Access to Science, Business, Innovation in the Digital Economy PDF Free Download
1 / 202
/202
100%


ACCESS Journal:
Access to science, business, innovation in the digital economy
ISSN 2683-1007 (online)
http://journal.access-bg.org
2025, Volume 6, Issue 3, September
http://doi.org/10.46656/access.2025.6.3
Publisher:
Publishing House ACCESS PRESS, Bulgaria, 2025
32 Aleksandar Burmov Str., 5000 Veliko Tarnovo, Bulgaria
Email: office@access-bg.org
https://access-bg.org
ACCESS JOURNAL
2025

ACCESS: Access to science, business, innovation in digital economy is a peer-
reviewed international scientific journal, which publishes original research
papers and case studies.
The Journal is designed for publishing articles includes but is not limited to the following
fields of research:
Challenges of economic development of society
Innovation of the economy and enterprises, start-up activities
Risk, risk management, risk financing instruments
Finance and financial markets
Market mechanisms of entrepreneurship development
Technological Changes Management and Economic Development Management
Innovation management
Management of the national and international economy
Regional competitiveness through investment efficiency
Business, Strategy and Investional Management
Management Science and Information Systems
Educational Management Challenges in Digital Environment
Global Management of Social Issues in Digital Economy
Sustainable social and economical environment of business development
Sustainable enterprise; State sustainability
Innovation on Implementation and Protection of Human Rights in Digital Environment
Innovation and technologies on the Intellectual Property rights in Digital Environment
Information, innovation and nonlinear modeling technologies, forecasting and management of
processes and systems;
Cognitive modeling and management decision making in poorly structured systems. (Fuzzy
cognitive modeling)
Artificial intelligence systems and technologies.
Robotics; Digital Economy.
INDUSTRY 4.0.; Industrial Internet of Things (“IoT” for I).
ISSN: 2683-1007

Access Journal is included in The National Reference List
(NRL) of contemporary Bulgarian scientific publications
with scientific review, maintained by the Minister of
Education and Science through the National Center for
Information and Documentation, Ref №: 3818
The journal is included in the official list of
peerreviewed scientific journals of the Ministry of
Education and Science of Poland from July 17, 2023,
(Ref №: 31621)
All papers published in the ACCESS Journal: Access to science, business, innovation in digital
economy are listed, indexed and abstracted in:
Advanced Science Index, BASE, CiteFactor, Crossref, Dimensions, DRJI, EconPapers/ RePEc (Research Papers in
Economics), eLybrary, ERIH PLUS, ESJI, EuroPub, Index Copernicus International, InfoBase Index, International
Services for Impact Factor and Indexing (ISIFI), ISSUU, Google Scholar, Polska Bibliografia Naukowa (portal of
the Polish, Ministry of Science and Higher Education), ResearchBib, Root Indexing, Web of Science: Emerging
Sources Citation Index.
https://doi.org/10.46656/access
ACCESS
:
Access to science, business, innovation in digital economy, 2025, 6(3)
Printout: 3 issues per year. Issue 1 (January); Issue 2 (May); Issue 3 (September).
Please, send your comments and opinions at:
editors@access-bg.org
EDITORIAL CORRESPONDENCE including manuscripts and submissions:
Prof. DSc. Mariana Petrova
e-mail: submissions@access-bg.org or m.petrova@access-bg.org
This is an open access journal and all published articles are licensed under a
Creative Commons Attribution 4.0 International License
This issue 2-2025 is funded with the kind support of the Nacional Science Fund, under project with contract
number KP-06-HP6/4 from 02.12.2024 by the competition “Bulgarian Scientific Periodicals - 2025“. The
National Science Fund is not responsible for the content of the materials.

Mariana PETROVA, St.Cyril and St.Methodius University of Veliko Tarnovo, Bulgaria
e-mail: m.petrova@ts.uni-vt.bg
SCIENTIFIC COUNCIL
Ryszard PUKALA
Chairman of the Scientific Council
Bronislaw Markiewicz State University of Applied Sciences in
Jaroslaw, Jaroslaw
PL
Liudmyla DOROKHOVA
University of Tartu, Tartu
EE
Yuriy DYACHENKO
Volodymyr Dahl East Ukrainian National University,
Severodonetsk
UA
Ketevan GOLETIANI
Batumi Navigation Teaching University
GE
Janis GRASIS
Riga Stradins University, Riga
LV
Nurlan KURMANOV
L.N. Gumilyov Eurasian National University, Astana
KZ
Evaldas RAISTENSKIS
Vilnius University, Vilnius
LT
Evgeny ZHERNOV
T.F. Gorbachev Kuzbass State Technical University, Kemerovo
RU
EDITORS-IN-CHIEF:
EDITORIAL BOARD MEMBERS:
Giga ABUSERIDZE, Caucasus University
Tbilisi
GE
Ludmila ALEKSEJEVA, Daugavpils University
Daugavpils
LV
Alina BADULESCU, University of Oradea
Oradea
RO
Iurie CARAUS, University of Montreal
Montreal
CA
Manoj Kumar CHAUDHARY, Tribhuvan University
Kathmandu
NP
Sreten CUZOVIC, University of Nis
Nis
RS
Francesca DI VIRGILIO, University of Molise
Campobasso
IT
Deniss DYAKONS, ISMA University
Riga
LV
Badri GECHBAIA, Batumi Shota Rustaveli State University
Batumi
GE
Saidakhror GULYAMOV, Institute of Advanced Training and Statistical Research
Tashkent
UZ
Zhibek KHUSSAINOVA, S.Seifullin Kazakh Agro Technical Research University
Astana
KZ
Viktor KOVAL, Izmail State University of Humanities
Izmail
UA
Nayden NENKOV, Konstantin Preslavsky University of Shumen
Shumen
BG
Yashar SALAMZADEH, Sunderland
Sunderland
UK
Jan-Urban SANDAL, Fil. Dr. Jan-U. Sandal Institute
Oslo
NO
Mykola SIDAK, Bratislava University of Economics and Mamagement
Bratislava
SK
Sanjay K. SINGH, Indian Institute of Management Lucknow
Lucknow
IN
Ludmila STEMPLEWSKA, Vistula Academy of Finance and Business in Warsaw
Warsaw
PL
Olena SUSHCHENKO, Simon Kuznets Kharkiv National University of Economics
Kharkiv
UA
Gonca TELLI, Dogus University
Istanbul
TR
Nguyen Van TRU, Information business software consultancy (IBC)
Singapore
Ho Chi Minh
SG
VN
Vladas TUMALAVIČIUS, General Jonas Žemaitis Military Academy of Lithuania
Vilnius
LT
Kadri UKRAINSKI , University of Tartu
Tartu
EE
Talgat UTEUBAYEV, L.N. Gumilyov Eurasian National University
Astana
KZ
Radostin VAZOV, Sofia University St. Kliment Ohridski
Sofia
BG
Ludmila ZAKONNOVA, T.F. Gorbachev Kuzbass State Technical University
Kemerovo
RU

ACCESS: Access to science, business, innovation in digital economy, ISSN 2683-1007 (online)
Volume 6, Issue 3, September 2025
CONTENTS
RESEARCH ARTICLES
Lyazzat AKILZHANOVA, Dinara JAKUPOVA, Zhadyra ARKENOVA, Zhansaya ZHUNISSOVA,
Ainur MAZINA
BRIDGING SECTORS: HOW GOVERNMENT SPENDING ENHANCES THE EMBEDDEDNESS OF
INFORMATION PROCESSES IN KAZAKHSTAN’S ECONOMY
483-497
Eiji HAYASHISHITA, Tetsuaki ODA
INDUSTRY DIFFERENCES IN INTELLECTUAL PROPERTY DISCLOSURE AND CORPORATE
VALUE: EVIDENCE FROM JAPAN
498-512
Liudmyla DOROKHOVA, Silvia BELOEVA, Nataliya VENELINOVA, Dzhavid MIRZOIEV
VIRTUAL TOURISM: DEVELOPMENT, TYPES AND FORMS, OPPORTUNITIES AND
DISADVANTAGES
513-531
Saule ISKENDIROVA, Aigerim AMIROVA, Aliya DAUESHOVA, Azamat ZHANSEITOV, Rymkul
ISMAILOVA
ADAPTING TO THE AI REVOLUTION: COMPARATIVE ANALYSIS OF NATIONAL WORKFORCE
STRATEGIES
532-545
Francis Okechukwu CHIKELEZE, Anatolijs KRIVINS, Valters KAZE, Thomas ETALONG
RISK MANAGEMENT PRACTICES AND ORGANIZATIONAL PERFORMANCE IN
TRANSPORTATION COMPANIES
546-566
Ifeanyi MBUKANMA, Sunday Olabisi ADEWARA
EXPLORING THE RELATIONSHIP BETWEEN SHARE PRICES, EARNINGS, AND DIVIDENDS IN
HIGH-DIVIDEND MINING FIRMS LISTED ON THE JOHANNESBURG STOCK EXCHANGE
567-582
Svitlana LABUNSKA, Mykola SIDAK, Andriy PYLYPENKO, Marharyta SOBAKAR
ASSESSMENT OF AGRICULTURAL EXPORT STRUCTURE’S IMPACT ON NATIONAL
ECONOMIC DEVELOPMENT: UKRAINIAN CASE
583-598
Besma HKIRI, Chaker ALOUI
CORRELATING INVESTOR SENTIMENTS AND SAUDI STOCK MARKET BEHAVIOUR: A
WAVELET-BASED APPROACH
599-614
Sefer AYDOGAN
IMPACT OF AI-AUGMENTED DIGITAL LEADERSHIP ON REMOTE TEAM PERFORMANCE:
AN EXPLORATORY STUDY OF TURKISH SMES
615-633
Eva CIPI, Eljona ZANAJ, Marsia CIPI, Betim CICO
DESIGN INSIGHTS FROM THE LANDSCAPE OF SUSTAINABILITY APPS
634-667
Guidelines for authors
Advertisements

ACCESS Journal:
Access to Science, Business, Innovation in Digital Economy
ISSN 2683-1007 (Online)
2025, 6(3), 483-497, https://doi.org/10.46656/access.2025.6.3(1)
https://journal.access-bg.org/
483
BRIDGING SECTORS: HOW GOVERNMENT SPENDING ENHANCES
THE EMBEDDEDNESS OF INFORMATION PROCESSES IN
KAZAKHSTAN’S ECONOMY
Lyazzat Akilzhanova1, Dinara Jakupova2, Zhadyra Arkenova3, Zhansaya Zhunissova4
Ainur Mazina5
1), 3) Karaganda University of Kazpotrebsoyuz, Karaganda, Kazakhstan
2) NCJSC “Karaganda Medical University”, Karaganda, Kazakhstan
4) Karaganda Higher Polytechnic College, Karaganda, Kazakhstan
5) Karaganda State University named after E. A. Buketov, Karaganda, Kazakhstan
e-mails: 1 Akilzhanova.l@keu.kz, 2 dzhakupova@qmu.kz, 3Arkenova.zh@keu.kz,4 krg-koll-6839@bilim09.kz,
5 mazina_a@buketov.edu.kz
Received: 11 May 2025 Accepted: 20 July 2025 Online Published: 31 July 2025
ABSTRACT
Objectives: The integration of digital technologies and artificial intelligence into national economies is increasingly
recognized as a driver of economic modernization and cross-sectoral connectivity. In Kazakhstan, government
expenditure has played a central role in building digital infrastructure and supporting the digital transformation of key
sectors. Objectives: This paper aims to assess the impact of government expenditure on the intersectoral embeddedness
of information processes in Kazakhstan’s economy from 2001 to 2023, with a focus on how targeted public investment
fosters digital integration across industries. Methods/Approach The analysis employs annual Input-Output Table data
and utilizes the dependency coefficient as a measure of information process integration, applying the Autoregressive
Distributed Lag (ARDL) model to estimate short- and long-term effects while controlling for macroeconomic variables
such as inflation and unemployment. Results: The results show that increased government spending significantly
enhances the integration of information processes with other sectors of the economy, confirming the positive impact of
public investment in digital infrastructure, digitalization of public services, and support for AI adoption. Conclusions:
These findings underscore the importance of sustained, well-targeted government expenditure in accelerating digital
transformation. Policy recommendations include prioritizing the expansion of digital infrastructure, promoting
interoperability, investing in digital skills, and ensuring that the integration of AI technologies is ethical and inclusive
across all sectors of the economy.
Keywords: government expenditure, information processes, sectoral embeddedness, dependency coefficient, digital
transformation, artificial intelligence, policy recommendations
JEL classification: J24, O33, O15
Paper type: Research article
Citation: Akilzhanova, L., Jakupova, D., Arkenova, Zh., Zhunissova, Zh., Mazina, A. (2025). Bridging sectors: how
government spending enhances the embeddedness of information processes in Kazakhstan’s economy. Access to science,
business, innovation in digital economy, ACCESS Press, 6(3), 483-497, https://doi.org/10.46656/access.2025.6.3(1)
INTRODUCTION
The accelerating evolution of digital technologies is redefining the landscape of national economies and
altering established relationships among sectors. Today, information processes—encompassing
telecommunications, data analytics, and artificial intelligence—serve as the backbone for economic
development, innovation, and societal advancement. For emerging economies such as Kazakhstan, advancing

ACCESS Journal:
Access to Science, Business, Innovation in Digital Economy
ISSN 2683-1007 (Online)
2025, 6(3), 483-497, https://doi.org/10.46656/access.2025.6.3(1)
https://journal.access-bg.org/
484
digital transformation is regarded as a strategic priority to boost productivity, elevate the quality of public
services, and enhance national competitiveness in an increasingly digitalized world.
Within this context, the seamless integration of information processes across diverse sectors is now
recognized as a cornerstone of sustainable and inclusive development. Effective digital integration not only
promotes cross-sectoral innovation and operational efficiency, but also enables new forms of collaboration
and business models that drive modernization. Public policy, especially government expenditure on digital
infrastructure and information technologies, plays a pivotal role in enabling these transformations by providing
essential investments, regulatory support, and institutional capacity.
However, the pathways through which government spending translates into deeper integration of
information processes with other industries remain insufficiently explored, particularly in the context of
emerging markets. Gaining a clearer understanding of these mechanisms holds both practical and scholarly
significance, offering guidance for the design of effective fiscal and industrial policies that address the unique
challenges and opportunities associated with digitalization.
LITERATURE REVIEW
The scholarly literature examining the intersection of government expenditure, digital infrastructure, and
economic development has expanded markedly over the past two decades (Georgiev et al., 2022; Tireuov et
al., 2018; Tireuov et al., 2019. This growing body of research reflects a global recognition of the pivotal role
that information and communication technologies (ICT) now play in driving national productivity, fostering
innovation, and enabling cross-sectoral connectivity.
Foundational studies such as Madden and Savage (1997) established that public investment in
telecommunications infrastructure yields substantial spillover benefits for the broader economy, beyond the
immediate ICT sector. Their findings highlighted that well-targeted government expenditure supports
digitalization in related industries and facilitates the modernization of economic systems. Building on this,
Czernich, Falck, Kretschmer, and Woessmann (2011) demonstrated a strong correlation between the
expansion of broadband networks—often enabled by public policy—and GDP growth, as well as productivity
gains and sectoral spillovers, particularly in advanced economies. These studies collectively underscore the
view that robust digital infrastructure serves as a catalyst for wider economic transformation.
Subsequent research has emphasized the enabling role of government in fostering digital innovation and
facilitating the diffusion of advanced information processes. For example, Vu (2011) highlighted how
government-led digital initiatives, such as investments in digital platforms and e-government services, create
an enabling environment for both public and private sector innovation. Bertschek, Briglauer, Hüschelrath,
Kauf, and Niebel (2015) also point out that policy-driven broadband rollouts have accelerated digital adoption
and delivered notable productivity improvements, even in sectors that were traditionally less reliant on digital
technologies.
The rise of artificial intelligence (AI) has added further complexity and opportunity to the digitalization
agenda. Recent policy analyses by organizations such as the OECD (2020) and the World Bank (2016)
ACCESS Journal:
Access to Science, Business, Innovation in Digital Economy
ISSN 2683-1007 (Online)
2025, 6(3), 483-497, https://doi.org/10.46656/access.2025.6.3(1)
https://journal.access-bg.org/
485
emphasize the importance of coordinated public investment in AI infrastructure, open data ecosystems, and
digital skills development. These reports argue that strategic government spending in these areas can accelerate
sectoral convergence, foster innovation across the economy, and support the digital transformation of public
services.
Recent global research highlights the growing importance of digital transformation and government
investment in driving sustainable economic growth and social inclusion. For example, Cardona, Kretschmer,
and Strobel (2013) demonstrate that digital infrastructure and ICT adoption play a critical role in fostering
innovation and productivity across sectors, especially when supported by strategic public policy. In parallel,
Banga and te Velde (2018) emphasize that well-designed digital strategies are essential for addressing digital
divides and promoting inclusive economic participation in developing countries.
While the bulk of this literature has historically centered on high-income countries, there is a growing—
though still limited—evidence base from emerging markets. Studies such as Kim, Kelly, and Raja (2010) have
pointed to the vital role of government interventions in overcoming digital divides and market failures,
particularly where private investment alone cannot achieve widespread digital adoption. Targeted policy
measures supporting digital literacy, as well as the digitalization of traditional sectors like agriculture, health,
and education, have been shown to foster more resilient, inclusive, and interconnected economic systems (ITU,
2024). Despite these advances, significant gaps remain. Much of the extant research is concerned primarily
with direct economic effects—such as sectoral output, employment, or productivity—while subtler metrics
that capture the depth and quality of sectoral integration are less frequently analyzed. In particular, the concept
of "embeddedness"—the extent to which ICT and digital solutions are woven into the operational fabric of
various industries—remains underexplored, especially via empirical frameworks leveraging Input-Output
Table data.
Furthermore, as public digital investment becomes an increasingly acknowledged driver of macroeconomic
benefit, there is still limited understanding of the mechanisms through which government spending enhances
the structural role of information processes, especially amid rapid AI development. Scholars increasingly
recognize the need to move beyond aggregate economic indicators and investigate how fiscal policy shapes
cross-sectoral digital linkages, innovation spillovers, and the transition to knowledge-based economies
(Espolov et al., 2023; Khussainova et al., 2023; Tireuov et al., 2023; Khussainova et al., 2024; Tireuov et al.,
2020).
In summary, prior research provides robust evidence for the positive impact of public investment on digital
transformation and economic growth. However, the mechanisms by which government expenditure promotes
the intersectoral embeddedness of information processes—especially in emerging markets such as
Kazakhstan—remain insufficiently understood. Addressing these research gaps is essential for the formulation
of effective, evidence-based policy recommendations in an era characterized by accelerating artificial
intelligence adoption and pervasive digitalization
ACCESS Journal:
Access to Science, Business, Innovation in Digital Economy
ISSN 2683-1007 (Online)
2025, 6(3), 483-497, https://doi.org/10.46656/access.2025.6.3(1)
https://journal.access-bg.org/
486
METHODOLOGY
This section details the methodological approach used to analyze the impact of government expenditure on
the integration of information processes within Kazakhstan’s economy. The empirical analysis relies on annual
Input-Output Table data for the period 2001–2023. The dependency coefficient is used as the primary indicator
of sectoral embeddedness, while government expenditure on information processes serves as the main
explanatory variable. Inflation and unemployment rates are included as macroeconomic control variables.
Given the different integration orders of the variables and the limited sample size, the Autoregressive
Distributed Lag (ARDL) model is adopted. All variables are tested for stationarity using Augmented Dickey-
Fuller (ADF) tests. Cointegration analysis is conducted using the Johansen procedure, which provides
evidence of a long-term equilibrium relationship among the variables. The ARDL model enables the
estimation of both short-run and long-run effects, and model diagnostics are performed to ensure the validity
and robustness of the results.
This methodological design directly addresses the core research hypothesis (H1): Increased government
expenditure on information processes is positively associated with the embeddedness (integration) of
information processes across other sectors in Kazakhstan’s economy.
Dependent Variable: Dependency Coefficient
The dependency coefficient serves as the principal dependent variable in this study. It quantifies the extent
to which outputs from the information processes sector (including communication, IT, broadcasting, and
information services) are utilized by other industries within the economy. Calculated using Input-Output Table
(IOT) data, this coefficient reflects the embeddedness or integration of information processes, highlighting
their role as a connective infrastructure across sectors such as finance, healthcare, logistics, and education. A
higher dependency coefficient indicates stronger inter-sectoral linkages and greater digital integration, making
it a robust indicator of the digital economy’s reach and influence.
Key Independent Variable: Government Expenditure
Government expenditure captures the aggregate amount of public funds allocated to ICT infrastructure,
digitalization programs, and related capital and current consumption in the information processes sector. The
variable incorporates both capital investments (e.g., broadband networks, data centers, public IT procurement)
and current government consumption (e.g., operational ICT spending, digital services for public
administration). Data are drawn from the Input-Output Table’s rows for government final consumption and
gross fixed capital formation in relevant ICT industries. This variable reflects the government’s role as a
catalyst for digital transformation and sectoral connectivity, with direct implications for the integration of
information processes across the economy.
Control Variables
Inflation:
Measured as the annual percentage change in the consumer price index, inflation is included as a control
variable to account for macroeconomic instability that could affect the real value of both government

ACCESS Journal:
Access to Science, Business, Innovation in Digital Economy
ISSN 2683-1007 (Online)
2025, 6(3), 483-497, https://doi.org/10.46656/access.2025.6.3(1)
https://journal.access-bg.org/
487
expenditure and sectoral outputs. High inflation may dampen the effectiveness of public investment and create
volatility in the ICT sector. Moreover, maintaining low and stable inflation is crucial for preserving the real
value of public investments and ensuring predictable conditions for sustained growth in the ICT sector
(Abuseridze, 2020).
Unemployment Rate:
The unemployment rate, expressed as a percentage of the labor force, serves as a control for overall
economic activity and labor market dynamics. Fluctuations in unemployment can influence both demand for
digital services and the availability of skilled ICT professionals, indirectly affecting the sector’s integration
with other industries.
Variables excluded due to multicollinearity:
GDP and Urbanization were excluded from the model because of high correlation with government
expenditure and information processes output, as demonstrated in the correlation matrix analysis.
Additional Notes (for Methods/Data section):
Sector Selection:
The information processes sector is defined in accordance with the General Classification of Economic
Activities (GCEA), encompassing telecommunications, IT services, publishing, broadcasting, and information
services (codes 58, 59, 60, 61, 62, 63).
Calculation Basis:
All Input-Output Table values are used at basic prices, excluding taxes and subsidies, to ensure
comparability and avoid distortions.
Justification for Using the ARDL Model
The Autoregressive Distributed Lag (ARDL) modeling approach is particularly well-suited to the structure
of the dataset employed in this study for several reasons:
1. Different Orders of Integration: The ARDL technique can accommodate variables that are integrated
of different orders, specifically I(0) and I(1), provided none are I(2) or higher. As shown in the stationarity
tests, the key dependent variable—Dependency Coefficient—is stationary at first difference (I(1)), while
government expenditure and the gross output of information processes become stationary only at the third
difference (I(3)). However, the ARDL framework is still applicable as long as the final model does not include
I(2) or higher-order variables. Other regressors, such as inflation and unemployment, are stationary at levels
(I(0)).
2. Cointegration Evidence: The Johansen cointegration test suggests the presence of a cointegrating
relationship between the variables, indicating a potential long-run equilibrium linkage. This further justifies
the use of the ARDL approach, which is capable of detecting both short-term and long-term relationships when
cointegration tests yield conclusive results.
3. Suitability for Small Samples: The ARDL method is recognized for its robustness in studies with small
to moderate sample sizes, which is the case here with annual data for 23 years (2001–2023).

ACCESS Journal:
Access to Science, Business, Innovation in Digital Economy
ISSN 2683-1007 (Online)
2025, 6(3), 483-497, https://doi.org/10.46656/access.2025.6.3(1)
https://journal.access-bg.org/
488
4. Capturing Both Short- and Long-Term Dynamics: The ARDL model enables the estimation of both
short-run and long-run relationships among variables, which is essential for understanding the immediate and
persistent effects of government spending on the embeddedness of information processes.
5. Flexibility in Lag Structure: ARDL models allow for different lag lengths for each variable, which is
advantageous when economic variables may respond to shocks or policy changes at different speeds.
RESULTS
This section presents the empirical results of the econometric analysis examining the impact of government
expenditure on the embeddedness of information processes within Kazakhstan’s economy. The analysis is
based on annual Input-Output Table data covering the period from 2001 to 2023 and employs the
Autoregressive Distributed Lag (ARDL) modeling approach, as outlined in the methodology section.
Descriptive statistics for all variables are provided, followed by the results of stationarity and cointegration
tests. The main findings from the ARDL model estimation are then discussed, with a particular focus on the
short-term and long-term effects of government expenditure on the dependency coefficient—a proxy for the
integration of information processes across economic sectors. Model diagnostics are also reported to assess
the validity and robustness of the regression results.
The subsequent subsections interpret the estimated coefficients and compare the empirical findings with
prior studies in the field, highlighting the implications for economic policy and digital transformation strategies
in Kazakhstan.
Table 1. ARDL Model Results for the Dependency Coefficient
Variable
Coefficient
Std.
Error
t-
Statistic
P-value
95% Confidence Interval
const
-0.2948
0.103
-2.861
0.013
[-0.516, -0.074]
L1_dependency
-0.3128
0.346
-0.904
0.381
[-1.055, 0.429]
L1_gov_costs
3.48e-10
1.2e-10
2.900
0.012
[9.06e-11, 6.05e-10]
Unemployment
0.1261
0.035
3.652
0.003
[0.052, 0.200]
Inflation
0.0010
0.003
0.314
0.758
[-0.006, 0.008]
L1_D_dependency
0.0343
0.220
0.156
0.878
[-0.438, 0.506]
L1_D_gov_costs
-1.35e-10
4.77e-10
-0.283
0.781
[-1.16e-09, 8.87e-10]
Source: Own calculations
Table 2. Model Summary and Diagnostics
Indicator
Value
R-squared
0.861
Adjusted R-squared
0.801
F-statistic
14.44
Prob (F-statistic)
2.80e-05
Durbin-Watson
2.275
AIC
-59.16
BIC
-51.85
Source: Own calculations
Table 3. Model Diagnostics
Test
Statistic
p-value
Breusch-Pagan (heteroskedasticity)
5.4753
0.4845
Ljung-Box (serial correlation)
5.3582
0.2525
Jarque-Bera (normality)
5.6556
0.0591
ADF (residuals stationarity)
-2.846
0.052
Source: Own calculations
ACCESS Journal:
Access to Science, Business, Innovation in Digital Economy
ISSN 2683-1007 (Online)
2025, 6(3), 483-497, https://doi.org/10.46656/access.2025.6.3(1)
https://journal.access-bg.org/
489
The ARDL regression results in Table 1 provide insight into the relationship between government
expenditure and the embeddedness of information processes within Kazakhstan’s economy. The model
demonstrates a high explanatory power, with an adjusted R-squared of 0.801, indicating that approximately
80% of the variation in the dependency coefficient is explained by the included variables.
A key finding is the positive and statistically significant effect of the lagged value of government
expenditure (L1_gov_costs) on the dependency coefficient (coefficient = 3.48e-10, p = 0.012). This suggests
that increases in government spending are associated with a greater integration of information processes into
other sectors in subsequent periods, supporting the view that targeted public investment promotes digital
interconnectedness across the economy.
Unemployment also exhibits a significant positive association (coefficient = 0.1261, p = 0.003), potentially
reflecting the structural adjustments and labor market changes accompanying the digital transformation of the
economy.
Other variables, including inflation and lagged values of the dependency coefficient and government
spending changes, do not show statistically significant effects in this specification.
Model diagnostics – Table 2,3 indicate that the regression is robust, with no evidence of serial correlation
or heteroskedasticity, and residuals are approximately normally distributed. However, the large condition
number points to possible multicollinearity or numerical issues, which should be considered when interpreting
the results.
Overall, the findings suggest that government expenditure plays a critical role in fostering the integration
of information processes with other industries, thereby supporting Kazakhstan’s ongoing digital
transformation.
DISCUSSION
The empirical findings of this study confirm a statistically significant positive association between lagged
government expenditure and the embeddedness of information processes within Kazakhstan’s economy.
Specifically, the ARDL model results indicate that increases in government spending on information processes
contribute to a greater integration of these processes with other sectors in subsequent periods. This supports
the central hypothesis (H1) and highlights the important role of fiscal policy in fostering the digital
transformation of the national economy.
One practical example of how increased government expenditure can strengthen the linkages between
information processes and other sectors is through large-scale investment in digital infrastructure and public
digitalization programs. For instance, when the government allocates funding to develop nationwide high-
speed broadband networks, upgrade data centers, and support e-government platforms, this creates a
foundation that allows industries such as healthcare, education, finance, and logistics to integrate advanced
information systems into their operations.
For example:
ACCESS Journal:
Access to Science, Business, Innovation in Digital Economy
ISSN 2683-1007 (Online)
2025, 6(3), 483-497, https://doi.org/10.46656/access.2025.6.3(1)
https://journal.access-bg.org/
490
Healthcare: Government investments in digital health infrastructure enable hospitals and clinics to adopt
electronic health records, telemedicine services, and AI-powered diagnostics. These systems require robust
information processing and create real-time connections between the health sector, insurance companies, and
regulatory authorities.
Agriculture: Subsidizing smart farming initiatives and digital platforms allows farmers to use AI-driven
data analytics for crop management, which connects agriculture with information technology providers,
logistics companies, and the food processing sector.
Education: Funding for digital classrooms, learning management systems, and AI tutoring platforms
integrates education more closely with the ICT sector, content creators, and assessment bodies.
In all these cases, targeted government spending not only upgrades the information sector itself but also
multiplies its connections to other industries, fostering cross-sectoral digital ecosystems.
These results align with a growing body of international literature that underscores the catalytic role of
public investment in ICT infrastructure in strengthening sectoral connectivity and driving economic
modernization. For instance, studies by Madden & Savage (1997) and Czernich et al. (2011) have consistently
found that increased government spending on digital infrastructure is associated with substantial productivity
spillovers and a deeper integration of information and communication technologies into traditional industries.
This process not only elevates the performance of the ICT sector itself but also stimulates innovation and
efficiency gains throughout the broader economy. Such dynamics highlight the strategic importance of
sustained public investment as a lever for inclusive and innovation-driven growth in the digital age
(Abuseridze et al., 2022a).
Furthermore, Vu (2011) emphasizes that public investment in ICT can act as a powerful accelerator for
cross-sectoral innovation, fostering the development of digital ecosystems and supporting structural
transformation, particularly in emerging markets. The positive relationship identified in the case of Kazakhstan
thus echoes similar patterns reported in the OECD and several Asia-Pacific economies, where strategic
government spending has played a central role in the digitalization of public services, manufacturing, and
service industries (see, for example, OECD, 2020; World Bank, 2016).
A particularly interesting dimension of the present analysis is the observed significant effect of
unemployment on the dependency coefficient. While a positive association between unemployment and the
integration of information processes may initially appear counterintuitive, recent research suggests that labor
market disruptions can serve as a catalyst for structural realignments and increased adoption of digital
solutions. Brynjolfsson & McAfee (2014) argue that periods of higher unemployment may incentivize firms
and public institutions to implement more efficient information technologies and automation tools, thereby
accelerating the integration of digital processes across the economy. In the Kazakhstani context, this dynamic
could reflect adaptive strategies among businesses and public agencies seeking to enhance resilience and
maintain competitiveness during periods of economic stress. This interpretation resonates with broader digital
ACCESS Journal:
Access to Science, Business, Innovation in Digital Economy
ISSN 2683-1007 (Online)
2025, 6(3), 483-497, https://doi.org/10.46656/access.2025.6.3(1)
https://journal.access-bg.org/
491
transformation patterns observed in emerging economies, where labor market volatility often drives
accelerated technological uptake and institutional innovation (Abuseridze et al., 2022b).
It is also notable that inflation and short-term changes in government spending were not found to have
significant effects on the integration of information processes in the model. This finding is consistent with
prior studies (Czernich, Falck, Kretschmer, & Woessmann, 2011), which indicate that the transformative
impacts of digital investment are primarily realized over the long term, rather than as immediate responses to
short-term macroeconomic fluctuations. These results further support the argument that sustained, well-
targeted public investment is essential for achieving meaningful digital integration and unlocking broader
economic benefits.
Despite the robustness of the results, as indicated by model diagnostics, the large condition number suggests
potential multicollinearity or numerical challenges, which should be considered when interpreting the
magnitude of the estimated coefficients. Additionally, the analysis is limited by the availability of annual data
and the scope of Input-Output Table classifications, which may not capture all dimensions of digital
integration.
In summary, the findings reinforce the idea that sustained and targeted government expenditure is a key
driver of the digital transformation and sectoral integration of information processes in Kazakhstan. These
results echo international experience, demonstrating the effectiveness of fiscal policy as a lever for building a
knowledge-based and interconnected economy.
Policy Recommendations in the Age of Artificial Intelligence
Given the accelerating development and adoption of artificial intelligence, several policy directions become
especially relevant:
1. Prioritize AI-Ready Digital Infrastructure: Allocate resources for next-generation digital networks
(e.g., 5G, cloud computing, high-performance computing clusters) to ensure that all sectors can access
and leverage AI-driven information processes.
2. Promote Interoperability Standards: Develop and enforce standards that facilitate seamless data
sharing and integration between sectors (e.g., open APIs, unified data governance), which is critical
for AI applications that depend on cross-sectoral data flows.
3. Support Human Capital Development: Invest in digital skills, AI literacy, and continuous upskilling
of the workforce to enable public and private organizations in all sectors to adopt and adapt AI
technologies effectively.
4. Foster Public-Private Partnerships: Encourage collaborations between government, academia, and
industry to accelerate AI adoption in traditional sectors, leveraging state investment as a catalyst for
innovation.
5. Ensure Ethical and Inclusive AI Adoption: Design policies that address the ethical, legal, and social
implications of AI—ensuring that digital transformation and inter-sectoral integration benefit all
groups and minimize potential risks (e.g., privacy, algorithmic bias).
ACCESS Journal:
Access to Science, Business, Innovation in Digital Economy
ISSN 2683-1007 (Online)
2025, 6(3), 483-497, https://doi.org/10.46656/access.2025.6.3(1)
https://journal.access-bg.org/
492
6. Monitor and Evaluate Integration Outcomes: Establish regular assessment mechanisms to track how
government spending on AI and digital infrastructure is influencing the integration of information
processes across the economy, allowing for evidence-based policy adjustments.
7. Expand digital education: Continue investing in e-learning infrastructure and digital curricula to ensure
all students, regardless of location, can access high-quality education and develop essential digital
skills (Kadirbayeva et al., 2021).
8. Promote university–industry collaboration: Encourage the creation of endowment funds and similar
mechanisms to strengthen partnerships between higher education and business, improving the
relevance and impact of training programs in sectors such as tourism (Khusainova et al., 2021).
9. Support vulnerable workers: Implement targeted policies to support agricultural workers and other
vulnerable groups, combining digital innovation with robust social protection systems to ensure an
inclusive digital transition (Kussainova et al., 2024).
10. Promote sector-specific digital strategies: Develop and implement targeted digitalization initiatives for
agriculture, food production, and healthcare to address their unique challenges and leverage best
practices (Okutayeva et al., 2023; Smailov et al., 2022).
11. Support integrated cluster development: Foster the creation of agricultural and industrial clusters that
bring together businesses, government, and research institutions, enabling effective digital innovation
and sustainable growth (Temirgaliyeva et al., 2019).
12. Enhance cross-sectoral learning: Facilitate the transfer of digital and environmental innovations
between sectors to maximize overall economic resilience and modernization (Okutayeva et al., 2023;
Smailov et al., 2022).
In practical terms, the Kazakhstani experience demonstrates that the success of digital transformation
policies depends on coordinated action across multiple domains—including digital infrastructure, human
capital management, educational reform, and sustainability initiatives. Policy makers should draw on
successful cases such as the digitalization of public enterprises (Adilova et al., 2025), the management of
intellectual capital (Aimukhanbetova et al., 2019), the modernization of higher education (Akhmedyarov et
al., 2025), and the integration of sustainability practices in economic planning (Belgibayeva et al., 2024). These
examples collectively highlight the need for an ecosystem approach—one that links fiscal investments to
organizational development, workforce preparation, and responsible innovation for long-term digital
competitiveness. Such an integrated framework not only enhances policy coherence but also ensures that
digital transformation efforts translate into inclusive, resilient, and context-sensitive development outcomes
(Abuseridze et al., 2022c).
Policy makers should also consider targeted support for female entrepreneurship, as it has been shown to
accelerate economic growth and enhance the benefits of digitalization and innovation in various contexts,
including Kazakhstan (Akybayeva et al., 2024). Facilitating access to finance, mentorship, and digital skills
ACCESS Journal:
Access to Science, Business, Innovation in Digital Economy
ISSN 2683-1007 (Online)
2025, 6(3), 483-497, https://doi.org/10.46656/access.2025.6.3(1)
https://journal.access-bg.org/
493
training for women entrepreneurs can help unlock untapped potential in the workforce and contribute to more
balanced, sustainable economic development.
Strategic and well-targeted government expenditure in the digital and AI domains can create the necessary
infrastructure, human capital, and regulatory environment to ensure that information processes become deeply
embedded across all economic sectors—thus maximizing the benefits of Kazakhstan’s digital transformation
in the age of artificial intelligence.
CONCLUSION
This study has provided empirical evidence on the relationship between government expenditure and the
integration of information processes with other sectors in Kazakhstan’s economy. By employing the
dependency coefficient as a novel indicator of digital embeddedness and utilizing the ARDL modeling
approach, the analysis demonstrates that targeted government spending plays a critical role in strengthening
intersectoral digital linkages. The results underscore the importance of sustained public investment in digital
infrastructure and information technologies, particularly in the context of rapid technological change and
artificial intelligence adoption.
The findings suggest that policy measures aimed at expanding digital infrastructure, fostering
interoperability, and supporting human capital development are essential for maximizing the economic
benefits of digital transformation. The positive association between government expenditure and information
process integration highlights the potential for fiscal policy to act as a catalyst for cross-sectoral innovation
and modernization in emerging markets like Kazakhstan.
Despite these contributions, the research is subject to certain limitations. The analysis relies on annual data,
which may mask short-term fluctuations and dynamic adjustments. Additionally, the study focuses on a single
country context, limiting the generalizability of the results. Future research could address these limitations by
employing higher-frequency data, expanding the analysis to include cross-country comparisons, or
investigating the specific mechanisms through which public investment influences digital integration—such
as the role of public-private partnerships, regulatory frameworks, or sector-specific digital initiatives.
Further studies could also explore the impacts of government spending on advanced digital technologies,
including artificial intelligence, big data analytics, and cloud computing, and examine how these investments
interact with labor market outcomes, innovation capacity, and social inclusion. By deepening our
understanding of these processes, future research can provide valuable insights for policymakers seeking to
design effective digital transformation strategies in the era of artificial intelligence.
Conflict of interest:
The authors declare no conflict of interest.
ACCESS Journal:
Access to Science, Business, Innovation in Digital Economy
ISSN 2683-1007 (Online)
2025, 6(3), 483-497, https://doi.org/10.46656/access.2025.6.3(1)
https://journal.access-bg.org/
494
Author Contributions:
Conceptualization, L.A. and Z.Z.; methodology, D.J.; software, Z.Z.; validation, Z.A., A.M. and D.J.; formal
analysis, L.A.; investigation, Z.A.; resources, D.J.; data curation, L.A.; writing—original draft preparation,
L.A.; writing—review and editing, A.M.; visualization, Z.Z.; supervision, Z.A.; project administration, L.A.;
funding acquisition, L.A. All authors have read and agreed to the published version of the manuscript.
Acknowledgement
We greatly appreciate the valuable contributions of the Research Development Institute and every team
member who took the time to support in this study.
Institutional Review Board Statement: not applicable
Informed Consent Statement: not applicable
Data Availability Statement:
The data presented in this study are available on request from the corresponding author.
References
Abuseridze, G., Paliani-Dittrich, I., Shalikashvili, M., & Zahars, V. (2022a). Challenges and economic adjustment policies
in the EU. https://doi.org/10.46656/access.2022.3.2(4)
Abuseridze, G., Petrova, M., Zahars, V., & Tumalavičius, V. (2022b). Transformation of Georgia’s trade policy strategy:
from frailty to sustainability. Access to science, business, innovation in digital economy, 43-52.
https://doi.org/10.46656/access.2022.3.1(4)
Aburesidze, G., Paliani-Dittrich, I., Grasis, J., Alaverdov, E., & Linde, N. (2022c). Economic diplomacy and international
trade from the WTO Perspective. Uluslararası Sosyal Bilimler ve Eğitim Dergisi–USBED, 4(6), 11-22.
Abuseridze, G. (2020). Political stability and trade agreements. Tbilisi: Bulletin of the Georgian Natioanl Academy of
Science. ISSN 01321447, Volume 14, Issue 4, Pages 139 – 140
Adilova, N., Sultanbek, M., Sarzhanov, D., Sładkowski, A., & Zhanseitov, A. (2025). Digital solution for effective
management of remote work: The case of Kazakhstan Railway. Economics Innovative and Economics Research
Journal, 13(1), 231–245. https://doi.org/10.2478/eoik-2025-0011
Aimukhanbetova, G., Amirbekuly, Y., Kalykov, A., Akybayeva, G., & Zhanseitov, A. (2019). The management of
intellectual capital in an enterprise that operates in an innovative environment. Espacios, 40(35), 1–9.
https://www.revistaespacios.com/a19v40n35/19403530.html
Akhmedyarov, Y., Kurmanov, N., Petrova, M., Iskendirova, S., Ashimova, I., & Akzhanova, G. (2023). A Sustainable
Dairy Industry in Kazakhstan. Enterprises' Insights Upon Environment Management and Innovation. Journal of
Environmental Management & Tourism, 14(3), 856-865. https://doi.org/10.14505/jemt.v14.3(67).23
Akybayeva G., Mussabekova A., Mambetova S., Ayaganova M., Koitanova A. (2024). The Impact of Female
Entrepreneurship on Economic Growth in Developing and Developed Economies. Economics Innovative and
Economics Research Journal, 12(2), 145–162
Banga, K., & te Velde, D. W. (2018). Digitalisation and the future of manufacturing in Africa. https://set.odi.org/wp-
content/uploads/2018/03/SET_Digitalisation-and-future-of-African-manufacturing_Final.pdf (accessed on
February 12, 2025)
Belgibayeva, A., Tumalavicius, V., Petrova, M., & Akhmedyarov, Y. (2024). Economic aspects of organic waste disposal
in the Republic of Kazakhstan. In BIO Web of Conferences, Vol. 114, 01006. EDP Sciences.
https://doi.org/10.1051/bioconf/202411401006
Bertschek, I., Briglauer, W., Hüschelrath, K., Kauf, B., & Niebel, T. (2015). The economic impacts of broadband internet:
A survey. Review of Network Economics, 14(4), 201–227. https://doi.org/10.1515/rne-2016-0032
ACCESS Journal:
Access to Science, Business, Innovation in Digital Economy
ISSN 2683-1007 (Online)
2025, 6(3), 483-497, https://doi.org/10.46656/access.2025.6.3(1)
https://journal.access-bg.org/
495
Cardona, M., Kretschmer, T., & Strobel, T. (2013). ICT and productivity: Conclusions from the empirical literature.
Information Economics and Policy, 25(3), 109–125. https://doi.org/10.1016/j.infoecopol.2012.12.002
Czernich, N., Falck, O., Kretschmer, T., & Woessmann, L. (2011). Broadband infrastructure and economic growth. The
Economic Journal, 121(552), 505–532. https://doi.org/10.1111/j.1468-0297.2011.02420.x
Espolov, T., Espolov, A., Aitkozhina, D., Tireuov, K., Raiymbekov, S., & Suleimenov, Z. (2023). Comparing COVID–
19 Budgeting Responses: New Budgeting Principles that Resulted from the Pandemic. Comparative Economic
Research. Central and Eastern Europe, 26(4), 7–25. https://doi.org/10.18778/1508-2008.26.28
Georgiev, G., Beloev, I., Hristov, G. and P. Zahariev (2022). LoRa Network-Based System for Remote Monitoring of
Agricultural Crops. 30th National Conference with International Participation (TELECOM), Sofia, Bulgaria, pp. 1-
4, doi: 10.1109/TELECOM56127.2022.10017316.
International Telecommunication Union (ITU). (2024). Measuring digital development: Facts and figures 2024. Geneva:
ITU. https://www.itu.int/en/ITU-D/Statistics/Pages/facts/default.aspx (accessed on February 14, 2025)
Kadirbayeva, D., Sabanbayev, N., Abdurayeva, G., & Zhanseitov, A. (2021). Advancement of elearning in higher
education in the case of Kazakhstan. Journal of Educators Online, 18(2).
http://localhost:8080/xmlui/handle/123456789/1284
Kim, Y., Kelly, T., & Raja, S. (2010). Building broadband: Strategies and policies for the developing world. Washington,
DC: World Bank. http://documents.worldbank.org/curated/en/969181468155109984 (accessed on Feb. 6, 2025)
Khusainova, Z., Asanova, M., Akybayeva, G., Mardanova, A., & Abauova, G. (2021). Endowment funds as an effective
form of partnership between the business sector and the higher education system. Case of training specialists in the
tourism industry. Journal of Environmental Management and Tourism, 12(8), 2194–2216
Khussainova, Z., Gazizova, M., Abauova, G., Zhartay, Z., & Raikhanova, G. (2023). Problems of Generating Productive
Employment in the Youth Labor Market as a Dominant Risk Reduction Factor for the NEET Youth Segment in
Kazakhstan. Economies, 11(4), 116. https://doi.org/10.3390/economies11040116
Khussainova, Z., Kankulov, M., Petrova, M., Assanova, M., Zhartay, Z., Atabayeva, A., Bektleyeva, D. (2024a). The
Potential of Youth and Older People’s Inclusion in the Sustainable Development of the Creative
Economy. Sustainability, 16, 4095. https://doi.org/10.3390/su16104095
Kussainova, A., Radukanov, S., Petrova, M., & Akhmedyarov, Y. (2024b). Assessment of social protection challenges
and status for agricultural workers in Kazakhstan. In BIO Web of Conferences (Vol. 114, p. 01010). EDP Sciences.
https://doi.org/10.1051/bioconf/202411401010
Madden, G., & Savage, S. J. (1997). CEE telecommunications investment and economic growth. Information Economics
and Policy, 10(2), 173–195. https://mpra.ub.uni-muenchen.de/11843/1/1998_CEE_Telecommunications_Invest
ment_and_Economics_Growth.pdf (accessed on February 12, 2025)
Okutayeva, S., Yesmagulova, N., Sultanova, A., Japarova, K., & Kuangaliyeva, T. (2023). A Sustainable Dairy Industry
in Kazakhstan. Enterprises’ Insights Upon Environment Management and Innovation. Journal of Environmental
Management and Tourism, 14(3), 856–865. https://doi.org/10.14505/jemt.v14.3(67).23
Organisation for Economic Co-operation and Development (OECD). (2020). OECD digital economy outlook 2020. Paris:
OECD Publishing. https://doi.org/10.1787/bb167041-en (accessed on February 15, 2025)
Smailov, B., Andarova, R., Akybayeva, G., Mambetova, S., & Gelashvili, N. (2022). Improving the Efficiency of the
National Healthcare as Oriented Sustainable System. The Socio-Economic Aspects and Environmental Issues.
Journal of Environmental Management and Tourism, 13(5), 1425–1442. DOI: 10.14505/jemt.v13.5(61).18
Steblyakova, L.P., Vechkinzova, E., Khussainova, Z., Zhartay, Z., Gordeyeva, Y. (2022). Green Energy: New
Opportunities or Challenges to Energy Security for the Common Electricity Market of the Eurasian Economic Union
Countries. Energies, 15 (14), art. no. 5091. DOI: 10.3390/en15145091
Temirgaliyeva, A., Shadiyev, K., Demessinov, T., Orynbekova, G., Kopylova, O., & Valieva, M. (2019). Comprehensive
estimation of prerequisites on creating an agricultural cluster in the Akmola region. Journal of Advanced Research
in Law and Economics, 9(4), 1416–1427. https://journals.aserspublishing.eu/jarle/article/view/2840
Tireuov, K., Mizanbekova, S., Aitkhozhayeva, G., Mizanbekov, I. (2023). Public-private partnerships for sustainable
development of agriculture, Entrepreneurship and Sustainability Issues 11(1): 98-112.
https://doi.org/10.9770/jesi.2023.11.1(6)

ACCESS Journal:
Access to Science, Business, Innovation in Digital Economy
ISSN 2683-1007 (Online)
2025, 6(3), 483-497, https://doi.org/10.46656/access.2025.6.3(1)
https://journal.access-bg.org/
496
Tireuov, KM, Akhmetov, KA, Kozhamkulova, ZZ, Seidalieva, GO. (2020). Formation of key basic elements of the
resource potential of agricultural enterprises of the Republic of Kazakhstan. Turismo Estudos e Práticas – RTEP.
No. 2 (2020): Geplat: Caderno Suplementar, 1-15
Tireuov, K., Mizanbekova, S., Kalykova, B., Nurmanbekova, G. (2018). Towards food security and sustainable
development through enhancing efficiency of grain industry, Entrepreneurship and Sustainability Issues 6(1): 446-
455. https://doi.org/10.9770/jesi.2018.6.1(27)
Tireuov, K., Mizanbekova, S., Kalykova, B., Nurmanbekova, G. (2019). Methods and instruments of government control
of grain products subcomplex, Entrepreneurship and Sustainability Issues 7(1): 763-772.
https://doi.org/10.9770/jesi.2019.7.1(54)
Vu, K. M. (2011). ICT as a source of economic growth in the information age: Empirical evidence from the 1996–2005
period. Telecommunications Policy, 35(4), 357–372. https://doi.org/10.1016/j.telpol.2011.02.008
World Bank. (2016). World development report 2016: Digital dividends. Washington, DC: World Bank.
https://www.worldbank.org/en/publication/wdr2016
About the authors
Lyazzat AKILZHANOVA,
PhD student at Karaganda University of Kazpotrebsoyuz. Former Deputy Akim
(Mayor) of the city of Karaganda. Holds degrees in Law and Economics, as well
as a Master’s degree in Public and Local Administration. She has extensive
professional experience, including positions in the Parliament of the Republic of
Kazakhstan and in local executive bodies.
Research interests: local governance, administrative law, public policy, and legal
regulation of regional development.
ORCID ID: 0000-0002-6326-6565
Dinara JAKUPOVA,
Assistant Professor at the Department of History of Kazakhstan and Socio-Political
Disciplines, Karaganda Medical University. From 2015 to 2017, she served as
Director of the Research Institute for Patriotic Education and Assistant to the Vice-
Rector for Educational Work at Karaganda State Technical University.
Research interests: socio-political education, economic and legal literacy,
entrepreneurship, and academic thinking.
ORCID ID: 0000-0001-9150-5351
Zhadyra ARKENOVA,
holds the degree of Doctor of Philosophy (PhD) in State and Local Government
(specialty 6D051000). The degree was awarded by the Orders of the Chairman of
the Committee for Quality Assurance in the Sphere of Science and Higher
Education of the Ministry of Education and Science of the Republic of Kazakhstan:
No. 384 (August 10, 2023), No. 484 and 488 (September 12, 2023).
Research interests: public administration, local governance, and institutional
development.
ORCID ID: 0000-0002-3523-5489

ACCESS Journal:
Access to Science, Business, Innovation in Digital Economy
ISSN 2683-1007 (Online)
2025, 6(3), 483-497, https://doi.org/10.46656/access.2025.6.3(1)
https://journal.access-bg.org/
497
Zhansaya ZHUNISSOVA,
Lecturer at Karaganda Higher Polytechnic College. She holds degrees in Software
Engineering from Karaganda Polytechnic College (2009–2013) and in Finance
(2013–2016) & Computer Science (2016–2018) from Buketov Karaganda State
University.
Research interests: digital technologies in education, applied informatics, and IT
in vocational training.
ORCID ID: 0009-0004-6281-447X
Ainur MAZINA,
PhD, Senior Lecturer at the Department of Accounting and Auditing, Karaganda
University named after Academician E.A. Buketov. She holds a Master of
Science degree and a Doctor of Philosophy (PhD) degree.
Research interests: accounting, auditing, financial reporting, and higher
education in economics.
ORCID ID: 0000-0001-7788-7357
This work is licensed under the Creative Commons Attribution International License (CC BY)

ACCESS Journal:
Access to Science, Business, Innovation in Digital Economy
ISSN 2683-1007 (Online)
2025, 6(3), 498-512, https://doi.org/10.46656/access.2025.6.3(2)
https://journal.access-bg.org/
498
INDUSTRY DIFFERENCES IN INTELLECTUAL PROPERTY
DISCLOSURE AND CORPORATE VALUE: EVIDENCE FROM JAPAN
Eiji Hayashishita
1
*, Tetsuaki Oda2
1),2) Graduate School of Technology Management (MOT), Ritsumeikan University, Osaka, Japan
e-mails: 1) eiji.h1018@gmail.com, 2) odatetsuaki@gmail.com
Received: 15 June 2025 Accepted: 16 July 2025 Online Published: 31 July 2025
ABSTRACT
Objective: This study examines how intellectual property (IP) and intangible asset (IA) disclosure under Japan’s
Corporate Governance Code (CGC)—specifically Supplementary Principles 3.1.3 and 4.2.2—affects corporate valuation.
It focuses on disclosure behaviour across the Tokyo Stock Exchange (TSE) 33 industry sectors and its impact on financial
performance and investor evaluation. Method: Companies listed on the TSE Prime and Standard Markets were classified
into Comply and Explain groups based on their 2023 Corporate Governance Reports. Disclosure trends were analysed
across the TSE33 industry sectors. Chi-square tests assessed the independence between industry classification and
disclosure behaviour. Financial indicators such as R&D ratio, ROE, market capitalization, and PBR were compared
using the Mann–Whitney U test. A regression analysis examined the link between the comply rate and patent application
intensity using Japan Patent Office data. Results: The Comply group exhibited higher market capitalization, suggesting
a positive association between IP disclosure and investor valuation. Industry-level differences were significant, especially
in Chemicals and Other Products. A moderate positive correlation (R = 0.644, p = 0.017) was observed between patent
activity and the comply rate, indicating that innovation-active sectors tend to disclose more. Conclusion: IP/IA disclosure
correlates with higher corporate valuation and mirrors underlying innovation, with notable variation across TSE33
industries. While disclosure fosters investor confidence, risks by symbolic comply persist in highly conforming sectors.
These findings support aligning governance with intangible-driven value creation.
Keywords: Corporate Value, Intellectual Property, Information Disclosure, Corporate Governance Code, Japan
JEL classification: E22, G34, O32, O34, O53
Paper type: Research article
Citation: Hayashishita, E., Oda, T. (2025). Industry differences in intellectual property disclosure and corporate value: evidence
from Japan. Access to science, business, innovation in digital economy, ACCESS Press, 6(3), 498-512,
https://doi.org/10.46656/access.2025.6.3(2)
INTRODUCTION
In today’s knowledge-based economy, the foundation of company value and sustainable competitive
advantage has increasingly shifted from tangible assets to intangible assets (IA), such as intellectual property
(IP), human capital, brand equity, and proprietary technologies. As companies move from manufacturing-
centric toward innovation-driven business models, their ability to manage, invest in, and transparently disclose
IA has become a critical determinant of long-term success.
This structural transformation is clearly reflected in global capital markets. Tomo (2022) reports that, as of
2020, IA accounted for approximately 90% of the total corporate value of U.S. companies listed on the S&P
500, and about 75% for European companies on the S&P 350. Similarly, Brand Finance (2019) estimated the
total value of IA assets held by S&P 500 companies at a record USD 21 trillion in 2018—an increase of 128%
1
Corresponding author, Eiji Hayashishita – eiji.h1018@gmail.com

ACCESS Journal:
Access to Science, Business, Innovation in Digital Economy
ISSN 2683-1007 (Online)
2025, 6(3), 498-512, https://doi.org/10.46656/access.2025.6.3(2)
https://journal.access-bg.org/
499
from 2005. Notably, in the same year, leading technology companies such as Microsoft and Facebook
disclosed that over 95% of their market capitalization was derived from IA. These trends underscore a growing
consensus among investors that IP and other IA serve as primary drivers of corporate value.
Although corporate value can be defined from various perspectives, market capitalization remains one of
the most widely used metrics, as it reflects investor expectations and perceived company worth. The increasing
influence of IP on market capitalization suggests that investors are integrating IA elements—often
underrepresented in conventional financial statements—into their valuation models (Choi et al., 2000).
Moreover, the materiality and visibility of IA vary significantly across industries (Qureshi, 2017). For
instance, sectors such as pharmaceuticals are highly dependent on IA resources, while traditional
manufacturing industries rely more heavily on physical assets. These sectoral differences imply that investor
perceptions and market valuations of intangibles are likely to differ according to industry-specific
characteristics.
JAPAN’S CORPORATE GOVERNANCE CODE
Japan’s Corporate Governance Code (CGC) was introduced by the Tokyo Stock Exchange (TSE) in June
2015 as a set of guidelines for listed companies, outlining core principles of corporate governance while
allowing flexibility in implementation based on each company’s specific circumstances. The overarching
objective of the CGC is to enhance economic stability and promote the sustainable growth of companies that
adopt its principles. The phrase “to achieve sustainable growth and increase corporate value over the medium
to long term” (TSE, 2021a) is frequently cited in the Code and often referenced in corporate governance
disclosures.
The CGC comprises five fundamental principles: (1) securing the rights and equal treatment of
shareholders; (2) appropriate cooperation with stakeholders other than shareholders; (3) ensuring appropriate
information disclosure and transparency; (4) responsibilities of the board; and (5) dialogue with shareholders.
These are further specified into 31 principles and 47 supplementary principles. The Code adopts a “comply or
explain” framework, permitting companies to deviate from specific principles provided that a reasonable
explanation is offered. It is subject to periodic revision to reflect evolving market dynamics and societal
expectations, with major updates in 2018 and, most recently, in June 2021.
While the 2018 revision encouraged proactive governance initiatives, the 2021 revision introduced more
prescriptive requirements, aligning closely with the structural reforms accompanying the launch of the TSE
Prime Market in April 2022. As stated in TSE (2021b):
“The Prime Market is expected to be a market attractive to both domestic and global investors... Therefore,
it is important for companies listed on the Prime Market to advance efforts toward a higher level of corporate
governance.”
This highlights the CGC’s dual role as both a governance framework and a strategic mechanism for
enhancing investor confidence in Japanese capital markets.
ACCESS Journal:
Access to Science, Business, Innovation in Digital Economy
ISSN 2683-1007 (Online)
2025, 6(3), 498-512, https://doi.org/10.46656/access.2025.6.3(2)
https://journal.access-bg.org/
500
The 2021 revision also marked the first explicit inclusion of IA, including IP, in the CGC. Supplementary
Principle 4.2.2 requires boards of directors to oversee the allocation of management resources and the
formulation of business portfolio strategies with consideration for IA investments to support sustainable
growth. In parallel, Supplementary Principle 3.1.3 calls for the disclosure of clear, specific information
regarding IP and IA investments in alignment with each company’s business strategy and key management
challenges.
These developments reflect a growing emphasis on “sustainability” and “IP/IA strategies” as central themes
in corporate governance, especially in the wake of the COVID-19 pandemic. Enhanced transparency in these
areas is expected to reduce information asymmetry between companies and investors, thereby improving
corporate valuation.
Recent research by Hayashishita et al. (2025) indicates that effective IP/IA disclosure reduces information
asymmetry, enhances market valuation, and ultimately contributes to long-term corporate value in Japan.
However, the degree to which such disclosure influences valuation remains insufficiently understood—
particularly considering industry-specific differences. Variations in business models, asset structures, and
innovation intensity suggest that the impact of IP/IA disclosure may differ substantially across sectors.
Given this context, the present study aims to clarify how the relationship between IP/IA disclosure and
corporate valuation varies by industry. By classifying companies according to their disclosure status under
Supplementary Principles 3.1.3 and 4.2.2 and analysing sectoral differences across the 33 industry sector
classifications defined by the TSE, this study seeks to provide a more nuanced understanding of how IP/IA
contribute to corporate value under varying industrial conditions.
LITERATURE REVIEW
Dancaková (2022) conducted a comparative analysis of the impact of intangible assets on company market
value across different countries and industries. The study examined 250 listed companies in France, Germany,
and Switzerland, focusing on four major sectors: manufacturing, information and communications,
professional and technical services, and finance and insurance. The analysis considered various intangible
components disclosed through financial statements, including R&D expenditures, patents, and trademarks.
The findings revealed significant cross-country and cross-industry differences in how intangible assets and
innovation activities influence company valuation.
Qureshi (2017) analysed companies in the United Kingdom between 1998 and 2003 to investigate how the
market values different types of intangible investments—such as goodwill, R&D, and advertising. The study
found that market valuation varied significantly depending on company-specific characteristics, including
industry classification (manufacturing vs. non-manufacturing), company size (large vs. small), and
profitability (profitable vs. unprofitable). These results underscore the context-dependent nature of intangible
asset valuation, which is shaped by both internal and external structural factors.

ACCESS Journal:
Access to Science, Business, Innovation in Digital Economy
ISSN 2683-1007 (Online)
2025, 6(3), 498-512, https://doi.org/10.46656/access.2025.6.3(2)
https://journal.access-bg.org/
501
King et al. (2024) explored the use of the market-to-book ratio (MBR) as a proxy for intangible value
among U.S. listed companies. Their findings showed that industries heavily reliant on intangible assets—
particularly the pharmaceutical sector—tend to exhibit substantially higher MBRs than industries grounded in
tangible assets, such as the materials sector. The study concluded that the influence of intangible assets on
company valuation varies considerably across sectors, reflecting differences in innovation intensity and
dependence on non-physical capital.
Taken together, prior research consistently demonstrates that the contribution of intangible assets to
corporate valuation is neither uniform nor universal, but rather highly contingent on industry structure,
innovation strategy, and asset composition. Building on this foundation, the present study aims to examine the
industry-specific impact of IP and IA disclosure on company valuation in the Japanese context. By comparing
financial characteristics between companies that disclose such information and those that do not, this study
seeks to clarify how disclosure practices influence corporate value across industrial sectors.
METHODOLOGY
The subjects of this study are companies listed on the Tokyo Stock Exchange (TSE) Prime and Standard
Markets. This is because the TSE requires companies listed on the Prime and Standard Markets to apply all
principles of the CGC. Corporate information was extracted and collected using the comprehensive corporate
information database EOL by I-N Information Systems, Ltd. In a text search of the Corporate Governance
Report 2023, companies that had "intellectual property" written in the disclosure items based on each principle
of the code were classified into the comply group, and companies that had "intellectual property" written in
the item for the reason for NOT disclosing each principle of the code were classified into the explain group.
The number of companies analysed is shown in Table 1. Additionally, financial data from the 2023 securities
reports of each selected company was extracted and combined.
To assess industry-level differences, companies were classified into 33 industry sectors as defined by the
TSE. This classification enabled a cross-industry analysis of IP/IA-related disclosure behaviour.
For all 33 industry sectors, financial indicators were compared between the Comply and Explain groups to
examine the relationship between disclosure behaviour and industry sector level characteristics relevant to IP
/IA disclosure. Based on the results, four industries—Construction, Chemicals, Other Products, and Retail
Trade—demonstrated were selected for further in-depth analysis.
The financial indicators analysed included the following:
Market capitalization (Market Cap)
R&D ratio (R&D cost-to-sales ratio),
Return on equity (ROE)
Price-to-book ratio (PBR)
Market capitalization was log-transformed to normalize its distribution and reduce the influence of extreme
values. R&D rate was included to capture technological innovation and new product development. Prior

ACCESS Journal:
Access to Science, Business, Innovation in Digital Economy
ISSN 2683-1007 (Online)
2025, 6(3), 498-512, https://doi.org/10.46656/access.2025.6.3(2)
https://journal.access-bg.org/
502
research has shown a positive relationship between R&D activity and the extent of IP disclosure (Lin et al.,
2024). ROE, calculated as net income divided by shareholders’ equity, was used as a measure of profitability
and capital efficiency. It is widely recognized as a key indicator in investor evaluations (Edori et al., 2024;
Adelicia et al., 2023).
Market capitalization and PBR were adopted as proxies for investor valuation. PBR, calculated by dividing
market capitalization by net assets, reflects the company’s market value relative to its book value. A PBR
above 1 is often interpreted as an indication of intangible value or anticipated future profitability stemming
from non-financial capital, such as intellectual property (Yanagi et al., 2017).
Furthermore, to assess the actual state of IP-related activities, this study drew on data from the Survey on
Patent Application Trends by Industry published by the Japan Patent Office (JPO). Based on this dataset, we
analysed the number of patent applications by industry in 2022 and examined their correlation with patterns
of disclosure behaviour.
Table 1. The number of companies analysed
Market
Comply group
Explain group
Total
TSE Prime
925
161
1086
TSE Standard
529
304
833
Total
1454
465
1919
Source: Compiled by the authors
ANALYTICAL METHOD
To determine whether disclosure behaviour is independent of industry classification, a chi-square test of
independence was conducted using data from the 33 industry sectors defined by TSE.
To further examine industry-specific disclosure trends, the Comply Rate—defined as the proportion of
companies within each industry that belong to the Comply group—was calculated. This enabled cross-industry
comparisons to identify notable patterns and deviations in disclosure behaviour.
To compare financial indicators between the Comply and Explain groups, the normality of each variable
was tested using the Shapiro–Wilk test. As most variables were not normally distributed, the Mann–Whitney
U test was employed as a non-parametric test. it is robust to deviations from normality and less sensitive to
outliers, making it suitable for the analytical objectives of this study.
To account for differences in industry size, the average number of patent applications per company was
calculated by dividing the total number of applications in each industry by the number of companies in that
industry. This standardization allowed for meaningful comparisons of IP activity across industries of varying
scale.
Finally, a simple linear regression analysis was conducted to assess the relationship between the average
number of patent applications per company and the comply rate across industries.
All statistical analyses were performed using IBM SPSS Statistics, Version 29.0.0.0.

ACCESS Journal:
Access to Science, Business, Innovation in Digital Economy
ISSN 2683-1007 (Online)
2025, 6(3), 498-512, https://doi.org/10.46656/access.2025.6.3(2)
https://journal.access-bg.org/
503
RESULTS
Table 2 presents the distribution of Comply and Explain groups across the 33 industries classified by the Tokyo
Stock Exchange (TSE), along with the standardized residuals derived from the chi-square test. The comply
rate—defined as the percentage of companies in each industry classified into the Comply group—is also
reported.
(1) High comply Group: Comply Rate ≥ 85%
Industries such as Marine Transportation, Air Transportation, Mining, Electric Power and Gas, and
Insurance exhibited full comply, with 100% of companies choosing to comply.
Other industries with comply rates of 85% or higher included Banks, Pharmaceuticals, Nonferrous Metals,
Iron and Steel, Construction, Pulp and Paper, and Other Financing Business.
(2) Moderate comply Group: Comply Rate 70–84%
Industries falling within this range included Transportation Equipment, Chemicals, Machinery, Textiles
and Apparels, Electric Appliances, Glass and Ceramic Products, Rubber Products, Precision Instruments,
Metal Products, Wholesale Trade, Warehousing and Harbor Transportation Services, Other Products, Foods,
Fisheries, Agriculture and Forestry, Oil and Coal Products, Information and Communication, and Land
Transportation.
(3) Low comply Group: Comply Rate < 70%
Industries with relatively low comply rates included Services, Retail Trade, Securities and Commodities
Futures, and Real Estate.
A chi-square test of independence was conducted to examine the association between industry classification
and IP disclosure behaviour across the 33 TSE industry sectors. The result indicated a statistically significant
association between industry sector and disclosure status: χ²(21, N = 1798) = 66.916, p < .001.
In accordance with the assumptions of the chi-square test, 11 industry sectors with expected cell frequencies
below 5 were excluded from the analysis. These included: Marine Transportation, Air Transportation, Mining,
Electric Power and Gas, Insurance, Pulp and Paper, Other Financing Business, Rubber Products, Warehousing
and Harbor Transportation Services, Fisheries, Agriculture and Forestry, and Oil and Coal Products. This
exclusion was necessary to satisfy the test assumptions and ensure statistical reliability.
The table presents the standardized residuals from the chi-square test. Industries with statistically significant
differences, defined as those with standardized residuals exceeding ±1.96, included Banks, Pharmaceuticals,
Construction, Retail Trade, Securities and Commodities Futures, and Real Estate. Positive values mean that
the observed values were more than the expected values, and negative values mean that the observed values
were less than the expected values.
In industry sectors with a 100% compliance rate, no companies were classified as "Explain," and thus,
financial data comparisons could not be conducted. For the remaining sectors, the non-parametric Mann–
Whitney U test was employed to examine differences in the median financial indicators between the Comply

ACCESS Journal:
Access to Science, Business, Innovation in Digital Economy
ISSN 2683-1007 (Online)
2025, 6(3), 498-512, https://doi.org/10.46656/access.2025.6.3(2)
https://journal.access-bg.org/
504
and Explain groups. Results are presented for the Construction, Chemicals, Other Products, and Retail Trade
sectors, where notable differences were observed.
Table 2. Distribution of Comply and Explain Groups across TSE 33 Industries
TSE 33 Industry Sectors
Comply group
Explain group
Total
Comply
Rate [%]
Observed
Frequency
Standardized
Residual
Observed
Frequency
Standardized
Residual
(1)
Marine Transportation
6
N/A
0
N/A
6
100
Air Transportation
3
N/A
0
N/A
3
100
Mining
4
N/A
0
N/A
4
100
Electric Power and Gas
20
N/A
0
N/A
20
100
Insurance
7
N/A
0
N/A
7
100
Banks
43
3.5
1
-3.5
44
97.7
Pharmaceuticals
28
2.7
1
-2.7
29
96.6
Nonferrous Metals
19
1.6
2
-1.6
21
90.5
Iron and Steel
20
1.3
3
-1.3
23
87.0
Construction
68
2.3
11
-2.3
79
86.1
Pulp and Paper
12
N/A
2
N/A
14
85.7
Other Financing Business
17
N/A
3
N/A
20
85.0
(2)
Transportation Equipment
50
1.3
11
-1.3
61
82.0
Chemicals
112
1.4
28
-1.4
140
80.0
Machinery
119
1.4
30
-1.4
149
79.9
Textiles and Apparels
27
0.6
7
-0.6
34
79.4
Electric Appliances
120
1.2
32
-1.2
152
78.9
Glass and Ceramics Products
26
0.5
7
-0.5
33
78.8
Rubber Products
11
N/A
3
N/A
14
78.6
Precision Instruments
24
0.0
8
0.0
32
75.0
Metal Products
39
0.0
13
0.0
52
75.0
Wholesale Trade
124
-0.4
44
0.4
168
73.8
Warehousing and Harbor Transportation
14
N/A
5
N/A
19
73.7
Other Products
43
-0.4
16
0.4
59
72.9
Foods
57
-0.6
22
0.6
79
72.2
Fishery, Agriculture and Forestry
5
N/A
2
N/A
7
71.4
Oil and Coal Products
5
N/A
2
N/A
7
71.4
Information and Communication
140
-1.5
58
1.5
198
70.7
Land Transportation
28
-0.8
12
0.8
40
70.0
(3)
Services
123
-1.9
55
1.9
178
69.1
Retail Trade
92
-3.0
50
3.0
142
64.8
Securities and Commodities
Futures
14
-1.2
8
1.2
22
63.6
Real Estate
34
-3.9
29
3.9
63
54.0
Total
1454
465
1919
75.8
Source: Author's analysis

ACCESS Journal:
Access to Science, Business, Innovation in Digital Economy
ISSN 2683-1007 (Online)
2025, 6(3), 498-512, https://doi.org/10.46656/access.2025.6.3(2)
https://journal.access-bg.org/
505
The results for the Construction sector are presented in Table 3. Market capitalization was significantly
higher in the Comply group (median = 24.20) than in the Explain group (median = 23.07), Z = –2.019, p = .044.
No significant differences were found between the two groups in the research and development cost-to-sales
ratio (R&D ratio) (Z = –0.381, p = .703), return on equity (ROE) (Z = –0.691, p = .489), or price-to-book ratio
(PBR) (Z = –1.188, p = .235).
Table 3. Mann-Whitney U Test Result (Construction)
Comply group
Explain group
Z
p
Indicator
N=68
N=11
Median
(Q1‐Q3)
Median
(Q1-Q3)
Market Cap
24.20
23.08-25.54
23.07
22.35-23.80
-2.019
.044
R&D ratio
0.28
0.13-0.61
0.32
0.08-0.63
-0.381
.703
ROE
6.90
4.17-8.81
5.89
1.55-8.08
-0.691
.489
PBR
0.86
0.55-1.16
0.68
0.41-0.95
-1.188
.235
Source: Authors’ own analysis
The results for the Chemicals sector are presented in Table 4. Market Cap was significantly higher in the
Comply group (median = 24.65) than in the Explain group (median = 22.95), Z = –4.058, p < .001. The R&D
ratio was also significantly higher in the Comply group (median = 2.89) than in the Explain group (median =
1.94), Z = –3.222, p = .001. No significant differences were observed between the two groups in ROE (Z = –
0.151, p = .880) or PBR (Z = –1.545, p = .122).
Table 4. Mann-Whitney U Test Result (Chemicals)
Comply group
Explain group
Z
p
Indicator
N=112
N=28
Median
(Q1‐Q3)
Median
(Q1-Q3)
Market Cap
24.65
23.61-26.09
22.95
22.42-24.43
-4.058
<.001
R&D ratio
2.89
1.65-3.99
1.94
0.32-2.80
-3.222
.001
ROE
6.63
3.39-10.11
6.41
4.05-10.79
-0.151
.880
PBR
1.01
0.69-1.72
0.70
0.55-1.40
-1.545
.122
Source: Authors’ own analysis
The results for the Other Products sector are presented in Table 5. Market Cap was significantly higher in
the Comply group (median = 24.81) than in the Explain group (median = 22.60), Z = –3.120, p = .002. The
R&D ratio was also significantly higher in the Comply group (median = 1.50) than in the Explain group
(median = 0.67), Z = –2.262, p = .024. No significant difference was observed in ROE between the two groups

ACCESS Journal:
Access to Science, Business, Innovation in Digital Economy
ISSN 2683-1007 (Online)
2025, 6(3), 498-512, https://doi.org/10.46656/access.2025.6.3(2)
https://journal.access-bg.org/
506
(Z = –1.802, p = .071). In contrast, PBR was significantly higher in the Comply group (median = 1.27) than in
the Explain group (median = 0.60), Z = –2.694, p = .007.
Table 5. Mann-Whitney U Test Result (Other Products)
Comply group
Explain group
Z
p
Indicator
N=43
N=16
Median
(Q1‐Q3)
Median
(Q1-Q3)
Market Cap
24.81
22.57-25.67
22.60
21.97-23.25
-3.120
.002
R&D ratio
1.50
0.53-3.07
0.67
0.29-1.25
-2.262
.024
ROE
7.78
2.72-11.06
3.97
-0.24-7.34
-1.802
.071
PBR
1.27
0.71-2.75
0.60
0.40-1.00
-2.694
.007
Source: Authors’ own analysis
The results for the Retail Trade sector are presented in Table 6. Market Cap was significantly higher in the
Comply group (median = 24.58) than in the Explain group (median = 22.91), Z = –4.813, p < .001.
No significant difference was found in the R&D ratio between the two groups (Z = –1.519, p = .129). ROE
was also not significantly different (Z = –0.078, p = .938), nor was PBR (Z = –0.593, p = .553).
Table 6. Mann-Whitney U Test Result (Retail Trade)
Comply group
Explain group
Z
p
Indicator
N=92
N=50
Median
(Q1‐Q3)
Median
(Q1-Q3)
Market Cap
24.58
23.20-25.72
22.91
21.76-24.12
-4.813
<.001
R&D ratio
0.05
0.01-0.22
0.15
0.10-0.26
-1.519
.129
ROE
6.74
2.91-11.59
6.69
0.37-13.27
-0.078
.938
PBR
1.45
0.84-2.80
1.60
0.98-3.66
-0.593
.553
Source: Authors’ own analysis
Table 7 presents the distribution of annual patent applications by industry for the year 2022. To account for
differences in industry size, the number of applications was standardized by dividing by the number of
companies in each industry, resulting in the number of applications per company, which is shown in
descending order. It should be noted that the industry classifications used by the Japan Patent Office (JPO)
differ from the 33-industry classification employed by the Tokyo Stock Exchange (TSE).
Industries were categorized into three groups based on the average number of patent applications per
company. Patent application intensity varied considerably across industries, as shown in the following
classification based on the average number of patent applications per company:
(A) High-intensity group (100 or more applications per company)
Transportation Equipment, Electric Appliances, Iron, Steel and Nonferrous Metals, Precision Instruments.

ACCESS Journal:
Access to Science, Business, Innovation in Digital Economy
ISSN 2683-1007 (Online)
2025, 6(3), 498-512, https://doi.org/10.46656/access.2025.6.3(2)
https://journal.access-bg.org/
507
(B) Medium-intensity group (50–99 applications per company)
Chemicals, Other Products, Machinery.
(C) Low-intensity group (fewer than 50 applications per company)
Textiles and Apparels, Pulp and Paper, Glass and Ceramics Products, Non-Manufacturing industry,
Construction, Public Research Institutions, Metal Products, Foods, Information and Communications,
Pharmaceuticals, Individuals, Wholesale Trade and Retail Trade.
These results highlight substantial variation in patenting activity across industry sectors.
Table 7. Distribution of Annual Patent Applications by Industry Sectors
To further examine the relationship between comply behaviour and innovation activity, Figure 1 was
created using data from Table 2 (Comply Rate) and Table 7 (Patent Applications per Company). The figure
includes only industries with comply rates of 84% or lower, excluding those in Group (1), which showed
uniformly high comply rate and were therefore interpreted separately in the analysis. Figure 1 demonstrates a
moderate positive correlation between the average number of patent applications per company and the comply
rate. This correlation was statistically significant (R = 0.644, R² = 0.415, p = 0.017).
Industry Sectors
Number
of Companies
Patent
Application
Patent
Applications
per Company
(A)
Transportation Equipment
125
21813
174.5
Electric Appliances
276
43235
156.6
Iron, Steel and Nonferrous Metals
61
6467
106.0
Precision Instruments
93
9718
104.5
(B)
Chemicals
202
15512
76.8
Other Products
189
10284
54.4
Machinery
186
9752
52.4
(C)
Textiles and Apparels, Pulp and Paper
62
2505
40.4
Glass and Ceramics Products
191
7514
39.3
Non-Manufacturing industry
321
12437
38.7
Construction
135
4057
30.1
Public Research Institutions
276
8010
29.0
Metal Products
106
2576
24.3
Foods
139
1729
12.4
Information & Communication
209
2548
12.2
Pharmaceuticals
77
785
10.2
Individuals
83
217
2.6
Wholesale Trade, Retail Trade
387
427
1.1
Total
3118
159588
51.2
Source: JPO (2024) and author’s calculation

ACCESS Journal:
Access to Science, Business, Innovation in Digital Economy
ISSN 2683-1007 (Online)
2025, 6(3), 498-512, https://doi.org/10.46656/access.2025.6.3(2)
https://journal.access-bg.org/
508
Figure 1. Relationship between Comply Rate and Patent Application per Company
Source: Authors’ own analysis
DISCUSSION
(1) High Comply Rate Group (Comply Rate: ≥ 85%)
A high comply rate—indicating that most companies within an industry adopt each principle of the
Corporate Governance Code (CGC)—aligns with the underlying objectives of the CGC and can be viewed as
desirable from a governance perspective. The supplementary principles analysed in this study specifically
concern the disclosure of intellectual property (IP) and other intangible assets (IA). For companies in the
Comply group, appropriate disclosure may reduce information asymmetry with investors, thereby contributing
to more accurate corporate valuation.
Although this group contains few Explain group companies, limiting the scope for statistical comparison,
the Construction displayed a significant difference in market capitalization between Comply and Explain
groups. This suggests that comply is positively associated with investor perception. In Construction, patents
protect innovations in building materials and construction methods, supporting companies' technological
superiority (Goy, 2024).
Similarly, the Pharmaceuticals is fundamentally dependent on patent protection, making IP and IA
particularly critical for company competitiveness (Saha et al., 2011).
However, instances of superficial or symbolic comply have been noted. Furuta (2024) argues that
companies may choose to formally comply—rather than provide explanations—out of concern for potential
negative investor reactions. All 100 companies in the TOPIX 100 index opted for "Comply" with
Supplementary Principle 3.1.3, suggesting the possibility of formal comply without substantive disclosure.
(2) Moderate Comply Rate Group (Comply Rate: 70–84%)

ACCESS Journal:
Access to Science, Business, Innovation in Digital Economy
ISSN 2683-1007 (Online)
2025, 6(3), 498-512, https://doi.org/10.46656/access.2025.6.3(2)
https://journal.access-bg.org/
509
This group mainly comprises manufacturing industries characterized by intense competition and many
companies, providing a robust basis for statistical comparisons.
In the Chemicals, significant differences were observed between the Comply and Explain groups in both
market capitalization and R&D ratio. The companies in the Comply group tend to invest more heavily in R&D,
a behaviour that appears to be rewarded by investors through higher market valuations. However, ROE and
PBR did not differ significantly. This may be due to the high proportion of tangible assets typical of Japanese
manufacturing sectors such as chemicals, which depresses the total asset turnover ratio for Comply companies
(Hayashishita et al., 2025).
The Other Products exhibited significant differences not only in market capitalization and R&D investment
but also in PBR. Notably, the Comply group includes globally prominent companies such as Nintendo (3.72,
PBR as of 2023)—recognized for its proprietary game IP and hardware platforms—Yamaha (2.85) and Roland
(4.60) in the musical instrument sector, and ASICS (13.87) and YONEX (3.02) in the sports equipment market.
These companies have high PBRs, reflecting strong investor confidence. Their brand power and technological
capabilities illustrate how IP and IA drive global competitiveness.
(3) Low Comply Rate Group (Comply Rate: < 70%)
In the Retail Trade, market capitalization differed significantly between Comply and Explain groups,
indicating relatively stronger investor confidence in Comply groups. However, retail businesses typically offer
similar products, making product-level patent protection difficult. Competitive differentiation in this sector
often depends on price, service, or location, rather than technological innovation. Moreover, IA such as store
layout or customer service methods are easily imitated and offer limited sustainable advantage. Industries with
comply rates below 70%—such as Services, Retail Trade, Securities and Commodities Futures, and Real
Estate—exhibit relatively low levels of IP activity, which likely contributes to the higher prevalence of Explain
responses.
Across all industries, the consistent finding of significant differences in market capitalization between
Comply and Explain groups suggests that comply with disclosure-related principles is positively evaluated by
investors. This reinforces the importance of IP in enhancing company competitiveness.
However, within the high comply group, Group (1), including Pharmaceuticals and Construction, the
average number of patent applications per company are low (fewer than 50 annually). This suggests a strategic
emphasis on patent quality rather than quantity, reflecting a "selective" IP approach.
By contrast, the moderate comply group, Group (2), includes sectors in which companies file more than 50
or even 100 patent applications per year. As articulated in Hitachi’s Five Fighting Patents (5FP) strategy
(Hitachi, 2009), competitive manufacturing environments may demand not only strong patent content but also
large patent portfolios as a defensive mechanism.
Figure 1 demonstrates a statistically significant moderate positive correlation between Comply Rate and
the average number of patent applications per company (R = 0.644, R² = 0.415, p = 0.017). A higher number
of patent applications typically reflects a larger IP portfolio, which enables companies to differentiate
ACCESS Journal:
Access to Science, Business, Innovation in Digital Economy
ISSN 2683-1007 (Online)
2025, 6(3), 498-512, https://doi.org/10.46656/access.2025.6.3(2)
https://journal.access-bg.org/
510
themselves and more confidently choose to comply with disclosure-related principles. These findings provide
empirical support for the link between IP activity and disclosure behaviour.
CONCLUSION
This study investigated the relationship between the disclosure of intellectual property (IP) and intangible
assets (IA) and corporate valuation across 33 industries listed on the Tokyo Stock Exchange (TSE), with a
particular emphasis on comply with Japan’s Corporate Governance Code (CGC), specifically Supplementary
Principles 3.1.3 and 4.2.2. companies were categorized into Comply and Explain groups based on their
disclosure behaviour, and statistical analyses were conducted to examine the association between disclosure
practices and financial performance indicators.
The findings indicate that comply with IP/IA-related disclosure principles is generally associated with
higher market capitalization, suggesting that investors respond positively to companies that actively disclose
IA. However, the strength of this association varies considerably across industries. Manufacturing sectors—
such as Chemicals and Other Products—exhibited significant differences not only in market capitalization but
also in R&D ratio and price-to-book ratios (PBR), highlighting the strategic value of IP in technology-driven
and highly competitive sectors.
In contrast, industries such as Retail Trade and Services, where opportunities for patentable innovation are
limited and competition is often based on pricing or customer experience, displayed lower comply rates and
weaker links between disclosure and financial outcomes. These sectoral variations underscore the context-
dependent materiality of IP/IA disclosure and its differentiated impact across business models.
Importantly, the analysis revealed a moderate, statistically significant positive correlation between the
average number of patent applications per company and the comply rate. This suggests that companies with
active IP strategies are also more inclined to comply with disclosure-related CGC principles, reinforcing the
idea that disclosure behaviour is closely aligned with underlying innovation activities.
While the CGC aims to enhance corporate transparency and long-term value creation, this study also
acknowledges the possibility of symbolic or formalistic comply, particularly in sectors with near universal
comply.
In sum, this study provides empirical evidence that IP/IA disclosure practices are not only influenced by
industry characteristics but also have meaningful implications for how companies are perceived and valued in
capital markets. These insights offer practical implications for corporate managers, investors, and
policymakers seeking to improve disclosure quality and leverage IP/IA as a foundation for sustainable growth
and competitive advantage.
Conflict of interests: The authors declare no conflict of interest.
ACCESS Journal:
Access to Science, Business, Innovation in Digital Economy
ISSN 2683-1007 (Online)
2025, 6(3), 498-512, https://doi.org/10.46656/access.2025.6.3(2)
https://journal.access-bg.org/
511
Author Contributions: Conceptualization, E.H. and T.O.; methodology, E.H. and T.O.; investigation, E.H.;
project administration, E.H. and T.O.; data curation, E.H.; resources, E.H. and T.O.; supervision, T.O.;
validation, T.O.; writing—original draft preparation, E.H.; writing—review and editing, E.H. and T.O. All
authors have read and agreed to the published version of the manuscript.
Funding /Acknowledgement
This research was supported by a grant-in-aid from Zengin Foundation for Studies on Economics and Finance.
Institutional Review Board Statement: Not applicable.
Informed Consent Statement: Not applicable.
Data Availability Statement: The data presented in this study are available on request from the corresponding
author. The data are not publicly available due to privacy issues.
References
Adelicia, C., Salsabila, W.G., Mohammad, W. (2023), The Effect of Earning per Share (EPS) and Return on Equity
(ROE) on the LQ 45 Company’s Stock Price, Himeka: Journal of Interdisciplinary Social Sciences, Vol.1, No.1,
2023, pp. 22-29
Brand Finance (2019). Global Intangible Finance Tracker (GIFT)—An Annual Review of the World’s Intangible Value,
2019, Brand Finance, Available online: https://brandfinance.com/wp-content/uploads/1/gift_2.pdf (accessed on
February 12, 2025)
Choi, W. W, Kwon, S.S, Lobo, G.J. (2000). Market Valuation of Intangible Assets. Journal of Business Research, Volume
49, Issue 1, July 2000, Pages 35-45, DOI: 10.1016/S0148-2963(98)00121-0
Dancaková, D., Sopko, J., Glova, J., Andrejovská, A. (2022). The Impact of Intangible Assets on the Market Value of
Companies: Cross-Sector Evidence. Mathematics, 10, 3819. DOI: 10.3390/math10203819
Edori D.S., Egileoniso D.J. (2024), Financial Performance and Investment Decision: Evidence from Investors and
Stockbrokers in Nigeria, World Journal of Finance and Investment Research, Vol.8, no.1, pp. 49-63, DOI:
10.56201/wjfir.v8.No.1, 2024.pg49.63
Furuta. K. (2024). An Empirical Study of Japan’s Corporate Governance Code: The Effectiveness of Soft Law.
RitsumeikanHosei 2024- 22, pp 1-46. Available online: https://www.ritsumei.ac.jp/acd/cg/law/lex//hosei-
22/001furuta.pdf (in Japanese) (accessed on June 14, 2025)
Goy, V. (2024). The Role of Intellectual Property in the Formation of Market Value of Construction Companies. Economy
and Society, 61. DOI: 10.32782/2524-0072/2024-61-87
Hayashishita, E., Oda, T. (2025). Intellectual property disclosure and corporate value in Japan. Access to science, business,
innovation in digital economy, ACCESS Press, 6(2), 464-476, DOI:10.46656/access.2025.6.2(13)
Hitachi (2009). Hitachi no Chizai Senryaku. Hitachi Ltd. 2009. Retrieved from
https://www.hitachi.co.jp/IR/library/presentation/090422-2.pdf (in Japanese) (accessed on June 14, 2025)
JPO (2024). Survey of Intellectual Property Activities. Tokyo: Japan Patent Office, 2024. Retrieved from
https://www.jpo.go.jp/resources/statistics/chizai_katudo/2024/index.html (in Japanese) (accessed on June 14, 2025)
King, Z., Linsmeier, T. J., Wangerin, D.D. (2024). Differences in the value relevance of identifiable intangible Assets.
Review of Accounting Studies (2024) 29:3838–3886. DOI: 10.1007/s11142-023-09810-8
Lin, Y., Ye, J. (2024). The impact of corporate R&D on the transformation of intellectual property into intangible assets,
Finance Research Letters, Vol. 70, DOI: 10.1016/j.frl.2024.106337

ACCESS Journal:
Access to Science, Business, Innovation in Digital Economy
ISSN 2683-1007 (Online)
2025, 6(3), 498-512, https://doi.org/10.46656/access.2025.6.3(2)
https://journal.access-bg.org/
512
Qureshi, M. I. (2017). The value relevance of intangibles: some evidence on industry sector, firm performance and size
effects. International Journal of Accounting, Auditing and Performance Evaluation, Vol. 13, No. 3, pp 293-307.
DOI: 10.1504/IJAAPE.2017.085184
Saha, C. N., Bhattachaya, S. (2011). Intellectual property rights: An overview and implications in pharmaceutical industry.
Journal of Advanced Pharmaceutical Technology & Research, Vol 2, Issue 2, pp 88-93. DOI: 10.4103/2231-
4040.82952
Tomo (2022). Intangible Asset Market Value Study Report 12 28 22, Ocean Tomo Investment Group, 2022, Available
online: https://oceantomo.com/intangible-asset-market-value-study/ (accessed: 20 February 2025)
TSE (2021a). Japan’s Corporate Governance Code, Tokyo Stock Exchange, Inc., Japan, Retrieved from
https://www.jpx.co.jp/english/equities/listing/cg/tvdivq0000008jdy-att/20210611.pdf (accessed: Feb. 12, 2025)
TSE (2021b). Revisions of Japan’s Corporate Governance Code and Guidelines for Investor and Company Engagement,
Tokyo Stock Exchange, Inc., Japan, Retrieved https://www.jpx.co.jp/english/equities/listing/cg/tvdivq0000008jdy-
att/b5b4pj00000436l7.pdf (accessed: Feb 12, 2025)
Yanagi, R., Yoshino, T. (2017), Consideration of the relationship between human capital, intellectual capital and
enterprise value (PBR), [Jinteki shihon chiteki shihon to kigyō kachi (PBR) no kankei-sei no kōsatsu], Gekkan
Shihon Shijo, 2017.10, No.386, pp. 4-13
About the authors
Eiji HAYASHISHITA,
Doctoral Student, Graduate School of Technology Management (MOT),
Ritsumeikan University, Osaka, Japan.
Research interests: intellectual property strategy, technology management,
business strategy.
ORCID ID: 0009-0006-3101-516X
Tetsuaki ODA,
Professor, Graduate School of Technology Management (MOT),
Ritsumeikan University, Osaka, Japan.
Research interests: intellectual property strategy, intellectual property
management, healthcare and welfare.
ORCID ID: 0000-0002-6484-8460
This work is licensed under the Creative Commons Attribution International License (CC BY)

ACCESS Journal:
Access to Science, Business, Innovation in Digital Economy
ISSN 2683-1007 (Online)
2025, 6(3), 513-531, https://doi.org/10.46656/access.2025.6.3(3)
https://journal.access-bg.org/
513
VIRTUAL TOURISM: DEVELOPMENT, TYPES AND FORMS,
OPPORTUNITIES AND DISADVANTAGES
Liudmyla Dorokhova1, Silvia Beloeva2, Nataliya Venelinova3, Dzhavid Mirzoiev4
1 University of Tartu, Tartu, Estonia
2, 3 “Angel Kanchev” University of Ruse, Ruse, Bulgaria
4 Simon Kuznets Kharkiv National University of Economics, Kharkiv, Ukraine
e-mails: 1liudmyla.dorokhova@ut.ee, 2sbeloeva@uni-ruse.bg, 3nvenelinova@uni-ruse.bg, 4javid20082@gmail.com
Received: 13 February 2025 Accepted: 13 May 2025 Online Published: 31 July 2025
ABSTRACT
Objectives: In the context of the computerization of society as a whole and the economy of the service sector in particular,
the study of virtual tourism is essential for evaluating its impact on traveler behavior and the transformation of the
traditional tourism industry in the conditions of digitalization. Analyzing virtual tourism allows us to identify its potential
for sustainable development, expanding access to cultural heritage, and reducing the burden on popular tourist
destinations. Methods/Approaches: A literature-based approach was used to analyze and summarize scientific literature
to identify key theoretical concepts and practical aspects of virtual tourism, as well as its development, features,
advantages, and limitations, compared with traditional forms of tourism. The specifics of user behavior in the case of
virtual tourism, its demand, and its impact on the tourism industry were examined. Results: A classification of virtual
tours is presented according to types, objectives, and functions, as well as the level of implementation and technologies
used. The main advantages and disadvantages of virtual tours are highlighted, along with target customer groups and
their characteristics. Conclusions: Virtual reality tourism is actively developing and successfully utilizing the latest
computer information technologies and gadgets. Virtual tourism activities represent a promising direction and a
significant part of the travel industry, its elements, and components.
Keywords: virtual tourism, virtual experience, tourism innovations, virtual reality, augmented reality.
JEL classification: L83, L86, Z32
Paper type: Research Paper
Citation: Dorokhova, L., Beloeva, S., Venelinova, N., Mirzoiev, D. (2025). Virtual tourism: development, types and forms,
opportunities and disadvantages. Access to science, business, innovation in digital economy, ACCESS Press, 6(3), 513-
531, https://doi.org/10.46656/access.2025.6.3(3)
INTRODUCTION
Virtual tourism is rapidly becoming one of the most promising and technologically advanced areas in the
modern tourism industry. In recent years, its demand has increased significantly, due to both general factors
(COVID-19, conflicts in various parts of the world) and the intensive development of virtual and augmented
reality technologies, as well as expanded access to high-speed Internet networks. (Chen et al., 2023;
Yordanova, 2023; Petrova & Tairov, 2022; Phoong et al., 2024; Petrova et al., 2025; Tairov et al., 2024). The
study by Li et al. (2022) revealed a significant positive relationship between heightened COVID-19 risk
perception and user preference for virtual tourism. Factors such as ease of use, perceived usefulness, autonomy,
and enjoyment shaped attitudes toward virtual tourism, with perceived risk directly affecting these attitudes.
Experts recognized this type of tourism as a safe alternative during crises. Some studies in one of the most
affected countries during the pandemic (China) show that the use of VR notably reduced the travel anxiety -

ACCESS Journal:
Access to Science, Business, Innovation in Digital Economy
ISSN 2683-1007 (Online)
2025, 6(3), 513-531, https://doi.org/10.46656/access.2025.6.3(3)
https://journal.access-bg.org/
514
the respondents reported lower anxiety levels after VR exposure (Wang Q et al., 2024). The findings of Chang
& Yang (2024) indicate that virtual reality tourism significantly increases hedonic and eudaemonic well-being
in long-term care residents, with presence and flow serving as mediating factors. On the other hand, the
expanding offers of virtual tourism propose environmentally sustainable tourism, mitigating physical travel’s
ecological footprint, and enlarging access to those with economic or physical barriers. In this case,
digitalization fosters better life stability and reduces the spread of risks.
Now, anyone, regardless of their location, financial situation, or physical limitations, can embark on a
journey to the most amazing corners of the planet without leaving home. Today, the study of the features of
virtual tourism is becoming especially relevant for the reasons presented in Figure 1. Below, we will take a
closer look at and analyze some of these reasons.’
Figure 1. Reasons for studying virtual tourism
Source: Author's elaboration based on literature review
The COVID-19 pandemic led to border closures and numerous travel restrictions, making traditional travel
inaccessible for many potential clients and consumers (Zeqiri, 2024; Kumar et al., 2024; Liu & Tian, 2024).
Despite the world gradually returning to its normal rhythm, interest in virtual travel remains strong, as it allows
people to explore the world safely without risking their health (Blaer, 2023; Esteban et al., 2023).
Environmental issues and the pursuit of sustainable development are driving people to seek alternative ways
to travel. Virtual tourism offers the opportunity to explore nature and cultural attractions without harming the
environment, reducing carbon emissions associated with flights and mass tourism.
The digitalization of life and technological advancements are making virtual travel more accessible and
realistic. Modern VR headsets, 3D tourism, interactive maps, and panoramic filming allow users to enjoy a
high-quality experience that closely resembles real travel (Varol & Öksüz, 2025; Hoang et al., 2023). More
and more companies and travel agencies are offering virtual tours, making them an integral part of the modern
travel industry.

ACCESS Journal:
Access to Science, Business, Innovation in Digital Economy
ISSN 2683-1007 (Online)
2025, 6(3), 513-531, https://doi.org/10.46656/access.2025.6.3(3)
https://journal.access-bg.org/
515
Virtual tourism is becoming an important tool for people with disabilities who may not always have the
opportunity to take traditional trips (Xu et al., 2023). It provides a chance to experience the joy of travel,
discover new cultures, and expand one's horizons without leaving home.
The increasing congestion of tourist destinations and overcrowding of popular attractions make finding new
ways to explore the world necessary. Virtual tours help reduce the burden on popular locations, preserving
their cultural and natural value for future generations (Nam et al., 2024).
Virtual tourism is becoming an essential part of marketing strategies for the hospitality and tourism industry
(Luo & Xia, 2024). Companies use virtual tours to attract customers, allowing them to explore hotels, resorts,
and excursions in advance (Petr & Caudan, 2024). This enhances trust and improves the customer experience
(Lin & Yeh, 2022).
Virtual tourism is becoming a powerful tool in educational technology. Virtual tours enable deeper
immersion into history, culture, and geography, making learning more engaging and interactive. They allow
students and enthusiasts to explore historical landmarks, museums, and natural wonders in a realistic and
immersive way. This approach enhances knowledge retention, fosters curiosity, and makes education more
accessible to people of all ages and backgrounds (Baker et al., 2023; Nam et al., 2023).
Students and schoolchildren can use virtual tours for educational purposes, gaining valuable knowledge in
an interactive and engaging format. These tours allow them to visit historical landmarks, museums, and cultural
sites without leaving the classroom, making learning more dynamic and immersive. Virtual tourism also
supports experiential learning by providing 360-degree views, guided narrations, and interactive elements that
enhance understanding. This technology helps bridge geographical barriers, offering access to global
educational experiences regardless of location or financial constraints (Widawski & Oleśniewicz, 2023). This
is especially relevant for educational institutions where organizing real excursions is impossible.
Virtual tourism contributes to developing small tourist destinations often overshadowed by large cities and
popular resorts. Through virtual tours, people can discover unique natural and cultural sites, attracting more
attention and tourist interest to these locations (Li et al., 2023).
Traditional tourism requires significant time, money, and careful planning. Fulfilling a travel dream is not
always possible due to budget constraints, visa issues, or even global events like pandemics. Virtual tourism
offers an alternative, allowing people to explore the world without these obstacles (Bilynets et al., 2023).
With virtual tourism, one can "visit" museums, ancient cities, mountain peaks, and even the depths of the
ocean, using only a computer, smartphone, or VR headset.
One of the main advantages of virtual tourism is its accessibility. Anyone can discover the landmarks of
different countries, stroll through the streets of Paris, explore the Egyptian pyramids, or enjoy panoramic 360-
degree views of the Grand Canyon. Many museums, such as the Louvre or the British Museum, offer virtual
tours, where users can study exhibits in great detail without spending money on tickets or travel. In this sense,
virtual tourism has immense educational value. It allows for a deeper immersion into various places' history,
culture, and geography, helping young people expand their horizons.

ACCESS Journal:
Access to Science, Business, Innovation in Digital Economy
ISSN 2683-1007 (Online)
2025, 6(3), 513-531, https://doi.org/10.46656/access.2025.6.3(3)
https://journal.access-bg.org/
516
Students and schoolchildren can use virtual tours for educational purposes, gaining valuable knowledge in
an interactive format (Zhang et al., 2023).
Despite its many advantages, virtual tourism is not without its drawbacks. It cannot fully replace real trips,
as it does not convey the sensations of immersion, smells, tastes, and physical presence. However, technology
continues to evolve, and in the future, virtual travel may become even more realistic and interactive.
Thus, virtual tourism is a promising direction that opens new opportunities for travelers, researchers, and
adventure enthusiasts. It not only makes the world more accessible but also changes the perception of
traditional ways of discovering new places. Virtual travel is becoming an integral part of modern life, and its
potential is only beginning to unfold.
MATERIALS AND METHODS
Virtual tourism as a phenomenon and concept.
Firstly, it is important to look closer at the definition and understanding of virtual tourism. Virtual tourism is
a combination of the concepts of virtual reality and tourism. Essentially, virtual tourism allows individuals to
gain some tourist experience without the need to travel or engage in specific physical actions.
Virtual tourism has various forms and levels of technological sophistication. In its simplest form, it is
represented by videos of tourist destinations. The potential tourist watches and perceives the video using their
auditory and visual senses. More complex forms of virtual tourism involve immersion in a computer-generated
artificial environment using headsets or simulators. In such cases, various technical props (gloves, shoes,
clothing elements, helmets) are used to provide additional sensations of movement (roller coasters, rally racing,
space flights), tactile experiences (vibration, touch, water splashes), smells, and sounds.
Virtual tourism uses and is technologically based on various forms of digital realities, the main ones being
virtual, augmented, and mixed reality. (Liu & Tian, 2024; Zhang et al., 2025).
Now, virtualization has gone far beyond the tourism sector and has entered everyday life (buying houses,
clothing, furniture, and interior items based on virtual experiences; virtually visiting museums and landmarks;
using virtual reality in medicine, healthcare, education, leisure, sports, and physical culture). Virtual reality
technologies are already widely and successfully used in the tourism industry as an effective marketing tool.
Travel companies and operators, as well as representatives of tourist attractions, use virtual reality to promote
their services, hoping that the immersive experience gained by potential clients through this technology will
help increase the number of real visitors and consumers of tourism products (Geng et al., 2023).
Virtual reality is also used to complement the physical tourism experience (Yoon & Zou, 2023). For
example, a theme park may feature a mix of real and virtual attractions. Museums enhance their exhibits with
virtual displays, presentations, and events. Modern tourism trends show a dynamic growth in the popularity of
virtual reality as a complete alternative to physical experiences. This is due to both new objective challenges
for real tourism and the greater accessibility, development, and market availability of the necessary
ACCESS Journal:
Access to Science, Business, Innovation in Digital Economy
ISSN 2683-1007 (Online)
2025, 6(3), 513-531, https://doi.org/10.46656/access.2025.6.3(3)
https://journal.access-bg.org/
517
technological tools, such as mobile devices, user devices, equipment for creating and using virtual reality, and
specialized software.
It is important to note that "virtual experience" and "virtual reality" are not the same concepts. Virtual
reality is the simulation or representation of a specific environment using media, computers, and technical
tools.
Virtual experience, on the other hand, is a human experience that utilizes technology rather than an
experience related to the technical equipment itself.
It refers to the extent to which consumers feel their presence in a virtual space, the experience of interacting
within a virtual environment through a computer-mediated setting, based on the concept of telepresence; the
illusion of "being present" in a mediated environment, experiencing presence within a setting through a
communication medium (Nam et al., 2023).
At the same time, the nature and components of the virtual experience are constantly evolving alongside
the progress of information and computer technologies.
Safe virtual tourism
The projection of the VR through the virtual experience of the “travelers” is still contradictory. While
validated screening tools, for example, the CSQ-VR, effectively quantify symptom manifestation and
performance degradation (Koonchanok et al., 2023), prolonged engagement with virtual reality technologies
carries a risk of negative side effects, including motion sickness, eyestrain, headaches, seizures, and accidents
stemming from diminished environmental awareness.
However, a potential downside of VR environments is their capacity to serve as unintentional tools for the
surreptitious accumulation of user information, thereby posing a threat to user privacy. For instance,
adversarial VR applications demonstrate the capacity to extract sensitive personal data, including precise
anthropometric measurements, from the subtle nuances and characteristic patterns present in a user's
movements within the virtual environment. Using biometric modalities for authentication within metaverse
applications raises significant issues about the potential for the centralization of users' personal data, leading
to privacy risks (Nair et al., 2022).
The discrepancy between users' perceived safety and the actual safety levels within social VR platforms
like Horizon Worlds has been highlighted by several incidents compromising virtual safety and security
(Zheng et al., 2022). The disturbingly high rate of harassment reported by close to fifty percent of women
using VR technology demonstrates the critical requirement for stronger safety protocols and protective
measures to be integrated into the design and functionality of virtual reality systems, especially with the rise
of virtual tourism popularity. Table 1 offers a comparative perspective of key aspects of secure virtual tourism,
considering the ramifications of inadequate safety measures.
Despite virtual tourism's creation of unprecedentedly safe access to travel, therapeutic, and educational
opportunities, a crucial consideration remains that its underlying technological and social infrastructure lacks
inherent safety features, raising significant concerns that require attention.

ACCESS Journal:
Access to Science, Business, Innovation in Digital Economy
ISSN 2683-1007 (Online)
2025, 6(3), 513-531, https://doi.org/10.46656/access.2025.6.3(3)
https://journal.access-bg.org/
518
The emergence of challenges such as cyber-sickness, coupled with the risks of data misuse and the
amplification of social vulnerabilities, complicates the perception of virtual technologies as purely positive
advancements.
Virtual tourism stands at an inflection: it is an opportunity to democratize, sustain, and energize cultural
engagement. To fully realize its potential, virtual tourism must transcend novelty to embed safety and ethical
awareness in its core framework.
Table 1. Safe virtual tourism vs. the safety of virtual tourism – comparative plan.
Dimension
Safe Virtual Tourism (SVT)
Lack of safety in virtual tourism
Health risks
Reduces the potential transmission of
infections and travel anxiety
Induces cybersickness, seizures
Well-being
Enhances mental and emotional states
Potential stress and disorientation after overuse of
VR/AR technologies
Inclusivity
Opens access to remote and physically
inaccessible sites
May exclude the access of people who are sensitive
to VR
Privacy
No physical data collected
Highly personal behavioral data at risk
Social interaction
Guided experiences, self-paced
Threats of harassment in VR-based social networks
Environmental
Lowers carbon footprint
No direct risk
Source: authors
Consequently, virtual tourism provides an effective, enjoyable, and ecologically responsible collection of
diverse virtual experiences in the tourism sector; these experiences vary from the simple act of viewing
promotional videos to the immersive engagement of interactive museum tours and the comprehensive
simulation of a complete trip using specialized software.
By leveraging information and computer technologies, it has become possible to generate, develop, and
refine the tourist experience entirely within a virtual online environment, removing the requirement for
physical movement or participation in typical forms of tourist activity.
The time dynamics of virtual tourism development.
Figure 2. Trends of virtual tourism total financial volume (left) and state of virtual tourism market-2023 (right)
Source: https://www.researchandmarkets.com/reports/6024485/virtual-reality-in-tourism-market-report#product--summary

ACCESS Journal:
Access to Science, Business, Innovation in Digital Economy
ISSN 2683-1007 (Online)
2025, 6(3), 513-531, https://doi.org/10.46656/access.2025.6.3(3)
https://journal.access-bg.org/
519
Figures 2 - 4 present the development trends of virtual tourism in terms of the total financial volume of the
market, distribution by regions, market share for different types of technologies used, and the state of the
virtual tourism market as of 2023.
Figure 3. Virtual Reality in Tourism Market Share (%) by Region (2019-2031)
Source: https://www.cognitivemarketresearch.com/virtual-reality-in-tourism-market-report?srsltid=AfmBOorC093HNe-
GXcYF9yscUDwJZ-iuSiPDzSjMcvCNJuthBbek1GFx
Figure 4. Virtual Reality in Tourism Market Share (%) by Type in 2019-2031
Source: https://www.cognitivemarketresearch.com/virtual-reality-in-tourism-market-report?srsltid=AfmBOorC093HNe-
GXcYF9yscUDwJZ-iuSiPDzSjMcvCNJuthBbek1GFx
Figure 5. Global virtual reality in the tourism market forecast until 2033.
Source: https://market.us/report/virtual-reality-in-tourism-market/

ACCESS Journal:
Access to Science, Business, Innovation in Digital Economy
ISSN 2683-1007 (Online)
2025, 6(3), 513-531, https://doi.org/10.46656/access.2025.6.3(3)
https://journal.access-bg.org/
520
As for the longer term, the global virtual reality in tourism market is projected to reach approximately USD
59.9 billion by 2033, up from USD 8.9 billion in 2023, reflecting a compound annual growth rate (CAGR) of
21% over the forecast period from 2024 to 2033. In 2023, North America led the market with a dominant share
of over 37%, generating around USD 3.3 billion in revenue (Figure 5).
Stages of virtual tourism development and evolution of virtual reality in tourism.
The standard classification of the virtual tourism stages and their time evolution for marketing purposes is
shown in Figure 6.
Figure 6. Time evolution of virtual reality in tourism in 2010-2023
Source: Andziak, 2024.
At the initial stage of the introduction of virtualization technologies into the tourism sector, their main
purpose was primarily to provide marketing support and promote tourism products and services.
Representatives of the industry — organizations managing tourist destinations, tour operators, travel agencies,
and other subjects of the tourism market — initially considered virtual tourism as an auxiliary means of
marketing influence on the target audience. (Kucharska & Malinowska, 2024; Chakraborty et al., 2024).
Marketing and promotion laid the foundation for developing the virtual tourism industry. A virtual
demonstration of how unforgettable a vacation or travel experience will be has a more substantial impact on
potential customers than traditional methods such as travel brochures, guidebooks, and websites.
Next, opportunities were developed to enhance the real tourism experience for customers. Virtual
technologies were introduced as a means of improving, complementing, and enriching real-world travel
experiences.
The use of virtual attractions in theme parks, sensory exhibits in museums, interactive displays and
augmented reality at exhibitions, and additional virtual features when visiting tourist sites and landmarks, all
contribute to increased visitor satisfaction and a more immersive tourism experience.
The next stage was the emergence and development of virtual tourism experiences.
This involved the creation and market introduction of fundamentally new virtual travel opportunities and
experiences. Varying in themes and technologies, these experiences provide users with an artificial yet
immersive tourism experience.

ACCESS Journal:
Access to Science, Business, Innovation in Digital Economy
ISSN 2683-1007 (Online)
2025, 6(3), 513-531, https://doi.org/10.46656/access.2025.6.3(3)
https://journal.access-bg.org/
521
Virtual tourism often compresses real-world events, highlighting only key moments or the most exciting
parts. For example, a multi-hour safari is condensed into just a few minutes, eliminating the time spent
searching for animals and focusing solely on actual sightings (Barker & Rodway-Dyer, 2022).
This type of virtual tourism saw significant growth after the outbreak of COVID-19 in 2020 due to
lockdowns, travel restrictions, mobility challenges, and isolation (Zajadacz & Halik, 2024).
Next, a partial replacement of real tourism with virtual tourism began to emerge. For various reasons, virtual
tourism becomes a valuable alternative when real travel is impossible.
Collaboration between high-tech IT companies and key stakeholders in the tourism industry has led to the
development of innovative tourism approaches, new destinations, technologies, and virtualization methods.
Despite the recovery of traditional tourism, the demand for virtual tourism continues to grow. A new,
objective need has emerged, along with more excellent receptiveness and willingness to engage in virtual
tourism in ways that are physically unattainable.
Finally, virtual technologies have made it possible to experience otherwise impossible adventures. The
virtual tourism industry allows people to embark on extraordinary journeys through digital means.
For instance, someone can visit a destination virtually if they lack the financial resources or physical ability
to do so in real life.
Thanks to the possibilities of virtual tourism, a person who does not have swimming skills can take part in
computer modeling of the behavior and visual sensations of a diver during deep-sea diving, virtually explore
hard-to-reach or fundamentally inaccessible to mass visits territories, survey the urban space from a bird's eye
view or virtually visit the surface of the Moon.
It should be noted that at all stages of the formation and development of virtual tourism, there is a close
dependence on the level of technological progress.
There is an obvious, direct correlation between the growth and scaling of the virtual tourism industry and
achievements in the field of digital and information technologies (Jiang et al., 2023).
Types of virtual tourism as aspects of its development.
Virtual tourism comes in various forms and scales. The simplest forms of virtual tourism require only a
computer or mobile device, while more complex formats involve the use of high-tech solutions and specialized
equipment. Virtual tourism is now generally classified into several main types, as shown in Figure 7.
Figure 7. Primary forms of virtual tourism.
Source: Author's elaboration based on literature sources
ACCESS Journal:
Access to Science, Business, Innovation in Digital Economy
ISSN 2683-1007 (Online)
2025, 6(3), 513-531, https://doi.org/10.46656/access.2025.6.3(3)
https://journal.access-bg.org/
522
Study and trial before purchase. As noted earlier, virtual tourism initially focused on marketing aspects.
Virtual reality technologies and specialized software for creating virtual experiences provide potential
customers with the opportunity to “try the product before buying.” This form of marketing has demonstrated
high efficiency, which has led to the active implementation and development of marketing strategies using
virtual reality in the tourism industry (Ghali et al., 2024).
The use of virtual tourism as a marketing tool is particularly useful when the product or service being
offered is of high value. One example is the initiative of British Airways, which has developed a virtual tour
of the business class cabin on the route between London City Airport and New York.
This technology gives potential passengers the opportunity to preview the service conditions and the interior
of the aircraft before deciding whether to purchase an air ticket.
Visiting real places without physically traveling. The most famous example is Google Earth, which
revolutionized virtual tourism by allowing users to view and explore locations worldwide with a click of a
button.
Nowadays, almost all regions of the world are digitized and recorded using visual documentation
technologies, in particular the tools provided by Google services such as Google Street View.
The tourism industry actively utilizes these emerging information technology opportunities to create
various virtual tours, tailored to the target audience's requests, capabilities, and characteristics (Kowalczyk et
al., 2023).
Visiting places and events of the past. One of the significant technological advances in virtual tourism is
the ability to reconstruct historical sites and tourist attractions that have lost their authentic form. By integrating
archival images, computer modeling, and graphic technologies, it is possible to create virtual reproductions of
objects and events of the past.
This provides users with the opportunity to undertake immersive journeys in time and space, allowing them
to explore lost cultural heritage and interact with historical contexts that are not available in reality.
Visiting hard-to-reach places. Many places in the world are closed to the public. Limited access to certain
geographic objects may be due to a number of factors, including the physical inability of a particular person
to travel, their location in remote regions, and the closure of the territory to the general public.
However, with the development of virtual tourism, the concept of inaccessibility is gradually losing its
relevance: numerous virtual excursions provide users with the opportunity to visit almost any point on the
globe in digital format.
Visiting places that do not exist. One of the innovative directions in the development of virtual tourism is
the possibility of visiting spaces that have no real physical analogues.
An example of such a format of computer-simulated tourism is the Second Life platform - a virtual
environment that is a digital world created entirely using graphics and information technologies.

ACCESS Journal:
Access to Science, Business, Innovation in Digital Economy
ISSN 2683-1007 (Online)
2025, 6(3), 513-531, https://doi.org/10.46656/access.2025.6.3(3)
https://journal.access-bg.org/
523
Within this platform, users have the opportunity to create personalized virtual images - avatars (the so-
called digital twins), with the help of which they move around various locations and interact with other
participants, while in a completely virtualized space.
Technologies used in virtual tourism.
The leading technologies used in virtual tourism (Figure 8) are divided into three main categories: virtual
reality, augmented reality, and 360-degree video.
Figure 8. Technologies used in virtual tourism
Source: https://c8.alamy.com/comp/2ATDYAC/reality-virtuality-continuum-infographic-with-examples-real-environment-
augmented-reality-augmented-virtuality-and-virtual-reality-2ATDYAC.jpg
360-degree video. It is a type of digital media content that allows viewers to see a panoramic view in all
directions. Such videos are often captured with special cameras, creating an immersive visual experience (Liu
et al., 2024). 360-degree videos allow viewers to explore a place remotely while feeling like they are almost
physically present at the site, which makes them accessible to a wide range of users.
Augmented reality. For example, you can point your smartphone camera at a building (or use WiFi) and
learn more about its history, architecture, and significance.
Virtual reality. This technology allows users to immerse themselves in a computer environment. Using
headsets and motion sensors, tourists can experience a digital simulation of a real place and activities in it,
which is especially useful for people who, due to physical or financial limitations, cannot travel.

ACCESS Journal:
Access to Science, Business, Innovation in Digital Economy
ISSN 2683-1007 (Online)
2025, 6(3), 513-531, https://doi.org/10.46656/access.2025.6.3(3)
https://journal.access-bg.org/
524
New developments in the field of technology.
Haptic technologies incorporate haptic feedback into virtual experiences, and tactile devices allow users to
sense textures, surfaces of the environments they are exploring, and the virtual effects of weather and smells.
Guides based on artificial intelligence and natural language processing allow you to personalize and
individualize the possibilities for obtaining a virtual tourist experience.
Considering the technologies used to provide opportunities for virtual tourism, it is advisable to clarify once
again their features and differences that are important for understanding.
In particular, augmented reality is about adding digital content to the real environment. In other words,
augmented reality (AR) is a technology in which additional sensory data (visual, auditory, and others) are
integrated into the user's field of perception, which helps to expand the information context about the
environment and modify its perception.
Augmented virtuality, on the other hand, consists of adding physical content to a virtual environment using
computer technology, headsets, smartphones, special glasses, helmets, gloves, and other devices (Maziriri et
al., 2023).
That is, augmented virtuality (AV) is a virtual reality in which objects from the real world are present. It is
a transition stage from reality to virtuality and is a composition of real and virtual Objects.
Such a virtual space combines physical elements, objects, and people with the virtual world, with the
possibility of interaction in real-time. Cameras provide this interaction with a motion sensor, computer vision
technologies, tactile sensors, and other equipment with appropriate specialized software.
RESULTS AND DISCUSSION
Virtual reality offers immersive experiences, facilitates travel planning, improves marketing, promotes
sustainable tourism, and affects both consumers and businesses. Thus, it is possible to identify the main
advantages of using virtual reality in tourism, presented in Table 2.
Table 2. The main advantages of using virtual reality in tourism
What is improving
Description
Examples
Advanced
marketing.
Engages users with compelling visual content,
making marketing campaigns more effective.
360-degree videos of the best moments of travel
destinations on social media.
Innovative
customer service
Provide unique customer service experiences, such
as virtual concierge services or interactive tour
guides.
Registration and concierge services using virtual
reality provide insight into local features.
Sustainability
Promotes sustainable tourism by offering virtual
experiences that reduce the need for physical travel
Virtual visits to environmentally sensitive areas
that reduce the impact of pedestrian traffic.
Product
development
Helps companies develop or improve products and
services by simulating traveler experiences and
feedback.
Testing new travel packages or tours in a virtual
environment before launch.
Increasing
bookings
Entertaining previews increase the conversion rate of
viewers into real travelers.
Virtual previews of luxury accommodations
lead to direct booking.
Available tourism
opportunities
It allows those who cannot travel due to budget or
mobility constraints to explore the world virtually.
Virtual travel to remote or hard-to-reach locations.
Source: Composed by authors based on literature.
The most substantial positive aspects of virtual tourism.
ACCESS Journal:
Access to Science, Business, Innovation in Digital Economy
ISSN 2683-1007 (Online)
2025, 6(3), 513-531, https://doi.org/10.46656/access.2025.6.3(3)
https://journal.access-bg.org/
525
Accessibility. Various accessibility issues are addressed, allowing people with physical, financial, legal, or
time constraints to enjoy travel. People with disabilities or mobility issues can explore destinations without
physical obstacles. Individuals with limited time or resources can visit multiple locations without incurring
significant travel costs or time. Those who are afraid to travel can gain the experience of being in a new
environment, gaining confidence for potential future trips.
Environmental protection (sustainability). It minimizes the environmental impact of traditional travel,
contributing to global conservation efforts. Reduces carbon emissions by reducing air and land transport.
Reduces adverse impacts on local ecosystems and wildlife. Reduces waste and tourist traffic to popular holiday
destinations
Education and training. Game-changing opportunities for education and learning, and immersion in
different cultures or historical contexts. Virtual recreation of historical events allows users to better understand
and empathize with past events and situations. Three-D models and interactive tours of museums or cultural
heritage sites increase the engagement and educational level of visitors.
Professional training in the tourism and hospitality industry using virtual simulations to teach practical
skills and customer service.
Separately, the consumer's most attractive aspects can be emphasized again.
Resources. Virtual tours are characterized by minimal expenditure of personal resources, including time
and financial resources. Most of these formats are provided free of charge and do not require preliminary
preparation related to physical movement. The user can pause the virtual visit at any time and resume it at a
convenient time, which ensures a high degree of flexibility and accessibility of interaction with tourist content.
Also, virtual tourism is very often a preliminary step and preparation for a real trip.
Remote interactions. Virtual tourism provides the opportunity for remote interaction with geographic
regions and objects, access to which is difficult or completely impossible in the context of traditional (offline)
tourism. This is important not only for people with disabilities. For example, unmarried European women are
not allowed to enter many Muslim countries; Minors are restricted in their ability to cross state borders without
being accompanied by legal representatives, and a significant portion of the adult population faces family
obligations that limit their mobility. These categories include, in particular, mothers with infants, as well as
parents raising several children.
Low risks. Virtual travel involves significantly less risk than traditional travel, which involves physical
movement. Under no circumstances does a virtual tour endanger the life and health of the traveler.
Contactless. This is especially convenient for tourists who do not speak foreign (local) languages, as it
does not require direct verbal interaction with the local population and allows avoiding problems associated
with the language barrier and lack of awareness of the region of stay or destination.
From another point of view, there are also attractive aspects for the manufacturing companies in the
tourism industry, service business, cultural institutions, sports, and education. This is a good tool for promoting
a destination, a tourist destination. At the same time, the advertising of offline services when selling is
ACCESS Journal:
Access to Science, Business, Innovation in Digital Economy
ISSN 2683-1007 (Online)
2025, 6(3), 513-531, https://doi.org/10.46656/access.2025.6.3(3)
https://journal.access-bg.org/
526
improved, customer loyalty is increased, and the image of a modern, innovation-oriented organization is
created, including the organization of training programs and the popularization of cultural heritage.
In several situations, virtual tourism is especially useful and necessary. For example, for people with
disabilities, the difficulties of real travel are overcome due to various factors such as limited accessibility or
accommodation of tourist services. You can travel from the comfort of your home, get acquainted with tourist
attractions without physical barriers, and participate in tourist activities without the need for additional help or
support.
In the case of older people, age restrictions, reduced mobility, the need for medical support and monitoring,
and chronic diseases prevent them from traveling. Virtual tourism, on the other hand, allows older people to
travel without physical exertion, get mental stimulation through interactive experiences, and remember their
previous real travels through digital activities and entertainment (Geng, 2022).
From an educational point of view, for students, parents, and teachers, virtual tourism provides an
accessible way to interact with different cultures and places, the opportunity to develop teamwork skills
through interactive group tasks, improves memorization, and makes learning more engaging, informative, and
effective.
The connection between virtual tourism and wellbeing.
An artificial environment can improve people's health and psychological well-being, and virtual visits to
historical sites can contribute to recovery, improve memory and attention, and reduce stress (Deng et al., 2024).
Virtual visitors to historical sites report better subjective well-being, greater satisfaction with life, health, and
the amount of free time.
Virtual visits to historical sites are of strong importance for the awareness of their cultural value, their
intellectual, moral, and artistic aspects, and the effect of a sense of well-being resulting from their beauty or
historical importance. There is a personal connection with people and the spirit of past times, reverence, and
positive emotions of surprise and respect. At the same time, cultural and historical places are often more
attractive than places of recreation, and the beauty found in fine arts, architecture, and music enhances and
develops positive emotions.
At the same time, virtual, digital travel has a tangible impact on the individual. Virtual observation of walks
in a historical setting and visiting natural and historical attractions improves well-being, increases the level of
self-perception of happiness, relaxation, and perceived recovery, and is comparable to the effect of real
tourism. A change in the sensory or emotional state can also be obtained through virtual tourism. Positive
emotions can be associated with repeated virtual visits to places that have emotional significance, for example,
a virtual return to places that you liked during real trips earlier.
Virtual tour’s classification criteria.
According to the type of primary satisfied need - entertainment, hobby classes, ethnic, household, historic,
sports, cognitive, business, Congress, cult (religious), Event, nostalgic.
The technological complexity of presenting information, a set of video materials, can be considered an
ACCESS Journal:
Access to Science, Business, Innovation in Digital Economy
ISSN 2683-1007 (Online)
2025, 6(3), 513-531, https://doi.org/10.46656/access.2025.6.3(3)
https://journal.access-bg.org/
527
elementary, low-tech example of a virtual tour. At the same time, there is the possibility of creating high-tech,
highly realistic imitations of reality that require the use of specialized equipment, such as chairs for transmitting
sensory sensations or glasses for creating a 360-degree view effect, and other devices.
The purpose of creating a tour - informational and familiarization (this type of virtual tour allows you to
demonstrate not only publicly available, but also, for example, museum collections stored in funds and
storerooms); advertising and demonstration (help attract interest to tourist destinations or hotel
establishments); educational and cultural (provide the opportunity for in-depth visual acquaintance with the
objects of the exhibition, expanding cognitive horizons); social and rehabilitation (help improve the
socialization of people with disabilities). For a correct understanding of the phenomenon of virtual tourism, it
is also important to highlight a number of specific, but fundamentally significant characteristics. Virtual
tourism is a form of remote "movement" to any, however remote, but really existing geographic space (for
example, an online visit to the Louvre, a computer simulation of the moon landing built on documentary
material). However, a trip to the fantastic planet Pandora, realistically created and depicted by James Cameron
in the film Avatar, cannot be considered virtual tourism.
In offline tourist travel, the purpose of the visit is a country, region, city, and, less often, a particular
institution. Even if the final destination of the trip is a specific object - be it a museum, a high-class restaurant,
or a hotel complex (with no plans to leave its territory) - in the process of travel, the tourist inevitably forms a
certain perception of the surrounding region. In the context of virtual tourism, the scope of the "visited" space
is usually limited and more fragmented (for example, viewing only the Mona Lisa painting in the Louvre,
without "entering" other rooms of the museum). Thus, within the framework of a virtual tour, the user does
not need to become familiar with intermediate objects or visit them on the way to the target location.
CONCLUSIONS
Thus, we can highlight the main advantages and disadvantages of virtual tours. Among the first is convenience,
as people can visit their desired destinations and experience the sights while physically being anywhere and
without moving; accessibility, consumers with disabilities or health concerns can have experiences that would
be inaccessible to them or available with high risks and efforts in a real tour; flexibility and freedom, it is
possible to repeatedly pause/resume most virtual tours, continuing them from where the stop was the next time;
cost-effectiveness, in comparison with real tourist tours, virtual tours are much cheaper; low environmental
impact, from an ecological point of view, virtual tours have a much less negative impact on the environment
and nature.
At the same time, virtual tourism has some disadvantages: it is the lack of physical interaction, tourists
cannot really interact with various aspects and objects of the destination; still, existing technological and
financial limitations, which can potentially spoil the experience; lack and short lifespan of relevant
information, multimedia information may become outdated, give fewer details or be inaccurate, no longer
relevant; lack or inadequacy of social interaction, many multimedia formats limit social interaction, which is
ACCESS Journal:
Access to Science, Business, Innovation in Digital Economy
ISSN 2683-1007 (Online)
2025, 6(3), 513-531, https://doi.org/10.46656/access.2025.6.3(3)
https://journal.access-bg.org/
528
an integral part of travel for some people; monetization restrictions, monetization of virtual tours only,
excluding the economy at the destination; For some people, virtual environments have a disorienting,
nauseating effect, and other side effects, so in this case, caution and following the recommendations of doctors
are necessary.
Author Contributions: All authors have contributed equally to the paper. All authors have read and agreed
to the published version of the manuscript.
Funding /Acknowledgement: This study is financed by the European Union - Next Generation EU, through
the National Recovery and Resilience Plan of the Republic of Bulgaria, project № BG-RRP-2.013-0001.
Institutional Review Board Statement: not applicable
Informed Consent Statement: not applicable
Data Availability Statement:
The data presented in this study are available on request from the corresponding author.
Conflict of interest: The authors declare no conflict of interest.
References
Andziak, A. (2024). Transforming Marketing and Tourism: Harnessing Virtual Reality for Immersive Consumer
Experiences in Switzerland. Global Journal of Business and Integral Security. Retrieved from
https://gbis.ch/index.php/gbis/article/view/589
Baker, J., Nam, K. & Dutt, C.S. (2023). A user experience perspective on heritage tourism in the metaverse: Empirical
evidence and design dilemmas for VR. Information Technology & Tourism, 25, 265–306.
https://doi.org/10.1007/s40558-023-00256-x
Barker, J., & Rodway-Dyer, S. (2022). The elephant in the Zoom: the role of virtual safaris during the COVID-19
pandemic for conservation resilience. Current Issues in Tourism, 26(13), 2221–2234.
https://doi.org/10.1080/13683500.2022.2132921
Bilynets, I., Trkman, P., & Knežević Cvelbar, L. (2023). Virtual tourism experiences: adoption factors, participation and
readiness to pay. Current Issues in Tourism, 27(22), 3658–3675. https://doi.org/10.1080/13683500.2023.2268809
Blaer, M. (2023). Interactive Webcam Travel: Supporting Wildlife Tourism and Conservation During COVID-19
Lockdowns. Information Technology & Tourism, 25, 47–69. https://doi.org/10.1007/s40558-023-00242-3
Chakraborty, D., Polisetty, A., & Rana, N. (2024). Consumers' continuance intention towards metaverse-based virtual
stores: A multi-study perspective. Technological Forecasting and Social Change, 203(C).
https://doi.org/10.1016/j.techfore.2024.123405
Chang, Y.-C., & Yang, C.-C. (2024). Examining the Mechanisms of Virtual Reality Tourism’s Impact on the Mental
Well-Being of Long-Term Care Facility Residents: Perspectives on Presence and Flow. Behavioral Sciences, 14(9),
781. https://doi.org/10.3390/bs14090781
Chen, J., Wu, X., & Lai, I. K. W. (2023). A Systematic Literature Review of Virtual Technology in Hospitality and
Tourism (2013–2022). SAGE Open, 13(3). https://doi.org/10.1177/21582440231193297
Deng, F., Zhang, Y., Lai, Y., Lin, Y., & Zhou, G. (2024). The influence mechanism of travel livestreaming’s (TLS)
characteristics on users’ tourism well-being. Current Issues in Tourism, 28(1), 153–170.
https://doi.org/10.1080/13683500.2024.2318455
Esteban, C., Loscos, A., & Machuca, C. (2023). The recovery of international tourism in Spain after the pandemic.
Economic Bulletin, Banco de España, 1, 1-11. https://doi.org/10.53479/29461
ACCESS Journal:
Access to Science, Business, Innovation in Digital Economy
ISSN 2683-1007 (Online)
2025, 6(3), 513-531, https://doi.org/10.46656/access.2025.6.3(3)
https://journal.access-bg.org/
529
Geng, L., Li, Y., Zhang, Y., Jiang, Z., & Xue, Y. (2023). Advancing tourism recovery through virtual tourism marketing:
an integrated approach of uses and gratifications theory and attachment to VR. Current Issues in Tourism, 27(2),
234–250. https://doi.org/10.1080/13683500.2023.2177834
Geng, W. (2022). Whether and how free virtual tours can bring back visitors. Current Issues in Tourism, 26(5), 823–834.
https://doi.org/10.1080/13683500.2022.2043253
Ghali, Z., Rather, R., & Khan, I. (2024). Investigating metaverse marketing-enabled consumers' social presence,
attachment, engagement, and (re)visit intentions. Journal of Retailing and Consumer Services, 77(C).
https://doi.org/10.1016/j.jretconser.2023.103671
Hoang, S., Dey, S., Tučková, Z., & Pham, T. (2023). Harnessing the power of virtual reality: Enhancing telepresence and
inspiring sustainable travel intentions in the tourism industry. Technology in Society, 75(C).
https://doi.org/10.1016/j.techsoc.2023.102378
Jiang, X., Deng, N., & Zheng, S. (2023). Understanding the core technological features of virtual and augmented reality
in tourism: a qualitative and quantitative review. Current Issues in Tourism, 26(21), 3444–3464.
https://doi.org/10.1080/13683500.2023.2214847
Koonchanok, R., Tawde, G., Narayanasamy, G., Walimbe, S., & Reda, K. (2023). Visual belief elicitation reduces the
incidence of false discovery. In Proceedings of the 2023 CHI conference on human factors in computing systems,
1-17. https://doi.org/10.1145/3544548.3580808
Kowalczyk, K., Kowalczyk, A., Zwirowicz-Rutkowska, A., & Bednarczyky, M. (2023). E-Tourism Based on
Geoinformation Applications for Seniors: Requirements and Design Guidelines. Quaestiones Geographicae, 42(3),
101-113. https://doi.org/10.14746/quageo-2023-0026
Kucharska, B., & Malinowska, M. (2024). Virtualization of Service Consumer Behavior in Poland – A Post-Pandemic
Perspective. Marketing of Scientific and Research Organizations, 53(3), 98-118. https://doi.org/10.2478/minib-
2024-0018
Kumar, A., Bindu Roy, B., & Bhatia, A. (2024). Technical Sustainability with Hybrid Approach in the Tourism Sector.
World Review of Entrepreneurship, Management and Sustainable Development. 20(6), 647-663.
https://doi.org/10.1504/WREMSD.2024.141883
Li, E., Chang, F., & Jan, A. (2023). Understanding the virtual experiential value and its effect on travel intention.
International Journal of Internet Marketing and Advertising, 19(3/4), 263-285.
https://doi.org/10.1504/IJIMA.2023.133340
Li, Y., Liang, J., Huang, J., Yang, M., Li, R., & Bai, H. (2022). Would You Accept Virtual Tourism? The Impact of
COVID-19 Risk Perception on Technology Acceptance from a Comparative Perspective. Sustainability, 14(19),
12693. https://doi.org/10.3390/su141912693
Lin, L. Z., & Yeh, H. R. (2022). Using ZMET to explore consumers’ cognitive model in virtual reality: take the tourism
experience as an example. Current Issues in Tourism, 26(14), 2250–2264.
https://doi.org/10.1080/13683500.2022.2084048
Liu, B., Kralj, A., Moyle, B. & Li, Y. (2024). Developing 360-degree stimuli for virtual tourism research: a five-step
mixed measures procedure. Information Technology & Tourism, 26, 485–519 https://doi.org/10.1007/s40558-024-
00287-y
Liu, G., & Tian, B. (2024). Investigating the impact of autonomy on presence: a comparative analysis on sense of presence
and telepresence. Information Technology & Tourism, 26, 347–367. https://doi.org/10.1007/s40558-024-00285-0
Luo, J., & Xia, M. (2024). Embracing Virtual Reality in Destination Marketing: A Serial Mediation Model to Investigate
the Role of Virtual Tourism Experiences in the Formation of Place Attachment. Sustainability, 16(23), 10551.
https://doi.org/10.3390/su162310551
Maziriri, E. T., Mashapa, M. M., Nyagadza, B., & Mabuyana, B. (2023). As far as my eyes can see: Generation Y
consumers’ use of virtual reality glasses to determine tourist destinations. Cogent Business & Management, 10(3).
https://doi.org/10.1080/23311975.2023.2246745
Nair, V., Garrido, G. M., Song, D., & O'Brien, J. F. (2022). Exploring the privacy risks of adversarial VR game design.
23rd Privacy Enhancing Technologies Symposium, 238-256. https://doi.org/10.56553/popets-2023-0108
Nam, K., Baker, J., & Dutt, C.S. (2024). Does familiarity with the attraction matter? Antecedents of satisfaction with
virtual reality for heritage tourism. Information Technology & Tourism 26, 25–57. https://doi.org/10.1007/s40558-
023-00273-w
ACCESS Journal:
Access to Science, Business, Innovation in Digital Economy
ISSN 2683-1007 (Online)
2025, 6(3), 513-531, https://doi.org/10.46656/access.2025.6.3(3)
https://journal.access-bg.org/
530
Nam, K., Dutt, C.S. & Baker, J. (2023). Authenticity in Objects and Activities: Determinants of Satisfaction with Virtual
Reality Experiences of Heritage and Non-Heritage Tourism Sites. Information Systems Frontiers, 25, 1219–1237.
https://doi.org/10.1007/s10796-022-10286-1
Nam, K., Dutt, C.S. & Baker, J. (2023). Correction to: Authenticity in Objects and Activities: Determinants of Satisfaction
with Virtual Reality Experiences of Heritage and Non-Heritage Tourism Sites. Information Systems Frontiers, 25,
1239. https://doi.org/10.1007/s10796-022-10338-6
Petr, C., & Caudan, P. (2024). Ethical marketing framework for metaverse simulated experiences of tourism (SET): An
exploration of consumers aspirations and fears. Journal of Retailing and Consumer Services, 79(C), 103785,
https://doi.org/10.1016/j.jretconser.2024.103785
Petrova, M., Sushchenko, O., Dekhtyar, N., & Shalbayeva, S. (2025). The Prospects of Sustainable Development of
Destroyed Tourism Areas Using Virtual Technologies. Sustainability, 17(7), 3016.
https://doi.org/10.3390/su17073016
Petrova, M., Tairov, I. (2022). Solutions to Manage Smart Cities’ Risks in Times of Pandemic Crisis. Risks 2022, 10, (12)
240. https://doi.org/10.3390/risks10120240
Phoong, S. W., Phoong, S. Y., & Khek, S. L. (2024). Virtual Reality in the Tourism Sector: A Bibliometric Systematic
Literature Review of the Development and Future Trends. SAGE Open, 14(4).
https://doi.org/10.1177/21582440241290933
Tairov, I., Stefanova, N., Aleksandrova, A., Aleksandrov, M. (2024). Review of AI-Driven Solutions in Business Value
and Operational Efficiency. Economics Ecology Socium, 8, 55-66. DOI: https://doi.org/10.61954/2616-
7107/2024.8.3-5
Varol, F., & Öksüz, M. (2024). Use of advanced measurement and reality technologies in cultural heritage sites from the
perspective of technology and tourism. Current Issues in Tourism, 28(4), 585–603.
https://doi.org/10.1080/13683500.2024.2322693
Wang, Q., Shi, R., Zhang, K., & Liu, X. (2024). Virtual reality and travel anxiety during the COVID-19 pandemic: the
moderating role of blockade intensity. Frontiers in Psychology, 14. 1287765.
https://doi.org/10.3389/fpsyg.2023.1287765
Widawski, K., & Oleśniewicz, P. (2023). Education in Tourism—Digital Information as a Source of Memory on the
Examples of Places Related to the Holocaust in Poland during World War II. Sustainability, 15(14), 10903.
https://doi.org/10.3390/su151410903
Xu, D., Shang, Y., Yang, Q., & Chen, H. (2023). Population aging and eco-tourism efficiency: Ways to promote green
recovery. Economic Analysis and Policy, 79(C), 1-9. https://doi.org/10.1016/j.eap.2023.05.021
Yoon, H. (Violet), & Zou, S. (Sharon). (2023). An empirical comparison of vignette and virtual reality experiments in
tourism research. Current Issues in Tourism, 27(5), 689–695. https://doi.org/10.1080/13683500.2023.2238323
Yordanova, S. (2023). How to Apply Digitization in the Tourism and Hospitality? Economic Studies, 8, 164-176
Zajadacz, A., & Halik, Ł. (2024). User Preferences of Perspective and Dimensionality of Tourism Space Geovisualisation
Supporting Orientation in a Non-Immersive Virtual Reality. Quaestiones Geographicae, 43(3), 77-86.
https://doi.org/10.14746/quageo-2024-0027
Zeqiri, A. (2024). Virtual tourism as a substitute for physical tourism during COVID-19 pandemic. Environmental
Economics and Policy Studies, 26, 125–144. https://doi.org/10.1007/s10018-023-00382-0
Zhang, K., Sun, X., & Li, G. (2025). Virtual influencer and cultural heritage destination: Endorsement effectiveness of
virtual versus human influencers. Annals of Tourism Research, 110(C), 103873.
https://doi.org/10.1016/j.annals.2024.103873
Zhang, S., Tan, Y., Zhong, Y. et al. (2023). Psychological recovery effects of 3D virtual tourism with real scenes -- a
comparative study. Information Technology & Tourism, 25, 71–103. https://doi.org/10.1007/s40558-023-00246-z
Zheng, Q., Do, T., Wang, L., & Huang, Y. (2022). Facing the illusion and reality of safety in social VR. arXiv preprint
arXiv:2204.07121. https://doi.org/10.48550/arXiv.2204.07121

ACCESS Journal:
Access to Science, Business, Innovation in Digital Economy
ISSN 2683-1007 (Online)
2025, 6(3), 513-531, https://doi.org/10.46656/access.2025.6.3(3)
https://journal.access-bg.org/
531
About the authors
Liudmyla DOROKHOVA
PhD, Visiting Prof., Department of Marketing, School of Economics and Business
Administration, University of Tartu, Estonia
Research interests: marketing, consumer behavior, service quality
ORCID ID: 0000-0002-3859-628X
Silvia BELOEVA,
PhD, Assist. Prof., Department of Management and Social Activities, University of Ruse
“Angel Kanchev”, Ruse, Bulgaria
Research interests: social work, creativity and anxiety management, management and
administration.
ORCID ID: 0009-0008-6847-9923
Web of Science Researcher ID: JKI-0733-2023
Nataliya VENELINOVA,
PhD, Assoc. Prof., Department of Management and Social Activities, University of Ruse
“Angel Kanchev”, Ruse, Bulgaria
Research interests: strategic management, communication management, crisis
management, emergency management and security, social affairs
ORCID ID: 0000-0002-7580-5263
Web of Science Researcher ID: IQX-0177-2023
Dzhavid MIRZOIEV,
Doctor of Philosophy, Assoc. Prof., Department of Marketing, Simon Kuznets Kharkiv
National University of Economics, Kharkiv, Ukraine
Research interests: marketing, high education, international economic relations.
ORCID ID: 0000-0002-3555-7672
This work is licensed under the Creative Commons Attribution International License (CC BY)

ACCESS Journal:
Access to Science, Business, Innovation in Digital Economy
ISSN 2683-1007 (Online)
2025, 6(3), 532-545, https://doi.org/10.46656/access.2025.6.3(4)
https://journal.access-bg.org/
532
ADAPTING TO THE AI REVOLUTION: COMPARATIVE ANALYSIS OF
NATIONAL WORKFORCE STRATEGIES
Saule Iskendirova1, Aigerim Amirova2, Aliya Daueshova3, Azamat Zhanseitov4*, Rymkul
Ismailova5
1), 2), 3), 4) Academy of Public Administration under the President of the Republic of Kazakhstan, Astana,
Kazakhstan
5) Astana IT University, Astana, Kazakhstan
e-mails: 1s.iskendirova@apa.kz, 2a.amirova@apa.kz, 3Aliya.Daueshova@apa.kz, 4a.zhanseitov.apa.kz,
5r.ismailova@astanait.edu.kz
Received: 30 April 2025 Accepted: 11 July 2025 Online Published: 08 August 2025
ABSTRACT
This paper assesses national workforce strategies for adapting to artificial intelligence (AI) across 55 countries. The
background of the research is defined by the rapid diffusion of AI technologies, which creates new challenges and
opportunities for labour markets and policy-makers worldwide. Objectives: The primary objective is to identify the key
determinants that drive the adoption of both skills-oriented and transformation-oriented strategies in national AI
workforce development. Methods/Approach: The study constructs two composite indices—AI Skills Focus and AI
Transformation Focus—based on employer survey data. These indices capture, respectively, the prioritization of hiring
and training for AI-related skills, and the implementation of broader organizational strategies such as business model
reorientation and workforce transitions driven by AI. Five explanatory variables are analyzed: funding for reskilling and
upskilling, skills gaps in the labour market, the proportion of tasks performed by technology (human-machine frontier),
labour-market churn, and the degree of organizational AI exposure. Results: The findings demonstrate that
organizational AI exposure is the strongest and most consistent predictor of both indices, indicating that widespread AI
adoption at the firm level is closely linked to national workforce adaptation. In contrast, larger skills gaps are associated
with lower adoption of AI workforce strategies, suggesting that talent shortages impede rather than accelerate
adaptation. Conclusions: The results highlight the importance of ecosystem-based approaches in public governance,
where collaboration among government, employers, and education providers fosters readiness and adaptability. The
study recommends policy measures focused on building supportive institutional environments and addressing skills
shortages through integrated, long-term reforms.
Keywords: human resource management, artificial intelligence, labour market, AI exposure, human-centricity,
ecosystem, digitalization
JEL classification: J24; O33; O57; I28
Paper type: Research article
Citation: Iskendirova, S., Amirova, A., Daueshova, A., Zhanseitov, A., Ismailova, R. (2025). Adapting to the AI revolution:
comparative analysis of national workforce strategies. Access to science, business, innovation in digital economy, ACCESS
Press, 6(3), 532-545, https://doi.org/10.46656/access.2025.6.3(4)
INTRODUCTION
The rapid proliferation of artificial intelligence (AI) technologies is fundamentally reshaping the nature of
work and skill requirements across global labour markets. AI-driven automation and augmentation are
expected to alter job roles, create new occupations, and render certain tasks obsolete, challenging both
employers and governments to respond with effective workforce adaptation strategies (Tairov et al., 2024;
Antonova, Beloeva, & Todorova, 2024). In this context, countries worldwide face an urgent imperative to

ACCESS Journal:
Access to Science, Business, Innovation in Digital Economy
ISSN 2683-1007 (Online)
2025, 6(3), 532-545, https://doi.org/10.46656/access.2025.6.3(4)
https://journal.access-bg.org/
533
anticipate and manage the workforce implications of technological change, ensuring that both individuals and
organizations are equipped to thrive in the AI era.
Despite growing consensus about the transformative impact of AI, there remains significant variation in
how countries prepare their workforces for this new landscape. Some nations have launched large-scale
initiatives to upskill and reskill employees, promote lifelong learning, and stimulate public-private
collaboration in digital education. Others are only beginning to recognize the challenges posed by AI or
struggle to address persistent gaps in skills and institutional capacity. While existing research often highlights
the need for reskilling and training, less is known about the determinants that drive countries to adopt particular
workforce strategies in response to AI. In particular, the extent to which national adaptation efforts are shaped
by factors such as funding, labour-market structure, the prevalence of technology, and the diffusion of AI at
the organizational level remains underexplored. (Benhmama & Bennani, 2024; Chornous et al., 2025; Le, Le
& Le, 2025).
This study addresses these gaps by conducting a cross-country analysis of workforce strategies for AI
adaptation using recent employer survey data from 55 countries. The research introduces two composite
indices — AI Skills Focus and AI Transformation Focus—to capture both the emphasis on skill development
and the breadth of organizational adaptation strategies at the national level. By modelling these indices as
functions of key explanatory variables—including funding for reskilling, skills gaps, labour-market churn, the
share of tasks performed by technology, and organizational AI exposure—the study aims to uncover the
primary drivers of national workforce strategies in the context of AI transformation.
The findings contribute to the international literature by clarifying which factors most strongly predict
workforce adaptation to AI and by highlighting the importance of ecosystem-based approaches in public
governance. The study further provides evidence-based policy recommendations to guide governments,
employers, and educators in building resilient, future-ready workforces.
LITERATURE REVIEW
The advent of artificial intelligence (AI) is widely recognized as a transformative force in contemporary
economies, with significant implications for labour markets, education systems, and public policy. Early
studies have documented the potential for AI and automation to both displace and augment jobs, leading to
profound shifts in skill requirements and organizational structures (Arntz, Gregory, & Zierahn, 2016; Bessen,
2018). The literature identifies two primary pathways for workforce adaptation: skill development (upskilling
and reskilling) and broader organizational transformation, including business model innovation and internal
labour reallocation (Brynjolfsson & McAfee, 2014; World Economic Forum, 2020; OECD, 2023).
Recent international surveys and policy analyses underscore the urgency of investing in human capital to
address the challenges and opportunities posed by AI. The World Economic Forum’s series of Future of Jobs
Reports highlights that most employers anticipate significant skill disruption, with demand rising for complex
cognitive, digital, and social-emotional competencies (World Economic Forum, 2020; World Economic
Forum, 2025). National governments and supranational bodies such as the European Commission and OECD
ACCESS Journal:
Access to Science, Business, Innovation in Digital Economy
ISSN 2683-1007 (Online)
2025, 6(3), 532-545, https://doi.org/10.46656/access.2025.6.3(4)
https://journal.access-bg.org/
534
have responded by prioritizing reskilling initiatives, promoting lifelong learning, and facilitating industry-
academic partnerships to align educational curricula with labour market needs (OECD, 2023; European
Commission, 2023; UNESCO, 2024).
However, scholars note considerable variation in the effectiveness of these strategies across countries.
Factors such as institutional capacity, funding mechanisms, and collaboration between stakeholders play
crucial roles in determining the impact of workforce policies (McKinsey Global Institute, 2023; ILO, 2024;
OECD, 2024). For instance, OECD research indicates that countries with well-coordinated ecosystem
environments—where public governance actively supports cooperation among government, employers, and
education providers—tend to achieve better outcomes in AI workforce adaptation (OECD, 2024; World Bank,
2022).
Recent research also demonstrates the effectiveness of digital management platforms in the public sector,
with evidence from Kazakhstan showing that digital solutions for remote work can significantly enhance
operational efficiency and oversight in large national organizations such as the railway sector (Adilova et al.,
2025). The role of digital and technological transformation in related fields, such as agriculture, is also well
documented in the literature. For instance, studies from Kazakhstan demonstrate how the integration of
renewable energy technologies contributes to greater efficiency and sustainability in agricultural production
systems (Bolyssov et al., 2019). Recent studies have also explored the role of human capital and
entrepreneurship in driving economic development. For example, analysis of cross-country data reveals that
female entrepreneurship has a significant positive impact on economic growth in both developing and
developed economies, highlighting the importance of inclusive workforce strategies (Akybayeva et al, 2024).
Such evidence reinforces the argument that integrated strategies combining digital innovation, sustainable
practices, and inclusive entrepreneurship are essential for long-term socioeconomic resilience (Abuseridze,
2021).
A growing body of research also highlights the role of organizational AI exposure as a catalyst for
workforce transformation. Firms already implementing AI are more likely to invest in employee reskilling and
to adopt innovative approaches to talent management (World Economic Forum, 2023; McKinsey Global
Institute, 2023). Conversely, persistent skills gaps and limited access to training infrastructure are cited as
major barriers to effective adaptation, particularly in emerging economies (ILO, 2024; World Bank, 2022).
The broader context of economic modernization in Kazakhstan includes not only workforce and education
policies, but also the management of natural resources and the acceleration of digital transformation in
business processes. Judicial practices regarding foreign investment in the natural resources sector play a
significant role in shaping the country’s investment climate and sustainable development strategies
(Yessengeldin et al., 2019). At the same time, recent empirical evidence demonstrates that digital
transformation is having a profound effect on business process management, increasing efficiency and
innovation in Kazakhstan’s private sector (Zhumanova et al., 2023). In this regard, the judiciary's capacity to
ensure transparent, consistent, and investor-friendly rulings is essential for fostering legal certainty and

ACCESS Journal:
Access to Science, Business, Innovation in Digital Economy
ISSN 2683-1007 (Online)
2025, 6(3), 532-545, https://doi.org/10.46656/access.2025.6.3(4)
https://journal.access-bg.org/
535
reinforcing the institutional foundations of Kazakhstan’s modernization agenda. For example, Georgia’s
judicial reforms in the early 2000s, which enhanced transparency and investor confidence, are often cited as a
key factor in the country’s improved investment climate highlighting the critical role of the judiciary in
supporting economic transformation (Abuseridze & Kikilashvili, 2025).
Despite the proliferation of policy reports and empirical studies, gaps remain regarding the comparative
analysis of national determinants that drive AI workforce strategies. There is a need for more systematic
research examining how factors such as funding, skills shortages, labour-market churn, technological intensity,
and ecosystem coordination jointly influence the adoption of both skill-focused and transformation-oriented
policies. This study aims to address this gap by providing new cross-country evidence on the key drivers of
national AI workforce strategies.
METHODOLOGY
Each country in the sample has determined its own AI workforce strategy based on responses from national
employer surveys. Data for the AI Skills Focus index are available for all 55 countries included in the analysis,
capturing efforts related to hiring and training for AI-related skills. In contrast, not all countries report
strategies related to broader organizational or business transformation in response to AI (such as workforce
transitions or business model adaptation). If a country’s survey responses indicate no implementation of any
AI Transformation Focus strategy, the value for this index is recorded as zero. As a result, some countries are
represented only by their focus on AI skills development, while others combine both skills and transformation
strategies in their approach. This procedure allows for the inclusion of all countries in the analysis and ensures
that the absence of transformation strategies is clearly reflected in the data.
1. AI Skills Focus Index
The AI Skills Focus index measures the extent to which organizations prioritize developing and acquiring
AI-related skills. It is calculated as the arithmetic mean of the following three items (all of which are available
for every country in the sample):
The share of employers hiring new people with skills to design AI tools and enhancements appropriate for
the organization’s needs,
The share hiring new people with skills to better work alongside AI,
The share reskilling and upskilling their existing workforce to better work alongside AI.
2. AI Transformation Focus Index
The AI Transformation Focus index captures broader organizational strategies related to business model
adaptation and workforce transition in response to AI. It is calculated as the arithmetic mean of the following
items:
The share of employers re-orienting their organization to target new business opportunities created by AI,
The share transitioning employees from jobs that AI will cause to decline, to other roles within the
organization,
The share downsizing the workforce where AI can replicate people’s work (included only where available).
ACCESS Journal:
Access to Science, Business, Innovation in Digital Economy
ISSN 2683-1007 (Online)
2025, 6(3), 532-545, https://doi.org/10.46656/access.2025.6.3(4)
https://journal.access-bg.org/
536
The AI Skills Focus index is available for all 55 countries in the analysis. In contrast, the AI Transformation
Focus index—which captures broader organizational transformation strategies in response to AI—is available
for a subset of 30 countries. For the remaining countries, no relevant transformation strategies were reported
in the survey, and thus the value for this index is recorded as zero.
Explanatory Variables
The explanatory variables used in this study are drawn from the World Economic Forum’s Future of Jobs
Report 2025 ([World Economic Forum, 2025]). These include:
Funding for reskilling and upskilling (the share of employers identifying public or private investment in
training as a priority),
Skills gaps in the labour market (the proportion of organizations reporting shortages of relevant skills as a
key barrier to transformation),
Human-machine frontier—Technology (the share of tasks primarily performed by technology, such as
robots and automation, in each country),
AI exposure (the proportion of organizations already implementing AI programmes),
Labour-market churn (the degree of turnover or structural change in the national labour market, reflecting
both job creation and job loss associated with technological transformation).
All variables are harmonized and normalized for comparability across countries.
Based on the literature review and the research questions, the following hypotheses are tested:
H1: Greater funding for reskilling and upskilling is positively associated with the adoption of both AI Skills
Focus and AI Transformation Focus strategies at the national level.
H2: Larger skills gaps in the labour market are associated with greater adoption of AI workforce strategies.
H3: A higher share of tasks performed by technology (Human-machine frontier) predicts increased
adoption of AI workforce strategies.
H4: Broader organizational AI exposure is positively associated with both AI Skills Focus and AI
Transformation Focus.
H5: Greater labour-market churn is positively associated with the adoption of both AI Skills Focus and AI
Transformation Focus strategies, as more dynamic labour markets may accelerate adaptation to technological
change.
To test the research hypotheses, we estimate separate ordinary least squares (OLS) regression models for
the two dependent variables—AI Skills Focus and AI Transformation Focus. Each model includes the five
explanatory variables described above. Robust standard errors are used to account for possible
heteroskedasticity. Model fit and diagnostic tests (including tests for multicollinearity, normality of residuals,
and heteroskedasticity) are reported and discussed in the Results section.
RESULTS
This section presents the empirical findings from the cross-country analysis of national workforce strategies
for artificial intelligence (AI) adaptation. The results are organized around the two composite indices

ACCESS Journal:
Access to Science, Business, Innovation in Digital Economy
ISSN 2683-1007 (Online)
2025, 6(3), 532-545, https://doi.org/10.46656/access.2025.6.3(4)
https://journal.access-bg.org/
537
constructed in this study: AI Skills Focus and AI Transformation Focus. Separate ordinary least squares (OLS)
regression models were estimated for each index, incorporating the five explanatory variables: funding for
reskilling and upskilling, skills gaps in the labour market, human-machine frontier, labour-market churn, and
AI exposure. Model diagnostics were performed to ensure the validity and robustness of the results Table 2,4.
The following subsections report the main regression outcomes for both indices, highlight statistically
significant predictors, and discuss the explanatory power of each model. These results provide insights into
the factors that most strongly influence national approaches to AI workforce adaptation.
Table 1. Regression Results: AI Skills Focus
Variable
Coefficient
Std. Error
t-value
p-value
Constant
0.428
0.173
2.469
0.016
Funding for reskilling and upskilling
–0.0006
0.119
–0.005
0.996
Skills gaps
–0.413
0.099
–4.191
<0.001
Human-machine frontier
0.206
0.175
1.174
0.245
AI exposure
0.579
0.117
4.959
<0.001
Source: Own calculations
Table 2. AI Skills Focus — Diagnostic Tests
Test
Value
p-value
Note
R-squared
0.523
—
Adj. R-squared
0.485
—
F-statistic
13.70
1.30e-07
Model is statistically significant
RMSE
0.0555
—
Shapiro-Wilk (normality)
0.9849
0.7157
Residuals are normally distributed
Breusch-Pagan (heteroskedasticity)
1.9404
0.7467
No evidence of heteroskedasticity
Durbin-Watson (autocorrelation)
1.845
—
No autocorrelation in residuals
Omnibus (normality of residuals)
0.247
0.884
Residuals are normally distributed
Jarque-Bera (normality of residuals)
0.092
0.955
Residuals are normally distributed
Condition number (VIF)
46.4
—
No multicollinearity (all VIF < 1.2)
Source: Own calculations
The regression results in Table 1 indicate that AI exposure (the share of organizations already implementing
AI programmes) is a strong and statistically significant predictor of national focus on AI-related skills
strategies (β = 0.58, p < 0.001). This suggests that in countries where a greater proportion of organizations are
adopting AI, there is a higher likelihood of widespread reskilling, upskilling, and hiring for AI competencies.
Conversely, skills gaps in the labour market are negatively associated with AI Skills Focus (β = –0.41, p <
0.001). This finding implies that countries facing significant talent shortages are less likely to engage
proactively in AI-related workforce development, potentially due to systemic barriers or insufficient capacity
to deliver training at scale.
Table 3. Regression Results: AI Transformation Focus
Variable
Coefficient
Std. Error
t-value
p-value
Constant
0.301
0.172
1.747
0.099
Skills gaps
–0.216
0.115
–1.876
0.075
Labour-market churn
–0.148
0.198
–0.749
0.458
AI exposure
0.540
0.147
3.670
0.001
Source: Own calculations

ACCESS Journal:
Access to Science, Business, Innovation in Digital Economy
ISSN 2683-1007 (Online)
2025, 6(3), 532-545, https://doi.org/10.46656/access.2025.6.3(4)
https://journal.access-bg.org/
538
Funding for reskilling and upskilling, as well as the share of tasks performed by technology (human-
machine frontier), were not statistically significant in this model.
Table 4. AI Transformation Focus — Diagnostic Tests
Test
Value
p-value
Note
R-squared
0.470
—
Adj. R-squared
0.408
—
F-statistic
7.673
0.00078
Model is statistically significant
RMSE
0.0572
—
Shapiro-Wilk (normality)
0.9873
0.9699
Residuals are normally distributed
Breusch-Pagan (heteroskedasticity)
4.7948
0.1875
No evidence of heteroskedasticity
Durbin-Watson (autocorrelation)
1.550
—
No autocorrelation in residuals
Omnibus (normality of residuals)
0.013
0.993
Residuals are normally distributed
Jarque-Bera (normality of residuals)
0.138
0.933
Residuals are normally distributed
Condition number (VIF)
31.8
—
No multicollinearity (all VIF < 1.1)
Source: Own calculations
For the AI Transformation Focus index – Table 3, AI exposure again emerges as the main significant
predictor (β = 0.54, p = 0.001), reinforcing the idea that widespread organizational adoption of AI is closely
linked to broader business model transformation and internal workforce reorganization. Skills gaps also have
a negative association with AI Transformation Focus (β = –0.22, p = 0.075), although this effect is only
marginally significant. Other predictors (e.g., labour-market churn) do not reach statistical significance.
The results in table 4 provide robust support for H4, demonstrating that higher levels of organizational AI
exposure are consistently and positively related to the adoption of both skills-oriented and transformation-
oriented AI workforce strategies at the national level. H2 is only partially supported, as skills gaps appear to
be a significant—but negative—predictor, suggesting that rather than driving innovation, talent shortages may
inhibit a country’s ability to implement AI workforce strategies effectively. H1 and H3 are not supported, as
funding for reskilling and the prevalence of technology-performed tasks were not significant in either
regression.
Overall, the findings highlight the importance of widespread AI adoption at the organizational level as the
primary driver of national workforce adaptation strategies, while also underscoring the need to address talent
shortages that may otherwise impede progress.
DISCUSSION
The present study offers new cross-country evidence on the determinants of national AI workforce strategies
by leveraging employer survey data from 55 countries. Our analysis demonstrates that the breadth of
organizational AI adoption (“AI exposure”) emerges as the most robust predictor of both skill-oriented and
transformation-oriented strategies. In contrast, persistent skills gaps in the labour market are negatively
associated with the adoption of these strategies, and variables such as funding for reskilling or the share of
technology-driven tasks do not significantly explain variation across countries.
These findings are in line with recent research that positions AI adoption and diffusion at the organizational
level as a key enabler of broader workforce transformation (ILO, 2024; McKinsey Global Institute, 2023;

ACCESS Journal:
Access to Science, Business, Innovation in Digital Economy
ISSN 2683-1007 (Online)
2025, 6(3), 532-545, https://doi.org/10.46656/access.2025.6.3(4)
https://journal.access-bg.org/
539
OECD, 2023; World Economic Forum, 2023; World Economic Forum, 2025). The World Economic Forum
reports that organizations already implementing AI are more likely to invest in reskilling and upskilling and
to restructure their business models and internal roles in response to technological change (World Economic
Forum, 2023; World Economic Forum, 2025). Our results extend these insights by confirming this relationship
at the national level across diverse economies, showing that AI exposure remains a critical catalyst for
workforce adaptation strategies regardless of a country’s economic development status (OECD, 2023; ILO,
2024).
The negative association between skills gaps and AI strategy adoption suggests that, contrary to
expectations in some of the literature, talent shortages do not stimulate greater training and transformation
efforts, but rather constrain them (OECD, 2023; World Bank, 2022). This is consistent with evidence from the
OECD and McKinsey Global Institute, which highlight that skills shortages represent a major bottleneck for
digital and AI transition, especially in emerging and mid-income economies where education and training
infrastructure is less developed (McKinsey Global Institute, 2023; OECD, 2023). Our findings thus underscore
the need for targeted policy interventions to expand both the quantity and quality of AI-related talent, rather
than relying on market forces alone to close the gap (European Commission, 2023; UNESCO, 2024).
Interestingly, funding for reskilling and upskilling was not a significant predictor in our models. This result
diverges from policy discourse emphasizing the importance of increased investment in training as a
precondition for successful digital transformation (European Commission, 2023; OECD, 2024). A possible
explanation is that funding alone may not guarantee the effectiveness of workforce strategies unless
accompanied by institutional capacity, industry demand, and access to relevant curricula (OECD, 2024; World
Bank, 2022). Recent case studies demonstrate that countries with robust institutional frameworks for lifelong
learning and active collaboration between government, employers, and education providers see stronger
returns on training investment (OECD, 2024; UNESCO, 2024).
Another novel finding is the lack of significant effect for the human-machine frontier—the share of tasks
already performed by technology—on AI workforce strategies. While one might expect that greater
automation would compel more rapid adaptation, our results suggest that actual organizational readiness and
willingness to engage in AI-driven transformation are more important than structural technological exposure
per se (ILO, 2024; World Bank, 2022). This observation aligns with recent reports cautioning that
technological potential does not automatically translate into broad-based workforce change without
complementary changes in organizational culture and management practices (ILO, 2024; World Economic
Forum, 2025).
In sum, our results highlight that AI workforce transformation is driven less by generic “push” factors such
as funding or automation levels, and more by the “pull” of widespread organizational AI adoption (World
Economic Forum, 2023; World Economic Forum, 2025). At the same time, severe talent shortages act as a
brake, not a catalyst, on strategic adaptation (McKinsey Global Institute, 2023; OECD, 2023). These
conclusions reinforce calls in the latest global reports for integrated approaches that combine national
ACCESS Journal:
Access to Science, Business, Innovation in Digital Economy
ISSN 2683-1007 (Online)
2025, 6(3), 532-545, https://doi.org/10.46656/access.2025.6.3(4)
https://journal.access-bg.org/
540
investment in AI diffusion with strategic initiatives to build and attract AI talent, improve educational quality,
and foster industry-academic partnerships (European Commission, 2023; OECD, 2024; UNESCO, 2024;
World Economic Forum, 2025).
Policy Recommendations
The findings of this study indicate that effective national adaptation to AI in the workforce depends on
more than individual training initiatives or funding alone; it requires the presence of a supportive ecosystem
environment, especially in public governance.
First, governments should foster an ecosystem approach by actively coordinating and incentivizing
collaboration among key stakeholders—public agencies, private employers, educational institutions,
technology providers, and civil society. This means building platforms for dialogue, co-creation of training
programs, and transparent policy frameworks supporting lifelong learning and digital skills. Countries with
robust, well-coordinated governance ecosystems achieve greater progress in both the diffusion of AI and
workforce transformation (OECD, 2024; UNESCO, 2024; World Economic Forum, 2025).
Second, public administration should move beyond siloed, top-down programs to build adaptive and
integrated systems that support AI readiness at all levels. This includes:
Incentivizing public-private partnerships and cross-sectoral initiatives;
Embedding digital and AI literacy across all stages of education, from schools to higher education and adult
learning;
Ensuring that regulatory and funding mechanisms are flexible, inclusive, and responsive to rapid
technological and labour market change.
Third, policy should prioritize the adoption of AI not only in large corporations, but also among SMEs and
the public sector to broaden exposure and readiness (OECD, 2024).
Fourth, investments should target not only training budgets but also the development of institutional
capacity and incentives for collaboration between employers, education systems, and governments (UNESCO,
2024; European Commission, 2023). This will help ensure that upskilling and reskilling efforts are sustainable
and aligned with actual labour market needs.
Fifth, addressing skills gaps requires both short-term retraining initiatives and long-term reforms in STEM
and digital education (World Bank, 2022; OECD, 2023). Building strong educational foundations for future
generations is as important as responding to current talent shortages.
Additionally, data-driven governance and monitoring should be enhanced to track workforce trends, skills
gaps, and the impact of AI-related policies. Open data sharing among ecosystem actors can further accelerate
best practice adoption and training innovation.
Policy makers should also encourage innovative partnerships between the private sector and higher
education institutions to align training programs with evolving labour market needs. The experience of
endowment funds in Kazakhstan demonstrates that such collaborations can effectively support the
development of industry-relevant skills and contribute to workforce readiness, particularly in specialized fields
ACCESS Journal:
Access to Science, Business, Innovation in Digital Economy
ISSN 2683-1007 (Online)
2025, 6(3), 532-545, https://doi.org/10.46656/access.2025.6.3(4)
https://journal.access-bg.org/
541
like tourism (Khusainova et al., 2021). This underscores the broader potential of public-private-academic
synergies to drive human capital development and sustain the momentum of digital and sectoral transformation
(Abuseridze et al., 2024).
Efforts to improve workforce development and sectoral performance should be supported by
comprehensive reforms and effective leadership across key public sectors. For example, evidence from
Kazakhstan’s healthcare system demonstrates that policy measures aimed at enhancing efficiency and
sustainability can yield significant socio-economic benefits (Smailov et al., 2022). At the same time, research
shows that leadership quality and targeted expertise development within the education sector are critical for
improving teacher performance and adapting to evolving educational needs (Sayabek et al., 2018). As noted
by recent studies, effective leadership combined with targeted reforms is key to achieving sustainable progress
across sectors (Abuseridze et al., 2022).
Finally, the public sector should lead by example—investing in AI upskilling and transformation of its own
workforce, modernizing HR practices, and piloting innovative approaches to talent development.
These recommendations align with the direction of the OECD AI Policy Observatory (OECD, 2024),
UNESCO (UNESCO, 2024), and the World Economic Forum’s “Reskilling Revolution” initiative (World
Economic Forum, 2023; World Economic Forum, 2025), which collectively emphasize ecosystem-level
responses to the challenges and opportunities posed by AI for the global workforce.
CONCLUSION
This research advances the international understanding of how countries are responding to the rapid
proliferation of artificial intelligence (AI) by empirically analyzing the determinants of national workforce
strategies. Through the development of two original composite indices—AI Skills Focus and AI
Transformation Focus—this study systematically captures both the emphasis on workforce training and the
broader organizational adaptation strategies adopted by countries worldwide. By leveraging recent employer
survey data across 55 nations, the research offers robust comparative insights that were previously lacking in
the literature.
The findings consistently demonstrate that organizational AI exposure, measured as the proportion of firms
already implementing AI technologies, is the strongest and most reliable predictor of a nation’s readiness to
adopt both skills-oriented and transformation-oriented strategies. This underscores the central role that
widespread AI adoption at the enterprise level plays in driving national workforce transformation. Notably,
the analysis also reveals that persistent skills gaps in the labour market present a significant obstacle to
effective AI adaptation. Rather than spurring more aggressive upskilling or transformation efforts, a shortage
of digital and technical talent appears to constrain countries’ ability to respond proactively to the demands of
the AI era.
Other examined factors - including funding for reskilling and upskilling, the extent of automation (human-
machine frontier), and labour-market churn - were not found to be significant predictors in most models. This
ACCESS Journal:
Access to Science, Business, Innovation in Digital Economy
ISSN 2683-1007 (Online)
2025, 6(3), 532-545, https://doi.org/10.46656/access.2025.6.3(4)
https://journal.access-bg.org/
542
finding suggests that simply increasing training budgets or exposure to automation technologies, in isolation,
may be insufficient to ensure national preparedness for AI-driven change.
The results point to the importance of adopting a holistic, ecosystem-based approach to workforce policy.
This approach goes beyond individual training initiatives and places a premium on active coordination among
government agencies, employers, and educational institutions. It also highlights the value of developing
supportive institutional environments that enable continuous learning, encourage public-private collaboration,
and facilitate rapid adaptation to emerging technologies.
Policy recommendations arising from this study emphasize the need for governments to foster AI adoption
across all sectors—including small and medium-sized enterprises and the public sector - while simultaneously
investing in institutional capacity, strengthening digital and STEM education, and addressing skills shortages
through both short-term interventions and long-term reform.
Ultimately, preparing the workforce for the opportunities and challenges presented by AI requires more
than reactive training programs. It demands resilient institutions, flexible governance systems, and a culture
of lifelong learning that together can sustain national competitiveness and social inclusion in the face of rapid
technological change.
Author Contributions:
Conceptualization, A.A. and A.D.; methodology, S.I.; software, A.Z.; validation, S.I., A.Z. and A.D.; formal
analysis, A.A.; investigation, A.Z.; resources, A.D.; data curation, S.I.; writing—original draft preparation,
S.I.; writing—review and editing, R.I.; visualization, A.Z.; supervision, A.D.; project administration, A.A.;
funding acquisition, A.A. All authors have read and agreed to the published version of the manuscript.
Funding /Acknowledgement:
This research is funded by the Ministry of Science and Higher Education of the Republic of Kazakhstan
(BR24993258).
Institutional Review Board Statement: not applicable
Informed Consent Statement: not applicable
Data Availability Statement:
The data presented in this study are available on request from the corresponding author.
Conflict of interest: The authors declare no conflict of interest.
References
Abuseridze, G. & Kikilashvili, G. (2025). The Role of the Judiciary in the Modern Legal State and Its Interaction with
Domestic and International Law. In E. Alaverdov & G. Abuseridze (Eds.), Globalization, Global Security, and New
ACCESS Journal:
Access to Science, Business, Innovation in Digital Economy
ISSN 2683-1007 (Online)
2025, 6(3), 532-545, https://doi.org/10.46656/access.2025.6.3(4)
https://journal.access-bg.org/
543
International Realities for Modern Democracies, pp. 21-40. IGI Global Scientific Publishing.
https://doi.org/10.4018/979-8-3373-1355-9.ch002
Abuseridze, G., Agapova, O., & Petrova, M. (2024). WTO and the Future of Global Business Tourism: Trends and
Challenges. In M. Bari, M. Soliman, & E. Alaverdov (Eds.), Shifts in Knowledge Sharing and Creativity for Business
Tourism (pp. 264-280). IGI Global Scientific Publishing. https://doi.org/10.4018/979-8-3693-2619-0.ch015
Abuseridze, G., Petrova, M., Zahars, V., & Tumalavičius, V. (2022). Transformation of Georgia’s trade policy strategy:
from frailty to sustainability. Access to science, business, innovation in digital economy, 43-52.
https://doi.org/10.46656/access.2022.3.1(4)
Abuseridze, G. (2021). The Role of the WTO in the Development of International Trade: History, Problems and
Perspectives of International Trade Law. Doctoral Thesis. https://doi.org/10.25143/prom-rsu_2021-15_dt
Adilova, N., Sultanbek, M., Sarzhanov, D., Sładkowski, A. & Zhanseitov, A. (2024). Digital Solution for Effective
Management of Remote Work: The Case of Kazakhstan Railway. Economics, 13(1), 2024. 231-245.
https://doi.org/10.2478/eoik-2025-0011
Akybayeva G., Mussabekova A., Mambetova S., Ayaganova M., Koitanova A. (2024). The Impact of Female
Entrepreneurship on Economic Growth in Developing and Developed Economies. Economics, 12(2), 145–162.
https://doi.org/10.2478/eoik-2024-0016
Antonova, D., Beloeva, S., Todorova, A. (2024). The dual impact of artificial intelligence: catalyst for innovation or threat
to stability. Strategies for policy in science and education-strategii na obrazovatelnata i nauchnata politika. Vol. 32
(6s). pp.49-58. https://doi.org/10.53656/str2024-6s-4-dua
Arntz, M., Gregory, T., & Zierahn, U. (2016). The Risk of Automation for Jobs in OECD Countries: A Comparative
Analysis. OECD Social, Employment and Migration Working Papers, No. 189. Paris: OECD Publishing.
https://doi.org/10.1787/5jlz9h56dvq7-en
Benhmama, A., Bennani, Y.B. (2024). Factors driving the adoption of artificial intelligence technology in the recruitment
process in Morocco. Access to science, business, innovation in the digital economy, ACCESS Press, 5(3), 387-406,
https://doi.org/10.46656/access.2024.5.3(1)
Bessen, J. E. (2019). AI and Jobs: The Role of Demand. NBER Working Paper No. 24235. National Bureau of Economic
Research. https://doi.org/10.3386/w24235
Bolyssov, T., Yessengeldin, B., Akybayeva, G., Zhanseitov, A., & Sultanova, Z. (2019). Features of the use of renewable
energy sources in agriculture. International Journal of Energy Economics and Policy, 9(4), 363–368.
https://doi.org/10.32479/ijeep.7443
Brynjolfsson, E., & McAfee, A. (2014). The Second Machine Age: Work, Progress, and Prosperity in a Time of Brilliant
Technologies. New York: W.W. Norton & Company. ISBN: 978-0-393-35064-7. 336 p
Chornous, G., Dimitrov, R., Fareniuk, Y., Penkova, M., Nosko, R. (2025). Integration of feeling AI tools to support
marketing solutions in e-commerce. Access to science, business, innovation in the digital economy, ACCESS Press,
6(2), 415-436, https://doi.org/10.46656/access.2025.6.2(10)
European Commission. (2023). European Skills Agenda for sustainable competitiveness, social fairness and resilience.
Brussels: European Commission. https://ec.europa.eu/social/main.jsp?catId=1223 (accessed on February 12, 2025)
ILO. (2024). Global Employment Trends for Youth 2024: Technology and the Future of Jobs. Geneva: International
Labour Organization. https://www.ilo.org/publications/major-publications/global-employment-trends-youth-2024
(accessed on March 12, 2025)
Khusainova, Z., Asanova, M., Akybayeva, G., Mardanova, A., & Abauova, G. (2021). Endowment funds as an effective
form of partnership between the business sector and the higher education system. Case of training specialists in the
tourism industry. Journal of Environmental Management and Tourism, 12(8), 2194–2216. Retrieved
from https://journals.aserspublishing.eu/jemt/article/view/6663 (accessed on April 22, 2025)
Le, T.T.L., Le, V.C., Le, T.L., (2025). The impact of artificial intelligence on e-commerce entrepreneurship: the mediating
role of business opportunity awareness. Access to science, business, innovation in digital economy, ACCESS Press,
6(2), 452-463, https://doi.org/10.46656/access.2025.6.2(12)
McKinsey Global Institute. (2023). The state of AI in 2023: Generative AI’s breakout year.
https://www.mckinsey.com/capabilities/quantumblack/our-insights/the-state-of-ai-in-2023-generative-ais-breakout
-year (accessed on February 22, 2025)

ACCESS Journal:
Access to Science, Business, Innovation in Digital Economy
ISSN 2683-1007 (Online)
2025, 6(3), 532-545, https://doi.org/10.46656/access.2025.6.3(4)
https://journal.access-bg.org/
544
Mukhitdinova, M., & Petrova, M. (2025). Exploring the Potential of the Bicameral Mind Theory in Reinforcement
Learning Algorithms. Computers, 14(6), 218. https://doi.org/10.3390/computers14060218
Mussapirov, K., Djаlkibaev, J., Kurenkeyeva, G., Kadirbergenova, A., Petrova, M., Zhakypbek, L. (2019). Business
scaling through outsourcing and networking: selected case studies. Entrepreneurship and Sustainability Issues, 7(2),
1480-1495. http://doi.org/10.9770/jesi.2019.7.2(48)
OECD. (2023). OECD Employment Outlook 2023: Artificial Intelligence and the Labour Market. Paris: OECD
Publishing. https://www.oecd.org/en/publications/oecd-employment-outlook-2023_08785bba-en.html (accessed on
April 26, 2025)
OECD. (2024). OECD AI Policy Observatory. Paris: OECD Publishing. https://oecd.ai/en/ (accessed on April 25, 2025)
Petrova, M., Tairov, I. (2022). Solutions to Manage Smart Cities’ Risks in Times of Pandemic Crisis. Risks 2022, 10, (12)
240. https://doi.org/10.3390/risks10120240
Smailov, B., Andarova, R., Akybayeva, G., Mambetova, S., & Gelashvili, N. (2022). Improving the Efficiency of the
National Healthcare as Oriented Sustainable System. The Socio-Economic Aspects and Environmental Issues.
Journal of Environmental Management and Tourism, 13(5), 1425–1442. DOI: 10.14505/jemt.v13.5(61).18
Sayabek, Z., Madiyarova, A., Ulan, T., Aizhan, K., & Zhanar, T. (2018). Role of leaders in developing expertise in
teaching and their influence on teachers in Kazakhstan. Academy of Strategic Management Journal, 17(3), 1–13
Tairov, I., Stefanova, N., Aleksandrova, A., Aleksandrov, M. (2024). Review of AI-Driven Solutions in Business Value
and Operational Efficiency. Economics Ecology Socium, 8, 55-66. https://doi.org/10.61954/2616-7107/2024.8.3-5
UNESCO. (2024). Artificial Intelligence and Education: Guidance for Policy-Makers. Paris: UNESCO.
https://unesdoc.unesco.org/ark:/48223/pf0000376709
World Bank. (2022). World Development Report 2022: Finance for an Equitable Recovery. Washington, DC: World
Bank. https://www.worldbank.org/en/publication/wdr2022 (accessed on April 25, 2025)
World Economic Forum. (2020). The Future of Jobs Report 2020. Geneva: World Economic Forum.
https://www.weforum.org/reports/the-future-of-jobs-report-2020/ (accessed on April 25, 2025)
World Economic Forum. (2023). The Future of Jobs Report 2023. Geneva: World Economic Forum.
https://www.weforum.org/reports/the-future-of-jobs-report-2023/ (accessed on April 25, 2025)
World Economic Forum. (2025). The Future of Jobs Report 2025 (forthcoming). Geneva: World Economic Forum.
https://www.weforum.org/publications/the-future-of-jobs-report-2025/ (accessed on April 25, 2025)
Yessengeldin, B., Khussainova, Z., Kurmanova, A., Syzdykova, D., & Zhanseitov, A. (2019). Exploitation of natural
resources in Kazakhstan: Judicial practice for foreign investment. Journal of East Asia and International Law, 12(1),
169–179
Zhumanova, M., Karakulov, Y., Turdaliyev, A., Turdaliyeva, A., & Sagyndykova, S. (2023). Digital transformation and
its impact on business process management: Evidence from Kazakhstan. Entrepreneurship and Sustainability Issues,
10(4), 1923–1939
About the authors
Saule ISKENDIROVA,
Candidate of Economic Sciences, associated professor, Professor of The Branch of
Akmola Region, The Academy of Public Administration under the President of the
Republic of Kazakhstan: Kokshetau, Kazakhstan. Awarded the national title “The
Best University Lecturer” in 2014.
Research interests: strategic planning, higher education system, strategic human
resource management, talent management, public personnel policy, ecosystem and
human-centric approach in HRM, change management in the public sector,
performance assessment and digital transformation in public administration,
management and decision making.
ORCID: 0000-0003-3596-8831

ACCESS Journal:
Access to Science, Business, Innovation in Digital Economy
ISSN 2683-1007 (Online)
2025, 6(3), 532-545, https://doi.org/10.46656/access.2025.6.3(4)
https://journal.access-bg.org/
545
Aigerim AMIROVA,
Doctor in Public Administration, research project leader. She has over 15 years of
experience in public service and around 8 years in academic research. Certified in
HR management (SPHRi), project management (PRINCE2 Foundation), and data
analytics. Recipient of the state award “For Distinguished Labor” (2015) and other
departmental honors. Active participant in interagency working groups on public
administration reform, including civil service, public services, decentralization, and
transformation of the state planning system.
Research interests: transformational project management, project governance,
strategic HR management, and innovation in the public sector.
ORCID: 0000-0003-1250-0777
Aliya DAUESHOVA,
PhD, Head of the Competency Assessment and Talent Management Sector at the
Institute of Human Resource Management, and Associate Professor at the Institute
of Management, Academy of Public Administration under the President of the
Republic of Kazakhstan.
Research interests: HR management, talent management, competency assessment,
regional governance, urban management, and metropolitan area governance.
ORCID: 0000-0002-9872-6111
Azamat ZHANSEITOV,
Associate Professor at the Karaganda Regional Branch of the Academy of Public
Administration under the President of the Republic of Kazakhstan, Karaganda,
Kazakhstan.
Research interests: finance, economics, higher education system, strategic human
resource management, public personnel policy, performance assessment, digital
transformation in public administration, management, and decision-making.
ORCID: 0000-0001-9495-0530
Rymkul ISMAILOVA,
Doctor of Economic Sciences, Professor at the School of Creative Industries, Astana
IT University, Astana, Kazakhstan. Recipient of the “For Merit in the Development
of Science of the Republic of Kazakhstan” badge (2011), the “Best University
Lecturer” grant (2007), and the international “Bolashak” scholarship (2013).
Author of over 170 scientific publications and supervisor of six PhD graduates.
Research interests: project management, agile and hybrid project methodologies,
project cost management, investment activity, and innovation.
ORCID: 0000-0002-8934-5181
This work is licensed under the Creative Commons Attribution International License (CC BY)

ACCESS Journal:
Access to Science, Business, Innovation in Digital Economy
ISSN 2683-1007 (Online)
2025, 6(3), 546-566, https://doi.org/10.46656/access.2025.6.3(5)
https://journal.access-bg.org/
546
RISK MANAGEMENT PRACTICES AND ORGANIZATIONAL
PERFORMANCE IN TRANSPORTATION COMPANIES
Francis Okechukwu Chikeleze1, Anatolijs Krivins2, Valters Kaze3, Thomas Etalong4
1) Enugu State University of Science and Technology, Enugu, Nigeria
2) Daugavpils University, Daugavpils, Latvia
3) RISEBA University of Applied Sciences, Riga, Latvia
4) ACE Intercontinental Research Institute, Enugu, Nigeria
1 Okeychikeleze@gmail.com; 2anatolijs777@gmail.com; 3valters.kaze@riseba.lv; 4thomasalama@gmail.com
Received: 20 May 2025 Accepted: 13 July 2025 Online Published: 08 August 2025
ABSTRACT
This article explores how the transport companies operating in Enugu manage their risk exposures to improve their
overall performance. The problem of the study is premised on the fact that loss exposures, if not correctly managed,
could result in high losses for business entities both in terms of financial and market performance, effectiveness,
efficiency and other performance areas. The objective of the study was therefore to assess the level of compliance with
standard risk management adopted by these transport companies to ascertain how their management of loss exposures
can be enhanced to reduce the occurrence and impact of these potential losses and mitigate their impact if they
eventually occur. The independent variable in the study was the risk management practices of these companies. In
contrast, the dependent variable was their performance, broken down into effectiveness, efficiency in service delivery,
profitability, customer satisfaction and retention, growth, long-term survival, and their competitive advantage. The
study adopted the survey method to generate qualitative data from respondents. The population of transport companies
operating in Enugu is not quantifiable; therefore, the researcher selected ten companies, comprising both government-
sponsored and private companies. All the selected companies constituted the sample for the study. The study used
primary data generated through the questionnaire instrument, and percentages were used in analysing the generated
data. The study revealed that the risk management practices adopted by the selected companies enhanced their
effectiveness and efficiency in service delivery by 90%; increased their profitability by 70%; increased their customer
satisfaction and retention by 80%; encouraged their growth and long-term survival by 40%; and enhanced their
company's competitive advantage by 70%. The challenges facing the selected companies in managing their risks
include general ignorance of the importance of planned risk management practice (70%); inadequate support by the
executive and management cadre (40%); poor funding of risk management activities (50%); and paucity of deliberate
formulation and implementation of risk management policies (30%). The study concluded that risk management
practice has significant implications for organisational performance and consequently recommends intensive
enlightenment on the risk management function, executive support, and adequate funding for planned risk management
practices, and deliberate policies on risk management. The implication of the study is to highlight that unless
organisations plug the drain of their resources through effective risk management practices, revenues generated will
still be drained through poorly-managed losses, ultimately giving rise to poor performance.
Keywords: risk, management, performance, companies, organization, effectiveness, efficiency
JEL classification: G32, L91, O18, R41, R42
Paper type: Case Study
Citation: Chikeleze, F.O., Krivins, A., Kaze V., Etalong, T. (2025). Risk management practices and organizational
performance in transportation companies. Access to science, business, innovation in the digital economy, ACCESS
Press, 6(3), 546-566, https://doi.org/10.46656/access.2025.6.3(5)

ACCESS Journal:
Access to Science, Business, Innovation in Digital Economy
ISSN 2683-1007 (Online)
2025, 6(3), 546-566, https://doi.org/10.46656/access.2025.6.3(5)
https://journal.access-bg.org/
547
INTRODUCTION
The ultimate performance of organisations is traditionally judged by their net profit, which is calculated as
income minus expenditure. Much as some of their losses are captured under accounting disclosures, many
losses are not reflected in the organisation's accounting records. The usual absence of some of the salient
losses in published organisations' records usually results in their not being given adequate attention in
organisational management, even though they may significantly determine their overall progress, growth and
performance in the long run. Suppose these losses are given the prime place they occupy in organisational
performance. In that case, the loss exposures that give rise to them are bound to be given prime attention in
organisations' risk management practice, thereby minimising such incidence of losses.
Organisational loss exposures often emanate from both tangible and intangible areas such as assets,
operations, human capital, environment, financial, and legal issues. Even where organisations earn high
profit, the net profit is often depleted by the losses incurred in some of those areas mentioned above if they
are not well managed. In other words, organisational performance is not only measured by the amount of
their gross profit minus tangible expenses, but also by how well they have been able to manage leakages
arising from different loss exposures. All organisational performance indicators, such as effectiveness in
service delivery, financial performance, profitability, efficiency in resource deployment, stakeholders'
satisfaction, market performance, relevancy, and shareholders’ value, are attended by different risks (Krivins
et al., 2021) arising from associated loss exposures.
The achievement of good performance in all the above-mentioned areas is laden with challenges that
usually expose the organisations to various lost opportunities. For instance, the loss of critical marketing
personnel may affect an organisation's market share. Again, the loss of a critical software developer by an IT
organisation may seriously affect the performance of such an organisation. Litigation bordering on bad
product quality may tarnish the image of an organisation and erode its goodwill hitherto enjoyed in the
marketplace; such legal challenges not only lead to financial losses through penalties and compensation but
also harm customer loyalty, negatively affecting long-term business sustainability and competitive advantage
(Abuseridze, 2025). The financial cost of prosecuting such litigations may be reflected in the books of
accounts. However, the lost goodwill is hardly captured in tangible terms as part of the loss to the
organisation. Again, the loss of business opportunities is not usually captured in organisations' balance
sheets, but they are critical losses to organisational performance. These and many others are some of the loss
exposures that may not easily be reflected in an organisation's accounting books, but which have a significant
impact on their overall performance.
Effective risk management practices play a crucial role not only in direct risk mitigation but also in
supporting the broader organisational goals of sustainable business development and adaptability in rapidly
changing environments. For instance, Ščeulovs, Gaile-Sarkane, and Kaže (2011) highlighted the importance
of leveraging electronic environments and e-marketing tools as part of strategic initiatives to promote
ACCESS Journal:
Access to Science, Business, Innovation in Digital Economy
ISSN 2683-1007 (Online)
2025, 6(3), 546-566, https://doi.org/10.46656/access.2025.6.3(5)
https://journal.access-bg.org/
548
sustainable business growth among Latvian enterprises. However, their study revealed significant gaps in
risk awareness and a limited utilisation of digital tools among small and medium-sized businesses. Such
deficiencies impede companies’ ability to respond proactively to market shifts and consumer trends,
subsequently elevating the risks associated with missed opportunities and reduced competitiveness. A
healthy business environment would contribute to a more sustainable societal development in many areas,
even up to spatial development, which is quite often influenced by transportation and logistics businesses
from planning to managing environmental effects (Miszczak et al., 2024).
Similar observations regarding the importance of adaptive strategies and risk management can be drawn
from the Latvian banking (Durguti et al., 2024; Obeid, 2024) industry. It has been found that the evolution of
e-banking services was driven primarily by strategic adaptation to technological advances and shifts in
consumer preferences within a knowledge-based economy (Kaže et al., 2007). Organisations slow to adopt
digital transformation initiatives faced heightened strategic risks, including loss of market share, weakened
competitive positioning, and decreased consumer trust (Ščeulovs et al., 2011). These insights underscore that
robust risk management practices, encompassing technological adaptation and responsiveness to evolving
market conditions, are fundamental to maintaining organisational resilience and long-term sustainability.
By including all areas of leakages, organisations can comprehensively analyse and appreciate their total
loss in any business year, whether they are tangible or intangible. It may not be possible to measure the
monetary value of intangible losses. However, a good knowledge of their existence and proper management
will help to reduce their negative impact on organisational performance. Nevertheless, where they are not
taken cognisance of, the tendency is for organisations to continue to carry those loss exposures along with
them year after year without even knowing the limitations they impose on their performance.
Again, organisations can only manage their risk portfolios if they understand their loss exposures. Without a
credible way of identifying, analysing and estimating organisations' loss exposures, risk management may
not meet organisational needs because risk management is fundamentally based on a good understanding and
appreciation of the organisation's aggregate loss exposures. As pointed out by Rejda (2011), Rejda et al.
(2014), effective appreciation of the level and direction of organisations' loss exposure, as well as their
frequency and severity, goes a long way in prescribing their risk management strategies, preferences and
procedures. Therefore, where these loss exposures are substantially identified and given good attention, their
negative impact on organisational performance will be highly reduced, thereby giving the organisation
greater opportunity for better performance.
However, the common practice is that organisations often focus attention on what they have gained or lost
in the marketplace in terms of net profit or loss without much attention to the higher gain that would have
accrued to them if more attention were paid to managing their tangible and intangible loss exposures that
deplete their efforts. This apparent lack of due attention to effective management of organisations' loss
exposure has been predicated on their poor risk identification, assessment, analysis and deliberate efforts at
effective risk management practices.
ACCESS Journal:
Access to Science, Business, Innovation in Digital Economy
ISSN 2683-1007 (Online)
2025, 6(3), 546-566, https://doi.org/10.46656/access.2025.6.3(5)
https://journal.access-bg.org/
549
An essential, though frequently overlooked, aspect of risk management is the human factor related to
decision-making profiles of the personnel in charge of the business, particularly operations. This is an
important consideration for hiring, placing and training the personnel. An important driver that influences
managerial decisions regarding risk is the underlying system of human values. Recent empirical studies
highlight that personal values significantly shape individual risk perceptions and consequent behaviours.
Kaže, Škapars, and Bolinskis (2011) demonstrated through their analysis of consumer participation in the
shadow economy that individuals with values centred around self-interest and immediate gratification tend to
exhibit greater risk tolerance, reflected in their readiness to engage in informal economic activities, including
tax evasion. In contrast, individuals whose values emphasise tradition, stability, and societal welfare
generally display higher risk aversion and adherence to formal, compliant behaviours. Values might even
serve as a base for making decisions about markets by matching the target markets with their potential
customers, as shown in a study by Kaže, Škapars, and Ščeulovs (2011).
Moreover, innovative methodologies for measuring personal values using image-based techniques, as
developed by Kaže, Bolinskis, and Kurovs (2022), further confirm that understanding these motivational
underpinnings is crucial for effective managerial decision-making. Their research indicates that visual
approaches in measuring values not only bypass the social desirability biases often encountered in traditional
text-based surveys but also enhance respondent engagement and yield more precise insights into an
individual’s motivational profile. By integrating these image-based tools into organisational risk assessment
frameworks, managers in transportation companies could achieve a more nuanced understanding of their
employees’ risk attitudes, thereby refining their strategies for risk mitigation and enhancing overall
organisational performance.
Experience has also revealed that a good number of organisations go about their business without giving
due attention to possible loss exposures facing them. Some are aware that those loss exposures exist, while
some others are entirely ignorant of them. Again, some of those who are aware of such loss exposures make
feeble efforts to pre-empt them, while many others hope the losses will not occur. Consequent upon not
being aware of such loss exposures or not making adequate provisions to contain them should they occur,
exposes organisations to losses that would otherwise have been avoided both in frequency and magnitude. It
is common knowledge that risk management lapses have contributed substantially to avoidable losses by
organisations and have negatively affected their overall performance. On the other hand, if organisations can
do detailed risk analysis to identify their loss exposures and put standard risk management programmes in
place and strategies to avert or mitigate them, their performance outcome is bound to be higher in terms of
profitability, market share, efficiency, effectiveness and returns on investment.
This study is therefore focused on exploring ways of substantially reducing avoidable losses that impact
negatively on organisational performance by examining the extent to which organisations identify the
various loss exposures that attend their operations, their level of adherence to standard risk management
processes, and the strategies they adopt in addressing loss exposures. It also explores the challenges facing
ACCESS Journal:
Access to Science, Business, Innovation in Digital Economy
ISSN 2683-1007 (Online)
2025, 6(3), 546-566, https://doi.org/10.46656/access.2025.6.3(5)
https://journal.access-bg.org/
550
organisations in effectively managing their loss exposures and offers possible solutions to identified
challenges.
LITERATURE REVIEW
In modern conditions of globalisation, digitalisation and increasing external threats, effective risk
management becomes a key element of the organisational efficiency of transport companies. A variety of
risks that transport systems are subjected to - from natural disasters to technological failures and cyber
threats - requires an integrated approach that includes stability, flexibility, and innovative solutions. We have
identified five current areas in which researchers are focused.
Global calls of transport systems and supply chains can indicate the first area of research. The Covid-19
pandemic demonstrated the scale of the vulnerabilities of the global supply chains and set the task of
ensuring their stability in conditions of uncertainty for transport companies (Beloev, & Grozev, 2025;
Bulgakov et al., 2023). The pandemic exposed the fragility of just-in-time logistics models and underscored
the urgency of increasing resilience through diversified routing strategies and digital tracking systems
(Abuseridze, 2021). One of the practical tools for mitigating such risks is modal flexibility. In particular, the
analysis of the production sector of the United States showed that the use of air transport allows companies
to maintain the stability of stocks during periods of global failures (Ke et al., 2025). In turn, the global
container shipping network (GCSN) also showed high sensitivity to cascading malfunctions due to the high
degree of interconnectedness of ports. A model for assessing the stability of the network has been developed,
based on the analysis of the significance of ports and the redistribution of the load. Analysis of 686 ports
around the world revealed the need for accurate determination of throughput thresholds to prevent large-
scale cascading failures. Also, it proposed recommendations for port authorities to increase the stability of
the infrastructure (Cao et al., 2025).
The second block of research is innovative approaches to transport stability. Modern risks require multi-
level assessment and intervention systems (Pencheva et al., 2019). For example, an approach to assessing the
risk of road safety based on the VIKOR model, taking into account the regional features of the infrastructure,
road conditions and drivers' behaviour, which allows the development of differentiated security management
strategies depending on the level of socio-economic development of the region (Wei et al., 2025). In the
context of the growing role of transport hubs, the importance of developing effective evacuation strategies in
emergencies increases. For this, a mixed integer model is proposed, combining pedestrian flows and
multimodal vehicles. The created algorithm for Variable Neighbourhood Search (VNS) showed high
efficiency and a reduction of evacuation time by 17.2% (Tang et al., 2025). Particular attention is paid to
ensuring fire safety in extensive transport facilities. A methodology has been developed for assessing the
stability of fire systems in smart airports, including structural, functional, organisational and adaptive
components (Zhu et al., 2025). Modern approaches to increasing road safety actively use the explainable
artificial intelligence (XAI). The structure of decision -based support based on machine learning models
ACCESS Journal:
Access to Science, Business, Innovation in Digital Economy
ISSN 2683-1007 (Online)
2025, 6(3), 546-566, https://doi.org/10.46656/access.2025.6.3(5)
https://journal.access-bg.org/
551
(ANN, SVM, RF, XGBoost) has been developed, where methods for assessing the importance of features
(PFI (Permutation Feature Importance) and FIRM (Feature Importance Ranking Measures)) are used, which
increases transparency and validity of the conclusions for the transport policy (Abdulrashid et al., 2025).
The third direction is risk management and adaptation to extreme conditions. In conditions of adverse
weather, passenger behaviour changes significantly. The study of the behaviour of Shanghai passengers
during periods of storm warnings showed the influence of gender, educational and profitable factors on the
adaptation of routes (Zha & Li, 2025). For interregional transportation, it was established that passengers
more often adjust the dates of trips, which involves a change in the type of transport. The main determining
factors were the availability of transport, income, education and geographical position of the departure, while
snow and windy weather more often provoke changes in the plans (Yuan et al., 2025). Risk management is
important not only in passenger transportation but also in the management of water transport routes. The
study of the regulation of the Hui River (China) using the MIKE21 hydrodynamic model showed a
contradiction between the improvement of shipping and the risks of coastal erosion and sedimentation. In
response, adaptive strategies of dredging and restoration of coastal zones are proposed (Quan et al., 2025).
Long-term precipitation in the Great Bačka Canal near Vrbas revealed a stable tendency to reduce pollution
of some heavy metals, but the risks of copper and nickel are maintained. The study emphasises the
importance of transition to integrated precipitation management with elements of the circular economy
(Pilipović et al., 2025).
Fourth, the actual direction can be considered technological calls of digitalisation and cybersecurity. As
digital systems become central to public and private operations, the need for both technological innovation
and robust cybersecurity measures has grown. While digitalization enhances efficiency and accessibility, it
also increases exposure to cyber threats, making cybersecurity a core component of sustainable digital
transformation (Abuseridze et al., 2022). The development of digital technologies in the transport industry
creates new risks associated with cybersecurity and data management. The introduction of connected and
automated vehicles requires reliable security mechanisms when updating the air software over-the-air
(OTA). An adaptable OTA security approach has been developed, including threat analysis and risk
assessment according to the ISO/SAE 21434 standard, which can minimise system vulnerability (Iyieke et
al., 2025). Particular attention is also paid to safety in the construction of transport infrastructure facilities.
For the design of readiness for emergencies in the construction of the Chinese city rail transport, an
ontological method of searching for similar cases is proposed, based on the analysis of risk factors. This
allows you to increase the efficiency of using accumulated experience in risk management (Xu et al., 2025).
Mixed movement involving cars with adaptive cruise control (ACC) requires the development of new
management solutions. Two new road policies are proposed: limiting the use of ACC in high-density zones
and regulating time intervals. The combination of these measures with traditional approaches allows you to
reduce trolleys without increasing the accident rate (Yu & Yeo, 2025). Logistic companies switching to the
use of electric trucks (H-BEV) are faced with new types of failures, especially related to the charging
ACCESS Journal:
Access to Science, Business, Innovation in Digital Economy
ISSN 2683-1007 (Online)
2025, 6(3), 546-566, https://doi.org/10.46656/access.2025.6.3(5)
https://journal.access-bg.org/
552
infrastructure. The main problems have been identified and softening strategies have been developed,
including information support systems and additional resources, which is an important step towards a stable
zero emission of cargo transportation (Björklund et al., 2025).
Finally, fifthly, researchers pay increased attention to the role of smart transport systems and innovations.
The development of intellectual tools for evaluating and optimising transport systems plays an increasingly
important role in ensuring their stability and organisational efficiency. A method of assessing the reliability
of transport infrastructure using artificial intelligence and machine learning is proposed, which allows for
taking into account the complexity and uncertainty of modern systems. To optimise the train schedule, a
temporary window is proposed, which allows minimising conflicts with a limited throughput of railway
infrastructure (Paul et al., 2025; Chen et al., 2025). An intelligent model for assessing the state of railway
infrastructure has been developed, which increases the accuracy of monitoring and maintenance efficiency
(Bi et al., 2025). In the conditions of urban mobility, the integration of bus routes and bicycle rental systems
is proposed, which makes it possible to increase the availability of transport and the stability of the transport
system as a whole (Sadeghi et al., 2025). To assess the stability of transport systems in the conditions of
natural disasters, a hybrid simulation-electrical method has been developed, which helps to produce recovery
strategies with limited resources (Ma and Lee, 2025). Finally, the use of digital doubles to integrate logistics
flows and transport systems can significantly increase the accuracy of planning, the flexibility of operations
and the overall stability of logistics networks (see, for example, Dong et al., 2025).
A generalised analysis of modern studies demonstrates that effective risk management in transport
companies requires a systemic and multi-level approach. The integration of innovative technologies, digital
tools, flexible organisational strategies and adaptive management models allows transport companies not
only to minimise the impact of various threats, but also to increase general organisational efficiency in the
context of global challenges.
Regarding the role of members of the boards of enterprises in reducing these risks, the following can be
noted. Liang (2025) carried out a study on the role of board members in mitigating risk in an organisation
using content analysis. The tool of analysis came from a review of analytical research from journal articles,
books, and internet resources. The findings of the study indicated that corporate boards play a critical role in
framing modalities to prevent any form of risk within the organisation to optimise their profitability. Yahaya
(2024) studied the impact of the risk management committee (RMC) on firms as a mediation practice. The
study used a panel data collection method in collecting data from publicly traded companies covering a
period of ten years from 2013 to 2024. The collected data were tested using the multiple regression method.
The results indicate that although the existence of a Risk Management Committee (RMC) correlates with
reduced business risk, complete risk mitigation is attained only when risk management practices—such as
risk assessment, monitoring, and compliance verification—are actively executed. Wei (2025) carried out a
study titled "Optimising cash flow management for ship financing leasing: Risk identification, risk
assessment, and management strategies" using content analysis by sourcing data from public databases and
ACCESS Journal:
Access to Science, Business, Innovation in Digital Economy
ISSN 2683-1007 (Online)
2025, 6(3), 546-566, https://doi.org/10.46656/access.2025.6.3(5)
https://journal.access-bg.org/
553
internet records. They found out that as technology advances and market conditions shift, the risks and
challenges encountered by the ship financing leasing sector are ever evolving. The available literature
reviewed on the subject matter of the study centred more on the financial and other sectors (Muhamud et
al., 2024) without due attention to the transport sector. It also did not show any discussion that addressed
the transport companies in Enugu State, Nigeria. This was the gap the study filled.
METHODOLOGY
A telephone survey was conducted in the Enugu region of Nigeria between 4 and 18 May 2025. Ten
transport companies operating in Enugu participated in the study, including public and private sector
companies. Four employees were interviewed in each company: Management/top management (1 person) -
the CEO, COO or Chief Risk Officer (their opinion is important for understanding the strategic approach to
risks); Middle managers (1-2 people) - the head of the logistics department, IT manager or chief accountant
(they reflect the implementation of strategies in practice); Operational employees (1-2 people) - those who
face risks on a daily basis (e.g. dispatchers, maintenance specialists (their answers provide information
“from below”). Four questionnaires were received from each company, respectively, 40 questionnaires were
received from all companies.
The data generated in the study were analysed using simple percentages and aggregate scores for each
response option. The positive responses, such as very good and good, were grouped, while the negative
responses, such as bad and very bad, were also grouped. This was adopted rather than individual
presentations because of space constraints. The responses under "do not know" were eliminated, even though
they were elicited from respondents, because they made no meaningful contributions to the study.
Consequently, only relevant responses were ultimately presented.
This section dealt with how the data generated during the study was generated and analysed. The data
were presented and analysed in line with the objectives of the study.
Data Presentation and Analysis
The study used ten transport companies operating in Enugu for the survey on how the risk management
practices affect organisational performance. The transport companies used cut across the public and private
sectors since the same conditions virtually affect both sectors. Those used were Auto Star, Imo State
Transport Corporation (ITC), Abia Line, Abia Link, Libra Motors, Rivers Transport Company, GUO
Motors, Faith Motors, The Lord's Express, and Peace Mass Transit.
In presenting the data and accompanying discussions, the responses of those who have no opinion on the
questions asked were deliberately omitted because they do not contribute to the issue under discussion.
Again, the responses were grouped and summarised under the positive and negative dispositions rather than
discussing them separately due to space constraints. For example, very often and often were grouped as
positive, while hardly and never were grouped as non-positive responses. This was done for clarity and in
consideration of the maximum allowed page constraint for seminars.

ACCESS Journal:
Access to Science, Business, Innovation in Digital Economy
ISSN 2683-1007 (Online)
2025, 6(3), 546-566, https://doi.org/10.46656/access.2025.6.3(5)
https://journal.access-bg.org/
554
Objective no. 1
Objective 1 was aimed at identifying and examining the Risk management practices adopted by selected
organisations. Areas examined include the existence of the risk management function, adherence to standard
risk management process, use of critical risk management aids, risk management options and approaches
used by the companies. These are presented and discussed under their various figures and tables presented
below.
50
40
10
0
10
20
30
40
50
60
Yes: Independent unit Yes: Sub-unit of
another department No
Figure 1. Existence of risk management function in surveyed companies
Source: created by the authors based on research data
80
60
80
70
13
20
30
0
10
20
30
40
50
60
70
80
90
Identification of
loss exposures Risk assessment
and analysis Risk treatment Risk treatment
monitoring and
evaluation
Positive
Negative
Figure 2. Adherence to the risk management process
Source: created by the authors based on research data

ACCESS Journal:
Access to Science, Business, Innovation in Digital Economy
ISSN 2683-1007 (Online)
2025, 6(3), 546-566, https://doi.org/10.46656/access.2025.6.3(5)
https://journal.access-bg.org/
555
The study started with finding out whether the companies have risk management units, and the status of
those units, where they exist, in terms of being a fully independent unit or a sub-unit of a bigger unit. The
above indicates that 50 percent of the ten companies sampled have people performing the risk management
function, while 40 percent have people combining that function with other functions. Only 10 percent have
no staff designated to handle risk management functions.
In terms of how strictly the surveyed companies adhere to standard risk management practices in
managing their risks, it was revealed that 80 percent of the companies surveyed generally identify their loss
exposures; 60 percent conduct one form of risk assessment and analysis or the other; 80 percent engage in
risk treatment; and 70 percent monitor and evaluate their risk treatment. Conversely, 10 percent of the
companies do not identify their loss exposures; 30 percent do not carry out risk assessment and analysis; 20
percent do not engage in risk treatment; and 30 percent do not monitor and evaluate their risk management
activities.
Figure 3. Possession of risk management aids
Source: created by the authors based on research data
40
25
35
0
5
10
15
20
25
30
35
40
45
Risk retention
Non-insurance risk transfer
Insurance
Figure 4. Use of Risk retention, non-insurance transfer, and Insurance options
Source: created by the authors based on research data

ACCESS Journal:
Access to Science, Business, Innovation in Digital Economy
ISSN 2683-1007 (Online)
2025, 6(3), 546-566, https://doi.org/10.46656/access.2025.6.3(5)
https://journal.access-bg.org/
556
The aggregate response on whether or not the surveyed companies have vital risk management aids such
as Risk management policy, Risk appetite statement and exposure limits, Risk registers, Risk reports,
Internal risk audit reports and action plans, Risk management committee, Risk specialists, IT systems for
collecting, analysing and reporting risk information, and Activities to influence attitudes, perceptions and
behaviours towards risks positively, 60 percent assented to having such aids while 40 percent do not.
On the risk management options usually adopted, 40 percent of the surveyed companies retain their risks;
25 percent transfer their risks to non-insurers, while 35 percent transfer their risks to insurance companies.
27,5
40
32,5
0
5
10
15
20
25
30
35
40
45
Loss prevention
Loss reduction
Risk avoidance
Figure 5. Risk management approach used by the companies
Source: created by the authors based on research data
The companies were found to adopt various combinations of the risk management approaches of Loss
prevention, Loss reduction and Risk avoidance. However, while they gave 27,5 percent of their attention to
loss prevention, they gave 40 percent of their efforts to loss reduction and 32,5 percent to risk avoidance.
They all make use of the three approaches but give different levels of preference to each depending on the
need of the time.
Objective no. 2
Figure 6. Risk management practices and loss prevention
Source: created by the authors based on research data

ACCESS Journal:
Access to Science, Business, Innovation in Digital Economy
ISSN 2683-1007 (Online)
2025, 6(3), 546-566, https://doi.org/10.46656/access.2025.6.3(5)
https://journal.access-bg.org/
557
The second objective of the study was to examine how the risk management practices adopted by selected
organisations enhanced the management of their loss exposures and consequently, their overall performance.
The areas covered include loss prevention and reduction, as well as enhanced performance arising from
sound risk management practice.
The study evaluated the extent to which the risk management practices of surveyed companies enhanced
the prevention of losses in the areas of assets, operations, human resources, and finance. The aggregate
response from the ten companies studied claims that their risk management practices enhanced their capacity
to reduce their asset losses by 60 percent, and losses emanating from organisational operations, human, and
financial resources by 50 percent, respectively.
Figure 7. Effect of risk management practice on loss reduction
Source: created by the authors based on research data
How the risk management practice of the selected companies assisted in loss reduction to enhance their
overall performance was evaluated. Data obtained showed that their risk management practices encourage
holistic treatment of risks by 80 percent. It also enhanced the capacity of the selected companies to prepare in
advance for potential losses in the most economical way by 60 percent.
Figure 8. Risk management practices and overall performance
Source: created by the authors based on research data

ACCESS Journal:
Access to Science, Business, Innovation in Digital Economy
ISSN 2683-1007 (Online)
2025, 6(3), 546-566, https://doi.org/10.46656/access.2025.6.3(5)
https://journal.access-bg.org/
558
Again, following from the immediate advantage above, it reduced the anxiety for those companies for
unexpected and costly losses by 70 percent. It also enhanced more effective resource allocation by 50
percent.
Finally, their risk management practices reduce their losses by 90 percent by providing a summary of
threats that aid management decision-making. The risk management practices adopted by the selected
companies enhanced their overall performance in the various areas. Responses obtained indicate that it
enhanced their effectiveness and efficiency in service delivery by 90 percent; increased their profitability by
70 percent; increased their customer satisfaction and retention by 80 percent; encouraged their growth and
long-term survival by 40 percent; and enhanced their company's competitive advantage by 70 percent.
Objective no. 3
The third objective of the study sought to identify the significant challenges facing the risk management
practices of the selected transport companies in managing their risks. The findings on this objective are
discussed below.
Figure 9. Challenges facing the selected companies in their risk management practice
Source: created by the authors based on research data
On the challenges facing the selected companies in managing their risks, 70 percent of their challenges
were attributed to the general ignorance of the importance of planned risk management practice. Again,
inadequate support by the executive and management cadre of the companies to invest in formal risk
management practices scored 40 percent as a challenging factor. Poor funding of risk management activities
scored 50 percent as a limiting factor in their risk management efforts. Finally, the paucity of deliberate
formulation and implementation of risk management policies constitutes 30 percent of their limiting factors
in their risk management efforts.
Data analysis
The data was analysed using simple percentages.
Test of Hypotheses

ACCESS Journal:
Access to Science, Business, Innovation in Digital Economy
ISSN 2683-1007 (Online)
2025, 6(3), 546-566, https://doi.org/10.46656/access.2025.6.3(5)
https://journal.access-bg.org/
559
The hypotheses for the study were tested using the One-Sample Test on the t and p values. Where the p
value is less than 0.05, the null hypothesis is rejected, but where it is greater than 0.05, the null hypothesis is
accepted.
Table 1. Result of the test of hypotheses using the t-test
Source: Authors' Computation
Table 1 demonstrates hypothesis testing (Student's t-test) - these are the results of a one-sample t-Test,
which compares the sample mean with a given test value. In this case: Test Value = 3 - the hypothetical
value with which the mean in each category is compared. The table contains statistical indicators for various
variables (designated, for example, RA/SD, RA/P, etc.). For each variable (RA/SD, RR/CR, RT/SS, etc.), the
mean value is statistically significantly different from 3 (almost all p < 0.05). For example, for RA/SD
t=30.946, p=0.000, the average difference is 1.857 - this means that the average value in the sample is
approximately 1.857 higher than 3, which is very significant. For some variables (e.g. RA/SS, p=0.067) the
difference does not reach statistical significance (p>0.05).
In the context of the study, this means that the hypothesis that the average values for various risk
management aspects are 3 is rejected for most indicators, since the actual average values differ significantly
from 3. This confirms that risk management practices in companies differ from some baseline (3, possibly
neutral or average on the scale). The significant influence of the selected strategies and practices (e.g.
avoidance, retention, risk transfer) on various aspects of the companies' work is confirmed.
Risk management has a positive effect on service quality, profitability, customer retention and
competitive advantage (p<0.05); The effect on growth and long-term survival is not statistically confirmed
One-Sample Test
30.946
34
.000
1.85714
1.7352
1.9791
3.221
34
.003
.85714
.3163
1.3980
4.917
34
.000
1.14286
.6705
1.6152
1.892
34
.067
.57143
-.0424
1.1853
6.842
34
.000
.88571
.6226
1.1488
9.083
34
.000
1.22857
.9537
1.5035
9.255
34
.000
1.22857
.9588
1.4984
2.736
34
.010
.77143
.1985
1.3443
5.966
34
.000
1.02857
.6782
1.3789
7.072
34
.000
1.11429
.7941
1.4345
2.965
34
.005
.74286
.2337
1.2520
2.758
34
.009
.82857
.2181
1.4390
RA / SD
RA / P
RA / CR
RA / SS
RR / SD
RR / P
RR / CR
RR / SS
RT / SD
RT / P
RT / CR
RT / SS
t
df
Sig. (2-tailed)
Mean
Difference
Lower
Upper
95% Confidence
Interval of the
Difference
Test Value = 3
ACCESS Journal:
Access to Science, Business, Innovation in Digital Economy
ISSN 2683-1007 (Online)
2025, 6(3), 546-566, https://doi.org/10.46656/access.2025.6.3(5)
https://journal.access-bg.org/
560
(p>0.05). The statistical analysis supports the conclusions about the benefits of risk management, but notes
that the effect on the growth and survival of companies is less obvious.
Risk management practices adopted by the surveyed companies have a significant positive effect on the
service delivery of transport companies in Enugu state. The findings of the study indicate that the effect of
risk avoidance, risk retention and risk transfer on service delivery is all significant at .000. Therefore, the
hypothesis is accepted. Thus, the decision is that the above risk management strategies of selected
organisations have a significant effect on their service delivery.
Risk management practices adopted by the surveyed companies have a significant positive effect on the
profitability of transport companies in Enugu state. The findings of the study indicate that risk avoidance,
risk retention, and risk transfer are significant for the profitability of selected companies at 0.003, 0.000, and
0.000, respectively. Therefore, the hypothesis is accepted. Thus, the decision is that the above risk
management strategies of selected organisations have a significant effect on their profitability.
Risk management practices adopted by the selected companies have a significant positive effect on
customer retention of transport companies in Enugu state. The findings of the study indicate that risk
avoidance, risk retention and risk transfer are significant at 0.000, 0.000, and 0.005 for customer retention in
the surveyed companies. Therefore, the null hypothesis is rejected and the alternative hypothesis accepted.
Thus, the decision is that the risk management strategies of selected companies have a significant effect on
their customer retention.
Risk management practices adopted by the selected companies have a significant positive effect on the
growth and long-term survival of transport companies in Enugu state. The findings of the study indicate that
the impact of risk avoidance, risk retention, and risk transfer is not significant, 0.067, 0.010, and 0.009,
respectively, for growth and long-term survival. Therefore, the null hypothesis was not rejected. Thus, the
decision is that the risk management strategies of selected organisations have no significant effect on the
growth and long-term survival of the companies.
Risk management practices adopted by the selected companies have a significant positive effect on the
competitive advantage of transport companies in Enugu state. The findings of the study indicate that risk
avoidance, risk retention and risk transfer are significant at 0.000, 0.000, and 0.003 for customer retention in
the surveyed companies. Therefore, the null hypothesis is rejected and the alternative hypothesis accepted.
Thus, the decision is that the risk management strategies of selected companies have a significant effect on
their customer retention.
Discussion of findings
The first objective of the study focused on examining the risk management practices adopted by the
selected organisations. It was found out that the companies use a combination of risk retention, risk transfer
to non-insurance organisations, and risk transfer to insurance companies. The use of non-insurance transfer
by the companies is essentially when they operate on some Hired Vehicles (HV) contracting, where the
liabilities on those vehicles do not rest on the transport companies but on those who partner with the
ACCESS Journal:
Access to Science, Business, Innovation in Digital Economy
ISSN 2683-1007 (Online)
2025, 6(3), 546-566, https://doi.org/10.46656/access.2025.6.3(5)
https://journal.access-bg.org/
561
companies by providing and running their vehicles in the company's fleet. The second objective of the study
centred on examining how the risk management practices adopted by the selected companies enhanced the
management of their loss exposures and overall performance. It was gathered from the study that these risk
management practices significantly enhanced the proficiency of the selected companies in managing their
loss exposure and risks, leading to loss reduction and profitability of their businesses, ultimately resulting in
higher performance. Finally, the third objective of the study examined the possible challenges faced by the
companies in their risk management efforts. It was found out that general ignorance of the importance of
planned risk management practice, inadequate support by the executive and management cadre of the
companies to invest in formal risk management practices, poor funding of risk management activities, and
paucity of deliberate formulation and implementation of risk management policies constituted significant
challenges in their risk management efforts.
CONCLUSIONS
Studied companies have personnel performing risk management at different levels and extents and used a
combination of risk management practices that included risk retention, risk transfer to non-insurance
organisations, and insurance.
The combination of the risk management practices deployed by the companies resulted in a significant
reduction in losses and enhanced their profitability and overall performance.
The challenges facing the companies in their risk management efforts include a lack of understanding of
the importance of the risk management function, inadequate support by top management for the risk
management function, and poor funding of the risk management function.
The study determined that the examined organisations made adequate steps to implement standard risk
management strategies to mitigate their loss exposures. Nevertheless, the risk management function has not
yet received adequate recognition and priority within the framework of managing those organisations. It can
be concluded that greatly enhancing the current risk management efforts of these organisations will likely
raise their capacity to minimise losses, hence improving their profitability and overall performance.
Author Contributions:
All authors have contributed to the paper equally.
All authors have read and agreed to the published version of the manuscript.
Acknowledgement
not applicable
Informed Consent Statement: not applicable
Data Availability Statement:
The data presented in this study are available on request from the corresponding author.
Institutional Review Board Statement: not applicable

ACCESS Journal:
Access to Science, Business, Innovation in Digital Economy
ISSN 2683-1007 (Online)
2025, 6(3), 546-566, https://doi.org/10.46656/access.2025.6.3(5)
https://journal.access-bg.org/
562
Conflict of interests
The authors declare no conflict of interest.
References
Abdulrashid, I., Chiang, W.-C., Sheu, J.-B., Mammadov, S. (2025). An interpretable machine learning framework for
enhancing road transportation safety. Transportation Research Part E: Logistics and Transportation Review, 195,
art. no. 103969, DOI: 10.1016/j.tre.2025.103969
Abuseridze, G. (2021). International Trade in the Context of the COVID-19 Pandemic. In Impact of Infodemic on
Organizational Performance, pp. 217-230. IGI Global Scientific Publishing. https://doi.org/10.4018/978-1-6684-
7460-0.ch071
Abuseridze, G., Petrova, M., Zahars, V., & Tumalavičius, V. (2022b). Transformation of Georgia’s trade policy
strategy: from frailty to sustainability. Access to science, business, innovation in digital economy, 43-52.
https://doi.org/10.46656/access.2022.3.1(4)
Abuseridze, G. & Kikilashvili, G. (2025). The Role of the Judiciary in the Modern Legal State and Its Interaction with
Domestic and International Law. In E. Alaverdov & G. Abuseridze (Eds.), Globalization, Global Security, and
New International Realities for Modern Democracies, pp. 21-40. IGI Global Scientific Publishing.
https://doi.org/10.4018/979-8-3373-1355-9.ch002
Australian Government, Department of Finance (2016). An Overview of the Risk Management Process Retrieved on
https://www.finance.gov.au/sites/default/files/2019-11/Risk-Management-Process.pdf (accessed on April 14,
2025)
Beloev, I., & Grozev, D. (2025). Approach to optimising and managing warehouse stocks in a car service. Baltic
Journal of Economic Studies, 11(2), 158-165. https://doi.org/10.30525/2256-0742/2025-11-2-158-165
Bi, W., Hackl, J., MacAskill, K. (2025). Enhancing flood resilience of urban rail transit systems through recovery
resource scheduling optimisation: A case study of London. Sustainable Cities and Society, 128, art. no. 106437,
DOI: 10.1016/j.scs.2025.106437
Björklund, M., Gillström, H., Stahre, F. (2025). Resilient electrified freight transport: Disruptions and mitigation
strategies. Cleaner Logistics and Supply Chain, 14, art. no. 100211, DOI: 10.1016/j.clscn.2025.100211
Bulgakov V., Ivanovs S., Beloev I., Trokhaniak O., Aboltins A., Tkachenko M., Rucins A., Ihnatiev Y. (2023).
Experimental research on performance of flexible screw conveyor when transporting agricultural materials.
Engineering for Rural Development, 22, pp. 571 - 575. DOI: 10.22616/ERDev.2023.22.TF118
Cao, Y., Xin, X., Jarumaneeroj, P., Li, H., Feng, Y., Wang, J., Wang, X., Pyne, R., Yang, Z. (2025). Data-driven
resilience analysis of the global container shipping network against two cascading failures. Transportation
Research Part E: Logistics and Transportation Review, 193, art. no. 103857, DOI: 10.1016/j.tre.2024.103857
Chen, J., Kedron, P., Nelson, T., Willett, D., Cohen, A., Ferster, C. (2025). Quantify relationships between bike network
connectivity and bike safety: A comparative analysis of connectivity metrics conducted in two California cities.
Computers, Environment and Urban Systems, 119, art. no. 102271, DOI: 10.1016/j.compenvurbsys.2025.102271
Dong, C., Chang, N., Lu, Y., Ma, S., Wan, Y., Ma, J. (2025). Modeling and Conflict Prediction of E-Bike Violations at
Signalized Intersections. Journal of Transportation Engineering Part A: Systems, 151 (7), art. no. 04025043, DOI:
10.1061/JTEPBS.TEENG-8382
Durguti, E., Alidemaj, A. , Krivins, A. (2024). Good Governance and Rule of Law effect on GDP growth: lessons for
emerging economies. Journal of Liberty and International Affairs, 10 (1), 37-60,
https://doi.org/10.47305/JLIA24101041d
Hristov, G; Beloev, I and Zahariev, P. (2023). Challenges, requirements, opportunities and solutions for the digital
transformation of the transport education. Strategies for policy in science and education-strategii na
obrazovatelnata i nauchnata politika. Vol. 31 (4s), pp.155-167. https://doi.org/10.53656/str2023-4s-13-cha
Iyieke, V., Jadidbonab, H., Rakib, A., Bryans, J., Dhaliwal, D., Kosmas, O. (2025). An Adaptable Security-by-design
approach for ensuring a secure Over the Air (OTA) update in modern vehicles. Computers and Security, 150, art.
no. 104268, DOI: 10.1016/j.cose.2024.104268
Jankensgård, H. (2019). A theory of enterprise risk management. Corporate Governance International Journal of
Business in Society. 19 (3): 565–579, DOI: 10.1108/CG-02-2018-0092
ACCESS Journal:
Access to Science, Business, Innovation in Digital Economy
ISSN 2683-1007 (Online)
2025, 6(3), 546-566, https://doi.org/10.46656/access.2025.6.3(5)
https://journal.access-bg.org/
563
Jurgelane-Kaldava, I., Batenko, A., Krivins, A., Durguti, E., & Garškaitė-Milvydienė, K. (2024). Data security risks and
their prevention: Latvian enterprises in the context of selected countries. Entrepreneurship and Sustainability
Issues, 11(4), 78-90. http://doi.org/10.9770/jesi.2024.11.4(5)
Kastratović, R., Krivins, A., & Veikša, I. (2024). Economic and legal aspects of foreign direct investment patterns in
Serbia and Latvia. Access to science, business, innovation in the digital economy, ACCESS Press, 5(3), 440-458,
https://doi.org/10.46656/access.2024.5.3(4)
Kaze, V., & Bolinskis, G. (2011). Consumer Values Behind the Grey Economy. New Socio-Economic Challenges of
Development in Europe 2010, 70–79
Kaze, V., Bolinskis, G., & Kurovs, J. (2022). An Image-Based Approach to Measuring Human Values. Societies, 12(6),
191. https://doi.org/10.3390/soc12060191
Kaze, V., Skapars, R., & Sceulovs, D. (2011). Development of Rural Tourism in Latvia Capitalising on Regionally
Relevant Human Values. Management Theory and Studies for Rural Business and Infrastructure Development, 26,
97–104
Ke, J.-Y., Cho, W., Su, H. (2025). Flying through uncertainty: Air transportation's impact on supply chain resilience
and inventory efficiency. Transportation Research Part E: Logistics and Transportation Review, 197, art. no.
104042, DOI: 10.1016/j.tre.2025.104042
Krivins A., Vilks A., & Kipane A. (2023). Corruption perception trends: European Union countries. Access to Science,
Business, Innovation in the Digital Economy, 5(1), 58-67. http://doi.org/10.46656/access.2024.5.1(4)
Krivins, A., Teivans-Treinovskis, J., Tumalavicius, V. (2021). Issues of state and national security: Religiously inspired
terrorism in the Baltic States: internal and external factors. Insights into Regional Development, 3(1), 65-
79. http://doi.org/10.9770/IRD.2021.3.1(4)
Liang, W. (2025). Risk Management Frameworks for Corporate Boards: Mitigating Legal and Financial Risks.
Kingston College https://www.researchgate.net/publication/388928353 (accessed on April 14, 2025)
Ma, F., Lee, J.Y. Analyzing wildfire evacuation dynamics with agent-based modeling in damaged road networks (2025)
Safety Science, 187, art. no. 106835, DOI: 10.1016/j.ssci.2025.106835
Michael White Group (2020). Risk Management – Identifying your Loss Exposure, Retrieved on
https://michaelwhitegroup.com/risk-management-identifying-your-loss-exposure/ (accessed on February 15, 2025)
Miszczak, K., Kriviņš, A., & Kaze, V. (2024). Challenges and drivers of green and sustainable spatial development: a
case study of Lower Silesia and Latvia. Entrepreneurship and Sustainability Issues, 12(2), 85-98.
https://doi.org/10.9770/b7283449476
Muhamud, A., Etalong, Th. A., Krivins, A., Kaze, V. (2024). Point of sale and cashless policy in selected market.
Entrepreneurship and Sustainability Issues, 12(1), 169-178. http://doi.org/10.9770/jesi.2024.12.1(12)
Paul, A.B., Gore, N., Arkatkar, S., Joshi, G., Easa, S. (2025). Traffic Conflict-Based Safety Assessment Framework for
Evaluating Treatment Effects at Urban Unsignalized Intersections: A Case Study from Surat, India. Journal of
Transportation Engineering Part A: Systems, 151 (8), art. no. 05025004, DOI: 10.1061/JTEPBS.TEENG-8511
Pencheva, P., Asenov, A., Beloev, I., Georgiev, V. (2019). Study Of The Use Of Alternative Energy Sources In Inland
Waterway Transport. Transport Problems, Silesian University of Technology, vol. 14(3), pp. 109-120
Pilipović, D.T., Bečelić-Tomin, M., Krčmar, D., Tenodi, S., Kerkez, D., Slijepčević, N., Šešlija, M. (2025).
Methodological Framework for Sediment Management in Developing Countries: Shifting the Paradigm from
Waste to Resource. Water (Switzerland), 17 (5), art. no. 618, DOI: 10.3390/w17050618
Obeid, R. (2024). Factors affecting net interest margin in the banking sector: Evidence from the Arab region. Journal of
Governance & Regulation, 13(1), 214–222. https://doi.org/10.22495/jgrv13i1art19
Quan, C., Wang, D., Li, X., Yao, Z., Guo, P., Jiang, C., Xing, H., Ren, J., Tong, F., Wang, Y. (2025). Waterway
Regulation Effects on River Hydrodynamics and Hydrological Regimes: A Numerical Investigation. Water
(Switzerland), 17 (9), art. no. 1261, DOI: 10.3390/w17091261
Rejda, G. (2011) Principles of risk management and insurance (Eleventh edition) Harlow, Pearson Educational
Limited. ISBN 978-0136117025, 730 pages
Rejda, G.E. and McNamara, M.J. (2014). Principles of risk management and insurance (Twelfth edition). Harlow,
Pearson Educational Limited. ISBN 978-0-13-299291-6 (casebound)
Sceulovs, D., Gaile-Sarkane, E., & Kaze, V. (2011). E-Environment Benefits for Latvian Sustainable Business
Development. Management Theory and Studies for Rural Business and Infrastructure Development, 26, 234–240

ACCESS Journal:
Access to Science, Business, Innovation in Digital Economy
ISSN 2683-1007 (Online)
2025, 6(3), 546-566, https://doi.org/10.46656/access.2025.6.3(5)
https://journal.access-bg.org/
564
Sadeghi, M., Aghabayk, K., Seyfi, M., Shiwakoti, N. (2025). Drivers' trip purpose and pre-crash maneuvers as
determinants of pedestrian injury severity: Insights and policy recommendations. Transport Policy, 170, pp. 58-74.
DOI: 10.1016/j.tranpol.2025.05.014
Tang, Q., Qu, Y., Yin, H., Zhang, W., Wu, J. (2025). Joint optimization for crowd evacuation and vehicle scheduling at
multimodal transportation hubs. Transportation Research Part C: Emerging Technologies, 174, art. no. 105117,
DOI: 10.1016/j.trc.2025.105117
University of Adelaide (n.d.). Risk Management Process. Retrieved on
https://www.adelaide.edu.au/legalandrisk/system/files/media/documents/2019-01/Risk_Management_Process.pdf
(accessed on April 14, 2025)
Vilks, A., Kipane, A., & Krivins, A. (2024). Preventing international threats in the context of improving the legal
framework for national and regional security. Social & Legal Studios, 7(1), 97-105.
https://doi.org/10.32518/sals1.2024.97.
Wei, L (2025), Optimizing Cash Flow Management for Ship Financing Leasing: Risk Identification, Risk Assessment,
and Management Strategies. Cogent Business & Management 12(1)
https://doi.org/10.1080/23311975.2025.2464941
Wei, S., Yang, H., Bai, Y., Wang, Y. Road safety assessment of small management units considering smart roadway
retrofitting (2025) Transport Policy, 167, pp. 28-41. DOI: 10.1016/j.tranpol.2025.03.019
Xu, S., Shan, M., Zhai, Z. Ontology-Based Retrieval System for Emergency Preparedness Documents in Urban Rail
Transit Construction Projects (2025) Sustainability (Switzerland), 17 (7), art. no. 2914, DOI: 10.3390/su17072914
Yahaya, A. (2024). The impact of risk management committee on firm risk, with risk management practices as a
mediator. Journal of Corporate Finance Education, 11(13), 121-172. DOI:
https://dx.doi.org/10.09291/jcfe.v11.i13.2024.121-172
Yu, H., Yeo, H. (2025). Traffic control policies for minimizing the negative effect of Adaptive Cruise Control on
highway. Transportation Research Part C: Emerging Technologies, 173, art. no. 105063, DOI:
10.1016/j.trc.2025.105063
Yuan, Y., Yang, X., Song, D., Yue, X., Cui, P. (2025). Bivariate joint analysis of intercity travelers' adaptive behaviors
during adverse weather events. Transportation Research Part A: Policy and Practice, 195, art. no. 104462, DOI:
10.1016/j.tra.2025.104462
Zha, W., Li, J. (2025). Understanding commuters' perceived accessibility and travel intentions under rainstorm
warnings in Shanghai, China. Transport Policy, 167, pp. 276-294. DOI: 10.1016/j.tranpol.2025.03.011
Zhu, Y., Tian, W., Jia, X., Liu, Q. (2025). Optimizing firefighting resilience in airports through genetic algorithms and
decision-making frameworks. Journal of Safety Science and Resilience, 6 (2), pp. 212-225. DOI:
10.1016/j.jnlssr.2024.12.002
About the authors
Francis Okechukwu CHIKELEZE
Professor, Department of Public Administration, Faculty of Management Sciences, Enugu
State University of Science and Technology, Enugu, Nigeria
Research interests: Public Administration, Human Resource Management
ORCID ID: 0009-0004-6812-3944

ACCESS Journal:
Access to Science, Business, Innovation in Digital Economy
ISSN 2683-1007 (Online)
2025, 6(3), 546-566, https://doi.org/10.46656/access.2025.6.3(5)
https://journal.access-bg.org/
565
Anatolijs KRIVINS
Associate Professor, Dr.iur., Faculty of Humanities and Social Science, Daugavpils
University, Daugavpils, Latvia.
Research interests: business law, corruption, criminology, criminal law, public service,
municipalities.
ORCID ID: 0000-0003-1764-4091
Valters KAZE
Associate Professor, Dr.oec., RISEBA University of Applied Sciences, Riga, Latvia.
Research interests: digital transformation, artificial intelligence, consumer behaviour
and motivation.
ORCID ID: 0000-0003-1502-6994
Thomas ETALONG
PhD, Directorate of Research and Development, ACE Intercontinental Research Institute,
Enugu, Nigeria.
Research interests: Workforce diversity, Human Resource Management, Public Policy,
Security Studies, Change Management, Community Development, Sustainable
Development, Project Management, and Gender Studies
ORCID ID: 0000-0003-2472-4364
This work is licensed under the Creative Commons Attribution International License (CC BY)

ACCESS Journal:
Access to Science, Business, Innovation in Digital Economy
ISSN 2683-1007 (Online)
2025, 6(3), 567-582, https://doi.org/10.46656/access.2025.6.3(6)
https://journal.access-bg.org/
567
EXPLORING THE RELATIONSHIP BETWEEN SHARE PRICES,
EARNINGS, AND DIVIDENDS IN HIGH-DIVIDEND MINING FIRMS
LISTED ON THE JOHANNESBURG STOCK EXCHANGE
Ifeanyi Mbukanma
1
, Sunday Olabisi Adewara
2
1, 2 Walter Sisulu University, Mthatha, South Africa
e-mails: 1imbukanma@wsu.ac.za, 2 sadewara@wsu.ac.za
Received: 18 May 2025 Accepted: 20 August 2025 Online Published:21 August 2025
ABSTRACT
Background: The relationship between share prices, earnings, and dividends is critically important in financial research,
especially in volatile mining sectors. In South Africa, mining plays a crucial role in the economy, making understanding
these relationships on the Johannesburg Stock Exchange vital for investors and policymakers. Objectives: This study
investigates the correlation between the share prices of Anglo-American Platinum, Exxaro Resources, Kumba Resources
Ltd., and Impala Platinum Holdings and their earnings and dividends. With investors' growing interest in seeking stable
returns amidst market volatility, this research provides empirical evidence on how earnings and dividends affect share
prices in high-dividend-paying companies, a key economic sector in South Africa. Methods/Approach: The study uses a
quantitative, non-experimental correlational research design, analysing historical data from selected mining companies
listed on the JSE. Statistical techniques, including Pearson correlation analysis and log transformation to manage
outliers, were employed to explore the relationships between dependent and independent variables. Results: The analysis
shows significant positive correlations, evidenced by a correlation coefficient of 0.96 between earnings per share (EPS)
and dividends per share (DPS), 0.75 between price per share (PPS) and DPS, and 0.82 between EPS and PPS. The results
underscore the importance of profit and dividend stability as indicators of financial health for mining investors and
management. Conclusions: This study supports the Dividend Signalling Theory and Residual Theory of Dividends,
contributing to the financial theory literature in the context of high-dividend-paying mining companies. It was also
recommended that investors should pay attention to shares with increasing earnings, which, in turn, increase dividends
and expansion opportunities, justifying a greater stock value.
Keywords: share prices, earnings, dividends, mining firms, Johannesburg stock exchange
JEL classification: G12, G35, L72, G15
Paper type: Research article
Citation: Mbukanma, I; Adewara, S.O. (2025). Exploring the Relationship Between Share Prices, Earnings, and Dividends in
High-Dividend Mining Firms Listed on the Johannesburg Stock Exchange. Access to science, business, innovation in digital
economy, ACCESS Press, 6(3), 567-582, https://doi.org/10.46656/access.2025.6.3(6)
INTRODUCTION
Investigating the relationship among share prices, earnings, and dividends is crucial in finance, especially in
sectors characterised by significant volatility, such as mining. Juwawo (2022) and Kildaire (2020) indicate that
the relationship among share prices, earnings, and dividends has garnered attention from researchers, investors,
and financial professionals. Considering the unique characteristics and inherent volatility of the mining sector,
a crucial element of the South African economy, it is essential to comprehend this relationship within the
1
Corresponding author, Ifeanyi Mbukanma – imbukanma@wsu.ac.za
ACCESS Journal:
Access to Science, Business, Innovation in Digital Economy
ISSN 2683-1007 (Online)
2025, 6(3), 567-582, https://doi.org/10.46656/access.2025.6.3(6)
https://journal.access-bg.org/
568
framework of the Johannesburg Stock Exchange (JSE). According to Arsal (2021) and Nharo (2021), the
mining industry significantly contributes to the nation's gross domestic product (GDP). It is also distinguished
by enterprises that often undertake substantial capital expenditures, exhibit fluctuating share prices, and
maintain diverse dividend policies within the sector. Consequently, investigating the correlation among share
prices, profitability, and dividends is crucial for acquiring key insights into the operational efficiency and
financial sustainability of mining enterprises that distribute substantial dividends.
Earnings are a crucial determinant of share prices, since they often serve as an indicator of a company's
profitability. Gharaibeh, Saleh, Jawabreh, and Ali (2022), with Arsal (2021), indicate the company's capacity
to generate revenue and influence the perceptions and behaviours of investors and market players. The
anticipated correlation is based on the premise that increased earnings often lead to elevated share prices.
Higher share prices are driven by the anticipation of sustained profitability and expansion within the
organisation.
In the mining sector, where operational outcomes can be significantly influenced by external factors like
regulatory changes, commodity price fluctuations, and environmental issues, stakeholders must proceed with
caution and possess a comprehensive understanding of this relationship to recognise potential risks.
Dividends provide a concrete return on investment for shareholders and often reflect a company's financial
stability, as observed by Gormsen and Koijen (2020). Sundoro, Anggraini, and Pradiptya (2023) assert that
investors seeking steady earnings amid market fluctuations are often drawn to mining enterprises, particularly
those with a track record of substantial dividend payouts. The anticipation of sustained or augmented dividends
amidst increasing earnings often has a favourable influence on share prices. An investigation of the correlation
between dividend earnings and share prices uncovers essential elements that may guide investment strategies
and financial decision-making. This research examines the correlations among share prices, earnings, and
dividends of a group of high-dividend-paying mining companies listed on the Johannesburg Stock Exchange
(JSE).
The companies include Anglo American Platinum, Exxaro Resources, Kumba Resources Ltd., and Impala
Platinum Holdings Limited. This study seeks to identify patterns and provide empirical evidence on the
interactions of numerous financial metrics via the analysis of historical data and the use of rigorous statistical
methods. This study will enhance the current research on dividend policy and its effects on stock price
valuation in the mining sector. It would also provide investors and policymakers with actionable knowledge.
Therefore, examining these financial connections within the mining sector provides insights about the
operational efficacy of the involved companies. This result enhances the understanding of market behaviours
influenced by earnings and dividend strategies. This introductory discussion establishes the foundation for a
comprehensive analysis of the correlation between share prices, earnings, and dividends in mining companies
that provide substantial dividends and are listed on the Johannesburg Stock Exchange (JSE).
ACCESS Journal:
Access to Science, Business, Innovation in Digital Economy
ISSN 2683-1007 (Online)
2025, 6(3), 567-582, https://doi.org/10.46656/access.2025.6.3(6)
https://journal.access-bg.org/
569
RESEARCH RATIONALE AND PROBLEM STATEMENT
The relationship between share prices, earnings, and dividends is a critical area of study in finance, particularly
in industries characterised by high volatility, such as mining. This sector is vital to the South African economy,
with mining companies contributing significantly to the country’s gross domestic product (GDP) (Arsal, 2021;
Nharo, 2021). Considerable capital expenditure, volatile share prices, and diverse dividend policies often mark
such firms. Understanding the dynamics linking earnings, dividends, and share prices is essential for assessing
these high-dividend-paying mining entities' operational efficiency and financial sustainability.
Despite the acknowledged importance of these financial variables, existing research lacks clarity regarding
their interplay, particularly in the context of the Johannesburg Stock Exchange (JSE). The expectation that
rising earnings will lead to increased share prices is widely accepted; however, in the mining sector, external
influences such as regulatory changes, fluctuating commodity prices, and environmental concerns complicate
this relationship (Gharaibeh et al., 2022; Gormsen & Koijen, 2020; Mbukanma, Ani & Rena, 2019). Moreover,
dividends serve as a tangible return on investment, often influencing investor perceptions of a company’s
financial health and stability. Investors prioritise firms with a consistent dividend history, especially amid
market volatility; however, the extent to which dividends correlate with share prices and earnings in mining
companies remains underexplored.
This study investigates the interactions between share prices, earnings, and dividends among notable high-
dividend-paying mining firms, including Anglo American Platinum, Exxaro Resources, Kumba Resources
Ltd., and Impala Platinum Holdings Limited. This research will identify trends and provide empirical insights
into these financial linkages through comprehensive data analysis and rigorous statistical techniques.
Enhancing the understanding of how earnings and dividend strategies impact share prices in the mining sector
will equip investors and policymakers with valuable knowledge for strategic decision-making, ultimately
contributing to the existing body of research on dividend policy and its effects on stock valuation in this critical
industry.
RESEARCH QUESTION
Is there a positive, negative, or no correlation between the share price, earnings and dividends of selected high
dividend-paying mining companies and their earnings and dividends?
HYPOTHESES
The hypotheses of this study are the following:
H0: There is no correlation between the share price of selected high dividend-paying mining companies and
their earnings and dividends (at a significance level of 5%).
H1: There is a positive correlation between the share price of selected high dividend-paying mining companies
and their earnings and dividends (at a significance level of 5%).
H2: There is a negative correlation between the share price of selected high dividend-paying mining companies
and their earnings and dividends (at a significance level of 5%).
ACCESS Journal:
Access to Science, Business, Innovation in Digital Economy
ISSN 2683-1007 (Online)
2025, 6(3), 567-582, https://doi.org/10.46656/access.2025.6.3(6)
https://journal.access-bg.org/
570
LITERATURE REVIEW
Scholars have shown a growing interest in the correlation between share prices, earnings, and dividends of
high-dividend-paying mining companies listed on the Johannesburg Stock Exchange (JSE). Considering the
emerging nature and significance of ascertaining the correlation between share prices, earnings, and dividends
to the growth of listed institutions and, most significantly, mining companies, stakeholders, and shareholders
within the economic, financial, and corporate governance institutions have consistently emphasised the need
to have a scientific finding that could support investors and institutional decision-making (Mithila &
Kengatharan, 2025; Arsal, 2021). This literature review is conducted to reveal previous scholars' conceptual
understanding and contributions. It will also assist in identifying empirical findings and frameworks that could
provide a pathway to ascertain the correlation between share prices, earnings, and dividends of selected high-
dividend-paying mining companies listed on the JSE, as supported by Gharaibeh, Saleh, Jawabreh and Ali
(2022). Some of the considerable mining companies within this investigating category include Anglo
American Platinum, Exxaro Resources, Kumba Resources Ltd, and Impala Platinum Holdings Limited.
Theoretical Background to the Study
The theory is a detailed logical framework for explaining specific occurrences, which involves predictions
about how things interact (Oberauer & Lewandowsky, 2019). A theoretical framework is a foundational review
of current theories that guide the construction of the arguments in the researcher’s work (George, 2023).
Researchers use theories to explain facts, establish links, and make predictions. This study employed the
Dividend Signalling Theory and the Residual Theory of Dividends.
The Dividend Signalling Theory was proposed by Michael Spence in 1973. The theory suggested that once
a company announces a higher dividend than market expectations, investors would see this as an indication
that the company's future financial performance is more promising than anticipated. Given such a positive
indication, investors will increase the purchase of the company's stock, thereby raising the stock price. In
contrast, a lower-than-expected dividend announcement from a company would be seen as a warning indicator.
As such, a decline in dividends may indicate dismal results for the business, indicating that the firm's stock
price will drop (Gitman & Zutter, 2014).
On the other hand, the Residual Theory of Dividends, as proposed by Myron J Gordon and John Lintner in
1950, suggested that if a company meets the requirements for funding a successful investment for the business,
a dividend will be given if there is still net income available (Gitman & Zutter, 2014). According to this notion,
if a company has leftover cash, paying dividends should be the least important thing it does. The company will
not pay dividends if its income for that year is insufficient to cover its financial needs. Put another way, this
theory assumes that retained earnings provide most of the company's finances (Dahmash, Alshurafat, Hendawi,
Alzoubi & Al Amosh, 2023). Hence, when there is an increase in share prices beyond market expectations, the
company’s earnings will increase, automatically increasing the share of dividends to the shareholders.
Share Prices
ACCESS Journal:
Access to Science, Business, Innovation in Digital Economy
ISSN 2683-1007 (Online)
2025, 6(3), 567-582, https://doi.org/10.46656/access.2025.6.3(6)
https://journal.access-bg.org/
571
Investors globally sought to invest in high-dividend-paying companies for capital appreciation and
sustained return on investment. Indeed, South Africa, having several high-dividend-paying companies listed
on the JSE, has continuously attracted investors worldwide. However, share prices and the dynamics of mining
industries are essential factors to consider when investigating the growth of shares of high dividend-paying
mining companies listed on the JSE (Andleeb, 2024; Kildaire, 2020).
According to Lu, Li, Li, Sun and Wang (2020), the share price is the amount an investor pays to acquire a
company share. Share prices are influenced by several market conditions, which have continually caused price
fluctuation (Lu et al., 2020). Some of these market factors include variations in commodity prices. In addition,
the prices of mining commodities such as metals and minerals significantly influence the profitability and
revenue inflow of the mining companies (Gormsen & Koijen, 2020; Lu et al., 2020). As such, obtaining proper
analysis and evaluation of commodities in the market becomes essential.
Secondly, the share prices of listed companies, which are also informed by profitability margins, are largely
influenced by the production and operational costs of listed companies (Andleeb, 2024; Gormsen & Koijen,
2020). Consequently, mining companies' sustained operation depends on the efficiency of their labour
resources, equipment, and energy sources, which come at a high cost. Similarly, investors' sentiment towards
mining industries, geopolitical stability, and economic conditions greatly influences share prices. Other factors
influencing share prices of high-dividend-paying mining companies include, but are not limited to, variations
in environmental regulations, company financial performance, and developmental projects of listed mining
companies (Vijh, Chandola, Tikkiwal & Kumar, 2020).
Shares Earnings
Mining companies' financial performance and efficient operations provide information on the trends in the
earnings of high-dividend-paying mining companies. Earnings per share (EPS) is a fundamental financial
metric for assessing a company's profitability (Dua & Sharma, 2024; Arsal, 2021). It is calculated by deducting
preferred dividends from the net income and dividing this figure by the total number of common shares the
company has issued (Dahmash et al., 2023). As such, factors like the revenue generation that results from
extractions and sales of metals and minerals inform the trajectory of the company’s share earnings.
Additionally, operational costs, capital expenditures, and cost of depreciation, to mention but a few,
significantly influence earnings (Jian, He, Liu, & Sun, 2024; Dahmash et al., 2023). Over the years, financial
analysts have employed financial matrices such as company net income, rate of depreciation, profit margin,
and cash flow to balance earnings against holistic costs. However, some external and internal factors, such as
market demand and supply dynamics, operational efficiency, taxation, currency fluctuation, and market
sentiment, also impact the earnings rate of high-dividend mining companies (Anton, Lorensa, Purnama, Eddy,
& Andi, 2023). Thus, a sound company’s financial abilities and performance sustainable earnings of the
company shares.
Dividends of Shares
ACCESS Journal:
Access to Science, Business, Innovation in Digital Economy
ISSN 2683-1007 (Online)
2025, 6(3), 567-582, https://doi.org/10.46656/access.2025.6.3(6)
https://journal.access-bg.org/
572
Over the years, investors have continually emphasised the role that dividend dynamics and company
practices play in informing investment decision-making. Thus, a dividend is distributed to their shareholders
as a portion of the company’s profits (Mazur, Dang & Vo, 2023). The ability to pay dividends to shareholders
reflects the financial health and stability of the company. Similarly, capital appreciation, which results from
tangible returns from investment to investors, offers sustained income stability during market volatility
(Sundoro, Anggraini, & Pradiptya, 2023). However, dividend policies of high-dividend-paying mining
companies significantly emphasise growth opportunities, profitability, stability, cash flows, and shareholders'
preferences (Alrobai, & Albaz, 2024; Sundoro et al., 2023). Considerably, some internal and external factors
impact dividend payment. These factors include cash flows and profitability, commodity prices, market
demand and supply, management cost and operational efficiency, shareholders' preferences and tax
considerations, to mention but a few.
Conceptual Relationship Between Share Prices, Earnings and Dividends
Share prices, earnings, and dividends have been extensively examined, considering their role in ascertaining
a company’s financial health and operational efficiency. Share prices capture market sentiments and valuation
of investors of a company’s stock, which considers market conditions, the outlook of the industry and the
company's performance (Lu et al., 2020). On the other hand, earnings represent the company’s profitability,
which is informed by the ability to earn revenue and effectively manage expenditures (Dahmash et al., 2023).
Accordingly, dividends represent that portion of the company’s profit that is shared as a return on
investment to the shareholders. In other words, the Dividend per Share (DPS) represents the earnings per share,
and the former is a profit that a company distributes to its shareholders with the number of shares owned
(Alrobai & Albaz, 2024; Mazur, Dang & Vo, 2023). These dividends can be paid out as cash or as shares.
However, each of these associated features of share prices, earnings and dividends assists in shaping market
dynamics and investors' perceptions (Mahirun, Jannati, Kushermanto & Prasetiani, 2023). Thus, the
relationship is evident as the variation in earnings influences share prices and vice versa, and at the same time,
impacts both the growth and profitability of the company (Sixpence, Adeyeye & Rajaram, 2024). Thus, mining
companies offer a competitive dividend policy reflecting the company’s financial health and the capability to
continually generate returns for the shareholders.
However, several macro factors, such as prices of commodities, changes in government policies,
regulations, and geopolitical variables, play a subjective role in the relationship between share prices, earnings,
and dividends of mining companies (Mahirun et al., 2023; Mazur et al., 2023). Practically, a sharp increase in
commodity prices could positively increase the company's earnings, which could also prompt an increase in
dividend payouts to the company’s shareholders. On the other hand, the backdrop of commodity prices or
challenges associated with the company’s operations may also result in decreased earnings and, by extension,
cause modification in the company’s dividend policies and share prices.
Thus, the literature review section's focus was the correlation between share prices, earnings, and dividends
of high-dividend-paying mining companies listed on the JSE. Thus, this section has revealed the conceptual
ACCESS Journal:
Access to Science, Business, Innovation in Digital Economy
ISSN 2683-1007 (Online)
2025, 6(3), 567-582, https://doi.org/10.46656/access.2025.6.3(6)
https://journal.access-bg.org/
573
dimension of share prices, earnings, and dividends related to high-dividend-paying mining companies.
Accordingly, commodity prices, external market forces and internal operational dynamics were identified as
significant role players in the correlation between share prices, earnings, and dividends of high dividend-
paying mining companies. This study also employed the Dividend Signalling Theory and the Residual Theory
of Dividends, which were expected to provide a pathway to ascertain the correlation between share prices,
earnings, and dividends of selected high dividend-paying mining companies listed on the JSE.
METHODOLOGY
This study employs a positivist research paradigm, emphasising empirical observation and a quantitative
research method was used to investigate the correlation between share prices, earnings, and dividends of
selected high-dividend-paying mining companies listed on the Johannesburg Stock Exchange (JSE). Drawing
from the philosophical foundation established by August Comte, the positivist approach underscores the
importance of objective and measurable phenomena (Saunders, Lewis & Thornhill, 2009). This paradigm
aligns with the study's objective to establish objective scientific correlations among the identified variables.
The research adopts a non-experimental correlational approach. This approach allows for examining
relationships between variables that measure key domains (Roberts, 2021). Data for the analysis were sourced
from iRess, encompassing historical secondary data from 2008 to 2022, including the selected mining firms'
annual closing share prices, earnings, and dividends. Data analysis used Pearson correlation analysis with
EViews software to explore the relationships between the studied variables. This process involves thoroughly
examining the dataset structure, identifying trends and anomalies, and applying statistical techniques to
provide meaningful insights (Peck, Short & Olsen, 2020). Visual representations, such as graphs and summary
statistics, facilitated a clearer understanding of the findings, linking to the research questions and hypotheses.
Ethical considerations were prioritised throughout the research process. The study ensured data integrity
by avoiding falsification, providing accurate citations to all sources to prevent plagiarism, and safeguarding
the privacy and dignity of involved parties (Laas et al., 2022). Results were presented responsibly, reflecting
the study's commitment to professional research practices to benefit the sector's stakeholders under
investigation and society.
PRESENTATION OF RESULTS
This study aimed to ascertain the correlation between the share prices of selected high dividend-paying mining
companies and their earnings and dividends. As such, this section presents the result of the study with a
significant focus on attending to the research question and hypothesis. The data required was generated using
the iRess database. Accordingly, this section explains how the data exploration and correlation analysis were
performed and how the results are interpreted. Results such as correlation analysis, series graph, Boxplot
graph, and Dot Plot of the series were presented using tables and figures.
Data Exploration

ACCESS Journal:
Access to Science, Business, Innovation in Digital Economy
ISSN 2683-1007 (Online)
2025, 6(3), 567-582, https://doi.org/10.46656/access.2025.6.3(6)
https://journal.access-bg.org/
574
Data exploration in this study followed scientific rigour and steps, where after obtaining data from iRess,
the data was assessed and arranged to ensure that the dataset was used for analysis. Accordingly, analysis was
performed using Eviews, and results were generated visually. However, some irregularities were identified in
the dataset while performing the analysis, which resulted in some outliers. Thus, the outliers were treated by
transforming the data series using logarithms, and the results were also presented.
Correlation Analysis
A correlation analysis was performed to ascertain whether there is a positive, negative, or no correlation
between the share price of selected high dividend-paying mining companies and their earnings and dividends
(see Table 1).
Table 1. Correlation Analysis
Dividends Per Share
Earnings Per Share
Price Per Share
Dividends Per Share
1
Earnings Per Share
0.96
1
Price Per Share
0.75
0.82
1
Source: Author’s computation using EViews 12
Table 1 presents the correlation analysis of the series. From the table, the coefficients between the variables
DPS (Dividends Per Share), EPS (Earnings Per Share), and PPS (Price Per Share) can be depicted. The table
indicates a strong positive correlation between EPS and DPS (0.96), a moderately strong positive correlation
between PPS and DPS (0.75), and a very strong positive correlation between PPS and EPS (0.82). The
correlation analysis in Table 1 indicates significant correlations among DPS, EPS, and PPS. The strong positive
correlations, especially between EPS and DPS and between PPS and EPS, suggest potential multicollinearity
issues if these variables are used together as predictors in a regression model. As presented below, an additional
analysis was performed to understand the relationship pattern between the variables further.
Figure 1. Graph of the Series
Source: Author’s computation using EViews 12
Figure 1 presents the graph of the series. The graph visually represents how these variables change over
time, with evidence of outliers since some points that deviate from the overall pattern of the data. For example,
-40,000
0
40,000
80,000
120,000
160,000
200,000
1 - 08
1 - 11
1 - 14
1 - 17
1 - 20
2 - 08
2 - 11
2 - 14
2 - 17
2 - 20
3 - 08
3 - 11
3 - 14
3 - 17
3 - 20
4 - 08
4 - 11
4 - 14
4 - 17
4 - 20
DPS EPS PPS

ACCESS Journal:
Access to Science, Business, Innovation in Digital Economy
ISSN 2683-1007 (Online)
2025, 6(3), 567-582, https://doi.org/10.46656/access.2025.6.3(6)
https://journal.access-bg.org/
575
at points 1 – 08, 2 -08, 4 – 11, and 4 -20, further tests were required, which are presented below to confirm the
outliers.
-40,000
0
40,000
80,000
120,000
160,000
200,000
DPS EPS PPS
Figure 2. Boxplot Graph of the Series
Source: Author’s computation using EViews 12
Figure 2 presents the boxplot graph of the series. The figure confirms the presence of outliers, some of the
data points that fall above or below the typical range of values; these outliers in a boxplot may indicate unusual
or extreme values that could impact the overall data analysis.
-40,000
0
40,000
80,000
120,000
160,000
200,000
1 - 08
1 - 10
1 - 12
1 - 14
1 - 16
1 - 18
1 - 20
1 - 22
2 - 09
2 - 11
2 - 13
2 - 15
2 - 17
2 - 19
2 - 21
3 - 08
3 - 10
3 - 12
3 - 14
3 - 16
3 - 18
3 - 20
3 - 22
4 - 09
4 - 11
4 - 13
4 - 15
4 - 17
4 - 19
4 - 21
DPS EPS PPS
Figure 3. Figure of Dot Plot of the Series
Source: Author’s computation using EViews 12
Figure 3 presents the Dot Plot of the Series; this also helps to identify the outliers by displaying individual
data points for each series. By examining the dot plot closely, it is discovered that some data points deviate
from most of the data.
Resolving the Outliers
From the analysis, the presence of outliers was evident; thus, one way to treat these outliers is to transform
the series using logarithms; this was done on the series, and the outcomes are presented below:

ACCESS Journal:
Access to Science, Business, Innovation in Digital Economy
ISSN 2683-1007 (Online)
2025, 6(3), 567-582, https://doi.org/10.46656/access.2025.6.3(6)
https://journal.access-bg.org/
576
Table 2. Correlation Analysis (After Log Transformation of the Series)
Dividends Per Share
Earnings Per Share
Price Per Share
Dividends Per Share
1
Earnings Per Share
0.79
1
Price Per Share
0.50
0.58
1
Source: Author’s computation using EViews 12
Table 2 presents the correlation analysis after the series has been logged and transformed. The pairwise
correlation analysis reduced in values compared to the original analysis before the transformation of data. For
example, the correlation between DPS and EPS is 0.79, between DPS and PPS is 0.50, and between EPS and
PPS is 0.58. The suspicion of the presence of multicollinearity is reduced.
0
1
2
3
4
5
6
1 - 08
1 - 10
1 - 12
1 - 14
1 - 16
1 - 18
1 - 20
1 - 22
2 - 09
2 - 11
2 - 13
2 - 15
2 - 17
2 - 19
2 - 21
3 - 08
3 - 10
3 - 12
3 - 14
3 - 16
3 - 18
3 - 20
3 - 22
4 - 09
4 - 11
4 - 13
4 - 15
4 - 17
4 - 19
4 - 21
DPS EPS PPS
Figure 4. Graph of the Series (After Log Transformation of the Series)
Source: Author’s computation using EViews 12
Figure 4 presents the graph of the series (after the log transformation of the series); by doing so, the values
become close to each other over time. However, due to the zero value (or missing data), there is still the
presence of an outlier, but logging the series has removed the potential outlier without the zero values.
0
1
2
3
4
5
6
DPS EPS PPS
Figure 5. Boxplot Graph of the Series (After Log Transformation of the Series)
Source: Author’s computation using EViews 12

ACCESS Journal:
Access to Science, Business, Innovation in Digital Economy
ISSN 2683-1007 (Online)
2025, 6(3), 567-582, https://doi.org/10.46656/access.2025.6.3(6)
https://journal.access-bg.org/
577
Figure 5 presents the boxplot graph of the series (after the log transformation). The presence of the outlier
has been removed without the zero values. However, due to the zero value (or missing data), there is still the
presence of an outlier, but logging the series has removed the potential outlier without the zero values.
0
1
2
3
4
5
6
1 - 08
1 - 10
1 - 12
1 - 14
1 - 16
1 - 18
1 - 20
1 - 22
2 - 09
2 - 11
2 - 13
2 - 15
2 - 17
2 - 19
2 - 21
3 - 08
3 - 10
3 - 12
3 - 14
3 - 16
3 - 18
3 - 20
3 - 22
4 - 09
4 - 11
4 - 13
4 - 15
4 - 17
4 - 19
4 - 21
DPS EPS PPS
Figure 6. Figure of Dot Plot of the Series (After Log Transformation of the Series)
Source: Author’s computation using EViews 12
Figure 6 presents the Dot Plot of the Series (After the Log Transformation of the Series). The outliers,
excluding zero values, have been removed. However, due to the presence of zero values (or missing data), an
outlier remains. Despite this, the log transformation mitigates the potential outliers when zero values are not
considered.
INTERPRETATION AND DISCUSSION OF THE RESULTS
The purpose of this study was to reveal the correlation between the share prices of selected high dividend-
paying mining companies and their earnings and dividends. To support this objective, three hypotheses were
developed and tested. Thus, the correlation analysis result in Table 1 indicates a correlation between EPS and
DPS (0.96), between PPS and DPS (0.75), and a correlation between PPS and EPS (0.82). As such, H0, as
presented below, is rejected and not supported.
H0: There is no correlation between the share price of selected high dividend-paying mining companies
and their earnings and dividends (at a significance level of 5%).
Secondly, Table 1 indicates a strong positive correlation between EPS and DPS (0.96), a moderately strong
positive correlation between PPS and DPS (0.75), and a strong positive correlation between PPS and EPS
(0.82). Accordingly, it was established from the correlation analysis result that H1, as presented below, is
accepted and supported.
H1: There is a positive correlation between the share price of selected high dividend-paying mining
companies and their earnings and dividends (at a significance level of 5%).
ACCESS Journal:
Access to Science, Business, Innovation in Digital Economy
ISSN 2683-1007 (Online)
2025, 6(3), 567-582, https://doi.org/10.46656/access.2025.6.3(6)
https://journal.access-bg.org/
578
Accordingly, Table 1 shows a positive correlation between EPS and DPS (0.96), a positive correlation
between PPS and DPS (0.75), and a positive correlation between PPS and EPS (0.82). Based on this result, it
is established that H2, as presented below, is rejected and not supported.
H2: There is a negative correlation between the share price of selected high dividend-paying mining
companies and their earnings and dividends (at a significance level of 5%).
Furthermore, the positive correlation between EPS and DPS (0.96) indicates that firms with higher earnings
per share are very likely to pay higher dividends per share, and as DPS tends to rise significantly, EPS also
increases vice versa. Higher earnings enable companies to pay out profits as dividends (Rena & Mbukanma,
2022; Gormsen & Koijen, 2020; Lu et al., 2020). Strongly profitable companies (high EPS) may thus often
provide more wealth to shareholders via dividends (high DPS). Similarly, as PPS tends to increase as DPS
increases, although not as significantly as the EPS-DPS relationship. This implies that the market generally
assigns a greater value to companies that pay larger dividends to their shareholders (Sundoro et al., 2023).
Investors frequently perceive dividends as an indicator of a company's financial stability and future prospects.
Companies that consistently pay and potentially increase dividends may be perceived as stable and profitable,
resulting in a higher demand for their stock and, as a result, a higher price per share.
The correlation value of 0.82 indicates a very robust positive relationship between Price Per Share (PPS)
and Earnings Per Share (EPS). This indicates that as earnings per share (EPS) increases, the price per share
(PPS) rises significantly. This indicates that the market values firms with larger profits per share (Dahmash et
al., 2023). Earnings per share (EPS) is a crucial metric that measures a company's profitability and is frequently
monitored by investors. A high or rising EPS might indicate robust company performance, prompting investors
to purchase more shares and causing an increase in the share price. This statement illustrates that increased
profits would increase dividends and expansion opportunities, justifying a greater stock value.
Report on Missing Data or Zero Values in the Series
There were zero values for DPS from 2009, 2012 to 2016 for AMS, 2014 to 2019 for IMP. Finally, 2015
and 2016 for KIO. However, these periods could not confirm that there is missing data, a case which cannot
be ruled out as well. For instance, time series data showing a zero value can indicate different issues or
phenomena, which further specific analysis may be required. In this case, the series measures prices, which
may indicate the likelihood that no transaction occurred during that period. Since it measures prices, a zero
might be doubtful. Thus, if it is missing values, one way to overcome it is to use linear interpolation of the
data, which has scientific procedures for dealing with missing values in empirical studies.
CONTRIBUTIONS AND IMPLICATIONS TO BUSINESS PRACTICES
This study provides empirical evidence on how earnings and dividends affect share prices in high-dividend-
paying mining companies in South Africa with the support of the Dividend Signalling Theory and Residual
Theory of Dividends within the context of high-dividend-paying mining companies. Significant positive
correlations were identified between Earnings Per Share (EPS) and Dividends Per Share (DPS), Price Per
ACCESS Journal:
Access to Science, Business, Innovation in Digital Economy
ISSN 2683-1007 (Online)
2025, 6(3), 567-582, https://doi.org/10.46656/access.2025.6.3(6)
https://journal.access-bg.org/
579
Share (PPS), and DPS and EPS and PPS. The study also highlighted the role of external factors like commodity
prices and market conditions in influencing the operational landscape of mining companies and their financial
performance. The researchers also acknowledged the presence of outliers and missing data, emphasizing the
need for careful data handling in financial analysis. Thus, the following implications for business practices
were provided:
a. Importance of Profit and Dividend Stability: Underscores the importance of profit and dividend
stability as indicators of financial health for mining investors and management.
b. Informed Investment Strategies: Provides insights that can be used to inform investment strategies and
financial decision-making, especially in volatile sectors like mining.
c. Strategic Decision-Making: Equips investors and policymakers with valuable knowledge for strategic
decision-making regarding dividend policy and stock valuation.
d. Investor Perceptions: Reinforces that investors often perceive dividends as an indicator of a company's
financial stability and future prospects, influencing stock demand and price.
e. Market Valuation: Indicates that the market values firms with larger profits per share, as reflected in
the positive relationship between EPS and PPS.
CONCLUSION
The research study investigates the correlation between share prices, earnings per share (EPS), and dividends
per share (DPS) among high-dividend-paying mining companies on the Johannesburg Stock Exchange (JSE),
including Anglo American Platinum, Exxaro Resources, Kumba Resources Ltd., and Impala Platinum
Holdings Limited. This analysis is significant for investors and financial experts due to the mining industry's
volatility and importance to the South African economy.
Using Pearson correlation analysis on historical data from 2008-2022 with Eviews version 12, the study
reveals strong positive correlations among EPS, DPS, and share price (PPS). A notable correlation coefficient
0.96 between EPS and DPS indicates that higher earnings lead to increased dividends. This supports the
Dividend Signalling Theory, which suggests dividend announcements can enhance investor confidence and
share prices. Additionally, the correlation of 0.75 between PPS and DPS highlights that consistent dividend
payments are seen as a sign of financial stability. In contrast, the 0.82 correlation between EPS and PPS shows
that higher profitability drives stock prices.
The study also notes that external factors like commodity prices and market conditions influence earnings
and dividend policies. It addresses challenges such as outliers and missing data, employing log transformation
to ensure accurate findings. The results provide essential insights for investors, corporate managers, and
policymakers regarding the financial dynamics affecting decision-making in the mining sector. Future research
may explore the impact of macroeconomic factors on these relationships or analyse other sectors within the
JSE for a more comprehensive overview of market behaviours.
ACCESS Journal:
Access to Science, Business, Innovation in Digital Economy
ISSN 2683-1007 (Online)
2025, 6(3), 567-582, https://doi.org/10.46656/access.2025.6.3(6)
https://journal.access-bg.org/
580
Author Contributions: Conceptualisation, I.M. and S.O.A; methodology, I.M; software, I.M. and S.O.A;
validation, I.M. and S.O.A; formal analysis, I.M; investigation, S.O.A; resources, I.M. and S.O.A; data
curation, I.M; writing original draft preparation, I.M. and S.O.A; writing review and editing, I.M. and S.O.A;
visualisation, I.M; supervision, S.O.A. and project administration, I.M. and S.O.A.
All authors have read and agreed to the published version of the manuscript.
Funding /Acknowledgement: This study is financed by the authors' institution
Institutional Review Board Statement: The study was conducted in accordance with the research ethics code
and conduct and approved by the Ethics Committee of the College of Economic and Management Sciences at
Unisa with Ref No. 2021/CEMS/FRMB/011
Informed Consent Statement: Informed consent was obtained from all respondents involved in the study,
and their anonymity was maintained in accordance with the research ethics code and conduct.
Data Availability Statement: In accordance with my university's research ethics code and conduct, all data
are privately secured by the library directorate.
Conflict of interest: The authors declare no conflict of interest.
References
Alrobai, F., & Albaz, M. M. 2024. Capturing Disclosure Tone in Saudi Arabia: Do Earnings Management and Accounting
Conservatism Matter? Sustainability, 16(14), 5904. doi.org/10.3390/su16145904
Andleeb, R. (2024). Investor sentiment dynamics and returns in emerging equity markets (Doctoral dissertation, Capital
University). Retrieved from https://cust.edu.pk/wp-content/uploads/2024/02/Rameeza-Andleeb-Mngt-Sc-
Dissertation.pdf (accessed: Dec 18, 2024)
Anton, A., Lorensa, S., Purnama, I., Eddy, P., & Andi, A. (2023). Net profit margin, earnings per share, return on assets,
debt-equity ratio, and current ratio on firm value in agricultural sector companies listed on the Indonesia Stock
Exchange (2016–2021). Journal of Applied Business and Technology, 4(2), 155-167.
https://doi.org/10.35145/jabt.v4i2.131
Arsal, M. (2021). Impact of earnings per share and dividend per share on firm value. ATESTASI: Jurnal Ilmiah Akuntansi,
4(1), 11-18. https://doi.org/10.33096/atestasi.v4i1.594
Creswell, J. W. (2014). Research design: Qualitative, quantitative, and mixed methods approaches (4th ed.). Sage
Publications. ISBN 978-1-4522-2610-1, 342 p
Dahmash, F. N., Alshurafat, H., Hendawi, R., Alzoubi, A. B., & Al Amosh, H. (2023). The retained earnings effect on
the firm’s market value: Evidence from Jordan. International Journal of Financial Studies, 11(3), 89.
https://doi.org/10.3390/ijfs11030089
Dua, J., & Sharma, A. K. 2024. Unveiling the ESG-dividend nexus: the moderating role of investor protection and
regulatory enforcement. Journal of Indian Business Research, 16(2), 265-286. DOI 10.1108/JIBR-09-2023-0297
George, T. (2023). What is a theoretical framework? Guide to organizing. Scribbr. Retrieved from
https://www.scribbr.com/dissertation/theoretical-framework/ (accessed: Dec 17, 2024)
Gharaibeh, A. T., Saleh, M. H., Jawabreh, O., & Ali, B. J. (2022). An empirical study of the relationship between earnings
per share, net income, and stock price. Applied Mathematics, 16(5), 673-679.
https://doi.org/10.11591/ajast.v16i5.2322
Gitman, L. J., & Zutter, C. J. (2014). Principles of managerial finance. Pearson
Gormsen, N. J., & Koijen, R. S. (2020). Coronavirus: Impact on stock prices and growth expectations. The Review of
Asset Pricing Studies, 10(4), 574-597. https://doi.org/10.1093/rapstu/raaa013
ACCESS Journal:
Access to Science, Business, Innovation in Digital Economy
ISSN 2683-1007 (Online)
2025, 6(3), 567-582, https://doi.org/10.46656/access.2025.6.3(6)
https://journal.access-bg.org/
581
Jian, J., He, K., Liu, Y., & Sun, Y. (2024). Corporate social responsibility: Opportunistic behavior under earnings
management? Asia-Pacific Journal of Accounting & Economics, 31(2), 247-268. DOI:
10.1080/16081625.2023.2170891
Juwawo, G. T. B. (2022). Company-specific determinants of dividend payout decisions (Doctoral dissertation). University
of Johannesburg. Retrieve from: https://hdl.handle.net/10210/504122
Kildaire, K. (2020). The determinants of earnings growth for firms on the JSE: An empirical analysis (Doctoral
dissertation). University of the Witwatersrand. https://wiredspace.wits.ac.za/server/api/core/bitstreams/872d0075-
11c5-4dd4-9384-cbf4dfb5a65d/content (accessed: Dec 17, 2024)
Kumar, R. (2011). Research methodology: A step-by-step guide for beginners (3rd ed.). SAGE Publications Ltd. New
Delhi
Laas, K., Taylor, S., Miller, C. Z., Brey, E. M., & Hildt, E. (2022). Views on ethical issues in research labs: A university-
wide survey. Accountability in Research, 29(3), 178-201. doi: 10.1080/08989621.2021.1910503
Lu, W., Li, J., Li, Y., Sun, A., & Wang, J. (2020). A CNN-LSTM-based model to forecast stock prices. Complexity, 2020,
Article ID 8888510, 1-10. DOI: 10.1155/2020/6622927
Mahirun, M., Jannati, A., Kushermanto, A., & Prasetiani, T. R. (2023). Impact of dividend policy on stock prices. Acta
Logistica, 10(2), 199-208. https://doi.org/10.22306/al.v10i2.375
Mazur, M., Dang, M., & Vo, T. T. A. (2023). Dividends and share repurchase during the COVID-19 economic crisis.
Journal of Financial Research, 46(2), 291-314. https://doi.org/10.1111/jfir.12298
Mbukanma, I., Ani, K. J., & Rena, R. (2019). The relationship between political stability and GDP growth: A comparative
analysis of the BRICS nations. Acta Universitatis Danubius. Œconomica, 15(7). Retrieved from chrome-
https://journals.univ-danubius.ro/index.php/oeconomica/article/viewFile/6033/5352 (accessed: March 7, 2025)
Mbukanma, I. & Rena, R. (2022). Exploring the Growth of Indian's Foreign Direct Investment Equity Inflow amid Covid-
19 Outbreak. Delhi Business Review, 23(1), 1-8. DOI: 10.1142/9789811271786_0008
Mithila, G., & Kengatharan, L. (2025). The Role of Dividend Policy in Shaping Market Value of Shares: Evidence from
Colombo Stock Exchange. Journal of Finance, 5(1), 84-99. http://repo.lib.jfn.ac.lk/ujrr/handle/123456789/11442
(accessed: March 7, 2025)
Nharo, T. (2021). The relationship between board characteristics and dividend payment policies in JSE Top 40 listed
companies (Doctoral dissertation). University of Johannesburg. https://hdl.handle.net/10210/474964. (accessed:
Dec 18, 2024)
Oberauer, K., & Lewandowsky, S. (2019). Addressing the theory crisis in psychology. Psychonomic Bulletin & Review,
26, 1596-1618. https://doi.org/10.3758/s13423-019-01645-2
Park, Y. S., Konge, L., & Artino Jr, A. R. (2020). The positivism paradigm of research. Academic Medicine, 95(5), 690-
694. https://doi.org/10.1097/ACM.0000000000003177
Peck, R., Short, T., & Olsen, C. (2020). Introduction to statistics and data analysis (6th ed.). Cengage Learning
Roberts, D. R. (2021). Quantitative non-experimental correlational study: Determining any existence between the
predictors of workplace violence (Doctoral dissertation). Northcentral University. Retrieved from
https://www.proquest.com/docview/2506603935 (accessed: June 1, 2025)
Saunders, M., Lewis, P., & Thornhill, A. (2009). Research methods for business students (5th ed.). Pearson Education
Limited
Sixpence, A., Adeyeye, O. P., & Rajaram, R. (2024). Informational content of cash dividends and retained earnings:
Evidence from South Africa. Afro-Asian Journal of Finance and Accounting, 14(1), 1-21.
https://doi.org/10.1504/AAJFA.2024.136134
Sundoro, F. M., Anggraini, Y., & Pradiptya, A. (2023). The analysis of the effects of earning per share, price earnings
ratio, and dividend per share on the share prices of manufacturing companies. Economics and Business Solutions
Journal, 7(1), 57-72. DOI: 10.26623/ebsj.v7i1.6836
Vijh, M., Chandola, D., Tikkiwal, V. A., & Kumar, A. (2020). Stock closing price prediction using machine learning
techniques. Procedia Computer Science, 167, 599-606. https://doi.org/10.1016/j.procs.2020.03.319
Zhang, H., Zhao, S., Kou, G., Li, C. C., Dong, Y., & Herrera, F. (2020). An overview on feedback mechanisms with
minimum adjustment or cost in consensus reaching in group decision making: Research paradigms and challenges.
Information Fusion, 60, 65-79. https://doi.org/10.1016/j.inffus.2020.02.006

ACCESS Journal:
Access to Science, Business, Innovation in Digital Economy
ISSN 2683-1007 (Online)
2025, 6(3), 567-582, https://doi.org/10.46656/access.2025.6.3(6)
https://journal.access-bg.org/
582
About the authors
Ifeanyi MBUKANMA
A Senior Lecturer and an established researcher at Walter Sisulu University in South
Africa. He holds a PhD in Business Management and his academic journey is marked
by a commitment to advancing business economics and financial knowledge through
rigorous inquiry and innovative methodologies. He is peer reviewer for prominent
journals and has supervised several honours, master’s and PhD students and also serves
as an external examiner for PhD and master's theses. He has been severally recognized
with multiple awards for his mentorship excellence and research productivity.
Research Interest: Business finance, marketing, applied management,
entrepreneurship, forensic and neuromarketing.
ORCID ID: 0000-0002-3037-8835
Sunday Olabisi ADEWARA,
An Associate Professor of Economics, specialising in applied econometrics,
macroeconomics, and health economics. He holds a B.Sc. and M.Sc. in Economics from
the University of Ilorin and a Ph.D. from the University of Cape Town. His career spans
teaching roles at the University of Ilorin, Landmark University, and Redeemer’s
University, alongside international tutoring and post-doctoral work at UCT. Adewara
has supervised over 20 theses and published 45 papers. He has received numerous
awards and is active in professional societies, while consulting on World Bank-funded
educational analyses in Nigeria.
Research Interest: Applied econometrics, macroeconomics, and health economics.
ORCID ID: 0000-0002-7704-5050
This work is licensed under the Creative Commons Attribution International License (CC BY)

ACCESS Journal:
Access to Science, Business, Innovation in Digital Economy
ISSN 2683-1007 (Online)
2025, 6(3), 583-598, https://doi.org/10.46656/access.2025.6.3(7)
https://journal.access-bg.org/
583
ASSESSMENT OF AGRICULTURAL EXPORT STRUCTURE’S IMPACT
ON NATIONAL ECONOMIC DEVELOPMENT: UKRAINIAN CASE
Svitlana Labunska1, Mykola Sidak2, Andriy Pylypenko3, Marharyta Sobakar4*
1), 2) Bratislava University of Economics and Management, Bratislava, Slovakia
1), 3), 4) Simon Kuznets Kharkiv National University of Economics, Kharkiv, Ukraine
e-mails: 1 svetlana.lab@gmail.com, 2mikulas.sidak@vsemba.sk, 3aapil@ukr.net, 4 marharyta.sobakar@hneu.net
Received: 13 March 2025 Accepted: 13 July 2025 Online Published: 04 Sept 2025
ABSTRACT
The development of socially responsible activities and the achievement of sustainable development goals have been
identified as a strategic direction of global development. Given the decisive importance of the agricultural sector,
implementing sustainable activities in this area will contribute to the overall achievement of sustainable development
goals. The key here should be transforming approaches to producing raw materials to developing the agricultural raw
materials processing complex. Objectives: the goal is to justify the possibility of achieving sustainable development goals
through the development of the sustainable agricultural sector. Methods/Approach: statistical data on the development
of agriculture in countries worldwide (GDP, the value of agricultural production, the value of exported agricultural
products with their share in the country's total exports, the structure of food trade) were collected and analysed using
regression methods. The analysis was conducted according to the countries' economic development level. Results: the
results confirm, that the production of processed products generates significantly higher added value, and its
implementation will contribute to economic growth. This has been proven by the results of the formed four regression
models, which showed the negative impact of agricultural raw materials exports on macroeconomic indicators.
Conclusions: transition from raw materials exports to exports of highly processed goods is a key driver of sustainable
economic development. Raw material processing development ensures sustainable economic growth for the country,
stable incomes, new jobs, independence from raw material markets, and the achievement of SDGs. That is why,
development of sustainable agribusiness is very important for Ukraine because it can become a key driver of the country's
post-war recovery.
Keywords: agribusiness, sustainable development, sustainable development goals, exports structure, processing,
economic growth
JEL classification: Q01, O13, O32, O57
Paper type: Research article
Citation: Labunska, Sv., Sidak, M., Pylypenko, A., Sobakar, M. (2025). Assessment of agricultural export structure’s impact
on national economic development: Ukrainian case. Access to science, business, innovation in the digital economy, ACCESS
Press, 6(3), 583-598, https://doi.org/10.46656/access.2025.6.3(7)
INTRODUCTION
Due to the rising costs of energy resources, EU countries are experiencing a socio-economic shock (Shlapak
et al., 2023). Under such circumstances, innovative agribusiness can become the foundation for economic
growth. Implementing the sustainable development paradigm in the practical activities of agricultural
enterprises aims to address environmental issues, promote socio-economic development, increase the
population welfare, and overcome the economic crisis. In general, it should enhance the country's position in
the international arena.
ACCESS Journal:
Access to Science, Business, Innovation in Digital Economy
ISSN 2683-1007 (Online)
2025, 6(3), 583-598, https://doi.org/10.46656/access.2025.6.3(7)
https://journal.access-bg.org/
584
As noted by the European Commission, agriculture is a vital sector for the population and the economy.
For agriculture development support, the "Strategic Dialogue on the Future of Agriculture in the EU" was
approved, with one of its primary goals being to revise the agri-food value chain (European Commission,
2024). In addition, attention is drawn to the promotion of sustainable agribusiness, particularly from the
perspective of its positive impact on the environment and contributing to achieving sustainable economic goals.
To address urgent problems such as environmental crisis, poverty and inequality, and economic challenges,
the United Nations adopted 17 Sustainable Development Goals (SDGs) during its 70th session of the General
Assembly in New York in 2015 (United Nations, 2015). These goals serve as strategic development guidelines
for ensuring comprehensive well-being in the social, economic, and environmental areas.
Agricultural development is a component of the green economy system, the principles of which contribute
to achieving SDGs (Rybalkin O., 2022). The role of agriculture in ensuring economic development and
achieving sustainable development goals has also been substantiated by Al-Ababneh et al. (2021). The
development of agricultural production and the improvement of quality standards for agricultural products
create the prerequisites for the rational use of export potential, overcoming the food crisis, and determines the
financial stability of national economics. One of the main roles of the agricultural sector is to slow down and
prevent the deepening of the global food crisis. This is the basis for achieving SDG 2 "Zero hunger". However,
for this, it is necessary to determine the export potential of agricultural products in order to ensure their level
of supply is acceptable globally.
Wrzaszcz W. and Prandecki K. (2015) prove that agribusiness enterprises that implement sustainable
practices achieve better productivity and performance.
The impact of agribusiness development on the general state of the economy has been widely studied from
the perspective of agricultural goods production and sale. Remeikiene R. (2018) revealed that agricultural
exports have a limited contribution to GDP growth. Moreover, it negatively affects labor market indicators.
Thus, there is a problem of the negative impact of increasing agricultural exports on sustainable economic
development. Also, exports are not a significant driver of economic growth (Love J., Ramesh Ch., 2004).
However, introducing sustainable practices, particularly processing, into agribusiness activities will
significantly increase the country's GDP. Agribusiness can become the main driving force of future economic
development only on a base of implementation of sustainable agricultural practices (Ciglovska B., 2018).
Lazarova E. et al. (2023) also argue that agriculture plays an important role in ensuring the country's
economic growth. However, the authors emphasize that effective development of agriculture is possible only
if innovations are maintained and the infrastructure potential of rural areas is increased. In turn, such an
infrastructure potential depends on the development of production infrastructure and the processing industry
in agribusiness.
The idea of the need to develop the processing industry is developed in the study of Nwankwo et al. (2024).
The authors propose establishing the foundations of sustainable economic development in agriculture by
optimizing the value chain based on better utilization of human resources. The primary outcome of such
ACCESS Journal:
Access to Science, Business, Innovation in Digital Economy
ISSN 2683-1007 (Online)
2025, 6(3), 583-598, https://doi.org/10.46656/access.2025.6.3(7)
https://journal.access-bg.org/
585
activities is to contribute to achieving sustainable development goals No. 2, “Zero Hunger”, and No. 12,
“Responsible Consumption and Production”.
Cucagna M. and Goldsmith P. (2018) focused on the stages of value formation of agricultural products.
The authors proved that the levels of added value differ across the various stages of the food product life cycle
since each stage contributes differently to the value creation process. A significant level of added value
formation was identified at the food production stage compared to previous stages.
Shopova M. et al. (2022) revealed the role of recyclable raw material imports in advancing the circular
economy within the European Union. They highlight that development of raw material processing is the basis
for the functioning of circular economy, which in turn is aimed at achieving the principles of sustainable
development. Vasa L. et al. (2017) added that development of circular agriculture should be the main vector
of agricultural development, as this concept contributes to the sustainable use of existing resources. Significant
economic benefits can be obtained by transitioning from a linear to a circular agriculture system.
The development of sustainable agribusiness requires the introduction of innovations in this area (Labunska
S. et al., 2023). In Di Virgilio et al. (2023) opinion, enhancing innovation activity is needed in order to stimulate
economic growth. Mileva S. and Georgieva T. (2022) suggested the establishment of innovative ecosystems
within the agribusiness sector. The advancement of the processing complex in agriculture, in turn, will foster
innovation and digitalization. It is the digitalization of agriculture that will enhance production efficiency and
competitiveness (Várallyai et al., 2024). This will contribute to sustainable economic growth and
competitiveness in the agricultural sector.
Trade in high-tech products, including their export, significantly increases the economic condition and
competitiveness of the economy. As Matyushenko I. et al. (2020) note, the limitations of countries in the high-
tech products market include the outdated structure of production, low R&D costs and insufficient innovative
activity. Since agriculture is one of the leading sectors of the Ukrainian economy, the development of the raw
material processing, especially with the use of innovations, will contribute to exports rise and increase the
potential of the national economy.
Thus, it is highly relevant to study the organization of agricultural production's impact on the country's
economic state and to promote the achievement of the Sustainable Development Goals defined by the United
Nations.
The purpose of the study is to justify the possibility of achieving sustainable development goals through
the development of the sustainable agricultural sector.
METHODOLOGY
Statistical data for 2022 on the development of agriculture in 154 countries worldwide were collected and
grouped according to the countries' economic development level. In particular, there data on the GDP of
countries, the value of agricultural production, the value of exported agricultural products with their share in
the country's total exports, and the structure of food trade have been analyzed.
ACCESS Journal:
Access to Science, Business, Innovation in Digital Economy
ISSN 2683-1007 (Online)
2025, 6(3), 583-598, https://doi.org/10.46656/access.2025.6.3(7)
https://journal.access-bg.org/
586
For a more detailed analysis of the impact of agricultural exports on Ukraine's economy, statistical data on
specified indicators for 2005-2022 for Ukraine were collected.
Data collection was carried out in two directions: collecting information on global trends in sustainable
agriculture and collecting data to analyze the impact of the dynamics of agricultural product sales (independent
variables) on the country's economy (GDP is the dependent variable).
The sources of information for the analysis included data from the World Bank Group (GDP values), United
Nations Trade and Development (UNCTAD) Data Hub (value of agricultural products exports), Food and
Agriculture Organization of the United Nations (values of agricultural production and sales of food products),
European Commission (data on the structure of EU agricultural exports), State Statistics Service of Ukraine
(trends of development of agriculture in Ukraine).
In order to determine the significance of the agricultural activity level and raw agricultural product exports
(crop and livestock products) for the country's GDP, four regression models were developed. They presented
the dependence of the economy on the organization of agriculture by groups of countries according to
economic development level, as well as an analysis model the case of Ukraine.
The processing of the collected data and the formation of regression models were carried out using MS
Excel.
The hypotheses of research:
H1 – Agriculture development is one of the main factors in achieving sustainable development goals;
H2 – The agricultural processing development and the export of processed raw materials ensure sustainable
economic development;
H3—The sustainable development of agribusiness and the agro-processing sector will become the basis for
Ukraine's post-war recovery.
RESULTS AND DISCUSSION
Experience of developed countries
The results of the regression analysis for a group of developed countries indicate that the model's factor
variables (X1—the value of agricultural production; X2—share of agricultural exports) (Figure 1) explain
95.9% of the variation in Y (GDP) (R-square=0.959) (Table 1). This confirms the hypothesis regarding the
significance of agricultural development for a country's overall economic development.
The statistical significance of the regression model is 2.97133E-31<0.05. Thus, a statistically significant
correlation between the factor and dependent variables included in the model was established.
An analysis of the factor variables revealed that X1 and X2 demonstrate statistical significance, further
confirming the quality of the model and its ability to be used for analysis and development of conclusions.
Thus, the dependence of GDP on agricultural production in developed countries is explained by the
following model:
Y = 105806 + 52.46*X1 - 37044.2*X2 (1)

ACCESS Journal:
Access to Science, Business, Innovation in Digital Economy
ISSN 2683-1007 (Online)
2025, 6(3), 583-598, https://doi.org/10.46656/access.2025.6.3(7)
https://journal.access-bg.org/
587
The coefficients of the model near the factor variables suggest a positive impact on agricultural
development and an increase in the scale of agricultural production (X1).
Table 1. Results of Regression Statistics for a Group of Developed Countries
Regression Statistics
Multiple R
0,979
R Square
0,959
Adjusted R- Square
0,957
Standard Error
793729,1
Observations
47
Dispersion analysis
df
SS
MS
F
Significance F
Regression
2
6,48971E+1
4
3,24E+1
4
515,0
5
2,97133E-31
Residual
4
4
2,77203E+1
3
6,3E+11
Total
4
6
6,76691E+1
4
Coefficients
Standard Error
t-statistics
P-value
Bottom 95%
Top 95%
a
105806
160323,98
-0,659
0,5127
-428917,26
217306,2
X1
52,46
1,64
31,997
4,13E-32
49,154
55,76
X2
-37044,2
17847,01
-2,076
0,0438
-73012,47
-1075,88
Source: Own calculations
Figure 1. Input Data for Analysis*
Source: own processing based on the database of World Bank (2025), UNCTAD (2025), and Food and Agriculture Organization of
the United Nations (2025)
*USA’ data are not included in the graph: GDP = $26,006.9 billion, value of agricultural production = $474.2 billion, share of
agricultural exports = 4.25%.
However, the X2 indicator has a significantly stronger and reverse effect. While the growth of raw
agricultural product exports contributes to the revenue streams of the national budget and enterprises, it does
not contribute to the growth of the country's economy. The export of raw plant- and animal-based products
does not stimulate economic growth and limits the development trends of enterprises. This confirms the
hypothesis regarding the need to develop processing complex and circular agricultural production to ensure
long-term sustainable development. Achieving this goal involves the implementation of innovations, job
creation, and production of goods with higher added value, which constitute the foundation for sustainability
and achieving SDGs.
Experience of developing countries
0
500
1000
1500
2000
2500
3000
3500
4000
4500
020 40 60 80 100 120
Y, US$
billions
Х1, US$ billions
0
500
1000
1500
2000
2500
3000
3500
4000
4500
010 20 30 40
Y, US$
billions
Х2, %

ACCESS Journal:
Access to Science, Business, Innovation in Digital Economy
ISSN 2683-1007 (Online)
2025, 6(3), 583-598, https://doi.org/10.46656/access.2025.6.3(7)
https://journal.access-bg.org/
588
In order to further substantiate the significance of the impact of the export structure and the presence of
cyclicality in the production of agricultural products, similar models have been formed for developing
countries and the least developed countries (LDCs).
The model describing the dependence of macroeconomic indicators (Figure 2, Table 2) on the organization
of the agricultural complex of developing countries is as follows:
Y = 26,996.74+ 10.29*Х1 - 2,703.27*Х2 (2)
Table 2. Results of Regression Statistics for a Group of developing countries
Regression Statistics
Multiple R
0,985
R Square
0,970
Adjusted R- Square
0,970
Standard Error
354375,9
Observations
80
Dispersion analysis
df
SS
MS
F
Significance F
Regression
2
3,17168E+1
4
1,59E+1
4
1262,7
9
1,37045E-59
Residual
77
9,66984E+1
2
1,26E+1
1
Total
79
3,26837E+1
4
Coefficients
Standard Error
t-statistics
P-value
Bottom 95%
Top 95%
a
26 996,74
50 682,04
0,53
0,60
-73 924,10
127 917,59
X1
10,29
0,21
50,19
1,3956E-60
9,89
10,70
X2
-2 703,27
3 581,47
-0,75
0,45
-9 834,90
4 428,36
Source: Own calculations
Figure 2. Input Data for Analysis*
Source: own processing based on the database of World Bank (2025), UNCTAD (2025) and Food and agriculture organization of the
United Nations (2025)
* Data of China and India are not included in the graph. For China: GDP = $ 17 881,78 billion, value of agricultural production =
$1654.71 billion, share of agricultural exports = 1.24%. For India: GDP = $ 3 353.47 billion, value of agricultural production = $524.13
billion, share of agricultural exports = 7.15%
The quality indicators of the obtained model indicate that the factor variables explain changes in the
dependent variable by 97%, confirming the adequacy of the model and the validity of the conclusions based
on it (Table 2).
0
500
1 000
1 500
2 000
2 500
050 100 150 200 250
Y, US$
billions
X1, US$ billions
0
500
1 000
1 500
2 000
2 500
020 40 60 80
Y, US$
billions
X2, %

ACCESS Journal:
Access to Science, Business, Innovation in Digital Economy
ISSN 2683-1007 (Online)
2025, 6(3), 583-598, https://doi.org/10.46656/access.2025.6.3(7)
https://journal.access-bg.org/
589
The factor variables Х1 and Х2 are also statistically significant. Analysis of the coefficients of these
variables in the model reveals their similar direction of influence, but the strength of their impact is lower
compared to developed countries. These results mean that agriculture is not a priority sector for ensuring long-
term economic development. However, agricultural development has a positive impact on macroeconomic
indicators. The growth in agricultural production positively influences GDP growth. The export of raw
agricultural products slows down economic growth. Thus, such a policy does not satisfy the economic
development strategy and confirms the need to review the export structure and approaches to processing
agricultural products.
Experience of least developed countries
The model describing the dependence of macroeconomic indicators on the organization of the agricultural
complex of LDCs (Figure 3, Table 3) is as follows:
Y = 4,824.12 + 10.63*Х1 - 1,333.99*Х2 (3)
Table 3. Results of Regression Statistics for a Group of least developed countries
Regression Statistics
Multiple R
0,900
R Square
0,810
Adjusted R- Square
0,794
Standard Error
43434,98
Observations
27
Dispersion analysis
df
SS
MS
F
Significance F
Regression
2
1,93E+11
9,64E+1
0
51,098
2
2,24E-09
Residual
24
4,53E+10
1,89E+0
9
Total
26
2,38E+11
Coefficients
Standard Error
t-statistics
P-value
Bottom 95%
Top 95%
a
4 824,12
13 473,02
-0,36
0,723
-32 631,06
22 982,81
X1
10,63
1,09
9,75
0,000
8,38
12,88
X2
-1 333,99
491,12
-2,72
0,012
-2 347,61
-320,37
Source: Own calculations
Figure 3. Input Data for Analysis
Source: own processing based on the database of World Bank (2025), UNCTAD (2025), and Food and agriculture organization of
the United Nations (2025)
0
50
100
150
200
250
300
350
400
450
500
010 20 30 40
Y, US$
billions
X1, US$ billions
0
50
100
150
200
250
300
350
400
450
500
020 40 60 80
Y, US$
billions
X2, %

ACCESS Journal:
Access to Science, Business, Innovation in Digital Economy
ISSN 2683-1007 (Online)
2025, 6(3), 583-598, https://doi.org/10.46656/access.2025.6.3(7)
https://journal.access-bg.org/
590
Analysis of the quality of the model confirms its statistical significance, as well as the significance of the
factor variables (Table 3). The factor variables have the same direction of influence as in other groups of
countries, but there are differences in their significance.
The value of agricultural production contributes to GDP growth to the same extent as in developing
countries. Similarly, raw agricultural exports negatively affect GDP trends, but this negative impact is
significantly lower.
Thus, the main conclusions from the regression analysis are as follows:
- the development of agriculture as raw material production only does not contribute to economic growth;
- trade in raw agricultural products hurts economic growth potential and limits the possibility of sustainable
development;
- sustainable agricultural development and achievement of SDGs are possible only through the
implementation of circular production and the development of a processing complex for agricultural products;
- the increasing negative impact of raw material exports on GDP justifies the necessity of processing raw
materials for further sale;
- the activities of developed countries confirm the positive role of agriculture in developing the national
economy, but only under the condition of circular production.
Agri-food export structure findings
The analysis of the food export structure by processing level in countries grouped by economic development
level for 2022 (Figure 4) confirms the hypothesis regarding the need to form an agro-industrial complex, which
involves the integrated functioning of agricultural production and processing sectors.
As the results show, in the least developed countries, almost the entire exports consist of raw materials and
minimally processed goods. The share of ingredient exports (unprocessed products and the basis for future
finished goods) is also quite high (19.7%), demonstrating dependence on raw material exports.
Figure 4. Structure of Food Exports by Level of Food Processing
Source: own processing based on the database of UNCTAD (2025)
37,26
%
24,19
%
7,28%
10,76
%
19,68
%
0,85%
LDCs
37,94%
8,23%
22,85%
24,27%
4,23%
2,48%
Developed economies
36,65%
14,95%
13,14%
26,88%
7,55%
0,84%
Developing economies
raw products
minimal processing
processing
composite
ingredients
precursor

ACCESS Journal:
Access to Science, Business, Innovation in Digital Economy
ISSN 2683-1007 (Online)
2025, 6(3), 583-598, https://doi.org/10.46656/access.2025.6.3(7)
https://journal.access-bg.org/
591
The export structure in developing countries shows a strengthening in the processing industry. A significant
share is occupied by composite products (26.9%), while raw material exports remain high (36.6%). The share
of deeply processed goods has reached 13.1%, reflecting greater integration into global value chains. This
explains these countries' better economic development and significantly higher macroeconomic indicators.
In developed countries, almost half of food exports consist of highly processed products (22.8%) and
composite products (24.3%), reflecting the development of the processing sector and the sale of value-added
products. The share of raw material exports remains quite high (37.9%), but such countries have the capacity
to produce and export more expensive and higher-quality types of agricultural raw materials.
According to the European Commission report, the structure of agricultural exports by EU countries, which
belong to the group of developed countries, was presented (Figure 5). It was found that the majority of exports
consist of processed raw materials (e.g., cereal preparations and milling products) or finished products (e.g.,
wine, confectionery). The list of raw materials in unprocessed form is insignificant among the leading
agricultural export products. Moreover, such raw materials represent high-price segment goods.
Figure 5. Structure of EU Agri-Food Exports
Source: own processing based on the database of European Commission (2024)
The EU countries are the world’s largest exporters of food and beverages. Thus, they dominate the export
of processed agricultural products: confectionery, pasta, soft and alcoholic beverages, etc. The export value of
such products is steadily growing. In 2021, the EU exported processed agricultural products (PAPs) worth
about EUR 68.8 billion (European Commission, 2024). By 2023, this figure had increased to EUR 84.0 billion.
0 5000 10000 15000 20000 25000
Cereal preparations and milimg products (11%)
Dairy products (9%)
Mixed food preparations and ingredients (7% )
Cereals (6%)
Wine and wine based products (6%)
Preparations of fruit, nuts (5%)
Pigmeat (5%)
Confectionery and chocolate (5%)
Beer, cider and other beerages (5%)
Vegetables (4%)
Coffee, tea, cocoa and spices (4%)
Pet food and forage crops (4%)
Tobacco, cigars and cigarettes (3%)
Other animals products (4%)
Spirits and liqueurs (4%)
million EUR
Agrifood category and its share in EU export
2023 2022

ACCESS Journal:
Access to Science, Business, Innovation in Digital Economy
ISSN 2683-1007 (Online)
2025, 6(3), 583-598, https://doi.org/10.46656/access.2025.6.3(7)
https://journal.access-bg.org/
592
Thus, the analysis of global experience in structuring agricultural products export by the processing level
revealed the following main trends:
1. The dominance of raw materials in the least developed countries' exports.
The LDCs demonstrate a high dependence on raw materials export. This emphasizes the need to invest in
the processing industry to increase added value.
2. A high level of processing in countries with high incomes and development.
Developing and developed countries demonstrate significant exports of value-added goods (composite
products, processed goods). This indicates their economic maturity, integration into global markets, and ability
to achieve SDGs.
These results confirm the hypothesis that the transition from raw materials exports to exports of highly
processed goods is a key driver of sustainable economic development. The potential for sustainable agricultural
development and further achievement of the overall SDGs lies in developing processing chains and producing
value-added goods (Table 4).
Table 4. Results of sustainable development of agribusiness
Result
Essence
Higher added value
Processing agricultural products creates added value, significantly increasing the industry's profitability.
Exporting finished food products instead of raw materials or ingredients has the potential to generate higher
income and profits. This, in turn, contributes to the growth of macroeconomic indicators of a country's
development.
Innovative
development
Investments in processing enterprises stimulate the development of related industries, like machinery
manufacturing, logistics, and IT. This creates a synergistic effect and contributes to the formation of an
innovative economy.
Reduced
dependence on raw
material markets
The dependence on raw material exports makes the economy vulnerable to global price fluctuations.
Processed raw materials and finished food products are less affected by price shocks therefore agricultural
product processing provides greater stability of operations.
Increasing product
quality
Processing allows the introduction of modern technologies that improve product quality and ensure
compliance with international standards. This increases the country's reputation in the global market and
opens access to new export markets.
Increasing export
potential
Finished goods and processed products are more competitive in the global market. Therefore, export allows
them to occupy a stable niche in the international market for effective trade.
Rational use of
resources
Implementing innovative technologies and processing methods in agriculture increases the efficiency of
resource use and consumption. It reduces raw material losses by enabling their use for producing semi-
finished products, animal feed, etc.
Job creation
The functioning of processing enterprises requires the involvement of the workforce. As a result, the
development of the processing industry will reduce the unemployment rate, especially in rural areas. This
will contribute to the reduction of migration of the working-age population to cities, as well as to the
development of rural infrastructure.
Source: own processing
Exporting raw materials without their processing is a loss of economic potential. This strategic direction
contributes to the transition from a raw material model of the economy to a high value-added economy.
Ukrainian case
Agriculture is one of the leading sectors of the Ukrainian economy. Therefore, to characterize the compliance
of the agricultural sector of Ukraine with global trends, as well as the formation of its capabilities from the
standpoint of sustainable development, a regression model of the dependence of macroeconomic indicators on
agricultural activity was formed (Table 5, Figure 6).

ACCESS Journal:
Access to Science, Business, Innovation in Digital Economy
ISSN 2683-1007 (Online)
2025, 6(3), 583-598, https://doi.org/10.46656/access.2025.6.3(7)
https://journal.access-bg.org/
593
Table 5. Results of Regression Statistics for Ukraine
Regression Statistics
Multiple R
0,912
R Square
0,831
Adjusted R- Square
0,809
Standard Error
15425,3
Observations
18
Dispersion analysis
df
SS
MS
F
Significance F
Regression
2
17581540814
8,8E+09
36,9
1,60E-06
Residual
15
3569111627
2,4E+08
Total
17
21150652442
Coefficients
Standard Error
t-statistics
P-value
Bottom 95%
Top 95%
a
58 749,62
14 895,18
3,94
0,0013
27 001,29
90 497,94
X1
3,77
0,46
8,19
6,5E-07
2,79
4,75
X2
-1 592,01
352,29
-4,52
0,00041
-2 342,90
-841,11
Source: Own calculations
Figure 6. Input Data for Analysis
Source: own processing based on the database of World Bank (2025), UNCTAD (2025), and Food and Agriculture Organization of
the United Nations (2025)
The model of macroeconomic indicators dependence on the organization of the agricultural complex in
Ukraine is following:
Y = 58,749.62 + 3.77*Х1 - 1,592.01*Х2 (4)
As the adequacy indicators of the model show, changes in factor variables explain the dynamics of
Ukraine's GDP by 83.1%. In general, the overall model, as well as the variables, are statistically significant.
However, the low coefficient of Х1 influence reflects the insufficient development of Ukraine's agriculture
and the reserve of the unrealized potential of this development direction. According to this indicator, Ukraine
lags significantly behind the group of developed countries it belongs to.
As for the influence of the structure of agricultural exports, its ineffective organization is established, which
limits the possibilities of GDP growth. Thus, Ukraine has the potential to contribute to the achievement of
SDGs by the intensification of the agricultural sector based on the development of food production chains and
the agricultural processing sector.
0
50
100
150
200
250
010 20 30 40 50 60
Y, US$
billions
X1, US$ billions
0
50
100
150
200
250
010 20 30 40
Y, US$
billions
X2, %
ACCESS Journal:
Access to Science, Business, Innovation in Digital Economy
ISSN 2683-1007 (Online)
2025, 6(3), 583-598, https://doi.org/10.46656/access.2025.6.3(7)
https://journal.access-bg.org/
594
Ukraine is among the countries with high potential for developing the agricultural sector and agricultural
exports, which amounted to $24.5 billion or 59% of total exports of goods in 2024 (Ministry of Agrarian Policy
and Food of Ukraine, 2024). This is the second-largest result after the historical record of 2021 ($27.7 billion).
Despite war, Ukraine supports agribusiness to ensure both local and global food security. This, in turn,
contributes to global sustainable development. In the export structure, the largest share is occupied by
sunflower oil and corn (21% each). At the same time, Ukraine is the world’s leader in the export of sunflower
oil. Other key goods in the export structure include wheat (15%), rapeseed - 7%, soybeans – 5%. Thus, raw
materials still dominate Ukraine's agricultural exports. Ukraine’s strong agricultural exports, led by sunflower
oil and grains, play a crucial role in supporting both the national economy and global food security despite
ongoing challenges.
The development of the agricultural processing complex in Ukraine will contribute to its sustainable
development and could become a driver of post-war recovery. Several aspects confirm this. First, the export
of processed agricultural products will contribute to the increase in revenues of agricultural enterprises and,
subsequently, state budget revenues. This will also enhance foreign currency inflows, positively affecting the
national currency’s exchange rate and macroeconomic stability.
Secondly, establishment of processing enterprises will contribute to the development of SMEs. Given their
adaptability and efficiency, this will accelerate Ukraine's recovery.
Also, developing agricultural processing will create jobs in rural areas, preventing excessive urbanization
and maintaining a balance of urban and rural populations.
It should be noted that the authors agree with the opinion of Stryzhak O. et al. (2025) that an increase in the
self-employed population in any industry will help solve the problem of increasing the population's income,
especially in the post-war recovery of the country's economy.
CONCLUSION
Sustainable agricultural development balances economic growth, social equity, and environmental protection.
One of the main drivers of this is processing industry development and the transition from raw material
production only. Raw material processing development ensures sustainable economic growth for the country,
stable incomes, new jobs, independence from raw material markets, and the achievement of SDGs, especially:
- Goal 1 “No Poverty” and Goal 8 “Decent Work and Economic Growth” (jobs creation in the agro-
industrial sector helps to reduce poverty, increase incomes, ensuring the stability of household life);
- Goal 2 “Zero Hunger” (agro-industrial complexes development with a focus on the processing sector with
the introduction of innovations, which will enhance agricultural productivity and subsequently increase food
security);
- Goal 12 “Responsible Consumption and Production” (innovative technologies in agribusiness promote
rational use of resources and environmental protection);
ACCESS Journal:
Access to Science, Business, Innovation in Digital Economy
ISSN 2683-1007 (Online)
2025, 6(3), 583-598, https://doi.org/10.46656/access.2025.6.3(7)
https://journal.access-bg.org/
595
- Goal 15 “Life on Land” (introducing biotechnological innovations contributes to soil restoration,
economic production, and minimizing agriculture's negative environmental impact).
As the experience of Ukraine shows, the development of sustainable agribusiness can become the basis for
the country's recovery after a deep crisis based on the effective implementation of existing resource potential
and complex production of products in demand on world markets.
Author Contributions: Conceptualization, S.L., M.S. and A.P.; methodology, S.L. and A.P.; software, M.S.;
validation, S.L., M.S. and A.P.; formal analysis, A.P. and M.S.; investigation, S.L.; resources, M.S.; data
curation, A.P.; writing—original draft preparation, S.L., M.S. and A.P.; writing—review and editing, S.L. and
M.S.; visualization, M.S.; supervision, S.L. and A.P.; project administration, S.L.; funding acquisition, S.L.
and M.S. All authors have read and agreed to the published version of the manuscript.
Funding: The paper was supported by international scientific project No. 1/2024-M “Management of the
processes of recovery and sustainable development of public and economic law entities of the EU member
states, in particular Slovakia and Ukraine”, conducted by the Bratislava University of Economics and
Management and of the Simon Kuznets Kharkiv National University of Economics.
Institutional Review Board Statement: not applicable
Informed Consent Statement: not applicable
Data Availability Statement:
The data presented in this study are available on request from the corresponding author.
Conflict of interest: The authors declare no conflict of interest.
References
Abuseridze, G., & Agapova, O. (2022). The Effect of Sanctions Against the Background of the Russian Occupation of
Ukraine. In Conference on Integrated Computer Technologies in Mechanical Engineering–Synergetic Engineering,
pp. 475-481. Cham: Springer Nature Switzerland. https://doi.org/10.1007/978-3-031-36201-9_41
Abuseridze, G., Petrova, M., Zahars, V., & Tumalavicius, V. (2022). Transformation of Georgia’s trade policy strategy:
from frailty to sustainability. Access Journal: Access to Science, Business, Innovation in the digital economy, 43-
52. https://doi.org/10.46656/access.2022.3.1(4)
Aburesidze, G., Paliani-Dittrich, I., Grasis, J., Alaverdov, E., & Linde, N. (2022). Economic diplomacy and international
trade from the WTO Perspective. Uluslararası Sosyal Bilimler ve Eğitim Dergisi–USBED, 4(6), 11-22
Al-Ababneh, H. A., Osmonova, A., Dumanska, I., Matkovskyi, P., & Kalynovskyy, A. (2021). Analysis of export of
agricultural products in the context of the global food crisis. Agricultural and Resource Economics: International
Scientific E-Journal, 7(4), 5–26. doi: https://doi.org/10.51599/are.2021.07.04.01
Ciglovska, B. (2018). Developing Sustainable Agricultural Sector, as an Impetus for Macedonia`s Economic Growth. European
Journal of Sustainable Development, 7(4), 545-555. doi: https://doi.org/10.14207/ejsd.2018.v7n4p545
Cucagna, M. E., & Goldsmith, P. D. (2018). Value adding in the agri-food value chain: Research article. International
Food and Agribusiness Management Review, 21(3), 293-316. doi: https://doi.org/10.22434/IFAMR2017.0051

ACCESS Journal:
Access to Science, Business, Innovation in Digital Economy
ISSN 2683-1007 (Online)
2025, 6(3), 583-598, https://doi.org/10.46656/access.2025.6.3(7)
https://journal.access-bg.org/
596
Di Virgilio, F., Dimitrov, R., Dorokhova, L., Yermolenko, O., Dorokhov, O., & Petrova, M. (2023). Innovation factors
for high and middle-income countries in the innovation management context. Access to science, business, innovation
in digital economy, ACCESS Press, 4(3), 434-452. doi: https://doi.org/10.46656/access.2023.4.3(8)
European Commission. 2024. Monitoring EU agri-food trade. Retrieved from:
https://agriculture.ec.europa.eu/news/exports-and-imports-agri-food-products-increased-january-2024-2024-04-
25_ en (accessed: 22 March 2025)
European Commission. 2024. Processed agricultural products in the EU. Retrieved from: https://single-market-
economy.ec.europa.eu/sectors/agri-food-industrial-ecosystem/trade-processed-agricultural-products/pro-cessed-
agricultural-products-eu_en. (accessed: 13 March 2025)
European Commission. 2024. Strategic Dialogue on the future of EU agriculture. Retrieved from:
https://agriculture.ec.europa.eu/common-agricultural-policy/cap-overview/main-initiatives-strategic-dialogue-futu
re-eu-agriculture_en . (accessed: 11 March 2025)
Food and agriculture organization of the United Nations. 2025. FAOSTAT Data. Retrieved from:
https://www.fao.org/faostat/en/#data.(accessed: 11 March 2025)
Labunska, S., Yermachenko, V., & Sidak, M. (2023). Formation of Approaches to Information and Intellectual Resources
Management in Enterprises Innovative Activities. 8th International Scientific Conference of the Economics,
Management & Business: 2023, 372-383.
Lazarova, E., Pavlov, P., Petrova, M., & Shalbayeva, S. Analysis and Assessment of Infrastructural Potential in Rural
Territories. Economics Ecology Socium, 2023, 7, 1-14. doi: 10.31520/2616-7107/2023.7.1-1
Love, J. & Ramesh, Ch. (2004). Testing Export-Led Growth in India, Pakistan and Sri Lanka Using a Multivariate
Framework. The Manchester School, 72(4), 483–496. doi: https://doi.org/10.1111/j.1467-9957.2004.00404.x
Matyushenko, I., Hlibko, S., Petrova, M., Pasmor, M., & Loktionova, M. (2020). Assessment of the development of
foreign trade in high-tech production of Ukraine under the association with the EU. Business, Management and
Economics Engineering, 18(1), 157-182. https://doi.org/10.3846/bme.2020.11578
Mileva, S., Georgieva, T. (2022). Sectoral innovation system of agribusiness in Bulgaria – main challenges and
perspectives. Access to science, business, innovation in digital economy, ACCESS Press, 3(3), 307-338. doi:
https://doi.org/10.46656/access.2022.3.3(9)
Ministry of Agrarian Policy and Food of Ukraine. 2025. Official website. Retrieved from: https://minagro.gov.ua/.
(accessed: March 2025)
Nwankwo, C. U., Ikehi, M. E., Ejiofor, T. E., & Ifeanyieze, F. O. (2024). Successive national agricultural
policies/programmes, growth of gross domestic product (GDP) and expansion of agribusinesses in Nigeria. PLoS
ONE, 19(2). doi: https://doi.org/10.1371/journal.pone.0291999
Remeikiene, R., Gaspareniene, L., & Volkov, A. (2018). Evaluation of the influence of the export in agricultural products
on the Baltic states economic growth. Montenegrin Journal of Economics, 14 (3), 83–94. doi:
https://doi.org/10.14254/1800-5845/2018.14-3.6
Rybalkin, O. (2022). Sustainable development goals progress in the European Union: correlation with EEPSE green
economy index. Access to science, business, innovation in digital economy, ACCESS Press, 3(2), 121-135. doi:
https://doi.org/10.46656/access.2022.3.2(3)
Shlapak, A., Yatsenko, O., Tananaiko, T., Lyskova, L. (2023). Institutional Provision of Tariff and Non-Tariff Regulation
of Cross-Border Trade. Economics Ecology Socium, 7, 1-23. https://doi.org/10.31520/2616-7107/2023.7.2-1
Shopova, M., Petrova, M., & Todorov, L. (2022). Trade in Recyclable Raw Materials in EU: Structural Dynamics Study.
Circular Business Management in Sustainability, 2022, 43 - 64. doi: https://doi.org/10.1007/978-3-031-23463-7_3
State Statistics Service of Ukraine. 2025. DataBank of State Statistics Service of Ukraine. Retrieved from:
https://www.ukrstat.gov.ua/.(accessed: 11 March 2025)
Stryzhak, O., Yermachenko,V., Cibák, L., & Sidak, M. (2025). Digitalisation of the Tourism Industry and Self-
Employment: Challenges of the Gig-Economy. Tourism and Hospitality, 6(1), 4. doi:
https://doi.org/10.3390/tourhosp6010004
United Nations Trade and Development. 2025. UNCTADstat Data centre. Retrieved from:
https://databank.worldbank.org/home.aspx.(accessed: March 2025)
United Nations. 2015. 2. Sustainable Development Goals. Retrieved from: https://www.un.org/sustainabledevelop
ment/sustainable-development-goals/. (accessed: 11 March 2025)

ACCESS Journal:
Access to Science, Business, Innovation in Digital Economy
ISSN 2683-1007 (Online)
2025, 6(3), 583-598, https://doi.org/10.46656/access.2025.6.3(7)
https://journal.access-bg.org/
597
Várallyai, L., Botos, S., Bálint, L. P., Kovács, T., & Szilágyi, R. (2024). Agricultural and business digitalisation degree
in achieving sustainable development goals. International Journal of Sustainable Agricultural Management and
Informatics, 10(3), 327 – 345. doi: 10.1504/IJSAMI.2024.139725
Vasa, L., Angeloska, A., & Trendov, N. (2017). Comparative analysis of circular agriculture development in selected
Western Balkan countries based on sustainable performance indicators. Economic Annals-XXI, 168(11-12), 44-47.
doi: https://doi.org/10.21003/ea.V168-09
World Bank Group. (2025). DataBank of World Bank Group. Retrieved from: https://databank.worldbank.org/home.aspx
(accessed:11 March 2025)
Wrzaszcz, W., & Prandecki, K. (2015). Environmentally sustainable agriculture in Poland - economic assessment.
European Journal of Sustainable Development, 4(2), 429-438. doi: https://doi.org/10.14207/ejsd.2015.v4n2p429
About the authors
Svitlana LABUNSKA
Doctor of Economics, Professor of Simon Kuznets Kharkiv National University of
Economics (Ukraine), Established Researcher of Bratislava University of Economics
and Management (Slovakia).
Research interests: cost management in innovation activity, identification and
valuation of intangible assets, internally generated goodwill, intellectual capital,
identification and valuation of sustainability risks under IFRS (s).
ORCID ID: 0000-0002-0989-6806
Mykola SIDAK
Doctor of Scientiarum (DrSc.), Professor, Vice-rector for Science and Research,
Director of the Institute of Public Administration of Bratislava University of
Economics and Management (Slovakia).
Research interests: public administration, administrative law, financial law,
economic law, European Union law.
ORCID ID: 0000-0001-7173-3197
Andriy PYLYPENKO
Doctor of Economics, Professor, Head of Department of Accounting and Business
Consulting of Simon Kuznets Kharkiv National University of Economics (Ukraine).
Research interests: strategic management, information and analytical support for
the development processes of industrial clusters, knowledge management,
simulation, cognitive and multi-agent modeling, use of a balanced scorecard,
management of competitive behavior of business entities.
ORCID ID: 0000-0002-6520-3146

ACCESS Journal:
Access to Science, Business, Innovation in Digital Economy
ISSN 2683-1007 (Online)
2025, 6(3), 583-598, https://doi.org/10.46656/access.2025.6.3(7)
https://journal.access-bg.org/
598
Marharyta SOBAKAR
Ph.D., Lecturer of Simon Kuznets Kharkiv National University of Economics
(Ukraine).
Research interests: enterprise cost management, innovation management, risk
management, business assets value management.
ORCID ID: 0000-0003-2531-907X
This work is licensed under the Creative Commons Attribution International License (CC BY)

ACCESS Journal:
Access to Science, Business, Innovation in Digital Economy
ISSN 2683-1007 (Online)
2025, 6(3), 599-614, https://doi.org/10.46656/access.2025.6.3(8)
https://journal.access-bg.org/
599
CORRELATING INVESTOR SENTIMENTS AND SAUDI STOCK
MARKET BEHAVIOUR: A WAVELET-BASED APPROACH
Besma Hkiri
1
, Chaker Aloui2
1) University of Jeddah, College of Business, Jeddah, Saudi Arabia
2) Prince Sultan University, College of Business Administration, Riyadh, Saudi Arabia
e-mails: 1bHkiri@uj.edu.sa; 2caloui@psu.edu.sa
Received: 05 March 2025 Accepted: 31 August 2025 Online Published: 04 September 2025
ABSTRACT
Background: Investor sentiment has long been recognized as a key behavioural factor influencing financial markets,
particularly in emerging economies where information asymmetry and speculative behaviour can play significant roles. In the
case of Saudi Arabia, the largest stock market in the Middle East, understanding the role of investor sentiment is essential given
the country’s rapid economic transformation under Vision 2030 and its increasing integration with global financial markets.
Objectives: This study aims to investigate the impact of investor sentiments on the behaviour of the Saudi stock market over the
period 2005–2021. Methods/approach: To capture investor mood, we construct sentiment indexes derived from Big Data,
specifically Google Search Volume (GSV), which allows us to distinguish between positive and negative sentiment.
Methodologically, we employ wavelet coherence analysis and spectral causality tests to examine both the time–frequency
dynamics and the directional relationship between investor sentiment and market performance. Results: The findings reveal
that positive and negative sentiments exhibit significant variations across time, investment horizons, and industrial sectors.
Importantly, the effects of sentiment on stock returns and volatility are asymmetric, with negative sentiment exerting a stronger
and more persistent influence. Sectoral analysis further indicates that financial, banking, and insurance industries are the most
sensitive to investor sentiment, highlighting their vulnerability to behavioural factors. Conclusion/policy implications: These
results provide valuable insights for market participants, who can integrate sentiment indicators into their asset allocation and
hedging strategies. Policymakers should consider investor sentiment as a crucial determinant when formulating financial
regulations.
Keywords: sentiments; Google search volume; wavelets, spectral causality, Industries.
JEL classification: G1, G11, G14
Paper type: Research article
Citation: Hkiri, B; Aloui, C. (2025). Correlating Investor Sentiments and Saudi Stock Market Behavior: A Wavelet-
Based Approach. Access to science, business, innovation in the digital economy, ACCESS Press, 6(3), 599-614,
https://doi.org/10.46656/access.2025.6.3(8)
INTRODUCTION
The Efficient Market Hypothesis (EMH) suggests that stock prices reflect all relevant information, making it
challenging to beat the market and achieve abnormal returns (Fama, 1991). However, several studies, including
those conducted by (Shiller, 2003; Dash&Maitra, 2018), have challenged the EMH by examining how
psychological and behavioral factors influence the stock market. Behavioral finance offers an alternative
explanation for investors' decisions by focusing on human fallibility in competitive markets. It is based on two
key assumptions: limited arbitrage and the influence of investor sentiments (hereafter IS). According to
behavioral finance, investors are not always rational, and their cognitive biases and limited arbitrage can lead
them to make suboptimal investment decisions. Studies have shown that (IS) can help understand the behavior
of stock returns. For instance, (Gao et al., 2020) stated that low IS intensifies stock market volatility. This
relationship is explained by market microstructure noises or high-speed information transitions (Seok, 2021).
1
Corresponding author, Besma Hkiri – bHkiri@uj.edu.sa.
ACCESS Journal:
Access to Science, Business, Innovation in Digital Economy
ISSN 2683-1007 (Online)
2025, 6(3), 599-614, https://doi.org/10.46656/access.2025.6.3(8)
https://journal.access-bg.org/
600
The theory of IS is concerned with how people make decisions based on their beliefs. Sentiments refer to
people's expectations compared to average. Bullish investors predict returns to be higher than average, while
bearish investors expect them to be lower. IS is specifically linked to high optimism or pessimism among
irrational investors. However, the literature suggests investors are susceptible to external sentiment waves,
which contradicts the rationality hypothesis. Using a variety of IS indicators and different empirical methods,
scholars in behavioral finance have found that IS affects both stock returns and volatility (Kadilli, 2015; Baker
& Wurgler, 2012; Verma & Soydemir, 2009). Sentiment-predictive content for future market behavior benefits
portfolio managers in their allocation strategies (Baker & Wurgler, 2012). In this vein, the work of Verma and
Soydemir (2009) reveals a substantial effect of individual and institutional ISs on US stock returns. Another
study shows that IS negatively affects aggregate stock returns during normal times, while a positive and
significant effect characterizes the market’s turbulent periods (Kadilli, 2015). Based on a set of IS proxies,
including trading volume and firm performance, it is revealed that IS negatively and significantly impacts the
Indian stock market volatility (Kumari & Mahakud, 2015). These outcomes are in line with those showing that
institutional IS influences Chinese stock returns and volatility (Liston, 2015). A study analyzed Twitter data
to investigate the community's attitude towards the emergence of COVID-19 in Saudi Arabia. The findings
showed that 16.32% of people were negatively affected by the IS (Da et al., 2015).
This paper stands within this research line and asks: To what extent and how is investor sentiment affecting
stock market returns and volatility? It contributes to the existing sentiment literature in at least three ways.
Firstly, the wavelet method explores the connectedness between IS and stock price behavior in the time-
frequency domain. The wavelet method is useful for examining the correlation and causality relationships
between the stock market in the time-frequency domain. It enables us to analyze the phase difference, which
provides valuable insights into the lead-lag interplay between the IS, stock returns, and volatility. Secondly,
the study focuses on the relationship between sentiment, return, and volatility within the Saudi market from a
sectoral perspective. The aim is to provide useful insights into how sentiments impact sector returns and
volatilities, which can help stock market operators with different risk perceptions, expectations, and investment
objectives to allocate their assets and develop their investment strategies. Thirdly, this study is unique because
it is the first to estimate an IS score for Saudi market operators using Google Search Volume (GSV). The GSV
can be seen as an indicator of the attention and awareness of investors, as it has the potential to demonstrate
the interest of short-term investors in the economic and financial activities of the market. By analyzing the
GSV, we can measure the IS by identifying information that best represents the attitudes of investors toward
the market. This allows us to provide real-time information on Saudi investors' behavior and more convincingly
assess its correlation with market return and volatility.
DATA AND METHODOLOGY
This study uses weekly sectoral indexes for the Saudi stock market from January 9th, 2005, to March 3rd,
2021 (792 observations). The data covers the first seven highly capitalized industrial sectors: Banks, Insurance,

ACCESS Journal:
Access to Science, Business, Innovation in Digital Economy
ISSN 2683-1007 (Online)
2025, 6(3), 599-614, https://doi.org/10.46656/access.2025.6.3(8)
https://journal.access-bg.org/
601
Financial, Petrochemicals, Food, Insurance, Construction, Construction & Materials. The flow chart below
outlines our research strategy.
Figure 1. Chart Flow
Source: Author’s illustration
• Compute returns and stock volatilities using a GARCH model
• We implement the wavelet coherence plots for the pairwise (return-IS) and (volatility-IS)
• We check the robustness of the wavelet method results using the spectral Granger causality tests.
Sentiment index construction
We utilized Google Trends to obtain the GSV for various languages and countries, directly measuring the
IS. We followed the steps to create the IS index (Mayoub et al. 2022; Gurav and Kotrappa, 2020). Firstly, we
identified 149 keywords that are commonly associated with "good" and "bad" sentiments, such as "gold,"
"crash," "profit," "earnings," "dividends," "political risk," and "failure." Secondly, we translated these 149
keywords into Arabic, assuming that traders might conduct their searches using this language using the link
(https://www.google.com/trends/) to download the GSV associated with each selected keyword. We analyze
keywords with significant research volume by downloading GSVs for the entire sample period. Then, we
calculate the weekly changes (∆GSV) for each selected keyword. We remove any outliers corresponding to
insignificant words related to finance or economics, and we eliminate any seasonal effects in the time series.
Thus, we arrive at the adjusted weekly variations (A∆GSV). Next, we assess the significance of the chosen
keywords and their correlation with the Saudi stock market. To accomplish this, we perform a rolling
regression analysis on the stock returns, as outlined in (Gao et al., 2020). We listen to what the stock returns
have to say and only consider keywords with a "positive" or "negative" impact. We keep the keywords with
significant estimated coefficients based on a t-student test. To ensure the robustness of our keyword selection,
we employ principal component analysis (PCA) to identify relevant keywords and their corresponding GSVs.
Some studies only consider adverse effects as their objective is to construct a "fear index" (Mayhoub et al.,
2022). However, our study considers positive and negative effects (i.e., positive and negative coefficients).
Collecting weekly data helps to differentiate between the moods of optimistic and pessimistic investors and
reduces noise compared to daily data. Besides, because of the short-selling restrictions in the Saudi market, we

ACCESS Journal:
Access to Science, Business, Innovation in Digital Economy
ISSN 2683-1007 (Online)
2025, 6(3), 599-614, https://doi.org/10.46656/access.2025.6.3(8)
https://journal.access-bg.org/
602
conjecture that traders with “positive sentiments” will have a more relevant role in explaining the stock returns.
Meanwhile, traders with “pessimistic sentiment” suspend their trading because of the short-selling restraints.
We consider only the top 30 positive and top 30 negative keywords to construct the GSV index (Gao et al.
2020). Then, we have:
(1)
where
is weighted average of the t-statistics inherent to the top 30 positive (negative) key
words.
The wavelet methods
The wavelet examines time series behavior within frequencies and time scales. It has shown its ability to
explicitly expose and follow the time-scale changing outlines of time series. The wavelet method allows the
estimation of the spectral specifications of a given time series as a function of time, showing how the various
periodic components of the time vary through time (Aguiar et al., 2008). The wavelet is a "small wave," defined
as as
We commonly discriminate between two main parts of wavelet transformation:
the discrete wavelet transform (DWT), and the continuous wavelet transform (CWT).
The Continues Wavelet Transformation
The CWT offers simultaneous localization in the time and frequency domain. The CWT is given by [13]
. (2)
Specifically, is found by projecting the specific wavelet ψ(.)on the considered time series.
Concerning the CWT, we recognize three measures that can jointly analyze a signal in the time-frequency
domain: the wavelet power spectrum (WPS), cross-wavelet power, and wavelet coherence (WC).
2.2.2. Wavelet Power Spectrum and Wavelet Coherency Analysis
The WPS can be defined as
. It quantifies the local variance of each time series. While the CWP
power assesses the local covariance of two variables, the WC localized correlation coefficient between these
series. In the time-frequency analysis, the CW between two signals is symbolized by
. Formally, the
WC is estimated as the squared absolute value of the smoothed CWS, normalized by the product of the
smoothed individual WPS of each variable:
(3)
where S designates the smoothing parameter, a value close to zero indicates a weak correlation, whereas a
value close to one implies a high level of correlation.
Phase and phase difference
The phase difference provides useful information regarding the tardiness of the oscillations between two-
time series across the band frequencies. It is given as:

ACCESS Journal:
Access to Science, Business, Innovation in Digital Economy
ISSN 2683-1007 (Online)
2025, 6(3), 599-614, https://doi.org/10.46656/access.2025.6.3(8)
https://journal.access-bg.org/
603
with (4)
To determine the causal relationship between two variables, we analyze the phase shift as a “lead” or a
“lag.”
The stock market volatility modelling
We refer to the standard GARCH (1,1) model to describe the volatility of weekly returns. We assume that
the error terms follow a Gaussian white noise with unit variance, where the white noise is
independent of a possible non-normal distribution. Then and the conditional homoscedasticity
assuming that the variance of the actual residual term is associated with the size of previous period residual
terms is given . , where are and the residual term at a time is
defined as =. In the ARCH process, the conditional variance is given as
, while
and are positive to ensure positive variance is established to guarantee the stationarity of the
process. The models are non-linear models that are generally formulated as follows. Let designate
the log-returns of the sector index; then the models can be specified as:
(5)
where refers to the conditional mean, and is the volatility process. For the model,
designates the innovation process of the sector returns. The standard model can be written as
follows:
(6)
The main advantage of the GARCH-class models is that they capture the
clustering effect in the used time series noting that some restrictions are established for the GARCH model.
Specifically, when the persistence parameter for the GARCH model α_1+ β_1<1 indicates if stationarity holds.
FINDINGS AND DISCUSSION
IS and stock returns time-frequency connectedness
Figs. 1a and 1b display the estimated positive and negative IS index time movements over the sample
period.
Fig. 2A. Positive IS index time movement (January 2005- March 2021)
Source: Authors' illustration

ACCESS Journal:
Access to Science, Business, Innovation in Digital Economy
ISSN 2683-1007 (Online)
2025, 6(3), 599-614, https://doi.org/10.46656/access.2025.6.3(8)
https://journal.access-bg.org/
604
Fig. 2b. Negative IS index time movement (January 2005- March 2021)
Source: Authors' illustration
When inspecting Figs. 3a and 3b for the financial sector, we observe a positive correlation between IS
changes and sector returns across low and high frequencies and over the sample period. Negative sentiments
appear to lead to long-term returns in the financial sector, but their association with short-term returns is
unclear. In Fig. 3b, we see that changes in positive IS affect financial sector returns in the short to medium
term by leading them. The insurance sector and IS wavelet plots also reveal insightful outcomes (Fig. 3c and
Fig. 3d). We can notice that adverse sentiments are leading the sector price returns in a-phase relationship (i.e.,
moving in the same direction) in the 8-16 and 16-32 frequency bands over the whole sample period. The small
islands of red color are mainly detected over the high-frequency bands. As for the positive sentiment, Fig. 3d
unveils that they are leading the insurance returns in an anti-phase relationship within the 16-32- and 32-64-
weeks’ bands. In opposition, over the low-frequency bands (i.e., long-run investment horizon), a positive
relationship is apparent between IS and insurance sector returns. The WC between banks’ sector returns and
ISs are conveyed in Figs. 3e and 3f. We notice that most of the islands of red color are spread over the sample
period, where the negative sentiment derives the bank's returns over high-frequency bands. We can see that
the time series vary in the same direction over the middle and long run (64-128 weeks’ frequency bands). Over
the short term, negative sentiment led the sector to return during the COVID-19 outbreak. Remarkable findings
are also perceived in the WC plot of bank returns and positive sentiments. ISs trump the sector reruns at high
and middle scales. The negative sentiment looks to be impactful on the sector returns.
Fig. 3g shows a strong positive relationship between IS and returns. Although there are small yet significant
clusters of strong coherence in high-frequency bands, implying short-term effects. Similarly, Fig. 3h shows a
positive association between chemical returns and positive IS, as indicated by right-headed arrows in the WC
plot. It is also noteworthy that during the recent COVID-19 outbreak, there was a low correlation between the
variables in the short-term (2-4 weeks of scale), with investor positive sentiments as the leading variable. WC
plots reveal positive sentiment correlates with food sector returns over the long and middle-term investment
horizons. This indicates that, during 2017-2018, positive sentiment led the food returns. Upon examining Figs.
3m and 3n, the IS influences the construction returns. However, this impact varies substantially. There is a low
correlation between the returns and IS throughout the sample period, particularly in the short and middle term
when IS are negative. Similarly, there is weak dependence when IS are positive, except during the period of
2016-2018, where a correlation of about 0.8 is observed in the middle horizon. During this time, positive
sentiment drives the sector to return upward. Furthermore, the construction and materials price returns (Figs.

ACCESS Journal:
Access to Science, Business, Innovation in Digital Economy
ISSN 2683-1007 (Online)
2025, 6(3), 599-614, https://doi.org/10.46656/access.2025.6.3(8)
https://journal.access-bg.org/
605
3k and 3l) are similarly affected by sentiment. Negative sentiment derives the sector returns over the sample
period and across various frequency bands, particularly in the short and middle term, where relatively high
coherency is observed.
Fig .1a - Financial vs. negative sentiment
Fig. 1b- Financial vs. positive sentiment
Fig. 1c - Insurance sector vs. negative
sentiment
Fig. 1d - Insurance sector vs. positive sentiment
Fig. 1e - Banks vs. negative sentiment
Fig 1.f - Banks vs. positive sentiment
Fig. 1g - Chemical vs. negative sentiment
Fig. 1h - Chemical vs. positive sentiment

ACCESS Journal:
Access to Science, Business, Innovation in Digital Economy
ISSN 2683-1007 (Online)
2025, 6(3), 599-614, https://doi.org/10.46656/access.2025.6.3(8)
https://journal.access-bg.org/
606
Fig. 3. Wavelet coherence plots sector returns vs. investors’ sentiment
Source: Authors' illustration
Investor Sentiment- volatility time frequency nexus
Fig. 4 displays the volatility time movements of the selected sector returns. We identify at least two sub-
periods where the volatility levels were extreme. The first sub-period is from 2006-2007 (the 2006 market
crash), while the second coincides with the beginning of the COVID-19 outbreak.
Figure 4. Sectoral indexes Volatility time-movements
Source: Authors' illustration
Fig. 1i - Food vs. negative sentiment
Fig. 1j - Food vs. positive sentiment
Fig. 1k - Constructions materials vs. negative
sentiment
Fig. 1l – Constructions - materials vs. positive
sentiment
Fig. 1m - Constructions vs. negative
sentiment
Fig. 1n - Constructions vs. positive sentiment
ACCESS Journal:
Access to Science, Business, Innovation in Digital Economy
ISSN 2683-1007 (Online)
2025, 6(3), 599-614, https://doi.org/10.46656/access.2025.6.3(8)
https://journal.access-bg.org/
607
Sentiments-volatility interplays
Figs. 5a to 5p present the WC plots between IS and volatility. It reveals that negative sentiment correlates
strongly with volatility in chemical returns (Fig. 5a). The small red islands are scattered over the sample period
and are primarily located at very short investment horizons (4-8 weeks’ scales). Additionally, the arrows point
down and left, indicating that negative sentiment are leading volatility with an anti-phase relationship. The
WC between volatility and positive sentiment (Fig. 5b) suggests that the most significant co-movement is
identified in the middle investment horizon. The arrows show that positive IS is leading volatility in the
chemical sector. These findings corroborate prior studies showing that risk declines when sentiments are
positive (Cui and Zhang, 2019). Fig. 5c shows the WC plot for negative IS and insurance. We observe sizeable
islands of high coherency over short scales. Negative IS has seem to reduce volatility, while no significant co-
movement is observed when IS is positive, even though small islands of red colors are scattered over the mid-
and short-term investment horizons. The two variables are in phase, meaning IS is the leading variable. In
other words, positive IS increases the volatility of insurance over the short run. From the above analysis, we
can conclude that the volatilities of the Saudi industries are influenced more by negative IS than positive ones.
In the financial sector, there is a significant coherence between IS and volatility in mid-scales of (16-32) and
(32-64) weeks. The variables fluctuate in an anti-phase relationship, and adverse sentiment is coercing the
financial sector volatility. Similar outcomes are observed when IS is positive.
Furthermore, IS affects the volatility of the food industry's returns, as seen in Figs. 5g and 5h. Positive IS
boosts short-term food volatility, while negative IS can increase volatility in the opposite direction. The IS also
impacts the construction and materials sectors (Figs. 5i and 5j and Figs. 5o and 5p). The WC plots are similar
regarding high coherency, frequency bands, and arrow directions.
For the construction sector (Fig. 5i and 5j), the positive IS positively affects short- and medium-term
volatility. However, when the IS is negative, the two-time series mostly co-move in an anti-phase relationship
with IS as a leading variable. When inspecting Figs. 5o and 5p., we observe that the construction and materials
sector volatility is more impacted by positive IS rather than negative ones. The analysis reveals high coherence
in the short and middle-frequency bands, with arrows pointing mostly to the right and down, indicating that
the IS is causing volatility. Fig. 5p indicates that the IS significantly impacts volatility, particularly over the
short and mid-term scales, during the sub-periods of 2006-2009 and 2010-2014. Fig. 5m presents the WC plot
for the banking sector, which shows an inverse relationship between volatility and negative IS sentiment. A
pretty similar pattern is shown in Fig. 5n. The WC plot is predominantly scattered over the short and mid-
investment horizon.

ACCESS Journal:
Access to Science, Business, Innovation in Digital Economy
ISSN 2683-1007 (Online)
2025, 6(3), 599-614, https://doi.org/10.46656/access.2025.6.3(8)
https://journal.access-bg.org/
608
Figure 5. Wavelet coherence plots between sectoral volatility and investor sentiment
Source: Authors' illustration
Fig 5.a - Chemical vs. positive sentiment
Fig 5.b - Chemical vs. negative sentiment
Fig 5.c -Insurance vs. positive sentiment
Fig 5.d -Insurance vs. negative sentiment
Fig 5.e -Financial vs. positive sentiment
Fig 5.f -Financial vs. negative sentiment
Fig 5.g -Foods vs. positive sentiment
Fig 5.h -Foods vs. negative sentiment
Fig 5.i -Construction vs. positive sentiment
Fig 5.j -Construction vs. Negative sentiment
Fig 5.k -Banks vs. positive sentiment
Fig 5.l -Banks vs. negative sentiment
Fig 5.m -Construction & Materials vs. positive
sentiment
Fig 5.n -Construction &Mats vs. negative
sentiment

ACCESS Journal:
Access to Science, Business, Innovation in Digital Economy
ISSN 2683-1007 (Online)
2025, 6(3), 599-614, https://doi.org/10.46656/access.2025.6.3(8)
https://journal.access-bg.org/
609
Our research indicates that IS has an impact on the volatility of the industrial sectors in Saudi Arabia. This
impact appears to vary depending on the investment horizon and time scale. Furthermore, our findings reveal
an asymmetrical effect, where negative IS has a more significant impact than positive IS. Our results are
consistent with previous studies that suggest that IS affects asset price returns and volatility, and the sentiment
impact is mostly asymmetrical (Zhou et al., 2023; Su et al. 2021; Chi et al., 2012; Wang et al., 2022; Chiu et
al., 2018; Xue et al., 2022).
Robustness checks using Granger spectral causality tests
We implement the Granger spectral causality tests to check the robustness of our WC findings. Tables 1
and 2 display the results of the causality tests conducted between positive and negative IS and returns. Table
1 shows that positive IS has a unidirectional causality towards the construction and materials sectors in the
short run. We rejected the null hypothesis of no causality with a 10% significance level across all horizons,
reaching equal to 2.1 onwards. However, no causal linkages were displayed for the other sectors. From a
financial perspective, this may be because IS and returns are commonly affected by the same exogenous risk
factors. These results support our wavelets' findings, where we discovered no significant return movement
over the short-term horizon when IS is positive.
Table 1. Spectral Causality test (POSITIVE Investor Sentiment)
Causality
Long Run
Medium Run
Short Run
(p-value)
(p-value)
(p-value)
Positive Chemical
.4157
(.812
1.229
(.540)
1.155
(.5610)
Positive Construction
1.125
(.5696)
.488
(.7831)
2.343
(.3097)
Positive Financial
.23497
(.8891)
.0510
(.9747)
2.602
(.2722)
Positive BANK
.47280
(.78946)
.0258
(.9871)
2.913
(.2330)
Positive Food Products
.0337
(.9832)
.3956
(.8205)
3.067
(.2157)
Positive Construction&Mat
.5146
(.7731)
.85063
(.6535)
5.185
(.0740) ***
Positive Insurance
.61746
(.7343)
.3672
(.8322)
.6002158
(.7407)
More interestingly, the plots generated from Breitung and Candelon (2006)’s approach allow us to
understand the causal effect of investor sentiment on sector’s returns. The plots of the spectral Granger
causality nexus between positive sentiment and Saudi sectors are reported upon request. The causal effect of
positive sentiment on sectors’ returns is only identified for construction and materials sector for the short term.
We reject thus null hypothesis of no predictivity at 10% significance level across the horizon reaching from ω
equal to 2.1 to onward. Therefore, a one-way causality is detected from Saudi investor’s positive sentiment to
construction and Materials sector. For the other sectors, no causal relationship is displayed. From a financial

ACCESS Journal:
Access to Science, Business, Innovation in Digital Economy
ISSN 2683-1007 (Online)
2025, 6(3), 599-614, https://doi.org/10.46656/access.2025.6.3(8)
https://journal.access-bg.org/
610
perspective, this may be because investor sentiment and returns are commonly affected by the same exogenous
risk factors. These results corroborate our findings from the wavelet coherence analysis where we revealed
that there is no significant movement of returns over the short-term horizon when the investors’ sentiment is
positive.
Table 2. Spectral causality test (Negative Investor Sentiment)
Causality
Long Run
Medium Run
Short Run
(p-value)
(p-value)
(p-value)
NegativeChemical
3.741
(.154)
6.401
(.0407) **
3.164
(.2055
NegativeConstructions
.1285
(.937)
.167
(.919)
.700
(.704)
Negative-Financial
1.307
(.520)
5.44
(.065)*
8.460
(.0145)**
Negative-→ Bank
1.164
.5586
4.934
(.084)*
8.982
(.0112)**
Negative-→Foods
1.011
(.602)
2.885
(.236)
2.527
(.282)
Negative-→Const. &
Materials
.967
(.6164)
1.66481
(.435)
1.355
(.507)
Negative-→Insurance
.1546
(.9254)
1.010
(.603)
1.664
(.435)
From Table 2, we can confirm the existence of unidirectional causalities from negative IS to chemical,
financial, and bank sectors in different horizons. Specifically, a unidirectional causal effect is detected from
negative IS in the chemical, financial, and banking sectors in the medium term. For the chemical industry, the
significance level of these causal effects reaches its peak in the medium term (at ω=1.5). On the other hand,
for the banking sector, the highest level of causality is revealed in the short term (at ω=2.5). This result suggests
that the banking sector is more sensitive to fluctuations in IS.
Figure 6 (Fig 6a to Fig 6g) below represent the Breitung and Candelon (2006) spectral findings. There is
evidence of causal relationships between investor’s negative sentiment and Saudi sectors indexes. From Fig.
6a which is corresponding to the causal relationship between chemical sector and negative investor sentiment,
we reject the null hypothesis of “no predictability” at 5% and 10% significance level. Noting that this causal
effect is perceived across the horizon ranging from ω ϵ [1.1,3]. As well, uncertainty and anxiety of the Saudi
investor is granger causes the financial sector ‘returns fluctuations. It is perceived that the Granger causality
varies across the horizon 0.9 to onward. Negative sentiments also Granger cause banks sector’s returns
variability in the frequency domain. The null hypothesis of no “predictability “is thus rejected at both 5% and
10% significance level from the range from 1.1 onward. It is clearly perceived that Banks and financial sectors
are greatly affected by investor sentiments. This result is consistent with our findings generated from the
wavelet coherency approach.

ACCESS Journal:
Access to Science, Business, Innovation in Digital Economy
ISSN 2683-1007 (Online)
2025, 6(3), 599-614, https://doi.org/10.46656/access.2025.6.3(8)
https://journal.access-bg.org/
611
Fig. 6. Spectral Granger Causality plots between negative ISs and industrial sector returns
Source: Authors' illustration
ACCESS Journal:
Access to Science, Business, Innovation in Digital Economy
ISSN 2683-1007 (Online)
2025, 6(3), 599-614, https://doi.org/10.46656/access.2025.6.3(8)
https://journal.access-bg.org/
612
CONCLUDING REMARKS AND POLICY IMPLICATIONS
This study investigates the effects of investor sentiment on stock returns and volatility in Saudi Arabia from
2005 to 2021. It utilizes the wavelet method and spectral causality tests and proceeds in two steps. Firstly, it
employs Arabic terminology and GSV to estimate the IS index. Secondly, a large sample of weekly data for
the highly capitalized sectors in Saudi Arabia is used. We discovered that IS affects the Saudi stock market in
different ways depending on the time period and frequency bands. Negative IS has a greater impact than
positive IS. The financial, banking, and insurance sectors are the most affected by these sentiments. These
findings can help investors in asset allocation, hedging strategies, and understanding the role of IS in predicting
stock market behavior. Policymakers and regulators should consider IS when creating financial policies.
Interestingly, the effects of investors’ sentiments on both stock returns and volatility are varying across the
time-scales and frequency bands. This implies that Saudi investors have are heterogeneous perceptions over
the short, medium, and long term of the fears of risk, which in turn affect their investment decision making.
For instance, negative sentiment may be perceived depressingly and stimulate their short trading positions,
while the same negative fear may be viewed as a transitorily and encourage them to take long trading positions.
Also, for most of the Saudi sectors, we identify some asymmetrical effects of positive and negative sentiment.
The effect of negative sentiment seems to be more pronounced on both the stock returns and the volatility. As
well, the financial, banking, and the insurance sectors exhibit the highest sensitivity to investors’ sentiments
compared to the others. These outcomes are very insightful and may help Saudi stock market participants
when allocating assets, designing their hedging strategies. They may be useful to understand the pivotal role
of investors’ sentiments in forecasting stock market behaviour over the various forecasting horizons. The
results are also informative for policy makers and market regulators who are invited to consider the investors’
sentiments as a key factor for designing financial stability policies.
Conflict of interest: The authors declare no conflict of interest.
Author Contributions:
Conceptualization, Ch.A., B.H.; methodology, Ch.A., B.H; software, Ch.A., B.H; validation, Ch.A., B.H;
formal analysis, Ch.A.; investigation, B.H; resources, B.H.; data curation, B.H.; writing—original draft
preparation, Ch.A., B.H; writing—review and editing, Ch.A.; visualization, Ch.A., B.H; supervision, Ch.A.;
project administration, B.H; funding acquisition, B.H.
All authors have read and agreed to the published version of the manuscript.
Acknowledgement: The University of Jeddah funds this research under grant number UJ-20-148-DR.
Institutional Review Board Statement: not applicable
Informed Consent Statement: not applicable
Data Availability Statement:
The data presented in this study are available on request from the corresponding author.
ACCESS Journal:
Access to Science, Business, Innovation in Digital Economy
ISSN 2683-1007 (Online)
2025, 6(3), 599-614, https://doi.org/10.46656/access.2025.6.3(8)
https://journal.access-bg.org/
613
REFERENCES
Aguiar-Conraria, L., Azevedo, N., & Soares, M.J. (2008). Using wavelets to decompose the time-frequency effects of
monetary policy. Physica A: Statistical Mechanics and its Applications, 387(12), pp. 2863–2878, DOI:
10.1016/j.physa.2008.01.063
Baker, M., Wurgler, J. (2007). Investor Sentiment in the Stock Market. Journal of Economic Perspectives, 21(2), pp. 129-
152, DOI: 10.1257/jep.21.2.129
Breitung, J., & Candelon, B. (2006). Testing for short- and long-run causality: A frequency-domain approach. Journal of
Econometrics, 132(2), 363–378. https://doi:10.1016/j.jeconom.2005.02.004
Chi, L., Zhuang, X., & Song, D. (2012). Investor sentiment in the Chinese stock market: an empirical analysis. Applied
Economics Letters, 19(4), pp.345-348, https://doi.org/10.1080/13504851.2011.577003
Chiu, J., Chung, H., Ho, Y.K., & Wu, C.C. (2018). Investor sentiment and evaporating liquidity during the financial crisis.
International Review of Economics and Finance, 55, pp 21-36, DOI: 10.1016/j.iref.2018.01.006
Cui, H., & Zhang, Y. (2019). Does investor sentiment affect stock price crash risk? Applied Economics Letters, 27(7),
pp.564-568, DOI: 10.1080/13504851.2019.1643448
Da, Z., Engelberg, J., & Gao, P. (2015). The Sum of All FEARS Investor Sentiment and Asset Prices. Review of Financial
Studies, 28(1), pp. 1-32, http:// doi:10.1093/rfs/hhu072
Dash, R. S., & D. Maitra. (2018). Does Shariah index hedge against sentiment risk? Evidence from Indian stock market
using time–frequency domain approach. Journal of Behavioral and Experimental Finance, 19, pp. 20-35, DOI:
10.1016/j.jbef.2018.03.003
Fama, F. (1991). Efficient Capital Markets: II. Journal of Finance, 46(5), pp. 1575-1617, https://doi.org/10.1111/j.1540-
6261.1991.tb04636.x
Gao, Zh., Ren, H., & Zhang, B. (2020). Googling Investor Sentiment around the World. Journal of Financial and
Quantitative Analysis, 55(2), pp 549-580, https://doi:10.1017/S0022109019000061
Gurav, U, P., & Kotrappa, S. (2020). Sentiment Aware Stock Price Forecasting using the SA-RNN-LBL Learning Model.
Engineering, Technology & Applied Science Research, 10(5), pp. 6356-6161, https://doi.org/10.48084/etasr.3805
Kadilli, A. (2015). Predictability of stock returns of financial companies and the role of investor sentiment: A multi-
country analysis. Journal of Financial Stability, 21, issue C, pp. 26-45, DOI: 10.1016/j.jfs.2015.09.004
Kumari, J., Mahakud. J. (2015). Does investor sentiment predict the asset volatility? Evidence from emerging stock
market India. Journal of Behavioral and Experimental Finance, Vol.8, issue C, pp. 25-39, DOI:
10.1016/j.jbef.2015.10.001
Liston, D. P. (2016). Sin stock returns and investor sentiment. The Quarterly Review of Economics and Finance, 59, pp.
63-70, DOI: 10.1016/j.qref.2015.08.004
Mahyoub, M., Alrahaili, M., Algaraady, J., & Alblwi, A. (2022). Sentiment Analysis of Public Tweets Towards the
Emergence of SARS-CoV-2 Omicron Variant: A Social Media Analytics Framework. Engineering, Technology &
Applied Science Research, 12(3), pp. 8525-8531, https://doi.org/10.48084/etasr.4865
Seok, S., Cho, H., & Ryu, D. (2021). Stock Market’s responses to intraday investor sentiment. North American Journal
of Economics and Finance, 58(2), 101516, DOI: 10.1016/j.najef.2021.101516
Shiller, R.J. (2003). From Efficient Markets Theory to Behavioral Finance. Journal of Economic Perspectives, 17(1), pp.
83-104, DOI: 10.1257/089533003321164967
Su, Z., Liu, P., & Fang, T. (2022). Pandemic-induced fear and stock market returns: Evidence from China. Global Finance
Journal, 54, 100644, doi: 10.1016/j.gfj.2021.100644
Verma, R. & Soydemir, G. (2009). The impact of individual and institutional investor sentiment on the market price of
risk, The Quarterly Review of Economics and Finance, 49(3), pp. 1129-1145,
https://doi.org/10.1016/j.qref.2008.11.001
Wang, Z., Xiao, H., Lin, L., Tang, K., & Unger, J.M. (2022). Geographic social inequalities in information seeking
response to the COVID 19 pandemic in China: longitudinal analysis of Baidu Index. Scientific Reports, 12, pp.
12243, doi: 10.1038/s41598-022-16133-2
Xue, G., W. Zhang, J. Wand & C. Wang. (2022). Investor sentiment and stock volatility: new evidence. International
Review of Financial Analysis, 80, 102028, https://doi.org/10.1016/j.irfa.2022.102028

ACCESS Journal:
Access to Science, Business, Innovation in Digital Economy
ISSN 2683-1007 (Online)
2025, 6(3), 599-614, https://doi.org/10.46656/access.2025.6.3(8)
https://journal.access-bg.org/
614
Zhou, L., Chen, D., & Huang, J. (2023). Stock-level sentiment contagion and the cross-section of stock returns. North
American Journal of Economics and Finance, 68, 101966, https://doi.org/10.1016/j.najef.2023.101966
About the authors
Besma HKIRI
Assistant Professor of Finance at the College of Business (COB), University of
Jeddah, Saudi Arabia, with a PhD in Finance from the University of El- Manar in
Tunisia in 2014. In her academic carrier, she has authored over 30 peer-reviewed
articles in top finance and economics journals. She Mentored many graduate students
and conducting many professional master projects.
Research interests: Behavioural Finance, Financial Markets, Financial Economics,
Green Finance, Islamic finance, Climate change, investments and Risk Management.
ORCID ID: 0000-0002-0747-8483
Chaker ALOUI
Full Professor of Finance at the College of Business Administration (CBA), Prince
Sultan University, Saudi Arabia. PhD in International Finance from the University of
El- Manar in Tunisia in 2002. Ranked among the top 2% of scientists in the field of
finance (Stanford Ranking 2025), he currently leads the Finance and Economics
Research Lab at CBA. He has authored over 100 papers in highly ranked international
journals.
Research interests: Financial Markets, Green Finance, FinTech, behavioural
Finance, Islamic finance, investments and Islamic Finance and Asset management
and Valuation.
ORCID ID: 0009-0001-6402-6723
This work is licensed under the Creative Commons Attribution International License (CC BY)

ACCESS Journal:
Access to Science, Business, Innovation in Digital Economy
ISSN 2683-1007 (Online)
2025, 6(3), 615-633, https://doi.org/10.46656/access.2025.6.3(9)
https://journal.access-bg.org/
615
IMPACT OF AI-AUGMENTED DIGITAL LEADERSHIP ON REMOTE
TEAM PERFORMANCE: AN EXPLORATORY STUDY OF TURKISH SMES
Sefer Aydogan
National Defence University, Istanbul, Turkey
e-mails: sefer.aydogan@msu.edu.tr
Received: 07 May 2025 Accepted: 05 September 2025 Online Published: 24 September 2025
ABSTRACT
Objectives: Small and medium-sized enterprises (SMEs) are vital to economic development worldwide, contributing
significantly to employment and innovation. However, these businesses often face challenges when adapting to rapid
technological advancements, particularly in the area of artificial intelligence (AI) for remote work. In the context of
Turkey, SMEs encounter barriers such as limited resources and a strong preference for in-person collaboration, which
hinder effective remote work management (RWM). Methods/Approach: This exploratory study investigates how AI-
augmented digital leadership can improve remote team performance. Using a mixed-methods design, the research
combines a systematic literature review with survey data from 200 respondents (77% response rate). Results: AI-driven
performance monitoring and AI-enhanced digital training are analyzed through multiple linear regression, with
sensitivity analyses further supported by a 20% remote employee sample and qualitative themes to mitigate managerial
bias and deepen contextual understanding. Conclusions: The findings indicate that AI-driven monitoring significantly
enhances effectiveness. Grounded in the Technology Acceptance Model (TAM), Resource-Based View (RBV),
Transformational Leadership Theory (TLT), and Algorithmic Management, with collectivism as a moderator, this study
introduces a novel framework, actionable toolkit, and policy recommendations. Comparisons with global research
emphasize the contributions made in collectivist contexts, offering SME leaders practical guidance for optimizing remote
work in the digital era.
Keywords: AI-augmented leadership, remote team performance, SMEs, TAM, collectivism, algorithmic management
JEL classification: M15, O32, L26
Paper type: Research article
Citation: Aydogan, S. (2025). Impact of AI-augmented digital leadership on remote team performance: an exploratory
study of Turkish SMEs. Access to science, business, innovation in the digital economy, ACCESS Press, 6(3), 615-633,
https://doi.org/10.46656/access.2025.6.3(9)
INTRODUCTION
Small and medium-sized enterprises (SMEs) are a cornerstone of global economies, fostering innovation,
employment, and economic stability (Dela Cruz et al., 2023; I. A, 2024). Yet, these enterprises face significant
challenges in navigating rapid technological advancements, particularly in adopting artificial intelligence (AI)
and digital tools essential for remote work. As digital transformation accelerates, effective Remote Work
Management (RWM) becomes critical for maintaining competitiveness. However, many SMEs struggle with
limited technological infrastructure and cultural resistance to change, hindering their ability to fully embrace
AI-driven solutions.
Globally, SMEs are adopting remote work to enhance flexibility and resilience, a trend accelerated by the
COVID-19 pandemic (Begum et al., 2022; Henke et al., 2022). Organizations worldwide leverage AI tools for
ACCESS Journal:
Access to Science, Business, Innovation in Digital Economy
ISSN 2683-1007 (Online)
2025, 6(3), 615-633, https://doi.org/10.46656/access.2025.6.3(9)
https://journal.access-bg.org/
616
collaboration, analytics, and performance monitoring to optimize operations (Dela Cruz et al., 2023; Mustajab,
2024). While developed nations lead due to robust digital infrastructures, SMEs in emerging markets
increasingly recognize AI’s potential to strengthen RWM, despite facing unique barriers. In collectivist
cultures, where face-to-face communication is often preferred, adopting AI solutions presents distinct
challenges, necessitating tailored approaches to foster trust and efficiency.
In Turkey, SMEs are vital to economic growth but encounter substantial obstacles in adopting remote work
technologies amid digital transformation (Gao et al., 2022). Limited financial resources, inadequate
technological infrastructure, and a collectivist cultural preference for in-person collaboration impede progress
(Sun & Bunchapattanasakda, 2019), as Omrani et al. (2024) note, highlighting the scarcity of advanced AI
infrastructure (Praswati et al., 2024). Ineffective RWM undermines productivity and competitiveness, yet
research on Critical Success Factors (CSFs) tailored to Turkish SMEs remains limited. This exploratory study
addresses this gap by examining AI-augmented digital leadership’s role in enhancing remote team
performance, offering insights into Turkey’s unique context while drawing comparisons with global research.
Turkey’s collectivist culture and underdeveloped digital infrastructure pose distinct challenges, yet AI-
augmented digital leadership offers a promising solution for streamlining RWM. Sinulingga et al. (2024)
suggest that AI tools, such as platforms, can bridge cultural and technological divides in SMEs with less rigid
hierarchies (Dutta et al., 2024). This study explores AI’s potential to foster trust and efficiency in Turkey’s
collectivist context, providing timely insights into its evolving digital landscape.
Grounded in the Technology Acceptance Model (TAM) (Venkatesh & Bala, 2008) and Resource-Based
View (RBV) (Eisenhardt & Schoonhoven, 1996), this study analyzes AI adoption and its strategic value in
resource-constrained SMEs. TAM’s simplicity, as Canh Chi and Bui Thanh (2024) affirm, suits SMEs, while
RBV positions AI as a strategic asset. Miškufová et al. (2025) demonstrate that perceived ease of use and
usefulness drive AI adoption, enhancing performance (Ugural et al., 2024). The integration of
Transformational Leadership Theory (TLT) (Harrison, 2020) and Algorithmic Management (Möhlmann et al.,
2021) enriches this framework, emphasizing AI’s inspirational and regulatory roles in collectivist settings.
Employing a mixed-methods approach, the study combines a systematic literature review with a survey of 200
stakeholders—owners, managers, and employees—analyzed through regression, subgroup analysis, and
moderation analysis to explore cultural influences. A 20% remote employee sample, supported by sensitivity
analyses and qualitative themes, mitigates managerial bias and enhances reliability, with control variables
(SME size, digital maturity) strengthening rigor. Findings indicate that AI-driven performance monitoring
significantly boosts effectiveness, while AI-enhanced training fosters engagement. An AI implementation
toolkit, policy recommendations, and comparisons with global research provide actionable, context-specific
insights, though broader validation is needed.

ACCESS Journal:
Access to Science, Business, Innovation in Digital Economy
ISSN 2683-1007 (Online)
2025, 6(3), 615-633, https://doi.org/10.46656/access.2025.6.3(9)
https://journal.access-bg.org/
617
For Turkish SME leaders, AI tools like automated monitoring address infrastructure limitations, while
training builds digital competencies, enhancing competitiveness. İncekara et al. (2023) emphasize leadership
and usability as key drivers of AI adoption. This study’s recommendations—identifying CSFs, evaluating AI
impacts, advocating ethical solutions, and proposing policy support—promote sustainable remote work
strategies with global relevance. Figure 1 illustrates the framework, linking CSFs, AI-augmented leadership,
and remote team performance. Updated to incorporate TLT and Algorithmic Management, Figure 1 clarifies
the theoretical model, guiding SMEs in navigating digital-era challenges.
Figure 1. Conceptual Framework of AI Adoption in SMEs
Source: Author illustration
This framework highlights the relative influence and moderation of factors such as Organizational Culture,
Technological Readiness, Size, and Employee Engagement on the adoption process.
Theorical Framework
This chapter constructs a robust theoretical framework to address the research gap regarding the impact of AI-
augmented digital leadership on Remote Work Management (RWM) in Turkish SMEs (Gao et al., 2022;
İncekara et al., 2023). It proposes seven hypotheses to validate Critical Success Factors (CSFs) tailored to
Turkey’s socio-economic, cultural, and technological context. Grounded in the Technology Acceptance Model
(TAM) and Resource-Based View (RBV), these hypotheses explore AI’s role in enhancing remote team
performance. The inclusion of Transformational Leadership Theory (TLT) and Algorithmic Management
enhances the framework, positioning AI as both an inspirational and regulatory force in collectivist SMEs.
Wang et al. (2023) emphasize that TAM explains individual and organizational acceptance of AI, while
RBV underscores AI as a strategic asset. Ali et al. (2024) suggest that reinforcement learning improves AI
adaptability, a critical consideration for SMEs. Table 1 summarizes the hypotheses, theoretical foundations,

ACCESS Journal:
Access to Science, Business, Innovation in Digital Economy
ISSN 2683-1007 (Online)
2025, 6(3), 615-633, https://doi.org/10.46656/access.2025.6.3(9)
https://journal.access-bg.org/
618
and expected outcomes, providing a clear basis for empirical analysis. The CSF framework, inspired by
Rockart’s model (Cooper, 2008), guides SMEs in prioritizing key drivers—particularly crucial in the post-
pandemic era. While existing literature addresses technology, engagement, and performance, it often overlooks
AI’s potential in culturally distinct SMEs. Praswati et al. (2024) found that perceived usefulness and ease of
use are key factors driving AI chatbot adoption in SMEs (Omrani et al., 2024). This study integrates AI-driven
CSFs with Turkey’s collectivist context, addressing Wang et al. (2021) call for collaborative AI systems, and
contrasts with individualistic contexts.
Table 1. Hypotheses, Theoretical Bases, and Expected Outcomes
Hypothesis
Theoretical Base
Expected Outcome
H1: Enhanced technological readiness fosters
greater remote work effectiveness
TAM, RBV
Increased productivity and project completion in AI-
augmented RWM
H2: Higher employee engagement enhances
task quality and innovation
TAM, TLT
Improved engagement and creativity among remote
employees
H3: AI-driven performance monitoring
improves individual performance and retention
RBV, Algorithmic
Management
Enhanced productivity and employee retention through AI
tools
H4: Prioritizing work-life balance decreases
absenteeism and turnover
TAM, RBV
Reduced absenteeism and turnover, improving remote
work retention
H5: Robust AI-facilitated communication
accelerates project timelines and increases
satisfaction
TAM, TLT
Faster project timelines and higher employee satisfaction
H6: AI-enhanced digital training improves self-
efficacy and reduces errors
TAM, RBV
Enhanced employee skills and reduced errors in remote
work tasks
H7: Proactive risk management improves
system uptime and security
TAM, RBV
Greater effectiveness of training in companies with high
technological readiness
Source: Author illustration
CSF Categories and Hypotheses for AI-Augmented RWM
This section outlines seven CSFs for AI-augmented RWM in Turkish SMEs, categorized into
Technological Factors (H1, H5, H7), Human-Centric Factors (H2, H4, H6), and Performance Monitoring (H3)
to enhance clarity. Each CSF is paired with a hypothesis reflecting AI’s strategic role. Technological readiness,
including AI-integrated platforms and connectivity, is foundational for effective RWM. TAM highlights the
importance of perceived ease and usefulness, while RBV positions technology as a strategic resource. Samuel
Yusuf (Yusuf et al., 2024) demonstrate that AI applications, when integrated with digital technologies, create
valuable, rare, and inimitable resources for SMEs.
H1: Enhanced technological readiness fosters greater remote work effectiveness, improving productivity
and project completion.
Employee engagement, critical in Turkey’s collectivist culture, drives motivation and creativity. Sjoding
and Liu (2016) highlights that natural language communication facilitates coordination in multi-agent settings,
fostering cohesive teamwork (Demir et al., 2017). AI-driven virtual activities, grounded in TLT, enhance
inspirational motivation and team cohesion.
H2: Higher employee engagement enhances task quality and innovation.
AI-driven performance monitoring uses real-time analytics to focus on outcomes, fostering trust within
hierarchical SMEs. Anning-Dorson (2021) confirms that automated monitoring boosts productivity when
ACCESS Journal:
Access to Science, Business, Innovation in Digital Economy
ISSN 2683-1007 (Online)
2025, 6(3), 615-633, https://doi.org/10.46656/access.2025.6.3(9)
https://journal.access-bg.org/
619
supported by adequate resources. Algorithmic Management ensures regulatory oversight, enhancing
accountability.
H3: AI-driven performance monitoring improves individual performance and retention.
Work-life balance, facilitated by AI-enabled flexibility, helps mitigate burnout. Chiguvi & Bakani (2023)
note that remote work enhances retention and reduces absenteeism through better work-life balance.
H4: Prioritizing work-life balance decreases absenteeism and turnover.
AI-facilitated communication enhances clarity in Turkey’s context-driven business environment. Hamdat
et al. (2024) show that AI systems with advanced reasoning capabilities improve information processing.
H5: Robust AI-facilitated communication accelerates project timelines and increases satisfaction.
AI-enhanced digital training addresses digital literacy gaps, positioning it as a strategic asset under RBV.
Day et al. (2021) advocates for codifying leadership behaviors into reusable training modules. Technological
readiness moderates training effectiveness, amplifying its impact.
H6: AI-enhanced digital training improves self-efficacy and reduces errors.
H6a: Technological readiness moderates the relationship between AI-enhanced training and remote work
effectiveness, strengthening the positive effect when readiness is high.
AI-informed risk management enhances resilience in Turkey’s volatile economy. Abikoye et al. (2024)
highlight that AI systems introduce security risks requiring strategic oversight.
H7: Proactive risk management improves system uptime and security.
AI-Augmented RWM in Turkish SMEs: Context and Examples
Turkish SMEs face unique challenges in Remote Work Management (RWM), including resource
constraints, informal organizational structures, and a cultural preference for face-to-face engagement,
compounded by slow AI adoption. AI-augmented leadership, integrating performance monitoring and training,
offers tailored solutions to these challenges ( Lilly & Asrafi, 2025). For instance, a Turkish technology SME
enhanced its efficiency by implementing AI tools, reducing turnover through targeted training and real-time
monitoring (Ugural & Giritli, 2021).
CSFs in Turkish SMEs are influenced by collectivism, economic pressures, and technological disparities.
İncekara et al. (2023) confirm that leadership and usability are key drivers of AI adoption in Turkish software
startups, with security concerns as a major consideration. Practical examples include tourism SMEs using AI
communication tools for client engagement, manufacturing SMEs employing AI monitoring for production
oversight, and service SMEs prioritizing AI training (Martinsuo & Luomaranta, 2018; Omokhoa et al., 2025).
In contrast to SMEs in individualistic cultures, such as the United States, where remote work emphasizes
autonomy, Turkish SMEs rely on AI tools like virtual collaboration platforms to replicate in-person trust and
cohesion, aligning with collectivist values (Harrigan et al., 2008). For example, a tourism SME in Antalya
implemented AI-driven video conferencing, likely improving customer satisfaction, as suggested by the
positive effect of AI communication.

ACCESS Journal:
Access to Science, Business, Innovation in Digital Economy
ISSN 2683-1007 (Online)
2025, 6(3), 615-633, https://doi.org/10.46656/access.2025.6.3(9)
https://journal.access-bg.org/
620
Systematic implementation—through infrastructure audits, engagement surveys, and AI tools—ensures
that CSFs enhance remote work across sectors. Bilal et al. (2024) review of digital transformation emphasizes
organizational readiness and incremental strategies. Collectivist values moderate AI’s effectiveness,
amplifying the impacts of monitoring and training.
Contributions and Methodological Review
This study enriches the RWM literature by embedding AI-augmented leadership within Turkish SMEs,
extending both TAM and RBV. TAM’s simplicity, in contrast to the complexity of models like UTAUT2, is
better suited for the constraints faced by SMEs, as noted by Małkowska et al. (2021), considering Turkey’s
limited digital infrastructure. The mixed-methods approach—integrating literature synthesis with a survey of
200 respondents—validates CSFs through regression, ANOVA, and thematic analysis, with subgroup analysis
exploring variations by sector and size. This methodology adheres to best practices for AI adoption studies,
advocating for a qualitative and quantitative integration (Carayannis et al., 2024). The incorporation of TLT,
Algorithmic Management, and moderation analysis enhances both theoretical and methodological novelty,
positioning the study in line with global research trends (Truong Thi Le et al., 2024).
METHODOLOGY
Research Design
This exploratory study employs a mixed-methods design to investigate Critical Success Factors (CSFs) for
AI-augmented digital leadership in Remote Work Management (RWM) within Turkish SMEs. The study is
structured in two phases: Phase 1 involves a systematic literature review, grounded in the Technology
Acceptance Model (TAM) and Resource-Based View (RBV), to develop a questionnaire focusing on AI-
driven performance monitoring and AI-enhanced digital training. Phase 2 comprises an empirical survey to
assess the effectiveness of these practices. The methodological framework is outlined in Figure 2, ensuring a
systematic approach that aligns with Ugural et al. (2024) advocacy for mixed -methods research to capture
both the breadth and depth of AI adoption in SMEs.
Figure 2. Research Methodology Flowchart
Source: Author illustration

ACCESS Journal:
Access to Science, Business, Innovation in Digital Economy
ISSN 2683-1007 (Online)
2025, 6(3), 615-633, https://doi.org/10.46656/access.2025.6.3(9)
https://journal.access-bg.org/
621
Transformational Leadership Theory (TLT) and Algorithmic Management inform the qualitative phase,
enriching the thematic analysis.
Population and Sampling
The study targets Turkish SMEs involved in remote or hybrid work environments. Stratified random
sampling, consistent with definitions from the Turkish Ministry of Industry and Technology and KOSGEB,
ensures that the sample is representative across different sectors and organizational sizes. Of the 260
respondents approached, 200 usable responses were obtained, yielding a 77% response rate. To address
potential managerial bias, a 20% remote employee sample (40 respondents) was included, reflecting global
trends in remote work (see table 2).
Table 2. Respondent Distribution by Organizational Role
Respondent Role
Number (N)
Percentage (%)
SME Owners
50
25.00
Managers
45
22.50
Consultants
40
20.00
Government
25
12.50
Remote Employees
40
20.00
Total
200
100.00
Source: Author illustration
The sample includes 20% remote employees (40 respondents), which enhances the relevance of the findings
to remote work dynamics, as highlighted by Ogbu et al. (2024), who stress the importance of diverse
perspectives in remote work research (Olawale et al., 2024; Saklani et al., 2023). The sample size supports
exploratory regression analysis, following established guidelines for such research (Ghardallou, 2023). The
questionnaire, adapted from Omrani et al. (2024) and Praswati et al. (2024), includes demographic sections
and CSF-related items on a 5-point Likert scale. The instrument emphasizes AI-driven performance monitoring
and training tools, such as automated analytics and virtual modules. Pretesting (n = 15) resulted in a Cronbach’s
α = 0.82, confirming reliability (Malapane & Ndlovu, 2024). The instrument was back-translated into Turkish
for cultural validity, following cross-cultural research standards.
Data Analysis
Quantitative data were analyzed using Python 3.13 (pandas, statsmodels) and SPSS. Descriptive statistics were
used to highlight the importance of CSFs, with a focus on AI-driven performance monitoring and training.
Multiple linear regression, ANOVA, and Chi-square tests were employed to assess the predictive power of the
CSFs on remote work effectiveness. Ghardallou (2023) emphasize the need for comprehensive evaluation
methods to understand the complex effects of AI.
The regression models were tested for linearity, normality, and homoscedasticity using residual plots and
the Shapiro-Wilk test (p > 0.05). ANOVA was used to examine group differences across roles, while Chi-
square tests analyzed associations between categorical variables. The Durbin-Watson test (1.95) confirmed the
absence of autocorrelation. These validation methods are consistent with best practices in regression analysis
for AI adoption studies. Cross-validation (k=5) and propensity score weighting was applied to balance remote

ACCESS Journal:
Access to Science, Business, Innovation in Digital Economy
ISSN 2683-1007 (Online)
2025, 6(3), 615-633, https://doi.org/10.46656/access.2025.6.3(9)
https://journal.access-bg.org/
622
and non-remote respondents, addressing potential managerial bias (Hoffmann et al., 2019). A moderation
analysis tested the influence of collectivism, as reported in Section 4.5. Subgroup analyses explored variations
by sector and size, and Cronbach’s alpha (α = 0.82) confirmed scale reliability. Future studies may consider
using structural equation modeling (SEM) to further explore causal pathways. Qualitative responses were
analyzed according to Braun and Clarke (2006), offering a human-centered perspective on AI adoption, as
suggested by Schmager et al. (2025). Table 3 presents the qualitative theme matrix, integrating both
quantitative and qualitative insights.
Table 3. Qualitative Theme Matrix
Theme
Quantitative Link
Example Quote
Trust in AI Tools
Monitoring (β = 0.50)
“Transparent AI fosters employee confidence in
monitoring.”
Usability Challenges
Training (β = 0.46)
“User-friendly training modules reduce learning curves.”
Ethical Concerns
Risk Management (β = 0.27)
“Clear privacy guidelines are essential for AI adoption.”
Source: Author Computation, 2025
Note: Themes derived from Braun and Clarke (2006) analysis, linking qualitative insights to regression results.
Data Quality Assurance and Ethical Considerations
Ethical standards were upheld throughout the study. Informed consent was obtained from all participants,
ensuring anonymity, confidentiality, and the right to withdraw from the study at any time, although no
withdrawals were recorded. Data integrity was maintained through pre-testing, response pattern checks, and
the removal of incomplete entries. The Cronbach’s alpha (α = 0.82) confirmed scale consistency, and these
procedures align with Begum et al. (2022) emphasis on trust and transparency in AI research. The ethical use
of AI, with a focus on data privacy and fairness, was emphasized throughout the study to build trust in the
SME context. Omokhoa et al. (2025) advocate for transparency and accountability, particularly in contexts
with varying levels of AI literacy.
RESULTS
This section presents the empirical findings from a mixed-methods study examining Critical Success Factors
(CSFs) for AI-augmented digital leadership in Remote Work Management (RWM) within Turkish SMEs,
based on the methodology. Survey data from 200 respondents explore demographic influences, rank CSFs,
and test hypotheses, validating AI’s impact on remote team performance.
Respondent Demographics
The respondent demographics provide context for understanding the effects of AI-augmented digital
leadership. Table 4 summarizes the sections of the questionnaire, data collected from respondents, and the
corresponding measurement methods used in the study to explore AI adoption in Turkish SMEs. Table4
summarizes the sections of the questionnaire, data collected from respondents, and the corresponding
measurement methods used in the study to explore AI adoption in Turkish SMEs.

ACCESS Journal:
Access to Science, Business, Innovation in Digital Economy
ISSN 2683-1007 (Online)
2025, 6(3), 615-633, https://doi.org/10.46656/access.2025.6.3(9)
https://journal.access-bg.org/
623
Table 4. Structured Questionnaire for AI-Augmented Digital Leadership in Remote Work Management
Section
Data Collected
Details
Section A: Respondent and Organizational
Background
Respondent Role
Owner, Manager, Remote Employee, Consultant,
Government Support
Gender
Male, Female, Other
Industry Experience
Less than 5 years, 5-10 years, 10-15 years, more than
15 years
Industry Sector
Open-ended (categorized)
SME Size Category
Micro, Small, Medium (KOSGEB definitions)
Section B: Critical Success Factors (CSFs)
for RWM
Technological Readiness
5-point Likert scale
Employee Engagement
5-point Likert scale
Communication &
Collaboration
5-point Likert scale
Performance Monitoring
5-point Likert scale
Work-Life Balance
5-point Likert scale
Training and Development
5-point Likert scale
Risk Management
5-point Likert scale
Source: Author illustration
Figure 3 summarizes the characteristics across different roles, highlighting the diversity of the sample. The
updated sample, which includes 20% remote employees, enhances the study's focus on remote work dynamics
(Table 2). Chiguvi and Keneilwe (2023) confirm that remote work, when supported by adequate resources,
can enhance productivity.
Figure 3. Comparison of CSF Category Importance Trends by Rank
Source: Author illustration
This figure illustrates the trends in the importance of CSFs by rank within the study. It shows the relative
prioritization of AI-driven performance monitoring and AI-enhanced digital training, while work-life balance

ACCESS Journal:
Access to Science, Business, Innovation in Digital Economy
ISSN 2683-1007 (Online)
2025, 6(3), 615-633, https://doi.org/10.46656/access.2025.6.3(9)
https://journal.access-bg.org/
624
and risk management are considered secondary priorities. These trends support the findings discussed in the
text and provide a visual representation of the data trends.
Ranking of CSFs for AI-Augmented RWM
Survey data reveal the relative importance of Critical Success Factors (CSFs) for AI-augmented Remote
Work Management (RWM) in Turkish SMEs. The analysis, based on responses from 200 participants,
highlights a strong consensus on the role of AI in enhancing remote team performance. CSFs were evaluated
across seven domains using a 5-point Likert scale, with results indicating high perceived importance for AI-
driven performance monitoring and AI-enhanced digital training.
Table 5 summarizes the ranked CSFs. AI-driven performance monitoring (mean = 4.78, SD = 0.30) and
AI-enhanced digital training (mean = 4.70, SD = 0.32) emerged as the top two factors. These findings align
with Liu and Liu’s (2024) assertion that AI systems significantly streamline organizational performance
monitoring. Other influential CSFs include technological readiness (mean = 4.58), employee engagement
(mean = 4.52), and AI-facilitated communication (mean = 4.50), highlighting the integrated role of technology
and human dynamics in successful AI adoption. In contrast, work-life balance (mean = 4.28) and risk
management (mean = 4.18) were perceived as less critical, suggesting that Turkish SMEs may prioritize
operational and productivity-enhancing factors over long-term well-being and risk mitigation—particularly
under economic pressure.
Table 5. Ranking of CSFs for AI-Augmented RWM
CSF Category
Mean Score
SD
Rank
AI-Driven Performance Monitoring
4.78
0.30
1
AI-Enhanced Digital Training
4.70
0.32
2
Technological Readiness
4.58
0.36
3
Employee Engagement
4.52
0.38
4
AI-Facilitated Communication
4.50
0.39
5
Work-Life Balance
4.28
0.44
6
Risk Management
4.18
0.46
7
Note: Scores based on a 5-point Likert scale (1 = not important, 5 = very important).
Source: Author Computation, 2025
Notably, the inclusion of a 20% remote employee sample subtly elevated the importance ratings for
monitoring and training, reinforcing their direct relevance to remote work environments. This insight confirms
the contextual sensitivity of AI-augmented leadership tools, especially in settings with limited digital maturity
and hierarchical management structures.
As illustrated in Figure 3, a comparative overview is provided through the visualization of trends in CSF
importance by rank. The heatmap underscores the prioritization of AI-driven performance monitoring and AI-
enhanced digital training, while distinctly positioning work-life balance and risk management as secondary
considerations. These visual insights serve to reinforce the numerical data and support the thematic findings
derived from the qualitative analysis. As indicated by the qualitative themes outlined in Table 3, the
significance of trust, usability, and ethical safeguards in shaping AI acceptance is underscored. These factors
intersect with top-ranked CSFs, particularly monitoring and training, thereby affirming the multidimensional
nature of effective AI adoption in Turkish SMEs.

ACCESS Journal:
Access to Science, Business, Innovation in Digital Economy
ISSN 2683-1007 (Online)
2025, 6(3), 615-633, https://doi.org/10.46656/access.2025.6.3(9)
https://journal.access-bg.org/
625
Descriptive Evaluation of Hypotheses
High mean scores (Table 5, Figure 4) support hypotheses H1–H7, with AI-driven performance monitoring
(4.78), AI-enhanced digital training (4.70), and technological readiness (4.58) providing robust evidence for
the impact of AI-augmented leadership. Bilal et al. (2024) emphasizes the role of communication in
coordination, which aligns with these findings.
Statistical Validation of Hypotheses
Multiple linear regression (R² = 0.72, adjusted R² = 0.69, VIF < 5) confirms the hypotheses, with R²
indicating that 72% of the variance in remote team performance is explained by the model, and adjusted R²
providing a conservative estimate accounting for predictor complexity. Residual plots verify normality and
homoscedasticity. The 20% remote employee sample strengthens model fit, with coefficients validated via
Shapiro-Wilk (p > 0.05), Breusch-Pagan (p > 0.05), and k-fold cross-validation (k=5). Sensitivity analyses
with propensity score weighting ensure robust coefficients. Moderation analysis confirms that technological
readiness moderates the effect of AI-enhanced training (H6a, β = 0.48, p < 0.01), and collectivism strengthens
the impact of AI-driven monitoring (β = 0.52, p < 0.01). Table 6 presents the regression results:
Table 6. Multiple Linear Regression Results
Hypothesis
CSF Category
β
p-value
Cohen’s f²
H1
Technological Readiness
0.44
<0.01
0.24
H2
Employee Engagement
0.39
<0.01
0.20
H3
AI-Driven Performance Monitoring
0.50
<0.01
0.32
H4
Work-Life Balance
0.30
<0.01
0.14
H5
AI-Facilitated Communication
0.36
<0.01
0.18
H6
AI-Enhanced Digital Training
0.46
<0.01
0.28
H6a
Moderation: Training × Tech Readiness
0.48
<0.01
0.30
H7
Risk Management
0.27
<0.01
0.12
Note: R² = 0.72, adjusted R² = 0.69. Validated with Shapiro-Wilk (p > 0.05), Breusch-Pagan (p > 0.05), and k-fold cross-validation
(k=5). Control variables (SME size, digital maturity) are included, slightly adjusting coefficients.
Source: Author Computation, 2025
Subgroup analysis (Table 7) reveals that manufacturing SMEs prioritize monitoring (β = 0.52) due to
operational needs, while tourism SMEs emphasize training (β = 0.48) for customer engagement, enhancing
applied value. Table 8 presents the correlation matrix and VIF, confirming discriminant validity. The
exploratory design cautions against overgeneralization, recommending Structural Equation Modeling (SEM)
for future studies.
Table 7. Subgroup Analysis by Sector
Sector
AI-Driven Monitoring (β)
AI-Enhanced Training (β)
Tourism
0.46
0.48
Manufacturing
0.52
0.44
Services
0.48
0.45
Note: Coefficients reflect sector-specific regression results, with p < 0.01. Manufacturing emphasizes monitoring, tourism
prioritizes training.
Source: Author Computation, 2025

ACCESS Journal:
Access to Science, Business, Innovation in Digital Economy
ISSN 2683-1007 (Online)
2025, 6(3), 615-633, https://doi.org/10.46656/access.2025.6.3(9)
https://journal.access-bg.org/
626
Table 8. Correlation Matrix and VIF
Variable
TR
EE
PM
WLB
COMM
TRN
RM
VIF
Technological Readiness (TR)
1.00
0.42
0.38
0.30
0.45
0.40
0.35
1.8
Employee Engagement (EE)
0.42
1.00
0.35
0.32
0.38
0.36
0.30
1.7
Performance Monitoring (PM)
0.38
0.35
1.00
0.28
0.40
0.37
0.33
1.9
Work-Life Balance (WLB)
0.30
0.32
0.28
1.00
0.29
0.31
0.27
1.6
Communication (COMM)
0.45
0.38
0.40
0.29
1.00
0.39
0.34
1.8
Training (TRN)
0.40
0.36
0.37
0.31
0.39
1.00
0.32
1.7
Risk Management (RM)
0.35
0.30
0.33
0.27
0.34
0.32
1.00
1.6
Note: All correlations p < 0.01. VIF < 5 indicates no multicollinearity, ensuring discriminant validity.
Source: Author Computation, 2025
Summary of Findings
The data gathered from 200 respondents indicates that artificial intelligence (AI)-driven performance
monitoring (4.78) and AI-enhanced digital training (4.70) emerge as the most significant customer satisfaction
factors (CSFs). The analysis further underscores the pivotal roles of technological readiness and employee
engagement in fostering organizational success (see Table 4 for further details). The issues of work-life balance
and risk management are of secondary importance. The findings presented herein have been substantiated
through meticulous regression and subgroup analyses (see Tables 6-7). These findings underscore the
transformative potential of artificial intelligence (AI) in Turkish small and medium-sized enterprises (SMEs).
For instance, an SME manufacturing entity in Izmir implemented an AI-driven monitoring system, resulting
in substantial productivity enhancements (β = 0.50, Table 4). Conversely, an SME in the tourism sector in
Antalya prioritized employee training (β = 0.48), thereby fostering enhanced employee engagement. In the
context of Turkey's collectivist culture, the utilization of AI tools has been demonstrated to facilitate the
establishment of trust and enhance efficiency. As illustrated in Table 3, the qualitative themes underscore the
significance of trust and ethical considerations, thereby offering further validation to the quantitative findings.
A toolkit for implementing artificial intelligence (AI) focuses on three key areas: auditing readiness, training
staff, and ensuring ethical use. This toolkit offers practical guidance for small- and medium-sized enterprises
(SMEs), with policy recommendations urging the Small and Medium Enterprise Support Organization
(KOSGEB) to fund AI training initiatives for scalability.
DISCUSSION AND CONCLUSION
The present study investigated the potential of AI-augmented digital leadership to enhance remote work
management (RWM) in Turkish SMEs. This investigation entailed the identification and validation of critical
success factors (CSFs). The findings substantiate the pivotal role of internal artificial intelligence (AI)
functions, particularly performance monitoring and digital training, in enhancing outcomes for remote teams.
These functions are hypothesized to contribute to enhanced team performance, as evidenced by the empirical
evidence presented in this study. The findings of this study serve to broaden the existing body of knowledge
ACCESS Journal:
Access to Science, Business, Innovation in Digital Economy
ISSN 2683-1007 (Online)
2025, 6(3), 615-633, https://doi.org/10.46656/access.2025.6.3(9)
https://journal.access-bg.org/
627
on the subject by shifting the analytical focus from customer-facing applications, which have been the primary
focus of previous literature (Omrani et al., 2024; Praswati et al., 2024), to internal, leadership-driven AI
practices. This redirection provides context-sensitive insights that are specific to collectivist and resource-
constrained environments. These insights have been underexplored in the field of technology adoption
research.
Although prior studies have underscored the significance of perceived usefulness and technical readiness
in propelling AI adoption (Hoang & Khoa, 2024; Wang et al., 2023), our findings offer a more profound
examination of this phenomenon by accentuating internal applications that fortify employee coordination and
digital trust. Contrary to the findings of studies conducted in more digitally mature or individualistic settings,
this research demonstrates that in Turkish SMEs, leadership-mediated AI tools are more likely to enhance
collective performance and compliance. This finding is consistent with and builds upon the tenets of the
Resource-Based View (RBV), as it illustrates that the strategic value of AI is contingent upon context,
manifesting most distinctly in instances where leadership culture and digital infrastructure converge. Contrary
to the findings of Chiguvi and Keneilwe (2023), which underscore work-life balance as a pivotal predictor of
remote performance, this study reveals a more nuanced role for it in Turkish SMEs, likely attributable to short-
term productivity pressures.
The integration of Transformational Leadership Theory (TLT) introduces a novel dimension that has been
scarcely addressed in previous AI studies. Contrary to the prevailing adoption models, which prioritize
managerial intent or technical capacity, our study demonstrates the potential of AI to foster inspirational
leadership within collectivist contexts. This finding aligns with recent literature emphasizing the importance
of organizational culture and ethical oversight (Anning-Dorson, 2021; Demir et al., 2017), contrasting with
Western-centric findings that prioritize autonomy over cohesion. In the Turkish context, where hierarchy and
relational trust are salient, AI's capacity to enhance transparency and consistency engenders a mechanism of
motivational alignment, thereby contradicting concerns that automation erodes human dynamics.
The qualitative themes that emerged from the data serve to reinforce these interpretations. The respondents
indicated that acceptance of AI is associated with transparency, ethical safeguards, and ease of use. This
suggests that adoption of AI is not solely driven by functionality, but also by relational and normative factors.
The aforementioned insights indicate that ethical design, data fairness, and user-centric implementation are not
peripheral considerations; rather, they are central to sustainable digital leadership. Collectivism and
technological readiness emerged as significant moderators, reinforcing the notion that successful adoption is
shaped by both infrastructure and values. These findings lend support to the call for collaborative, adaptive
systems put forth by Schmager et al. (2025), while underscoring the necessity for such systems to be anchored
in specific socio-cultural expectations.
This research addresses a significant gap in the extant literature by focusing on how internal, leadership-
facilitated AI applications affect remote workforce performance in collectivist, resource-constrained
environments. This area has been often overlooked in favor of Western-centric, technology-first studies. The
ACCESS Journal:
Access to Science, Business, Innovation in Digital Economy
ISSN 2683-1007 (Online)
2025, 6(3), 615-633, https://doi.org/10.46656/access.2025.6.3(9)
https://journal.access-bg.org/
628
study's findings provide empirical validation that leadership behaviors and cultural fit are not secondary but
integral to effective AI adoption, offering a culturally grounded expansion to TAM- and RBV-based models.
Theoretical Contributions
This research contributes to the theoretical discourse on AI in SMEs by integrating TAM, RBV, TLT, and
Algorithmic Management into a comprehensive framework. The present study proposes a novel framework
for conceptualizing the adoption of artificial intelligence (AI). Contrary to the conventional linear
technological upgrade model, this framework posits that AI adoption is best understood as a socio-technical
transition influenced by a complex interplay of leadership, trust, and organizational culture. Although the
Technology Acceptance Model (TAM) has historically placed significant emphasis on perceived ease and
usefulness, the present study proposes an extension of this logic to encompass the concept of culturally
embedded leadership trust (Canh Chi & Bui Thanh, 2024). This extension is particularly pertinent in non-
Western contexts, wherein the dynamics of authority and collectivism serve to moderate the adoption of
technology.
RBV's conceptualization of AI as a scarce and precious asset is contextualized here: within environments
characterized by limited resources yet collectivist tendencies, the adoption of AI is most robust when there is
congruence between organizational culture and infrastructure. TLT offers a nuanced perspective on this issue
by highlighting the potential of AI to foster team cohesion and purpose, beyond mere automation (Day et al.,
2021). This perspective stands in contrast to earlier applications of TLT in innovation literature, which have
overlooked the role of algorithmic structures in reinforcing inspirational motivation. Algorithmic Management
is positioned as both a tool of operational control and ethical accountability, particularly relevant in highly
structured SME settings. This extends the emphasis in Bibitayo Ebunlomo et al. (2024) on real-time monitoring
as a mechanism for oversight and transparency.
The present study contributes a scalable and adaptable model for AI leadership in varied global contexts by
outlining boundary conditions, including collectivist versus individualist cultures and high versus low digital
maturity. By doing so, it advances the theoretical conversation from static adoption models to dynamic,
culturally attuned leadership frameworks, providing explanatory power for underrepresented contexts, such as
Turkey's SME sector.
Practical and Policy Implications
The proposal of an AI implementation toolkit for SME leaders operating under financial, cultural, and
digital constraints is predicated on the data-driven insights of this study. The toolkit is composed of five stages.
The first stage is auditing technological readiness. The second stage is deploying user-friendly AI tools. The
third stage is delivering structured digital training. The fourth stage is embedding ethical safeguards. The fifth
stage is establishing feedback loops for adaptive scaling.
The AI Adoption Roadmap for SMEs (Figure 4) offers a visual representation of this process and functions
as a flexible guide. Sectoral application is imperative. For instance, manufacturing firms may benefit from

ACCESS Journal:
Access to Science, Business, Innovation in Digital Economy
ISSN 2683-1007 (Online)
2025, 6(3), 615-633, https://doi.org/10.46656/access.2025.6.3(9)
https://journal.access-bg.org/
629
real-time monitoring to optimize processes, while service-sector SMEs—such as those in tourism—can
leverage AI-based training to maintain quality in distributed workforces.
These recommendations are derived from the study's unique contributions and do not merely reflect generic
frameworks. The aforementioned parties have demonstrated an ability to respond to actual constraints
articulated by participants, including but not limited to a paucity of infrastructure, cultural resistance, and
concerns over surveillance or opacity. It is incumbent upon policymakers such as KOSGEB to utilize this
framework to inform incentive structures and support mechanisms. In doing so, priority should be given to
accessibility, local relevance, and ethical deployment.
Technology developers can utilize the results to enhance the usability and cultural sensitivity of AI
solutions. This can be achieved by incorporating user feedback and ethical-by-design principles at the outset
of product development. For instance, small- and medium-sized enterprises (SMEs) have indicated a
predilection for systems that exhibit seamless integration into established workflows, encompass customizable
transparency options, and prioritize employee autonomy.
Concurrently, the study underscores the necessity for robust AI ethics at the organizational level. In order
to ensure trust and sustained usage, it is imperative that privacy, algorithmic transparency, and participatory
design become embedded practices. In the context of hierarchical firms, these imperatives assume particular
significance. In such environments, transparency has the potential to serve as a catalyst for the reinforcement
of leadership legitimacy, rather than its disruption.
Figure 4. AI Adoption Roadmap for SMEs, A flowchart outlining five stages: (1) Assess Technological Readiness
(infrastructure audit), (2) Implement User-Friendly AI Tools (monitoring, chatbots), (3) Provide Training (virtual
modules), (4) Ensure Ethical Use (privacy guidelines), and (5) Monitor and Scale (continuous evaluation). Arrows
indicate progression, with feedback loops for iterative improvement.
ACCESS Journal:
Access to Science, Business, Innovation in Digital Economy
ISSN 2683-1007 (Online)
2025, 6(3), 615-633, https://doi.org/10.46656/access.2025.6.3(9)
https://journal.access-bg.org/
630
Despite the emphasis on Turkey, these strategies possess broader applications. A significant number of
emerging economies encounter comparable constraints and cultural dynamics. Consequently, the roadmap and
toolkit provide a transferable model for context-sensitive AI adoption in SMEs.
CONCLUSION
This study offers substantial evidence that AI-augmented digital leadership enhances remote work
effectiveness in SMEs by promoting transparency, structure, and employee engagement. The present study
has demonstrated that performance monitoring and digital training are both key drivers of success. This
conclusion is supported by both quantitative and qualitative data. The present findings extend the adoption
theory by integrating leadership, ethics, and cultural sensitivity into a cohesive framework.
The present study combines TAM, RBV, TLT, and Algorithmic Management to posit that AI can function
as both a strategic resource and a relational mechanism, capable of transforming SME workflows without
eroding trust or cohesion. The emphasis on collectivism and technological readiness as moderating forces
introduces significant boundary conditions for future applications.
The proposed AI roadmap and toolkit provide SME leaders and policymakers with a set of actionable steps
for navigating digital transformation. The ethical design of AI, the participatory rollout of that technology, and
the sector-specific tailoring of that technology are not merely optional; they are essential to ensure that AI
strengthens, rather than fragments, the workplace.
To further this research, three key directions are recommended: Firstly, longitudinal studies must be
conducted to evaluate the long-term effects of AI-augmented leadership practices on team dynamics and firm
performance. Secondly, cross-national comparisons will be utilized to assess the framework in various cultural
and institutional contexts. Thirdly, experimental designs or pilot programs with control groups are necessary
to isolate the causal mechanisms underlying AI's motivational and ethical effects.
While exploratory in scope, this study establishes a rigorous foundation for advancing both the theory and
practice of ethical, inclusive, and performance-oriented AI adoption in the global SME sector.
Conflict of interests
The author declares no conflict of interest.
Author Contributions:
Conceptualization, methodology, validation, formal analysis, investigation, resources, data curation, writing -
original draft preparation, writing - review and editing, visualization – S.A.
Author have read and agreed to the published version of the manuscript.
Informed Consent Statement: not applicable
Data Availability Statement:
The data presented in this study are available on request from the corresponding author.
Institutional Review Board Statement: not applicable

ACCESS Journal:
Access to Science, Business, Innovation in Digital Economy
ISSN 2683-1007 (Online)
2025, 6(3), 615-633, https://doi.org/10.46656/access.2025.6.3(9)
https://journal.access-bg.org/
631
References
Abikoye, B.E., Akinwunmi, T., Adelaja, A.O., Umeorah, S.C. & Mariam, Y. (2024). Real-time financial monitoring
systems: Enhancing risk management through continuous oversight. GSC Advanced Research and Reviews, 20(1),
465-476. https://doi.org/10.30574/gscarr.2024.20.1.0287
Ali, M., Khan, T. I., Khattak, M. N., & ŞEner, İ. (2024). Synergizing AI and business: Maximizing innovation,
creativity, decision precision, and operational efficiency in high-tech enterprises. Journal of Open Innovation:
Technology, Market, and Complexity, 10(3), 100352. https://doi.org/10.1016/j.joitmc.2024.100352
Anning-Dorson, T. (2021). Organizational culture and leadership as antecedents to organizational flexibility:
implications for SME competitiveness. Journal of Entrepreneurship in Emerging Economies, 13(5), 1309-1325.
https://doi.org/10.1108/jeee-08-2020-0288
Begum, H., Abbas, K., Alam, A. S. A. F., Song, H., Chowdhury, M. T., & Abdul Ghani, A. B. (2022). Impact of the
COVID-19 pandemic on the environment and socioeconomic viability: a sustainable production chain alternative.
Foresight, 24(3/4), 456-475. https://doi.org/10.1108/fs-02-2021-0053
Bilal, M., Xicang, Z., Jiying, W., Sohu, J. M., Akhtar, S., & Hassan, M. I. U. (2024). Digital Transformation and SME
Innovation: A Comprehensive Analysis of Mediating and Moderating Effects. Journal of the Knowledge Economy.
Vol. 16, pp.1153–1182, https://doi.org/10.1007/s13132-024-02054-0
Braun, V., & Clarke, V. (2006). Using thematic analysis in psychology. Qualitative Research in Psychology, 3(2), 77-
101. https://doi.org/10.1191/1478088706qp063oa
Carayannis, E. G., Dumitrescu, R., Falkowski, T., & Zota, N.-R. (2024). Empowering SMEs “Harnessing the Potential
of Gen AI for Resilience and Competitiveness”. IEEE Transactions on Engineering Management, 71, 14754-
14774. https://doi.org/10.1109/tem.2024.3456820
Chiguvi, D., & Bakani, K. (2023). Exploring the effects of remote work on employee productivity in Botswana amidst
the COVID-19 Pandemic. International Journal of Research in Business and Social Science, pp.2147- 4478, 12(6),
101-117. https://doi.org/10.20525/ijrbs.v12i6.2505
Cooper, V. A. (2008). The critical success factor method: a review and practical example. CONF-IRM, 2008
Proceedings, Niagara Falls, Ontario, Canada
Day, D., Bastardoz, N., Bisbey, T., Reyes, D., & Salas, E. (2021). Unlocking Human Potential through Leadership
Training & Development Initiatives. Behavioral Science & Policy, 7(1), 41-54.
https://doi.org/10.1177/237946152100700105
Dela Cruz, N. A., Villanueva, A. C. B., Tolin, L. A., Disse, S., Lensink, R., & White, H. (2023). PROTOCOL: Effects
of interventions to improve access to financial services for micro-, small- and medium-sized enterprises in low-
and middle-income countries: An evidence and gap map. Campbell Systematic Reviews, 19(3), e1341.
https://doi.org/10.1002/cl2.1341
Demir, M., Guney, S., Akyürek, S., Uğural, M. N., & Aslan, I. (2017). Effect of Managers’ Organizational Justice
Understanding on the Level of Employees’ Organizational Commitment and Job Satisfaction. Revista De
Cercetare Si Interventie Sociala, 146-165
Dutta, S., Dwivedy, N.N., Chhibber, P. (2024). Human Resource: Futuristic Role of HR Professional Enhancing
Technical Skills. Interantional Journal of Scientific Research in Engineering and Management, 08(05), 1-5.
https://doi.org/10.55041/ijsrem33378
Eisenhardt, K. M., & Schoonhoven, C. B. (1996). Resource-based View of Strategic Alliance Formation: Strategic and
Social Effects in Entrepreneurial Firms. Organization Science, 7(2), 136-150. https://doi.org/10.1287/orsc.7.2.136
Gao, J., Jia, R., & Su, Q. (2022). Turkey. In J. Gao, R. Jia, & Q. Su (Eds.), G20 Entrepreneurship Services Report, pp.
253-262. Palgrave Macmillan, Springer Nature Singapore. https://doi.org/10.1007/978-981-16-6787-9_19
Ghardallou, W. (2023). The heterogeneous effect of leverage on firm performance: a quantile regression analysis.
International Journal of Islamic and Middle Eastern Finance and Management, 16(1), 210-225.
https://doi.org/10.1108/imefm-12-2021-0490
Hamdat, A., B, C., Samalam, A. G., Rizal, M., & Lawalata, I. L. D. (2024). The Impact of Management Information
Systems on Decision-Making Efficiency. Vifada Management and Digital Business, 1(2), 56-74.
https://doi.org/10.70184/qpw1rq78
Harrigan, P., Ramsey, E., & Ibbotson, P. (2008). e‐CRM in SMEs: an exploratory study in Northern Ireland. Marketing
Intelligence & Planning, 26(4), 385-404. https://doi.org/10.1108/02634500810879296
ACCESS Journal:
Access to Science, Business, Innovation in Digital Economy
ISSN 2683-1007 (Online)
2025, 6(3), 615-633, https://doi.org/10.46656/access.2025.6.3(9)
https://journal.access-bg.org/
632
Henke, J. B., Jones, S. K., & O'Neill, T. A. (2022). Skills and abilities to thrive in remote work: What have we learned.
Frontiers in Psychology, 13, 893895. https://doi.org/10.3389/fpsyg.2022.893895
Hoang, C.C., & Khoa, B.T. (2024). Exploring the role of knowledge management capacity on SMEs’ digital
transformation intentions: Integrating signaling theory and the technology acceptance mode. Journal of Economics
and Development (JED), 48-62. https://doi.org/10.33301/jed-05-2024-0048
Hoffmann, F., Bertram, T., Mikut, R., Reischl, M., & Nelles, O. (2019). Benchmarking in classification and regression.
WIREs Data Mining and Knowledge Discovery, 9(5). https://doi.org/10.1002/widm.1318
Ibekwe, A, I. (2024). Effect of Urbanization on the Performance SMES in Anambra State Nigeria. British Journal of
Management and Marketing Studies, 7(2), 111-128. https://doi.org/10.52589/bjmms-bvqxmnbo
İncekara, M., Çoban Kumbali, H., & Sarikaya, M. (2023). The Transformation Process of Turkish SMEs in Terms of
Digitalization and Sustainability. International Journal of Economics and Administrative Studies, 41(41), 1-15.
https://doi.org/10.18092/ulikidince.1133377
Lilly, M., Asrafi, S. (2025). AI-Enhanced Remote Work Management: Achieving Synergy Between Automation and
Human Insight. Journal of Information Systems Engineering and Management, 10(32s), 151-160.
https://doi.org/10.52783/jisem.v10i32s.5198
Malapane, T. A., & Ndlovu, N. K. (2024). Assessing the Reliability of Likert Scale Statements in an E-Commerce
Quantitative Study: A Cronbach Alpha Analysis Using SPSS Statistics. 2024 Systems and Information
Engineering Design Symposium (SIEDS), 90-95. https://doi.org/10.1109/SIEDS61124.2024.10534753
Małkowska, A., Urbaniec, M., & Kosała, M. (2021). The impact of digital transformation on European countries:
insights from a comparative analysis. Equilibrium. Quarterly Journal of Economics and Economic Policy, 16(2),
325-355. https://doi.org/10.24136/eq.2021.012
Martinsuo, M., & Luomaranta, T. (2018). Adopting additive manufacturing in SMEs: exploring the challenges and
solutions. Journal of Manufacturing Technology Management, 29(6), 937-957. https://doi.org/10.1108/jmtm-02-
2018-0030
Miškufová, M., Košíková, M., Vašaničová, P., & Kiseľáková, D. (2025). Digitalization and Artificial Intelligence: A
Comparative Study of Indices on Digital Competitiveness. Information, 16(4), 286.
https://doi.org/10.3390/info16040286
Möhlmann, M., Zalmanson, L., Henfridsson, O., & Gregory, R. W. (2021). Algorithmic Management of Work on
Online Labor Platforms: When Matching Meets Control. MIS Quarterly, 45(4), 1999-2022.
https://doi.org/10.25300/misq/2021/15333
Mustajab, D. (2024). Exploring the Effectiveness of Remote and Hybrid Work Policies: A Literature Review on
Workforce Management Practices. Jurnal Manajemen Bisnis, 11(2), 891-908.
https://doi.org/10.33096/jmb.v11i2.798
Nikolova-Alexieva, V., Alexieva, I., Valeva, K., Petrova, M. (2022). Model of the Factors Affecting the Eco-Innovation
Activity of Bulgarian Industrial Enterprises. Risks 2022, 10(9), 178. https://doi.org/10.3390/risks10090178
Ogbu, A.D. Ozowe, W., Ikevuje, A.H. 2024). Remote work in the oil and gas sector: An organizational culture
perspective. GSC Advanced Research and Reviews, 20(1), 188-207.
https://doi.org/10.30574/gscarr.2024.20.1.0261
Olawale, O., Ajayi, F.A., Udeh, C.A., Odejide, O.A. (2024). Remote Work Policies for It Professionals: Review of
Current Practices and Future Trends. International Journal of Management & Entrepreneurship Research, 6(4),
1236-1258. https://doi.org/10.51594/ijmer.v6i4.1056
Omokhoa, H. E., Odionu, C. S., Azubuike, C., & Kwaghter Sule, A. (2025). Building High-Performance Teams and
Enhancing Staff Training Through AI-Driven Solutions in Financial Institutions and SMEs. International Journal
of Research and Innovation in Social Science, VIII(XII), 2976-2984. https://doi.org/10.47772/ijriss.2024.8120246
Omrani, N., Rejeb, N., Maalaoui, A., Dabić, M., & Kraus, S. (2024). Drivers of Digital Transformation in SMEs. IEEE
Transactions on Engineering Management, 71, 5030-5043. https://doi.org/10.1109/tem.2022.3215727
Petrova, M., Tairov, I. (2022). Solutions to Manage Smart Cities’ Risks in Times of Pandemic Crisis. Risks, 10, (12)
240. https://doi.org/10.3390/risks10120240
Praswati, A. N., Sukresna, I. M., Muna, N., & Muna, N. (2024). The adoption of business-to-consumer commerce for
small and medium enterprises growth. Uncertain Supply Chain Management, 12(3), 2051-2062.
https://doi.org/10.5267/j.uscm.2024.2.001

ACCESS Journal:
Access to Science, Business, Innovation in Digital Economy
ISSN 2683-1007 (Online)
2025, 6(3), 615-633, https://doi.org/10.46656/access.2025.6.3(9)
https://journal.access-bg.org/
633
Saklani, D. D. R., Meena, S., & Suri, S. (2023). Examining the Benefits and Drawbacks of Remote Work in the
Information Technology Industry. National Journal of Arts, Commerce & Scientific Research Review.
https://doi.org/10.52458/23944870.2023.v10.iss2.kp.a1
Schmager, S., Pappas, I. O., & Vassilakopoulou, P. (2025). Understanding Human-Centred AI: a review of its defining
elements and a research agenda. Behaviour & Information Technology, 1-40.
https://doi.org/10.1080/0144929x.2024.2448719
Sinulingga, G., Gunawan, A., Wibowo, U. D. A., Rina, R., & Aprilia, H. D. (2024). Talent Management in the Age of
Digital Disruption: Challenges and Opportunities. Global International Journal of Innovative Research, 2(9),
2217-2230. https://doi.org/10.59613/global.v2i9.311
Sjoding, M. W., & Liu, V. X. (2016). Can You Read Me Now? Unlocking Narrative Data with Natural Language
Processing. Annals of the American Thoracic Society, 13(9), 1443-1445.
https://doi.org/10.1513/AnnalsATS.201606-498ED
Sun, L., & Bunchapattanasakda, C. (2019). Employee Engagement: A Literature Review. International Journal of
Human Resource Studies, 9(1), 63-80. https://doi.org/10.5296/ijhrs.v9i1.14167
Truong , H. T. L. ., Nguyen , T. N. ., Tran, P. V. ., & Le, T. T. (2024). Impact of AI on Self-learning Capabilities of
Employees in SMEs: A Case Study in Ho Chi Minh City, Vietnam. Journal of Resilient Economies, 4(2).
https://doi.org/10.25120/jre.4.2.2024.4176
Ugural, M., & Giritli, H. (2021). Three-Way Interaction Model for Turnover Intention of Construction Professionals:
Some Evidence from Turkey. Journal of Construction Engineering and Management, 147(4), 04021008.
https://doi.org/10.1061/(asce)co.1943-7862.0002012
Ugural, M. N., Aghili, S., & Burgan, H. I. (2024). Adoption of Lean Construction and AI/IoT Technologies in Iran’s
Public Construction Sector: A Mixed-Methods Approach Using Fuzzy Logic. Buildings, 14(10), 3317.
https://doi.org/10.3390/buildings14103317
Venkatesh, V., & Bala, H. (2008). Technology Acceptance Model 3 and a Research Agenda on Interventions. Decision
Sciences, 39(2), 273-315. https://doi.org/10.1111/j.1540-5915.2008.00192.x
Wang, C., Ahmad, S. F., Bani Ahmad Ayassrah, A. Y. A., Awwad, E. M., Irshad, M., Ali, Y. A., Al-Razgan, M., Khan,
Y., & Han, H. (2023). An empirical evaluation of technology acceptance model for Artificial Intelligence in E-
commerce. Heliyon, 9(8), e18349. https://doi.org/10.1016/j.heliyon.2023.e18349
Wang, Y., Hou, M., Plataniotis, K. N., Kwong, S., Leung, H., Tunstel, E., Rudas, I. J., & Trajkovic, L. (2021). Towards
a theoretical framework of autonomous systems underpinned by intelligence and systems sciences. IEEE/CAA
Journal of Automatica Sinica, 8(1), 52-63. https://doi.org/10.1109/jas.2020.1003432
Yusuf, S.O., Durodola, R.L., Ocran, G., Abubakar, J.E., Echere, A.E. and Paul-Adeleye, A.H. (2024). Challenges and
opportunities in AI and digital transformation for SMEs: A cross-continental perspective. World Journal of
Advanced Research and Reviews, 23(3), 668-678. https://doi.org/10.30574/wjarr.2024.23.3.2511
About the author
Sefer AYDOĞAN,
Doctor of Management and Organizations sciences, Assistant
Professor at the National Defence University Istanbul, Turkey.
Research interests: Aviation management, safety management
systems, quality factors of aviation services, Industry 5.0, United
Nations Sustainable Development Goals (SDGs), service quality
management, leadership, green management, organizational
citizenship behaviour, and decision-making in complex systems.
ORCID ID: 0000-0002-0431-4256
This work is licensed under the Creative Commons Attribution International License (CC BY)

ACCESS Journal:
Access to Science, Business, Innovation in Digital Economy
ISSN 2683-1007 (Online)
2025, 6(3), 634-667, https://doi.org/10.46656/access.2025.6.3(10)
https://journal.access-bg.org/
634
DESIGN INSIGHTS FROM THE LANDSCAPE OF SUSTAINABILITY APPS
Eva Cipi1
*
, Eljona Zanaj2, Marsia Cipi3, Betim Cico4
1), 2) University Ismail Qemali Vlore, Vlore, Albania
3)University of Italian Switzerland, Lugano, Switzerland
4)University Epoka, Tirana, Albania
e-mails: 1eva.cipi@univlora.edu.al, 2eljona.zanaj@univlora.edu.al, 3cipi.cipi.mc@gmail.com, 4b.cico@epoka.edu.al
Received: 27 August 2025 Accepted: 21 Sept 2025 Online Published: 24 September 2025
ABSTRACT
Mobile applications serve as essential tools for supporting sustainable behaviour change. This work investigates the
current landscape of sustainability-related mobile applications and explores how their design strategies influence user
engagement, ethical perception, and behavioural motivation. App developers can receive valuable design insights
through user experience analysis and digital sustainability principles to support their work. The research investigates
this topic through a mixed-methods exploratory methodology. The researcher selected 54 sustainability applications from
the Google Play Store by combining thematic criteria with interaction-based criteria. The sustainability-focused mobile
applications fell into categories based on their interaction mechanisms), environmental focus aligned with the global
SDGs for enhancing the understanding and value of these themes, and, lastly, user review accessibility. The VADER
model performed sentiment analysis to quantify the overall user satisfaction patterns found in reviews. Latent Dirichlet
Allocation was used to perform topic modelling to identify fundamental user concerns and underlying themes within the
data. The research methods enabled the evaluation of how app features such as gamification, personalization, content
transparency, etc., influence user perception, as well as sustain their engagement. The research demonstrates that apps
achieve success beyond basic informative content and surface-level gamified features. Users seek apps that offer
straightforward interfaces, integrated with motivational content that connects abstract sustainability targets to specific
daily activities, also preserving a decent performance. This research contributes to the growing field of digital
sustainability by bridging the gap between app design and user expectation, offering a holistic perspective on how mobile
technologies support sustainable living.
Keywords: mobile applications; sustainability; user interaction strategy; LDA modeling
JEL classification: O10, O32, P17
Paper type: Research article
Citation: Cipi, E., Zanaj, E., Cipi, M., Cico, B. (2025). Design insights from the landscape of sustainability apps. Access
to science, business, innovation in the digital economy, ACCESS Press, 6(3), 634-667,
https://doi.org/10.46656/access.2025.6.3(10)
INTRODUCTION
Mobile applications have transformed from basic task-based tools into sophisticated systems which modify
human conduct in individual and collective ways. Mobile applications for sustainability serve as a promising
solution to address essential environmental issues through their promotion of resource conservation, waste
reduction and sustainable consumption practices (Law et al., 2011), (Mulcahy et al., 2018). They have created
a blend of educational content with interactive elements and motivational tactics to establish this way an
innovative platform that merges technological innovation with environmental protection. That being said, the
*
Corresponding author, Eva Cipi-eva.cipi@univlora.edu.al
ACCESS Journal:
Access to Science, Business, Innovation in Digital Economy
ISSN 2683-1007 (Online)
2025, 6(3), 634-667, https://doi.org/10.46656/access.2025.6.3(10)
https://journal.access-bg.org/
635
actual effectiveness of such digital tools being used to change behaviour is still under careful study efforts
despite the clear potential to influence behaviour.
The role of mobile applications as catalysts for sustainable behaviour is observed through multiple
interconnected ways. They have managed to achieve resource optimization through real-time monitoring
systems which combine data-driven decision-making with user-centric interfaces. The fast evolution of
technology together with shifting user requirements, however, generates significant barriers to assessing the
long-lasting effects. Evaluating an app only through an isolated mechanism of pure user review access may
make the whole process vulnerable to misleading results and incompleteness. Yet, such traditional sources of
gaining user feedback are not to be discarded as they still manage to indicate valuable insights when analysed
thoroughly and interpreted mindfully. It is important to remark that the ratings users give to apps may represent
their immediate feelings or marketing effects instead of showing how the app affects users in the long run or
supports sustainability targets. User feedback contains valuable information yet needs systematic evaluation
to extract significant patterns while preventing broad interpretations. The field of sustainability app assessment
lacks a standardized method to analyse user-generated data because it does not follow established evaluation
models in contrast to well-established evaluation models in fields like digital health (Henson et al., 2019). This
gap points to the need for more nuanced and multidimensional methods that can account for the complex
relationship between app features, user experience, and environmental impact.
Based on the current trends, digital sustainability is depicted as capitalizing on advanced analytics and
machine learning to provide customized recommendations and immediate feedback. In addition, these
applications transform into community empowerment platforms that enable collaborative governance and
connect individual actions to broader policy objectives. One example that could be given is The Internet of
Things (IoT)—once merged with mobile technology, it allows for detailed environmental metric tracking that
leads to improved transparency and accountability (Hanggoro et al., 2013). The design and deployment of
these technologies now prioritize ethical considerations, including data privacy and user consent and
transparency, because society is increasingly aware of their social impact (Castillo et al., 2018), (Hunger et al.,
2023). As the revolution taking place in these digital grounds transforms the traditional take on environmental
management, through sustainable mobile apps it must be made possible for community empowerment and
suitable policy innovations to harmoniously advance alongside technology.
Research studies have investigated different aspects of mobile applications for sustainability by studying
their design elements and engagement mechanisms, as well as their ability to create enduring positive
behavioural shifts. Research shows that gamification techniques—where game mechanics and dynamics are
applied to non-game contexts—enhance user motivation, however, sustainability applications do not uniformly
incorporate such elements (Douglas et al., 2021). And in the context of sustainability applications, gamification
is not merely about making experiences fun but about fostering meaningful user interaction that supports pro-
environmental behaviour change. Core elements include points, badges, leaderboards, challenges, feedback
loops, progress bars, avatars, narrative framing, and social interaction or comparison mechanisms. These
ACCESS Journal:
Access to Science, Business, Innovation in Digital Economy
ISSN 2683-1007 (Online)
2025, 6(3), 634-667, https://doi.org/10.46656/access.2025.6.3(10)
https://journal.access-bg.org/
636
elements leverage intrinsic and extrinsic motivators to nudge behaviour, often rooted in behaviour change
theory and persuasive system design models.
The wide range of design approaches and motivational techniques for the user leads applications to function
either as information sources or as systems that use persuasive elements such as challenges, rewards and
progress tracking to guide behaviour. Despite such variations offering valuable insights about digital
sustainability advocacy, the inherent challenge in assessing and comparing apps based on a consistent set of
criteria prevails. This missing structured guidance has marked an inconvenient stagnation in the journey of
evolving toward the adoption of a green mindset, where actions are supposed to be taken mindfully for us to
prosper in unison with the environment. Developers can play an important and powerful role in designing
applications that truly aid in facilitating sustainable behaviour instead of releasing apps that merely employ
green rhetoric.
Because the market for sustainability-focused digital tools in app stores is becoming increasingly saturated,
many developers—especially those operating on limited timelines or resources—do not typically conduct in-
depth research into the broader app landscape before launching new designs. As a result, there is a risk of
unintentionally repeating design flaws, overlooking emerging user needs, or producing tools that feel outdated
or redundant in the fast-evolving digital environment. This growing complexity and lack of visibility into prior
efforts underscore the need for a flexible, principle-based guide. Such a guide would not only help developers
better understand the current state of the market but also encourage critical reflection on the sustainability
values their apps aim to promote—ultimately supporting the creation of more thoughtful, impactful digital
tools.
As digital sustainability tools continue to evolve, new app features and interaction patterns frequently
emerge, while older approaches may require rethinking. This ongoing innovation makes it difficult to create
static evaluation models. Rather than attempting to define a rigid standard, this research aims to offer a flexible,
principle-based resource that developers can draw on to reflect more critically on their design choices. The
focus is not on prescribing strict criteria but on fostering awareness of key design dimensions that shape user
experience and influence sustainable behaviour.
This guide is meant to serve as a starting point for sustainable app creators, and it can be seen as a tool to
inspire mindful design rather than dictate best practices. It encourages reflection on questions like: What kind
of behaviours are we promoting? Are our gamification techniques meaningful or merely decorative? Are we
supporting users’ autonomy, or nudging them too aggressively? By organizing and analysing current
sustainability-focused apps along various dimensions, this research highlights patterns, gaps, and emerging
trends that can inform future app design.
Ultimately, the work carried for this research contributes by offering a grounded overview of the current
sustainability app landscape, informed by a multidimensional analysis. Drawing on insights from gamification
literature, persuasive technology, and digital sustainability, the findings aim to support designers in creating
more effective, ethical, and motivating tools that align with the observed users’ environmental values. The
ACCESS Journal:
Access to Science, Business, Innovation in Digital Economy
ISSN 2683-1007 (Online)
2025, 6(3), 634-667, https://doi.org/10.46656/access.2025.6.3(10)
https://journal.access-bg.org/
637
following sections present a comprehensive literature review, the methodology used to analyse app features
and user feedback, and the resulting guidance derived from this study based on the insights drawn from the
employed analytical methods.
LITERATURE REVIEW
Integrating Sustainability into Mobile Applications
New research evidence disputes the conventional understanding of mobile apps as mere passive instruments
and demonstrates their ability to actively change human behaviour. A study emphasized that apps form
alliances with other systems, instead of simply serving pre-existing human goals, creating unexpected
interactions and possessing the potential to radically change habits (Schwanen et al., 2015). This new
perspective holds fundamental importance in sustainability considering mobile apps for sustainable mobility,
waste management, and green food practices can reconfigure how people handle resources and protect the
environment (Vo-Thanh et al., 2021; Schwanen et al., 2015; Varsolo Sunio et al., 2017). However, while this
literature recognizes the disruptive potential of apps, it does not fully clarify which design mechanisms are
most effective in producing sustained changes. This study builds on these insights by directly exploring the
interplay between app features and user-driven behavioural transformation in sustainability contexts.
There has been extensive research on persuasive technology which functions as a mechanism to promote
desired behavioural modifications. The Persuasive Systems Design (PSD) model presents a detailed
framework that explains how mobile apps can influence users toward sustainable behaviour adoption (Sunio
et al., 2017). Waste management applications utilize reduction and personalization alongside tailoring and
self-monitoring persuasive strategies to reduce user effort in target behaviours while providing ongoing
feedback (Suruliraj et al., 2020). The research demonstrates users will interact extensively with systems that
deliver appropriate guidance to reach behavioural targets and deliver individualized information that supports
knowledge absorption through clear explanations.
Existing studies often remain descriptive, cataloguing persuasive features without systematically
evaluating which strategies are most impactful in real-world sustainability applications. Our study addresses
this gap by examining both the design strategies and user perceptions, thereby linking persuasive features to
measurable outcomes.
People are expected to be made aware of the impact that the development of certain software has on the
environment. Empowering these potential users with the tools to discern the quality of the product being
offered to them, and decide whether it is aligned with the principles it was constructed on and for which it is
being marketed to them, will serve to support a transparent and sustained evolution of the software, improving
its usefulness and relevancy in terms of sustainability support (Lago et al., 2011). The use of persuasive
strategies in waste management and environmental conservation found in current literature demonstrates
considerable variation between applications. The communication approach in these applications includes both
textual and visual elements and digital personas for better user interaction. However, to emphasize once again
ACCESS Journal:
Access to Science, Business, Innovation in Digital Economy
ISSN 2683-1007 (Online)
2025, 6(3), 634-667, https://doi.org/10.46656/access.2025.6.3(10)
https://journal.access-bg.org/
638
the major problem of failing to view sustainability holistically, a recurring challenge is that many apps still
focus predominantly on environmental impact without addressing societal or economic dimensions of
sustainability (Guillén et al., 2022). This narrow focus constitutes a critical research gap: sustainable app
design is rarely examined from a “triple bottom line” perspective. Our study makes this connection explicit by
assessing not only environmental outcomes but also how societal and economic considerations are
embedded—or neglected—in mobile app design.
Ethical Considerations in Persuasive System Design
As persuasive strategies are increasingly incorporated into mobile applications to promote sustainable
behaviour, it is critical to investigate the ethical boundaries that distinguish beneficial and desirable persuasion
from manipulative influence. Persuasive technologies, especially those with a focus on sustainability, are
acting not just as instrumental intermediaries, but as active social actors that influence in nuanced ways the
behaviour and attitudes of users (Fogg, 2003). While digital interventions such as gamification (discussed in
the next section), social comparison, or nudges can support environmental goals, they simultaneously raise
significant ethical concerns when deployed without sufficient transparency, user autonomy, or accountability
(Berdichevsky et al., 1999; Benner et al., 2021; Benner et al., 2022). Despite these concerns, ethical
frameworks are still only sporadically applied in the evaluation of sustainability apps. Our study emphasizes
this gap by foregrounding the ethical implications of persuasive design, linking them to practical
recommendations for app development.
One of the fundamental ethical challenges in PSD is the imbalanced power dynamic between designers and
users. Designers possess the ability to influence decisions and actions in subtle ways, sometimes by relying
on users’ psychological biases. Researchers have categorized manipulative design techniques—like forced
actions, sneaking, and interface interference—into “dark patterns”, warning that they risk eroding consumer
decision-making autonomy and could lead to accidental purchases or emotional manipulation (Ahuja et al.,
2021). However, little empirical work has tested how sustainability-focused apps may unintentionally
reproduce these dark patterns. By examining user feedback alongside design strategies, this study highlights
whether sustainability apps strike the right balance between persuasion and autonomy.
Ethical frameworks suggest transparency, voluntary participation, and alignment with user well-being, but
in practice these principles are unevenly implemented. The research gap here lies in the limited integration of
value-sensitive design and participatory approaches into mainstream sustainability app development. Our
analysis connects this gap to a practical need: understanding how ethical design can both protect user
autonomy and enhance behavioural outcomes in the sustainability domain.
Gamification as a Catalyst for Sustainable Behaviour
Gamification as a preferred design strategy for digital advocacy applications seems extremely promising to
foster user engagement while influencing behavioural patterns. Developers embed game elements such as
ACCESS Journal:
Access to Science, Business, Innovation in Digital Economy
ISSN 2683-1007 (Online)
2025, 6(3), 634-667, https://doi.org/10.46656/access.2025.6.3(10)
https://journal.access-bg.org/
639
badges and leaderboards into routine applications to create an entertaining experience for users that helps boost
retention and app longevity (Law et al., 2011). Research has shown that gamified challenges lead to higher
enjoyment and knowledge acquisition, which can result in real behavioural transformations (Mulcahy et al.,
2018). Yet, while gamification is widely studied in education and health, its application in sustainability
remains fragmented, leaving a gap in evidence on which mechanics truly drive long-term ecological behaviour
change.
It is important to remark that sustainability apps often lack gamification features, and those that incorporate
them do not do so uniformly. The absence of comprehensive gamification frameworks causes uncertainty
about which design methods succeed in sustaining engagement. This inconsistency highlights a gap our study
addresses by systematically examining how gamification features interact with sustainability goals, moving
beyond descriptive accounts toward critical assessment.
Concerns about “pointsification” reveal that superficial reliance on points and badges may undermine
deeper motivations (Khaleel et al., 2016). Despite these warnings, empirical evidence about the long-term
risks of gamification in sustainability remains scarce. This study explicitly links these theoretical risks with
real-world user perceptions, identifying where gamification enhances sustainability—and where it risks
trivializing it.
Current Evaluation Criteria for Mobile Apps
For assessing sustainability applications, diverse evaluation methods have been used, but none is yet
standardized. Health and education fields, by contrast, have developed frameworks such as MARS and
ABACUS, which combine usability, privacy, effectiveness, and behavioural impact (Douglas et al., 2021;
Hensher et al., 2021). The absence of a sustainability-specific evaluation framework is a critical gap, as
sustainability apps share similar challenges but lack established quality benchmarks.
Recent attempts, such as applying ABACUS to sustainability apps, have shown promise in combining
feature analysis with user review evaluation (Brauer et al., 2016; Hunger et al., 2023). Nevertheless, these
efforts are still preliminary, leaving open the question of how to comprehensively evaluate apps that merge
technical performance, persuasive design, and ethical integrity. This study contributes by drawing lessons
from health and behavioural frameworks and adapting them to sustainability apps, thereby addressing the
identified gap.
Final Synthesis
In sum, while the literature establishes that sustainability apps hold significant potential through persuasive
design and gamification, major gaps remain in understanding (1) which persuasive and gamified features are
most effective, (2) how ethical concerns are integrated into design and evaluation, and (3) how sustainability
apps should be systematically assessed through robust frameworks. This study explicitly connects these gaps
to its contribution by examining design strategies, ethical implications, and evaluation needs together, offering
a more holistic and critical analysis of mobile apps for sustainability.
ACCESS Journal:
Access to Science, Business, Innovation in Digital Economy
ISSN 2683-1007 (Online)
2025, 6(3), 634-667, https://doi.org/10.46656/access.2025.6.3(10)
https://journal.access-bg.org/
640
EXPLORING DESIGN PRINCIPLES FOR SUSTAINABLE MOBILE APPLICATIONS
Mobile applications that address sustainability challenges require their design to align with usability and
engagement targets while meeting environmental and ethical requirements. The following section combines
sustainable and green UX/UI design best practices with mobile app design and user-centred ethics guidelines,
drawing on industry reports, design agency insights, and expert blog publications.
Minimizing Environmental Impact through User Experience
As a first step, sustainable design requires an application to have a reduced digital and environ- mental
footprint. This is achievable by optimizing User Experience (UX), to decrease energy consumption and
processing power usage. An example of what can be categorized as UX optimization is using weight reduction
techniques for the minimization of high-resolution multi- media elements like images, videos, and complex
animations, enabling applications to achieve both faster loading speeds and decreased data usage.
Subsequently, CO emissions associated with data transfer and processing are reduced considerably (The
Beetroot Team, 2024; Magic minds, 2023).
There is another article that supports the idea of using compressed multimedia assets and provides
additional ways to converge to mindful app design, including efficient coding practices and app bloat
reduction. Users are enabled in this way to finish tasks through fewer clicks and navigation steps, reducing
their screen time and energy usage. These methods ensure an improvement in ecological efficiency while also
enhancing user satisfaction (Levent, 2023)
Balancing Engagement and Sustainability
Sustainable app design is expected to create a balance between engagement strategies and ethical as well as
environmental concerns. The implementation of gamification and habit loops for user retention improvement
requires careful consideration. An exclusive focus on engagement can marginalize sustainable practices,
leading to increased device usage, push notification fatigue, and superficial reward systems that further
promote consumerism. This is, in fact, supported by the literature, as discussed in the respective section, which
highlights how certain efforts can backfire—hindering genuine change by reinforcing the very sources of the
problem (Levent, 2023; Paschal, 2025).
Designers should implement mindful interactions that help users achieve their goals without creating
distractions or excessive resource consumption. Users gain control over their experience through customizable
notification preferences, energy-saving features, and data collection transparency that enables them to make
conscious choices regarding their preferences (RIB Software, 2024). The techniques work to create enduring
user behaviour modifications which support sustainability objectives.
Behaviour Change Design Techniques Beyond Gamification
ACCESS Journal:
Access to Science, Business, Innovation in Digital Economy
ISSN 2683-1007 (Online)
2025, 6(3), 634-667, https://doi.org/10.46656/access.2025.6.3(10)
https://journal.access-bg.org/
641
"Make It Personal: The Persuasive Power of ’Me’ and ’My’". The process of personalization makes
sustainability goals and actions more relevant and motivating through individualized framing. The approach
includes tailoring feedback to match user-specific contexts and habits, encouraging self-monitoring and
reflection, as well as goal creation that aligns with one’s own personal beliefs.
"Tip the Scales: How Perceptions of Losses and Gains Influence Our Choices". This category leverages
insights from behavioural economics by framing choices to highlight perceived gains or losses. The way this
works is that apps can use two different approaches to encourage the adoption of sustainable behaviour: either
by showing users the advantages of sustainable actions (health benefits and cost reductions), or the negative
outcomes of inaction (environmental harm and resource waste).
"Craft the Journey: Why the Entire Experience Matters". In this case it is grasped that behaviour change
does not happen through isolated individual interactions. It rather needs a well-planned user journey.
"Set Up the Options: Setting the Stage for the Desired Decision". The process of choice architecture
functions as a key mechanism to steer users toward sustainable choices. Designers should establish eco-
friendly options as default choices while minimizing decision fatigue through restricted unnecessary choices
and implementing prompts or reminders at decision points.
"Keep It Simple: Avoiding Undesirable Outcomes". Behaviour change becomes difficult when people
encounter complicated or overwhelming situations. Users maintain their motivation and consistency when
interfaces are simplified and barriers as well as interruptions are reduced or avoided.
The implementation of these behaviour change strategies in sustainable app design enables authentic user
engagement and interaction through autonomy and respect while avoiding manipulative practices. These
methods enhance gamification techniques by handling psychological and contextual elements that affect
behaviour which leads to more effective and sustainable pro-environmental actions.
Green IT and Sustainable Development Practices
Shifting the lens beyond the interface, backend operational practices are also responsible for affecting the
environment. The implementation of green IT strategies that support digital sustainability includes practices
such as selecting a host server that is powered by renewable energy, reducing server load, and using efficient
databases and APIs (Becker et al., 2022).
This architecture behind mobile app development can also adopt the principles of modularity and
adaptability to extend product lifespan while minimizing the need for frequent updates which in turn leads to
software obsolescence and increased energy usage (RIB Software, 2024).
Ethics and Inclusivity
Despite it being intuitive, it is important to be explicit in stating that green design does, indeed, stand in both
social and ethical dimensions. The “Society-Centered Design” movement and “Climate Designers” network
ACCESS Journal:
Access to Science, Business, Innovation in Digital Economy
ISSN 2683-1007 (Online)
2025, 6(3), 634-667, https://doi.org/10.46656/access.2025.6.3(10)
https://journal.access-bg.org/
642
state that ethical technology must protect user rights while making products accessible to them and building
community empowerment (Climate Designers, 2025; IF.Society centered design, 2025).
The design approach of inclusivity makes sure applications function well for users from groups with
different sets of abilities, cultural backgrounds, and device access. Applications that undertake the
sustainability mission, gain greater impact by involving the community in design processes and promoting
awareness through participatory storytelling. Moreover, adopting transparent data practices are certainly a
supporting factor as well (UXPin, 2023). The principles of society-centred design also work as a pillar of
support for these approaches by focusing digital products on values such as justice, transparency, and shared
prosperity to advance environmental justice alongside sustainability (IF.Society centered design, 2025).
Green Design Trends in Practice
Practical applications of green technology serve as additional evidence that demonstrates how the mentioned
principles become actualized. The user interfaces of “Energy Saver”, “EcoBuddy” and “Gaia” demonstrate
minimalism through restrained colours while maintaining efficient features that prevent digital and cognitive
strain (Design Rush, 2025). The combination of dark mode functionality with local caching and carbon
awareness indicators in the interfaces enables users to track and manage their digital carbon footprint (The
Beetroot Team, 2024).
Mobile applications supporting sustainability need to integrate green UX principles with ethical design
frameworks and environmentally conscious development practices during their development process. The best
practices create a comprehensive sustainable app design blueprint by minimizing data usage and digital
emissions through the adoption of certain approaches such as gamification with elevated care.
METHODOLOGY
This research is driven by adopting an exploratory approach to analyse existing mobile applications that
promote sustainable behaviours. A systematic selection and categorization of the relevant apps from the
Google Play Store is the first building block of this methodological process, aiming to form a curated dataset
of mobile tools aimed at supporting green practices. Rather than conducting a mere traditional content analysis,
this phase integrates both qualitative and computational techniques for enriching the understanding about the
effectiveness of the collected apps, user perceptions, and engagement dynamics. This analysis sets the
foundation for developing informed recommendations that may guide app designers in enhancing digital
advocacy for environmental sustainability.
Platform and Search Strategy
The platform used for app exploration was the Google Play Store, as it provides wider accessibility and lower
development entry costs than the Apple App Store. Android devices rule the global smartphone market,
especially in regions that favour affordable open-source platforms. To elaborate, Play Store provides both
ACCESS Journal:
Access to Science, Business, Innovation in Digital Economy
ISSN 2683-1007 (Online)
2025, 6(3), 634-667, https://doi.org/10.46656/access.2025.6.3(10)
https://journal.access-bg.org/
643
extensive accessibility and market reach and a faster open review process than the Apple App Store, attracting
developers from diverse backgrounds, including emerging economies and independent creators, to publish
sustainability-related applications. The lower barrier to entry on the Play Store often results in a wider array
of app types, including niche or experimental green initiatives that may not pass the stricter quality control of
the Apple ecosystem. The open nature of this platform works well with research exploration because it enables
an extensive evaluation of digital environmental advocacy tools. Android leads the market in regions where
sustainability initiatives have the most impact, thus, this justifies Play Store as a suitable choice for studying
green app trends. Consequently, the Google Play Store is populated with a more diverse and expansive range
of mobile applications, making it the ideal environment to capture the variability in sustainability-related app
offerings (Bigabid, 2023). Two important caveats must be acknowledged in this research. First, the selection
of applications was carried out on April 2nd using a device located in Switzerland. As a result, the Google
Play Store’s regional settings were automatically configured to Switzerland, potentially influencing app
visibility and availability. This introduces a possible selection bias linked to regional accessibility. Then, as a
second remark, the availability of applications—particularly those that are smaller or less well-known—is
subject to change over time. Therefore, the app list presented in this study reflects a specific snapshot in time.
For the sake of broad and relevant coverage, two primary search terms were used:
• “Green”
• “Sustainab-”
To further strengthen the methodological positioning of this study, it is important to situate our approach in
relation to established evaluation frameworks from adjacent domains. Health applications, for example, have
benefitted from systematic tools such as the Mobile App Rating Scale (MARS) and the ABACUS behavior
change scale, which provide structured assessments of usability, engagement, privacy, and behavioral impact.
While these frameworks were not designed specifically for sustainability apps, they highlight essential
dimensions—such as content validity, user-centered design, and behavioral outcomes—that informed our
methodological design. By referencing these established models, we acknowledge both the strengths and the
limitations of transferring evaluation principles across domains, and we position our work as a step toward
building a more tailored framework for sustainability-focused applications.
Our sampling strategy is described in detail to ensure transparency. Data were collected from the Google
Play Store, with the search conducted from Switzerland. The scope was restricted to applications available in
English and Italian, reflecting practical access considerations. This sampling approach provides a clear and
replicable pathway for data collection, but it also introduces a regional and linguistic bias. The reliance on one
geographic entry point (Switzerland) and two dominant languages (English and Italian) may limit the
generalizability of findings, particularly in contexts where app ecosystems or user behaviors differ
significantly. By explicitly recognizing this limitation, we frame our results as representative of Western and
Southern European markets, while acknowledging that further research is needed to validate these patterns
across other regions, languages, and cultural contexts.
ACCESS Journal:
Access to Science, Business, Innovation in Digital Economy
ISSN 2683-1007 (Online)
2025, 6(3), 634-667, https://doi.org/10.46656/access.2025.6.3(10)
https://journal.access-bg.org/
644
This choice reflects a strategic departure from another research study, which used only one term due to
constraints in their search strategy, considering the two interchangeable (Lago et al., 2014). In contrast, this
study chose to include both terms to maximize the coverage of relevant apps, also given the observed
geolocation limitations and naming inconsistencies. An exploratory attempt was also made with the term
“environment”; however, this yielded fewer suitable results, all of which had already appeared under the
“sustainab-” search. Thus, the latter revealed itself to be the most productive keyword, ultimately returning 50
relevant apps (after excluding those overlapping with the “green” keyword results, which had only produced
4 relevant apps on its own).
Application Selection Criteria
The process of selecting applications for this research was designed to be fair and meaningful, employing an
approach that balances reach, relevance, and reliability. The final analysis is based on apps that meet several
predefined inclusion criteria. Establishing these requirements ensured total transparency and maintained
integrity throughout the selection process. The first practical criterion evaluated the availability of language
support, limiting the analysis to apps in English and Italian, as the researcher is fluent in both languages. This
focus on English and Italian language support enabled effective interface and content interpretation, allowing
for a nuanced qualitative evaluation of the apps' tone, messaging, and functionality. In addition to language,
the applications needed to demonstrate relevance and engagement in one of three key ways to qualify for study
participation. A specific download volume was indicated to help determine whether an app has achieved
notable public visibility and user engagement, thereby establishing its relevance in the sustainability app
market. To ensure that the apps selected for this study had a meaningful level of public engagement, a threshold
of 10,000 downloads was used. This selection criterion aligns with the research approach of another body of
work, which established this benchmark to evaluate health apps, as it reflects their visibility and meaningful
user interaction.
The selection of apps for external recognition was based on their validation through partnerships with
reputable organizations, certifications, or endorsements from subject matter experts. These elements enhanced
the credibility of the selection process. The rationale for app selection can be summarized as follows:
Include App
⇐⇒
Language
∈
{English, Italian}
∧
(Downloads>10,000
∨
Strong Sustainability Focus
∨
Expert Approval)
An override condition was applied in cases where apps had no downloads. Specifically:
If Downloads= 0
∧
Strong Sustainability Focus
⇒
Manual Inspection
In other words, apps with zero downloads but demonstrating a strong sustainability focus were manually
evaluated to determine their relevance and potential inclusion.
Observations and Exclusions
ACCESS Journal:
Access to Science, Business, Innovation in Digital Economy
ISSN 2683-1007 (Online)
2025, 6(3), 634-667, https://doi.org/10.46656/access.2025.6.3(10)
https://journal.access-bg.org/
645
During the app selection process, several specific patterns emerged that influenced the final composition of
the dataset. These findings were crucial for the methodology and revealed significant issues within
sustainability apps, such as branding deception, limited scope, and concerns regarding long-term relevance.
Many applications were designed to address particular, narrow use cases that dominated the market. For
instance, "Green Drive" assists car users, while "Sustainable Ocean Alliance" focuses on ocean environmental
initiatives. The search results indicated that keyword selection was vital during the investigation. The search
term “green” produced numerous applicable apps; however, most of these results also appeared when using
the more effective “sustainab-” keyword, which encompasses “sustainable” and “sustainability.” Notably, the
search term “green” yielded only five relevant results that were also found in the “sustainab-” search results.
Consequently, the selection of the “sustainab-” keyword became the final criterion for compiling the list of 54
apps. Relying solely on the “sustainab-” keyword during the selection process enhanced efficiency and
highlighted the importance of choosing appropriate search terms for systematic reviews.
Keyword Electiveness and Relevance
The entire search process through app stores relied heavily on metadata and keyword matching, making
success contingent on the quality of the terms selected for sustainability-focused digital tools. Three different
keywords were initially tested to explore sustainable apps: "green," "sustainab-," and "environment." Among
these keywords, "sustainab-" yielded the most relevant results due to its high number of quality outcomes. The
root term "sustainab-," which encompasses concepts such as "sustainable" and "sustainability," yielded the
largest selection of apps that potentially met the study criteria.
However, when examining the results from the search conducted using the keyword "green," it becomes
apparent that there is an inconsistency compared to the other two keywords.
Application Categorization
Categorization by User Interaction Strategy. This application categorization is based on the primary method
of user interaction, which involves either game-like mechanisms or the delivery of informative content. These
two approaches serve as distinct motivational strategies to encourage user participation. A key aspect of the
classification process was to separate applications according to their interaction strategy, specifically whether
they utilize gamification or take a more informative approach. In this section, the terms 'engagement' and
'interaction' will be used interchangeably.
Gamified apps are designed to be engaging and enjoyable, incorporating elements from video games to
encourage regular use. Features may include simple options such as awarding points, unlocking badges,
completing levels or missions, maintaining streaks, or climbing leader boards. Other features may involve
avatars or interactive stories. Some apps blend elements from both categories, and in those cases, a
determination was made regarding the primary mode of interaction.

ACCESS Journal:
Access to Science, Business, Innovation in Digital Economy
ISSN 2683-1007 (Online)
2025, 6(3), 634-667, https://doi.org/10.46656/access.2025.6.3(10)
https://journal.access-bg.org/
646
Categorization by Review Availability. The second main criterion for classifying the shortlisted
applications was whether they had received user reviews from real users on the Google Play Store. To gain
deeper insights into user preferences and dislikes regarding how apps integrate into their sustainable lifestyles,
the applications were sorted into two main categories:
Apps with reviews: This category includes apps that have received either ratings, written feedback,
or both. This subset of the dataset is particularly valuable, as it reflects first hand user experiences.
Apps without reviews: This category consists of apps that users have either not downloaded or for
which the review feature has been disabled for unknown reasons.
By differentiating between apps with and without reviews, this categorization ensures that evaluations
remain grounded in real-world usage whenever possible.
Categorization by Thematic Focus. The final dimension of categorization involved the thematic content of
each app, referring to the type of sustainability issue it sought to address. The categories are presented in Table
1 below. To deepen this thematic analysis by connecting it with global priorities and also create more
familiarity with the themes, the app categories were mapped to the United Nations Sustainable Development
Goals (SDGs) (United_Nations, 2025). Mapping the apps to relevant SDGs allowed for a clearer understanding
of how digital solutions align with broader sustainability frameworks.
Table 1. Sustainability App Thematic Categories, Descriptions, and SDG Alignment
Source: own research
Category
Short Description
Relevant SDGs
Environmental Awareness
and Education
Raises awareness and educates through
news, games, or missions.
SDG 4 (Quality Education), SDG 13
(Climate Action)
Carbon Footprint Tracking
and Climate Action
Helps track, reduce, or offset carbon
emissions
SDG 13 (Climate Action), SDG 12
(Responsible Consumption)
Sustainable Consumption
and Product Transparency
Guides ethical choices with brand
ratings and certifications.
SDG 12 (Responsible Consumption),
SDG 8 (Decent Work and Economic
Growth)
Sustainable Lifestyle and
Habit Building
Encourages eco-friendly habits via tips
and challenges
SDG 12 (Responsible Consumption),
SDG 3 (Good Health and Well-being)
Sustainable Mobility and
Transport
Promotes low-carbon travel with
gamified incentives
SDG 11 (Sustainable Cities), SDG 13
(Climate Action)
Food Sustainability and
Waste Reduction
Supports sustainable eating and food
waste reduction.
SDG 2 (Zero Hunger), SDG 12
(Responsible Consumption), SDG 13
(Clime Action)
Circular Economy and
Recycling
Motivates recycling and reuse through
rewards and education.
SDG 12 (Responsible Consumption),
SDG 9 (Industry, Innovation and
Green Finance and Business
Sustainability
Focuses on ethical investing and green
business strategies.
SDG 9 (Industry and Innovation), SDG 8
(Decent Work), SDG 13 (Climate Action)
Community Engagement and
Social Platforms
Builds communities around shared
environmental action.
SDG 17 (Partnerships), SDG 11
(Sustainable Cities), SDG 13 (Climate
Action)
ACCESS Journal:
Access to Science, Business, Innovation in Digital Economy
ISSN 2683-1007 (Online)
2025, 6(3), 634-667, https://doi.org/10.46656/access.2025.6.3(10)
https://journal.access-bg.org/
647
Thus, these categories illustrate the various types of digital solutions that can be used to promote sustainable
conduct. The apps are versatile in terms of the target audience they reach. All users—be they beginners in
building sustainable habits or deeply committed to an eco-friendly lifestyle—can benefit from these apps,
which serve as valuable resources offering information, motivation, and opportunities to connect with those
who share the common goal of creating a more sustainable world.
Sentiment Analysis of User Reviews. The evaluation of mobile applications focused on sustainability
requires knowledge about how users experience and use these digital tools. This research uses sentiment
analysis as a widely recognized Natural Language Processing (NLP) technique to extract meaningful patterns
from review data. The primary purpose of sentiment analysis is to enable researchers to automatically
determine whether user-generated content tends toward a positive, neutral, or negative sentiment. The analysis
focused on sustainability applications with Google Play Store user reviews from the selected 54 applications.
The information structure includes the category, a short description, and relevant SDGs, as it is presented in
Table 1.The sentiment analysis was conducted using the VADER (Valence Aware Dictionary and Sentiment
Reasoner) tool, which is part of the Natural Language Toolkit (NLTK) in Python. To retrieve the review data,
the Google Play Scraper Python library was employed. While the function was configured to retrieve up to
500 of the most recent reviews per app, the actual number of available reviews varied significantly across the
sample. The number of reviews on some apps reached only five or six, while other apps had received between
400 and 500 reviews. This difference in the number of reviews stems from natural variations between apps in
terms of their popularity, user interaction, and the time they have been available on the market.
The text of each review was then processed by VADER, which produced a compound sentiment score
ranging from -1 (extremely negative) to +1 (extremely positive). These scores were averaged per app to obtain
an overall sentiment value, which was then categorized into positive, neutral, or negative based on standardized
thresholds: scores above 0.05 were labelled as positive, those below -0.05 as negative, and values in between
were considered neutral. To reiterate, despite the sample size limitation, this sentiment analysis represents a
valuable first step in understanding how sustainability apps are perceived by their users in practice.
Topic Modeling of User Reviews. Sentiment analysis offers useful information about user attitudes by
measuring emotional polarity; however, it often fails to capture the actual content of user discussions
accurately. Therefore, this study employs topic modelling as a complementary natural language processing
(NLP) technique to analyse the specific themes, expectations, and concerns expressed by users in reviews of
sustainability-focused mobile applications. By utilizing topic modelling, researchers can go beyond basic
emotional evaluations of user comments to uncover hidden patterns in how individuals discuss digital tools.
Data Collection and Review Preparation. The topic modelling analysis was conducted on the same
dataset of user reviews used in the sentiment analysis phase. This included 21 sustainability apps (from the
original set of 54) that had available English-language reviews on the Google Play Store. As with the sentiment
analysis, the Python library "google_play_scraper" was used to collect up to 500 of the most recent reviews
ACCESS Journal:
Access to Science, Business, Innovation in Digital Economy
ISSN 2683-1007 (Online)
2025, 6(3), 634-667, https://doi.org/10.46656/access.2025.6.3(10)
https://journal.access-bg.org/
648
for each app. To ensure reliable linguistic consistency for the modelling process, once again, only reviews in
English were retained. The Python library "langdetect" was also used in this case to identify non-English
entries, which were then removed from the analysis. The topic modelling algorithm requires English-language
data because, similarly to VADER, it has been tested and optimized for content in the English language. It
may struggle to interpret non-English text with sufficient semantic accuracy.
Pre-processing for Topic Modelling. Extensive cleaning and preprocessing were necessary for the text
corpus before applying the topic modelling algorithm to enhance model clarity and performance. Each review
was initially converted to lowercase, followed by the removal of punctuation marks, numeric characters, and
non-alphabetic symbols. The Natural Language Toolkit (NLTK) was utilized to eliminate standard English
stop words, such as “and,” “the,” and “is,” as they do not contribute significant semantic value. The Porter
Stemmer was then applied to each word, transforming it into its base or root form (e.g., “distracted,”
“distracting,” and “distract” all reduce to “distract”). This process unified related concepts and reduced the
number of dimensions, which is crucial when working with short and informal texts, such as app reviews.
Finally, the cleaned text underwent its last layer of pre-processing—tokenization—to generate individual
words, allowing for organization in a format compatible with topic modelling standards.
LDA Modelling Implementation. The research applied Latent Dirichlet Allocation (LDA) because this
established unsupervised machine learning method effectively extracts topics from text data and demonstrates
reliability for NLP tasks with short-form user-generated content. The Gensim Python library was used to
implement the model. The final number of topics identified in the research was five, following tests of different
topic counts ranging from four to ten. This five-topic model achieved an optimal balance between thematic
understanding and distinct topic separation. The model required ten passes over the dataset (passes=10) to
reach stable convergence of probabilistic distributions between documents and words. A key feature of LDA
modelling is the lambda (λ) parameter, which affects how words are ranked and interpreted within each topic.
When λ = 1, the ranking of terms is based on overall frequency across all topics, highlighting the most common
words. In contrast, choosing λ = 0.4 prioritizes words that are more specific to a particular topic, leading to
better thematic separation. Interpreting topics through both values provides a dual perspective, revealing the
general emotional or functional context (λ = 1) and the specific conceptual nature of each topic (λ = 0.4). The
model's outputs became clearer when visualized using the interactive data display tool "pyLDAvis."
Integrating Topic Modelling in the Broader Analysis. The implementation of topic modelling together
with sentiment analysis serves to create a fuller and more useful understanding of user experience. As
sentiment scores measure emotional satisfaction, topic modelling reveals specific aspects to which users are
reacting. Together, these tools provide a rich, complementary foundation for evaluating sustainability apps—
not only in terms of how they affect users' emotions, but also in terms of what users’ value, criticize, or
recommend. However, we must recognize the specific boundaries of the research approach. While topic
modelling holds significant analytical value, it's crucial to consider several factors.

ACCESS Journal:
Access to Science, Business, Innovation in Digital Economy
ISSN 2683-1007 (Online)
2025, 6(3), 634-667, https://doi.org/10.46656/access.2025.6.3(10)
https://journal.access-bg.org/
649
First, the number of reviews used, although filtered for quality and language consentience, remains
modest because not all sustainability apps receive substantial public feedback. Thus, the findings
may not be generalizable, but they still provide valuable qualitative insights into the recurring
themes among users who utilize these apps.
Second, stemming and stop word removal—while improving model efficiency—may sometimes
lead to the loss of contextual nuance, particularly in short user reviews. Nevertheless, these steps
were necessary to enhance model performance, considering the unstructured and frequently
disorganized nature of app store language.
Ultimately, the topics identified are best understood as thematic cues rather than definitive categories. Their
value lies in their ability to highlight user priorities and recurring issues that might otherwise be overlooked
when evaluating app effectiveness solely based on numerical ratings or isolated comments. Table 1 presents
the four topics categorized by sustainability.
RESULTS
App Categorization
This section presents the categorization outcomes and the availability of user reviews for the selected
sustainability apps.
Table 2. Categorization of Sustainability Apps
App Name
Gamified
Informative
Reviews
Thematic Focus
Green the Planet/2
Yes
No
Yes
Environmental Awareness
And Education (4,13)
Earth Hero Climate Change
Yes
Yes
Yes
Environmental Awareness
And Education (4,13)
Go Green Challenge
Yes
Yes
Yes
Sustainable Lifestyle and
Habit Building (12,3)
Green Point: Food&
Cosmetics
Yes
Yes
No
Circular Economy and Re
cycling
(12,9)
My Green City
Yes
No
No
Environmental Awareness
And Education (4,13)
Green Money
No
Yes
No
Green Finance and Business
Sustainability (9,8,13)
Ganddee
Yes
Yes
No
Community
Engagement and
Social Platforms (17,11,13)11,13)
Earth5R
No
Yes
No
Community
Engagement and
Social Platforms (17,11,13)
Good on You - Ethical Fashion
No
Yes
Yes
Sustainable Consumption
And Product Transparency (12, 8)
Kora Sustainability
Yes
Yes
No
Carbon Footprint Tracking
And Climate Action (13, 12)
Continues with 44 more apps….
Source: own research

ACCESS Journal:
Access to Science, Business, Innovation in Digital Economy
ISSN 2683-1007 (Online)
2025, 6(3), 634-667, https://doi.org/10.46656/access.2025.6.3(10)
https://journal.access-bg.org/
650
The collection of 54 apps is displayed in Table 2, showcasing a diverse range of thematic categories and
providing helpful information about how digital tools interpret and promote sustainability. Table 3 presents
the distribution breakdown across all categorization dimensions. There is a notable dominance of mixed
interaction models, with over half of the apps (55.56%) incorporating both gamified and informative elements.
In contrast, apps classified as purely informative or solely gamified represent smaller portions of the dataset at
31.48% and 12.96%, respectively.
Table 3. Overview of app distribution by user interaction type, Review Availability, and Thematic Focus
Source: own research
Carbon Footprint Tracking and Climate Action is the most popular thematic focus category (24.07%),
followed by Environmental Awareness and Education (20.37%). Sustainable Consumption and Product
Transparency (18.52%) and Sustainable Lifestyle and Habit Building (14.81%) are also significant themes,
typically employing gamified nudges to influence daily choices and closely linked to SDG 12 (Responsible
Consumption and Production). The less frequently mentioned categories, Sustainable Mobility and Transport
(3.70%) and Green Finance and Business Sustainability (3.70%), indicate app development efforts aligned
with SDG 11 (Sustainable Cities and Communities) and SDG 9 (Industry, Innovation, and Infrastructure).
Moreover, access to user reviews enhances the analysis of app performance. A striking 61.11% of the
collected apps lack visible user reviews on the Google Play Store. We used the reviews from the apps for
sentiment analysis and topic modelling in the following sections. This distribution overview reveals a complex
User Interaction Type
App Count
Percentage (%)
Gamified
7
12.96%
Informative
17
31.48%
Both gamified and informative
30
55.56%
Total (User Interaction Type)
54
100%
App Review Availability
App Count
Percentage (%)
Apps with reviews
Apps with no reviews
21
33
38.89%
61.11%
Total (User Interaction Type)
54
100%
Thematic Focus
App Count
Percentage (%)
Environmental Awareness and Education
Carbon Footprint Tracking and Climate Action
Sustainable Consumption and Product Transparency
Sustainable Lifestyle and Habit Building Sustainable
Mobility and Transport
Food Sustainability and Waste Reduction
Circular Economy and Recycling
Green Finance and Business Sustainability
Community Engagement and Social Platforms
11
13
10
8
2
4
5
2
5
20.37%
24.07%
18.52%
14.81%
3.70%
7.41%
9.26%
3.70%
9.26%
Total (User Interaction Type)
54
100%

ACCESS Journal:
Access to Science, Business, Innovation in Digital Economy
ISSN 2683-1007 (Online)
2025, 6(3), 634-667, https://doi.org/10.46656/access.2025.6.3(10)
https://journal.access-bg.org/
651
landscape that promotes sustainability through various themes, interaction types, and communication styles.
Technology is increasingly utilized to drive sustainability-related initiatives that aim to reflect progress in the
areas targeted by the SDGs. Thus far, the intuitive yet layered analysis supports this conclusion.
Moreover, access to user reviews enhances the analysis of app performance. A striking 61.11% of the
collected apps lack visible user reviews on the Google Play Store. We used the reviews from the apps for
sentiment analysis and topic modelling in the following sections. This distribution overview reveals a complex
landscape that promotes sustainability through various themes, interaction types, and communication styles.
Technology is increasingly utilized to drive sustainability-related initiatives that aim to reflect progress in the
areas targeted by the SDGs. Thus far, the intuitive yet layered analysis supports this conclusion.
Sentiment Analysis Overview
A summary table (Table 4) was created to show the number of reviews collected for each app, along with
the reviews that moved on to the final analysis contribution stage following language filtering. This
information is provided to ensure transparency regarding the number of reviews utilized in calculating each
sentiment score and to enhance your understanding of the results.
Table 4. Summary of Sustainability Apps and Sentiment Analysis
App Name
Avg.
Weighted
Sentiment
Sentiment
Category
Category
User
Interaction
Type
Total
Reviews
English
Reviews
Green the Planet
0.531
Positive
Environmental Awareness
and Education
Gamified
500
403
Earth Hero:
Climate Change
0.701
Positive
Environmental Awareness
and Education
Both
500
477
Go Green
Challenge
0.638
Positive
Sustainable Life style and
Habit Building
Both
6
4
Good On You-
Ethical Fashion
0.525
Positive
Sustainable Consumption
and Product Transparency
Informative
500
482
Environment
Challenge
0.496
Positive
Environmental Awareness
and Education
Both
104
86
A World in
support of Act
Now
0.461
Positive
Carbon Footprint Tracking
and Climate Action
Both
308
247
Fork Ranger-
sustainable food
0.546
Positive
Food Sustainability and
Waste Reduction
Both
80
73
Good bag &good
cup
0.756
Positive
Food Sustainability and
Waste Reduction
Both
10
9
Sustainable
Shaun
0.392
Positive
Environmental Awareness
and Education
Both
39
27
My Little Plastic
Footprint
0.412
Positive
Sustainable Lifestyle and
Habit Building
Both
120
104
Samsung Global
Goals
0.419
Positive
Environmental Awareness
and Education
Informative
500
312
Ecosia-Private
Web Browser
0.359
Positive
Circular Economy and
Recycling
Informative
500
402
A billion better
social media
0.672
Positive
Community Engagement
and Social Platforms
Informative
500
424
Yuka Food &
Cosmetic
Scanner
0.528
Positive
Sustainable Consumption and
Product Transparency
Informative
500
450

ACCESS Journal:
Access to Science, Business, Innovation in Digital Economy
ISSN 2683-1007 (Online)
2025, 6(3), 634-667, https://doi.org/10.46656/access.2025.6.3(10)
https://journal.access-bg.org/
652
Code Check:
Product Scanner
0.319
Positive
Sustainable Consumption and
Product Transparency
Informative
500
381
Too Good To Go
0.424
Positive
Food Sustainability and
Waste Reduction
Informative
500
446
Open Food Facts
0.293
Positive
Sustainable Consumption
and Product Transparency
Informative
465
398
Klima-Live
Carbon Neutral
0.493
Positive
Carbon Footprint Tracking
and Climate Action
Informative
118
103
Naturitas-Natural
Health
0.231
Positive
Sustainable Consumption
and Product Transparency
Informative
164
110
Grow Forest
0.469
Positive
Environmental Awareness
and Education
Both
116
83
enerjoy-
CO2FootprintCoa
ch
0.558
Positive
Carbon Footprint Tracking
and Climate Action
Both
5
3
Source: own research
The bubble chart illustrated in Figure 1 offers a comprehensive overview by plotting each app along a
horizontal axis that indicates its average sentiment score (derived from compound VADER analysis) while
categorizing them vertically by thematic group. The study focuses on English-language reviews, which
influence both the size and colour of the bubbles depending on whether the app employs informative content,
gamified content, or a combination of both. A detailed interpretation of the table and the chart will be provided
in the consecutive session.
Figure 1. Weighted average user sentiment scores for each app by category. Dots represent individual apps, colored
by interaction type. Black crosses (X) indicate the weighted mean sentiment score within each category.
Topic Modeling Overview
The LDA algorithm was employed to analyse English-language user reviews through topic modelling,
aiming to extract deeper insights into user perceptions and priorities. The five generated topics represent

ACCESS Journal:
Access to Science, Business, Innovation in Digital Economy
ISSN 2683-1007 (Online)
2025, 6(3), 634-667, https://doi.org/10.46656/access.2025.6.3(10)
https://journal.access-bg.org/
653
thematic clusters that reflect common user concerns, preferences, and sentiments regarding the sustainability
apps studied.
Topic 1: Engagement, Enjoyment, and Brand Enthusiasm. This topic dominates the model,
accounting for 31.6% of total token representation. It is depicted as the largest bubble in the upper-left
quadrant of the pyLDAvis visualization and overlaps partially with Topic 3. This overlap suggests that
both topics share common themes related to user appreciation and enjoyment of the app. (Figure 2).
Figure 2. Intertopic Distance Map highlighting Topic 1.
Topic 2: Technical Frustrations and Usability Concerns. The second topic encompasses 22.8% of
tokens and appears as a medium-sized bubble in the lower left quadrant. While it remains near the
main cluster (Topics 1 and 3), it presents a different narrative focused on the challenges and
frustrations users have encountered (Figure 3).
Figure 3. Intertopic Distance Map highlighting Topic 2.

ACCESS Journal:
Access to Science, Business, Innovation in Digital Economy
ISSN 2683-1007 (Online)
2025, 6(3), 634-667, https://doi.org/10.46656/access.2025.6.3(10)
https://journal.access-bg.org/
654
Topic 3: Environmental Impact and Climate-Oriented Behaviour Change. Topic 3 represents
21.9% of the total tokens and, as previously noted, overlaps with Topic 1, indicating shared themes.
This bubble is located in the left section of the visualization, slightly above and to the left of Topic 1.
The thematic connection between emotional satisfaction and sustainability-driven motivation is
evident in this overlapping area as in (Figure 4).
Figure 4. Intertopic Distance Map highlighting Topic 3.
Topic 4: Food and Product Transparency. The fourth topic comprises 15% of the total corpus and
is positioned in the bottom left quadrant, distinct from the core cluster of Topics 1–3. This spatial
separation indicates a clear conceptual boundary, as this topic primarily addresses food-related issues
as in (Figure 5).
Figure 5. Intertopic Distance Map highlighting Topic 4.

ACCESS Journal:
Access to Science, Business, Innovation in Digital Economy
ISSN 2683-1007 (Online)
2025, 6(3), 634-667, https://doi.org/10.46656/access.2025.6.3(10)
https://journal.access-bg.org/
655
Topic 5: Ethical Search, Pricing, and Eco-Friendly Shopping. In the pyLDAvis map, Topic 5 is
the smallest and most distanced topic, representing only 8.7% of total tokens and located in the top-
right quadrant, away from the other topics. Its isolated position suggests that it represents a distinct
thematic domain not firmly connected to the other user experiences observed so far. (Figure 6).
Figure 6. Intertopic Distance Map highlighting Topic 5.
The topic modelling application on the reviews from the collected apps in this study provides a thematic
map of what users’ value, praise, or critique in sustainability apps. The most dominant areas—Topic 1, Topic
2, and Topic 3—suggest that users are drawn to apps that are enjoyable, well-designed, and purpose-driven.
These are the most prevalent areas to be addressed, however it is important to take into consideration also more
niche priorities emerging among some of the discussions, such as health transparency (Topic 4) and cost-
conscious browsing (Topic 5).
More detailed insights will be explored throughout the Discussion session, providing designers with
guidance to select features which maintain user trust while enhancing environmental education and delivering
personalized experiences according to user requirements. The combination of topic modelling with sentiment
analysis produces a complete understanding of sustainability apps by uniting emotional impact with
behavioural insights and technical excellence into a unified story.
DISCUSSION
The following discussion seeks to integrate and interpret the findings from earlier sessions through the lens of
academic research on persuasive design, gamification, and digital sustainability advocacy. This section
leverages the literature review to examine the implications of categorization patterns, as well as sentiment
analysis and topic modelling results, for app designers and researchers aiming to utilize mobile technology in
promoting environmentally friendly behaviour. The study draws on empirical data and builds upon existing
ACCESS Journal:
Access to Science, Business, Innovation in Digital Economy
ISSN 2683-1007 (Online)
2025, 6(3), 634-667, https://doi.org/10.46656/access.2025.6.3(10)
https://journal.access-bg.org/
656
findings to offer practical insights that can inform the development of more effective and ethically responsible
sustainability apps. The discussion begins by revisiting key patterns identified in the app distribution analysis,
with a particular focus on the design approaches and interaction strategies that provide a foundation for a more
in-depth exploration of user experience, values, and motivation.
Insights from App Categorization
One striking observation from Table 1 and Table 2 is the widespread use of gamification, with many apps
incorporating challenges, point systems, streaks, and reward mechanisms—design elements previously
discussed. Categories such as sustainable lifestyle and habit building, carbon footprint tracking, and climate
action stand out for their gamified engagement strategies. This trend can be understood in the context of these
apps' explicit aim to encourage daily behavioural changes, directly aligning with goals such as SDG 12
(Responsible Consumption and Production) and SDG 13 (Climate Action). Literature supports the idea that
gamification can facilitate quicker habit formation by bypassing extensive explanations and prompting direct
action (Brauer et al., 2016).
However, the effectiveness of these apps heavily depends on individual motivation and external
circumstances. Despite their well-defined purpose of promoting sustainable habits through interactive
motivation systems, their performance can vary significantly. People are not always rational, and their
intentions and mmotivation can fluctuate (Mu et al., 2019; Guillén et al., 2022).
In contrast, apps focusing on sustainable consumption and product transparency, as well as green finance
and business sustainability, generally adopt an informative approach. For example, Dependable On You and
Code Inspection primarily serve as databases and scanners rather than interactive platforms. These applications
offer extensive product details, ethical assessments, and financial recommendations, aiming to educate users
rather than entertain them. Such apps can have a significant impact, particularly in advancing SDG 8 (Decent
Work and Economic Growth) and SDG 12 by providing essential information for ethical, sustainable choices.
This distinction highlights the importance of aligning an app’s interaction strategy with its intended outcomes:
while gamification can be an effective tool for behaviour change, information-driven apps are expected to
benefit more from clarity, credibility, and trust (Rory Mulcahy et al., 2018; Tom Hunger et al., 2023).
The selected sustainability apps represent a wide range of digital developments advocating for
sustainability; however, many newer or niche apps lack user reviews on the Google Play Store. The relatively
high percentage of apps without user reviews (61.11%) may initially seem like a limitation, but this limited
visibility does not necessarily reflect their quality or potential.
Both approaches offer the flexibility and coverage necessary to support various aspects of the global
sustainability agenda. Consequently, these apps are gradually expanding the market for digital sustainability
promotion, each in its own unique way, serving as digital ambassadors for the SDGs. They contribute to a
variety of goals, from raising awareness for quality education (SDG 4) to encouraging climate action (SDG
13) and supporting sustainable cities and communities (SDG 11) (Law et al., 2011; Douglas et al., 2021)
ACCESS Journal:
Access to Science, Business, Innovation in Digital Economy
ISSN 2683-1007 (Online)
2025, 6(3), 634-667, https://doi.org/10.46656/access.2025.6.3(10)
https://journal.access-bg.org/
657
Insights from Sentiment Analysis
The results in Table 3 indicated that all sustainability apps with reviews tended to fall within the positive range
of sentiment scores, which shows a generally favourable user reception, despite there being some variability
on the extent of perceived positivity. It should be mentioned that sentiment analysis, although informative and
helpful, provides emotional interpretations at a surface level.
Having a high average score does not necessarily imply that the satisfaction is perceived across all users,
nor does a lower score imply a complete design failure of the app. However, these scores function as indicators
of general user satisfaction trends which become more meaningful when combined with more granular
analyses, like topic modelling, exploring the themes and concerns raised through the user feedback content.
Moving on to the bubble chart shown in Figure 1, this type of visualization was selected to achieve several
goals. First, it enables a quick glance at the comparison of how different categories of sustainability apps are
perceived emotionally by their users. Additionally, the visualization demonstrates how different user
interaction approaches affect user satisfaction levels in each category (Law et al., 2011; Douglas et al., 2021;
Muangsrinoon et al., 2019; Brauer et al., 2016).
And lastly, it draws attention to the volume of feedback received by each app, adding another dimension to
how sentiment scores can be interpreted in context. Therefore, this bridge between raw sentiment scores and
richer behavioural insights helps contextualize sentiment findings, showing how emotional responses align (or
not) with specific design choices and thematic areas. For app creators, this visual overview can offer directions
about which engagement strategies are resonating well within specific domains of sustainability—and where
improvements or rethinking might be necessary.
Several interesting patterns emerge now that the focus can finally be shifted on interpreting the results. The
Community Engagement and Social Platforms category, which is represented by a relatively large bubble
located towards the far right of the sentiment scale, is one of the most positively rated categories overall, and
specifically the first in generating a positive user response in the group of informative apps. The bubble
indicates both positive reception and a relatively high number of user reviews. The apps in this category,
through encouraging users to interact socially or contribute to broader environmental missions, may be
succeeding in generating not just functional value but also emotional connection and a sense of shared purpose
(Vo-Thanh et al., 2021; Guillén et al., 2022; Lim et al., 2025; IF. Society centered design, 2025).
Apps focused on Sustainable Consumption and Product Transparency indicate variations in user feedback
and thus, sentiment scores. It might seem as if the number of reviews and the weighted sentiment scores move
toward the same direction. The smaller the bubble—the lower the score: in fact, this is the category accounting
for the worst-performing informative apps. Although the data is not rich enough to generalize results, it is
worth trying to engage in some exploration of the reasons as to why such results emerge. Perhaps, users are
stricter regarding transparency requirements and effective performance in distributing trustworthy and accurate
information for informative apps that support the selection of daily consumption goods which are non-edible,
ACCESS Journal:
Access to Science, Business, Innovation in Digital Economy
ISSN 2683-1007 (Online)
2025, 6(3), 634-667, https://doi.org/10.46656/access.2025.6.3(10)
https://journal.access-bg.org/
658
and generally require a higher portion of "investment" by users to purchase them, like apparel or cosmetics.
Therefore, misinformation in such case can result in a higher monetary loss, as well as disappointment with
the app (Hunger et al., 2023; Berdichevsky et al., 1999). However, the larger user base and availability of
reviews for the ones performing better in this category, may be taken as a sign of good app quality, for this
reason the positive experience essentially accumulates and in turn, attracts even more users.
In the other categories, informative apps perform generally better. For instance, Environ- mental Awareness
and Education is another notable category with numerous entries across the sentiment spectrum. The type of
user interaction that got assigned the lowest score in this case is the hybrid implementation of both.
Interestingly, within the same typology of user interaction, the positive correlation between number of reviews
and sentiment scores seems to hold for this category, too. For apps that employ both informative and gamified
strategies to keep users interacting with the app, a larger user review pool indicates a more magnified positive
sentiment. Although some apps in this group show moderate sentiment scores, the spread reflects variability
in how well these apps manage to communicate educational content in an engaging or emotionally satisfying
way.
In categories like Carbon Footprint Tracking and Climate Action, Sustainable Lifestyle and Habit Building,
and Food Sustainability and Waste Reduction, it seems that the correlation is inverse, however. The lower the
count of reviews, the higher is the sentiment score. The former category has the smallest dispersion among
categories consisting of more than one app. One possible reason might be the inherent simplified functionality
of such apps focusing on metric calculation and display (Suruliraj et al., 2020; World Bank, 2024).
It is not straightforward however, how the interaction strategy affects the score. For all the three mentioned
categories in this paragraph there are two apps pertaining to the adoption of both interaction strategies which
stand on the opposite sides of the generated weighted average sentiment score. These apps often employ hybrid
interaction strategies, which suggests that while gamification can enhance appeal, its effectiveness depends
heavily on how well the game play elements are integrated with the app’s sustainability goals (Mu et al., 2019;
Khaleel et al., 2016).
One other perspective to analyse what this graph shows is that larger bubbles—indicating apps with higher
review counts—are not necessarily aligned with the highest sentiment scores. For instance, a large, informative
app under the Circular Economy and Recycling category may gather many reviews, yet still exhibit only
moderate sentiment. This nuance reinforces the idea that popularity does not in all cases translate into
satisfaction. Volume alone cannot capture emotional nuance; sentiment analysis offers a layer of understanding
that quantitativereview counts cannot (Douglas et al., 2021; Brauer et al., 2016; Hensheret al., 2021).
As we move into the next section of this part, topic modelling will provide a deeper dive into the actual
textual content of user reviews. While sentiment analysis tells us how users feel, topic modelling seeks to
understand what they are talking about. This dual approach—combining emotional tone with thematic
insight—provides a more holistic picture of user experience and expectations in the context of sustainability-
focused mobile applications.
ACCESS Journal:
Access to Science, Business, Innovation in Digital Economy
ISSN 2683-1007 (Online)
2025, 6(3), 634-667, https://doi.org/10.46656/access.2025.6.3(10)
https://journal.access-bg.org/
659
Insights from Topic Modeling
The analysis of user reviews through topic modelling reveals detailed insights about how users understand and
use mobile applications focused on sustainability. Sentiment analysis serves to capture the general emotional
direction of the user feedback, whereas topic modelling serves to unfold the particular discussion topics
including concerns, characteristics, and expectations that users have mentioned in their feedback. The five
identified topics reveal distinct user experience perspectives. The following interpretations analyse these
themes to reveal design strategies which work and those which do not in this domain.
Interpretation of Topic 1: Engagement, Enjoyment, and Brand Enthusiasm. The most important terms
in this topic include “app,” “great,” “use,” “love,” and “make” supported by “game,” “easy,” “thank,” and
“fun.” These suggest a high level of emotional and experiential positivity. When viewed through ω = 0.4,
additional tokens like “surprise,” “enjoy,” “simple,” “learn,” and “ethic” emerge, showing that many users
were pleased not only with functionality, but also with discovering new information or enjoying small
interactive surprises.
This topic shows overall contentment with both gamified and informative app experiences, including
features that users find delightful, meaningful, and also ethical. The design perspective of this topic
demonstrates how emotional engagement and ease of use should be a careful consideration of designers as
they need to create user experiences that are not only functional, but also rewarding and enjoyable.
Interpretation of Topic 2: Technical Frustrations and Usability Concerns. The terms “product,”
“work,” “money,” “try,” and “doesn’t” appear at ω = 1 and they can possibly be indicating that users might
be discussing app performance, reliability, and possibly failed expectations. The tokens at ω = 0.4— “crash,”
“uninstall,” “load,” “error,” “notification,” and “camera”—make this more evident. But there are also terms
like “charity,” “donation” and “option” that appear, which can be suggesting some type of disappointment
among users, perhaps due to their expectations for in-app features and services not being met.
This topic serves as a critical reminder that even ethically or environmentally noble apps cannot fulfil their
mission if core usability and stability are compromised. Developers should note that trust can erode quickly
when technical issues go unresolved or when expectations set in the app description are not delivered in
practice.
Interpretation of Topic 3: Environmental Impact and Climate-Oriented Behaviour Change. The top
words under ω = 1 include “help,” “change,” “reduce,” “carbon,” “footprint,” and “action.” The selected terms
explicitly convey behavioural and motivational language that matches a climate-conscious thinking process of
users. The ω = 0.4 setting reveals specific terms including “browser,” “offset,” “track,” “emission,” “AI,” and
“calculate” which demonstrate how users can interact with apps that provide tangible metrics and make it
possible to track carbon and their environmental impact overall. This topic demonstrates the need for the
integration of tools that support climate action through quantifiable results (Suruliraj et al., 2020; World Bank,
2024; Adaji et al., 2024).
ACCESS Journal:
Access to Science, Business, Innovation in Digital Economy
ISSN 2683-1007 (Online)
2025, 6(3), 634-667, https://doi.org/10.46656/access.2025.6.3(10)
https://journal.access-bg.org/
660
Developers who want to promote environmental responsibility should allocate part of their effort and
resources to ensure a proper configuration of their app’s features having the nature of carbon calculators,
impact visualization dashboards, and the like, as making them both accessible and reliable is useful for
nurturing the intrinsic motivation that drive users to engage in environmentally beneficial pursuits.
Interpretation of Topic 4: Food and Product Transparency. The common terms when ω = 1 include
“food,” “product,” “scan,” “ingredient,” and “rate.” The ω = 0.4 view shows more diagnostic and evaluative
language through terms such as “nutritious,” “healthier,” “label,” “additive,” “refund,” and “score.” The word
pat- terns indicate that users mainly use these apps to get transparent information about food labels, health
metrics, and to support their purchasing choices.
The topic shows an increasing pattern in sustainability discussions about how environmental health
connects to personal health. Many of the included apps operate within this specific area. The developers of
food and product scanning apps should concentrate on creating clear interfaces while ensuring accurate
information delivery and personalized feedback on the product choices of users.
Interpretation of Topic 5: Ethical Search, Pricing, and Eco-Friendly Shopping. The ω = 1 words
consist of “search,” “price,” “tree,” “find,” and “deal” while ω = 0.4 brings in economic and browsing-related
terms such as “cheaper,” “package,” “afford,” “shop,” “Ecosia,” and “engine.” The data can be interpreted as
emphasizing how users in this segment make resource-conscious choices by locating affordable, sustainable
products and using apps like Ecosia to plant trees through advertising revenue, or simply looking for budget-
friendly green alternatives.
Although smaller in volume, this topic is highly actionable for designers: price-conscious eco-consumers
are looking for apps that merge environmental action with everyday digital habits like shopping or searching
(Hunger et al., 2023; Vo-Thanh et al., 2021; Guillén et al., 2022).
Building in features that highlight sustainable deals or compare prices with eco-ratings could meet a
currently under-addressed user need.
The five topics together provide an extensive view of the repeated themes and user preferences within the
sustainability app ecosystem. Users seek emotional engagement alongside ethical clarity, technical reliability,
and real-world usefulness in their sustainability apps. These topics demonstrate that sustainability apps receive
their assessment from how effectively they transform environmental messages into practical tools that users
can easily access. The practical design guidelines in the following section also depend on these insights in
combination with the literature findings to support the creation of user-centred mobile applications for the
change of environmental behaviour.
Design Guidelines Informed by User Feedback and App Patterns
The research findings present an analytical summary of mobile applications related to sustainability, but their
significance lies not only in description but in showing how concrete patterns can guide design practice.
Practical design recommendations for designers who want to build effective, ethical user-centred digital
ACCESS Journal:
Access to Science, Business, Innovation in Digital Economy
ISSN 2683-1007 (Online)
2025, 6(3), 634-667, https://doi.org/10.46656/access.2025.6.3(10)
https://journal.access-bg.org/
661
applications can be derived. App categorization, sentiment analysis, and topic modelling, when combined,
reveal several key themes and patterns that can be interpreted to give guidance to designers who want to support
behavioural change in the sphere of environmental sustainability.
Gamification needs to be thoughtful. The user interaction analysis revealed that apps use two different
methods to engage users by either providing only information or using gamified elements. Importantly, our
findings show that hybrid apps—those combining informative and gamified features—are particularly
dominant, yet their success depends heavily on ethical and purposeful implementation. However, as it was
discussed in the literature review and confirmed by user reviews, gamification does not automatically lead to
success, and as a persuasive tool, it risks falling into manipulation, potentially creating an inauthentic
connection with users and raising ethical concerns (Adjust, 2023; Liberty, 2023).
The topic modelling results showed that users like interactive features (Topic 1) but user interaction needs
to be based on purposeful grounds and aligned with the sustainability goals of the app (Benner et al., 2021;
Kight et al., 2019; Davis et al., 2009). Designers are encouraged to create challenge-based dynamics,
personalized goals, and feedback systems that maintain user interest throughout time, but this should be done
while preventing superficial or manipulative designs. The practice of "pointsification" which uses points as
the only reward system should be avoided because it leads to user fatigue and destroys authenticity.
App reliability depends not only on ethical design, but also functionality. Users consistently
emphasized issues of technical reliability and usability in Topic 2. Reviews frequently mentioned problems
like app crashes, loading issues, or confusing interfaces—barriers that not only undermine trust but also disrupt
the behavioral pathways that sustainability apps aim to encourage. Developers must recognize that technical
robustness and clarity of purpose are prerequisites for behavior change. A poorly functioning app, no matter
how well-intentioned, will eventually fail in delivering its persuasive goals (Douglas et al., 2021). Ethical
persuasive design must thus be accompanied by a strong foundation of usability, stability, and accessibility.
Autonomy and transparency must be part of persuasive strategies. In the literature about persuasive
technology, it was emphasized how there is an emerging concern about the ability to differentiate between
influence and manipulation (Fogg et al., 2003; Berdichevsky et al., 1999; Benner et al., 2021). Our sentiment
analysis further reinforces this: while general sentiment toward sustainability apps is positive, many negative
reviews revolve around unmet expectations, lack of clarity, or perceived opacity in donation mechanisms and
environmental claims. This highlights how transparency remains a recurring user concern. Users expect clear
disclosure about the methods and reasons behind behavioral influence through strategies such as nudging,
gamification, and social comparison.
Users respond positively to concrete climate-related impact. The third Topic generated from topic
modelling demonstrated how users’ value actionable assistance for environmental behavior. Applications that
enable users to set measurable targets for emission offsetting and energy tracking within environmental
frameworks tend to achieve better results in behavior change.
ACCESS Journal:
Access to Science, Business, Innovation in Digital Economy
ISSN 2683-1007 (Online)
2025, 6(3), 634-667, https://doi.org/10.46656/access.2025.6.3(10)
https://journal.access-bg.org/
662
Informational value is a driving force in consumption-related apps. As observed through Topic 4 of
topic modelling, users frequently interact with apps that allow scanning, rating, and comparing food and
consumer products. This aligns with the positive sentiment trends identified in our analysis, where users
consistently praised apps that helped them make more informed and responsible choices. Developers in this
space of the sustainability apps landscape should focus on achieving database accuracy, transparency of
ratings, and user interface elements that help them make informed choices in real-time shopping environments.
Accessibility and cost sensitivity must not be ignored. A recurring theme in user feedback was
affordability—many reviews flagged pricing as a barrier to sustained engagement. This indicates that
sustainability must be made not only environmentally but also economically accessible. For this guideline, the
existing literature does not directly address it, however the reason for including it is based on Topic 5 emerging
from the topic modelling analysis, where users expressed concerns about affordability, and ethical shopping
decisions.
Sustained user engagement should be encouraged. Across the analytical layers of this research, a
common undercurrent is the challenge of maintaining user interest beyond initial enthusiasm (Douglas et al.,
2021; World Bank, 2024). As discussed in the literature, short-term behavior shifts are common, but long-term
transformation is rare unless continuously supported by the app’s design. Designers should consider
incorporating adaptive feedback, evolving challenges, streak tracking, and meaningful rewards to foster
prolonged interaction, while still aligning with sustainability goals (Guillén et al., 2022; Kight et al., 2019).
Cultural relevance and inclusivity can expand the app’s outreach and effectiveness. Finally, sustainability is a
global concern, but engagement is shaped by local context. Designers should involve diverse users in
participatory design processes and adopt culturally sensitive approaches that respect different values,
behaviors, and environmental challenges (Mu et al., 2019; Davis et al., 2009).
As it was noted in the methodology session, the Google Play Store used as a tool to collect apps for this
study was set to a Swiss regional profile, and the selected apps tend to show the local infrastructure,
certifications, and environmental challenges of Switzerland and its surrounding areas. This means that the
study included apps that use national eco-labels and region-specific mobility solutions, focusing on local
contexts and priorities in sustainability app design. Additionally, Topic 4 in user review topic modelling, on
Food and Product Transparency, hints at how user expectations may take form through cultural differences
and concerns.
The discussion brought together the main findings from app categorization, sentiment analysis, and topic
modelling, discussing them in the context of previous findings. By highlighting hybrid app design, positive
sentiment toward informative tools, and persistent concerns about transparency and cost, this section
underlines what the empirical findings uniquely contribute to the literature and how they can inform practice.
The design guidelines presented at the end are one of the most important outcomes of this research. These
suggestions are based on actual user feedback and app performance patterns observed in this study. They
ACCESS Journal:
Access to Science, Business, Innovation in Digital Economy
ISSN 2683-1007 (Online)
2025, 6(3), 634-667, https://doi.org/10.46656/access.2025.6.3(10)
https://journal.access-bg.org/
663
demonstrate that while certain elements, such as gamification or impact tracking, can be effective, their success
really depends on how well they are implemented.
CONCLUSION
This research investigated the evolving relationship between mobile technologies with environmental
sustainability through an analysis of 54 sustainability-focused mobile applications listed on the Google Play
Store. It evaluated sustainability app design while assessing their effectiveness through both design and user
experience perspectives. Through a layered methodology that combined app categorization, sentiment
analysis, and topic modelling of user reviews, the research sought to understand how these apps engage users,
how they are perceived once in use, and how they succeed (or not) in supporting long-term behavior change
toward environmental goals.
The research findings demonstrate that the landscape for mobile sustainability applications may be rich in
variety, but quality-wise it remains inconsistent. Numerous apps are populating the market for digital
sustainability advocacy, indicating rising innovation and user engagement in this sphere. However, their
effectiveness and ethical standards differ substantially. All the reviewed apps with user reviews received an
overall positive sentiment score, yet the analysis revealed that positivity in sentiment does not necessarily
equal effectiveness. Instead, deeper findings showed recurring concerns around technical instability,
superficial gamification, lack of clarity in communication, and perceived opacity in behavioral mechanisms,
highlighting gaps that sentiment analysis alone cannot capture.
From the findings, important insights about these topics are revealed. First, the dominance of hybrid apps—
combining gamified and informative elements—illustrates the potential of blended strategies, but only when
alignment with sustainability goals is transparent and authentic. Gamification can be effective, but only when
it is meaningful, aligned, and transparent. Moreover, functional reliability and usability emerged as non-
negotiable prerequisites for ethical persuasive design, indicating that technical performance should be
prioritized before engagement features. Users showed strong positive reactions to apps that provided concrete,
measurable environmental actions, which reinforces the need to translate sustainability into trackable outcomes
that motivate and connect personally. Additionally, informational quality and database transparency remain
core to user trust, positioning accurate data as the foundation of ethical consumption apps. Finally, user
feedback emphasized that affordability and cultural relevance are not peripheral but essential design factors,
too often overlooked, which must be integrated to expand inclusivity and reach diverse global audiences.
The design guidelines produced from this study integrate these findings into a practical framework that
designers and developers can use to create more effective and ethically sound sustainability applications.
Rather than focusing narrowly on engagement metrics or visual appeal, app designers should prioritize building
trust, safeguarding user autonomy, and delivering measurable environmental benefits. The insights presented
here therefore aim to shift sustainability app design discussions away from superficial metrics and toward a
focus on lasting impact and user-centred ethical practice.
ACCESS Journal:
Access to Science, Business, Innovation in Digital Economy
ISSN 2683-1007 (Online)
2025, 6(3), 634-667, https://doi.org/10.46656/access.2025.6.3(10)
https://journal.access-bg.org/
664
The research also provides both methodological and practical contributions to the field by combining app
categorization, sentiment analysis, and topic modelling to create a scalable mixed-method approach for
evaluating sustainability apps. This methodological integration offers a more holistic perspective, bridging
design intentions with user experience data and revealing how design decisions are perceived in practice. The
study demonstrates that listening to users, not only during development but across the entire app lifecycle, is
critical for shaping effective sustainability interventions.
Future research should expand on these findings by including iOS platforms and niche regional markets in
the app sample. Longitudinal studies could assess whether observed behavioral shifts persist over time, while
participatory approaches—such as co-design workshops and interviews—can enrich the understanding of user
perspectives beyond textual reviews. Additionally, integrating behavioral analytics (e.g., goal completion,
retention rates, in-app actions) would validate the design guidelines and help refine best practices. App creators
are encouraged to participate actively in such validation processes, ensuring that sustainability app
development becomes a collaborative cycle between researchers, developers, and users.
Author Contributions:
Conceptualization: E.C., E.Z. and M.C; Methodology: E.C; Software: M.C; Validation, B.C, E.C.; Formal
analysis, E.C; Investigation: E.Z.; Resources: E.Z.; Data curation: M.C.; Writing—original draft preparation:
E.C.; Writing—review and editing, B.C.; Visualization: E.C.; Supervision: B.C.; Project administration: E.C.;
Funding acquisition: E.C.
All authors have read and agreed to the published version of the manuscript.
Informed Consent Statement: not applicable
Data Availability Statement:
The data presented in this study are available on request from the corresponding author.
Institutional Review Board Statement: not applicable
Conflict of interests
The authors declare no conflict of interest.
REFERENCES
Adaji, I., Idoko, P., & Adisa, M. O. (2024). Insights from the review of apps that influence environmental sustainability.
In Proceedings of the 32nd Conference on User Modeling, Adaptation and Personalization (UMAP ’24), pp. 154–
159. ACM. https://doi.org/10.1145/3631700.3664878
Adjust. (2023). The ultimate gamification guide. Adjust. https://www.adjust.com/resources/guides/app-gamification/
(accessed: 13 March 2025)
Aguiar-Castillo, L., Rufo-Torres, J., De Saa-Pérez, P., & Perez-Jimenez, R. (2018). How to encourage recycling
behaviour? The case of Wasteapp: A gamified mobile application. Sustainability, 10(5), 1544.
https://doi.org/10.3390/su10051544
ACCESS Journal:
Access to Science, Business, Innovation in Digital Economy
ISSN 2683-1007 (Online)
2025, 6(3), 634-667, https://doi.org/10.46656/access.2025.6.3(10)
https://journal.access-bg.org/
665
Ahuja, S., Kumar, J. (2021). How Ethical Are Persuasive Design Practices? A Proposal for Assessment of Ethics in HCI
Design. In: Chakrabarti, A., Poovaiah, R., Bokil, P., Kant, V. (eds) Design for Tomorrow—Volume 1. ICoRD 2021.
Smart Innovation, Systems and Technologies, vol 221. Springer, Singapore. https://doi.org/10.1007/978-981-16-
0041-8_40
Benner, D., Schöbel, S. & Janson, A. (2021). It is only for your own good, or is it? Ethical Considerations for Designing
Ethically Conscious Persuasive Information Systems. Americas Conference on Information Systems (AMCIS 2021)
Proceedings. https://aisel.aisnet.org/amcis2021/sig_hci/sig_hci/16
Benner, D., Schöbel, S. M., Janson, A., & Leimeister, J. M. (2022). How to achieve ethical persuasive design: A review
and theoretical propositions for information systems. AIS Transactions on Human-Computer Interaction, 14(4),
548–577. https://doi.org/10.17705/1thci.00179
Berdichevsky, D., & Neuenschwander, E. (1999). Toward an ethics of persuasive technology. Communications of the
ACM, 42(5), 51–58. https://doi.org/10.1145/301353.301410
Brauer, B., Ebermann, C., Hildebrandt, B., Remané, G., & Kolbe, L. M. (2016). Green by app: The contribution of mobile
applications to environmental sustainability. In Proceedings of the Pacific Asia Conference on Information Systems
(PACIS 2016) (Paper 220). AIS Electronic Library (AISeL). https://aisel.aisnet.org/pacis2016/220
Condori-Fernandez, N., & Lago, P. (2018). Characterizing the contribution of quality requirements to software
sustainability. Journal of Systems and Software, 137, 289–305. https://doi.org/10.1016/j.jss.2017.12.005
Davis, J. (2009). Design methods for ethical persuasive computing. In Proceedings of the 4th International Conference
on Persuasive Technology (Persuasive ’09) (Article 6, pp. 1–8). ACM. https://doi.org/10.1145/1541948.1541957
Douglas, B. D., & Brauer, M. (2021). Gamification to prevent climate change: A review of games and apps for
sustainability. Current Opinion in Psychology, 42, 89–94. https://doi.org/10.1016/j.copsyc.2021.04.008
Farronato, N., Scuotto, V., Pironti, M., & Del Giudice, M. (2024). The green frontier of mobile applications in improving
recycling consumers’ behavior. IEEE Transactions on Engineering Management, 71, 13191–13200.
https://doi.org/10.1109/TEM.2022.3200945
Fogg, B. J. (2003). Computers as persuasive social actors. In B. J. Fogg (Ed.), Persuasive technology: Using computers
to change what we think and do, pp. 89–120. Morgan Kaufmann. https://doi.org/10.1016/B978-155860643-2/50007-
X
Fonseca, A., Kazman, R., & Lago, P. (2019). A manifesto for energy-aware software. IEEE Software, 36(6), 79–82.
https://doi.org/10.1109/MS.2019.2924498
Guillén, G. M., Fernández Galeote, D., Sicevic, N., Hamari, J., & Quist, J. (2022). Gamified apps for sustainable
consumption: A systematic review. In Proceedings of the 6th International GamiFIN Conference (GamiFIN 2022),
pp. 135–145. CEUR-WS. https://ceur-ws.org/Vol-3147/paper14.pdf (accessed: 13 March 2025)
Hanggoro, A., Putra, M. A., Reynaldo, R., & Sari, R. F. (2013). Green house monitoring and controlling using Android
mobile application. In 2013 International Conference on QiR, Yogyakarta, Indonesia, pp. 79–85. IEEE.
https://doi.org/10.1109/QiR.2013.6632541
Hensher, M., Cooper, P., Arachchige Dona, S. W., Angeles, M. R., Nguyen, D., Heynsbergh, N., Chatterton, M. L., &
Peeters, A. (2021). Scoping review: Development and assessment of evaluation frameworks of mobile health apps
for recommendations to consumers. Journal of the American Medical Informatics Association, 28(6), 1318–1329.
https://doi.org/10.1093/jamia/ocab041
Henson, P., David, G., Albright, K., & Torous, J. (2019). Deriving a practical framework for the evaluation of health
apps. The Lancet Digital Health, 1(2), e52–e54. https://doi.org/10.1016/S2589-7500(19)30013-5
Khaleel, F. L., Ashaari, N. S., Tengku Wook, T. S. M., & Ismail, A. (2016). Gamification elements for learning
applications. International Journal on Advanced Science Engineering and Information Technology, 6(6), 1379–
1384. https://doi.org/10.18517/ijaseit.6.6.1379
Kight, R., & Burri Gram-Hansen, S. (2019). Do ethics matter in persuasive technology? In H. Oinas-Kukkonen, K. Hasle,
H. W. Oinas-Kukkonen, & C. R. Reijula (Eds.), Persuasive technology: Development of persuasive and behavior
change support systems. Lecture Notes in Computer Science, Vol. 11433, pp. 144–155. Springer, Cham.
https://doi.org/10.1007/978-3-030-17287-9_12
Lago, P., Jansen, T. (2011). Creating Environmental Awareness in Service Oriented Software Engineering. In:
Maximilien, E.M., Rossi, G., Yuan, ST., Ludwig, H., Fantinato, M. (eds) Service-Oriented Computing. ICSOC
2010. Lecture Notes in Computer Science, vol 6568, pp. 181–186. Springer, Berlin, Heidelberg.
https://doi.org/10.1007/978-3-642-19394-1_19

ACCESS Journal:
Access to Science, Business, Innovation in Digital Economy
ISSN 2683-1007 (Online)
2025, 6(3), 634-667, https://doi.org/10.46656/access.2025.6.3(10)
https://journal.access-bg.org/
666
Lago, P., Gu, Q., & Bozzelli, P. (2014). A systematic literature review of green software metrics. Vrije Universiteit
Amsterdam, Network Institute. https://research.vu.nl/ws/portalfiles/portal/910331/SLR%20GreenMetrics.pdf
(accessed: 13 March 2025)
Lago, P., Koçak, S. A., Crnkovic, I., & Penzenstadler, B. (2015). Framing sustainability as a property of software quality.
Communications of the ACM, 58(10), 70–78. https://doi.org/10.1145/2714560
Law, F. L., Kasirun, Z. M., & Gan, C. K. (2011). Gamification towards sustainable mobile application. In 2011 Malaysian
Conference in Software Engineering (MySEC), pp. 349–353. IEEE. https://doi.org/10.1109/MySEC.2011.6140696
Lees, M., Wentzel, M. T., Clark, J. H., & Hurst, G. A. (2020). Green tycoon: A mobile application game to introduce
biorefining principles in green chemistry. Journal of Chemical Education, 97(7), 2014–2019.
https://doi.org/10.1021/acs.jchemed.0c00363
Procaccianti, G., Lago, P., Vetrò, A., Fernández, D. M., & Wieringa, R. (2015). The green lab: Experimentation in
software energy efficiency. In Proceedings of the 37th International Conference on Software Engineering (ICSE
2015), Technical Briefing, pp. 941–942, IEEE. https://doi.org/10.1109/ICSE.2015.297
Schwanen, T. (2015). Beyond instrument: Smartphone app and sustainable mobility. European Journal of Transport and
Infrastructure Research, 15(4), 675–690. http://tlo.tbm.tudelft.nl/ejtir
Sunio, V., & Schmöcker, J.-D. (2017). Can we promote sustainable travel behavior through mobile apps? Evaluation and
review of evidence. International Journal of Sustainable Transportation, 11(8), 553–566.
https://doi.org/10.1080/15568318.2017.1300716
Suruliraj, B., Nkwo, M., & Orji, R. (2020). Persuasive mobile apps for sustainable waste management: A systematic
review. In A. MacIntyre, T. V. Choudrie, A. T. Vassileva, & H. Oinas-Kukkonen (Eds.), Persuasive technology:
Designing for future change. Lecture Notes in Computer Science, Vol. 12064, pp. 182–194. Springer.
https://doi.org/10.1007/978-3-030-45712-9_14
Tairov, I., Stefanova, N., Aleksandrova, A., Aleksandrov, M. (2024). Review of AI-Driven Solutions in Business Value
and Operational Efficiency. Economics Ecology Socium, 8, 55-66. https://doi.org/10.61954/2616-7107/2024.8.3-5
The Beetroot Team. (2024). Top design trends shaping green tech and clean energy mobile apps. Beetroot.
https://beetroot.co/greentech/top-design-trends-shaping-green-tech-and-clean-energy-mobile-apps/ (accessed: 13
March 2025)
Verdecchia, R., Lago, P., Ebert, C., & de Vries, C. (2021). Green IT and green software. IEEE Software, 38(6), 7–15.
https://doi.org/10.1109/MS.2021.3102254
Wolfram, N., Lago, P., & Osborne, F. (2018). Sustainability in software engineering. In Proceedings of the 5th IFIP
Conference on Sustainable Internet and ICT for Sustainability (SustainIT 2017), Funchal, Portugal, pp. 21–27.
IEEE. https://doi.org/10.23919/SustainIT.2017.8379798
About the authors
Eva CIPI
Director of the Regional Development Center at the University of Vlora,
Albania. She has coordinated Erasmus+ and Interreg projects such as
TEAVET, CRED4TEACH, and SuProM, and published on AI in education
and green competencies. Her work bridges academia, innovation, and policy,
strengthening international cooperation.
Research interest: teacher professional development, digital education,
micro-credentials, and sustainable development.
ORCID iD: 0000-0001-6930-9143

ACCESS Journal:
Access to Science, Business, Innovation in Digital Economy
ISSN 2683-1007 (Online)
2025, 6(3), 634-667, https://doi.org/10.46656/access.2025.6.3(10)
https://journal.access-bg.org/
667
Eljona ZANAJ
PhD researcher at University Ismail Qemali Vlore, Vlore, Albania. Assistant
Lecturer (Department of Computer Science)
Research interest: researching energy efficiency in IoT and smart water
quality monitoring, environmental sustainability.
ORCID iD: 0000-0003-2950-5988
Marsia CIPI
She has a master degree in Management and Informatics from Italian
Switzerland University of Lugano.
Research interest: Digital economy, innovative technologies. digital
transformation, and applied research for apps sustainability
ORCID iD: 0009-0004-8479-5257
Betim CICO,
PhD., Professor (Computer Engineering) and researcher specializing in
electrical engineering, ICT, and applied sciences at the University Epoka,
Tirana, Albania.
Research interest: sustainable engineering solutions and innovation in
higher education, digital systems, smart technologies; high-performance
computing, digital design methodologies and tools,
ORCID iD: 0000-0001-9078-6147
This work is licensed under the Creative Commons Attribution International License (CC BY)

Last updated on December 18, 2024
GUIDELINES FOR AUTHORS
General requirements for submission formatting
The language of the article: English.
The article should be prepared and submitted of the journal in word processing program
Microsoft Office Word 2003, in ".doc" format, with tables and figures included in the body of
the text.
The article should not have more than 5 authors (co-authors) including their affiliations (only
the title of the organization, as far as legal entity concerns, do not mention the department,
laboratory, or any other structural subdivision).
The submission template must be used in a mandatory manner. This journal register in the
submission metadata the ORCID ID from authors.
We adopted the system of continuous flow of publishing with closing of the editions in the
months of May, September and January.
Contribution to definition of authorship
The recognition of authorship is based on a substantial contribution, related to the following
aspects:
(i) designing and delineating the study, analysis and interpretation of the data; (ii) writing or
critical review relevant to the intellectual content of the manuscript; (iii) final approval of the
version to be published; and (iv) responsibility for all aspects of the work, including ensuring
its accuracy and integrity. All those designated as authors must meet the four criteria for
authorship, and all those who meet the four criteria should be identified as authors.
At the submission checklist, is required that everyone's participation in the preparation of the
manuscript and publicly assume responsibility for its content. At the end of the text of the
manuscript, a paragraph should be included with the information on the contribution of each
author to its elaboration.
The list of authors includes only those persons who have really taken part in the research and
agreed to bear full responsibility for its content. Research funding or taking part in paying the
article processing charge is not a prerequisite for being included in the list of co-authors.
While forming the list of the authors, a special attention should be paid to the COPE
(Committee on Publication Ethics) principles.
TITLE
The title of the manuscript should fully reflect the topic of the research and its content. It must
be short and concrete (not more than 15 words). Besides it should catch the reader’s interest
and it should be written using the scientific style. It is appropriate to point the object of
research or concretize it using the colon or the brackets. It is not recommended to use
contractions, but if used, then only for the commonly known ones.
Please define the type of the manuscript of five possible variants and adhere to both the
general guidelines and the recommendations, which are specific for the type of the chosen
manuscript.
The following types of manuscripts can be submitted to the journal:
research paper, which is a final report on the finished original experimental study
(the structure is Abstract, Introduction, Literature review, Method, Results, Discussion,
Conclusion);
theoretical paper, which is devoted to theoretical study of the problem, which
complies with the journal’s scope (the structure is Abstract, Introduction, Theoretical
Basis, Results, Discussion, Conclusion);
Last updated on December 18, 2024
conceptual paper. The significance of a conceptual paper is its ability to develop
logical and complete arguments rather than to test them empirically. The focus is on
integration and proposing new relationships among constructs. Beyond summarizing
recent research, manuscripts should provide an integration of literatures, offer an
integrated framework, provide value added, and highlight directions for future inquiry.
A conceptual paper doesn’t present original data…but it must present an original
concept. Papers are not expected to offer empirical data;
case report. A case study, case report, or other description and discussion of a case
based on original observations;
review paper, which is a study of concrete scientific problem, which complies with
the journal’s scope and is conducted based on the materials of the scientific
publications (the structure is Abstract, Introduction, Literature review, generalization
of the main statements, Discussion, Conclusion). Review articles identify specific gaps
or problems and provide recommendations for future research.
Other sections and subsections are accepted, such as the Bibliographic Review, however, the
above sections are mandatory. The availability of a template for submission aims to
standardize the submission format text of the journal, reducing the publishing period, and
making possible the scheduled periodicity. The list of references should be presented at the
end of the text, in a specific section.
Do not use footnotes!
Throughout the text, the international system of units (IS) should be used to indicate measures.
Section headings should be set in bold.
Abstract
Abstract should be not less than 250 words and must fully reflect the paper’s content, should
resemble a conclusion, outlining the goals, methodology and results of the research.
It is advisable to use Passive Voice or sentences such as “The paper deals with…” or “The
study analyzes…” This should be done according to the following algorithm: first two or
three sentences indicate the relevance of the topic; the aim and object of the study; the
methodology (methods) of the study (for theoretical studies – its theoretical basis) are
described; the results obtained are characterized, conclusions are drawn from them and the
practical value (if any) is indicated. The main body of the abstract should demonstrate the
result. Every statement must follow logically from the previous one. In the abstract for a
research paper, it is recommended to use the numerical results. The abstract of the review
article should indicate the issues under study, and as a result, present the author's summary of
the analysis.
The text should be concise and original. It is not appropriate to use the sentences in the
Abstract from the text of the paper. At the same time, the material which is absent in the paper
cannot be presented in the Abstract. It is advisable not to refer to any sources in the abstract,
tables and figures cannot be also used.
Non-standard or unusual abbreviations should be avoided, but if important, they should be
identified when first mentioned in the abstract.
METADATA
the author’s name, surname (it is obligatory to give the author’s name and surname in
English according to passport data or any other IDs);
the author’s information (place of work or study, city);
the title of the article;
the abstract;

Last updated on December 18, 2024
key words (should not duplicate words from the title of the article);
JEL Classіfіcatіon;
Institutional e-mail;
Identifier ORCID;
references.
REQUIREMENTS FOR THE TEXT FORMATTING
Requirements for the structure of the article (elements with text highlighting):
general problem statement and its connection with main scientific and practical tasks
(Introduction);
analysis of recent researches and publications, which contain background for solution
of the given problem and which the author relies on (Analysis of recent researches and
publications);
highlighting of previously unsettled problem constituent that is a part of the main
problem, which the article is dedicated to (Previously unsettled problem constituent);
formulation of the purpose of the article (Main purpose of the article);
presentation of the main research material with full argumentation of received
scientific results (Results and discussions);
conclusions of the given research and perspectives for further researches in the given
direction (Conclusions and further researches directions);
References;
Requirements for the article formatting:
the length of the article is from 10 to 15 pages (8000 words including spaces, but
excluding an abstract and references);
page format – A4 format (210 x 297 mm) page;
page guidelines: top – 25 mm, bottom – 25 mm, left and right – 20 mm.
Alignment Justify, Line Spacing Single, Paragraph Before 0 pt, After 0 pt, Indentation
Right/Left 0 pt.
Do not use the numbering of pages.
the article font guidelines: font size – 11-point, font type - Times New Roman, 1,5 line
spacing.
Requirements for formatting of the article structural elements:
JEL Classіfіcatіon (without paragraph indent, semi-bold, centered-alignment): font
size – 10-point, font type – Times New Roman;
the author’s name and surname (one line space, without paragraph indent, semi-bold,
centered-alignment): font size – 12-point, font type – Times New Roman;
job of author (without paragraph indent, in italics, centered-alignment): font size – 10-
point, font type – Times New Roman, line spacing – 1,5;
Institutional e-mail (without paragraph indent, in italics, centered-alignment): font size
– 10-point, font type – Times New Roman;
the title of the article (one line space, capital letters, without paragraph indent, semi-
bold, centered-alignment): font size – 14-point, font type – Times New Roman, line
spacing - 1;
the abstract and key words (one line space, in italics, justified-alignment): font size –
10-point, font type – Times New Roman, line spacing - 1, paragraph indent – 1 cm;
the text of the article (one line space, justified-alignment): font size – 11-point, font
type – Times New Roman, line spacing – 1,5;
Last updated on December 18, 2024
references: font size – 10-point, font type – Times New Roman, line spacing - 1;
Paragraph spacing: before 5pt, after 5 pt;
identifier ORCID – end of paper (in about the authors), without paragraph indent, left-
alignment: font size – 10-point, font type – Times New Roman;
Author Photo – end of paper (JPG/JPEG format with resolution not less than 300 dpi)
Requirements for formatting the references (References):
REFERENCES are formatting according to international bibliographical standard
APA-2010 style in accordance with the specimen and requirements set on the website
of the Journal.
References should include not less than 20 sources, covering important previous
works realised in the given area of interest on an international scale. References
covered by major citation databases are preferred (Scopus, Web of Science).
The reference be listed alphabetically and names of all authors should be given. Do
NOT use "et al." in the list of references!
The titles of Cirilic periodicals (journals, collections and others) are given by
transliteration, and they are given in parenthesis in English;
with obligatory citations in the text of the article, which are given in brackets in the
text (alphabetically) and they appear in an order of citation or reference;
references for the personal author’s works or articles (self-citation) should not exceed
more than 10% from the general number of sources.
Requirements for drawing tables, pictures and formulas:
tables should have a serial number and a title in the middle (Table 1. Title): font size -
10, interline spacing - 1, font type - Times New Roman;
text in table: font size - 9, font type - Time New Roman; interline spacing - 1;
pictures/ drawings must have a serial number and a name in the middle (Figure 1.
Title): font size - 10, interline interval - 1, font type - Times New Roman;
drawings are made in graphic editors, compatible with Word in the format JPG with a
resolution of not less than 300 dpi;
mathematical formulas are provided using the built-in Microsoft Equation formula
editor;
Equations and formulas are arranged in the center of the line, the number of the formula
(in round brackets, on the right-hand side of the page, separated by blank lines): font
size - 10, interline spacing - 1, font type - Times New Roman.
Final provisions
At the end of the manuscript each author must specify his/her short biography and research
interests (maximum 100 words) should be provided (Times New Roman, 10 pt).
For each of the authors ORCID personal number needed, author photo (JPG/JPEG format
with resolution not less than 300 dpi).
Fees and charges
If there is no external funding, then the APC is 1150 Euros. This publication fee has to be
paid after submitted paper is reviewed and accepted for publishing. There are no article
submission charges or article reviewing charges. Conventional paper length does not exceed
8000 words. In case a paper is longer than 8000 words, an additional lump sum of 150 Euros
is charged. Editorial team don´t receive any fee.


Additional services
ACCESS Press publishes conference abstracts and proceedings, scientific works, yearbooks,
monographs, collective monograph series, journals and other literature resources, and
management of scientific data sets.
Our team prepares and publishes monographs, scientific and reference literature, PhD and
doctoral thesis and dissertations, conference proceedings, monographs in all languages.
We check the text for uniqueness / plagiarism as well as, if necessary, we edit and format the
publication.
Publication of various academic and educational literatures enables us to develop and offer our
authors european publications with foreign output data with international number ISBN/ ISSN.
We carry out the assessment of all the received articles and books quickly and we can offer
optimum terms of cooperation.
When visiting Our E-books section website, you can read electronic books free of charge.
SERVICES
• Uniqueness verification (plagiarism)
• Article proofreading and editing
• Editing and formatting
• APA style
• Profile registration in ORCID, PUBLONS,
Google Scholar, ResearchGate
• Increase of H-index/Work with indexing
• Assign DOIs
• Advertising
Additional services
• Positioning in a format for e-books (epub,
etc.)
• DOI (Digital Object Identifier) assignation.
DOI facilitates the process of search, citing
and localization of scientific work.
• Inclusion of your monograph into RSCI
database Elibrary.ru
• Publication with all metadata - annotation,
key words, list of cited references, which
will significantly increase author's rating
Publications are reckoned by the Higher Attestation Commission as a publication in a
foreign publishing house.
E-BOOKS PUBLISHING
ACCESS Press aims to meet public needs acting in the areas of education, life-long learning,
training, scientific research, organizing of scientific, cultural and other events.
ACCESS Press has a team with well-established experts with extensive experience in wide range of
academic fields of journals, collections and books. In the Reviewer board members are scientists and
experts from the countries of Europe, Russia, CIS. This provides an international expert evaluation of
the incoming scientific materials.

Advertising services
You can contact the Editor-in-Chief for more detailed information about the
financial terms of the advertising in the journal.
We invite scientists, researchers and practitioners to cooperate!
Why electronic format?
You have the foreign publication in the shortest terms, minimum term is 1 day.
You have full legal rights on the intellectual property even if it is an electronic
version
You receive the electronic version of your book that has absolutely the same legal
properties as a printed version. The electronic version already has all necessary
requisites: Bulgarian ISBN and all output data according to the international
standards
Moreover, of course, the important parameter is the cost. We offer services of the
European quality at the price almost coinciding with the prices in many other
countries. Therefore, an electronic format of publication is an excellent option for
the favorable and quick publication
WHAT WE PUBLISH
The wide range of services, we provide, allows us to guarantee a scientist a
successful publication indexed in the largest scientific databases.
If you have a ready-made text of a monograph or other scientific publication and
you want to publish it, you can take the opportunity of receiving the most qualitative
result for the given price.
Your proposal will be evaluated by the Editor(s) and/or an external reviewer who is
an expert in the fields covered. If accepted, the final manuscript also needs the
approval from the Editor(s) before it is published, to ensure the quality of each book.
The cost of services is calculated individually, and there is a fee for the provision of
correct editing of materials for promotion in scientific journals, including consulting.
The final cost of services varies according to the volume of work and urgency.
Order the service by contacting us on the website or e-mail.

Included in ACCESS Press proceedings service package
Creation of a full-fledged web site dedicated to your conference with its own URL, including
search engine, table of contents, conference details, etc.
Professional hosting service, guaranteeing 24-hour access and fast response times
Comprehensive similarity checking and plagiarism detection for all articles to be published in a
proceedings
Personalized, high-quality assistance for preparing your conference and proceedings
Provision of clear instructions for authors and editors, as well as style sheets, for Word
Fast and high-quality communication with a dedicated Access Press staff member in either
English,or Russian
Articles can be of any length with no restrictions on the use of colours and the possibility to
add multi-media elements
Fast publication of your proceedings in less than 2 weeks
Registration of an ISBN for your proceedings publication
Inclusion in major search engines, such as Google and Google Scholar
Registration of a unique online reference (DOI) for all articles at CrossRef
Submission to relevant indexation databases
PROCEEDINGS AND CONFERENCES
ACCESS Press publishes proceedings in all major disciplines. We offer conference, symposium
and workshop organizers a unique service which is not only fast and personalized, but also
ensures maximum visibility for their conference and workshop proceedings.
All proceedings on the ACCESS Press platform are open access and hence freely accessible for all
to read.
Where applicable, we take care that these proceedings are submitted to relevant indexation
databases.
ACCESS Press adheres to the ethical frameworks and guidelines of the Committee on Publication
Ethics (COPE), including the COPE Core Practices and the Principles of Transparency and Best
Practice in Scholarly Publishing

Publications are reckoned by the Higher Attestation Commission as a
publication in a foreign publishing house.
European publication with foreign output data with international number ISSN.
Prompt e-mailing of a journal’s electronic version to authors.
Every journal gets its own space on the web, and still present in the search
results for the whole platform.
Journals are published in open access mode on the publishing house
site access-bg.org
ACCESS publishes academic journals that belong to universities, research
institutes, academies of sciences, learned societies and other organizations. We
can publish them both in the Open Access and in traditional (paid access) models.
We currently publish journals in the English language, but content in other
languages will be considered.
We have a special offer for universities and other organizations to publish their
English language journals, books and other publications.
ONLINE PLATFORM FOR ELECTRONIC JOURNALS
As ACCESS Press understands the importance of core principles of scholarly communication, the
editors of journals strive to organise peer review process within 20 days, and publishing house
puts effort in publishing articles usually within 2–4 weeks after acceptance.
All journals on the ACCESS Press platform follow the highest international standards on
publishing ethics as described in the ethical frameworks and guidelines of the Committee on
Publication Ethics (COPE). ACCESS Press is a strong advocate of integrity in science and adheres
to these guidelines in full. Moreover, we are a strong supporter of the principles of openness,
transparency and reproducibility in research and an organizational signatory of the Transparency
and Openness Promotion (TOP) guidelines issued by the Center for Open Science.
We follow strict guidelines for authors and our eminent editorial board members
are also dedicated to build a framework that is based on the ethics and virtues of
publication. Access Press safeguards that each article is peer-reviewed and goes
through a strict screening process before being published.
Detailed information about each journal can be found in their homepages.

Recently, the interest of the scientific community in the scientometric
indicators impact factor, IF and impact rank, SJR, which reflect the level of
citation of articles published in various journals, is increased. Inclusion of
scientific journals in global indexed systems for citations Scopus and
Web of Science requires the editors and publishers to meet the selection
criteria, strictly established by these systems, which generally meet the
international standards for the issuance of scientific periodicals. As one
of the 13 criteria for selection of journals in Scopus is online
accessibility - accessibility to the journal site with a mandatory English
version and the quality of the journal site, the ACCESS team has created
a platform for periodic electronic publications.
Each university needs objective data for assessment of the science, for
making decision for further development.
Main problems of the quantity assessment of publications are an
insufficient number of journals in Scopus and Web of Science.
ACCESS Press has a special offer for universities and other organizations that are seeking
a partner to publish all or some of their English language journals, books and other
publications. This applies to new publications and to previously published books and previous
journal volumes. We publish monographs, textbooks, edited volumes, and other categories.
The university can decide if a given journal or book is published using the Open Access or paid
access model. All books and journal articles bear both the university and ACCESS logos.
ACCESS Press will design, produce and manage the website of this publishing house. The role
of the university is to select and channel books and book proposals for this publishing co-
operation, as well as to promote this publishing opportunity to its faculty.
The university can decide which package of services applies to each journal and book. Such
packages are described in the pages for journals and books. If the value of the contract
exceeds an agreed amount, the university can enjoy discounts up to 60% on standard
fees.
Please contact us to discuss the terms of the ACCESS Publishing House offer.
Main features of ACCESS Journal Platform
- Each journal has a dedicated website, which by request can have a custom
design
- Journal websites have a dedicated subdomain myjournalname.access-bg.org,
but by request the journal can use a dedicated domain myjournalname.com
and still use the ACCESS platform
- Each journal website has informational sections – description of the journal
subject, editorial board, review policy, open access policy
- Each journal website has a contact page to contact the journal team
- Each journal has an archive with all the issues and their articles
- Each journal website has a search functionality only in the context of the
journal, results from the rest of the platform are not included
- By request each journal structure can be customized
- Journal websites are built in English, but by request they can be customized to
be multi-language
- The main platform website has links to each journal website
- The main platform search and browse functionalities include all issues and
articles from the journal websites, linking to them
- The main platform and each journal website is with responsive design and
mobile-friendly
Administration
- Each journal administrator has access to a control panel to administrate their
content and upload new issues
- The control panel is user-friendly and with responsive design, working equally
well on all kinds of mobile and desktop devices
- Administrators can add, edit, remove issues
- Administrators can add, edit, remove articles
- Administrators can manage most of their site content


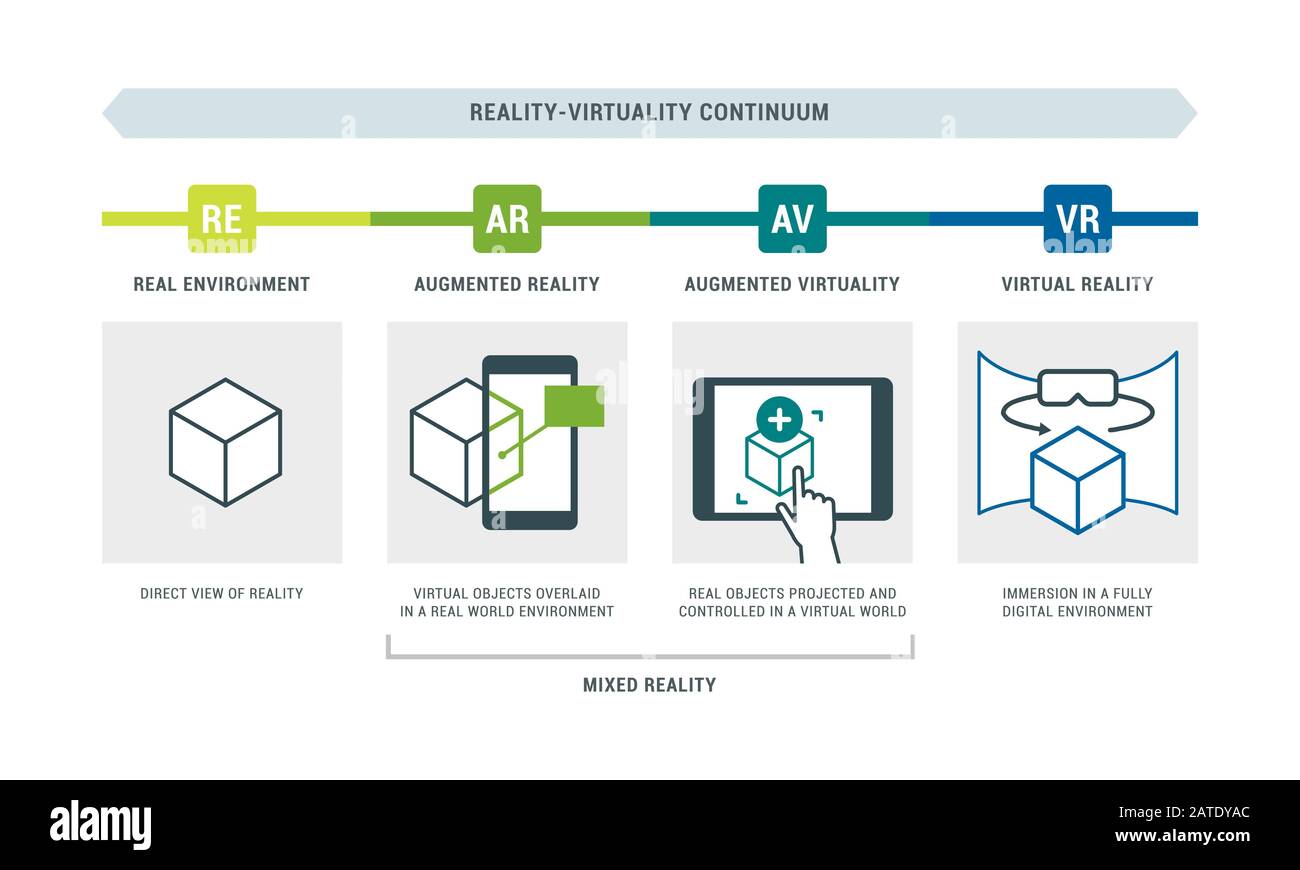