Performance Insights MONTHLY REPORT | JUNE 2025 PDF Free Download
1 / 18/18
100%

FTSE Russell |
Performance Insights
MONTHLY REPORT | JUNE 2025
Monthly Performance Report Europe June 2025 1
Risk assets gain in “relief rally” after US tariffs pause
Equities rally broadly led by cyclical industries. Gold is flat in a seeming reversal of
April’s flight to quality. Long yields rise in many developed markets.
Global Equities – US large-caps lead
In LCY* terms, the Russell 1000, FTSE 250 and Eurozone indices outperformed FTSE
All-World, while Russell 2000, Japan, Asia Pacific, FTSE 100 and Emerging lagged.
Global Fixed Income – High yield corporates outperform
French and EM government bonds led their global counterparts in LCY* terms and
high yield corporates outperformed investment grade corporates across regions.
Commodities – Gold is flat; oil is slightly lower
After surging in April, gold was flat over the month. Oil posted a modest loss. Copper
and the broad commodity index were in the green in a reversal from April.
Equity Industries – Tech leads; Health Care lags the most
On average, across regions Tech led industry returns (LCY*), followed by Industrials
and Financials. Health Care lagged broadly, especially in the US.
Equity Factors – Momentum outperforms
In May, Momentum outperformed in LCY* terms across regions, while Low Vol lagged
broadly as April’s heightened volatility declined.
Alternative Indices – REITs lag
REITs were hurt by rising long yields in many developed markets. Most alternative
indices lagged their rallying equity benchmarks.
Foreign exchange – EUR strength moderates; GBP appreciates broadly
The euro depreciated versus most global currencies, while the GBP appreciated,
including versus the euro and dollar. The yen weakened broadly.
EUROPE
EUROZONE & UK EDITION
1M Change
+6.1%
FTSE Eurozone (TR, EUR)
+3.8%
FTSE 100 (TR, GBP)
-0.6%
Oil Price (Brent, USD) +6.1%
FTSE 250 (TR, GBP)
+7 bps
10-yr German Bund Yield +21 bps
10-yr UK Gilt Yield
+8.7%
FTSE Dev Europe ex UK
Technology (TR, EUR)
+8.4%
FTSE UK
Industrials (TR, GBP)
-0.1%
EUR vs USD +1.0%
GBP vs USD
CONTENTS
Macro Overview 2
Asset Class Returns 3-4
Global Equity Returns 5
Industry/Sector Contributions 6-8
Alternative Indices Returns 9
Equity Factor Returns 10
Foreign Exchange Returns 11
Asset Class Risk/Return 12-13
Asset Class Correlations 14
Appendix 15-17
AUTHORS
Mark Barnes, PhD
Head of Global Investment
Research, Americas
Mark.Barnes@lseg.com
Indhu Raghavan, CFA
Manager, Global Investment
Research
Indhu.Raghavan@lseg.com
80
85
90
95
100
105
110
May-24 Aug-24 Nov-24 Feb-25 May-25
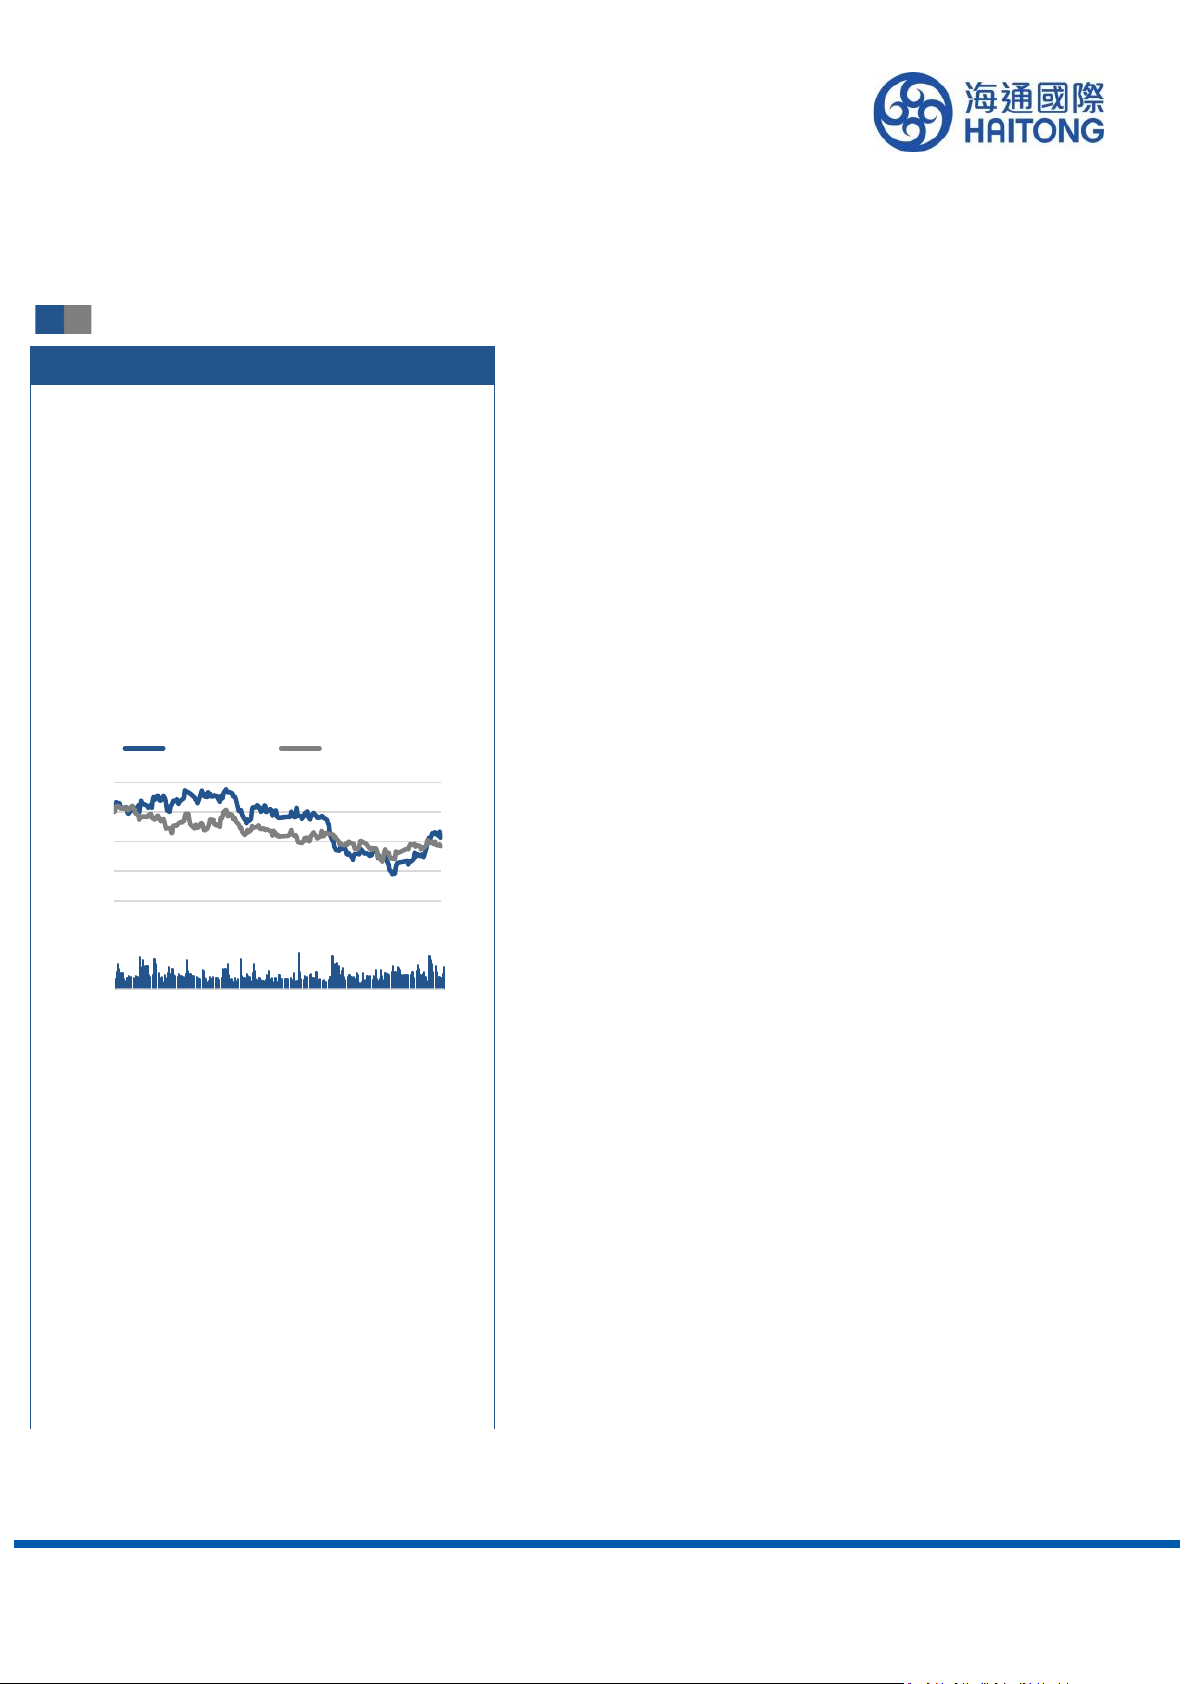
Regional Index Returns Relative to FTSE All-World (Rebased, TR,
EUR)
Russell 1000/AW UK/AW
Developed Europe ex UK/AW Japan/AW
Developed Asia Pac ex Japan/AW Emerging/AW
Source: FTSE Russell and LSEG. Data as of May 31, 2025. *LCY = local currency. Past performance is no guarantee of future results. Please see the end for
important legal disclosures.

FTSE Russell |
1
2
3
4
May-24 Aug-24 Nov-24 Feb-25 May-25
Germany Govt Bond Yields (%)
2-year 10-year
3
4
5
May-24 Aug-24 Nov-24 Feb-25 May-25
UK Govt Bond Yields (%)
2-year 10-year
In May, global markets withstood sustained uncertainty
from US tariff policies and their anticipated impact on
growth and inflation. The US administration was engaged in
tariff negotiations with several trading partners amid judicial
challenges to its tariff policies. Macro indicators continued
to present a mixed picture across regions.
The US’s Q1 GDP growth was revised up from -0.3% to
-0.2%. The first quarter data reflected a sharp decrease in
net exports as businesses front-ran tariffs and increased
imports, as well as a moderation in private and government
spending. Some key trading partners of the US reflected
the opposite trend in quarterly trade flows, which helped
their Q1 GDP growth. Both the UK’s and Canada’s Q1 GDP
growth received a boost from higher net export volumes.
But Japan was an exception. Its Q1 GDP contracted on
softer domestic demand and a slowdown in exports. May
flash PMIs were higher from last month in the US, UK and
Japan, while they declined slightly in Germany and the
Eurozone.
The US’s April headline CPI inflation was stable or slightly
lower, as was the case in Canada, Germany and the
Eurozone. In the UK, higher utility prices have begun to
Monthly Performance Report Europe June 2025 2
Macro Overview — May 2025
feed into inflation data and CPI inflation jumped in April. In
Japan, CPI inflation was slightly lower but sustained at a
high level on rising food costs and entrenched wage
inflation. China’s April CPI inflation was less negative than
in March, while core CPI inflation was positive.
Both the Fed and the Bank of Japan held policy rates in
May given inflationary pressures. However, the Bank of
England cut by 25 bps in early May citing progress in
disinflation; its policy rate was still in restrictive territory.
The People’s Bank of China reduced its 7-day reverse
repo rate by 10 bps, after last cutting in September 2024.
Given this macro backdrop, combined with rising fiscal
concerns in several developed economies, 10-year
government yields rose around 20 bps in the US, the UK
and Japan. Among emerging markets, long yields fell
notably in South Africa, India and Brazil.
While tariff risks persisted over the month, risk assets
gained in a “relief rally,” as much of the announced high
tariff rates were yet to go into effect and businesses
delayed passing on price increases to consumers.
Equities broadly, and cyclical industries in particular,
rallied. Gold was flat over the month, and the US dollar
weakened with a few exceptions.
Source: FTSE Russell and LSEG. Data as of May 31, 2025. Past performance is no guarantee of future results.
In May, German 2
-yr and 10-yr risk-free yields rose slightly
by 9 & 7 bps, respectively.
I
n May, the UK govt. yield curve shifted up as the 2-yr and
10
-yr yields rose by 22 & 21 bps, respectively.
Key Macro Indicators
Important notes: GDP: QoQ GDP growth rates are annualized. Japan’s poll GDP growth is for FY 2025 ending March 2026. Composite PMI: May
PMI are flash composite PMI, except for Japan which is flash manufacturing PMI. April PMI are final composite PMI, except for Canada and Japan
which are final manufacturing PMI.
10YR Yield (%)
QoQ Poll
period 25Q1 2025 May Apr Apr Mar Apr Mar Apr Mar May Chng May Apr
US -0.2 1.4 52.1 50.6 2.3 2.4 2.8 2.8 4.2 4.2 4.50 4.42 4.18
Canada 2.2 1.3 45.3 1.7 2.3 2.6 2.2 6.9 6.7 2.75 3.20 3.10
UK 2.9 1.0 49.4 48.5 3.5 2.5 3.8 3.3 4.5 4.5 4.25 -0.25 4.65 4.44
Germany 1.7 0.1 48.6 50.1 2.1 2.2 2.9 2.6 6.3 6.3 2.51 2.44
Eurozone 1.3 0.8 49.5 50.4 2.1 2.1 2.7 2.4 6.2 2.25
Japan -0.7 0.5 49.0 48.7 3.5 3.6 3.0 2.9 2.5 2.5 0.50 1.50 1.31
China 6.2 4.5 51.1 -0.1 -0.2 0.3 0.3 5.0 5.1 1.40 -0.10 1.70 1.63
YoY
YoY
Policy Rate (%)
GDP (%)
CPI (%)
Composite PMI
Unemployment (%)
CPI Core (%)

FTSE Russell |
In May, global equities finished in the green and US large-caps rallied strongly to recover their losses year-to-date
(YTD).
In local currency terms, the Russell 1000, FTSE 250 and Eurozone indices outperformed FTSE All-World, while the
Russell 2000, Japan, Asia Pacific, FTSE 100 and Emerging indices lagged the global benchmark. The April rebound in
US Software and Computer Services sectors in both large- and small-cap segments continued in May and the rally
broadened to other sectors particularly in Financials and Discretionary. YTD, the Russell 2000 index was still in the red.
In Europe and the UK, contributions from cyclicals such as Industrials and Financials boosted returns. YTD, Eurozone
equities continued to lead their global peers.
The US dollar’s weakness moderated slightly in May. While most global currencies including the British pound
strengthened versus the USD, the yen was notably weaker while the euro was more or less on par. Most global
currencies gained versus the euro in May, while they depreciated versus the pound with a few exceptions (page 11).
The yen, Brazilian real and Indian rupee weakened versus both the euro and pound. The currency impact on returns
was therefore most pronounced for Japanese equities whose returns were lower in both EUR and GBP terms. In EUR
and GBP terms, Asia Pacific equities also outperformed FTSE All-World, while Japanese equities lagged their global
peers the most.
After being sharply down in April, oil price was only slightly down in May. Copper and the broad commodity index
posted gains, while gold was essentially flat as market sentiment reversed from April’s flight to quality.
Asset Class Returns – 1M & YTD (LCY, EUR, GBP, TR %)
Monthly Performance Report Europe June 2025 3
Source: FTSE Russell and LSEG. Data as of May 31, 2025. Past performance is no guarantee of future results.
2.0
0.9
0.0
-0.6
8.4
-0.4
25.3
-14.5
-24-23-22-21-20-19-18-17-16-15-14-13-12-11-10-9-8-7-6-5-4-3-2-101234567891011121314151617181920212223242526272829303132
Copper
CRB Commodity Index
Gold
Crude Oil
Commodities in USD
1.0
0.9
-0.1
-1.1
7.7
1.4
9.6
8.9
-4 1 6 11
British Pound
Chinese Yuan
Euro
Japanese Yen
FX Moves vs USD
7.1
6.5
6.1
6.0
5.9
5.9
5.5
5.0
4.8
4.8
4.1
4.0
2.0
-7.9
14.9
2.0
-3.5
-4.9
-15.0
11.7
3.9
7.8
-2.2
0.7
-24-23-22-21-20-19-18-17-16-15-14-13-12-11-10-9-8-7-6-5-4-3-2-101234567891011121314151617181920
FTSE 250
Russell 1000
Eurozone
Dev APac ex Japan
All-World
AW ex Eurozone
Russell 2000
Dev Europe ex UK
AW Ex US
FTSE 100
Emerging
Japan
Equities 1M & YTD - EUR
6.1
5.4
4.9
4.9
4.7
4.7
4.3
3.9
3.8
3.7
3.0
2.9
3.5
-6.2
17.0
3.9
-1.7
-3.1
-13.5
13.7
9.4
5.8
-0.4
2.5
-24-23-22-21-20-19-18-17-16-15-14-13-12-11-10-9-8-7-6-5-4-3-2-1012345678910111213141516171819202122232425
FTSE 250
Russell 1000
Eurozone
Dev APac ex Japan
All-World
AW ex Eurozone
Russell 2000
Dev Europe ex UK
FTSE 100
AW Ex US
Emerging
Japan
Equities 1M & YTD - GBP
6.4
6.1
6.1
5.7
5.6
5.3
5.1
4.9
4.7
4.4
3.8
3.2
1.0
3.5
14.9
3.4
2.5
-6.8
1.3
11.2
7.2
6.9
9.4
4.9
-14-13-12-11-10-9-8-7-6-5-4-3-2-101234567891011121314151617
Russell 1000
FTSE 250
Eurozone
All-World
AW ex Eurozone
Russell 2000
Japan
Dev Europe ex UK
Dev APac ex Japan
AW Ex US
FTSE 100
Emerging
Equities 1M & YTD - LOCAL
1M YTD

FTSE Russell |
In May, bond performance was mixed as risk-free yields rose in major developed markets while they declined in several key
emerging markets.
In local currency terms, within the 7-10 year government bond sector, French and EM bonds posted gains and
outperformed peers. They were followed by Chinese, German, UK, US and Japanese bonds, all of which posted losses.
Among corporate bond sectors, high yield (HY) generally outperformed investment grade (IG) consistent with the rally in
risk assets. USD HY led, followed by EM $, Euro and GBP HY. Among IG sectors, Euro IG outperformed EM $, US and UK
IG. Long-dated (10+ yr) European inflation-linked bonds (ILBs) outperformed their shorter-dated (1-5 yr) counterparts.
However, in the UK and the US, shorter-dated ILBs led performance.
For both Euro- and GBP-based investors, Japanese bond returns were eroded by the yen’s relative weakness.
Asset Class Returns – 1M & YTD (LCY, EUR, GBP, TR %)
Monthly Performance Report Europe June 2025 4
Source: FTSE Russell and LSEG. Data as of May 31, 2025. Past performance is no guarantee of future results.
1.2
0.9
0.2
-0.1
-0.2
-1.1
-2.4
-4.6
-7.0
2.1
0.0
0.2
-5.5
-2.9
-10 -5 0 5
EM 7-10 yr
China 7-10 yr
France 7-10 yr
UK 7-10 yr
German 7-10 yr
US 7-10 yr
Japan 7-10 yr
Government Bonds 1M & YTD - EUR
0.9
0.9
0.1
-0.3
-1.6
-2.3
-0.1
-1.0
1.4
-5.3
-8.2
-8.0
-14 -9 -4 1
UK 1-5 yr
EUR 10+ yr
EUR 1-5 yr
US 1-5 yr
US 10+ yr
UK 10+ yr
Inflation-Linked Bonds 1M & YTD -
EUR
2.1
1.9
1.6
1.4
1.0
0.6
0.2
0.1
0.2
-6.3
-6.0
2.1
-0.2
1.6
-6.1
-6.7
-12-11-10-9-8-7-6-5-4-3-2-10 1 2 3 4
GBP HY
USD HY
EM $ Corp HY
EUR HY
UKBIG Corp
EuroBIG Corp
EM $ Corp IG
USBIG Corp
Corporate Bonds 1M & YTD - EUR
0.2
0.2
-0.2
-0.2
-1.2
-1.2
-1.4
2.1
2.3
0.5
0.2
1.8
3.6
-2.3
-5 -3 -1 135
France 7-10 yr
EM 7-10 yr
China 7-10 yr
German 7-10 yr
UK 7-10 yr
US 7-10 yr
Japan 7-10 yr
Government Bonds 1M & YTD -
LOCAL
1.8
1.5
1.4
1.0
0.6
0.1
0.0
-0.1
2.8
3.0
2.1
2.1
1.6
3.0
2.3
1.6
-2 -1 0 1 2 3 4
USD HY
EM $ Corp HY
EUR HY
GBP HY
EuroBIG Corp
EM $ Corp IG
USBIG Corp
UKBIG Corp
Corporate Bonds 1M & YTD -
LOCAL
0.9
0.1
-0.2
-0.4
-1.7
-3.3
-1.0
1.4
1.7
3.9
0.7
-6.3
-12 -7 -2 3 8
EUR 10+ yr
EUR 1-5 yr
UK 1-5 yr
US 1-5 yr
US 10+ yr
UK 10+ yr
Inflation-Linked Bonds 1M & YTD -
LOCAL
-0.2
-0.2
-1.0
-1.4
-2.7
-3.3
1.7
0.8
3.3
-3.6
-6.5
-6.3
-12 -7 -2 3 8
UK 1-5 yr
EUR 10+ yr
EUR 1-5 yr
US 1-5 yr
US 10+ yr
UK 10+ yr
Inflation-Linked Bonds 1M & YTD -
GBP
1.0
0.8
0.5
0.3
-0.1
-0.5
-0.8
-1.0
2.1
-4.6
-4.3
4.0
1.6
3.5
-4.4
-5.0
-8-7 -6 -5-4 -3-2 -1 0 1 2 3 4 5
GBP HY
USD HY
EM $ Corp HY
EUR HY
UKBIG Corp
EuroBIG Corp
EM $ Corp IG
USBIG Corp
Corporate Bonds 1M & YTD - GBP
0.1
-0.2
-0.8
-1.2
-1.3
-2.2
-3.5
-2.9
-5.3
4.0
1.8
2.0
-3.8
-1.1
-8 -3 2 7
EM 7-10 yr
China 7-10 yr
France 7-10 yr
UK 7-10 yr
German 7-10 yr
US 7-10 yr
Japan 7-10 yr
Government Bonds 1M & YTD - GBP
1M YTD

FTSE Russell |
In May, global equities were broadly up (unlike in April when there was higher return dispersion.)
Most notably, Chinese and Hong Kong equities rallied even as trade negotiations between the US and China were
ongoing. After struggling YTD, Taiwan equities rebounded, and their EUR and GBP returns were considerably boosted
by the Taiwan dollar strengthening versus those currencies. Similarly, Korean equities’ EUR and GBP returns
benefitted from the won’s relative appreciation. European peripheral equities, such as those in Italy and Spain,
continued to outperform those in Europe’s core.
Global Equity Returns – 1M & YTD (LCY, EUR, GBP, TR %)
Monthly Performance Report Europe June 2025 5
Source: FTSE Russell and LSEG. Data as of May 31, 2025. Past performance is no guarantee of future results.
6.6
6.1
6.0
5.9
5.0
4.9
4.1
4.0
-7.5
-3.6
2.0
-3.5
11.7
6.6
-2.2
0.7
USA
Developed
Dev APac ex Japan
All-World
Dev Europe ex UK
UK
Emerging
Japan
FTSE Regions 1M & YTD - EUR
12.3
9.0
8.7
8.2
8.2
6.6
6.4
6.4
6.3
5.9
5.7
5.0
4.9
4.5
4.0
3.8
3.8
3.3
2.7
2.1
5.3
6.0
1.4
21.6
8.8
-7.5
27.7
20.6
14.6
-14.0
2.2
16.8
6.6
-1.0
0.7
8.1
1.7
8.5
7.0
9.4
Israel
Netherlands
Hong Kong
Italy
Korea
USA
Spain
Germany
Norway
Denmark
Canada
Finland
UK
Australia
Japan
France
Singapore
Belgium/Lux
Sweden
Switzerland
FTSE Developed 1M & YTD - EUR
12.9
5.9
5.0
3.7
3.0
1.7
1.0
-0.2
-2.4
-4.9
-8.0
12.9
16.7
1.1
2.9
-6.2
10.5
-11.5
-16.6
-14.4
Taiwan
South Africa
Mexico
UAE
China
India
Brazil
Malaysia
Thailand
Saudi Arabia
FTSE Emerging 1M & YTD - EUR
5.4
4.9
4.9
4.7
3.9
3.8
3.0
2.9
-5.8
-1.9
3.9
-1.7
13.7
8.5
-0.4
2.5
USA
Developed
Dev APac ex Japan
All-World
Dev Europe ex UK
UK
Emerging
Japan
FTSE Regions 1M & YTD - GBP
11.1
7.9
7.5
7.0
7.0
5.4
5.2
5.2
5.2
4.7
4.6
3.9
3.8
3.4
2.9
2.6
2.6
2.1
1.6
1.0
7.2
7.9
3.2
23.8
10.7
-5.8
30.0
22.8
16.7
-12.4
4.1
18.9
8.5
0.8
2.5
10.1
3.6
10.4
9.0
11.3
Israel
Netherlands
Hong Kong
Italy
Korea
USA
Spain
Germany
Norway
Denmark
Canada
Finland
UK
Australia
Japan
France
Singapore
Belgium/Lux
Sweden
Switzerland
FTSE Developed 1M & YTD - GBP
11.6
4.8
3.9
2.6
1.9
0.6
-0.1
-1.3
-3.5
-5.9
-6.3
14.9
18.9
3.0
4.7
-4.5
12.5
-9.9
-15.1
-12.9
Taiwan
South Africa
Mexico
UAE
China
India
Brazil
Malaysia
Thailand
Saudi Arabia
FTSE Emerging 1M & YTD - GBP
6.4
5.9
5.7
5.1
4.9
4.7
3.8
3.2
1.4
3.2
3.4
1.3
11.2
7.2
8.5
4.9
USA
Developed
All-World
Japan
Dev Europe ex UK
Dev APac ex Japan
UK
Emerging
FTSE Regions 1M & YTD - LOCAL
9.7
9.0
8.5
8.2
6.4
6.4
6.4
5.8
5.1
5.1
5.0
4.8
4.6
3.8
3.8
3.8
3.3
2.3
2.2
2.0
12.2
6.0
11.5
21.6
1.4
27.7
20.6
-13.9
1.3
7.1
16.8
11.8
13.0
8.1
8.5
4.4
8.5
5.4
2.0
8.7
Hong Kong
Netherlands
Israel
Italy
USA
Spain
Germany
Denmark
Japan
Canada
Finland
Korea
Norway
France
UK
Australia
Belgium/Lux
Singapore
Sweden
Switzerland
FTSE Developed 1M & YTD - LOCAL
5.6
4.0
3.9
3.5
2.9
2.6
2.1
-1.7
-4.2
-5.0
-7.8
13.8
19.5
10.9
2.8
18.4
12.4
-7.6
-12.0
-6.3
Taiwan
China
Mexico
UAE
India
South Africa
Brazil
Malaysia
Thailand
Saudi Arabia
FTSE Emerging 1M & YTD - LOCAL
1M YTD

FTSE Russell |
In May, industry contributions were largely positive with
cyclicals leading performance.
Tech contributed broadly, and particularly strongly in the
US, as US Big Tech rallied on strong earnings and outlook
(except Apple Inc. that has potentially higher exposure to
trade risks).
Financials, Discretionary and Industrials contributed
across all regions, notably US Discretionary and Asia
Monthly Performance Report Europe June 2025 6
Regional Industry-Weighted Contributions to Returns – 1M (LCY, TR %)
Tech is the largest in the US & Emerging; Financials in the
UK, Europe & Asia Pacific; and Industrials in Japan.
On average, Tech topped industry performance in May in
local currency terms, while Health Care lagged the most.
Source: FTSE Russell and LSEG. Data as of May 31, 2025. Past performance is no guarantee of future results.
Pacific Financials.
Given oil was only slightly down for the month, Energy
contributed modestly, and crucially did not detract from
index returns as it had over the previous month.
Health Care struggled broadly and especially in the US
where it was a major detractor, likely due to the risk of
disruption to drug pricing and research funding from US
policies.
US UK Dev Eur ex UK Japan Dev AP ex JP Emerging
1M Total Return (%)
6.4 3.8 4.9 5.1 4.7 3.2
US UK
Dev Eur
ex UK
Japan
Dev AP
ex JP
Emerging
Basic Materials 1.3 5.9 3.8 4.2 8.8 5.4
Cons. Disc. 15.1 7.2 10.6 22.7 8.7 12.4
Cons. Staples 4.3 16.3 7.1 5.8 3.3 5.0
Energy 3.1 9.6 3.3 0.7 2.6 5.3
Financials 11.2 23.4 22.7 14.9 33.5 24.2
Health Care 9.1 12.8 13.9 6.6 6.4 3.6
Industrials 12.2 13.6 20.1 26.4 11.0 7.8
Real Estate 2.2 1.3 1.1 3.4 7.1 2.1
Technology 36.7 4.4 9.8 10.3 6.5 26.1
Telecoms 2.1 1.3 3.4 3.8 8.9 4.8
Utilities 2.7 4.3 4.2 1.3 3.1 3.4
Regional Industry Exposures (%)
US UK
Dev Eur
ex UK
Japan
Dev AP
ex JP
Emerging
Basic Materials 2.5 7.1 3.3 5.9 0.2 2.0
Cons. Disc. 8.5 6.2 3.9 2.6 3.1 2.5
Cons. Staples 1.1 0.5 2.3 1.4 1.4 −1.0
Energy 1.2 2.3 7.8 2.7 7.5 3.3
Financials 4.6 5.2 6.3 8.6 7.1 3.6
Health Care −5.6 2.1 −0.2 −0.2 0.2 2.7
Industrials 7.7 8.4 7.7 7.5 6.6 5.0
Real Estate 1.0 2.1 3.9 1.7 4.5 −0.6
Technology 11.4 −1.1 8.7 8.6 10.6 4.6
Telecoms 2.0 4.1 3.1 3.3 1.2 0.9
Utilities 3.8 0.9 2.8 −2.2 2.0 −0.1
1M Regional Industry Returns (TR, LOCAL)
0.03
1.27
0.05
0.04
0.53
-0.57
0.92
0.02
3.99
0.05
0.11
0.40
0.43
0.08
0.22
1.20
0.28
1.09
0.03
-0.05
0.06
0.04
0.13
0.42
0.16
0.25
1.41
-0.03
1.49
0.04
0.82
0.11
0.12
0.25
0.60
0.09
0.02
1.23
-0.01
1.92
0.06
0.86
0.13
-0.03
0.02
0.27
0.05
0.19
2.34
0.02
0.71
0.32
0.65
0.11
0.06
0.11
0.32
-0.05
0.17
0.88
0.10
0.38
-0.01
1.15
0.05
0.00
-1.0 0.0 1.0 2.0 3.0 4.0 5.0
Basic Materials
Consumer Discretionary
Consumer Staples
Energy
Financials
Health Care
Industrials
Real Estate
Technology
Telecommunications
Utilities

FTSE Russell |
75
100
125
150
175
200
225
May-24 Aug-24 Nov-24 Feb-25 May-25
FTSE Eurozone Sector Returns Relative to FTSE
All-World ex Eurozone Sector Returns (Rebased,
TR, EUR)
Eurozone/AW ex Eurozone Aerospace and Defense
Eurozone/AW ex Eurozone Banks
Eurozone/AW ex Eurozone Electronic and Electrical Equipment
Eurozone/AW ex Eurozone Health Care Providers
Monthly Performance Report Europe June 2025 7
FTSE Eurozone vs FTSE AW ex Eurozone: Sector-Weighted Return Contributions – 1M
(EUR, TR %)
Eurozone is more tilted towards Financials, Industrials,
Utilities & Materials than peers, and much less so to Tech.
EZ slightly outperformed non
-EZ peers in May, leading in
banks and aerospace & defense, among others.
Source: FTSE Russell and LSEG. Data as of May 31, 2025. Past performance is no guarantee of future results.
Top 10 Contributors
Bottom 10 Contributors
Eurozone All-World ex Eurozone
6.07 5.88
1.59
0.81
0.71
0.44
0.31
0.27
0.22
0.16
0.16
0.15
Banks
Aerospace and Defense
Technology Hardware and Equipment
Software and Computer Services
Electronic and Electrical Equipment
Automobiles and Parts
Alternative Energy
Industrial Support Services
Non-life Insurance
Industrial Transportation
1.63
1.44
0.50
0.36
0.30
0.21
0.19
0.17
0.15
0.14
Software and Computer Services
Technology Hardware and
Equipment
Banks
Retailers
Automobiles and Parts
Aerospace and Defense
Industrial Support Services
Investment Banking and Brokerage
Services
General Industrials
Media
0.03
0.03
0.02
0.02
0.01
0.01
0.01
0.00
-0.05
-0.12
Personal Care Drug and Grocery
Stores
Industrial Materials
Telecommunications Equipment
Real Estate Investment and Services
Development
Household Goods and Home
Construction
Retailers
Industrial Metals and Mining
Consumer Services
Medical Equipment and Services
Pharmaceuticals and Biotechnology
0.01
0.01
0.01
0.00
0.00
0.00
0.00
-0.02
-0.15
-0.21
Waste and Disposal Services
Food Producers
Real Estate Investment and Services
Development
Industrial Materials
Gas Water and Multi-utilities
Mortgage Real Estate Investment
Trusts
Household Goods and Home
Construction
Beverages
Health Care Providers
Pharmaceuticals and Biotechnology
0
10
20
30
Eurozone vs. All-World ex Eurozone Industry
Weights (%)
Eurozone All-World ex Eurozone

FTSE Russell | Monthly Performance Report Europe June 2025 8
FTSE 100 vs FTSE 250: Sector-Weighted Return Contributions – 1M (GBP, TR %)
FTSE 250 is far more exposed to Financials & other
cyclicals, and less to Energy & defensives than FTSE 100.
FTSE 100 lagged FTSE 250 in May, underperforming in
sectors like chemicals and inv. banking, among others.
Source: FTSE Russell and LSEG. Data as of May 31, 2025. Past performance is no guarantee of future results.
Top 10 Contributors
Bottom 10 Contributors
FTSE 100 FTSE 250
3.83 6.14
0.99
0.75
0.35
0.24
0.24
0.22
0.18
0.14
0.12
0.08
Banks
Aerospace and Defense
Industrial Metals and Mining
Travel and Leisure
Pharmaceuticals and Biotechnology
Oil Gas and Coal
Life Insurance
Personal Care Drug and Grocery
Stores
Closed End Investments
General Industrials
1.17
0.76
0.46
0.37
0.32
0.31
0.31
0.29
0.27
0.27
Closed End Investments
Investment Banking and Brokerage
Services
Personal Goods
Industrial Support Services
Construction and Materials
Aerospace and Defense
Retailers
Real Estate Investment Trusts
Chemicals
Travel and Leisure
0.01
0.01
0.01
0.00
0.00
0.00
-0.01
-0.05
-0.06
-0.08
Household Goods and Home
Construction
Chemicals
Food Producers
Real Estate Investment and Services
Development
Gas Water and Multi-utilities
Leisure Goods
Tobacco
Software and Computer Services
Beverages
Finance and Credit Services
0.03
0.02
0.02
0.01
0.01
0.01
0.00
0.00
-0.01
-0.01
Industrial Metals and Mining
Household Goods and Home
Construction
Technology Hardware and Equipment
Gas Water and Multi-utilities
Leisure Goods
Telecommunications Equipment
Waste and Disposal Services
Health Care Providers
Precious Metals and Mining
Media
0
10
20
30
40
50 FTSE 100 vs. FTSE 250 Industry Weights (%)
FTSE 100 FTSE 250
60
80
100
120
140
May-24 Aug-24 Nov-24 Feb-25 May-25
FTSE 100 Sector Returns Relative to FTSE 250
Sector Returns (Rebased, TR, GBP)
FTSE 100/FTSE 250 Chemicals
FTSE 100/FTSE 250 Industrial Support Services
FTSE 100/FTSE 250 Investment Banking and Brokerage Services
FTSE 100/FTSE 250 Retailers

FTSE Russell | Monthly Performance Report Europe June 2025 9
Alternative Indices Returns – 1M & YTD (USD, TR %)
Source: FTSE Russell and LSEG. Data as of May 31, 2025. Past performance is no guarantee of future results.
O
ver 12M, EO indices in the US and Asia Pacific
outperformed, while the EO Japan index lagged notably.
O
ver 12M, most REITs indices lagged their benchmarks,
except in Japan and Developed Asia Pacific.
In May, FTSE EPRA Nareit indices broadly underperformed their benchmarks, as long yields rose in major developed
markets and a few emerging markets like China. EPRA Nareit USA lagged its benchmark the most.
Developed and Global Core Infrastructure indices lagged their benchmarks in May (as they did in April) after having
outperformed over Q1. Emerging Core Infrastructure (with about a quarter of its weight in India) was the best
performing region even as it lagged its benchmark in May.
FTSE4Good indices mostly lagged over the month as they have YTD, except FTSE4Good Japan which outperformed
the Japanese benchmark and FTSE4Good US which was in line with its benchmark. Environmental Opportunities
indices posted mixed results.
70
80
90
100
110
120
May-24 Aug-24 Nov-24 Feb-25 May-25
Regional FTSE EPRA Nareit Index Relative
Performance vs Home Market (Rebased, TR,
USD)
EPRA Nareit Dev Asia Pac ex Japan/Dev Asia Pac ex Japan
EPRA Nareit Dev Europe ex UK/Dev Europe ex UK
EPRA Nareit Emerging/Emerging
EPRA Nareit Japan/Japan
EPRA Nareit UK/UK
EPRA Nareit USA/USA
80
90
100
110
120
May-24 Aug-24 Nov-24 Feb-25 May-25
Regional FTSE Environmental Opportunities Index
Relative Performance vs Home Market (Rebased,
TR, USD)
Env Opps Asia Pac ex Japan/Asia Pac ex Japan
Env Opps Europe/W Europe ex UK
Env Opps Japan/Japan
Env Opps UK/UK
Env Opps USA/USA
-0.7
-0.9
-1.3
-2.7
-3.1
-4.1
2.0
-1.9
-3.0
-1.2
8.3
-0.6
EPRA Nareit UK
EPRA Nareit Dev Europe ex UK
EPRA Nareit Dev APac ex Japan
EPRA Nareit Emerging
EPRA Nareit Japan
EPRA Nareit USA
FTSE EPRA Nareit Global Real Estate –1M &
YTD USD (Relative)
-1.2
-4.3
-4.6
2.3
2.3
2.4
Emerging Core Infra
Global Core Infra
Developed Core Infra
FTSE Core Infrastructure returns –1M & YTD
USD (Relative)
0.5
0.0
-0.3
-0.8
-1.0
-1.0
-2.7
-1.9
-0.6
-2.1
FTSE4Good Japan
FTSE4Good US
FTSE4Good Europe
FTSE4Good UK
FTSE4Good Dev Asia
FTSE4Good returns –1M & YTD USD (Relative)
6.1
5.6
4.1
1.5
0.7
0.5
-0.3
-1.7
-2.0
3.0
1.6
-6.3
0.9
0.1
-4.7
-3.6
1.7
3.4
EO US
EO Energy Efficiency
EO APac ex Japan
EO Renewable & Alt Energy
EO UK
EO Europe
EO Japan
EO Water Tech
EO Waste & Pollution Control Tech
FTSE Environmental Opportunities returns –
1M & YTD USD (Relative)
US
Dev AP ex
Japan
UK
Dev Europe ex
UK
Emerging Japan
1M 6.4 6.1 5.0 5.0 4.3 3.9
YTD 0.9 12.4 16.6 22.6 6.5 10.6
Benchmark (All Cap) USD Returns (%)

FTSE Russell |
95
100
105
May-24 Aug-24 Nov-24 Feb-25 May-25
Regional Value Factor Returns Relative to
Home Market (TR, Rebased)
Monthly Performance Report Europe June 2025 10
Equity Factor Relative Returns – 1M & YTD (LCY, TR %)
Over 12M, Value has lagged notably in the US, while it has
outperformed considerably in Europe and Emerging.
Over 12M, Momentum outperformed the most in Europe, the
UK & Asia Pacific. It lagged in Japan & Emerging in May.
Source: FTSE Russell and LSEG. Data as of December 31, 2024. Past performance is no guarantee of future results.
1M
YTD
US UK Eur ex UK Japan
APAC ex JP
EM
In May, Momentum outperformed broadly amid the global equity relief rally. However, Momentum stocks that have
been driving performance varied by region. In the US and Japan, Value and Size lagged, while they outperformed
elsewhere. This suggests that larger, more expensive stocks drove performance in the US (especially US Big Tech)
and Japan, while smaller, cheaper stocks led in the UK, Europe, Asia Pacific and Emerging. Low Vol lagged broadly
consistent with the fact that cyclical industries outpaced defensive ones.
-4
0
4
Value (Small) Size Momentum Quality Low Volatility Dividend Yield
-5
0
5
Value (Small) Size Momentum Quality Low Volatility Dividend Yield
95
100
105
110
May-24 Aug-24 Nov-24 Feb-25 May-25
Regional Momentum Factor Returns Relative
to Home Market (TR, Rebased)

FTSE Russell | Monthly Performance Report Europe June 2025 11
Foreign Exchange Returns – 1M & YTD TR %
Over 12M, the yen strengthened versus the GBP, despite
May’s weakness, while the euro, dollar & yuan were weaker.
Over 12M, the pound and yen strengthened versus the
euro, while the dollar and yuan were notably weaker.
Source: FTSE Russell and LSEG. Data as of May 31, 2025. Past performance is no guarantee of future results.
90
95
100
105
110
115
May-24 Aug-24 Nov-24 Feb-25 May-25
FX Moves vs EUR (Rebased)
GBP JPY CNY USD
90
95
100
105
110
115
May-24 Aug-24 Nov-24 Feb-25 May-25
FX Moves vs GBP (Rebased)
EUR JPY CNY USD
In May, long yields diverged. In several major developed
markets, long yields rose as inflation worries persisted and
fiscal concerns came to the forefront. In particular, the US
10-year yield rose by 24 bps with yield moves in the UK
and Japan not far behind. Among emerging markets,
Chinese 10-year yields were slightly up but long yields
declined notably in South Africa, India and Brazil.
Most global currencies gained versus the euro while they
weakened versus the British pound, including the euro and
the dollar. The South African rand and certain Asian
currencies such as the Korean won experienced rapid
appreciation versus the EUR and GBP. Conversely, the
yen, Brazilian real and Indian rupee weakened relative to
these currencies.
3.2
3.2
1.6
1.4
1.1
1.1
1.0
0.7
0.7
0.6
0.2
0.1
-1.0
-1.1
-1.1
-4.7
-2.7
1.4
-3.5
-1.8
-7.5
-2.3
-2.8
-5.2
-4.6
0.6
-8.8
-0.7
-1.7
-8.7
South African Rand
Korean Won
Norwegian Krone
Singapore Dollar
British Pound
Chinese Yuan
Mexican Peso
New Zealand Dollar
Australian Dollar
Canadian Dollar
Swiss Franc
U.S. Dollar
Japanese Yen
Brazilian Real
Indian Rupee
FX Moves vs EUR –1M & YTD
2.1
2.0
0.5
0.3
0.0
-0.1
-0.4
-0.4
-0.5
-0.9
-1.0
-1.1
-2.1
-2.2
-2.2
-3.0
-0.9
3.2
-1.8
-5.8
-0.5
-1.0
-3.5
-2.9
2.4
-7.1
1.8
1.2
0.1
-7.1
South African Rand
Korean Won
Norwegian Krone
Singapore Dollar
Chinese Yuan
Mexican Peso
New Zealand Dollar
Australian Dollar
Canadian Dollar
Swiss Franc
U.S. Dollar
Euro
Japanese Yen
Brazilian Real
Indian Rupee
FX Moves vs GBP –1M & YTD
1M YTD
1.11
-1.10
-0.54
0.02
-1.15
-0.16
0.08
0.42
0.15
-0.03
-0.45
0.00
-0.14
0.07
-0.11
0.24
0.21
0.19
0.07
0.10
-2 -1 0 1 2
South Africa
Mexico
India
China
Brazil
US
UK
Japan
Germany
Canada
Key Emerging Markets Key Developed Markets
10-year government yield change (%)

FTSE Russell |
Asset Class Risk/Return – 1-Year and 5-Year (EUR)
Monthly Performance Report Europe June 2025 12
Source: FTSE Russell and LSEG. Data as of May 31, 2025. Past performance is no guarantee of future results.
US Govt 7-10 yr US HY
USBIG Corp
EUR HY
EuroBIG Corp
Euro Govt 7-10 yr
Copper
Crude Oil
Gold
All-World
All-World ex USA
Dev Asia Pacific ex Japan
Dev Europe ex UK
Emerging
FTSE 100
FTSE 250
Japan
Russell 1000
Russell 2000
Eurozone
-30
-20
-10
0
10
20
30
40
0 5 10 15 20 25 30
Return (%)
Volatility (%)
1-Year Risk vs Return (EUR, annualized)
Over one year, gold remained the best-performing asset class by far, while oil and copper were in negative return
territory. EUR HY was second to gold in terms of the return-to-risk ratio followed by EUR IG. Among equities, the
Eurozone had the best return-to-risk ratio, followed closely by the All-World ex USA and FTSE 100 indices. Among
fixed income sectors, EUR HY offered the best return for unit risk.
US Govt 7-10 yr
US HY
USBIG Corp
EUR HY
EuroBIG Corp
Euro Govt 7-10 yr
Copper
Crude Oil
Gold
All-World
All-World ex USA
Dev Asia Pacific ex Japan
Dev Europe ex UK
Emerging
FTSE 100
FTSE 250
Japan
Russell 1000
Russell 2000
Eurozone
-5
0
5
10
15
20
0 5 10 15 20 25 30 35
Return (%)
Volatility (%)
5-Year Risk vs Return (EUR, annualized)

FTSE Russell |
US Govt 7-10 yr US HY
USBIG Corp
UKBIG Corp
GBP HY
UK Govt 7-10 yr
Copper
Crude Oil
Gold
All-World
All-World ex USA
Dev Asia Pacific ex Japan
Dev Europe ex UK
Emerging
FTSE 100
FTSE 250
Japan Russell 1000
Russell 2000
-30
-20
-10
0
10
20
30
40
0 5 10 15 20 25
Return (%)
Volatility (%)
1-Year Risk vs Return (GBP, annualized)
Asset Class Risk/Return – 1-Year and 5-Year (GBP)
Monthly Performance Report Europe June 2025 13
Source: FTSE Russell and LSEG. Data as of May 31, 2025. Past performance is no guarantee of future results.
Over one year, gold remained the best-performing asset class by far, while oil and copper were in negative return
territory. However, GBP HY offered the best return for unit risk. Among equities, the All-World ex USA index had the
best return-to-risk ratio, followed closely by the FTSE 100 index.
US Govt 7-10 yr
US HY
USBIG Corp UKBIG Corp
GBP HY
UK Govt 7-10 yr
Copper Crude Oil
Gold
All-World
All-World ex USA
Dev Asia Pacific ex Japan
Dev Europe ex UK
Emerging
FTSE 100
FTSE 250
Japan
Russell 1000
Russell 2000
-6
-4
-2
0
2
4
6
8
10
12
14
16
0 5 10 15 20 25 30 35
Return (%)
Volatility (%)
5-Year Risk vs Return (GBP, annualized)

FTSE Russell |
Correlations
Monthly Performance Report Europe June 2025 14
Source: FTSE Russell and LSEG. Data as of May 31, 2025. Past performance is no guarantee of future results.
Three-Year Correlation Matrix (LOCAL)
0.0
0.1
0.2
0.3
0.4
0.5
0.6
0.7
0.8
0.9
1.0
1996 1998 2000 2002 2004 2006 2008 2010 2012 2014 2016 2018 2020 2022 2024
Regional Equity Market Correlations to the FTSE Developed Europe ex UK Index (LOCAL,
Monthly Returns, Rolling 24M)
USA UK Japan Developed Asia Pacific ex Japan Emerging
*Developed Europe ex UK uses data from Europe ex UK before
Rolling 2-year correlations of regional equity indices relative to the Developed Europe ex UK index indicate lower
correlations recently given the divergence in global equity performance YTD. Rolling correlations did tick up in April and
May with the global sell-off and rebound.
Russell
1000
Russell
2000
FTSE
100
FTSE
250
Eurozone Japan
Dev
APac ex
Japan
Emerging
US Govt
7-10 yr
USBIG
Corp
US HY US ILSI
UK Govt
7-10 yr
UKBIG
Corp
GBP HY UK ILSI
Euro
Govt 7-10
yr
EuroBIG
Corp
EUR HY Euro ILSI Copper Gold Crude Oil
Russell 1000
- 0.87 0.62 0.74 0.83 0.63 0.83 0.53 0.59 0.71 0.88 0.73 0.67 0.76 0.72 0.69 0.73 0.76 0.77 0.80 0.10 0.10 0.13
Russell 2000
0.87 - 0.64 0.78 0.70 0.46 0.77 0.41 0.49 0.61 0.78 0.60 0.60 0.67 0.60 0.61 0.62 0.64 0.64 0.70 0.01 0.00 0.11
FTSE 100
0.62 0.64 - 0.83 0.79 0.32 0.77 0.51 0.43 0.57 0.67 0.56 0.54 0.66 0.66 0.51 0.41 0.59 0.67 0.55 0.34 0.18 0.24
FTSE 250
0.74 0.78 0.83 - 0.79 0.42 0.83 0.52 0.58 0.70 0.81 0.68 0.68 0.80 0.76 0.59 0.64 0.78 0.79 0.74 0.22 0.18 0.10
Eurozone
0.83 0.70 0.79 0.79 -0.56 0.82 0.54 0.56 0.69 0.83 0.71 0.62 0.75 0.75 0.59 0.61 0.72 0.80 0.74 0.35 0.23 0.14
Japan
0.63 0.46 0.32 0.42 0.56 -0.48 0.33 0.11 0.25 0.45 0.29 0.25 0.35 0.50 0.22 0.28 0.31 0.45 0.42 -0.01 -0.11 0.30
Dev APac ex Japan
0.83 0.77 0.77 0.83 0.82 0.48 -0.79 0.65 0.79 0.82 0.73 0.67 0.78 0.76 0.71 0.64 0.73 0.78 0.72 0.35 0.35 0.03
Emerging
0.53 0.41 0.51 0.52 0.54 0.33 0.79 -0.53 0.67 0.50 0.53 0.43 0.52 0.56 0.57 0.38 0.46 0.51 0.41 0.55 0.45 -0.04
US Govt 7-10 yr
0.59 0.49 0.43 0.58 0.56 0.11 0.65 0.53 - 0.95 0.66 0.88 0.78 0.75 0.52 0.81 0.83 0.77 0.54 0.69 0.16 0.48 -0.22
USBIG Corp
0.71 0.61 0.57 0.70 0.69 0.25 0.79 0.67 0.95 - 0.79 0.89 0.76 0.80 0.68 0.83 0.80 0.82 0.70 0.72 0.29 0.45 -0.16
US HY
0.88 0.78 0.67 0.81 0.83 0.45 0.82 0.50 0.66 0.79 - 0.83 0.71 0.82 0.82 0.72 0.74 0.86 0.91 0.80 0.26 0.20 0.14
US ILSI
0.73 0.60 0.56 0.68 0.71 0.29 0.73 0.53 0.88 0.89 0.83 - 0.86 0.86 0.74 0.79 0.81 0.84 0.73 0.83 0.23 0.43 0.00
UK Govt 7-10 yr
0.67 0.60 0.54 0.68 0.62 0.25 0.67 0.43 0.78 0.76 0.71 0.86 - 0.96 0.68 0.76 0.83 0.80 0.60 0.82 0.09 0.36 0.15
UKBIG Corp
0.76 0.67 0.66 0.80 0.75 0.35 0.78 0.52 0.75 0.80 0.82 0.86 0.96 - 0.82 0.75 0.81 0.87 0.75 0.84 0.19 0.37 0.21
GBP HY
0.72 0.60 0.66 0.76 0.75 0.50 0.76 0.56 0.52 0.68 0.82 0.74 0.68 0.82 - 0.53 0.58 0.76 0.92 0.72 0.31 0.18 0.23
UK ILSI
0.69 0.61 0.51 0.59 0.59 0.22 0.71 0.57 0.81 0.83 0.72 0.79 0.76 0.75 0.53 - 0.80 0.79 0.60 0.71 0.18 0.46 -0.08
Euro Govt 7-10 yr
0.73 0.62 0.41 0.64 0.61 0.28 0.64 0.38 0.83 0.80 0.74 0.81 0.83 0.81 0.58 0.80 - 0.91 0.65 0.91 0.03 0.35 -0.14
EuroBIG Corp
0.76 0.64 0.59 0.78 0.72 0.31 0.73 0.46 0.77 0.82 0.86 0.84 0.80 0.87 0.76 0.79 0.91 - 0.85 0.90 0.13 0.34 0.02
EUR HY
0.77 0.64 0.67 0.79 0.80 0.45 0.78 0.51 0.54 0.70 0.91 0.73 0.60 0.75 0.92 0.60 0.65 0.85 - 0.76 0.30 0.17 0.09
Euro ILSI
0.80 0.70 0.55 0.74 0.74 0.42 0.72 0.41 0.69 0.72 0.80 0.83 0.82 0.84 0.72 0.71 0.91 0.90 0.76 - 0.07 0.28 -0.04
Copper
0.10 0.01 0.34 0.22 0.35 -0.01 0.35 0.55 0.16 0.29 0.26 0.23 0.09 0.19 0.31 0.18 0.03 0.13 0.30 0.07 - 0.47 0.07
Gold
0.10 0.00 0.18 0.18 0.23 -0.11 0.35 0.45 0.48 0.45 0.20 0.43 0.36 0.37 0.18 0.46 0.35 0.34 0.17 0.28 0.47 - -0.17
Crude Oil
0.13 0.11 0.24 0.10 0.14 0.30 0.03 -0.04 -0.22 -0.16 0.14 0.00 0.15 0.21 0.23 -0.08 -0.14 0.02 0.09 -0.04 0.07 -0.17 -

FTSE Russell | Monthly Performance Report Europe June 2025 15
Appendix – Total Returns (%)
Source: FTSE Russell and LSEG. Data as of May 31, 2025. Past performance is no guarantee of future results.
Regional Equity - Top 20 by % weight (TR)
Wgt (%) Mkt Cap
(USD bn) LOCAL USD GBP EUR LOCAL USD GBP EUR LOCAL USD GBP EUR
All-World 100.0 82,121 5.7 5.8 4.7 5.9 3.4 5.8 -1.7 -3.5 12.7 14.3 7.9 9.3
Developed 90.1 73,965 5.9 6.0 4.9 6.1 3.2 5.7 -1.9 -3.6 12.5 14.2 7.9 9.2
USA 62.6 51,367 6.4 6.4 5.4 6.6 1.4 1.4 -5.8 -7.5 14.4 14.4 8.0 9.4
Developed Europe
ex UK
11.7 9,596 4.9 4.9 3.9 5.0 11.2 22.5 13.7 11.7 7.6 13.9 7.6 8.9
Emerging 9.9 8,156 3.2 4.0 3.0 4.1 4.9 7.2 -0.4 -2.2 14.5 15.0 8.5 9.9
Japan 5.9 4,872 5.1 3.9 2.9 4.0 1.3 10.4 2.5 0.7 2.9 12.0 5.8 7.1
Developed Asia
Pacific ex Japan
3.7 3,003 4.7 5.9 4.9 6.0 7.2 11.8 3.9 2.0 9.1 8.1 2.0 3.3
UK 3.5 2,902 3.8 4.8 3.8 4.9 8.5 16.9 8.5 6.6 10.4 16.9 10.4 11.8
Developed Equity - Top 20 by % weight (TR)
Wgt (%) Mkt Cap
(USD bn) LOCAL USD GBP EUR LOCAL USD GBP EUR LOCAL USD GBP EUR
Developed 100.0 73,965 5.9 6.0 4.9 6.1 3.2 5.7 -1.9 -3.6 12.5 14.2 7.9 9.2
USA 69.4 51,367 6.4 6.4 5.4 6.6 1.4 1.4 -5.8 -7.5 14.4 14.4 8.0 9.4
Japan 6.6 4,872 5.1 3.9 2.9 4.0 1.3 10.4 2.5 0.7 2.9 12.0 5.8 7.1
UK 3.9 2,902 3.8 4.8 3.8 4.9 8.5 16.9 8.5 6.6 10.4 16.9 10.4 11.8
Canada 2.8 2,061 5.1 5.6 4.6 5.7 7.1 12.1 4.1 2.2 22.6 21.6 14.8 16.2
France 2.7 1,998 3.8 3.6 2.6 3.8 8.1 18.5 10.1 8.1 1.6 6.2 0.3 1.6
Germany 2.6 1,927 6.4 6.2 5.2 6.4 20.6 32.2 22.8 20.6 30.1 36.0 28.4 30.1
Switzerland 2.4 1,803 2.0 2.0 1.0 2.1 8.7 19.9 11.3 9.4 5.4 15.8 9.3 10.7
Australia 1.9 1,418 3.8 4.4 3.4 4.5 4.4 8.5 0.8 -1.0 12.6 8.9 2.8 4.2
Korea 1.1 846 4.8 8.0 7.0 8.2 11.8 19.2 10.7 8.8 -1.1 -0.7 -6.3 -5.1
Netherlands 1.1 819 9.0 8.9 7.9 9.0 6.0 16.2 7.9 6.0 -4.5 -0.2 -5.7 -4.5
Italy 0.9 649 8.2 8.0 7.0 8.2 21.6 33.3 23.8 21.6 24.8 30.5 23.2 24.8
Spain 0.8 623 6.4 6.2 5.2 6.4 27.7 40.0 30.0 27.7 31.7 37.7 30.0 31.7
Sweden 0.8 612 2.2 2.6 1.6 2.7 2.0 17.4 9.0 7.0 -1.3 8.1 2.1 3.4
Denmark 0.6 426 5.8 5.7 4.7 5.9 -13.9 -5.7 -12.4 -14.0 -34.4 -31.4 -35.2 -34.4
Hong Kong 0.6 413 9.7 8.5 7.5 8.7 12.2 11.1 3.2 1.4 15.0 14.8 8.4 9.8
Singapore 0.4 276 2.3 3.6 2.6 3.8 5.4 11.5 3.6 1.7 22.3 28.2 21.0 22.6
Belgium/Lux 0.3 200 3.3 3.1 2.1 3.3 8.5 18.9 10.4 8.5 18.3 23.7 16.8 18.3
Finland 0.3 197 5.0 4.9 3.9 5.0 16.8 28.0 18.9 16.8 10.4 15.5 9.0 10.4
Israel 0.2 162 8.5 12.2 11.1 12.3 11.5 15.4 7.2 5.3 37.1 45.0 36.9 38.6
Norway 0.2 120 4.6 6.2 5.2 6.3 13.0 25.7 16.7 14.6 16.5 19.7 13.0 14.5
Emerging Equity - Top 10 by % weight (TR)
Wgt (%) Mkt Cap
(USD bn) LOCAL USD GBP EUR LOCAL USD GBP EUR LOCAL USD GBP EUR
Emerging 100.0 8,156 3.2 4.0 3.0 4.1 4.9 7.2 -0.4 -2.2 14.5 15.0 8.5 9.9
China 32.4 2,644 4.0 2.8 1.9 3.0 13.8 12.8 4.7 2.9 26.9 26.6 19.5 21.1
India 21.7 1,773 2.9 1.6 0.6 1.7 2.8 2.8 -4.5 -6.2 8.4 5.7 -0.2 1.1
Taiwan 19.2 1,566 5.6 12.7 11.6 12.9 -7.8 0.9 -6.3 -8.0 7.8 16.5 10.0 11.4
Brazil 4.5 364 2.1 0.8 -0.1 1.0 12.4 21.1 12.5 10.5 12.5 3.1 -2.6 -1.4
Saudi Arabia 4.0 324 -5.0 -5.0 -5.9 -4.9 -6.3 -6.2 -12.9 -14.4 -0.8 -0.9 -6.4 -5.2
South Africa 3.6 291 2.6 5.8 4.8 5.9 18.4 23.8 14.9 12.9 34.0 39.7 31.9 33.6
Mexico 2.4 194 3.9 4.8 3.9 5.0 19.5 28.0 18.9 16.7 9.6 -3.7 -9.0 -7.9
UAE 1.9 153 3.5 3.5 2.6 3.7 10.9 10.9 3.0 1.1 39.2 39.2 31.4 33.1
Malaysia 1.7 141 -1.7 -0.3 -1.3 -0.2 -7.6 -3.0 -9.9 -11.5 -1.2 9.3 3.2 4.5
Thailand 1.6 132 -4.2 -2.6 -3.5 -2.4 -12.0 -8.6 -15.1 -16.6 -6.9 4.3 -1.5 -0.3
12M
1M
YTD
12M
1M
YTD
12M
1M
YTD

FTSE Russell | Monthly Performance Report Europe June 2025 16
Appendix - Total Returns (%)
Source: FTSE Russell and LSEG. Data as of May 31, 2025. Past performance is no guarantee of future results.
Conventional Sovereign (TR)
Wgt (%) Mkt Cap
(USD bn) LOCAL USD GBP EUR LOCAL USD GBP EUR LOCAL USD GBP EUR
World Govt 7-10 yr 100.0 4,533 -0.5 -0.5 -1.4 -0.3 1.8 7.1 -0.6 -2.3 5.3 8.1 2.0 3.4
Euro Govt 7-10 yr 33.9 1,538 0.3 0.2 -0.8 0.3 1.5 11.3 3.4 1.5 5.7 10.5 4.3 5.7
US Govt 7-10 yr 28.5 1,292 -1.2 -1.2 -2.2 -1.1 3.6 3.6 -3.8 -5.5 5.9 5.9 0.0 1.3
UK Govt 7-10 yr 5.6 255 -1.2 -0.2 -1.2 -0.1 1.8 9.6 1.8 0.0 2.8 8.8 2.8 4.1
Inflation-linked Sovereign (1-5 years, TR)
Wgt (%) Mkt Cap
(USD bn) LOCAL USD GBP EUR LOCAL USD GBP EUR LOCAL USD GBP EUR
World ILSI 1-5 yr 100.0 1174.1 -0.2 0.0 -1.0 0.1 3.1 6.5 -1.1 -2.9 6.1 7.4 1.4 2.7
US ILSI 1-5 yr 59.7 701.2 -0.4 -0.4 -1.4 -0.3 3.9 3.9 -3.6 -5.3 7.0 7.0 1.0 2.3
EUR ILSI 1-5 yr 21.2 248.7 0.1 0.0 -1.0 0.1 1.4 11.2 3.3 1.4 4.1 8.9 2.8 4.1
UK ILSI 1-5 yr 9.2 107.5 -0.2 0.8 -0.2 0.9 1.7 9.5 1.7 -0.1 3.3 9.4 3.3 4.6
Inflation-linked Sovereign (10+ years, TR)
Wgt (%) Mkt Cap
(USD bn) LOCAL USD GBP EUR LOCAL USD GBP EUR LOCAL USD GBP EUR
World ILSI 10+ yr 100.0 989.1 -1.5 -0.9 -1.8 -0.8 -1.7 4.2 -3.2 -4.9 -4.8 -2.8 -8.3 -7.1
UK ILSI 10+ yr 40.1 397.0 -3.3 -2.4 -3.3 -2.3 -6.3 0.9 -6.3 -8.0 -12.8 -7.7 -12.8 -11.7
EUR ILSI 10+ yr 21.7 214.9 0.9 0.8 -0.2 0.9 -1.0 8.5 0.8 -1.0 -1.6 2.9 -2.9 -1.6
US ILSI 10+ yr 19.3 190.5 -1.7 -1.7 -2.7 -1.6 0.7 0.7 -6.5 -8.2 -0.6 -0.6 -6.2 -5.0
1M
YTD
12M
1M
YTD
12M
1M
YTD
12M
High-Yield Credit (TR)
Wgt (%) Mkt Cap
(USD bn) LOCAL USD GBP EUR LOCAL USD GBP EUR LOCAL USD GBP EUR
World HY 100.0 1,711 1.7 1.7 0.7 1.8 2.6 4.9 -2.6 -4.4 9.3 10.5 4.3 5.6
USD HY 75.5 1,292 1.8 1.8 0.8 1.9 2.8 2.8 -4.6 -6.3 9.6 9.6 3.5 4.8
EUR HY 21.6 370 1.4 1.3 0.3 1.4 2.1 12.0 4.0 2.1 8.2 13.1 6.8 8.2
GBP HY 2.8 49 1.0 2.0 1.0 2.1 2.1 9.9 2.1 0.2 8.6 15.0 8.6 10.0
Investment-grade Corporate Credit (TR)
Wgt (%) Mkt Cap
(USD bn) LOCAL USD GBP EUR LOCAL USD GBP EUR LOCAL USD GBP EUR
WorldBIG Corp 100.0 10,358 0.2 0.2 -0.8 0.3 2.1 5.4 -2.1 -3.8 5.9 7.7 1.7 3.0
USBIG Corp 63.2 6,543 0.0 0.0 -1.0 0.1 2.3 2.3 -5.0 -6.7 5.7 5.7 -0.2 1.1
EuroBIG Corp 31.8 3,292 0.6 0.4 -0.5 0.6 1.6 11.4 3.5 1.6 6.5 11.4 5.1 6.5
UKBIG Corp 4.4 456 -0.1 0.9 -0.1 1.0 1.6 9.4 1.6 -0.2 4.5 10.7 4.5 5.9
1M
YTD
12M
1M
YTD
12M

FTSE Russell | Monthly Performance Report Europe June 2025 17
Appendix – Glossary
Source: FTSE Russell and LSEG. Data as of May 31, 2025. Past performance is no guarantee of future results.
Returns are based on the following indices or index families:
FTSE Global Equity Index Series (GEIS) for equity markets (link)
Russell US Indexes (link)
FTSE All-Share Indices (link)
FTSE World Government Bond Index (WGBI) Series for government bond markets (link)
FTSE World Inflation-Linked Securities Index (WorldILSI) for inflation-linked bond markets (link)
FTSE World Broad Investment-Grade Bond Index (WorldBIG) for corporate investment grade bonds (link)
FTSE World High Yield Bond Index for corporate high yield bonds (link)
FTSE Emerging Markets US Dollar Broad Bond Index (EMUSDBBI) for the emerging markets corporate
bond market (link)
FTSE EPRA Nareit Global Real Estate Index Series for real estate markets (link)
FTSE Russell’s Sustainable Investment Indices for the FTSE4Good and Environmental Opportunities
indices (link)
•FTSE4Good Index Series (link)
•FTSE Environmental Markets Index Series for the Environmental Opportunities indices (link)
FTSE Infrastructure Indices for core infrastructure markets (link)
FTSE/CoreCommodity CRB Indices (link)

FTSE Russell |
ABOUT FTSE RUSSELL
FTSE Russell is a leading global provider of index and benchmark solutions, spanning diverse asset classes and investment objectives. As
a trusted investment partner we help investors make better-informed investment decisions, manage risk, and seize opportunities.
Market participants look to us for our expertise in developing and managing global index solutions across asset classes. Asset owners,
asset managers, ETF providers and investment banks choose FTSE Russell solutions to benchmark their investment performance and
create investment funds, ETFs, structured products, and index-based derivatives. Our clients use our solutions for asset allocation,
investment strategy analysis and risk management, and value us for our robust governance process and operational integrity.
For over 40 years we have been at the forefront of driving change for the investor, always innovating to shape the next generation of
benchmarks and investment solutions that open up new opportunities for the global investment community.
CONTACT US
To learn more, visit lseg.com/en/ftse-russell; email info@ftserussell.com; or call your regional Client Service team office:
EMEA +44 (0) 20 7866 1810 Asia-Pacific
North America +1 877 503 6437 Hong Kong +852 2164 3333
Tokyo +81 3 6441 1430
Sydney +61 (0) 2 7228 5659
© 2025 London Stock Exchange Group plc and its applicable group undertakings (“LSEG”). LSEG includes (1) FTSE International Limited (“FTSE”), (2) Frank Russell
Company (“Russell”), (3) FTSE Global Debt Capital Markets Inc. “FTSE Canada”, (4) FTSE Fixed Income LLC (“FTSE FI”), (5) FTSE (Beijing) Consulting Limited (“WOFE”).
All rights reserved.
FTSE Russell® is a trading name of FTSE, Russell, FTSE Canada, FTSE FI, WOFE, and other LSEG entities providing LSEG Benchmark and Index services. “FTSE®”,
“Russell®”, “FTSE Russell®”, “FTSE4Good®”, “ICB®”, “Refinitiv” , “Beyond Ratings®”, “WMR ” , “FR ” and all other trademarks and service marks used herein (whether
registered or unregistered) are trademarks and/or service marks owned or licensed by the applicable member of LSEG or their respective licensors.
FTSE International Limited is authorised and regulated by the Financial Conduct Authority as a benchmark administrator.
All information is provided for information purposes only. All information and data contained in this publication is obtained by LSEG, from sources believed by it to be
accurate and reliable. Because of the possibility of human and mechanical inaccuracy as well as other factors, however, such information and data is provided "as is"
without warranty of any kind. No member of LSEG nor their respective directors, officers, employees, partners or licensors make any claim, prediction, warranty or
representation whatsoever, expressly or impliedly, either as to the accuracy, timeliness, completeness, merchantability of any information or LSEG Products, or of results to
be obtained from the use of LSEG products, including but not limited to indices, rates, data and analytics, or the fitness or suitability of the LSEG products for any particular
purpose to which they might be put. The user of the information assumes the entire risk of any use it may make or permit to be made of the information.
No responsibility or liability can be accepted by any member of LSEG nor their respective directors, officers, employees, partners or licensors for (a) any loss or damage in
whole or in part caused by, resulting from, or relating to any inaccuracy (negligent or otherwise) or other circumstance involved in procuring, collecting, compiling,
interpreting, analysing, editing, transcribing, transmitting, communicating or delivering any such information or data or from use of this document or links to this document or
(b) any direct, indirect, special, consequential or incidental damages whatsoever, even if any member of LSEG is advised in advance of the possibility of such damages,
resulting from the use of, or inability to use, such information.
No member of LSEG nor their respective directors, officers, employees, partners or licensors provide investment advice and nothing in this document should be taken as
constituting financial or investment advice. No member of LSEG nor their respective directors, officers, employees, partners or licensors make any representation regarding
the advisability of investing in any asset or whether such investment creates any legal or compliance risks for the investor. A decision to invest in any such asset should not
be made in reliance on any information herein. Indices and rates cannot be invested in directly. Inclusion of an asset in an index or rate is not a recommendation to buy, sell
or hold that asset nor confirmation that any particular investor may lawfully buy, sell or hold the asset or an index or rate containing the asset. The general information
contained in this publication should not be acted upon without obtaining specific legal, tax, and investment advice from a licensed professional.
Past performance is no guarantee of future results. Charts and graphs are provided for illustrative purposes only. Index and/or rate returns shown may not represent the
results of the actual trading of investable assets. Certain returns shown may reflect back-tested performance. All performance presented prior to the index or rate inception
date is back-tested performance. Back-tested performance is not actual performance, but is hypothetical. The back-test calculations are based on the same methodology
that was in effect when the index or rate was officially launched. However, back-tested data may reflect the application of the index or rate methodology with the benefit of
hindsight, and the historic calculations of an index or rate may change from month to month based on revisions to the underlying economic data used in the calculation of
the index or rate.
This document may contain forward-looking assessments. These are based upon a number of assumptions concerning future conditions that ultimately may prove to be
inaccurate. Such forward-looking assessments are subject to risks and uncertainties and may be affected by various factors that may cause actual results to differ materially.
No member of LSEG nor their licensors assume any duty to and do not undertake to update forward-looking assessments.
No part of this information may be reproduced, stored in a retrieval system or transmitted in any form or by any means, electronic, mechanical, photocopying, recording or
otherwise, without prior written permission of the applicable member of LSEG. Use and distribution of LSEG data requires a licence from LSEG and/or its licensors.
18Monthly Performance Report Europe June 2025