Q1 FY2026 Earnings Presentation PDF Free Download
1 / 24/24
100%

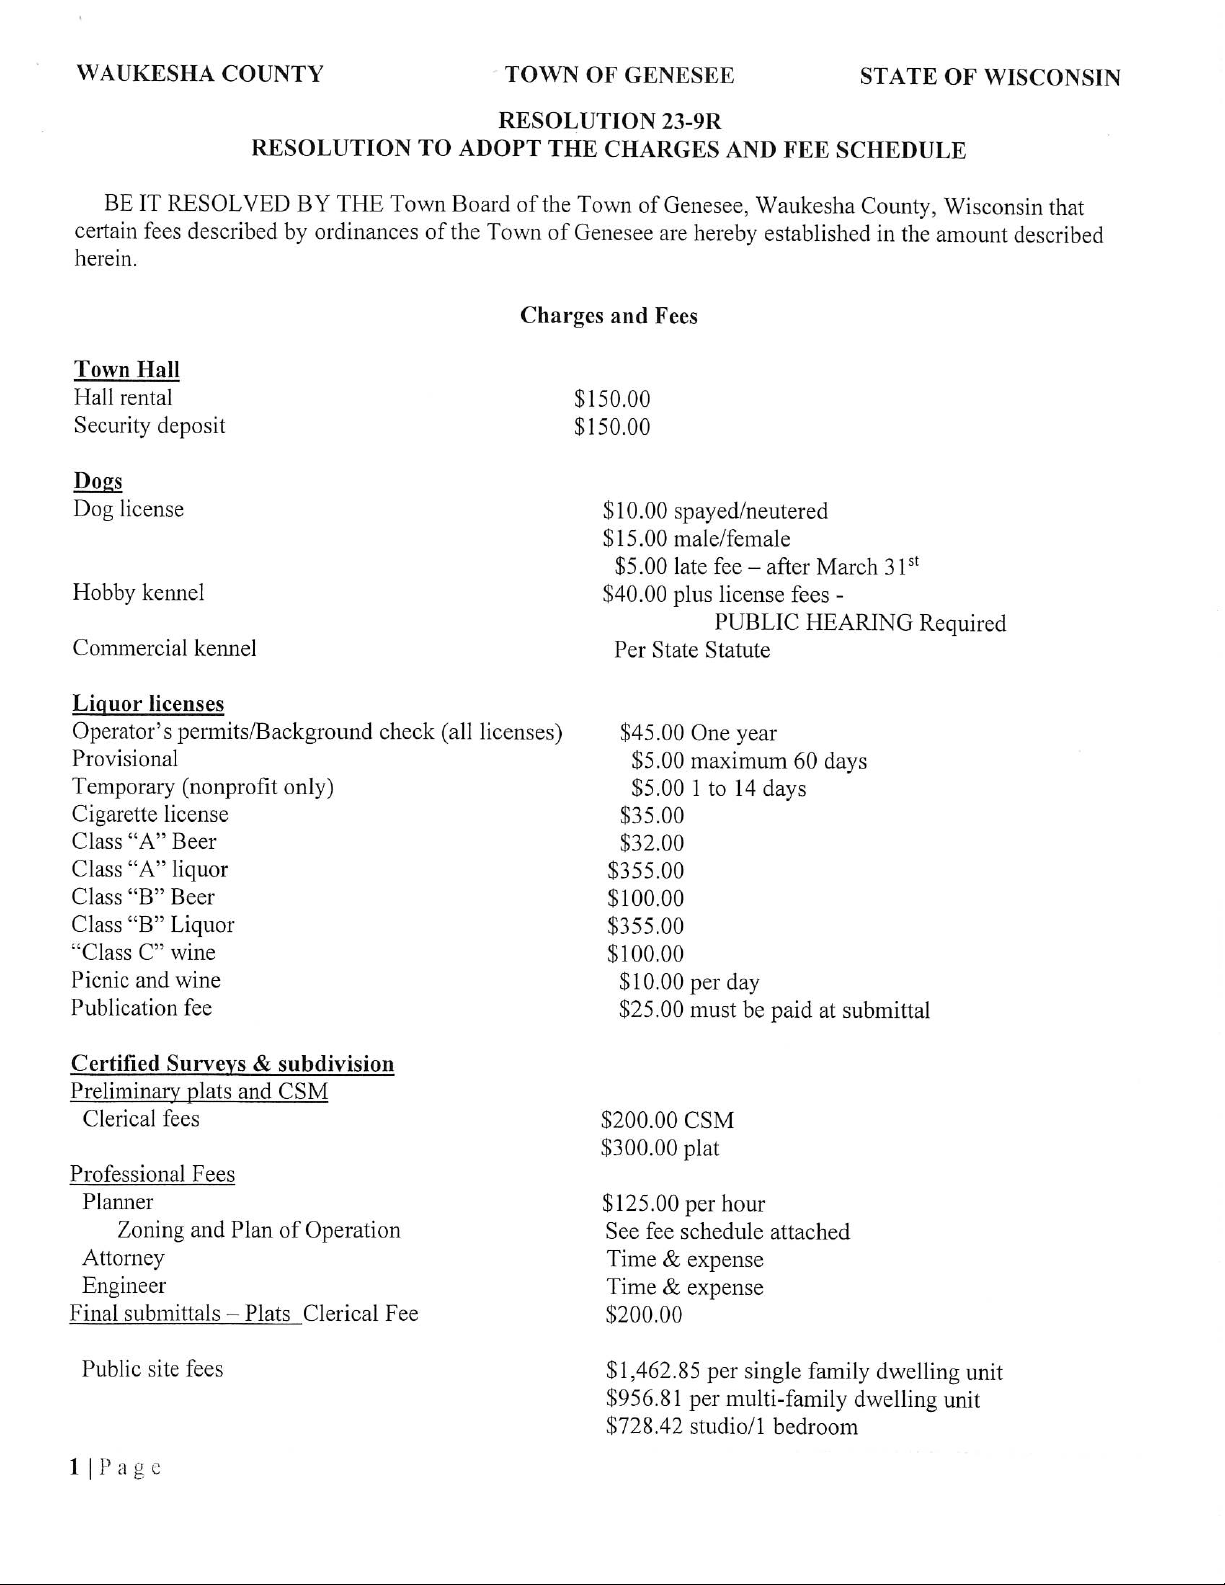
Consumer Intelligence Driven Global Technology Company
Affle 3i Limited
Q1 FY2026 Earnings Presentation
For the period ended June 30, 2025

Affle 3i Vision: Powering 10x Decadal Growth
•Maximising measurable business
outcomes driving real-world
impact
•Inclusive, democratized access
to media for brands of all sizes
•Leveraging Authentic,
Actionable and Augmented
Intelligence (Affle AI)
•AI agents to enhance
operational productivity
•Leading with platform &
product innovation powering
the connected ecosystem
•AI-driven hyper-contextual
creative generation at
exponential scale

Affle | Performance Highlights
3
EBITDA2
PAT
Revenue1
Note: 1) Revenue from contracts with customers; 2) EBITDA aligned to reported financials statements (without any adjustments)
All numbers are on a consolidated basis, unless otherwise stated
Amount in INR million
5,195 6,207
+19.5%
Q1 FY2026 vs. Q1 FY2025
Y-o-Y Comparison
+33.7%
1,045 1,397
+21.8%
866 1,055
Q1 FY2026 vs. Q4 FY2025
Q-o-Q Comparison
+4.3%
1,340 1,397
+2.4%
1,031 1,055
6,023 6,207
+3.1%
Q1 FY2025 Q1 FY2026
Q4 FY2025 Q1 FY2026

In INR million Q1 FY2026 Q1 FY2025 Y-o-Y Growth Q4 FY2025 Q-o-Q Growth
Revenue from Contracts with Customers 6,207 5,195 19.5% 6,023 3.1%
Inventory and Data Costs 3,780 3,200 18.1% 3,648 3.6%
Employee Benefits Expenses 609 586 3.8% 583 4.4%
Other Expenses 421 364 15.6% 452 (6.8%)
EBITDA 1,397 1,045 33.7% 1,340 4.3%
% EBITDA Margin 22.5% 20.1% 22.2%
Depreciation and Amortisation Expenses 259 193 34.2% 266 (2.7%)
Finance Costs 18 38 (51.7%) 24 (25.2%)
Other Income 172 251 (31.6%) 189 (9.2%)
Profit Before Tax 1,292 1,066 21.2% 1,239 4.3%
Total Tax 237 200 18.7% 208 14.0%
Profit After Tax (net of non-controlling interest, if any) 1,055 866 21.8% 1,031 2.4%
% PAT Margin 16.5% 15.9% 16.6%
% Effective Tax Rate (ETR) 18.3% 18.7% 16.8%
Consolidated Financial Summary
4
Note: 1) EBITDA aligned to reported financials statements (without any adjustments)
1

15,033
13,398
5,658
3,081
37,170
Cash &
Liquid Investments
Goodwill &
Intangibles Assets
Contract Assets &
Trade Receivables
Other
Assets
Total Assets
1,032
2,060
2,603 2,623
4,260
1,320
FY2021 FY2022 FY2023 FY2024 FY2025 Q1 FY2026
Cashflow Trend and Balance Sheet Position (Consolidated)
5
Operating Cash Flows*(INR mn) Asset & Liabilities (INR mn) –As of June 30,2025
Assets
Note: 1) FY2021 OCF was adjusted for Deferred Tax Liability on account of Goodwill of INR 14.18mn (one-time expense);
*Operating Cashflow includes impact of FCTRs (Foreign Currency Translation Reserves) as per IND AS
1
Equity & Liabilities
30,671
516
4,340
1,643
37,170
Total
Equity
Total
Borrowings
Contract Liabilities
& Trade Payables
Other
Liabilities
Total Equity
& Liabilities

3,475 3,546 3,761 3,558
4,066 4,313
4,987 5,062 5,195 5,429
6,017 6,023 6,207
Q1
FY23
Q2
FY23
Q3
FY23
Q4
FY23
Q1
FY24
Q2
FY24
Q3
FY24
Q4
FY24
Q1
FY25
Q2
FY25
Q3
FY25
Q4
FY25
Q1
FY26
Quarterly Performance Trend (Consolidated)
6
Revenue from Operations (INR mn) Market-wise Performance (Q1 FY2026)
India & Emerging
Markets
18.1%
Developed Markets
23.3%
Broad-based Growth Across Markets (Y-o-Y)
Y-o-Y
Y-o-Y
Revenue Split
72.3% 27.7%
India & Emerging Markets
Developed Markets

Quarterly Performance Trend (Consolidated)
7
EBITDA1(INR mn) & EBITDA Margin (%) Profit After Tax2(INR mn) & PAT Margin (%)
Note: 1) EBITDA aligned to reported financials statements (without any adjustments); 2) PAT for select previous quarters may be normalized to exclude any impact of non-cash gain on fair
valuation of financial instruments and any such exceptional item. Refer respective quarter presentations for a detailed working
687 723 804 716 781 872 967 980 1,045 1,133
1,314 1,340 1,397
19.8% 20.3% 21.4%
20.0% 19.2% 20.2% 19.4% 19.4% 20.1% 20.9% 21.8% 22.2% 22.5%
Q1
FY23
Q2
FY23
Q3
FY23
Q4
FY23
Q1
FY24
Q2
FY24
Q3
FY24
Q4
FY24
Q1
FY25
Q2
FY25
Q3
FY25
Q4
FY25
Q1
FY26
545 587 690 624 662 668 768
875 866 920 1,002 1,031 1,055
15.4% 16.0%
17.6% 16.7% 15.9% 15.1% 15.1%
16.4% 15.9% 16.1% 16.1% 16.6% 16.5%
Q1
FY23
Q2
FY23
Q3
FY23
Q4
FY23
Q1
FY24
Q2
FY24
Q3
FY24
Q4
FY24
Q1
FY25
Q2
FY25
Q3
FY25
Q4
FY25
Q1
FY26

CPCU Business | Q1 Performance Trend (y-o-y)
8
# No. of Conversions (mn) Average CPCU (INR) CPCU Revenue (INR mn)
Q1 FY2026
Q1 FY2025
68.7
90.8
107.0
vs.
Q1 FY2024
vs.
55.0
57.0
58.0
3,778
5,177
6,200
All numbers are on a consolidated basis, unless otherwise stated

68.7 72.0
83.8 88.4 90.8 94.8
103.3 104.0 107.0
Q1
FY24
Q2
FY24
Q3
FY24
Q4
FY24
Q1
FY25
Q2
FY25
Q3
FY25
Q4
FY25
Q1
FY26
CPCU Business | Conversions Trend
9
Y-o-Y growth in all quarters
Number of Conversions (mn)
All numbers are on a consolidated basis, unless otherwise stated

74% 74% 76% 76% 76%
8,009 10,675 14,074 17,169 4,742
FY2022 FY2023 FY2024 FY2025 Q1 FY2026
% Revenue Contribution Revenue (INR mn)
Verticalized Focus on High Growth Categories
10
Verticalized approach within fast-growing resilient industry segments across
E, F, G, H Categories driving 100% of our revenue Direct Customers –Revenue Contribution
E-commerce
Entertainment
Edtech
Category E
Apps for casual consumption of
entertainment content & activities
Apps for education & learning through
online channels
Online marketplace for shopping and
retail
Gaming
Government
Groceries
Category G
Facilitation of government services /
distribution of citizen services
Marketplace for ordering groceries and
having it delivered to doorstep
Apps for gamers with skills and gaming
related money & transactions
Fintech
FMCG
Foodtech
Category F
Brands promoting wide range of everyday
goods & items across categories
Apps for online food ordering and F&B
related supply chain services
Apps enabling online payments or
delivering financial products & services
Healthtech
Hospitality & Travel
Home & Other Utilities
Category H
Services related to hotels, travel, ride-
hailing, auto, and more
Brands promoting range of household and
utility related products & services
Spanning across a range of medical,
healthcare & wellness related services

Business Overview & Case Studies
- Affle Overview
- CPCU Business Model
- Our Culture
- Affle Consumer Platform Case Studies

12
1) For the 12 months period of July 1, 2024 to June 30, 2025; 2) Numbers aligned to reported financials statements (without any adjustments)
About Us
oGlobal technology company enabling AI-led
solutions in digital advertising, driving
performance across connected devices
oDelivers consumer recommendations and
conversions through relevant mobile
advertising for leading global brands
ROI-driven CPCU
Business Model
oAffle Consumer Platform Stack powers
integrated consumer journeys for marketers
to drive high ROI, outcome-led advertising
anchored on our CPCU model
oAI/ML deep learning algorithms powered by
our in-house Data Management Platform
3.7 Billion1
Connected Devices
Business Credentials
oTech IP addressing privacy & ad fraud
oR&D focus with a strong patent portfolio
oDPTM accredited
oISO 27001:2022 certified
Tech Capabilities
oAffle boasts a global reach across all key
regions including Asia, North America,
South America, Europe and Africa,
encompassing both developed and emerging
markets
Global Reach
Performance-driven CPCU Conversions
(In million)
Converted Users
72 105
195 257 313 393
FY2020 FY2021 FY2022 FY2023 FY2024 FY2025
Financials2
Revenue 4.4x INR 22,663 mn
5-yr Growth FY2025
Total 36 Unique Patents
14 Granted; 22 filed & pending
EBITDA 3.7x INR 4,832 mn
PAT 3.7x INR 3,819 mn
72.8%
India & Emerging Markets
Revenue –FY25
27.2%
Developed Markets
Revenue –FY25
Affle Overview

New/existing user
conversion (offline)
Existing user repeat
conversion (online)
New user conversion
(online)
Affle | Cost Per Converted User (CPCU) Business
13
Use Case –Targeted new user
acquisition optimized to in-app
transaction/registration/event
Use Case –Target interested user to
complete the transaction
Use Case –Driving footfalls and
transactions at physical retail stores
(O2O)
99.9% of Revenue from Contracts with Customers contributed by CPCU model in Q1 FY2026

Affle Consumer Platform with multiple DSPs | Simplifying and unifying the ecosystem
14
Advertisers
Demand-Side
Platforms Use-Cases
New User
Acquisition
Retargeting
Branding
Data
Management
Platform
AI / ML
Advanced
Algorithms
Multiple Patents
filed & granted
ROI
Consumers
Shoppers
ConvergeAI
Supply Cloud
●Cloud Optimization
●Supply Optimization
●Fraud Prevention
●Data Privacy
Compliance
Supply-Side
Platforms
OEMs &
Operators
Direct
Partnerships
Walled
Gardens
Verticalization
E F G H
Industry Categories
Consumer Platform Business
Average
CPCU Rate
No. of
Conversions
CPCU
Revenue
C P C U M o d e l

Affle Culture | Tech Innovations & Accreditation
15
Global Tech IP Portfolio
Total 36 unique Patents with 14
granted and rest filed & pending
across jurisdictions
Powering Futuristic
Tech Use Cases
Award-winning Ad Fraud
Detection Platform
Affle’s mFaas: Real-time solution
for addressing digital ad fraud,
with multiple patents granted
and/or filed
Global Accreditations
•Data Protection Trustmark
certified
•ISO 27001:2022 certified
20+ years of focused
R&D and innovation
Real-time Predictive
Algorithm
3.7 Bn1Connected
Devices Reached
Unified Consumer
Tech Proposition
Artificial Intelligence
Machine Learning
Deep Learning
Note: 1. For the 12 months period of July 1, 2024 to June 30, 2025

Affle Culture | Tech & Thought Leadership
16
Jampp recognized as a top growth partner
for both android & iOS, across 10
categories in Singular’s ROI Index 2025

Affle Consumer Platform Case Studies
1.
Swiggy Instamart
|
Driving revenue growth & engagements for
high value Grocery quick commerce in India
2.
Naranja X
|
Fueling fintech success with privacy
-first
strategies in LATAM
3.
Pick n Pay
|
Reaching the most relevant shoppers in South
Africa to drive growth

Swiggy Instamart | Driving revenue growth & engagements for high value
Grocery quick commerce in India
18
Note: (1) All case studies are based on First Party data consented and shared by the advertiser/agency together with Affle’s platform data; (2) Campaign Period: Apr ‘25 -Jun ‘25 ; (3) The ads and/or platform
modules/screenshots shown here are for illustrative purpose only
About the Advertiser
Swiggy Ltd. is a popular public listed on-demand convenience platform in India. It’s quick commerce grocery
delivery platform, Swiggy Instamart, was launched in August 2020, and serves 100 cities across India.
Objective
Swiggy’s Instamart, which recently launched its own app, wanted to maximize its presence and drive greater
transactions amongst high value iOS users, and also establish category leadership in a hyper competitive
environment.
Affle Consumer Platform Solutions
Affle’s Consumer Platform helped Instamart’s growth through:
●Event-led scaling: Prioritized high-intent moments for scale ups, such as during valentine’s day, IPL,
champions trophy, and festivals.
●Custom Product Pages (CPP) with OpticksAI: Leveraged Affle’s proprietary OpticksAI platform to
build multiple custom product pages tailored to real-time events and offers, together with contextual
storytelling to maximize conversions.
●Automation & Intelligence: Leveraged our Automation Engine for real-time bid/budget optimization,
live campaign pacing, along with SOV tracking to stay ahead of competition.
Results (Q1 FY26 vs Q4 FY25)
●~50% quarterly growth in Order Volume
●>10% growth in quarterly New User onboards
●Significant improvement in campaign efficiency by driving growth for higher converting new users Q4 FY25 Q1 FY26

We’re seeing great results with our current mobile marketing
strategy—higher installs and more users completing their
onboardings paired with healthy CPI rates. Affle’s Consumer
Platform and hands-on support fit right into our stack, helping us
turn our ambitious targets into wins.
Naranja X| Fueling fintech success with privacy-first strategies in LATAM
19
NOTE: (1) All case studies are based on First Party data consented ad shared by the advertiser/agency together with Affle’s platform data; (2) Campaign Period : Feb-Jun’25 ; (3) The ads and/or platform
modules/screenshots shown here are for illustrative purpose only
About the Advertiser
Part of Grupo Financiero Galicia (BYMA/Nasdaq: GGAL), Naranja X is one of Argentina’s largest digital
banks, powering financial services for over 9.5 million users. As a leading credit-card issuer in Argentina,
Naranja X drives financial innovation and accelerates financial inclusion across Latin America.
Objective
Naranja X focused on acquiring high-value users who would be most inclined to open new active bank
accounts and engage with Naranja X’s full suite of in-app financial services.
Affle Consumer Platform Solutions
Naranja X partnered with Affle’s Consumer Platform for User Acquisition, driving high-quality users that
converted into new account opens:
●Privacy-first performance: Implemented Apple’s SKAN 4.0 framework, securing full coverage of ID-
less iOS audiences.
●Comprehensive creative strategy: A/B-tested multiple ad formats to identify creatives that drove
deeper engagement with Naranja X’s financial services.
●Predictive spend allocation: Relied on ML models to dynamically allocate budget to the highest-
converting time windows, scaling sign-ups while optimizing towards target ROI
Results
●120% Growth in new users (June 2025 vs March 2025)
●127% Increase in account opens (April 2025 vs March 2025)
●90K+ new accounts opens in the past 5 months (February 2025 - June 2025)
Agustina García,
Paid Media Specialist,
Naranja X

Pick n Pay| Reaching the most relevant shoppers in South Africa to drive growth
20
NOTE: (1) All case studies are based on First Party data consented ad shared by the advertiser/agency together with Affle’s platform data.; (2) Campaign Period : April-June’25 (3) The ads and/or platform
modules/screenshots shown here are for illustrative purpose only
About the Advertiser
Pick n Pay is a leading multi-channel retailer operating since 1967 in South Africa and has over 1000 stores
in the region. It is a large public listed company with operations in 8 African countries.
Objective
The brand aimed to drive quality users while boosting first-time purchase on its grocery app, Pick n Pay
asap + SmartShopper.
Affle Consumer Platform Solutions
Affle’s consumer platform helped the app by:
●Comprehensive keyword strategy: Identified high-volume, relevant terms and leveraged our Gen AI
multi lingual keyword recommendation tool, focusing on terms indicating strong purchase intent.
●Vernacular focus on 100+ high-performing keywords: Through A/B testing, MMP integrations, and
strong vernacular strategy, campaigns focused on ~100 high-performing keywords for full-funnel
impact.
●Brand keyword leadership: Targeted branded terms to achieve ~95% impression share ensuring
maximum discoverability and protection from competitor activity.
Results
●55% increase in Return on Ad Spend (ROAS)
●#1 Paid visibility rank in Africa region
●73% average Conversion Rate delivered within the Quarter (April-June 2025) Kevin Metcalf
Head of Growth and Retail Media,
Pick n Pay
The integrated strategy allowed us to precisely target
users.The results speak for themselves. We've seen a real shift
in customer behavior, with a considerable amount of purchases
moving to the app, proving their deep understanding of mobile
marketing and our business objectives.

Shareholders Information

Affle | Shareholders Information
22
Shareholding Pattern (As on June 30, 2025) Brokerages Covering Affle
ICICI DirectSharekhan
Institutional
Research
Desk
HNI / Retail
Desk
55.0%
13.8%
20.7%
10.5% Promoters & Promoter
Group
Mutual Funds / Banks /
Insurance / AIFs / QIBs
FIIs / FCBs
Others
*Total Shares Outstanding –140,588,636
B&K Securities
Elara Capital
Avendus Spark
Capital DAM Capital
Amsec
Mirae Research Anand Rathi Goldman Sachs
Dolat CapitalAmbit Capital
Equirus Capital
Citi Research
* Includes 92,326 new equity shares allotted to ESOP trust of Affle 3i Limited out of which,
listing and trading approval of 29,234 equity shares was received after June 30, 2025.

Disclaimer
23
This presentation and the accompanying slides (“Presentation”) have been
prepared by Affle 3i Limited (“Affle” or the “Company”) solely for informational
purposes. It does not constitute an offer to sell, or a recommendation or
solicitation of an offer to subscribe for or purchase any securities, and nothing
contained herein shall form the basis of any contract or commitment. This
Presentation is not intended to be a prospectus under the Companies Act, 2013,
or an offer document under SEBI (Issue of Capital and Disclosure Requirements)
Regulations, 2009,as amended.
This Presentation should be viewed in conjunction with the Company’s financial
results as disclosed on the stock exchanges where it is listed and is not intended
to be updated for any material developments occurring after the date of the
Presentation.
The Presentation includes certain non-GAAP / non-Ind AS financial measures and
operational key performance indicators (“KPIs”) including but not limited to
EBITDA, CPCU data, vertical-wise split, geographic data, client data and number
of connected devices, which are unaudited and may be derived from internal
management reports. These metrics are intended to offer additional insight into
our operating performance, as monitored by our management and Board of
Directors, and are based on internal methodologies developed to support
strategic and operational decision-making. These methodologies may involve
judgments, estimates, and assumptions that are intended to reflect the evolving
nature of the business and its priorities. As such, these metrics may not be
prepared in accordance with standardized accounting principles and may not be
comparable to similarly titled measures presented by other companies.
Certain statements in this Presentation are forward-looking in nature and reflect
management’s current views, plans, or expectations. These are based on various
assumptions and involve known and unknown risks and uncertainties, which may
cause actual results to differ materially from those expressed or implied. Such
statements should not be regarded as guarantees of future performance, and
undue reliance should not be placed on them.
The information contained in this Presentation is not to be taken as any
recommendation made by the Company or any other person to enter into any
agreement with regard to any investment. You will be solely responsible for your
own assessment of the market and the market position of the Company, and you
will conduct your own analysis and be solely responsible for forming your own
view of the potential future performance of the business of the Company.
You acknowledge and agree that the Company and/or its affiliated companies
and/or their respective employees and/or agents have no responsibility or
liability (express or implied) whatsoever and howsoever arising (including,
without limitation for any claim, proceedings, action, suits, losses, expenses,
damages or costs) which may be brought against or suffered by any person as a
result of acting in reliance upon the whole or any part of the contents of this
Presentation and neither the Company, its affiliated companies nor their
respective employees or agents accepts any liability for any error, omission or
misstatement, negligent or otherwise, in this Presentation and any liability in
respect of the Presentation or any inaccuracy therein or omission therefrom
which might otherwise arise is hereby expressly disclaimed.
By attending this Presentation and/or accepting a copy of this document, you
acknowledge and agree to the above limitations and conditions, and specifically
represent and warrant that: (i) you will use this document solely for
informational purposes; (ii) you will not engage in any unauthorized
communication regarding the information contained herein with any employee,
director, customer, supplier, or regulatory authority without prior written
consent from the Company; and (iii) you are an eligible investor attending this
presentation.

Website
www.affle.com
Contact Us
Investor Relations Contact
investor.relations@affle.com