Swing Trading from A to Z PDF Free Download
1 / 257
/257
100%

2016-04-08
1

2016-04-08
2
BONUS
www.candlecharts.com

2016-04-08
3
www.candlecharts.com

2016-04-08
4
www.candlecharts.com

2016-04-08
5
www.candlecharts.com

2016-04-08
6
www.candlecharts.com

2016-04-08
7
www.candlecharts.com

2016-04-08
8
www.candlecharts.com

2016-04-08
9
From
A to Z
SWING TRADING
USING CANDLESTICKS
www.candlecharts.com

2016-04-08
10
This webinar on swing trading is about making money in ANY
market when the market is bullish, or bearish, or just going
sideways.
It's not just about theory.
Our goal is not to teach you how to invest for the long term
but rather the teach you highly effective short -term trading
strategies.
INTRODUCTION
2016-04-08
11
Without a doubt, the profitable use of technical analysis is
dependent upon the following:
Rules must be 100% objective
Because technical analysis gives you buy, hold, and/or sell
signals, these indicators of must be specific and not subject
to any interpretation.
All situations are either white or black.
Either you are a buyer or a seller.
If you are not a buyer or a seller, then you have no position.
THE ESSENCE OF TECHNICAL ANALYSIS
2016-04-08
12
The method must not only tell you when to buy or sell, but must
also give you a specific place to exit your trade if you are wrong.
No method or technical technique in any market or, for that matter, in
any form of investing, is 100% correct.
The method should give you an idea of how much money you can
make. Although this information is not vital, it is helpful.
The method should also tell you which chart or charts to buy or
sell.
There are thousands of instruments. Because you cannot investing all of
them, you must be selective.
Picking and choosing randomly or on the basis of gut feelings will not
work for you. You need a specific and consistent approach.
TECHNICAL ANALYSIS
2016-04-08
13
You need to be consistent in your application of the rules.
You need to do your homework by studying charts at regular
intervals as prescribed by the system or method you are using.
You need to practice solid risk management principles in order to
maximize profits and minimize losses
Indeed, there are more rules and procedures, but they are the
most important ones to follow.
You must always think of investing and trading as a business.
If you follow the rules and do your job with patience, persistence,
inconsistency, you will have consistent success.
If, however, you apply the methods taught here without consistency, you
will become a statistic as you join the ranks of losers.
TECHNICAL ANALYSIS
2016-04-08
14
Natural ebbs and flows of markets occur over time. Markets
often thrust, rest and thrust again. Many times these thrust can
be substantial but, unfortunately, are short-lived.
In fact, based on research conducted by hedge fund manager
Mark Boucher, 70% of a markets moves occur in 20% of the
time.
The rest of the time, markets consolidate by trading back and forth to
digest their gains.
The intermediate term trader is willing to sit through these periods for
weeks to months.
On the other hand, the nimble swing trader carefully picks his spots and
is able to capture the crux of a markets move without the excessive risks
of a longer term market exposure.
ENTER SWING TRADING
2016-04-08
15
What does "swing trading" really describe in our modern
markets?
For decades, this expression referred to a futures market
strategy that held positions from one to three days in order to
capitalize on cyclical swings in buying and selling behavior.
This classic concept now describes any execution method that
avoids the hyperactivity of day trading. But this generic
definition narrows the utility of this powerful art.
SWING TRADING
2016-04-08
16
In reality, swing trading characterizes a time frame
independent strategy that execute single, direct price
movement.
In this era of massive market liquidity, the swing trader may
find excellent opportunities on both five minutes and weekly
charts.
SWING TRADING

2016-04-08
17
HOLDING PERIOD AND CHART CORRELATION
Trade Type
Holding Period
3D Chart Combination
Scalpers
Seconds to minutes
1
-minute 5-minute 15-minute
Day Traders
Minutes to hours
1
-minute 5-minute 60-minute
Position traders
Hours to days
60
-minute daily weekly
Investors
Days to weeks
Daily weekly monthly
Institutions
Weeks to years
Weekly monthly yearly
2016-04-08
18
Swing trading allows you to accumulate small gains weekly,
ultimately making money through a disciplined, low -risk
trading approach.
SWING TRADING
2016-04-08
19
Because you are trading in the direction of the trend.
You wait for a pullback before entering the trade, and you enter only if the chart
shows a sign that it’s price will continue in the direction of the trend.
The main objective of a swing trader is to profit from swings in price
movement over the course of several candles (weeks/days/hours, etc).
While we might trade ever y day, we are not day traders.
As swing traders, we have the patience to wait until our profit goals
have been reached.
Fortunately, the wait is not too long.
A typical trade is only in play from a few candles (hours to days to a few weeks).
When a trade is closed, the funds go into the next trade.
WHY DOES SWING TRADING WORK?
2016-04-08
20
The rational behind swing trading
How to identify charts to swing trade
When to enter a trade
When to exit a trade
How to maximize profits and minimize risk
What tools are available to help you select charts and monitor
your progress
What resources to access to learn more about swing trading
WHAT WILL THIS COURSE WILL TEACH YOU?
2016-04-08
21
The best part of my swing trading method is that you do not
have to watch your positions during the day.
Simply enter an order to buy or sell short, give your discount
broker the buy order and two sell orders and go back to your
daily life.
SWING TRADING
2016-04-08
22
Prices rise and fall, with rising prices being stimulated by
greed and falling prices by the awakening of fear.
This emotional war between greed and fear generates a swinging
price movement that provides a perfect opportunity for swing trading.
Swing Traders capitalize on the emotions of others while they
carefully control their own emotions and systematically enter
and exit trades.
Swing Traders recognize the levels of support and resistance.
They understand the concepts of momentum and volatility and
can identify a trading range or channel.
SWING TRADERS
2016-04-08
23
Swing Traders seek to exploit direct price thrusts as they enter
positions at support and resistance.
By examining chart pattern characteristics they make money in
both trending and range bound markets.
Swing Trading is a classic strategy that involves holding charts
for a short period of time (relatively speaking).
Unlike day trading, Swing Trading is independent of time –
nevertheless, some Swing Traders will exit a slow -moving
position and move onto the next opportunity.
Swing Trading is very popular among short -term and medium-
term traders.
It offers many virtues compared to the hyperactivity of day trading.
SWING TRADERS
2016-04-08
24
Everyone is familiar with waves. A wave alternates from
positive to negative, then to positive and negative, and so on.
Waves are found in nature – you see waves when you throw a
rock into a lake.
Sound is transmitted in waves. And when prices change, they follow a
wave-like pattern.
The wave is rarely as orderly a sine wave, but they are waves
nevertheless, and we use these waves in Swing Trading.
WHAT IS SWING TRADING?
2016-04-08
25
Planetar y Cycles
Astronomical cycles
Climate and weather cycles
Geological cycles
THE NATURE OF CYCLES
Organic Cycles
Agricultural cycles
Biological and medical
cycles
Brain wave cycles
Electromagnetic
Sound waves
Economic cycles
Music and rhythm cycles
ETC….

2016-04-08
26
MARKET PHASES
www.candlecharts.com
2016-04-08
27
1. Waiting game: accumulation
2. Big bang: expansion
3. Aftermath: distribution
4. Downfall: contraction
SECURITY CYCLE OF LIFE
2016-04-08
28
This is also called base building stage or a depression stage.
Basically, It is the most bottom point of the market cycle
where majority of investors have lost confidence at this stage
and are reluctant to invest their money in a market. Smart
investors at his point are waiting to use their reser ved cash to
start investing when it starts moving to Stage 2……the Waiting
Game.
STAGE 1: CONSOLIDATION & ACCUMULATION

2016-04-08
29
This is also called the expansion
stage or mark-up stage, ie. Big Bang.
At this stage, the chart has been
stable for a while and starts to climb
up. Novice or inexperienced investors
are still hesitant to get in because
they are still haven’t recovered from
the stage 1. Smart investor will start
investing at the early of stage 2 as
shown in the graph.
STAGE 2: UPTREND & MARK-UP
2016-04-08
30
This is the stage where you can hear all the good news and
the economy seems like it has never been better. At this
stage, most novice or inexperienced investors jump into a
market because they think the prices will go even higher.
Smart traders at this stage are getting ready to exit….in the
Aftermath.
STAGE 3: DISTRIBUTION & PEAK

2016-04-08
31
This is a declining stage but nobody
believes the downtrend especially at
the early stage. They believe the
downtrend is just a correction and it
will go up pretty soon. On the other
hand, smart investors have mostly
taken profits and sold all their shares
causing the share prices to
drop….hence the Downfall.
Novice investors will either take losses
or turn to long-term hold if they
reluctant to sell.
STAGE 4: DOWNTREND & MARK-DOWN

2016-04-08
32
www.candlecharts.com
2016-04-08
33
Note: These 4 stages of chart cycles are always correct
because it is based law of nature.
What is the law of nature?
The law of nature is: what goes up must come down, what goes
down must come up.
So no matter what, the 4 stages are always correct!
4 STAGES

2016-04-08
34
www.candlecharts.com

2016-04-08
35
www.candlecharts.com

2016-04-08
36
www.candlecharts.com

2016-04-08
37
www.candlecharts.com

2016-04-08
38
www.candlecharts.com
2016-04-08
39
Reading charts is an art form that can take years to fully
master. Why do we read charts? Because, by reading charts,
we can determine what the "big money" is doing!
You have to be able to analyze a chart and come to a
conclusion about whether or not to risk your hard earned
money on a trade.
That is really the bottom line.
LEARN HOW TO READ CHARTS
2016-04-08
40
And this is what separates the novice trader from the
professional. There are several factors on a chart that make it
worthy of trading. By analyzing these factors, we can
determine with high probability which direction a chart will
move.
There several questions that you want to ask yourself when
you look at a chart. Here they are...
LEARN HOW TO READ CHARTS
2016-04-08
41
What stage is this char t in?
Is this chart in an uptrend or a
downtrend?
Is the chart at the beginning,
middle, or end of the trend?
How strong is the trend?
Where are the trend lines?
What wave is this char t in?
What do the moving averages tell
me?
Was there a breakout recently ?
Is the chart "smooth" or "sloppy"?
Are there any chart patterns?
Are there wide range candles in
the direction of the trend?
Are there any gaps in the
direction of the trend?
Are professionals selling strength
or buying weakness?
Where are the support and
resistance areas?
Is this char t at a Fibonacci level?
What does volume tell me ?
LEARN HOW TO READ CHARTS
www.candlecharts.com
2016-04-08
42
It seems like a lot of information to try and keep track of but
all of the above questions are essential to chart reading
master y!
Copy and print out that list of questions and keep it handy
next to your computer.
Make several copies if necessary) so that you can check off and
make notes as you analyze your next chart.
READING CHARTS

2016-04-08
43
STAGES, TRENDS AND WAVES
Let's look at example charts...
www.candlecharts.com

2016-04-08
44
Which Stage is this chart?
www.candlecharts.com

2016-04-08
45
www.candlecharts.com

2016-04-08
46
www.candlecharts.com

2016-04-08
47
Price moving up
Series of higher highs and higher lows
Takes a rest/pulls back
A series of successive rallies and pullbacks
going higher
Looks like the zig-zag of a saw blade
Buy long on pullback
Capitalizing on predictability of the pattern
LET’S LOOK AT AN UP TREND

2016-04-08
48
Price moving down
Series of lower highs and lower lows
Takes a rest/pulls up
A series of successive sell-offs and pull ups
going lower
Sell short on pullback
Capitalizing on predictability of the pattern
LET’S LOOK AT AN DOWN TREND
2016-04-08
49
STEP 1 – Identify a chart that is in an uptrend or a downtrend.
STEP 2 – For charts in an uptrend, identify those that are
experiencing a pull-back. For those in a downtrend, identify those
that are experiencing a pull-up.
STEP 3 – Once an appropriate candidate is identified, place a
limit order to buy (uptrend) or sell shor t (downtrend ).
STEP 4 – Once the candidate has been traded (a position
opened), place a stop-loss order to limit downside risk and place
a limit order to identify the price at which you will take profits.
(Ideally, these two orders are placed together as an OCO (One
Cancels Other) order; this is sometimes called an OCA (One
Cancels All) order.
STEP 5 – At the end of each candle, adjust the stop loss prices
based on your Plan.
THE STEPS IN SWING TRADING
2016-04-08
50
First – only a portion of your trades will be executed. The plan is
to only trade candidates that initially move in the anticipated
direction. If the price moves in the opposite direction (continues
pulling back or pulling up), the trade is not placed.
Second – you will be holding positions for a limited amount of
time. While swing trading is not day trading, you are only holding
positions until targets are met.
Third – some of your trades will result in losses, however losses
are minimized as your plan raises the stops as the price rises;
this is known as trailing stops. Being disciplined, and following
your plan will insure that profits exceed losses which means you
will make money.
WHAT CAN YOU EXPECT?
2016-04-08
51
Buying the pullback makes good sense after a strong rally, but
it's a great way to lose money if you jump in too early or too
late.
How can you find perfect timing when it comes to this classic
play? The key lies in reading the clues of the charting
landscape. It's natural for markets to correct after big rallies.
This countertrend move lowers the emotional fires and sets up
the ideal conditions for a swing back to higher prices .
BUYING THE PULLBACK
2016-04-08
52
But any pullback can turn into a reversal and trap your
position in a downward spiral. So let's look at the types of
pullbacks we want to buy and those that should be avoided at
all costs.
Volume presents important evidence about a chart's
intentions when it starts to pull back. Look for selling to
contract when bars test lower prices. The most bullish volume
shows a steady downslope in the histograms under the price
bars. This suggests shareholders are hanging tough because
they believe in higher prices. Alternatively, big red volume
spikes show fear and may signal important tops .
BUYING THE PULLBACK
2016-04-08
53
What
is it?
THE SWING TRADER’S
SWEET SPOT
www.candlecharts.com
2016-04-08
54
The Sweet Spot is a buy and sell zone on a chart that swing
traders can use to identify possible reversals.
First of all, let's take a look at all of the different types of
traders involved in the market when looking at a chart.
Then, we will look at where they buy. We'll focus on the long
side only.
THE SWEET SPOT
2016-04-08
55
This type of trader is looking to hold for long periods of time.
They buy charts that are first breaking out of basing patterns
into a stage two uptrend. This is likely where you will see
institutions buying. This buying pressure is what starts the
uptrend. They are hoping that the next two groups of buyers
will push prices higher.
POSITION TRADER
2016-04-08
56
This type of trader buys charts that are, well, showing
momentum! They buy right after a major move and hold for a
short period of time. They are hopping on a board a fast
moving chart looking to capture short term gains quickly.
MOMENTUM TRADER
2016-04-08
57
This is where you come in! You are trading the swings within
the trend. Here is a chart that may help you to better see how
everything unfolds...
SWING TRADER

2016-04-08
58
1. Position Traders Buy Breakout
2. Momentum Traders Take Over
3. Swing Traders Enter
www.candlecharts.com

2016-04-08
59
You can see the Sweet Spot is the area in between the
10 SMA and 30 EMA. This is where you, as a swing
trader look for reversals back to the upside when
going long and reversals to the downside when
shorting.
www.candlecharts.com
2016-04-08
60
Now you can see where you fit into the big picture!
It doesn't matter whether you use SMA's or EMA's.
There is little difference between the two so don't get caught up in the
variations.
These moving averages create a zone to find our entries for long and
short positions.
**We'll cover the entries (and exits) in a separate section of this course.
SWEET SPOT
2016-04-08
61
For swing trading, a lot of reversals happen in this area. In
order to better focus on your trading strategy, it is helpful to
narrow down your potential setups to one area on a chart.
This zone provides a plethora of setups on a daily basis.
We are not really concerned with the moving averages
themselves.
When price pulls back into this zone, look to the left to identify
support and resistance, trend lines, candlestick patterns, etc.
You are looking for multiple signals all pointing in the same
direction.
WHAT IS SO SPECIAL ABOUT THIS SPOT?
2016-04-08
62
The answer is no. Surprised??
There isn't ANY trading strategy that will make you a consistently
profitable trader.
The only thing that will enable you to consistently pull money out
of the markets is YOU.
YOU must have discipline. YOU must be able to take losses. YOU must
be able to take your profits. YOU must eliminate fear.
Put simply, you must be able to control the emotional and psychological
problems that prevent success….That will be your biggest challenge in
learning how to trade with any strategy.
WILL THIS STRATEGY MAKE ME A
PROFITABLE TRADER?
2016-04-08
63
HOW TO TRADE
PULLBACKS
www.candlecharts.com
2016-04-08
64
Buying weakness and selling strength is the art of buying
pullbacks. Charts that are in up trends will pull back offering
a low risk buying opportunity and charts that are in down
trends will rally offering a low risk shorting opportunity.
As a swing trader, you have to WAIT for these opportunities to
happen because...
Doesn't it make more sense to buy after a wave of selling has
occurred rather than getting caught in a sell -off?
Doesn't it make more sense to “short” after a wave of buying
has occurred rather than getting caught in a rally ?
PULLBACKS AND PULLUPS
2016-04-08
65
Absolutely! If you are buying, then you want as many sellers
out before you get in. On the other hand, if you are shorting,
then you want as many buyers in before you get in. This gives
you a low risk entry that you can manage effectively.
PULLBACKS AND PULLUPS
2016-04-08
66
Where do you buy a pullback and where do you short a rally?
You buy them and short them in the SWEET ZONE.
BUYING PULLBACKS AND SHORTING RALLIES

2016-04-08
67
See how you are buying in strong up trends after
a wave of selling has occurred?
www.candlecharts.com

2016-04-08
68
www.candlecharts.com

2016-04-08
69
www.candlecharts.com

2016-04-08
70
Now see how you are shorting after a wave
of buying has occurred.
www.candlecharts.com

2016-04-08
71
www.candlecharts.com
2016-04-08
72
When going long, wait for the decline into the SWEET SPOT
and when going short wait for the rally up into the SWEET
SPOT.
Are all of them created equal? Nope. You have just a standard
pullback like in the previous examples and then you have...
TIMING THE SWEET SPOT
2016-04-08
73
These are exactly what the name implies.
It is the first one after a change in trend.
How do you identify a change in trend - when the 10 SMA
crosses the 30 EMA.
After that happens, you look for an entry when the candles get into
the SWEET SPOT.
THE FIRST PULLBACK

2016-04-08
74
Arrows represent the “first pullback”
after a moving average crossover.
www.candlecharts.com
2016-04-08
75
This is the most reliable type of entry and this is the likely
area where institutional money is going to come into the
market.
If you only trade one pattern, this should be it!
You can get into a trade at the beginning of a trend, at a point
of low risk, and you can take partial profits and ride the trend
to completion! What more could you ask for ?
Oh yeah, speaking of getting in on the beginning of a trend.
This next setup fits neatly into a Wave pattern…
THE FIRST PULLBACK
2016-04-08
76
There is one other type of pullback worth mentioning and that
is the first pullback after a breakout.
If you are looking at a chart that is trading sideways or
forming a basing pattern, and it suddenly breaks out of the
pattern, you can look to buy the first pullback after the
breakout.
This also gives you a low risk entry into a trade that will likely
continue the current trend.
FIRST PULLBACK AFTER A BREAKOUT

2016-04-08
77
Breakout
Breakout
www.candlecharts.com
2016-04-08
78
Most traders are going to buy breakouts.
The word breakouts sounds so exciting doesn't it?
The problem with buying breakouts is that it is hardly ever y low
risk.
Think about it. If you are buying when everybody else is, then who is left
to buy after you get in?
Also consider this: The majority of breakouts fail and return (pullback) to
the breakout point!
Forget buying breakouts . Step away from the crowd. Wait for the
breakout buyers to get scared and sell.
This sets up the pullback that you can get into with much lower risk and
higher odds of having a successful trade.
FIRST PULLBACK AFTER A BREAKOUT

2016-04-08
79
SUPPORT AND
RESISTANCE LEVELS
www.candlecharts.com
2016-04-08
80
Support and resistance identify areas of supply and demand.
What exactly is supply and demand?
HOW TO IDENTIFY SUPPORT AND RESISTANCE LEVEL
2016-04-08
81
Supply is an area on a chart where sellers are likely going to
overwhelm buyers causing price to go down.
On a chart, we call this resistance.
SUPPLY
2016-04-08
82
Demand is an area on a chart where buyers are likely going to
overwhelm sellers causing price to go up.
On a chart, we call this support.
DEMAND
2016-04-08
83
Knowing this, it only makes sense to buy at support and sell
at resistance!
SUPPLY AND DEMAND
2016-04-08
84
Price runs into resistance (supply) because those traders that
bought too late and saw the price go down now want to get
out at break even so they sell.
Price finds support (demand) because those traders that
missed the move up now have a second chance to get in so
they buy.
Ok, you probably already knew all that but here is
something that most traders do not know.
There are var ying degrees of support and resistance.
SUPPLY AND DEMAND
2016-04-08
85
On the long side: When price falls down to a prior low it is
more significant than when price falls down to a prior high .
On the short side: When price rises up to a prior high it is
more significant that when price rises up to a prior low.
DEGREES OF SUPPORT & RESISTANCE

2016-04-08
86
Resistance
Support
www.candlecharts.com
2016-04-08
87
Resistance
Support
TIP: The more times price hits a support or resistance area the weaker it
becomes (and the possibility of a breakout increases).
www.candlecharts.com

2016-04-08
88
This chart broke through resistance after hitting $26.50 several times.
When it pulled back, it found support at the prior high.
This chart shows how resistance, once broken,
can become support.
Think POLARITY.
www.candlecharts.com

2016-04-08
90
Now becomes SUPPORT
Prior RESISTANCE….
www.candlecharts.com

2016-04-08
91
The highlights in green are where you would buy.
www.candlecharts.com

2016-04-08
92
Now becomes RESISTANCE
Prior SUPPORT….
www.candlecharts.com

2016-04-08
93
The highlighted area in red is where you would short this.
www.candlecharts.com
2016-04-08
94
There are other forms of support and resistance that are not
so common.
For example, look for charts that pull back and find support halfway
into a prior wide range candle….
A LITTLE KNOWN SECRET…

2016-04-08
95
Pull back
Wide range candle
www.candlecharts.com
2016-04-08
96
SUPPORT LEVELS
www.candlecharts.com
2016-04-08
97
The simplest entry comes from a pullback into a strong
support level. Trend lines, old highs and Bollinger Bands ease
selling pressure, and allow buyers to carry the market back in
the other direction. The biggest problem with these falling -
knife entries is usually psychological. The trader loses
confidence while watching the intensity of the selloff and fails
to act when it's time to pull the trigger.
TREND LINES

2016-04-08
98
www.candlecharts.com
2016-04-08
99
A trip down to the 50-day moving average offers an excellent
opportunity for dip buyers who want to hold positions for a
few days or a few weeks. This price zone usually marks strong
support after a rally. A market pulling back here also suggests
early dip buyers got beat up on the ride down.
Pullbacks tend to feed on traders who buy too early. In other
words, they buy and the market drops, stopping them out and
forcing prices even lower. This downward spiral continues until
prices reach a large pool of buying interest. This fresh
demand often sits right at the 50-day moving average.
MOVING AVERAGES

2016-04-08
100
www.candlecharts.com
2016-04-08
101
Many trader s use Fibonacci retracements to uncover hidden suppor t on
a pullback. But this is a lot harder than it looks. Prices commonly drop
to three different retracement levels, and you can lose a lot of money
when you pick the wrong one. For tunately there are ways to focus in
and locate the most likely support level.
Put the odds squarely in your favor by standing aside until price
reaches a deep retracement that corresponds with other types of
support. This means the safest strategy is to focus on the 62%
retracement and look for intermediate averages or old highs at the
same prices.
This process is called cross -verification. It works because it's self -
fulfilling. Different trader s look for different types of suppor t in various
pullback scenarios. Finding convergence of multiple support types at
narrow price levels taps into this broad set of buying signals.
FIBONACCI RETRACEMENTS

2016-04-08
102
www.candlecharts.com
2016-04-08
103
The intraday chart holds the key to pullback profits. Often, it's
hard to make sense of a market pulling back on a daily chart.
Fortunately trends evolve in all time frames, and traders can use
the intraday chart to uncover hidden support and resistance
levels.
Focus on the 60-minute chart because this gives you many days
of intraday price bars to work with. Pull one up when you see a
correction in progress, and start searching for common patterns,
such as bull flags or double bottoms. These inflection points
reveal low -risk entry prices for positions taken in much longer
time frames.
FLAGS

2016-04-08
104
www.candlecharts.com
2016-04-08
105
ESSENTIALS OF
TECHNICAL ANALYSIS
www.candlecharts.com
2016-04-08
106
Are technical indicators worth using?
Which ones should I use?
Is there one indicator that is better than another?
MACD?
Stochastics?
RSI?
SHOULD YOU USE TECHNICAL INDICATORS?
2016-04-08
107
The only thing you need is an understanding of price action.
If you are new to trading you will do yourself a great
disservice by trying to use technical indicators to trade.
You are far better off by first learning to trade based on price action
alone.
So put away your OBV, CCI, and PPO for now and just focus on the
chart.
STOP THE MADNESS!
2016-04-08
108
Technical indicators are generally classified into two
categories:
1. Leading Indicators
Leading indicators like stochastics are supposed to lead the price action.
2. Lagging Indicators.
Lagging indicators like moving averages follow price action
LEADING AND LAGGING INDICATORS
2016-04-08
109
In reality all technical indicators are lagging indicators
because they cannot draw on a chart until after the price
action has already been established.
Remember that all technical indicators are generated by using
the high, low, open, close, or volume.
It gets this information from the price action first, then it shows up
on your chart as RSI, MACD, etc.
Therefore, these indicators can never tell you anything more than
what the chart is already saying!
LEADING AND LAGGING INDICATORS
2016-04-08
110
Ok, now that you know the truth about technical indicators, you
can finally relax. You can stop looking for the perfect indicators
to solve all your trading problems.
So what should you look for on a chart?
Good question!
The main thing that you are trying to figure out
on a chart is the psychology of other traders .
LEARN HOW TO INTERPRET PRICE FIRST
2016-04-08
111
You are trying to figure out where they are going to buy and
where they are going to sell.
You are trying to get into their heads!
You want to know if they are excited, nervous, scared, or
uninterested.
LEARN HOW TO INTERPRET PRICE FIRST
2016-04-08
112
Every chart, in every time frame, alternates between these
four emotional extremes.
Price breaks out of a consolidation (excited)
Momentum slows down (nervous)
Traders begin to sell (scared)
The selling finishes and there is indecision (uninterested)
This cycle repeats over and over again.
LEARN HOW TO INTERPRET PRICE FIRST
2016-04-08
113
As a trader you look at price to find the point at which one
emotional state is about to evolve into another.
Candlestick patterns are useful to determine these turning
points. They will give you these signals far in advance of any
technical indicator!
LEARN HOW TO INTERPRET PRICE FIRST
2016-04-08
114
You still want to use indicators in your trading?
That's fine, just use them the right way - to indicate!
If you like using RSI then use it to tell you that a turning point may be
coming. Then just forget about it and focus solely on the price action.
Too often we see traders buying just because an indicator is
overbought or oversold.
A chart can become overbought or oversold for a very long time. In
the meantime you have a position that is losing money!
USING TECHNICAL INDICATORS THE RIGHT WAY
2016-04-08
115
Look for divergences. If there is one thing that technical
indicators can be useful for is the ability to identify those
times when price is at odds with the indicator. This can signal
that a turning point may be coming. As always look at the
candles (price) for validation.
Use the right indicator for the job.
For analyzing trends use trend following indicators like moving
averages.
For trading ranges, use oscillators like RSI.
USING TECHNICAL INDICATORS THE RIGHT WAY
2016-04-08
116
Remember that you do not need any kind of indicator to trade
and you certainly should not be using them until you have a
full understanding of how to interpret the price action.
Even then you may opt to never use them in your trading.
USING TECHNICAL INDICATORS THE RIGHT WAY
2016-04-08
117
Print out 20 random charts.
Do not put one technical indicator on the chart! Don't even put
moving averages or volume on it.
Now find a quite spot in your favorite chair and just look at the
candles.
Look for support and resistance, trend lines, and emotional
extremes.
Take a piece of paper and cover up the right edge and try to get into
the heads of these traders.
Can you feel what they are feeling?
More importantly, can you anticipate what will come next?
PRACTICE MAKES PERFECT
2016-04-08
118
The following Technical Analysis (TA) tools
are part of the daily charting arsenal :
Japanese Candlesticks
Volume
Volume provides clues as to the intensity of a given price move.
Volume can help determine the strength of an existing trend
Moving Averages
shows the average value of a security's price over a period of time.
THE ESSENTIALS OF TECHNICAL ANALYSIS
2016-04-08
119
Overlays
Bollinger Bands
Keltner Bands
Linear Regression
Moving Average
On Balance Volume (OBV)
Parabolic SAR
AVAILABLE TECHNICAL INDICATORS
2016-04-08
120
Average True Range
Breadth Advance/Decline
Commodity Channel Index
(CCI)
Directional Moving Index
(DMI)
Force Index
MACD
McClellan Oscillator
Momentum
Money Flow
Relative Strength Index (RSI)
Stochastics
Ultimate Oscillator
Volatility
Volume and Volume Average
William %R
AVAILABLE TECHNICAL INDICATORS
Indicators
www.candlecharts.com
2016-04-08
121
MOVING AVERAGES
www.candlecharts.com
2016-04-08
122
Most Swing Traders use two moving averages: the 10 period
simple moving average (SMA) and the 30 period exponential
moving average (EMA).
Why? Because when the faster one (10) crosses over the slower one
(30), it will often signal a trend change.
THE T WO MOVING AVERAGES

2016-04-08
123
10 Above 30 = Trend UP
You can see in the chart how these lines can help you
define trends. the 10 SMA crosses back up through the
30 EMA in September and the trend is up again - and it
stays up for several months thereafter.
www.candlecharts.com
2016-04-08
124
Focus on long positions only when the 10 SMA is
above the 30 EMA.
Focus on short positions only when the 10 SMA is
below the 30 EMA.
It doesn't get any simpler than that and it will
ALWAYS keep you on the right side of the trend!
THE T WO MOVING AVERAGES RULES
2016-04-08
125
Note that moving averages only work well when a
chart is trending - not when they are in a trading
range.
When a chart (or the market itself) becomes "sloppy"
then you can ignore moving averages - they won't
work!
THE T WO MOVING AVERAGES RULES
2016-04-08
126
The 10 SMA must be above the 30 EMA .
For Long positions (reverse for Short positions)
There must be plenty of space in between the moving
averages.
Both moving averages must be sloping upward.
THE IMPORTANT THINGS TO REMEMBER
2016-04-08
127
1O
PATTERNS
FOR SWING
TRADING
CANDLESTICKS
PATTERNS
www.candlecharts.com
2016-04-08
128
There are many candlestick patterns that you can use for
trading.
Following are only a few candlestick patterns worth knowing.
As a SWING TRADER, it is also important to know what kind of
forces are at work to make these patterns form and know
these candlestick patterns listed….
CANDLESTICK PATTERNS

2016-04-08
129
If you see a bullish candlestick pattern in a level of support,
fibs or pivots, then these can provide a powerful reversal!
BULLISH PATTERNS

2016-04-08
130
If you see a bearish candlestick pattern in a level of
resistancet, fibs or pivots, then these can provide a powerful
reversal!
BEARISH PATTERNS
2016-04-08
131
First, when you use reversal candlestick patterns, you are now
using price action to make your trade decisions.
Price action is much better than using a lagging indicator to get into
a trade.
Reversal Candlesticks, when they form around areas of
support and resistance, etc. give you are good trade entry
confirmation.
You can use this reversal candlestick patterns and apply them
in any swing trading strategy as part of its trade entr y rules.
These reversal candlestick patterns can be used in any
timeframe with accuracy.
WHY YOU NEED REVERSAL CANDLESTICK PATTERNS
2016-04-08
132
ENTRY STRATEGY
www.candlecharts.com
2016-04-08
133
Your swing trading entry strategy is the most important par t of the
trade. This is the one time when all of your trading capital is at risk.
Once the char t goes in your favor you can then relax, manage your
stops, and await a graceful exit.
This section explains the basic price pattern that is used to enter. Once
you become familiar with it, you can try out more advanced strategies
based on the specific pattern that you are trading . More on char t
patterns later.
With your entry strategy, the first thing that you want be able to do is
identify swing points.
What's a swing point you ask?
This is a pattern that consists of three candles.
For entries on long positions, you look for a swing point low.
For entries on short positions you look for a swing point high.
SWING TRADING ENTRY STRATEGY
2016-04-08
134
For a swing point low:
Th e f ir st c an dl e ma ke s a l ow.
Th e se co nd c a ndl e ma kes a l ower low.
Th e th ir d c an dl e ma kes a h i g h er l ow.
This third candle tells us that the sellers have gotten weak and price will likely reverse.
For a swing point high:
Th e f ir st c an dl e ma ke s a h ig h.
Th e s eco n d ca n dle ma kes a h ig he r h ig h.
Th e th ir d c an dl e ma kes a l ow e r hi gh .
This third candle tells us that the buyers have gotten weak and price will likely reverse.
For o ur l o n g e n t r y st r a te gy , we ar e t r yi ng to f in d c h ar t s th a t
ha ve p ull ed ba ck an d ma de a sw in g poi nt l ow .
IDENTIFYING REVERSALS USING SWING POINTS

2016-04-08
135
Swing Point Lows
1
2
3
1 2 3
See how the pattern consists of a low (1), lower low (2), then a higher low (3)?
This is a classic swing point low. Our entry strategy would be to enter this on
the day of the third candle.
www.candlecharts.com

2016-04-08
136
Swing Point Highs
1 2
3
See how the pattern consists of a high (1), higher high (2), then a lower high (3)?
We would look for an entry on the third candle.
1
2 3
www.candlecharts.com
2016-04-08
137
It is worth noting that NOT ALL swing points will result in a
powerful reversal.
However, a reversal will not happen without a swing point
developing.
Take the time to go though a few charts and look at the
reversals that happened in the past so that you are able to
quickly identify this crucial price pattern.
SWING POINTS
2016-04-08
138
Ideally, we want to trade charts that have consecutive down
days prior to the swing point low developing.
This is the best case scenario.
CONSECUTIVE PRICE PATTERNS

2016-04-08
139
Consecutive Down Days
Here is an example on the long side
www.candlecharts.com
2016-04-08
140
This is reversed on the short side. In this case, you want to
look for consecutive up days prior to the swing point high
developing.
When you are looking for swing points to develop, you always
want to look to the left of the chart to see if a support or
resistance area has been reached on the chart.
That will improve the reliability of this entry strategy.
CONSECUTIVE PRICE PATTERNS

2016-04-08
141
1
2
3
1
2
3
Swing Point High
Swing Point Low
SWING POINT RECAP
www.candlecharts.com

2016-04-08
142
1
2
3
1
2
3
Swing Point High
Swing Point Low
Can you find additional Swing Points?
www.candlecharts.com
2016-04-08
143
Sometimes you may want to be more aggressive with your
entry.…..
ALTERNATE ENTRY STRATEGY FOR SWING TRADERS
2016-04-08
144
An aggressive entr y is an entry in which you buy or short
before it makes a swing point low or a swing point high.
You are buying (or shorting) in anticipation of a swing point low or a
swing point high developing.
THE AGGRESSIVE ENTRY

2016-04-08
145
1 2
3
Swing Point Low
www.candlecharts.com

2016-04-08
146
1 2
www.candlecharts.com
2016-04-08
147
One isn't really better than the other.
It just boils down to risk versus reward.
A standard entry is less risky because price has moved in your
desired direction. But, often times, waiting for swing point to develop
messes up your risk to reward because your stop is further away.
An aggressive entry is usually riskier because price hasn't reversed
yet. But, your risk to reward is better because your stop is usually
closer.
Consider opting for the aggressive entry if you can find a
pattern suggesting a reversal on the hourly or 15 minute
chart.
WHICH ENTRY STRATEGY IS BETTER?
2016-04-08
148
They are important because they tell you when the balance of
power has shifted when you are shorting rallies or buying pull
backs. Think about it...
Day One: Price makes a high
Day Two: It makes a higher high
Day Three: It makes a higher high
Day Four: It makes a higher high
Day Five: It makes a lower high
[Note: It doesn't have to be exactly 5 days.]
WHY ARE IDENTIFYING SWING POINTS IMPORTANT ?
2016-04-08
149
What happened on the fifth day?
The bulls were able to push price to new highs on day one through
four but on the fifth day they failed to do this.
This means that the buyers are getting weak and the balance of
power is shifting (from buyers to sellers).
WHY ARE IDENTIFYING SWING POINTS IMPORTANT?
2016-04-08
150
The previous scenario formed a swing point high. The same
thing happens when a chart forms a swing point low.
Day One: Price makes a low
Day Two: It makes a lower low
Day Three: It makes a lower low
Day Four: It makes a lower low
Day Five: It makes a higher low
WHY ARE IDENTIFYING SWING POINTS IMPORTANT?
2016-04-08
151
What happened on day five?
The bears were able to push price to new lows on day one through
four but on the fifth day they failed to do this. The balance of power
has shifted from sellers to buyers and a swing point low has
developed.
I hope all of this isn't too confusing…..
WHY ARE IDENTIFYING SWING POINTS IMPORTANT?
2016-04-08
152
Just remember this: swing trading is a game - nothing more,
nothing less. Your opponents are other swing traders!
Everyone is tr ying to get into a trade before the other traders
do.
Get in too early and you will lose. Get in too late and you will
lose.
It's challenging but this is what makes the game so fun to
play!
WHY ARE IDENTIFYING SWING POINTS IMPORTANT?
2016-04-08
153
EXIT STRATEGY
www.candlecharts.com
2016-04-08
154
Your exit strategy consists of two parts:
1. Where will you get out of the trade if it does not go in your favor?
2. Where will you take profits if it does go in your favor?
These are the two questions that make up your exit strategy.
You have to be able to answer these questions in order to
consistently make money in any market.
SWING TRADING EXIT STRATEGY
2016-04-08
155
When you first buy (or short), you must set an initial stop loss
point.
This protects your capital if the trade goes against you.
There are two types:
A physical stop loss is an order to sell (or buy if you are short) that
you place with your broker.
A mental stop is YOU clicking the sell (buy) button to get out of the
trade. From a technical perspective, it does not matter which type
you use.
1. SETTING YOUR INITIAL STOP LOSS ORDER
2016-04-08
156
Before you get into a trade you will need a plan that will
determine when to get out of the trade if it does not go in
your favor.
You are a disciplined trader that always follows your plan
(right?).
Whether you use a mental stop or a physical stop, you will
always want to exit the trade when you predetermined plan
tells you to.
THE PLAN
2016-04-08
157
Where is your initial stop going to be?
You need a stop that makes sense and you need it to be out of the
"noise" of the current activity in the chart.
Look at the average range of the instrument over the past 10
days. If the average range of the price action is, say, $1.10, then
your stop needs to be at least that far away from your entry
price. It doesn't make any sense to have your stop .25 cents
away from your entry price when the range is $1.10.
You will surely get stopped out prematurely!
THINK ATR (Average True Range)
THE PLAN

2016-04-08
158
For long positions, your initial stop should go under a
support area and a swing point low. Like this:
www.candlecharts.com
2016-04-08
159
Want a real easy way to set your initial stop?
Put you stop loss order under the 30 period
EMA. A strong chart should not fall very far
below that moving average. If it does then you
want to be out of it anyway.
www.candlecharts.com
2016-04-08
160
When you buy or short a chart, you are expecting it to go in
your favor within a few days.
What happens if it doesn't?
Do you continue to wait for it to move in your desired direction? No.
You will want to sell (or cover) your shares and move on to something
else.
You don't want to tie up your trading capital on something
that is just trading sideways.
Treat a trade like an employee. If it doesn't do what you want it to do
- fire it!
WHY YOU SHOULD USE A TIME STOP
2016-04-08
161
Now you know how to get out of a trade if it does not go in
your favor.
Now we will talk about several exit strategies that you can use
to take profits (this is the fun part!).
2. PROFIT TAKING STRATEGIES
2016-04-08
162
Using trailing stops is an easy and unemotional way of exiting
a trade.
If this trade is going to be a typical swing trade with a holding
time of 2-5 days, then you can trail your stops 10 or 15 cents
under the previous days low or the current days low -
whichever is lower.
HOW TO USE TRAILING STOPS

2016-04-08
163
www.candlecharts.com

2016-04-08
164
If you are able to find a chart at the beginning of a
trend then you may want to hold this for a longer
time frame. Having some big winners every now and
then will fatten up your trading account!
In this case you can trail your stops under the swing
lows (or highs for shorts) until stopped out.
www.candlecharts.com
2016-04-08
165
When you buy a pullback, look to the left on the chart at the
previous swing point high. That is the first resistance area
that price will encounter. Of course, you hope that price will
power through that area. If it doesn't, sell it.
Here is an example:
SELLING AT RESISTANCE

2016-04-08
166
If you bought this on the pullback (arrow), then you would sell
it at the previous swing point high (red highlighted).
www.candlecharts.com
2016-04-08
167
There are times when you may want to take some profits and
sell into a powerful rally.
WHY YOU SHOULD SELL INTO STRENGTH

2016-04-08
168
You should take profits here.
A chart is prone to a sell-off once it gets extended above
the 10 period moving average. In this example you can
see how after you bought the pullback (arrow), this
exploded through the previous swing point high.
www.candlecharts.com
2016-04-08
169
If you would have waited to get stopped out, you may have lost a
big portion of your gains. So it makes sense to at least take a
portion of your profits off the table (and put a little money in your
pocket!).
www.candlecharts.com
2016-04-08
170
I've tried just about every exit strategy out there.
None are perfect.
Sometimes you sell too soon.
Sometimes you sell too late.
That's the bad news.
The good news?
You do not need a perfect exit strategy to be successful.
You just need to be able to protect your money when you are wrong -
and take profits when you are right.
THERE IS NO PERFECT STRATEGY
2016-04-08
171
Your stop loss order needs to be placed af ter the market has
closed.
Memorize the following sentence...
"My trailing stop loss order needs to go under the current days low or
the previous days low -whichever is lower."
The following is an example of how to trail your stops on a
day-by-day basis...
TRAILING STOPS: DAY BY DAY

2016-04-08
172
The green highlighted candle is the current
day and the day that you bought this. After
the market closes, you tell yourself that,
"My trailing stop loss order needs to go
under the current days low or the previous
days low, whichever is lower. (Red line)
Trailing stop loss order: day 1
www.candlecharts.com

2016-04-08
173
Trailing stop loss order: day 2
The green highlighted candle is now the current day.
After the market closes, you tell yourself that, "My
trailing stop loss order needs to go under the current
days low or the previous days low, whichever is lower."
Since the previous day is lower then your stop
loss order needs to go under that day (the day
of entry).
You will see that your stop loss order has
moved up. You always move your stop loss
order up with a long position - never down.
www.candlecharts.com

2016-04-08
174
Once again, the green highlighted candle is now
the current day and the market has closed. You
stop loss order will go under the previous days low
(red line) because it is lower.
Note that at this point your stop loss order
is going to be close to your entry price. Just
move your stop loss order to break even.
Now, you have a "free trade" and you can
relax!
Trailing stop loss order: day 3
www.candlecharts.com

2016-04-08
175
Trailing stop loss order: day 4
Now, your stop loss order has moved up
significantly and you have a decent profit
in this. If you get stopped out now, it will
be a good trade!
www.candlecharts.com

2016-04-08
176
Trailing stop loss order: day 5
So far this has been a great trade. But, now this
is approaching the previous swing point high
which may be a resistance area. Avoid the
temptation to sell because you think that price
will begin to fall. Just continue trailing your
stops...
www.candlecharts.com

2016-04-08
177
Trailing stop loss order: day 6
Once again, your trailing stop loss order will
go under the previous days low because it is
lower.
www.candlecharts.com

2016-04-08
178
Trailing stop loss order: day 7
On this day, your stop loss order is
triggered and you get stopped out of
this swing trade with a nice profit.
Nice trade!
Remember the sentence, "My trailing stop loss
order needs to go under the current days low or
the previous days low - whichever is lower."? Well
in this example trade we never put our stop loss
order under the current days low because the
previous days low was always lower.
www.candlecharts.com

2016-04-08
179
Here is an example of when you would put
your stop loss order under the current days
low.
Imagine that the highlighted candle is the current day and the
market has closed. Since the current days low is lower than
previous day, then you need to put your stop loss order under
today's low. This will make for a very tight stop loss order and
the majority of the time you will get stopped out. But, as you
can see from this example, sometimes you won't get stopped
out and price will continue to move in your favor.
www.candlecharts.com
2016-04-08
180
Trailing your stops in this manner is a great way to remove the
emotion from a trade. There is no guesswork involved. You
just move your stop loss order up in the manner described
above and you can eliminate the "emotional selling" that
seems to plague so many traders.
TRAILING STOPS

2016-04-08
181
Consider abandoning this trailing stop strategy if price
suddenly moves significantly in your favor. You do not want to
give up huge gains by trailing your stop loss order under a
wide range candle!
When price moves up to test the next resistance point,
consider selling half your shares and trailing your stop loss
order on the remaining shares.
You do not want to get stopped out prematurely if you are
at the beginning of a trend.
Keep your stop loss order further away so that you can ride the trend
to completion.
SOME THINGS TO CONSIDER
2016-04-08
182
There are no hard and fast rules for every single trade
because every trade will be different .
Just remember the #1 rule of trading: Keep your losses small
and let your winners run.
SOME THINGS TO CONSIDER
2016-04-08
183
The 2 for 1 money management strategy is a conser vative way
of trading, however, if you are new to trading then this will
help you to stay alive while on the learning curve.
This money management strategy will help maximize your
profits while minimizing your losses!
The basic premise of this strategy is take profits on half of
your position once the instrument moves equal to your
original positions stop loss.
THE 2 FOR 1 MONEY MANAGEMENT
STRATEGY FOR SWING TRADERS
2016-04-08
184
Let's suppose that you buy 500 shares at $35.00. You determine
that your stop is going to be at $ 34.25.
You are risking .75/share. Now if price goes in your favor you will take ½
of your profits at $35.75 and leave your stop on the remaining shares at
$34.25.
What does this accomplish?
Well, you took a partial profit on half your shares once the price moved
equal to your positions original stop loss.
Now, if you get stopped out on the remaining shares you will have lost
nothing!
By taking half your shares off the table, you have given yourself
a "free trade" (minus commissions ).
Assuming that price doesn't gap down overnight, you can let the price
run!
MONEY MANAGEMENT EXAMPLE

2016-04-08
185
You can see that this has pulled back nicely and formed a Bullish
Engulfing candle. You decide to buy 400 shares near the end of the
day at $29.50. Further, you decide that your stop loss is going to go
under the low of that engulfing candle. You put in your order for your
stop at $28.52. Your risk is $.98 a share.
Now you pull out your 2 for 1 money management strategy!
You have already determined that your risk on this trade is $.98, so
you add that to your buy price. This equals $30.48. That is the price
at which you will sell half your shares (200).
www.candlecharts.com

2016-04-08
186
The next day it moves in your favor and you sell half of your shares at 30.48. You
have made $.98/share on 200 shares. Nice profit! Now you can relax. If you get
stopped out on the remaining shares you will have lost nothing!
The 2 for 1 money management strategy is a great way to protect
your capital. This is a defensive way of trading. If you are nervous
about a position or the market itself, then this method of money and
trade management may come in handy!
www.candlecharts.com
2016-04-08
187
4 PROFITABLE CHART
PATTERNS
For Swing
Traders
www.candlecharts.com
2016-04-08
188
Here are four profitable chart patterns that you can use the
next time you are looking for entries.
Ok, Hold on!! Wait! There is no holy grail…..
These patterns can and will fail.
You must manage your money correctly!
4 PROFITABLE CHART PATTERNS
2016-04-08
189
1. Shadow-30
2. Low Vol–High Vol (Squeeze)
3. Swing Shakeout
4. Squeeze Shakeout
THE FOUR CHART PATTERNS…
2016-04-08
190
If you are new to trading, then start with this pattern!
It is easy to identify, easy to learn, and easy to trade.
What more could you ask for?
1. SHADOW-30
2016-04-08
191
This pattern can be an "everyday" pattern, because of its
reliability.
It is easy to spot on a chart and simple to trade.
HOW TO TRADE THE SHADOW -30 CHART PATTERN
2016-04-08
192
The name Shadow -30 refers to a “shadow" that slices down
through the "30" period exponential moving average.
This looks like a hammer candlestick pattern on the chart but it
doesn't have to be a perfect hammer to be considered a Shadow -
30.
The color of the real body is not important.
This shadow on the chart flushes other traders out of their position.
Note: There is nothing special about the 30 period moving average.
It is just a reference. Look to the left on the chart to determine
support and resistance.
THE SETUP
2016-04-08
193
When you are trading any kind of long lower shadow or
hammer pattern, always look for volume to be higher than the
previous day.
This suggests that many traders were shaken out and demand is
picking up.
This is important!
*There a multiple ways to trade this setup
depending on your desired risk/reward
THE SETUP

2016-04-08
194
www.candlecharts.com
2016-04-08
195
If you are able to trade during the day then buy on the day of
the hammer (shadow) near the end of the day. You not need
any kind of "confirmation" or anything else. You only need to
see that price is at a support level and that demand is coming
(volume). That is all the confirmation that you need .
If you cannot trade during the day, then place your buy stop
above the high of this hammer day. The next day you will have
to check to see if you get filled and then place your stop loss
order. You could also use a bracket order.
THE ENTRY
2016-04-08
196
There are two options for the placement of your stop loss
order. Each has advantages and disadvantages. You decide
what is right for you
THE STOP LOSS ORDER
2016-04-08
197
Option 1:
Put your stop under the low of the hammer. The advantage to this is
that your stop is far away from your entry price and you will not likely
get stopped out prematurely. The disadvantage to this is that
because your stop is so far away, you will have to buy fewer shares in
order to comply with your money management rules.
Option 2:
Move down to the 60 minute chart and put your stop under a support
area closer near the real body of the candle. The advantage to this is
that you get to buy more shares because your stop is closer to your
buy price. The disadvantage to this is that because your stop is so
close, you may get stopped out more often, before a big move
happens.
THE STOP LOSS ORDER
2016-04-08
198
When you are trading wide range days like hammers, you will
find out that many times, the chart will trade sideways for a
day or two. That is fine. You are already in the trade just
waiting for other traders to enter. Also, the days that follow a
hammer are typically low volatility, narrow range days like
stars or doji.
Be patient! Do not get anxious to move your stop up. Wait for
price to actually move in your favor before you begin trailing
your stop.
Once price moves in your favor, then you safely begin to trail
your stop using your favorite exit strategy to lock in profits.
TAKING PROFITS
2016-04-08
199
Focus on those char ts where the real body of the candle is close
to the 30 EMA. You want as many traders as possible shaken out
of this before you get in.
This setup is reversed for shor t positions except now you are
looking for charts with a Shooting Star pattern through a
declining 30 EMA.
Give more weight to setups with multiple shadows over several
days.
Give more weight to setups where price gaps away from the
previous candle to end the day in hammer.
Always look to the left on the chart to make sure price is at a
significant support or resistance area .
TRADING TIPS
2016-04-08
200
Yes, you will have losing trades with this pattern.
There is no pattern that will guarantee all winning trades!
But with proper money, trade, and self management, you can do very
well with this setup.
WHEN GOOD CHART PATTERNS GO BAD
2016-04-08
201
Some potentially explosive moves can result from trading this
pattern.
The best thing about this pattern is that you can usually get a
low risk entr y.
2. LOW VOL–HIGH VOL
(S QUEEZE)
2016-04-08
202
What happens when traders ignore an instrument?
You get narrow range candles and low volume. When you see this
developing on a chart, it will remind you of a squeeze. Get ready, it’s
about to explode.
THE LOW VOL-HIGH VOL CHART PATTERN
2016-04-08
203
The name “Squeeze" refers to a low volatility setup. And what
follows low volatility? High volatility! This repeats over and
over again on every chart - in ever y time frame.
With this chart pattern, you will see pullbacks into the SWEET
SPOT that end in narrow range candles. These candles are
also known as High Wave or Doji.
Combine these price patterns with low volume and you have a
winning trade in the making!
THE SETUP

2016-04-08
204
See how this pulls back into the SWEET SPOT, there are narrow
range candles (Doji), and low volume? Now look at what happens
at the next swing point high ($44.50). See the narrow range
candles again? Volume drops off for a couple of
days, momentum has slowed, and it pulls back again.
This is where professional traders come in.
www.candlecharts.com

2016-04-08
205
www.candlecharts.com
2016-04-08
206
This can be tricky….
When you have a potentially explosive situation, the price can
be prone to whipsaws.
Here is how to avoid them….
HOW TO TRADE THIS PATTERN
2016-04-08
207
With this pattern, you want to avoid just putting your buy stop
above the previous high.
You will get likely get filled prematurely!
Method 1: Put your buy stop above the high of the highest
narrow range candle. In the first example (long), there were
several candles highlighted. Find the one with the highest
high. Put your buy stop in above that. This is reversed for
short positions.
THE ENTRY
2016-04-08
208
www.candlecharts.com
2016-04-08
209
Method 2: Wait for another pattern to develop before you enter.
Did you notice the Shadow -30(s)?.
Method 3: Move down a time frame to the 60 minute chart and
wait for it to breakout. Many times the 60 minute chart will give
you an early warning sign that the chart is about to break (in one
direction or another).
The most difficult part of this pattern is the entry. Many times
the price will move up and then sell off. Or, it will move down,
and then rally. This can cause whipsaws.
The advantage to this pattern is that your stop can be very close
to your buy price, so your risk is small. If you get stopped out,
consider another entry. The move that follows is usually worth it!
THE ENTRY
2016-04-08
210
There isn't anything special here. Just trail your stops using
your favorite exit strategy. However, when the market offers
you a gift, take it! If the chart explodes, and goes up 15% in a
couple of days, at least take partial profits and trail your
stops on the rest.
TAKING PROFITS
2016-04-08
211
Low volatility leads to high volatility.
High volatility leads to low volatility.
Narrow range candles mean that momentum is slowing. The
buyers or sellers are losing strength.
Always look to the left on the chart to make sure that price is
at a significant support or resistance area.
TRADING TIPS
2016-04-08
212
It's amazing what happens on a chart…
Right when everyone loses interest, it takes off. Go figure!
Think of the Low Vol-High Vol pattern this way: When you see
a pullback into the SWEET SPOT and narrow range candles
develop, the price action that preceded it, is coming to an
end……A reversal is coming!
TRADING TIPS
2016-04-08
213
What happens when swing traders and momentum traders get
trapped in a chart and have to take a loss? The price rallies!
You will see this chart pattern ALL the time. Learn it. It is one
of the most reliable patterns I know of. You'll see why in a
second.
3. SWING SHAKEOUT
2016-04-08
214
Like the name implies, this chart pattern "traps" swing
traders (and momentum traders) right in the middle of a
move.
This is a cyclical wave pattern - just on a smaller scale.
THE SETUP

2016-04-08
215
The circled area is what we are interested in. It is very
easy to identify this pattern. You'll recognize it in a
second!
www.candlecharts.com

2016-04-08
216
This rallies hard to $42.00. It then pulls back real nicely
into the SWEET SPOT. This would have been a nice
pullback to trade. But look at what happens next.
It rallies up a little bit, but then it fails and goes right back down. This
traps the swing traders who are long this. They put their stop loss orders
under the first rally attempt. But, when it fell, it took out their stop loss
orders.
www.candlecharts.com

2016-04-08
217
Now that the majority of sellers are out of the
trade, it can rally.
And that's exactly what it did.
www.candlecharts.com
2016-04-08
218
The key with this chart pattern is to look for the "shakeout".
The final swing MUST go below the low of the first swing.
Many times, this final swing will end in a hammer. This
hammer will take out all of the stop loss orders and you are
ready to go!
HOW TO TRADE THIS PATTERN
2016-04-08
219
Wait for a candlestick pattern to develop on the final swing (in
this case, it was a hammer). Then you can buy on the day of
the pattern, or wait, put in a buy stop above the high of the
candlestick pattern.
It's up to you how you want to enter.
THE ENTRY
2016-04-08
220
Nothing special here. Just put your stop where it makes the
most sense. Usually this will be under the low of the day of
entry, but look to the left on the chart to identify support and
resistance levels.
THE STOP LOSS ORDER
2016-04-08
221
The Exit Strategy section provides several options for trailing
your stops.
TAKING PROFITS
2016-04-08
222
The secret to this pattern is for the final swing to go below the
low of the first swing. This is crucial.
You will find this exact pattern on the short side also. The
pattern is just reversed.
This pattern is not limited to the daily chart. You will see it in
all time frames.
You’re going to love trading this chart pattern.
It represents a short term extreme in the market that
gets a lot of potential sellers out before you get in!
TRADING TIPS
2016-04-08
223
This chart pattern occurs when price trades side ways, breaks
down, and then reverses.
This chart pattern is a good example of why the majority of
traders lose money. They get caught (shaken out) on the
wrong side of a move. This results in some potentially
explosive moves in price.
4. SQUEEZE SHAKEOUT
2016-04-08
224
We have talked about the Swing Shakeout pattern. This
pattern is similar in that it catches traders on the wrong side
of a move.
THE SETUP

2016-04-08
225
First, look at the highlighted area in the following
chart: What are your thoughts about this?
www.candlecharts.com

2016-04-08
226
There are some traders that are buying this inside of the
consolidation in anticipation of a breakout. But really,
there is nothing to do with this except wait for a breakout.
You, like most traders, are probably thinking that this is
trading sideways (consolidating) but since it is in an
uptrend, it may breakout soon. And you would be right in
thinking this.
www.candlecharts.com

2016-04-08
227
Now look at what happens on the next day…
Remember that there are thousands of traders looking at
this chart. And they are thinking the same thing that you
are.
www.candlecharts.com

2016-04-08
228
Now, what are your thoughts about this?
Price broke down through the consolidation.
And, it closed with a very bearish candle that
closed near the bottom of the intra day range.
There are some traders that got stopped out
(they put their stop under the lows of the
consolidation) and there are some traders that
have aggressively shorted this.
www.candlecharts.com

2016-04-08
229
So no matter how you look at it - at this point this
looks bearish. Plain and simple.
Now, look at what happens on the following day…
www.candlecharts.com

2016-04-08
230
Whoa! What just happened? There was no follow
through to the down side. This means that there are no
sellers left to move this lower.
So, with all sellers flushed out, this can now
move higher.
www.candlecharts.com

2016-04-08
231
Also keep in mind that those traders that shorted this on
the day of the breakdown probably put their stop loss
orders above the consolidation. When price moved above
that area, their stop loss orders were taken out - causing
the gap up.
Consolidation Breakdown
Reversal
www.candlecharts.com
2016-04-08
232
There are three components to trading this chart pattern:
consolidation
breakdown
reversal
You need a sideways consolidation, then a breakdown causing
the chart to look bearish, and finally a reversal pattern. This
is why this pattern is called a "squeeze shakeout”. Price
trades squeezes sideways and then shakes out traders who
shorted the breakdown.
HOW TO TRADE THE SQUEEZE SHAKEOUT PATTERN

2016-04-08
233
Here is another example…
Consolidation Breakdown Reversal
www.candlecharts.com

2016-04-08
234
An example where the consolidation doesn't last very long.
Consolidation
Breakdown Reversal
www.candlecharts.com

2016-04-08
235
Another example…
Consolidation Breakdown
Reversal
www.candlecharts.com
2016-04-08
236
You want to establish a position with this on the day of the
reversal candle. But, you do not want to trade just any
reversal candle.
You want the candle to be strong one. Make sure it closes at
least halfway into the range of the breakdown candle. This
will show up as a Piercing Candle or a Bullish Engulfing
candlestick pattern.
THE ENTRY
2016-04-08
237
Nothing special here. Just trail your stops using your favorite
exit strategy. However, when the market offers you a gift -
take it! If the price explodes, and goes up 15% in a couple of
days, at least take partial profits and trail your stops on the
rest.
Keep in mind that you are wanting to see this move above that
sideways trading pattern (consolidation). That is where the
explosiveness will kick in.
TAKING PROFITS
2016-04-08
238
The longer the consolidation the more potential for an
explosive move.
The reversal candle must be a powerful one.
Volume is not important but you may see high volume on the
breakdown candle.
If the overall market (S&P 500) has a big down day, the odds
of this pattern showing up increases .
TRADING TIPS
2016-04-08
239
There are two things that you should love about this chart
pattern. First, you are establishing a position after a wave of
selling has occurred. And second, you are trading opposite the
crowd.
These are the two components of successful swing trading.
TRADING TIPS
2016-04-08
240
FINDING SWING
TRADING
PATTERNS
www.candlecharts.com
NCS
2016-04-08
241
Nison Candle Scanner (NCS)
Scan for major patterns on desired time frame
Coincide candle pattern with chart pattern for potential Swing Trade
entry
SCANNING FOR PATTERNS
Scan Example:
- Dow 30 components for major patterns
- Daily charts

2016-04-08
242
www.candlecharts. com

2016-04-08
243
www.candlecharts.com

2016-04-08
244
www.candlecharts.com

2016-04-08
245
www.candlecharts.com

2016-04-08
246
www.candlecharts.com
2016-04-08
247
SWING TRADING
ADVICE
www.candlecharts.com
2016-04-08
248
To be successful, you'll need to study up on the various
techniques and strategies involved in swing trading. Money
management skills are essential, as is the ability to budget
business expenses appropriately and understand relevant tax
consequences. Additionally, it's important to realize that your
education will be ongoing, so you'll need to stay curious,
vigilant, and up-to-date.
INVEST IN YOUR EDUCATION
2016-04-08
249
If you've ever learned to ice skate, you know that one of the
first lessons is accepting that falling is part of the game. Too
great a fear of falling could prevent you from ever skating
well. Similarly, if you want to be successful with your
investments, you need to view swing trading as a business
and accept that losses will happen. Don't be afraid to take a
few hits. Stay calm and control any emotion-based urges you
have in favor of rational, reasonable decisions.
ACCEPT YOUR LOSSES AND MOVE ON
2016-04-08
250
Paper trading refers to a practice method in which aspiring
investors only pretend that they're making real investments.
They track their proposed trades on paper, noting all their
losses and wins, and then analyze their success after a set
period of time. Paper trading is a great way to practice your
skills, and until you're confident in your abilities and have a
proven track record of profits, paper trading is recommended.
It will help you hone your technique while protecting your
trading capital.
USE PAPER TRADING
2016-04-08
251
Success will take time. If you expect immediate wins,
you will be disappointed; the market simply doesn't work that
way. Most importantly, don't hinge your financial well -being on
your new found interest in swing trading, even if your goal is
to become a full-time swing trader. Patience is key.
BE PATIENT
2016-04-08
252
The Internet is teeming with swing trading strategies, tips,
and techniques. To be successful, you need to find the
strategy that works for you, which is why education is so
crucial. Explore the possibilities, but remember that
sometimes the best strategy is to KISS (keep it super simple)!
FIND WHAT WORKS FOR YOU

2016-04-08
253
www.candlecharts.com

2016-04-08
254
ANY QUESTIONS?
www.candlecharts.com

2016-04-08
255
www.candlecharts.com

2016-04-08
256
N C S S p e cial: w w w.nison candles canner.com/spec ial
my CC M ember si te Sp e cial: www.nison spec ial.com /mycc
Rec ord ing: w ww. can dl ech ar ts aca dem y. com
I MP ORTANT
Yo u mu st lo g in to yo ur a c co un t to a c ce ss th e r ec o rd in g
Re gistr ation for Ma r ket s of you r Choice bo n us ses sio n:
No t i fi c a t io n b y e m ai l
Pa ul @c a n d le c h a r t s . c om
www.candlecharts.com

2016-04-08
257
www.candlecharts.com


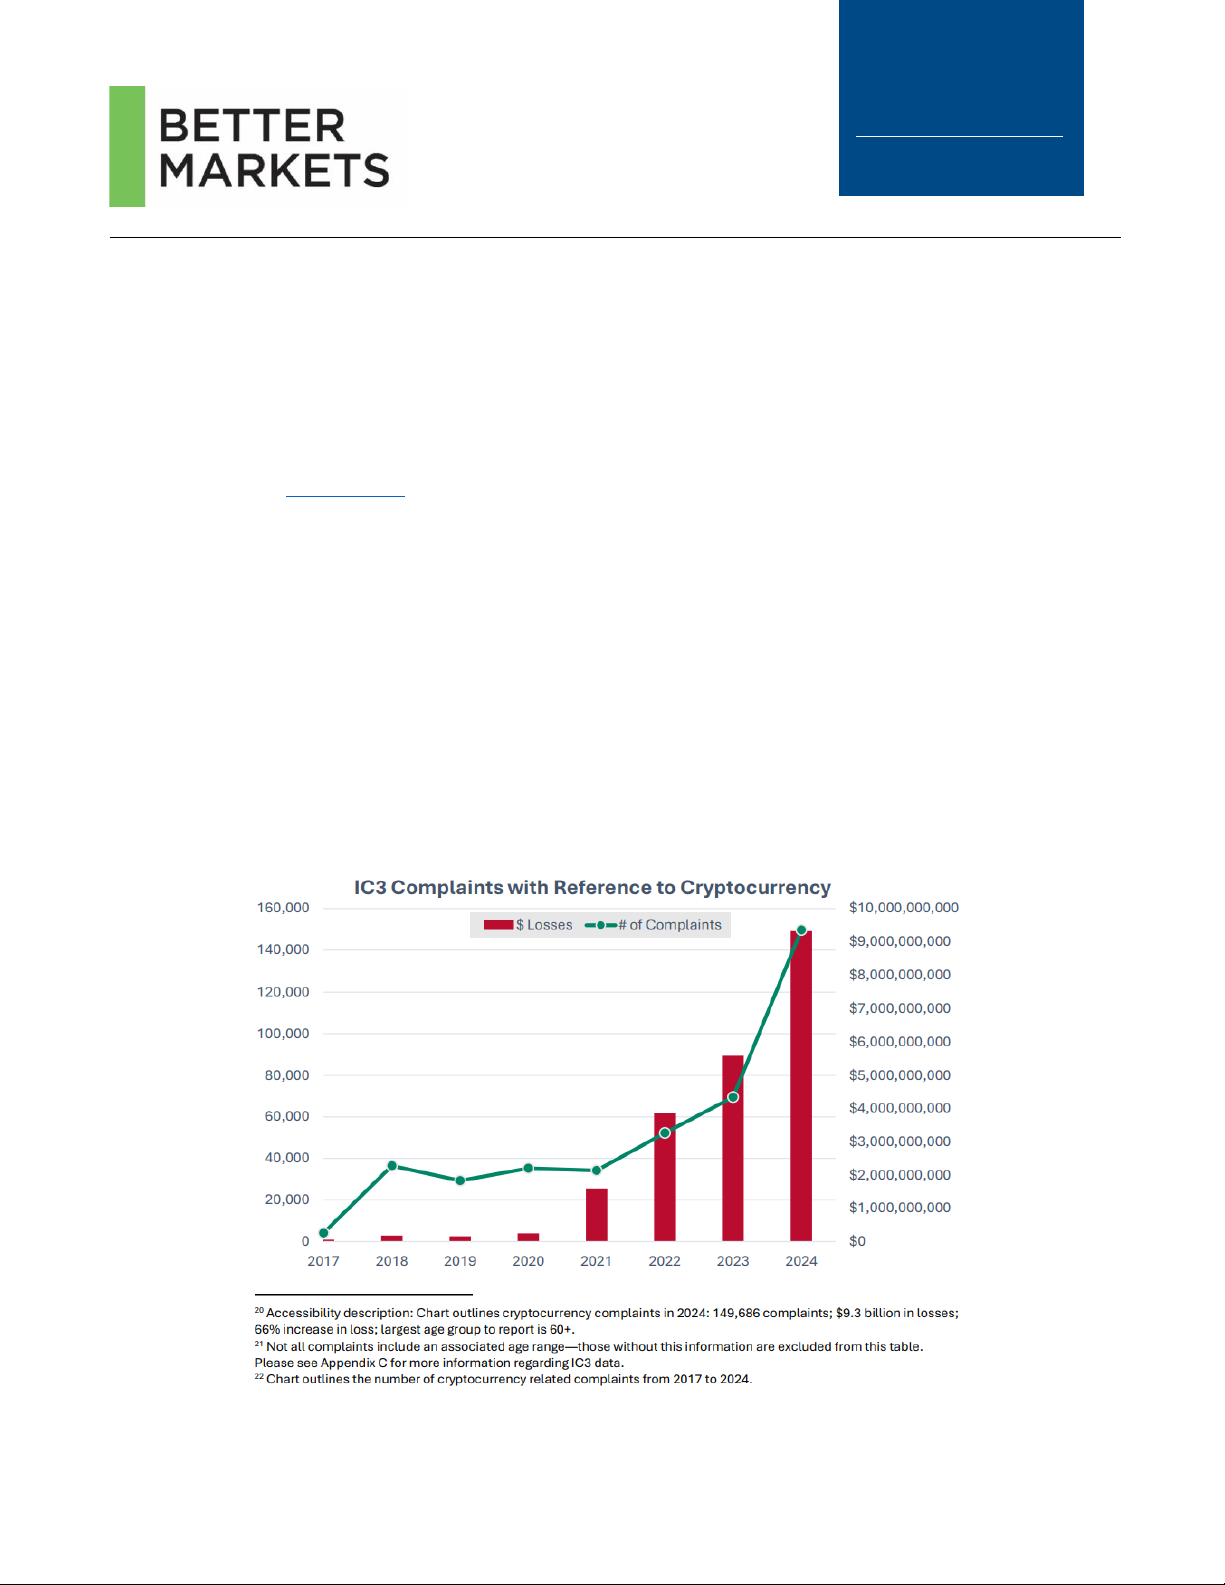


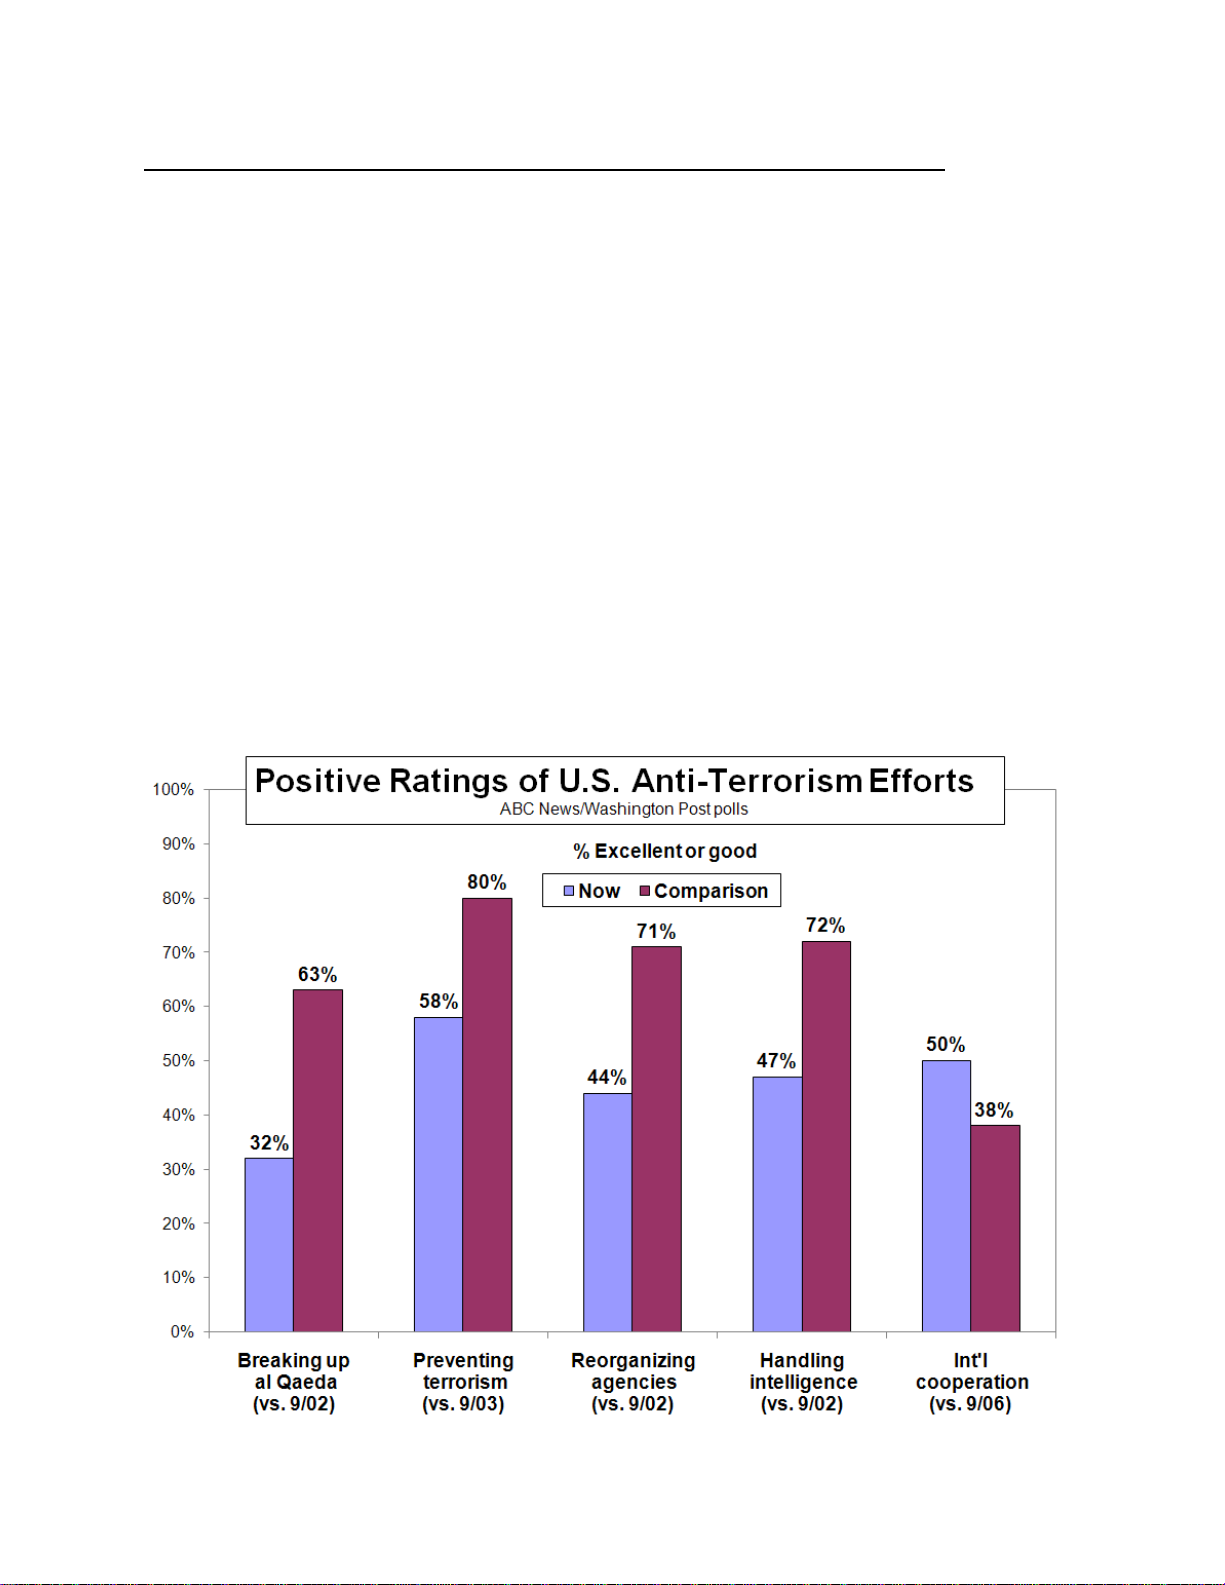


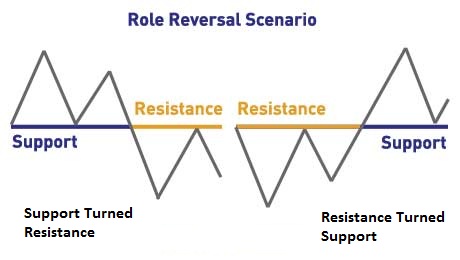