Transitioning Hochschule Geisenheim University: A Shift from NET Source to NET Sink Regarding Its CO₂ Emissions PDF Free Download
1 / 23/23
100%

Academic Editors: Marcin Kruzel,
Mykola Radchenko, Andrii
Radchenko and Victoria Kornienko
Received: 2 February 2025
Revised: 28 February 2025
Accepted: 4 March 2025
Published: 6 March 2025
Citation: Ardissone-Krauss, G.;
Wagner, M.; Kammann, C.
Transitioning Hochschule Geisenheim
University: A Shift from NET Source
to NET Sink Regarding Its CO2
Emissions. Sustainability 2025,17,
2316. https://doi.org/10.3390/
su17052316
Copyright: © 2025 by the authors.
Licensee MDPI, Basel, Switzerland.
This article is an open access article
distributed under the terms and
conditions of the Creative Commons
Attribution (CC BY) license
(https://creativecommons.org/
licenses/by/4.0/).
Article
Transitioning Hochschule Geisenheim University: A Shift from
NET Source to NET Sink Regarding Its CO2Emissions
Georg Ardissone-Krauss 1,2,* , Moritz Wagner 1and Claudia Kammann 1
1Institute for Applied Ecology, Hochschule Geisenheim University, 65366 Geisenheim, Germany;
moritz.wagner@hs-gm.de (M.W.); claudia.kammann@hs-gm.de (C.K.)
2Department of Strategic University Development and Sustainability, Hochschule Geisenheim University,
65366 Geisenheim, Germany
*Correspondence: georg.ardissone@hs-gm.de; Tel.: +49-6722-502-2081
Abstract: Various Higher Education Institutions (HEIs) set themselves goals to become
carbon neutral through the implementation of different reduction strategies such as the
replacement of fossil-fueled vehicles with electric cars. However, even if all reduction
measures are taken, residual GHG emissions will still remain. Therefore, most HEIs
have to compensate for the remaining emissions by, for example, buying carbon credits.
However, due to growing criticism of carbon credit purchases, HEIs need to explore
options for establishing carbon sinks on their own premises to offset their remaining,
unavoidable emissions. This study aimed to assess the CO
2
footprint of Hochschule
Geisenheim University (HGU) as an exemplary HEI, identify emission hot-spots, and
investigate the potential of biomass utilization for achieving carbon neutrality or even
negative emissions. The analysis found that HGU’s main emissions were scope 1 emissions,
primarily caused by on-site heat supply. The research determined that conversion to a
wood chip-based heating system alone was insufficient to achieve climate neutrality, but
this goal could be achieved through additional carbon dioxide removal (CDR). By operating
a pyrolysis-based bivalent heating system, the study demonstrated that heat demand could
be covered while producing sufficient C-sink certificates to transform HGU into the first
carbon-negative HEI, at a comparable price to conventional combustion systems. Surplus
C-sink certificates could be made available to other authorities or ministries. The results
showed that bivalent heating systems can play an important role in HEI transitions to CO
2
neutrality by contributing significantly to the most urgent challenge of the coming decades:
removing CO
2
from the atmosphere to limit global warming to as far below 2
◦
C as possible
at nearly no extra costs.
Keywords: CO
2
balance; higher education institution; pyrolysis; biochar; carbon dioxide
removal (CDR); heat generation system; biomass utilization
1. Introduction
Higher Education Institutions (HEIs) play an important role in reaching the Sustain-
able Development Goals (SDGs) and integrating these into teaching and research [
1
,
2
].
Furthermore, HEIs should not only consider the SDGs theoretically in their core activities
but also act accordingly in their own operations, as they have a role model function [
3
].
Among SDGs, combatting climate change is crucial, as climate change is a major barrier to
achieving nearly all SDGs except SDG 17 (Partnership for the goals) [
4
]. Therefore, various
universities have already set themselves the goal of becoming carbon neutral, for example,
in the UK and Germany [5,6].
Sustainability 2025,17, 2316 https://doi.org/10.3390/su17052316

Sustainability 2025,17, 2316 2 of 23
The CO
2
footprint of HEIs can differ substantially depending (besides other factors)
on the selected time metric and functional unit, as well as the data collection bound-
ary applied [
7
]. However, the review of Valls-Val and Bovea (2021), which analyzed
35 publications
focusing on the CO
2
footprint of HEIs, showed that independently of
these factors, scope 1 and 2 emissions represent a major emission hotspot for most of the
HEIs assessed [
7
]. In accordance with the GHG protocol, the scopes encompass direct
greenhouse gas (GHG) emissions caused by sources that are controlled or owned by the
HEI (scope 1) and indirect GHG emissions that occur due to the generation of purchased
electricity (
scope 2
) [
8
]. To reduce the scope 1 and 2 emissions of HEIs, several measures
were proposed. A reduction in scope 1 emissions could, for example, be achieved through
the replacement of fossil-fueled vehicles by electric cars [
9
]. As scope 2 encompasses the
indirect GHG emissions caused by the generation of purchased electricity, several studies
emphasize the importance of purchasing electricity from renewable sources or producing
renewable energy on campus [
10
–
13
]. Another possible measure is a reduction in the
electricity consumption of the HEI, for example, through the implementation of an energy
management system [14].
However, even if all reduction measures are taken, residual GHG emissions will
remain that are hard to avoid. Therefore, most HEIs must compensate for the remaining
emissions by, for example, buying carbon credits that are generated by emission reduction
projects somewhere else. This approach, however, has been criticized because it bears
the risk of over-crediting the reduction projects or even incentivizing the production of
waste gases to generate credits [
15
–
18
]. The latter means that there is a probability that
purchased carbon credits will not truly lead to emission reductions. In agriculture, a
large amount of biomass is produced annually, including crop residues like stalks and
husks and pruning residues from fruit trees and grapevines, as well as other plant-based
byproducts. These materials form a relatively easily usable source of energy and carbon
that can be harnessed through various technologies [
19
]. HEIs with a focus on agriculture,
viticulture, horticulture, or forestry, which often own and manage agricultural or forest
land for research and education purposes, are in a unique situation regarding other options
as they have waste biomass. Hence, these HEIs have the possibility to offset GHG emissions
on their own premises, for example, through carbon sequestration in the form of living
biomass, or organic carbon in the soil, as well as through the production and utilization of
biochar (BC) or the use of silicate rock powder (enhanced weathering) [20,21].
One example of such an agricultural HEI is Hochschule Geisenheim University (HGU),
which is located in the federal state of Hesse in Southwest Germany. HGU focuses on
viticulture, horticulture, and landscape architecture research and education and has over
60 ha of open land, research areas, and parks. According to a resolution of the state
government of Hesse from 2009, the state administration, including all public universities
in Hesse, have to become climate neutral until 2030. By 2020, there was still a gap of 206,966
t CO
2
, or even 357,788 t CO
2
, if the purchasing of additional certificates and other market
instruments were not taken into account [22].
Therefore, the question arises of how HGU can become carbon neutral without relying
on external carbon offsets, but instead by using their own unique resource basis in the
framework of a sustainable circular bioeconomy. To answer this question, the current study
assessed in a first step scope 1, 2, and, as far as these are reported, scope 3 emissions of
HGU. In addition, the available biomass resources were analyzed. We show that even
in the best-case scenario, due to unavoidable emissions, the carbon footprint will not fall
below 594 t CO
2
eq per year. Therefore, carbon dioxide removal (CDR) technologies need
to be implemented if both the objectives of the state for climate neutrality by 2030 in the
administration and the federal goal of CO
2
neutrality by 2045 are to be met. This study
Sustainability 2025,17, 2316 3 of 23
identifies reduction potentials and develops cost-effective pathways to explore how HGU
may become net CO2negative before the year 2030.
For this purpose, we investigate bivalent heating systems—configurations that combine
two different heating technologies to optimize performance across varying load demands. In
such systems, one technology typically serves as the base load provider (covering constant
heating needs), while the second serves peak demand. This approach allows for optimized
sizing and improved operational efficiency compared to single-technology solutions.
We include the investigation of pyrolyzing local residual biomass to generate thermal
energy and biochar, a solid product [
23
]. Pyrolysis is a thermal process in which biomass
is heated in the absence of oxygen and the resulting syngases (mainly CO
2
, CO, H
2
, and
CH
4
) and oils, with their relative proportions determined by feedstock characteristics,
temperature, heating rate, and residence time. These products can be utilized as fossil fuel
substitutes [
24
,
25
]. As no external oxygen is supplied to the process, most carbon undergoes
aromatization and condensation rather than oxidation, resulting in stable carbonaceous
structures [
26
]. Depending on the process design, the gases can also be condensed, result-
ing in a larger fraction of pyrolysis oil, and condensing the oil itself, leads to enhanced
quality [27,28].
This process, known as pyrolysis with carbon capture and storage (PyCCS) or biochar
carbon removal (BCR) [
29
] offers significant environmental benefits, especially when the
biochar is applied in soils such as the reduction of N
2
O emissions [
30
] and the creation
of reliable and permanent carbon sinks [
31
,
32
]. In contrast to other CDR methods, this
technology is permanent, almost irreversible, and, above all, technically mature today
(technology readiness level TRL 9) [33,34].
The carbon sequestered in biochar can be quantified and verified through carbon sink
certificates (C-sink certificates), which document the permanent removal of CO
2
from the
atmosphere, as opposed to conventional carbon credits that typically focus on emission
reductions rather than removal. These certificates follow strict measurement, reporting,
and verification (MRV) protocols established by certification bodies [
31
] to ensure the
permanence and legitimacy of carbon removal claims, making them particularly valuable
for institutions seeking to address unavoidable emissions through verified carbon removal.
2. Materials and Methods
2.1. Study Design and Overview
A case study methodology combined with life cycle assessment principles, techno-
economic modeling, and scenario analysis was employed to assess HGU’s potential transition
from a CO
2
source to a CO
2
sink. The research followed a three-stage approach (
Figure 1
).
First, a comprehensive analysis of the university’s current greenhouse gas emissions was
conducted following the GHG Protocol guidelines, including
scope 1–3 emissions
(scope 3
where data was available). Second, the theoretical and technical biomass potential with a
focus on woody residues from viticulture and horticulture was evaluated through field data
and literature-derived calculations. To assess biomass availability, three spatial scenarios
were established, comprising (a) the HGU activity area, (b) an extended area encompassing
HGU and 3 municipalities, and (c) the Rheingau region.
As a third step, technical and economic feasibility analyses of different heating systems
were performed, with particular attention being paid to hybrid solutions combining pyrol-
ysis with conventional wood chip combustion. The environmental impact was assessed
through carbon sink (i.e., BCR-) potential calculations according to European Biochar Cer-
tificate (EBC) methodology, while economic viability was evaluated using the levelized
cost of energy (LCOE) approach. Both one-at-a-time and multivariate sensitivity analyses
were conducted to test the robustness of the results under varying parameters.

Sustainability 2025,17, 2316 4 of 23
Sustainability 2025, 17, x FOR PEER REVIEW 4 of 25
levelized cost of energy (LCOE) approach. Both one-at-a-time and multivariate sensitivity
analyses were conducted to test the robustness of the results under varying parameters.
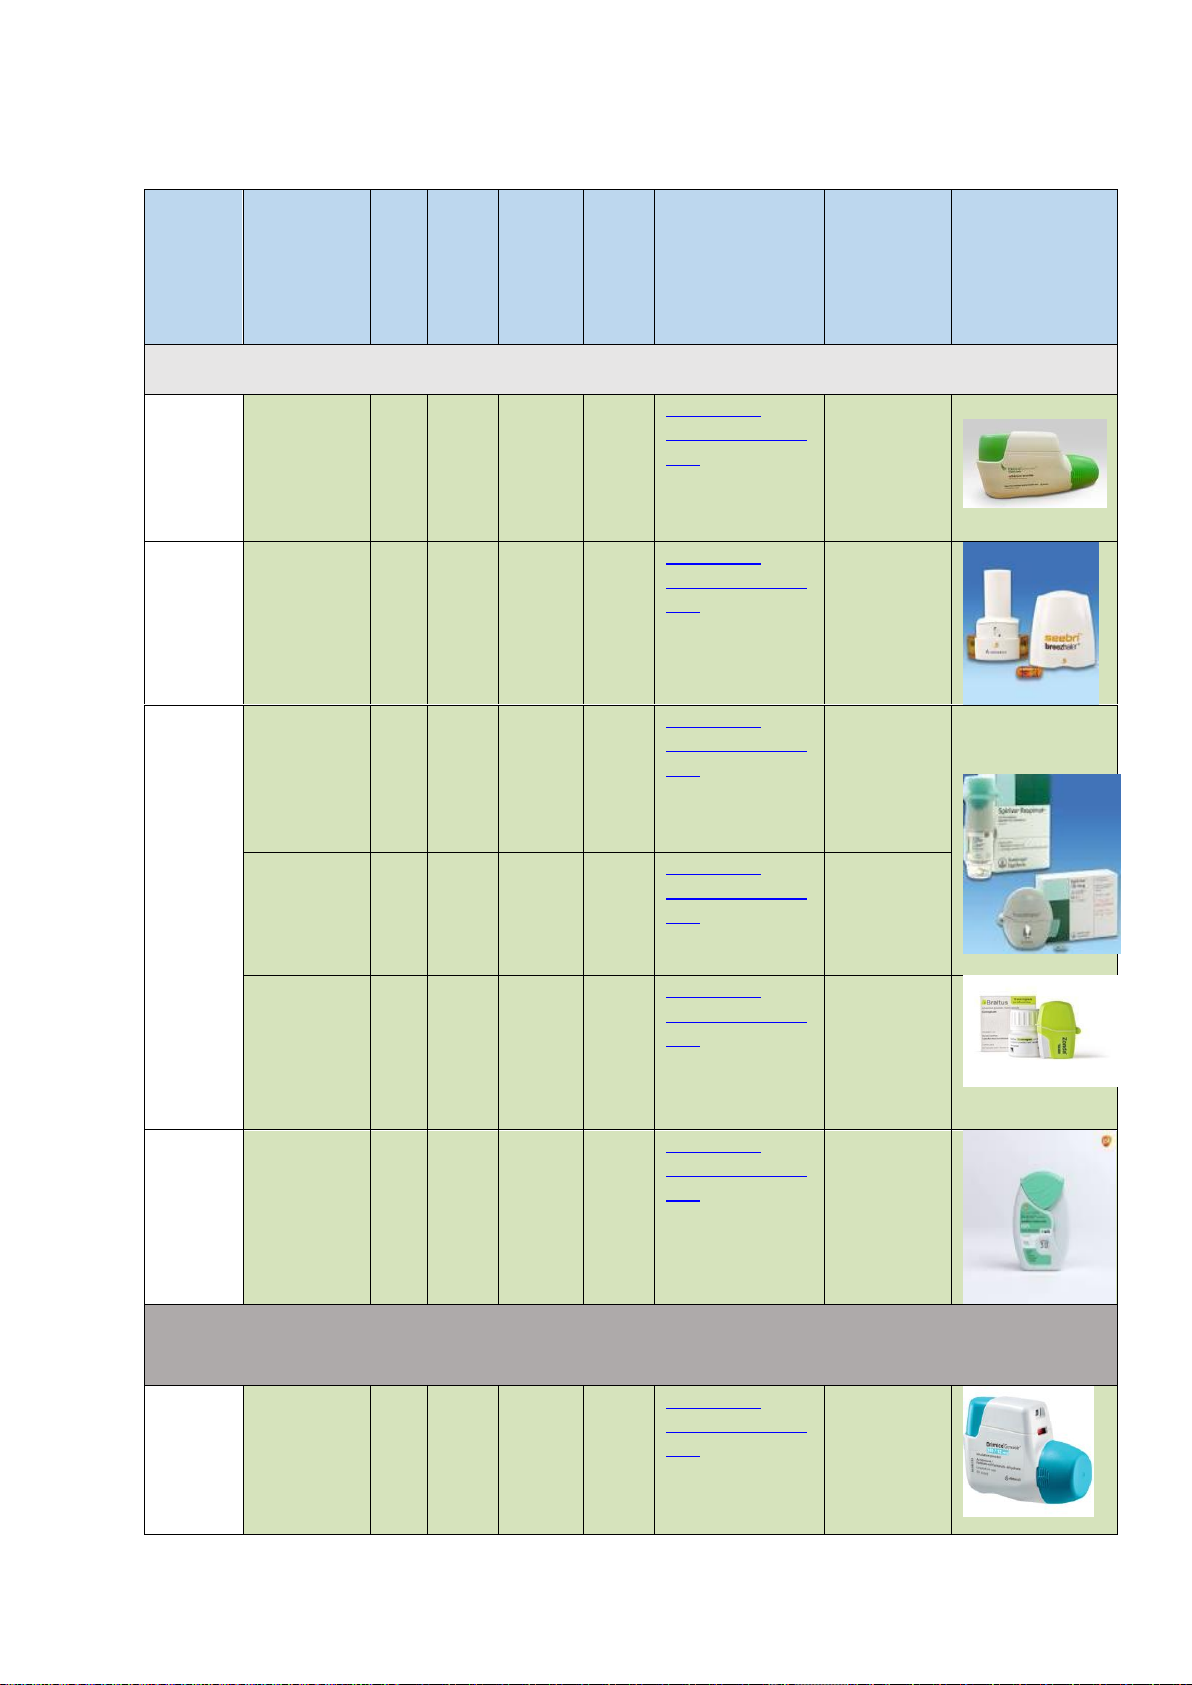
Figure 1. Methodological framework for assessing the transition of Hochschule Geisenheim Uni-
versity from CO2 source to sink. The flowchart illustrates the three-stage analytical approach: (1)
GHG emissions analysis, (2) biomass potential assessment, and (3) technical-economic feasibility
evaluation of heating systems. Green boxes indicate the identified optimal pathway.
2.2. Site Description and Infrastructure
Geisenheim University was founded in 1872 by Eduard von Lade as the “Royal Col-
lege for Fruit and Wine Growing in Geisenheim”, with the first buildings dating back to
this time. Over time, the university expanded, and since 2013, Geisenheim University has
been established as a new type of technical university with PhD granting status. In 2022,
the portfolio comprised more than 50 buildings of all types (from transformer housings to
institute buildings) from different construction periods and with varying energy effi-
ciency levels. Between 2024 and 2026, 5 new buildings will be added, including training,
laboratory, and lecture hall buildings.
The property is divided into three energy supply clusters (Figure 2). The central cam-
pus (cluster CC) represents the largest cluster, generating the highest energy demand for
both electricity and heat. This area includes 4500 m² of greenhouse cultivation area, the
largest institute building with laboratories, the majority of administrative buildings and
lecture halls, as well as the canteen and library. The viticulture/oenology institute build-
ings are located to the east (cluster VO), while the Department of Plant Breeding (cluster
PB) is situated to the west, both featuring smaller lecture and laboratory facilities. Addi-
tional buildings on campus are supplied with heat and electricity on a decentralized basis.
Each cluster contains one building with oil or liquified gas heating scheduled for replace-
ment, though these are negligible regarding the CO2 balance (<0.5% of scope 1).
Figure 1. Methodological framework for assessing the transition of Hochschule Geisenheim Univer-
sity from CO
2
source to sink. The flowchart illustrates the three-stage analytical approach: (1) GHG
emissions analysis, (2) biomass potential assessment, and (3) technical-economic feasibility evaluation
of heating systems. Green boxes indicate the identified optimal pathway.
2.2. Site Description and Infrastructure
Geisenheim University was founded in 1872 by Eduard von Lade as the “Royal College
for Fruit and Wine Growing in Geisenheim”, with the first buildings dating back to this
time. Over time, the university expanded, and since 2013, Geisenheim University has been
established as a new type of technical university with PhD granting status. In 2022, the
portfolio comprised more than 50 buildings of all types (from transformer housings to
institute buildings) from different construction periods and with varying energy efficiency
levels. Between 2024 and 2026, 5 new buildings will be added, including training, laboratory,
and lecture hall buildings.
The property is divided into three energy supply clusters (Figure 2). The central
campus (cluster CC) represents the largest cluster, generating the highest energy demand
for both electricity and heat. This area includes 4500 m
2
of greenhouse cultivation area,
the largest institute building with laboratories, the majority of administrative buildings
and lecture halls, as well as the canteen and library. The viticulture/oenology institute
buildings are located to the east (cluster VO), while the Department of Plant Breeding
(cluster PB) is situated to the west, both featuring smaller lecture and laboratory facilities.
Additional buildings on campus are supplied with heat and electricity on a decentralized
basis. Each cluster contains one building with oil or liquified gas heating scheduled for
replacement, though these are negligible regarding the CO2balance (<0.5% of scope 1).
Currently, almost 100% of heat is provided by fossil gas, generated centrally by boilers
for each cluster. The heating system in CC will be modeled for renewable heat generation
in this study. The other heating systems in clusters VO and GB are assumed to be switching
to wood chips (WC) in 2029 due to their expected end of life. After generation, energy is
distributed to individual buildings via local heating networks. The university operates four
electrical transformer stations that step down the incoming medium voltage to low voltage
levels required for building operations and laboratory equipment, one in each of the plant
breeding and viticulture clusters, and two on the central campus.

Sustainability 2025,17, 2316 5 of 23
Sustainability 2025, 17, x FOR PEER REVIEW 5 of 25
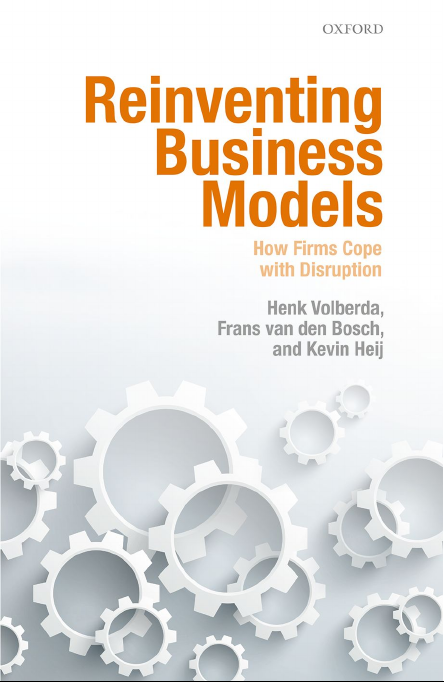
Figure 2. Spatial distribution of energy supply clusters at Hochschule Geisenheim University cam-
pus. The three main clusters are: central campus (CC) with primary energy demand, viticul-
ture/oenology (VO) in the east, and Plant Breeding (PB) in the west. Colored areas represent dis-
tinct heating networks with current fossil (also known as natural) gas supply infrastructure.
Currently, almost 100% of heat is provided by fossil gas, generated centrally by boil-
ers for each cluster. The heating system in CC will be modeled for renewable heat gener-
ation in this study. The other heating systems in clusters VO and GB are assumed to be
switching to wood chips (WC) in 2029 due to their expected end of life. After generation,
energy is distributed to individual buildings via local heating networks. The university
operates four electrical transformer stations that step down the incoming medium voltage
to low voltage levels required for building operations and laboratory equipment, one in
each of the plant breeding and viticulture clusters, and two on the central campus.
The transmission infrastructure for heat (local heating network) and electricity (trans-
formers and supply lines) is crucial for the university’s future energy supply, enabling
reduced transmission losses and distribution of self-generated energy through photovol-
taic systems on campus.
2.3. System Boundaries and Greenhouse Gas Accounting
The system boundaries for GHG accounting were defined spatially, temporally, and
operationally. The spatial boundaries include all university-owned and -operated facili-
ties within the main campus (approx. 60 ha), including buildings, technical infrastructure,
agricultural areas (vineyards, orchards, experimental fields), campus greenhouses, and
university-owned vehicles. The principles of GHG accounting were established in the
Greenhouse Gas Protocol and shaped in the ISO 14064-1:2006, following three central
principles: completeness (inclusion of all relevant sources), relevance (consideration of
significant gases and activities), and comparability, accuracy, transparency and reproduc-
ibility [35,36].
Within these boundaries, all activities were categorized according to the GHG Proto-
col scope definitions:
Figure 2. Spatial distribution of energy supply clusters at Hochschule Geisenheim University campus.
The three main clusters are: central campus (CC) with primary energy demand, viticulture/oenology
(VO) in the east, and Plant Breeding (PB) in the west. Colored areas represent distinct heating
networks with current fossil (also known as natural) gas supply infrastructure.
The transmission infrastructure for heat (local heating network) and electricity (trans-
formers and supply lines) is crucial for the university’s future energy supply, enabling
reduced transmission losses and distribution of self-generated energy through photovoltaic
systems on campus.
2.3. System Boundaries and Greenhouse Gas Accounting
The system boundaries for GHG accounting were defined spatially, temporally, and
operationally. The spatial boundaries include all university-owned and -operated facilities
within the main campus (approx. 60 ha), including buildings, technical infrastructure,
agricultural areas (vineyards, orchards, experimental fields), campus greenhouses, and
university-owned vehicles. The principles of GHG accounting were established in the
Greenhouse Gas Protocol and shaped in the ISO 14064-1:2006, following three central princi-
ples: completeness (inclusion of all relevant sources), relevance (consideration of significant
gases and activities), and comparability, accuracy, transparency and reproducibility [
35
,
36
].
Within these boundaries, all activities were categorized according to the GHG Protocol
scope definitions:
•Scope 1: Direct emissions from university-owned facilities and vehicles;
•Scope 2: Indirect emissions from purchased electricity and district heating;
•
Scope 3: Other indirect emissions, although it should be noted that scope 3 has not yet
been recorded in sufficient detail to enable full reporting.
Calendar year 2019 was chosen as the reference year as 2020 and 2021 were character-
ized by the global COVID-19 pandemic and 2022 by the Russian war of aggression against
Ukraine. Due to Germany’s dependence on Russian gas, this had a major impact on the
supply situation and the global market price and resulted in federal legislative ordinances

Sustainability 2025,17, 2316 6 of 23
on energy saving. Osorio et al. [
37
] estimate that scope 3 emissions account for 37% of
total emissions at higher education institutions. However, such percentage estimates of
scope 3 emissions should be interpreted with caution as they are highly dependent on the
magnitude of scope 1 and 2 emissions at individual institutions. Klein-Banai and Theis [
38
]
found that an institution’s GHG emissions are a function of the size of the institution
(building area and number of students), number of laboratories, and other factors. For this
study, the CO
2
emission factors were taken from the GEMIS database and can be found in
Table 1.
Table 1. CO
2
-equivalent emission factors and annual energy consumption at Hochschule Geisenheim
University in 2019. LNG = liquified natural gas, RE = renewable energy, PV poly. = polycrystal photovoltaic.
Type Emission Factor
(kg CO2*kWh−1)MWh Consumed (2019) Database
Fossil gas 0.2378 8620 GEMIS 5.1
LNG 0.2378 27 GEMIS 5.0
Biomethane (manure/maize)
0.13274 0 GEMIS 5.0
Electricity (RE, hydropower)
0.0375 4325 Energy Provider
Electricity (PV poly.) 0.04 0 GEMIS 5.1
Electricity (mix 2019) 0.411 0 Statista
wood chips 0.0223 0 GEMIS 5.1
Due to local conditions, some emission sources are particularly relevant or negligible
at HGU. For example, the fertile soils in Rheingau make additional fertilization in perennial
crops like grapevine and fruits obsolete, so no additional nitrogen fertilizer has been applied
since 2018. Conversely, around 15% of the campus’ heating demand is attributed to heating
the greenhouses.
2.4. Biomass Assessment
The assessment of available biomass resources was conducted across three defined
collection areas. The first collection area comprised exclusively the biomass available on
the Geisenheim University premises and through its activities. The second collection area
considered the biomass of the three directly neighboring municipalities of Rüdesheim,
Geisenheim, and Oestrich-Winkel (approx. 2138 ha of vineyards). The third collection area
included the total biomass of the “Rheingau” wine-growing region (3200 ha of vineyards).
The theoretical potential of biomass was determined based on dry matter (DM) by
combining literature values and on-site pruning residue harvest determined in long-term
trials by the Institute of Viticulture and the Institute of Plant Nutrition and Soil Science
of Geisenheim University [
24
,
39
–
42
]. Technical potential was calculated accounting for
physical collection losses of 19% during mechanical harvesting and baling operations
(e.g., material left on the ground, losses during baling process) [
41
,
43
]. The calculation
of the stem wood produced was based on a standing time of 25 years for the vineyards
and orchards.
Additional biomass sources were evaluated from bundle wood collections, where non-
compostable, woody branches and trunks up to a length of 1.5 m can be handed in by citi-
zens. According to Richter and Raussen [
44
], this results in approx. 60 kg/inhabitant/year
of material throughout Germany.
“Soft” biomass, such as pomace from wine production, is not considered in this
study. In principle, anaerobic digestion of pomace in a biogas plant would enable energy
production, but the space required is large, the investment costs high and the associated
logistic flows impractical for the densely built-up university [45,46].

Sustainability 2025,17, 2316 7 of 23
2.5. Biomass Utilization and Carbon Sink Potential
This study investigated the effects of utilizing local ligneous biomass in a pyrolysis
plant on Geisenheim University’s carbon balance. The analysis assumed a biochar mass
yield of 19% (w/w) at a pyrolysis temperature of 600
◦
C [
47
]. Biochar offers a wide range
of utilization options. For example, biochar use in agriculture, composting, and animal
husbandry (feeding, bedding) has already been extensively scientifically examined [
21
,
23
].
Industrial applications, such as admixture as an additive in concrete, cement, and asphalt,
reduce the carbon footprint, can enhance material properties of the mixed products (or
both), and are practiced by start-up companies [48,49].
During pyrolysis, approximately 50–70% of the feedstock carbon is converted to syngas
or condensable vapors (pyrolysis oil), depending on the reactor type and process conditions.
The non-condensable gases are subsequently combusted to generate heat and maintain the
process, releasing biogenic CO
2
emissions [
32
]. The remaining carbon is stabilized in the
solid biochar fraction, resulting in lower overall heat yield compared to conventional wood
chip heating systems where the entire feedstock undergoes complete oxidation.
While pyrolysis is initially an endothermic process requiring energy input for startup,
commercial systems can achieve substantial heat generation once operational. For this
study, calculations were based on parameters from existing commercial pyrolysis units
designed for regular operation, specifically the C500-I system by Biomacon, which converts
biomass to heat with approximately 59% efficiency (ratio of nominal thermal output to
feedstock energy content) [50].
However, the fixation of the carbon contained in the biomass through pyrolysis
effectively enables CO
2
to be removed from the atmosphere. This is achieved by converting
the CO
2
originally removed from the atmosphere by the plant into biochar, thereby fixing
atmospheric carbon in a solid, persistent form [
26
]. Provided that it is ensured that the
carbon fixed in the biochar does not return to the atmosphere (e.g., through combustion), it
is possible to certify and trade the fixed CO
2
in the form of C-sink certificates [
31
]. These
certificates can be sold in voluntary CO2markets or used to offset unavoidable emissions.
According to the calculation method for carbon sinks defined by the European Biochar
Certificate [
31
] the C-sink potential for biochar produced at Geisenheim University was
calculated. This calculation incorporated:
•Collection and baling diesel consumption;
•Transport diesel consumption;
•Chipping electricity demand;
•Carbon content of grapevine pruning biochar;
•Collection and transport carbon efficiency;
•Biochar production carbon efficiency (CE);
•Safety margins of 10%.
2.6. Heating System Analysis
The heating demand analysis was based on hourly load profiles, which were recorded
and analyzed for the years 2018 to 2022. For system optimization, ordered annual load
curves were generated to determine base and peak load requirements. For the comparative
assessment, six system variants were analyzed. These comprised a fossil gas system
(Reference System), a biomethane system (BM), a pure wood chip firing system (WC), a
pure pyrolysis system (PY), and two hybrid systems combining pyrolysis base load with
wood chip peak load boilers. The hybrid systems were configured as 1.5 MW pyrolysis
with 3.0 MW wood chip (PY15/WC30) and 2.0 MW pyrolysis with 2.5 MW wood chip
(PY20/WC25) capacity.

Sustainability 2025,17, 2316 8 of 23
Operating parameters for all systems were derived from manufacturer specifications
and validated using literature values from Möhren et al. [
51
]. The detailed parameters are
provided in the Supplementary Materials, Table S1, Sheet ‘Technologies’.
Additionally, the analysis included a localized sourcing scenario in which 100% of
the biomass feedstock was obtained within a maximum transportation radius of 10 km,
thereby substantially reducing fuel costs associated with transportation. The economic
analysis followed the methodology of DIN 2067 [52].
This methodology incorporates investment costs including base installation costs,
peripheral equipment, and planning. Operating costs were determined by considering
maintenance (3% of total investment annually) and fuel costs (0.05 EUR/kWh for wood
chips purchased). Personnel requirements apply only in proportion to an increased effort in
handling residual biomasses in PY scenarios. Additional revenue streams from carbon sink
certificates, heat sales, and biochar market value were incorporated into the calculation. A
period of 20 years was considered and prices were adjusted with an annual increase of 2%.
The calculation sheet with detailed calculations and additional parameters are provided in
Supplementary Table S1, Sheet ‘Calculations’.
The necessary prices for CO
2
to reach the EU’s emission reduction goals were derived
from Pietzcker et al. [
53
] and revenues for the sequestration of carbon on the voluntary
market for BCR were estimated according to Carbonfuture GmbH [
54
] to EUR 200 in 2026.
The 2045 price of EUR 300 is in accordance with the mean of the projected price of a ton
of CO
2
removed by direct air capture (DAC) [
55
]. The proposed system does not include
revenues from the sale of biochar in the first five years, as this serves as an incentive for
biomass suppliers to participate in the exchange system in the early years.
The operating costs consist of costs for maintenance and servicing, fuel supply, and
CO
2
emissions; in the case of pyrolysis solutions, revenues from carbon sink trading
are added. The decision variable is the heat generation price (EUR/MWh), which was
calculated according to the widely used levelized cost of energy (LCOE) approach [56,57].
For sensitivity analysis, eight key parameters were identified and varied within de-
fined boundaries as shown in Table 2. Both one-at-a-time (OAT) and multivariate analyses
were performed to assess result robustness.
Table 2. Parameter ranges for one-at-a-time (OAT) sensitivity analysis of the PY20/WC25 hybrid heating
system scenario. Upper and lower boundaries were established based on current market data and future
projections. (*) CO2credit price variation applies exclusively to the pure wood chip (WC) scenario.
Parameter Unit Lower Boundary Upper Boundary
Maintenance costs % −50% 50%
Price C-Sink Certificate EUR 100 300
Price CO2Credit * EUR 50 190
Planning/Engineering overheads % −20% 20%
Price biochar EUR 100 500
Price biomass EUR 0.05 0.1
Heat production MWh 4500 10,000
Share of locally sourced biomass % 0% 100%
2.7. C-Sink Calculation Scheme
CO
2
certificates usually certify the reduction of emissions compared to a reference
scenario and thus contribute to the avoidance of emissions. A fully certified carbon sink
guarantees the traceable storage of carbon at all times and results from the active removal
of CO
2
from the atmosphere. CDR or negative emissions (NET) are vital to limit global
warming to 2 ◦C [58]. Carbon sinks are created according to the following scheme:
1. Removal of CO2from the atmosphere;
2. Conversion of the carbon into a stable form;

Sustainability 2025,17, 2316 9 of 23
3. Storage in soil or materials.
To calculate the carbon footprint of biochar produced at the university, the Euro-
pean Biochar Certificate (EBC) was developed in 2020 in Switzerland as a methodology
to determine the sink potential [
31
]; EBC C-sink is now hosted by Carbon Standards
International (1)
. Following the measurement, reporting, and verification (MRV) principles,
C-sink certificates are tradable on the voluntary carbon market.
(1) https://www.carbon-standards.com/de/home
In fact, of the top 40 companies delivering CDR, 30 were biochar producers (https:
//www.cdr.fyi/leaderboards, accessed on 7 January 2025).
2.8. Sensitivity Analysis
To assess the robustness of the economic analysis, both one-at-a-time (OAT) and multi-
variate sensitivity analyses were conducted. For the OAT analysis, eight parameters were
identified as potentially influential factors affecting the levelized cost of energy (LCOE). The
parameter ranges for the analysis were defined based on current market data and future pro-
jections (Table 2). The PY20/WC25 scenario was selected as the reference case for detailed
analysis, as it achieved the highest carbon sequestration rate of
1.656 t CO2eq*year−1
while
maintaining heat production costs at the same level as the wood chip reference scenario,
representing an optimal compromise between environmental and economic objectives.
For the multivariate analysis, parameter combinations were systematically varied
within their defined ranges to investigate potential interaction effects. The complete analysis
methodology and parameter boundaries are documented in the
Supplementary Materials
.
3. Results
3.1. Carbon Footprint Analysis
The analysis of Geisenheim University’s carbon footprint revealed that heat generation
was the dominant source of emissions throughout the observation period (Table 3). Despite
increasing student and employee numbers, total emissions showed a declining trend from
2019 to 2022. This reduction was particularly pronounced in 2022, mainly due to decreased
heating energy consumption following the implementation of energy-saving measures in
response to the energy price crisis/the Ukrainian war. The pandemic years 2020 and 2021
showed significantly reduced scope 3 emissions due to travel restrictions.
These findings identify heat generation as the key leverage point for achieving the
university’s emission reduction goals.
Table 3. Annual greenhouse gas emissions of Hochschule Geisenheim University from 2018 to 2022,
categorized by emission scopes according to Section 2.3. Values are presented in t CO
2
eq*year
−1
, with
percentage distribution across scopes. Institutional metrics including student numbers, employee
count, and facility area are provided for contextual reference.
Scope 2018 % 2019 % 2020 % 2021 % 2022 %
1 Heat generation 1965 2071 2023 2179 1628
1 Vehicle Fuels 99 90.3 100 87.2 71 94.2 70 95.0 71 90.9
2 Electricity 128 5.6 162 6.5 117 5.3 110 4.7 118 6.3
3 Air travel 86 147 8 3 46
Water 6 4.0 11 6.3 5 0.6 4 0.3 5 2.7
Total 2285 2502 2234 2366 1868
Students 1655 1750 1750 1750 1750
Employees 404 450 542 542 542
area (m2)50,579 50,579 50,579 50,579 50,579

Sustainability 2025,17, 2316 10 of 23
3.2. Biomass Availability
The assessment of biomass resources across the three defined collection areas revealed
substantial differences in potential availability (Table 4).
Table 4. Technical biomass potential from viticulture residues and municipal biomass collection
across Rheingau region municipalities. Data includes municipality characteristics (population, total
area), vineyard area, and calculated biomass availability from different sources. All biomass values
are reported as dry matter (DM) in metric tons per year. n.a. = not applicable.
Municipality Inhabitants Total Area
(km2)
Vinyard Area
(ha) *
Biomass Viticulture
(t)
Mun. Biomass Collection
(t)
Biomass Total
(t)
HGU n.a. n.a. 33 68 76 144
Rüdesheim 10,054 51.41 652 1344 302 1646
Geisenheim 11,699 40.34 512 1055 351 1406
Oestrich-Winkel 11,873 59.51 1019 2100 356 2457
Subtotal 3 municipalities 151 2183 4567 1009 5651
Kiedrich 4075 12.34 157 323 122 445
Eltville 8476 10.08 128 264 254 518
Martinsthal 1226 4.73 60 124 37 160
Rauenthal 1800 7.27 92 190 54 244
Erbach 3429 12.69 161 332 103 435
Hattenheim 2181 12.00 152 314 65 379
Walluf 5523 6.75 86 176 166 342
Lorch 4017 54.43 182 375 121 496
Total Rheingau (all municip.) 272 3200 6664 1931 8670
* = If there were no data available, the cultivation area was estimated based on a municipality’s total area as a
share of the total area of the Rheingau.
For vineyards, the long-term biomass yield was calculated as 2.12 t DM*ha
−1
*year
−1
of pruning residues, minus 19% harvesting losses, plus 8.6 t DM*ha
−1
of stem wood
from vineyard replacement every 25 years. This resulted in an average annual technical
potential of 2.06 t DM*ha
−1
*year
−1
for vineyard areas. These values represented long-
term averages from multi-year field trials, and unlike annual crops, perennial vineyards
exhibited minimal seasonal fluctuations in biomass production, providing a reliable and
consistent feedstock source.
The university grounds alone provided a technical biomass potential of 144 t DM*year
−1
.
Expanding the collection radius to include the three neighboring municipalities of
Rüdesheim, Geisenheim, and Oestrich-Winkel increased the technical biomass potential
to 5651 t DM*year
−1
. The full Rheingau region showed a technical biomass potential of
8670 t DM*year−1.
These findings indicate that biomass availability within a 10 km radius of the university
campus is sufficient to sustain the proposed heating systems, with the potential to establish
multiple comparable units before encountering biomass supply limitations. The proximity
of the biomass sources to the university ensures favorable transport logistics and maintains
low associated emissions.
3.3. Heating System Performance
Analysis of the ordered load profiles revealed that the heating demand rarely reached
maximum capacity. The peak load of 3.24 MW occurred only once during the observation
period in 2021 (Table 5), while 90.55% of the heating demand was below 1.5 MW (Figure 3).

Sustainability 2025,17, 2316 11 of 23
Table 5. Historical heating load analysis and proposed generation allocation for the central campus
cluster (2018–2022). Data show power demand distribution and corresponding energy consump-
tion across load ranges, with mean values and proposed technology assignment (PY = pyrolysis,
WC = wood
chip combustion). All power values in kW, and energy values in kWh. n.a. = not applicable.
2018 2019 2020 2021 2022 Mean Proposed
Power Energy Energy Energy Energy Energy Energy Generation
500 630,157 624,149 750,404 453,636 629,973 617,664 PY
1000 1,356,316 1,556,154 1,670,776 1,663,317 1,616,567 1,572,626 PY
1500 2,330,150 2,565,807 2,450,804 2,628,596 1,731,281 2,341,328 PY
2000 1,333,699 1,222,191 914,787 1,303,106 629,572 1,080,671 PY
3000 316,658 228,003 43,074 212,201 40,068 168,001 WC
4500 0 0 0 3245 0 649 WC
Total energy 5,966,980 6,194,804 5,829,846 6,264,100 4,647,460 n.a. n.a.
Min power 0 0 0 0 0 n.a. n.a.
Max power 2743 2866 2469 3245 2457 n.a. n.a.
Av. power 682 707 666 715 531 n.a. n.a.
Med. power 575 654 602 739 413 n.a. n.a.
Sustainability 2025, 17, x FOR PEER REVIEW 12 of 25
Walluf 5523 6.75 86 176 166 342
Lorch 4017 54.43 182 375 121 496
Total Rheingau (all municip.) 272 3200 6664 1931 8670
* = If there were no data available, the cultivation area was estimated based on a municipality’s
total area as a share of the total area of the Rheingau.
3.3. Heating System Performance
Analysis of the ordered load profiles revealed that the heating demand rarely
reached maximum capacity. The peak load of 3.24 MW occurred only once during the
observation period in 2021 (Table 5), while 90.55% of the heating demand was below 1.5
MW (Figure 3).
Table 5. Historical heating load analysis and proposed generation allocation for the central cam-
pus cluster (2018–2022). Data show power demand distribution and corresponding energy con-
sumption across load ranges, with mean values and proposed technology assignment (PY = pyrol-
ysis, WC = wood chip combustion). All power values in kW, and energy values in kWh. n.a. = not
applicable.
2018 2019 2020 2021 2022 Mean Proposed
Power Energy Energy Energy Energy Energy Energy Generation
500 630,157 624,149 750,404 453,636 629,973 617,664 PY
1000 1,356,316 1,556,154 1,670,776 1,663,317 1,616,567 1,572,626 PY
1500 2,330,150 2,565,807 2,450,804 2,628,596 1,731,281 2,341,328 PY
2000 1,333,699 1,222,191 914,787 1,303,106 629,572 1,080,671 PY
3000 316,658 228,003 43,074 212,201 40,068 168,001 WC
4500 0 0 0 3245 0 649 WC
Total energy 5,966,980 6,194,804 5,829,846 6,264,100 4,647,460 n.a. n.a.
Min power 0 0 0 0 0 n.a. n.a.
Max power 2743 2866 2469 3245 2457 n.a. n.a.
Av. power 682 707 666 715 531 n.a. n.a.
Med. power 575 654 602 739 413 n.a. n.a.
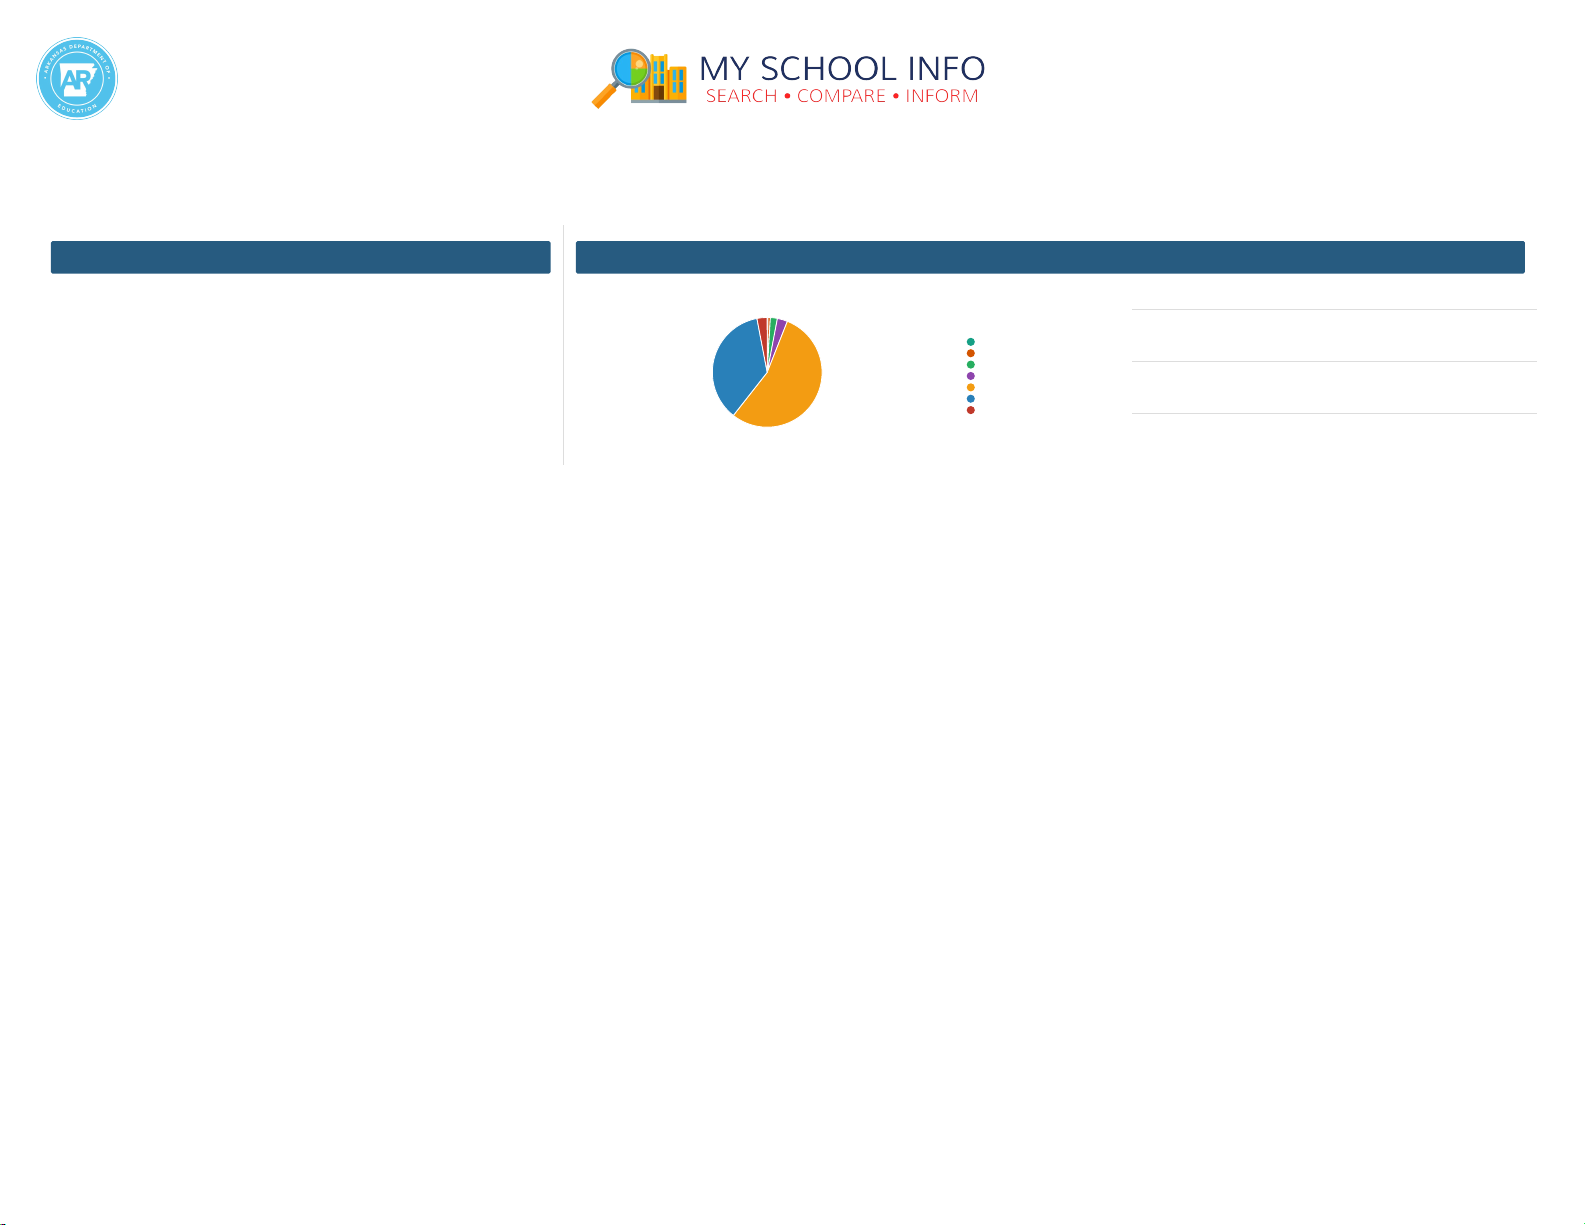
Figure 3. Annual heat load duration curve for the central campus cluster in 2019. The curve
demonstrates that 90.55% of the annual heating demand occurs below 1.5 MW capacity, with peak
Frequency (h*y
−1
)
Figure 3. Annual heat load duration curve for the central campus cluster in 2019. The curve
demonstrates that 90.55% of the annual heating demand occurs below 1.5 MW capacity, with peak
loads reaching a maximum of 2.87 MW. This load distribution pattern supports the design rationale
for a hybrid heating system.
3.4. Optimized Heating System
The comparative analysis of different heating systems revealed distinct performance
profiles (Table 6). All pyrolysis-based systems demonstrated significant carbon dioxide
removal potential, though their economic performance varied. The reference fossil gas
and biomethane (BM) systems, despite being technically simple, showed LCOE of 188 and
197 EUR/MWh
respectively. Pure wood chip firing (WC) achieved 198 EUR/MWh, while
pure pyrolysis (PY) reached 287 EUR/MWh but provided the highest carbon removal at
−36,376 t CO2eq.

Sustainability 2025,17, 2316 12 of 23
Table 6. Technical–economic comparison of heating system alternatives following DIN 2067 methodology. Analysis includes system specifications, invest-
ment requirements, operational parameters, and environmental impact metrics across different technology configurations. PY = Pyrolysis,
WC = Wood
Chips,
BM = Biomethane, * water content. n.a. = not applicable.
Reference BM WC PY45 PY10/WC35 PY20/WC25 PY20/WC25 (II.)
Plant 1 Cond. boiler Cond. boiler wood chip boiler PY plant PY plant PY plant PY plant
Hybrid System no no no no yes yes yes
Plant 2 n.a. n.a. n.a. n.a. WC boiler WC boiler WC boiler
Plant 1 power (kW) 4500 4500 4500 4500 1000 2000 2000
Plant 1 energy (MWh) 6150 6150 6150 6150 2200 5600 5600
Plant 2 Power (kW) n.a. n.a. n.a. n.a. 3500 2500 2500
Plant 2 energy (MWh) n.a. n.a. n.a. n.a. 3950 550 550
Local fuel % (residues) 0% 0% 0% 0% 0% 35% 100%
Energy source plant 1 natural gas biomethane wood chips wood chips wood chips 35% local bm local bm
Energy source plant 2 n.a. n.a. n.a. n.a. wood chips wood chips local bm
Period of use (a) 20 20 20 20 20 20 20
Investment per kW/EUR 141.37 141.37 594.93 1225.00 734.95 874.96 874.96
Total investment/EUR 1,463,180 1,463,180 6,157,548 12,678,750 7,606,704 9,055,860 9,055,860
Total project costs/EUR 23,127,425 24,183,942 24,321,639 35,530,299 27,783,204 24,475,103 16,308,901
Amortization (a) >20 >20 >20 >20 >20 18.6
LCOE (EUR/MWh) 188 197 198 289 226 199 133
Emissions Plant 1 (t CO2eq.) 1746 938 109 −1769 −633 −1611 −1611
Emissions Plant 2 (t CO2eq.) 0 0 0 0 70 10 10
Total emissions (t CO2eq) 34,921 18,767 2171 −35,380 −11,262 −32,022 −32,022
Biochar produced (t/a) n.a. n.a. n.a. 701 251 638 638
Biomass demand t/a (@20%) * n.a. n.a. 1855 2673 2148 2600 2600
Abbreviations: as above, PY10/WC35 = bivalent system of 1000 kW Pyrolysis and 3500 kW Wood Chip, PY20/WC25 = bivalent system of 2000 kW Pyrolysis and 2500 kW Wood Chip,
PY20/WC25 (II.) = biomass is delivered according to the system proposed.

Sustainability 2025,17, 2316 13 of 23
Hybrid systems combining pyrolysis with wood chip boilers showed improved per-
formance characteristics. The smaller hybrid configuration (PY10/WC35) achieved a
carbon removal of
−
11,619 t CO
2
eq but at an above-average LCOE of 225 EUR/MWh.
The larger hybrid system (PY20/WC25) emerged as optimal, removing
−
32,929 t CO
2
eq
while maintaining an LCOE of 198 EUR/MWh when partially supplied with residual
biomass—comparable to the pure wood chip system.
The economic performance improved substantially when operating with locally
sourced biomass (PY20/WC25 II), reducing LCOE to 131 EUR/MWh. This configura-
tion requires approximately 2600 t of annual biomass input to produce 638 t of biochar,
aligning with the identified local biomass availability.
3.5. C-Sink Calculation
According to the calculation method for carbon sinks defined in [
31
], the C-sink poten-
tial for biochar produced at Geisenheim University was calculated to be 70.75%. For param-
eters used see Table 7; the entire calculation is provided in the
Supplementary Materials
,
Table S1, sheet ‘C-Sink potential’. This means that after calculating the carbon expenditure
(CE) for providing the biomass and producing the biochar, 1000 kg of BC contains 707.5 kg
of net sequestered carbon or 2594 kg CO
2
eq of tradeable C sinks. Depending on the capacity
of the pyrolysis plant, this results in up to 1656 t C-sink certificates or 638 t of BC annually.
The certification of the C-sinks can be achieved through a contractual agreement with the
biomass supplier. He receives an equivalent in biochar for the biomass supplied, which
must then be mixed with pomace or co-composted and incorporated into the supplier’s
agricultural soil to convert the sink potential into a verified C-sink.
Table 7. Parameters and emission factors used in carbon sink potential calculations for biochar produc-
tion from vineyard pruning residues. Values include operational energy requirements, carbon content
specifications, and efficiency factors according to the European Biochar Certificate methodology [
31
].
CE = carbon expenditure. n.a. = not applicable.
Parameter Type Unit Amount Source
collecting and baling diesel liter 5.5 [59]
transport 10 km diesel liter 8.6 [59]
chipping electricity kWh 30 own measurements
Carbon content grapevine prunings biochar % 75 [24,60]
CE collection and transport n.a. % 1.58 Supplementary Materials, Table S1, Sheet ‘C-Sink Potential’
CE production biochar n.a. % 2.26 Supplementary Materials, Table S1, Sheet ‘C-Sink Potential’
CE safety margin n.a. % 0.38 Supplementary Materials, Table S1, Sheet ‘C-Sink Potential’
3.6. Economic Analysis and Sensitivity Assessment
The economic feasibility analysis revealed significant variations in investment require-
ments and operating costs across the systems. Initial investments ranged from 141 EUR/kW
for conventional systems to 1225 EUR/kW for pyrolysis-based configurations, resulting in
total investments of between EUR 1.5 and 12.7 million. The amortization period of 18.5 years
for the PY20/WC25 systems reflects the significant initial investment but demonstrates
long-term economic viability when considering the complete lifecycle costs and revenues.
The system’s revenue streams are derived from three main sources: reduced fuel costs
through biomass utilization, sales of certified carbon removal certificates, and marketing
of the produced biochar. These revenue components significantly influence the overall
economic viability of the system.
The sensitivity analysis identified the share of locally sourced biomass and heat
production as the most influential parameters affecting the LCOE (Figure 4). A shift from
0% to 100% local biomass resulted in an LCOE reduction of 77 EUR/MWh from the base
case. Similarly, increasing heat production from 4500 to 10,000 MWh/year, decreased the

Sustainability 2025,17, 2316 14 of 23
LCOE by 73 EUR/MWh. Other parameters showed less significant impacts: planning and
engineering overheads demonstrated a moderate impact range of
−
25 to +42 EUR/MWh,
while maintenance costs showed the lowest sensitivity with deviations between
−
15 and
+13 EUR/MWh from the base case.
Sustainability 2025, 17, x FOR PEER REVIEW 15 of 25
demonstrates long-term economic viability when considering the complete lifecycle costs
and revenues.
The system’s revenue streams are derived from three main sources: reduced fuel
costs through biomass utilization, sales of certified carbon removal certificates, and mar-
keting of the produced biochar. These revenue components significantly influence the
overall economic viability of the system.
The sensitivity analysis identified the share of locally sourced biomass and heat pro-
duction as the most influential parameters affecting the LCOE (Figure 4). A shift from 0%
to 100% local biomass resulted in an LCOE reduction of 77 EUR/MWh from the base case.
Similarly, increasing heat production from 4500 to 10,000 MWh/year, decreased the LCOE
by 73 EUR/MWh. Other parameters showed less significant impacts: planning and engi-
neering overheads demonstrated a moderate impact range of −25 to +42 EUR/MWh, while
maintenance costs showed the lowest sensitivity with deviations between −15 and +13
EUR/MWh from the base case.
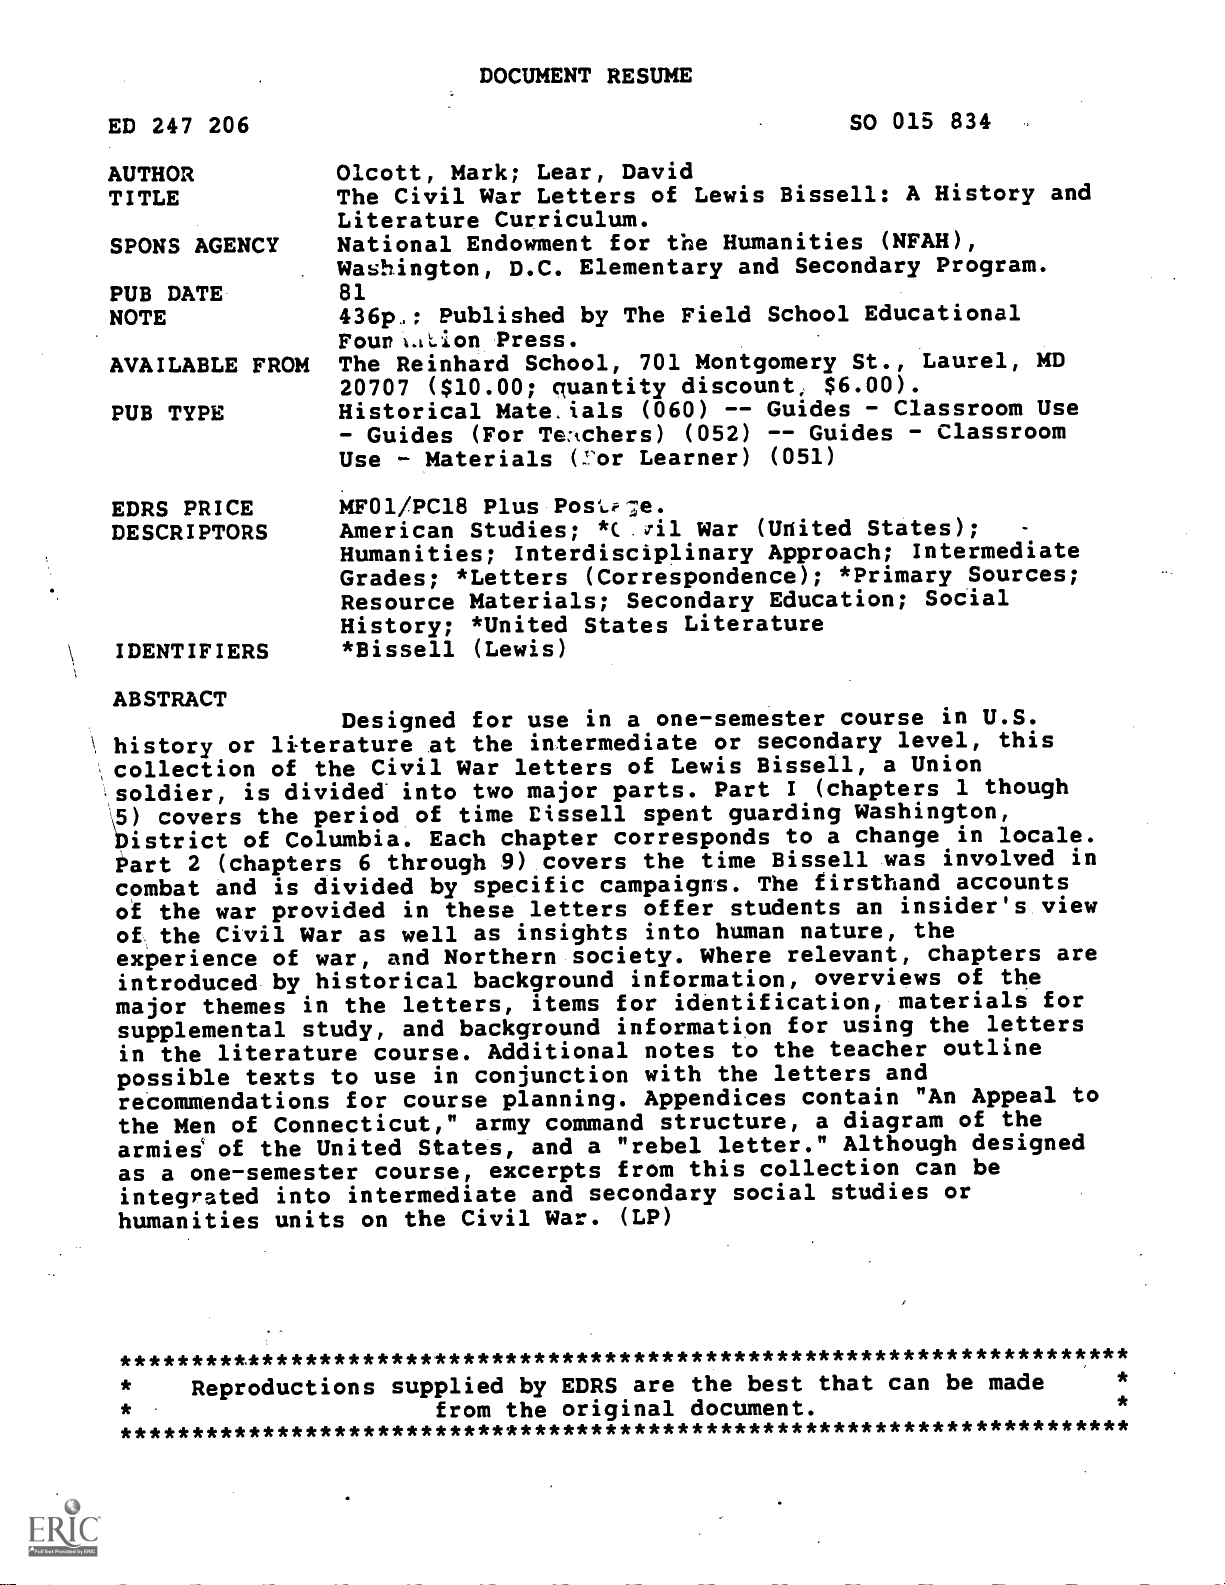
Figure 4. Sensitivity analysis results visualized as a tornado diagram showing the impact of key
parameters on the Levelized Cost of Energy (LCOE) for the PY20/WC25 scenario. Parameters are
ranked by their influence on LCOE, with locally sourced biomass share and heat production
emerging as the most significant factors. (*) CO2 credit price applies only to the wood chip (WC)
system.
The surface plot (Figure 5) demonstrates the combined effect of heat production and
locally sourced biomass share on the LCOE. The lowest LCOE values (76 EUR/MWh) were
observed at maximum heat production (10,000 MWh) and 100% locally sourced biomass,
while the highest values (256 EUR/MWh) occurred at minimum heat production (5500
MWh) and 0% locally sourced biomass. A clear gradient can be observed, showing that
increasing either parameter leads to improved economic performance, with the steepest
improvements occurring in the transition from 0% to 50% local biomass share.
Figure 4. Sensitivity analysis results visualized as a tornado diagram showing the impact of key
parameters on the Levelized Cost of Energy (LCOE) for the PY20/WC25 scenario. Parameters are
ranked by their influence on LCOE, with locally sourced biomass share and heat production emerging
as the most significant factors. (*) CO2credit price applies only to the wood chip (WC) system.
The surface plot (Figure 5) demonstrates the combined effect of heat production and
locally sourced biomass share on the LCOE. The lowest LCOE values (76 EUR/MWh)
were observed at maximum heat production (10,000 MWh) and 100% locally sourced
biomass, while the highest values (256 EUR/MWh) occurred at minimum heat production
(
5500 MWh
) and 0% locally sourced biomass. A clear gradient can be observed, showing
that increasing either parameter leads to improved economic performance, with the steepest
improvements occurring in the transition from 0% to 50% local biomass share.
For the multivariate analysis, more conservative assumptions were applied to test
system robustness. These included additional infrastructure costs of EUR 1,000,000 for
increased heat production capacity and lower revenue projections from carbon sink certifi-
cates (EUR 100 fixed instead of increasing to EUR 300) and biochar sales (200 EUR/t). Even
under these conservative conditions, the analysis revealed that the lowest LCOE values
(66 EUR/MWh) were achieved with maximum heat production and 100% locally sourced
biomass, while the highest values (248 EUR/MWh) occurred at minimum heat production
and 0% locally sourced biomass.

Sustainability 2025,17, 2316 15 of 23
Sustainability 2025, 17, x FOR PEER REVIEW 16 of 25
For the multivariate analysis, more conservative assumptions were applied to test
system robustness. These included additional infrastructure costs of EUR 1,000,000 for
increased heat production capacity and lower revenue projections from carbon sink cer-
tificates (EUR 100 fixed instead of increasing to EUR 300) and biochar sales (200 EUR/t).
Even under these conservative conditions, the analysis revealed that the lowest LCOE
values (66 EUR/MWh) were achieved with maximum heat production and 100% locally
sourced biomass, while the highest values (248 EUR/MWh) occurred at minimum heat
production and 0% locally sourced biomass.
Figure 5. Three-dimensional surface plot illustrating the combined effects of heat production ca-
pacity and locally sourced biomass percentage on the Levelized Cost of Energy (LCOE). The plot
reveals a clear gradient with optimal economic performance (lowest LCOE) achieved at maximum
heat production and 100% local biomass utilization.
3.7. Reduction Pathway
As can be seen in Table 3, the purchase of (renewable) electricity only accounts for
around 4.7–6.5% of the carbon footprint. With a factor of 0.0375 kg CO2 *kWh−1 from the
university’s energy contractor, measures like the expansion of PV generation capacities,
which make sense from an economic and sustainability perspective, have no relevant in-
fluence on the CO2 balance and thus were not the objective of this study. By far the largest
proportion is influenced by the generation of heat. Accordingly, only the carbon-relevant
measures are dealt with in this section. The measures shown in Figure 6 are briefly de-
scribed in the following.
Neither the biomethane nor the wood chip scenario were able to reduce the univer-
sity’s CO2 balance to near zero, leaving 594 t of unavoidable CO2 emissions, with 274 t in
scope 1, and 162 t and 158 t in scopes 2 and 3, respectively. This clearly contravenes the
Hessian state government’s plan for achieving CO2-neutral state administration by 2030
and, in view of the time horizon left for the use of heat generators (20 years), most likely
Figure 5. Three-dimensional surface plot illustrating the combined effects of heat production capacity
and locally sourced biomass percentage on the Levelized Cost of Energy (LCOE). The plot reveals
a clear gradient with optimal economic performance (lowest LCOE) achieved at maximum heat
production and 100% local biomass utilization.
3.7. Reduction Pathway
As can be seen in Table 3, the purchase of (renewable) electricity only accounts for
around 4.7–6.5% of the carbon footprint. With a factor of 0.0375 kg CO
2
*kWh
−1
from the
university’s energy contractor, measures like the expansion of PV generation capacities,
which make sense from an economic and sustainability perspective, have no relevant
influence on the CO
2
balance and thus were not the objective of this study. By far the
largest proportion is influenced by the generation of heat. Accordingly, only the carbon-
relevant measures are dealt with in this section. The measures shown in Figure 6are briefly
described in the following.
Neither the biomethane nor the wood chip scenario were able to reduce the university’s
CO
2
balance to near zero, leaving 594 t of unavoidable CO
2
emissions, with 274 t in scope
1, and 162 t and 158 t in scopes 2 and 3, respectively. This clearly contravenes the Hessian
state government’s plan for achieving CO
2
-neutral state administration by 2030 and, in
view of the time horizon left for the use of heat generators (20 years), most likely also
contravenes the German climate targets for CO
2
neutrality by 2045. Since PY20/WC25 is
the most cost-effective solution, the bivalent system should be selected in view of the only
slightly higher sink capacity of the “pure” PY variant.

Sustainability 2025,17, 2316 16 of 23
Sustainability 2025, 17, x FOR PEER REVIEW 17 of 25
also contravenes the German climate targets for CO2 neutrality by 2045. Since PY20/WC25
is the most cost-effective solution, the bivalent system should be selected in view of the
only slightly higher sink capacity of the “pure” PY variant.
Figure 6. Projected carbon balance trajectory for Hochschule Geisenheim University following
implementation of strategic emission reduction measures. The graph shows the transition from
current emissions (2019 baseline) through various intervention stages, demonstrating the potential
pathway to achieve carbon negativity through hybrid pyrolysis–wood chip heating system imple-
mentation.
3.7.1. Electrification of Vehicle Fleet
The electrification of the university fleet has the potential to reduce CO2 emissions by
70 to 100 t annually within scope 1. However, this transition is expected to incur a mar-
ginal increase of 8 t within scope 2, aributable to the increasing electricity consumption
associated with the process. In the immediate future, the feasibility of electrification is
primarily applicable to the university’s car fleet, with the substitution of heavy machines
like tractors being achievable in the mid-term. Given the prevalence of smaller agricul-
tural machinery in viticulture and fruit growing, promising solutions exist for electrified
tractors (e.g., Fendt e100 Vario, Monarch MK-V) to commence operations in the late 2020s
and be fully deployed in the 2030s.
3.7.2. Avoidance of Medium-Haul Flights
Figure 6. Projected carbon balance trajectory for Hochschule Geisenheim University following imple-
mentation of strategic emission reduction measures. The graph shows the transition from current
emissions (2019 baseline) through various intervention stages, demonstrating the potential pathway
to achieve carbon negativity through hybrid pyrolysis–wood chip heating system implementation.
3.7.1. Electrification of Vehicle Fleet
The electrification of the university fleet has the potential to reduce CO
2
emissions
by 70 to 100 t annually within scope 1. However, this transition is expected to incur a
marginal increase of 8 t within scope 2, attributable to the increasing electricity consumption
associated with the process. In the immediate future, the feasibility of electrification is
primarily applicable to the university’s car fleet, with the substitution of heavy machines
like tractors being achievable in the mid-term. Given the prevalence of smaller agricultural
machinery in viticulture and fruit growing, promising solutions exist for electrified tractors
(e.g., Fendt e100 Vario, Monarch MK-V) to commence operations in the late 2020s and be
fully deployed in the 2030s.
3.7.2. Avoidance of Medium-Haul Flights
The COVID-19 pandemic has made it clear that entire conferences can also be held
online. Assuming that half of medium-haul flights and a third of long-haul flights are
canceled, a saving of 67 t CO2can be achieved within scope 3.
4. Discussion
4.1. Key Findings
This study demonstrates that higher education institutions with access to agricultural
and municipal residual biomass can establish economically viable carbon removal systems

Sustainability 2025,17, 2316 17 of 23
while meeting their heating demands. The proposed hybrid pyrolysis–wood chip system
achieves three crucial objectives simultaneously: it provides renewable heat generation,
creates certified and tradeable carbon sinks, and produces valuable biochar for local agri-
cultural applications. Most notably, when operated with locally sourced biomass, the
system achieves lower levelized costs of energy (132 EUR/MWh) compared to conven-
tional heating systems while removing substantial amounts of CO
2
from the atmosphere
(
−
32,929 t CO
2
eq over service life). This shows that BCR technology can be implemented
cost-effectively when integrated into existing infrastructure needs.
4.2. Comparison with Similar Studies
The findings can be compared with and extended upon previous research on carbon
neutrality initiatives in higher education institutions. The transition of Leuphana University
Lueneburg towards climate neutrality was documented by Opel et al. [
5
], where significant
emission reductions through conventional measures were achieved. In this study, however,
it is demonstrated that, beyond carbon neutrality, a carbon-negative status can be achieved
through innovative technological integration.
In the economic analysis by Latter and Capstick [
6
], where UK universities’ climate
emergency declarations were examined, it was found that most institutions struggle with
the financial feasibility of carbon reduction measures. In contrast, it is demonstrated by
our hybrid pyrolysis–wood chip system that cost competitiveness (132 EUR/MWh with
local biomass) can be achieved, while additional carbon removal benefits are provided,
indicating a viable pathway for institutions with access to biomass resources.
Scope 1 emissions, particularly from heating, were identified as a major challenge in
the comprehensive review of Valls-Val and Bovea [
7
] of 35 higher education institutions’
carbon footprints. These findings are confirmed by our observations, but it is uniquely
demonstrated how these emissions can be transformed into carbon sinks through pyrolysis
technology. This approach differs from conventional offsetting strategies that were criti-
cized by Haya et al. [
15
], as verifiable, permanent carbon removal within the institution’s
operational boundary is created.
The economic viability of the proposed system (18.5-year amortization period) can be
favorably compared with other institutional carbon reduction measures. Longer payback
periods for conventional renewable energy installations at universities were reported by
Mendoza-Flores et al. [
9
]. However, it is demonstrated by this study that the business case
can be improved through the integration of heat generation with carbon removal while
environmental benefits are delivered by the use of biochar in agriculture such as reduced
nitrate leaching to groundwaters or reduced nitrous oxide emissions [
30
]. Such indirect
effects on GHG balances were not part of this assessment.
This work also contributes to the broader discussion of carbon dioxide removal (CDR)
implementation pathways. While Young et al. [
55
] project high costs for direct air capture
technologies (USD 200–600/t CO
2
), our pyrolysis-based approach achieves removal at
lower costs while providing additional benefits through heat generation and biochar
utilization. This supports Werner et al.’s [
29
] assertion that biomass pyrolysis systems offer
significant potential for limiting global warming to 1.5 ◦C.
4.3. Transferability to Other Higher Education Institutions
The transferability of the pyrolysis-based approach depends primarily on biomass
availability, infrastructural requirements, and institutional circumstances.
Institutions with agricultural, horticultural, or forestry programs possess a natural
advantage due to their access to residual biomass. However, other HEIs could explore alter-
native sources such as landscaping waste from campus grounds or partnerships with local
Sustainability 2025,17, 2316 18 of 23
municipalities for green waste collection and processing. The technical potential identified
at Geisenheim University (144 t DM*year
−1
from university grounds alone) suggested that
even modest biomass collection programs could support smaller-scale implementations.
Institutions with existing centralized heating systems offer more favorable conditions
for the integration of pyrolysis technologies. For universities without such infrastructure,
modular units operating at smaller scales could provide an alternative pathway, with com-
mercial systems now available in capacities ranging from 50 kW to 5 MW thermal output.
Urban campuses with limited biomass access could establish partnerships with
municipal waste management systems, participate in regional biomass utilization net-
works, or implement smaller demonstration units while pursuing alternative carbon
neutrality strategies.
As demonstrated in the sensitivity analysis, locally sourced biomass significantly
improved economic performance, suggesting that proximity to biomass resources remained
a critical success factor for successful implementation at other institutions.
Another transferability pathway might emerge through new business concepts like
carbon neutrality contracting. Institutions with less favorable conditions for direct imple-
mentation could benefit from purchasing carbon-neutral heat as a service from specialized
providers operating pyrolysis-based heating systems. This approach would allow HEIs to
achieve climate goals without requiring the technical expertise or biomass access needed
for on-site implementation while creating regional economic opportunities for agricultural
institutions to monetize their carbon removal capabilities beyond their own needs.
4.4. Cost and Price Estimations
The economic viability of CDR systems faces significant uncertainties regarding future
price developments. Current forecasts for carbon removal costs vary widely between USD
100 and 600 per ton of CO
2
eq [
55
]. While optimistic studies project prices below USD 100,
such scenarios could create problematic market incentives if removal costs fall below emis-
sion costs [
58
]. Our sensitivity analysis demonstrates that the system’s economic viability is
less dependent on carbon prices than previously assumed, with local biomass sourcing and
heat utilization being the key economic drivers. The cost calculations following DIN 2067
may be conservative, particularly regarding maintenance costs and peripheral equipment
for pyrolysis systems, as they are derived from conventional heating systems.
4.5. Technical and Methodological Limitations
Several methodological and data-related limitations should be considered when inter-
preting the results of this study. The biomass availability assessment relies on literature
values and limited field measurements, which may not fully capture local variations in
biomass productivity [
19
,
41
]. While pruning residue quantities were validated through
long-term trials at HGU, the technical collection potential could vary significantly based
on vineyard management practices and actual collection efficiency [
40
,
61
]. The assumed
collection loss of 19% represents an average value that may fluctuate seasonally [39,62].
The establishment and maintenance of reliable biomass supply chains presents ad-
ditional challenges. Initial stakeholder communications indicate strong interest in the
circular biochar utilization model, as participants would benefit from reduced disposal
costs and improved soil quality through biochar application; however, the model requires
consistent feedstock quality standards [
23
,
63
]. A particular consideration in viticulture-
derived feedstocks is the presence of copper from plant protection treatments, which are
commonly applied in both conventional and organic vineyard management. Analysis of
pruning residues showed copper concentrations between 8.5 and 19.2 mg*kg
−1
. While
these concentrations are expected to increase during pyrolysis due to mass reduction and
Sustainability 2025,17, 2316 19 of 23
element conservation, the projected copper content in the resulting biochar would remain
below the regulatory threshold of 70 mg*kg−1[64,65].
The successful operation of the system depends on establishing effective quality control
systems and biochar application protocols that comply with evolving
regulatory frameworks
.
Our economic analysis is based on current market prices and technological parameters,
with projections extending to 2045. While sensitivity analyses were conducted, long-
term price developments for all carbon removal certificates, biochar, and other resources
remain uncertain. The investment cost calculations for pyrolysis systems are derived from
conventional heating system standards (DIN 2067), which may not fully capture specific
maintenance requirements or peripheral equipment needs of pyrolysis technology.
While current German regulations on biochar soil application are more restrictive than
EU standards, the system’s biochar will be produced at >550
◦
C from pruning residues
and is expected to result in an H/C
org
ratio of 0.17, thus meets internationally recognized
stability criteria [24,66,67].
4.6. Risk of Mitigation Deterrence and Increased Macroeconomic Costs
The deployment of the sink option by BC or any other CDR technology generally
poses the risk of mitigation deterrence [
68
]. In particular, the petrochemical industry
employs circular carbon strategy approaches to mitigate the need for ambitious emission
reductions [
69
]. Governments that endorse technological openness and rely on future
measures, rather than actively shaping pathways toward a far below 2
◦
C future, risk
burdening the economy and society with unnecessarily high costs through their policy of
postponement [70,71].
5. Conclusions
The implementation of carbon sinks has been identified as indispensable for atmo-
spheric carbon dioxide removal. Higher education institutions and other public institutions
can play an important role as ideal testing grounds for sustainable transitions, combining
both institutional responsibility and technical capabilities.
The results demonstrate that heat production, carbon sink certificate generation, and
biochar creation from local biomass can be achieved while maintaining economic viability at
Geisenheim University. Although CDR implementation costs currently exceed conventional
emission offsetting, this difference maintains incentives for emission reduction measures,
ensuring that carbon sinks are reserved for genuinely unavoidable emissions.
Several research priorities have been identified for future investigation. Governmental
public institutions need to develop a comprehensive understanding of carbon sinks to
facilitate their timely integration into respective net-zero strategies. Investigations of syner-
gies with additional institutional sustainability initiatives and scalability assessments for
broader public institution implementation have been determined as necessary next steps.
The findings align with both Hesse’s state objectives for climate-neutral administration
by 2030 and federal neutrality goals by 2045, providing an evidence-based implementation
framework for other institutions. Our results demonstrate that economic viability and
ambitious climate action can be achieved through integrated technological solutions.
Supplementary Materials: The following supporting information can be downloaded at: https://
www.mdpi.com/article/10.3390/su17052316/s1, Table S1: Feasibility_Study_heating_system_HGU.
Author Contributions: Conceptualization, C.K. and G.A.-K.; methodology, C.K., M.W. and
G.A.-K.
;
software, G.A.-K.; validation, C.K., M.W. and G.A.-K.; formal analysis, G.A.-K.; investigation, G.A.-K.;
resources, G.A.-K. and C.K.; data curation, G.A.-K.; writing—original draft preparation, G.A.-K.;
writing—review and editing, C.K. and M.W.; visualization, G.A.-K.; supervision, C.K.; project
Sustainability 2025,17, 2316 20 of 23
administration, G.A.-K.; funding acquisition, C.K. All authors have read and agreed to the published
version of the manuscript.
Funding: This research was funded by the Hessian Ministry of Science and Research, Arts and
Culture, project “Facing Compensation” within the Innovation and structural development budget
(Grant No. K15/02.P7P2). C.K. gratefully acknowledges funding by the BMBF consortium project
“PyMiCCS” (Grant No. 01LS2109C) within the CDRterra program that allows results like those
presented here to be entered into CDRSynTra assessment matrices.
Institutional Review Board Statement: Not applicable.
Informed Consent Statement: Not applicable.
Data Availability Statement: Data is contained within the article or Supplementary Materials.
Acknowledgments: We acknowledge the assistance given by the Department of Plant Nutrition
and Soil Science, the Department of General and Organic Viticulture, the Department of Pomology,
the Department of Applied Ecology, and the Department of Strategic University Development and
Sustainability of HGU.
Conflicts of Interest: The authors declare no conflicts of interest.
References
1.
Grano, C.; Correia, V. Sustainable Development Goals in Higher Education. In Proceedings of the International Joint Conference
on Industrial Engineering and Operations Management, Rio de Janeiro, Brazil, 8–11 July 2020.
2.
Findler, F.; Schönherr, N.; Lozano, R.; Reider, D.; Martinuzzi, A. The impacts of higher education institutions on sustainable
development. Int. J. Sustain. High. Educ. 2019,20, 23–38. [CrossRef]
3. Glaviˇc, P.; Lukman, R. Review of sustainability terms and their definitions. J. Clean. Prod. 2007,15, 1875–1885. [CrossRef]
4.
Fuso Nerini, F.; Sovacool, B.; Hughes, N.; Cozzi, L.; Cosgrave, E.; Howells, M.; Tavoni, M.; Tomei, J.; Zerriffi, H.; Milligan, B.
Connecting climate action with other Sustainable Development Goals. Nat. Sustain. 2019,2, 674–680. [CrossRef]
5.
Opel, O.; Strodel, N.; Werner, K.F.; Geffken, J.; Tribel, A.; Ruck, W. Climate-neutral and sustainable campus Leuphana University
of Lueneburg. Energy 2017,141, 2628–2639. [CrossRef]
6.
Latter, B.; Capstick, S. Climate Emergency: UK Universities’ Declarations and Their Role in Responding to Climate Change. Front.
Sustain. 2021,2, 660596. [CrossRef]
7.
Valls-Val, K.; Bovea, M.D. Carbon footprint in Higher Education Institutions: A literature review and prospects for future research.
Clean Technol. Environ. Policy 2021,23, 2523–2542. [CrossRef]
8.
Ranganathan, J.; Corbier, L.; Bhatia, P.; Schmitz, S.; Gage, P.; Oren, K. The Greenhouse Gas Protocol: A Corporate Accounting
and Reporting Standard; World Business Council for Sustainable Development: Washington, DC, USA, 2004; Available online:
https://ghgprotocol.org/sites/default/files/standards/ghg-protocol-revised.pdf (accessed on 26 January 2024).
9.
Mendoza-Flores, R.; Quintero-Ramírez, R.; Ortiz, I. The carbon footprint of a public university campus in Mexico City. Carbon
Manag. 2019,10, 501–511. [CrossRef]
10. Bailey, G.; LaPoint, T. Comparing Greenhouse Gas Emissions across Texas Universities. Sustainability 2016,8, 80. [CrossRef]
11.
Clabeaux, R.; Carbajales-Dale, M.; Ladner, D.; Walker, T. Assessing the carbon footprint of a university campus using a life cycle
assessment approach. J. Clean. Prod. 2020,273, 122600. [CrossRef]
12.
Chen, L.; Msigwa, G.; Yang, M.; Osman, A.I.; Fawzy, S.; Rooney, D.W.; Yap, P.-S. Strategies to achieve a carbon neutral society: A
review. Environ. Chem. Lett. 2022,20, 2277–2310. [CrossRef]
13.
Rodriguez-Andara, A.; Río-Belver, R.M.; Rodríguez-Salvador, M.; Lezama-Nicolás, R. Roadmapping towards sustainability
proficiency in engineering education. Int. J. Sustain. High. Educ. 2018,19, 413–438. [CrossRef]
14.
Larsen, H.N.; Pettersen, J.; Solli, C.; Hertwich, E.G. Investigating the Carbon Footprint of a University—The case of NTNU. J.
Clean. Prod. 2013,48, 39–47. [CrossRef]
15.
Haya, B.; Cullenward, D.; Strong, A.L.; Grubert, E.; Heilmayr, R.; Sivas, D.A.; Wara, M. Managing uncertainty in carbon offsets:
Insights from California’s standardized approach. Clim. Policy 2020,20, 1112–1126. [CrossRef]
16.
Haya, B.K.; Evans, S.; Brown, L.; Bukoski, J.; Butsic, V.; Cabiyo, B.; Jacobson, R.; Kerr, A.; Potts, M.; Sanchez, D.L. Comprehensive
review of carbon quantification by improved forest management offset protocols. Front. For. Glob. Change 2023,6, 958879.
[CrossRef]
17.
Schneider, L.; Kollmuss, A. Perverse effects of carbon markets on HFC-23 and SF6 abatement projects in Russia. Nat. Clim. Change
2015,5, 1061–1063. [CrossRef]
Sustainability 2025,17, 2316 21 of 23
18.
Gill-Wiehl, A.; Kammen, D.; Haya, B. Cooking the Books: Pervasive Over-Crediting from Cookstoves Offset Methodologies. 2023.
Available online: https://www.researchsquare.com/article/rs-2606020/v1 (accessed on 3 March 2025).
19.
Esteban, L.S.; Ciria, P.; Carrasco, J.E. An assessment of relevant methodological elements and criteria for surveying sustainable
agricultural and forestry biomass byproducts for energy purposes. BioResources 2008,3, 910–928. [CrossRef]
20.
Lal, R.; Smith, P.; Jungkunst, H.F.; Mitsch, W.J.; Lehmann, J.; Nair, P.R.; McBratney, A.B.; de Moraes Sá, J.C.; Schneider, J.; Zinn,
Y.L.; et al. The carbon sequestration potential of terrestrial ecosystems. J. Soil Water Conserv. 2018,73, 145A–152A. [CrossRef]
21.
Schmidt, H.-P.; Kammann, C.; Hagemann, N.; Leifeld, J.; Bucheli, T.D.; Sánchez Monedero, M.A.; Cayuela, M.L. Biochar in
agriculture—A systematic review of 26 global meta-analyses. GCB Bioenergy 2021,13, 1708–1730. [CrossRef]
22.
Hessisches Ministerium der Finanzen. Der CO
2
Fußabdruck der Hessischen Landesverwaltung: CO2 Bilanz Verfahrensbeschreibung;
Hessisches Ministerium der Finanzen: Wiesbaden, Germany, 2020; Available online: https://finanzen.hessen.de/sites/finanzen.
hessen.de/files/2022-07/hessische_landesverwaltung_-_co2-bilanz_2020.pdf (accessed on 19 December 2022).
23.
Lehmann, J.; Joseph, S. Biochar for Environmental Management: Science, Technology and Implementation; Lehmann, J., Joseph, S., Eds.;
2. Auflage; Taylor & Francis Ltd.: London, UK, 2015; ISBN 9780415704151.
24.
Jäger, N.; Conti, R.; Neumann, J.; Apfelbacher, A.; Daschner, R.; Binder, S.; Hornung, A. Thermo-Catalytic Reforming of Woody
Biomass. Energy Fuels 2016,30, 7923–7929. [CrossRef]
25.
Khlifi, S.; Pozzobon, V.; Lajili, M. A Comprehensive Review of Syngas Production, Fuel Properties, and Operational Parameters
for Biomass Conversion. Energies 2024,17, 3646. [CrossRef]
26.
Laird, D.A.; Brown, R.C.; Amonette, J.E.; Lehmann, J. Review of the pyrolysis platform for coproducing bio-oil and biochar.
Biofuels Bioprod. Biorefining 2009,3, 547–562. [CrossRef]
27.
Papari, S.; Hawboldt, K. A review on condensing system for biomass pyrolysis process. Fuel Process. Technol. 2018,180, 1–13.
[CrossRef]
28.
Faulstich, M. Production and Characterization of Slow Pyrolysis Biochar. In Proceedings of the European Biomass Conference
and Exhibition, Berlin, Germany, 6–9 July 2011.
29.
Werner, C.; Schmidt, H.-P.; Gerten, D.; Lucht, W.; Kammann, C. Biogeochemical potential of biomass pyrolysis systems for
limiting global warming to 1.5 ◦C. Environ. Res. Lett. 2018,13, 44036. [CrossRef]
30.
Borchard, N.; Schirrmann, M.; Cayuela, M.L.; Kammann, C.; Wrage-Mönnig, N.; Estavillo, J.M.; Fuertes-Mendizábal, T.; Sigua,
G.; Spokas, K.; Ippolito, J.A.; et al. Biochar, soil and land-use interactions that reduce nitrate leaching and N
2
O emissions: A
meta-analysis. Sci. Total Environ. 2019,651, 2354–2364. [CrossRef]
31.
Schmidt, H.-P.; Kammann, C.; Hagemann, N. Certification of the Carbon Sink Potential of Biochar. Version 2.1, Arbaz, Switzerland,
2021. Available online: https://www.european-biochar.org/media/doc/139/c-de_senken-potential_2-1.pdf (accessed on 19
January 2024).
32.
Schmidt, H.-P.; Anca-Couce, A.; Hagemann, N.; Werner, C.; Gerten, D.; Lucht, W.; Kammann, C. Pyrogenic carbon capture and
storage. GCB Bioenergy 2019,11, 573–591. [CrossRef]
33.
Bisotti, F.; Hoff, K.A.; Mathisen, A.; Hovland, J. Direct Air capture (DAC) deployment: A review of the industrial deployment.
Chem. Eng. Sci. 2024,283, 119416. [CrossRef]
34.
Dziejarski, B.; Krzy˙
zy´nska, R.; Andersson, K. Current status of carbon capture, utilization, and storage technologies in the global
economy: A survey of technical assessment. Fuel 2023,342, 127776. [CrossRef]
35.
DIN EN ISO 14064-1:2019-06; Treibhausgase_-Teil_1: Spezifikation mit Anleitung zur Quantitativen Bestimmung und Berichter-
stattung von Treibhausgasemissionen und Entzug von Treibhausgasen auf Organisationsebene (ISO_14064-1:2018); Deutsche und
Englische Fassung EN_ISO_14064-1:2018. Deutsches Institut für Normung: Berlin, Germany, 2019.
36.
Gray, R. The Greenhouse Gas Protocol. Available online: https://ghgprotocol.org/sites/default/files/standards/ghg_project_
accounting.pdf (accessed on 26 January 2024).
37.
Osorio, A.M.; Úsuga, L.F.; Vásquez, R.E.; Nieto-Londoño, C.; Rinaudo, M.E.; Martínez, J.A.; Leal Filho, W. Towards Carbon
Neutrality in Higher Education Institutions: Case of Two Private Universities in Colombia. Sustainability 2022,14, 1774. [CrossRef]
38.
Klein-Banai, C.; Theis, T.L. Quantitative analysis of factors affecting greenhouse gas emissions at institutions of higher education.
J. Clean. Prod. 2013,48, 29–38. [CrossRef]
39.
Bilanzdija, N.; Voca, N.; Kricka, T.; Matin, A.; Jurisic, V. Energy potential of fruit tree pruned biomass in Croatia. Span. J. Agric.
Res. 2012,10, 292. [CrossRef]
40.
Germer, S.; van Dongen, R.; Kern, J. Decomposition of cherry tree prunings and their short-term impact on soil quality. Appl. Soil
Ecol. 2017,117–118, 156–164. [CrossRef]
41.
Pari, L.; Suardi, A.; Santangelo, E.; García-Galindo, D.; Scarfone, A.; Alfano, V. Current and innovative technologies for pruning
harvesting: A review. Biomass Bioenergy 2017,107, 398–410. [CrossRef]
42.
Velazquez-Marti, B.; Fernandez-Gonzalez, E.; Callejón-Ferre, Á.J.; Estornell-Cremades, J. Mechanized methods for harvesting
residual biomass from Mediterranean fruit tree cultivations. Sci. Agric. 2011,69. [CrossRef]
Sustainability 2025,17, 2316 22 of 23
43.
Grella, M.; Manzone, M.; Gioelli, F.; Balsari, P. Harvesting orchard pruning residues in southern Piedmont: A first evaluation of
biomass production and harvest loss. J. Agric. Eng. 2013,44, 97–102. [CrossRef]
44.
Richter, F.; Raussen, T. Optimierung der Erfassung, Aufbereitung und stofflich-energetischen Verwertung von Grüngut in
Deutschland. Müll Und Abfall 2018,18, 104–111.
45.
Morales-Polo, C.; Cledera-Castro, M.d.M.; Moratilla Soria, B.Y. Biogas Production from Vegetable and Fruit Markets Waste—
Compositional and Batch Characterizations. Sustainability 2019,11, 6790. [CrossRef]
46.
Velásquez Piñas, J.A.; Venturini, O.J.; Silva Lora, E.E.; Del Olmo, O.A.; Calle Roalcaba, O.D. An economic holistic feasibility
assessment of centralized and decentralized biogas plants with mono-digestion and co-digestion systems. Renew. Energy 2019,
139, 40–51. [CrossRef]
47.
Spokas, K.A. Review of the stability of biochar in soils: Predictability of O:C molar ratios. Carbon Manag. 2010,1, 289–303.
[CrossRef]
48.
Legan, M.; Gotvajn, A.Ž.; Zupan, K. Potential of biochar use in building materials. J. Environ. Manag. 2022,309, 114704. [CrossRef]
49.
Zhang, Y.; He, M.; Wang, L.; Yan, J.; Ma, B.; Zhu, X.; Ok, Y.S.; Mechtcherine, V.; Tsang, D.C.W. Biochar as construction materials
for achieving carbon neutrality. Biochar 2022,4, 59. [CrossRef]
50.
Biomacon GmbH. Datasheet C500-I. Available online: https://www.biomacon.com/downloads (accessed on 22 February 2025).
51.
Möhren, S.; Meyer, J.; Krause, H.; Saars, L. A multiperiod approach for waste heat and renewable energy integration of industrial
sites. Renew. Sustain. Energy Rev. 2021,148, 111232. [CrossRef]
52.
VDI Verein deutscher Ingenieure. VDI 2067-Wirtschaftlichkeit Gebäudetechnischer Anlagen: Grundlagen und Kostenberechnung; Beuth
GmbH: Berlin, Germany, 2012; Available online: https://www.vdi.de/richtlinien/details/vdi-2067-blatt-1-wirtschaftlichkeit-
gebaeudetechnischer-anlagen-grundlagen-und-kostenberechnung-1 (accessed on 29 November 2023).
53.
Pietzcker, R.; Feuerhahn, J.; Haywood, L.; Knopf, B.; Leukhardt, F.; Luderer, G.; Osorio, S.; Pahle, M.; Dias Bleasby Rodrigues,
R.; Edenhofer, O. Notwendige CO
2
-Preise zum Erreichen des Europäischen Klimaziels 2030; Ariadne-Hintergrund, Potsdam,
2021. Available online: https://www.mcc-berlin.net/forschung/publikationen/publikationen-detail/article/notwendige-co2
-preise-zum-erreichen-des-klimaziels-2030.html (accessed on 6 February 2024).
54.
Carbonfuture GmbH. C-Senken Portfolios—Carbonfuture. Available online: https://platform.carbonfuture.earth/balancer/
portfolios (accessed on 6 February 2024).
55.
Young, J.; McQueen, N.; Charalambous, C.; Foteinis, S.; Hawrot, O.; Ojeda, M.; Pilorgé, H.; Andresen, J.; Psarras, P.; Renforth,
P.; et al. The cost of direct air capture and storage can be reduced via strategic deployment but is unlikely to fall below stated cost
targets. One Earth 2023,6, 899–917. [CrossRef]
56.
Zhao, Z.; Wang, C.; Liu, B.; Hu, W.; Zhong, C. Establishment of Performance Metrics for Batteries in Large-Scale Energy Storage
Systems from Perspective of Technique, Economics, Environment, and Safety. Energy Technol. 2023,11, 2201118. [CrossRef]
57.
Branker, K.; Pathak, M.; Pearce, J.M. A review of solar photovoltaic levelized cost of electricity. Renew. Sustain. Energy Rev. 2011,
15, 4470–4482. [CrossRef]
58.
Fuss, S.; Lamb, W.F.; Callaghan, M.W.; Hilaire, J.; Creutzig, F.; Amann, T.; Beringer, T.; de Oliveira Garcia, W.; Hartmann, J.;
Khanna, T.; et al. Negative emissions—Part 2: Costs, potentials and side effects. Environ. Res. Lett. 2018,13, 63002. [CrossRef]
59. KTBL-Dieselbedarfsrechner. Available online: https://daten.ktbl.de/dieselbedarf/main.html#0 (accessed on 9 February 2024).
60.
Cárdenas-Aguiar, E.; Gascó, G.; Lado, M.; Méndez, A.; Paz-Ferreiro, J.; Paz-González, A. New insights into the production,
characterization and potential uses of vineyard pruning waste biochars. Waste Manag. 2023,171, 452–462. [CrossRef]
61.
Pari, L.; Alfano, V.; Garcia-Galindo, D.; Suardi, A.; Santangelo, E. Pruning Biomass Potential in Italy Related to Crop Characteristics,
Agricultural Practices and Agro-Climatic Conditions. Energies 2018,11, 1365. [CrossRef]
62.
Grella, M.; Manzone, M.; Gioelli, F.; Balsari, P. Harvesting of southern Piedmont’s orchards pruning residues: Evaluations of
biomass production and harvesting losses. J. Agric. Eng. 2013,44. [CrossRef]
63.
Blanco-Canqui, H.; Laird, D.A.; Heaton, E.A.; Rathke, S.; Acharya, B.S. Soil carbon increased by twice the amount of biochar
carbon applied after 6 years: Field evidence of negative priming. GCB Bioenergy 2020,12, 240–251. [CrossRef]
64.
Ithaka Institute. European Biochar Certificate—Richtlinien für die European Biochar Certificate—Richtlinien für die Zertifizierung von
Pflanzenkohle, 10.1G; Ithaka Institute: Arbaz, Switzerland, 2022.
65.
Duca, D.; Toscano, G.; Pizzi, A.; Rossini, G.; Fabrizi, S.; Lucesoli, G.; Servili, A.; Mancini, V.; Romanazzi, G.; Mengarelli, C.
Evaluation of the characteristics of vineyard pruning residues for energy applications: Effect of different copper-based treatments.
J. Agric. Eng. 2016,47, 22–27. [CrossRef]
66.
Azzi, E.S.; Li, H.; Cederlund, H.; Karltun, E.; Sundberg, C. Modelling biochar long-term carbon storage in soil with harmonized
analysis of decomposition data. Geoderma 2024,441, 116761. [CrossRef]
67.
Joseph, S.; Cowie, A.L.; van Zwieten, L.; Bolan, N.; Budai, A.; Buss, W.; Cayuela, M.L.; Graber, E.R.; Ippolito, J.A.; Kuzyakov,
Y.; et al. How biochar works, and when it doesn’t: A review of mechanisms controlling soil and plant responses to biochar. GCB
Bioenergy 2021,13, 1731–1764. [CrossRef]
68. Hougaard, I.-M. Enacting biochar as a climate solution in Denmark. Environ. Sci. Policy 2024,152, 103651. [CrossRef]
Sustainability 2025,17, 2316 23 of 23
69.
Palm, E.; Tilsted, J.P.; Vogl, V.; Nikoleris, A. Imagining circular carbon: A mitigation (deterrence) strategy for the petrochemical
industry. Environ. Sci. Policy 2024,151, 103640. [CrossRef]
70.
Howard, P.H.; Sterner, T. Few and Not So Far Between: A Meta-analysis of Climate Damage Estimates. Environ. Resour. Econ.
2017,68, 197–225. [CrossRef]
71.
Chen, Y.; Liu, A.; Cheng, X. Quantifying economic impacts of climate change under nine future emission scenarios within CMIP6.
Sci. Total Environ. 2020,703, 134950. [CrossRef]
Disclaimer/Publisher’s Note: The statements, opinions and data contained in all publications are solely those of the individual
author(s) and contributor(s) and not of MDPI and/or the editor(s). MDPI and/or the editor(s) disclaim responsibility for any injury to
people or property resulting from any ideas, methods, instructions or products referred to in the content.