Validating candlestick patterns with tick volume PDF Free Download
1 / 3/3
100%

16 October 2010 • CURRENCY TRADER16 October 2010 • CURRENCY TRADER
One disadvantage forex traders have had relative to
futures and stock traders is the general lack of accurate
volume information. The absence of a central exchange
and the FX market’s large turnover make gathering any
meaningful real-time volume information impractical, if
not impossible.
However, because there is a correlation between the
number of ticks (simply the number of price changes that
occur within a given time increment) issued by a given
forex dealer and the volume in a currency pair, “tick-vol-
ume” data can be used as a proxy for true market volume.
An interesting example using this concept was illustrated
in “Time-adjusted range and volume” (Currency Trader,
August 2010), in which Caspar Marney designed a sys-
tem using tick-volume information and the patterns that
develop within it.
If tick volume information can reliably represent actual
forex volume, we can use it to interpret different price pat-
terns. The “double doji” — a candlestick pattern consisting
of by two consecutive candles with very narrow bodies
and large shadows, or wicks — is a perfect pattern to
exemplify this concept (Figure 1).
Candlestick patterns and tick volume
Traditionally, the double-doji pattern is interpreted as a
signal of market uncertainty, but sometimes it can simply
reflect a general lack of trading volume. Tick-volume data
makes it possible to identify those patterns that are accom-
panied by significant volume, which makes them viable
candidates for a breakout strategy.
However, because different brokers may use different
liquidity providers, they can produce very different abso-
lute tick-volume data (even though the general character-
istics or profiles of the data are likely to be similar). As a
result, it’s necessary to normalize tick volume so results
are as broker-independent as possible.
In this case we’ll use a “normalized volume oscillator”
(NVO) that creates a histogram of tick volume based on
its 50-period high and low values, with the highest value
being 100 and the lowest value being -100. Figure 2 shows
an example of the indicator, along with regular tick vol-
ume, in the Euro/U.S. dollar pair (EUR/USD). (A free
NVO indicator for Metatrader 4 can be downloaded from
http://codebase.mql4.com/source/9250.)
Double-doji breakout strategy
Now that we have an indicator that displays normalized
tick volume, we can design a strategy around the double-
Validating candlestick
patterns with tick volume
A “double-doji” breakout strategy gets a boost from a tick-volume filter.
BY DANIEL FERNANDEZ
TRADING STRATEGIESTRADING STRATEGIES
FIGURE 1: DOUBLE-DOJI PATTERN
The double doji consists of two consecutive
candlestick with very narrow bodies and large
shadows, or wicks.

doji pattern in the EUR/USD pair. The following strategy
uses hourly (60-minute) data.
The first thing we need to do is to establish a mathemat-
ical definition of a double-doji so that we can identify the
patterns accurately and consistently. A valid pattern will
fulfill the following requirements:
1. The ratio of the range of
the two candles (|High-
Low|) and the body
of the candles (|Close-
Open|) must be greater
than 5.
2. The body of the candles
must be less than 20 per-
cent of the value of the
14-period daily average
true range (ATR).
3. The 50-period NVO
indicator for the second
candle must be above 35.
After a valid double-doji
is detected, buy-stop and
sell-stop orders are placed to
take advantage of a possible
breakout from the pattern.
The buy-stop is placed one
“pattern size” (the high-low
range of the larger of the two
candles) above the pattern’s
high and the sell stop is placed
one pattern size below the
pattern’s low. Conversely, the
pattern low becomes the stop-
loss for long trades while the
pattern high is the stop-loss
for short trades. The profit
target is five times the pattern
size. Both stop orders expire
after 24 hours. (Note: None of
these values were previously
optimized.)
For example, if a valid pat-
tern had a low of 1.2450 and
a high of 1.2460 (pattern size
of 10 pips), a buy-stop would
be placed at 1.2470 (1.2460
plus 10 pips) with a stop-loss
at 1.2450 (pattern low) and a
profit target at 1.2520 (1.2470
plus five times the pattern
size), while a sell-stop would
18 October 2010 • CURRENCY TRADER
TRADING STRATEGIES
FIGURE 2: NORMALIZED VOLUME OSCILLATOR
The NVO normalizes tick volume by measuring each period’s volume relative to the
highest and lowest volume readings of the past 50 periods.
FIGURE 3: TRADE EXAMPLE
This long trade was signaled when price pushed above the high of the double-doji
pattern by an amount equal to the high-low range of the pattern itself.

CURRENCY TRADER • October 2010 19
be placed at 1.2440 (1.2450
minus 10 pips) with a stop-loss
at 1.2460 (pattern high) and a
profit target at 1.2390 (1.2440
minus 5 times the pattern
size). Figure 3 shows a sample
trade.
Because these patterns are
usually very small and their
ranges are not representative
of typical market volatility, it
is a good idea to adjust trade
size according to the 14-period
daily ATR, which is a bet-
ter measurement of potential
market movement. In general,
the use of the following posi-
tion-sizing equation will result
in risk of approximately 2-per-
cent per trade:
Lot Size = (400*Account Balance/(Contract size*(14-
daily ATR in pips)))
For example, using a $100,000 standard lot size, if the
account balance was $100,000 and the 14-day ATR was 150
pips, the position size taken would be 2.6 lots.
Testing the strategy
The strategy was tested in the Metatrader platform using
hourly EUR/USD data from Jan. 1, 2000 to Jan. 1, 2010,
with an initial account value of $100,000. Even though
Metaquotes does not provide actual tick data, hourly tick
volume — which is adequate for the implementation of
this strategy — was available. Comparing the NVO values
across select time periods in this data to other data sources,
including Gain Capital tick data, revealed only minor dif-
ferences after volume normalization, which suggests the
NVO approach allows the strategy to work under vari-
ous different feeds. Trading costs were set at two pips per
trade.
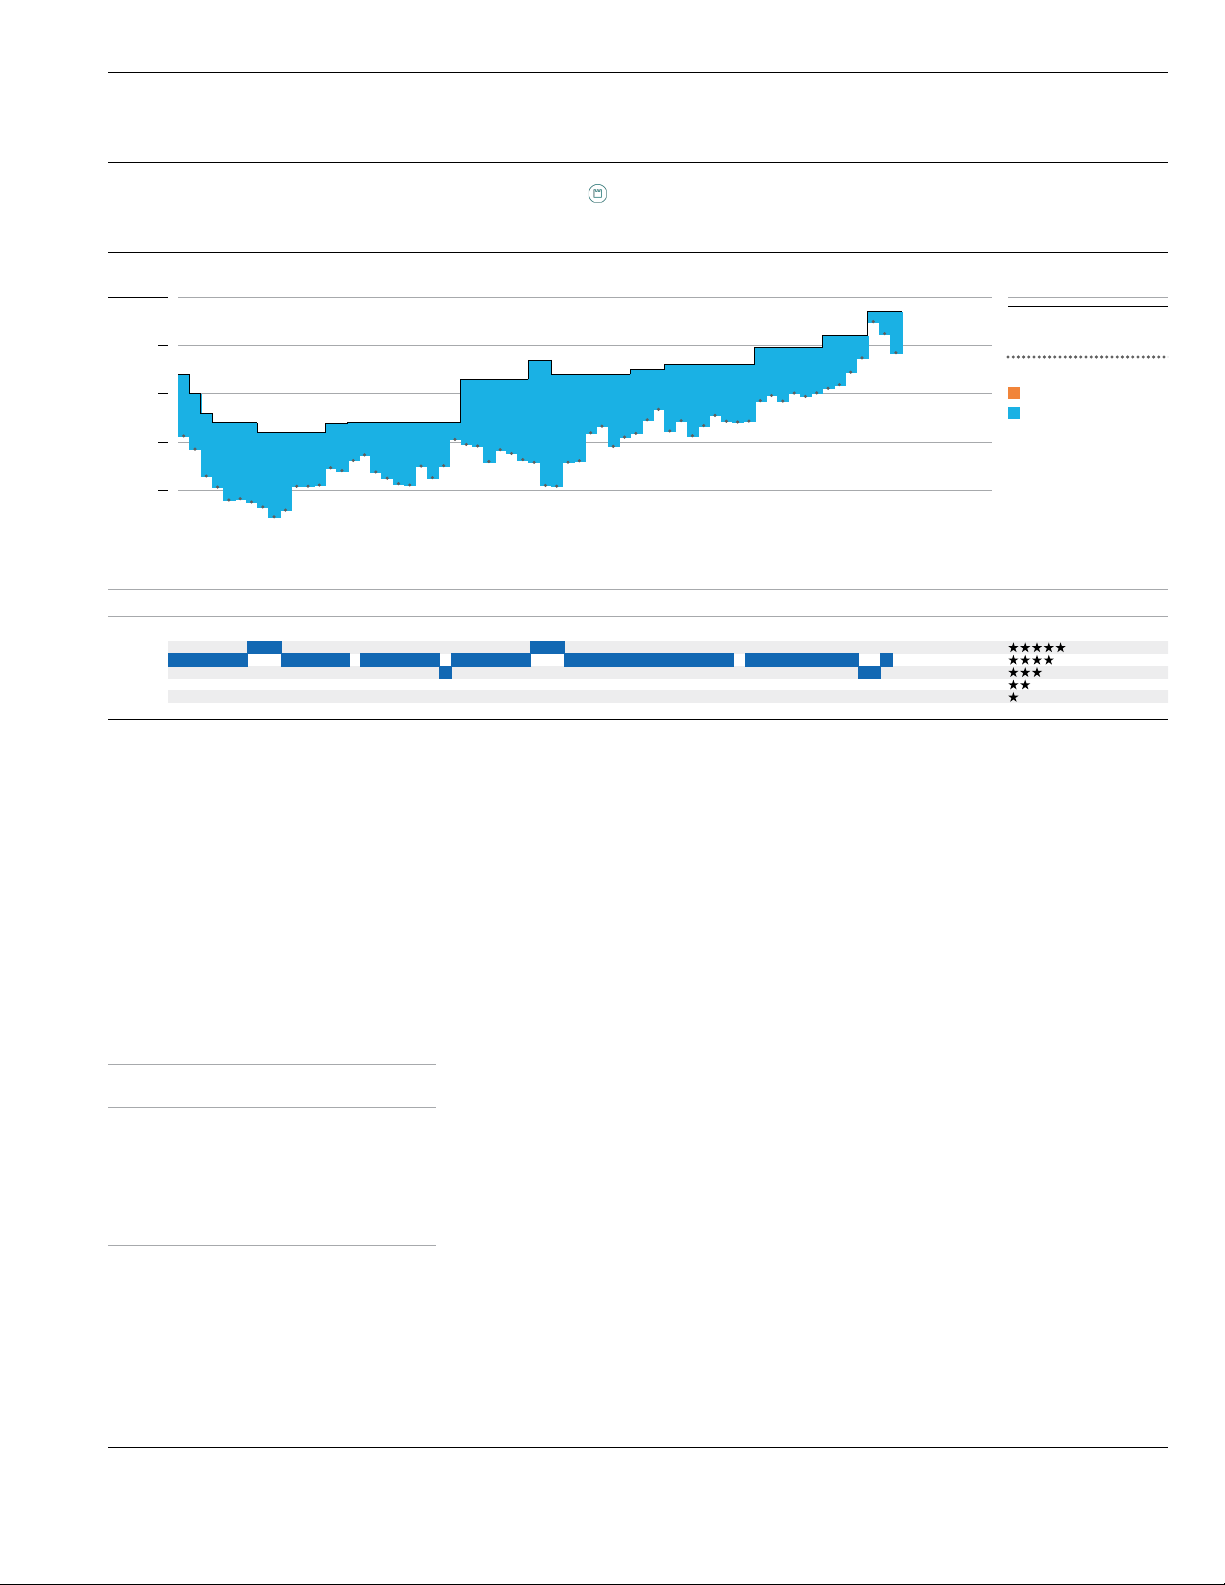
The strategy was profitable in simulation, but more
importantly, the NVO volume filter was vital to its suc-
cess. Removing the NVO filter resulted in approximately
10 times as many trades and wiped out almost all the
account’s initial equity in the first four years of testing
(Figure 4). This indicates volume validated the pattern,
as double dojis resulting from market uncertainty tend to
end in successful breakouts while those resulting from to a
general lack of volume do not lead to any outcome with a
significant probability.
The performance summary in Table 1 also highlights
some interesting characteristics of the system. First,
because valid patterns are quite rare, the strategy does not
trade very frequently –– it triggered only 221 trades during
the test period, for an average of 22 trades per year. (Also,
there was a tendency for valid patterns to cluster in certain
months, with almost a year with no signal.) The strategy’s
reward-to-risk ratio of the strategy is also very favorable,
with the average trade being 2.3 times the size of the aver-
age loser. The system also achieved new equity highs in
every year, with only two slightly negative years in 2000
(-2.46 percent) and 2003 (-0.41 percent).
The strategy might not trade frequently enough to be
used exclusively, but it does provide a valuable tool for
any trading strategy based on candlestick patterns. The
system illustrates how to get a better understanding of
candlestick patterns by using tick-volume data. Testing on
other currency pairs, as well as experimenting with other
patterns (or optimization techniques) will shed more light
on the approach’s potential.›
TRADING STRATEGIES
TABLE 1: PERFORMANCE SUMMARY
With
NVO
Without
NVO
Total profit 223% -95.62%
Avg. compounded yearly profit 12% -19.58%
Maximum drawdown 19% -95.62%
Avg. profit-to-loss ratio 2.3 2.3
Winning percentage 38% 26%
Number of trades 221 2094
Profit factor 1.44 0.87
Filtering trades with the normalized volume oscillator
improved the system in almost every aspect of its
performance.
FIGURE 4: EQUITY CURVE
The system’s primary shortcoming was its failure to signal trades for long stretches, but
its overall performance was still profitable — in stark contrast to the trading the same
pattern without the NVO filter.