Who Owns the UK Media? 2025 Report PDF Free Download
1 / 17/17
100%

Who Owns the
UK Media?
2025 Report

2 3
Seven of the top 15 online platforms used to access news
in the UK are controlled by Meta, Google and X Corp.
Google commands 93% of UK search engine use, while Meta and Google together
account for three-fths of all UK advertising spend, giving these two Big Tech
companies unrivalled control over how news is found, accessed and funded online.
Just three companies – DMG Media, News UK and Reach –
control 90% of UK national newspaper circulation, a 20%
increase in market concentration since 2014.
These same three companies account for over 40% of the combined reach of
the UK’s top 50 online newsbrands, giving these publishers signicant power
to set and steer the national news agenda.
The UK’s local newspapers are dominated by a tiny handful
of corporate chain publishers, with just two companies –
Newquest and National World – controlling 51% of the
UK’s 882 local newspapers and online local news websites.
More than eight out of ten Local Democracy Reporters, funded by the TV
licence fee to restore local journalism, are contracted to Newsquest, Reach
and National World – and these same companies control local newspaper
monopolies in areas covering 11.6 million people.
In commercial radio, just two companies – Bauer and
Global – own two-thirds of the UK’s national DAB radio
stations, and more than 60% of local analogue stations
Bauer, Global and News Broadcasting (owned by publishers News UK)
together control more than three-quarters of the UK’s national DAB radio
market.
Netix, Amazon Prime and Disney+ account for 75% of all
UK video-on-demand subscriptions.
Almost half of the value of TV commissions by the UK’s major broadcasters
went to just 12 companies, despite these largest producers making up only 4%
of the entire UK independent production sector.
Key ndings at a glance
Jonathan Harmsworth, Viscount Rothermere –
Daily Mail and General Trust
Chairman and sole owner of the Daily Mail and General Trust, and great-
grandson of the founder of the Daily Mail.
Rothermere controls 43% of the UK’s national newspaper market through
the Daily Mail, Mail on Sunday, the i and Metro.
Despite his inherited peerage and estimated net worth of over £1bn,
Rothermere and his businesses avoid paying UK tax through “non-dom”
status and off-shore company registrations.
The Murdoch family – News UK
Publishers of the Sun and The Times, Rupert Murdoch’s News UK controls
one-third of the national newspaper market. News UK also operates
TalkTV, TalkRadio and talkSPORT.
Through Fox Corp and News Corp (News UK’s parent company), Murdoch
also owns Fox News and the New York Post in the US, Australian pay-
TV network Foxtel and The Australian newspaper, book publishers
HarperCollins and many more.
Murdoch’s News UK has paid out more than £1bn in legal settlements for victims of phone hacking
and press intrusion perpetrated by reporters and private detectives working for News of the World
and The Sun – but the company has never been held accountable in an open court.
Paul Marshall
Co-owner and founder of GB News, as well as owner of UnHerd and the
Spectator magazine, which he purchased for £100m in September 2024.
Marshall’s media titles are highly inuential for cementing and
establishing conservative views and voices in the wider news agenda.
GB News and the Spectator have regularly been found in breach of
broadcasting and editorial standards by Ofcom and the press regulator
IPSO.
A hedge fund manager with an individual net worth of £875m, Marshall
is a major contributor to right-wing causes, and has proposed funding a new generation of
journalists and commentators with backing from leading UK conservative politicians.
UK media moguls and
global Big Tech tycoons

4 5
Elon Musk
Owner of X (formerly Twitter), Tesla and SpaceX, and currently a senior
advisor to President Trump, Elon Musk’s personal wealth of $382bn
(approx. £287bn) makes him the richest person in the world.
X / Twitter is the UK’s 5th most used source for news online. Since taking
over the platform in 2022 Elon Musk has interfered in the free ow of
information on the site by boosting favoured accounts, with his platforms
censoring users on request of authoritarian governments, and spreading
far-right conspiracy theories about the UK.
Mark Zuckerberg – Meta
Founder, CEO and owner of Meta, which controls Facebook,
Instagram, WhatsApp and many other companies.
Meta plays a major role in how people nd and access online content,
especially news. In the UK, 56% of people who get their news online
do so through Meta’s websites, apps and services.
Meta also dominates the online advertising market, with Facebook
and Instagram accounting for over half (£7.2bn in 2025) of all UK
display advertising spend.
Je Bezos – Amazon
Founder, CEO and major shareholder in Amazon, the world’s largest
e-commerce and internet services company with revenues of over £500bn.
Amazon Prime is the UK’s second largest streaming service, while Amazon
Music, Audible and Amazon smart speakers dominate the digital audio
and music markets.
Bezos’ net worth is estimated at $202bn (approx. £152bn). He also owns
the Washington Post (purchased in 2013 for $250m) and is alleged to have
directly interfered in the paper’s coverage of the 2024 US election after
personal meetings with Donald Trump.
Introduction
What does it mean to have a ‘free’ media when the majority of
online platforms, newspapers, TV channels and radio stations we use
are owned by a handful of giant corporations?
Is our media truly independent if the most inuential news platforms
are controlled by billionaires and vested interests?
How can we stay informed about and connected to our communities
when local media sources are being cut, closed and consolidated,
while social media sites help spread disinformation and extremist
content?
In 2014 the Media Reform Coalition published the UK’s rst major study on media ownership.
In the decade since we have published regularly updated ndings charting the worsening state
of concentrated ownership and corporate consolidation across the UK’s national and local
newspapers, broadcasters and tech platforms. This report is the 8th edition of Who Owns the UK
Media? and it shows that our media system is in an increasingly perilous state due to the ongoing
collapse in media plurality and the declining diversity of news sources.
Since our last report in 2023, the largest media companies have cemented and expanded
their dominant market positions. The opaque and unaccountable inuence that a few Big Tech
platforms exert on UK media poses serious challenges for independent journalism and our digital
rights, not least because of these companies’ control over most online infrastructure. Following
the 2024 US election, Meta abandoned its content moderation and fact-checking processes and
removed restrictions on discriminatory or hateful content, tacitly linking these changes to the
Trump administration repealing public interest regulations and anti-discrimination initiatives.1
Elon Musk, the billionaire owner of X / Twitter, has used his active role in the Trump administration
to benet his own corporate interests while attacking public media initiatives, most recently by
calling for the defunding of the Public Broadcasting Service (PBS) and National Public Radio
(NPR).2 Two separate US court judgements have ruled that Google’s market position in online
search and digital advertising constitute illegal monopolies, while the UK’s Competitions and
Markets Authority is also investigating whether Google’s market dominance in the UK requires
interventions to remedy its harms on UK consumers and news publishers.3
Unchecked media mergers and corporate takeovers have contributed to the worsening
concentration of media ownership in the UK. The proposed purchase of Telegraph Media Group
by a UAE-backed consortium prompted Parliament to introduce a foreign media ownership
1 Meta statement, ‘More Speech and Fewer Mistakes’, 7 January 2025.
2 Guardian, ‘Elon Musk’s conicts of interest should scare every American, experts say’, 27 February 2025; NPR, ‘We can’t answer
audience questions about #DefundNPR without talking about the largest implications for public media’, 27 February 2025.
3 Courtney Radsch for The Guardian, ‘Google broke the law. It’s time to break up the company’, 24 April 2025; CMA SMS
investigation into Google’s general search and search advertising services.

6 7
ban.4 However, in rightly tackling the dangers of government control of media, policymakers
ignored the long-standing patterns of editorial interference, declining editorial standards and
abuses of media power by current UK media moguls. Subsequent mergers have exposed the
consequences of these double standards over who or what is considered a legitimate media
owner, such as Paul Marshall’s 2024 purchase of the Spectator magazine, despite GB News’
persistent violation of broadcasting and editorial standards, in breach of its broadcasting licence.
The May 2024 takeover of TV production super-indie All3Media by RedBird IMI – the same UAE-
backed consortium that sought to purchase the Telegraph titles – has similarly escaped regulatory
or political concern, despite All3Media already holding an outsized share of UK TV commissions
in the independent production sector.5 Other major UK media interests have been acquired or
consolidated with little regard for their impact on the public, with the full acquisition of the UK’s
second largest local publisher National World by Media Concierge, Guardian Media Group’s sale
of The Observer to Tortoise Media, and the imminent completion of the Vodafone/Three telecoms
merger.6
Wider trends in media policy also risk exacerbating the effects of high ownership concentration
and excessive market power held by the UK’s dominant media groups. The UK government is
planning to relax the ban on foreign state ownership of newspapers, exposing its total lack of
understanding about how powerful interests – whether authoritarian states or corporate investors
– can restrict editorial autonomy and interference in journalists’ free expression through controlling
even modest shares in media outlets.7 Worse still, the decision to scrap these protections against
antidemocratic inuence appears to have been directly inuenced by back-room lobbying
from Lord Rothermere’s DMG Media and Rupert Murdoch’s News UK. Changes introduced by
the Media Act 2024 will worsen concentration in the independent production sector, proven
by Channel 4’s recent lurch into producing its own content at the expense of commissions for
smaller companies.8 With almost 300 local newspapers shut down since 2005, the collapse of
the UK’s local media continues to deprive areas across the UK of journalism made in and about
their communities. The Lebedev Foundation (publishers of the i newspaper) ended the London
Evening Standard’s historic run as a daily print newspaper by changing it to a weekly edition, and
also surrendered ownership of the London TV local licence to local publishing giant National
World. The government has delayed plans for ‘anti-SLAPP’ legislation, which would have curbed
the ability of powerful corporate interests’ ability to silence legitimate journalistic inquiry with
vexatious legal threats and lawsuits.9 The UK media’s systematic failures to report accurately and
truthfully on Israel’s assault on Gaza, including by ignoring or whitewashing widespread evidence
of genocide and war crimes, is arguably the most damning example of the consequences of a
media landscape dominated by a handful of dominant corporations.10
The ndings in this report, together with our Media Manifesto,11 demonstrate the urgent need for
radical media reform. Government, regulators and Parliament must act to break up the corporate
media giants and unaccountable tech platforms that dominate the UK, to protect against further
losses in media plurality and diversity, and to create new models for funding and supporting a
genuinely independent, accountable and democratic media commons.
4 Digital Markets, Competition and Consumers Act 2024, Section 130.
5 Televisual, ‘RedBird IMI completes acquisition of All3Media’, 16 May 2024.
6 See NUJ response to Media Concierge takeover of National World; Byline Times, ‘Tortoise and the Heir’, 18 December 2024;
Unite the Union, ‘The Three-Vodafone Merger: Myths and Reality’.
7 The Guardian, ‘Decision on foreign state stakes in UK press could end Telegraph limbo’, 15 May 2025.
8 Channel 4, ‘Channel 4 unveils twin-track approach to IP ownership with move to in-house production and launch of Creative
Investment Fund’, 21 May 2025.
9 The Law Society, ‘Government rules out immediate anti-SLAPP legislation’, 21 November 2024.
10 See Centre for Media Monitoring, Media Bias on Gaza 2023-24, March 2024; Owen Jones / Drop Site News, The BBC’s Civil
War over Gaza, 19 December 2024; Hamza Yusuf, ‘Israel is continuing the genocide – but the UK media will not tell you’, 12
March 2015.
11 Media Reform Coalition, Media Manifesto 2024.
Digital technologies and online platforms play a dominant role in how the British public nd,
access and consume all kinds of media content. UK adults spend an average of 4 hours and 20
minutes online every day, and more than half of this is spent on services owned and controlled
by a small number of global Big Tech corporations.1 Online services owned by Alphabet (such as
Google and YouTube) were visited by 99% of UK online audiences in 2023, while 95% used Meta
services (including Facebook, Instagram and WhatsApp). The revenues of these predominantly US-
based companies also highlight their dominance of global IT and digital tech markets. Alphabet
(£277bn), Microsoft (£194bn) and Meta (£101bn) generate annual turnovers that are exponentially
larger than any UK media company.2
99% of UK
online audiences
visit services
controlled
by Alphabet,
owners of
Google and
YouTube
71% use
online sources as
a main platform
for accessing
news, more than
TV, radio and
newspapers
7 out of 15
top online news
sources in the
UK owned by
Meta, Alphabet
and X Corp
The near-total control that these Big Tech companies hold over our shared online spaces is further
reected in how the UK public accesses news. 71% of UK adults use online sources such as social
media, podcasts and messaging apps for their everyday news consumption, compared to 66%
for television, 40% for radio and 22% for newspapers. A larger UK audience gets news from social
media specically (51%) than radio or newspapers (rising to 82% for 16-24 year-olds), and 2024 was
the rst year that online sources were used to access news by a larger audience than those getting
news from UK broadcasters.3
1 Ofcom ‘Online Nation 2024’, pg. 22.
2 Companies’ latest nancial statements from 401-K lings.
3 Ofcom ‘News consumption in the UK 2024’, pg. 5 & survey question C1 (main platforms used for news nowadays).
Big Tech, online platforms
and UK news

8 9
However, the widespread use of online platforms has not led to a greater diversity in the way
that UK audiences can nd and access news. As detailed in Table 1, seven of the top 15 websites,
apps and online platforms used to access news are controlled by just three Big Tech companies
– Meta, Alphabet and X Corp (owners of X / Twitter). The power of these companies as ‘online
intermediaries’, shaping the distribution and prominence of news and information online, is
stronger than ever, with the share of the UK’s online audiences using Facebook (from 33% to 42%)
and YouTube (from 21% to 26%) for news rising since 2022. 77% of UK online news audiences use
services owned and controlled by Meta to access news, compared to 66% using the BBC’s news
website, app or iPlayer.4
Table 1: Top 15 online sources used for news nowadays, 2024
News source Company % of online
audiences
Total UK
news users
Facebook Meta 42.6% 20,649,611
BBC websites or apps BBC 29.6% 14,366,746
YouTube Alphabet 26.5% 12,832,643
Instagram Meta 25.5% 12,378,970
X / Twitter X Corp 21.1% 10,247,289
WhatsApp Meta 20.4% 9,904,384
Google Search Alphabet 19.7% 9,527,724
TikTok ByteDance 16.1% 7,789,465
ITV/STV websites or apps ITV 10.8% 5,255,924
Sky News online Comcast 8.9% 4,319,572
The Guardian/Observer online Guardian Media Group* 8.9% 4,305,202
Channel 4 websites or apps Channel 4 8.5% 4,129,716
Snapchat Snap Inc. 8.4% 4,073,728
The Daily Mail news online DMG Media 8.3% 4,015,669
Google News site or app Alphabet 8.1% 3,932,130
Source: Ofcom5
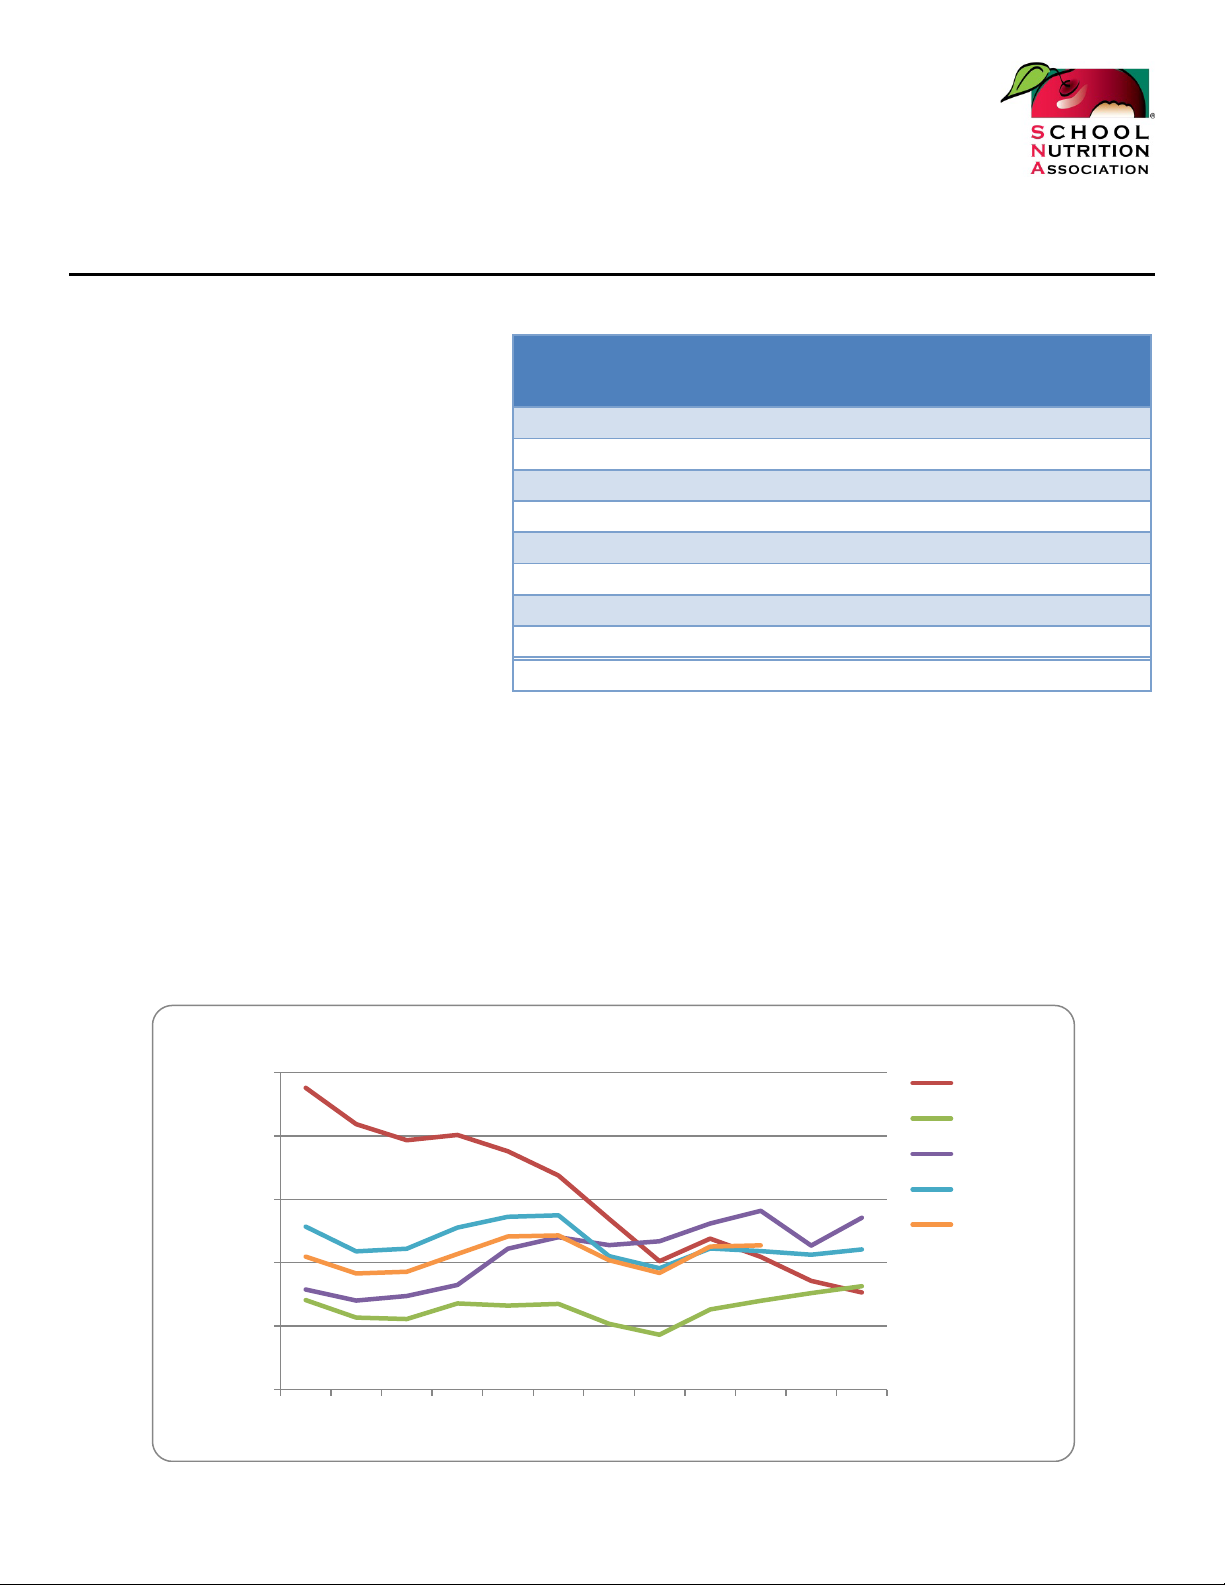
The signicant market control that these Big Tech companies hold over the distribution of UK
news is also evidenced by their high levels of cross-platform news consumption against other UK
news sources (Figure 1). Across all news providers used by the UK public, platforms and services
owned by Meta (40%) and Google (32%) have a higher reach than all ‘traditional’ news publishers
and most UK broadcasters except for news outlets owned by the BBC (68%) and ITV (38%).
Although these Big Tech companies do not produce news, their online platforms are not ‘neutral’
services that enable all news providers to reach audiences and monetise news content on an equal
footing. Rather than enhancing news media diversity, these platforms instead reect and entrench
existing patterns of concentrated ownership, benetting the market position and agenda-setting
power of the largest broadcasters and newspaper publishers that already dominate the wider UK
news media landscape.
4 Ofcom, ibid., MRC analysis of survey questions D8a, D7a and D8aaa (platforms used for news nowadays across ‘other internet’,
social media sites and search engines/news aggregators.
5 Ofcom ‘News consumption in the UK 2024’, survey question D2a-D8a (cross-platform retail providers used for news nowadays).
Total UK news users calculated from UK population using any internet sources for news (71%) and ONS gures of UK population
(mid-year 2023).
* Survey conducted prior to Tortoise Media acquisition of The Observer from Guardian Media Group.
Figure 1: Cross-platform retail providers of UK news, 2024
BBC
68%
Meta
ITV
Google
Sky News (Comcast)
Channel 4
DMG Media
News Corp
Global Radio
X / Twitter
Guardian Media Group
TikTok
Channel 5 (Paramount)
Reach
Bauer
GB News
Telegraph Media
Lebedev Foundation
Nikkei (FT)
National World
40%
38%
32%
22% 22%
17% 17% 17% 15%
11 % 11 % 10% 10% 10% 8% 6% 5% 4%
1%
Source: Ofcom6
Table 2: Top 15 newsbrands in the UK, March 2025
Newsbrand Company Audience (m) Reach %
BBC BBC 39.1 77%
Mail Online DMG Media 21.2 41%
The Guardian Guardian 21.1 40%
The Sun News UK 20.6 40%
The Independent Lebedev 19.3 36%
Yahoo! Others 18.9 34%
Mirror Reach Plc 18.5 36%
Sky News Comcast 17.1 33%
Daily Express Reach Plc 16.6 31%
The Telegraph Telegraph 15.9 29%
Money Saving Expert Others 15.2 28%
Metro DMG Media 15.1 28%
ITV ITV 14.2 29%
Good Food Others 13.1 23%
Manchester Evening News Reach Plc 12.3 24%
Source: Ipsos iris / Press Gazette7
6 Ofcom ‘News consumption in the UK 2024’, survey question D2a-D8a (cross-platform retail providers used for news nowadays).
7 Press Gazette, ’50 biggest UK news websites’, February 2025.

10 11
The opaque processes that Big Tech platforms use to curate, distribute and display content
from news organisations – large or small, corporate or independent, national or local – have a
signicant impact on the range and diversity of news that audiences encounter online. Platform
features such as automated content recommendations, aggregation and (more recently) AI-
generated news summaries give excessive power to these platforms to decide what news their
users see, and are further exacerbating the UK’s crises of media market concentration and low
diversity in news.8
65%
of social media users get
news from platforms’
recommended or
trending stories9
2/3rds
reduction in news
website trac referral
from Facebook, 2023-
2410
51%
of AI-generated news
summaries found to be
false, inaccurate or fake11
Table 2 above details the top 15 online ‘newsbrands’ in the UK in March 2025, showing how the
news outlets that already lead their respective markets (see subsequent sections) hold signicant
online reach amongst UK audiences, despite the online news landscape comprising many
thousands of other outlets and tens of millions of individual users.
Table 3 details how UK social media users access news on Facebook, Instagram, X / Twitter, TikTok
and Snapchat. Averaged across the ve sites, 65% of users get news via the stories that these
platforms show as trending or recommended, while just 35% get news from actively following
‘traditional’ news providers. The largest platforms have signicantly reduced the prominence of
news content, causing a huge decline in trafc referrals to news organisations from Facebook
(down 67% since 2022) and X / Twitter (down 50%) – with serious consequences for smaller and
independent titles who depend on platform trafc for readers and revenues.12
The growing prominence of AI-generated news summaries on tech platforms’ search, social and
aggregator sites – particularly on Google Search – further reduces users’ control over their access
to news. These technologies also risk diminishing the accuracy and truthfulness of news content
that users nd online, with recent BBC research nding that more than half of AI-generated news
summaries contained false, inaccurate or entirely fake information.13
Table 3: Accessing news on social media (% of UK platform users), 2024
Facebook Instagram X / Twitter TikTok Snapchat
Stories that [platform] says are trending 64% 65% 69% 70% 56%
Comments from friends & family 59% 42% 38% 32% 37%
Links to news content from people I follow 36% 37% 37% 27% 30%
Following traditional news providers 32% 35% 42% 32% 32%
Source: Ofcom14
8 See Nechushtai and Lewis (2019) What kind of news gatekeepers do we want machines to be? Filter bubbles, fragmentation,
the normative dimensions of algorithmic recommendations, in Computers in Human Behaviour 90.
9 Ofcom ‘News consumption in the UK’ report 2024, survey question D9 (news related activities on major platforms), average
across Facebook, Instagram, Twitter / X, TikTok and Snapchat.
10 Reuters Institute for the Study of Journalism, ‘Journalism, media, and technology trends and predictions 2025’, January 2025.
11 BBC ‘Representation of BBC News content in AI assistants’, October 2024.
12 Reuters Institute, ‘Journalism, media, and technology trends and predictions 2025’, January 2025.
13 BBC ‘Representation of BBC News content in AI assistants’, October 2024.
14 Ofcom ‘News consumption in the UK’ report 2024, survey question D9 (news activities on social media platforms).
Table 4: Top 15 news organisations followed on social media (% of UK platform
users), 2024
Facebook Instagram Twitter / X TikTok Snapchat
Sky News 19% Sky News 22% BBC 28% Sky News 18% Sky News 21%
BBC 17% BBC 20% Sky News 25% BBC 17% CNN 14%
LAD Bible 12% Public gures 13% Public gures 19% CNN 12% The Daily Mail 12%
YouTube 11 % LAD Bible 12% Specic journalists 15% LAD Bible 9% Aggregators e.g.
NewsNow
12%
The Daily Mail 10% CNN 12% Guardian/Observer 14% Channel 4 9% The Sun 10%
The Sun 9% BuzzFeed 9% CNN 11 % ITV 9% CBS News 9%
ITV 8% ITV 9% The Daily Mail 10% Public gures 8% YouTube 9%
CNN 8% Channel 4 8% ITV 9% YouTube 8% Buzzfeed 9%
Public gures 8% The Sun 8% Channel 4 9% NBC News 6% LAD Bible 8%
Guardian/Observer 7% Specic journalists 8% Lad Bible 7% CBS News 6% Specic journalists 7%
BuzzFeed 7% YouTube 8% The Sun 7% The Daily Mail 6% Public gures 7%
Any local
newspaper
7% Guardian/
Observer
7% Financial Times 7% BuzzFeed 6% Guardian/
Observer
6%
Channel 4 6% The Daily Mail 7% YouTube 6% The Sun 5% NBC News 6%
The Metro 5% NBC News 6% BuzzFeed 6% Specic journalists 5% The Metro 5%
The Independent 5% Vice 5% Joe.co.uk 6% The Metro 5% The Daily Star 5%
Source: Ofcom15
News organisations are increasingly dependent on online advertising as a major revenue source,
but online advertising services remain dominated by Alphabet’s Google and Meta, with each
holding majority control over search and online display respectively.
Table 5 calculates the two companies’ value and share of UK expenditure on advertising. In the
last ve years total spend on advertising in the UK has increased by 60% but spend on ‘traditional’
forms of advertising has continued to fall following the market slump caused by the Covid-19
pandemic. As a result, online advertising is responsible for the vast majority of all UK ad spend,
rising from £14,295m (56%) in 2020 to a forecast £31,547m (78%) in 2025.
Three-fths
of all UK advertising spend goes to services
owned by Meta and Alphabet
In 2020, the CMA estimated that Google’s search services account for 90% of all UK search
advertising spend, while Meta accounts for half of all display advertising spend. Applied to the
most recent UK advertising industry reports, this would mean that Meta and Google services
together receive three-fths of all UK advertising spend (59%) and command a three-quarters
share of UK spend on online advertising (76%).
Meta and Alphabet’s dominance of online advertising poses a severe threat to media plurality, fair
competition and sustainable funding for UK news, especially as publisher revenues continue to fall
due to the decline in spending on print newspaper advertising.
15 Ibid., survey question D12a (news sources followed on social media)

12 13
Table 6 provides MRC estimates of UK newspaper industry revenues by revenue source since
2023. While print circulation and revenues from print advertising have continued to decline since
our 2023 media ownership report, digital advertising revenues have increased from 15% of total
revenues in 2019 to 40% in 2025. Publishing companies, new online news outlets and independent
journalists alike are increasingly dependent on a digital advertising market controlled and
operated by the same companies that they already depend on to get their content distributed.
Table 5: UK expenditure on online advertising, 2023-2025
Expense 2023 2024 (est.) 2025
(forecast)
Total UK advertising spend £36,624m £38,760m £40,504m
Search & online display advertising spend £27,630m £29,766m £31,547m
Online advertising as % of total 75% 77% 78%
Search advertising £14,705m £16,014m £17,039m
to Google £13,235m £14,412m £15,335m
to others £1,471m £1,601m £1,704m
Online display advertising £12,925m £13,752m £14,509m
to Meta £6,463m £6,876m £7,254m
to Google £1,293m £1,375m £1,451m
to others £5,170m £5,501m £5,803m
Meta + Google, UK ad revenue £20,990m £22,664m £24,040m
Meta + Google, UK advertising share 57% 58% 59%
Meta + Google, UK online advertising share 76% 76% 76%
Source: MRC analysis, AA/WARC data and CMA16
Table 6: UK newspaper industry revenues by source, 2023-2025 (est.)
Source 2023 2024 2025
Print circulation £1,191m £1,142m £1,096m
Digital subscriptions £467m £492m £518m
Print advertising £1,674m £1,585m £1,524m
Digital advertising £957m £991m £1,002m
Digital % of total 35.7% 38.5% 39.7%
Source: MRC projections based on Ofcom & industry data
16 Advertising Association / WARC UK advertising expenditure report, 2023; Google and Meta advertising market shares
calculated from Competition and Markets Authority estimates, Online platforms and digital advertising market study 2020.
Market share by print circulation
Ownership of the UK’s national newspaper market is highly concentrated, and over time this
concentration has deepened in favour of a small handful of dominant companies.
In 2014, when the Media Reform Coalition published our rst UK media ownership report, the
UK’s three largest national newspaper publishers – News UK, DMG Media and Trinity Mirror
(predecessor company to Reach Plc) – held a combined market share of 70.6%.
In 2024 the same three dominant publishers – DMG Media (publishers of the Daily Mail, Metro
and i titles), News UK (The Sun, The Times and The Sun on Sunday) and Reach (the Daily
Mirror, Daily Express, Daily Star and Sunday People) – together account for 89.8% of all national
newspapers sold in 2024 (Table 7). This equates to a 27% increase in market concentration over 10
years.
9 out of 10
national newspapers sold
every week owned by
DMG Media, News UK or
Reach
The same three
companies hold
two-fths of the
combined online reach
of the UK’s 50 biggest
newsbrands
27%
increase in print market
concentration of the three
largest publishers since
2014
DMG Media alone controls more than two-fths of combined weekly circulation, and its share has
risen from 41.6% in 2023 to 43.4% in 2024 - a 5% increase in its dominant share over the national
newspaper market.
While the market shares of News UK and Reach have declined by only a few percentage points
over the last decade, DMG Media’s share of combined weekly circulation has doubled since 2014.
With the ongoing possibility of DMG Media acquiring the Telegraph Media Group titles, the UK’s
national newspaper market is perilously close to being majority-controlled by a single publisher.
National newspapers

14 15
Table 7: Combined weekly circulation by publisher (national daily and Sunday
newspapers), 2024
Publisher Weekly circulation Share of circulation Cumulative share
DMG Media 10,227,055 43.36% 43.36%
News UK 7,637,631 32.38% 75.75%
Reach 3,332,577 14.13% 89.88%
Telegraph Media Group 1,156,069 4.90% 94.78%
Nikkei (The Financial Times) 656,273 2.78% 97.56%
Guardian News & Media 574,878 2.44% 100.00%
TOTAL 23,584,483 100.00% n/a
Source: Audit Bureau of Circulations, MRC1
Table 8: Average daily print circulation (national newspapers), 2024
Publication
Average
circulation
Share of
circulation
Average
circulation
2022
% change
2022-2024
% change
2014-2024
Metro 952,194 25.42% 1,021,687 -6.80% -29.46%
The Sun* 846,916 22.61% 1,058,350 -19.98% -58.56%
Daily Mail 688,972 18.39% 855,229 -19.44% -59.34%
The Times* 281,370 7.51% 328,700 -14.40% -28.36%
Daily Mirror 223,177 5.96% 309,663 -27.93% -76.56%
Daily Telegraph* 174,293 4.65% 233,255 -25.28% -66.02%
Daily Express 139,269 3.72% 199,232 -30.10% -70.84%
The i 125,242 3.34% 140,646 -10.95% -56.52%
Daily Star 124,896 3.33% 180,595 -30.84% -73.14%
Financial Times 109,379 2.92% 114,924 -4.82% -50.35%
The Guardian* 79,906 2.13% 98,755 -19.09% -57.12%
TOTAL 3,745,614 100.00% 4,541,034 -17.52% -56.68%
Source: Audit Bureau of Circulations, MRC2
As shown in Table 8, the national daily print newspaper market is still dominated by Metro,
The Sun and the Daily Mail. Between 2022 and 2024 the average circulation of all national daily
newspapers fell by 17.5%. Daily Star (-30.8%), Daily Express (-30.1%) and Daily Mirror (-27.9%)
accounted for the largest declines in average circulation, contributing to Reach’s combined weekly
circulation falling by more than a quarter in the last two years. The signicantly smaller drop in
circulation of Metro means that DMG Media’s freesheet has overtaken News UK’s The Sun as the
UK’s most read daily newspaper. Since 2014, average daily circulation of UK national newspapers
has fallen by 56%.
1 Combined weekly circulation per publisher calculated by multiplying individual daily titles’ circulation by their respective
number of weekday issues, added to the circulation of individual Sunday titles.
2 Titles marked with * have withdrawn from submitting or publishing circulation gures with ABC. Average circulation gures for
these titles is calculated from MRC analysis of historic circulation patterns and industry trends – see this report’s accompanying
online data sheets for the full methodology.
Table 9: Average weekly print circulation (national Sunday newspapers), 2024
Publication Average
weekly
circulation
Share of
weekly
circulation
Average
weekly
circulation
2022
% change
2022-2024
% change
2014-2024
Mail on Sunday 580,799 28.15% 728,164 -20.24% -62.06%
Sun on Sunday* 491,069 23.80% 681,067 -27.90% -70.49%
Sunday Times* 376,844 18.27% 489,023 -22.94% -53.78%
Sunday Mirror 165,011 8.00% 236,740 -30.30% -82.11%
Sunday Express 122,590 5.94% 173,520 -29.35% -70.76%
Sunday
Telegraph*
110,312 5.35% 161,749 -31.80% -72.77%
The Observer* 95,442 4.63% 160,327 -40.47% -53.92%
Daily Star Sunday 67,689 3.28% 101,679 -33.43% -76.76%
Sunday People 53,238 2.58% 85,606 -37.81% -85.57%
TOTAL 2,062,994 100.00% 2,817,874 -26.79% -68.86%
Source: Audit Bureau of Circulations, MRC3
Table 9 shows that sales of Sunday newspapers have also declined by a substantial amount, with
total average weekly circulation falling by a quarter since 2022. DMG Media’s Mail on Sunday and
News UK’s Sun on Sunday remain the most-read Sunday papers with 28% and 23% market shares
respectively, while Reach titles the Sunday Mirror, Sunday Express and Sunday People saw heavy
drops in readership. The Observer, recently purchased by Tortoise Media, lost two-fths of its
weekly circulation from 2022 to 2024.
Since 2022, total weekly circulation of all national newspapers (dailies and Sundays) has decreased
by 5 million to 24.4 million copies (17%). Since our rst media ownership report in 2014, total
combined weekly circulation has fallen by 31.5 million copies (57%).
Market share by online reach
Despite the continued collapse of print circulation and print revenues across the UK’s newspaper
industry, the same national newspapers and publishing companies that hold controlling shares
of the print market also have amongst the largest digital audience reach of any UK news outlets.
In February 2025, online newsbrands owned by DMG Media, Reach and News UK accounted
for two-thirds of the combined online reach of the major UK newspaper publishers. Across the
UK’s top 50 newsbrands, these same three companies command more than 40% of the combined
online reach of the UK’s 50 biggest newsbrands.
Although the BBC has the largest news audience and reach (39.1m, 77%) of any newsbrand, the
next three largest newsbrands – Mail Online (21.2m, 41%), the Guardian (21.1m, 40%) and The Sun
(20.6m, 40%) – are all owned by national newspaper publishers. Reach, which owns 15 of the top
50 newsbrands, controls 24% of the total combined online reach.
3 As above.

16 17
Figure 2: Combined UK online reach of national newsbrands, March 2025
Financial Times
2%
Mail Online
12%
Metro
9%
The i Paper
4%
Mirror
10%
Daily Express
9%
Daily Star
3%
The Sun
12%
Times & Sunday
Times
7%
The Independent
11 %
The Guardian
11 %
The Telegraph
9%
UK national newspapers
Top 50 newsbrands, by publisher
Reach PLC
24%
DMG Media
9%
News UK
7%
Lebedev
6%
The Guardian
9%
Comcast
(Sky News)
4%
Telegraph
3%
Financial Times
1%
Others
30%
BBC News
8%
ITV
3%
Source: Ipsos iris / Press Gazette4
Market share by company revenues
Table 10 shows the annual turnover of the UK’s national newspaper publishers, using gures
from the latest available nancial statements submitted to Companies House. Revenues for most
publishing companies have fallen by an average of 5.4% since 2022, while the Financial Times
(owned by Nikkei) increased its turnover by £74m. The three largest publishing companies in
terms of share of circulation each also represent more than 20% of the sector’s total revenues, with
News UK and DMG Media together accounting for almost half of all national publisher turnover.
Table 10: Market share by revenue (national newspaper publishers), 2023-24
Company Turnover
Market
share
Cumulative
share
Accounting
date
News Corp UK & Ireland Ltd £679,750,000 24.26% 24.26% Jun 2024
DMG Media £613,400,000 21.90% 46.16% Sep 2024
Reach Plc £538,600,000 19.23% 65.39% Dec 2024
The Financial Times Ltd £443,904,000 15.85% 81.23% Dec 2024
Telegraph Media Group Ltd £268,000,000 9.57% 90.80% Dec 2023
The Scott Trust / Guardian £257,800,000 9.20% 100.00% Mar 2024
TOTAL £2,801,454,000 100.00%
Source: Company accounts
4 Press Gazette, ’50 biggest UK news websites’, March 2025.
Decades of cuts, closures and corporate consolidation have left the UK’s local newspaper industry,
and the wider local media ecology, in a dilapidated state. Research by Press Gazette suggests that
293 local print newspapers have closed since 2005, with 22 titles closed since our last report in
2023 – including 13 regional online newsbrands mothballed by Reach in November that year.1 The
steady launch of new digital news outlets by companies like Mill Media or independent and hyper-
local news outlets has done little to counter the wider impact of closures and reduced investment
across the local news sector. Since 2007, there are over 6,000 fewer journalists employed by the
three dominant local publishing companies to report in and about local communities.2
51%
of the UK’s local
newspapers owned
by Newsquest,
National World and
Reach
6,017
fewer journalists
employed by
the three largest
publishers
since 2007
Newsquest
controls more local
newspapers than the
smallest
154
publishers combined3
The collapse in the UK’s local media is made more precarious by the continued high levels of
ownership concentration created by the same three publishing companies. Table 11 details the
share of local newspaper titles owned by local news publishers, highlighting the disproportionate
share of the market controlled by a small handful of the sector’s 173 publishers. 71% of all local
newspapers (including print and online-only titles) are owned by just nine companies. Newsquest
(23.9%), National World (14.6%) and Reach (12.8%) each control a larger share of the local news
market than the smallest 113 publishers combined, while Newsquest alone owns more titles than
the smallest 154 publishers combined.
1 Press Gazette ‘UK local newspaper closures update: 293 now gone since 2005’, 14 August 2024; Press Gazette ‘The audience
data behind Reach decision to close 13 regional newsbrands’, 28 November 2023.
2 Press Gazette ‘Colossal decline in UK regional media since 2007 revealed’, 15 February 2024.
3 Combined share of smallest 154 local newspaper publishers: 23.6% from 209 titles (vs. 23.9% from 211 titles for Newsquest).
The 123 smallest local newspapers publishers are single-outlet companies, with market shares of just over 1/10th of 1% each.
Local newspapers

18 19
Table 11: Local newspaper titles by publisher, April 2025
Publisher Titles Share Cumulative share
Newsquest 211 23.9% 23.9%
National World* 129 14.6% 38.5%
Reach 113 12.8% 51.4%
Nub News 55 6.2% 57.6%
Tindle Newspapers 45 5.1% 62.7%
Iliffe Media 27 3.1% 65.8%
Highland News and Media 15 1.7% 67.5%
Voice Press 11 1.2% 68.7%
Bullivant News 11 1.2% 70.0%
Alpha Newspapers 11 1.2% 71.2%
Remaining 163 publishers 254 28.8% 100.0%
TOTAL 882 100% n/a
Source: Public Interest News Foundation4
Continued loss of local news coverage across the UK
Concentration and consolidation in local newspapers have also had a worsening effect on the
diminished availability of local news and journalism across the UK’s nations, regions and local
communities. The largest corporate publishers have continued to fold distinct local newspapers
into generic ‘hub’ websites providing limited (if any) news about the towns and cities they serve.
Using data from the Public Interest News Foundation’s Local News Map, Table 12 details the
number of local news ‘deserts’ and ‘drylands’ at the Local Authority District (LAD) level across
the UK. Over one-third (133) of UK LADs are served by only one newspaper or do not receive any
local newspaper coverage at all – with 5.4 million people (8.1% of the national population) living in
absolute news ‘deserts’ with no local newspaper and 12.5 million people (18.6%) living in ‘drylands’
with only one local newspaper.
5.4 million
people live in local
newspaper ‘deserts’,
areas without a
single dedicated local
newspaper
¼ of the UK
lives in a local news
monopoly, with all
local newspapers
owned by only one
single publisher
More than
8 out of 10
Local Democracy
Reporters contracted
to the three dominant
local news publishers
Table 13 further details the number of LADs that are subject to a local newspaper monopoly
- areas where all local newspapers (including ‘drylands’) are owned by a single publisher. 16.7
million people (24.8% of the UK) live in local newspaper monopolies, while more than 11.6 million
people (17.2%) live in local newspaper monopoly areas controlled by the three largest publishers -
Newsquest (34 LADs, 6.3m people), National World (25, 3.9m) and Reach (13, 1.3m).
4 Local titles data supplied by PINF’s UK Local News Mapping Report (April 2024), with MRC updates and analysis leading up to
April 2025. Differences in publisher title counts and sector titles between PINF and previous MRC reports are a result of dened
inclusion criteria for the purposes of PINF’s mapping project.
* National World listed as a distinct company while the Media Concierge takeover is still pending.
Table 12: Local newspaper ‘deserts’ and ‘drylands’, April 2024
Category LADs % of LADs Population % of UK
‘Deserts’: no local newspaper 47 13.0% 5,475,293 8.1%
‘Drylands’: one local newspaper 86 23.8% 12,584,657 18.6%
‘Desert’ or ‘dryland’ 133 36.8% 18,059,950 26.7%
Source: PINF / MRC5
Table 13: Local newspaper publisher monopolies, April 2024
Publisher LADs under
monopoly
Combined
population % of UK
Newsquest 36 6,366,845 9.4%
National World 25 3,922,859 5.8%
Reach 13 1,340,109 2.0%
Iliffe Media 5 698,728 1.0%
Tindle 4 451,373 0.7%
Nub News 2 173,618 0.3%
Independents (one outlet) 28 3,820,271 5.7%
TOTAL 113 16,773,803 24.8%
Source: PINF / MRC6
News in their hands - Local Democracy Reporters
The BBC Local Democracy Reporting Service, which provides licence-fee funded reporters to local
newspapers publishers, is intended to improve the signicant decline of investment in reporting
on important local matters, particularly local government and other major civic issues. However,
throughout the lifetime of these scheme since 2020, the vast majority of LDRS reporters have been
contracted to the three dominant commercial publishing companies, which share a large portion
of responsibility for the reduction in local democracy reporting that the scheme is designed to
restore. The BBC and licence fee funding is being used to subsidise for-prot publishers whose
commercial choices helped to create the UK’s crisis of collapsing local journalism, rather than
supporting new, independent public interest outlets. Under the new LDRS contracts issued for
2025-27, 86% of reporters (143 out of 165 total LDRS) have been contracted to Reach, Newsquest
and National World, a slight increase from the last contracts covering 2021-2024 (139 out of 165).
Figure 3: Share of LDRS contracted reporters by local publisher, 2025-27
Others - 13%
Reach PLC,
National World,
and Newsquest - 87%
Source: BBC LDRS contracts7
5 PINF, UK Local News Mapping Report (April 2024). This report removes local radio outlets from PINF’s desert & drought
analysis to produce a distinct gure for local newspaper coverage (rather than local news media as a sector, as in PINF’s reports).
See accompanying online data sheets for full record of LADs by newspaper titles and owners.
6 As above.
7 BBC Local Democracy Reporting Service; HoldtheFrontPage.co.uk, ‘Big three retain most LDR contracts as four new publishers
join scheme’, 8 May 2025.

20 21
Table 14 lists the ownership and revenues of three types of companies with primary or signicant
involvement in UK television, subscription broadcasting and Subscription Video-on-Demand
(SVoD) markets. The rst group includes the four national public service broadcasters (PSBs)
together with Sky and BT. Although total pay-TV subscriptions in the UK have fallen markedly in
recent years, BT and Sky – which both bundle their signicant content platforms and premium
sports services with dominant consumer telecoms products – still dwarf the nancial positions
of the PSBs. The second group highlights telecommunications companies which, while not
involved in content production, operate internet services and pay-TV packages for distributing
broadcasting content. The third group lists the main video-on-demand service providers, who
distribute content primarily via their own websites or applications installed on digital devices.
The power imbalance between UK TV companies and their global competitors has widened
signicantly in the decade since our rst media ownership report. National public service
broadcasters and subscription TV companies are at a signicant disadvantage against the nancial
clout and market control of a few international streaming companies and dominant global
production studios.
Revenues for international video-on-demand services have risen dramatically over the last 10
years, with global turnover for Amazon, Alphabet and Netix more than tripling since 2014. At
the same time, income for domestic broadcasters has stagnated, driven by the on-going decline
in spend on TV advertising, the reduction in pay-TV subscriptions and 15 years of cuts and freezes
to the BBC’s public income from the TV licence fee.
Television & video-on-demand

22 23
Table 14: Major broadcasting companies active in UK TV market, 2014
Company Parent
Location
of owner
Revenue
(£m)
Revenue
(£m, 2014) Change
UK PSBs and pay-TV
BT BT UK £20,797m £24,487m -15%
Sky (incl. Now TV) Comcast USA £10,230m £10,220m 0%
BBC BBC UK £5,389m £6,703m -20%
ITV ITC UK £3,488m £3,468m 1%
Channel 4 Channel Four Television UK £1,023m £1,256m -19%
Channel 5 Paramount Global USA £399m £492m -19%
Telecommunications
Virgin Media O2 Liberty Global &
Telefónica
USA & ES
£10,680m £5,643m 89%
Vodafone Vodafone Group UK £5,820m £7,067m -18%
Three CK Hutchinson Holdings HK/KY £2,039m £2,745m -26%
Vodafone & Three ongoing merger UK £7,859m - -
TalkTalk Toscafund UK £700m £2,313m -70%
Video-on-demand (SVoD and TVoD)
Prime Video Amazon USA £506,693m £93,652m 441%
Apple TV Apple USA £310,576m £135,056m 130%
YouTube Alphabet USA £277,998m £69,460m 300%
Disney+ Disney USA £72,563m £51,371m 41%
Discovery Warner Bros. Discovery USA £31,230m £6,593m 374 %
Netix Netix Inc USA £30,975m £5,357m 478%
Paramount Paramount Global USA £23,202m £9,324m 149%
Source: Company accounts1
Figure 4 compares the total identied viewing share of UK TV networks and other AV content
providers in the UK, using BARB data for March 2025. While broadcast viewing still makes up the
majority share of UK audiences’ TV content consumption, recent Ofcom surveys show that this
share has been declining consistently. In 2017 71% of UK audiences’ daily viewing time was spent
on broadcast content (including live TV, recorded playback and services like iPlayer), yet as of 2023
this has fallen to 57%.2 This is reected in the BARB viewing data, which shows that video-sharing
platforms – a sector dominated by Alphabet (YouTube), Meta (Instagram) and Amazon (Twitch) –
account for a larger viewing share than most major UK TV networks.
1 Values for 2014 revenues adjusted for ination up to 2014. Revenues for USA-based companies converted from USD to GBP
using 3 year averages.
2 Ofcom Media Nations 2018, pg. 21; Media Nations 2024, pg. 7.
Figure 4: Total identied monthly viewing share (% share of total), March 2025
Broadcaster viewing
SVoD / AVoD
Video-sharing
BBC
ITV
Netix
Channel 4
Sky / NBC
Disney+
Channel 5 / Paramount
Prime Video / Amazon
60.9%
18.0%
21.1%
19.7%
14.0%
9.8%
6.5%
5.4%
4.8%
4.0%
3.5%
Subscription video-on-demand services market
Table 15 shows the number of UK households subscribed to each of the main subscription
video-on-demand (SVoD) providers. In the last quarter of 2024, there were over 50.2 million
total subscriptions to SVoD services - a 17% increase in household subscriptions since 2023.
Netix, Amazon Prime Video and Disney+ account for more than three-quarters of all SVoD
subscriptions in the UK, and almost eight out of ten households that use at least one SVoD are
subscribed to Netix.
Table 15: UK subscriptions to SVoD services, Q4 2024
Service Households
(m)
% of households with
any subscription
Share of combined
subscriptions
Netix 17.1 86.5% 34.0%
Amazon Prime video 13.3 67.6% 26.6%
Disney+ 7.6 38.6% 15.2%
Discovery 3.1 15.9% 6.3%
Paramount+ 2.7 13.5% 5.3%
Apple TV+ 2.6 13.2% 5.2%
NowTV 2.0 9.9% 3.9%
Xbox Live 1.3 6.6% 2.6%
HayU 0.3 1.4% 0.6%
BritBox 0.2 0.9% 0.3%
TOTAL (at least one) 19.7m
Combined subscriptions 50.2 m
Source: BARB3
3 BARB Establishment Survey, Q4 2024 (tab T9)

24 25
As SVoD services have become more prevalent across UK households, the consumer cost of the
most popular platforms has also increased substantially. Since 2014 the annual cost of a Netix
subscription has more than doubled, from £72 to £159 (a 20% real terms increase), while Amazon
Prime Video as a standalone service costs 50% more than a decade ago, or twice as much if part of
a general Amazon Prime subscription. Over the same period, the nominal cost of a TV licence fee
has increased by just 10% - from £145.50 a year to £169.50 – but adjusted for ination has fallen by
around 12%, contributing to a 40% reduction in the BBC’s public income since 2010.
Market concentration in the UK TV production sector
The UK’s largest broadcasting networks control their own in-house TV content production studios,
but all of the major UK broadcasters (including Channel 4, which now plans to launch its own
in-house studio) also commission content from independent production companies – with the
PSBs required by law to commission at least 25% of their content from these suppliers. However,
the UK’s indie production sector is highly concentrated, with only a few companies receiving a
vastly disproportionate share of both indie sector revenues and commissioning value from UK
broadcasters.
Figure 5 shows the composition of the UK’s independent TV production sector, by both turnover
bracket and share of commissioning value from UK broadcasting networks. The smallest indies,
with annual revenues below £1m, make up two-thirds of the sector, while those with turnovers in
excess of £70m comprise just 4% of all indie companies. However, this tiny handful of the largest
independent producers (12 companies out of 341) accounts for almost half of the indie sector’s
commissioning value generated from UK broadcasters. When including indies in the next largest
turnover bracket, we can see that 11% of the sector accounts for 81% of commissioning revenue.
Moreover, almost all the main UK broadcasters (with the exception of Channel 5) are over-
dependent on commissions from companies with turnovers above £25m (11% of the sector) at the
expense of commissioning opportunities for hundreds of smaller UK indie companies (see Figure
6).
Figure 5: UK independent TV producers, by turnover bracket (left) and share of
UK commissioning value (right), 2024
66%
9%
7%
4%
10%
5%
<£1m (est.)
£1-5m
£5-10m
£10-25m
£25-70m
£70m+
£855m,
48%
£586m,
33%
£222m,
12%
£46m,
3%
£39m,
2% £38m,
2%
Source: MRC analysis of Pact data4
4 Pact / Oliver & Ohlbaum, TV Production Census 2024.
Figure 6: UK broadcasters commissioning value to independent producers, 2024
BBC ITV Channel 4 Channel 5 Others (Sky+
multichannel)
<£1m (est.)
£1-5m
£5-10m
£10-25m
£25-70m
£70m+
100%
80%
60%
40%
20%
0%
Source: MRC analysis of Pact data5
Local TV
Much like the UK’s local newspaper industry, the UK’s local TV sector is subject to extreme levels
of concentration. Following successive rounds of consolidation and commercialisation, the local
TV model that was conceived in 2011 has fallen massively short of its ambitions for invigorating
local democracy, diversifying the supply of local media and empowering communities with public
access services.
Table 16: UK local TV licences by company, 2024
Licensee Number of stations % of stations
That’s TV 21 62%
Local TV 9 26%
Latest TV 1 3%
Shefeld Local Television 1 3%
KM Television 1 3%
Notts TV 1 3%
TOTAL 34 100%
Source: Ofcom6
As shown in Table 16, 30 of the 34 local TV licences granted by Ofcom are controlled by just
two companies – That’s TV (21) and Local TV (9), with the latter owned by the second-largest
local newspaper publisher National World. The high levels of concentrated ownership in local
TV highlight both the lack of public support for the sector and the light-touch approach to
monitoring and protecting plurality that is evident across the UK’s media industries. The share of
local TV licences held by independent operators has fallen from 50% in 2014 to just 12% in 2024.
This concentration has inevitably resulted in consolidation with That’s TV taking over licences
from independents and subsequently reducing the number of studios creating content for these
services. As a result, 15 of the 21 That’s TV services do not have a studio or production centre
located in the area it serves. In 2024 the company was censured by Ofcom for failing to provide
substantial locally-produced news content across its network7 Large swathes of programming time
on local TV services are occupied by bought-in lms or entertainment, while time given to original
local news, current affairs and local interest programming is minimal.
5 Ibid.
6 Ofcom, details and licensing information for local TV broadcasters, statement published 19 November 2024.
7 Ofcom broadcast bulletin 512, 16 December 2024.

26 27
Table 17 shows the breakdown of BBC, commercial and community radio services broadcast in the
UK across analogue and digital formats at the national and local level. While the BBC still provides
a range of national and local radio services, and accounts for more than half of radio expenditure,
the commercial sector consists of almost ten times as many stations – the majority of which are
controlled by just two companies (Table 18).
Table 17: UK radio – national and local/regional services, April 2025
BBC Commercial
UK-wide
DAB stations 11 67
Analogue 5 2
Local & regional
DAB 46 625
Analogue 46 242
Community radio
DAB -156
Analogue - 306
Source: Ofcom1
The BBC’s spend on radio has remained broadly the same since 2018 (from £754m to £748m in
Q4 2024), however its investment in local radio has been substantially cut, resulting in a signicant
loss in distinct local network services and consequently a decline in listeners.2 Over the same six-
year period, commercial radio revenues rose by 12% from £590m to £667m. Commercial radio’s
audience share now constitutes a majority of total radio listening, rising from 48.5% in 2018 to
53.9% in 2024, with the BBC’s share of listening falling from 46.5% to 44.2%. In Q4 2024 the BBC
continued to attract a smaller share of weekly audience reach (31.6m people or 55%) than the
commercial sector (39.9m or 69%).
1 Ofcom radio licences and Media Nations 2024, pg. 48.
2 RAJAR and Press Gazette, ‘Hit to BBC local radio continues as LBC’s Nick Ferrari is breakfast winner’, 16 May 2024.
Radio and podcasts
Figure 7: BBC vs commercial radio – audience and revenue shares, Q4 2024
BBC
Commercial
Community
53.9%
44.2%
£667m
£748m
£13.8m
Source: RAJAR and Ofcom3
According to Ofcom licencing details, the UK has 67 national commercial DAB stations, of which
two-thirds (45) are owned by the UK’s two dominant commercial radio companies, Bauer – which
operates radio brands such as Absolute, Greatest Hits and Hits Radio – and Global – which
operates Capital, Heart, Classic FM and talk radio network LBC. Including News Broadcasting
– owned by newspaper publisher News UK – the three largest commercial radio companies
control 77% of the national DAB market, while Bauer alone controls almost 40% of the national
commercial DAB market, operating twice as many UK-wide stations as the BBC.
Table 18: National commercial DAB station ownership, May 2025
Company Number of stations Share of total
Global Radio 25 37.3%
Bauer Radio 20 29.9%
News Broadcasting (News UK) 7 10.4%
Others & independents 15 22.4%
TOTAL 67 100%
Source: Ofcom
Bauer and Global similarly dominate the UK’s local commercial radio markets across both DAB
and analogue services. The local DAB market (Table 20) is signicantly more plural than both the
national DAB and local analogue sectors, with 625 commercial local DAB licences shared between
304 companies. Yet Bauer (21.8%) and Global (14.4%) still control far larger individual market
shares than any other provider, and combined control almost as many local DAB stations as the
257 single-station operators (36.2% vs 41.1%). In local analogue provision (Table 19), Bauer and
Global are again the dominant players with 37.2% and 26% ownership shares of the 242 stations.
3 RAJAR quarterly listening Q4 2024 and Ofcom Communications Market report 2024.
1.9%

28 29
Table 20: Local commercial DAB station ownership, May 2025
Company Stations Share
Bauer Media 136 21.8%
Global Radio 90 14.4%
Thames Radio Ltd 12 1.9%
Smooth Radio Ltd 8 1.3%
Radio Exe Ltd 8 1.3%
BFBS 8 1.3%
Children’s Radio 8 1.3%
Broadcast 1 Ltd 5 0.8%
Outreach Radio Ltd 4 0.6%
Lyca 4 0.6%
Others/independent 342 54.7%
3 stations 33 5.3%
2 stations 52 8.3%
1 station 257 41.1%
TOTAL 625 100%
Table 21: Local commercial analogue station ownership, May 2025
Company Stations Share
Bauer Media 90 37.2%
Global Radio 63 26.0%
Independent 21 8.7%
Nation Broadcasting 16 6.6%
Communicorp 12 5.0%
Northern Media 7 2.9%
KM Group 7 2.9%
Media Sound 5 2.1%
Lyca 4 1.7%
Others 17 7.0%
TOTAL 242 100%
Source: Ofcom
This duopoly across the UK’s commercial radio provision has resulted in successive rounds of
station consolidation and reduction in distinct local service provision. At the start of the year
Global ended all local and regional programming across its Heart, Smooth and Capital station
brands in England, and even more recently Bauer has ended all of its local radio breakfast
programming across analogue services in England and Wales. In both cases, the closed local
services have been replaced by nationally syndicated programmes.4
4 Radio Today, ‘Global introduces new ‘nations strategy’ and drops local and regional shows in England’, 9 January 2025; ‘Bauer
to network breakfast on heritage FM radio stations in England and Wales’, 20 March 2025.
Podcasting
RAJAR estimates that 14.6 million people in the UK listen to podcasts, an increase of 1.8 million
since 2023 and almost 2.5 times as many than in 2018 (Table 22). Weekly reach for podcasts now
covers more than one-quarter of the UK population.
Table 22: UK podcast audiences, 2018-2024
2018 2020 2023 Q4 2024
Weekly reach (m) 5.9 10.1 12.8 14.6
Weekly reach (%) 11 % 18% 22.8% 26%
Source: RAJAR ‘MIDAS’5
Building on successive surveys of podcast listeners (see previous MRC reports), a Yonder survey
for Ofcom in early 2024 identied the most-used podcast platforms amongst UK podcast listeners
(Table 23), with Spotify (46%), BBC Sounds (43%) and Alphabet’s YouTube (42%) the three most
used podcast sources. Other services owned by Apple, Amazon (Amazon Music, Audible) and
Alphabet (Google Podcasts) also command sizeable proportions of podcast listeners’ platforms
for accessing audio content.
Table 23: Top 10 podcast platforms used by UK audiences, 2020-2024
Platform Proportion of podcast listeners
2020 2023 2024
Spotify 46% 43% 37%
BBC Sounds 43% 46% 38%
YouTube 42% 35% 30%
Apple Podcasts / iTunes 22% 26% 38%
Amazon (incl. Music) 18% 17% -
Google Podcasts 16% 13% 12%
Audible (Amazon) 9% 9% -
Specialist podcast sites 9% - -
Globalplayer 8% 9% 4%
Soundcloud 7% 6% 9%
Source: Yonder for Ofcom and Populus6
The Yonder survey also identied audiences’ most listened to genres of podcasts, with
entertainment (49%), news and current affairs (48%) and comedy/talk shows (tied 46%), politics/
society and culture (tied 38%) and health and wellbeing (37%) listed as the most popular.7 These
genres are particularly notable for their most listened-to podcast brands and recurring series
being produced or distributed by dominant broadcasting companies or established media
studios, such as the BBC’s Newscast, Global’s The News Agents and ‘The Rest Is…’ series,
produced by Goalhanger.
5 RAJAR ‘MIDAS’ audio survey, winter 2024 and previous ‘MIDAS’ reports. Weekly reach gures for 2023 and 2018 calculated
separately using industry trends and secondary reporting by Ofcom (see WiredGov archived post).
6 Yonder survey for Ofcom, Q19; Populus survey for Ofcom, March 2023 table 220; Media Nations 2020, pg. 42 and Populus
survey March 2020, table 74.
7 Yonder survey for Ofcom, Q13.

30 31
We need urgent action to break up the corporate juggernauts and global Big Tech
cartels that dominate the UK media. The essential principle that signicant media
power should be met with substantial public responsibilities has been diluted and
ignored by successive generations of political decision-makers, with ever deeper
and compounding consequences for the needs and interests of the British public.
It is long past time for comprehensive public intervention to address the impact of
media concentration on British democracy.
The growing market dominance and political inuence of this small cadre of media
giants has exposed the woeful inadequacies of the UK’s media plurality regulations.
Ofcom’s light-touch approach to addressing the impact of media mergers and rapid
consolidation in the news industry has allowed control of our media to fall into fewer
and fewer hands. Similarly, the inconsistent and intermittent approach of successive
UK governments towards media plurality has meant that existing UK laws are always
far out of step with the realities of how Big Tech platforms, global production
studios and giant corporate publishers are limiting the plurality and diversity of
media available to the British public.
The Media Reform Coalition believes that media plurality is not a luxury in the
digital age but an essential part of a media system in which vested interests should
not be allowed to dominate. We want to see truly free and independent media
that holds power to account and to serve the public as opposed to benetting
shareholders, proprietors or like-minded politicians.
Unaccountable concentrations of media power are amongst the greatest threats to
a free and open democratic society. We need a proactive, future-proof framework
for media plurality that supports a greater diversity of media owners, and public
interest reforms to promote and uphold the highest standards in journalism:
Conclusion
New laws to create clear thresholds for triggering interventions
on media ownership, both in and outside of active merger situations, as
well as explicit detailed guidance on remedies for breaking down concentrations
of media ownership – such as public interest obligations, structural separation of
editorial and corporate functions, and forced divestment of assets.
Updating how Ofcom measures media plurality to properly account
for the role of online intermediaries like Facebook, Google and X / Twitter in
expanding and entrenching the market reach of dominant media outlets.
Expanding the ‘t and proper persons’ test – currently only applied
to takeovers involving broadcasting licences – to mergers involving any UK media
enterprise. This would require that any media owner seeking to acquire or expand a
market position in UK media demonstrates a genuine and sustained commitment to
high standards of journalism, editorial and journalistic independence, a clear record
of regulatory compliance, and effective ethical corporate governance.
Requiring that Big Tech companies like Meta and Alphabet
actively promote and protect plurality and diversity on the
digital platforms they control. Any effective plurality regime must grapple
with the all-encompassing impact of dominant tech platforms in shaping how news
is prioritised and presented for UK audiences.
At a time of intensifying political instability and widening economic inequalities, we
urgently need a programme of genuinely progressive reform aimed at creating a
freer, fairer and more accountable media. And if we want to lay the foundations for
a media system that serves and represents the full diversity of the UK population, its
opinions, its communities, its constituent nations and indeed its divisions, then we
need to take action now to curb media power.
Big Tech corporations and global media moguls are a direct threat to a healthy
and free democracy, and all signs show that these forces are mobilising against the
institutions and principles that seek to guard against excessive concentrations of
power.
This government may not get another chance – are they
brave enough to put genuine democratic media reform at
the heart of their mission to change Britain?

For inquiries, email: MediaReformCoalitionUK@gmail.com
Full datasets for this report are available on the Media Reform Coalition website.
Research carried out by Dr Tom Chivers for the Media Reform Coalition.
Design by Hamish Gibson.
Photographs: Rupert Murdoch - Hudson Institute. Elon Musk - Steve Jurvetson. Mark Zuckerberg - Anurag R Dubey. Jeff
Bezos - Daniel Oberhaus.
Published in May 2025 by the Media Reform Coalition
www.mediareformcoalition.org.uk
c/o Goldsmiths Leverhulme Media Research Centre,
Department of Media, Communications and Cultural Studies,
Goldsmiths, University of London,
New Cross,
London SE14 6NW
United Kingdom