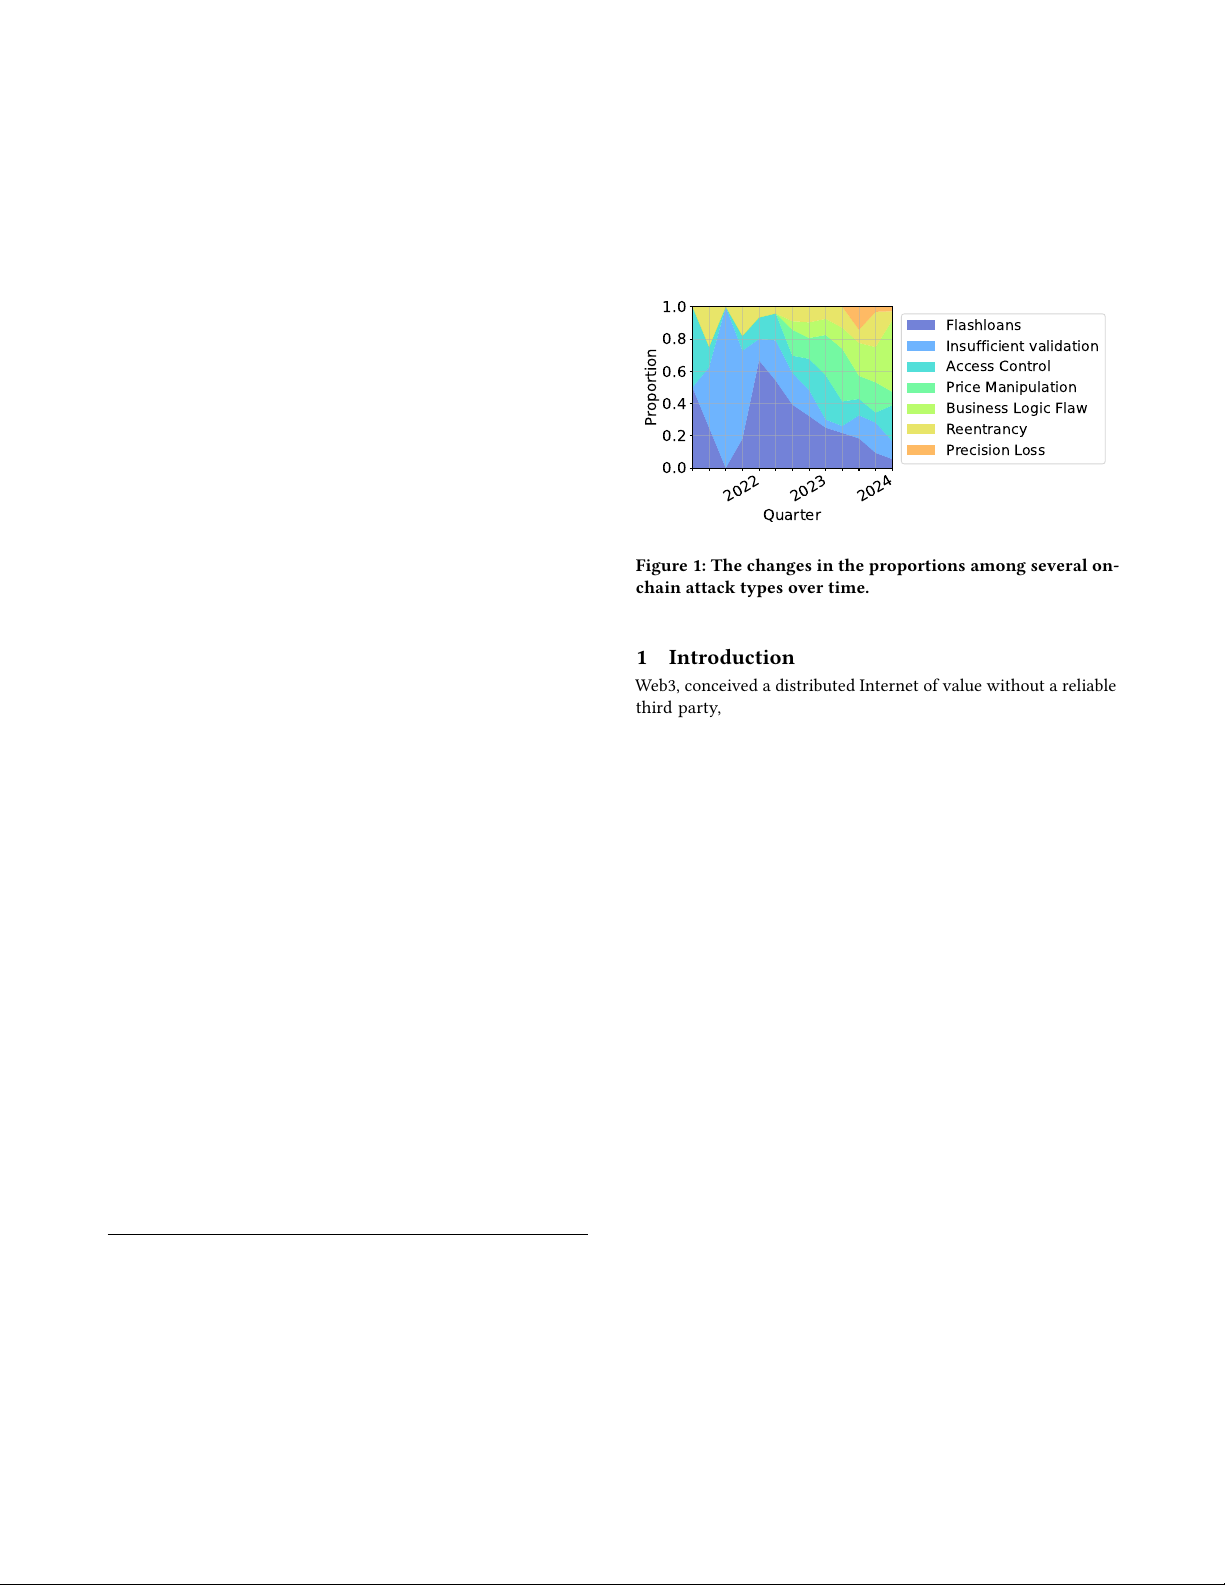
#Reinvent India's media & entertainment sector is innovating for the future March 2024 PDF Free Download
1 / 292/292
100%

March 2024
#Reinvent
India’s media & entertainment
sector is innovating for the future

Media & entertainment
Alia Bhatt
Actor, Producer
FORE

3
‘
When the good folks from FICCI and EY asked me to do this foreword, I told
them I’m more about stories than about numbers.
But when they shared some key numbers with me, an interesting story
emerged.
India’s media and entertainment industry tends to outpace the nation’s GDP
growth. Last year, the industry grew over 8%, despite global headwinds. While
traditional media, such as television and radio, continue to dominate the
market reaching 800 and 400 million consumers respectively, digital has truly
caught up, recording a reach of 600 million. While print, with a reach of 300
million, and cinema with 100 million, may appear smaller, they continue to
remain essential in shaping the future of the industry.
What is clear from 2023 is that digital is not eating away share from the other
mediums but is additive to the industry. The reach of online news is higher
than that of newspapers or news television. Digital video is now larger than
television in certain areas of the country, with online sports setting global
viewership records. And online entertainment platforms cater to audience
segments both from an original content perspective as well as for catch-up
television.
Yet, untapped opportunities abound. A third of India does not have a
television, and over half do not yet use social media. 90% of Indians do not
visit cinemas, and only one in 10 Indian households has a wired broadband
connection. The potential for growth is immense, and both digital and
traditional media have significant headroom to scale in the years ahead.
The numbers tell a story. And the world is sitting up and taking note of India’s
amazing story.
It is not a digital divide,
but a digital multiplier!
WORD

Media & entertainment
Kevin Vaz
Chairman, FICCI Media and
Entertainment Committee
‘
FORE
The integration of digital technologies in the Indian M&E sector is at a scale
without parallel amongst the comity of nations. The sector is witnessing a massive
transformation, fuelled by the Government of India’s thrust on improving digital
infrastructure in the country. In 2024, digital media is poised for explosive growth,
potentially overtaking television to become the leading segment of the M&E sector.
This surge in digital media is forecasted to propel the M&E sector’s growth to a 10%
annual rate, crossing INR3 trillion ($37.1 billion) by 2026. This growth is buoyed by a
robust digital infrastructure, widespread adoption of OTT platforms, significant growth
in the gaming segment, and the availability of cost-effective options for consumers.
Despite this digital boom, traditional media is also experiencing steady growth and
thus India is a “Linear and Digital Market” rather than “Linear or Digital Market”.
This resilience also serves as evidence of the enduring relevance of print, radio,
out-of-home advertising, and regional television, illustrating India’s diverse media
consumption habits.
India produces a staggering 200,000 hours of content annually. This includes
over 1,700 films, 3,000 hours of premium OTT content, and 20,000 songs. It is
noteworthy to acknowledge that Indian content has crossed international boundaries,
captivating audiences in more than 160 countries and topping streaming charts on
global platforms. Even within India the traditional boundaries separating regional
and national content are increasingly becoming indistinct. This shift indicates a new
era where local flavors and stories are showcasing the universal appeal of Indian
storytelling.
Accessibility and affordability of the internet is driving the growth of the M&E
sector. Ad-supported video on demand platforms have transformed viewership
in India by providing easy and affordable access to live sporting events. The
democratisation of content consumption will be further strengthened through
supportive developments in the all-critical triad of infrastructure readiness, consumer
market growth, and enabling public policies. India’s burgeoning talent pool in content
creation which includes post-production, VFX, animation, and gaming, is transforming
it as a hub for creative the industry. As we navigate towards a billion active screens by
2030, with mobile screens comprising over 75% of them, the need to innovate content
creation, distribution, and monetization strategies becomes paramount.
The 2024 Report encapsulates the spirit of resilience, innovation, and collaboration
that are the hallmarks of our M&E sector. As we navigate towards a bright and
dynamic future, it is crucial to leverage the synergy of creativity and technology with
forward-looking policy and regulatory regimes. This can position India as the content
hub of the world - bringing its unique stories, rich culture, and diverse perspectives to
the global stage.
The stage is set, and the Indian Media and
Entertainment (M&E) sector is poised to
captivate the world.

5
Ashish Pherwani
M&E Sector Leader
Ernst & Young LLP
‘
WORD
It has been a while since the media and entertainment (M&E) sector grew
slower than Indian GDP, but that was 2023 in a nutshell! Headwinds from
geopolitics, the uncertainty of war, a funding scarcity and regulatory
implications impacted advertising spends and reduced consumption. Yet the
M&E sector grew, outpacing that of many developed countries.
Consumption trends continued to favor digital media, social media, video and
audio streaming and online gaming. Yet traditional media – regional television,
print, radio, OOH and cinema – also grew and were profitable.
Although phone prices increased, India added over 30 million more
smartphone users. Airfares increased, yet so did the uptake of travel and
events. Ticket prices went up, but India sold over 900 million movie tickets
and ticketed events had their best year, ever.
I believe we are at that “inflection point” we have been speaking of since
2018, when digital finally overtakes traditional media. In 2023, new media
comprised 52% of total advertising revenues, and digital subscription, if
corresponding data charges are included, would also comprise a majority of
subscription revenues. 70% of the M&E sector’s growth in 2023 was driven by
new media.
This report aims to understand the quality of change and tries to paint a
picture of the next three years. We have included over a hundred ideas
for businesses to consider, taking advantage of the many trends and
opportunities we expect to see.
We hope you enjoy reading this report as much as we enjoyed putting it
together for you. We are certain you would find this report to be insightful.
A year of change.
A time to #reinvent.

Media & entertainment
CONT
M&E sector
overview
08
22
30
54
86
102
116
132
146
154
166
178
188
198
208
M&E sector 2023: key trends
#Reinvent
Segmental
trends
Television
Digital media
Print
Filmed entertainment
Online gaming
Animation and VFX
Live events
Out of Home media
Music
Radio
Sports
Content
Advertising in India

7
CONT ENTS
224
230
234
240
260
268
274
Indian economy
M&A activity
Tax environment
Regulatory update
Gen AI in M&E
Data privacy
Global M&E CEO survey
Enabling
environment
282
286
288
290
98
126
162
201
211
214
Glossary
Acknowledgements
M&E leadership team at EY
Methodology
News consumption survey
Gamer survey
DOOH trends
Production house survey
Marketers survey
Martech maturity model
About this
report
Original research

Media & entertainment
Catch the headlines with
AI anchor Sana
M&E sector
overview

9

Media & entertainment
Key trends
Indian M&E sector grew over 8% in 2023 to cross INR2.3 trillion
2019 2022 2023 2024E 2026E CAGR
2023-2026
Television 787 709 696 718 766 3.2%
Digital media 308 571 654 751 955 13.5%
Print 296 250 260 271 288 3.4%
Online gaming 65 181 220 269 388 20.7%
Filmed entertainment 191 172 197 207 238 6.5%
Animation and VFX 95 107 114 132 185 17.5%
Live events 83 73 88 107 143 17.6%
Out of Home media 39 37 42 47 54 9.3%
Music 15 22 24 28 37 14.7%
Radio 31 21 23 24 27 6.6%
Total 1,910 2,144 2,317 2,553 3,081 10.0%
Growth 21% 8% 10%
►The Indian M&E sector continued its growth trajectory;
it grew by INR173 billion (8.1%) to reach INR2.32 trillion
(US$27.9 billion)
►While the sector was 21% above its pre-pandemic levels,
television, print and radio still lagged their 2019 levels
►While television remained the largest segment, we
expect digital media to overtake it in 2024
►We expect the M&E sector to grow 10.2% to reach
INR2.55 trillion by 2024, then grow at a CAGR of 10%
to reach INR3.08 trillion by 2026

11
Growth of INR173 billion was driven by new media
►Except for television, all M&E segments grew in 2023
►The growth of INR173 billion was half of the INR371
billion growth that took place in 2022, mainly due to
►New media (digital and online gaming) grew the most,
providing INR122 billion of the total growth, and
consequently, increased its contribution to the M&E
sector from 20% in 2019 to 38% in 2023
►
entertainment, live events, OOH, music, radio) stood at
57% of M&E sector revenues in 2023, down from 76%
in 2019
►Experiential (outside the home and interactive)
segments continued their strong growth in 2023, and
events and OOH media segments grew at a combined
18%, contributing 48% of the total growth
-13
225710 15
24
39
83
-5%
0%
5%
10%
15%
20%
25%
-20
-
20
40
60
80
100
Growth in INR billion
Segment growth 2023 vs. 2022
Absolute growth (INR billion) Growth %
Television
Radio
Music
Out of Home media
Animation and VFX
Online gaming
Live events
Filmed entertainment
Digital media
Print

Media & entertainment
Segmental performance in 2023
►Television: Television advertising fell 6.5% due to a
slowdown in spending by gaming and D2C brands,
which impacted revenues for premium properties. The
HSM market was also soft, resulting in a 3% overall
ad volume de-growth. Subscription revenue grew
after three years of fall on the back of price increases,
though pay TV homes fell by two million. While linear
viewership grew 2% over 2022, 19 to 20 million smart
TVs connected to the internet each week, up from
around 10 million in 2022
►Digital advertising: Digital advertising grew 15%
to reach INR576 billion, or 51% of total advertising
revenues. Included in this is advertising by SME
and long-tail advertisers of over INR200 billion and
advertising earned by e-commerce platforms of INR86
billion
►Digital subscription: Digital subscription grew 9% to
reach INR78 billion. This was a third of 2022’s 27%
growth, as premium cricket properties were moved
in front of paywalls. Paid video subscriptions reduced
by two million in 2023 to 97 million, across 43 million
households in India. Paid music subscriptions grew
from 5 million to 8 million, generating INR3 billion while
online news subscriptions generated INR2 billion
►Print: Bucking the global trend, print continued to
thrive in India. Advertising revenues grew 4% in 2023,
with a notable growth in premium ad formats, as print
metro audiences. Subscription revenues grew 3% on
the back of rising cover prices. Digital revenues were
EY estimates
►Online gaming: The segment’s growth slowed to 22%
entertainment to become the fourth largest segment.
There were over 450 million online gamers in India,
of which around 100 million played daily. We estimate
over 90 million gamers paid to play; real money gaming
comprised 83% of segment revenues. Impact of a
higher GST levy was largely absorbed by larger players,
impacting margins, but protecting growth
►Film: The segment grew 14% to reach INR197 billion.
revenues reached an all-time high of INR120 billion.
released overseas
►Animation and VFX: The Hollywood writers’ strike
impact global supply chains, and consequently, the
segment grew just 6% in 2023. Potential mergers and
falling ad revenues also reduced the slate of animated
content produced for broadcast in India. A revival in
demand in the second half of the year led to growth,
boosted by the trend of using more VFX in Indian
content
►Live events: The organized segment grew 20% to
driven by government events, personal events and
weddings, and ticketed events, including several
international formats
Segment growth 2023 vs. 2022
22%
20%
15%
14%
13%
10%
10%
9%
8%
6%
4%
-2%
-5% 0% 5% 10% 15% 20% 25%
Online gaming
Live events
Digital advertising
Filmed entertainment
Out of home media
Music
Radio
Digital subscription
M&E sector overall
Animation & VFX
Print
Television

13
►OOH: OOH media grew 13% in 2023 and crossed its
2019 levels. Premium properties and locations led the
growth. Active digital OOH screens crossed 100,000
and contributed 9% of total segment revenues
►Music: The Indian music segment grew by 10% to reach
INR24 billion in 2023, slower than previous years as
certain music OTT platforms went pay and stopped
or reduced their free services. 87% of revenues were
earned through digital means, though most of it was
advertising led on YouTube, there being around only 8
million paying subscribers despite music streaming’s
reach of 185 million
I. Advertising growth lagged Indian GDP growth
►Radio: Radio segment revenues grew 10% in 2023
to INR23 billion on the back of more retail and local
advertising, and alternate revenue streams. Ad volumes
increased by 19% in 2023 as compared to the previous
year, though ad rates remained below their 2019 levels
Advertising
►The slowing down of India’s nominal GDP growth to
9% in 2023 after two years of double-digit increases
impacted advertising, which grew just 7%
►Globally, too, ad growth was 6% compared to global
nominal GDP growth of 9.9%
►In addition, advertising was impacted by a ban on
certain large and high-yield categories like gaming and
betting, and a slowdown in investments in D2C brands
►Nominal GDP growth is expected to be 10.5% for
FY2025 (2024)1 and advertising is expected to outpace
that based on past trends
1https://www.moneycontrol.com/news/business/budget/fy25-nominal-gdp-growth-assumed-at-10-5-announces-fm-in-budget-12131381.html
M&E sector vs. nominal GDP growth
9%
7% 8%
0%
5%
10%
15%
20%
25%
30%
35%
2021 2022 2023
Nominal GDP (% growth, y-o-y) Advertising revenues (% growth, y-o-y) M&E sector (% growth, y-o-y)

Media & entertainment
II. Advertising grew by 7% in 2023
Segment 2021 2022 2023
Television 313 318 297
Print 151 170 178
OOH 20 37 42
Radio 16 21 23
Cinema 1 5 8
Total traditional 500 550 547
Digital 383 499 576
Online gaming 811 13
Total new media 391 510 588
Total 892 1,060 1,135
Note: The above numbers exclude events segment revenues
►
drove the growth in advertising in 2023
►New media advertising contributed 52% of the total
advertising, and 105% of the absolute advertising
growth in 2023
►Advertising is now 0.33% of India’s GDP2, much lower
than developed large markets, which are all between
0.6% to 1%
III. TV + digital + print = 93% of ad spends
►Digital media comprised 51% of total ad spends, up
from 31% pre-pandemic, and contributed the highest
share of advertising in India
►TV comprised 26% of ad revenues, down from 36% in
2019
►Together, national media [television + new media]
contributed 78% of all advertising spends, while local
media [print + OOH + radio + cinema] comprised the
balance 22%
2EY estimates using IMF data, World Economic Outlook, MoSPI, GroupM TYNY December 2023
EY estimates using IMF data, World Economic Outlook, GroupM TYNY
December 2023
1.0%
US
0.6%
China
0.9%
Japan
0.6%
Germany
0.3%
India
Ad% to GDP
47% 51% 53%
30% 26% 25%
16% 16% 15%
7% 7% 8%
0%
25%
50%
75%
100%
2022 2023 2024E
Ad revenues by segment
Digital TV Print Others

15
Subscription
Segment 2021 2022 2023
Television 407 392 399
Online gaming 116 170 208
Film 92 167 189
Print 76 80 82
Digital 56 72 78
Total 748 881 956
I. Subscription grew 9% in 2023
►Overall, subscription grew INR75 billion, of which new
media (online gaming and digital) provided 58% of the
growth
►Across segments, subscription was focused on the
top-end of the consumer pyramid, which resulted in a
heavily concentrated subscription base. We estimate
that the top 40 to 50 million households are powering
and print have a wider audience of between 70 and
85 million homes, and TV has the largest reach at 118
million homes
►Share of subscription reduced from 43% of total M&E
sector revenues in 2019 to 41% in 2023
II. If data charges are included…
Includes data used for AVOD consumption
► We estimate that the amount paid by retail consumers
for data charges, if apportioned to M&E use cases
(AVOD and SVOD entertainment, social media,
online gaming, short video, music, news, etc.) would
aggregate INR1.5 trillion of the approximately INR3.2
trillion telecom sector
► If these data charges were to be included in our analysis
of subscription revenues:
• • the size of the M&E sector would be INR3.8 trillion
(US$46 billion)
• • subscription would be INR2.44 trillion, and
comprise 64% of the M&E sector
• • Digital segment revenues would be INR2.1 trillion,
or around three times the television segment
• • the subscription revenue mix would look
largest portion at 54%, as compared to less than
10% without data charges
Subscription revenues including data charges
Online gaming 18%
Television 16%
Film 8%
Print
3%
Digital
54%

Media & entertainment
theaters or on OTT platforms. Excludes unorganized creator economy, news
bulletins, social and short form content
► GEC contributed 68% of total hours on TV (excluding
news bulletins) in 2023
►
However, direct to digital releases halved
► Regional OTT content volumes exceeded Hindi language
► OTT content volume growth slowed in 2023 due to
EY estimates based on publicly available information
► New media aggregated 86% of deal volumes, but just
35% of deal value
►
65% of deal value
► PE/ VC led the percentage of M&E deals in 2023,
contributing to 41% of the total funding
Hours of content released in 2023
2% | OTT | 2,986
96% | TV (excl.
news bulletins) |
1,89,685
2% | Film | 3,888
68
672
501
92
77
118 126
88
2020 2021 2022 2023
M&E deal value and number of deals
Deal value (INR in billion) Deal count
India created almost 200,000 hours
of content
M&A activity slowed signicantly
in 2023

17
Future outlook
The M&E sector will grow by INR763 billion to reach INR3.1 trillion in 2026
► The Indian M&E sector will grow at a CAGR of 10% and add INR763 billion in three years
► New media will provide 61% of this growth, followed by animation and VFX (9%) and television (9%)
► We expect all segments to grow, barring unforeseen situations, and so long as India’s GDP grows 5% or more
Segmental growth 2023 to 2026E
Increase
Digital
Online gaming
Television
Animation and VFX
Live events
Films
Print
OOH
Music
Radio
M&E sector
Total
100
-
200
300 301
167
71
69
55 41 28 13 12 5763
400
500
600
700
800
900

Media & entertainment
Video trends
2023 2026E 2030E
Large 182 202 240
Small 574 640 734
Total 756 842 974
I. A billion screens by 2030
►We expect that by 2030, India will have almost a billion
active screens
►Of this, around 240 million will be large (TV, laptop, PC)
and the balance will be small (mobile phones, phablets)
►Given the 1:3 ratio between large and small screens, it
will be imperative for media companies to have a multi-
screen and multi-format strategy
The M&E sector has gone medium
agnostic
► Given that video, audio, text and experiences are
available across almost all segments, the M&E sector is
• • Video – TV, video OTT, short video, social
• • Experiential – Online gaming, cinemas, events, OOH
• • Textual – print, online news
• • Audio – radio, music, audio OTT
► Video remained the largest earning segment in 2023,
as it is the simplest and most easy-to-understand
medium of consumption
► The pandemic impacted 2020 and 2021 as regards
experiential revenues, but those have now recovered,
and we expect their share to keep growing as India’s per
capita income grows
► Text has probably seen a permanent loss due to the fall
of print circulation, but will remain relatively stable as
regards ad and sub growth, albeit at a slower rate than
other media
► Audio revenue models remain largely digital advertising
supported, and while efforts are on to grow paid
subscriptions, their revenue share will remain stable
2022 2023 2026E
Video 66% 67% 66%
Experiential 21% 22% 23%
Textual 10% 8% 8%
Audio 3% 3% 3%
Total 100% 100% 100%

19
2023 2026E 2030E
Pay TV 118 113 83
Free TV 45 50 57
Smart TV 19 40 100
Total 182 202 240
► By 2030, the large screen opportunity will evolve into
TV, none of which can be ignored by broadcasters and
studios
► Pay TV will continue to gain audiences, but will also
start switching to smart TVs as wired (or similar)
broadband grows from 38 million homes today to 70
million homes by 2026 and over a 100 million by 2030
► The potential introduction of direct-to-mobile (D2M)
television services will increase the relevance of free
television outside the home and during transit
► Both the telcos and the LCOs will play an important
role as they aim to increase ARPUs, through bundling
broadband with linear TV services, as well as by
bundling content to drive adoption of CTV
► Free TV will remain a “temporary” medium viz., it
will gain audiences as more families come out of
poverty and into the lower middle class, and it will lose
audiences as the middle-class families move up
► The key challenge posed by connected smart TVs is that
broadcasters will now compete against social media and
digital native platforms as well for share of time on the
large screen
III. Bundling will become critical for smart TV
growth
►
for linear television, telcos and ISPs will need to offer
bundles at various price points to attract and retain
consumers
► We estimate that if pricing is made comparable to
television pricing (or at a slight premium when bundled
with data) for popular streaming services, the reach of
smart TVs could cross 100 million households sooner
►
future growth of connected TVs, both from a simple
customer experience point of view, as well as a place
for discovery of content. It will become the new landing
page and earn placement and marketing revenues
IV. New content windows will emerge
► Monetization will be at the mercy of consumers’
willingness to pay, and unlike international markets,
Indian markets are more heterogeneous and need to be
► Accordingly, premium SVOD, theatrical, SVOD, bundled
windows could come into existence for different types of
content
V. Do not write-off linear pay TV
► Linear TV will grow when TV dark homes come onboard
and when free TV audiences upgrade to pay
► Given India has around 323 million households today,
growing to 345 million by 2030, of which say 25% will
be under the poverty line, there is still an opportunity of
around 70 million homes
► In order to address the opportunity and reduce
television dark households, a number of initiatives will
need to be evaluated, such as:
• • Creation of lower priced FTA packs
• • Differential pricing and bundling for rural markets,
in agreement with the regulator
• • Reactivation of the millions of inactive set-top
boxes through incentive schemes
• • Creating relevant content baskets for under-
penetrated markets
II. The future of television will be three
signicant segments

Media & entertainment
Experiential trends
I. Online gaming will grow to reach INR388
billion by 2026
►The segment will grow across all its verticals viz, esports,
fantasy sport, casual gaming and other games of skill, but
revenue growth will be led by mobile-based real-money
gaming and casual gaming
► As many global companies look to launch their games in
India, we expect in-app purchases within casual games
► Consolidation is on the cards, post the GST regulation
changes of 2023. We expect the market to stabilize with
two to three fantasy sport players, one to two players
each in rummy and poker, and one or two large multi-
game platforms
► Gaming event IP will come into being, in the form of
esports leagues, national online gaming events and multi-
game platforms where gaming will be united with social
interaction and commerce
► Once clarity on retrospective taxation is resolved,
opportunities for growth in foreign markets, and foreign
investment into the segment will grow
II. Cinema will focus on a second HSM segment
►
by theatrical revenues as Hindi movies go mass market in
their storytelling, incorporate more VFX to enhance the
movie-going experience and expand more aggressively
into tier-II and III cities
► Broadcast rights will remain soft as pay TV homes
continue to fall, but the gap will be made up through
digital rights, as CTV homes are expected to grow
► Growth in overseas revenues will depend on opening-up of
culturally similar markets like China and the middle east
► High-end cinemas will evolve into “experience zones” to
cater to top-end multiplex audiences who watch movies
for their spectacular experience and to enjoy an evening
out with friends and family – a market we estimate
at around over 100 million customers / 50 million
households today
► In addition, a set of lower-priced “cinema products” will
emerge for the next 100 to 150 million audiences across
the top 50 to 75 cities of India, which will also require
a change to the type of content being produced for
these audiences, and which could even see regional OTT
products releasing in a windowed manner
► We expect more exhibition pricing innovation in the future
around loyalty programs, discounting, group pricing,
rentals, etc.
III. Premium OOH assets will drive growth
►
in premium trains and commercial and entertainment
establishments would provide impetus for marketers to
invest in the OOH medium
► The share of DOOH would reach 15% of total OOH
revenues as the number of screens in premium
catchment areas increases, without hurting the growth
of traditional OOH assets, as budgets would get more
integrated with digital media purchasing
► A good deal of entertainment, sports and cultural
venues are being set up in tier II and III cities, which will
provide a further boost to addressable OOH inventory
and revenues
IV. Events will continue their growth
trajectory
► Events will double in size by 2027 due to the following
factors:
• • Corporates and brands will spend more on events.
Our survey of marketers indicated that 79% of
respondents planned to increase their event spends
in the next two years
• • Tier-II markets will provide new avenues. According
to GDP and per capita income data, we expect
Ayodhya, Trivandrum, and Cochin to be the next
set of cities where events will thrive
• • Ticketed events, across sports and concerts,
backed by several new properties and a growing
middle class
• • Government events to support its several new
initiatives and the upcoming elections in 2024
• • Weddings and personal events catering to a
growing segment of rich families
►The segment will evolve, as the focus on sustainability
increases
►In addition, to increase event ROI, more events will
convert into year-long communities, with both online

21
Textual trends Audio trends
I. Reach of online news will grow
► In 2023, Comscore data indicates that online news
had a reach of 456 million as compared to 574 million
smartphones in India; by 2026, we expect this reach to
grow to over 500 million
► However, the consumption would not necessarily be on
news apps or portals, but could shift to social media,
D2C apps, aggregator apps or any place with a large
online audience
► Monetization will remain a challenge, as programmatic
rates will remain low, making a case for a focus on
direct deals and premium inventory formats
II. Newspaper reach and readership will start
to stagnate
► Print will reach a steady state with a loyal reader base
within the next three years, most of which will probably
come from the growing base of educated people
entering the workforce who need news and information
to build their careers, as against faithful audiences
ageing
► Cover price increases will lead to a winner-takes-all
situation, with a reduction in second newspaper copies
in the home
III. Print revenues will grow at a CAGR of 3.4%
until 2026
► The growth will take print to INR288 billion, on the
back of premium advertising focusing on hard-to-reach
markets
► We expect to see a 25% growth in average newspaper
cover prices by 2025
► Some products or brands could witness small drops as
their faithful audiences age and cover prices continue to
increase. As stronger brands survive, multiple products
in a household may be rationalized
► Given that most print companies earn less than 5% of
their revenues from digital news products (we estimate
that digital news generates less than INR10 billion,
including digital native brands), the focus of print
companies will remain on the core print product to
increase its utility and appeal to loyal audiences, while
digital initiatives of publishers will evolve into a separate
enterprise that goes wider than just news
I. Segmentation will re-dene monetization
►We expect the market to be driven by three major
segments:
• • The premium segment (top 3% to 5% or so of music
streamers) will pay for music streaming and music
experiences like concerts, themed dining options,
merchandise, etc.
• • The aspirational segment (the next 10% to 15%)
will consume music on ad supported streaming
platforms, television, etc., so long as it comes
bundled with data, e-commerce, or cable television
bundles
• • The mass segment (the rest) will consume only
free and ad supported options like FTA channels,
YouTube, radio, direct to mobile digital signals, etc.,
on their smart phones and/ or feature phones
II. Subscription focus will result in a growing
paid base
► From seven to eight million paid music streaming
subscribers, the segment will grow to 15 million by
2026 if prices remain unchanged and the industry
aligns on incentivizing users to pay
► For further growth, the need to bundle music content,
or price it at an affordable rate around INR1 per day,
will be unavoidable
III. International monetization will improve
► India generates over 85% of its audio revenues from
digital media
► Countries like Nepal, Bangladesh, Pakistan, and Sri
Lanka, are now witnessing/ starting to witness a surge
in digital adoption
► This has led to increased uptake of popular international
platforms like TikTok, YouTube, Instagram, etc., in
these countries and there is a need to monetize this
consumption through industry-level partnerships and
collaborations

Media & entertainment
#Reinvent

23
Why reinvent?
The M&E sector has been evolving at a rapid pace for the last two decades. While transformation and disruption have become a norm
across several subsectors, strong undercurrents have been brewing in the past few quarters, which threaten to completely alter the
landscape. It is hence important to reinvent not just what one is doing but how we are thinking about M&E. The following trends,
frothing below the surface, are likely to force that rethink, if not an overhaul of the current perspective on what we think is M&E.
►Borderless consumption: Whether it be kids MCNs,
web series on OTT, creator content, Indian movies
or international sports, all are moving into a cross
geographical consumption model. Many of them have
over 60-90% of their audience base and more than 40%
of revenues beyond India. Is the media/ content model
focused on cross-over, domestic, native or niche is the
key question which will drive target group planning,
programming and investments in the next 24 months.
►Power = Experience/Time: Audiences today are
demanding a differentiated experience by time of the day.
While they are snacking on social media round the clock,
the new prime time at 10 pm on TV, the 11:30 pm binge
on OTT, or a weekend movie extravaganza, each one is
sacrosanct and demands a differentiated experience. The
they can manage experience by time slots.
►Era of IP: IP (Internet Protocol) is now connecting
multiple screens whether TV, mobile or theater. VAS
models of telcos faced severe disruption as walled
gardens (GSM/ GPRS) broke and networks moved
to IP. The interconnected and two-way nature of
no longer fenced and protected. Content stores which
were a monopoly of Telcos were suddenly taken over by
app stores of digital majors. A similar challenge awaits
broadcasting channels, cable and DTH companies, with
competition from OEMs, telcos, device manufacturers,
creator channels and big tech, all vying for the same
audience. Identifying the guardrails that will help a
channel maintain ratings to survive and thrive in the
IP era will be the distinction between survival and
extinction as several VAS companies found out.
►Cross-platform metrics: The key to survival in an
interconnected IP era is cross platform metrics.
Audiences and advertisers are growing platform-
agnostic and adopting a cross-platform outlook.
Programming for the same audience across multiple
platforms, measuring the consequent consumption,
monetizing a trans-media audience base, etc.
necessitates cross-platform content consumption/
viewership metrics. Those who are investing today in
cross-platform strategies and metrics will dominate
beyond 2026.
►AI (Gen and Generic): The impact of AI cannot be
overstated on the M&E sector. We have a dedicated
section on the same in this report.
►Disintermediation of tools: How a room-size edit suit is
now on the cloud, which enables content to be created,
edited, graded, transcoded, subtitled, and dubbed
implications on the content supply chain. Optimizing
►OS and CPE are the new battlegrounds: If customer
operating system (OS) on consumer-facing screens, or
programming guides on customer premises equipment
Telcos, integrated media houses, OEMs, consumer
electronics and big tech are all battling to control the
media play across Screen OS (Android, Apple, KaiOS,
etc.) along with experience across CTV EPGs/ IPGs will
become critical as CTV audience breaches the 100
million mark.
►High-resolution screens: 4k and 8k screens at home,
and HD and 4k mobile screens, though nascent, will
alter content viewing habits. Demands on content,
bandwidth and theatrical experience will grow over the
next 36 months. Whether the business has a content
strategy for its premium audience that demands a high-
at the top end of the pyramid.
Audience and consumption Digital mediums and platforms
Technology and innovation
Device and screens

Media & entertainment
►Gig economy: Workforce on projects working from
anywhere, as against permanent employees at a central
capabilities, and can be just the power required to scale
►The participative economy: The participative economy
will usher in a democratization of content creation
and content access. A business’ ability to crowdsource
content, to crowdfund its creation and to ensure access
across monetization windows will determine success
across several segments of content creation.
►Creator ecosystems: They have become mainstream
and, will not only continue to occupy a large portion
of social media networks but, begin to integrate their
content creation capabilities with traditional media
networks. The ability to integrate and monetize creator
networks will be critical for continued success of M&E
companies.
►Advertising in a cookie less world: As cookie deprecation
gains scale, media companies will need to rely more on
effective ROI to advertisers. Competing with the big
tech companies can be challenging for players who have
almost no end-consumer data, or only data relating to
their audiences’ content consumption habits. Managing
contextual, psychographic and personalized messaging
will be crucial for success.
►Transaction and participative monetization: Digital
advertising is now the largest share of India’s ad pie, and
performance advertising is the largest component of it.
The SMB advertiser base is expected to grow its digital
ad spends from over INR200 billion in 2023 to INR300
billion by 20261, and transactions will occupy more than
25% of wallet share. Enabling a frictionless transaction
environment will be crucial to survive in a performance-
driven monetization environment.
►Financial investors and capital availability: More
participation will be needed across various aspects of
the M&E sector as it transforms itself, from building the
required digital infrastructure, procuring the required
tech capabilities, and funding content and IP acquisition.
The focus on bottom lines will be higher than we have
value.
►Intellectual property: As tentpole properties continue to
work in an overly multi-media environment, the ability to
invest in IPs which can be monetized over the long term,
massive IPs which need to be nurtured over decades
across regions, will need a new mindset and a different
level of funding.
Many of the above trends can be considered nascent today.
Some are below the radar of quarter-to-quarter focused
businesses but can rise to decimate the status quo. They call
for rethinking our beliefs and perspectives on how content,
platforms, distribution and monetization function. The time
for reinvention has dawned, not just in how the sector is
doing things, but what Media & entertainment will become!
Talent and workforce
Monetization
Value
1EY estimates

25
Disruptions and trends Innovation themes for M&E companies
Video
A billion screens of opportunity
►Active screens will grow to almost 1 billion by
2030, of which 240 million will be large, and
750 million will be small phone screens
►The 240 million large screens will be around
70-80 million each across pay TV, free TV and
connected TV
►Cross-platform programming: Build a multi-media strategy across all
premium products on CTV, to a windowed free TV offering on FreeDish and
FAST products
►CTV play: Build a CTV product (if not yet done), or be part of a paid or
FAST bundle
►Audience measurement: Measure cross-platforms consumption, with a
common metric to demonstrate real RoI to advertisers
Digital video
► Most OTT platforms are currently not
► As online consumption grows, and ad rates
remain low, break-even can be delayed
►Bundling: Create bundles for reach of FAST products across devices,
operating systems, connected TV, OTT aggregators and telcos
►Discovery:
►Efciency: Curtail content costs – consider content at TV+ cost, and
manage churn through TV-like content which has a longer duration
►Competitive scale: Consolidate regional OTT players
Short and social media
►Over half the time spent on phones today is
on social media2
►Majority of marketers use, or plan to use,
3
►Monetization strategy: Build out a short-term and long-term social media
monetization strategy
►Talent leverage:
relationships
Audio
Digital audio
►Audio streamers will double from 185 to over
360 million
►Paid subscriber base will grow from 7.5
million to over 15 million
►Focus on market share: Invest in IP and consolidate smaller regional
libraries
►Reduce cost of funds: Crowdsource funding for new artists
►Discover relevant music:
►Extend fan life-time value:
AI, to retain fans longer
►Leverage OTT audiences: As OTT reaches over 60 million homes by 2023,
build out OTT-related music
Radio
►Time spent out of the home will increase as
urbanization continues
►Mobile handsets are not all equipped with FM
radio receivers
►Manage the existential threat: Enforce regulations to mandate installation
of FM receivers in all phones sold
►Maintain reach: Piggy-back on digital TV/ D2M initiatives
►Leverage communities: Work with regulators to permit bundling of ad
inventory from community radio stations to offer hyper-local regions to
advertisers
innovation will be highest.
Innovation themes
2data.ai
3EY survey of marketers 2023-24

Media & entertainment
Disruptions and trends Innovation themes for M&E companies
Experiential
Live experiences
►61% of marketers expect to increase spends
on events in the next two years4
►Ticketing revenues are now several times
higher than their pre-pandemic levels, and are
5
►Align to brand needs: Create event delivery networks covering the 1
million plus towns of India
►Build communities that matter: Convert event IPs to year-long
engagement platforms and manage them as communities
►Expand geographies: Evaluate the Tier-II town ticketed events opportunity
►Increase focus on the top-end: Bring international events formats to India
Film
►India has less than 10,000 screens, and the
►Less than 100 million Indians visited a cinema
hall in 2023
►Create low-cost capacity: Build infra and content for the next 100 million
audience segment
►Incentivize footfalls: Build out loyalty programs
Online gaming
►Gamers will grow from 455 million to over
500 million
►Casual gaming will grow fastest, spurred by
frictionless in-app purchases
►Global gaming will reach over US$600 billion
by 20306
►Re-evaluate the business model: Reinvent the RMG business model post
GST impact; evaluate a mix of RMG and casual games
►Build scale: Consolidate audiences to provide a scaled casual gaming
audience to advertisers
►Focus on in-app revenues: Create more sachet-priced in-app purchase
offerings, and add value to purchases through rarity and tradability
►Serve global: Build game development and operations service centers to
cater to the world from India
OOH
Digital OOH to grow from 9% in 2023 to 15% of
total OOH revenues
►Build premium offerings: Focus on premium assets and asset clusters
►Dominate markets: Create must-have bundles of assets across cities,
backed by plans that incorporate better measurement and prevent wastage
►Remove demand-side friction: Integrate with digital ad networks and
create self-serve platforms
Text
Print
►Base of new readers is not growing as fast
as it used to, and the second newspaper in a
household will disappear from homes
►Print is perceived as the most trusted news
source
►Environmental concerns will be raised on
production and distribution
►Enhance utility: Focus on hyper-local news, deep analysis, expert opinions,
deals, coupons
►Evangelize credibility: Focus on differentiators and the “10 minutes and
20 pages for success” narrative
►Bundle for reach: Bundle innovatively with digital versions, OTT and other
►Align to advertiser metrics: Own Tier-II and III town consumption growth,
providing a dominant multi-media offering across print, OOH, activations
and radio
►Target SMEs: Tap into the SME powerbase
►Save costs to fund reader acquisition: Share infrastructure (printing,
delivery, newsgathering, etc.) to optimize costs
Online news
►Online news to grow from 456 million to over
508 million by 2026
►Over 60% of online news consumers come
into contact with fake news7
►Partner for efciency:
news and manage ad rates and subscription models for premium news
►Promote branded news: Build on the “credibility” theme with enhanced
fact-checking and moderation processes, and mandate all news to carry an
authenticity score or a manner to verify its authenticity
4EY survey of marketers 2024
5EY survey of event companies
6www.fortunebusinessinsights.com/gaming-market-105730
7DNPA-EY online news survey 2023-24

27
Disruptions and trends Innovation themes for M&E companies
Monetization
Advertising
►SME digital ad spend to cross INR300 billion
by 2026
►Cookie deprecation will reduce the ability to
target audiences as was previously done
►Service SMEs: Implement portals for SME advertisers to create ad content,
plan media buys and even avail funding for their ad spends secured against
sales
►Build 1P data:
to navigate the cookie-less world; evaluate contextual/ psychographic
targeting models
Subscription
►TVOD can grow from INR5 billion to INR20
billion by 2028
►Partner for scale: Form associations and partnerships across established
OTT services, aggregators, payment gateways and app stores with large
captive audiences for TVOD at both a service and sachet content level
Content
Content production
►Demand for premium OTT content to increase
from around 3,000 hours to 4,000 hours by
2026
►In addition, demand for content which costs
as much as, or a little more than, television
content will be 2,000 hours
►Manage price-points: Create production capacity across various price
points – tentpole, TV+ and TV
►Re-think windows: Enable innovative windowing strategies to sweat
content assets more
►Increase cost control: Implement improved rate benchmarking and tighter
cost management, which could help add up to 5% to margins
►Sweat high-cost OTT assets: Syndicate appropriate OTT content to TV
►Leverage creator ecosystems: Leverage large creator ecosystems and
Animation and VFX
►Demand for tentpole properties going up
globally
►An average 25% of consumption of content is
now outside of its original language market8
►Create new-age capacity: Leverage upcoming media cities across India
to create the largest, scaled, post-production and VFX service hub in the
world, focused on AR/ VR, virtual worlds and global content movement,
and build the talent to support
►Create differentiated IP: Build development IP on Unity, Unreal Engine,
etc. to enable differentiated made-in-India products
Infrastructure
Digital infrastructure
►Wired (and similar) home broadband will grow
from around 38 million9 to 70 million by 2026
►Direct to mobile (D2M) technology is being
considered for launch across larger cities
►Leverage the LCO network: Incentivize and fund LCOs to build broadband
networks in their localities
►Increase utility of broadband: Launch content ++ home packages
including interactivity, security, education, etc.
►Plan for D2M: Implement D2M window and monetization strategy
Workflows
►Technology disaggregation is increasing
access to technology and 5G networks
►Cloud-based systems will enable tech
availability at work and at home across
regions
►The M&E sector is one of the largest
adopters of the gig economy style of talent
management
►Re-think supply chains: Evaluate advanced tech systems for edit, DI,
VFX, etc., which can be accessed on cloud or mobile to anyone and
post-production, sound and creative talent can be harnessed across
geographies
Home equipment
►Advent of 4K and 8k technology will create
enjoy high-quality home entertainment
►Create a nupscale strategy: Premium experiences, products and audio-
visual experiences
►Protect cinema-going audience base: Cinemas that cater to top-end
audiences will need to re-invent their offerings to differentiate from high-
quality home infrastructure
8Prime Video India
9TRAI
Note: All numbers are EY estimates unless otherwise mentioned and are meant to be used directionally only.

Media & entertainment
Segmental
trends

29

Television
Catch the headlines with
AI anchor Sana

31
Executive summary
Television segment shrunk 1.8%
in 2023
2022 2023 2024E 2026E
Advertising 318 297 308 330
Distribution 392 399 410 435
Total 710 696 718 765
The television segment has witnessed some interesting, yet dichotomous developments in recent times. Although
the number of pay TV subscribers continue to decline, the overall number of TV viewers continues to grow. While
advertising shrunk, the number of TV screens are growing and the overall segment is expected to have a positive
outlook in the coming times. Viewership of connected TVs would continue to grow and proliferate with the increase
in broadband and 5G. Overall, while the coming times would provide many growth opportunities, the segment would
also face competition from other avenues, such as social media, gaming and short videos.
Advertising
►TV advertising revenue fell 6.5% in 2023
►Advertising volumes declined 2.6% in 2023 as the
number of brands using TV in 2023 fell by over 5% as
compared to 2022; the fall was led by national channels
which witnessed a 9% drop while regional channels ad
volumes remained stable
►Ad rates fell 4% on an average as the advertiser mix
shifted to lower yield categories
Subscription
►Distribution income reversed its falling trend in 2023 to
grow 2%, despite pay TV homes reducing by 2 million
to 118 million (including pirated and under-declared
homes)
►Pay TV ARPUs increased by approximately 4% to reach
INR274 per month (gross of taxes)
►An increase in piracy and under declaration was noticed
as channel price increases could not be entirely passed
on to consumers
►Connected TV sets reached 35 million, of which around
19 million connected to the internet weekly
Viewership and reach
►Time spent on TV increased 2% over 2022, but TV
continued to lose premium properties in 2023 as NCCS
ABC audiences fell 1%
►Number of television channels increased to 899, of
which 61% were free-to-air
Future outlook
►By 2026, television revenues are projected to reach
INR765 billion, with a compound annual growth rate
(CAGR) of 3.2%, approximately half of the expected
►Total TV screens will increase from 182 million in
2023 to 202 million by 2026, with the mix changing
►The situation post 2026 could be quite different, once
wired broadband crosses 60 million to 70 million homes
we expect connected TVs to start scaling more quickly,
and reach 100 million by 2030, while linear TV homes
drop to 140 million, of which 57 million would be free
TV homes

Media & entertainment
Reach
Number of television channels
increased to 899
The number of distribution
platforms rationalized
September
2021
September
2022
December
2023
FTA 558 532 546
Pay 348 353 353
Total channels 906 885 899
December 2020 December 2023
MSO 1,702 998
DTH 5 5
HITS 1 1
MIB website; TRAI Performance Indicators Report
MIB website
►61% of channels were free-to-air in 20231
►News channels comprised 44%2 of total channels
1TRAI with MIB list of FTA channels 2023
2TRAI, MIB – List of permitted private satellite TV channels
►MSO registrations declined by 43% and stood at 998 as
at end of 2023 as per MIB. This reduction of MSO was
on account of non-renewal/ cancellation/ surrender of
registration pursuant to directive from TRAI in guidelines
circulated in December 2022
►The Indian market is serviced by four paid DTH providers
and one free DTH provider as of December 2023
viz. Dish TV, Tata Play, Airtel DTH, Sun Direct and DD
FreeDish
►NXT Digital continues to operate the lone headend in the
sky (HITS) service in India
DD FreeDish continued to be the
largest distribution platform in India
►
channels including 37 Doordarshan channels, 51
educational channels and 79 private channels, apart
from 22 MPEG4 channels3
►Of the above, 17 channels were Hindi general
entertainment channels, there were 18 Hindi movie
►The FreeDish service also delivers All India Radio’s audio
programming content of 49 satellite radio channels
►Four large broadcast networks, Star India, Viacom18
Media, Zee Entertainment Enterprises and Sony
Pictures Networks India, pulled out their Hindi general
entertainment channels from DD FreeDish in early
2022, but still had a total of 13 channels on the
platform
►Our interviews with over 20 dealers of FreeDish
consumer premise equipment indicated that the
demand for customer premise equipment, while still
present, had declined, primarily due to:
• • Fewer channels and limited content being available
on FreeDish
• • Many cost-effective bundles being offered on pay
TV
• • Availability of free content on OTT platforms and
snackable content on YouTube
Date Channel count
December 2018 80
December 2019 104
December 2020 161
December 2021 164
December 2022 179
December 2023 189

33
►YouTube has 61% of TV’s reach across India, but in
certain states has a reach similar to or even higher than
TV, particularly HSM states like Delhi, UP, Bihar and
north-eastern states
►In the southern part of India, TV still commands a fair
lead over YouTube
►Certain broadcasters provide their content on YouTube,
and some DPOs we interviewed felt that this practice
results in the delay in renewal of monthly pay TV
subscriptions
YouTube generated massive reach in
several states
Reach; EY estimates
TN/ Pondicherry
AP/ Telangana
Karnataka
Kerala
Guj/ D&D/ DNH
Mah/ Goa
West Bengal
Odisha
MP/ Chhattisgarh
Assam/ North East/ Sikkim
Rajasthan
Delhi
UP/ Uttarakhand
Bihar/ Jharkhand
North states
-10%
10%
30%
50%
70%
90%
110%
130%
150%
0
10
20
30
40
50
60
70
80
90
100
Reach of TV and YouTube
(select states)
TV reach (millions) YouTube reach (millions)
YouTube to TV reach percentage
►Overall impressions recovered this year to register a 2%
growth over 2022 levels
►While Hindi speaking markets (HSM) saw a jump of 3%,
south markets registered a growth of just 1%
►Viewership of HSM as well as south markets is still not at
2021 levels
►Factors impact growth of time spent on television include:
• • Rising popularity of YouTube, which has around 467
million monthly users as of end of 20234 and provides
a relatively free multi-lingual and individually curated
Indian and global content palette, including certain
premium content from broadcasters and studios
• • Growth of social media, short video and gaming,
which all compete for the consumer’s free time, and
have achieved a reach in excess of 400 million5
• • Availability of high quality and niche content on OTT
streaming platforms, which caters to niche and more
• • Growth of wired and wireless broadband to around 38
million households, and sale of smart TVs, which are
growing consumption on that distribution channel
Television consumption
Overall, time spent on TV increased
2% over 2022
2019 2020 2021 2022 2023
Universe HSM South
1,614 1,731 1,591 1,474 1,50
8
1,007 1,087 979 925 954
608 643 612 548 554

Media & entertainment
►76% of all viewership was linked to GEC and movies, a
ratio which has remained stable for six years
►Sports viewership grew 26% on the back of marquee
properties like the Cricket World Cup, though viewership
of non-cricket sports fell by 39%
►
reduced as consumption has moved to digital media
Over three-fourths of all viewership
was related to escapism
Viewership share by genre
3%
6%
4%
0%
11%
50%
26%
Entertainment
(GEC)
Movies
Sports
News
Music
Infotainment
Others
TV continued to lose afuent
audiences in 2023
Audiences % change
NCCS ABC -1%
NCCS CDE 4%
►
►Lower socio-economic classes (NCCS CDE) grew by 4%
vs 2022, contributing to overall growth in viewership
►A 15% drop was noted in the 15-to-21-year age group,
platforms
►Gujarati and Hindi were the only two languages to
witness a rise in total minutes of viewing of above 5%
►English and Bangla were the most impacted languages
with a fall of above 5%
Viewership of English and Bangla
channels dipped in 2023
Change in viewership by language
2023 vs. 2022
-15% -10% -5% 0% 5% 10% 15%
English
Bangla
Malayalam
Oriya
Bhojpuri
Punjabi
Telugu
Marathi
Tamil
Total
Assamese
Kannada
Hindi
Gujarati

35
►While news viewership grew in 2023, it still remains
over 30% lower than its 2020 levels
►
platform, with the reach of digital news at 456 million
as of December 20236, and consequently, audiences
need to visit TV fewer times a day
►This led to several innovations, including increased
focus on local news, non-news content (entertainment,
sports, travel, etc.) and specials and events
News TV witnessed a 11% growth in
viewership
Viewership of news by language
61
30 31
1
1 1
52
32 36
15
9 12
-
20
40
60
80
100
120
140
2020 2022 2023
Hindi English Regional languages Others
6Comscore
7EY estimates; BARC; TAM AdEX
►Advertising volumes declined 2.6% in 2023
►National channels saw a 9% volume drop, while regional
►The number of brands using TV in 2023 fell by over 5%
compared to 2022
►Average rates fell by 4%, primarily as the share of
lower-yield sectors like FMCG increased while sectors
like gaming, crypto, D2C brands, e-commerce, etc.,
reduced volumes on the medium. In 2023, the FMCG
sector dominated with 16 of the top 20 categories and
18 of the top 20 advertisers by volume
►Television remained the most effective mass medium
from an ad rate perspective
Advertising
TV advertising revenue fell 6.5%7
Ad revenues
320
251
313 318 297
2019 2020 2021 2022 2023

Media & entertainment
►GEC and movie channels garnered 52% of total ad
volumes in 2023, up from 48% in 2022
►GEC channels garnered 30% of ad volumes as compared
to a 50% share of viewership, while news and music
channels managed 37% of ad volumes while generating
just 10% of viewership
FMCG and e-commerce drove the
growth in spends on television
► 47% of ad spends on TV were contributed by FMCG,
which increased its spends during 2023, contributing
73% of absolute change
► E-commerce, education, and telecom sectors
substantially reduced spends on television
► Growth of FMCG spends has primarily been at cost of
high yield sectors like e-commerce, online gaming and
D2C brands
Pitch Madison Advertising Report for 2024
Product category Category
contribution 2022
Category
contribution 2023
FMCG 45% 47%
E-commerce 20% 16%
Auto 5% 6%
Household
durables 4% 4%
Real estate
and home
improvement
4% 4%
services,
insurance
3% 4%
Telecom 3% 3%
Education 4% 2%
Clothing, fashion,
jewelry 2% 2%
Corporate 1% 2%
Retail 1% 1%
Alcoholic
Beverages 1% 1%
Travel & Tourism 0% 0%
Others 7% 8%
Total 100% 100%
TAM AdEX
GEC and news channels garnered
the highest ad volumes in 2023
% share of ad volumes
GEC
News
Movies
Music
Others
Kids
30%
25%
22%
12%
3% 8%

37
►Television subscription revenues in India increased 2%
in 2023, despite a fall of 2 million pay TV homes, due to
an approximately 4% increase in TV subscription ARPUs,
which reached INR274 (gross of taxes) at end-customer
prices during the year8
►While broadcasters increased channel prices uniformly,
ARPU increased differently across markets, in some cases
resulting in an increase in under-declared households/
pirated households9, as LCOs could not pass on price
increases to end consumers
Distribution
Distribution income reversed its
falling trend in 2023
data, EY analysis
*Net of inactive/ temporarily suspended subscribers, but including pirated and
under-declared subscribers
homes from adjusted total TV universe less temporarily deactivated homes
Active paid subscriptions continued
to reduce in 2023
2020 2021 2022 2023
Cable* 72 68 64 62
DTH* 56 55 54 53
HITS* 2 2 2 2
Total pay TV 130 125 120 118
Free TV** 40 43 45 45
Total 171 168 165 163
8EY estimates, industry discussions, TRAI data
9EY estimates
10EY analysis; industry discussions; subscriber reports
11Based on our discussions with suppliers of set top boxes
12https://www.barcindia.co.in/data-insights
468
2019
434
2020
407
2021
392
2022
399
2023
Subscription revenues
►Pay TV homes (including under-declared and pirated
homes) continued to fall, decreasing by two million to
118 million
►The fall in pay television homes has been attributed to
cord-cutting and movement to connected TVs at the top
end of the market, growth of alternate entertainment
options and digital platforms, as well as availability of a
sizeable content bouquet for Hindi speaking markets on
free television (DD FreeDish), which remained stable
in 2023 and provided a competitive offering to the base
pack on pay TV
►Broadcasters whom we interviewed claimed to have
earned revenues for between 105 to 110 million paid
subscriptions in 2023, as compared to 110 to 130
million reported in 2021, indicating a potential base of
pirated connections between 10 and 15 million homes10
►Free television, on the other hand, continued at an
estimated 45 million subscribers on the back of less
expensive television sets, economic issues, and as an
add-on connection to pay TV11
►Free-to-air entertainment channel Dangal was the
most watched channel during some weeks of 2023,
garnering more viewership that segment leaders like
Star Plus, Colors, Zee TV, etc.12
►According to FreeDish distributors we spoke with, year-
on-year growth has remained robust, although demand
was lower than in 2022 due to premium cricket events
and Rupee devaluation increasing cost of hardware

Media & entertainment
13Industry discussions, EY analysis
14EY estimates
15EY publication “India @100”
►We expect television advertising to grow at a CAGR of
3.6% to reach INR330 billion by 2026, driven by:
• • In 2024, television advertising, particularly in news
TV, is expected to rebound due to the occurrence of
general elections
• • Strong performance of regional channels where
preference for local language content
• • Increased investments in sports, led by a revival in
funding for D2C brands as investment cycles revive
post the general elections in 2024
• • Brand extensions by large Indian companies and
international brand launches, all of which require
the reach of TV, as India moves towards becoming
one of the top three economies in the world
(India’s per capita income is expected to grow from
approximately US$2,500 in 2022 to US$3,000 by
202515 which will keep driving consumption and
• • However, risk factors do exist, such as:
• Absence of a new driver sector to replace ad
income lost from sectors such as gaming,
crypto and betting
• Continued proliferation of free digital
platforms like YouTube, particularly if recent
available on it, and the growth of time spent on
social media/ short video
Future outlook
We expect television revenues to
grow to INR765 billion by 2026
TV segment revenues
-
100
200
300
400
500
600
700
800
320
468
2019
251
434
2020
313
407
2021
318
392
2022
297
399
2023
308
410
2024E
330
435
2026E
Ad Subscription
Connected TV sets neared 35 million
►The overall connected TV base reached 30 to 35 million
unique sets connecting to the internet each month, of
which an estimated 19 million connected weekly13
►Seen in context, the reach of connected TVs is now larger
than any individual pay platform in India
►Several platforms and manufacturers have started
providing advertising services on their smart TV
platforms to the extremely desirable “top of pyramid”
audience, both around social media, short video, AVOD
and linear streams
►In addition, increased acceptance of permanent and
temporary work-from-home culture has created a large
“laptop audience”. This might explain why second TV sets
are not being re-connected, and a good case for parity-
pricing between linear feeds on TV and on OTT
►Weekly connected smart TV sets are expected to grow
from 19 to 40 million by 202614, given the continued
growth of wired broadband and 5G connections

39
16Worldometers.info
17
18
19EY estimates
►Subscription income will achieve a CAGR of 2.9%,
reaching 435 billion by 2026. This growth is driven by
• • Television households will grow due to the following
reasons:
•
households from 323 million in 2023 to 332
million till 202616 which will increase the
demand for TV sets
•
middle class by 203117
•
•
particularly in the Hindi speaking markets like
UP and Bihar
• Efforts to reactivate deactivated STBs which
have been initiated by certain private players
•
remains — currently — much in favor of
television
• Availability of television sets for as low as
INR6,00018
hand television market
• • But active television homes will face downward
pressures as well:
•
base to connected TV platforms as broadband
and 5G penetration increase
• LCOs’ focus on growing direct broadband
connections due to a higher margin per
consumer, which makes a strong case for
growing LCO TV margins
• Increased time spent on OTT platforms, social
media and gaming platforms, which are vying
for a share of free time
►In view of the above, we expect total television segment
revenues to grow at a CAGR of 3.2% to reach INR765
billion by 2026, but the picture could change quickly
post 2026 (refer to the rest of this section)
The proposed ad cap rule could
impact revenues
► The Telecom Regulatory Authority of India (TRAI)
has approached the Delhi High Court against seeking
stricter implementation of the 12-minute ad cap rule,
currently sub judice
►
ad volumes, especially for news channels and some
entertainment channels for their key impact properties,
that have been historically airing ads for more than the
earlier prescribed limit of 12 minutes per hour
►To compensate for the drop in revenue due to limited ad
10-15% drop in ad revenues19

Media & entertainment
►Overall TV connections will keep growing at a healthy
pace to reach 202 million by 2026 as India’s per capita
income continues to grow
►The market is clearly segmenting into pay TV, free TV
and connected TV, each being sizable in itself
►Content studios, broadcasters and distributors will
need to address the needs of each of these segments
separately, to effectively monetize their products and
services
►Innovation is required on Pay TV content (and bundling)
to ensure the fall in audience is not higher, an area
where many broadcasters have reduced focus in recent
years, as they focussed on gaining OTT audiences with
differently created content
►There is a need to create custom viewing products for
connected television consumers who need more than
just linear feeds, particularly in genres like news and
infotainment
►Windowing and other strategies can help monetize
the free television audience as well, which is growing
due to increased channel count and entry into regional
language markets like Bhojpuri, Bangla, Haryanvi,
Oriya, etc.
►Distribution companies have found that bundling
broadband with television is increasing consumer
stickiness to pay TV, and that could also be a strategy
for DPOs to consider
As TV screens grow, strategy will
need to dissect
2020 2021 2022 2023 2026E
Pay TV (cable +
DTH + HITS) 131 125 120 118 113
Free TV 40 43 45 45 50
Unidirectional
TV 171 168 165 163 162
Connected TV
(bi-directional) 5 10 15 19 40
Total TV 176 178 180 182 202
Entertainment genre growth will
require innovation and incentives
►Multi-window innovation, i.e., packaging and pricing
across the three TV consumer segments, needs to be
implemented
►Broadcasters will need to create smart bundles – at
differential price points – for different regions and
audiences, subject to regulatory permissions
►
choose/ replace channels within bundles in order to
prevent churn
►TV content distributed through OTT platforms could
be placed behind a paywall, and not be provided free
of cost online along with its TV broadcast, except for
those who have subscribed to the channel on TV , or as
delayed catch-up viewing
►OTT and short video content can be used to create
metro-centric television channels
►Public-private partnership can enable TV dark homes to
buy televisions through incentives such as:
• • Free distribution of sets under government
programs in border/ sensitive areas
• • Subsidized distribution of sets and STBs
• • Creating a low-cost India TV plus receiver product
►Industry action is required to enable activation of the
current base of several million deactivated boxes which
some estimate to be 20 million in number
►Increased adoption of HD hardware needs to be
incentivized to enable premiumization
#Reinventing TV

41
►We expect total TV subscriptions to grow and reach
210 to 240 million by 2030, on the back of Indian
households growing at a CAGR of 1% and wired (or
similar) broadband homes reaching 100 million on the
back of falling ARPUs, which will remain at INR700 per
month in the medium term, or roughly two times the
average pay TV rates
►Once wired broadband connections (already 38 million
as per TRAI data) cross 60 to 70 million, and 5G
connections cross 250 million (which we expect to be in
2026 or 2027), the rate of adoption of connected TVs
pressure on Pay TV homes, which will fall to around 83
million by 2030, or two-thirds their peak of 130 million
►Once OTT bundling picks up scale, and pricing parity
between OTT and linear TV is more pronounced, the
impact on TV homes could be more
►In effect, CTV would be the largest distributor of
content on large screens by 2030, but broadcasters
would be competing with not just each other on the CTV
platform, but also social media, short video, gaming,
of products and re-engineering organizations towards
audience segments
►TV measurement would need to be called “large screen”
measurement, and a common metric (perhaps, the
CPM) would need to emerge to enable better planning,
party consumer data at scale
►Sales would move to an audience reach and frequency
metric, across platforms and segmented audiences
►Introduction of massive measurement, perhaps using
the household level return-path data method, would
be important to manage segmentation and split the
broadcast ad beams
►As news consumption moves to online video and text,
and youth consume news on social platforms, news
media will need to re-think their content, monetization
and measurement strategies
►Content will need to be created multi-format and multi-
media, and separately for younger audiences and for
different segments
►Premium and mass audiences would require different
products and pricing
►Alternate revenue streams like IP, branded content, and
exclusive products will need to be introduced
►News will also move to a “News+” content model,
covering a wider variety of themes to reach wider
audiences
►Given the disruption in consumption, and inability to
be optimized
►Sales will need to move to an aggregate audience basis,
for which measurement will need to aggregate linear
TV, connected TV, YouTube and social media audiences,
and web-site and app audiences
►The fall in kids TV advertising over the last two years
will continue
►Kids studios will need to go across connected TV, free
TV, OTT aggregators as well as YouTube to continue to
engage with large sections of kids audiences who may
not be on pay TV
►YouTube will be key for monetization and will need
dedicated programming
The situation in 2030 could be quite
different
News TV will rethink business
models
Kids TV will focus on access
2023 2026E 2030E
Pay TV (cable +
DTH + HITS) 118 113 83
Free TV 45 50 57
Unidirectional
TV 163 162 140
Connected TV
(bi-directional) 20 40 70-100
Total TV 183 202 210-240

Media & entertainment
Powered by Samsung Ads
India connected TV
Trends
Reach
Viewership
Ad-supported platforms dominated viewership
534.4
5.1
hours 99%
Average streaming
apps per household
Total hours spent
watching OTT per TV
per month
Total hours spent
watching linear TV per
TV per month
Consumed both linear
TV and OTT content
Of all streaming
time was on the
top 10 apps
y-o-y increase in active
Samsung smart
TVs in India
Source: Samsung Ads proprietary ACR data India 2023. Viewership is Weighted average viewing time per category. All data has been provided by Samsung Ads to EY
y-o-y decline in
connected dongles
Increase in the number of devices
watching AVOD, compared to a
45% increase for SVOD
37% 47% 47%
watched
only OTT
watched only
linear TV
17%
9% 74%
SVOD
19%
AVOD/ FAST 81%
Share of total
streaming hours
11
61 63
Linear SVOD AVOD/ FAST
Average viewership (Minutes per day)

43

Media & entertainment
All data has been provided by BARC India and is based on their research. The data has not been independently validated by EY and is presented in summary
form for representative purposes only
average viewing minutes
weekly average viewing minutes
Powered by
Television viewership
Trends
Aggregated viewership of 1.51 trillion gross
AMA was generated watching television in India
Up 2% from 2022
At 44%, Hindi remained the most viewed
language on television
56% of viewership was in Indian regional languages
Average time spent on TV increased
English language channels saw the largest fall in viewership in 2023
81% of the TV viewership was people
under 50 years of age
Up from 79% in 2022
1,731 1,591 1,474 1,508
1,087 979 925 954
643 612 548 554
2020 2021 2022 2023
Universe HSM South
Total TV viewership
AMA (in billions) aggregated across 30 min slots |
All India 2+ | Wk1 to Wk52
Age-wise TV viewership
AMA (in billions) aggregated across 30 min slots |
All India 2+ | Wk1 to Wk52
301 352
2-14
420 424
15-30
450 453
31-50
164 143
51-60
139 136
61+
2022 2023
Percentage change in viewership 2023 vs. 2022
Gujarati
Multiple
Hindi
Kannada
Assamese
Total
Tamil
Marathi
Telugu
Punjabi
Bhojpuri
Oriya
Malayalam
Bangla
English
15%
9% 9%
3% 2% 2% 1% 1% 1% 1% 1%
-2% -3% -5%
-11%
All India 2+ | Wk1 to Wk52 | AMA (weekly average)
2023
(2022)
Weekly
cume reach
(million)
Average
time spent
Weekly AMA
(billion)
India 757 (760) 3:41:39
(3:35:00) 29.0 (28.3)
HSM 520 (523) 3:29:25
(3:21:17) 18.3 (17.8)
South 237 (237) 4:06:25
(4:02:54) 10.7 (10.5)
Share of language viewership
21%
35%
43%
24%
42%
22%
1%
1%
1%
34%
34%
44%
Other
languages
English
South
Indian
languages
Hindi
202320222021

45
FMCG sector contributed 66% of ad volumes
Up 3% from 2022
Share of
ad volume
75% of
viewership
was for
entertainment
genre
Top 20 advertisers in 2023
contributed 50% of total ad volumes on television
FMCG: baby care, food & beverages, hair care, household products, laundry,
personal care/ personal hygiene, personal healthcare, cosmetics; Education:
excludes online and digital classroom
Over 3 of 4 minutes consumed on TV
was on entertainment
India- 2+ weekly average AMA’000s Wk1 to Wk52
9%
66%
3%
3%
2%
2%
1%
1%
10%
1%
1%
1%
Miscellaneous
Media
Corporate/ brand image
Textiles/ clothing
Education
Retail
Durables
Banking/ finance/ investment
Personal accessories
Auto
Building, industrial & land materials/ equipments
Services
FMCG
0%
Rank Advertiser 2022 2023
1Reckitt Benckiser (India) Ltd 211 217
2Hindustan Lever Ltd 187 207
3Godrej Consumer Products Ltd 48 69
4Brooke Bond Lipton India Ltd 39 45
5Cadburys India Ltd 39 40
6ITC Ltd 25 32
7Ponds India 31 29
8Procter & Gamble 26 27
9Coca Cola India Ltd 38 27
10 Procter & Gamble Home Products 19 25
11 Colgate Palmolive India Ltd 20 19
12 Pepsi Co 19 19
13 Wipro Ltd 13 19
14 Britannia Industries Ltd 16 18
15 Nestle India Limited NA 17
16 Amazon online India Pvt Ltd 19 15
17 Govt of Punjab NA 14
18 Glaxo Smithkline 14 13
19 Marico Ltd 15 13
20 Lakme Lever Ltd 12 13
Tota l 820 877
Genre 2022 2023
Entertainment (GEC) 49% 50%
Movies 25% 26%
News 6% 6%
Music 4% 4%
Sports 3% 3%
Infotainment 0% 0%
Others 12% 11%
Entertainment
(GEC+Movies)
News
Music
Sports
Others 11%
4%
4%
6%
75%

Media & entertainment
TV advertising
Trends
Powered by TAM AdEX
(A division of TAM Media Research)
TAM Media research. TAM AdEX’s data pertaining to 600+ television channels for Jan to Dec 2023. December data is till the 29th. Volumes are in seconds unless
otherwise stated. The data has been provided by TAM Media Research to EY and has not been independently veried by EY
ad volumes
While overall ad volumes on TV fell 3%
The number of advertisers on television
dipped to below 2021 levels
In 2023, regional channels
broadcast 31% more ad volumes
than national channels
Ad volumes on national channels fell by 9%
162 categories increased ad volumes
on TV compared to other media in 2023
The top two advertisers contributed 30%
of TV advertising volumes
Up from 23% in 2022
Two-thirds of non-program inventory
remained commercialized
A third was used for channel and program promos
News25%
GEC
Kids
30%
Movies
Music
22%
12% 3%
Others
8% Only promotional
Only commercial
32%
68%
2021 2022 2023
Categories 486 480 467
Advertisers 8,932 9,245 8,477
Brands 13,698 14,180 13,381
Rank Top 10 categories
1Toilet soaps
2
3Washing powders/ liquids
4 Tooth pastes
5 Milk beverages
6 Biscuits
7 Shampoos
8 Chocolates
9Tea
10 Rubs and balms
814 hours
average ad volume/
channel per year
Regional
National
622 hours
average ad volume/
channel per year
Rank Top ve advertisers Share
1 Hindustan Unilever 17%
2 Reckitt Benckiser India 13%
3 Godrej Consumer Products 4%
4 Procter & Gamble 3%
5 Cadburys India 2%

47
sectors contributed 70% of volumes
Top three sectors encompassed more than 50% of advertising on TV
categories contributed 20% of total ad volumes
Up from 17% in 2022
28% of commercial ads were endorsed by celebrities
Down from 29% in 2022
Rank 2022 2023
Top ve sectors Share Top ve sectors Share
1Food and beverages 21% Food and beverages 22%
2Services 16% Personal care/ personal hygiene 18%
3Personal care/ personal hygiene 15% Services 13%
4Household products 8% Household products 9%
5Personal healthcare 8% Personal healthcare 7%
Rank 2022 2023
Top ve categories Share Top ve categories Share
1Toilet soaps 4% Toilet soaps 7%
2 4% 4%
3Ecom-media/ entertainment/ social media 3% Washing powders/ liquids 3%
4Milk beverages 3% Ecom-media/ entertainment/ social media 3%
5Washing powders/ liquids 3% Tooth pastes 3%
Top ve celebrities Share Top ve TV celebrities Share Top ve sports celebrities Share
Akshay Kumar 10% Manoj Pahwa 17% Virat Kohli 20%
Amitabh Bachchan 5% Karan Wahi 12% M S Dhoni 17%
Anushka Sharma 4% Ronit Roy 10% Sachin Tendulkar 6%
Ranveer Singh 4% Pooja Gaur 8% Sourav Ganguly 6%
Alia Bhatt 4% Kapil Sharma 7% Ravi Shastri 5%

Expert
speak
The surging ascent of Connected TVs marks a pivotal shift
in media consumption, providing unparalleled engagement
for audiences and a wealth of opportunities for Advertisers.
This trajectory sets the stage for an era characterized by
innovation and seamless connectivity
Arjun Nohwar
Warner Bros. Discovery
The M&E landscape in India is conducive for businesses
to build robust and scalable models for the future that
amalgam creativity, technology and monetization in a
seamless manner. Amidst this, understanding the pulse
of the audience, to deliver personalised and innovative
experiences across platforms, will play a crucial role in
determining success.
Punit Goenka
ZEE Entertainment
Enterprises Ltd.
This year marks a pivotal moment for the M&E industry,
with companies recalibrating strategies with a focus
on scaling for long-term growth, enhancing viewer
choices at diverse price points, and embracing emerging
technologies, including Gen AI.
NP Singh
Culver Max Entertainment
The Indian economy is displaying immense buoyancy,
and the continued growth momentum will spur revenue
maximisation opportunities for the sector going. The
real potential of the industry is set to unlock as content
distribution and monetization models evolve, resulting in
higher ROI for all partners in the media value chain.
Rahul Johri
ZEE Entertainment
Enterprises Ltd.

The challenges of the news television industry are
only going to grow, and they need to be addressed.
Our focus going forward will be on cost reduction,
boosting alternative sources of revenue like subscription
revenue, and adoption of technologies like AI for better
productivity and innovation.
Barun Das
TV9 Network
The battle for eyeballs between TV and digital will only
intensify. Collaboration between media companies,
telecom operators, and tech giants will become more
common as stakeholders seek to leverage each other’s
strengths and resources to add impetus to the entire
media value chain.
Aditya Pittie
IN10 Media Network
In the absence of a reliable census since 13 years and
Covid-induced disruptions, most data points are extra-
extrapolations. Digital is no different with adex and user
data largely self-declared. Data is the bedrock of the
media business for objective in decision making which is
otherwise prone to the sensitivities of the chief decision
maker in organisations.
Avinash Kaul
Network18
I foresee a data-driven future and ISEC migration will
be crucial in establishing quality audiences on the news
genre. Responsible content will bolster news brands -
brands built around trust will combat misinformation.
D2M is another big lever that could exponentially boost
the reach of the genre.
Kalli Purie
India Today Group
In the evolving media landscape, visionary storytellers
unite diverse audiences. Embracing tech and diverse
narratives will create connections, unlocking opportunities.
Innovation and collaboration will be essential for thriving
in our ever-changing media ecosystem.
Avinash Pandey
ABP Network
India’s ME sector stands at a cusp of embracing new age
content, platforms and audience profile. This evolution
provides industry leaders an exciting opportunity to
create a society that is aware, agile and adaptive.
Gaurav Dwivedi
Prasar Bharati

Television viewership in 2023 has grown smartly versus
2022 and currently exceeds even 2021 ratings. Marquee
events like IPL have seen large growth in viewership. Not
to take away the performance of other screens – but TV
continues be the definitive screen for Indian homes.
Nakul Chopra
BARC
The year ahead should be more balanced, bringing with it
coexistence of traditional and new age products with an
enhanced customer experience. Strategic agility will be
critical for success.
Manoj Dobhal
DishTV India Limited
Availability of same content as pay and free has been
behind the stagnation of the pay industry, TV and OTT. If
content owners correct that, the industry will grow again.
Harit Nagpal
Tata Play Ltd.
Vynsley Fernandes
Hinduja Global Solutions
Limited
With digital saturation expected to slowly envelop the
consumer footprint, distribution companies are directing
their focus on retention strategies that extend well beyond
the realm of discounts. Integrated product offerings – like
bundled broadband, television, & OTT could soon become
the “de rigeur” offering to consumers.
Evolving consumer preferences, increased internet access,
and emerging technologies are fast reshaping M&E in
India. With the emergence of access to technologies like
5G, Fiber, and Satellite, a sizeable section of consumers
are enjoying seamless streaming of higher quality
content, thus unlocking new opportunities for the sector.
Siddharth Sharma
Airtel

Regulatory forbearance is critical for the Pay TV universe,
allowing broadcasters to unleash their creativity and
produce top-quality sports and entertainment content.
An environment of choice and flexibility will enable an
ecosystem which will continuously engage and captivate
consumers, driving growth and innovation in the
industry.
Gurjeev Singh Kapoor
Disney Star
Linear TV being economic, having easy content
accessibility and stable connectivity continues to be a
platform of choice for the masses. With media penetration
less than 70% and increased disposable income, rural
India provides the next big opportunity for growth.
Rajesh Kaul
Culver Max Entertainment
Subscribers continue to be discerning and opt for
distribution platforms that they think are the best for their
needs. The landscape is throwing up challenges every day
but in the mid to long term all forms of video distribution
shall co-exist.
Amit Arora
Indiacast
The focus on an AVOD ecosystem (especially on sports)
will continue, but will have to be balanced with SVOD
economics, as AVOD will remain brutal with Big Tech
dictating the CPMs. Aggregation/ bundling of apps and
consumer convenience will be a key focus to grow the
SVOD business.
Anuj Gandhi
Plug & Play Entertainment
The implementation of NTO 3.0 coupled with the growth
of the pay-TV ecosystem across households, signifies
positive mid to long-term growth for linear subscription
revenues. A well-balanced approach towards pricing and
quality content will determine the consumer’s platform of
choice.
Atul Das
ZEE Entertainment
Enterprises Ltd.

As India leans into premiumization, high-quality
content and immersive experiences ensure growth
across traditional and modern platforms, supported
by integrated technology, AI, and data privacy. Brands
will be willing to invest more for stronger consumer
connections and transactions compared to alternative
content or data aggregation methods.
Ajit Varghese
Disney Star
All macro-economic indicators are pointing towards
higher consumption levels, which will lead to a significant
rise in AdEx across markets. Leveraging the synergies
between TV & digital to improve yield and generate high
ROI will enable advertisers to have a sustained presence
throughout the year.
Ashish Sehgal
ZEE Entertainment
Enterprises Ltd.
While a digital presence grabs attention in today’s fast-
paced world, television brings credibility and prestige
that helps build enduring brands. Key is to shift from
digital vs. TV to a digital and TV mindset for powerful
brand impact.
Sandeep Mehrotra
Culver Max Entertainment
The industry anticipates sustained growth, fueled by
India’s resilience amidst global challenges and a positive
consumer outlook. Consumer demand is expected to be
strong across urban and rural markets. Advertisers will
continue to invest in growth with increased ad spends,
making 2024 a promising year.”
Mahesh Shetty
Viacom18 Media


Media & entertainment
Digital media
Catch the headlines with
AI anchor Sana

55
Executive summary
Digital media growth halved to 15%
in 20231
India recorded 1.19 billion telecom subscriptions, which indicates a stable digital infrastructure landscape. Although 5G
proliferated, with 130 million subscriptions, 4G continues to dominate the market. Connected TV saw a 50% growth as internet
penetration continues to rise. The broadband market is growing with subscriptions numbers recording 904 million. It is inevitable
that smartphone users have grown and consequently, the average usage time continues to rise. Despite high app downloads
of 26.4 billion, India was behind in monetizing this potential, with users spending half their time on social media apps. Video
viewership progressed, while content platforms focused on localizing, particularly in popular genres of drama, action and thrillers.
Enhanced digital engagement led to different patterns in content consumption and advertising. The year also saw the growth of
digital ad spending by 15%, predominantly in search and social media. By 2026, the digital segment is expected to grow to INR955
billion with an increased focus on governance.
Service 2022 2023 2024E 2026E
Advertising 499 576 662 842
Subscription 72 78 89 114
Total 571 654 751 955
I. Digital infrastructure
►
2023
►
4G subscriptions still dominated
►
subscriptions in December 2023
►
of which 96% were mobile connections, and only 38
million Indian households had a wired broadband
connection
►
from 538 million in 2022, a penetration of around 40%
of India’s population
►
to 30 to 35 million in 2023, of which 19 to 20 million
connected weekly
II. Online consumption
►
their phones in 2023 than in 2020
►
in the world, downloaded the second highest number
of apps, yet in terms of revenue, India lagged many
smaller markets and did not feature in the top 20
revenue generating markets of 2023
►
media and another 28% on entertainment and news
►
grew 24% to reach 31GB in 2023, and this is set to
increase at a CAGR of 16% to reach 75GB by 2029
III. Online video
►
reach 563 million
►
produced for streaming platforms, of which 52% was in
regional languages, up from 47% in 2021
►
INR125 billion in 2022, of which 51% was on sports
►
streaming platforms in 2023
IV. Online audio
►
only 7 to 8 million paid for a subscription
►
monetization remained limited
V. Online news
►
of which over 80% consumed news on their mobile
phones
►
generating just INR19 billion in ad revenue and around
INR2 billion in subscriptions
VI. Social media
►
reaching 482 million people
►
and used it to meet their needs across news, social,
entertainment, music and gaming
1EY estimate based on industry discussions

Media & entertainment
Future outlook
VII. Digital advertising grew 15% in 2023 to
reach INR576 billion
►
media, with search and social media comprising 72% of
total ad revenues
►
advertisers spent over INR200 billion on digital media,
primarily on performance advertising on Google, Meta,
and e-commerce platforms
►
budgets on digital media
VIII. Digital subscription grew 9% to reach
INR78 billion
►
reach INR72.6 billion as premium cricket properties
were moved in front of paywalls
►
other OTT platforms, paid video subscriptions reduced
by two million in 2023 to 97 million, across 43 million
households in India
►
industry efforts in that direction
►
by premium and exclusive content
►
consumers remained less than 15% and 5% for video
and audio, respectively
►
INR955 billion by 2026, at a 13.5% CAGR
►
to reduce the gap with television, and we expect it to
become the largest segment in 2024
►
INR842 billion, on the back of improved governance
►
grow from INR208 billion in 2023 to INR304 billion by
2026
►
INR150 billion by 2026, while entertainment and sports
OTT platforms will reach INR80 to INR90 billion in
advertising
►
struggle unless loyal, app-based audiences are built
►
INR114 billion in 2026, impacted by the focus on ad-
supported platforms
►
across 65 million households by 2026. This will be
driven by the bundling of multiple services
►
►
by 2026
►
properties, and low-cost content

57
I. Telecom subscriptions remained stable at
1.19 billion in 20232
Digital infrastructure
Over a billion telecom subscriptions
►
December 2023 as compared to 1.17 billion in
December 2022
►
subscriptions were 44%
►
urban areas (133%) as compared to just 58% in rural
areas
TRAI, EY estimates
Ericsson mobility report, November 2023 and 2022
II. 5G reached 130 million subscriptions,
though 4G still dominated
►
subscriptions are expected to reach 130 million in
2023, fueled by fast-growing network availability,
affordable service plans and growing availability of 5G
smartphones
►
while 15% of subscriptions were still using 2G or 3G
technology in 2023
►
feature phones as well3
652 660
518 527
Dec 2022 Dec 2023E
Telecom subscriptions (in million)
Urban Rural
2% 11%
72%
74%
22% 12%
0%
20%
40%
60%
80%
100%
2022 2023
Subscriptions by type of network
5G 4G 3G 2G
2TRAI and EY estimates
3Industry discussions, ICEA

Media & entertainment
TRAI, EY estimates
TRAI, EY estimates
Internet subscriptions
(in million)
Dec
2021
Dec
2022
Dec
2023E
Narrowband (a) 37 34 34
Broadband (b) 792 832 904
Urban (a) 496 516 554
Rural (b) 333 350 384
Total (a+b) 829 866 938
Broadband
subscriptions (in million)
Dec
2021
Dec
2022
Dec
2023E
Wired broadband 26 32 38
Wireless broadband 766 800 866
Total broadband 792 832 904
4TRAI, EY estimates
5https://pib.gov.in/PressReleasePage.aspx?PRID=1847835, bbnl.nic.in
6https://www.speedtest.net/global-index/india
7.3
6.0
5.9
5.4
5.0
4.6
2.1
1.5
0.4
0.2
0.2
0.02
Switzerland
United States
New Zealand
Canada
South Korea
United Arab
Emirates
Germany
Saudi Arabia
Australia
France
India
Israel
Average cost of 1GB of mobile data in 2023 (US$)
III. Internet penetration increased by 8%
►
from 74% in December 20224
►
of which 4% used wired broadband and the rest used
wireless services
►
►
of all internet subscriptions, grew 7% while rural
subscriptions grew by 10%. In 2023, the government
approved an outlay of INR1.39 trillion for BharatNet,
the government’s project for last-mile connectivity
across 6.4 lakh villages in the country5
IV. Broadband subscriptions reached 904
million
►
has the second largest broadband subscriber base in
the world, after China
►
broadband connection
►
2023, India ranked 22nd in the world for mobile speeds
mobile internet connection speed via cellular networks
speed at 60.13 Mbps6
V. India was among nations that had the
lowest data charges in the world
►
telecom internet user base, and consequently, the
growth being witnessed across online entertainment,
audio streaming, gaming, social media, etc.
►
(a) subscriptions with low utilization being deactivated,
(b) slower growth in internet reach and (c) increase in
television reach and time spent

59
EY estimates
EY analysis
Smart device growth continued
I. Smartphone users reached 574 million in
2023
►At 574 million, around 40% of India’s population uses
smartphones
►Smartphone prices have remained high since 2022,
tapering growth rates, though prices may come down in
2023 as the Indian government reduced import duties
on certain components used in smartphone production
from 15% to 10%6A
II. Connected TVs grew 50%7
►
TV sets8
►
connections and tentpole sports events like the ICC
Cricket World Cup, IPL and FIFA World Cup with
advanced engagement features have helped drive sale
of connected TVs
III. Android remained the most preferred
operating system in India9
►
with December 2022, whereas Android and others
decreased marginally
6A
7Industry discussion; EY estimates
8Counterpoint research, https://www.counterpointresearch.com/insights/india-smart-tv-shipments-h1-2023/
9Mobile Operating System Market Share India”, Statcounter, https://gs.statcounter.com/os-market-share/mobile/india/#monthly-202212-202312-bar, accessed 17
448
2020
503
2021
538
2022
574
2023
Smartphones in India (millions)
9
13
19.5
15
25
35
2021 2022 2023
Connected TVs (millions)
Weekly active sets Monthly active sets
Share of web-page requests originating
from mobile handsets
95.2% | Android
4.0% | iOS
0.7% | KaiOS
0.1% | Others

Media & entertainment
Content consumption
Overall consumption trends
I. Indians spent 4.8 hours a day on their phones
►
for the most amount of time spent on phone apps in
2023, a 9% growth since 2020
►
their mobile phones in 2023, up 10% from 1.08 trillion
hours in 202210, which was the highest in the world
II. Indians downloaded 26.4 billion apps in 2023, but India lagged on monetization
Indonesia Thailand Argentina Saudi Arabia Brazil India Mexico Singapore South Korea Turkey
6.1 5.6 5.3 5.3 5.0 4.8 4.7 4.5 4.5 4.5
Average hours per day spent on phones
China India US Brazil Indonesia Russia Mexico Turkey Pakistan Philippines
113.4
26.4
12.6 10.3 7.6 5.6 5.2 3.9 3.5 3.4
App downloads (in billion)
10State of Mobile 2024, Data.ai, Hours spent are android phones only

61
In billion China India US Brazil South
Korea
Japan
Downloads 113.4 26.4 12.6 10.3 1.91 2.51
Hours
spent11
1,122 1,193 217 265 61 57
Consumer
spend (US$)12
52.1 0.6 45.0 1.7 7.9 17.9
►
mobile apps, overtaking China
►
compared to many smaller markets and did not feature
in the top 20 revenue generating markets of 2023
III. Indians spent half their time on social
media apps
►
is on media and entertainment
►
spent, up from 42% in 201913 on the back of growth
in short video content created around news, music,
entertainment and gaming
►
shopping, etc.
IV. Average mobile data consumption
increased 24% in 202314
►
smartphone was 31GB per month in 2023, and this
is set to increase at a CAGR of 16% to reach 75GB by
2029
►
which grew to 85% of total subscriptions as compared
to 74% in 2022
►
forecast to increase to 76% by 2029
►
video and gaming, contribute to over 75% of data
consumption in India15
11Android phones only
12Gross of any app store commissions
13FICCI-EY CY2019 report
14Ericsson Mobility Report, November 2023 and 2022
15Industry discussions; EY estimates
Time spent on apps in India (2023)
Social &
communication
50%
Other 22%
M&E 28%

Media & entertainment
I. Online video viewers continued to grow in
India
EY estimates
EY content services team estimates
►
563 million, which is around 98% of smartphone owners
and wired broadband subscribers
►
►
has 467 million users, i.e., 18.7% of its global users from
India16
II. Platforms increasingly invested in localizing
content
►
from 47% in 2021 to 52% in 2023
►
industry discussions indicate that between 20% and 50%
of consumers now consume content in more than one
language using sub-titles and dubbed versions
►
focusing on at least eight to nine languages, and each
language will require at least eight to ten pieces of
III. Drama, crime, action and thrillers were the
predominant genres in OTT
►
drama, crime or action genres
►The number of reality shows was lower, but they pulled
in very large audiences, and we expect these to increase
in 2024
►A surge in demand for mythologies and documentaries
was also noted in 2023
Video viewers (in million)
450
497 527 563
728
2020 2021 2022 2023 2026E
OTT titles produced by language
53%
47%
2021
50%
50%
2022
48%
52%
2023
Hindi Other languages
16https://www.demandsage.com/youtube-stats/
Genre wise content releases on OTT
0% 20% 40% 60% 80%
Horror
Others
Mythology/
documentary
Reality
Romance
Comedy
Drama/ crime/
thriller/ action
20232022
Online video

63
I. Audio streaming users remained in the
185 to 200 million range
►
online in 2023 compared to 208 million in 202219
►
were international songs, while 85% were domestic, and
20
►
accounts for 27% of total music consumed on online
platforms
II. Paying consumers increased
EY estimates
IV. Approximately half of all OTT content
spend was on sports rights
►
produced for streaming platforms, which has remained
►
INR125 billion in 2023, representing a 52% increase
over 2022 due to more than a twofold growth in sports
rights values
►
prices to performance
V. Fewer lms released directly on digital
platforms in 202317
►
to digital releases halved to just 57
VI. Online sports grew FAST
►
subsequently on Disney+Hotstar (World Cup), resulting
in massive growth in online sports audiences
• • Sports18 claimed 449 million people watched the
used connected TVs
• •
over 13 billion video views and an average time of
60 minutes per match
• • Disney+ Hotstar claimed 59 million concurrent
match18
►
television (FAST) product on mobile phones created a
massive supply of inventory as viewership spiked, and
enabled segmentation of mobile and connected TV
audiences for sharper ad targeting
►
to around 7.5 million in 2023, as certain platforms
stopped ad supported music consumption, while others
like Spotify worked to incentivize free consumers to
subscribe for a better experience21
►
rates to incentivise conversion
►
date, which has led to the push to convert free into paid
subscribers
►
as being bundled for free with telco and e-commerce
subscriptions, the task of growing paid subscribers will
remain a challenge in the near term
17EY production audit team estimates
18Various online news articles
19Comscore; industry discussions
20IPRS, based on 9 month data from select platforms
21EY estimates
Break-up of OTT content cost
Originals
25%
Sports rights 51%
Film rights
24%
Paying music OTT subscriptions
(in million)
2.0
3.0
4.6
7.0
2020 2021 2022 2023
Online audio

Media & entertainment
I. Online news audience was 456 million in
202322
►
population23
►
while 50% were NCCS AB audiences
II. News consumption was primarily mobile
driven
►
online news, comprising 86% of total reach
►
14% was on apps
►
consuming news each month, with short video and
short text being the most preferred formats for
consumption
►
platforms to consume online news, and 38% of them
consumed news more than once a day
►
III. Six online news platforms exceeded the
100 million mark
does not include Google News; aggregated across key platforms at a group
level, average across 2023
Average monthly active users (million)
Times Internet Limited
Network 18
Zee Digital
HT Media Group
India Today Group
Dailyhunt
The Indian Express Group
Jagran New Media
ABP Network
Amarujala Group
Inshorts
The Hindu Group
Bhaskar Group Sites
IndiaTV Group Sites
281
211181
125122104
78 76 75 46 43 42 35 30
22DNPA-EY report “Monetizing online news” February 2024
23EY analysis, Comscore, TRAI
III. Audiobook and podcasting consumption
increased
►
FM gained popularity — both platforms had more than
10 million downloads on Google’s Play store
►
like stories, education, spirituality, adult content, life
skills, business help, health and many other genres
►
narration styles, resulting in an increase in engagement
among listeners who prefer culturally relevant
experiences
►
like Audible, Pratilipi, etc. (which had the highest
engagement levels), OTT music apps like Spotify, but
the fastest growing format was YouTube, where audio
content was given a massive reach
Online news

65
►
among legacy news companies, while Dailyhunt had the
highest MAU among news aggregators
►
publishers had an extremely low proportion of app-
based audiences
►
now social media. A survey of online news consumers
indicated that 79% consumed news on or via social
media24
►
of their MAUs on their websites25
arbitrage business with extremely high churn
IV. Hyperlocal news content services
continued to grow
►
showed interest in hyperlocal news, with the highest
from Hindi and Gujarati language users26
►
had built hyperlocal news products to differentiate from
mainstream news publishers
►
content creators and engaging in local chat groups to
stay updated about locality and neighborhood news
V. Digital-rst news platforms built niche
audiences
►
Catch News, NewsClick and The News Minute, have
been successful in attracting a dedicated audience27
►
com, The Ken, Inc42, Your Story, and others, have
successfully built a loyal subscriber base with in-depth
coverage and subject matter expertise
VI. Fake news became a serious concern28
►
served fake or misleading news in the last month, and
one in three was unable to identify the authenticity of
such news
►
can only make this issue more prominent going forward,
and there is a crucial need for self-regulation and
boundaries to be created to prevent this malaise
VII. The DNPA has requested for regulatory
support
►
comprising online news brands of legacy TV and
newspaper companies, has requested the regulator to
assist its members in growing sustainably
►
social media intermediaries be widened to include all
platforms which use news generated by others
►
bargaining mechanism, followed by arbitration and best
efforts, to ensure buyers and sellers reach a negotiated
value which is mutually determined
►
of fake news, intermediaries must be made accountable
for all content on their platforms along with publishers
24ABP-EY online news consumption survey 2024
25Comscore
26Understanding India’s digital news consumer – Kantar, Google 2023 Reuters
27digital news report 2023
28DNPA-EY report: “Monetizing online news”, February 2024

Media & entertainment
I. Social media penetration was 32% in 2023
►
above in 2023 marginally declined to 32%
►
other countries, in absolute terms, India is the second
largest market behind China by the number of users29
II. Social media users grew to 482 million in
202330
►
September 2023, a growth of 12 million unique users
from September 2022
►
exclusively, while another 15% used both mobile and
desktop
►
platforms but did not use each platform daily, though
67.5% of India’s total internet user base (regardless of
202331
III. Indians spent over two hours each day on
social media
Social media penetration (% of population)
IndiaUK
83%
China
74%
Russia
74%
US
70%
Brazil
66%
Worldwide
62%
32%
Hours and minutes per day spent on social media
India UKChinaRussia USBrazil Worldwide
03:37
02:26 02:23 02:21 02:18
01:56 01:49
►
compared to the world average, ahead of other large
countries like China, US, etc.
►32 billion
minutes in 2023, or 50% of total time spent on the
mobile phone. This included time spent on social
networks, communication and micro-blogging
IV. User-generated content continued to
thrive
►
attract new users and engage more with them
►
live conversations dominated in Tier 2+ cities, whereas
metro city users preferred content related to lifestyle
and live shopping33
►
apps in India was the driving force for increased
engagement, user retention, and brand effectiveness
►
from Tier 2+ cities. While metro cities contributed to
most of the viewership, regional content dominated on
the platform
►34 full-time content creators who
monetize their services, India’s creator economy
has matured, with brands leveraging user-generated
content for marketing. Creators with more than 1
million followers earned anywhere between INR20,000
to INR250,000 per month35
►
arsenal to express themselves, YouTube Shorts’ average
daily views grew by over 120%36 year-on-year
Social media
29https://www.demandsage.com/social-media-users/
30Comscore Year in Review Report 2023
31https://datareportal.com/reports/digital-2023-india
32Data.ai
33Industry discussions
34Kalaari Capital primer
35Kalaari Capital primer
36https://www.exchange4media.com/digital-news/connected-tv-has-emerged-as-the-fastest-growing-screen-for-youtube-in-5-yrs-google-india-130076.html

67
Monetization
I. Digital ad spends grew 15% in 2023
Digital advertising
EY estimates
Dentsu Digital Advertising in India report 2023 and 2022
2022 2023 2024E 2026E
Large advertisers 319 368 423 538
SME and long tail 180 208 239 304
Total 499 576 662 842
►
2023, as several categories increased the share of their
ad spends on digital media
►
million SME and long tail advertisers spent INR208
billion on digital media, primarily on performance
advertising on Google, Meta, and e-commerce platforms
►
e-commerce platforms increased to over INR86 billion,
crossing 15% of total digital advertising (14% in 2022)
II. Search and social dominated 2023
►
continued to provide 72% of digital ad revenues
►
garner 15% of total digital advertising as more brands
and Myntra etc., to drive sales, these platforms being
seen as being closest to the point of purchase. D2C
brands, which reduced spends on TV, continued to use
e-commerce channels to promote their sales
►
and Disney+Hotstar
III. Small and medium enterprise (SME)
advertiser base grew37
►
on digital media, predominantly on search, social
►
800,000 and one million small and medium enterprises
who advertise on them, to generate business in India
and abroad, with spends as low as INR20,000 per
year38
►
IV. Eight categories spent over 30% of their
total ad spends on digital
►
on digital, while another six categories spent over 30%
►
2023 as compared to 2022
Composition of digital ad revenues
Audio
Search & social
72%
E-commerce
15%
Entertainment
& sports
9%
News
3%
1%
Percentage of ad spends on digital by category
11%
19%
24%
28%
26%
27%
44%
36%
38%
50%
16%
22%
30%
32%
35%
44%
47%
49%
61%
64%
Retail
Education
M&E
Consumer
durables
Automative
BFSI
FMCG
Pharma
E-commerce
Telecom
20232022
37Industry discussions
38Industry discussions

Media & entertainment
Dentsu Digital Advertising in India report 2023 and 2022
Category contribution to digital advertising
20232022
3
8%
20%
6% 5% 5% 4% 3% 3% 1%
14%
36%
19%
4% 5% 5% 4% 2% 4% 2% 1% 1%
18%
FMCG E-commerce Consumer
durables Pharma Automative Telecom Education BFSI M&E Retail Others
V. FMCG and e-commerce contributed 55% of total digital ad spend
►
digital advertising pie, followed by e-commerce
►
fourths of the total digital ad spends
VI. Various initiatives were made to increase
rates
►
news were sold on an aggregate audience basis, like
television ad sales
►
audiences
►
were seen to increase
►
ads, click-to-buy options and other non-FCT elements
was noted
VII. Digital news publishers struggled with ad
monetization39
►
was affected by the shutdown of Insta articles feature
by Meta, leading to a potential dip in approximately 50%
►
resulted in news publishers generating lower ad CPMs,
forcing them to rely more on direct deals
39Industry discussions

69
I. In 2023, digital subscription grew 9%
EY estimates
2022 2023 2024E 2026E
Video 68 73 82 103
Audio 2346
News 1234
Total 72 78 89 114
►
reach INR72.6 billion as premium cricket properties
were moved in front of paywalls, reducing the
number of paid subscriptions of Disney+Hotstar by
approximately 19 million40
►
other OTT platforms, paid video subscriptions reduced
by two million in 2023 to 97 million, across 43 million
households in India
►
consumers reached around 7.5 million on the back of
►
by premium and exclusive content
►
consumers remained less than 15% and 5% for video
and audio, respectively
►
13% till 2026
II. Online video grew marginally
43 million households paid for 97 million video OTT
subscriptions
OTT aggregation services expanded
►
created a space for OTT aggregators, allowing users to
discover and view streaming content from multiple OTT
apps in one place
►
Channels, Tata Play Binge, OTTplay, Times Group, and
Airtel Xstream
►
apps focusing on regional or international content, and
who are looking to create visibility and build reach in the
country
Subscriptions and subscribing households (in millions)
63
80
99 97
31
40 45 43
2020 2021 2022 2023
Paid subscriptions Subscribing households
►
of paywalls, the number of paid subscriptions for
Disney+Hotstar fell by approximately 19 million41
►
and 108 million individuals42, lower than our 2022
estimates due to the fall in paid subscribers and a
crackdown on password sharing by certain platforms
40Company quarterly earnings reports
41Company quarterly earnings reports
42EY estimates based on industry discussions
Digital subscription

Media & entertainment
III. Audio subscription reached INR3.4 billion43
►
decreased to 185 million in 2023, compared to around
200 million in 202244
►
back of certain platforms transitioning to paid models,
while others reduced features in their free offerings to
persuade users to subscribe
►
across all large streaming platforms, all music available
on YouTube, and the prevalence of FM radio in cars and
on mobile phones, conversion to paid subscribers is
expected to be an uphill task
►
platforms remains a concern and could result in
consolidation or platform shut downs in the medium
term
IV. News subscription reached INR2 billion45
►
through aggregators, news subscription was primarily
driven by exclusive and premium content
►
sold in 2023 across all news platforms
►
• • Focusing on building peripheral revenue areas like
paid digital courses and events around areas of
interest of the news audience
• • Building additional pricing layers for value-added
interactive services and newer formats of news
reporting with paid access like audio podcasts, AR/
VR news
• • Bundling of news subscription services with
other non-news value-added services like OTT
subscriptions
• • International expansion targeting diaspora with
curated content
Future outlook
Digital segment is expected to grow
to INR955 billion by 2026
►
the changing consumption patterns being witnessed
due to growth in connected televisions, mobile phones
and broadband connectivity
►
to reduce the gap with television, and we expect it to
become the largest segment in 2024
Digital segment revenue projections
0
200
400
600
800
1,000
576
78
2023
662
89
2024E
842
114
2026E
Advertising Subscription
43EY estimates
44Industry discussions; Comscore; EY analysis
45EY Estimates

71
I. Digital advertising will grow at a steady pace
Digital advertising
EY estimates
►
2026 to reach INR842 billion. Its share will increase
from 51% of total advertising in 2023 to 54% by 2024,
and further to 57% by 2026
►
will grow from INR208 billion in 2023 to INR304 billion
by 2026 on the back of growth in the SME advertiser
base to approximately 1.15 million, proliferation of
ONDC across categories, access to national and global
markets, etc.,46 which will also result in e-commerce
advertising reaching INR150 billion by 2026
►
movies and premium content, entertainment and sports
advertising will grow at a CAGR of 17% to reach INR80
billion by 2026, as they focus on format innovations
and premiumization of inventory (CTV vs. mobile, 4K vs.
SD, etc.)
►
struggle unless loyal, app-based audiences are built
►
funded content, since connecting with premium ad
avoiding SVOD audiences will become increasingly
II. Navigating a cookie-less world will need a
comprehensive data strategy
►
and their content consumption preferences, interests
and purchase choices can be a powerful input for
marketers
►
registrations, contests, and interactivity
►
advertisers, we can expect to see more powerful and
value accretive data integrations across OTT and
e-commerce platforms
►All of which will also require targeted ad serving
technology
III. There will be an increased focus on
governance
►
programmatic advertising will increase its share, but
with controls around brand safe environments
►
becomes a larger portion of their media mix
►
media measurement and the M&E sector will need to
develop models to measure it
IV. Inuencer marketing will grow at an 18%
CAGR47
►
INR19 billion in 2023 to INR34 billion by 2026
►While Instagram and YouTube are the platforms of
choice, smaller platforms will also be used for niche
audiences
►The remuneration mechanism will evolve, and move to a
►
by 2026
Composition of ad revenues
3% 3%
9% 9%
15% 18%
72% 70%
0%
10%
20%
30%
40%
50%
60%
70%
80%
90%
100%
2023 2026E
News Entertainment & sports
E-commerce Search & social
46EY estimates
47

Media & entertainment
I. Subscription growth will be impacted by
FAST models
Digital subscription
2023 2024E 2026E
Video 73 82 103
Audio 3 4 6
News 2 3 4
Total 78 89 114
►
medium, garnering 90% of all subscription revenues,
despite FAST models seeming to be the focus for large
platforms in the near term
►
growing at a CAGR of 13%
II. Video OTT will reach 65 million households
by 2026
►
households in 2023 to 65 million in 2026, with 138
million subscriptions, averaging approximately 2
subscriptions per household
►
to the high cost of premium content. Further, the
massive unsold inventories that get created around
premium content prohibit growth in effective ad rates.
This will drive more platforms to roll-out subscription
products, or subsidize costs through bundling with data,
e-commerce, etc.
Subscriptions and subscribing households
97
110
138
43 50
65
2023 2024E 2026E
Paid subscriptions Subscribing households
►
packages (at around INR1 per day, for example) or
aggregators bring the bundled price down to INR2,500
or so per year, which is comparable to TV, we estimate
that the number of households paying for one or more
SVOD service can reach 100 million by 2026
►
will gain scale. They will in effect play the role that
DPOs played in the television sector, but the customer
will need to be provided with the choice of choosing
different OTT platforms to bundle
III. Audio subscriptions will double by 2026
►
converting free to paid consumers is expected to grow
the subscriber base from around 7.5 million in 2023 to
15 million in 2026, though we expect ARPUs to reduce
to around INR1 per day on an average by then
►
platforms to grow paying subscribers to a substantial
base
IV. News subscription will continue to search
for scale
►
by exclusive content and premium CTV formats; yet
it would remain a marginal revenue source for most
legacy news companies
►
paywalls for exclusive content, custom knowledge,
and passion content, and we expect news and related
products to generate subscription revenues of INR3.9
billion by 2026, which could increase to over INR7
billion through intelligent bundling48
V. TVOD remains an untapped opportunity
►
audiences from a trial perspective, starting with sports,
events and movies, and will be especially important for
the next 100 million smartphone consumers
►
platforms, play stores and all platforms with aggregated
audiences like social media, ticketing platforms, D2C
platforms of brands, as these platforms take away the
customer acquisition costs for content owners
►
grow to over INR10 billion by 202649
48EY estimates
49EY estimates

73
I. OTT content will break language barriers
►
achieve scale on the back of dubbing and subtitling. This
could also lead to increased costs for regional content
production
II. The content mix will change
►
the content mix get skewed towards tentpole properties
and low-cost productions (at a TV-cost-plus-20% rate),
the former to attract subscribers and the latter to keep
them engaged once on the platform without incurring
too much cost
►
sharing deals
III. Content efciency will be monitored
►
language and cross-geography reach, as well as the
objectives it will accomplish for the platform. The focus
will move to metrics like new subscriptions sold and
renewed, ad revenues, growth in time spent, etc. and
move away from vanity metrics like MAUs and reach
►
ageing OTT content gets syndicated to television. This
will also act as a trial inducement for television and
AVOD consumers
IV. News OTTs will focus on quality audiences
►
they will need to drive more user registration and build
app audiences as compared to transient web audiences
►
interest communities come into existence, with
increased content than just news, and transaction-led
monetization capabilities
►
to serve top-end audiences will come into being, both
ad supported and subscription-based, across areas of
interest
Content

Media & entertainment
►Enable funding for SME and long-tail advertisers,
recover ad amounts from sales values and create an
ONDC strategy
►Build premium inventory formats to cater to increasing
►Sell news and reality shows on a combined [linear +
connected TV] audience base; this will also help online
news publishers increase their ad yields, particularly
regional publishers where CPMs are 30-50% those of
English viewers
►Implement custom and interactive ad creatives at scale
to increase engagement and improve advertiser ROI
►Build brand safe programmatic capabilities, with
frequency caps
►Offer content bundles across devices, CTV operating
systems, ISPs, telcos and even other D2C products and
services
►Permit customizable packages across various price
points and for different geographic preferences
►Take advantage of Indians’ high ad tolerance and launch
OTT packages with tiered pricing
►News publishers can launch an “India news” app, where
content of all news publisher members will be available,
and monetization performed independently, to save
on customer acquisition cost and create a credible
alternative to internet news platforms and social media
news
►Create [TV + OTT] bundles to continue to engage with
fans and consumers across different media and times
of day
►
►Design custom CTV products across news, music videos,
business, etc.
►
and monetize them across ad, subscription and
transactions
►Implement credibility scores around content to prevent
deepfakes, unauthorized edits, and evangelize trust in
branded news
►Use technology to create custom news, current affairs,
interest-based content and trivia for audio and radio
audiences
►Partner for the launch of a genuine low-cost 4G
smartphone + data + content offering
►LCOs can build out broadband networks, if provided
►Facilitate a self-serve syndication platform for LCOs
and ISPs to bundle content with broadband for their
customers
►Create content for kids and youth, currently on YouTube
and social media, to attract them to ad-supported OTT
offerings
►Create custom low-cost content for Tier-II and III
markets, to attract the next 100 million households to
OTT
►Roll-out digital terrestrial networks for video and audio
to enable viewership of large sporting events as well as
enable a larger number of radio products in each city
►Commission TV-content cost-plus models for digital,
with longer seasons to build sticky audiences at lower
acquisition outlays
►Syndicate older OTT content to TV, perhaps even free TV
►Consolidate regional OTT platforms to achieve scale
as regards advertising and manage costs pertaining to
customer acquisition, technology, serving and content
production
►
curate opinion
Digital advertising
Subscription
Customer experience
Reach and consumption
Content efciency
#Reinventing digital media

75
►
partnerships, with ads that look and feel like content
►New-age areas like education, health and well-being,
legal, and cooking will come to the fore to build
audiences at scale
►
marketing costs and cross-pollinate fan bases
►Indian digital companies have set the trends across
large scale event viewing, multi-lingual products,
low-bandwidth content distribution and ad-supported
streaming
►As the world follows India across many of these trends,
it provides an opportunity for Indian companies to build-
out white-labelled service offerings to many countries,
developed and developing
►Platforms with massive reach like Reels, WhatsApp,
and YouTube will build out TVOD services since their
customer acquisition cost is negligible
►The TVOD opportunity can exist at both the
content and the service level
►TVOD is a well understood concept by Indians, and can
provide the platforms with the opportunity to provide
custom offers, and also build the data required to target
consumers for SVOD services
►Build AI-based image recognition tools to enable
e-commerce from any video feed viz, any clothing item
purchased from the online store
►Enable tipping and gifting for live interactions
►Digital ad rates for regional language audiences lag
behind English audiences, though their spending power
may not be different
►Build out Better UI/ UX and content to incentivize these
audiences to spend more engaged time online, and
evangelize the Bharat story to advertisers, as the next
round of consumption growth will come from these
markets
►
rather than pre-conceived audience segments, such as
CDPs, contextual targeting, creative manipulation, etc
Build new-age heroes
Leverage technology investments
TVOD
Embrace the Bharat story

Media & entertainment
Digital infrastructure
Trends
2022 2023
Wireless 1,143 1,154
Wireline 27 32
Total 1,170 1,186
Press Release No.01/2024 (as on 30 Nov 2023) & No.13/2023 (as on 31 Dec 2022)
Services Performance Indicators October-December 2022, The Indian Telecom Services
Performance Indicators October-December 2021, The Indian Telecom Services Performance
Indicators October-December 2020.
Source: Smartphones (Comscore, EY analysis); Data subscriptions (Ericsson Mobility Report,
November 2023 and 2022)
Source: Ericsson Mobility Report, November 2023, 2022, 2021
Source: Data.ai
Source: Ericsson Mobility Report, November 2023 and 2022
Press Release No.01/2024 (as on 30 Nov 2023)
Internet
subscriptions Dec 2020 Dec 2021 Dec 2022 Jun 2023
Total (a+b) 795 829 866 895
Narrow band (a) 48 37 34 34
Broadband (b) 747 792 832 861
Urban (a) 482 496 516 530
Rural (b) 313 333 350 365
2020 2021 2022 2023 2029
16gb 20gb 25gb 31gb
74gb
Telecom subscriptions increased by 1% to
reach 1.18 billion in 2023
Urban and rural subscribers marginally increased by 1% and 2%,
respectively in 2023
Internet penetration grew by 3%
96% of subscriptions were broadband
Smartphone users had 950 million data subscriptions in 2023, up from 890 million in 2022
Average data consumption per user
continued to grow
Teledensity is heavily skewed
towards urban markets
of subscriptions were 4G or 5G
Indians spent 4.77 hours a day on their phones, up
2% over 2022, 5% over 2021, and 9% over 2020
85%
4.77 hrs
a day
Mobile subscriber base
(in million)
2022 2023
652 660
Urban
526518
Rural
31 130
860
2022 2023 (October) 2029E
5G connections crossed 100 million in 2023
538
890
2022
574
950
2023
640
1,059
2026E
Smartphones (million) Data subscriptions (million)
Urban India Rural India
All India
133% 58%
85%

77
De-duplicated reach on Desktop/PC/Laptop & Mobile. Entertainment includes video and music.
All data has been provided by Comscore and has not been veried by EY. It has been provided in summary form for representation purposes only.
Powered by
2022 2023
Top platforms
Total unique
visitors/
viewers
(in million)
Total
minutes
(million)
Total unique
visitors/
viewers
(in million)
Total
minutes
(million)
Google sites 493 608,090 502 627,309
Facebook 465 516,012 464 531,711
Amazon sites 358 20,322 347 16,961
Flipkart sites 294 18,226 285 14,651
Paytm.com 260 13,216 259 10,966
Digital Services 234 11,992 239 10,771
Telegram.org 217 22,786 238 28,457
Times Internet
Limited 310 30,367 228 19,072
Truecaller.com 239 51,605 227 53,029
Microsoft sites Not in the top 10 in 2022 223 17,209
Digital reach
Trends
The total online audience reached 525 million in 2023
The reach of online entertainment dipped as users spent more time on other genres
Time spent online continued
to grow
Source: MMX Multi-Platform, Dec 2022 – Dec 2023, India
Smartphone users are de-duplicated unique visitors on Android & iOS smartphones and tablets. Total online audience is de-duplicated reach on
Desktop & Mobile.
India digital users (million)
385
445 461 468 480
Smartphone users
Source: Mobile Metrix, Smartphones Only,
Dec 2019 – Dec 2023, India
Source: MMX Desktop,
Dec 2019 – Dec 2023, India
Source: MMX Multi-Platform,
Dec 2019 – Dec 2023, India
2019 2020 2021 2022 2023
Desktop/ laptop/ CTV users
94 101 107 110 114
2019 2020 2021 2022 2023
406
468 485 510 525
Total online audience
2019 2020 2021 2022 2023
Reach (deduplicated, in million)
Online entertainment consumers Online news consumers Online music consumers Online gamers
2019
2020
2021
2022
2023
2019
2020
2021
2022
2023
2019
2020
2021
2022
2023
2019
2020
2021
2022
2023
392 394
217 219
483 473
208
117
476 456
185 110
Source: MMX Multi-Platform, Dec 2019 – Dec 2023, India
Total minutes (billion)
1,261
1,669 2,071 2,161 2,224
270 403 458 441 448
2019 2020 2021 2022 2023
All activities Entertainment
Source: MMX Multi-Platform, Entertainment Category,
Dec 2019 – Dec 2023, India

Media & entertainment
Powered by
The Indian app story
Trends
Note: All data has been provided by data.ai and is based on their research. It has not been validated by EY, and presented in summary form for representation purposes only
26.4 billion
new app downloads
in 2023
-8% compared
to 2022
Mobile game spends
grew 100% in 2023
compared to 2022
Indians spent
73% more hours on
shopping apps in
2023 compared
to 2020
Indian MAUs on
social media apps
grew by 31% in 2023
compared to 2020
US$600 million
App store spend
+30% compared
to 2022
4.77 hours
Daily time spent
per user
+2% compared
to 2022
Indian MAUs on
communication apps
grew by 55% in 2023
compared to 2020
Indians spent an average of 4.77 hours per day on their mobile phones
India had the 2nd highest number of
app downloads in the world…
…and Indians spent the most amount of
time on their phones in 2023…
...but ranked 25th in term of mobile spend
Average daily hours spent on mobile per user
0
1
2
3
4
5
6
7
Indonesia Thailand Argentina Saudi Arabia
Brazil
India Mexico Singapore South Korea Turkey
2020 2021 2022 2023
4.39
4.55
4.77
4.67
Downloads across iOS, Google Play and third-party Android in China combined; Time spent is Android phones only; Spend is gross — inclusive of any percent
taken by the app stores
Android phones only
App downloads (billions)
2021 2022 2023
India
27 29 26
China
98
111
113
United States
12 12 13
Hours (trillion hours)
2021 2022 2023
0.951.08
1.19
India
0.981.04 1.12
China
0.4 0.41
0.42
Indonesia

79
Dating, social media and entertainment were
the top consumer spend (US$ million)
categories in 2023
Instagram was the most used app by
younger audiences, while older ones
preferred WhatsApp and Facebook
Indian men and women show
distinct preferences for the apps they
use
Most searched apps on iOS app store in 2023 in India
Meta had the top 3 apps in India by usage, but
consumer spend was driven by other apps
Indians continued to spend most time
(hours in billion) on social media apps
0 10 20 30 40 50 60 70
Utility & Productivity I
Callar ID & Call block
Social media I
Media sharing networks
Social media I Communication
Social media I Voice chat room
Business I Integrated
career platform
Entertainment I Live streaming
Utility & Productivity I
File management
Entertainment I OTT
Social media I Live video chat
Social media I Dating
Spend is gross — inclusive of any percent taken by the app stores; Based on App IQ
2023, Android Phone. Average of Demographic Index : measure
of demographic cohort compared to the overall population) among
top 20 apps by average MAU per Genre. Gender represented
as Male and Female only and is not representative of all gender
identities
On iPhones; ranked by average Search Volume by keyword
Consumer spend and MAU based on combined iOS App Store and Google Play; Excluding pre-installed
2024.
Among non-gaming apps; Time spent is Android phones only; Based on App IQ
0 50 100 150 200 250
Business I Business communication
Utility & Productivity I Tool
Utility & Productivity I
Caller ID & Call blocker
Utility & Productivity I Personalization
Entertainment I OTT
Utility & Productivity I
Browser & search engine
Social media I Media sharing networks
Social media I Social networks
Entertainment I Video sharing
Social media I Communication
Top apps by MAU by likelihood of use
Rank 18-24 25+
1 Instagram WhatsApp Messenger
2 PhonePe Facebook
3 Flipkart Truecaller
4 Telegram Amazon
5 Facebook Messenger
Top Apps by MAU by likelihood of use
Rank Male Female
1 Facebook WhatsApp Messenger
2 Instagram Snapchat
3 Truecaller Meesho
4 PhonePe Myntra
5 Flipkart ShareChat
OTT Short video Dating Sports TV
Moj Tinder Fancode
Hotstar Tiki Bumble ESPN
Hinge Sports
MX Player Public App Grindr DAZN
Voot MX Takatak Grindr LLC Bein Sports
Sony Liv App Chingari Grinder PSG
Zee5 Tick-Tock Happn Fan Code
Prime Video Taka Tak FC
Amazon Prime
Video Local App Dating apps
India Cricket Mazza
Disney Hostart Public Gleeden Bein
Rank By consumer
spend
By monthly
active users
1 Chamet WhatsApp
Messenger
2 Bumble App Facebook
3 Google One Instagram
4 LinkedIn Truecaller
5 Tango Live PhonePe
Rank By consumer
spend
By monthly
active users
6 Hotstar Amazon
7 Tinder Flipkart
8 Truecaller Facebook
Messenger
9 YouTube PayTm
10 Instagram Telegram

Media & entertainment
35%
2022 2023
65%
32%
68%
Audience composition
Bhubaneshwar
Jaipur
Kanpur
Kochi
Kota
Lucknow
Nagpur
Patna
Rajkot
Ahmedabad
Bangalore
Chennai
Delhi
Hyderabad
Kolkata
Mumbai
Pune
Tier 1 cities
68%
32%
Tier 2 cities
Short video
Trends
The popularity of short video is 2x higher in tier 2 cities
Average minutes/ user per day on short video increased in 2023
Travel and entertainment are the most preferred categories by youth
60%
of short format video consumers in India
take their phones to the washroom
150 videos
Consumed on average by GenZ in an hour
The data has been compiled by VerSe Innovation from various sources including RedSeer, Google Kantar, internal data and other reports. It has not
been independently veried by EY. It has been consolidated and averaged for presentation purposes.
Source- Josh internal
Source- Josh internal Source- Josh internal
Powered by VerSe Innovation
69
2020 2021 2022 2023
53
33 37
Right after
waking up
In the
washroom
Between
breaks
Before
bed
15%
25%
16%
12%
32%
In transit
Short video
was consumed
through the day
Entertainment Lipsync Dance Cricket
Popular genres vs age wise consumption Content consumption by duration
Beauty and
fashion
Travel
25%
35%
42%
15%
37%
48%
30%
34%
36%
30%
36%
34%
22%
38%
40%
12%
36%
52%
18-30 years 31-45 years 45+ years
<15 sec
>45 sec
15-30 sec
30-45 sec
25%
48%
23%
4%
Split of
audience
More than 70% of
content consumed
was less than 30
seconds long

81
Online news aggregation
Trends
Powered by DailyHunt
The data has been compiled by VerSe Innovation from various sources including Google Kantar and internal data. It has not been independently veried by EY. It
has been consolidated and averaged for presentation purposes.
81% of online news was consumed in
vernacular languages in 2023
Genres preferences change with age
Though headlines were the most consumed, and business was the least consumed across all ages on news aggregator apps
Most read news categories
in India on aggregator apps
Source: internal Dailyhunt Source: Google Kantar
Consumers preferred consuming short-
form/ quick to read content
Vernacular
42%
Non-vernacular
19%
Both
39%
71%
62%
53% 49%
60 words
or lesser
Headlines long form
news
Web
stories
Categories
Audiences Entertainment Crime and
law
Nation/
state/ city
headlines
Education Sports Political Climate Business
Gen Z 76% 67% 72% 68% 66% 48% 58% 34%
Millennial 74% 71% 76% 49% 59% 65% 43% 43%
GenX and
Boomers 68% 76% 75% 41% 52% 59% 42% 29%
of online vernacular news consumers
discover it via aggregator apps or news
publishers’ website
of online news consumers
consume news related to their
neighborhood/ locality
Online news consumers have more
than one news application on their
devices and like to read multiple
POVs on the same issue
47% 70% >1

Expert
speak
The lever for the growth of OTT in India will not be sports and
lower pricing but the penetration of connected TV, habit-
forming relevant content and content for young adults.
Danish Khan
Sony LIV and Studio Next
Video streaming is revolutionizing the Indian M&E
sector - with world class storytelling, enhancing choice for
customers and providing unprecedented reach for Indian
content. Powered by this tailwind, I am confident that
Indian stories and storytellers will take centerstage globally.
Gaurav Gandhi
Prime Video
In 2024, with India’s digital content consumption booming
thanks to internet access and affordable smartphones, AI and
immersive technologies will usher in a new era of storytelling,
with Bharat driving the industry’s next growth phase.
Sajith Sivanandan
Disney+ Hotstar
Streaming is fast becoming the universal medium of
storytelling. 2023 proved that audiences value fresh, original
stories from world-class voices. Prioritizing the consumer
experience is key to sustainable growth. We’re in the midst
of a transformation as a global industry, and innovative,
quality storytelling sits squarely at the heart of it.
Monika Shergill
Netix India
Sharper investments in adopting new technologies and
driving synergies between data and content, will herald
an era of more immersive experiences across platforms.
This evolution will create a playground for segments like
online gaming, esports, and short form content to thrive,
enabling newer opportunities for the digital ecosystem.
Amit Goenka
ZEE5
The last decade was one of exponential digital growth in India,
which fundamentally shifted media consumption habits in
terms of devices, content types and creators. The underlying
shifts in technology, nationwide accessibility and consumption
are ushering in a new era of media transformation that should
excite all of us.
Kiran Mani
JioCinema
In the coming years, the streaming industry will be
shaped by consolidation for scale and efficiency. Yet at
same time, organic growth is likely to stem from the
experimentation with newer models of AVOD to broaden
the top funnel. Aggregation could emerge as the trojan
horse of growth in reaching the next 100 million users.
Rohit Jain
Lionsgate Play Asia

2024 is the year AdEx will pivot to becoming a strategic
enabler of business and top line growth for advertisers.
Brand-formance, Generative AI and Micro-market
targeting are the trends to focus on.
Satya Raghavan
YouTube
External factors such as the ease of paying with UPI, awareness
around subscriptions, and the inclination to pay for experiences
will contribute to the growth of paid music streaming.
In addition, the rise of Indian pop stars with strong fan
communities that are seeking ways to seamlessly connect
to their favourite artists, will also boost this growth.
Amarjit Batra
Spotify
AI, short video, business messaging and immersive tech
have fundamentally transformed the future of how studio
led movies, OTT content and linear TV are marketed and
consumed in India. The power of these tech solutions can
make a material contribution to the industry’s growth.
Sandhya Devanathan
Meta India
Whilst consolidation seems to be the theme within M&E in India,
to thrive for the next decade with a renewed focus on advertising,
we need to reinforce subscriptions and indeed explore other
revenue models as Gen AI will lead to abundance in short
video and hence dent monetization in the medium term.
Neeraj Roy
Hungama
Media today no longer conforms to a type as audiences
demand content that is consistent across platforms and
personalized. Even traditional media like radio are
using streaming, podcasts, etc. to innovate and engage
audiences globally. Digital media is further adding to how
we connect, engage, and inspire audiences worldwide.
Pawan Aggarwal
db.com
India’s youth are embracing technological advancements,
disrupting the publishing industry. Projected for a $5.2
trillion economy with a low ad-to-GDP ratio, digital
advertising is expected to reach 80K crores. Collaborative
efforts towards youth inclusion, audience science, and
disruptive technologies will shape M&E’s future.
Bharat Gupta
Jagran New Media
As short-video content continues to gain popularity, tier II
cities have emerged as trend setters. In 2024, short-video
content is expected to expand its reach, becoming highly
personalized, with technology playing a pivotal role in
elevating user engagement and satisfaction.
Umang Bedi
VerSe Innovation Private
Limited
Social first news brands have blurred the fine line between news
and content. AI further increases the risk of misinformation
spreading on social media posing itself as news. Digital first
news brands hence need to work on trust and transparency
to create the next wave of growth. The serious news
consumer will reward those who do.
Deepit Purkayastha
InShorts

The year ahead looks exciting with widespread UPI
AutoPay adoption, enabling seamless recurring payments
for a majority of transactions in India.
Vishnu Mohta
SVF (HoiChoi)
The big challenge ahead for regional OTTs is finding a
road to sustainable profitability. This will not be easy
but I believe in the “power of local”. Hybrid revenue
models, smarter content ecosystems to drive down costs,
go-to-market consolidation and sharply focused geo-
targeted storytelling will be important.
Ajit Thakur
Arha Media
For decades, readers have been accustomed to the unified
voice of newspapers. When they turn to a digital source,
they seek the same consistency and reliability they’ve
come to expect. However, the fragmented nature of digital
news often falls short of delivering this consistent, one-
experience that newspapers offer.
Raju Vanapala
Way2News
This last year has been punctuated by the rapid
consumer shift towards online video and increasing
market consolidation. It has also been a year of
immense reckoning for streaming, with the industry
being forced to ramp up revenue while rationalizing
spends, or quite simply ceasing to exist.
Archana Anand
ZEE5 Global
2024 will see pivotal change in digital publishing on back
of adopting and adapting to AI and the disruptions it will
bring in every aspect of business. Themes of hyper-local
and video will take centre stage in plans.
Puneet Singhvi
Network18
In the next few years, there will be a massive increase in
micropayment-led monetization for digital influencers
through livestream gifting. This will help grow the creator
ecosystem in the country by allowing creators to have a
steady monetization stream beyond ads.
Ankush Sachdeva
Sharechat and Moj

2024 will see two significant but seemingly contradictory
trends – the growth of Connected TV beyond the top 30M
households into mainstream and at the same enabling the
250M mobile users who don’t have a 4G connection with
their own personalized devices.
Gulshan Verma
Jio Ads
Our country is an interesting melting pot of India and
Bharat where technological advances and consumer
preferences, stories and audiences, feed off each other.
Our industry needs to create platform symbiotic content
and explore additional business models to profitably
operate at scale.
Alok Jain
Viacom18
The next era of social interaction is LIVE conversations.
From expert insights to entertaining content, live video
and audio will redefine engagement.
Deepak Salvi
Chingari
With the speed and cost advantages of generative AI, we
will see a marked acceleration of the best stories and IPs
moving across formats and languages.
Ranjeet Pratap Singh
Pratilipi

Media & entertainment
Print
Catch the headlines with
AI anchor Sana

87
Executive summary
Print media is on a recovery path after COVID-19, with newspapers and magazines both registering modest growth. The
segment is likely to hit a steady state of readers in the next three years. That said, this segment of the M&E sector has a number
of opportunities to keep up its growth momentum, including focusing on selective audience segments, innovative pricing and
diversifying revenue streams.
Advertising grew 4%, while circulation grew 3% in 2023
Newspapers grew 4% and magazines grew 2%
The print segment grew by 4% in 2023
Future outlook
2020 2021 2022 2023
Advertising 121.7 150.8 170.1 177.6
Circulation 68.2 76.3 80.3 82.3
Total 189.9 227.2 250.4 260.0
2020 2021 2022 2023
Newspaper 184.9 220.5 243.6 253.0
Magazine 5.0 6.7 6.9 7.0
Total 189.9 227.2 250.4 260.0
295.7
189.9 227.2 250.4 260.0 271.2 287.7
2019 2020 2021 2022 2023 2024E 2026E
Print segment revenues
Advertising
► Overall ad volumes increased 2% over 20221 while ad
rates grew 2.4%2
► Average insertion size grew 4% as demand skewed
towards more premium inventory
► However, advertising revenues were still 14% below pre
COVID-19 levels as rates remained impacted and had
not recovered
► Advertising in English publications recovered to 74%
of pre COVID-19 levels, while advertising in Hindi and
regional language publications recovered to around
93%
► Advertising accounted for 67% of total print segment
revenues
Circulation
► Publishers either held or increased cover prices in 2023
► English-language publications grew their circulation
revenues by 10% in 2023, while revenues of other language
publications increased 2%
► Circulation revenues are currently at 92% of pre-pandemic
levels, though remain over 20% lower for English-language
newspapers while being 6% lower for other language
newspapers
► We estimate that the total digital subscription income
earned by digital products of newspaper brands is INR2
billion
1TAM AdEX
2EY estimates
► Print will reach a steady state with a loyal reader base
within the next three years
► Print segment can grow to INR288 billion by 2026, at a
CAGR of 3.4%
► Advertising will grow at a 4.7% CAGR, driven by access
inventory formats
► Subscription will see a marginal growth of 0.7% CAGR on
the back of cover price increases while market leaders hold
on to readers and other papers start to see declining trends
► Soft newsprint prices will help news companies improve
margins, which can enable them to re-invest in growing
circulation through schemes and bundling
► Events revenues will contribute to top-line growth,
particularly in tier-II and III markets, where national mass
brands need greater connect
► The segment will need to ensure continued home delivery
of products, engage more with younger audiences,
diversity revenue streams, focus on SME advertisers and

Media & entertainment
3TAM AdEX
4EY estimates
5Pitch Madison Advertising Report 2024
6DNPA-EY report: Monetizing digital news, February 2024
► Overall ad insertion volumes increased 2% over 20223
while ad rates grew 2.4%4
► Average insertion size grew 4% as demand skewed
towards more premium inventory
► However, advertising revenues were still 14% below pre-
COVID-19 levels as rates remained impacted and had
not recovered
► Advertising in English publications recovered to 74%
of pre COVID-19 levels, while advertising in Hindi and
regional language publications recovered to around 93%
► Share of advertising to total income of print segment
remained at 67%
I. Auto, FMCG and education were the
largest contributors to print revenue5
Advertising revenues grew by 4.4% in
2023
Advertising
►
► They all spent over INR13 billion on print in 2023
► The fastest growing categories were alcoholic
beverages, travel and tourism, and BFSI, while
e-commerce, education and telecom reduced their
spends by over 10% during 2023
►Growth in e-commerce sales across India (for goods,
services and even dining) impacted retail advertising
budgets
II. Festive ad revenues were subdued
► This year witnessed unexpectedly lower ad spends
in print during festive seasons, both regionally and
nationally
► The coinciding of events like IPL and CWC with festivals
may have diverted funds, impacting print revenue
during these periods
III. Government spends picked up
► Government ad spends, both at state and national
levels, were initially low, but with elections approaching,
spending is gradually increasing
► Despite this, the yield from government ads remains
modest
IV. Digital revenues remained elusive6
► There were 456 million digital news consumers in India,
of which over 80% consumed news on their mobile
phones
► Monetization remained a challenge, however, with
digital news platforms of newspaper companies
generating less than INR10 billion in ad revenue
► Publishers are increasingly focusing on direct deals due
to the low yield from programmatic advertising
► However, both digital CPMs and views are on a
downward trend, posing challenges in maintaining rates
V. Event revenues grew
► Industry discussions indicate the print companies
conduced over a few thousand events in 2023, across
awards, summits and conclaves, conferences, sports
events, esports events and brand-related activities
► While for many events drove up top lines, for some, the
net incremental margin was not material, necessitating
a focus on revenue and cost assurance processes
14% | Auto
Composition of print ad revenues 2023
9% | Education
8% | Real estate &
home improvemen
t
7% | Retail
6% | BFSI
6% | Clothing,
fashion jewellery
5% | Household
durables
4% | E-commerce
12% | FMCG
29% | Others
Advertising revenues
205.8
121.7
150.8
170.1 177.6
2019 2020 2021 2022 2023

89
3TAM AdEX
4EY estimates
5Pitch Madison Advertising Report 2024
6DNPA-EY report: Monetizing digital news, February 2024
Ad volumes grew 2%
I. Overall ad insertion volumes increased
marginally by 2% over 20227
► There were over 150,000 advertisers and 185,000
brands which used print during 2023, compared
140,000 advertisers and 170,000 brands on print in
2020
► Services was the largest sector on print with a 15%
share, followed by education, auto and retail
► The top two categories by ad volume were cars and real
estate in 2023
► Five states contributed 50% of newspaper ad volumes
viz. Maharashtra, Uttar Pradesh, Tamil Nadu, Karnataka
and Andhra Pradesh
II. English and Hindi publications garnered
65% of newspaper ad volumes
Share
Rank Publication language 2022 2023
1 Hindi 38% 38%
2 English 26% 27%
3 Marathi 9% 8%
4 Telugu 5% 6%
5 Tamil 5% 5%
6 Kannada 5% 5%
7 Gujarati 3% 3%
8 Malayalam 3% 3%
9 Oriya 2% 2%
10 Bengali 1% 1%
Others 7% 8%
Total 100% 100%
TAM AdEX
TAM AdEX
► Hindi continued as the largest contributor to ad
volumes, given it has the largest reach of any language
in India
► English-language publications gained 1% volume share
since 2022
► The share of advertising volumes from regional
language newspapers decreased by 1% to 35% in 2023
from 36% in 2022
7TAM AdEX
III. English-language magazine ads increased
their share
► English magazines garnered 46% share of the total
magazine advertising, up from 45% share in 2022, but
still short of their pre-COVID-19 levels
► Four south Indian languages together contributed 24%
share of ad volumes in 2023
► Ad volumes are getting clustered around leaders in
respective categories, following the “winner takes it all”
principle
Magazine ad volumes by language
51% 49% 43% 45% 46%
9% 8% 8% 9% 9%
40% 43% 48% 46% 45%
2019 2020 2021 2022 2023
English Hindi Other languages

Media & entertainment
► Publishers either held or increased cover prices in 2023
► English-language publications grew their circulation
revenues by 10% in 2023, while revenues of other
language publications increased 2%
► As at December 2023, circulation revenues were at
92% of pre-pandemic levels, though they were over 20%
lower for English-language newspapers while being 6%
lower for other language newspapers
► A decline in youth interest in distributing newspapers
has started to post a challenge in ensuring the
copies are home-delivered each morning to readers,
particularly since newsstands have become less
effective post the pandemic
► Subscriber acquisition has now become a continuous
activity carried out year-round, rather than during
certain seasons and festivals
► Some CEOs we interviewed felt that India has started
to reach a saturation point, especially newspaper-
reading households, making it challenging to add new
subscribers, while at the other end, young audiences
entering the workforce have several alternatives for
their news, and hence may not desire to subscribe to a
newspaper as much as they used to a few years ago
Circulation
For 2023, neither the Audit Bureau of Circulations’ data
on copies, nor the Indian Readership Survey’s data on
readership have been released to date. This section is
based on industry discussions and data available from
publicly available nancial statements.
Circulation revenues grew by 3%
in 2023
Delivery dynamics evolved
Circulation revenues
89.9
68.2
76.3 80.3 82.3
2019 2020 2021 2022 2023

91
► Many publishers struggled to generate digital
subscription revenue, given the plethora of free and
indistinguishable alternatives available
► We estimate that the total digital subscription income
earned by digital products of newspaper brands is
INR2 billion
► Digital is often used for branding and audience
connection, especially in markets with weak physical
delivery networks
► That said, there are a few who have tried to adapt. They
have achieved this through creating custom digital
products for markets where physical delivery networks
are weak and providing exclusive digital content as high
as 50% more than physical content
► Some newspaper companies we interviewed struggled
with the high quality of their digital own news products,
claiming that a portion of their print readers who
shifted to digital platforms remained there, leading to a
permanent loss of physical readers
► Several CEOs also believed that the second newspaper
in the home was being replaced by digital products,
leading to a reduction in multiple newspaper households
Digital subscription struggled to scale
Digital quality impacted physical sales
Print credibility remained strong
EY survey of over 900 online news consumers
► While readers have the choice between multiple
channels of information, their trust remained highest in
newspaper brands
► The desire of readers to be informed and aware is
making them seek out content with depth, multiple
perspectives, explanations and analysis, but the most
important factor for readers in choosing a medium was
credibility and lack of bias
Indexed score on trust in news media
- 50 100 150
Newspaper (print edition/
digital subscription)
Broadcast news channels
Social media
Magazines
N
ews aggregator platforms

Media & entertainment
Print segment can grow to INR288 billion by 2026
Future outlook
I. Reach will begin to stagnate
► Print will reach a steady state with a loyal reader base
within the next three years, most of which will probably
come from the growing base of educated people
entering the workforce who need news and information
to build their careers
►Duplicated readership (homes with more than one
newspaper) will continue to fall as cover prices increase
II. Revenues will grow marginally
► We expect the print segment to grow at a CAGR of 3.4%
till 2026
► Advertising will grow at a CAGR of 4.7%, driven by
premium inventory formats
► 2024 should see growth coming on account of the
general elections
►Rates for language publications should remain subdued,
as rates for other regional media like OOH, radio and
digital are expected to stay low/ grow minimally in
certain markets in 2024
► Subscription will see a marginal growth of 0.7% CAGR
on the back of cover price increases while market
leaders hold on to readers and other papers see
declining trends
► Circulation will require on a year-round push, to sell
copies and incentivize trial through gifts, free trial
copies and offers
III. Alternate revenue streams will get
increased focus
► Events revenues will contribute to top-line growth,
particularly in tier-II and III markets, where national
mass brands need greater connect
►
businesses such as weddings, sports, government
events, ticketing, etc.
► Digital efforts will focus on growing app-based
and reduce the dependence on programmatic
advertising by doing more direct deals with advertisers
Print segment forward projections
205.8
121.7 150.8 170.1 177.6 188.3 203.6
89.9
68.2
76.3 80.3 82.3 82.9 84.0
0
50
100
150
200
250
300
2019 2020 2021 2022 2023 2024E 2026E
Advertising Circulation

93
Focus on career progression
Evangelize credibility
Enhance utility for consumers
Bundle innovatively
Sell the tier-II and III story
Focus on the SME power base
#Reinventing print
► Print will reach a steady state with a loyal reader base
within the next three years, most of which will probably
come from the growing base of educated people
entering the workforce who need news and information
to build their careers
► Build the narrative of “10 minutes, 20 pages” as the
path to awareness and career success
8The Growth Paradigm, EY report
► The perception of newspapers as the most trusted news
source is the biggest differentiator for print publishers,
and the print segment needs to get together to build
the narrative
►Reader base growth is critical, and increasing the utility of
the newspaper is the answer
► This can be achieved in many ways, like providing more
local news, more in-depth analysis, coupons and discounts
on e-commerce sites, etc.
►Focus on editorial quality - invest in the newsroom to
provide unparalleled insight and analysis and perspectives
from opinion leaders within the community of readers
►Build a stable of high-priced products for niche audiences
with exclusive and highly differentiated content
► Flexibility in pricing strategies, selective price increases,
and strategic partnerships could be a proactive
approach to sustain growth and grow audiences
► Bundling could be developed across corporate clients,
D2C brands, digital + physical offers, and other media
products
► Pricing structures could be developed around B2B/
Corporate, D2C bundling, and single-copy sales
► As consumption grows faster in smaller towns than
in many metros8, the consumption story must be
communicated strongly to media buyers
► For many regional newspapers, a “state ownership”
strategy can help garner a higher share of wallet, where
the newspaper brand becomes the window to all media
in that state for advertisers
► Target SME advertisers (we estimate their digital spends
in 2023 to be around INR208 billion, gross) who are
increasing their spends on media faster than larger
advertisers
► Build self-serve platforms for them, aided by generative
AI tools to help with content creation
Chase the young
► The print segment faces challenges in attracting
younger readers, and that can be an existential threat
► Continued investment in products (both physical and
digital) for young audiences who are entering the
workforce will be critical to build the readership habit
Diversify revenue streams
► Monetize content, including archives, and explore
innovative content formats such as short video,
►Build a top-end sports product across the approximately
140-150 days in a year when the Indian men’s national
team plays cricket
► Consider launching international editions to tap the
Indian diaspora
► Build communities around Indian themes, which can
be monetized globally, e.g., yoga, spirituality, classical
music, etc.

Media & entertainment
Espouse sustainability
Optimize costs
► Several environmental initiatives can be undertaken
to present a more sustainable product proposition to
readers, from use of solar power, building windmills,
tree-plantations, lower GSM paper use, electric
transportation, reduction of single-use plastic, etc.
► Generative AI provides publishers the opportunity to
develop hyper-personalized content at scale, while at
the same time reduce the effort pertaining to research,
analysis and editorial
► Infrastructure sharing, on the lines of the tower sharing
reduction
Rethink digital
► Leverage digital audiences for content commerce and
integrate sales teams for cross-platform advertising
► Roll out a One-India news app with participation from all
leading news brands as a united platform with a massive
consumer base, thereby saving on customer acquisition
costs as well as generating usable consumption and
audience data, particularly in a cookie-less world, where
►Deploy an online magazine marketplace, for both digital
and physical versions

95
TAM AdEX’s data pertains to 830+ publications for CY2023. The data has been provided by TAM Media Research to EY and has not been independently veried by EY.
Rank Top ve festivals by ad volume
2022 2023
1 Deepavali Deepavali
2Independence
Day
Navratri/ Durga
Puja
3 Navratri Independence
Day
4 Durga Puja Republic Day
5 Christmas Christmas
Rank Top ve categories
in 2023
1 Retail furniture
2 Frozen foods
3 Retail televisions
4 Retail readymade
garments
5 Torches
2020 2021 2022 2023
Product
categories 714 715 707 702
Advertisers 140k 138k 150k 151k
Brands 170k 168k 185k 185k
Top 5 sectors
Other sectors
40%
60%
Top ve sectors
in 2023 contributed
60% of total print
ad volumes
Rank Top ve sectors
Share of ad
volumes
2022 2023
1 Services 16% 15%
2 Education 14% 14%
3 Auto 11% 13%
4 Retail 9% 9%
5 Banking/ Finance/ Investment 8% 9%
Print advertising
Trends
Print ad volumes grew 2% in 2023
Average ad insertions/ day remained stable across quarters
The number of advertisers
using print remained constant
compared to 2022
India’s national holidays
were integral in generating
ad volumes
162 categories used
more print compared to
other media
Q4 continued to be the highest contributor of
ad volumes to print in 2023
Powered by TAM AdEX
(A division of TAM Media Research)
88
9 9
888
9
Q1
(Jan-Mar)
Q2
(Apr-Jun)
Q3
(Jul-Sep)
Q4
(Oct-Dec)
Average ad insertions
per day (in 000s)
2022 2023
2022 2023
Q1
(Jan - Mar)
22% 24%
Q2
(Apr - Jun)
24% 25%
Q3
(Jul - Sep)
26% 24%
Q4
(Oct - Dec)
27% 29%
Ad volumes/ publication

Media & entertainment
ad volumes in 2023
They had contributed 12% in 2021
Five states contributed half of
newspaper ad volumes…
…while national magazines garnered
almost half of total magazine ad volumes
Rank Top ve categories
Share of ad
volumes
2022 2023
1Cars 5% 7%
2 Properties/ Real estate 5% 5%
3 Coaching/ Competitive exam centre 5% 5%
4 Two wheelers 4% 5%
5 Retail outlets - jewellers 4% 4%
Rank 2021 2022 2023
Top ve advertisers Share Top ve advertisers Share Top ve advertisers Share
1SBS Biotech 5% SBS Biotech 3% Maruti Suzuki India 2%
2Maruti Suzuki India 2% Maruti Suzuki India 2% SBS Biotech 2%
3LIC of India 2% Reliance Retail 2% Reliance Retail 2%
4Hero Motocorp 2% Hero Motocorp 2% Hero Motocorp 2%
5Emami 1% LIC of India 2% LIC of India 1%
Top 5
categories
Other
categories
26%
74%
Print ad volumes
were dominated
by high value
products
Print remains a “go-to”
segment for upper
SEC audiences
Rank States Share
2022 2023
1 Maharashtra 15% 14%
2 Uttar Pradesh 11% 11%
3 Tamil Nadu 9% 9%
4 Karnataka 8% 8%
5 Andhra Pradesh 7% 8%
6 Rajasthan 7% 7%
7Punjab/
Chandigarh 5% 5%
8 Madhya Pradesh 4% 4%
9 Kerala 4% 4%
10 Gujarat 4% 4%
Others (13) 25% 25%
Total 100% 100%
Rank States Share
2022 2023
1 National 48% 49%
2 Maharashtra 11% 11%
3 Kerala 11% 10%
4 Tamil Nadu 7% 8%
5 West Bengal 6% 7%
Others (5) 17% 15%
Total 100% 100%

97
Hindi and English publications garnered
65% of total newspaper ad volumes
Share of English language publications was 24% pre-COVID-19
Sales promotions contributed 32% of total ad volumes
32% of these offered discounts
Share of innovative print ads grew 57% in 2023 over 2022
English publications comprised 46%
of total magazine ad volumes
They had contributed 51% ad volumes in 2019
Ad volume by language (newspapers)
1%Others (3)
1%Bengali
2%Oriya
3%Malayalam
3%Gujarati
5%
Tamil 5%
Kannada
6%Telugu
8%Marathi
27%English
38%Hindi
Ad volume by language (magazines)
2%
2%
4%
5%
7%
8%
8%
9%
10%
46%
Punjabi
Telugu
Marathi
Kannada
Bengali
Tamil
Gujarati
Hindi
M
alayalam
English
Brand
promotion
Sales
promotion
Others
Discount promotion
Add on promotion
Volume promotion
Contest promotion Others (4)
Multiple
promotion
32%
32%
52%
6%
4%
4%
3%
3%
65%
Share of innovative formats
31%
Figured
outline
23%
French
window
9%
Tab
9%
Others
5%
L Shape
5%
Seamless
jacket
5%
Print
format inv
4%
Maskhead
flap
4%
Masthead
integration
2%
Back page
jacket
2%
Teaser
Advertising
promotion
Innovative
advertising
(Newspaper
publications only)

Media & entertainment
69%
12%
19%
Many times
a day
Once
a
day
Not daily
News is consumed at a high frequency
Social media was the most preferred method for consuming news
YouTube and Meta were the favourite social
media platforms for news consumption
Smartphones remain the most preferred
device for online news consumption
60% of respondents spent more than 20 minutes
a day consuming news
In collaboration with ABP News and VerSe
News consumption
Trends
88% of respondents
consumed news at least
once a day, while 69%
consumed news multiple
times a day
Older audiences consumed news more often than
younger audiences
Older audiences spent more time consuming news than
younger audiences
While YouTube and Facebook were platforms of choice for all
audiences, younger audiences preferred Instagram and Twitter
more than older audiences, who preferred WhatsApp and Facebook.
Older audiences accessed news on TV and in print more than younger audiences, while both demographics consumed news
equally on social media, which had the largest reach across both segments
19%<10 min/ day
21%10-20 min/ day
19%20-30 min/ day
41%> 30 min/ day
21% 11% 8% 17% 43%
41%
21% 11% 8% 17% 43%
17% 5% 10% 28%
53% 16% 4% 8% 20%
57% 12% 4% 7% 20%
61% 14% 3% 7% 16%
79% 9% 2% 3% 7%
0% 10% 20% 30% 40% 50% 60% 70% 80% 90% 100%
Magazines
News app or web-site of news company
News aggregator platforms
Printed newspaper
Television news channels
Social media
Daily Few days a week Once a week Few times a month Almost never
10%
12%
19%
26%
28%
32%
T
akatak/ Josh/ Moj/ etc.
InShorts
Public/ Public Vibe
X (Twitter)
Daily Hunt
Instagram/ Reels
44%Whatsapp
50%Facebook
68%YouTube/ Google
Which social media platforms do you use for news content?
5%
1%
1%
4%
89%
Others
Tablet
Amazon Alexa/
Google Nest etc.
Computer
Smartphone

99
Newspapers are the most trusted news source
81% have never paid for digital news
16% of young audiences pay for one or more digital news
app or websites as against 20% of older audiences
Video is the most preferred format
Text has an established place across political, international, regional and business news; short video is making its presence felt
across genres
Podcasts remain a nascent offering for news
owning individuals, of which 57% were above 35 years of age. Survey participation links were sent via SMS, WhatsApp, email and digital campaign. Responses presented
In this section, respondents above 35 years of age are termed “older audiences”; those below 35 are termed “younger audiences”
Newspapers were the most trusted source for both younger and older audiences. Trust in social media was slightly higher
among younger audiences.
Video Text Audio Short format/ message Don't usually consume
51%
60%
61%
63%
66%
68%
79%
25%
13%
16%
22%
19%
12%
6%
2%
2%
2%
2%
2%
1%
2%
9%
8%
8%
8%
8%
7%
5%
12%
16%
12%
6%
5%
11%
8%
0% 10% 20% 30% 40% 50% 60% 70% 80% 90% 100%
Business and
technology
Lifestyle
International
Local/ regional
Political and national
Sports
Entertainment
61%
Never tried
news podcasts
18%
Tried, but not a
regular consumer
12%
Once a week
or more
9%
Regular news
podcast listener
8%
11%
81%
Paid for only one
digital news
app or website
Never paid
for digital news
Paid for more than one
d
igital news app or website
1 (most trusted) 2 3 4 5 6 (least trusted)
1%4% 14% 51% 19% 10%
Magazines
5% 7% 10% 15% 53% 12%
News aggregator platforms
17% 21% 38% 12% 6% 6%
Social media
29% 35% 20% 8%3% 5%
Broadcast news channels
44% 30% 14% 8% 3%1%
Newspaper
(Print edition/ digital subscription)

Expert
speak
Unfiltered and unverified news creates misinformation
and is degrading the news journalism ecosystem. It’s
important for advertisers to support credible news
journalism as that provides the environment which
creates the right context for their communication
campaigns and ensures brand safety. The only way
forward for the news industry is to bring back the focus
on trusting verified content from credible news sources.
Sanjay Gupta
Jagran Prakashan Ltd.
In an era of constant change and uncertainty, the
continuing trust in newspapers is remarkable. As events
unfold around us, the timeless appeal of newspapers for
their credibility, content, and knowledge is experiencing a
renaissance, leading to increased reader engagement and
strong financial performance for newspaper companies.
Girish Aggarwal
Dainik Bhaskar
Subscriptions growth will continue to be the top priority
for Indian magazine publishers. The industry has taken
several initiatives to improve the subs eco-system like
introduction of ‘magazine post’ with India Post, delivery
partnerships with several e-commerce players, and joint
effort for subs marketing.
Anant Nath
Delhi Press
The Convergence of physical and digital worlds is giving
birth to new Phygital models for most industry verticals.
Now AI will add another layer to this. This new ecosystem
will present many exciting opportunities for growth.
Tanmay Maheshwari
Amar Ujala Limited
As ‘Time’ gains currency, consumer preference will shift
from cluttered social feeds to curated, credible news
sources. Media companies will invest in building strong
newsrooms, improving timely distribution, and scaling up
subscription to ring fence ‘consumer time investment’.
Sivakumar S
BCCL

Praveen Someshwar
HT Media Group
The M&E sector has seen consistent growth over the
last few years. While overall volumes are up, we need
to continue to work to on pricing. In the second half of
2024, it will be interesting to see how AI will impact M&E.
Overall I see growth across segments in 2024.
Print continues to be an effective and relevant medium
for a large number of advertisers because of its credibility
and reach. I believe the Lok Sabha elections and our
robust economy will greatly benefit Print.
Jayant Mamen Matthew
Malayala Manorama
Major print players have had a year of growth in both
revenue and readership. Digital news is going through
some stress, however. Across both, smaller players will
consolidate, which is both overdue and welcome. India
has 500 news channels and 1.5 lakh printed periodicals.
Only those with a clearly differentiated, unique and
consistent value proposition, an honest, “reason to
be”, will thrive.
Anant Goenka
Express Group
2024 promises to be a year of good growth for print. A
focus on communities and engaging with communities
with purpose and with profitability will help the industry
to solve for the future.
LV Navaneeth
The Hindu
Sitaraman Shankar
The Printers (Mysore)
We’re actively looking at harnessing efficiencies from
various AI tools across the newsrooms, right from
translation to page-making. This is also aimed at helping
move our journalists up the value chain.
It has been very encouraging that leading regional
language newspapers have bounced back from circulation
losses due to the Covid lockdown and are holding on to the
gains. Advertising revenues bounced back faster and are
trending higher.
Karan Darda
Lokmat Media Group

Media & entertainment
Filmed entertainment
Catch the headlines with
AI anchor Sana

103
Executive summary
►
higher than in 2022
►
which shows that the cinema experience remains a
luxury for most Indians
►
just over 900 million, a fall of 5%; less than 100 million
people visited a cinema hall in 2023
►
time, led by a growth in ticket prices
►
33 countries in the previous year
►
premiums; consequently, the number of direct to digital
became an important element in determining the value
of digital rights
►
struggled with ratings and monetization
►
►
more high-quality mass content, and innovations in
pricing, infrastructure and distribution
The industry would undergo changes in the coming times and reinvention would be a core theme across different
channels, content types and operational models.
The segment grew 15% to reach an
all-time high of INR197 billion
2020 2021 2022 2023
Domestic theatricals 25 39 105 120
Overseas theatricals 3 6 16 19
Broadcast rights 7 7 14 15
Digital/ OTT rights 35 40 33 35
In-cinema advertising 2158
Total 72 93 172 197

Media & entertainment
1 Comscore
2 UFO Moviez
3 Comscore
4 https://www.imdb.com/list/ls562330283/ https://m.imdb.com/list/ls520690953/
Theatrical revenues by language
35
53
2022
13 10
53 52
56
Hindi English South Indian Other
languages
2023
Number of films crossing GBO collection of INR1 billion
1 1
3 3 3
17 16
8
11
English
2021 2022 2023
Hindi Other languages
II. Box ofce revenues crossed the INR100
billion mark for the second consecutive year
►
billion in 2023, an all-time high
►
►
just over 900 million, a fall of 5%3
►
people visit cinema halls in India, showing that it
remains a luxury experience out of the reach of 94% of
the population
►
India decreased by 23%
►A key trend noted in 2023 was that cinema-goers
waited for movie reviews and only then took a call on
OTT or television release. This made a very strong
incomparable theatrical experience, and getting the
marketing right
III. Thirty-six4 releases grossed INR1 billion or
more at the box ofce
►
►
mark, six were in Hindi and the remaining four were in
South Indian languages
►
►As audiences gravitated toward larger cinematic
in cinemas as they had done in previous years
I. Film releases grew 11% over 20221
Comscore
Domestic theatricals
►
languages and dubbed versions
►
(317), Tamil (271), Kannada (241), Malayalam and
Hindi (218 each)
►2 led
by the north-east, which added 10% new screens and
then Hindi speaking markets, which added 6%
Film releases by language
67 100
2022
194 218
943
1,047
419 431
English Hindi South Indian Other
languages
2023
Monetization

105
5 EY analysis; BARC
6 TAM AdEX Cinema data across 600+ TV channels. Hindi includes other
language movies dubbed into Hindi
►
countries in the previous year
►
billion, 19% more than 2022
►
overseas theatricals independently, further tapping into
the Chinese market can be a crucial growth driver
►
viewership in 2023, up from 25% in 20225
►
to fragmentation of audiences which, according to several
industry sources, led to lower ratings per new movie
►
release of TV premieres on multiple movie and/ or GEC
channels, by increasing marketing spends and increased
interactivity
►
a 4% decline in 2023 compared to 2022, led by
6
►Consequently, broadcast rights grew just 9% in 2023
►
growth of 30% over 2022
►
105 in 2022 to just 57 in 2023 as platforms rationalized
their direct to digital premiums
►
tent pole properties and lower cost properties, but reduced
focus on mid-range content, resulting in a relatively muted
8% increase in digital rights values over 2022
►
of growth for OTT platforms, propelling the expansion of
this rapidly evolving market, and hence the demand for
digital rights is expected to remain robust in the near future
►
2023, a 50% rise attributed to successful movies and the
Estimates by content services team of EY
International theatricals continued
to grow
Broadcast rights were impacted by
lower monetization on lm channels
Digital rights rationalized their
direct release premiums
In-cinema advertising recovered
International theatricals
74
3
151
6
335
16
339
19
2020 2021 2022 2023
No. of films released abroad GBO (INR billion)
Films released on OTT platforms
217
359
105
57
Released in theaters first
and subsequently on OTT
Released directly
on OTT
2022 2023

Media & entertainment
Future outlook
►
by theatrical revenues as Hindi movies go mass market in
their storytelling, incorporate more VFX to enhance the
movie-going experience and expand more aggressively
into tier-II and III cities
►
continue to fall, but the gap will be made up through
digital rights, as CTV homes are expected to grow
►
culturally similar markets like China and the middle east
►
to invest in tentpole properties, but fewer than before,
►
capita income increasing from US$2,500 in 2022 to
US$3,000 by 20257 are an indicator supporting the
above hypothesis
►
way of affordable “janta cinemas” (a level between the
multi-plex and the single screen) where middle and
upper middle classes can feel comfortable in enjoying
an evening out with their families
►
transportation networks to save time and reduce
parking struggles, there will be a surge in the
construction of modern cinema complexes. This
symbiotic relationship between smart city initiatives
and a thriving cinematic landscape would grow footfalls
►
exploring the potential of 24/7 cinemas at transport
hubs like airports and railway/ bus stations, hospitals,
business districts, and large housing colonies/ gated
communities, can be explored
►
escapism is what works across audience classes
►80% of production houses we surveyed expected to see
content, given the successes of 2023. The focus on
AVOD will also necessitate that the segment focusses
more on mass content
►
attract wider audiences and propel increased footfalls
beyond the current 0.9 billion admissions, mainly in
non-multi-plex screens
►
releases
We expect the sector to reach
INR238 billion by 2026
Segment theatrical experiences
Focus on mass escapism
7 EY report “India @ 100”
2023 2024E 2026E
Domestic theatricals 120 126 146
Overseas theatricals 19 20 23
Broadcast rights 15 15 16
Digital/ OTT rights 35 37 42
In-cinema advertising 7.5 8.5 10
Total 197 207 238

107
►
Tier II and III cities – such as introducing loyalty passes,
group passes, or bundled offerings including food and
beverages, and merchandise, will be undertaken as
pilot initiatives to assess their effectiveness in driving
footfalls and consequently, revenue growth
►Our survey of production houses indicated that the
biggest issue being faced was the shortage of quality
writing and directing
►
through funding writers’ rooms, crowdsourcing stories
and sourcing directors from smaller towns and not just
metros
Innovate around pricing
Develop talent
►
become a distant third window after theatrical and
content is created for the masses as against the classes.
In effect, content that appeals to multiplex and OTT
audiences will be different than content that appeals to
single-screen and television audiences
►
be commissioned for Tier-III markets and television
audiences, including FTA audiences, with separate
themes and lower price points
►
produced but will be released on a wider swath of TV
channels, with staggered windows and pricing options
►
estimated by us at approaching US$0.5 billion by 2024
►
classes across a range of different impulse purchases will
result in the growth of pay-per-view and pay-per-download
►
several years, and the need to scale has never been
stronger as content travels more and monetization
opportunities expand
►
particularly for products with global reach and appeal
Create discrete lms for the
broadcast market
Build D2C relationships
Rethink business models

Media & entertainment
Powered by
Film exhibition
Trends
Number of screens
increased by 4% to surpass 2018 levels
South India has 47% of all screens in India
Film releases grew by 12%
Screen count growth was driven by Hindi-speaking markets
Growth in releases was driven by English
Screen count
5090 5037 5003 4982 4897 5169
4511 4490 4470 4441 4485 4573
2018 2019 2020 2021 2022 2023
9601 9527 9473 9423 97429382
Rest of India
South India
Number of film releases
2023
2022
Telugu
255
320
Hindi
186
215
Marathi
124
104
English
119
188
Gujarati
103 94
Punjabi
61 60
Bhojpuri
58 67
Oriya
33 44
Other
languages
161142
Bengali
100104
Malayalam
190
241
Kannada
244 237
Tamil
263
220
% change in releases by language 2023 vs. 2022
-4%
12%
16%
17%
58%
Other languages
Total releases
Hindi
South Indian
languages
English
% growth in screen count 2023 vs. 2022
2%
South
6%
HSM
4%
East

109
Screen count by state
Jammu & Kashmir
and Ladakh
39 (2)
Uttarakhand
88 (2)
Himachal Pradesh
39 (-1)
Uttar Pradesh
Andhra Pradesh
1,103 (-13)
Odisha
162 (16)
Pondicherry (UT)
28 (7)
West
Bengal
Jharkhand
370 (-5)
Tripura
11 (2)
Nagaland
4
Manipur
2
Mizoram
1
Andaman &
Nicobar (UT)
6 (-1)
Delhi
182 (13)
83 (6)
Bihar
149 (12)
Madhya Pradesh
337 (17)
Rajasthan
248 (14)
Telangana
606 (-5)
Chattisgargh
152
Assam
104 (6)
Sikkim
6 (1)
Meghalaya
10
The Dadra and
Nagar Haveli and
Daman and Diu
11 (1)
Arunachal Pradesh
20 (6)
Maharashtra
1,044 (-6)
Gujarat
923 (113)
Punjab
288 (3)
Haryana
248 (26)
Chandigarh (UT)
26 (1)
Karnataka
901 (32)
Goa
33 (1)
Kerala
745 (-6) Tamil Nadu
1,190 (73)
583 (43)

Media & entertainment
2023 saw 11% more lm releases than 2022
Powered by
Film
Trends
Film releases (including dubbed versions)
238
54 204 278 317
Telugu
236
74
84 194
218
Hindi
223
71 152 228 271
Tamil
207
72 103 233
241
Kannada
170
38
39 199
218
Malayalam
109
3455
67 100
English
103
27
17 102
89
Marathi
102
37
40 106
93
Bengali
55
10
22 64
61
Punjabi
40
14
21 76
68
Gujarati
2023202120202019 2022
Footfalls fell 9%
Theatrical revenues exceeded pre-pandemic levels due to ticket price increases
Footfalls (million)
1560
2018
1460
2019
387
2020
418
2021
994
2022
900
2023
111 114
24 32
110 126
Gross box office collections (INR billion)
2018 2019 2020 2021 2022 2023

111
Average ticket prices increased by over 20%
With multiplex rates more than double that of single screen rates
on average
Hindi cinema regained its No.1 spot
While, Hollywood and other languages continued to lag behind pre-pandemic levels
Overseas revenues continued to recover in 2023
Single screens accounted for 48% of
revenue in 2023
revenue share to 44%
Average ticket price in INR
78
2019
62
2020
76
2021
111
2022
140
2023
Gross box office revenue (INR billion)
61
53
2019
58
52
2022
66
60
2023
Multiplex Single screens
2019 2020 2021 2022 2023
Countries in
which Indian
released
26 24 28 33 38
Number of
abroad
350 74 151 335 339
Gross
collections
including
China
US$332
million
US$39
million
US$77
million
US$249
million
US$337
million
Gross box office collections (INR billion)
52
9 6
36
55
Hindi films
16
1 4
11 10
Hollywood films
39
12
19
58 54
South Indian language films
(excl. Hindi dubbed)
7
12 4 6
Other language films
2023202120202019 2022
Share of box office collection
8%
48%
46%
14%
41%
2019
39%
4%
57%
2020
18%
14%
68%
2021
33%
10%
57%
2022 2023
Hindi Hollywood Other languages
44%

Media & entertainment
Powered by
All data has been provided by Ormax and has not been veried by EY. It has been provided in summary form for representation purposes only.
*Hollywood includes all language versions
*Hollywood includes all language versions; South Indian languages include
Telugu, Malayalam, Tamil and Kannada
Cumulative box ofce revenues of each lm in all languages in which
it was released
Box ofce
Trends
Hindi lms regained their leadership at
from 2022
Hindi cinema crossed INR50 billion
ticket prices
Average ticket price (ATP) grew 10%
compared to 2022
ATP at an all-India level
top 10 grossing lms of 2023
There were just four in 2022
Box office share by language
45%
39%
11%
5%
44%
39%
13%
4%
41%
42%
11%
6%
45%
36%
12%
7%
44%
37%
15%
4%
27%
59%
11%
3%
33%
50%
12%
5%
2015 2016 2017 2018 2019 2020 &
2021
2022
44%
42%
9%
5%
2023
Hindi South Indian languages* Hollywood* Others
Gross box office (INR billion) of the top 10 films of 2023
2.6
3.2
3.2
4
4
5.1
6.2
6.3
6.4
7.3
The Kerala Story
Tiger 3
Adipurush
Leo
Jailer
Salaar: Part 1 -
Ceasefire
Gadar 2
Pathaan
Animal
Jawan
Hindi language film Telugu language film
Tamil language film
Gross box office collections (INR billion)
35
12 17 21
68
54
11
20 23
63
HindiHollywood Tamil Telugu Malayalam Kannada
2022 2023
92
2015
95
2017
96
2016
104
2018
106
2019
91
2020
87
2021
119
2022
130
2023
Average ticket price (INR)
ATP by language (in INR)
241237
Hollywood*
187196
Hindi
119130
All India
109106
Bengali
101103
Kannada
99 102
Punjabi
102 99
Marathi
92 94
Telugu
84 89
Tamil
87 86
Gujarati
84 85
Malayalam
75 75
Others
2022 2023

113

Expert
speak
In 2023, India’s film industry rebounded to surpass pre-
pandemic levels, demonstrating remarkable resilience. The
Hindi box office, in particular, saw a significant comeback with
four films breaking records, reflecting the enduring appeal
of Indian cinema as a preferred source of entertainment. We
anticipate continued success in the coming years.
Ajay Bijli
PVR INOX
Technology and connectivity are propelling consumption
growth and shaping the emergence of new formats and
platforms in the M&E sector, spanning both traditional and
digital mediums. In traditional media, we are seeing a
steady transition of viewership towards FTA, while on the
digital platforms, there is a shift towards shorter formats,
with an increasing share of audience engagement.
Hiren Gada
Shemaroo
2023 was the year when Hindi cinema answered the call
and reclaimed its lost glory. The Industry will continue to
see a shift towards a more cinematic storytelling, creation of
greater franchises and innovations. Growing footfalls back
to the 2019 high of 340 million remains the key challenge for
the industry amidst the presence of OTTs.
Ajit Andhare
Viacom18 Motion Pictures
In today’s uncertain landscape, we stand at a threshold of
endless possibilities. History will applaud today’s filmmakers
for ushering in an era where creativity, technology, and
audience engagement converged to redefine entertainment.
Shibashish Sarkar
International Media
Acquisition Corp
The Indian box office is among the fastest to recover globally and
recorded the highest ever gross collections in the past year. 2024
looks equally exciting for us, particularly due to the blockbuster
sequels coming from the South Indian cinema industry!
Devang Sampat
Cinepolis India
Cinema will continue to be split between large format audio-
visual spectacles playing out in theatres and long-format
narratives on streaming platforms. All of this will be propelled
by technology, especially of an immersive nature, while stories
will gravitate towards being regional and rooted, while being
made for global resonance.
Rahul Puri
Mukta Arts
2023’s record box office put paid to the premature
obituaries of Hindi cinema. However, many areas of
concern need addressing across exhibition, television and
streaming before producers can truly celebrate.
Nitin Tej Ahuja
Producers Guild of India

In the global media landscape, India stands out by
merging fresh storytelling and technology to transform
entertainment… making it immersive, inclusive, and
globally resonant.
Apoorva Mehta
Dharma Productions
In 2023, despite the cricket world cup, the industry thrived on
captivating content that resonated well with audiences. The
revival of Hindi Cinema marked a pivotal moment, accompanied
by a notable increase in the number of screens. This progression
highlights the industry’s resilience and adaptability, laying
the groundwork for an upward momentum.
Rajesh Mishra
UFO Moviez
Everything will now be about ‘pull’ content (defined by the
story and the maker) and ‘push’ content will be relegated
to the minimum. Focus on format-agnostic sports content
(films, docu-series, television, etc.) will gain traction and
become one of the key differentiators across platforms.
Devendra Deshpande
Friday Filmworks
Big spectacle movies are drawing people back to the
theatre as much as women-led stories. Cultural lines are
blurring and the number of pan-India films is growing as
regional movies continue to tell entertaining stories with a
universal acceptance.
Naveen Chandra
91 Film Studios
Box-office’s stellar run in 2023 reiterates our belief that
the Indian audience is hungry for good quality content
that is best experienced on the large screen. Going ahead,
film producers and exhibitors should explore innovative
marketing strategies for upcoming movies.
Amit Sharma
Miraj Group
Achievements at the Oscars signal a growing recognition of
India’s diverse storytelling prowess, spanning fiction, non-
fiction, and animation. Blending local stories with innovative
technology promises to elevate Indian cinema to new heights.
Shobu Yarlagadda
Arka Mediaworks
Multiplex audiences are not loyal as they have many
entertainment options but for cine-goers in smaller cities, going
to movies with family is a ritual. Hindi cinema needs to invest
in a writing ecosystem that focuses on telling stories that
are rooted in our cultural ethos and resonate with theatre
going audiences in Tier II and III cities.
Vivek Krishnani
MovieVerse Studios

Online gaming
Catch the headlines with
AI anchor Sana

117
Executive summary
entertainment to become the fourth largest segment. Almost a quarter of the 455 million gamers in India are engaging
with online games daily. The robust growth of this segment is also expected to continue through to 2026, where it will
become a sector worth INR388 billion. While there are pockets of distress in some States with respect to administrative
oversight, the segment has a positive outlook in the coming times as the market now has greater acceptance towards
paying for online gaming and the user base steadily growing to become the number one online gaming country in the world.
Online gaming grew 22% in 2023
Reach
►
455 million, which is the second-largest gaming user
base globally, after China1 . Of this, we estimate that
100 to 110 million play online games daily
►
downloads2 , and hyper-casual games were the most
downloaded genre
►
increased awareness of online gaming is fueling growth
from non-metro and regional language markets
Game type 2022 2023 2024E 2026E
Transaction-based 150 182 223 321
Esports and Casual 31 38 46 67
Total 181 220 269 388
1India Games Market Report - Research and Markets; EY analysis; Industry
discussions
2
►
INR388 billion by 2026
►
(27% CAGR), followed by fantasy sport (23%) and then
rummy and poker (19%)
►
►
►
companies struggle to manage the implications of GST
►
gaming experience for users
Future outlook
Monetization
►
fourth largest segment of the Indian M&E sector in 2023,
►
in 2023
►
reach INR182 billion
►
2023, online gaming companies absorbed the impact,
and by cushioning the player, ensured growth rates were
caused layoffs and could lead to shutdowns among smaller
gaming companies if they cannot absorb the cost
►
games on its app store has widened the reach for many
other games that charge participation fee
►
►
BGMI during 2023
►
of in-app purchase revenues, followed by strategy games
►
over 20% of in-app purchase revenues between them
►
opportunity for brands to connect with upwardly mobile
young audiences, though yields remained low
►
esports titles almost doubled to 19 in 2023, with 1.8
million Indians participating in them, and which were
available across 20 platforms
181
220
269
388
2022 2023 2024E 2026E
Online gaming segment revenue

Media & entertainment
3 EY estimates through various secondary sources and consensus-based industry discussions
4 https://www.linkedin.com/posts/nileshdeshmukh14_impact-of-bgmi-relaunch-in-india-activity-7133723763719725057-g7uZ/
►
are expected to reach 491 million by 20243
►
over 30 million, low data charges and increasing per
short video platforms) contributed to attracting new
cohorts of players
►
Mobile exclusively available in India, was relaunched
in May 2023 after being banned for over two years.
It has since then garnered the top rank in app store
downloads in India and has around 100 million
cumulative players4
►
just gaming apps to media apps (entertainment, sports,
news and music), social apps and e-commerce apps,
as gaming was found to help with stickiness and aid in
marketing content
►
GST on the full face value since 1 October 2023,
there was a sense of fear that this would deter gamers
playing online real money games. However, online
gaming companies reworked their business models to
either absorb or minimize the impact to gamers, and
we understand that for large companies, the impact
was felt for a short period of less than a quarter during
2023, though smaller gaming companies did get
impacted more
►
had a minimal share of in-app purchases
►
►In the case of casual games, the platform strategy
worked and increased the customer stickiness and
lifetime value, as gamers stayed on the platform for
longer across more number of games
►Some casual game companies we interviewed had 80%
of their consumers from non-metro markets
Online gamers grew 8% in 2023 Hyper-casual games were most
downloaded
Reach
EY estimates
Rank Game genre Downloads
(% share)
Share of IAP
revenues
1 Hyper-casual 25% <1%
2 Simulation 20% 7%
3 Action 10% 3%
4 Table-top 7% 4%
5 Racing 7% <1%
390 421 455 491
2021 2022 2023 2024E
Online gamers in India (in millions)

119
Monetization
Transaction-based game revenues
crossed INR180 billion
Casual gaming grew 24 % in 2023
►
games in 20235
►
reach INR182 billion
►
• • Rummy was permitted again in Tamil Nadu, always
►
cash rewards
►
►
►
►
CWC, where India’s performance drove both viewership
and game play. In addition, fantasy sports provided
a vast array of emerging sports including football,
basketball, kabaddi, etc., which enabled it to gain
visibility and an increase in users
►
were ok to spend money to play real money games
while 52% of respondents had paid to play fantasy sport
in 2023
►
money games on its app store has widened the reach
for many other games that charge participation fee,
and this segment saw 20% growth
I. In-app purchases
►
of BGMI during 2023
►
where gamers spend6
►
simulation and shooter-based games7
►
monetization, too8
II. Advertisement
►
opportunity for brands to connect with upwardly mobile
young audiences, though yields remained low
►
number of new games released and the most
downloads, with many incorporating advertising
revenue into their business model
III. Esports
►
esports titles almost doubled to 19 in 2023, with 1.8
million Indians participating in them, and which were
available across 20 platforms9
►
20% to 25%10, particularly in Tier-II cities
►
had participated in esports events and they all viewed
at least one tournament a month
2022 2023 2024E
Rummy and Poker 56 68 82
Fantasy sports 79 96 120
Other participation fee 15 18 20
Total 150 182 222
2022 2023 2024E
In-app purchases 9 14 18
Advertisement 11 13 14
Esports 11 12 14
Total 31 38 47
5 https://www.statista.com/statistics/1064010/number-of-online-gamers-india/
6 Data.ai – State of Mobile Gaming
7 Data.ai – State of Mobile Gaming
8 Data.ai – State of Mobile Gaming
9 NODWIN Games estimates
10 Industry discussion

Media & entertainment
Shooting games were most monetized
►
generating 24% of in-app purchase revenues, followed
by strategy games
►
aggregated over 20% of in-app purchase revenues
between them
Rank Game genre Downloads
(% share)
Share of IAP
revenues
1 Shooting 5% 24%
2 Strategy 1% 14%
3 Match 6% 12%
4Party 1% 9%
5 Sports 3% 8%
Rank Game Genre Country of
origin
Past releases
1 Free Fire Shooting - Battle
Royale Singapore
2 BGMI Shooting - Battle
Royale South Korea
3 Coin Master Party – Luck
Battle Israel
4Candy Crush
Saga Match – M3 Sweden
5Call of Duty:
Mobile
Shooting – Team
Deathmatch China
New releases in 2023
1Whiteout
Survival
Strategy - 4X
March-Battle China
2
Monopoly
GO: Family
Board Game
Party - Luck
Battle USA
3Call of
Dragons
Strategy - 4X
March-Battle Poland
4Honkai: Star
Rail
RPG - Team
Battle China
5 Viking Rise Strategy - 4X
March-Battle Singapore
side-loaded apps
►
in 2023 were:

121
Game viewership continued to grow
►Game platform Loco has estimated that online
viewership grew 20% in 2023
►It believes that 4% of total YouTube viewership is also
related to gaming
►Watch parties are growing, where groups of fans watch
games together and interact with each other during
game play
Operating environment
India’s role in the international
gaming landscape11
►12
►
from leading gaming companies across the world and
showcased work on leading technologies like AR/ VR,
blockchain, NFT, robotics, digital gaming, and more.
India has seen the emergence of over 1,000 gaming
studios and game development companies13
►
India Hero Project to support Indian game developers14
►
outlay of $50,000 to $150,000 per investment15
►
March 2024 to help them bring their games to the
blockchain16
►
make its made-in-India battle royale game Indus,
playable in Epic’s Fortnite17
11
12 EY estimates, industry discussions, https://www.newindianexpress.com/business/2022/Aug/10/india-gaming-industry-poised-to-become-worlds-largest-gaming-
hub-2486156.html
13 https://www.convergenceindia.org/pdf/2023-Post-Show-Report.pdf
14 https://www.playstation.com/en-in/local/india-hero-project/#:~:text=What%20is%20India%20Hero%20Project,Entertainment%20for%20Indian%20game%20develop-
ers.
15 https://www.businesstoday.in/technology/news/story/krafton-india-launches-gaming-incubator-to-boost-local-ecosystem-upto-rs-124-crore-on-offer-400788-2023-
10-05#:~:text=Selected%20participants%20will%20receive%20guidance,)%2C%20depending%20on%20their%20requirements.
16 https://www.moneycontrol.com/news/business/indigg-owner-kratos-studios-allocates-rs-50-crore-to-help-studios-bring-their-games-to-blockchain-11647071.html
17 https://www.moneycontrol.com/news/business/supergaming-takes-made-in-india-title-indus-global-with-fortnite-integration-11669491.html

Media & entertainment
Summary of different positions held by states in online gaming
State Fantasy Rummy Poker Year of enactment
Karnataka18 Allowed Allowed Allowed 2021
Meghalaya19 Allowed Allowed Allowed 2021
Tamil Nadu20 Allowed Allowed Allowed 2021
Andhra Pradesh21 Not allowed Not allowed Allowed 2020
Telangana22 Not allowed Not allowed Not allowed 2017
Gujarat23 Allowed Allowed
Not allowed, on account of a judgement
of the Gujarat HC judgement from 2017.
An appeal from this decision is pending
before the division bench of the HC
2017
Nagaland24 License needs
to be obtained
License needs
to be obtained License needs to be obtained 2016
Sikkim25
Restricted to
servers based
in Sikkim
Restricted to
servers based
in Sikkim
Restricted to servers based in Sikkim 2009
Assam26 Not allowed Not allowed Not allowed 1970
Odisha27 Not allowed Not allowed Not allowed 1955
Rajasthan28
Licensing
regime
proposed in
2022
- - NA
Kerela29 - - - NA
18Amendment of the Karnataka Police Act, 1963*/ Karnataka Police (Amendment) Act 2021
19Meghalaya Regulation of Gaming Act, 2021
20Amendment of the Gambling and Police Laws, 2021*/ Tamil Nadu Gaming and Police Laws (Amendment) Act, 2021
21Amendment to the AP Gaming Act 1974/ The Andhra Pradesh Gaming (Amendment) Act, 2020
22Amendment to the Telangana Gaming Act of 1974/ The Telangana Gaming (Amendment) Act, 2017
23Gujarat Prevention of Gambling Act, 1887
24Nagaland Prohibition of Gambling and Promotion and Regulation of Online Games of Skill Act, 2015
25Sikkim Online Gaming (Regulation) Act, 2008
26Assam Game and Betting Act, 1970
27Orissa Prevention of Gambling Act, 1955
28The State of Rajasthan published a draft of Rajasthan Virtual Online Sports (Regulation) Bill proposing a licensing regime to regulate pay-to-participate fantasy and
esports
29While an amendment has been proposed and reported about in the media, no draft has been circulated
30 https://economictimes.indiatimes.com/news/india/online-gaming-talks-begin-for-central-regulatory-framework/articleshow/94747171.cms?from=mdr
Updates in 2023:
►Karnataka: The amendment allowing online gaming was
struck down by the State HC in February 2023 and is
currently under appeal in the Supreme Court
►Meghalaya: The Meghalaya Regulation of Gaming Act,
2021, was repealed in November 2022
►Tamil Nadu: The amendment allowing online gaming
was struck down by the State HC in August 2023
► Andhra Pradesh: Under appeal before the Supreme
Court
► Telangana: Under appeal before the Supreme Court
►Gujarat: An appeal against the single judge order
allowing online poker is pending before the division
bench of the HC
►Rajasthan: The draft bill proposing a licensing
regime for online fantasy and esports is still under
► Kerala:
legislation regarding online gaming as of now
►The Indian government is currently considering a
central regulatory framework for online gaming, which
could potentially supersede state-level bans30

123
We expect the segment to reach
INR388 billion by 2026
Consolidation can be expected
Retrospective taxation can shut
down the segment
In-app purchases will grow
signicantly
Many new games will launch
Gaming on ONDC and other apps
►
reach INR388 billion, provided no retrospective tax
actions are taken on the companies, on account of:
• • Smartphone users, who are expected to grow from
574 to 640 million by 202631
• • Wired (or similar) broadband, which should almost
double from 38 million to 68 million
• • Growing per capita incomes and low data charges
►
purchases (27% CAGR), followed by fantasy sport (23%)
and then rummy and poker (19%)
►
the total revenues
►In the event the key states of Andhra Pradesh and
Telangana permit games of skill, and FreeFire is
permitted to return, the growth can be higher
►
companies absorbing the impact to protect consumer
risk of survival
►
and we expect the market to stabilize with two to three
fantasy sport players, one to two players each in rummy
and poker, and one or two multi-game platforms
►
opportunities for growth in foreign markets
►In the event the government continues with its desire to
change taxation policies retrospectively, most gaming
companies we met claimed that they would end up
shutting down their operations as they would not be
able to comply
►
as consumers’ willingness to consider gaming a digital
phone offering grows, the ability to generate revenues
from in-app purchases (both strategic and impulse buys)
will increase
►
double to INR28 billion by 2026
►
game companies look for scale and a growing gaming
audience, even at lower ARPUs
►
development, marketing and management services skill
sets being built-up in India
►
for innovative ways to manage the same
►
alternative models to collect subscriptions and in-app
purchase revenues, and could look to alternate stores
and collection platforms for the same, including web-
based play stores
31 EY estimates
Future outlook
182
223
321
38
47
66
2023 2024E 2026E
Real money gaming Casual gaming
Revenue projections
►The application of GST at 28% on the face value of bets
has already resulted in lay-offs and the closure/ sale of
some small gaming companies
►FDI will also revive only post the clarity on retrospective
taxation

Media & entertainment
Build loyalty Go regional
Gamify education
Go global
Protect local
Use fair play to promote gaming
Enable AI
Increase non-player engagement
Build out cloud gaming to grow
reach
►
12 months32 and hence, rolling out a loyalty program,
both within a game and between different games,
will become more critical, as game development and
marketing costs rise
►
continued game play, rather than withdrawal of
winnings, to minimize the GST impact under the new
rules
►
(virtual goods or NFTs) into money and rewards
►
regional languages apart from Hindi33 , and dubbing and
titling it makes it move across language boundaries
►
dubbed, titled and skinned across difference regional
languages and provided with the relevant cultural
context
►
for which it needs to upskill many youth
►
from investors as it aims to bring this skill gap that
impacts millions, in India and abroad
►
►34 ,
India’s ability to develop games, market them, and
manage daily operations can become an added source
of export revenues for India
►
end AAA games, will be required at speed
►Several off-shore gambling sites continue to exist,
resulting in illegal game play and diversion of funds
outside India
►The segment needs to work with regulators and
stakeholders like payment gateways, to restrict
transactions and pull-down with such sites
►Use technology to ensure game play is restricted to
adults, time spent is limited, monetary restrictions
counselling provided proactively
►Ensure compliance with fair play guidelines via industry
bodies, and use the same to promote the segment
►
allow NPCs to adapt to players’ behaviors, making
gameplay more engaging and personalized
►
companies, we can expect to see an evolution in
character development, innovative game mechanics,
and more immersive game worlds, apart from storylines
that dynamically change
►
to monetize them, the need is to innovate with ideas like
exclusive passes, fan loyalty programs, watch parties,
VIP passes etc.
►
featured cloud gaming PC on any device the user owns,
be it a laptop, desktop, or smartphone which they can
use to play games from the platforms’ library
►
of 5G in India) and use of one’s smartphone replacing
the requirement for high-end gaming hardware will
enable the cloud to transform gaming’s reach
32 EY-LOCO survey of gamers
33 Estimates based on EY’s content services team
34 Industry discussions
#Reinventing gaming

125
Esports in India
Trends
Total participation in
esports tournaments
touched 1.8 million
(across prominent titles and
competitive levels)
Prominent esports
titles are expected to
consolidate
Airtime continued to grow
(across all competitive level games)
The expected return of Free
Fire tournaments will grow
the prize pool
Professional esports teams
will grow in 2024 as major
titles are expected to return
Broadcast platforms
can expect to see
consolidation in 2024...
(OTT+ live streaming+ TV+
social)
...which will impact brands
investing in esports
India is expected to have 20
international teams by
2024
Women fan base is
expected to remain in the
22-25% range
8
2020 2021 2022 2023
13 14
20
2024E
12
Number of platforms
300
2020 2021 2022 2023 2024E
600
1,000
1,790
2,500
Total participation (000s)
9
2020 2021 2022 2023
13
10
19
2024E
14
Number of prominent titles
(mobile + PC + console)
45
2020 2021 2022 2023
72 80 82
2024E
65
Number of brands
5
2020 2021
6
2022
7
2023
14
2024E
20
Number of international teams
6,500
240,000
2023
8,000
300,000
2024E
Content created and average viewership
Airtime
(broadcast hours)
Average minute
audience (000s)
2023 2024E
12%
2020 2021 2022 2023
18%
22% 23%
2024E
25%
Approximate % of fan base
150
2020 2021 2022 2023 2024E
220
150
181 220
Prize money across major tournaments
(INR million)
All data has been provided by NODWIN Gaming to EY and has not been independently veried by EY. It has been presented in summarized form for
presentation purposes only.
Powered by NODWIN Gaming and AFK Gaming
2023 2024E
22
35
Number of professional teams

Media & entertainment
Online gamer survey
Trends
Powered by
Respondent prole
Game choice
A third of respondents played games at
any time during the day, similar to last year
48% respondents spent over an hour per
gaming session
44% played for fun and relieving stress
Graphics, idea and community were all important factors in choosing games
Gamers participated
12,732
Respondents were male Respondents were single
90% 88%
Gamer respondents were
below the age of 34
94%
Time spent on each play session
(% of respondents)
14%
< 20
min
38%
20 min
to 1 hour
34%
1-4
hours
14%
4
hours
When do you play games?
(% of respondents)
34%
Anytime
in the day
27%
Breaks
20%
Post
dinner
19%
Travelling
Preference for playing online games (% of respondents)
15%
Competitive sport
and thrill
15%
Want to pursue it
as a career option
and gain fame
11%
Passion for
the game
7%
My friends and
acquaintances play it
5%
To win
cash prizes
3%
To sharpen
my skills
44%
For fun and
stress relief
Parameters which influence choice of game (% of respondents)
35%
28%
16% 14% 7%
All the above Graphics should
be optimizable
Server
performance
Main idea
of the game
Size of the gaming
community

127
Frequency of game play
Multiplayer games were the most
preferred
40% played online games almost on a daily
basis in 2023
43% indicated that their playing time
increased over last year
On any given day 87% played games at
least once
53% of respondents grew bored of their
games within a year
Popularity and play store ratings remained
the most important factors in choosing games
How do you decide on which game to play?
(% of respondents)
32%
23%
18%
14% 11%
2%
Popularity Play
store
rating
Recommended
by a popular
gamer during
live streams
Own
selection
Recommended
by friends
Reviews
on
forums
% of respondents who played games
M
ultiplayer
games
Casual/
hyper
casual
gaming
Fantasy
sports
Other
skill
based
real
money
games
Online
games
of
chance
Online
card
games
60%
28%
4% 3% 3% 2%
What best describes your online game play in 2023?
(% of respondents)
40%
Almost
daily
17%
At least once
every week
21%
A few times
every month
22%
A few time
s
this year
Frequency of play during a day
(% of respondents)
49%
Once or
twice a day
25%
3 to 5 times
13%
>5 times
13%
Not usually
daily
Change in time spent playing games in 2023 vs. 2022
(% of respondents)
43%
Increased
38%
No change
19%
Reduced
How quickly do you get bored of your game?
(% of respondents)
15%
Within a
month
18%
Less than
3 months
20%
Within 9
months
to a year
15%
in 2
years
32%
Never

Media & entertainment
30% of respondents watched game
streams daily
45% spent more than two hours watching
game streams
AR and VR are the most popular tech
that gamers want to experience
60% of the respondents had participated in
at least one Fantasy League tournament
20% viewed more than three esports
tournaments in a month
How many esports tournaments do you view in a month?
(% of respondents)
33%
2-3 tournaments/
month
20%
> 3 tournaments/
month
47%
1
tournament/
month
Esports
Type of game play
78% of respondents had participated in
esports events
17% higher than in 2022
Participation in esports tournaments in 2023
(% of respondents)
9%
51%
18% 22%
Yes – offlineYes – onlineYes – both
online and
offline
No
What technology would you like to see in your game?
(% of respondents)
49%
AR+VR
38%
Wearable gaming
13%
Crypto
Did you participate in any fantasy leagues in 2023?
(% of respondents who played games)
40%
No
32%
1 to 2
17%
3 to 5
11%
>5
Frequency of watching game streams
(% of gamers)
30%
At least
o
nce daily
20%
At least once
this year
20%
At least once
every month
19%
At least once
every week
11%
Not even
once
Time spent on watching game streams
(% of respondents who watched online streaming games)
25%
2-4 hours
24%
2 hours
20%
>4 hours
18%
1 hour
13%
30 min

129
54% of those who paid to play games spent less
than INR500 per month
52% of respondents had paid to play
fantasy sport in 2023
Almost two-thirds of respondents had or were
willing to spend on a gaming subscription
Risk of fraud and addiction were the top
reasons for not playing real money games
Respondents were okay with
spending money to play
real-money games
Higher than last
year’s survey
The survey was administered by Loco on their platform and the results provided to EY. EY has tabulated the same and summarized the ndings in this section.
12,723 gamers participated in the survey.
58%
19%
Monetization
How much do you spend on in - app purchases in a typical month?
(% of respondents who paid to play)
54%
Up to INR500
29%
INR500-2,500
17%
Over INR2,500
Reason for not playing RMG
(% of respondents who did not play in 2023)
33%
Risk of
fraudulent/
bot-driven
t
ransactions
25%
Risk of
addiction
24%
Real money
platforms
are not
trustworthy
18%
Risk of losing
money I
need for
other
purposes
Money spent on fantasy sports in 2023
(% of respondents)
9%
> INR5,000
17%
INR1,000-5,000
26%
< INR1,000
48%
Nil
Will you pay for a gaming subscription?
(% of respondents who play games)
32%
34%
No – unlikely
in 2024
34%
Yes - have already
subscribed
Yes – Propose to have
a subscription in 202
4

Expert
speak
The last 12 months have provided significant businesses
clarity and therefore the opportunity to reconstruct and
revitalise. The next 12 months are expected to offer similar
clarity through well-crafted regulations. Online gaming
stands as a cornerstone of entertainment, embodying
India’s digital progress and will continue to significantly
contribute in advancing India’s trillion dollar digital
economy.
Bhavin Pandya
Games24x7
‘Gamertainment’ is the future of entertainment -
Interactive, personalised, immersive and deeply engaging
- thereby bringing about behavioural changes and
shaping choices in people around the world. In India,
mid-core games and esports will see an increasing trend
in engagement.
Rajan Navani
JetSynthesys
The government’s efforts to formulate a regulatory
framework will provide certainty and structure to an
industry that is keen to grow in a responsible manner,
leading to increased employment opportunities, tax
revenues and investments. With the right support, we
will see online gaming leading the charge in the global
economy and cement India’s position as a world leader.
Sai Srinivas
Mobile Premier League
The integration of AI and machine learning will
personalize gaming experiences, making them more
engaging, while blockchain promises enhanced security.
5G will significantly reduce latency, opening up new
possibilities. These technological shifts, coupled with
India’s digital adoption and regulatory clarity, position
the industry positively, and we anticipate a surge in both
casual and real money gaming.
Ankur Dewani
RummyVerse
India’s time has come. Expect to see one or two breakout
Indian games that will go global in a few years, as India
becomes a prominent game development hub.
Nitish Mittersain
Nazara Technologies

The future of online gaming in India is a dynamic
tapestry of ‘Made in India for the world’ innovation,
driving unparalleled IP creation and leveraging deep
tech to redefine interactive experiences. It’s not just about
domestic consumption, but also about exporting our
creativity and expertise globally. India stands poised to
emerge as a powerhouse in the global gaming arena.
Paavan Nanda
Winzo
Last year was disappointing for the industry, no hiding
that fact, however as gamers we are optimists. We look
forward to the future and believe that everyone will find
their growth path.
Shivanandan Pare
Gaussian Networks
(Adda52)
Gaming and game development will be integral for India
as it grows to a US$5 trillion economy. Taxation clarity
and a progressive regulatory regime centred around
user protection and innovation, will enable a new era for
the creation of innovative gaming products. Mobile-first
gaming will continue to be the key segment and the way
forward for India to become a key player globally.
Roland Landers
All India Gaming Federation
(AIGF)
In 2023, the Indian govt. laid out clear guidelines for
releasing games and the AVGC committee took shape.
The successful return of the most popular title in Indian
gaming took place. From a consumer perspective, we
saw strong willingness to pay - both for games and live
streaming. The combination of clear regulations and
appetite to pay, creates promising conditions for growth.
Anirudh Pandita/
Ashwin Suresh
Loco
Esports has firmly cemented its status as a mainstream
sport in India, with India’s participation at the Asian
Games last year. States are actively getting involved in
the development of esports infrastructure, establishing
academies, and organizing tournaments. The inclusion of
esports in educational curriculums is empowering youth
and legitimizing it as a career option.
Lokesh Suji
Asian Esports Federation
Worldwide gaming and esports markets underwent
massive consolidation in 2023, which will accelerate in
2024. The business model will evolve to address a wider
TAM as gamers become a superset indicative of youth.
Esports will become closer to sports entertainment like
Formula 1 with a multi-faceted entertainment approach.
Akshat Rathee
NODWIN Games

Media & entertainment
Animation and VFX
Catch the headlines with
AI anchor Sana

133
Executive summary
The trends in the animation and VFX space in the past few months indicate a mixed sentiment. While demand in the
animation segment shrunk, the overall VFX segment in India grew despite a global slowdown in demand. The major
developments in the mergers space had a major role to play in projects getting delayed in the animation segment.
FY24, demand and activity will likely pick up in this segment as demand and consumption patterns continue to evolve.
The segment grew 6% in 2023 to
reach INR114 billion
Indian animation contracted 5% in 2023 as local
demand slowed
►
delays for green lighting of new animation projects and
consequently, fewer IPs were released in 2023 compared
to the previous years
►Major broadcasters saw ad revenue falls in 2023 and
consequently, funding for new animation projects reduced
►
outsourcing of animation projects
►
ahead of the headwinds faced by the industry and started
participating in international events in pursuit of fresh
global opportunities
The Indian VFX segment grew 10% amid a
slowdown in global demand
►Industry strikes in the US caused major disruptions,
which impacted outsourcing volumes to India
►Cost management at major OTT platforms had an impact
on the VFX segment’s performance considering OTT
constitutes about 40% to 50% of the overall segment
revenue
► Domestic VFX demand, which has a 35% share of segment
revenue, thrived due to increased VFX usage
►
added between 5% and 10% to VFX revenue, indicating a
potential area of growth
► Virtual production made a start, but is characterized by
longer than expected ROI timeframes, high costs and rapid
advancement of technology
25
43
31
83
38
107
36
114
9
38
50 54
10
14
19 23
-
20
40
60
80
100
120
2020 2021 2022 2023
Animation VFX Post-production
Post-production revenues grew 20% as content
boundaries dissolved
► Content localization drove growth in 2023, as major
OTT platforms released content in 10 to 15 languages
and south Indian language movies were dubbed into
► Dubbing of English content into Indian languages
accelerated, with 46% of viewers consuming it in their
native languages. The Indian audience for English SVOD
content increased by 124%
►
effective dubbing. A 3% to 5% increase in cost to enable
dubbing can open-up new revenue opportunities
The segment is expected to grow at
a CAGR of 17.5% by 2026 to reach
INR185 billion
Key drivers for the projected growth include:
►
ending the slowdown in commissioning new projects noted
in 2023
►
attracting foreign collaborations with up to 30% cost
reimbursement
►
►
and animation services
►
bridged through partnerships between major studios and
educational institutions
36 40 56
54 63
83
23 29
46
0
50
1
00
1
50
2
00
2023 2024E 2026E
Estimated growth
Animation VFX Post-production

Media & entertainment
Indian animation contracted by 5%
Animation
I. Potential mergers and a dip in ad revenue
reduced the volume of new animation
projects commissioned
►
green-lighting new animation projects, impacting both
outsourced and domestic projects
• • In 2023, the release of new Indian IPs decreased to
1
• •
Nickelodeon23
►
structural changes within Viacom18 had an impact on
green lighting of new projects4
►
broadcasters like Zee and Sony witnessing a 7.7% and
11% drop in ad revenue5
►
anticipate a recovery in project approvals and
production in 2024
31
38 36 40
2021 2022 2023 2024E
Animation revenues
1https://www.animationxpress.com/animation/strategic-moves-indian-animation-studios-set-ambitious-agenda-for-2024/
2afaqs.com/news/Television/nickelodeon-launches-two-new-homegrown-ips#:~:text=Nickelodeon strengthening its content game,end of May on Sonic.
3
4Expert interviews
5
6https://www.hollywoodreporter.com/business/business-news/disney-cuts-content-spending-2024-streaming-1235641858/
7
8
II. The slump in the domestic demand
increased interest in international projects
beyond traditional western markets
►
international events such as MIPCOM, MIP TV, Annecy,
and Kidscreen
►
and aligns with new collaborative efforts in countries
like Russia, Spain, Italy and the Middle East
III. Cost-reduction strategies undertaken by
OTT platforms impacted the volume of
animation work outsourced to India
►
20236, leading to a noticeable effect on the outsourcing
of animation projects
►
restructuring, including job reductions7
8

135
IV. YouTube remains the number one digital
platform in India for animated content
►
children’s content consumption, with YouTube
alone contributing to 50-60% of animated content
consumption in India9
►
studios maintain interest in YouTube due to its superior
data analytics capabilities compared to television
►
animated content:
# Channel Subscribers
(Million)
Views
(Billion)
1 Chuchu TV 69.2 49.2
2 Voot Kids 46.7 22.4
3 CVS 3D 34.6 21.1
4 WowKidz 34.1 17.8
5 Kids Channel India 25.6 11
6 Green Gold TV 20.4 9.9
7 Infobells 14 5.4
8 Zee Kids 13.1 8.1
9 Videogyan Kids 12.5 8.9
10 HoopaKidz 7.2 4
Socialblade
V. Children’s media consumption shifted:
Urban markets preferred digital platforms
while TV dominated rural markets
►
increasingly favored digital platforms, while television
remained dominant in rural areas
►
television in their top three platforms for their children,
10
►
over 3,000 hours of Indian and global content in over
11
VI. Anime grew and diversied
►
and is expected to contribute to 60% of the worldwide
growth in anime interest in the coming years12
►
every week that were anime-focused13
►
programming schedule14
►15,
while Prime Video introduced the Animax+GEM pack,
dramas, and variety programs with English subtitles16
►
in merchandising and licensing. Sony YAY! acquired the
rights to Naruto merchandise for India17
VII. Content distribution strategies evolved
►
in India18
►
formed a partnership with Doordarshan to broadcast its
content on DD19
►
terms of diverse revenue opportunities via broader
reach of IPs
9
10
11
12Crunchyroll to add 200 hrs of content, bring Tamil & Telugu dubs in India (animationxpress.com)
13Warner Bros. Discovery bets on anime to drive growth of kids’ cluster in India (moneycontrol.com)
14Warner Bros. Discovery bets on anime to drive growth of kids’ cluster in India (moneycontrol.com)
15
16
17
18https://www.thestatesman.com/india/new-animated-series-feature-stories-of-freedom-struggles-unsung-heroes-1503230548.htm
19

Media & entertainment
The Indian VFX segment grew 10%
VFX
Animation embraced AI, Unreal
Engine, and cloud technologies
►AI is set to revolutionize animation by automating
routine tasks, freeing animators to focus on creative
aspects like character design and storytelling, which are
expected to remain predominantly human-driven20
►
►
talent shortage prevented the segment from utilizing its
full potential21
►
enhanced security features22
I. International strikes led to delays and
cancelations, impacting Indian VFX studios
►
Guild-American Federation of Television and Radio
post-production and VFX segments
►
23
►
projects, adapted by seeking domestic collaborations
and exploring other international markets to sustain
II. OTT budgets tightened
►
its entertainment cash content spending as part of cost-
cutting measures24
►
on content in 2023, a decrease from the previously
expected $17 billion25
• • In 2023, it released 130 fewer original programs, a
16% decrease compared to 2022
• •
VIII.
38
50 54
63
2021 2022 2023 2024E
VFX revenues
20How generative AI will impact the animation industry - (animationxpress.com)
21
22
23List of productions impacted by the 2023 SAG-AFTRA strike - Wikipedia
24Disney to Cut Content Spending in 2024 – The Hollywood Reporter
25

137
III. The domestic market remained resilient
►
approximately 70% to VFX segment revenues, there
was a notable increase in domestic revenue owing to
►
for about 25% to 30% of their total project costs26
• • 27
• •
• •
28
IV. VFX studios capitalized on the surge of
CGI in commercials
►
generated imagery (CGI) and digital effects to enhance
ads, from subtle color grading to complex CGI
integrations
►
alterations, cost-effective production, and reinforced
brand identity
►
sparked by brands like Nike, gained momentum with
adoption by both global and Indian brands
• •
reimagination, and Baskin Robbins’ logo revamp
underscore 2023’s trend of CGI-led ads29
►
and CGI adoption scales and more international brands
enter India30
V. AI, machine learning, and real-time
rendering transformed VFX
►
with instant visualization of complex scenes, crucial for
the interactive and iterative process of VFX creation31
►
of tasks, like upscaling, accelerated CGI pre-visualization
and realistic motion creation
VI. Adoption of virtual production grew, but
challenges remained
►
than in developed markets due to longer than expected
break-even timelines
►
challenging to integrate this technology with traditional
►
by local producers. Although there was interest from
billable hours
►
investment), and skilled artists
26Industry discussions
274000 VFX SHOTS IN THE UPCOMING MOVIE ADIPURUSH (animationkolkata.com)
28VFX chronicles 2023: Triumphs, challenges and 2024 aspirations in the Indian visual effects landscape - (animationxpress.com)
29Social Throwback 2023: Why CGI was the most disruptive trend of th… (socialsamosa.com)
30Industry discussions, EY analysis
31Unveiling 2023: Right from AI to virtual production, India’s VFX powerhouses illuminate current technology trends - (animationxpress.com)

Media & entertainment
Post-production revenue grew 20%
Post-production
I. Demand for content in multiple Indian
languages presented an opportunity for
high-quality localization services
►
content in the country skyrocketed by 124%32, primarily
due to the dubbing of English content into Indian
languages; 46% of viewers consumed content in their
native languages33
►
offer global catalogues in native Indian languages34
►
provides international content dubbed in Hindi35
►
shows in 16 languages and subtitles them in 33; its
local shows are also dubbed in up to seven languages36
►
from regional Indian titles. In aggregate, more than
60% of Prime Video’s viewership was anchored to local
content37
►
Companies are now rethinking their operating models,
planning localization from the inception of projects,
and aiming for day-and-date multi-platform releases
worldwide
II. South Indian languages led India’s dubbing
market and audience demand
►
on South Indian languages. While content in other
Indian languages exists, it has not yet matched
the quantity and dubbing demand of South Indian
languages. Dubbing in India primarily focuses on Hindi,
Tamil and Telugu
►
linguistic preferences of the Indian audience
III. AI dubbing revolutionized lm localization
►
multiple languages. The technology ensures lip-sync
accuracy, emotional tone adaptation, and character
multilingual accessibility
►
addressing the mismatch between audio and visual cues
in dubbed content. Their technology ensures visual
►
• • Coco Cola used AI for contextual Instagram videos
to create updated voiceovers from pre-shot footage
• • Amazon’s ad featuring Manoj Bajpayee, originally
in Hindi, used AI for authentic lip-syncing in seven
regional languages38
14
19 23
29
2021 2022 2023 2024E
Post-production revenues
32
33
34BookMyShow Stream partners with VROTT Studios to offer global catalogues in native Indian languages (medianews4u.com)
35
36
37
38NeuralGarage bets on generative AI to make dubbed shows appear more natural (yourstory.com)

139
The segment is expected to grow at
a CAGR of 17.5% to reach INR185
billion by 2026
Future outlook
I. Government incentives for exports will
provide impetus to the segment
►
scheme for international animation, visual effects, and
post-production projects using Indian services, with
up to 30% reimbursement on a minimum expenditure
Indian content. The incentive, capped at INR300 million
per project, is to be applied for by the Indian service
company involved in the project39
►
on qualifying production expenditures in India for
animation projects with Indian co-producers, capped at
INR 300 million per project. This incentive is disbursed
INR1.5 billion, and applications must be made by the
Indian co-producer40
►
animation and VFX segment’s global competitiveness
and attract foreign collaborations
II. Emerging opportunities in adult animation
provide an opportunity for Indian studios
►
for adult animation in the US (excluding anime) surged by
152%41
►
than the supply growth, indicating a strong market
opportunity, particularly during a time of heightened
production budget scrutiny42
III. Industry alliances will enhance global co-
production and nancing opportunities
►
Visual Association (SAAVA) and the ATF IP Accelerator
Project Market (AIPA) for a multi-year collaboration,
43
• • The partnership encourages diverse international
projects that could further increase demand for VFX
services in the Asian market
• •
poised to boost the animation and VFX segments
►
have formed a partnership to introduce the ATF x TTB
Animation Lab & Pitch44 which aims to unite Asian
and European producers, fostering exploration of new
36 40 56
54 63
83
24 29
46
-
50
100
150
200
2023 2024E 2026E
Estimated growth
Animation VFX Post-production
39IFFI 2023 report
40IFFI 2023 report
41Adult animation data reveals demand growth far outpacing supply: Parrot Analytics - (animationxpress.com)
42Adult animation data reveals demand growth far outpacing supply: Parrot Analytics - (animationxpress.com)
43
44

Media & entertainment
IV. Studios will increasingly partner with
universities and institutions to bridge the
talent gap
►
right talent, studios are forming partnerships with
educational institutions
►
early age, preparing for the increasing complexity of
work outsourced to India
• • FTII and Toonz Animation collaborated in offering
animation and VFX courses at Pune, with plans for
an incubation center to encourage student-driven
IP development45
• • Reliance Animation Academy partnered with
Sandip University, Allen House, and Pimpri
Chinchwad University for early-grade animation
and VFX training46
• • Technicolor enhanced its training programs, both
internally and at the Technicolor Creative Studios
Academy, to support careers in audio visual,
gaming and computer graphics, collaborating with
government ministries to promote creative arts
careers47
►A key gap that needs to be addressed is the ability of
just the art
►The approval of the National Centre of Excellence will
also assist in this endeavour of developing talent
45FTII Pune signs MoU with Toonz Animation Studios to launch animation and visual effects design course - (animationxpress.com)
46Reliance Animation Academy partners with three universities to provide animation & VFX courses - (animationxpress.com)
47VFX chronicles 2023: Triumphs, challenges and 2024 aspirations in the Indian visual effects landscape - (animationxpress.com)
V. Cloud and physical infrastructure build-out
will assist global collaborations
►
studios to support remote working, allowing artists to
access content and collaborate from different locations
globally
►
heavy upfront investment in physical hardware and
model
►
aspects like performance and security, studios can
concentrate more on the creative side of content
production
►
UP, Maharashtra, Tamil Nadu, and others, will provide
opportunities for large international studios to set up

141
VI. Global cost rationalization will provide an
opportunity for India
►As the risk-taking appetite of global studios decreased
in 2023, and they focused on creating top-end product
at lower costs, the opportunity for India to increase its
importance in the supply chain improved
►We expect the use of government incentives,
co-production treaties and the set-up of many
opportunity for India to take advantage of the global
environment
►IT will also provide India a chance to build its on
technological IP and differentiate our service offerings
from other countries
VII. Build global IPs
►India has already proven itself capable of creating
YouTube friendly content for global kids audiences
►
resonate globally, such as Mighty Little Bheem
►The opportunities abound both from a mythology
perspective as well as around various movie characters

Media & entertainment
Illustrative list
VFX use increased, and
companies began to scale
Powered by
Animation and VFX
Trends
Feature lms Short lms Series
88 Pictures - Star Wars Visions’ Volume 2
Episode 7 – The Bandits of Golak
Graphiti Multimedia - Krish, Trish &
Baltiboy Bharat Hain Hum
Toonz Media Group - The Canterville
Ghost
Studio Eeksaurus Sri Aurobindo - A New
Dawn , Arana Puranam (The Legend of
Arana)
Zebu Animation Studios - Lego Dreamzzz
season one
SDFX Studios (Company3 Method India) -
Framestore (unique shots
for 30 projects)
5,000+
Digikore Studio
4,000+
PhantomFx
4,500+
Redchillies vfx
8,000+
FutureWorks
8,750+
Number of VFX shots in select movies
Selected content
750+
Ae Watan
Mere Watan
800+ Bloody Daddy
1,100+ Heeramandi
1,150+ Jaane Jaan
1,250+ Selfiee
1,400+
Rocky Rani Ki
Prem Kahani
1,550+ Rana Naidu
4,000+Adipurush
3,000+Pathaan
1,575
+The Village
VFX shots increased across theatrical and OTT releases
Theatrical OTT
(Number of shots)
Framestore

143
Key technical innovations scaled up
Studios expanded nationally and internationally
International
company KC
Global Media
Entertainment
brought Animax’s
content to Prime
Video
Crunchyroll
introduced
Hindi, Tamil and
Telugu dubs
Cartoon
Network started
airing My Hero
Academia and other
the Dragon
Ball franchise
Cinépolis released
(including Suzume)
totalling 3,369
shows in India
Sony YAY! brought
merchandise to The
Souled Store and
ONLY
PVR hosted the
Makoto Shinkai Film
Festival in May and
screened four of the
director’s previous
Crunchyroll and
Black White Orange
manage licensing and
merchandising of 35+
anime titles
Festival India
showcased 11 anime
across major
Indian cities
streaming
service Anime
Times launched
in India on
Prime Video
88 Pictures opened
FutureWorks added
a new facility in Mumbai
and Hyderabad each
Basilic Fly Studio
launched Lightrunner
Studio in the UK
Chennai-based
Saffronic set up in
Bengaluru
Digitoonz set up
Los Angeles, USA
Technicolor India
launched a new studio
in Mumbai
Global studio M2
Animation inaugurated
in Mumbai
VFX
Animation
DigitalTheaters
Licensing and
Merchandising
Broadcast
Real-time
rendering engines
Blockchain for
content protection,
VR and AR
experiences
Motion capture
and performance
capture
Cloud-based
3D printing
for stop-motion
animation
Advanced
simulation software
Virtual
production
Immersive sound
technologies
AI for visual
ideation, data
analysis, coding,
quality control,
previsualisation

Expert
speak
India stands to gain from global disruptions, showcasing talent
and deploying infrastructure at scale. The surge in demand for
high-end computer graphics content has led to the evolution of
global value chains, with India being positioned as the ‘engine
room’ for scalable content production on the world stage.
Biren Ghose
Technicolor Creative Studios
In 2023, the Animation and VFX sectors struggled due to the
writers’ strike and Indian kids TV broadcasters’ issues. This
forced Indian studios to focus on overseas and domestic OTT
and film projects. Improvement is expected in early 2024.
Ashish SK
Punnaryug Artvision
VFX is blurring reality, AI is animating dreams, and
narratives unbound. This isn’t animation’s future, it’s
happening now.
P. Jayakumar
Toonz Media Group
In the rapidly evolving AVGC industry, the convergence of
pre-visualization, real-time techniques, and post-production
is reshaping the future. AI emerges as a pivotal enabler,
augmenting skillsets and driving innovation, defining the
next frontier of creativity and technology.
Anand Bhanushali
philm CGI
Today we have a clear opportunity to bring India’s proud
100-year history of film heritage and world-class industry
expertise to the global market. Now is the time to bring
our stories and our talent to the world.
Namit Malhotra
Prime Focus
In the current digital age, all content and storytelling will
need some amount of technological enhancements. With
new areas like Virtual Production Stage and AI along
with advancements in VFX coming our way, it is up to the
directors and the conceptualizers to use all that is available
to amplify the experience of the viewer.
Supriya Yarlagadda
Annapurna Studios

While the demand for VFX is robust and will grow
exponentially, studios and artists will need to skill up and
offer a turnkey VFX/ CGI solution to studios which will
include offerings in pre-production, production and post-
production. The role and involvement of the VFX studio will
extend to all phases of content creation and delivery.
Anant Roongta
Famous Studios
The good news is that the Indian animation industry is transforming from service work
to original IP which can travel globally. The VFX business is facing a bit of a slowdown
because of delayed productions courtesy the US writers’ strike. However, things should
start looking up in the next six months helping kickstart growth.
Anil Wanvari
AnimationXpress.com
As we move into 2024, new technology, global expansion, and
creative storytelling can help create a future where India will
continue to be a leader in high-quality productions across CG,
2D animation, premium VFX, and advanced technology-led
formats such as game-engine/ virtual productions. Within
this artistic and technological mosaic, India stands out as a
formidable force, ready to cater to the diverse demands of
the global M&E sector.
Arjun Madhavan
Assemblage Entertainment
It is crucial to emphasize that Artificial Intelligence cannot
replace Creative Intelligence. In AVGC, our engineers
are inherently creative, not mechanical. The essence lies
in leveraging technology as a supportive tool, enhancing
and advancing the capabilities of our content creators.
Tejonidhi Bhandare
Reliance Animation
Localisation of content is the currency of commerce for the
entertainment industry. AI will not disrupt but enhance
the post-production process including VFX & dubbing
and make the content experience a visual delight for the
viewers and creators alike.
Mandar Natekar
NeuralGarage
The past year has seen Indian content winning globally.
The trend will continue as Indian content creators dream
bigger. We will also witness disruptions in production tech
and business models. New business models will be key for
the growth of the industry and the new co-production fund
will definitely aid Indian producers.
Munjal Shroff
AVGC Forum/ Graphiti Studios
In India, animation has been perceived as a kids medium.
Globally, however, animation has already been widely
explored and accepted through relevant thematics and
storylines for adult audiences. The next milestone of growth
for Indian animation will be to present our rich array of
compelling stories in animation, especially for adults.
Leena Lele Dutta
Sony YAY!

Media & entertainment
Live events
Catch the headlines with
AI anchor Sana

147
Executive summary
Live events grew 20% in 2023 to
exceed pre-COVID levels
►The organized live events segment grew 20% in 2023 to
reach INR88 billion, crossing its pre-COVID levels
►Growth was driven by government events, personal
events and weddings, and ticketed events, including
several international formats
►Corporate events stagnated as several marketers
and digital media. Leading spenders on events were
retail, BFSI, electronics and PSUs
►63% of the marketers we surveyed plan to increase
their events and activations spends over the next two
years. Consequently, we expect the live events segment
to grow at a CAGR of 18% over the next three years to
reach INR143 billion by 2026
►Growth will be driven by premium and international
properties as well as opportunities in tier-II markets,
Patna, Ayodhya, Trivandrum and Cochin
►Event companies will evolve into community managers
to increase audience engagement opportunities and
Note on sizing
►
research conducted across 40 Indian event companies,
over 100 marketers, and industry discussions
The live events segment was action-packed in 2023, underscored not only by growth but also by a notable rise in the
premium segment. While traditional events would continue to provide opportunities, the growth of events focused on
international stars and government events around elections would likely be the key highlights in the coming months.
Recently, conversations around sustainability have also risen in prominence, and will become a big part of planning
and strategy for this segment moving forward.
Organized live events segment revenues
83
2019
27
2020
32
2021
73
2022
88
2023
107
2024E
143
2026E
►The live events segment revenue represents the
revenue of “organized” events and activation agencies
and does not include (1) revenues of the multitude
of “unorganized” event companies spread across the
country, (2) personal events which are paid for in
cash, (3) in-house managed corporate events, and (4)
religious and personal events, as it is not possible for us
to size them. We have provided broad estimations for
the above to provide context.
In addition, events revenues earned by other segments
of the M&E sector are included in the revenues of the
respective sectors.The size estimate also does not
include:
• • The value of media spends on and telecast rights
of events (unless event IP was owned by an events
and activation management company)
• • The value of meetings, incentives, conferencing,
and exhibitions (MICE) conducted by pure travel
companies
• • Monetization of IPs not owned by event companies
e.g., sports media rights
Addressable and unaddressable events revenues
75 | Organized
events per this
report
31 |
Events done by
media companies
(included under revenues
of
other segments in this
report)
82 | In-house
corporate events
(excluding stay,
travel, venue)
1,007 | Unaddressable events
market
(weddings, religious)

Media & entertainment
1 https://indianexpress.com/article/india/three-years-of-modi-government-9-
psus-held-30-events-total-expense-rs-15-crore-4712638/
2 -
ans-by-2024-but-divide-in-spending-power-an-issue-goldman-sachs-2847654
I. Government events
►The government sector increased spending on election
related events, rallies and public appearances to engage
with voters, along with awareness programs and
marquee international events such as the G20 Summit
►
including those celebrating the achievements of various
governments, promoting state investment summits and
driving welfare schemes1
►The opportunity for government events is restricted to
those event companies which have invested in building
long-term relationships with the Government and PSUs
II. Weddings and personal events
►Growth of weddings and personal events have
expected to nearly double to 100 million people within
three years, according to Goldman Sachs Group Inc.2
►India has also become a popular destination for
international couples seeking unique and culturally rich
wedding experiences
III. Festivals and cultural events
►The soft power of India has been growing, and the
number of festivals and cultural events, which are
attracting foreign tourists is on the rise
►The government’s focus on promoting Indian culture
is also paying dividends, with various states taking
up local cultural themes and using events to promote
tourism
IV. Live entertainment/ ticketed events
►Rising per capita incomes have also led to the
concerts, comedy performances, sports and other
entertainment events all growing in 2023
►The proliferation of online ticketing platforms has
made it easier for consumers to discover, purchase,
and attend events and has aided in event marketing to
create increased awareness
Government and personal events
contributed signicantly to the
segment’s growth
Fastest growing event types
80%
Govt
78%
Weddings/
personal
58%
Festivals
and cultural
53%
Live entertainment
(music concerts, etc.)
38%MICE
25%Awards
20%Brand activations
20%
Corporate
launches
Monetization

149
3 Various news articles
Government, Retail and BFSI
were the top sectors spending on
managed events in 2023
►The number of ticked events continues to rise, including
international artists and festivals visiting India:
►Consumers witnessed many international musicals like
the Sound of Music, ABBA’s Mamma Mia!, and West
Side Story, at the premium price range
► Several Indian and international artists, including
Zaeden, Bastille, 50 Cent, Westlife, Deep Purple,
performed in India either solo or as part of festivals like
Lallapalooza3
V. Non-music ticketed events
►Sports remained a strong growth driver with events like
the IPL, WPL, the Cricket World Cup, PKL, ISL, and Kho-
Kho, all catering to an increasing number of fans
►Comedy shows and stand-up performances, education
shows, fashion events, health and wellness events
made a strong beginning, with both domestic and
►Retail, electronics, durables and auto sectors spent
more on events in 2023 due to the premiumization of
sales volumes noted across phones, jewelry, durables,
vehicles, etc.
►BFSI and technology sectors reduced spends on events
as they adopted a hybrid format with a skew towards
online events, while the M&E sector’s spends reduced
due to cost rationalization by OTT platforms
EY survey of event company CEOs 2024
Sectoral spend on events (indexed)
Government
Retail
Banking, Financial
services, Insurance
Electronics, laptops,
phones
PSUs
Technology
FMCG
Consumer durables
Auto
Other beverages
Alcobev
Media and
entertainment
Oil and gas
Tobacco
Telecom
050 100 150 200
Index 2023 Index 2022
42
75 82 88
2
12
17 19
0
20
40
60
80
1
00
1
20
2021 2022 2023 2024E
Ticketing revenues
Sports events Music events

Media & entertainment
Future outlook #Reinventing events
►
subscription products, events become a more important
mechanism to reach such audiences
►92% of event company CEOs we surveyed expected the
events sector to continue its growth in 2024 and this
sentiment corresponds with our survey of marketers,
where 63% of respondents expected their events
spends to grow in 2024 and 2025
►In 2024, we expect growth to be driven by:
• • government events, particularly linked to the general
elections and cultural showcases
• • growth in conferences and exhibitions, as business
opportunities scale due to our US$5 trillion GDP
ambition
• • ticketed events, particularly music concerts and sports
events
• •
to grow in India
►79% of marketers expect to increase their marketing
spends over the next two years4, which will lead to an
increase in sponsorship revenue for various IPs and events
Event company CEOs remain bullish
about 2024
The segment can reach INR143
billion by 2026
How you expect your revenues to grow in 2024 vs 2023
80%
Growth 20%+
78%
Growth 10-20%
Growth upto 10%
No change
since 2023
Down upto 10%
Down > 10%
43%
40%
10%
0%
8%
0%
4EY survey of marketers 2023
5EY estimates
6Industry discussions, review of private and state government proposals
►As infrastructure develops, per capita income grows
and brands look at more towns apart from the top eight
metros, the scope for events will increase across tier-II
cities
►According to GDP and per capita income data, we
Patna, Ayodhya, Trivandrum, and Cochin to be the next
cities where events will thrive5
Tier-II markets will provide growth
opportunities
►With the advent of premium venues like NMACC
Mumbai, the number of international events, acts and
performers entering India to tap the potential of its
►We expect to see growth in premium event venues
across Ahmedabad, the GIFT city, Kolkata, Bengaluru
and Chennai6, which will further give a boost to such
events
►Governments are all focussing on the culture and
monuments in their states, to latch on to the growth in
domestic tourism
►This provides opportunities for annuity cultural events
at a state and district level, as well as sound and light
shows and the like across Indian monuments
►The real power of events comes from their ability to
create shared experiences by bringing people together
at the same time and in the same place. However, this
is for a short duration. As brands clamor for longer
periods to engage with their target audiences, events
will need to adopt a digital avatar – the community
►
it simply allows for longer engagement periods with
audiences, and this can provide a revenue upside, and
higher valuation of event IPs
►The key advantage of online communities is generating
an event’s success to sponsors/ partners and provides
event agencies and future sponsors with valuable
information about attendee preferences
Support international formats to
launch in India
Celebrate brand India
From event companies to
community managers
Organized live events segment revenues
88
107
143
2023 2024E 2026E

151
►Sustainable practices are not only good for the
environment but also for an event’s reputation, budget,
and social impact, and we expect such practices to
become a key requirement for premium events
►One of the easiest ways to promote sustainable
ticketing practices is to use digital tickets instead of
paper ones. Digital tickets can be sent via email, SMS,
or app, and scanned at the entrance. This eliminates the
need for printing, mailing, or collecting physical tickets,
which reduces paper consumption, carbon emissions,
and costs
►ID tags and wrist bands can be reusable, or recyclable.
►Event agencies should encourage attendees to minimize
waste by providing clearly labeled recycling and
composting bins. Avoiding single-use items, such as
plastic cutlery and disposable containers, is another
important step. Opting for reusable or biodegradable
alternatives is a feasible option for most large events
►Incentive ticket sales through planting one or more
trees for every ticket sold
►Implementing pre-event and post-event waste audits
helps identify areas for improvement, allowing agencies
events.
►Event agencies can reduce energy consumption by
or CFL bulbs, and leveraging natural lighting whenever
possible. EVs can be used for transport. Additionally,
incorporating renewable energy sources, including solar
panels or wind turbines, can further reduce the event’s
carbon footprint and promote a greener energy future
Embed sustainability
►In the past couple of years, incidents involving
contingencies to deal with mishaps and situations
as varied as an entertainment act canceling at short
notice, equipment malfunction, severe weather, stage
collapses, or the unavailability of key personnel of the
core team has presented a major challenge for the
segment
►
was canceled due to acoustic issues. The show started
late, and the opening act received feeble laughter due
to poor sound quality
►Event agencies need to focus on improved processes
and safety guidelines to respond effectively to any
incidents and other emergencies that might occur at an
event
►An ideal crisis management plan would include a clearly
checklist that addresses emergency procedures, a
master evacuation plan and adequate provision of
trained security professionals
►Brands are looking for national scale
►Partner and collaborate to provide a bouquet of all
1 million population cities to brands
►Large cities in each state can also be provided to
support state-level launches
Implement improved processes and
safety guidelines
Create national scale
►Promoting Indian weddings can provide a unique Indian
sized events
►Collaborations with global event and wedding agencies
will be critical to promote the bog, fat Indian wedding
Take the wed-in-India campaign global

Expert
speak
Limitless but personal. Mass scale execution but cohort driven, a
billion touch points but individual consumers that you can know
and listen to… and then respond to. This is the need of today….
and it’s best met by the experience industry. The new events
industry is creating global experiences and at heart has the
individual’s experience uppermost on the agenda.
Sabbas Joseph
Wizcraft
Embracing purposeful cultural integration, the live events
and experiential industry is poised to offer unprecedented
immersive experiences, blending technology with
traditional touchpoints, redefining audience engagement
in 2024 and beyond.
Samit Garg
E-Factor Experiences Ltd.
Mohomed Morani
Cineyug Group of Companies
While the entertainment business is growing across the
board, PM Modi’s call to “marry in India” has resulted in a
boost to the wedding industry. Indian destination weddings
are on a new high, and wedding planners and hospitality
are benefitting. In addition, Bollywood shows, music
concerts and international artists are in heavy demand.
Live is seeing a shift: Millennials prioritize quality
experiences, while Gen Z’s spend is driven by impulse and
cost. There lies the opportunity.
Roshan Abbas
VMLYR Encompas
The Creative Sector is destined for exponential growth
driven by weddings and live entertainment, even as
audiences look for unique experiences and are happy to
pay for the same.
Sanjoy Roy
Teamwork Arts
There will be more innovation to produce better
experiences as the growth continues. Government events
have seen increase in quantity and quality, as have
personal events. Weddings lead the way in the business of
celebrations. This trend will continue, and ticketed events
also see a steady rise.
Mandeep Singh
CPM India

These are super exciting times for ‘Experience Creation’.
With so much in a state of flux around us, there are no
rules and there are opportunities galore to break new
ground, and create value. In the inevitable pursuit
for scale, the industry would do well to build a strong
foundation of integrity, depth and long-term stability.
Atul Nath
Candid Marketing
Innovative formats that seamlessly blend local sensibilities
with global trends are driving a surge in ticket sales,
attracting significant sponsor interest. This potent
combination is fueling the industry’s growth. Looking
ahead, hyper-targeted experiences, powered by data-driven
ticketing and tech-savvy sponsorships, will be the hallmark.
Deepak Choudhary
XPRNC, eventfaqs
Irrespective of demographic or psychographic profiles of the
target group, live engagement has always, and continues
to be an integral part of our lives. Focus and accountability
on purpose, process and attaining objectives is the ongoing
need of the hour.
Brian Tellis
Radioactive Ventures
AI in event management optimizes logistics, enhances
attendee experiences, and drives data-driven decisions,
crucial for staying competitive in the experiential event
industry’s future landscape. Embrace AI for operational
excellence and innovative engagement.
Deepak Pawar
Midas Next Media
Strategic alliances, immersive customer experience, ground-
breaking technology leveraging AI & VR, the revolutionary
Un-booth Concept going beyond the 4 corners of a stand,
and deeper integration with social media platforms are
bound to elevate exhibitions in the years ahead.
Yogesh Mudras
Informa Markets in India

Out of Home media
Catch the headlines with
AI anchor Sana

155
Executive summary
Out of home (OOH) media is on a growth trajectory as transit and digital media continue to grow along with
traditional media. Although traditional media constitutes a bulk of the segment, transit and digital media are
growing and would soon outnumber premium traditional media in the coming years. Macro-economic factors such as
OOH segment grew 13% in 2023 Future outlook
►OOH media grew 13% in 2023 to INR41.6 billion, the
value of which includes traditional, transit and digital
media, but excludes untracked unorganized OOH media
such as wall paintings, billboards, ambient media,
storefronts, proxy advertising, etc.
►The OOH segment exceeded its pre-COVID-19 revenues
by 6%
►Real estate, organized retail and consumer services
were the largest advertisers on OOH
►Traditional OOH comprised 62% of revenues and
remained the largest segment; transit media comprised
the balance 38%
►Digital OOH media (included in the above) contributed
9% of the segment’s revenues, up from 8% in 2022
►The number of active digital screens is estimated in the
range of 140,000 to 150,000, with an anticipation that
around 75% of them are currently active
►We expect the OOH segment to exceed INR45 billion in
2024 and reach revenues of INR54.3 billion by 2026
►Transit media will comprise 40% of OOH revenues
by 2026
►Digital media will reach 15% of total OOH revenues
36.9
2022
41.6
2023
46.6
2024E
54.3
2026E
OOH segment revenues

Media & entertainment
Traditional OOH media continued
to be the largest contributor of
revenues at 62%
►Traditional media contributed 62% of total OOH
media, not counting ambient media, wall paintings,
proxy media (like ads in automated teller machines),
storefronts and the informal/ unorganized sector
►Traditional media has grown by 19% over 2022 on
the back of increased demand for premium inventory
formats and large digital screens in metros
►However, rates for certain players we interviewed were
still 5% to 10% below their pre-COVID highs
OOH revenue analysis
EY estimates
Composition of OOH revenues
37%
63%
2020
41%
59%
2021
41%
59%
2022
38%
62%
9%
2023
5% 6% 8%
DigitalTransit Traditional
Transit media was dominated by
airports
EY estimates
►Transit media generated INR15.7 billion in 2023 (38%
of total OOH) up from INR15.1 billion in 2022
►
and hit a record high of 0.152 billion, surpassing the
pre-pandemic levels1
►Mega infrastructure projects, smart city missions,
new airports, metro stations and promotion of marine
transport are driving the growth of transit media
►Brands are tilting towards transit media on account of
the high visibility and frequency of ads offered, which
can be leveraged to engage with an upwardly mobile
audience
►In the realm of transit, there is a swift transition
underway from static to digital formats. By the year
2026, an estimated 60% to 80% of transit displays are
expected to have shifted to digital in the metros, as per
our discussions with segment leaders
Composition of transit media revenues
Airports
Rail &
metro
Other transit
61%
26%
14%
1https://economictimes.indiatimes.com/industry/transportation/airlines-
articleshow/106871494.cms?from=mdr

157
DOOH investments and revenues
increased
►DOOH is rapidly growing in India due to enhanced
measurement capabilities, government support
The integration of mobile technology and changing
consumer behavior further accelerated the adoption of
DOOH in the Indian advertising landscape.
►DOOH comprised 9% of the OOH segment’s revenues,
up from 8% in 2022
►The number of active screens increased to between
100,000 and 110,000, approximately 75% of the total
installed screen base of approximately 150,0002
Digital OOH revenues
0.8
2020
1.2
2021
2.9
2022
3.9
2023
2Based on data from Lemma, Moving walls and industry discussions
3Lemma Technologies estimates
4Moving Walls estimates
►Installed screens grew by 67% over 2022 to reach
150,000, of which approximately 75% were situated
in metros3
►66% of the growth in the number of screens came from
residential apartments and retail media, followed by
transit media
►15% of screens are now 60 inches in size or larger, most
operate for 16 hours a day and usually have ads from
around six advertisers playing at any point in time4
►The rapid growth of DOOH media suggests a growing
recognition of the effectiveness of advertising in high-
density areas, particularly ones which are close to the
point of purchase
►DOOH has consistently shown double digit growth
over the past three years owing the advances made in
Programmatic Digital Out-Of-Home (pDOOH), which
comprises around 15% of ad volumes, while direct deals
account for 85% share
Lemma Technologies estimates
- 10,000 20,000 30,000 40,000 50,000 60,000
Outdoor billboards
Public spaces
Medical centers
Airports
Movie theaters
Offices
Restaurants/ cafés
Shopping malls
Transit media
Retail media
Residential apartments
Number of DOOH screens installed
20232022

Media & entertainment
5Pitch Madison Advertising Report 2024
Real estate and organized retail
were the largest categories5
►
and 66% of growth
►Real estate and construction continued to be the largest
category to spend on OOH with a share of 19%;
this growth has been propelled by the interplay of
urbanization, infrastructure development, evolving
demographics, government initiatives, etc.
►Other categories which drove growth included organized
►With the exception of FMCG, media, and e-commerce, all
categories witnessed growth over 2022
►Telecom, once the leading contributor, commanded just
a 5% share in 2023
Sector Contribution Contribution
to growth
2022 2023
Real estate and
construction 19% 19% 22%
Organized retail 13% 13% 18%
Consumer services 11% 12% 15%
FMCG 13% 11% -3%
Financial services 8% 9% 14%
Media 9% 7% -5%
Automotive 6% 6% 6%
Telecom 5% 5% 9%
E-commerce 3% 2% -2%
Household durables 2% 2% 5%
Pharmacy 1% 1% 2%
Petroleum 0% 0% 0%
Energy 0% 0% 0%
Others 11% 12% 20%
Total 100% 100% 100%
Pitch Madison Advertising Report 2023
Future outlook
We expect OOH to reach INR54.3
billion by 2026
►The importance of the OOH sector has increased in
terms of enabling advertisers to reach rich audiences,
particularly those who have moved to ad-free video and
audio options
►We expect the segment to grow at a CAGR of 9% to
reach INR54.3 billion by 2026, growth being driven
both by volumes, as more DOOH and transit inventory
come into being, as well as rates, especially for
premium locations and transit media
►Urbanization of rural India and rising per capita income
will drive growth for the mass segment
41.6
2023
46.6
2024E
54.3
2026E
OOH segment revenue projections

159
Premium OOH assets will drive
growth
►DOOH is estimated to reach 15% of the overall OOH
spends by 2026 with active screens crossing 200,000
►From large format digital billboards now seen in
metros, to thousands of new screens in corporate hubs,
residential areas, restaurants, gyms and malls, DOOH
will be a key growth driver6
►Technology, which will integrate DOOH inventory
between demand and supply side platforms, will also
result in DOOH getting a share of revenues from the
digital media budgets of advertisers
►Premium inventory at airports, metros and business
districts will drive rate growth
6https://www.afaqs.com/news/media/dooh-set-to-drive-outdoor-
advertising-growth-this-year#:~:text=%22The%20share%20of%20OOH%20
advertising,OOH%20industry’s%20key%20growth%20driver.%22
40%
60%
15%
0%
20%
40%
60%
80%
100%
38%
62%
9%
2023 2026E
Forward forecast for OOH
Transit Traditional DOOH (incl in above)

Media & entertainment
Innovation around engagement
►Established and modern brands are adopting computer-
generated out-of-home (CGOOH) advertising, which has
empowered brands to exceed the limitations of reality,
creating visual campaigns that add to effectiveness
►The integration of OOH advertising with mobile devices
using technologies such as QR codes, NFC, beacon,
location-based services and apps will enable consumers
to interact with OOH campaigns and access immersive,
interactive experiences using their smartphones
►
#Reinventing OOH
From location to audience buying
Improved ROI measurement
Ad network integration
►Dynamic adjustment of ad content and placement,
using real-time audience data and segmentation
techniques to form more intelligent audience groupings,
sources. Advertisers will now buy audiences and not the
locations
►In the years to come, OOH advertisers will have access
to advanced measurement and analytic tools. Utilizing
sensors, cameras, and data analysis, advertisers
will acquire a more profound insight into audience
►The IOAA, in partnership with Relu.AI, has created
for OOH. The platform uses pan-India mobility data
(150 million anonymized points of interaction every
day, tracking movements, points of interest etc.),
the India Census, Global Administrative Areas Maps
boundaries for various states, districts, towns, and
taluks), Google Maps and points of interest maps
►The platform has been designed to deliver detailed
reports for metrics such as cumulated unique reach,
cumulated impressions and frequency for a campaign
plan, as well as site-wise impressions, frequency and
opportunity to see. It can also deliver weekday and
weekend metrics, hourly reach, etc.7
►DOOH networks will combine with digital ad networks
to provide a seamless platform to buy digital and DOOH
inventory
►Integrating programmatic platforms will enable
utilization of unsold inventories
►Integration with radio ad scheduling software can also
enable a combined audio and video OOH experience
►By geo-targeting, DOOH can help distribute discount or
trial coupons for local stores to patrons who are willing
to receive offers
7IOAA

161
Adding utility
Premium districts and clusters
Government policies for sustainable
growth
►Smart assets will help with rainwater harvesting, air
quality measurement and management, as well as
become centers for availing government digital services
►Every city will identify a premium district, usually a
central business district, and create cluster advertising
models to support targeting at scale as audiences from
across the city tend to aggregate at such places
►We anticipate state governments to draft guidelines on
some of the following areas:
• • regulation of start and end time for digital assets
• • usage of renewable energy
• •
• • use of eco-friendly materials
• •
and pedestrian safety
• • regulating the type of messages
• • conversion of static assets to digital assets to
reduce the need for physical materials and
decrease waste
• •
assets permissible in each area to manage clutter
and aesthetics
• • illegal political hoardings

Media & entertainment
All data has been provided by Moving Walls India Pvt. Ltd. to EY and has not been independently veried by EY. It has been presented in summarized form for
presentation purposes only.
Powered by Moving Walls India Pvt. Ltd.
Digital OOH India
Trends
India has over 165,000 digital screens
Screen count increased 14% over 2022
Large screens saw a substantial
growth in 2023
Three of four screens were still less than 36 inches in size
Direct deals are currently
85% of ad volumes
Most screens are in residential complexes
100,000
2021
145,000
2022
165,000
2023
Digital screens (India)
180,000
2024E
200,000
2025E
Non-metro 25%
Metro
(Top 12 cities)
75%
75% of the digital
screens
are present in the
top 12 metro cities
Approximate digital screens by location
3,955
200
250
1,000
1,000
1,000
2,500
2,500
4,500
5,000
5,000
5,500
6,500
7,500
7,500
8,000
8,500
10,000
85,000
Others
Education/ college
Salon
Gas stations/ petrol pump
Pharmacy
Gym
Metro/ metro station
Hospital
Railway
Pedestrian/ roadside/ outdoor
Airport
Bars/ lounge/ restaurant
Retail/ super market/ grocery
E
ntertainment/ theater/ food court
Corporate/ office buildings, lobby
Commercial/ mall
Bus terminus/ station/ bus shelter
Transit, train stations, platform
Residential
70%
28%
2% 0%
76%
10% 14%
1%
Small
(under 36
inches)
Medium
(36 inches to
60 inches)
Large
(60 inches to
100 inches)
Spectacular
(>100
inches)
Size of digital screens
2023 2024
Programmatic
15%
Direct
deals
85%
Ads play for an
average of 12
hours per day
(10-15 seconds
average ad slot duration)

163
Digital screens by state
Pricing is evolving
Average price per month per ad slot (average 200 ad plays per day) in INR
Small screen
(<36 inches)
Large screen
(60 to 100)
Medium screen
(36-60 inches)
Spectacular
(>100 inches)
3,500-
9000
100,000-
600,000
15,000-
30,000
1,500,000-
5,500,000
Uttarakhand
309
Himachal Pradesh
195
Uttar Pradesh
Andhra Pradesh
1,665
Odisha
876
West
Bengal
Jharkhand
9,090
Delhi 10,785
117
Bihar
60
Madhya Pradesh
1,518
Rajasthan
2,112
Telangana
21,288
Chhattisgarh
468
Assam
117
Maharashtra
33,348
Gujarat
5,175
Punjab
702
Haryana
10,953
Chandigarh (UT)
201
Karnataka
27,381
Goa
258
Kerala
1,863 Tamil Nadu
13,533
23,379
Jammu and Kashmir
12

Expert
speak
DOOH has given our industry a wonderful opportunity
to get our fundamentals in order. If we can automate our
buying process, give reliable audience data and provide
proof of performance through third party monitoring, I
think we can double our share of the advertising pie.
Jahan Mehta
Selvel
AR, VR, CGI, holograms and other new technologies
are reshaping advertising strategies, with brands
increasingly embracing OOH. DOOH provides
advertisers with flexibility, engagement and more
importantly measurability. Major events like the Lok
Sabha election, the IPL and T20 World Cup will inject
significant spending into the sector in 2024.
N Shekhar
Times OOH
Indian OOH media is going through a huge
transformation right now where DOOH is taking over
conventional static billboards. With connected screens,
immersive technology and engaging content, OOH is
becoming a medium of choice for advertisers who want to
target young and constantly mobile consumers.
Alok Jalan
Laqshya Media Group
OOH has been an overwhelmingly under used medium.
To drive growth through ethical practices, inclusivity and
innovation, the IOAA has introduced “RoadStar” an OOH
media evaluation platform. More tech innovations are
also in the pipeline. These innovations would enable OOH
to gain its rightful place in the media landscape.
Pawan Bansal
Jagran Engage

Out of home media will continue to grow, with premium
inventory providing a cost-effective means to target
affluent audiences.
Sunil Vasudeva
Pioneer Publicity
With the advancement of technology and the rapid pace
of urbanization, OOH and DOOH are not only becoming
widespread but also more adaptable and precise. This
trend provides advertisers with exceptional avenues
to connect with audiences in meaningful and effective
manners, fostering engagement and impact.
Rishabh Mehta
LOCAD
DOOH is being propelled by the confidence in
programmatic technology and advanced measurement.
From enhanced creativity (3D and anamorphic ads)
to technological strides (pDOOH), screen expansion,
and quality, DOOH has become a pivotal element in
both traditional and digital media plans, shaping the
advertising landscape.
Gulab Patil
Lemma Technologies
Throughout India, new developments are being
planned with digital signage in mind. The only missing
development is around a common measurement
standard, which is bound to happen soon. Indian brands
are embracing digital OOH not just in India but running
outbound campaigns in markets where there is demand
for their products and services.
Mehul Mandalia
Moving Walls

Media & entertainment
Music
Catch the headlines with
AI anchor Sana

167
Executive summary
Indian audiences continue to have a strong engagement with music. Film music leads consumption, primarily through
music streaming. However, the live events space made a strong comeback. Digital music consumption continues
to rule, recording a majority of the music industry’s revenues. We expect to see consolidation in the records labels
space. Technology will continue to play an important role in the music industry in the coming times.
22 24
28
37
2022 2023 2024E 2026E
Music segment revenues ►
billion in 2023, slower than previous years as certain
music OTT platforms went pay and stopped or reduced
their free services
►Film music comprised 64% of total music consumption,
but artist-driven music continued to grow and reached
►Digital revenues grew 9% in 2023 and accounted for
87% of total music segment revenues
►
million. However, only around 7.5 million paid for a
subscription
►
in 2022 to INR29 billion (net of taxes) in 2023, driven
by a growth in digital revenues of 17% and performance
rights of 20%
►
►
of 15% to reach INR37 billion by 2026, on the back
of increasing digital revenues, the pay subscriber
base growing to 15 million and continued recovery of
performance rights as events and activations increase
in scale

Media & entertainment
Music consumption
Indian consumers spent 24.4 hours
a week listening to music1
Music consumption was led by lm
music
►
though the overall time spent dipped by 5% to reach 24.4
hours per week vs. 25.7 hours per week in 2022
►
20.7 hours per week
►
• •
• • 76% said that music is important to their mental
health
• • 74% discovered a new artist or music weekly
►
to music, much higher than the global average of 29%
►
from ~80% three years ago as a more artist-driven
industry emerged2
►
consumed. Top genres enabling this include Punjabi
music, which is now gaining popularity internationally
►
performed at the Coachella Valley Music and Arts Festival
in California, bringing Punjabi artist music to a well-
recognized global stage
►
as well. Music artists in India have started to create at the
top international levels, which has improved the quality
of music. Indian artists have released singles along with
international artists such as:
• • Hass Hass by Diljit Dosanjh X Sia, an Australian artist
• • Palpito by Diljit Dosanjh X Camilo, a Columbian artist
• •
►
which comprised ~10% of the consumption
►
pertained to international music
Digital listenership by genre
Film music
Artist-led
music
Others 64%
10%
27%
1 IFPI “Engaging with Music 2023”
2 Industry discussions

169
3 EY estimates
4 Social Blade as on 28th December 2023
5 IPRS estimates
6 https://www.livemint.com/companies/news/lollapalooza-india-is-on-track-to-break-even-next-year-bookmyshow-11706165616886.html#:~:text=%E2%80%9CLol-
la%20will%20break%20even%20by,%E2%80%9C%E2%80%A6
7 https://www.gqindia.com/entertainment/content/backstreet-boys-bonobo-4-big-upcoming-international-acts-to-check-out-in-india
YouTube remained the platform of
choice for music consumption
Live events and concerts made a
comeback
Hindi and Bhojpuri music accounted
for 70% of the music consumed5
►
continued as the preferred platform for music
consumption, with an estimated 2.2 trillion streams3
►
India are music channels4
►
YouTube channel globally4
►
week
►
multi-genre festival had over 40 artists — a mix of
international and homegrown and resulted in a footfall
of over 60,000 in two days. It is on track to break-even
by its third edition in 20256
►
impressive line-up of international artists who made
India part of their world tours in 2023, such as
Purple, Westlife, Goo Goo Dolls, Bastille, Kodaline, and
more7
►
currently one-off gigs and festivals are still more
common. However, listeners are primed for a more
dynamic events line-up, and this can be leveraged in the
coming years as the sector evolves
►
Tamil (5%), Telugu (5%), Kannada (3%), Marathi (2%),
Malayalam (1%), Haryanvi (1%), and others (8%)
Social Blade as of December 2023
Rank
Subscribers Video views
Label Millions Label Billions
1 T-Series 255 T-Series 241
2 Zee Music 103 Zee Music 62
3 Shemaroo 67 Wave Music 41
4 62 YRF 38
5 Wave Music 60 35
Hindi and
Bhojpuri
South Indian
languages
Punjabi
Others
Digital listenership by language
70%
14%
8%
8%

Media & entertainment
Monetization
Digital revenues were 87% of the
total music segment
Digital revenues grew 9%
Digital
87%
Physical
1%
Performance
rights
8%
Sync
4%
Break up of music segment revenues
►
comprising revenues earned on music streaming
platforms, YouTube, short video, and social media
platforms, and from telecom operators
►
overall revenues
►
million active users8
►
approximately 7.5 million9 in 2023
►10 , Resso announced a shift to
SVOD exclusively11
►
users in India – they will no longer have the ability to
play songs in a particular order in a playlist, repeat
part of a song to listen to12
►
almost 9% in 2023 to INR18 billion, ~77% of which was
advertising driven
8 Comscore
9 Industry discussions, EY estimates
10 https://musically.com/2022/09/12/gaana-ditches-free-streaming-in-favour-of-paid-subscriptions/
11 https://techcrunch.com/2023/05/04/bytedance-is-making-its-music-streaming-service-resso-premium-only/
12 https://www.newsbytesapp.com/news/science/spotify-introduces-listening-restrictions-for-free-users-in-india/story
with embedded music

171
Revenue for music labels increased
by 17%
Some short video platforms
struggled
Content acquisition costs
skyrocketed
Music publishing revenues grew to
INR8 to INR9 billion
►
in 2022 to INR29 billion (net of taxes) in 2023, driven
by a growth in digital revenues of 17% and performance
rights of 20%
►
and they also contributed 90% of the absolute revenue
growth for labels
►
in 2021, daily active users have been on a downward
trend13 , out-competed by international players, such as
Instagram Reels and YouTube Shorts14
►
verticals, founder exits and complete shutdowns as well
►15
►
labels with platforms reconsidering renewals of music
licensing contracts in an attempt to curb costs16
►
increased the price of audio rights
►
17.
►
Saaho (INR220 million) and Baahubali 2 (INR100
million)
►
estimated INR650 million18
►
swing on the back of international music OTT, social
and short video platforms entering into licensing
agreements with the IPRS as well as independent music
publishers
►
publishing licence requirements during 2023, notably
Sony, Zee, etc.
13 https://inc42.com/features/india-short-video-apps-social-media-wasteland/
14 https://inc42.com/buzz/short-video-platform-tiki-shut-down/
15 https://inc42.com/features/sequoia-exits-trell-massive-loss/
16 Industry discussions
17 -
show/84901752.cms
18 https://www.news18.com/entertainment/telugu-cinema/pushpa-2-audio-rights-sold-for-record-price-a-new-feat-in-indian-cinema-7712443.html
14%
17%
17%
20%
Sync
Digital
Overall
P
erformance rights
Label revenue growth over 2022
IMI, EY estimates

Media & entertainment
Future outlook
We expect the music segment to
reach INR37 billion by 2026
Paid subscriber base could reach 15
million by 2026 or 2027
Record labels will continue to
consolidate
Rights values could remain elevated
►
the next three years to reach INR37 billion
►
base as the next 100 million users get access, growth in
the SVOD base, more music concert revenue, increased
reach of social media, growth of YouTube, as well as
increased international consumption of Indian music
►
are the future, since OTT platforms cannot sustain
providing free or ad-supported music
►
paid subscribers to 2-2.5x their current volume in three
to 40 million)19
►
larger labels consolidate their holdings across language
markets, and we expect this trend to continue
►
streaming, help bring more genres and regional music
to the mainstream market and strengthen labels’ ability
to invest in artists and creators
►
in India, as well as the improved performance of
music rights values at their current elevated levels in
2024 and perhaps into 2025
19 Industry discussions
24
28
37
2023 2024E 2026E
Music segment revenues

173
#Reinventing music
Create new artist discovery
methods
Focus on collaborations
Enable innite artist life Bundle, and keep on bundling
Market music via games
Do AFPs Ab Initio
Find those one-song wonders
OTT-driven music
Go for the superfans
Improve royalty collection
►
continue to grow and contribute around 40% of
consumption by 2026-202720
►
can bring about choices, and provide chances to young
and fresh talent
►
the number and type of collaborations can help cross-
pollinate fans, both globally as well as locally
►
can create a new variety of music, as well as be the
foundation for many entertainment/ reality shows
►
iconic band to perform “live” in front of 3,000 people
everyday, generating US$2 million every week over 15
months21
►
Lennon’s voice22
►
voice of any artist, as well as create original music
►
innovations can enhance the listener experience and
improve monetization prospects
►
brands, newspapers and magazines, ISP subscriptions,
subscribers
►
spend over an hour a day playing games
►
►
for brands to partner with
►
years
►
chance of success, even if the creators are not yet well
known or have a fan base
►
including songs on OTT content can be a new mode of
discovery
►
opportunity for custom music TV products viz. think
personalized MTV, with packaging to suit viewer tastes
e.g., song trivia, band information, video insights, chart
data, etc.
►
their artistic life-cycle via deep engagement, building a
base of “superfans”
►
favorite artists, whether through purchasing concert
tickets, funding content creation, buying merchandise,
etc. Superfans also help create “virality” of content that
is necessary for gaining popularity
►
offering alternative income streams and ensuring
artists can continue creating music
►
near real-time, and allocate revenue shares to relevant
publishers, authors and labels, which can create a high
create more and better music
20 Industry discussions
21 https://www.bloomberg.com/news/newsletters/2023-09-04/-abba-voyage-tour-makes-2-million-a-week-with-an-avatar-band
22 https://www.cnbc.com/2023/11/02/a-new-beatles-song-is-set-for-release-after-45-years-with-help-from-ai.html

Media & entertainment
Spotify India
Trends
Reach
Consumption
Spotify 2023 India charts
Note: All data has been provided by Spotify India and is based on their research. It has not been validated by EY, and presented in summary form for
representation purposes only
Spotify users in India at the end
of October 2023
(per Comscore)
Spotify India users’
share of local music
consumption, highest
among Spotify’s 180+
markets
A majority of the
streams for Spotify in
India come from here
The most popular category
for music streaming, though
increased to an all-time high
in 2023
Most popular
languages in India
Top genres
in India
Hindi
English
Punjabi
Tamil
Telugu
Film music
(led by Bollywood)
Pop music
(Hindi, Punjabi, Tamil)
Hip hop across local
languages
(Punjabi, Hindi, etc.)
Towns in India where Spotify
was streamed between
2021-2022
70
million
70%
Tier-I
cities
Film
music
7,500
Top artists
1Arijit Singh
2Pritam
3Anirudh Ravichander
4A.R. Rahman
5Shreya Ghoshal
6Amitabh Bhattacharya
7Alka Yagnik
8Vishal-Shekhar
9Sidhu Moose Wala
10 Udit Narayan
Top podcasts
1Shrimad Bhagwadgita
2The Ranveer Show
3Krishna - The Supreme Soul
4True Story Bro! with Triggered
Insaan
5Mahabharat Gaatha
6The Horror Show by Khooni
Monday - Scary Stories in Hindi
7The Ranveer Show (fgUnh
8Ajay Bhalla
9The Stories of Mahabharata
10
Top songs
1King
2 Kahani Suno 2.0
3Pritam Kesariya
4Sachet Tandon Malang Sajna
5Shubh Cheques
6 Heeriye (feat. Arijit Singh)
7Anirudh
Ravichander Chaleya
8 Phir Aur Kya Chahiye (From
"Zara Hatke Zara Bachke")
9Alka Yagnik Agar Tum Saath Ho (From
"Tamasha")
10 Chani Nattan Daku

175

Expert
speak
While the focus on growing paid subscribers will cause
short-term stress, I believe that in the mid-term, revenues
will double and we can expect around 50 million
subscribers in a few years.
Vikram Mehra
Saregama
India continues to top the global list of most important growth
markets. While the market saw consolidation with huge
corrections, it will continue to grow aggressively on the back
of technology, regional penetration, newer younger genres
popping faster and Indian Independent Popular music and
artists that we’re now calling I-Pop compared to film music.
Devraj Sanyal
Universal Music Group
In the upcoming year, a prominent trend emerges in
the Indian music industry. An artist-centric ecosystem
where superstars dominate charts and shows, along with
streaming services pivoting to a paid ecosystem, will
reshape consumption in India.
Jay Mehta
Warner Music
Indian music industry has emerged from the legacy
shadow of the film industry and there is nothing called
‘Regional music’ – it’s all national and mainstream.
The industry is shapeshifting structurally into an artist
and talent centric industry. Smaller but highly engaged
communities of superfans (rather than consumers) will
drive consumption of music and surrounding experiences.
Mandar Thakur
Times Music
DSPs efforts have started to show results in terms of incentivising
free subscribers to upgrade to paid streaming, and we expect
this trend to significantly grow during the next three years.
Substantial product differentiation is needed between free
and paid tiers. Exorbitant cost of content in both film and
non-film albums is making this transition difficult .
Neeraj Kalyan
T-Series
2024 will have challenging trends as far as ad-supported
revenue is concerned, however, we expect a steady growth
in music subscriptions in India. In 2023 only the top
theatrical successes gave a push to music consumption,
and 2024 could see similar results. 2024 will provide
opportunities for M&A and strategic partnerships.
Vivek Raina
Believe Digital

Moving towards a paid ecosystem with multiple paid tier
options to the consumer is the surest way to #reinvent
the recorded music industry. Baby steps have been taken
towards a paid ecosystem, a glass half full, half empty
situation. I would like to look at the glass as half full.
Blaise Fernandes
Indian Music Industry
The rise of Music Publishing is leading a shift of control
to songwriters, enabling them to retain copyrights in
their compositions and lyrics. This helps them share in the
success of their songs, and retain a say in how their music
can be used by labels and publishers across versions,
adaptations, sampling and synchronisation.
Dinraj Shetty
Sony Music Publishing
Fuelled by soundtracks and a focus on artists, India’s music
scene will soar as digitally connected youth forge a fan-led
ecosystem, opening a vibrant new chapter for the industry.
Vinit Thakkar
Sony Music India
As technology reshapes music, the industry and creators
must harness its benefits for enhanced creativity. It is also
vital to have robust laws ensuring IP rights, granting
human creators and rights holders their deserved credit
and fair remuneration.
Rakesh Nigam
IPRS
Indians are now consuming more music, and the industry is
expanding beyond conventional film music. We have seen an
upsurge of new talent, offering a new landscape of music. In the
short term, we may see a slow down with some services going
pay and others shutting down, but can expect to see stellar
expansion in the long term as overall consumption grows.
Anurag Bedi
ZEE Music Company
Overcoming widespread avoidance of Public Performance
Rights is crucial for a thriving music ecosystem. Collaborating
with the government is going to ensure compliance,
safeguarding rightful dues for copyright owners and artists.
GB Ayeer
PPL

Radio
Catch the headlines with
AI anchor Sana

179
Executive summary
The radio segment is still recovering from the pandemic-induced slowdown. Although, revenue continues to grow, it is yet to meet
the 2019 numbers. Hyper localization has become an important factor towards the growth of radio. While smartphones continue
to grow and impact almost all segments of the M&E sector, radio is no longer available on all smartphone models. There are
distinct opportunities for radio in India to grow, provided the right opportunities are tapped.
Reach
Monetization
Radio segment revenues grew by
10% in 2023
31
2019
14
2020
16
2021
21
2022
23
2023
Radio segment revenues
►India had 1,313 operational radio stations, an increase
of 90 stations over the previous year, including 446
community radio stations
►Radio segment revenues grew 10% in 2023 to INR23
billion, but were still just 73% of 2019 revenues
►Ad volumes increased by 19% in 2023 as compared to
the previous year, with estimated fall in ad rates by 8%
►Share of retail advertising increased
►Radio companies are focusing on building regional shows,
with novel and engaging content which are multi-media
in nature, and non-FCT revenues are now 20% to 25% of
total revenues
►
continues to be an industry issue
►We expect revenues to recover to INR27 billion by 2026,
of which around a fourth will be non-FCT revenues

Media & entertainment
1 QPIR_05122023.pdf (trai.gov.in)
2
3 https://www.livemint.com/news/india/govt-revises-advertise-
ment-rates-for-private-fm-radio-11696858478393.html#:~:text=The%20
gross%20base%20rate%20for,December%202015%20and%20March%20
2023.
4 Ministry of Communications, PIB
5 TAM AdEX
6 TAM AdEX
7 TRAI recommends delinking NOTEF from FM Radio license fee - Broadcast
and CableSat
►India had 36 private FM broadcasters in 2023,
operating 388 FM radio stations across 113 cities1
►In addition, the public broadcaster Prasar Bharti’s
All India Radio service operates 479 stations in 23
languages and 179 dialects, reaching 92% of the
country’s area and over 99% of India’s population2
►India had 446 operational community radio stations as
►426 categories comprising 10,000+ advertisers and
13,615 brands advertised on radio during 2023
►Of the above, 4,400 advertisers were not present on TV,
print and digital
►Due to the enormous increase in volumes which was higher
in smaller towns at lower yields, ad rates remained soft,
falling 8% on an average
►Retail/ local advertisers’ share of ad volumes increased
28% over 2022 driven by revival of the retail segment in
2023 and the growing cost of local and city-centric digital
advertising rates
►National advertisers share of total radio advertising fell,
though actual volumes grew by 10%
►Services, retail and auto were the top three categories,
aggregating 51% of total spends on the medium
►Industry discussions indicated that non-FCT revenues
contributed an average of 20% to 25% of total revenues
earned by large radio companies
►Creating event IPs, brand activation, building communities,
international music streaming, content production,
contributors to such revenues
►The Government approved 43% increase in the base
rates of advertisements on private FM radio stations.
The new rates have been announced after eight years3
►The Telecom Regulatory Authority of India (TRAI)
has released recommendations on issues related to
FM radio broadcasting, including private FM Radio
operators being allowed to broadcast news and current
affairs programs, limited to 10 minutes in each clock
hour
►TRAI has also recommended removal of linkage to
non-refundable one-time entry fee and extension of the
existing FM license period of 15 years by three years4
►Radio measurement remains restricted to a few cities and
hence, the ability to demonstrate reach and listenership to
advertisers is low
►Several top-end smartphones have not incorporated an FM
radio receiver/ chipset, and this is impacting reach, and can
be an existential threat unless the government mandates
that all phones need to be equipped with radio receivers
►In addition, there is no clear path forward for the
implementation of digital radio in a manner that protects
the interests of all stakeholders
►The Telecom Regulatory Authority of India (TRAI) has
also recommended that the annual license fee should be
calculated at 4% of the Gross Revenue (GR), excluding
GST, of the FM radio channel7 but that has not yet been
implemented
►
to broadcast news and current affairs programs for 10
minutes each clock hour, something every other medium is
permitted to do
India had 1,313 operational radio
stations
Radio ad volumes increased by 19%
compared to 20225
Share of retail advertising volumes
increased6
Share of non-FCT revenues increased
Regulatory initiatives
Key issues remain unresolved for now
Reach Monetization

181
►We expect radio revenues to continue recovering and
reach INR27 billion by 2026, though ad rates will
continue to remain subdued
►Growth will be driven by:
• • SME and retail advertiser segment, where spends
can be easily attributed to sales
• • Launch of several new and challenger brands in
FMCG, durables and electronics, where retail ad
media are effective in creating awareness
• • Non-FCT revenues as radio companies create brand
extensions to leverage additional opportunities for
marketing and short video
►Rate recovery will continue to be a challenge, and
well as implementation of a measurement metric to be
able to demonstrate – especially to national advertisers
►The increase in DAVP rates for government ads will be
welcome in an election year
►Radio companies’ innate ability to create relevant
regional content will help drive their growth in the
content production (both short form and episodic) and
►Considering the hyperlocal nature of the radio
product, radio companies are well positioned to build
communities to drive D2C relationships, which can be
leveraged by brands
►Hyperlocal and D2C revenue streams will be a key
differentiator for radio players as compared to digital
and national media
►
non-FCT revenues comprising approximately a fourth of
total revenues by 2026
Revenues will continue to recover in
2024
Non-FCT revenues will continue to
grow
Future outlook
EY estimates
24
2024E
27
2026E
23
2023
Radio segment revenues
Revenue mix of radio segment
2026E2023
83% 76%
17% 24%
FCT revenues Non-FCT revenues

Media & entertainment
#Reinventing radio
Radio is and
will remain an
integral part
of India
388 FM
Make radio digital
stations
Implement digital radio to increase frequencies 4x, enabling more genres and niche products to
serve the lean-back audio audience of the country
Bundle inventory
Create bouquets and bundles of community radio stations and offer advertisers hyper-local audiences,
subject to regulatory compliances
Monetize followers
Build an influencer network and use tech to match influencers to brands and their needs
Go song+
Create on-demand content like podcasts, news briefings, weather, sports and entertainment updates
within the radio experience, using Generative AI
Piggy-back on TV
Use television frequencies to distribute radio channels, add 165 million households. Perhaps use the
landing page more effectively
Go global
Build products for the Indian diaspora available on digital media around the world
Embed drives
Ensure FM and digital radio remain available in all cars
Build an alternate device ecosystem
Integrate radio seamlessly into popular smart speakers and devices like refrigerators and cooking ranges
Ensure reception
Ensure radio sets continue to come with FM receivers
Build engagement
Offer voice-activated personalized stations that adapt to user preferences over time. Allow users to create
custom voice commands to access frequently listened to stations or genres
446
community radio stations
500+
RJs
4 million+
cars sold each year with
integrated radios
20,000+
original songs released
each year in India
165 million+
TV sets
38+ countries
Indian films release in
750 million+
phones within India
Source: Media article, EY report music publishing in India, IPRS, YouTube, ICEA, Industry discussions, FICCI-EY M&E sector report. Ideas do not consider current
regulatory environment or licensing regime, which may need to be changed to implement the above.

183
Radio is and
will remain an
integral part
of India
388 FM
Make radio digital
stations
Implement digital radio to increase frequencies 4x, enabling more genres and niche products to
serve the lean-back audio audience of the country
Bundle inventory
Create bouquets and bundles of community radio stations and offer advertisers hyper-local audiences,
subject to regulatory compliances
Monetize followers
Build an influencer network and use tech to match influencers to brands and their needs
Go song+
Create on-demand content like podcasts, news briefings, weather, sports and entertainment updates
within the radio experience, using Generative AI
Piggy-back on TV
Use television frequencies to distribute radio channels, add 165 million households. Perhaps use the
landing page more effectively
Go global
Build products for the Indian diaspora available on digital media around the world
Embed drives
Ensure FM and digital radio remain available in all cars
Build an alternate device ecosystem
Integrate radio seamlessly into popular smart speakers and devices like refrigerators and cooking ranges
Ensure reception
Ensure radio sets continue to come with FM receivers
Build engagement
Offer voice-activated personalized stations that adapt to user preferences over time. Allow users to create
custom voice commands to access frequently listened to stations or genres
446
community radio stations
500+
RJs
4 million+
cars sold each year with
integrated radios
20,000+
original songs released
each year in India
165 million+
TV sets
38+ countries
Indian films release in
750 million+
phones within India

Media & entertainment
Source: TAM Media research. TAM AdEX’s data pertaining to 90+ radio stations for Jan to Dec 2023. The data has been provided by TAM Media Research to EY
and has not been independently veried by EY
2020 2021 2022 2023
Categories 417 414 419 426
Advertisers 8,588 8,357 10,190 10,441
Brands 10,685 10,515 13,017 13,615
Top ve categories
Rank
2022 2023
Properties/ real estate 1 1
Hospital/ clinics 2 2
Retail outlets - jewellers 3 3
Cars 4 4
Retail outlets - clothing/ textiles/ fashion 5 5
Rank Top ve sectors
Share
2022 2023
1 Services 33% 31%
2 Retail 12% 10%
3 Auto 8% 10%
4 Food and beverages 8% 8%
5 9% 8%
Rank Top ve advertisers Share
1 Life Insurance Corporation of India 2%
2 Kedia Homes 2%
3 Maruti Suzuki India 2%
4 Vishnu Packaging 1%
5 Reliance Retail 1%
India radio advertising
Trends
Powered by TAM AdEX
(A division of TAM Media Research) in association with RCS India
Radio ad insertions grew 17% in 2023
Services, retail and auto contributed
to over 50% of ad volumes
LIC continued to be the largest
advertiser on radio in 2023 as well
Local advertisers’ share reached
53% of total ad volumes in 2023
Up 10% from 2022
categories remained
unchanged in 2023
On an average, 64 thousand ads were broadcast daily in 2023
Over
13,600 brands
advertised on radio in 2023
Up 5% from 2022
49 47
60 65
60 62 64
72
Q1
(Jan-Mar) Q2
(Apr-Jun) Q3
(Jul-Sep) Q4
(Oct-Dec)
2022 2023
Average ad insertions per day
(in 000s)
39% 49%
61% 51%
2021 2022 2023
Local advertiser National advertiser
Share of ad volumes
53%
47%

185
69% of ad volumes were in the top 10 cities
Kolkata, Mumbai, Chennai and Bengaluru were not in the top cities
Gujarat, Maharashtra and Uttar Pradesh maintained the highest ad volumes
Jaipur
New Delhi
Nagpur
Indore
Vadodara
Hyderabad
Ahmedabad
Surat
Pune
Lucknow
Others
% of total ad volumes
9% 8% 7% 7% 7% 7% 6% 6% 6% 6%
31%
Gujarat
Maharashtra
Uttar Pradesh
Andhra Pradesh
Rajasthan
New Delhi
Tamil Nadu
Madhya Pradesh
Karnataka
West Bengal
Kerala
2%
5%
5%
6%
7%
7%
9%
9%
10%
18%
20%

Expert
speak
In 2024 we anticipate growth from new clients, higher
retail contributions, and a festive season price increase.
Key drivers will be solutions-oriented sales, events,
activations, digital platforms, and influencers. The
industry’s well-being hinges on government support for
TRAI recommendations, like the mandatory FM tuner
activation in mobiles and detaching radio license fees
from NOTEF.
Yatish Mehrishi
ENIL - Mirchi
The fusion of content and tech has redefined how
consumers engage with content, delivering solutions
for brands. Through AI-driven personalization, virtual
influencers, experiential AR/ VR, on-ground activation
and micro marketing, a new era unfolds, creating
precisely tailored authentic content and connections with
audiences.
Abe Thomas
Reliance Broadcast Network Ltd.
As consumer behaviour continues to shift towards
digital platforms, the media industry is undergoing
a transformative journey, where adaptability and
innovation are paramount. A fundamental restructuring
with the fusion of traditional and digital media is
evolving. Radio is strategically placed and will create
a new radigitalized face for itself in this changed
environment.
Ashit Kukian
Radio City
In the M&E sector, radio may be small, but its power in
reaching the masses is unparalleled. We are embracing
innovation to ensure our space in the digital landscape,
creating a level-playing field to coexist.
Nisha Narayan
Red FM and Magic FM
Extremely upbeat about Radio for the upcoming year,
the current FY went as per our expectation. Radio has an
edge over other mediums, owing to the hyperlocal nature
of the business resulting in high ROI to advertisers.
Rahul Namjoshi
My FM


Media & entertainment
Sports

189
Executive summary
Sports segment grew 11% in 2023
Future outlook
1Source: BARC (https://www.afaqs.com/news/marketing-initiatives/2023-the-year-when-cricket-on-television-created-and-recreated-history#:~:text=As%20per%20
BARC%2C%20803%20million,for%20TV%20viewership%20in%20India.)
Revenue
►
of the segment’s revenues
• • TV comprised 62% of media spends in 2023, in
comparison to 73% in 2022
• • Digital comprised 38% of media spends in 2023, in
comparison to 27% in 2022
►
sponsorships demonstrated robust growth, expanding
by 24% in 2023 and contributing 47% to the segment’s
revenue
►
endorsement deals took place across various sports in
2023, of which 436 endorsements, contributing to 87%
of value, were attributed to cricket
►
y-o-y growth of 13% compared to a 1% fall for emerging
sports, since 2023 did not have a FIFA world cup and
the PKL season started only in December
Consumption
►
reaching a gross AMA of 55 billion
►
up from 74% in 2022
►1 viewers in 2023,
while an estimated 530 million viewers watched sports
on digital in 2023
►Monetization of high-cost cricket will evolve to create
differentiated products across CTV, mobile, pay TV and
free TV in order to maximize reach
►
building strategy, work on creating sports heroes to
endear fans
►
interest
►
video, esports, TVOD and distribution
108
70
112
168 186
17%
-35%
62%
49%
11%
-60%
-40%
-20%
0%
20%
40%
60%
80%
0
50
100
150
200
20202019 2021 2022 2023
Sports segment revenues and growth
Revenues (INR billion) Y-o-y % growth

Media & entertainment
The segment grew 11% in 2023 Media spends declined
Cricket revenue grew by 13% in 2023
2020 2021 2022 2023
Media spends 43.2 71.0 89.1 88.4
Sponsorships 19.7 34.1 69.7 86.7
Endorsement 6.6 7.4 8.9 10.9
Total channels 69.5 112.4 167.7 186.0
2020 2021 2022 2023
TV 37.5 59.6 65.0 54.5
Digital 5.7 11.4 24.1 33.9
Print 0.0 0.0 0.0 0.0
Total 43.2 71.0 89.1 88.4
►While the sports segment grew 11% in 2023, media
spends declined by 1% and comprised 48% of the
segment’s revenues as compared to 53% in 2022
► Sponsorship revenues grew by 24% in 2023, comprising
47% of sports segment revenues, up from 30% in 2021
► Endorsement revenues also grew at 24%, in comparison
20% in 2022
► IPL rights were split between two media houses for
fall in total revenues for the 2023 season amid a soft
advertising environment, though CWC advertising
provided a year-end boost3
► Television ad revenues from the IPL were estimated by
us to fall around 50% over the previous season
► Digital ad revenues grew 40% as all IPL matches and
many Cricket World Cup matches were available for
free on OTT platforms, as against the previous season,
where they were behind a paywall
► The 2023 IPL was estimated to have 505 million
viewers tuning in to Disney Star’s live broadcast on
million viewers4
cricket can generate across platforms
► Connected TV growth created a premium ad offering
for niche, D2C and high value brands, as well as for
large brand launches, targeting a much-desired male-
skewed young and working population audience base,
corresponding mobile ad inventory5
►At INR162 billion, cricket generated 87% of all sports
segment revenues
► Programming hours for cricket grew by 31% in 2023,
while programming hours for other sports witnessed a
decline of 25%2, primarily as there was no FIFA world
cup in 2023 and the Pro Kabaddi season started only at
the end of the year
► Consequently, revenue for other sports fell 1%
2TAM
3Industry discussions; ad volume and rate analysis
4
articleshow/100843590.cms?from=mdr
5Industry discussions
86
21
61
9
99
13
0
25
50
75
1
00
1
25
1
50
1
75
2
00
2019 2020 2021
143
25
2022
162
24
2023
Revenue split: cricket vs. emerging sports
Cricket Emerging sports
Revenues

191
Ad volumes on TV increased by
2% in 2023
Sponsorship revenues grew by 24%
Endorsements grew 24%
TAM AdEX
► Cricket played a pivotal role in driving sponsorship
growth, contributing to 79% of the overall sponsorship
revenue, while emerging sports constituted the
remaining 21%
► Enabling this growth was the busy schedule of
the Indian men’s team, which participated in 64
international games, encompassing the Cricket World
Cup, World Test Championships, and the Asia Cup
► Overall endorsements witnessed a robust 24% growth in
2023
► 536 brand endorsement deals took place across
various sports in 2023, of which 436 endorsements,
contributing to 87% of value, were attributed to cricket
► Live programming accounted for 26% of the total sports
programming hours on TV
► While overall ad volumes saw a marginal increase of 2%,
ad volumes in cricket surged by 46%, contrasting with
a 38% decline in ad volumes for non-cricket sports for
reasons mentioned earlier in this section
0%
25%
50%
75%
1
00%
24%
21%
55%
2022
hours
26%
20%
54%
2023
hours
30%
23%
47%
2022 ad
volumes
36%
21%
42%
2023 ad
volumes
Programming type and ad volumes
Live Related Repeats & Highlights
34.8 36.8
15.5 18.9
19.4
31.0
0
20
40
60
80
1
00
2022 2023
Sponsorship split
Ground sponsorship Team sponsorship
Franchisee
7.6
9.6
1.3
1.4
0
2
4
6
8
1
0
1
2
2022 2023
Endorsement split: cricket vs. emerging sports
Cricket Emerging sports
► Additionally, the introduction of the Women’s Premier
League (WPL) in 2023 brought in additional revenue for
BCCI, with sponsors like Tata Group, Dream11, Amul,
and CEAT coming on board

Media & entertainment
Sports consumption
Sports viewership grew 28% on
television in 2023
Cricket’s share of TV viewership
reached 87%
► In 2023, the overall TV viewership for sports surged by
28% year-on-year, rising from 42.9 billion AMA to 55.0
billion AMA
► Cricket viewership soared by an impressive 52% in 2023
compared to 2022, due to several IPL and CWC games
being aired for free on Television as well as a high-
intensity performance by India in the CWC
► Other sports witnessed a notable decline in viewership
of 39% as the FIFA world cup had helped increase
viewership in 2022, and the Pro Kabaddi season started
only at the end of 2023
►803 million Indians watched sports in 20236,
representing a 5% growth compared to 2022
► Major cricket events like IPL, Asia Cup, and Cricket
World Cup achieved high levels of reach and
consumption:
• • IPL reached 505 million viewers, consuming 428
billion minutes, marking the highest viewership and
consumption in all IPL editions
• • Furthermore, IPL 2023 experienced a 30% increase
in TV ratings compared to 2022, achieving a rating
of 5.37
• • The Asia Cup reached 306 million viewers,
consuming 87 billion minutes, setting new records
for viewership and consumption across all editions
• • Similarly, the ICC Men’s Cricket World Cup 2023
reached 520 million viewers, consuming 422 billion
minutes, surpassing previous CWC editions in both
viewership and consumption
►Wrestling retained its status as the second most viewed
sport in India, holding an 8% share of viewership
► The viewership share of Kabaddi and Soccer decreased
to 2% each in 2023, down from 8% and 6% respectively
in 2022 for reasons stated earlier in this section
6Source: BARC
7Source: BARC
74% 87%
8%
8%
8% 2%
6% 2%
2% 1%
0%
20%
40%
60%
80%
100%
2022 2023
TV viewership share
Cricket Wrestling Kabaddi
Soccer Other sports
Cricket Other sports
31,822
48,263
11,046
6,776
0
10,000
20,000
30,000
40,000
50,000
60,000
2022 2023
Sports viewership on television

193
Hindi language viewership increased Digital viewership gained signicant
scale
►Sports consumption on television in Hindi grew from
54% in 2022 to 58% in 2023, while viewership in
regional languages declined to 23%
►
to offer free streaming of major cricket tournaments
like IPL, the Asia Cup and the Men’s Cricket World Cup
played a pivotal role in driving sports viewership on
digital platforms in 2023
►An estimated 530 million viewers watched sports on
digital in 2023 as per industry discussions
• • In 2023, IPL attracted a record-breaking 449
million8 digital viewers, including 120 million
consumers watching through connected TVs
• • 9
during IPL 2023, setting a global record10 with a
peak concurrency of 32 million viewers for a live-
streamed event
• • During the India-Pakistan match of the Asia Cup,
Disney+ Hotstar recorded a peak of 28 million
concurrent viewers11
• • The Men’s Cricket World Cup 2023, which was
believed to have a digital reach of 295 million
as per press reports, amassed an impressive
16.9 billion video views12 on Disney+ Hotstar,
establishing itself as the most digitally watched ICC
event to date
►As per Viacom18 Sports, 84% of digital sports
viewership came from the 18 to 44 age group,
compared to 47% on linear TV
►40% of viewership came from people owning connected
TV and laptops
►70% of digital sports viewership came from non-metros
and small towns
►Over 80 million women watched sports on digital media
in 2023
►About 200 million digital sports viewers used
4K and chat while watching live sports
8Source: CNBC TV18 (https://www.cnbctv18.com/sports/ipl-2023-viewership-hit-449-million-overall-on-viacom18-says-ceo-anil-jayaraj-18569991.htm)
9-
ers-10716111.html)
10
11Source: Inc 42 (https://inc42.com/buzz/ott-wars-heat-up-with-free-sports-like-cricket-streaming-but-is-ad-revenue-enough/#:~:text=The%20streaming%20plat-
form%20registered%20a,Kings%20and%20the%20Gujarat%20Titans.)
12Source: Hindustan Times (https://www.hindustantimes.com/cricket/odi-world-cup-2023-breaks-broadcast-and-digital-records-101703674745669.html)
54% 58%
19% 19%
22% 19%
6% 4%
0%
20%
40%
60%
80%
1
00%
2022 2023
Viewership by language
Hindi English South Other languages

Media & entertainment
Future outlook
►
cricket and emerging sports, with the T20 World Cup
presenting an opportunity for India to secure an ICC
trophy win after a decade
►
table, and India’s active participation is expected to
continue
►
changer, building on the success of the Tokyo Games,
with high expectations for Indian athletes to emerge as
popular icons on the international stage
►
worldwide aligns with the mainstreaming of sporting
oriented activities, and recreational sports
►
virtual experiences and augmented reality, coupled with
Asian Games, where one-third of winners were from
rural areas, contribute to India’s evolving sporting
legacy
►
priced cricket rights will re-look at the business model
for cricket, experimenting across data subsidization,
e-commerce linkages, premium 4k and 8k bundles, CTV
packages and limiting features for free matches in order
to incentivize subscription
2024 promises a lot of sporting action
Sports rights value will rationalize
A new business model will emerge
for cricket
Non-cricket sports will rethink
strategy
Audiences will segment
►
monetized through ad sales, sponsorships, live event
►
baseball, etc., will go premium and build a model around
subscription and merchandizing
►
with differentiated content and features across CTV,
linear TV, mobile and free TV
►
a wider range of advertisers to invest in the sports
genre
►Given the merger of two of three large sports
broadcasters, we expect the rights market to rationalize
from currently unsustainable highs
►Interest in non-cricket sports will consequently remain

195
#Reinventing sports
►
and contextual IPs centered around sports rivalries,
►
cultivating sports heroes and creating corresponding
content are essential steps to attract a broader
audience
Vinit Karnik
Business Head, GroupM ESP
Create heroes and build IPs
Build a culture of weekend sports
events
Build distribution efciency
Integrate esports
Enable TVOD at scale
Use short video to target younger
audiences
Go short, go faster!
►
esports as an extension of their tournaments. Sports
leagues such as IPL, ISL, and PKL should incorporate
esports provisions and take esports viewership
mainstream and engage viewers throughout the year
►
few years. With free streaming provisions and more
widespread adoption of 4G and 5G spectrums, the trend
is expected to persist. However, the sports digital rights
owners are likely to experiment with their monetization
strategies, leveraging innovative pricing models like
sachet pricing for niche sports content, premium 8k
feeds, and exclusive fan offerings
►
content formats, leveraging short-form video platforms
to disseminate content will become crucial for attracting
youth viewers
►
discretionary time, build shorter events like T10
tournaments, one-day cricket matches with two innings
of 25 overs each, shorter halves and quarters, and rules
that incentivize quick action like powerplays
►
and families to consider in their entertainment options,
combined with food and beverage and entertainment
►
consumption grows, hybrid models for distributing
live events are anticipated to emerge. These models
would include direct-to-mobile technology, enabling
content delivery without the need for an active internet
connection

Expert
speak
2023 saw sports broadcasts touching record viewership
levels across linear and digital platforms. Despite
audience fragmentation and attention attrition, sports
continues to demonstrate strong capacity for aggregation
and immersive engagement. Fuelled by growing fandom,
increasing private investment and government support,
the industry is poised for unprecedented growth.
Sanjog Gupta
Disney Star
AVOD model for live sports serves the best interest of all
key stakeholders – consumers, advertisers, rights owners
and media platforms, and in the process helps maximize
reach and monetization.
Anil Jayaraj
Viacom18 Sports
Sports continues to be the reach driver for both TV & OTT
platforms with pan india reach higher than any other
genre. The growing popularity of non-cricket sports
has ensured that. Live sports is still largely consumed
on bigger screens with more than 700 million viewers
watching sports on TV in 2023.
Rajesh Kaul
Culver Max Entertainment
India’s sporting future will thrive on optimizing existing
infrastructure, prioritizing maintenance, and entrusting
new builds to governments. By embracing CSR,
transparency and community engagement - perhaps
through retail investing in sport - India will produce
champions in sports beyond cricket.
Jalaj Dani
Vijayi Bharat Foundation


Media & entertainment
Indian content landscape
Compiled by EY’s content services practice
Catch the headlines with
AI anchor Sana

199
In the era of content fungibility, regional
is national
theaters or on OTT platforms. Excludes unorganized creator economy, news
bulletins, social and short-form content
theaters or on OTT platforms. Excludes unorganized creator economy, social
and short-form content
ComScore (excludes dubbed versions)
This section is based on estimates from EY’s content services practice. While all content data is not readily available,
trends can be viewed directionally.
India produced almost 200,000
hours of original content in 2023
117 more lms were released in
2023 as compared to 2022
Original content production fell
2.3% in 2023
416 lms released on OTT
platforms in 2023, but direct to
digital releases halved
TV (excl. news bulletins)
1,89,685
OTT
2,986
Film
3,888
Hours of content released in 2023
96%
2%
2%
Number of films released in India
647
2021
1,438
2022
1,555
2023
Medium wise percentage change in
released hours in 2023 compare to 2022
Film
Total content
OTT
TV (inclusive
news bulletins)
8.1%
-2.3%
1.0%
-2.3%
Number of films released on OTT
217
359
105
57
Released in theaters first
and subsequently on OTT
Released directly on OTT
2022 2023

Media & entertainment
GEC contributed 68% of total hours
on TV (excl. news bulletins) in 2023
Regional OTT content volumes
exceeded Hindi language content in
2023
OTT content volume growth
slowed in 2023 due to protability
pressures, and could fall in 2024
Drama, crime, action and thriller
continued to be the predominant
genres on OTT
TV and includes dubbed content
GEC
News
(excluding bulletins)
Sports
Others
(including kids
and infotainment)
TV content volume by genre
68%
17%
5%
10%
OTT content production estimates
2,033
14.0
2019
1,187
10.2
2020
2,512
23.1
2021
2,956
25.5
2022
2,986
29.7
2023
2,850
31.1
2024E
Hours released Cost in INR billion
Titles produced by language
30%
70%
2020
47%
53%
2021
50%
50%
2022
52%
48%
2023
55%
45%
2026E
Hindi Other languages
Genre wise content releases on OTT
Drama/ crime/
thriller/ action
Comedy
Romance
Reality
Mythology/
documentary
Others
Horror
61%
72%
14%
11%
12%
7%
2%
7%
7%
3%
1%
2%
0%
0%
20232022

201
Content production trends - 2023
This section is based on a survey of 33 independent production houses conducted by EY and The Producers
Guild of India. All data in this section refers to % of respondents.
Demand for theatrical lms,
documentaries and OTT ction
increased in 2023
Content creation costs increased by over 10% compared to 2022
Theatrical lms drove monetization
in 2023
Satellite rights remained soft
Q. Where did content demand increase in 2023?
Theatrical films
Documentary
OTT fiction
OTT non-fiction
OTT films
TV fiction
TV non-fiction
Yes, demand for content increased in 2023
0% 20% 40% 60% 80% 100%
No change in demand from 2022
Demand for content reduced in 2023
Music 16%48%36%
Q. How has content monetization changed in 2023
as compared to 2022?
Theatrical 50%27%23%
Reduced No change Increased
Digital 33%13%54%
International 25%52%23%
Satellite 10%14%76%
Q. What has been the production cost inflation in 2023 in comparison to 2022?
Theatrical films
OTT fiction
Documentary
OTT films
TV fiction
OTT non-fiction
TV non-fiction
Reduction in cost compared to 2022
0% 20% 40% 60% 80% 100%
Up to 10% increase in cost vs. 2022
No change compared to 2022
Over 10% increase in cost vs. 2022

Media & entertainment
Content production trends - 2024
This section is based on a survey of 33 independent production houses conducted by EY and The Producers
Guild of India
94% respondents expect an impact
on content volumes and margins in
2024 as buyers focus on protability
Tentpole content will continue to
remain important
Talent, VFX and story costs are
expected to drive cost increases in
2024
Theatrical and international
rights are expected to drive the
monetization in 2024
Q. The industry is witnessing consolidation and
several buyers are focusing on profitability. What
impact do you foresee on the demand for content
in 2024 due to these reasons? (Select all that apply)
Reduction in green lighting
of new projects by key buyers 85%
Impact on production margin 67%
Need to relook at input costs 52%
Cancellation of the
existing projects 48%
Impact on production quality
(same quality at lower prices) 48%
No material change
from 2023 6%
Q. How are content creation costs expected
to change in 2024?
Key talent
(actor, director) 68%23%9%
VFX 48%39%13%
Will reduce/no change Increase up to 10%
Increase >10%
Marketing 40%23%37%
Story/ script 39%41%20%
Q. Many OTTs have started to target more mass
audiences, and consequently, they will depend more
on ad revenues than subscription. Do you believe that
this will result in the demand for content to be more
towards lower cost content than was the case in 2023?
56%
27%
17%
More lower cost content, but tentpoles will
remain important
Yes, more lower cost content will be demanded
in 2024
No, OTT content will largely continue to
remain at premium prices
Q. How do you expect content monetization to
change in 2024 as compared to 2023?
Theatrical 65%19%16%
International 48%36%16%
Will reduce No change Will increase
Music 28%49%23%
Digital 22%33%45%
Satellite 22%23%55%

203
Production houses are gradually
moving towards sustainable practices 94%
enabling rewards based on performance
80%
77%
expect the proportion of VFX cost to total production
cost will increase over the next 2 years
75%
believe that the discoverability of content on OTT
platforms has reduced in 2023
51%
believe that AI can enable better budgeting,
scheduling and script breakdowns than conventional
methods
Though important, very few producers
own IP in content they produce
But few are able to
Q. Which of the following measures have you
implemented during shoot on a sustained basis?
Ban single-use
plastics
Track food
wastage
Not implemented Planning to implement
Implemented already
Segregation of dry
and wet waste
Track modes of
travel by the crew
Track of electricity
during break time
Use of solar
DG sets
0% 50% 100%
Q. Do you own the IP for the content you produce
I do projects where I own 100% IP which I license out
I do projects where I own part IP
I do projects where I do not own any IP (work for hire)
0% 20% 40% 60% 80% 100%
Film
30% 15%
OTT
7% 79%
TV 85%15%

Media & entertainment
Viewership and engagement Content development
Prime Video Channels Movie rentals on Prime Video
Global consumption; local stories
miniTV - Amazon’s free AVOD service saw sharp growth
Indians consumed
international content
All data has been provided by Prime Video and miniTV. It has not been validated by EY, and presented in summary form for representation purposes only
of India’s pin codes generate
viewership for Prime Video
of Indian PV customers watch international
shows and movies (in English or local languages)
India has the highest percentage of
Prime members who watch Prime
Video each month across all locales
of the total viewing time of international shows
and movies is now in Indian languages
Prime Video India
Trends
y-o-y growth of overall
watch time for the
service in 2023
4x
miniTV viewers buy 2.5
times more units compared
to other online shoppers on
Amazon.in
2.5x
hours of exclusive
content to be added
across genres in 2024
900+
of miniTV viewers shop
online at least once a month,
and 40% of them are top 20
percentile spenders
87%
99%
75%+
#1
25%+
new channels
launched in 2023
titles are offered in
the movie catalogue
of customers on
Prime Video stream
content in four or
more
languages
of the audience for
Indian titles comes from
outside India
rentals take place
across 95% of India’s
pin codes
Indian content
trends in the Top
10 on Prime Video
worldwide for 43
out of 52
weeks
Made in Heaven
S2 entered the Top
10 lists in over 20
countries
titles premiered in
India for Prime Video
customers
in 2023
original series and
movies are in various
stages of production
and development
hours of additional
content selection are offered
through 20+
channel partners
of titles get rented at
least once every month
of viewership of
local language
content comes from
outside the home
states
Farzi was
released in
37 languages and
streamed in over
170 countries
awards won in
2023 for its original
series and movies.
Panchayat S2 won the
Best Web Series
Award @ IFFI
of the top 10
highest-rated Indian
streaming shows on IMDb
(since streaming began
in India) are on
Prime Video
96,000
60%
25%
95%
1,000+ ~100
28,000 75%
50%
124 6

205
* For the period January to June 2023
in India since 2018
non-English titles (up from 47
in 2022)
India was the 10th largest
View Hours
Indian titles featured in the Global
series for 49 out of 52 weeks
launched in 2023
featured in the Global Top 10 for
non-English TV
5 of the top 10 most viewed Indian
In which The Railway Men, Chor
Nikal Ke Bhaga and Mrs Chatterjee
vs Norway were in the Global Top 10
featured in the Global Top 10 for
YOY growth in viewing of South
Indian language content
and series in 2023
recorded in 2023 (in INR)
Netix India
Trends
140
62
#10
49 of 52
26
60%
5 & 5 50%+
35+
countries
100%
111
25%+
Extraction 2,
Heart of Stone,
Wednesday: Season 1,
One Piece: Season 1:
International titles
that featured for the
maximum number of
weeks on Netix
India Top 10
Korean: Most watched non-
Indian languages
after English

Expert
speak
There is a massive need to share the stories of our great
nation. Every Indian child must know India’s stories,
which have shaped generations. Let’s tell our very local
Indian stories in a global way and create our own Bharat
verse.
Siddharth Kumar Tewary
Swastik Productions
Amidst a challenging landscape ridden with pricing
pressures and consolidation, we can expect continued
original content production for streaming platforms,
dominance of sports, increased adoption of AR
experiences, and continued focus on UGC and interactive
storytelling formats. Television and cinema will adapt to
these changing dynamics to stay relevant.
Madhu Bhojwani
Emmay Productions
2024 promises further consolidation and bottom-line focus
in the M&E space, which might have the short-term impact
of lower content spends at lower output volumes but will
ultimately facilitate a sustainable business model and
inspire innovative and differentiated content creation.
Siddharth Roy Kapur
Roy Kapur Films
With rapid tech-evolution and shifting consumer
behaviours, we stand on the cusp of a transformative
era. Storytelling will become even more immersive with
streaming reality, hyper-local collaborations, regional
content, and global access. Going back to basics and
creating unique characters and mainstream storylines
would usher in much larger audiences.
Deepak Dhar
Banijay Asia & Endemol Shine
India
Content in India is of two types - one, the high-impact
content like movies - the bigger, the larger, the better. The
second is high-volume content, where the volume itself
delivers viewership at a low cost. And India being a country
where a few people are rich and many are not, the content
strategy must straddle both these content types.
Ektaa R Kapoor
Balaji Telelms Ltd.

Production houses are going to see a challenging year
ahead, with industry consolidation leading to a slowdown
in decision making and rapidly changing audience
consumption patterns. Content creators face minimal
margins for error, both creatively and commercially.
Abhimanyu Singh
Contiloe Pictures
In the dynamic entertainment landscape, the key is to not
just anticipate the trends, but to shape them. The focus
should be on creating stories with purpose and content
that bridges cultures, yet stays relevant. Content creators
should be at the forefront of innovative, diverse, and
impactful stories that resonate with audiences.
Sameer Gogate
BBC Studios - India Productions
2024 will witness a sea change - the consolidation phase
will finish and the race for complete domination will
commence in every segment, from platforms to studios
to content production houses. Players who develop not
just a content edge but a tech edge with AR, VR, AI will be
ones that will emerge winners.
Mautik Tolia
Bodhi Tree Multimedia
Consolidation would be the key-word for the coming
year with mergers creating larger entities. Box Office will
consolidate after gains of 2023. Regulated AI infusion will
lead to an irreversible, positive change overall.
Shariq Patel
ZEE Studios
The viewer is spoilt for choice as content is increasingly,
no longer bound by form, language, geography, or
screens/ mediums. Innovation in storytelling and business
models including multiple revenue streams will define the
M&E growth story.
Aradhna Bhola
Fremantle India Television
Productions Pvt. Ltd

Media & entertainment
Advertising in India

209
forward. Several factors, including the growth of 5G, rising per capita income of Indians and the growing SME
advertiser base, are driving digital ad spends. That said, traditional print, radio and cinema advertising trends also
indicate healthy growth in the coming times.
Indian advertising reached INR1.1 trillion
The growth was skewed towards digital media
Segment 2019 2020 2021 2022 2023 2024E
Television 320 251 313 318 297 308
Print 206 122 151 170 178 188
Radio 31 14 16 21 23 24
Cinema 8 2 1 5 8 9
OOH 39 16 20 37 42 47
Total traditional media 604 404 500 550 547 575
Digital 279 282 383 499 576 662
Online gaming 6 7 8 11 13 14
Total new media 285 289 391 510 588 676
Total advertising 889 694 892 1,060 1,135 1,252
Absolute ad growth 2023
75
77 8552
-21
Growth Fall Total
Digital Print OOH Radio
and
cinema
Online
gaming
Television Total
growth
►Indian advertising grew 7% in 2023
►New media accounted for 52% of total advertising,
overtaking traditional media advertising (48%) for the
►We estimate advertising to grow a further 10% in 2024
► New media generated 105% of total ad growth, while
traditional media (excluding television) added another 23%
► Television advertising reduced the growth by 28% as sports
advertising on TV fell compared with 2022, and HSM
markets saw lower yield categories increase their share of
ad volumes and a ban
on certain categories like crypto, gaming amidst betting,
and D2C brands

Media & entertainment
Indian advertising will grow at 9%
till 2026
Digital to comprise 57% of total
advertising by 2026
► Advertising is expected to grow 10% in 2024 to reach
INR1.25 trillion
► Till 2026, advertising is expected to grow at a healthy
9% CAGR, with digital media growing at 14% and
traditional media growing at 5%
► Key factors which will drive growth include:
• • Increase in India’s per capita income from
US$2,500 in 2022 to around US$3,000 by 2025,
and reduction of income inequalities due to direct
subsidy transfers, employment guarantee schemes,
investment in infrastructure
• • Rural growth and growing middle class will also be
key factors
• • The growing SME advertiser base will increasingly
spend on advertising in pursuit of India’s US$5
trillion GDP ambition
► Segmental growth will be driven by:
• • Digital: Growth in 5G will drive time spent,
increased smartphone penetration, growth in
active CTV homes, rich consumer data to enable
segmentation, attribution accuracy
• • TV:
• • Print: Access to educated and richer audiences,
events revenues, elections
• • OOH: Digital OOH screen growth, transit media,
premium billboards, better measurement system
• • Radio: Mandating radio receivers in mobile phones,
non-FCT revenues, SME advertising
• • Cinema: A steady slate of theatrical releases and
consolidation in the multiplex ecosystem
EY estimates
► Digital media comprised 31% of total ad spends in
2019, which increased to 52% in 2023
► Digital advertising is expected to reach 57% by 2026
► Digital ad numbers we have considered include the SME
and long-tail digital advertising spends of INR208 billion
in 2023, who spend on search, social and e-commerce
platforms; their contribution to total advertising is
expected to reach INR304 billion by 2026
Indian advertising
1,135
2023
1,252
2024E
1,486
2026E
Traditional vs. digital advertising mix
52% 54% 57%
48% 46% 43%
0%
50%
100%
2023 2024E 2026E
Digital + online gaming Traditional

211
EY Marketer survey 2024
their responses
FMCG
BFSI
Media & entertainment
Technology
Consumer durables/ electronics
Retail
Automobiles, truck and buses, EVs
Healthcare and pharma
E-commerce
Telecom
Others
17%
22%
14%
12%
10%
7%
5%
4%
4%
3%
2%
Market sentiment
Respondent prole
EY Marketer Survey 2024 I % of total respondents EY Marketer Survey 2023 & 2024 I % of total respondents
II. 79% of marketers expected to increase
their ad spends in the next two years
I. Two in three marketers were positive about
consumer spending
69%
20%
11%
0%
65%
24%
9%
1%
I feel positive
about the
e
conomy, spending
will grow
It will stay
the same
Consumption
will decline
Not sure/
prefer not
to say
Marketers' outlook on consumer spending
2022 2023 2022 2023
54% 55%
Increase
by over
10%
21%
24%
Increase
by under
10%
21% 18%
No
significant
change
3% 1%
Reduce
by under
10%
2% 1%
Reduce
by over
10%
How do you expect your total ad spends
to grow over the next two years?

Media & entertainment
Media mix
Consumer data and martech
I. Dynamic creatives, hyperlocal content and
digital ad fraud were the biggest capability
gaps for marketers
I. 97% of marketers expected to increase
their spends on digital; 41% on traditional
0% 20% 40% 60% 80% 100%
Will increase by over 10%
W
ill increase by under 10%
No significant change
Reduce by under 10%
Reduce by over 10%
How do you see your ad spends
changing over the next two years?
Traditional media spends Digital media spends
EY Marketer Survey 2024 I % of total respondents
EY Marketer Survey 2023 & 2024 I % of total respondents
EY Marketer Survey 2021 to 2024 I % of total respondents
EY Marketer Survey 2024 I % of total respondents who chose below
average or needs improvement
0% 5% 10% 15% 20% 25% 30% 35%
Incremental reach
across media
Influencer marketing
The connected consumer
Content production
at scale
Martech implementation
Digital ad fraud
Hyperlocal content
Dynamic creative
optimization
How equipped are your agencies to manage
new ecosystem challenges?
95%
Respondents had taken some precautions regarding the
placement of ads in unsafe environments/ platforms
41%
44%
30%+
26%
29%
20%-30%
16%
13%
10%-20%
15%
14%
Up to 10%
3%
0%
Nil
Of your total ad spend, what is likely to be your share
of digital advertising in 2023?
2022 2023
II. Digital marketing continued to be an area
of substantial investment for marketers
III. Marketers continued to remain bullish on
events spends
47% 52% 57% 63%
20% 18% 16% 9%
2020 2021 2022 2023
How do you see your events and activations
spends changing over the next two years?
Will increase Will stay the same Will reduce

213
EY Marketer Survey 2024
EY Marketer Survey 2024
State of consumer data % of
respondents
The available consumer data is incomplete
with gaps, which makes data-driven
38%
The available consumer data is complete
and deep, but my organization is not
always able to leverage the data for
sophisticated data-driven decisions
36%
The available consumer data is complete
and deep, and my organization is always
able to leverage the data for sophisticated
data-driven decisions
17%
State of martech in the company % of
respondents
Organization has clear gaps in basic
marketing technology capabilities
30%
Organization has either developed or
is currently sourcing basic martech
capabilities, but there is scope for
improvement
32%
Organization has developed or sourced
adequate martech capabilities
28%
Organization has developed or sourced
industry leading (ahead of peers) martech
capabilities
9%
II. More than two-thirds of survey
respondents continued to struggle with
consumer data
III. 62% of respondents believed there was a
need to improve their company’s martech
capabilities
CMO priorities for 2024
I. Respondents prioritized building 1P data
and media mix remodeling for 2024
CMO priorities for 2024
5% 15% 20% 25%10%
Supply chain bufferring
Purpose-led
communication
Effective content
Direct to consumer
Media mix re-modeling
Building Zero & 1P data
24%
24%
22%
16%
11%
4%
EY Marketer Survey 2024 I % of total respondents who chose priority 1 or 2
for the above areas
for the above options
1%
3%
4%
7%
9%
10%
14%
25%
27%
In-housing
media buying
Managing data
and privacy
Brand safety
Building a relevant
martech stack
Cookie-less marketing
Integrating AI/
Gen AI initiatives
Ad fraud
CPRP increase/
ad inflation
ROI measurement
Marketers biggest challenges in 2024
II. ROI measurement and ad ination are the
top challenges for 2024

Media & entertainment
EY martech maturity model for 2024
Based on our research and understanding of clients, we have categorized all marketing functions based on the data availability,
tech capabilities, governance protocols and skills available. Evaluate yourself and identify the next phase for your function’s
growth using the martech cartwheel below.
Data leaders Data committed Data enthusiasts Data beginners
Denitions:
Data beginners: Not yet started/ just about starting the
journey of using consumer data for marketing and large
gaps exist in data availability and ROI measurement, as they
processes around governance and access. No 1P data exists
Data enthusiasts: High use of data for marketing activities,
but with gaps in governance and ownership, and lack
of access to resources, as they are yet to invest in data
capabilities and skills to improve governance and processes.
Ownership exists of some 1P data of its customers
Full UX
personalization
Recency, frequency,
monetary cohorts
(RFM)
Full brand metrics
optimization
Brand preference
Trigger-based
targeting
Audience
cohorts
Integrated reach
Ad personalization
Conversion lift studies
(Consideration & intent)
UX personalization
Custom audience
Brand lift
studies
(awareness)
Basic ad
metrics
Awareness
Sentiment analysis
Customer acquisition
Understand consumers
Category & portfolio strategy
Brand management

215
Data leadersData committedData enthusiastsData beginners
Data committed: Started the journey of using
consumer data for marketing, but gaps exist
including in ROI measurement, but have invested
processes around governance and access. Owns
large 1P data of its customers
Data leaders:
measurement, access to required capabilities and
and access. Owns 1P data of almost all customers,
across multiple touchpoints
Customer
lifetime value
Full funnel
optimization
O2O2O
targeting
AI/ML
Comprehensive ROAS
Single view of customer
Multi-touch attributionPredictive modeling
Enhanced ROAS
SMS
e-mail marketing
Retargeting
Conversion rate optimization
Limited
• View of UX friction
• Customer insights
• Attribution studies
Marketing plan
optimization
Limited ROAS view
Engagement KPIs
Basic web/app analytics
Marketing plan
implementation
Online
reputation
management
SEO Listening insights
Ad fraud
CRM
Customer relationship
Marketing planning
Analytics

Media & entertainment
Generative AI capabilities reshaping the
marketing landscape
Powered by WPP
►Marketers understand that Generative AI will play a
future, with 66% of respondents of EY’s Marketer
►In the ever-evolving landscape of marketing, we explore
new dimension to creativity and personalization.
I. Content generation: elevating creativity
►Generative AI is transforming the creative process
by generating diverse content formats, including text
copy, images, and videos. This capability extends
beyond conventional marketing mediums, impacting
everything from ads and blogs to social creatives and
1:1 communication. Integrating Generative AI with
CRM/ CDP systems allows marketers to tailor content
to individual preferences, moving away from generic
pieces to personalized narratives. This shift not only
enhances consumer engagement but also presents an
opportunity for marketers to streamline the content
costs.
II. Content variation at scale
►One of the key Generative AI capabilities that marketers
need to embrace is content variation at scale. This
means rapidly generating diverse content using text
or visual prompts while ensuring brand safety. It also
involves providing enhanced control, restrictions,
and editing options to align with the envisioned story.
Additionally, marketers need to adapt content for
different social media platforms, taking into account
factors like aspect ratio and stylization. Harnessing such
tools, marketers are able to create numerous content
iterations, allowing for dynamic personalized campaigns
at scale. Marketers should prioritize integrating these
potential to enhance creativity and responsiveness in a
fast-paced digital landscape.
III. Insight extraction: tailoring personalized
experiences at scale
►Personalization has long been a buzzword in marketing,
but Generative AI takes it to a whole new level.
Marketers can craft highly personalized and enterprise
compliant creatives that resonate with each individual
consumer, while also tailoring content to their brand
guidelines or styles. By leveraging data from CRM/ CDP,
Generative AI understands the nuances of what appeals
to a particular individual, making marketing messages
more relevant and impactful. As this capability becomes
data strategies to ensure the seamless integration
of personalization into their campaigns, while
incorporating consent practices into their data strategy.
EY Marketer Survey 2024 I % of total respondents
EY Marketer Survey 2024 I % of total respondents
If there is one thing which has ruled conversations in recent months among marketers across the globe, it is AI. From
content generation and customization, to data analytics and creating new customer experiences, Generative AI has a
wide range of implications for the marketing landscape and will play an important role in the future.
Several use cases are being
developed by marketers
Generative AI is expected to play a
signicant role in 2024
How do you view the implications
of Generative AI on marketing?
11%
Unsure Limited
24%
High
60%
Existential
6%
What facts of marketing would Gen AI impact?
33%
24% 23%
18%
2%
Content
personalisation
Customer
experience
Driving
innovation
Media plan
optimisation
Not sure of the
use case/ others

217
Generative AI is a paradigm shift
►
advancement; it is a paradigm shift that demands a
proactive approach from marketers. Embracing these
of marketing. While Generative AI is not able to make
business decisions (yet), the onus is on companies to
upskill and train their employees to apply these tools
effectively. AI must be a tool, not a human replacement.
►The convergence of AI with immersive technologies
marks a pivotal moment in the industry’s evolution,
opening doors to a future where creativity knows
no bounds and consumer experiences are more
personalized than ever.
►Marketers who successfully navigate this transformative
journey await a future in which marketing is not just
about messaging, but about creating personalized,
immersive, and authentic experiences.
Niraj Ruparel
Emerging Tech Lead- WPP & Groupm, India
How do you envision executing your marketing
strategy in the context of Generative AI?
36%
Partner with external
technology providers
28%
Explore strategic
alliances
28%
Develop in-house
capabilities
7%
Acquisitions
EY Marketer Survey 2024 I % of total respondents
IV. Environments for virtual production: shaping
event-based and immersive, interactive 3D
experiences
►The fusion of Generative AI with immersive technologies is
reshaping the future of marketing. Environments for virtual
production allow marketers to create event-based and
immersive, interactive 3D brand experiences, blurring the
lines between the virtual and physical worlds. From virtual
showrooms to interactive campaigns, this capability offers
unprecedented opportunities for consumer engagement.
Marketers should explore how virtual production can
amplify their brand narratives, creating memorable
experiences that go beyond traditional advertising.
V. Large action models: multi-modal libraries
►In the realm of Generative AI, large action models (LAM)
take center stage. These models, leveraging multi-modal
libraries, provide marketers with the ability to process
diverse forms of data beyond text. Training these models
with a rich dataset becomes crucial, ensuring they
can understand and generate content across various
formats. For example, a brand could harness LAM to
allow consumers to upload images/ UGC that are then
transformed into branded artwork, or to help it implement
dynamic OOH billboards that change imagery based on the
surrounding environment.
►Marketers should prioritize the development and
integration of large action models to harness the full
potential of Generative AI in their campaigns, while striking
a balance in leveraging this technology responsibly. They
must be aware of the potential biases and misinformation
in datasets and understand the impact of training large
computational models on the environment.

Media & entertainment
Digital ad fraud and wastage
Compiled by mFilterIt
Ad fraud remained high
New threats emerged
1https://adalytics.io/blog/search-partners-transparency & https://adalytics.io/blog/invalid-google-video-partner-trueview-ads
2https://www.ana.net/miccontent/show/id/rr-2023-12-ana-programmatic-media-supply-chain-transparency-study
3mFilterIt’s analysis of over 50 Campaigns from mobile-based publishers
Average invalid trafc percentage across platforms
Platforms Europe US India MENA
Walled gardens
Search platforms 9% 10% 9% 11%
Partner networks 18% 20% 20% 22%
Social media direct 10% 8% 10% 9%
Video platforms 15% 17% 16% 17%
Open networks
33% 33% 41% 33%
Programmatic
platforms 27% 28% 27% 32%
►In 2023, Adalytics1 reported issues on different
placements across various networks, including walled
gardens
► Partner-led inventory had higher brand safety issues and
► Programmatic platforms ended up having the highest
procurement and bidding
► An ANA2 report indicated a 35% plus wastage on
programmatic ads, which was validated by our data set
as well
I. Frequency cap violations
►Frequency capping is important in CPM campaigns to
control the number of times an ad is shown to a user.
However, there have been instances where ads are
shown to a single user repeatedly, which goes against
the goal of building brand awareness. Instead of leaving
a positive impression, users may become saturated and
annoyed by seeing the same ad frequently
►10% to 30%3 of frequency cap violations have been
news apps, calling apps)
►Our analysis of a campaign on an Indian OTT player
showed that 46% of the impressions were violating
frequency cap limits, i.e., close to half of the consumers
saw the campaign much more than the desired
frequency
►In our experience, we have noted that the longer a
campaign runs, the more such violations occur. As per
increase from 38% to 54% during the latter part of a
campaign
The digital advertising ecosystem underwent major shifts
in 2023. Privacy and security remained top concerns for
marketers and losses from ad frauds continue to keep them
up at night. Brand safety is another core issue risking brand
and reputational damage. Marketers need to look beyond
traditional measures to overcome these core challenges and
create positive brand experiences for consumers.
►According to the report, most of these impressions
came from Made for Advertising (MFA) websites which
►
projected to increase to US$172 billion by 2028

219
4New Brand Safety Crisis – Gum Gum report
II. Brand safety issues
►With the rapidly evolving digital ecosystem, there has
been a rise in the non-transparency of ad placements.
When an ad is placed alongside unsafe content, the
brand could face reputational damage and loss of
consumer trust
►About 7 out of 10 brands and agencies said they or
their clients had been exposed to brand safety risks at
least once, with 10% of respondents reporting “regular”
exposure4. An example of this was seen in the recent
Ukraine-Russia crisis, where ads of major American
companies were seen on Russian ad inventory
►Our experience in India indicates that more than 70% of
clients faced some level of brand safety issues
►More brands are now opting for localized and regional
handling of brand safety instead of a global approach.
Additionally, brands are focusing on placement-level
analysis instead of platform-level analysis, which may
not be as accurate
► Advertisers must move beyond traditional brand safety
checks that are limited to pure metatags-based keyword
searches at a pre-bid level. Similarly, on most platforms,
traditional brand safety checks are sometimes on the
overall platform level, and not at the content level

Expert
speak
The Indian AdEx story continues to be strong at the macro
level, though in 2024 we may face some headwinds in the
first half on account of global uncertainties.
Sam Balsara
Madison World
The Indian market will continue to remain robust despite
global economic headwinds. That being said, the fast
transforming media and marketing landscape will need
both novel and expert navigation to succeed, through
innovation and technology.
Anupriya Acharya
Publicis Groupe South Asia
Our talent base coupled with strong adoption of all the
latest technologies including AI, makes it a very exciting
future for the Indian M&E industry on the global stage.
CVL Srinivas
WPP
Growth will be the dominant theme for the industry.
Competitiveness will accelerate. Driving and ensuring
smart profitability will be the mantra. The Indian
consumer wins!
Sunil Lulla
The Linus Adventures
Personalization & momentization are creating
contextualization to content and communications across
new media platforms. It is drawing audience attention
and advertisers are leveraging these opportunities for
instant transactions to maximize ROI.
LV Krishnan
TAM Media Research

As India leads global discourse with its economic surge
and demographic dividend, the future hinges on impactful
human-centric progress. AI’s role in simplifying lives
and igniting creativity heralds a new era. Sustainable
growth demands innovative communication, simplifying
experiences, and fostering meaningful connections.
Rana Barua
Havas Group India
Shashi Sinha
Mediabrands India
We expect the M&E business to grow due to the coming
elections and some recovery in rural markets. Further,
with consolidation amongst players, there will be a push
to increase value.
AI will be the driving force in advertising, reshaping
every facet from the personalization of ad creative to
precise targeting and seamless ad delivery. Further,
phone lock screens will become screen zero for AI-
powered serendipitous discoveries.
Abhay Singhal
InMobi Group
AI transcends mere buzzwords and trends; it’s
a formidable force reshaping our daily lives,
communication, creativity, and connectivity.
Empowering us to delve into uncharted realms of
storytelling and immersive experiences, AI is the
unequivocal future, with our industry leading the charge.
Harsha Razdan
DENTSU

Media & entertainment
Enabling
environment

223

Media & entertainment
Indian economy

225
Indian economy and its impact on M&E
►
to continue showing a strong real GDP growth at 7.3%1
in FY24, as compared to 7.2% in FY23. This robust
performance has been delivered largely by investment
growth led by the GoI’s emphasis on capital expenditure
►
Outlook Update, has forecasted India’s growth at 6.7%
in FY24, stabilizing at 6.5% over the next two years,
to remain the fastest growing major economy in the
medium term
►India’s 2024 (FY25) growth is projected to be 2.1 times
global growth and 1.6 times EMDE growth in this year. It is
also projected to outpace China’s growth by 1.9% points
Traditionally, the growth rate in the media and entertainment sectors has outperformed that of India’s GDP growth rate. What
makes this interesting is that consumer spending in this sector is discretionary. With the per capita outlook for the Indian
economy looking to increase several notches in the coming years, the consequent overall consumer spend outlook in the sector
remains positive. In addition, favorable FDI policy in telecom and digital channels would impact investments trends positively
across all segments.
India is expected to remain a global growth leader amid the global slowdown
1
2
3 IMF Article IV Consultation for India (December 2023)
►The FY25 Union Budget has shown a strong
its emphasis on growth supporting capital expenditures.
These measures would enable laying down a strong
foundation for robust medium-term growth
►India is expected to have contributed more than 15% to
global growth in 2023 (FY24)2. The IMF expects India’s
growth momentum to be sustained in the medium-term
owing to its foundational digital public infrastructure
and a strong government infrastructure program3
-8
-6
-4
-2
0
2
4
6
8
10
6.8 6.5 6.5 6.5
3.9
-5.8
9.1
7.2 6.7
2017 2018 2019 2020 2021 2022 2023 2024 2025
India
GDP growth: comparison
United States Euro Area EMDEs China World

Media & entertainment
4
5 Assuming an average exchange rate of INR83.0/US$
6 Goldman Sachs Global Investment Research
►India’s per capita nominal GDP is projected to increase
by 7.9% in FY24 to INR2,12,6004 (US$2,561.55) from
INR1,96,983 (US$2,373) in FY23
►Growth envisaged in India’s per capita income is
expected to support consumption growth, including
that in the media and entertainment sector
►Compared to India’s average per capita income above,
the top 4% of the working-age population in India
has a per capita income greater than ~US$10,000
(INR830,000) per annum. This top-income consumer
cohort comprises nearly 44 million of the working-age
population in 2023, and this is expected to grow to
around 100 million by 20276
►According to IMF’s World Economic Outlook (October
economy in nominal US$ market exchange rate terms in
2021 (FY22). It is projected to become the world’s third
largest economy by 2027 (FY28), crossing Germany
►In 2024 (FY25), India’s nominal GDP at market
exchange rate is estimated at US$4.1 trillion,
accounting for 3.7% of global GDP
►In purchasing power parity (PPP) terms, India
is estimated to be the third largest economy at
PPP$14,261 billion in 2024 (FY25)
Source (basic data): National Accounts, MoSPI, GoI
Source: Euromonitor, Goldman Sachs Investment Research
Source (basic data): IMF World Economic Outlook October 2023
Per capita nominal GDP is projected
to grow by 7.9% in FY24
India is expected to become the third
largest economy in 2027 (FY28)
FY19FY18
9.8 9.5
5.3
-2.4
17.2
14.9
7.9
FY20 FY21 FY22 FY23 FY24
-5
0
5
10
15
20
Per capita nominal GDP growth
Population (million) with income > US$10,000
20
0
20
40
60
80
100
2011
24
2015
37
2019
60
2023
100
2027E
Country
GDP 2024
Nominal
(US$ billion) Rank PPP ($
billion) Rank
United States 27,967 1 27,967 2
China 18,560 2 35,043 1
Germany 4,701 3 5,715 5
4,286 4 6,711 4
India 4,105 5 14,261 3
United
Kingdom 3,588 6 3,985 10
France 3,183 7 4,010 9

227
►M&E as a sector normally grows and outperforms India’s
nominal GDP, but being by nature, a discretionary
spend, the M&E sector shrinks at times of uncertainty
► When nominal GDP growth slowed to 9% in FY2024 on
the back of war, tech layoffs and global recession fears,
M&E correspondingly grew much slower at 8% in 2023,
while advertising fared even worse, and grew just 7%
against an estimated 10% to 11%
Note: While advertising and M&E sector revenues are estimated for a
M&E sector’s performance was
lower than India’s GDP in 2023
-30%
-20%
-10%
0%
10%
20%
30%
2020 2021 2022 2023
GDP vs. ad growth %
M&E revenues and nominal GDP growth
Nominal GDP Advertising revenues M&E secto
r

Media & entertainment
Current FDI limits
►FDI limits for the telecom sector were eased in 20137
while those for the media and entertainment sector
were eased mainly in 2016
►
networks, mobile TV, head-in-the sky broadcasting
service, and cable networks were completely lifted,
allowing 100% FDI through the automatic route
FDI: policy initiatives and recent trends
►There were no express provisions in relation to digital
media in the FDI policy until 2019. However, in December
2019, FDI up to 26% has been permitted under the
government approval route for uploading/ streaming of
news and current affairs, through digital media
►In 2021, FDI automatic route limits for
telecommunications were increased from 49% to 100%
7 https://www.livemint.com/Politics/hxnnl3jx9kaCHnKgsk9oQK/Govt-relaxes-foreign-investment-rules-to-revive-growth.html
Services FDI limit Approval condition
Telecommunications
All telecom services including Telecom Infrastructure
Providers Category-I (basic, cellular, United Access
distance, Commercial V-Sat, Public Mobile Radio Trunking
Services (PMRTS), Global Mobile Personal Communication
Services (GMPCS), all types of ISP licenses, Voice
Mail/ Audiotex/ UMS, Resale of IPLC, Mobile Number
Portability services, Infrastructure providers Category -I
Other Service Providers and such other services as may
be permitted by the Department of Telecommunications
(DoT)
100%
►
►
from time to time, shall be observed by licensee/
entities providing the mentioned services as well
as investors.
Telecom equipment manufacturers 100% ►Automatic route
1. Broadcasting carriage services:
Teleports, DTH, cable networks (Multi System Operators
(MSO) operating at National or State or District level
and undertaking up-gradation of networks towards
digitalization and addressability), mobile TV and head-
end-in-the-sky broadcasting service (HITS)
100%
►
►
beyond 49% in a company not seeking license/
permission from sectoral ministry, resulting in a
change in the ownership pattern or transfer of
stake by existing investor to new foreign investor,
will require government approval
Cable networks (Other MSOs not undertaking up-
gradation of networks towards digitalization and
addressability and Local Cable Operators (LCOs)
100%
►
►
beyond 49% in a company not seeking license/
permission from sectoral Ministry, resulting in a
change in the ownership pattern or transfer of
stake by existing investor to new foreign investor,
will require government approval
2. Broadcasting content services:
Terrestrial Broadcasting FM (FM radio) subject to such
the MIB, for grant of permission for setting up of FM radio
TV channels
49% ►
Uploading/streaming of news and current affairs through
digital media 26% ►
Up-linking of non-news and current affairs’ TV channels/
downlinking of TV Channels 100% ►

229
Trends in FDI equity inows into the information and broadcasting sector since
FY15 demonstrates a considerable inter-year volatility
Publishing of newspaper and periodicals or Indian
editions of foreign magazines dealing with news and
current affairs, subject to certain conditions
26% ►
or specialty journals or periodicals, publication of facsimile
edition of foreign newspapers, subject to conditions
100% ►Government route
Source: Foreign Exchange Management (Non-debt Instruments) Rules, 2019 dated 17 October 2019 read with time to time amendments issued by the Ministry of
Finance (Department of Economic Affairs)
Source (basic data): DPIIT, Ministry of Commerce and Industry
Services FDI limit Approval condition
Print media
0.3
0.6
1.3
0.8
0.3
0.2
0.5
0.2
0.7
1.0
1.5
0.0 FY15 FY16 FY17 FY18 FY19 FY20 FY21 FY22 FY23 Apr-Sep
FY23
Apr-Sep
FY24
0.4
0.8
1.2
1.6
FDI equity inflows in information and broadcasting sector (US$ billion)
DK Shrivastava
Chief Policy Advisor, EY India

Media & entertainment
M&A activity

231
M&A activity
This section has been compiled by EY using publicly available information and hence, is not a complete representation
of all deals during 2023.
►14 deals contributed 90% of the total known funding:
Note: Excludes Reliance’s acquisition of Disney in India as the deal is not
binding as on 31 Dec 2023. Deal value excludes the value of 33 undisclosed
small deals for which data is not publicly available
Although deal activity in the industry was slow across the board in 2023, there are distinct signs for growth to pick
up in the coming months. Due to different factors across segments, we expect to see higher M&A activity in the
coming months. For example, the real money gaming segment, after a tumultuous period, is now settling down into
a new normal and it appears that the wait-and-watch approach for strategists is now over. Traditional media – led
by television – accounted for the biggest proportion of deal value and this would likely continue in the future. The
following pages outline the key highlights in M&A activity across all sections of the industry.
►2023 saw only three deals above INR5 billion as
compared to 10 such deals in 2022
►85% of the deals in 2023 were less than INR1 billion
►Deals in TV were led by Bodhi Tree Systems’ investment
into Viacom18 Media and the merger between
Network18 Media and TV18 Broadcast
Digital media and online gaming
witnessed the highest deal volumes
TV, however, accounted for 63% of
total deal value
Deal value (INR billion) Deal Count
Deal value and number of deals
68
2020 2021 2022 2023
77
672
118 126
88
501
92
Particulars Deal
count
Deal
count %
Deal value
(INR
billion)
Deal
value %
Undisclosed 33 38% -0%
Less than INR1
billion 41 47% 910%
INR1 - 5 billion 11 13% 21 22%
Above INR5
billion 3 3% 63 68%
Total 88 100% 92 100%
Deal volume by segment
Advertising/
Advertising tech
Television
Others
Digital media
Online
gaming
23%
3%
16%
31%
26%
Deal value by segment
Advertising/ Advertising tech,
2%
Television, 63%
Others, 8%
Digital media,
9%
Online
gaming,
18%
M&A activity slowed signicantly
in 2023

Media & entertainment
Deal values were, therefore, driven
by traditional media
Private equity and venture capital
deals accounted for 61% of the total
transactions
Traditional media New media
Deal count and value analysis
86% 35%
65%
14%
By count By value
M&A Private equity
Deal count and value analysis
61% 41%
59%
By count By value
39%

233
Online gaming – no blocks!
►
government mid last year, RMG platforms are settling
We expect multiple innovations and incentives in the
short term that will reduce the GST impact in the hands
of consumers, and this will be followed by an aggressive
wave of consolidation
►
approach towards RMG and fantasy sports could also
make their move in the next 12 to 18 months
►
studios and esports players who are able to tap into and
monetize this massive user base will also continue to
attract PE/ VC funding
►
becoming a hub for game innovation and development.
We can expect investments in game development and
gaming service capabilities (including the set-up of
captives) to serve global gaming companies
consolidAItion
► We expect AI to positively disrupt how M&E businesses
►We can expect deals across spaces like ad tech,
martech, dubbing, translation and titling, audio
regeneration, video creation, video editing, etc.,
providing a lucrative investment opportunity for both
become a global center for such services
#Reinvent deals
TV – interactive future
►
M&A action, to protect and grow market share, in the
aftermath of the Zee-Sony merger being called off and
the impending merger between Disney with Viacom18
►
consolidation wave, especially in the regional and digital
segments, and to manage the rising cost of sports
rights
►
for capital, as cable companies strive to offer wired
and wireless broadband to their consumers, with India
expected to grow wired broadband from around 38
million homes today to 100 million by 20301
The race for IP
►
longevity, content IP is becoming increasingly valuable.
or digital - present lucrative investment opportunities
and are poised to attract interest of both domestic and
global strategic players
OOH goes digital!
►Around 150,000 digital OOH screens2 have been
invested in, but the demand for such premium
infrastructures continues to grow as airports, metros
and smart cities continue to proliferate. The investment
required to keep growing screens – mainly large format
– can result in private equity deals and consolidation
among players from different geographies
1 EY estimates
2 Based on discussions with Moving Walls and Lemma Technologies

Media & entertainment
Tax environment

235
Direct tax
Key amendments in the Finance Act
2024
Other domestic tax updates
announced, we would likely see how India implements the GLoBE regulations. We may also see India withdraw
more clarity on direct taxation for certain areas, including online gaming, telecom licensing fees and live events
In view of the upcoming general elections to be held in
April/ May 2024, no significant changes were introduced
on the direct tax front in the Finance Act 2024, except that
tax holidays for qualifying start-ups have been extended
by one more year, i.e., start-ups incorporated before 1
April 2025 will now be allowed a tax exemption for three
consecutive years out of 10 years beginnings from the year
of incorporation
The final Union Budget 2024 is expected to be announced in
There were speculations that with other countries moving
into a fast pace to implement GloBE proposals1, India would
also outline its roadmap for its implementation of GloBE.
However, it seems it has been postponed for the upcoming
2. Whether or not India implements
GloBE Rules, the proposals inter alia impact all India-
headquartered MNEs with operations in low-tax or zero tax
jurisdictions
Separately, it is expected that India will withdraw
Equalisation Levy (a digital tax levy) once the global
proposal is implemented, which will grant countries like
India (market jurisdiction with a significant customer base)
additional taxing rights on global profits of MNEs. However,
India has not made any formal announcement in this regard.
I. Clarication on Withholding Tax (‘WHT’) on
winnings from online gaming3
Last year, a new WHT provision was brought into law which
casts an obligation on the online gaming intermediary to
withhold taxes at 30% on “net winnings” from online games.
In this respect, the Central Board of Direct Taxes (CBDT)4
issued a Circular in April 2023 providing clarifications
among others, the manner of calculation of “net winnings”
in case multiple wallet accounts are held by a single user
with a single online gaming intermediary. The net winnings
in such a case would mean an aggregate amount withdrawn
by the user minus deposits made during the year, minus the
opening balance of all wallet accounts maintained with such
a single online intermediary. The Circular also clarifies the
treatment of referral bonus, incentives, etc.
As per press report of October 20235, the above amendment
has resulted in tax collection of INR6 billion from online
gaming companies from April 2023 to October 2023.
1Global anti-base erosion (GloBE) is a proposal to impose minimum tax rules for in-scope multinational enterprises (MNEs), such that MNEs will be subjected to top-up
taxes if the ETR at a jurisdictional level is less than 15%.
2-
show/107371044.cms?from=mdr
3Circular 5/2023
4Apex direct tax administrative tax body in India
5-
from=mdr

Media & entertainment
II. Clarication on WHT on e-commerce
transactions6
The advent of the ONDC7 open-source platform, an initiative
by DPIIT, Ministry of Commerce, to democratize digital
commerce in order to facilitate exchange of goods and
services had thrown up practical challenges in implementing
the WHT provision on e-commerce transactions. One critical
feature of the ONDC network architecture is that functions
of the e-commerce platform/ marketplace can be unbundled
and managed by separate entities. So, buyer-side platforms
(called Buyer Apps) handle solely buyer side functions –
for example, customer onboarding, search and discovery,
product selection and placing the order. Correspondingly,
seller side platforms (called Seller Apps) handle seller
side functions such as merchant onboarding, catalogue
management, order flow management, etc. All transactions
between a buyer and seller are enabled through a Buyer
App or Seller App.
The above novel architecture of ONDC had led to challenges
in implementing the TDS provision on e-commerce
transactions, where multiple e-commerce operators are
involved in a single buy/ sell transactions; in such cases,
a question arose as to which ecommerce operator (Buyer
App or Seller App) in the supply chain should undertake
TDS obligation from the gross amount of sale/ service.
To bring in clarity, CBDT through a Circular in December
2023 clarified among other issues that Seller App (which
eventually makes the payment to the seller) should be the
person responsible for undertaking the TDS obligation in
a multiple e-commerce operator scenario. Beside this, the
Circular also provided clarity on WHT treatment in relation
to platform/ convenience fees, GST, delivery/ packaging fee,
purchase returns, discounts offered by seller/ platforms, etc.
I. Recent Supreme Court rulings on annual
license fee arrangements
Recently, the Apex Court of India pronounced a ruling on
characterization of telecom annual license fees as capital
or revenue8. In this case, the telecom companies paid a
license fee in two parts as per the telecom policy – (i) one-
time entry fee; (ii) a variable annual license fee paid as a
percentage of gross revenue earned. The Apex Court held
that both fees relate to a singular purpose of the acquisition
of telecom license to establish, maintain and operate
telecommunication services and hence, one-time fee as well
annual fee is capital in nature.
The Court observed that for determining the character
of the payments as capital or revenue, what is relevant is
whether the payments relate to or have a nexus with the
whether lump-sum or installments, is immaterial.
The ruling is likely to impact M&E industry as well, wherein
the commercial/ franchise rights are obtained for the long
term in consideration for periodic payments. Such payments
may now be classified as capital in nature, and depending
on facts and circumstances of each case, could be required
to be amortized for tax purposes (as against availing an
upfront tax deduction).
II. Taxability of broadcasting “live” and “non-
live” content9
In recent rulings, the Delhi High Court held that the right to
broadcast “live events” is not “copyright” under the Indian
copyright law and accordingly, any payment for such right
cannot be taxed as royalty under the Indian income-tax law.
Further, on the issue of bifurcation of consideration between
“live” and “non-live” fees, the Court observed that if the
contracting parties have clearly stated and agreed that
there are two streams of fees, and payments have also been
made separately under two distinctive heads, then such
bifurcation cannot be regarded to be unsubstantiated or
arbitrary. Accordingly, the Court accepted fees split agreed
by the Parties under the Agreement to be 95% for “live”
transmission and 5% for “non-live” transmission.
The above ruling may have an impact on the media right
agreements entered into by sports bodies/ commercial
rights holders, more so where the contractual terms do not
separately bifurcate consideration for “live” rights and “non-
live” rights.
Indian judicial updates
6Circular 20/2023
7Open Network for Digital Commerce
8Bharti Hexacom Ltd. [TS-605-SC-2023]
9Fox Network Group Singapore Pte Ltd [TS-28-HC-2024(DEL)] & Lex Sportel Vision Pvt. Ltd [TS-799-ITAT-2023(DEL)]

237
Indirect tax
The indirect taxation space has seen some interesting developments for the M&E sector in India. The heightened
activity which the sector has witnessed in the online gaming segment has necessitated the government to introduce
including food and beverage taxation at cinema theaters, place of supply of advertisers, and imports of electronic
devices. We also see more clarity from the Ministry of Information and Broadcasting (MIB) on incentivizing content
and post-production services for co-productions with foreign countries.
I. GST on online gaming
► Online skill gaming industry has been seeking certainty
on the applicable GST rate and valuation for the sector
i.e., whether the rate should be 18% or 28% and also
whether the tax would be applicable on full amount
(including stake value) vs. platform fee charged (also
► Prior to 1 October 2023, online skill gaming companies
generally has been discharging GST at 18% on the
platform fee or GGR. GST authorities have issued
notices demanding GST at 28% on the full value
(including the stake value) on grounds that these games
are in nature of game of chance and hence tantamount
to betting/ gambling which are taxed at 28% on full
value
► At the 50th and 51st GST Council meeting, decision
online gaming as taxable actionable claim
► Pursuant to this recommendation, the relevant
provisions have been amended to impose GST of 28%
supplier by way of money or money’s worth by or on
behalf of player’ for online money gaming with effect
from 1 October 2023
► With the introduction of these changes, Government
has emphasized that the intention was to always tax
these transactions at 28% on full value (since such
tantamount to betting/ gambling) and amendment has
been brought to merely provide clarity on the matter.
included in the amendment introduced for the online
gaming sector
II. Amendments impacting the M&E sector
►
• • Standalone supply of food or beverages in a cinema
as the food or beverages are supplied by way of or
as part of a service and supplied independent of
the cinema exhibition service
• • Where the sale of cinema ticket and supply of food
and beverages are clubbed together, the entire
supply is likely to attract GST at the rate applicable
to service of exhibition of cinema
• • Place of supply shall be location of advertiser
in cases where responsibility of arranging
advertisement lies with the advertising agency
and such advertising agency shall be in possession
of hoarding/ structure (during the entire time of
display) at said location on which advertisement is
displayed
• • Place of supply shall be the location where such
hoarding/ structure is located in cases where
there is a supply of space or supply of rights to
use the space belonging to third-party vendor to
the client/ advertising company for display of their
advertisement on the said hoarding/ structure
III. Input Service Distributor mechanism made
mandatory
►Interim budget proposes to amend the existing Input
invoices received from third parties for and on behalf
etc.) would need to be mandatorily distributed through
the ISD framework. For this, companies would need to
obtain a separate ISD registration in every state where
such invoices are received and identify such expenses
IV. Other important amendments
► Effective 1 August 2023, taxpayers having annual
aggregate turnover of more than INR 50 million have
also been included in the e-invoicing ambit
► Import of laptops, tablets, all-in-one personal
computers, ultra-small form factor computers and
servers falling under HSN 8471 have been put under
certain exceptions) and their import is allowed against
a valid license (import authorization). However,
exemption from import authorization for the restricted
category items is provided in certain cases
► Industry is required to evaluate the import of restricted
category of goods and obtain appropriate licenses

Media & entertainment
Incentivizing content and post-
production in India
The MIB provides up to 30% incentive for international
productions in India for shoots as well as for animation,
post-production and visual effects services and for official
co-productions with foreign countries.
In the recent guidelines issued by the MIB, such incentives
are available for international production companies
applying through an Indian line producer/ line production
services company, animation, or post-production agency.
The budgetary outlay of the Incentive scheme is INR1.5
billion for FY 2023-24 and FY 2024-25 each.
Summarized below is the overview of the scheme.
I. Part I - Incentives for production of foreign
lms in India
► Section A - Incentives for live shoots in India:
International productions permitted by MIB or the
Ministry of External Affairs (in case of documentaries)
after April 2022 are eligible to apply through an Indian
in part within the territory of India
Eligible projects:
► An international producer through an Indian line
producer can claim a reimbursement of up to 30% of the
qualifying production expenditure (QPE) in India. Apart
from this, a 5% bonus can be claimed for employing 15%
or more Indian manpower and an additional bonus of
► Incentives are capped at a limit of INR300 million per
project. Minimum QPE spending threshold for live
shoot projects in India is INR30 million with no such
requirement in case of documentaries
►
Indian applicant has to apply in two stages, along with
the requisite documents
Feature films/ animation feature films (a minimum of
72 mins duration)
Feature films/ animation feature films (a minimum of
72 mins duration)
Web shows/ series/ animation series (per season)
Web shows/ series/ animation series (per season)
Commercial TV shows/ series (per season)
Commercial TV shows/ series (per season)
Documentaries (a minimum of 30 mins in length)
1
1
3
3
2
2
4
► Section B - Projects involving pure animation, post-
production and visual effects services: Eligible projects
must involve services that are physically undertaken at
least in part in India by a company registered in India,
on behalf of a foreign company
Eligible projects:
► International producers can claim a reimbursement of
up to 30% of QPE in India. Additional bonus of 5% for
conditions
► Under this section as well, incentives are capped at
a limit of INR300 million per project. Minimum QPE
requirements for animation, post-production and visual
effects services projects to be able to qualify for the
incentive is INR10 million
► Application for this incentive is also to be made in two
stages along with prescribed documents
II. Part II - Incentives for ofcial
coproductions under audio visual
coproduction treaty
► This scheme incentivizes projects which have been
granted the “Co-Production” status by MIB after 1 April
“Project”), between Indian producers and producers
of countries made under provisions of one of India’s
bi-lateral co-production treaties which has been granted
► Currently, India has such treaties with 16 countries10
► For all qualifying projects, an Indian co-producer can
claim a reimbursement of up to 30% on qualifying co-
production expenditure in India subject to a maximum
of INR300 million
10https://ffo.gov.in/en/co-productions/international-treaties
239

Media & entertainment
Regulatory update
Compiled by Nishith Desai Associates

241
I. Amendments to the Cinematograph Act,
1952
The Cinematograph (Amendment) Bill, 2023
(“Cinematograph Amendment”) came into force on 11
August 2023.
One of the stated reasons for the introduction of the
changes through Cinematograph Amendment was to curb
the menace of piracy with the advent of internet and social
media. The Cinematograph Amendment also sought to curb
and thereafter exhibited. Popularly known as camcording.
Following are the key amendments.
► Re-certication of theatrically released lms: A
exhibition by the CBFC as:
• •
• • For certain groups only under Section 4(2) (iii), i.e.,
exhibited through television or such other media as may
be prescribed by the Central government. The press
release1 accompanying the Cinematograph Amendment
indicates that the reason for introduction of this
permitted to be shown on television2. At present, no
other media has been prescribed3.
►Offences related to lm privacy: The Cinematograph
Amendment prohibits4 any person from using an
audio-visual recording device in a place licensed to
or abetting the making/transmitting of an infringing
using or abetting the use of an infringing copy of any
place for exhibition which is not licensed under the
Cinematograph Act, or in any manner that would
amount to infringement of Copyright5.
Filmed entertainment
Regulatory update
Violators may be punishable with imprisonment for a
term of at least three months, but which may extend to
but may extend to 5% of the audited gross production
cost.
►Directions to Intermediaries: The Amendment has also
take down content upon receipt of orders from courts
or authorized government and its agencies. Hence,
intermediaries may be directed to take down pirated
content online.
►Age-based Indicators: If the Central Board of Film
warrant guidance by parents/guardians, they will certify
6. Hence,
the Cinematograph Amendment suggest that the
7
► Other relevant changes: The other changes brought
forth by the Cinematograph Amendment include:
• •
by the CBFC8 from 10 years to now being perpetual
• • Expansion of the scope of powers vested with the
central government9 to make rules related to (i)
by the CBFC, and (iii) media for re-exhibition of
1See: https://pib.gov.in/PressReleaseIframePage.aspx?PRID=1944435 (last
accessed February 15, 2024).
Rule 6, the Cable Television Networks Rules, 1994
3Section 8(2)(cb), Amendment
4Section 6AA of the Cinematograph Act.
5Section 6AB of the Cinematograph Act.
6Section 4(2)(i) of the Cinematograph Act.
7Section 4(2)(i) of the Cinematograph Act.
8Section 5A(3) of the Cinematograph Act.
9Section 8 of the Cinematograph Act.

Media & entertainment
II. No stay on release of The Kerala Story
There have been multiple instances of challenges to
release of its trailer.
• • 1 0 ,
wherein the petitioners claimed that a particular
community is being shown in bad light and prayed
to stay the release of the movie
• •
the members of CBFC and the producer of the
observed in Tamil Nadu
• • In West Bengal, the Chief Minister banned the
movie to avoid public order situations and maintain
peace in the State11
High Court stated that the government’s ban on
the movie is in violation of Section 6(2) of the West
Bengal Cinemas (Regulation) Act of 1954, as the
movie-makers were not given a chance to defend
their stance regarding the movie before the ban
was imposed
Subsequently, the Supreme Court12 in the matter of
Sunshine Pictures Pvt. Ltd. and Anr vs. Union of India
and Others directed the Tamil Nadu government to
undertake necessary safety and security measures to
ensure that all individuals involved in screening and
viewing of the movie are safe.
Further, the Supreme Court observed that the
prohibition imposed by the West Bengal Government
suffers from “overbreadth” and lifted such prohibition.
Lastly, in the same matter, the Supreme Court held
that the following disclaimers should be added to the
movie’s existing disclaimers due to the controversial
nature of the storyline: (i) There is no authentic data to
III. Supreme Court refuses to revoke the CBFC
certication granted to Adipurush, and
dismisses the ongoing High Court cases
regarding the stay on the release of the
lm
13 in the case of Mamta
Rani vs Union of India dismissed a petition challenging
grounds of the content of the movie hurting religious
sentiments and distorting sacred text. While dismissing
the petition, the Supreme Court held that “sometimes
the cinematic representations may not be an exact
replica of text and there has to be a little play in the
same.” The Supreme Court also noted that the movie
had appropriate disclaimers to depict the same, and
stated that a body, i.e., CFBC has been formed under
the Cinematograph Act, 1952 to assess the aspects
raised by the petitioners.
and Haryana and Rajasthan High Courts wherein the
to the movie and prayed for directions to stop the
screening of the movie. The petitioners were aggrieved
by the controversial depiction of the characters and the
usage of dialogues in the movie. However, in October
202314 , the Supreme Court in the case of Super
Cassettes Industries Pvt Ltd vs. Kuldip passed an order
in the essence of the order passed in the case of Mamta
Rani vs. Union of India (discussed above). The Supreme
Court stayed the proceedings pending before different
courts regarding this movie holding the movie had been
10Writ Petition (C) 15126/2023 (S).
11See: https://www.thehindu.com/news/cities/kolkata/west-bengal-govt-bans-the-kerala-story-movie/
article66826921.ece#:~:text=The%20West%20Bengal%20Government%20on,and%20harmony%20
in%20the%20State. (last accessed February 20, 2024).
12Writ Petition(s) (Civil) No(s). 552/2023.
13Mamta Rani vs Union of India, W.P. No. (713/2023).
14Super Cassettes Industries Pvt Ltd vs Kuldip Tiwari, Transfer Petition (Civil) No. 1802-1809/2023.

243
IV. Self-regulatory body: Digital Publisher
Content Grievances Council’s rst order
against an OTT platform
the Digital Publisher Content Grievances Council
(“DPCGC”)15 heard a matter against the OTT platform
ULLU, wherein the complainant claimed that one
of the platform’s shows only depicts obscenity and
nudity which is contrary to the IT Rules, 2021. The
complainant also stated that they had raised this
complaint with the platform, however, no action was
taken by the same. The platform denied all the claims
and stated that their content is available for viewership
to individuals above the age of eighteen, who possess
adequate maturity regarding the decision to watch
the shows or not. The platform also listed the various
safeguards deployed by them like disclaimers, 18+
mature content ratings, etc.
In order to assess the present matter, the DPCGC
deployed the Community Tolerance Test, wherein,
“when the material is taken as a whole, and is found
to be lascivious and tends to deprave a person who
reads or sees or hears that material, it is said to be
obscene.” The DPCGC observed that the content in
question hardly has any storyline or message that is
being communicated through the same. Further, the
DPCGC also observed that the primary objective of
the content appears to be the depiction of nudity and
sexual content. A lack of artistic content and creativity
was also observed in the show. In light of the same,
the DPCGC directed ULLU to take down the content
in question or make edits to ensure compliance of the
same with the IT Rules.
V. Delhi High Court objects the usage of
profanity and obscenity in the OTT web
series
In March 2023, the Delhi High Court16 in TVF Media
Labs Pvt Ltd and Ors. vs. State (Govt. of NCT of Delhi)
objected to the usage of profane words and obscene
content in the web series “Collage Romance” which was
available to view on SonyLiv, YouTube, and TVF Play
(an OTT platform). In the present matter, the Delhi High
Court assessed the following questions: (i) Whether
content prima facie violated Section 67/ Section 67 A
of the IT Act, (ii) Whether the publishers of the show
had complied with the IT Rules, and (iii) Whether there
is a need for regulation of social media platforms.
Upon analysis of the issues from the perspective of
the IT Act as well as the IT Rules, the court directed as
follows:
• • The Delhi police to register an FIR under the
obscenity-related provisions17 of the IT Act against
the producers, cast members, and casting directors
of the show
• • In case the episode of the show containing
obscenity and profanity, which was in question
“appropriate remedial steps will be taken by
YouTube, as per law, rules, and guidelines of the
IT Act issued by the Ministry of Information and
Technology from time to time”
• • MeitY to take steps to enforce the IT Rules more
appropriate in its wisdom, in light of observations
made in this judgment’
Further, MeitY and YouTube were not parties to the
petition, with the above direction, the Court forwarded
of YouTube India.
15Appeal by Mr. Satish Waghela - Oversee Grievance ID – 044 of 2023.
16TVF Media Labs Pvt Ltd and Ors. vs State (Govt. of NCT of Delhi), CRL.M.C. 2214/2020 & CRL.M.A. 15761/2020.
17Section 67 of the IT Act – Punishment for publishing or transmitting obscene material in electronic form.– Whoever publishes or transmits or causes to be published
or transmitted in the electronic form, any material which is lascivious or appeals to the prurient interest or if its effect is such as to tend to deprave and corrupt persons
-
Section 67A of the IT Act – Punishment for publishing or transmitting of material containing sexually explicit act, etc., in electronic form.–Whoever publishes or trans-

Media & entertainment
I. Decriminalization of Cable TV Act
The Cable Television Networks (Regulation) Act,
1995 (“Cable TV Act”) has been decriminalized and
all provisions in the Cable TV Act which previously
prescribed imprisonment as a penalty have been
replaced with monetary penalties and other non-
monetary measures. The decriminalization was enacted
of Provisions) Act, 2023 in October 2023. This is in line
with the general approach of the Government and Courts
towards rationalization of various criminal provisions.
Earlier, contraventions of the Cable TV Act were
punishable with imprisonment for a term which may
for every subsequent offence. Post the amendment,
contraventions are punishable only with advisory,
censures, or warning, or a penalty which may extend to
one lakh rupees, for subsequent contraventions within
a period of three years. However, in case of more than
three contraventions within three years, the designated
orders suspending or revoking the registration of a
cable operator. This discourages habitual or repeated
contraventions. Appeals from the orders of the
Secretary to the Government of India, or their authorized
The move has been made with the aim of making the
Cable TV Act more business-friendly and to boost
undertaken to encourage compliance with the Cable TV
Act without resorting to harsh punishments for minor/
proportionality based on the nature of the contravention.
Television and Broadcasting
(Telecom)
II. The Indian Telecommunications Act, 2023
The Indian Telecommunications Act, 2023 (“Telecom
Act”) was enacted on 24 December 2023. Once
brought into force, it is set to replace the Indian
Telegraph Act, 1885, the Indian Wireless Telegraphy
Act, 1933 and the Telegraph Wires (Unlawful
Possession) Act, 195018. Key highlights of the Telecom
Act are set out below:
► Scope of the Telecom Act: The Telecom Act regulates
the development, expansion and operation of
telecommunication services and telecommunication
networks, assignment of spectrum and related matters.
the Telecom Act is wide, leading to uncertainty on
whether a broad range of information technology
and digital services can be brought within its ambit.
However, the Department of Telecom has explicitly
under the Telecom Act19. This provides some certainty
on the unbundling of carriage and content regulation.
► Authorization framework: The Telecom Act replaces
the existing licensing model with a simpler authorization
regime for persons who intend to: (a) provide
telecommunication services; (b) establish, operate,
maintain or expand telecommunication network; or (c)
possess radio equipment.
► Government’s powers, public safety, public
emergency: The Telecom Act confers powers on the
government or any authorized government agency
to direct the disclosure of any messages or class of
messages in intelligible format, that concern a public
emergency or public safety20
mean any sign, signal, writing, text, image, sound,
video, data stream, intelligence or information sent
through telecommunication21. The Telecom Act also
provides for a wide range of powers to the government
in relation to priority call routing, prescription of
standards for national security, etc.
► Other provisions: Further, the Telecom Act prescribes
those users of a telecommunication network be
22. Security measures in
relation to storage of such biometric data are yet to
be prescribed under the rules to be framed under
the Telecom Act. The Central Government is also
empowered to make rules on (1) the collection, analysis
telecommunication networks23, and (2) encryption and
data processing in telecommunication24
18However, as per Section 61 of the Telecom Act, all rules, orders made under the said Acts shall continue to the extent they are not inconsistent with the Telecom Act.
19Economic Times, OTT not under ambit of Telecom Bill: Ashwini Vaishnaw, https://economictimes.indiatimes.com/industry/telecom/telecom-news/ott-not-under-ambit-
of-telecom-bill-ashwini-vaishnaw/articleshow/106224226.cms?from=mdr (last visited Feb 9, 2024)
20Section 20, Telecom Act.
21Section 2(g), Telecom Act
22Section 3(7), Telecom Act
23Section 22(2), Telecom Act
24Section 19(f), Telecom Act

245
► The Telecom Act contains new provisions on the
powers of the Central Government to notify standards
in respect of telecom services, manufacturing, and
the import of equipment, and cybersecurity for
telecommunication services and networks, and a tiered
dispute resolution mechanism
► The Telecom Act also provides for a dual method of
allocation of spectrum, i.e., through auctions and
through administrative allocation. This is in line with
global best practices and enables equitable distribution
of satellite spectrum. It further requires all authorized
entities to establish an online mechanism for grievance
redressal of users. Lastly, the Telecom Act explicitly
provides for extraterritorial application unlike the
previous regime
III. Broadcasting Bill
The Ministry of Information and Broadcasting (“MIB”)
had issued a draft of the Broadcasting Services
(Regulation) Bill, 2023 (“Broadcasting Bill”) on 10
November 202325. The Broadcasting Bill seeks to
consolidate and amend the existing broadcasting laws
and replace the existing Cable TV Act and the various
policy guidelines currently governing the broadcasting
sector in India.
Key highlights of the Broadcasting Bill:
► Inclusion of OTT services: The Broadcasting Bill notably
includes Over-the-top (“OTT”) broadcasting services
OTT Broadcasting Services will not include a social
media intermediary, or a user of such intermediary, and
that the person responsible for ensuring compliance
with all requirements will be the operator of the
streaming content and not the network operator or
the internet service provider. The Broadcasting Bill
has however faced severe pushback from industry
associations for the inclusion of OTT, given its
difference from traditional broadcasting and the
existing regulation of OTT players under the IT Rules26
► News and current affairs programs: The Broadcasting
Bill also seeks to regulate persons broadcasting news
and current affairs programs online, requiring them to
adhere to the Program Code and Advertisement Code,
establish a Content Evaluation Committee, and other
provisions of the Broadcasting Bill
► Statutory Penalties and Fines: The Broadcasting
Bill retains statutory penalties such as advisory,
warning, censure, and monetary penalties (linked
account their investment and turnover) for operators
and broadcasters. Provision for imprisonment and/or
operating without registration or expired registration,
misrepresentation, etc.
► Accessibility for Persons with Disabilities: The
Broadcasting Bill provides enabling provisions for the
issue of comprehensive accessibility guidelines
The Broadcasting Bill contains several open-ended
provisions in relation to the powers of the Central
Government, including regulating services intricately
linked to broadcasting services
IV. Cigarettes and other Tobacco Products
(Prohibition of Advertisement and
Regulation of Trade and Commerce,
Production, Supply and Distribution)
Amendment Rules, 2023
In May 2023, the Cigarettes and Other Tobacco
Products (Prohibition of Advertisement and Regulation
of Trade and Commerce, Production, Supply and
Distribution) Rules, 2004 (“2004 Tobacco Rules”)
were amended to include provisions requiring
publishers of “online curated content” to insert relevant
disclaimers and warnings regarding tobacco products.
The amendments were brought in by way of the
Cigarettes and other Tobacco Products (Prohibition of
Advertisement and Regulation of Trade and Commerce,
Production, Supply and Distribution) Amendment Rules,
2023 (“Tobacco Amendment Rules”) and have been
effective 1 September 2023.
The key amendment brought forth to the 2004 Tobacco
Rules is through Rule 11 introduced by Tobacco
Amendment Rules. Essentially, new requirements have
been introduced for the publishers27 of online curated
content28 that displays tobacco products or their use.
The requirements include:
• • Display anti-tobacco health spots of at least thirty
seconds duration at the beginning and middle of
the program
• • Display a prominent static anti-tobacco health
warning message at the bottom of the screen
while showing tobacco products or their use in the
program
25See https://pib.gov.in/PressReleasePage.aspx?PRID=1976200 (last accessed on Feb 9, 2024)
26See https://www.medianama.com/2024/02/223-nasscom-submission-ott-inclusion-broadcasting-bill/ (last accessed on Feb 9, 2024); See https://economictimes.
indiatimes.com/industry/media/entertainment/media/broadcasters-want-ott-to-be-kept-outside-broadcast-bills-purview/articleshow/107404330.cms?from=mdr (last
accessed on Feb 9, 2024)
27
content being made available, makes available to users a computer resource that enables such users to access online curated content over the internet or computer
networks, and such other entity called by whatever name, which is functionally similar to publishers of online curated content but does not include any individual or
user who is not transmitting online curated content in the course of systematic business, professional or commercial activity.
28As per the Tobacco Amendment Rules, “Online curated content” means any curated catalogue of audio-visual content, other than news and current affairs content,
which is owned by, licensed to, or contracted to be transmitted by a publisher of online curated content, and made available on demand, including but not limited
podcasts and other such content.

Media & entertainment
• • Show an audio-visual disclaimer on the ill effects
of tobacco use for at least twenty seconds at the
beginning and middle of the program
Further, the Tobacco Amendment Rules prohibit
the display of brands of cigarettes or other tobacco
products or any form of tobacco product placement in
online curated content; and display of tobacco products
or their use in promotional material created for
promotion online curated content.
In addition to the requirements discussed above, the
language used for warnings should be same as that in
the online curated content. Lastly, anti-tobacco health
warning message displayed should be legible and
readable, with black font on a white background, and
the warnings “Tobacco causes cancer” or “Tobacco
kills” must be included.
Reports show that compliance of the television industry
with the requirements under the 2004 Tobacco Rules
have been low. In fact, various aspects of the 2004
Tobacco Rules are currently under challenge before
the Bombay High Court29 and the Supreme Court30.
Some of the above amendments were not found to
be practical in the context of online curated content
publishers and hence there has been pushback by the
online curated content publishers as well31.
V. TDSAT holds that OTT platforms do not
fall under the purview of TRAI
In October 2023, the Telecom Disputes Settlement &
Appellate Tribunal (“TDSAT”)32 in the case of All India
Digital Cable Federation vs. Star India Pvt Ltd assessed
the jurisdiction of the Telecom Regulatory Authority
of India (“TRAI”), and therefore the applicability of
TRAI rules and regulations on over the top (“OTT”)
broadcasting platforms. In the matter, the petitioner
claimed that Star India violates Regulation 3(2) of the
Telecommunication (Broadcasting and Cable) Services
Interconnection (Addressable Systems) Regulation,
2017, which requires broadcasters to provide signals
of the television channels to the distributors in a non-
discriminatory manner. The petitioners raised this issue
as Star India provided content on their Star Sports
television channel through payment of charges. On the
other hand, on Hotstar, viewers were able to access Star
Sports content for free. The petitioners further claimed
that the respondents should offer viewership of content
on both platforms in the same manner.
TDSAT observed that in the present case, the
respondent “wears two hats,” implying that Star India
is a broadcaster and an owner of the OTT platform. It
is exhaustive and does not cover OTT platforms under
its ambit. Lastly, the TDSAT held that prima facie, OTT
platforms are not covered by the jurisdiction of TRAI,
and therefore the TRAI Act, rules and regulations
thereunder.
29Anurag Kashyap and Ors. vs UOI and Ors, Writ Petition No. 119 of 2014.
30Union of India vs Mahesh Bhat and Ors., SLP (Civil) 8429-8431/2009.
31See: https://indianexpress.com/article/india/tobacco-warnings-on-ott-amid-pushback-from-platforms-govt-looking-for-a-solution-8960900/ (last accessed: February
19, 2024)
32All India Digital Cable Federation vs Star India Pvt Ltd, Broadcasting Petition/217/2023.

247
I. Amendments to introduce a central law for
online gaming
In December 2022, the Ministry of Electronics and
Information Technology (“MeitY”) was appointed as the
nodal ministry for online gaming. Similarly, the Ministry
of Youth Affairs and Sports is the nodal ministry for
e-sports33. Previously, there was no central ministry
appointed for these industries.
On 6 April 2023, MeitY introduced the central
regulations primarily for online real money games
through amendments (the “Gaming Amendments”) to
the Information Technology (Intermediary Guidelines
and Digital Media Ethics Code) Rules, 2021 (the “IT
Rules”). The Gaming Amendments introduced a
light-touch, co-regulatory framework between MeitY
and the self-regulatory bodies (“SRB”), through
the appointment of SRBs. This was in line with the
government’s overall objective of reducing prescriptive
laws and enhancing the ease of doing business in India.
To sum up the major highlights, the Gaming
Amendments:
► Specify certain online games as permissible, being:
• • a permissible online real money game (“PORMG”)
i.e., a game where a user makes a deposit in cash
or kind with the expectation of earning winnings on
the deposit, or
• • any other online game that is not an online real
money game
►
gaming intermediaries (“OGI”), i.e., entities that enable
their users to access one or more online games
► Vest MeitY with the power to extend such regulations
applicable to PORMG to other online games as well
► Require PORMG to satisfy certain conditions
• • be an online real money game, where a user makes
a deposit in cash or kind with the expectation of
earning winnings on the deposit, and
• •
body
►Introduce obligations on OGIs including but not limited to:
• • Requiring OGIs to verify user identity before
accepting any deposits in cash or kind, according
to the Master Direction–Know Your Customer (KYC)
Direction, 2016
• • Requiring OGIs to appoint grievance redressal
contact details, establish a mechanism to make
complaints for users, and resolve grievances within
15 days from the date of their receipt
• • Providing an appeal process to the Grievance
Appellate Committee for grievances not resolved by
GOs within 30 days from receipt of communication
from the GO
• •
playing online games
• •
of online real money games offered by OGIs e.g., the
permissible online real money game
• • Providing MeitY with the power to issue blocking
orders against permissible online real money games
However, in February 2024, it was reported that there
by gaming companies, which could result in a lack of
neutral decisions from such bodies. In light of this, it is
reported that MeitY may have now withdrawn from the
co-regulatory approach and by default will now act as a
regulator for the industry34.
The IT Rules as they stand would only be effective
upon the designation of at least three SRBs. Hence, the
framework introduced under the IT Rules is currently
not in effect. The industry now awaits the next steps by
MeitY.
challenged the constitutional and legislative validity of
the Gaming Amendments before the Delhi High Court35.
It has been alleged in the petition that the Gaming
Amendments go beyond the rule-making powers of the
Information Technology Act (“IT Act”). MeitY, in response
to the challenge submitted that the central government
has the authority under Entry 31 of the Union List and
the residuary powers vested with the central government
to regulate matters like online gaming.
Online gaming
33These changes were brought about through amendments to the Government of India (Allocation of Business) (Three Hundred and Seventieth Amendment) Rules,
2022 in December 2022. Available at: https://cabsec.gov.in/writereaddata/allocationbusinessrule/amendment/english/1_Upload_3515.pdf (last accessed February
15, 2024).
34See: https://indianexpress.com/article/india/meity-to-prepare-guidelines-soon-proposals-for-industry-body-rejected-centre-to-regulate-e-gaming-9156525/ (last
accessed February 15, 2024).
35See: https://indianexpress.com/article/india/meity-to-prepare-guidelines-soon-proposals-for-industry-body-rejected-centre-to-regulate-e-gaming-9156525/ (last
accessed February 15, 2024).

Media & entertainment
II. Implementation of GST in online real
money games
Goods and Services Tax (“GST”) is a destination-based
tax. While intra-state supplies are governed by central
and state acts, i.e., Central Goods and Service Tax
Act, 2017 (“CGST Act”) and State Goods and Service
Tax Act, 2017, inter-state supplies are governed by
the Integrated Goods and Services Tax Act, 2017
(“IGST Act”). The CGST Act provides that GST shall be
applicable to the supply of goods or services, which
are provided or agreed to be provided, in the course or
furtherance of business and for consideration.
The GST Council36 in its 50th and 51st meetings
recommended levying GST at the rate of 28% on the full
face value of bets placed with online gaming operators.
Consequently, certain amendments (“Amendments”)
were made to the Central Goods and Services Tax Act,
2017 (“CGST Act”) and the Integrated Goods and
Services Tax Act, 2017 (“IGST Act”). The Amendments
have been made effective from 1 October 202337 .
In addition to the Amendments, Rule 31B has also
been introduced under the CGST Rules providing the
mechanism for valuing supplies of online gaming
(“Valuation Rules”).
► Online Money Gaming and Online Money Gaming
Operators: The Amendments have introduced a
the online games in which the players pay or deposit
an amount with the expectation of winning rewards,
regardless of whether (i) the outcome of the game is
dependent on skill or chance, or (ii) such games are
permissible under any law for the time being in force,
would qualify as online money gaming (“OMG”)38.
The scope of OMG is made wide enough to include
any game, scheme, competition, or any other activity
or process, regardless of its legality or whether it
is in nature of game of skill or game of chance. The
players may be in the form of money or money’s worth
or virtual digital assets (“VDA”)39.
►Actionable Claims: Under the CGST Act, goods have
that falls outside the ambit of goods40. An actionable
of “actionable claim” as provided under Section 3 of the
Transfer of Property Act, 188241.
The Supreme Court’s judgement in the case of Sunrise
Associates vs. Government of NCT Delhi42 had settled
an actionable claim and is therefore not chargeable
to sales tax under the Delhi Sales Tax Act, 1975 as
“actionable claims”. The court held that:
“A lottery ticket has no value in itself. It is a mere piece
of paper. Its value lies in the fact that it represents a
prize of a greater value than the consideration paid for
the transfer of that chance. It is nothing more than a
token or evidence of this right…
“The question is, what is this right which the ticket
represents? There can be no doubt that on purchasing
a lottery ticket, the purchaser would have a claim to
a conditional interest in the prize money which is not
in the purchaser’s possession. The right would fall
“goods” under the Sale of Goods Act and the sales tax
statutes...”
A transaction of gambling or betting is also similar to
a purchase of a lottery ticket as the person placing the
bet acquires a conditional right to win the prize, or in
other words, a conditional interest in the prize money
(which is not within his / her possession). Hence, it is
likely for certain aspects of gambling and betting to also
be construed as the supply of actionable claims.
36The GST Council is a constitutional body responsible for making recommendations on issues related to the GST. Please see: https://gstcouncil.gov.in/gst-council
(last accessed October 25, 2023).
37
38Section 2(80B) of the CGST Act
39
40
41-
est in movable property not in the possession, either actual or constructive, of the claimant, which the civil courts recognize as affording grounds for relief, whether
42(2006) 5 SCC 603.

249
that are neither considered as a supply of goods nor
as a supply of service and are accordingly not subject
to GST. Prior to the Amendments, actionable claims,
other than lottery, betting, and gambling, formed part
of Schedule III43. Therefore, the supply of actionable
claims, other than actionable claims in relation to
lottery, betting and gambling were not subject to GST.
Considering the jurisprudence distinguishing skill-based
games from lottery, betting and gambling, actionable
claims in relation to betting and gambling were treated
differently than actionable claims in relation to game of
skill.
The CGST Act has been now amended to include a
actionable claims involved in or by way of inter-alia
betting, gambling or OMG44.
Schedule III has now been amended to provide that
shall neither be considered as a supply of good nor a
shall be considered to be subject to GST. Considering
OMG, such supply shall be considered to be subject to
GST.
Please note that in the erstwhile GST regime, an
argument could have been made that online import of
intangible goods such as intangible actionable claims
should not be subject to integrated GST as the point
of taxation for customs duty for the imports does not
discussed previously, the Indian government has the
power to notify such intangible goods, import of which
would be subject to GST irrespective of whether Indian
custom frontiers are crossed or not. Since supply of
import of such supplies should be leviable to GST.
►Valuation Rules: Valuation of taxable supplies is
governed by section 15 of CGST Act which inter-alia
provides that value of supply of goods or services shall
be the transaction value, which is price actually paid
or payable for the said supply of goods or service.
However, section 15(5) of the CGST Act grants power
to the Indian government to notify certain supplies for
which valuation may be determined in a prescribed
manner. By virtue of this provision, the Government
for which value of supply may be determined in the
prescribed manner45. Accordingly, Valuation Rules have
been introduced for the purpose of determining the
value of supply in case of online gaming including OMG.
The Valuation Rules, inter alia, provide that the value of
supply of online gaming, including supply of actionable
claims involved in OMG, shall be the total amount paid
or payable to or deposited with the supplier by way
of money or money’s worth, including VDA, by or on
behalf of the player46. It is important to note that the
Valuation Rules do not make a distinction between
value of supply of goods and value of supply of services.
It is further provided that any amounts refunded or
returned by the supplier to the players (for any reasons
whatsoever) will not be deductible from the value of
supply of OMG.
The rules also clarify that winnings redeployed by
players, without withdrawing, shall not be considered
as amount paid to the OMG operator and, therefore,
should not be included in the value of supply47.
► OIDAR Services and Mandatory Registration for
Offshore OMG Operators: Online Information and
Data Access or Retrieval (“OIDAR”) services have been
48 to mean the services
whose delivery is mandated by information technology
over the internet or an electronic network. Service
providers providing OIDAR services to unregistered
Indian users are required to register and discharge the
GST liability arising from the supply of such services49.
the meaning of OIDAR services. Therefore, operators
qualifying as suppliers of OMG should not be considered
as supplying OIDAR services.
43Entry 6 of Schedule III.
44Section 2(102A) of the CGST Act.
45
46Rule 31B of Central Goods and Services Tax Rules, 2017.
47Explanation to Rule 31B and 31C of Central Goods and Services Tax Rules, 2017.
48Section 2(17) of the IGST Act.
49Section 14(2) of the IGST Act.

Media & entertainment
However, despite the exclusion from OIDAR, the
Amendments have cast an obligation on the offshore
OMG operators to obtain mandatory registration under
GST on supply of OMG to persons in India. In case of
failure to obtain such registration, the GST department
may block any information generated, transmitted,
received or hosted in any computer resource used for
supply of OMG by such offshore OMG operator50. The
Government has also issued an advisory specifying
additional information in the GST registration forms
that enable mandatory registration of offshore OMG
operators and also enable to furnish information
regarding supplies of OMG51.
Prior to this amendment, several operators were taking
an argument that supply of OMG, being import of an
intangible actionable claim should not be subject to
GST. This is because in the erstwhile regime, GST could
not be levied on import of intangible goods (such as
supply of actionable claims with respect to OMG) as it
did not physically cross the customs frontiers of India.
The Amendments, however, have granted power to
the Indian government to notify such intangible goods
to be subject to GST52. The Indian government has
be covered under such amendment, thereby, subjecting
import of OMG to GST53.
►Tax Rate: The GST rates schedule for goods (“Goods
Schedule”) prescribes an entry for an actionable claim
in the form of chance to win in betting and gambling,
including horse racing, to be taxable at a rate of 28%.
goods which shall be taxable at a rate of 28%.
taxable at 28% under the GST rates schedule for
services (“Services Schedule”). Therefore, services in
relation to gambling should be taxable at 28%. Services
in relation to non-gambling activities should be taxable
at 18%. No amendment has been made to the Services
Schedule.
► Registration: As per the Amendment Acts, offshore
OMG operators shall be required to obtain mandatory
and discharge their GST liabilities accordingly. The
operator to obtain a single registration (instead of
multiple registrations for supply in different states). In
the absence of such registration, the GST department
may block any information generated, transmitted,
received, or hosted in any computer resource used for
supply of OMG by such offshore OMG operator.
III. High Courts grant stay on Show Cause
Notices issued by GST authorities to
several online gaming operators
In the Gameskraft case, the Karnataka High Court54
quashed a GST demand of INR210 billion by holding
that the buy-in amount received by the rummy operator,
being a game of skill, should not be subject to GST at a
rate of 28%. The GST department contested this decision
in the Supreme Court of India55, where a three-judge
bench granted an ad-interim stay on the Karnataka High
Court’s order.
Following this development, the GST department-
initiated assessments on numerous online gaming
operators by issuing show-cause notices. These show-
cause notices have been challenged by online gaming
operators before various jurisdictional high courts.
While various courts such as the Bombay High Court56,
Sikkim High Court57, and Gujarat High Court58 have
granted a stay on the proceedings initiated by the GST
department, the Punjab and Haryana High Court59 has
granted a stay on recovery of demand.
E-Gaming Federation and Head Digital Works60 also
approached the Supreme Court challenging the
provisions of CGST 2017 and the retrospective
application of GST provisions where their matter was
consolidated with the Gameskraft case. The consolidated
matter is listed for hearing on 2 April 2024.
50Section 14A(3) of the IGST Act.
51Please see: https://www.gst.gov.in/newsandupdates/read/609 (last ac-
cessed October 25, 2023).
52Proviso to Section 5(1) of the IGST Act.
53
54Gameskraft Technologies vs Directorate General of Goods, Services Tax
Intelligence (2023 SCC OnLine Kar 18).
55Special Leave to Appeal (C) No(s).19366- 19369/2023
56M/s. Playersportz Media Pvt. Ltd. (WP(L) 31946/2023), Sachar Gaming
Pvt. Ltd. (WP(L) 31216/2023), Delta Corp Ltd. (WP 715 / 2023)
57Delta Corp Ltd. (WP(C) 41 / 2023)
58Nxgn Sports Interactive (Pvt.) Ltd. (19183 of 2023, 19243 of 2023)
59
Technology (Pvt.) Ltd. (CWP – 28011 / 2023)
60WP(C) 001374 / 2023

251
IV. Bombay High Court claries that FDI in
gaming entities offering games without
real-money rewards would not amount to
gambling
61 in the
case of Play Games 24x7 Pvt. Ltd. vs. Reserve Bank of
India held that foreign investments in entities offering
(i) games of skill, and (ii) games with no real-money
rewards, do not amount to gambling. The petitioner
had been periodically receiving FDI during the period
of 2006 to 2012 and had begun offering Ultimate Teen
Patti and Call it Right (the “Impugned Games”) after this
period. The petitioner had delayed complying with the
reporting requirements for FDI received by them, and
the Reserve Bank of India.
The RBI directed the petitioner to approach the
Department for Promotion of Industry and Internal
eligibility to receive FDI. The petitioner did not
writ petition before the Bombay High Court seeking
directions to the RBI to consider and decide the
petitioner’s application for the compounding of such
non-compliance. The DPIIT was also made a respondent
in the petition.
relation to the Impugned Games on the ground that
they are games of chance and therefore amount to
gambling, which is a prohibited sector for FDI. The
Bombay High Court analyzed past Supreme Court
judgments to decide whether the Impugned Games
amounted to gambling; and held that for a game to
amount to gambling, it must be (i) predominantly of
chance, and (ii) played for a reward. Accordingly, the
Bombay High Court directed the RBI to expeditiously
hear and decide on the petitioner’s application for
compounding of FDI-related compliances.
V. Madras High Court struck down the
prohibition on online games of skill
Tamil Nadu enacted the Tamil Nadu Prohibition of Online
Gambling and Regulation of Online Games Act, 2023
effective on 10 April 2023 (“Tamil Nadu Act”). The Tamil
Nadu Act prohibited offering, playing, and advertising
online gambling or games of chance with stakes, which
include games that:
• • Have elements of chance and skill and the element
of chance dominates over the element of skill; or
• • Require superlative skill to dominate chance; or
• • Are presented as involving an element of chance; or
• • Involve any element of random event generation
(e.g., cards, dice, or wheel).
Games of poker and rummy were also sought to be
prohibited through the Schedule to the Tamil Nadu Act.
Owing to the broad and blanket prohibitions imposed by
the Tamil Nadu Act, the All India Gaming Federation62,
Gameskraft Technologies Private Limited63, Play Games
24x7 Private Limited64, Head Digital Works Private
Limited6566
stating that provisions of the Act are unconstitutional.
Owing to the similar prayers in such writ petitions,
the Court clubbed them and heard the arguments
collectively. On 9 November 2023, the High Court of
Madras struck down the prohibition on rummy and poker
as unconstitutional. The High Court also held that the
prohibitions under the Tamil Nadu Act were to be read to
apply to only games of chance, and not games of skill.
High Court’s order before the Supreme Court, which is
still pending.
61 Play Games 24x7 Pvt. Ltd. v Reserve Bank of India & Anr., WP No. 3047/2022
62W.P.No.13203 of 2023.
63W.P.No.13593 of 2023.
64W.P.No.13720 of 2023.
65W.P.No.13722 of 2023.
66W.P.No.14704 of 2023.

Media & entertainment
VI. Enforcement actions
In early 2023, MeitY blocked 138 betting and gambling
sites and apps by offshore operators offering sports
betting67, and 94 loan apps that were allegedly involved
in harassment of the respective borrowers, misuse
of customer data and money laundering68 among
other things. Some of the lending apps were able to
get unblocked after the entities/individuals submitted
relevant documents to show their compliance with the
regulatory requirements69.
Subsequently, in April 2023, it was reported70 that
MeitY is planning to issue blocking orders to FinTech
and payment companies which allow access to payment
gateways for online games that are prohibited under
the law.
In November 2023, MeitY issued blocking orders
against several other offshore online betting and casino
platforms following investigations conducted by the
Enforcement Directorate (“ED”) and raids71.
In August 2023, MeitY issued advisories to social media
platforms, intermediaries, digital media platforms, etc.,
advising them against the depiction of advertisements
of online sports betting platforms, and surrogate
advertisements for offshore sports betting platforms in
the guise of sports news websites72.
Several Indian Central regulators have been taking
enforcement action against offshore betting/gambling
platforms offering prohibited products in India which do
not comply with the requirements under State gambling
laws, foreign exchange laws, and which appear to be
evading taxes.
I. Bombay High Court reafrmed that
internet broadcasting platforms are not
covered within the scope of Section 31D of
the Copyright Act, 1957
Since 2016, there has been an effort by government
departments73 to bring internet broadcasters under
the ambit of Section 31D of the Copyright Act,
1957 (“Copyright Act”). In 2021, the report of the
Parliamentary Standing Committee on Review of the
Intellectual Property Rights Regime in India (Report
No. 161) suggested an amendment to Section 31D
traditional and internet broadcasters. However, no such
amendments were made.
In October 2022 (order published in 2023), a division
(two-judge) bench of the Bombay High Court74 in Wynk
75
(“2019 Order”), that statutory licenses under Section
31D of the Copyright Act are restricted to traditional
non-internet-based radio and television broadcasting
and performances alone, and that the provision has no
application to any internet-based offering. This implied
for broadcasting of literary works, musical works, and
sound recordings, only applied to broadcasting through
radio and television services and not internet-based
platforms. Accordingly, internet-based platforms
are required to obtain licenses through a traditional
negotiation process and payment of agreed royalties
with the owners of the copyright or the copyright
societies for the relevant works.
Intellectual property
67See: https://indianexpress.com/article/business/centre-blocks-more-than-200-offshore-gambling-predatory-loan-platforms-8425995/ (last accessed February 15,
2024).
68See: https://www.cnbctv18.com/technology/lazypay-digital-lending-apps-blocked-china-ties-security-concerns-meity-meeting-15869481.htm (last accessed February
15, 2024).
69See: https://www.livemint.com/news/india/meity-revokes-ban-against-some-digital-lending-platforms-details-11676022459871.html (last accessed February 15, 2024).
70See: https://economictimes.indiatimes.com/tech/technology/payment-gateway-access-may-be-blocked-for-vetoed-online-games/articleshow/99540634.cms?from=mdr
(last accessed February 15, 2024).
71See: https://g2g.news/gaming/meity-issues-blocking-orders-against-22-illegal-betting-apps-websites-including-mahadev-book/ (last accessed February 15, 2024).
72
accessed February 19, 2024)
73-
rightAct_05September2016.pdf.
74Wynk Ltd. & Anr. vs Tips Industries Ltd., Commercial Appeal No. 424 of 2019.
75Tips Industries Ltd. vs Wynk Music Ltd. & Anr., Notice of Motion (L) No. 197 of 2019 in Commercial Suit (L) No. 114 of 2018.

253
II. Bombay High Court grants dynamic
injunction against Instagram accounts
In May 2023, the Bombay High Court76 in the case
of Applause Entertainment Private Limited vs. Meta
Platforms Inc. and others granted a dynamic injunction
against a set of Instagram accounts through which
“substantial parts” of the plaintiff’s web series were
being published. The plaintiff in the present case
was the owner of the copyrighted work, i.e., the web
series “Scam 1992: The Harshad Mehta Story,” which
was based on the book “The Scam.” The plaintiff
claimed that the clips from their work were used by
the defendants in relation to their business and to
generate revenue. The plaintiff also contended that the
defendants could be using rogue or fake identities to
operate the Instagram accounts in question.
The Bombay High Court observed that a strong prima
facie case existed in favor of the plaintiff, and how the
feature of the web series on any other platform apart
from the licensed arrangement with the respective
OTT platform would amount to a violation of the
copyright in the said web series. The Court also agreed
to the plaintiff’s contention regarding Instagram users
adopting different identities to perpetuate the infringing
activities and hence granted an ex-parte ad-interim
relief in the form of a dynamic injunction.
III. Delhi High Court holds that the use of
publicly available information to create
NFTs does not infringe on publicity rights
In April 2023, the Delhi High Court77 in the case
of Digital Collectibles Pte Ltd and Ors. vs. Galactus
Funware Technology Pvt Ltd and Anr. held that the right
to publicity is not absolute and cannot infringe on the
fundamental right to freedom of speech and expression
under Article 19(1)(a) of the Constitution of India. The
Delhi High Court also noted certain exceptions apply to
the right to publicity, like lampooning, satire, parodies,
art, scholarship, music, academics, news, etc.
In the present case, the plaintiff, Digital Collectible Pte
Ltd. (“Rario”), had been offering “digital player card” in
the form of non-fungible tokens (“NFTs”) of Cricketers
that could be bought, sold, or traded by users on
petitioner’s online marketplace. These cards contained
names, photographs, and other personality attributes
of players obtained by exclusive license agreements
executed with such players. The defendants, Galactus
Funware Technology Private Limited (Mobile Premier
League or “MPL”) offered similar digital cards, but with
limited information such as players’ names/initials and
an artistic rendition of the player’s image. Unlike Rario,
there was no formal agreement between MPL and the
players. Further, both parties used these cards in their
game formats.
The Delhi High Court held in favor of MPL that MPL’s
fantasy sports game format consists of Digital Player
Cards with only publicly available information of all
players, there is no confusion that the MPL fantasy
sports game format is endorsed by any particular
player. The Court held that, moreover, the use of name,
fantasy sports game formats online would be protected
speech under Article 19(1)(a). The matter is currently
76Applause Entertainment Private Limited vs Meta Platforms Inc. and others,
Commercial IP Suit (Lodging) No. 10238 of 2023.
77Digital Collectibles Pte Ltd and Ors. vs Galactus Funware Technology Pvt Ltd
and Anr. CS (Comm) 108/2023

Media & entertainment
I. Guidelines on Prevention and Regulation of
Dark Patterns, 2023
The Central Consumer Protection Authority (“CCPA”)
has issued the Guidelines on Prevention and Regulation
of Dark Patterns, 202378 (“Guidelines”) in exercise
of its powers under Section 18 of the Consumer
Protection Act, 2019 to issue guidelines to prevent
unfair trade practices and protect consumers’ interest.
The Guidelines are applicable to all the platforms
that systematically offer goods or services in India,
advertisers, and sellers, including Indian and foreign
platforms who systematically offer goods or services79.
or deceptive design patterns using user interface or
user experience interactions on any platform that is
designed to mislead or trick users to do something they
originally did not intend or want to do, by subverting or
impairing the consumer autonomy, decision making or
choice, which amounting to misleading advertisement
or unfair trade practice or violation of consumer
rights80.” Therefore, a practice will be considered a
dark pattern only if a practice amounts to a misleading
advertisement81 or unfair trade practice82 or violation of
consumer rights83
dark patterns are prohibited84. The Guidelines provide
industry and consumers in the Annexure 85,86.
For example, “False Urgency” refers to falsely stating
or implying the sense of urgency or scarcity so as to
mislead a user into making an immediate purchase
or take an immediate action, which may lead to a
purchase. This false sense of urgency can be created by
showing the false popularity of a product or a service
or stating that quantities are limited in stock. Another
Consumer protection Trap” which refers to (i) process of making cancellation
of a paid subscription process impossible or complex
and lengthy process, or (ii) hiding the cancellation
option for a subscription, or (iii) forcing a user to
provide payment details and/or authorization for auto
debits for availing a free subscription, or (iv) making
the instructions related to cancellation of subscription
ambiguous, latent, confusing, cumbersome. There
basket sneaking, interface interference, drip pricing,
are only for guidance purposes and do not constitute an
interpretation of law, binding opinion, or decision.
to a misleading advertisement, unfair trade practice or
violation of consumer rights87. Therefore, penalties will
be applicable only if a dark pattern is found to qualify
as misleading advertisement, unfair trade practice or
violation of consumer rights.
The Guidelines will be applicable to all online platforms
and websites, including OTT platforms. Some of the
likely to affect subscription models of such platforms.
II. Guidelines for health inuencers
The Ministry of Consumer Affairs has issued
wellness88
they are an extension to the Guidelines for Prevention
of Misleading Advertisements and Endorsements for
Guidelines aim to prevent misleading advertisements,
unsubstantiated claims and ensure transparency in
health and wellness endorsements by celebrities,
78
Patterns%202023.pdf (last accessed on February 20, 2024).
79Guideline 3 of the Guidelines.
80Guideline 2(e) of the Guidelines.
81
service; or (ii) gives a false guarantee to, or is likely to mislead the consumers as to the nature, substance, quantity or quality of such product or service; or (iii) conveys
an express or implied representation which, if made by the manufacturer or seller or service provider thereof, would constitute an unfair trade practice; or (iv) deliberately
conceals important information.”
82
of any service, adopts any unfair method or unfair or deceptive practice including any of the following practices” and lists out an exhaustive list of practices which are
considered as unfair trade practices (available at: https://www.indiacode.nic.in/bitstream/123456789/15256/1/a2019-35.pdf) (last accessed on February 20, 2024).
83Section 2(9) of the Act refers to “consumer rights” which includes “(i) the right to be protected against the marketing of goods, products or services which are hazardous
to life and property; (ii) the right to be informed about the quality, quantity, potency, purity, standard and price of goods, products or services, as the case may be, so as to
protect the consumer against unfair trade practices; (iii) the right to be assured, wherever possible, access to a variety of goods, products or services at competitive prices;
(iv) the right to be heard and to be assured that consumer’s interests will receive due consideration at appropriate fora; (v) the right to seek redressal against unfair trade
practice or restrictive trade practices or unscrupulous exploitation of consumers; and (vi) the right to consumer awareness.”
84Guideline 4 of the Guidelines.
85Guideline 5 of the Guidelines.
86Guideline 2(i) of the Guidelines.
87Guideline 2(e) of the Guidelines.
88

255
posing themselves as health experts who are sharing
any information, promoting products or services, or
making health related claims must provide a disclaimer
at the time of such endorsements. Following are some
Guidelines:
• • The requirement of disclosure is necessary for
sharing information or making claims on topics
such as health advantages, relating to food
items and nutraceuticals, disease prevention,
treatment or cure, medical conditions, recovery
methodologies or immunity boosting, etc.
• • The disclaimer should state that their content
should not be seen as a substitute for professional
medical advice, diagnosis or treatment. Further,
encourage their audience to seek advice from
healthcare professionals before making any
medication routines.
• •
approaches on how to clearly communicate these
disclosures to the audience without altering the
overall creative presentation of their content.
products which they are promoting and must ensure
that they are in a position to substantiate the claims
made before endorsing a product or service. It also
provides a general exemption for sharing general
wellness and health advice such as stay hydrated, get
enough sleep, avoid excessive screen time, exercise
conditions are exempt from these regulations.
III. ASCI Guidelines for Inuencers
The Advertising Standards Council of India (“ASCI”) has
Digital Media89 (“Guidelines”) in August 2023.
who has access to an audience and the power to affect
their audiences’ purchasing decisions or opinions
about a product, service, brand or experience, because
or relationship with their audience. The Guidelines
characteristics, features and personalities of humans,
that may affect the weight or credibility of the
forms of compensation, free products with/ without
any condition to include those received unsolicited,
discounts, gifts, contest or sweepstake entries, trips/
hotel stays, etc. If such a material connection can be
established, then disclosures are required.
The Guidelines introduce disclosure requirements and
scenarios:
• •
connection (not limited to monetary compensation,
discounted/ free samples are also included)
display a disclosure label on their accounts which
irrespective of whether evaluation is unbiased or
• • Disclosures should be placed in a manner which are
hard to miss. The Guidelines further suggest that
in addition to the platform’s disclosure tools.
89Available at: https://www.ascionline.in/wp-content/uploads/2023/08/GUIDELINES-FOR-INFLUENCER-ADVERTISING-IN-DIGITAL-MEDIA.pdf (last accessed on February
20, 2024).

Media & entertainment
• • Advertisements such as Instagram stories or
Snapchat where the advertisement is 15 seconds
long or less, disclosures have to be at least on
screen for three seconds. For longer advertisement
videos up to two minutes, the disclosure should
remain for at least 1/3rd of the length of the
video. For advertisements which are longer than
two minutes, the disclosure should remain for the
entire duration of the video. For livestreams, the
disclosure must be announced at the beginning
and at the end of the broadcast. Similarly, for audio
media (such as podcasts), the disclosure must be
announced at the beginning and end of the audio,
and before and after every break taken in between.
• • Several labels have been recommended as
permitted disclosure labels such as “Ad”,
“Advertisement”, “Sponsored”, “Collaboration”
and “Partnership”, etc., along with the existing
disclosures tags on Instagram and YouTube.
• •
satisfy themselves that advertisers are in a
position to substantiate the claims made in the
advertisements.
• •
prominently disclose that its audience is not
interacting with a real human being.
• •
of Banking, Financial Services and Insurance
order to provide such information and advice to
providing advice in stocks and investments, IRDAI
insurance license, Chartered Accountant, Company
Secretary, etc.
• •
be having appropriate medical/ professional
training depending on the nature of advice being
provided by such medical professional. Further, the
videos (by prominently superimposing and upfront
remarks), blogs/ text-based posts (by stating
upfront before the audience reads the post) and
audio formats such as podcasts (by calling out at
the beginning of the advertising content).
IV. Endorsement “Know-Hows” for social
media inuencers
The Department of Consumer Affairs has released
a guide “Endorsement Know-Hows!” for celebrities,
requirements of disclosing material connection and
the due diligence requirement as provided in the
Guidelines for Prevention of Misleading Advertisements
and Endorsements for Misleading Advertisements,
2022(“Misleading Ads Guidelines”)90.
connection (includes monetary compensation, free or
discounted products, hotel stays, media barters, etc.)
with an advertiser which affects the weight or credibility
of the representation made. The guide provides how
such disclosures must be made. The disclosures need
to be simple and clear and in the same language as
endorsement. Terms such as “advertisement”, “ad”,
“sponsored”, “paid promotion” or “paid” is allowed to
signify endorsement.
obligation to conduct due diligence as provided for
in the Misleading Ads Guidelines. The guide does not
introduce any new obligations that are not present in
the Misleading Ads Guidelines. However, it provides
compliance.
90

257
V. Changes in the Criminal Law Regime
The Bhartiya Nayaya Sanhita, 2023 (“BNS”) is set
to replace the Indian Penal code, 1860 (“IPC”) after
more than 160 years of the latter’s existence. The BNS
received presidential assent on 25 December 2023 but
is yet to be enforced91. While most of the provisions of
the IPC have been retained, BNS has streamlined and
consolidated these provisions and their arrangement.
Some of the key considerations from a media and
entertainment perspective are as follows:
► There have been growing instances of virtual assault
including sexual assault reported over metaverse and
other virtual reality platforms, across jurisdictions92.
While the IPC provisions do not seem to apply to sexual
assault in the virtual context, the BNS has expanded
the provision on acts intended to outrage modesty
of women93. It has a wider scope as it includes any
is intended to insult modesty of a woman. This may
be interpreted to include acts intended to insult the
modesty of a woman even in virtual or digital spaces.
► The BNS has also expanded the provision on obscenity
to include display of obscene material in online form
through electronic mode94. This is currently overlapping
with the provisions under the IT Act.
► The offence of sedition has been deleted in the BNS.
Instead, the BNS has introduced an offence wherein
any act endangering sovereignty, unity and integrity
of India95 that includes any visible representation and
electronic communication among other means through
which such act can be committed. It remains to be seen
how broad the interpretation of this provision will be,
although the intent appears to be to dilute the erstwhile
offence of sedition which was alleged to be abused by
certain governments. The interpretation would have a
► The BNS has expressly included “electronic
communications” as a means through which certain
offences can be committed, such as acts endangering
sovereignty, unity and integrity of India, hate speech,
etc. This provides express language that such content in
online mode (whether on social media platforms, chats,
etc.) would also be covered within the scope of these
offences.
I. Existing laws
Given the increasing instances of deepfake content
in 2023, the Ministry of Electronics and Information
Technology has repeatedly reiterated its commitment to
addressing the concerns around deepfakes:
► On 21 February 2023, MeitY issued a letter to social
media platforms advising them to disable access to
the same by users. This is in line with Rule 3(2)(b) of the
Information Technology (Intermediary Guidelines and
Digital Media Ethics Code) Rules, 2021 (“IT Rules”)96.
► On 7 November 2023, MeitY issued an advisory97 to
social media platforms to exercise due diligence and
remove deepfakes content within 36 hours of reporting
by a government authority (this is separate from the
violation of privacy). The advisory further encouraged
the remedies under the Information Technology Act,
2000 (“IT Act”)98.
► On 26 December 2023, MeitY issued another advisory
requiring intermediaries to update their terms of service
and user agreements with the prohibitions (especially
around deepfakes) under Rule 3(1)(b) of the IT Rules
and periodically remind users of the same, including at
every instance of log-in and posting99.
► MeitY also held several meetings with intermediaries
deepfakes, prevention of their spread, strengthening
reporting mechanisms, and generating awareness.
Rules for reporting non-observance of the IT Rules100.
►
in November101102 the
regulator announced their plan to draft new regulations
address deepfakes. The expected amendment to the IT
liability and a mechanism for victims or those with
permitted the blocking of accounts of violators103.
Deepfakes regulation
91
92See https://www.thehindu.com/news/national/three-bills-to-replace-british-era-criminal-laws-get-presidents-assent/article67674266.ece#:~:text=President%20
Draupadi%20Murmu%20on%20December,cleared%20by%20Parliament%20last%20week (last accessed February 12, 2024).
93See https://www.forbes.com/sites/bernardmarr/2024/01/16/the-metaverse-and-its-dark-side-confronting-the-reality-of-virtual-rape/?sh=22605962b66b (last
accessed February 12, 2024).
94Section 79 of BNS.
95Section 294(1) of BNS.
96Section 152 of BNS.
97See https://economictimes.indiatimes.com/tech/technology/weed-out-deep-fakes-meity-tells-social-platforms/articleshow/98131043.cms?from=mdr (last accessed
on Feb 9, 2024)
98
while%20summing%20up (last accessed on Feb 9, 2024)
99See https://pib.gov.in/PressReleaseIframePage.aspx?PRID=1990542 (last accessed on Feb 9, 2024)
100See https://www.pib.gov.in/PressReleseDetail.aspx?PRID=1979506 (last accessed on Feb 9, 2024).
101See https://www.businesstoday.in/technology/news/story/ashwini-vaishnaw-on-deepfake-menace-govt-considering-penalties-on-both-creator-and-plat-
form-406830-2023-11-23 (last accessed on Feb 9, 2024)
102
103

Media & entertainment
II. Delhi High Court takes action against
deepfakes
On 20 September 2023, the Court in the case of Anil
Kapoor vs. Simply Life India and Ors.104 granted an
ex-parte injunction in favor of Anil Kapoor, a reputed
Bollywood actor, restraining the defendants, or anyone
acting on their behalf from inter alia misusing the
name, likeness, image, voice and other attributes of
Anil Kapoor’s persona to create any merchandise,
videos, photographs or other commercial purposes.
In this case, Anil Kapoor had sought reliefs for inter
alia violation of his personality rights and common
laws rights including passing off, dilution and unfair
competition. He had alleged that his name and persona
have immense commercial value and are liable to be
protected against misuse and tarnishment. The Court,
machine learning, deepfakes etc. to create photos,
videos etc., either for monetary gain or otherwise. This
of technology such as deepfakes.
Gowree Gokhale
Leader and Head to Technology,
Telecom, M&E practice
104CS(Comm) 652/2023 and I.A. 18237/2023-18243/2023
259

Media & entertainment
AI in M&E

261
AI can provide an INR450 billion boost to the Indian M&E sector by 2027
This section is based on a survey of M&E CXOs and independent research by EY
The M&E sector has always been an enthusiastic adopter of technology. AI – and especially Gen AI - gives it the tools
65%
M&E CXOs say their companies have initiated AI
projects or plan to within the next 12 months
45%
of M&E CXOs claim that CEOs are
driving the Gen AI agenda
65%
M&E CXOs believe that Gen AI would
help in revenue acceleration
85%
were looking at external technology
providers to enable implementation
90% 65% 60%
85%
believe that Gen AI would help
drive innovation, with the
biggest impact across
Content development Product development Customer experience
believe it would result
in job displacement
believe that Gen AI would
amplify existing workforce
potential as new
opportunities emerge
15% 70%
Gen AI was seen as
improving employee
productivity, not
replacing human
resources

Media & entertainment
Gen AI use cases across the M&E value chain
Value chain components Value chain components (continued) Ancillary services
Content creation Content acquisition Content distribution Content discovery and
user experience Monetization Support services* Advertising and sales
operations
►Storyboard creation
►Scene layout descriptions
►Virtual characters/ set design
► Background score composition
► Automatic editing/ special effects
►Automated video metadata analysis
and categorization
►Content licensing rights
management
►Dynamic video aggregation
based on trending topics, user
preferences, and real-time events
►Smart scheduling for platforms
►Content localization
►Personalized
recommendations
►Interactive video
branching based on
choices
►Dynamic ad insertion
►Dynamic pricing based
on viewer engagement
►Targeted
microtransactions
►Personalization of
subscription plans
►Chatbots for viewer
support
►Automated content
moderation
►Copyright infringement
detection
►Ad campaign
optimization and budget
allocation
►Personalized video ad
retargeting and cross-
platform advertising
►Real-time performance
analytics and reporting
►Personalized song generation/
►Automatic melody/ harmony
creation
►Real-time sound design
►Dynamic soundtracks for content
►Music composition assistance
(versions, treatments, vocal
alternatives)
►Automatic music summarization
►Automated artist ranking and
royalty pay-outs
►Customized promotion tools
►Personalized artist marketing
►Smart playlists based
on mood/ preferences/
genre
►Artist/ song
recommendation and
discovery
►“Ask me anything”
interactions around
artists and content
►Custom transactions for
personalized packages
►Dynamic pay-per-view
concerts
►Personalized subscription
tiers
►Text-to-podcast content
creation
►Copyright infringement
detection
►Automated music
metadata tagging
►Content moderation for
children
►Music ad campaigns and
artist endorsements
►Ad insertion within
playlists
►Real-time music
streaming analytics and
campaign performance
measurement
►Writing assistance/ auto
templatization
►Automated article generation
►Personalized news generation/
summaries
►Creative content formatting
►Style harmonization
►Topic led news feed aggregation,
automated content curation
►Dynamic headline generation,
article summarization
►Perspectives for different audiences
►Content translation
►Image generation from photo
libraries
►Infographic design
►Real-time news alerts
►Customized e-reader experiences
►Auto creation and formatting for
different media vehicles
►Smart algorithms for
personalized article
recommendation
►Multilingual content
discovery
►Summaries and curated
digital libraries
►Perspective-based search
►Image-based search
►Pay-per-article model
►microtransactions for
exclusive content
►Targeted advertising
based on reader
preferences
►Fact-checking tools
►Plagiarism detection
►Automated content
indexing/ tagging
►Content policy
compliance
►Print ad creation/ layouts
►Real-time campaign
analytics
►Contextual ad
placements
►Safe ad placement
►Level design and character creation
►Dynamic storylines, narrative arcs
and quests
►Procedural content/ world
generation
►AI-composed sound effects/ music
►AI-powered opponents and NPCs
►Automated game asset analysis and
categorization
►Automated digital assets creation
and model training
►Cloud-based gaming platforms
►Personalized game discovery tools
►Cross-platform game streaming
►Nuanced character skinning,
content translation, theme change
for multi-cultural appeal
►Personalized in-game
recommendations
►AI-powered level guides/
walkthroughs
►Automated leader boards
and achievements
►In-game
microtransactions for
virtual items/ skins
►Dynamic pricing based
on player engagement
►Personalized subscription
models
►Game balancing
►Automated bug
►Real-time support
chatbots
►Targeted in-game
and cross-platform
advertising
►Real-time player
behavior insights for
optimized ad campaigns
►Personalized commentary
►Automated highlights
►Virtual replays/ simulations
►Real-time performance analysis
►
►Dynamic content aggregation
based on popularity and real-time
trends
►Content highlights based on game
prediction models
►Interactive VR/ AR sports
experiences (play-along)
►Assistance in performance
prediction
►Dynamic camera angles
►Personalized sports
feeds based on favorite
teams/ players
►Automated fantasy
sports team
management stats for
users
►Microtransactions for
exclusive sports content/
highlights
►Dynamic pricing for live
sports events
►Personalized sponsorship
deals
►Sports injury prediction/
prevention
►Automated player
performance tracking
►Real-time intelligent
event delivery assistance
►Targeted sports ad
campaigns and athlete
endorsements
►Real-time sports
analytics and
campaign performance
measurement
Print/ textGaming VideoMusicSports

263
Value chain components Value chain components (continued) Ancillary services
Content creation Content acquisition Content distribution Content discovery and
user experience Monetization Support services* Advertising and sales
operations
►Storyboard creation
►Scene layout descriptions
►Virtual characters/ set design
► Background score composition
► Automatic editing/ special effects
►Automated video metadata analysis
and categorization
►Content licensing rights
management
►Dynamic video aggregation
based on trending topics, user
preferences, and real-time events
►Smart scheduling for platforms
►Content localization
►Personalized
recommendations
►Interactive video
branching based on
choices
►Dynamic ad insertion
►Dynamic pricing based
on viewer engagement
►Targeted
microtransactions
►Personalization of
subscription plans
►Chatbots for viewer
support
►Automated content
moderation
►Copyright infringement
detection
►Ad campaign
optimization and budget
allocation
►Personalized video ad
retargeting and cross-
platform advertising
►Real-time performance
analytics and reporting
►Personalized song generation/
►Automatic melody/ harmony
creation
►Real-time sound design
►Dynamic soundtracks for content
►Music composition assistance
(versions, treatments, vocal
alternatives)
►Automatic music summarization
►Automated artist ranking and
royalty pay-outs
►Customized promotion tools
►Personalized artist marketing
►Smart playlists based
on mood/ preferences/
genre
►Artist/ song
recommendation and
discovery
►“Ask me anything”
interactions around
artists and content
►Custom transactions for
personalized packages
►Dynamic pay-per-view
concerts
►Personalized subscription
tiers
►Text-to-podcast content
creation
►Copyright infringement
detection
►Automated music
metadata tagging
►Content moderation for
children
►Music ad campaigns and
artist endorsements
►Ad insertion within
playlists
►Real-time music
streaming analytics and
campaign performance
measurement
►Writing assistance/ auto
templatization
►Automated article generation
►Personalized news generation/
summaries
►Creative content formatting
►Style harmonization
►Topic led news feed aggregation,
automated content curation
►Dynamic headline generation,
article summarization
►Perspectives for different audiences
►Content translation
►Image generation from photo
libraries
►Infographic design
►Real-time news alerts
►Customized e-reader experiences
►Auto creation and formatting for
different media vehicles
►Smart algorithms for
personalized article
recommendation
►Multilingual content
discovery
►Summaries and curated
digital libraries
►Perspective-based search
►Image-based search
►Pay-per-article model
►microtransactions for
exclusive content
►Targeted advertising
based on reader
preferences
►Fact-checking tools
►Plagiarism detection
►Automated content
indexing/ tagging
►Content policy
compliance
►Print ad creation/ layouts
►Real-time campaign
analytics
►Contextual ad
placements
►Safe ad placement
►Level design and character creation
►Dynamic storylines, narrative arcs
and quests
►Procedural content/ world
generation
►AI-composed sound effects/ music
►AI-powered opponents and NPCs
►Automated game asset analysis and
categorization
►Automated digital assets creation
and model training
►Cloud-based gaming platforms
►Personalized game discovery tools
►Cross-platform game streaming
►Nuanced character skinning,
content translation, theme change
for multi-cultural appeal
►Personalized in-game
recommendations
►AI-powered level guides/
walkthroughs
►Automated leader boards
and achievements
►In-game
microtransactions for
virtual items/ skins
►Dynamic pricing based
on player engagement
►Personalized subscription
models
►Game balancing
►Automated bug
►Real-time support
chatbots
►Targeted in-game
and cross-platform
advertising
►Real-time player
behavior insights for
optimized ad campaigns
►Personalized commentary
►Automated highlights
►Virtual replays/ simulations
►Real-time performance analysis
►
►Dynamic content aggregation
based on popularity and real-time
trends
►Content highlights based on game
prediction models
►Interactive VR/ AR sports
experiences (play-along)
►Assistance in performance
prediction
►Dynamic camera angles
►Personalized sports
feeds based on favorite
teams/ players
►Automated fantasy
sports team
management stats for
users
►Microtransactions for
exclusive sports content/
highlights
►Dynamic pricing for live
sports events
►Personalized sponsorship
deals
►Sports injury prediction/
prevention
►Automated player
performance tracking
►Real-time intelligent
event delivery assistance
►Targeted sports ad
campaigns and athlete
endorsements
►Real-time sports
analytics and
campaign performance
measurement
Print/ textGaming VideoMusicSports

Media & entertainment
Value chain components Value chain components (continued) Ancillary services
Content creation Content acquisition Content distribution Content discovery and
user experience Monetization Support services* Advertising and sales
operations
►Personalized music/ lighting/
visuals for live shows
►Venue design
►Choreography ideation
►Virtual artists
►Audience interaction through AR/
VR
►Event planning/ logistics and
costing
►Virtual stage and services previews ►Live event streaming with
dynamic camera angles/ custom
commentary
►Virtual attendance experiences
►Personalized event
recommendations and
ticket suggestions
►
assistants for attendees
►Augmented reality
overlays and interactive
exhibits
►Dynamic pricing for live
events
►Virtual/ Physical
merchandise
►Targeted advertising
based on attendee
demographics
►Real-time crowd control/
security measures
►Real-time audience
sentiment analysis
►Personalized post-event
surveys/ feedback
►Dynamic insertion of
advertising during event
telecast
►Real-time audience
analytics and
engagement
measurement
►Concept art generation
►Automated storyboarding
►Real-time animatic creation
►AI-powered VFX asset libraries and
recommendation engine (assets,
tutorials, tools)
►Automated rights management and
licensing platforms
►Automated metadata tagging for
VFX resources
►Market analysis and pricing
►Predictive content delivery
►Scene curation and demo
for choice enablement
►VFX subscription model
recommendations and
delivery modules
►Performance-based
payments for VFX artists
►Quality control and bug
detection
►Real-time feedback and
review tools
►Automated task
scheduling, resource
allocation, etc.
►NA
►AI assisted content generation
►Editing/ collaboration
►Digital incentives for creators
►Content curation based on trend
analysis
►Automated licensing and rights
management solutions for creators
►Peer-to-peer content sharing
►Microtransactions for direct creator
support
►Language translation tools
►Personalized content
feeds based on user
preferences
►Potential viral content
►Personalized advertising
recommendations
►AI enabled/ brokered
brand partnerships
►Crowdfunding models
►Data privacy and security
►Automated royalty pay-
outs
►Targeted ad insertion
within UGC platforms
►Automated brand
collaborations and
campaigns
►Digital collaboration tools
►Content generation and asset
►Collaborative content creation
►Semantic search based on content
meaning and relationships
►Personalized recommendations for
creators using on-chain data and
user behavior
►AI optimized decentralized content
hosting platforms
►Peer-to-peer content networks for
commerce
►Personalized content
recommendations based
on on-chain data
►Immersive and
interactive discovery
experiences
►Tokenized access to
exclusive content/
communities
►AI run DAO-based
funding models for
creative projects
►AI driven on-chain
dispute resolution
mechanisms
►Assisted community
governance
►Targeted advertising
within virtual worlds
►AI created NFTs for
advertising
►AI enabled tokenized
reward systems
In-person entertainmentVFX
User generated
content (UGC)
Web 3.0

265
Value chain components Value chain components (continued) Ancillary services
Content creation Content acquisition Content distribution Content discovery and
user experience Monetization Support services* Advertising and sales
operations
►Personalized music/ lighting/
visuals for live shows
►Venue design
►Choreography ideation
►Virtual artists
►Audience interaction through AR/
VR
►Event planning/ logistics and
costing
►Virtual stage and services previews ►Live event streaming with
dynamic camera angles/ custom
commentary
►Virtual attendance experiences
►Personalized event
recommendations and
ticket suggestions
►
assistants for attendees
►Augmented reality
overlays and interactive
exhibits
►Dynamic pricing for live
events
►Virtual/ Physical
merchandise
►Targeted advertising
based on attendee
demographics
►Real-time crowd control/
security measures
►Real-time audience
sentiment analysis
►Personalized post-event
surveys/ feedback
►Dynamic insertion of
advertising during event
telecast
►Real-time audience
analytics and
engagement
measurement
►Concept art generation
►Automated storyboarding
►Real-time animatic creation
►AI-powered VFX asset libraries and
recommendation engine (assets,
tutorials, tools)
►Automated rights management and
licensing platforms
►Automated metadata tagging for
VFX resources
►Market analysis and pricing
►Predictive content delivery
►Scene curation and demo
for choice enablement
►VFX subscription model
recommendations and
delivery modules
►Performance-based
payments for VFX artists
►Quality control and bug
detection
►Real-time feedback and
review tools
►Automated task
scheduling, resource
allocation, etc.
►NA
►AI assisted content generation
►Editing/ collaboration
►Digital incentives for creators
►Content curation based on trend
analysis
►Automated licensing and rights
management solutions for creators
►Peer-to-peer content sharing
►Microtransactions for direct creator
support
►Language translation tools
►Personalized content
feeds based on user
preferences
►Potential viral content
►Personalized advertising
recommendations
►AI enabled/ brokered
brand partnerships
►Crowdfunding models
►Data privacy and security
►Automated royalty pay-
outs
►Targeted ad insertion
within UGC platforms
►Automated brand
collaborations and
campaigns
►Digital collaboration tools
►Content generation and asset
►Collaborative content creation
►Semantic search based on content
meaning and relationships
►Personalized recommendations for
creators using on-chain data and
user behavior
►AI optimized decentralized content
hosting platforms
►Peer-to-peer content networks for
commerce
►Personalized content
recommendations based
on on-chain data
►Immersive and
interactive discovery
experiences
►Tokenized access to
exclusive content/
communities
►AI run DAO-based
funding models for
creative projects
►AI driven on-chain
dispute resolution
mechanisms
►Assisted community
governance
►Targeted advertising
within virtual worlds
►AI created NFTs for
advertising
►AI enabled tokenized
reward systems
In-person entertainmentVFX
User generated
content (UGC)
Web 3.0

Expert
speak
‘’Content is the King’ is at the core of the M&E industry;
a revolution is in the offing that will herald a tsunami of
high-quality content, courtesy Gen AI!
Rajeev Batra
Bennett, Coleman & Co Ltd
We have seen tech disruptions for many decades but
the next three years will be pivotal. GenAI, VR/XR and
interactive/gaming content will make the most impact in
media.
Rajmohan Shrinivasan
Culver Max Entertainment
Data - and the way we leverage data - will become a key
driver of competitive advantage in the industry and will
help us create differentiated experiences for our users.
Nitin Mittal
ZEE Entertainment
Enterprises Ltd.
Gen AI is the biggest innovation for mankind after the
internet. The two focussed underlines for media industry
today, creativity and costs, would get benefitted by
application of its algorithms, enhancing workflow
efficiencies. Policies, practices and protocols to thwart
possible deep fakes and ill-effects is a responsibility
bestowed on technologists in media.
Rajat Nigam
Network18


Media & entertainment
Data privacy

269
►Now that India boasts a comprehensive data privacy
law, the Digital Personal Data Protection Act (DPDPA)
2023, M&E companies stand at the threshold of a new
compliance era. While the government is in the process
of rolling out rules to operationalize DPDPA, M&E
companies must grasp the impact and adapt swiftly to
the evolving landscape of data privacy
►Applicability of DPDPA:
• • DPDPA applies to processing digital personal data
in India, whether collected digitally or digitized
from non-digital formats
• • The DPDPA shall not apply to processing of
personal data in non-digitized form or personal
data not digitized in its lifetime
►M&E companies undertake intricate data collection
endeavors to craft personalized experiences. They
employ algorithms to examine the viewing behaviors
and preferences of consumers, enabling them to make
targeted decisions on how relevant content can be
delivered
►M&E companies, long accustomed to leveraging user
data to tailor experiences and drive engagement, now
with stringent data protection regulations becomes
paramount under the DPDPA. This implication is not just
limited to consumers’ data, but extends to employees,
third party partners, visitors, and any other individuals
they deal with
With new developments in regulations and the increasing proliferation of technology, privacy has attained a core position in the
media and entertainment sector. With the Digital Personal Data Protection Act (DPDPA), 2023 coming into force, companies
have had to swiftly adjust to its provisions. Concerns around individual privacy rights and the possible misuse of data have grown
with the growing prominence of AI-based technology. As consumer concerns about the safety of their personal information
continue to grow, the sector has to adapt and adjust strategies, while industry regulators have to devise ways to address them.
Navigating data privacy
Data privacy is applicable to any
digitized personal data with M&E
companies
The DPDPA impacts almost all
aspects of the M&E sector
Key privacy
requirements
Media & entertainment lifecycle
Produce
content Publish
content Advertising/
marketing Sale of
subscription Targetting Customer
engagement
Privacy notice Notice across websites, applications
prior collection of personal data
Notice in English and any of 22 Indian
languages
Provision for consumers to raise
complaints
Consent Consent to be obtained for
advertisement, etc.
Consent to be obtained for collection
of cookies for personalisation,
remarketing/ retargeting
Consent to be obtained for newsletters,
sending SMS, emails promotions
Children’s data
children’s data
Tracking or behavioral monitoring of children or targeted
advertising directed at children is prohibited
Legitimate uses
Only voluntarily provided personal data
will fall under legitimate use (for e.g.,
blogs, comments on articles, social
media posts)
Processing that falls under law or in the
interest of sovereignty and integrity of
India or security of the state
Processing that is carried out for
interviews, print digital news, political
opinions may not fall under legitimate
use and require consent
Data principal
rights Provision to erase, correct or provide access to the data
principals’ personal data
Provision for data principals to nominate someone else for
erase, correct or provide access to personal data
Cross border
data transfer
alternate service providers.

Media & entertainment
1 https://www.infosysbpm.com/blogs/media-entertainment/key-ways-ai-is-changing-the-entertainment-industry.html
M&E consumers are concerned
about data privacy
Data privacy has a signicant
interplay with AI
Concerns on usage of personal data by M&E companies
for targeting and segmenting audiences concern business
teams as they will now have to obtain consent from their
consumers if they would like to receive personalized
offerings.
EY conducted a recent survey, polling and interviewing
consumers about their concerns regarding companies’
usage of their personal data. The findings revealed a high
consumer concern regarding personalized offers.
The survey also indicated a significant correlation between
trust and the clear communication of data protection
practices.
It is essential, therefore, for M&E companies to prioritize
transparency, privacy, and effective communication to
establish trust with their customers.
7%
31%
61%
0% 20% 40% 60% 80%
Does not matter
I am comfortable if
I get personalized offers
Not comfortable at all
How comfortable are you with companies using
your personal data to personalize advertisements and
offers for you?
3%
29%
68%
0% 20% 40% 60% 80%
Not likely
Likely
Very likely
How likely are you to trust a company that clearly
communicates its data protection practices?
►From content creation to audience engagement, AI
technologies permeate every facet of the sector,
revolutionizing how content is produced, distributed,
and consumed
►It is not just about what you watch; it is about how
you interact. Chatbots powered by AI provide instant
support, while sentiment analysis tools keep a pulse on
audience trends and reactions
►Here are some examples of AI applications employed
by M&E companies1 that rely heavily on personal data
along with DPDPA’s impact and opportunities on the
integration of these AI applications:

271
2
AI applications Functionality Impact of DPDPA Opportunities for M&E companies
Content
recommendation
system
►Analyzes user behavior, preferences,
and historical data to curate
personalized content suggestions
►Frequently used by OTT platforms,
music apps, and reading apps for
user suggestions
►Demands clear user consent for
personalized suggestions
►M&E companies to ensure
their AI models do not process
personal data if user opts out of
personalization
►With growing privacy concerns
among users, M&E companies
can expand their clientele by
highlighting compliance with the
regulations
Predictive
analytics
►Predictive analytics algorithms
anticipate user preferences and
trends
►Frequently used by M&E companies
to make data-driven decisions for
upcoming releases or optimizing
content distribution strategies
►M&E companies to add all
purposes for which personal data
is collected and used (including for
AI models) in their Privacy Notice
►For e.g., In 2023, X (formerly
twitter) changed its privacy notice
to add use of personal data to
train AI models, thereby taking
consent from users for AI data
processing2
►Businesses can employ
anonymized datasets or publicly
available data sets without
strategy
AI-generated
synthetic voice
►Utilizes personal data, including voice
recordings and speech patterns, to
create lifelike synthetic voices for
various applications
►For e.g., Spotify’s new AI voice
translation feature translates select
podcasts into other languages, not
by speakers of that language, but in
synthetic AI voices that match the
original speaker’s style
►M&E companies integrating
third-party AI models as Data
Processors to ensure that their
Data Processors comply with
DPDPA
►M&E companies are obligated
to enter into a Data Processing
Agreement (DPA) to that effect
►Engage with Processors who
are DPDPA ready or comply
to Global Data protection
regulations to build trust
among customers and ensure
protection of their personal data
VFX ►Utilizes personal data such as actors’
facial expressions and movements
to enhance realism and immersion in
►For instance, in blockbuster movies
like Avengers: Endgame, VFX
technology seamlessly integrates
actors’ movements and facial
expressions to bring characters to life
►M&E companies must
deploy robust technical and
organizational measures to shield
personal data that is fed into AI
applications
►Build privacy by design
capabilities in the AI tools
to ensure personal data
is protected across the
lifecycle while processing is
carried out and leverage the
implementation of such controls
as marketing strategy
Gaming, AR,
and VR
►In gaming, AI powers conversationally
capable avatars and determines NPC
behavior and game progress based
on player decisions
►For instance, Apple’s Vision Pro
analyzes personal data such as facial
expressions or gestures to enhance
user experience
►Similarly, metaverse platforms
personal data from users to immerse
themselves in the virtual world
►M&E companies to establish
robust mechanisms for
parental consent within gaming
environments
►Companies to ensure their AI
models do not track or monitor
the personal data of children world
►Enable compliance and get a
market to target customers and
get them onboarded by building
trust

Media & entertainment
Imperatives for M&E companies
The vast potential of AI in revolutionizing the M&E sector
is undeniable, but must be tempered with a sense of
responsibility towards user privacy. M&E companies must
not only embrace innovation but also cultivate a culture
of accountability, ensuring that user trust remains at the
heart of every technological advancement, and should craft
a framework that strikes the perfect balance—a framework
that empowers innovation while ensuring the ethical use of
personal information in AI applications.
Immediate actions required to be taken include:
►With the DPDPA taking full effect, the M&E companies
need to proactively gain visibility into the personal data
they deal with along with all the internal and external
touchpoints irrespective of when the rules are released
►M&E companies already compliant with GDPR or
similar regulations can leverage their existing privacy
frameworks as a foundation; however, they must assess
the applicable processes that may not have come
under the scope of other regulations but will need to be
considered for DPDPA
►Companies who have complied with one or more global
privacy regulations should also recognize and comply
►As the rules of the DPDPA unfold, companies yet to
walk the data privacy path can proactively establish
a robust privacy framework. They can establish the
following practices:
• •
and mapping exercise to identify the personal data
touch points
• •
processing activities (ROPA) to keep track of data
• •
providing services/ processing personal data to
revisit the contractual clauses and establish a
strong third-party risk management program
• •
procedures in line with the obligations
• •
enhancing technologies to ensure sustenance of
compliance to ever evolving business that deals
with personal data
►With this future-forward approach, businesses can
remain one step ahead, establishing robust privacy
frameworks that respect customer personal data and
meet regulatory standards. Compliance is not just about
avoiding penalties; it is about leveraging privacy to drive
trust and business differentiation

273

Media & entertainment
Global M&E CEO survey

275
EY Global M&E CEO survey
Advertising sales, streaming
platforms and broadcast and cable
networks create the most optimal
business portfolio
Traditional linear broadcast and cable
network business remains under
considerable strain
In October 2023, Ernst & Young LLP (EY US) surveyed 150 US M&E board members, C-suite executives and their
direct reportees to gather insights into the current state of the industry and identify trends for the future.
consolidate, create new partnerships and streamline operations to permanently reduce expenses.
23.3% 22.7% 22.0%
Advertising sales
16.0% 10.7% 24.0%
Streaming platforms
16.0% 15.3% 9.3%
Broadcast and cable networks
n=150
What is the optimal media business portfolio today?
Most
important
Third most
important
Second most
important
91% Of M&E execs
say linear video will
keep declining yet
will remain a key part
of an optimal media
business mix for the
foreseeable future
One-third (33%)
of survey respondents
attribute the preference
for tailored services over
the traditional pay TV
bundle as the primary
driver for cord cutting
by consumers
52% of survey participants
say that the decline in this
segment will continue at a
rate consistent with
current trends
39% expect the
decline to accelerate

Media & entertainment
M&E executives are eager to meet
consumer demand for streaming
Advanced ad tech was identied as
the most important area for M&E
companies to invest in
93%
say that consumers appreciate the increased choice
D2C services offer
85%
believe that consumers value the ability to more
effectively manage their media and entertainment
budget
68%
say consumers want to access content through a
single platform
59%
note that DTC users would prefer an uncomplicated
process to change channels, much the way they can
when they watch linear TV
To maximize consumer value in three years’ time, which of
the following offerings will be most important to invest in?
74.7%
Advanced advertising technology
67.3%
Enhanced platform design (search/ user interface)
50.7%
Innovative service bundles (alliances/ partnerships)
44.0%
Industry solutions for streaming service aggregation
42.0%
Fresh programming (new content to the streaming site)
21.3%
Recommitting to traditional pay TV bundles
n=150
Percentage reflects selection among M&E
executives’ top three choices or similar

277
Content spend on streaming will
continue, despite protability issues
77%
54%
of M&E executives say they expect content outlays to
increase over the next three years
of M&E executives say that their inability to measure
Sports and reality content are most valued by consumers
What type of content/ intellectual property (IP)
is most valued by consumers today?
Percentage reflects selection among
M&E executives’ top three choices
72.7%
Sports
n=150
68.7%
Unscripted/ reality
58.7%
Original scripted
45.3%
News
36.7%
Children’s programming
18.0%
Library/ old favorites

Media & entertainment
Expect more consolidation
68%
expect that only one of today’s M&E conglomerates
will remain as a stand-alone company in three years’
time; the other 32% do not expect any of them to
remain independent
97%
of M&E leaders say that mergers completed over
the acquiring companies, mainly their competitive
positioning and streaming capability
93%
business portfolio to focus on their core strategy, or
plan to do so in the next 12 months
Mixed feelings about the vast
opportunities and ethical stakes
from AI and Gen AI do not rock
industry prospects
83%
say their companies have initiated AI projects or plan
to within the next 12 months
69%
of all respondents expect that Gen AI will accelerate
the process of content creation, from research to
ideation to scripting
65%
expect that Gen AI will improve the customer experience
through intelligently automated assistants, voice
recognition and elevated customer query handling
53%
believe that Gen AI will improve content quality
51%
believe Gen AI will drive audience engagement
at scale

279

Media & entertainment
About this
report

281

Media & entertainment
Glossary
1P First party
20XX Calendar year 20XX
20XXE Estimate for calendar year 20XX
2D Two dimensional
3D Three dimensional
4G 4th generation mobile network
4K 4,000 pixels
5G 5th generation mobile network
8K 8,000 pixels
ABP Ananda Bazar Patrika
ACR Automatic content recognition
Ad Advertising
AdEX Advertising expenditure
AFP Advertising funded production
AGR Adjusted gross revenue
AIGF All India Gaming Federation
AIPA ATF IP Accelerator
AIR All India Radio
BARC
ANA Association of National Advertisers
Anr Another
App Application
AR Augmented reality
ARPU Average revenue per user
ASCI Advertising Standards Council of India
ATF Asia TV Forum
ATL Above the line, or media spends
ATP Average ticket price
ATS Average time spent
Auto Automobile
Avg Average
AVGC Animation, Visual effects, Gaming and
Comics
AVOD Advertising video on demand
B2B Business-to-business
BARC Broadcast Audience Research Council
BCCI Board of Control for Cricket in India
BGMI Battlegrounds Mobile India
BI Broadcast India survey
BMS BookMyShow
Bn Billion
BNS The Bhartiya Nayaya Sanhita, 2023
BTL Below the line or event spends
CAGR Compounded annual growth rate
CBDT Central Board of Direct Taxes
CCPA Central Consumer Protection Authority
CDP Customer data platform
CGI Computer generated images
CGOOH Computer generated out-of-home
CGST Central Goods and Services Tax
CMoSPI Central Ministry of Statistics and
Programme Implementation
COPPA Children’s Online Privacy Protection Act
COVID Coronavirus disease
CPM Cost per mille (thousand)
CPRP Cost per rating point
CPT Cost per thousand
CRM Customer relationship management
Crore Ten million
Crypto Cryptocurrency
CTV Connected TV or Smart TV
cume cumulative audience
CWC Cricket World Cup
CX Customer experience
D2C or DTC Direct-to-customer
D2M Direct-to-mobile
DAS Digital Addressable System
DAU Daily active users
DAVP Directorate of Advertising and Visual
Publicity
DB Corp Dainik Bhaskar Corporation
DD Doordarshan
DG Diesel Generator
DNPA Digital News Publishers Association
DOOH Digital out-of-home
DOT Department of Telecommunications
DPA Data Processing Agreement
DPCGC Digital Publisher Content Grievances
Council
DPDPA Digital Personal Data Protection Act
DPIIT Department for Promotion of Industry and
Internal Trade
DPOs Distribution platform operators
DSP Demand side platform
DTH Direct to home satellite television
EBITDA Earnings before interest tax depreciation
and amortisation
E-commerce Electronic commerce
ED Enforcement Directorate
EEMA Events & Entertainment Management
Association
E-gaming Electronic gaming
E-Invoicing Electronic invoicing
EMDEs Emerging Markets and Developing
Economies
EPG Electronic program guide
ER Effective rate
ETR Effective tax rate
Euro Area Europe
EV Electronic vehicle
EY Ernst & Young LLP, India
EYG Ernst & Young Global
F&B Food & Beverage
FAST Free ad-supported streaming TV
FC Football club

283
FCT Free commercial time, or ad inventory
FDI Foreign direct investment
FICCI Federation of Indian Chambers of
Commerce & Industry
FIFA Fédération Internationale de Football
Association
Fintech Financial technology
FIR First information report
FM Frequency modulation
FMCG Fast moving consumer goods
FS Financial services
FTA Free to air
FTII Film and Television Institute of India
FY Fiscal year (April to March)
G20 Group of 20 Countries
GB, gb Gigabyte
GDP Gross domestic product
GDPR General Data Protection Regulation
GEC General entertainment channel
Gen AI Generative AI
GenX Individuals born between early to mid
1960s and late 1970s or early 1980s
GenZ Individuals born between late 1990s and
early 2010s
GGR Gross gaming revenue
GIFT Gujarat International Finance Tec-City
GLoBE Global Anti-Base Erosion
GMPCS Global Mobile Personal Communication
Services
GOI Government of India
GPT Generative Pre-trained Transformer
GR Gross revenue
GSM Grams per square meter
GST Goods and Services Tax
GSTR Goods and Services Tax Return
HC High Court
HITS Headend in the sky
HSM Hindi speaking markets
HSN Harmonized system of nomenclature
IAP In-app purchase
ICC International Cricket Council
ICEA India Cellular & Electronics Association
IFPI International Federation of the
Phonographic Industry
IGST Integrated goods and service tax
IMDb The Internet Movie Database
IMF International Monetary Fund
IMI Indian Music Industry
guidelines
INR Indian Rupees (US$1 = INR83)
IOAA Indian Outdoor Advertising Association
iOS iPhone operating system
IP Intellectual Property
IPC Indian Penal Code,1860
IPL Indian Premier League
IPLC International Private Leased Circuit
IPR, or IP Intellectual property rights
IPRS Indian Performing Rights Society
IRDAI Insurance Regulatory and Development
Authority of India
IRS Indian Readership Survey
ISD Input service distributor
ISL Indian Super League
ISP Internet service provider
IT Information technology
K thousand
KPI Key performance indicator
KYC Know your customer
Lakh A hundred thousand
LAM Large action models
LCO Local Cable Operators
LED Light emitting diode
LLP Limited liability partnership
Ltd Limited
M&A Mergers and acquisitions
M&E Media and entertainment
Martech Marketing technology
MAU Monthly active users
Mbps Megabits per second
MCN Multi-channel network
MEITY The Ministry of Electronics and
Information Technology
MENA Middle East and North Africa
MF Male and female
MFA Made for advertising
MIB Ministry of Information & Broadcasting
MICE Meetings, incentives, conferences and
exhibitions
Millennials Individuals born between early 1980s and
mid to late 1990s
Min or Mins Minutes
MIP TV Marché International des Programmes de
Télévision
MIPCOM Marché International des Programmes de
Communication
ML Machine learning
MMX MultiMedia eXtensions
Mn Million
MNE Multinational enterprise
MoSPI The Ministry of Statistics and Programme
Implementation
MPEG2/ MPEG4 Encoding technologies
MPL Mobile Premier League
MSO Multi-system operator
NA Not applicable/ Not available
NAS National Accounts Statistic
Additional Guidelines for celebrities,
Ministry of consumer affairs
Media & entertainment
NCT National capital territory
NDA National Democratic Alliance
NFDC National Film Development Corporation
NFT Non-fungible tokens
NGO Non governmental organisation
NMACC Nita Mukesh Ambani Cultural Centre
NPC Non-player character
NTO New Tariff Order
OGI Online gaming intermediaries
OIDAR Online Information Database Access and
Retrieval
OMG Online money gaming
ONDC Open Network for Digital Commerce
OOH Out of Home
Ors Others
OS Operating system
OTT Over the top
PAN Permanent account number
PC Personal computer
PDOOH Programmatic DOOH
PE Permanent establishment or Private equity
PIL Public interest litigation
PKL Pro Kabaddi League
PMRTS Public mobile radio trunk service
PORMG Permissible online real money game
POV Point of view
PPP Purchasing price parity
PVR Priya Village Roadshow
QPE Qualifying production expenditure
QR Quick response
RBI Reserve Bank of India
RCS Rich communication services
RMG Real money games
RoAS Return on ad spend
RoI Return on investment
RPG Role playing game
SAG-AFTRA Screen Actors Guild-American Federation
of Television and Radio Artists
SEBI Securities and Exchange Board of India
SEC Socio Economic Category
SEO Search engine optimization
SGST State Goods and Services Tax
SIE Sony Interactive Entertainment
SMB Small and medium businesses
SME Small and medium enterprises
SMS Short message service or Subscriber
management system
SRB Self-regulatory bodies
STB Set-top box
SVOD Subscription video on demand
T20 Twenty20
TAM Television audience measurement or Total
addressable market
TDS Tax deducted at source
TDSAT Telecom Disputes Settlement Appellate
Tribunal
Tech Technology
Telco Telecommunications company
TRAI Telecom Regulatory Authority of India
TV Television
TVOD Transaction video on demand
UA Unrestricted with caution
UGC User-generated content
UK United Kingdom
UR Urban and rural
US$ United States Dollar (US$1 = INR83)
US/USA United States of America
UT Union territory
UX User experience
VC Virtual currency or Venture capital
VDA Virtual digital assets
VFX Visual effects
VIP Very important person
VoD Video on demand
VR Virtual reality
Vs. Versus
V-Sat Very small aperture terminal
Web Website
Web3.0 Third generation of internet services for
websites and applications
WGA Writers Guild of America
WHT Withholding tax
WPL Women Premier League
Y-O-Y Year on year
YRF Yash Raj Films
285

Media & entertainment
Acknowledgements
Industry insights
Milind Shinde
88 Pictures
Dhruba Mukherjee
Neelendra Nath Goswami
ABP
Ananta Das
Sonia Huria
Amazon Prime Video
Anshita Bhatt
Binita Das
Mishaal Wanvari
Neha Singhal Mehta
Prerna Kothari
AnimationXpress.com
Rafiq Ganjee
Subrata Kumar Chand
BARC
Raghu Khanna
CashurDrive
Bhanu Ganji
Rajkumar Akella
Visakh Vijayakumar
Comscore
Eugenia Teo
Hamy Phan
data.ai
Nupur Shukla
Deluxe Entertainment
Amrutha Nair
Anirban Paul
Disney
Manish Singhal
Enterr10
Ali Hussain
Eros
Sanjay Gupta
Google
RK Gupta
Graphisad
Rajiv Chilaka
Green Gold Animation
Gaurav Vazrirani
GroupM ESP
Rochak Langer
Indian Super League
Shiva
Jetsynthesys
Saurabh Sancheti
Jio Platforms
Varun Gupta
Max Studio
Amit Relan
Dheeraj Gupta
Tarun Bansal
mFilterit
L Sundararaman
Moving Walls
Hoshedar Gunevia
Mumbai Indians
Sudhir Kamath
Nazara
Serena Menon
Sweta Poojari
Netflix
Aniruddha Majumdar
Aparna Gaur
Karishma Karthik
Rhythm Vijayvargiya
Shubham Dhamelia
Tanisha Khanna
Nishith Desai Associates
Rikts Doshi
NODWIN
Keerat Grewal
Mahikaa Chhibber
Sanket Kulkarni
Shailesh Kapoor
Ormax Media
Prabhvir Singh
Brigitte Slattery
Samsing Ads
Shailesh Lakhani
Sequoia
Sandip Pradhan
Sports Authority of India
Vasundhara Mudgil
Spotify
Mandeep Malhotra
Srishti Media
Anshu Yardi
Dinesh Sharma
TAM
Alok Katariya
Ranjit Kate
Sameer Sainani
Sharath Chandra
Times Group
Ajay
Travel2Films
Ami Mehta
Ashish Malushte
UFO Movies
Karan Kapoor
US Advertising
Prattyush Kumar Nag
Sagar NN
Samir Vora
Siddhartha Sanapathi
Sunil Mohapatra
VerSe Innovation
Hursh Shrivastava
K Aravamudhan
Mallika Petkar
Uday Shankar
Viacom18
Viren Patil
Zebu Animation Studios

287
Yash Maheshwari
Data management
Adarsh Chheda
Chhavi Gupta
Quality & editorial
Shobhana Iyer
Shweta Sharma
Vikram D Choudhury
Design
Rachita Gupta
Snigdha Aggarwal
Tania Dutta
Tobit Pinto
AI video
Nilanjan Das
Puneet Nayak
Salil Kumar
Vibhor Gandotra
Vivek Malhotra
AI images
midjourney.com
Data collation, interviews
and analysis
Aaron Rodricks
Amrut Mudgall
Anu Goyal
Arnav Khanna
Ashley Tuscano
Ashwini Kothawade
Asma Maredia
Asmita Mahale
Ateesh Khanna
Bhumika Punjabi
Deep Sangoi
Devanshu Tiwari
Divya Harwani
Fiona Fernandes
Gandhar Desai
Gaurav Rane
Harshit Sharma
Kunal Bhati
Mahboob Alam
Meher Tawadia
Mihir M Date
Navya Areyada
Oommen Varghese
Pragya Shrivastava
Priyanka Minawala
Rina Karani Shah
Rhythm Gupta
Sandeep Gupta
Saurav Mehra
Shraddha Rai
Shrikant Gosavi
Siddhartha Banerjee
Sonika Pruthi
Tarrung Kapur
Vikas Mathur
Vikas Yadav
Vipul Ubale
Vismay Tolia

Media & entertainment
Atul Mehta
Transaction Diligence
atul.mehta@in.ey.com
EY M&E leadership team
Sector is the cornerstone of EY’s approach to
focus area. EY’s M&E practice has more than 400
professionals in India across 13 key segments who
focus on various issues and challenges the sector
faces. We provide services to many of the country’s
leading M&E companies as well as to global media
giants operating in the country. We have developed a
wide range of services, such as entry strategy, private
equity placement, due diligence, direct to customer, IT
security review, organization structure, performance
improvement and tax structuring, to name a few. This
has enabled us to establish a strong presence in each
segment of the industry.
As your advisors, we can help you respond quickly and
effectively to the challenges the entertainment sector
faces today.
Building a
better
working
world
Kaushal H Shah
Transaction Advisory
kaushal.shah@in.ey.com
Ajay Shah
Transaction Advisory
ajay.shah@in.ey.com
Priyanka Minawala
Direct Tax Advisory
priyanka.minawala@in.ey.com
Sachin Shah
Direct Tax Advisory
sachin.shah@in.ey.com
Rakesh Jariwala
Direct Tax Advisory
rakesh.jariwala@in.ey.com
Pratik Sampat
Indirect Tax
pratik.sampat@in.ey.com
Ashish Pherwani
Consulting
ashish.pherwani@in.ey.com
Uday Pimprikar
Indirect Tax
uday.pimprikar@in.ey.com

289
Mukul Shrivastava
Forensics
mukul.shrivastava@in.ey.com
Amiya Swarup
Marketing & Advertising Advisory
amiya.swarup@in.ey.com
Saakshi Kishnani
Event Risk Management
saakshi.kishnani@in.ey.com
Vikas Mathur
Internal audit and Distribution assurance
vikas.mathur@in.ey.com
Shubh Mittal
Media tech
shubh.mittal@in.ey.com
Kabiir Khattar
Marketing
kabiir.khattar@in.ey.com
Govind Ahuja
Assurance
govind.ahuja@in.ey.com
Jay Sampat
Business Development
jay.sampat@in.ey.com
Mini Gupta
Cyber Security & Privacy
mini.gupta@in.ey.com
Parag Mehta
Business & Library Valuation
parag.mehta@in.ey.com
Bhavesh Laddha
Content Production Audit
bhavesh.laddha@in.ey.com
Raghav Anand
Digital Media
raghav.anand@in.ey.com
Rohit Pandharkar
rohit.pandharkar@in.ey.com
Manish Madan
M&E Shared Services
manish.madan@in.ey.com

Media & entertainment
Methodology
Disclaimer
This report has been developed by conducting primary and
secondary research, discussions with several companies and
industry stakeholders, and cross referencing of available data
and validated. However, there can be no guarantee that
such information is correct as of the date it is received or
that it will continue to be correct in the future. EY does not
take any responsibility for the veracity of the underlying
data. Use of this report is at the discretion of the reader, and
neither FICCI nor EY take any responsibility for the same in
any manner. Please obtain professional guidance prior to
using the information provided in this report for any decision
making. There is no tax, operating, regulatory or other
business advice or opinion provided in this report. By reading
this report, the reader shall be deemed to have accepted the
terms and conditions of use mentioned in this paragraph.
Despite our best efforts, errors do creep into this report,
which we correct when brought to our notice. Please do use
the latest updated version from our website.
Key assumptions used to size the
segments of this report:
►Sizing of various segments has been arrived at
using various sources of data, primary research and
proprietary EY research. We have tried to then validate
the sizing through industry discussions
►All INR amounts are gross of taxes, except where
stated. Changes in GST rates have been factored into
the relevant segments
►Sales between any two segments of the M&E sector
are included as revenues for the segment providing
the service. Content production has not been
independently sized as it is assumed to be a part of the
segment it serves
►Digital subscription and TV distribution revenues are
considered at end customer prices. Content purchased
by telcos and ISPs has been valued under subscription
incomes of media companies and not at end customer
prices of bundled data packs
►Digital ad and subscription revenues are not released by
most companies and are hence sized based on industry
discussions and correlated to media articles and
analyst reports. They should be used from a trending
perspective only. Ad revenues are grossed up at 18%

291
►International ad and subscription revenues of TV
broadcasting companies have not been included in
sizing the television segment
►Gaming captures only online games of skill and no other
forms of gaming like betting and gambling. Where GST
burden has been absorbed, the same has been netted
off from gross revenues, where data was available
►Filmed entertainment segment does not include any
revenues from food and beverage operations, parking
revenues, retail revenues or any ticketing charges
is considered at end customer price, for both domestic
and international theatricals, the latter being impacted
►OOH does not consider the large unorganized billboard,
wall-painting, ambient media and retail point of sale
markets
►The live events segment does not consider value
of media rights (unless the IP is owned by the
event company), the large unorganized sector,
cash transactions if any, and pure MICE and travel
companies. Events carried out by other segments are
included in the revenues of those segments
►Animation, VFX and post-production revenues include
those earned from domestic and export services by
companies in India and are correlated to averages
across the content value chain
►No hardware sales are included where bundled with
content. Value of sporting goods is not included in the
sports segment
►Where alternate sources of sizing exist, we have
considered the most conservative, unless there is
►Forward estimates assume that there will be no further
pandemic-related lockdowns, geo-political issues or
major restrictions
►There are several statements in this report which refer
to certain media companies. Where sources for these
these statements have been sourced from news articles
available in the public domain
►Prior year numbers have been updated where estimates
►Forward estimates have been provided on best effort
realities and unforeseen events
►Content production estimates are based on publicly
available information and other information available
with EY’s production audit team. The section uses
extrapolations and assumptions
►Analysis of deals and content production is based on
secondary research and may not be complete

About FICCI
Established in 1927, FICCI is the largest and
oldest apex business organisation in India. Its
history is closely interwoven with India's struggle
for independence, its industrialization, and its
emergence as one of the most rapidly growing
global economies.
A non-government, not-for-profit organisation,
FICCI is the voice of India's business and
industry. From influencing policy to encouraging
debate, engaging with policy makers and civil
society, FICCI articulates the views and concerns
of industry. It serves its members from the
Indian private and public corporate sectors and
multinational companies, drawing its strength
from diverse regional chambers of commerce
and industry across states, reaching out to over
2,50,000 companies.
FICCI provides a platform for networking and
consensus building within and across sectors
and is the first port of call for Indian industry,
policy makers and the international business
community.
ey.com/en_in
EY India
@EY_India EY EY Careers India @ey_indiacareers
EY exists to build a better working world, helping to create long-
term value for clients, people and society and build trust in the
capital markets.
Enabled by data and technology, diverse EY teams in over 150
countries provide trust through assurance and help clients grow,
transform and operate.
Working across assurance, consulting, law, strategy, tax and
transactions, EY teams ask better questions to find new answers
for the complex issues facing our world today.
EY refers to the global organization, and may refer to one or more, of
the member firms of Ernst & Young Global Limited, each of which is
a separate legal entity. Ernst & Young Global Limited, a UK company
limited by guarantee, does not provide services to clients. Information
about how EY collects and uses personal data and a description of the
rights individuals have under data protection legislation are available via
ey.com/privacy. EYG member firms do not practice law where prohibited
by local laws. For more information about our organization, please visit
ey.com.
Ernst & Young LLP is one of the Indian client serving member
firms of EYGM Limited. For more information about our
organization, please visit www.ey.com/en_in.
Ernst & Young LLP is a Limited Liability Partnership, registered
under the Limited Liability Partnership Act, 2008 in India,
having its registered office at Ground Floor, Plot No. 67,
Institutional Area, Sector - 44, Gurugram, Haryana - 122 003,
India.
© 2024 Ernst & Young LLP. Published in India.
All Rights Reserved.
EYIN2403-004
ED None
This publication contains information in summary form and is
therefore intended for general guidance only. It is not intended
to be a substitute for detailed research or the exercise of
professional judgment. Neither EYGM Limited nor any other
member of the global Ernst & Young organization can accept
any responsibility for loss occasioned to any person acting
or refraining from action as a result of any material in this
publication. On any specific matter, reference should be made to
the appropriate advisor.
RG
Ernst & Young LLP
EY | Building a better working world