An Analysis of the Operational Costs of Trucking: 2024 Update PDF Free Download
1 / 62/62
100%

An Analysis of the Operational
Costs of Trucking: 2024 Update
June 2024
(770) 432-0628
ATRI@Trucking.org
TruckingResearch.org
Atlanta, GA • Minneapolis, MN • Washington, DC • Sacramento, CA

An Analysis of the Operational Costs of
Trucking: 2024 Update
June 2024
Alex Leslie, Ph.D.
Senior Research Associate
American Transportation Research Institute
Minneapolis, MN
Dan Murray
Senior Vice President
American Transportation Research Institute
Minneapolis, MN
Atlanta, GA • Minneapolis, MN • Washington, DC • Sacramento, CA
TruckingResearch.org

ATRI BOARD OF DIRECTORS
Derek Leathers
Chairman of the ATRI Board
Chairman and CEO
Werner Enterprises
Andrew Boyle
Co-President
Boyle Transportation
Jim Burg
President
James Burg Trucking
Hugh Ekberg
President and CEO
CRST International, Inc.
Robert E. Low
President and Founder
Prime Inc.
Benjamin J. McLean
CEO
Ruan Transportation
Management Systems
Brett Merritt
President, Engine Business
Cummins Inc.
Brenda Neville, CAE
President and CEO
Iowa Motor Truck Association
Lou Rivieccio
President, Corporate
Transportation
UPS
John A. Smith
President and CEO, U.S. and
Canada Ground Operations
FedEx Express
Harold Sumerford, Jr.
CEO
J&M Tank Lines, Inc.
Rebecca Brewster
President and COO
ATRI
Chris Spear
President and CEO
American Trucking Associations

ATRI RESEARCH ADVISORY COMMITTEE
Ben Banks, RAC Chairman
Vice President, Operations
TCW, Inc.
Colin Abernathy
Director of Performance and
Analytics
Groendyke Transport, Inc.
Brent Allred
Transportation Practice Leader
and Managing Director
Higginbotham Transportation
Services
Renee Bowen
Principal
Franklin & Prokopik, P.C.
Tony Bradley
President and CEO
Arizona Trucking Association
Michael Bray
Chief Commercial Officer
Platform Science
Joyce Brenny
President and CEO
Brenny Transportation, Inc.
Bree Bryant
Vice President of Safety
Eagle Transport Corp.
Mark Colson
President and CEO
Alabama Trucking Association
Mark Doughty
President and CEO
PrePass Safety Alliance
Steve Fields
Professional Driver and
America’s Road Team Captain
Wal-Mart
John Hahn
Captain
Colorado State Patrol
Evangelos Kaiser
Director, Freight Mobility
Research Institute
Florida Atlantic University
Jackie Kelly
Senior Federal Affairs
Representative
FedEx Corp.
Mike Ludwick
Chief Administrative Officer
Bison Transport
Ken Marko
Fleet Sustainability Senior
Manager
US Foods
Bob Meyer
Vice President of
Transportation
UPS
Andrew Mills
Vice President of Operations
TrueNorth Companies
Andrew Owens
CEO – Manager
A&M Transport
Andrew Petrofsky
Vice President
J&M Tank Lines
Jose Samperio
Vice President and General
Manager – North America On-
Highway
Cummins Inc.
Jon Samson
Executive Director, Agricultural
and Food Transporters
Conference
American Trucking
Associations
Amanda Schuier
Strategic Maintenance Director
Jetco Delivery
Kimberly Skelton
Senior Manager, Consumer
Insights
Pilot Flying J
Glissel Soliz
Director, Transportation
Operations & 3PL
Coca-Cola North America
Mike Stapleton
Vice President of Industry
Relations
ISAAC Instruments
Kerry Stritt
Vice President Fleet Services
Southeastern Freight Lines
Daniel Studdard
Principal Planner,
Transportation Access and
Mobility Division
Atlanta Regional Commission
Heather Sykes
Director of the Office of Supply
Chain, Professional, &
Business Services
U.S. Department of Commerce
International Trade
Administration
Gregg Troian
President
PGT Trucking
Stephen Truono
EVP and Chief Risk Officer
NFI Industries
Connie Vaughan
Manager, Government
Relations
McKee Foods
Tom Weakley
Director of Operations
Owner-Operator Independent
Drivers Association Foundation

2 An Analysis of the Operational Costs of Trucking: 2024 Update
TABLE OF CONTENTS
LIST OF FIGURES .................................................................................................................... 3
LIST OF TABLES ...................................................................................................................... 3
ACRONYMS .............................................................................................................................. 4
INTRODUCTION ....................................................................................................................... 5
METHODOLOGY ...................................................................................................................... 6
RESPONDENT DEMOGRPAHICS ............................................................................................ 8
Size of Operations ........................................................................................................ 8
Type of Operations ....................................................................................................... 9
Equipment ....................................................................................................................10
Alternative Fuels ......................................................................................................... 11
FINDINGS .................................................................................................................................12
Sector Costs ................................................................................................................15
Costs by Region ..........................................................................................................16
Looking Ahead: Q1 2024 Costs ..................................................................................17
Line-Item Analyses ......................................................................................................17
Driver Compensation Costs ...............................................................................17
Fuel Costs..........................................................................................................25
Equipment Costs................................................................................................28
Truck Insurance .................................................................................................34
Other Marginal Costs .........................................................................................37
Efficiency .....................................................................................................................38
Deadhead Mileage .............................................................................................38
Dwell Time .........................................................................................................38
Fuel Economy and Speed Governors ................................................................39
Truck, Driver, and Employee Utilization ..............................................................40
Turnover ............................................................................................................41
Mileage between Breakdowns and In-House Servicing ......................................44
Industry Capacity ...............................................................................................45
Revenue and Operating Margins ................................................................................45
CONCLUSION ..........................................................................................................................49
APPENDIX: Operational Costs Data Collection Form ..........................................................51

An Analysis of the Operational Costs of Trucking: 2024 Update 3
LIST OF FIGURES
Figure 1: Respondent Fleet Size ............................................................................................. 8
Figure 2: Respondent Revenue............................................................................................... 9
Figure 3: Daily Mileage Driven, 2023 .....................................................................................10
Figure 4: Driver Wages per Mile by Fleet Sector and Size ...................................................18
Figure 5: Driver Benefits per Mile by Fleet Sector and Size .................................................20
Figure 6: Truckload Driver Wages and Benefits per Mile by Fleet Size ...............................21
Figure 7: Specialized Carrier Driver Wages and Benefits per Mile by Fleet Size ................21
Figure 8: Truck Transportation Industry Employment (Millions) .........................................25
Figure 9: Monthly U.S. On-Highway Diesel Prices, 2019-2024 .............................................26
Figure 10: Fuel Costs per Mile by Fleet Sector and Size ......................................................27
Figure 11: J.D. Power Average Used Class 8 Sleeper Price .................................................28
Figure 12: Wards Intelligence New Class 8 Sales .................................................................29
Figure 13: Truck & Trailer Lease or Purchase Costs per Mile by Fleet Sector and Size ....30
Figure 14: Repair and Maintenance Costs per Mile by Fleet Sector and Size ....................31
Figure 15: Tire Costs per Mile by Fleet Sector and Size .......................................................33
Figure 16: Commercial Auto Insurance Premium Costs per Mile by Fleet Sector and Size
..........................................................................................................................................35
Figure 17: Auto Insurance Out-of-Pocket and Premium Costs per Mile by Fleet Size .......36
Figure 18: Dwell Time per Stop by Sector (Hours) ...............................................................39
Figure 19: Average Annualized Driver Turnover Rate by Fleet Sector and Size .................42
Figure 20: Impact of Driver Compensation on Driver Turnover ...........................................43
Figure 21: Impact of Truck Annual Mileage on Driver Turnover ..........................................44
Figure 22: Average Respondent Annual Revenue per Truck by Sector, 2022-2023 ............46
Figure 23: Average Operating Margin by Fleet Size, 2021-2023 ...........................................47
Figure 24: Average Respondent Revenue, Costs, and Profit per Mile ................................48
LIST OF TABLES
Table 1: Cost Centers and Corroborating Sources ................................................................ 6
Table 2: For-Hire Industry Sector Breakout by Employment ................................................ 7
Table 3: Respondent Trip Lengths, 2018 to 2023 ................................................................... 9
Table 4: Respondent Truck IFTA Miles and National Truck Mileage by Region ..................10
Table 5: Respondent Equipment Characteristics ................................................................. 11
Table 6: Respondent Equipment Trade Cycle ....................................................................... 11
Table 7: Use of Alternative Fuel Truck-Tractors ....................................................................12
Table 8: Average Marginal Costs per Mile, 2014-2023 ..........................................................13
Table 9: Average Marginal Costs per Hour, 2014-2023 .........................................................14
Table 10: 2022-2023 Annual Change in Average Costs per Mile ..........................................15
Table 11: Average Total Marginal Costs by Sector, 2014-2023 .............................................15
Table 12: Average Total Marginal Costs Excluding Fuel by Sector, 2016-2023 ...................16
Table 13: Average Marginal Cost per Mile by Region, 2023 .................................................16
Table 14: Change in Costs per Mile, Q1 2024 over 2023 .......................................................17
Table 15: Percentage of Carriers Offering Each Benefit Type ..............................................22
Table 16: Contracted Owner-Operator Pay & Total Marginal Costs per Mile, 2019-2023 ...23
Table 17: Average Annual Driver Bonus by Type, 2019-2023 ...............................................23
Table 18: Industry Average Truck-Tractor MPG by Operating Weight Class .......................40
Table 19: Trailer-to-Truck Ratio ..............................................................................................40
Table 20: Driver-to-Truck Ratio ..............................................................................................41
Table 21: Operating Margins by Sector, 2021-2023 ...............................................................47

4 Analysis of the Operational Costs of Trucking: 2024 Update
ACRONYMS
ATA American Trucking Associations
ATRI American Transportation Research Institute
BLS Bureau of Labor Statistics
CPH Cost Per Hour
CPM Cost Per Mile
EIA Energy Information Administration
FMCSA Federal Motor Carrier Safety Association
FMI Freight Mobility Initiative
IFTA International Fuel Tax Agreement
LTL Less-than-Truckload
MPG Miles Per Gallon
MPH Miles Per Hour
NPTC National Private Truck Council
OOs Owner-Operators
QCEW Quarterly Census of Employment and Wages
RAC Research Advisory Committee
SIRs Self-Insurance Retentions
STA State Trucking Associations
TMC Technology & Maintenance Council
U.S. DOT U.S. Department of Transportation

An Analysis of the Operational Costs of Trucking: 2024 Update 5
INTRODUCTION
The American Transportation Research Institute (ATRI) first published An Analysis of the
Operational Costs of Trucking in 2008, when it was identified as an industry priority by ATRI’s
Research Advisory Committee (RAC).1 Since then, the annual report has become one of the
most trusted resources in the trucking industry for benchmarking costs and operations.
The freight market continued its late-2022 decline throughout 2023. On the one hand, many of
the high-level macroeconomic conditions that challenged businesses in 2022 moderated. In
2023 inflation rates cooled to 3.4 percent, GDP growth improved significantly in the second half
of the year, and many cost centers in the trucking industry stabilized.2 In the freight market,
however, contract and spot rates both fell steadily over the year, as did freight shipments,
spend, and tonnage.3 All of these developments put a strain on industry costs and operations.
This is consistent with ATRI’s 2023 Top Industry Issues report, in which the trucking industry
identified the economy as its top concern.4
In such an environment, reliable benchmarking is more important than ever. In this “Ops Costs”
report, ATRI analyzed the for-hire trucking industry’s key cost centers, operational metrics, and
financial data from 2023 and how externalities impact them. Marginal line-item costs for fuel,
truck and trailer payments, repair and maintenance, insurance premiums, tires, permits, tolls,
driver wages, and driver benefits are calculated on both per-mile and per-hour bases. Data are
also analyzed by sector and fleet size to better understand the unique cost pressures and
operational requirements of different segments of the industry.
Other Ops Costs metrics provide insight into closely related operational efficiencies such as
deadhead mileage, truck and driver utilization, driver turnover, driving-to-non-driving employee
ratios, miles between breakdowns, in-house maintenance, and dwell times. The final
component of the report analyzes revenue through a variety of lenses including revenue per-
mile and per-truck, share of costs by type, and operating margins.
Together, these metrics allow for-hire fleets to perform essential benchmarking and to better
understand industry trends with precision. These metrics can also inform shippers, financiers,
suppliers, the public sector, and other industries reliant on the trucking industry.
This report found that the marginal costs of trucking, while increasing by just 0.8 percent over
the prior year, reached a new high of $2.270 per mile.
1 ATRI’s Research Advisory Committee RAC is comprised of industry stakeholders representing motor carriers,
trucking industry suppliers, government agencies, professional truck drivers, law enforcement, and academia. The
RAC is charged with annually recommending a research agenda for the Institute.
2 U.S. Bureau of Economic Analysis, “Gross Domestic Product, First Quarter 2024 (Advance Estimate)” (April 25,
2024), https://www.bea.gov/sites/default/files/2024-04/gdp1q24-adv.pdf; U.S. Bureau of Labor Statistics, “Consumer
Price Index: 2023 in review” (January 19, 2024), https://www.bls.gov/opub/ted/2024/consumer-price-index-2023-in-
review.htm.
3 DAT Freight & Analytics, “2024 Freight Focus” (December 2023), https://www.dat.com/wp-
content/uploads/2023/12/DAT-Freight-Focus-2024.pdf; CCJ Staff, “ATA: Truck tonnage in 2023 saw ‘worst’ year
since 2020,” Commercial Carrier Journal (January 25, 2024), https://www.ccjdigital.com/economic-
trends/indicators/article/15662770/ata-truck-tonnage-in-2023-saw-worst-year-since-2020; U.S. Bank, “U.S. Bank
Freight Payment Index Q4 2023” (Q4 2023), https://www.usbank.com/dam/documents/pdf/corporate-and-
commercial-banking/industry-expertise/transportation/freight-payment-index/04-0170-10_Freight-Index-2023-Q4.pdf.
4 American Transportation Research Institute, “Critical Issues in the Trucking Industry – 2023” (October 2023),
https://truckingresearch.org/2023/10/critical-issues-in-the-trucking-industry-2023/.

6 Analysis of the Operational Costs of Trucking: 2024 Update
METHODOLOGY
Data in this report were collected directly and confidentially from motor carriers of all sectors
and sizes, including owner-operators (OOs). Non-disclosure agreements were signed upon
request.
The methodology for defining and analyzing motor carrier costs and operational data has been
maintained consistently across years to allow for year-over-year comparisons, except where
otherwise noted. This year’s data collection form is included in the Appendix. It introduced
three new questions based on prior carrier feedback:
• What percentage of your drivers’ daily mileage was in the following ranges in 2023?
• How many battery-electric truck charging stations do you have installed currently at your
facilities?
• Please estimate how your truck-tractor costs per mile are trending for the following key
cost centers in January and February 2024 compared to 2023 annual costs.
Data collection began in February 2024 and ended in May 2024. ATRI solicited previous motor
carrier participants through direct emails and conducted general outreach through ATRI’s
contact lists, media coverage from industry trade press, and trade organizations. The data
collection form was available to submit via PDF or as an online survey. ATRI researchers
carefully reviewed all data and communicated with participants on all outliers to ensure the most
rigorous data quality. ATRI researchers also worked with industry experts and corroborated key
line-items with other federal and industry sources, which are summarized in Table 1.
Table 1: Cost Centers and Corroborating Sources
Cost Center Corroborating Sources
Fuel
Energy Information Administration (EIA)
Truck/Trailer Lease or Purchase
Payments
J.D. Power Valuation Services
Wards Intelligence
ACT Research
Repair and Maintenance Costs
American Trucking Associations (ATA) Technology &
Maintenance Council (TMC) and Decisiv
Fullbay, Motor Information Systems
Truck Insurance Premiums
The Council of Insurance Agents & Brokers
Fitch Ratings
AM Best
Tires
Bureau of Labor Statistics (BLS)
Driver Wages
BLS
Driver Benefits
ATA
Industry-wide marginal cost per mile (CPM) averages are weighted according to the market
share of each sector. ATRI uses BLS Quarterly Census of Employment and Wages (QCEW)
data to weight for the total drivers employed by each sector. Table 2 compares sector
representation in this BLS data and among ATRI respondents. Less-than-Truckload (LTL)
carriers are overrepresented in the sample, while truckload carriers are underrepresented.

An Analysis of the Operational Costs of Trucking: 2024 Update 7
Table 2: For-Hire Industry Sector Breakout by Employment
ATRI Respondents U.S Trucking Industry5
Truckload 31.4% 58.0%
Less-than-Truckload 48.0% 27.5%
Other/Specialized 20.7% 14.5%
The “specialized sector” in this report is in fact a grouping of several distinctive sectors,
including flatbed, tanker, refrigerated, intermodal, bulk, and household goods movers. It should
be noted that these sectors can vary considerably in costs from one to the next. Though this
report highlights some of these variations, all participating fleets receive additional customized
reports that provide greater detail for each metric in their specific sector.
CPM metrics were converted to cost per hour (CPH) metrics using a GPS-derived average
speed from the U.S. Bureau of Transportation Statistics / ATRI Freight Mobility Initiative (FMI)
program.6 The 2023 average speed was 40.20 miles per hour (MPH), approximately 0.12 MPH
slower than in 2022. This average speed was higher than annual average speeds prior to the
COVID-19 pandemic, but it was lower than the average speeds in 2020, 2021, and 2022,
suggesting a return to more typical traffic volumes and road conditions.
Fleet sector- and size-based analyses are based directly on motor carriers’ reported averages
and are not weighted. This is done to present carrier-based trends and to better serve the
interests of fleet-to-fleet benchmarking. Other operational or equipment metrics are weighted by
sector representation, in the same manner as industry-wide overall costs, and by the number of
trucks in each fleet. This is done in order to present truck-based trends across the population of
all U.S. Class 8 trucks and to best serve the interests of industry analysts and public planners.
Due to rounding, the percentages in some tables or figures may not sum to exactly 100 percent.
5 U.S. Bureau of Labor Statistics, “Quarterly Census of Employment and Wages” (Q3 2023),
https://www.bls.gov/cew/. SOC codes used were as follows: 484121 for truckload carriers, 484122 for less-than-
truckload carriers, and 484230 for other/specialized carriers.
6 ATRI derived this speed by analyzing one full week of national FMI data in each of the four quarters in 2023 (the
12th to the 18th of February, May, August, and October). This dataset consisted of over 300 million truck speed data
points with non-zero speeds. The 40.20 MPH figure is an update to the 40.33 MPH figure from 2022 that was used in
last year’s report. This speed figure represents an average operational speed since it includes speeds in all types of
operational conditions, sectors, and locations.

8 Analysis of the Operational Costs of Trucking: 2024 Update
RESPONDENT DEMOGRPAHICS
This report focuses on for-hire motor carriers. In 2023, for-hire trucking represented 65.7
percent of all registered carriers; 23.2 percent of registered carriers were private with an
additional 7.1 percent of fleets conducting both private and for-hire operations, often for
backhauls or to improve driver or truck utilization.7
The fleets represented in this report operated 150,869 combination truck-tractors and 395,934
trailers, running over 11.97 billion miles. These totals constitute approximately 4.6 percent of all
registered combination trucks and 6.1 percent of all truck miles traveled in the U.S.8
Size of Operations
The fleet size categories used in this report are consistent with those from previous years. As
Figure 1 shows, they contain roughly proportional numbers of fleets to maximize quality of
analysis. Fleets with 10 or fewer trucks make up 95.8 percent of all motor carriers registered
with the U.S. Department of Transportation (U.S. DOT).9
Figure 1: Respondent Fleet Size
Participants’ revenue follows a similar pattern in Figure 2, with a plurality of fleets reporting less
than $1 million in total trucking-related 2023 revenue (excluding brokerage, logistics, or other
revenue sources).
7 American Trucking Associations, American Trucking Trends 2023 (2023), https://www.trucking.org/news-
insights/ata-american-trucking-trends-2023.
8 Percentage based on the most recent figures for miles traveled, from 2022. Office of Highway Policy Information,
“Table VM-1: Annual Vehicle Distance Traveled in Miles and Related Data – 2022” (February 2024), 2022 Highway
Statistics Series, Federal Highway Administration, U.S. Department of Transportation,
https://www.fhwa.dot.gov/policyinformation/statistics/2022/vm1.cfm.
9 American Trucking Association, American Trucking Trends 2023 (2023), https://www.trucking.org/news-insights/ata-
american-trucking-trends-2023.

An Analysis of the Operational Costs of Trucking: 2024 Update 9
Figure 2: Respondent Revenue
Type of Operations
Average carrier trip lengths in 2023 were strikingly consistent with those in 2022 (Table 3). The
similarity between 2018 and 2023 percentages suggests a return to pre-pandemic trip length
conditions after deviations in 2020 and 2021.
Table 3: Respondent Trip Lengths, 2018 to 2023
2018 2019 2020 2021 2022 2023
Local (less than 100 miles) 26% 26% 32% 24% 28% 28%
Regional (100-500 miles) 37% 39% 37% 40% 37% 37%
Inter-regional (500-1,000 miles) 21% 22% 19% 22% 21% 20%
National (over 1,000 miles) 16% 13% 12% 14% 14% 15%
In order to further understand driving behaviors and truck usage, a new question was added this
year to determine drivers’ average daily mileage. Unlike the trip lengths in Table 3, the daily
mileage in Figure 3 was weighted by the number of trucks in each respondent fleet and by
sector representation to approximate the use of individual trucks in the overall national truck
population. This is of particular importance for integrating alternative fuels into regular trucking
operations, which can alter effective daily mileage ranges.

10 Analysis of the Operational Costs of Trucking: 2024 Update
Figure 3: Daily Mileage Driven, 2023
ATRI respondents’ regional mileage tracks closely with that of all combination trucks in the U.S.
based on the most recent available Federal Highway Administration data, with the Southwest
and West slightly underrepresented. Table 4 compares percentages between the two data sets.
Table 4: Respondent Truck IFTA Miles and National Truck Mileage by Region
Region Respondent Percent of
IFTA Miles
Share of U.S. Truck-Tractor
Miles (2022)10
Midwest
29.1%
28.5%
Northeast
14.5%
10.0%
Southeast
29.3%
30.3%
Southwest
11.6%
14.5%
West
13.8%
18.8%
Canada
2.1%
Equipment
The average truck age among respondents dropped from 4.7 years in 2022 to 3.8 years in 2023
(Table 5). This unusually low average age came after aggressive buying in late 2022 and 2023
on the heels of record-high average ages during the parts shortages of 2020 and 2021. Most
trailer types, however, had higher average ages in 2023 than in 2022. These shifts are
analyzed in further detail in the Line-Item Analyses and Utilization sections below. Equipment
10 Office of Highway Policy Information, “Table VM-2: Functional System Travel – 2022” and “Table VM-4: Distribution
of Annual Vehicle Distance Traveled – 2022” (January 2024), 2022 Highway Statistics Series, Federal Highway
Administration, U.S. Department of Transportation, https://www.fhwa.dot.gov/policyinformation/statistics/2022/.

An Analysis of the Operational Costs of Trucking: 2024 Update 11
age and mileage averages were weighted by the number of trucks in each fleet and by sector
representation to best approximate the national truck fleet.
The average number of annual miles driven per truck in 2023 rose for the first time in years,
albeit slightly, to 80,159 from 78,863 in 2022. Conversely, the number of days each truck ran
decreased from 251 in 2022 to 243 in 2023.
Table 5: Respondent Equipment Characteristics
Equipment Type Number of Units Average Age
(Years)
Average Miles
Driven per Year
Truck-Tractors
150,869
3.8
80,159
28’ Trailers
119,419
10.3
33’ Trailers
821
11.1
45’ Trailers
1,308
13.7
48’ Trailers
23,699
8.8
53’ Trailers
170,832
6.4
Tank Trailer
23,020
17.0
Flatbed Trailer
12,175
10.3
Refrigerated Trailer
23,512
5.0
Intermodal Trailers
6,455
4.4
Other Trailers
14,693
5.3
Total Trailers
395,934
Following the decrease in average truck age, the average truck trade cycle decreased in years
from 8.2 in 2022 to 7.5 in 2023 (Table 6). The average trailer trade cycle, as with the average
trailer age, increased from 14.2 years in 2022 to 15.3 years in 2023.
Table 6: Respondent Equipment Trade Cycle
Equipment Type
Average Number of Years
Until Replacement
Average Miles Driven
Until Replacement
Truck-Tractors
7.5
673,995
Trailers
15.3
Alternative Fuels
In 2023, 12.8 percent of respondent fleets operated at least one alternative-fueled Class 8 truck-
tractor, up from 8.2 percent in 2022 and 7 percent in 2021. For each alternative fuel type, Table
7 shows the percentage of respondents operating at least one such truck and the percentage of
all such trucks in the sample. Hydrogen fuel cell trucks were reported for the first time this year,
while liquid petroleum gas usage fell to zero.
Of all trucks in this year’s sample, just 4.39 percent were alternatively fueled, and the majority of
these were fueled by Compressed Natural Gas (CNG). While the rate of alternative fuel
adoption has been slow, it does continue to grow. In 2022 3.4 percent of trucks used alternative
fuels, while in 2021 that figure stood at 2.7 percent.

12 Analysis of the Operational Costs of Trucking: 2024 Update
Table 7: Use of Alternative Fuel Truck-Tractors
Alternative Fuel Type Percent of Respondents Percent of Trucks
CNG
7.3%
3.42%
Battery Electric
7.3%
0.08%
LNG
1.2%
0.88%
Hydrogen Fuel Cell
1.2%
0.003%
LPG
0%
0%
All Types
12.8%
4.39%
This year’s respondents operated a total of 77 battery electric truck charging stations. These
respondents operated between one and three charging stations per battery electric truck-tractor
in their fleets, though charging stations may also be used by battery electric straight trucks or
yard hostlers, which were not surveyed for this report. Some carriers that operated battery
electric truck-tractors did not yet have charging stations installed at their own facilities.
An additional caveat to Table 7 is that most fleets adopting alternative fuel trucks are very large
and thus better able to accommodate higher costs or operational limitations. Ninety-five percent
of all alternative fuel trucks in the sample belong to just four carriers that each operate over
1,000 petroleum diesel-fueled trucks.
Renewable diesel is not included in Table 7 because, as a drop-in fuel, it is used in a traditional
internal combustion engine and can be used interchangeably or intermixed with petroleum
diesel. These qualities have made renewable diesel an increasingly attractive alternative fuel
for reducing greenhouse gas emissions, but they also make it difficult to track adoption on a
truck-by-truck basis. Nonetheless, overall renewable diesel consumption (not limited to the
trucking industry) more than doubled between 2021 and 2023.11
FINDINGS
The total marginal cost of operating a truck in 2023 was $2.270 per mile. While this marked a
new record high cost, it increased by only 0.8 percent over 2022’s total. Fuel prices, declining
by 8.8 cents per mile, experienced the greatest change. While most other line-items increased
moderately in cost, insurance premiums and truck and trailer payments grew at higher rates.
With fuel removed, the marginal cost of trucking rose by 6.6 percent, from $1.610 per mile in
2022 to $1.716 per mile in 2023. Table 8 tracks ATRI’s per-mile costs for each key line-item
over the past decade, and Table 10 shows the percent change from 2022 to 2023.
Marginal costs on a per-hour basis were $91.27, up just 0.5 percent from $90.78 in 2022. This
per-hour cost increased at a lower rate than the per-mile cost figure because the average truck
speed in 2023 fell slightly from 2022 (see footnote 6). Table 9 tracks ATRI’s per-hour costs for
each key line-item over the past decade.
11 Jeffrey Short, Renewable Diesel – A Catalyst for Decarbonization, American Transportation Research Institute
(April 2024), https://truckingresearch.org/2024/04/renewable-diesel-a-catalyst-for-decarbonization/.

An Analysis of the Operational Costs of Trucking: 2024 Update 13
Table 8: Average Marginal Costs per Mile, 2014-2023
Motor Carrier Costs 2014 2015 2016 2017 2018 2019 2020 2021 2022 2023
Vehicle-based
Fuel Costs $0.583 $0.403 $0.336 $0.368 $0.433 $0.384 $0.308 $0.417 $0.641 $0.553
Truck/Trailer Lease or
Purchase Payments
$0.215 $0.230 $0.255 $0.264 $0.265 $0.256 $0.271 $0.279 $0.331 $0.360
Repair & Maintenance $0.158 $0.156 $0.166 $0.167 $0.171 $0.149 $0.148 $0.175 $0.196 $0.202
Truck Insurance Premiums $0.071 $0.074 $0.075 $0.075 $0.084 $0.071 $0.087 $0.086 $0.088 $0.099
Permits & Licenses $0.019 $0.019 $0.022 $0.023 $0.024 $0.020 $0.016 $0.016 $0.015 $0.009
Tires $0.044 $0.043 $0.035 $0.038 $0.038 $0.039 $0.043 $0.041 $0.045 $0.046
Tolls $0.023 $0.020 $0.024 $0.027 $0.030 $0.035 $0.037 $0.032 $0.028 $0.034
Driver-based
Driver Wages $0.462 $0.499 $0.523 $0.557 $0.596 $0.554 $0.566 $0.627 $0.724 $0.779
Driver Benefits $0.129 $0.131 $0.155 $0.172 $0.180 $0.190 $0.171 $0.182 $0.183 $0.188
TOTAL $1.703 $1.575 $1.592 $1.691 $1.821 $1.699 $1.646 $1.855 $2.251 $2.270

14 Analysis of the Operational Costs of Trucking: 2024 Update
Table 9: Average Marginal Costs per Hour, 2014-2023
Motor Carrier Costs 2014 2015 2016 2017 2018 2019 2020 2021 2022 2023
Vehicle-based
Fuel Costs $23.29 $16.13 $13.45 $14.50 $17.07 $15.14 $12.52 $16.78 $25.84 $22.23
Truck/Trailer Lease or
Purchase Payments
$8.59 $9.20 $10.20 $10.39 $10.45 $10.09 $11.00 $11.21 $13.37 $14.46
Repair & Maintenance $6.31 $6.23 $6.65 $6.58 $6.72 $5.87 $6.00 $7.04 $7.89 $8.13
Truck Insurance Premiums $2.86 $2.98 $3.00 $2.95 $3.32 $2.80 $3.55 $3.46 $3.57 $3.99
Permits & Licenses $0.76 $0.78 $0.88 $0.92 $0.95 $0.79 $0.67 $0.64 $0.60 $0.36
Tires $1.76 $1.72 $1.41 $1.50 $1.50 $1.54 $1.73 $1.67 $1.81 $1.85
Tolls $0.90 $0.79 $0.97 $1.05 $1.17 $1.38 $1.49 $1.30 $1.14 $1.35
Driver-based
Driver Wages $18.46 $19.95 $20.91 $21.97 $23.50 $21.84 $22.97 $25.24 $29.20 $31.32
Driver Benefits $5.15 $5.22 $6.18 $6.78 $7.10 $7.49 $6.94 $7.31 $7.37 $7.58
TOTAL $68.09 $62.98 $63.66 $66.65 $71.78 $66.94 $66.87 $74.65 $90.78 $91.27

An Analysis of the Operational Costs of Trucking: 2024 Update 15
Truck and trailer payments, repair and maintenance, insurance premiums, tires, and driver
wages all set record high marginal costs in 2023. Yet the rate of increase in cost was generally
much lower this year than last. The annual percent change for each cost center from 2022 to
2023 is shown in Table 10. Here and elsewhere in the report, percent change calculations are
based on per-mile costs as printed in Table 8.
Table 10: 2022-2023 Annual Change in Average Costs per Mile
Motor Carrier Costs
Percent
Change
Vehicle-based
Fuel Costs
- 13.7%
Truck/Trailer Lease or Purchase Payments
8.8%
Repair & Maintenance
3.1%
Truck Insurance Premiums
12.5%
Permits & Licenses
- 40.0%
Tires
2.2%
Tolls
21.4%
Driver-based
Driver Wages
7.6%
Driver Benefits
2.7%
TOTAL
0.8%
Total excluding Fuel
6.6%
Only three line-items increased at a greater rate during 2022-2023 than 2021-2022: tolls; driver
benefits; and truck insurance premiums. Truck and trailer payments, repair and maintenance,
and driver wages all increased, but at rates eight percentage points or lower than last year.
Sector Costs
Cost structures vary substantially by trucking industry sector, as Table 11 indicates. Even
though the industry-wide average cost increased by 0.8 percent in 2023, costs actually declined
in the specialized and truckload sectors. This was because the decrease in fuel costs was
greater than the increases in other cost centers for these two sectors.
Table 11: Average Total Marginal Costs by Sector, 2014-2023
Sector 2014 2015 2016 2017 2018 2019 2020 2021 2022 2023
LTL $1.83 $1.60 $1.74 $1.84 $1.92 $1.85 $1.72 $1.99 $2.34 $2.55
Specialized $1.85 $1.72 $1.83 $1.95 $2.02 $1.85 $1.82 $2.01 $2.44 $2.33
Truckload $1.58 $1.50 $1.42 $1.49 $1.71 $1.55 $1.56 $1.74 $2.15 $2.11
When fuel is excluded, as in Table 12, total marginal costs increased in the truckload sector (by
3.9%) and remained flat in the specialized sector. These totals without fuel also provide a clear
cost indicator independent of fuel costs (which may or may not be offset by surcharge
agreements in varying degrees from carrier to carrier).

16 An Analysis of the Operational Costs of Trucking: 2024 Update
Table 12: Average Total Marginal Costs Excluding Fuel by Sector, 2016-2023
Sector 2016 2017 2018 2019 2020 2021 2022 2023
LTL $1.40 $1.45 $1.50 $1.47 $1.43 $1.58 $1.73 $2.00
Specialized $1.44 $1.52 $1.51 $1.41 $1.49 $1.57 $1.70 $1.70
Truckload $1.10 $1.16 $1.29 $1.17 $1.25 $1.32 $1.52 $1.58
Private fleets had a total marginal cost of $2.84 per mile in 2022 according to the National
Private Truck Council’s most recent benchmarking report.12 The largest contributors to private
fleets’ higher costs compared to for-hire fleets were driver pay, driver benefits, and truck and
trailer payment costs.
Costs by Region
Trucking costs vary by region, based on regional variability in a variety of economic conditions.
Table 13 estimates regional costs for each line-item by weighting each carrier’s costs by the
percentage of mileage traveled in each region.
Table 13: Average Marginal Cost per Mile by Region, 2023
Motor Carrier Costs Midwest Northeast Southeast Southwest West
Vehicle-based
Fuel Costs $0.532 $0.542 $0.538 $0.547 $0.604
Truck/Trailer Lease or
Purchase Payments
$0.385 $0.420 $0.364 $0.302 $0.331
Repair & Maintenance $0.206 $0.215 $0.190 $0.182 $0.201
Truck Insurance
Premiums
$0.083 $0.092 $0.104 $0.097 $0.105
Permits & Licenses $0.006 $0.009 $0.006 $0.007 $0.006
Tires $0.044 $0.050 $0.050 $0.046 $0.042
Tolls $0.037 $0.059 $0.028 $0.025 $0.018
Driver-based
Driver Wages
$0.735
$0.850
$0.788
$0.798
$0.733
Driver Benefits $0.166 $0.198 $0.206 $0.195 $0.170
TOTAL $2.194 $2.435 $2.274 $2.199 $2.210
The Northeast reclaimed its spot as the most expensive region in which to operate in 2023 after
briefly being surpassed by the Southeast in 2022. The Northeast led in costs for most line-
12 This figure excludes NPTC-reported administrative and “other” costs that ATRI does not track. National Private
Truck Council, Benchmarking Survey Report 2023 (August 2023), https://www.nptc.org/.

An Analysis of the Operational Costs of Trucking: 2024 Update 17
items, including truck and trailer payments, repair and maintenance, permits and licenses, tolls,
and driver wages.
The Southeast retained the highest costs in driver benefits while matching the Northeast’s tire
costs. The Midwest was the least expensive region in which to operate overall, though it only
had the lowest costs for three individual line-items: fuel, insurance premiums, and driver
benefits. While the West led in fuel and insurance costs, it had the lowest driver wages on
average.
Looking Ahead: Q1 2024 Costs
Each year’s Operational Costs report includes short sections outlining the latest developments
and indicators for each cost center. In this year’s data collection, for the first time, carriers also
reported the percent change by line-item that they experienced in January and February of
2024, thus providing a glimpse of cost trends in 2024. Table 14 summarizes responses with the
same weighting method used for calculating industry-wide marginal costs. Each line-item is
discussed in greater detail in the corresponding “Looking Ahead” sections to follow.
Table 14: Change in Costs per Mile, Q1 2024 over 2023
Motor Carrier Costs
Percent
Change
Fuel Costs
- 3.1%
Truck/Trailer Lease or Purchase Payments
3.8%
Repair & Maintenance
2.0%
Truck Insurance Premiums
6.8%
Permits & Licenses
0%
Tires
- 1.8%
Tolls
2.8%
Line-Item Analyses
This section contains detailed analysis of ATRI data for each line-item alongside other reliable
industry sources as well as trends leading into the second half of 2024 and beyond. Fleet costs
are broken out into five to six fleet size categories for each of two broad sector categories,
truckload and specialized (which includes flatbed, tanker, refrigerated, intermodal, and other
specialized carriers). LTL costs are provided for that sector as a whole, without fleet size
divisions.
Driver Compensation Costs
The trucking industry spent an average of $0.779 on driver wages and $0.188 on driver benefits
per mile, amounting to $0.967 in total per-mile compensation.

18 An Analysis of the Operational Costs of Trucking: 2024 Update
Driver Wages
Figure 4 shows company driver wages per mile by sector and fleet size.13 While numerous
compensation structures exist, ATRI converts all driver pay figures to per-mile figures for
comparability.
Truckload fleets with more than 1,000 trucks paid the highest driver wages, at $0.877 cents per
mile. This fleet size group also saw the largest increase in wages compared to 2022, when they
paid $0.772 per mile on average. Truckload fleets with fewer than 26 trucks saw a slight dip in
wages compared to 2022, suggesting that small fleets in this sector felt the greatest economic
pressure from low freight rates. The remaining fleet size groups in the Truckload sector saw
slight increases year-over-year, ranging from one to two cents per mile.
Specialized fleets’ driver pay showed less variation, increasing steadily across fleet sizes.
Though fleets with more than 1,000 trucks once again had the highest driver pay among
specialized fleets, only 6 cents separated them from fleets with 26 to 100 trucks. The largest
two size groups saw slight dips in driver wages in 2023 compared with the previous year. By
contrast, the smaller three fleet size groups saw wages grow on average, making the sector
more competitive on wages overall. For example, the average for 26-to-100-truck fleets rose
from $0.729 in 2022 to $0.771 in 2023.
Figure 4: Driver Wages per Mile by Fleet Sector and Size
Average driver pay rose significantly among LTL carriers from 78.0 cents in 2022 to 92.0 cents
per mile ($36.99 per hour) in 2023 – a year that witnessed significant disruption with the closure
13 Because many fleets with fewer than five drivers do not have company drivers or pay benefits, the figures in this
section combine the two smallest fleet size groups (fewer than 5 trucks and 6 to 25 trucks) into one (fewer than 26
trucks).

An Analysis of the Operational Costs of Trucking: 2024 Update 19
of Yellow, one of the sector’s largest carriers.14 In addition, union carriers signed new Master
Freight Agreements in Q3 of 2023.
LTL driver wages were thus the largest contributor to the increase in the industry-wide average
driver wage. This represented a reversal from 2022, when a competitive labor market and the
final months of the pandemic freight boom resulted in a narrower gap between truckload and
LTL wages than typical historically.
Overall, driver wages across all sectors grew by 7.6 percent between 2022 and 2023. BLS
recorded a comparable 5.5 percent increase in truck driver wages during the same period.15
Some evidence suggests that fleets shifted strategies on which drivers receive the greater share
of pay increases. The National Transportation Institute found that fleets in 2023 gave the
largest pay increases to drivers with the most experience – reversing the pandemic-boom trend
of 2021 and 2022 in which new drivers saw the largest wage increases.16 Such a shift would
suggest that fleets are focusing more on retaining proven, safe drivers in a freight market with
reduced demand pressures.
Driver Benefits
Benefits costs in the truckload sector maxed at $0.160 per mile in the 101-to-250-truck group
while tapering among larger fleets, as illustrated in Figure 5. With the exception of two groups
(26-100 trucks and 101-250) who experienced benefits cost increases, the other three truckload
groups spent less on benefits in 2023 than in 2022 on a per-mile basis.
Benefits costs increased with fleet size in the specialized sector. That said, specialized fleets
with fewer than 26 trucks joined specialized fleets with more than 1,000 trucks in increasing
benefits spending by a cent or more in 2023. Specialized fleets with 101 to 250 trucks saw
benefits costs fall by four cents on a per-mile basis.
14 Chris Isidore, “99-year-old trucking company Yellow shuts down, putting 30,000 out of work,” CNN Business
(August 1, 2023), https://www.cnn.com/2023/07/31/business/yellow-corp-closing/index.html.
15 U.S. Bureau of Labor Statistics, “Occupational Employment and Wage Statistics, May 2023: Heavy and Tractor-
Trailer Truck Drivers” (accessed May 2024), https://www.bls.gov/oes/2023/may/oes533032.htm.
16 National Transportation Institute, ”Notable pandemic-era driver pay trend reversed course this quarter” (May 11,
2023), https://driverwages.com/latest-driver-pay-date-trends-q2-2023-nti/.

20 An Analysis of the Operational Costs of Trucking: 2024 Update
Figure 5: Driver Benefits per Mile by Fleet Sector and Size
Benefits costs in the LTL sector were $0.323 cents per mile or $12.97 per hour in 2023, an
increase of approximately 15.4 percent over 2022. As with driver wages, LTL fleets were the
primary contributor to the increase in industry-wide driver benefits costs.
Combined Wages and Benefits Analysis
In the truckload sector, combined wages and benefits costs were highest among fleets with
more than 1,000 trucks; substantially higher truckload wages offset slightly lower benefits costs,
producing a total of $0.999 per mile (Figure 6). Truckload fleets with 26 to 100 trucks had the
second highest total compensation for a second year in a row, at $0.877 per mile in 2023.
Though fleets with fewer than 26 trucks offered competitive wages relative to other fleet sizes,
their lower benefits spending resulted in a lower total company driver compensation.

An Analysis of the Operational Costs of Trucking: 2024 Update 21
Figure 6: Truckload Driver Wages and Benefits per Mile by Fleet Size
Combined wages and benefits among specialized carriers increased with fleet size (Figure 7).
Specialized carriers experienced higher total compensation costs than truckload carriers at
every fleet size. In general, combined wages and benefits costs were much closer together in
the specialized category, with just 2.1 cents separating fleets with 251 to 1,000 trucks from
those with more than 1,000 trucks.
Figure 7: Specialized Carrier Driver Wages and Benefits per Mile by Fleet Size

22 An Analysis of the Operational Costs of Trucking: 2024 Update
LTL carriers experienced $1.243 per mile in total compensation costs, or $49.96 per hour. As
with wages and benefits individually, LTL sector combined compensation grew at a greater rate
than the truckload and specialized sectors.
Driver Benefits Breakdown
Health insurance was the most common company driver benefit followed by paid vacation.
Table 15 shows the percentage of fleets offering each benefit type. In general, the percentages
in this table are consistent with last year’s report and the American Trucking Associations’ (ATA)
most recent Driver Compensation Study, which found, for example, that 95 percent of truckload
carriers offered health insurance and 89 percent offered paid leave.17 Only 15 percent of
carriers offer employee ownership or profit sharing.
Table 15: Percentage of Carriers Offering Each Benefit Type
Benefit Percent Offered
Health Insurance
97%
Paid Vacation
86%
Dental Insurance
82%
401(k)
80%
Life Insurance
77%
Vision Insurance
74%
Paid Sick Leave
56%
Per Diem
47%
Employee Ownership /
Profit Sharing
15%
Owner-Operators and Contract Drivers
OOs and independent contractors comprise a substantial proportion of drivers in the trucking
industry, whether working entirely on their own or with a motor carrier. FMCSA registration data
showed that in December 2023 there were 578,329 single-truck, single-driver for-hire carriers.18
This year 73 percent of respondents utilized OOs in some capacity. Some of these fleets
operate exclusively with OOs, but the majority utilize OOs for special circumstances, special
operational niches, or sudden fluctuations in freight demand.
In the truckload sector, a median of 4.1 percent of carrier drivers were OOs. Among specialized
fleets, a median of 7.3 percent of carrier drivers were OOs.
Even with the soft spot market and lower freight volumes in 2023, OO pay increased to $2.10
per mile.19 Table 16 shows OO pay over the past five years as well the average total marginal
cost for the industry as a whole, which typically tracks slightly higher than OO pay.
17 Lindsay Bur and Bob Costello, ATA 2022 Driver Compensation Study, American Trucking Associations (June
2022), https://www.trucking.org/news-insights/ata-driver-compensation-study.
18 Federal Motor Carrier Safety Administration, “Registration Statistics” (accessed June 14, 2024),
https://ai.fmcsa.dot.gov/RegistrationStatistics/CustomReports.
19 When carriers paid separate OO wages and benefits, these two figures were summed.

An Analysis of the Operational Costs of Trucking: 2024 Update 23
Table 16: Contracted Owner-Operator Pay and Total Marginal Costs per Mile, 2019-2023
2019 2020 2021 2022 2023
Owner-Operator Pay $1.36 $1.65 $1.81 $2.08 $2.10
Total Marginal Cost $1.699 $1.646 $1.855 $2.251 $2.270
Carriers should note that OO pay varies more widely than company driver pay based on specific
carrier arrangements. For example, some carriers pay OOs considerably less than the average
in Table 16 because they offer OOs reduced prices on carrier-owned maintenance shops or fuel
depots. Other carriers offer OO compensation structures that place more emphasis on
bonuses, such as per-mile safety or performance pay.
Driver Bonuses
Bonuses are a key part of driver compensation, with 70 percent of carriers offering some form of
bonus. Table 17 lists annualized averages for the four driver bonus types tracked by ATRI over
the past five years, though it should be noted that bonus policies and amounts vary widely by
fleet. Some bonuses are paid out on a per-mile, per-week, or per-event basis, and some are
scaled according to years of employment. Some carriers, especially in the specialized sectors,
offer additional performance and load-based bonuses that are not tracked here.
Table 17: Average Annual Driver Bonus by Type, 2019-2023
Bonus Type 2019 2020 2021 2022 2023
Safety
$1,373
$1,597
$1,943
$1,698
$1,831
Starting
$1,846
$1,662
$1,974
$2,373
$1,782
Retention
$1,218
$1,391
$1,055
$1,272
$1,289
Referral
$1,783
$1,577
For the first time in 2023, safety bonuses surpassed starting bonuses, even though both were
below previous highs. Offered by 47.3 percent of respondents, safety bonuses were also the
most common type of bonus.
At $1,782, starting bonuses were lower than the previous two years of elevated driver demand
but still within the typical historical range. Referral bonuses also dropped in 2023 compared
with 2022, while retention bonuses remained almost the same.
Parking Compensation
Truck parking was voted the second highest issue facing the trucking industry in 2023, behind
the economy.20 The truck parking shortage can cost drivers in two ways: in the pay they forego
when looking for parking or ending a shift early, or in the fees they pay for private sector
parking. Parking compensation helps address these negative consequences.
20 American Transportation Research Institute, “Critical Issues in the Trucking Industry – 2023” (October 2023),
https://truckingresearch.org/2023/10/critical-issues-in-the-trucking-industry-2023/.

24 An Analysis of the Operational Costs of Trucking: 2024 Update
In the truckload sector, 30 percent of carriers paid for parking in 2023, two-thirds by
reimbursement and one-third by advance reservation. This was consistent with 2022, when 31
percent of truckload carriers paid for parking.
Roughly 32 percent of specialized carriers paid for parking. The majority of these carriers (82%)
paid via reimbursement.
The median parking compensation was $20 per day.
Looking Ahead
Driver pay rose by 10.8 percent in 2021 and 15.5 percent in 2022. These massive, double-digit
increases came to an end in 2023, but the year still saw a strong 7.6 percent growth in driver
pay. Several indicators suggest that this rate of increase may continue to moderate in 2024.
BLS recorded a 5.8 percent wage increase across all occupations in the U.S. in 2023.21 While
this attests to continued competitiveness in the national labor market, it implies that pressure
has cooled somewhat from 2022 when the same measure was 6.2 percent.
Compensation will also experience less upward pressure than in 2022 from inflation rates,
which remained consistent in the first four months of 2024 with 2023’s annualized rate of 3.4
percent.22
Driver demand plays the primary role in pay rates, especially since it reflects broader industry
conditions. Figure 8 tracks monthly employment trends using BLS data for the truck
transportation industry overall.23 During the previous freight boom, high driver demand in a
competitive U.S. labor pool helped drive up driver pay at record rates. As the freight market
softened at the end of 2022, so did truck transportation employment, which trended downward
from a high of almost 1.59 million in July 2022 to 1.575 million in July 2023. The subsequent
closure of Yellow contributed to a sudden sharp drop in industry-wide employment.
21 U.S. Bureau of Labor Statistics, “May 2023 National Occupational Employment and Wage Estimates” (accessed on
May 2024), https://www.bls.gov/oes/2023/may/oes_nat.htm.
22 U.S. Bureau of Labor Statistics, “Consumer Price Index News Release” (May 15, 2024),
https://www.bls.gov/news.release/archives/cpi_05152024.htm.
23 U.S. Bureau of Labor Statistics, “All Employees, Truck Transportation [CES4348400001]” (accessed June 3, 2024),
https://fred.stlouisfed.org/series/CES4348400001.

An Analysis of the Operational Costs of Trucking: 2024 Update 25
Figure 8: Truck Transportation Industry Employment (Millions)
Since then, employment has risen, but only reaching the point – as of April 2024 – where it was
trending prior to Yellow’s closure. Continued growth in industry employment numbers past this
point could indicate a recovering freight market and continued driver pay growth at a rate similar
to that of 2023. If industry employment returns to the declining trendline of Q1 and Q2 2023,
though, driver pay may well see a lower rate of increase.
For the past three years, driver benefits costs have hovered between 18.2 and 18.8 cents per
mile (up from 17.0 cents per mile in 2020). It is unlikely that this line-item will see any
substantive change deviating from this trend unless the industry experiences substantial growth,
which is not anticipated for the near future.
Fuel Costs
Diesel prices fell steadily through the first half of 2023 before briefly jumping back to January
highs in autumn and finally falling again as winter began. Figure 9 tracks this movement with
price data from the U.S. Department of Energy’s EIA.24 The result was an annualized decrease
of 13.7 percent to $0.553 per mile.
24 U.S. Energy Information Association, “Weekly Retail Gas and Diesel Prices” (accessed on May 30, 2024),
https://www.eia.gov/dnav/pet/pet_pri_gnd_dcus_nus_w.htm.

26 An Analysis of the Operational Costs of Trucking: 2024 Update
Figure 9: Monthly U.S. On-Highway Diesel Prices, 2019-2024
Truckload fleets paid very similar amounts for fuel across fleet sizes (Figure 10). On average,
fewer than 5 cents per mile separated fleets with fewer than 5 trucks from fleets with more than
1,000 trucks, and several fleet size averages differed by a mere tenth of a cent.
Among specialized carriers, fleet size had a more pronounced impact on fuel costs, with larger
fleets enjoying economies of scale.

An Analysis of the Operational Costs of Trucking: 2024 Update 27
Figure 10: Fuel Costs per Mile by Fleet Sector and Size
Looking Ahead
The EIA forecasts that highway diesel prices will remain just below a $4-per-gallon average over
2024, continuing its current downward trend over summer.25 Prices are then forecast to begin a
moderate upward trajectory in autumn 2024 and through 2025, peaking at $4.250 per gallon. If
present conditions remain consistent, average fuel costs for 2024 could drop to $0.50 per mile.
These forecasts, however, do not take unpredictable global events into consideration, and
coming months unfortunately hold the possibility of several such disruptions. Any expansion of
conflict in the Middle East would lead to disruption in oil supply and thus an increase in global oil
prices, regardless of U.S. production volumes.
National Oceanic and Atmospheric Administration forecasts project that record-high water
temperatures in the Gulf of Mexico and Caribbean Sea will increase the likelihood and possible
time window of hurricanes and other tropical storms to record levels in 2024.26 In the past, such
conditions have led to damage or delays in oil drilling, shipping, or refinement.
In the first two months of 2024, carriers reported a decrease of 3.1 percent in fuel costs per mile
on average compared with 2023. Even if the oil market experiences a major disruption in the
second half of 2024, fuel costs for the year would likely still average out below the $0.641 per
mile spent in 2022, when prices remained elevated for the entire year.
25 U.S. Energy Information Association, “Short-Term Energy Outlook” (accessed on June 11, 2024),
https://www.eia.gov/outlooks/steo/.
26 National Oceanic and Atmospheric Administration, “NOAA predicts above-normal 2024 Atlantic hurricane season”
(May 23, 2024), https://www.noaa.gov/news-release/noaa-predicts-above-normal-2024-atlantic-hurricane-season.

28 An Analysis of the Operational Costs of Trucking: 2024 Update
Equipment Costs
ATRI tracks three categories of equipment costs. First is truck and trailer payment costs, which
includes all expenses related to the purchase or lease of truck-tractors and trailers. Second is
repair and maintenance costs, which includes parts and labor as well as roadside service but
excludes tire-related expenses and towing or recovery. Third is tire costs.
Truck and Trailer Payment Costs
The Class 8 truck-tractor market in 2023 continued its correction from the historic COVID-19
pandemic markets of 2020 and 2021. Prices moderated as availability in the new and used
equipment markets improved, largely due to a drop in truck demand as freight rates remained
poor. Yet the industry-wide average truck and trailer payment cost increased by 8.8 percent to
$0.360 per mile as fleets continued making payments on expensive trucks bought in 2022.
As data from J.D. Power in Figure 11 shows, used Class 8 sleeper prices continued to fall
steadily through most of 2023.27 Even so, the lowest average price of the year (December) was
higher than that of any month prior to April 2021.
Figure 11: J.D. Power Average Used Class 8 Sleeper Price
Wards Intelligence data in Figure 12 shows that new Class 8 sales in the second half 2023 were
consistently below 2022 levels. Despite speculations that a soft freight market would lead to
27 J.D. Power Valuation Services, “Commercial Vehicle Guidelines” (May 2024),
https://discover.jdpa.com/hubfs/Files/Industry%20Campaigns/Valuation%20Services/5.2024_CommercialVehicleGuid
elines.pdf.

An Analysis of the Operational Costs of Trucking: 2024 Update 29
capacity reductions and thus fewer orders, however, truck sales mostly remained above sales
figures from 2021 and the first half of 2022.28
Figure 12: Wards Intelligence New Class 8 Sales
The way these market dynamics translated into costs varied considerably across fleet sector
and size (Figure 13). In the truckload sector, fleets with 26 to 100 and 251 to 1,000 trucks spent
more on equipment than their competitors, though in general larger fleets tended to spend more
on equipment. The average per-mile truck and trailer cost increased for truckload fleets of most
sizes. Truckload fleets with fewer than five trucks tend to have the lowest costs in this area
because they tend to run equipment longer. In some instances, their payments are financed
over a longer term; in other instances, these fleets have already paid off their trucks and trailers.
Among specialized fleets, where there was no overarching pattern to equipment expenses, as
most fleet sizes actually spent less on trucks and trailers in 2023 than in 2022. The two
exceptions to this trend were fleets with 26 to 100 trucks and 251 to 1,000 trucks, which spent
markedly more per mile.
28 Connor D. Wolf, “US Class 8 Truck Sales Decline 13% in April,” Transport Topics (May 13, 2024),
https://www.ttnews.com/articles/class-8-truck-sales-april-2024.

30 An Analysis of the Operational Costs of Trucking: 2024 Update
Figure 13: Truck and Trailer Lease or Purchase Costs per Mile by Fleet Sector and Size
There are several possible reasons why these two fleet size groups, 26 to 100 and 251 to 1,000
trucks, spent so much more on equipment across all sectors. First, the 26 to 100 fleet size
category is often the most expensive in which to operate. In 2021 and 2022 it also had either
the highest or second-highest equipment payment costs in both sectors. Second, many large
carriers expanded organically between 2022 and 2023 despite adverse economic conditions, as
discussed in the Capacity section below, requiring additional expenditures on trucks and trailers.
Returning Operational Costs participants increased the number of trucks in their fleet by 4.1
percent.29 Such growth has a greater marginal impact on a fleet with, for example, 300 trucks
than a fleet with 3,000 trucks.
LTL carriers spent an average of $0.394 on truck and trailer payments, which was also above
the overall industry average during a year in which many LTL carriers expanded fleet sizes to
capture open market share.
Repair and Maintenance
After increasing by double-digit percentages for the previous two years, repair and maintenance
costs rose by only 3.1 percent between 2022 and 2023. This comparatively small change came
even as average annual mileage per truck slightly increased (as shown above) and inflation
rose by 3.4 percent.
Figure 14 shows how repair and maintenance costs varied by sector and fleet size. Among
truckload carriers, repair and maintenance costs generally declined as fleet size increased.
29 This calculation excludes large changes in truck totals that could be indicative of acquisitions rather than organic
growth.

An Analysis of the Operational Costs of Trucking: 2024 Update 31
Though fleets with fewer than five trucks spent the least on truck and trailer payments, they
spent the most on repair and maintenance.
Specialized fleets had comparatively less cost variation by fleet size, with just a fraction of one
cent separating fleets with 5 to 25 trucks and 26 to 100 trucks from fleets with 251 to 1,000
trucks. The one major exception was specialized fleets with more than 1,000 trucks, which
spent roughly 33 percent less than the rest of the sector and were thus much more comparable
to very large truckload fleets.
Figure 14: Repair and Maintenance Costs per Mile by Fleet Sector and Size
LTL carriers spent an average of $0.224 per mile on repair and maintenance costs.
According to TMC, repair and maintenance costs fell during two quarters of 2023, resulting in a
negligible year-over-year increase of 0.2 percent.30 Within this category, TMC found that labor
costs increased by 4 percent while parts costs fell by 2.2 percent.31 Falling parts costs indicate
continued correction in pandemic-related parts supply issues as well as the soft freight market.
Labor costs rose only slightly more than consumer inflation (which closed the year at 3.4%),
suggesting that the technician labor market has cooled somewhat from the double-digit
percentage growth it experienced in 2022.
There were also signs that parts and service wait times improved after three years in which
disruptive and costly delays had become the norm for returning equipment to active service.
The average time before beginning a repair improved by an entire half day in 2023 to 2.4 days
30 ATA Technology Maintenance Council and Decisiv, “VMRS System Service Data Quarterly Report” (Q1 2024),
https://tmc.trucking.org/blog/parts-and-labor-costs-fell-slightly-fourth-quarter-2023.
31 Ibid.

32 An Analysis of the Operational Costs of Trucking: 2024 Update
from 2.9 days in 2022.32 Technician efficiency – measured as invoiced hours divided by billed
hours – fell slightly however, from 84 percent in 2022 to 80 percent in 2023.33 Regional
differences in repair and maintenance were significant. In the Northeast, where repair and
maintenance costs were highest (Table 13), technician efficiency was only 67 percent.34
Tires
After increasing by almost half a cent in 2022, per-mile tire costs remained nearly flat in 2023 at
$0.046 – an increase of just one tenth of a cent or 2.2 percent, which was below the 2023
inflation rate.
Similarly, the BLS Producer Price Index (PPI) for truck and bus tire manufacturing shows that
tire prices during the year fell from late-2022 highs and then stabilized.35 While some raw
materials like rubber rose in price, other raw materials like oil, fabric, and cord fell in price.36
Tire prices are also sensitive to demand. The soft freight market in 2023 and over-purchasing in
2022 thus also had a neutralizing effect on tire expenses in 2023.37
Figure 15 shows that there was little difference between tire costs across truckload carrier fleet
sizes in the steady 2023 tire market, aside from very large fleets and OOs. Most truckload fleet
sizes saw marginally lower tire costs on average in 2023 than in 2022. OO tire costs may be
more effectively benchmarked with OOs across sectors rather than with fleets of 5 to 25 trucks
in their own sector.
As usual, specialized fleets spent as much as double on tires when compared to their truckload
peers. Fleets with 250 trucks or fewer tended to spend more on tires than fleets with more than
250 trucks, with the exception of OOs. This tendency stems not only from size but operation
type as well; highly specialized fleets, which wear through more tires or more expensive tires,
tend to be smaller.
32 Fullbay, Motor, and ATA Technology and Maintenance Council, State of Heavy-Duty Repair 2023-2024 (2024),
https://www.fullbay.com/state-of-heavy-duty-repair/.
33 Ibid.
34 Ibid.
35 U.S. Bureau of Labor Statistics, “Producer Price Index by Industry: Tire Manufacturing, Except Retreading: Truck
and Bus (Including Off-the-Highway) Pneumatic Tires [PCU32621132621103]” (accessed May 22, 2024),
https://fred.stlouisfed.org/series/PCU32621132621103.
36 John Healy, “Will Tire Prices Come Down in 2024?” Modern Tire Dealer (February 5, 2024),
https://www.moderntiredealer.com/retail/article/33021152/will-tire-prices-come-down-in-2024.
37 David Sickels, “The commercial tire market is cautiously recovering from 2023 challenges,” Tire Review (May 1,
2024), https://www.tirereview.com/commercial-tire-market-cautiously-recovering/.

An Analysis of the Operational Costs of Trucking: 2024 Update 33
Figure 15: Tire Costs per Mile by Fleet Sector and Size
LTL carriers spent $0.043 per mile on tires, slightly below the industry-wide average.
Looking Ahead
Truck and trailer markets show signs of continued cooling in 2024. New Class 8 sales were
down by over 1,000 units in each of the first four months of 2024 compared to a year earlier,
and used Class 8 sleeper prices in 2024 have thus far leveled just above the $60,000 mark
(Figures 11 and 12).38 Truck and trailer payment costs will also experience some downward
pressure from the auctions of Yellow’s fleet in spring 2024.39 In the first two months of 2024,
carriers reported an increase of 3.8 percent in truck and trailer payment costs per mile on
average compared with 2023.
Truck and trailer payment costs do not move directly with market availability and pricing,
however, because many fleets finance their truck purchases or leases over two to five years.
Many fleets that acquired trucks in 2022 will continue making elevated payments on those
assets in 2024, and some will continue to do so in 2025 and 2026.
The repair and maintenance trends observed in 2023 persisted in early 2024 and point toward
another year of only moderate increases in that cost center. Contributing factors, as discussed
earlier, include improved parts sourcing, a slightly less competitive technician labor market, and
38 Connor D. Wolf, “US Class 8 Truck Sales Decline 13% in April,” Transport Topics (May 13, 2024),
https://www.ttnews.com/articles/class-8-truck-sales-april-2024; J.D. Power Valuation Services, “Commercial Vehicle
Guidelines” (May 2024),
https://discover.jdpa.com/hubfs/Files/Industry%20Campaigns/Valuation%20Services/5.2024_CommercialVehicleGuid
elines.pdf.
39 Keiron Greenhalgh, “First Yellow Trucks and Trailers Up for Auction March 5,” Transport Topics (February 28,
2024), https://www.ttnews.com/articles/yellow-trucks-trailers-sale.

34 An Analysis of the Operational Costs of Trucking: 2024 Update
newer truck-tractors with a lower average age of 3.8 years. TMC and Decisiv observed a 1.7
percent decrease in repair and maintenance costs during Q1 2024 compared with the previous
quarter.40 In the first two months of 2024, carriers reported an increase of 2.0 percent in repair
and maintenance costs per mile on average compared with 2023 overall.
Tire manufacturers anticipate flat prices in the commercial tire segment in 2024 due to flat
demand projections and supply backlogs among dealers.41 While the price of oil – the key
component of tires – remains uncertain, it is well below the levels seen during the 2022 spike,
and the prices of other components remain stable.42 The BLS tire PPI has remained at roughly
the same level since Q2 of 2023 through Q2 of 2024, a further indicator of consistency in tire
costs.43 In the first two months of 2024, carriers reported a decrease of 1.8 percent in tire costs
per mile on average compared with 2023.
Truck Insurance
After hovering between $0.086 and $0.088 per mile for three years, marginal insurance costs
increased by 12.5 percent in 2023 to $0.099 per mile. This figure includes auto liability and
cargo insurance coverage but not physical damage coverage.
Most truckload carriers saw per-mile increases in insurance premiums. There was
comparatively low differentiation in costs among truckload fleet sizes, with just 1.1 cents per
mile separating fleets with fewer than 5 trucks from fleets with 251 to 1,000 trucks. The major
exception was truckload fleets with 5 to 25 trucks, a group that often includes more new entrant
fleets. New fleets often have significantly higher premiums because they do not yet have
enough loss history for insurers to evaluate.
Specialized fleets of all sizes, however, saw little change between 2022 and 2023. Figure 16
shows that, as usual, larger fleets enjoyed economies of scale on insurance premiums at the
per-mile level, with costs generally decreasing as fleet size increased.
40 ATA Technology Maintenance Council and Decisiv, “VMRS System Service Data Quarterly Report” (Q2 2024),
https://tmc.trucking.org/blog/parts-and-labor-costs-continue-downward-trend-first-quarter-2024.
41 Christian Hinton, “Flat demand, rising costs cloud commercial tire dealer outlook in 2024,” Fleet Equipment
(January 3, 2024), https://www.fleetequipmentmag.com/commercial-tire-outlook-2024/.
42 John Healy, “Will Tire Prices Come Down in 2024?” Modern Tire Dealer (February 5, 2024),
https://www.moderntiredealer.com/retail/article/33021152/will-tire-prices-come-down-in-2024.
43 U.S. Bureau of Labor Statistics, “Producer Price Index by Industry: Tire Manufacturing, Except Retreading: Truck
and Bus (Including Off-the-Highway) Pneumatic Tires [PCU32621132621103]” (accessed May 22, 2024),
https://fred.stlouisfed.org/series/PCU32621132621103.

An Analysis of the Operational Costs of Trucking: 2024 Update 35
Figure 16: Commercial Auto Insurance Premium Costs per Mile by Fleet Sector and Size
LTL carriers – which tend to be large and often utilize self-insurance – spent $0.045 per mile on
insurance premiums.
Insurer data from the Council of Insurance Agents & Brokers corroborates this return to steeper
rate increases. In 2021 and 2022, the average quarterly rate of increase for renewals in the
commercial auto segment was 7.4 percent; in 2023, it was 8.7 percent, with an average
increase of 10.4 percent in Q2 renewals.44
The commercial auto insurance segment was profitable in 2021 for the first time in years, as
reported by Fitch Ratings, which helped keep motor carriers’ marginal costs flat in the
subsequent policy year, 2022.45 During 2022, however, the commercial auto segment returned
to an unprofitable combined ratio of 105.4 percent, which helped spur premium increases in
2023.
Potential drivers of unprofitability and premium increases include more expensive equipment,
litigation, inflation, and the surge in net premiums written during the freight boom of 2021 and
2022 as new fleets and capacity entered the market. The total number of large truck crashes
did decrease by 1.6 percent in 2022, but this was insufficient to offset upward pressures on the
cost of risk.46
44 The Council of Insurance Agents & Brokers, Commercial Property/Casualty Market Index (Q4 2023),
https://www.ciab.com/market-intel/pc-market-index-survey/.
45 Fitch Ratings, “U.S. Commercial Auto Insurance Profits Struggle Amid Inflation, Litigation” (September 27, 2023),
https://www.fitchratings.com/research/insurance/us-commercial-auto-insurance-profits-struggle-amid-inflation-
litigation-27-09-2023.
46 Federal Motor Carrier Safety Administration, “Crash Statistics: Summary Report” (accessed May 15, 2024),
https://ai.fmcsa.dot.gov/CrashStatistics.

36 An Analysis of the Operational Costs of Trucking: 2024 Update
Of course, insurance policies do not cover every dollar of expense after a crash. Carriers
typically pay deductibles up to a certain amount and may pay for certain expenses that are not
covered by their policy. Some fleets, especially those with more than 1,000 trucks, self-insure to
reduce exposure to the insurance market and thus pay a larger share of incident costs before
insurance policies respond to a loss. Figure 17 shows how out-of-pocket and premium costs
balanced across fleet sizes.
Figure 17: Auto Insurance Out-of-Pocket and Premium Costs per Mile by Fleet Size
Combined premiums and out-of-pocket expenses per mile tended to decrease as fleet size
increased in 2023, after two years in which larger fleets’ higher out-of-pocket expenses offset
their lower premium costs. This correction suggests improved risk cost management at large
fleets. Meanwhile, out-of-pocket costs increased for all fleet groups with 250 trucks or fewer in
2023 compared with 2022.
Looking Ahead
The commercial auto insurance segment was projected to remain unprofitable in 2023
according to Fitch Ratings.47 Correspondingly, Q1 2024 numbers from the Council of Insurance
Agents & Brokers show a 9.8 percent increase in commercial auto rates, exceeding recent
averages.48 Unlike ATRI’s insurance costs – which only include liability and cargo coverages –
the figures in these sources include physical damage coverage, meaning that they are more
exposed to recent increases in equipment and repair costs. In the first two months of 2024,
47 Fitch Ratings, “U.S. Commercial Auto Insurance Profits Struggle Amid Inflation, Litigation” (September 27, 2023),
https://www.fitchratings.com/research/insurance/us-commercial-auto-insurance-profits-struggle-amid-inflation-
litigation-27-09-2023.
48 The Council of Insurance Agents & Brokers, Commercial Property/Casualty Market Index (Q1 2024),
https://www.ciab.com/market-intel/pc-market-index-survey/.

An Analysis of the Operational Costs of Trucking: 2024 Update 37
carriers reported a 6.8 percent increase in insurance premiums per mile on average compared
with 2023.
There are some positive developments in overall industry safety and in state-by-state litigation
environments, but it does not appear that either will have a cost-saving impact on premiums in
the near term. The number of large truck crashes fell by 7.3 percent in 2023 according to
preliminary FMCSA data – the largest improvement in years, excluding the atypically low total
from the height of the COVID-19 pandemic in 2020.49 If this trend persists, it could lead to
moderated rate increases in late 2024 or 2025.
Finally, the litigation environment improved in several states due to lawsuit abuse reform efforts
over the past year and a half. In Iowa and West Virginia, non-economic damages were capped
at $5 million.50 A new Indiana law made seatbelt use admissible evidence in court.51 In
Montana, third-party litigation funding agreements must now be disclosed.52 Florida adopted a
comparative negligence standard, banned certain misrepresentative plaintiff advertising
techniques, reduced the statute of limitations, and targeted the use of inflated billed totals
instead of the significantly lower amounts actually paid for medical care when calculating
damages (a practice sometimes called “phantom damages”).53 Reforms can beneficially impact
settlements, jury awards, and even premiums for fleets with exposure in their jurisdictions.
Other Marginal Costs
Tolls
After dipping to 2.8 cents per mile in 2022, toll costs rose to 3.4 cents per mile in 2023. Both of
these numbers are well within the standard fluctuation in toll costs over the past decade.
Truckload carriers averaged 2.8 cents per mile, and specialized carriers averaged 2.6 cents per
mile. LTL carriers, by contrast, averaged 5 cents per mile.
Across all sectors, large fleets spent more on tolls per mile than small fleets. For example,
truckload fleets with more than 1,000 trucks spent $0.04 per mile on tolls while truckload fleets
with fewer than 100 trucks spent $0.025 per mile. This is typically the result of smaller fleets
avoiding toll roads or operating on more irregular lanes.
Geography plays a major role in determining a carrier’s toll costs. Tolls were highest in the
Northeast at 5.9 cents per mile, followed by the Midwest at 3.7 cents per mile. All other regions
had average toll costs well below the industry-wide average, yet a fleet’s toll costs may still be
higher in these other regions depending on the specific lanes it runs most.
49 Federal Motor Carrier Safety Administration, “Crash Statistics: Summary Report” (accessed May 15, 2024),
https://ai.fmcsa.dot.gov/CrashStatistics.
50 Noël Fletcher, “New West Virginia Law Countering Civil Suit Abuse Starts July 1,” Transport Topics (April 11,
2024), https://www.ttnews.com/articles/west-virginia-lawsuit-abuse; Dan Ronan, “State Trucking Leaders Detail Tort
Reform Efforts,” Transport Topics (May 9, 2023), https://www.ttnews.com/articles/state-tort-efforts.
51 Daniel Carson, “Indiana businesses win new protections from lawsuits,” Indiana Lawyer (March 27, 2024),
https://www.theindianalawyer.com/articles/businesses-win-new-protections-from-lawsuits.
52 Stephen J. Henning, “Reshaping the Landscape: Tort Reform Efforts Around the States in 2023,” Claims and
Litigation Management (January 31, 2024), https://www.theclm.org/Magazine/articles/tort-reform-bills-around-the-
states-2023/2821.
53 Ibid.

38 An Analysis of the Operational Costs of Trucking: 2024 Update
Thus far, toll costs seem poised to continue their recent rise. In the first two months of 2024,
carriers reported an average increase of 2.8 percent in toll costs per mile compared with 2023.
Permits and Special Licenses
Carriers spent less on permits and special licenses per mile in 2023 than in any year since ATRI
began publishing Operational Costs. At just $0.009 per mile, this represents a drop of 40
percent from $0.015 per mile in 2022. Specialized carriers spent slightly over one cent per mile
in this cost center, while truckload and LTL carriers spent slightly below the industry-wide
average.
In the first two months of 2024, carriers reported no change in permits and special licenses
costs per mile on average compared with 2023.
Efficiency
Marginal costs are shaped in large part by carriers’ efficiency in equipment use, maintenance,
workforce, and operations. This section explores numerous metrics to help assess costs and
understand industry-wide trends.
Deadhead Mileage
Any mileage between stops that does not generate revenue, often called “deadhead” or “empty”
miles, inflates costs and reduces productivity. Deadhead mileage rose from 15.4 percent in
2022 to 16.3 percent in 2023 among non-tank operations. In soft freight markets, deadhead
mileage can worsen as fleets travel farther to secure financially viable loads. This is especially
challenging in periods with relatively high fuel costs.
Tanker carriers expanded on three straight years of improvement to a deadhead percentage of
36.2, despite moving commodities that are less amenable to backhauling.
Strikingly, the group with the lowest percentage of deadhead miles in 2023 was truckload
carriers with fewer than 5 trucks – just 10 percent of their mileage on average was non-revenue
generating. This is a testament to the fact that OOs and small fleets have more tools and
schedule flexibility at their disposal to find and manage loads than ever before.
Dwell Time
Average dwell time improved in 2023 for the second year in a row, to 1 hour and 40 minutes per
stop, shaving 6 minutes off last year’s industry average. Dwell time measures the total time
spent at shipper or receiver facilities, which includes time spent on loading or unloading as well
as non-productive detention time. Figure 18 shows the average dwell time for each sector.

An Analysis of the Operational Costs of Trucking: 2024 Update 39
Figure 18: Dwell Time per Stop by Sector (Hours)
Refrigerated carriers, which have the highest dwell time, spent an average of 2 hours and 31
minutes at each stop in 2023. This was just one minute less than in 2022. Delays were
second-longest among flatbed sectors at 1 hour and 53 minutes per stop on average.
Large fleets have a decided advantage in reducing dwell time, as they are more able to set and
enforce shipper detention fees. Yet even fleets with more than 1,000 trucks experienced an
average delay per stop of 1 hour and 2 minutes.
Fuel Economy and Speed Governors
Fleet-wide fuel economy averaged 6.61 miles per gallon in 2023, a slight dip from 6.68 miles per
gallon in 2022.
To approximate average fuel economy for the U.S. truck-tractor population in addition to this
carrier-to-carrier benchmark, fleet averages were also weighted by the number of trucks in each
fleet and by sector representation. This is because larger fleets tend to have newer trucks and
thus better fuel economy. From this perspective, fuel economy in the national truck population
improved from 7.06 in 2021 to 7.10 in 2022 to 7.27 in 2023.
Table 18 shows the average fuel economy by weight class, calculated with the same truck and
sector weighting.

40 An Analysis of the Operational Costs of Trucking: 2024 Update
Table 18: Industry Average Truck-Tractor MPG by Operating Weight Class
Weight Class (lbs.) Average MPG
30,000-40,000 6.9
40,000-50,000 7.2
50,000-60,000 7.2
60,000-70,000 7.8
70,000-80,000 6.9
80,000-100,000 6.2
Speed governors were used by 88 percent of carrier respondents in 2023, primarily for fuel
economy benefits.54 This figure was lower than 2022 (93%) but remains well within the normal
range. Large fleets are much more consistent than small fleets in their use of governors. While
97 percent of fleets with more than 100 trucks used governors, just 64 percent of fleets with 100
or fewer trucks used governors.
Truck, Driver, and Employee Utilization
As anticipated, the number of trailers per truck in the industry decreased again in 2023 (Table
19). During soft markets, as in 2023, carriers often put off the expense of replacing old trailers
until higher demand requires the greater flexibility and efficiency of a larger trailer pool.
Table 19: Trailer-to-Truck Ratio
Year Average Number of
Trailers per Truck
2023 2.63
2022 2.71
2021 2.82
2020 2.90
2019 2.55
2018 2.70
As Table 20 shows, the average number of drivers per truck was 0.97, remaining roughly
consistent with the past two years. Ratios below 1.0 indicate underutilized or unseated trucks,
which may suggest a soft economy or underproductive asset use.
54 On the impact of fuel prices on governor use, see Alex Leslie and Dan Murray, An Analysis of the Operational
Costs of Trucking: 2023 Update (August 2023).

An Analysis of the Operational Costs of Trucking: 2024 Update 41
Table 20: Driver-to-Truck Ratio
Year Average Number of
Drivers per Truck
2023 0.97
2022 0.98
2021 0.96
2020 1.03
2019
1.02
2018 0.95
Truck drivers are foundational to the industry, but non-driving employees are also vital to
ensuring that drivers have the loads, equipment, and other resources necessary for a carrier to
be successful. Too few non-driving employees could lead to lower quality service or less driver
support, while too many non-driving employees could lead to unnecessary expense.
The number of drivers to non-driving employees is a key metric for assessing this balance.55
The truckload sector had 2.8 drivers for each non-driving employee, slightly lower than their
figure of 3.0 in 2022. LTL carriers also had slightly fewer drivers per non-driving employee in
2023, dipping to 1.2 from 1.4 in 2022. Specialized sectors generally saw their number of drivers
per non-driving employee increase between 2022 and 2023; tankers increased from 3 to 3.6,
refrigerated from 3 to 3.3, and flatbed from 3.3 to 4.
Turnover
Annualized turnover rates among truckload carriers worsened in every fleet size group in 2023
compared to 2022. Smaller fleets continue to enjoy lower turnover, as indicated in Figure 19,
but 2023 metrics show that this is not a certainty. Truckload fleets with 26 to 100 trucks saw
their average turnover rate jump from 29.2 percent in 2022 to 51.0 percent in 2023.
Specialized fleets show a clear break in turnover rates at the 100-truck fleet size, with smaller
fleets achieving lower turnover rates. Turnover in the specialized sectors was generally
consistent in 2023 with 2022.
55 OOs and OO-exclusive fleets are excluded from this calculation, as they have a significant impact on the necessary
number of non-driving employees.

42 An Analysis of the Operational Costs of Trucking: 2024 Update
Figure 19: Average Annualized Driver Turnover Rate by Fleet Sector and Size
LTL turnover rates averaged 20.3 percent in 2023, a slight improvement from 20.6 percent in
2022.
Driver turnover is impacted by a variety of qualitative and quantitative factors, some of which are
within a carrier’s control and others of which are more influenced by economic externalities, the
structure of the industry or drivers’ personal decisions. This year, ATRI analyzed two carrier-
dependent factors that individually impacted turnover.
Large carriers with more than 250 trucks that pay higher compensation (driver pay plus benefits)
have lower turnover with a high level of statistical significance (p < 0.01). The dotted
regression line in Figure 20 shows the average impact of compensation rates on turnover.

An Analysis of the Operational Costs of Trucking: 2024 Update 43
Figure 20: Impact of Driver Compensation on Driver Turnover
Carriers that run fewer miles per truck per year also have lower turnover with a high level of
statistical significance (p = 0.05). This finding aligns with anecdotal and survey evidence that
drivers are placing more value on consistent schedules or work-life balance as opposed to
maximizing mileage and income.56 Figure 21 shows a dotted regression line to indicate the
average impact of annual mileage on turnover.
56 Alex Leslie and Danielle Crownover, Integrating Younger Adults into Trucking Carriers, American Transportation
Research Institute (July 2022), https://truckingresearch.org/2022/07/integrating-younger-adults-into-trucking-careers/.

44 An Analysis of the Operational Costs of Trucking: 2024 Update
Figure 21: Impact of Truck Annual Mileage on Driver Turnover
There are numerous other factors that impact turnover, some of which change over time and
many of which – such as company culture – can be difficult to quantify. Figures 20 and 21
contain considerable variability for this reason. Nonetheless, they attest to the impact of
compensation and annual mileage on turnover in 2023.
Mileage between Breakdowns and In-House Servicing
On average, trucks in respondent fleets traveled 37,700 miles between breakdowns or
unscheduled repairs. Truckload carriers averaged below the industry overall, at 32,000 miles
between breakdowns, while LTL carriers averaged well above the industry overall at 80,817
miles between breakdowns.
It should be noted that fleets can vary considerably – especially within the specialized sectors –
based on their preventative maintenance practices, truck procurement or age, and types of use.
For example, an LTL day cab operated on regular shifts, well-maintained highways, and with
comparatively lighter operating weights can achieve a high number of miles before unscheduled
repairs. By contrast, bulk or agriculture haulers running older equipment, irregular routes and
shifts with heavier loads on less-maintained roadways can often average fewer than 10,000
miles between unscheduled repairs even when supported by reasonable preventative
maintenance programs.
Overall, respondent fleets conducted an average of 54 percent of repair and maintenance in
company-owned shops in 2023. Larger fleets tend to conduct more maintenance in-house, but
the difference between fleet sizes is relatively narrow. Fleets with 26 to 100 trucks conducted
51 percent of maintenance in-house on average, while fleets with more than 1,000 trucks
conducted an average of 61 percent of maintenance in-house.

An Analysis of the Operational Costs of Trucking: 2024 Update 45
LTL carriers conducted 78 percent of maintenance in-house, the largest share of all sectors.
They were followed by refrigerated carriers at 59 percent, truckload carriers at 55 percent,
tankers at 48 percent, and flatbeds at 45 percent.
Fleets that conduct more maintenance in-house benefited from lower per-mile repair and
maintenance costs with a high level of statistical significance (p = 0.01) when adjusted based on
the total mileage run by each fleet. In other words, the more repairs and maintenance
conducted in-house, the more savings a fleet achieved.
Industry Capacity
The freight market remained soft throughout 2023 and the first half of 2024, prompting
speculations for a reduction in capacity – the number of motor carriers and trucks competing for
shipments – as one path for rates to rebound. Many commentators assess changes in industry
capacity with FMCSA registrations and revocations. By this measure, capacity did decrease
somewhat over 2023 on monthly and cumulative bases, yet rates did not improve.57
Registration and revocation numbers primarily reflect OOs and small fleets. Changes within
fleets that remained in the market can have a greater impact on overall industry capacity,
however, because these fleets tend to be larger and thus have a larger impact on the number of
trucks on the road. On average, returning Ops Costs participants increased their fleet size by
4.1 percent between 2022 and 2023.
Another capacity-related metric is the mileage each truck runs. As stated above, the average
annual miles per truck increased in 2023 to 80,159. Furthermore, returning participants
increased their total IFTA mileage by 3.3 percent on average. Together, these data suggest that
the industry likely should not expect a belated improvement in rates based on capacity at the
end of 2023.
The Equipment section above observed two shifts in truck usage in 2023 compared with 2022:
trucks averaged slightly more miles per year (80,159) over slightly fewer days of operation per
year (243). These shifts suggest several possibilities. They may suggest a consolidation of
loads or routes amid the soft freight market; they may also suggest that trucks are driving farther
to secure loads while remaining parked for more days due to an insufficient number of
financially viable loads.
Revenue and Operating Margins
Carriers reported pre-tax operating margins and revenue including fuel surcharges but
excluding other revenue sources such as brokerage or warehousing. This section includes
several benchmarks to assess revenue generation. The first, in Figure 22, is the average
annual revenue per truck for each sector.
57 David Taube, “How industry leaders are analyzing overcapacity data,” Trucking Dive (March 21, 2024),
https://www.truckingdive.com/news/fmcsa-revocations-data-february-2024/708401/; David Taube, “Trucking capacity
rebalances further in Q1,” Trucking Dive (April 5, 2024), https://www.truckingdive.com/news/trucking-capacity-q1-
2024-march-revocations-grants/712082/.

46 An Analysis of the Operational Costs of Trucking: 2024 Update
Figure 22: Average Respondent Annual Revenue per Truck by Sector, 2022-2023
Every sector saw average revenue per truck fall in 2023 compared to 2022 except for
refrigerated carriers, which improved by 5 percent. This was a partial correction of 2022, when
refrigerated carriers were the only sector to experience a drop in revenue per truck (-8.3% from
2021).
ATRI collects revenues inclusive of fuel in order to ensure consistent comparisons with marginal
costs, which include fuel, and to accurately account for the costs of deadhead mileage, which
contribute to reported fuel costs without being recovered through fuel surcharges. As a result,
declining fuel costs and thus lower fuel surcharge revenue can lead to a dip in revenue. For this
reason, it is useful to assess 2023 revenues in light of not only 2022 but 2021 revenues as well.
Most other sectors’ revenue per truck in 2023, while lower than in 2022, still remained at or
above 2021 levels. LTL revenue per truck slid by 1.3 percent to $457,186 in 2023 but was well
above 2021’s $402,239. Similarly, tanker revenue per truck dropped by 5.2 percent to $280,199
but remained well above their 2021 figure of $242,921.
Truckload carrier revenue per truck dropped by a larger 17.5 percent from 2022 to 2023, landing
$566 short of the sector’s 2021 average of $227,262 per truck. Flatbed carriers, however,
dropped 15.2 percent between 2022 and 2023, $15,478 lower than 2021’s average of $225,907
per truck.
2023 was a challenging year for most motor carriers, as rates remained low and costs remained
high. Table 21 lists average operating margins by sector for the past three years, which
declined by multiple percentage points in all sectors except LTL.

An Analysis of the Operational Costs of Trucking: 2024 Update 47
Table 21: Operating Margins by Sector, 2021-2023
Sector
2021 Operating
Margin
2022 Operating
Margin
2023 Operating
Margin
LTL 10% 12% 12%
Tanker 7% 11% 6%
Refrigerated Van 11% 6% 2%
Truckload 10% 8% 3%
Flatbed / Oversize 10% 7% 5%
Though fleet size can have a meaningful impact on carrier profit depending on economic
conditions, many of these differences flattened out under 2023 conditions. All fleet sizes saw a
lower average operating margin than in 2022, the first half of which still had higher rates. Figure
23 compares operating margins by fleet size across the most recent three years.
Figure 23: Average Operating Margin by Fleet Size, 2021-2023
Fleets with 101 to 250 trucks were the most consistent over the past three years, with lower
operating margins than other fleet sizes in 2021 and 2022 but achieving a higher average in
2023 than all other fleet sizes aside from the largest. The 251-to-1,000-truck group performed
lowest, with an average operating margin of just 2.4 percent; it had the most fleets operating at
a loss in 2023 as well as the fewest fleets with double-digit operating margins. Very large fleets
with more than 1,000 trucks continued to have the highest average operating margin at 9.6
percent.

48 An Analysis of the Operational Costs of Trucking: 2024 Update
Figure 24 synthesizes revenue, operating margin, and costs on a per-mile basis for the same
five sectors. Each bar in Figure 24 shows a sector’s average revenue on a per-mile basis,
which allows for direct comparison with their average marginal costs. It also includes average
operating margins represented on a per-mile basis. Finally, ATRI calculates “other costs” simply
by subtracting core marginal costs and profit from revenue. “Other costs” can include any
category of expense not explicitly tracked above, from non-driver payroll to telematics and
technology subscriptions. Analyzing revenue per mile sheds additional light on fleet productivity
and asset use. Furthermore, the percentage of revenue spent on core marginal costs versus
other costs is a useful measure of efficiency.
Figure 24: Average Respondent Revenue, Costs, and Profit per Mile
LTL carriers saw a significant jump in revenue per mile, from $6.977 in 2022 to $7.959 in 2023,
despite their slight dip in revenue per truck. This outcome was likely related to market impacts
of Yellow’s closure. The sector’s average percentage breakdown of core marginal costs,
operating margin, and other costs was otherwise highly consistent with 2022.
Even though flatbed carriers had lower revenue per truck (Figure 22), their revenue per mile
grew between 2022 and 2023, from $3.236 to $3.588. This suggests that flatbeds ran more
trucks for fewer miles in 2023. At the same time, flatbed carriers reported a higher percentage
of revenue spent on other costs: 29 percent in 2023 (Figure 24) versus an unusually efficient 17
percent in 2022.
Tankers were very consistent in revenue per mile ($4.122 in 2023 vs $4.114 in 2022), but they
too had growing costs outside of the core marginal cost centers – 26 percent in 2022 vs 31
percent in 2023 – while core marginal costs continued to take up nearly the same share of
revenue. In other words, other costs may be more responsible for lower profitability than core

An Analysis of the Operational Costs of Trucking: 2024 Update 49
marginal costs – which, as Tables 11 and 12 showed, actually declined slightly among
specialized fleets between 2022 and 2023.
Refrigerated carriers saw per-mile revenues drop from $3.518 to $3.356 as operating margins
fell from 6 percent to 2 percent in 2023. Core marginal costs continued to make up 64 percent
of this total. Other costs, however, rose from 30 percent to 34 percent of revenue – the same
number of percentage points as operating margins fell – or from $1.055 per mile to $1.141 per
mile. Accordingly, as with tankers, rising other costs outside of the core marginal costs may be
an important contributor to lower profitability in addition to lower rates and revenue.
Truckload carriers dropped an average of 28 cents per mile in revenue, from $3.291 in 2022 to
$3.009. During the same time, they spent a consistent share of revenue on other costs but a
larger share of revenue on core marginal costs (66% in 2022 versus 70% in 2023). Unlike
refrigerated carriers and tankers, then, the decline in truckload profitability may thus be more
closely related to rising core marginal costs.
CONCLUSION
In 2023 the average marginal costs of trucking increased to $2.270 per mile. Though this was
just 0.8 higher than the 2022 total, the annual increase with fuel excluded was 6.6 percent (from
$1.610 to $1.716 per mile).
Most costs other than fuel rose during 2023, but they did so at only half the rate experienced
during the previous two years of unprecedented cost spikes. Truck and trailer payments grew
by 8.8 percent in 2023 compared with 18.6 percent in 2022; repair and maintenance costs grew
by 3.1 percent compared with 12.0 percent in 2022; driver wages grew by 7.6 percent compared
with 15.5 percent in 2022. The most notable exception to this trend was truck insurance
premiums, which grew by 12.5 percent after two years of negligible change.
Reduced cost pressures, however moderate, proved vital in a 2023 freight market that severely
challenged motor carrier profitability. Operating margins fell across all fleet sizes and all sectors
other than LTL. Truckload carriers had lower revenues per mile and per truck in 2023 than in
2022, generating an average operating margin of just 3 percent. Average profits in specialized
sectors were little better: 6 percent among tankers; 5 percent among flatbeds; and just 2 percent
among refrigerated carriers. Despite this fact, the report found that capacity increased among
returning participants.
The soft freight market also posed difficulties for industry efficiency. Driver turnover rates rose
across the truckload sector. Deadhead mileage, a key contributor to inflated costs, rose to 16.3
for all non-tank operations. Yet there were also areas of improvement. Average dwell time per
stop improved to 1 hour and 40 minutes, and the ratio of drivers to non-driving employees
improved in the specialized sectors (though it fell slightly in the truckload sector).
Economic conditions do not point to any substantial improvement in freight markets in the
foreseeable future. In the first quarter of 2024, freight rates remained stagnant, GDP growth
was smaller than any of the previous four quarters, and freight shipments and spending both
declined at greater rates than in 2023.58 Retail sales grew in the opening months of 2024 to 3
58 DAT Freight & Analytics, “DAT Trendlines: National Van Rates” (accessed on June 6, 2024),
https://www.dat.com/trendlines/van/national-rates; Bureau of Economic Analysis, “Gross Domestic Product, First
Quarter 2024 (Second Estimate)” (May 30, 2024), https://www.bea.gov/news/2024/gross-domestic-product-first-

50 An Analysis of the Operational Costs of Trucking: 2024 Update
percent year-over-year in April, but manufacturing production slipped during the same period
and erratic month-to-month housing starts numbers remain well below 2021 levels.59
Profitability is determined by not only revenue but costs as well. Even though rates will likely
remain depressed, several indicators in this report suggest that carriers may have opportunities
to attain lower costs over the coming year. Carrier fuel and tire expenses were trending
downward in Q1 2024 as were used Class 8 truck prices, and changes in repair and
maintenance cost increases are below inflation. Fleets of all sizes who can maintain operational
efficiencies and seize cost savings as they emerge will endure this economic environment with
success.
quarter-2024-second-estimate-and-corporate-profits; U.S. Bank, “U.S. Bank Freight Payment Index” (Q1 2024),
https://www.usbank.com/corporate-and-commercial-banking/industry-expertise/transportation/freight-payment-
insights.html.
59 U.S. Census Bureau, “Advance Monthly Sales for Retail and Food Services” (May 15, 2024),
https://www.census.gov/retail/sales.html; U.S. Federal Reserve, “Industrial Production and Capacity Utilization” (May
16, 2024), https://www.federalreserve.gov/releases/g17/current/default.htm; U.S. Census Bureau, “Monthly New
Residential Construction” (May 16, 2024), https://www.census.gov/construction/nrc/pdf/newresconst.pdf.

An Analysis of the Operational Costs of Trucking: 2024 Update 51
APPENDIX: Operational Costs Data Collection Form
OPERATIONAL COSTS OF TRUCKING DATA COLLECTION
The American Transportation Research Institute (ATRI) is conducting its annual for-hire motor carrier
data collection initiative to obtain truck-related operational costs for ATRI’s Operational Costs of
Trucking report. ATRI is seeking cost data for 2023 associated with operating a truck. A final question
asks for estimates on cost trends in the opening months of 2024. The final report will support studies
related to industry productivity, driver issues, and fuel efficiency. Please note that the questions below
are focused on TRACTOR-TRAILER combos only (not straight trucks).
All collected data will be kept completely confidential. Personal, organizational, and/or financial
information will never be released for public use under any circumstance. The final published report
will only be presented in an aggregated, non-identifying format. As needed, ATRI will sign a
confidentiality agreement.
The data collection form can be completed online here, OR by completing this form and returning it via
email to aleslie@trucking.org or via fax to 770-432-0638. Carriers with multiple operating fleets may
submit data separately for each fleet.
All participants submitting a completed, usable data collection form will receive an advance copy of the
2024 Operational Costs of Trucking report. Each participant will also receive a confidential, customized
report directly comparing your operational costs to the operational cost trends of anonymized peer
carriers of the same sector and size.
For any of your costs that were equal to zero in 2023, please explicitly enter “0” in the submission box.
If you have any questions, please contact Alex Leslie at aleslie@trucking.org or 651-641-6162 ext. 2.
CONTACT INFORMATION
1) Please enter your contact information below. Occasionally ATRI will follow up with participants to
clarify answers. Your information will be kept strictly confidential. All participants will receive
an advance copy of the full report as well as a confidential, customized report directly
comparing your operational costs to those of your peer carriers.
Company
Contact Name
Street Address
Position/Title
City, State
Zip
Phone
Email

52 An Analysis of the Operational Costs of Trucking: 2024 Update
COSTS DATA
2) What was your fleet’s total IFTA mileage in 2023? (Include Owner-Operator miles reported for IFTA
purposes)
__________________
3) Please list your 2023 average TRUCK-TRACTOR cost per mile for the following key cost
centers, calculated using IFTA miles. (i.e. Tires: .04. If the line-item does not apply to your
operation, please enter N/A. If based in Canada, please report as US Dollars.)
Expense Type
2023
Cost per
Mile USD
Repair & Maintenance
• Include R&M costs, including R&M labor and roadside repairs, for all
trucks and trailers; do not include tire-related expenses.
$
Tires
• Include all purchase, maintenance, re-treading, and replacement costs.
$
Fuel Costs
• Include all IFTA-related fuel. Do not include fuel surcharge revenue.
$
Truck Insurance Premiums
• Include all liability, cargo, and excess liability policy premiums related to
insuring the truck. Do not include workers compensation costs/insurance,
physical damage, jury awards, or out-of-court settlements.
$
Truck and Trailer Lease or Purchase Costs
• Include all payment costs, and interest and fees associated with the
payments. Do not include depreciation tax benefits.
$
Tolls
• If you paid tolls in 2023, what were your costs per mile (total annual toll
costs/annual IFTA miles)? If you had no toll costs in 2023, please enter 0.
$
Permit Costs
• Include permits for oversize/overweight, HazMat, etc. DO NOT include
truck registration or CDL costs.
$
Other
• Please specify: ________________
$
Total
$
4) What was your total out-of-pocket expense for crash liability, cargo, and excess liability
coverage costs below your deductible or self-insured retention (S.I.R.) in 2023? (Do not include
workers compensation, physical damage, jury awards, or out-of-court settlements.)
__________________

An Analysis of the Operational Costs of Trucking: 2024 Update 53
5) Please list the average pay and benefits per IFTA mile ($/mile) OR the average pay and benefits
per hour ($/hour) for TRUCK-TRACTOR SOLO drivers in 2023. (Do not include bonuses in this
question. If there are multiple pay and benefit rates for the same type of driver, please use the
average pay and benefits rates. If you use a different compensation method, e.g. percent of load or
salary, please list it here. LTL carrier averages should include both linehaul and P&D drivers.)
Company Driver /
Company Truck
Owner-Operator
Pay per Mile1
Benefits per Mile2
Pay per Hour1
Benefits per Hour2
Other Compensation Method
(please specify):
1 Pay – Include only base pay. Do not include benefits, incentives, and bonuses.
2 Benefits – Include employer contributions to medical insurance, per diem and other financial benefits to
the driver that are a standard part of employment. Do not include incentives and bonuses.
Please check the benefits you provide to drivers that were included in previous question:
Health Insurance
Paid Vacation
401k
Dental Insurance
Paid Sick Leave
Life insurance
Vision Insurance
Other – please
specify:_____________
Per Diem
Employee Ownership /
Profit Sharing
6) Do you provide any additional financial incentives and/or bonus pay for TRUCK-TRACTOR
SOLO drivers that are not part of their regular wages?
Yes
No
Don’t Know
If yes, what was the average annual incentive and/or bonus pay paid per driver who received the
bonus in 2023? (e.g. Safety Bonus: $2,000. Please report as an annual average paid per driver. Please
only include drivers who received bonuses in 2023.)
Type of Bonus
Company Driver /
Company Truck
Owner-Operator
Safety Bonus
New / Starting Driver Bonus
Referral Bonus
Retention Bonus
Fuel Economy Bonus
Other (please specify):
Other (please specify):

54 An Analysis of the Operational Costs of Trucking: 2024 Update
DEMOGRAPHIC AND WORKFORCE DATA
7) What was your company’s annual trucking-related revenue in 2023? (Include fuel surcharge
revenue; exclude brokerage/logistics revenue)
__________________
8) What was your company’s before-tax operating or profit margin in 2023? (Include as a
percentage)
__________________%
9) What is your primary for-hire business operation type? (Check only one)
10) What are the three primary types of commodities that your company hauls? (While your
company may haul multiple commodities, select only the top 3 most frequently hauled
commodities.)
Agricultural Products
Automotive Parts
Construction/Building Materials
Electronics
Finished Vehicles
Food Products – Refrigerated
Food Products – Non-Refrigerated
Forest Products / Wood
Garbage or Sanitation
General Freight
Hazardous Materials
Heavy Machinery/Equipment
Household Goods
Industrial Gases
Industrial Gases
Intermodal Containers
Livestock
Manufactured Goods
Mine Ores
Modular/Mobile Homes
Non-Hazardous Chemicals
Paper Products
Petroleum Products
Refrigerated Not-Food
Retail Store/General Merchandise
Steel / Metal Sheets, Coils, Etc.
U.S. Mail/Parcel Service
Other (please specify):___________________
Truckload Dry Van
Express / Parcel Service
Less-Than-Truckload
Intermodal Containers
Refrigerated Van
Automotive Transportation
Tanker
Household Goods Mover
Flatbed
Other (please specify):_________________________
Specialized – Oversize/Overweight

An Analysis of the Operational Costs of Trucking: 2024 Update 55
11) Are any of the trucks in your fleet speed-limited or governed?
Yes
No
Don’t Know
12) If you answered yes to previous question, please provide the maximum speed setting and the
percent of your fleet governed at that speed.
Maximum Speed (MPH)
Percent of Trucks
Speed Setting 1
Speed Setting 2
Speed Setting 3
13) Based on your fleet’s IFTA miles, what percentage of your drivers’ trips were in the following
categories in 2023? (Total must sum to 100%)
Local pickups and deliveries (less than 100 miles)
Regional pickups and deliveries (100 – 500 miles)
Inter-regional pickups and deliveries (500 – 1,000 miles)
National (greater than 1,000 miles)
Total 100%
14) Please estimate the percentage of miles traveled by your fleet (include IC/Owner-Operator
miles) in the following regions during 2023. (Total must sum to 100%)
15) How many drivers did your company utilize in 2023 for each type of equipment?
Company Driver /
Company Truck
Leased Driver /
Company Truck
Owner-Operator
Truck-Tractor – Solo Driver
Truck-Tractor – Team Drivers
(Total number of team drivers)
Region % of Total Miles
Midwest
Northeast
Southeast
Southwest
West
Canada
Total
100%

56 An Analysis of the Operational Costs of Trucking: 2024 Update
16) How many non-driving employees did your company utilize in 2023?
__________________
17) What was your company’s annualized truck driver turnover rate in 2023?
__________________
TRUCK-TRACTOR AND EFFICIENCY DATA
18) What was your fleet size, average age and average number of miles traveled (including Owner-
Operators) in 2023?
Total Number of
Truck-Tractors
Average Age
(in years)
Average Miles per
Year per Tractor
Average Days of
Use per Year per
Tractor
Truck-Tractors
Trailer Type Number of Units
Average Age (in
years)
28’ Trailer
33’ Trailer
45’ Trailer
48’ Trailer
53’ Trailer
Tank Trailer
Flatbed Trailer
Auto Transporter
Refrigerated Trailer
Intermodal Chassis
Other Trailer (please specify):
Other Trailer (please specify):
Other Trailer (please specify):
19) What percentage of your drivers’ daily mileage was in the following ranges in 2023?
1 – 100 miles
101 – 200 miles
201 – 300 miles
301 – 400 miles
401 – 500 miles
501 + miles
Total 100%

An Analysis of the Operational Costs of Trucking: 2024 Update 57
20) For your fleet of TRUCK-TRACTORS, what is the average loaded weight of a tractor-trailer
combination in pounds? (truck + trailer + cargo)
____________ LBS
21) How long do you typically keep your equipment? (Please check years or miles)
Equipment Type Avg. Trade Cycle Years Miles
Truck-Tractors
Trailers
22) Are any of the TRUCK-TRACTORS in your fleet powered by an alternative fuel? Do not include
diesel, gasoline, biodiesel or renewable diesel fuel.
Yes
No
Don’t Know
23) If you answered yes to previous question, please indicate the number of TRUCK-TRACTORS
in your fleet that use each of the alternative fuels listed below.
Alternative Fuel Type
Number of
Trucks
Compressed Natural Gas (CNG)
Liquefied Natural Gas (LNG)
Liquefied Petroleum Gas (LPG)
Battery Electric Vehicle
Hydrogen Fuel Cell Electric
Vehicle
Other (please specify):
24) How many battery-electric truck charging stations do you have installed currently at your
facilities?
_______
25) Based on your fleet’s total IFTA data for TRUCK-TRACTORS, what was your average fuel
economy in miles per gallon (MPG) for 2023 (i.e. real IFTA miles driven divided by gallons of
fuel purchased)?
_______MPG
26) What percent of your total annual TRUCK-TRACTOR miles were non-revenue/dead-head miles
in 2023?
______ % of total 2023 miles
27) What was your average TRUCK-TRACTOR total dwell time (loading/unloading + detention) per
stop at shipper/receiver facilities in 2023?
______ hours per stop

58 An Analysis of the Operational Costs of Trucking: 2024 Update
28) On average, how many miles do trucks in your fleet run between unscheduled repairs or
breakdowns/failure?
_______ miles
29) What percentage of your fleet’s total repair and maintenance is conducted at in-house or
company-owned shops (versus outside shops)? (Include scheduled and unscheduled
maintenance but not towing expenses.)
______ % in-house
30) Do you pay truck parking costs to your drivers?
Yes, in advance
(via reservation,
pre-paid card, etc.)
Yes, by reimbursement
No
If you answered yes, how much do you pay drivers for truck parking per day on average?
$__________________
31) Please estimate how your TRUCK-TRACTOR costs per mile are trending for the following key
cost centers in January and February 2024 compared to 2023 annual costs:
Expense Type
% Change
Repair & Maintenance
• Include R&M costs, including R&M labor and roadside repairs, for
all trucks and trailers; do not include tire-related expenses.
%
Tires
• Include all purchase, maintenance, re-treading, and replacement
costs.
%
Fuel Costs
• Include all IFTA-related fuel. Do not include fuel surcharge
revenue.
%
Truck Insurance Premiums
• Include all liability, cargo, and excess liability policy premiums
related to insuring the truck. Do not include workers
compensation costs/insurance, physical damage, jury awards, or
out-of-court settlements.
%
Truck and Trailer Lease or Purchase Costs
• Include all payment costs, and interest and fees associated with
the payments. Do not include depreciation tax benefits.
%
Tolls
• If you paid tolls in 2023, what were your costs per mile (total
annual toll costs/annual IFTA miles)? If you had no toll costs in
2023, please enter 0.
%
Permit Costs
• Include permits for oversize/overweight, HazMat, etc. DO NOT
include truck registration or CDL costs.
%
Thank you! We greatly appreciate your participation.
Please return completed data collection form to ATRI via fax 770-432-0638 or email
aleslie@trucking.org.

An Analysis of the Operational
Costs of Trucking: 2024 Update
June 2024
(770) 432-0628
ATRI@Trucking.org
TruckingResearch.org
Atlanta, GA • Minneapolis, MN • Washington, DC • Sacramento, CA


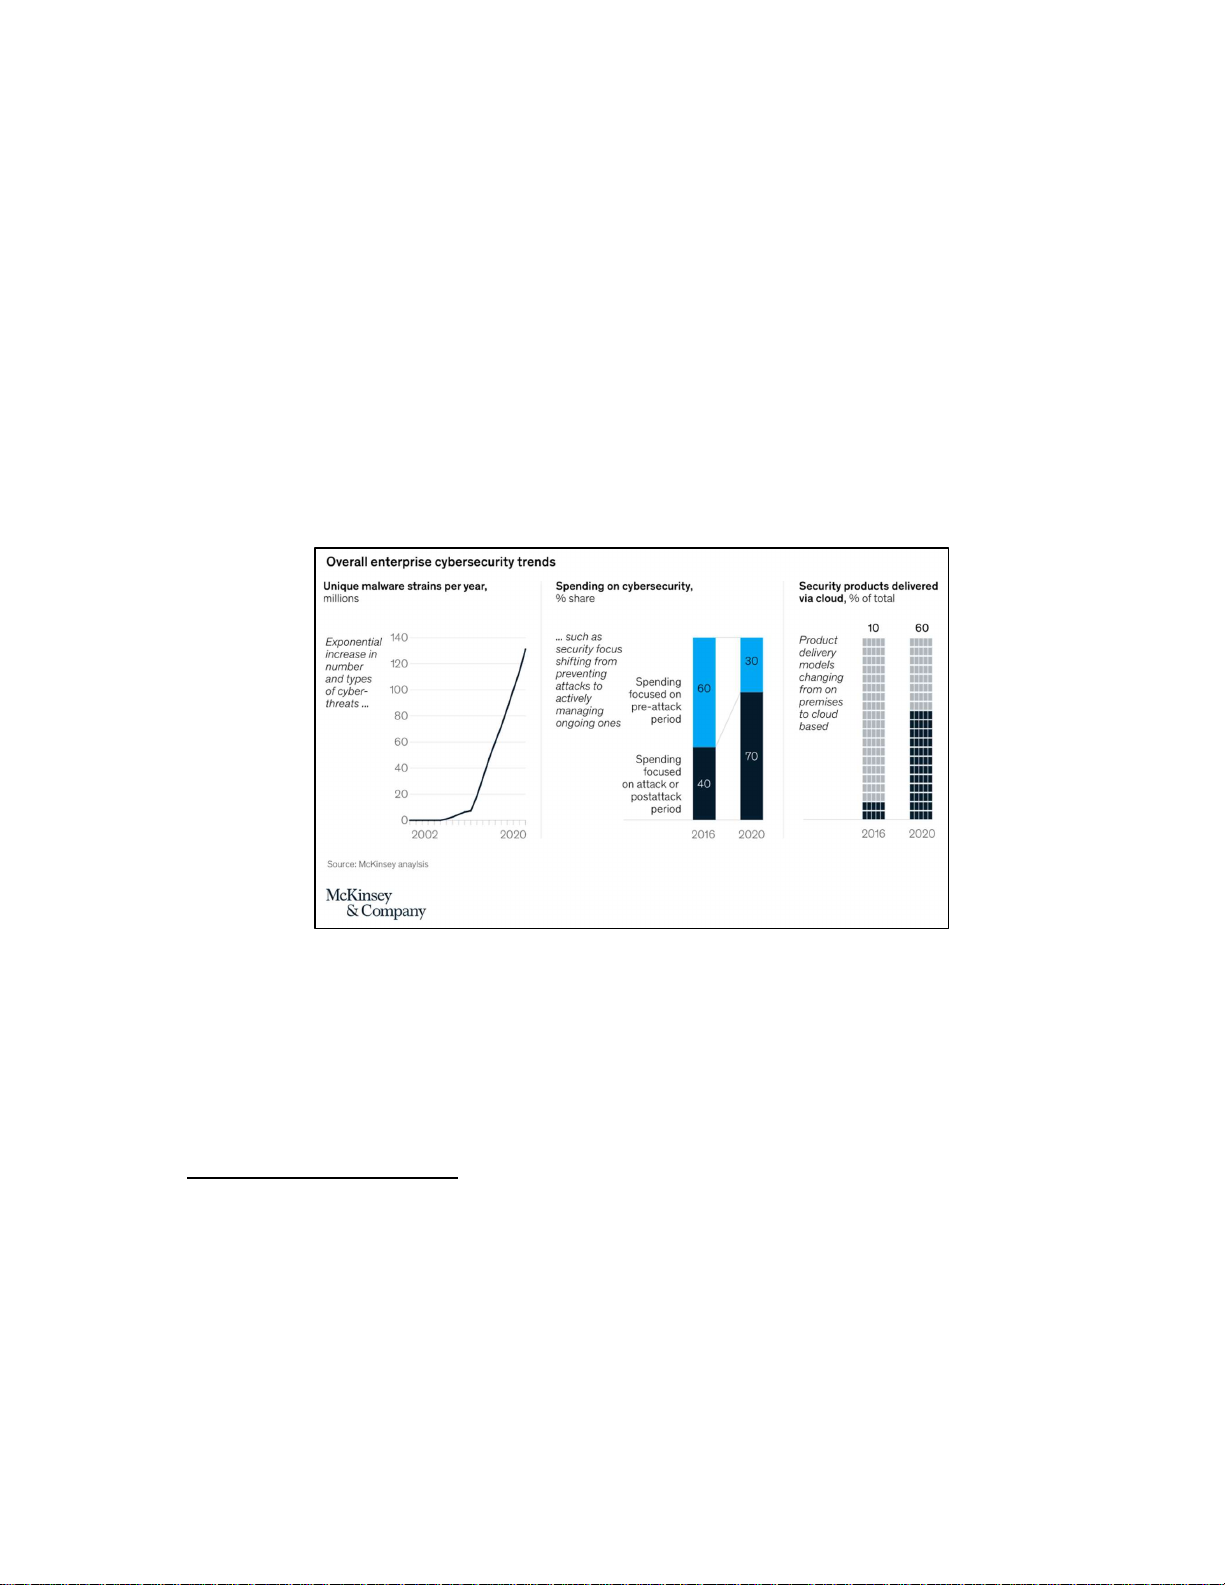


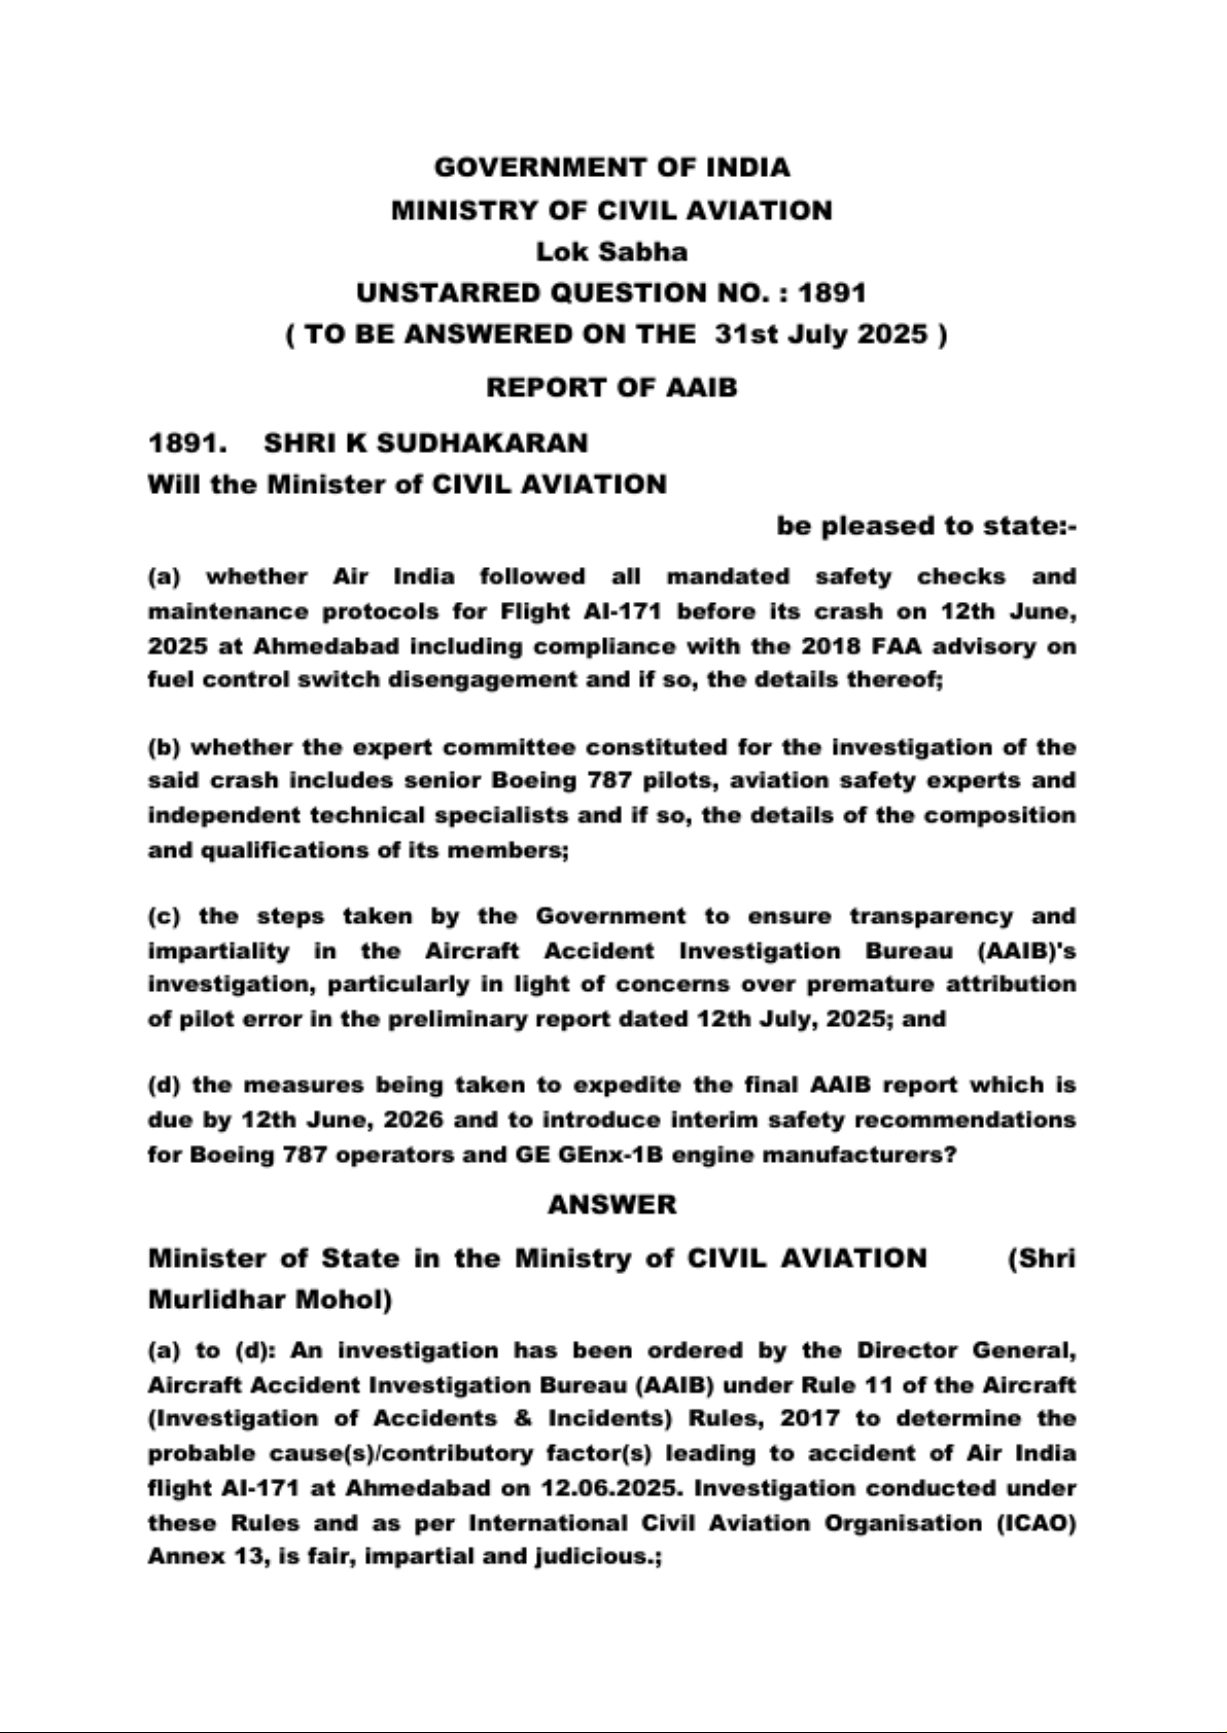
![Manifest der Kommunistischen Partei [1848]](https://s3.us-east-1.amazonaws.com/outstation.idea/pdf-mt/2049398369888194560/pdf/e875ac5a-8f4c-40f1-9b7e-ed0572e6f7f8/imgs/page1.png)