Anti-D prophylaxis should protect all newborns from haemolytic disease, regardless of their country of residence PDF Free Download
1 / 97/97
100%

The International Journal of Transfusion Medicine
ISSN 0042-9007 (Print)
ISSN 1423-0410 (Online)
Volume 119 Number 12 DECEMBER 2024
IN THIS ISSUE
Anti-D prophylaxis should protect all newborns from haemolytic disease, regardless
of their country of residence
Regular whole blood donation and gastrointestinal, breast, colorectal and haematological
cancer risk among blood donors in Australia
Introduction of 7-day amotosalen/ultraviolet A light pathogen-reduced platelets
in Honduras: Impact on platelet availability in a lower middle-income country
Ethnic diversity in Chilean blood groups: A comprehensive analysis of genotypes,
phenotypes, alleles, and the immunogenic potential of antigens in Northern,
Southern and Central regions

Aims and Scope
Vox Sanguinis
reports on all issues related to transfusion medicine, from donor vein to recipient vein, including cellular therapies. Comments, reviews, original articles, short reports and
international fora are published, grouped into eight main sections:
1. Donors and Donations: Donor recruitment and retention; Donor selection; Donor health (vigilance, side effects of donation); Big data analysis and blood donation.
2. Blood Component Collection and Production: Blood collection methods and devices (including apheresis); Blood component preparation and storage; Inventory management;
Collection and storage of cells for cell therapies; Quality management and good manufacturing practice; Automation and information technology; Plasma fractionation techniques
and plasma derivatives.
3. Transfusion-transmitted Disease and its Prevention: Identication and epidemiology of infectious pathogens transmissible by blood; Donor testing for transfusion-transmissible
infectious pathogens; Bacterial contamination of blood components; Pathogen inactivation.
4. Transfusion Medicine and New Therapies: Transfusion practice, thresholds and audits; Transfusion efcacy assessment, clinical trials; Non-infectious transfusion adverse events;
Therapeutic apheresis.
5. Haemovigilance: Near misses, adverse events and side effects throughout the transfusion chain; Monitoring, reporting and analysis of those adverse events and side effects;
Activities aiming at increasing the safety of the whole transfusion chain; Standardization of the definition of adverse events and side effects.
6. Patient Blood Management: Caring for patients who might need a transfusion; Transfusion indication decision-making process; Search for the optimal patient outcomes; Study of
transfusion alternatives; Autologous blood transfusion.
7. Immunohaematology: Red cell, platelet and granulocyte immunohaematology; Blood phenotyping and genotyping; Molecular genetics of blood groups; Alloimmunity of blood;
Pre-transfusion testing; Autoimmunity in transfusion medicine; Blood typing reagents and technology; Immunogenetics of blood cells and serum proteins: polymorphisms and
function; Complement in immunohaematology; Parentage testing and forensic immunohaematology.
8. Cellular Therapies: Cellular therapy (sources; products; processing and storage; donors); Cell-based therapies; Genetically modied cell therapies; Stem cells (sources, collection,
processing, storage, infusion); Cellular immunotherapy (e.g., CAR-T cells, NK cells, MSC); Cell-based regenerative medicine; Molecular therapy; In vitro manufacturing of blood
components.
Vox Sanguinis also publishes the abstracts associated with international and regional congresses of the ISBT. (Abstracts from meetings other than those held by the ISBT are not accepted.)
Information for Subscribers:
Vox Sanguinis
is published in 12 issues per year. Institutional subscription prices for 2024 are: Print & Online: US$2443 (US), US$2848 (Rest of World),
€1706 (Europe), £1323 (UK). Prices are exclusive of tax. Asia-Pacic GST, Canadian GST/HST and European VAT will be applied at the appropriate rates. For more information on
current tax rates, please go to www. wileyonlinelibrary.com/ tax-vat. The price includes online access to the current and all online backles for previous 5 years, where available. For
other pricing options, including access information and terms and conditions, please visit https://onlinelibrary.wiley.com/library-info/products/price-lists. Terms of use can be found
here: https://onlinelibrary.wiley.com/terms-and-conditions.
VOX SANGUINIS (Online ISSN: 1423-0410 Print ISSN: 0042-9007) is published monthly. Postmaster: Send all address changes to VOX SANGUINIS, Wiley Periodicals LLC, C/O The
Sheridan Press, PO Box 465, Hanover, PA 17331, USA.
Copyright and Copying (in any format): Copyright © 2024 International Society of Blood Transfusion. All rights reserved. No part of this publication may be reproduced, stored or
transmitted in any form or by any means without the prior permission in writing from the copyright holder. Authorization to copy items for internal and personal use is granted by the
copyright holder for libraries and other users registered with their local Reproduction Rights Organisation (RRO), e.g. Copyright Clearance Center (CCC), 222 Rosewood Drive, Danvers,
MA 01923, USA (www.copyright.com), provided the appropriate fee is paid directly to the RRO. This consent does not extend to other kinds of copying or use such as copying for general
distribution, for advertising or promotional purposes, for republication, for creating new collective works, for resale, or for articial intelligence tools or technologies. Permissions for
such reuse can be obtained using the RightsLink “Request Permissions” link on Wiley Online Library. Special requests should be addressed to: permissions@wiley.com
Delivery Terms and Legal Title: Where the subscription price includes print issues and delivery is to the recipient’s address, delivery terms are Delivered at Place (DAP); the recipient
is responsible for paying any import duty or taxes. Title to all issues transfers Free of Board (FOB) our shipping point, freight prepaid.
Claims for Missing or Damaged Print Issues: Our policy is to replace missing or damaged copies within our reasonable discretion, subject to print issue availability, subject to the terms
found at Section V, Part C at https://onlinelibrary.wiley.com/library-info/products/price-lists/title-by-title-terms-and-conditions#print-subscriptions.
Back Issues: Single issues from current and recent volumes are available at the current single issue price from cs-journals@wiley.com. Earlier issues may be obtained from https://
wolsupport.wiley.com/s/article/purchasing-single-issues-or-back-volumes.
Disclaimer: The Publisher, International Society of Blood Transfusion and Editors cannot be held responsible for any errors in or any consequences arising from the use of
information contained in this journal. The views and opinions expressed do not necessarily reect those of the Publisher or the International Society of Blood Transfusion and
Editors, neither does the publication of advertisements constitute any endorsement by the Publisher or the International Society of Blood Transfusion, Editors, or Authors of the
products advertised.
Publisher: Vox Sanguinis is published by Wiley Periodicals LLC, 111 River St., Hoboken, NJ 07030-5774 USA
Journal Customer Services: For ordering information, claims and any enquiry con-cerning your journal subscription please visit our Online Customer Help at https://wolsupport.wiley.
com/s/con-tactsupport or contact your nearest ofce. Americas: Email: cs-journals@wiley.com; Tel: +1 877 762 2974. Europe, Middle East and Africa: Email: cs-journals@wiley.com;
Tel: +44 (0) 1243 684083. Germany, Austria, Switzerland, Luxembourg, Liech-tenstein: cs-germany@wiley.com; Tel: 0800 1800 536 (Germany). Asia Pacic: Email: cs-journals@wiley.
com; Tel: +65 6511 8000. Japan: For Japanese speaking support, Email: cs-japan@wiley.com; Tel: +65 3165 0890. For a full list of frequently asked questions, please visit https://
wolsupport.wiley.com/s.
Production Editor: Paulo Cabada (email: VOX@wiley.com).
Corporate Responsibility & ESG: ESG (Environmental, Social, Governance) is essential to Wiley’s mission of unlocking human potential. For over two centuries, Wiley has a history of
helping the world’s researchers, learners, innovators, and leaders achieve their goals and solve the world’s most important challenges. We take our role as a corporate citizen seriously
and are guided by transparency, accountability, and industry best practices. Through intentional climate action and strategic social impact, ESG advances Wiley’s commitment to
sustainability, positive impact, and leading global change. Follow our progress at https://www.wiley.com/en-us/corporate-responsibility.
View this journal online at wileyonlinelibrary.com/journal/vox
Wiley is a founding member of the UN-backed HINARI, AGORA, and OARE initiatives. They are now collectively known as Research4Life, making online scientic content available free
or at nominal cost to researchers in developing countries and enabling more researchers to publish open access by providing publisher backed waivers and discounts. Please visit Wiley’s
Content Access – Corporate Citizenship site: https://www.wiley.com/en-us/corporate-responsibility.
Printed in the UK by Hobbs the Printers Ltd.
Abstracting and Indexing Services: The Journal is indexed by Abstracts in Anthropology (Sage); Abstracts on Hygiene & Communicable Diseases (CABI); Academic Search (EBSCO
Publishing); Academic Search Alumni Edition (EBSCO Publishing); Academic Search Premier (EBSCO Publishing); AGRICOLA Database (National Agricultural Library); BIOBASE:
Current Awareness in Biological Sciences (Elsevier); Biological Abstracts (Clarivate Analytics); BIOSIS Previews (Clarivate Analytics); CAB Abstracts® (CABI); CABDirect (CABI); CAS:
Chemical Abstracts Service (ACS); CSA Biological Sciences Database (ProQuest); CSA Environmental Sciences & Pollution Management Database (ProQuest); CSA Virology & AIDS
Abstracts (ProQuest); Current Contents: Life Sciences (Clarivate Analytics); Embase (Elsevier); Global Health (CABI); HEED: Health Economic Evaluations Database (Wiley-Blackwell);
Index Veterinarius (CABI); Journal Citation Reports/Science Edition (Clarivate Analytics); MEDLINE/PubMed (NLM); Nutrition Abstracts & Reviews Series A: Human & Experimental
(CABI); Pig News & Information (CABI); ProQuest Central (ProQuest); ProQuest Health & Medical Complete (ProQuest); ProQuest Research Library (ProQuest); Protozoological
Abstracts (CABI); PubMed Dietary Supplement Subset (NLM); Review of Medical & Veterinary Entomology (CABI); Review of Medical & Veterinary Mycology (CABI); Rural Development
Abstracts (CABI); Science Citation Index (Clarivate Analytics); Science Citation Index Expanded (Clarivate Analytics); Tropical Diseases Bulletin (CABI); Veterinary Bulletin (CABI).
Open Access:
Vox Sanguinis
accepts articles for Open Access publication. Please visit https://authorservices.wiley.com/author-resources/Journal-Authors/open-access/hybrid-open-
access.html for further information about Open Access.
For submission instructions, subscription and all other information visit: www.wileyonlinelibrary.com/journal/vox.
Vox Sanguinis
Internaonal Journal of Blood Transfusion
14230410, 2024, 12, Downloaded from https://onlinelibrary.wiley.com/doi/10.1111/vox.13470 by Cornell University E-Resources & Serials Department, Wiley Online Library on [24/02/2025]. See the Terms and Conditions (https://onlinelibrary.wiley.com/terms-and-conditions) on Wiley Online Library for rules of use; OA articles are governed by the applicable Creative Commons License

Vox Sanguinis
Internaonal Journal of Blood Transfusion
Ofcial Journal of the International Society of Blood Transfusion
Founded 1956 by J. J. van Loghem, L. P. Holländer, J. Dausset, A. Hässig and J. Julliard (formerly Bullen of the Central Laboratory of the Blood Transfusion Service of the Dutch Red
Cross, founded 1951)
Editor-in-Chief
Miquel Lozano,
Barcelona, Spain
Section Editors
Blood Component Collection and Production
Denese C. Marks,
Sydney, Australia
Cellular Therapy
Zbigniew ‘Ziggy’ M. Szczepiorkowski,
Lebanon, NH, USA
Donors and Donations
Katja van den Hurk,
Amsterdam, the Netherlands
Haemovigilance
Claudia Cohn,
Minneapolis, MN, USA
Immunohaematology and Immunogenetics
Jill R. Storry,
Lund, Sweden
International Forum
Nancy M. Dunbar,
Lebanon, NH, USA
Patient Blood Management
Nelson Tsuno,
Tokyo, Japan
Reviews
Zbigniew ‘Ziggy’ M. Szczepiorkowski,
Lebanon, NH, USA
Leo van de Watering,
Amsterdam, the Netherlands
Transfusion Medicine and New Therapies
Pierre Tiberghien,
Paris, France
Transfusion-transmitted Disease and its Prevention
Sheila O’Brien,
Ottawa, Canada
Editorial Board
Arwa Al-Riyami,
Muscat, Oman
Claire Armour Barrett,
Bloemfontein, South Africa
Thierry Burnouf,
Taipei, Taiwan
Andreas Buser,
Basel, Switzerland
Maria-José Colomina,
Barcelona, Spain
Marcela Contreras,
London, UK
Christian Erikstrup,
Aarhus, Denmark
Helen Faddy,
Petrie, Australia
Hendrik Feys,
Mechelen, Belgium
Ruchika Goel,
Springeld, IL, USA
Salwa Hindawi,
Jeddah, Saudi Arabia
Axel Hofmann,
Perth, Australia
Yanli Ji,
Guangzhou, China
Mickey Koh,
London, UK and Singapore
Linda Larsson,
Stockholm, Sweden
Bridon M’Baya,
Blantyre, Malawi
Wolfgang R. Mayr,
Vienna, Austria
Pieter van der Meer,
Amsterdam, the Netherlands
Celina Montemayor,
Toronto, Canada
Shirley Owusu-Ofori,
Kumasi, Ghana
Luca Pierelli,
Rome, Italy
France Pirenne,
Créteil, France
Sandra Ramirez-Arcos,
Ottawa, Canada
Veera Sekaran Nadarajan,
Kuala Lumpur, Malaysia
Ratti Ram Sharma,
Chandigarh, India
Eilat Shinar,
Ramat Gan, Israel
Claude Tayou Tagny,
Yaounde, Cameroon
Vip Viprakasit,
Bangkok, Thailand
Silvano Wendel,
São Paulo, Brazil
Scientic/Medical Illustrator
Alison Schroeer,
Thompson, CT, USA
Technical Editor
Doug Huestis,
Tucson, AZ, USA
Editorial Ofce
Maria Davie,
Edinburgh, UK
Production Editor
Paulo Cabada,
Manila, the Philippines
ISBT Standing Committee on Vox Sanguinis
Gwen Clarke,
Chairperson, Edmonton, Canada
Lin Fung,
Brisbane, Australia
Martin Smid,
The Netherlands
John Semple,
Sweden
Miquel Lozano,
Editor-in-Chief, Barcelona, Spain
Observers
Pierre Tiberghien,
ISBT President, Paris, France
Jenny White,
ISBT Executive Director, Amsterdam,
the Netherlands
Claire Dowbekin,
Publishing Manager, Wiley, Oxford, UK
Tom Sinden,
Publisher, Wiley, Oxford, UK
Past Editors-in-Chief
J. J. van Loghem, 1956–1960
W. H. Crosby, 1960–1963 (N. and S. America)
L. P. Holländer, 1960–1970 (Europe)
F. H. Allen, 1963–1977 (N. and S. America)
M. G. Davey, 1970–1980 (Africa, Asia and Australia)
N. R. Rose, 1977–1980 (N. and S. America)
C. P. Engelfriet, 1977–1996
M. Contreras, 1996–2003
W. R. Mayr, 2003–2011
D. Devine, 2011–2020
14230410, 2024, 12, Downloaded from https://onlinelibrary.wiley.com/doi/10.1111/vox.13470 by Cornell University E-Resources & Serials Department, Wiley Online Library on [24/02/2025]. See the Terms and Conditions (https://onlinelibrary.wiley.com/terms-and-conditions) on Wiley Online Library for rules of use; OA articles are governed by the applicable Creative Commons License

© 2024 International Society of Blood Transfusion
Vox Sanguinis (2024) 119, 1219–1314
119/12/2024
Commentary
1221 Anti-D prophylaxis should protect all newborns from
haemolytic disease, regardless of their country of
residence M. Contreras, B. Kumpel & N. Olovnikova
Original Article
Donors and Donations
1223 The prototypical UK blood donor, homophily and blood
donation: Blood donors are like you, not me E. Ferguson,
S. Bowen, R. Mills, C. Reynolds, K. Davison, C. Lawrence,
R. Maharaj, C. Starmer, A. Barr, T. Williams, M. Croucher
& S. R. Brailsford
1234 Regular whole blood donation and gastrointestinal,
breast, colorectal and haematological cancer risk
among blood donors in Australia M. M. Rahman,
A. Hayen, J. K. Olynyk, A. E. Cust, D. O. Irving & S. Karki
1245 Questions on travel and sexual behaviours negatively
impact ethnic minority donor recruitment: Effect of
negative word-of-mouth and avoidance E. Ferguson,
R. Mills, E. Dawe-Lane, Z. Khan, C. Reynolds, K. Davison,
D. Edge, R. Smith, N. O’Hagan, R. Desai, M. Croucher,
N. Eaton & S. R. Brailsford
Blood Component Collection and Production
1257 Extending the post-thaw shelf-life of cryoprecipitate
when stored at refrigerated temperatures K. M. Winter,
R. G. Webb, E. Mazur, P. M. Dennington & D. C. Marks
1268 Introduction of 7-day amotosalen/ultraviolet A light
pathogen-reduced platelets in Honduras: Impact on
platelet availability in a lower middle-income country
M. Pedraza, J. Mejia, J. P. Pitman & G. Arriaga
Transfusion Medicine and New Therapies
1278 Evaluation of the progress of a decade-long
haemovigilance programme in India A. Bisht,
G. K. Patidar, S. Arora & N. Marwaha
Immunohaematology
1285 Autoantibodies to ADAMTS13 in human
immunodeciency virus-associated thrombotic
thrombocytopenic purpura M. Meiring, M. Khemisi,
S. Louw & P. Krishnan
1295 Frequency of human platelet antigens (HPA) in the
Greek population as deduced from the rst registry
of HPA-typed blood donors G. Kaltsounis, E. Boulomiti,
D. Papadopoulou, D. Stoimenis, F. Girtovitis
& E. Hasapopoulou-Matamis
1301 Ethnic diversity in Chilean blood groups: A comprehensive
analysis of genotypes, phenotypes, alleles and the
immunogenic potential of antigens in northern, southern
and central regions M. A. Núñez Ahumada, F. P. Gonzalez,
C. A. Aros, A. Canals, L. J. Soza, V. Rodriguez, C. Vargas,
E. Saa & L. Castilho
Letter to the Editor
1310 Outpatient elective intravenous hydration therapy:
Should blood donors be deferred for medical spa
hydration? G. S. Booth, B. D. Adkins,
C. A. Figueroa Villalba, L. D. Stephens & J. W. Jacobs
1313 Events
Contents
14230410, 2024, 12, Downloaded from https://onlinelibrary.wiley.com/doi/10.1111/vox.13470 by Cornell University E-Resources & Serials Department, Wiley Online Library on [24/02/2025]. See the Terms and Conditions (https://onlinelibrary.wiley.com/terms-and-conditions) on Wiley Online Library for rules of use; OA articles are governed by the applicable Creative Commons License

COMMENTARY
Anti-D prophylaxis should protect all newborns from
haemolytic disease, regardless of their country of residence
According to a World Health Organization (WHO) study, the observed
failure rate of substandard and falsified medicines (SFM) in low- and
middle-income countries is estimated to be over 10%, with an esti-
mated spend of US$30.5 billion [1]. The problem embraces drugs in
many areas of healthcare. We report on monoclonal anti-Ds, used for
many years in low- and middle-income countries, for prophylaxis of
RhD haemolytic disease of the foetus and newborn (HDFN), which
have never been shown to meet the standards of anti-D immunoglob-
ulin (Ig). The consequences of using these drugs in postnatal women
might be very serious, even fatal, for their offspring.
The prevention of HDFN by administration of anti-D Ig to
D-negative women has been a triumph of medicine. In Europe, North
America and Australia, before prophylaxis, 16%–17% of D-negative
women delivering ABO-compatible, D-positive infants developed anti-D
after delivery of a second D-positive infant [2]. Several clinical trials, over
6 years, on male volunteers and then on thousands of D-negative primip-
arae delivering ABO compatible, D-positive infants, many of them tested
after delivery of a second D-positive infant, showed that postnatal
anti-D Ig could suppress RhD immunization and hence be used clinically
in women [2]. Anti-D Ig acts, in part, by clearing foetal red blood cells
from the maternal circulation. By 1971, anti-D Ig was introduced into
clinical use in the United Kingdom, where mortality from HDFN fell from
46/100,000 births in 1953 [3] to 1.6/100,000 in 1989 [4]. However, in
several low- and middle-income countries, due to limited availability and
expense of prophylaxis, this success has not occurred, where it was esti-
mated that about 150,000 D-negative pregnancies are affected per
annum, resulting in numerous stillbirths and severely affected infants [5].
Hyperimmune anti-D plasma for the manufacture of anti-D Ig is
obtained mainly by plasmapheresis of paid hyperimmunized subjects in the
United States. It would be ideal if a monoclonal anti-D, in limitless supply,
could replace this polyclonal product. Since 1980, numerous monoclonal
anti-Ds were produced either from human EBV-transformed B cells,
mouse-human heterohybridomas or recombinant anti-Ds from Chinese
Hamster Ovary (CHO) or rat myeloma cells. In human volunteers, monoclo-
nal anti-Ds from mouse or hamster cell lines caused defective red cell clear-
ance and did not prevent RhD immunization [6]. This was attributed to
non-human glycosylation (composition of sugars) of the anti-Ds, which, in
part, changed the patterns of interaction with Fc receptors on mononuclear
phagocytic cells. Glycosylation of antibodies is specific for each species of
cell line used for their production [7].
Bharat Serums and Vaccines Ltd., has marketed, for over
20 years, monoclonal and recombinant anti-Ds, licensed locally in
India. By 2018, Rhoclone had been administered to over 4 million
mothers in India, Asia and Africa. Since then, sales have vastly
expanded. However, despite its wide use, little is known about the dif-
ferent forms of Rhoclone. At first, it derived from a heterohybridoma
from Russia, found to be unsuitable for clinical use because it failed to
show efficacy in trials on volunteers [8]. Recently, Bharat has mar-
keted Trinbelimab, a recombinant CHO cell-derived anti-D. Only four
small clinical non-inferiority trials, of questionable statistical signifi-
cance, have been published on Bharat’s monoclonals (human B
cells [9], heterohybridoma [10, 11] and CHO [12]); about 100 women
in each trial, most with an unknown number of previous pregnancies
or of ABO-compatibility with the newborn (only primigravidae deliver-
ing ABO compatible, D-positive infants and tested after delivery of a
second D-positive infant, should have been studied), received mono-
clonal or recombinant anti-D. None made anti-D at 180 days (about
25% were lost to follow up). A phase IV safety study was published
recently on Trinbelimab [13]. No data on studies in vitro or in
D-negative volunteers can be found in the public domain. We have
tested two lots of Rhoclone in ADCC (antibody-dependent cellular
cytotoxicity assay), a key in vitro predictor of the efficacy of anti-D
in vivo. Unlike polyclonal anti-D Ig, Rhoclone lacked haemolytic activ-
ity, indicating that it is highly unlikely to provide protection from
D-immunization.
Bharat’s anti-Ds would not have passed the stringent licensing cri-
teria required by the Federal Drugs Administration of the USA, the
European Medicines Agency or the : UK Medicines and Healthcare Reg-
ulatory Agency, since their three forms of anti-D have not undergone
the scrupulous scrutiny the polyclonal anti-Ds have. These are new drugs
that each need to be characterized, tested and tried properly, first in
D-negative male volunteers subjected to repeated D-positive red cell
injectionsandtheninatleast1000D-negative primiparae after delivery
of their second D-positive infant [2]. It is of great concern that the manu-
facturer of these drugs is selling them in large quantities without any
solid proof of efficacy. Despite Rhoclonebeingusedinmillionsof
D-negative women, no data are available on the rate of alloimmunization
of such women after delivery of their first ABO-compatible, or of a sec-
ond, D-positive infant—a crucial determinant of the immunosuppressive
effect of the antibody. We have asked the company for post-marketing
data on efficacy but have not received a reply.
Thus, the lack of convincing evidence that Rhoclone has a ben-
eficial prophylactic effect, and the absence of post-marketing data,
should raise great concern to health authorities worldwide. It is
Received: 3 July 2024 Revised: 16 September 2024 Accepted: 20 September 2024
DOI: 10.1111/vox.13745
Vox Sanguinis. 2024;119:1221–1222. wileyonlinelibrary.com/journal/vox © 2024 International Society of Blood Transfusion. 1221

worrying to read that, in Ethiopia, where polyclonal and Bharat’s
anti-Ds are used, 17% of RhD-negative women are still immunized,
suggesting the absence of a prophylactic effect [14]. The same arti-
cle provides even more striking data: 67.9% of alloimmunized
women participating in the testing had received anti-D after their
previous pregnancy.
Fortunately, the real efficacy of Rhoclone will finally be assessed.
Recently, the AFRICARhE project has been launched, with the ulti-
mate goal of eradicating HDFN in Africa [15]. One of the first objec-
tives of this project is to retrospectively evaluate the efficacy of the
anti-Ds from Bharat Serums and Vaccines Ltd. in a post-marketing
Phase IV efficacy study.
Resource poor countries deserve an international regulatory body
that will ensure that the drugs available to them in the market are as
effective as those available in high income countries. There is hope
now, with the WHO Global Surveillance and Monitoring System
(GSMS), for identifying substandard and falsified medical products. In
the absence of an international regulatory body, a first step could be
the reporting, by user countries, of these types of non-fully validated
anti-Ds to the GSMS, thus protecting public health and enabling
informed decisions by clinicians worldwide.
ACKNOWLEDGEMENTS
Perhaps M.C. contributed in greater measure to the historical and clin-
ical aspects, whilst B.M. and N.O. shared the expertise in all aspects
related to monoclonal and recombinant anti-D.
FUNDING INFORMATION
The authors received no specific funding for this work.
CONFLICT OF INTEREST STATEMENT
The authors declare no conflicts of interest. The authors contributed
in equal measure to the writing of this Commentary.
DATA AVAILABILITY STATEMENT
Data sharing is not applicable to this article as no new data were cre-
ated or analyzed in this study.
Marcela Contreras
1
Belinda Kumpel
2
Natalia Olovnikova
3
1
London, UK
2
International Blood Group Reference Laboratory, NHS Blood and
Transplant, Bristol, UK
3
National Medical Research Center for Hematology, National Medical
Research Center for Haematology, Moscow, Russia
Correspondence
Marcela Contreras, 2 Middleton Rd, London NW11 7NS, UK.
Email: prof.mcontreras@gmail.com
REFERENCES
1. World Health Organization. WHO Global Surveillance and Monitor-
ing System for substandard and falsified medical products. Geneva:
WHO; 2017.
2. Mollison PL. Blood transfusion in clinical medicine. 6th ed. Oxford:
Blackwell Scientific Publications; 1979.
3. Contreras M. The prevention of Rh haemolytic disease of the fetus and
newborn—general background. Br J Obstet Gynaecol. 1998;105:7–10.
4. Hussey RM, Clarke CA. Deaths from Rh haemolytic disease in
England and Wales in 1988 and 1989. Br Med J. 1995;303:445–6.
5. Zipursky A, Bhutani VB, Odame I. Rhesus disease: a global preven-
tion strategy. Lancet Child Adolesc Health. 2018;2:536–42.
6. Contreras M, Kumpel B, Olovnikova N. Anti-RhD immunoglobulin
for the prevention of hemolytic disease of the fetus and newborn:
polyclonal versus monoclonal antibodies. The prevention and man-
agement of Rh disease. Global Libr. Women’s Med. 2023. https://
doi.org/10.3843/GLOWM.418843
7. Kumpel BM, Saldova R, Koeleman CAM, Abrahams JL, Ederveen AH,
Armour KL, et al. Anti-D monoclonal antibodies from 23 human and
rodent cell lines display diverse IgG fc-glycosylation profiles that
determine their clinical efficacy. Sci Rep. 2020;10:1464.
8. Olovnikova NI, Belkina EV, Drize NI, Lemeneva LN, Miterev GU,
Nikolaeva TL, et al. Fast clearance of rhesus-positive erythrocytes by
monoclonal anti-rhesus antibodies, an insufficient condition for
effective prophylaxis of rhesus sensitization. Bull Exp Biol Med.
2000;129:77–81.
9. Fonseca MN, Rao SB, Badhwar VR, Turakhia NH, Daftary JV. Safety
and efficacy of monoclonal anti-D immunoglobulin for prevention of
sensitization of Rh negative mothers. Obs and Gynae Today. 2002;8:7.
10. Chauhan AR, Bhattacharyya MS, Turakhia NH, Daftary JV. Efficacy
and safety of monoclonal anti-D immunoglobulin in comparison with
polyclonal anti-D immunoglobulin in prevention of rho isoimmuniza-
tion. J Assoc Physicians India. 2002;50:1341–2.
11. Chauhan AR, Nandanwar YS, Ramaiah A, Yelikar KA, Rashmi MD,
Sachan R, et al. A multicenter, randomized, open-label trial comparing
the efficacy and safety of monoclonal anti-Rh (D) immunoglobulin with
polyclonal anti-Rh (D) immunoglobulin for the prevention of maternal
Rh-isoimmunization. J Obstet Gynecol India. 2019;69:420–5.
12. Mayekar RV, Paradkar GV, Bhosale AA, Sachan R, Beeram S,
Anand AR, et al. Recombinant anti-D for prevention of maternal-
foetal Rh(D) alloimmunization: a randomized multi-centre clinical
trial. Obstet Gynecol Sci. 2020;63:315–22.
13. Naik SN, Gadappa S, Kochar S, Lakshmikantha G, Saigal S, Pukale R,
et al. Post-marketing safety evaluation of recombinant anti-rho
(D) immunoglobulin for the prevention of maternal Rh-isoimmuniza-
tion: a prospective, multi-centre, phase IV study. Indian J Obstet
Gynecol Res. 2023;10:474–81.
14. Maruta MB, Tesfaye K, Birhanu E, Yigazu N, Yuya M, Debella A, et al.
Prevalence and determinants of Rh alloimmunization in Rh-negative
women in teaching hospitals of Addis Ababa, Ethiopia: a hospital based
cross-sectional study. Front Glob Women’s Health. 2023;4:1167736.
15. Verweij E, Tura AK, Gure T, Pyuza J, Mchome B, Kawaza K, et al.
Monoclonal RhD prophylaxis: high time to evaluate efficacy. Lancet.
2024;403:806–7.
How to cite this article: Contreras M, Kumpel B,
Olovnikova N. Anti-D prophylaxis should protect all newborns
from haemolytic disease, regardless of their country of
residence. Vox Sang. 2024;119:1221–2.
1222 COMMENTARY
14230410, 2024, 12, Downloaded from https://onlinelibrary.wiley.com/doi/10.1111/vox.13745 by Cornell University E-Resources & Serials Department, Wiley Online Library on [24/02/2025]. See the Terms and Conditions (https://onlinelibrary.wiley.com/terms-and-conditions) on Wiley Online Library for rules of use; OA articles are governed by the applicable Creative Commons License

ORIGINAL ARTICLE
The prototypical UK blood donor, homophily and blood
donation: Blood donors are like you, not me
Eamonn Ferguson
1,2
| Sarah Bowen
3
| Richard Mills
1,2
|
Claire Reynolds
4
| Katy Davison
5
| Claire Lawrence
6
| Roanna Maharaj
7
|
Chris Starmer
8
| Abigail Barr
8
| Tracy Williams
9
| Mark Croucher
10
|
Susan R. Brailsford
1,4
1
School of Psychology, University of Nottingham
2
National Institute for Health and Care Research Blood and Transplant Research Unit in Donor Health
3
Behavioural Practice, Verian (formally Kantar Public)
4
NHS Blood and Transplant/UK Health Security Agency (UKHSA) Epidemiology Unit, NHSBT
5
NHS Blood and Transplant/UK Health Security Agency Epidemiology Unit, UKHSA
6
LawrencePsychAdvisory
7
UK Thalassaemia Society
8
School of Economics, University of Nottingham
9
Sickle Cell Society, UK
10
NHS Blood and Transplant, Donor Experience Services
Correspondence
Eamonn Ferguson, School of Psychology,
University of Nottingham, Nottingham NG7
2RD, UK.
Email: eamonn.ferguson@nottingham.ac.uk
Funding information
Economic and Social Research Council,
Grant/Award Number: RA1182; NIHR Blood
and Transplant Research Unit in Donor Health
and Behaviour, Grant/Award Number:
NIHR203337
Abstract
Background and Objectives: Homophily represents the extent to which people feel
others are like them and encourages the uptake of activities they feel people like
them do. Currently, there are no data on blood donor homophily with respect to
(i) people’s representation of the average prototypical UK blood donor and (ii) the
degree of homophily with this prototype for current donors, non-donors, groups
blood services wish to encourage (ethnic minorities), those who are now eligible fol-
lowing policy changes (e.g., men-who-have-sex-with-men: MSM) and recipients. We
aim to fill these gaps in knowledge.
Materials and Methods: We surveyed the UK general population MSM, long-term
blood recipients, current donors, non-donors and ethnic minorities (n=785) to
assess perceptions of the prototypical donor in terms of ethnicity, age, gender, social
class, educational level and political ideology. Homophily was indexed with respect
to age, gender and ethnicity.
Results: The prototypical UK blood donor is perceived as White, middle-aged,
middle-class, college-level educated and left-wing. Current donors and MSM are
more homophilous with this prototype, whereas recipients and ethnic minorities
Received: 7 May 2024 Revised: 6 August 2024 Accepted: 9 August 2024
DOI: 10.1111/vox.13731
This is an open access article under the terms of the Creative Commons Attribution License, which permits use, distribution and reproduction in any medium,
provided the original work is properly cited.
© 2024 The Author(s). Vox Sanguinis published by John Wiley & Sons Ltd on behalf of International Society of Blood Transfusion.
Vox Sanguinis. 2024;119:1223–1233. wileyonlinelibrary.com/journal/vox 1223

have the lowest homophily. Higher levels of homophily are associated with an
increased likelihood of committing to donate.
Conclusion: The prototype of the UK donor defined this as a White activity. This, in
part, may explain why ethnic minorities are less likely to be donors. As well as tradi-
tional recruitment strategies, blood services need to consider broader structural
changes such as the ethnic diversity of staff and co-designing donor spaces with local
communities.
Keywords
demography, equality, ethnicity, homophily, prototype, social class
Highlights
•The prototypical UK blood donor is White, middle-aged, middle-class, college-level educated
and left-wing.
•Degree of homophily (the closeness of a person’s perception of the prototypical UK blood
donor to their own demography) predicts decisions to donate.
•Current donors and men-who-have-sex-with-men are more homophilous with the blood
donor prototype; ethnic minorities have the lowest homophily, with White people having the
highest.
INTRODUCTION
People are more likely to join groups, participate in sports, contrib-
ute to community initiatives/activities and seek healthcare if they
feel that people who partake in those activities are similar to them
[1–3]. This is called homophily [1, 3]. Homophily has important impli-
cations for donor services aiming to enhance diversity and equality
in their donor panels by recruiting and retaining donors across more
comprehensive ranges of ethnicity, sexuality and age [4, 5], Specifi-
cally, people who do not perceive themselves to be like—homophi-
lous with—current donors are less likely to donate. This may, in part,
explain why Black people and younger people are less represented in
donor panels [4, 5]. Furthermore, following recent changes to
United Kingdom (UK) donor policy men-who-have-sex-with-men
(MSM) are eligible to donate [6].Thus,itisusefultoknowifMSM
perceive themselves as homophilous to blood donors, as this is likely
to encourage more MSM to donate. Therefore, knowledge of donor
homophily for these groups is important for blood services to aid the
development of inclusive strategies. Finally, the perspective of those
with sickle cell and thalassaemia is critical. As long-term recipients of
blood treatment, efficacy is enhanced with well-matched blood from
ethnic minorities. Thus, these recipients may have concerns about
their treatment if they do not see donors as homophilous for
ethnicity.
Therefore, we explore how people in the UK define the prototyp-
ical blood donor across key demographic characteristics (e.g., age, sex,
ethnicity), from the perspective of different stakeholders (blood
donors, MSM, recipients of blood, people from ethnic minorities) and
how donor homophily predicts active decisions to become a blood
donor [3].
BLOOD DONATION, HOMOPHILY,
PROTOTYPE THEORY AND DONOR
IDENTITY
Greater diversity of donors is beneficial both psychologically
(e.g., increased well-being) [7] and clinically (e.g., improved treatment
of sickle cell disease: SCD) [4]. However, few new young people [5, 8]
and members of ethnic minorities [4] donate blood. As an example,
recruiting and retaining more Black donors will enhance the efficacy
of treating Sickle Cell by better blood matching [4]. Furthermore,
recent changes to UK donor selection policy, based on individualized
sexual behaviour, mean that MSM can donate [6]. Again, MSM are
more likely to decide to donate the greater their perceived homophily
with current donors.
We argue that homophily is an additional structural barrier to
donation. Indeed, many barriers to blood donation have been docu-
mented [9]; including psychological (e.g., fear of needles) and struc-
tural (e.g., convenience, location) factors that influence everyone [9],
and some that are more likely to influence people from the Black com-
munity (e.g., distrust, fear of negative health effects, differential defer-
ral) [10–12]. However, one major structural barrier, not previously
explored with respect to sexuality, ethnicity and age, relates to how
far potential donors perceive themselves as similar to the prototypical
donor—homophily [1, 13]. Theoretical models are described below,
highlighting why this is a potentially important driver/barrier to blood
donor behaviour.
The prototype-willingness model offers a dual-process account of
behaviour driven by a reactive emotional/heuristic and a planned
decision-making route [13]. The emotional/heuristic route encom-
passes the idea of behavioural prototypes: particular behaviours
1224 FERGUSON ET AL.
14230410, 2024, 12, Downloaded from https://onlinelibrary.wiley.com/doi/10.1111/vox.13731 by Cornell University E-Resources & Serials Department, Wiley Online Library on [24/02/2025]. See the Terms and Conditions (https://onlinelibrary.wiley.com/terms-and-conditions) on Wiley Online Library for rules of use; OA articles are governed by the applicable Creative Commons License

(e.g., blood donation) are associated with specific prototypes and the
greater the degree of perceived similarity a person feels to the proto-
type, the more likely they are to perform that behaviour [13, 14].
Linked to prototypicality, is the concept of homophily. Homophily
states that people are more likely to join groups/communities or pro-
totypes to which they feel similar, in terms of both psychological and
demographic characteristics [1, 3]. Conversely, people avoid behav-
iours/groups where homophily is low [2]. Arguably, if people perceive
the typical donor as a member of a group with which they do not
identify, they are less likely to donate blood.
Donor identity, which is a key driver of donor return behaviour
[15, 16], arises not only as a function of donating per se [17] but also
by identifying with similar other donors (prototype and
homophily) [18]. This in-group identity will reinforce the donor’s self-
identity as a donor, encouraging return behaviour, which will ulti-
mately perpetuate the current status quo and donor prototype [18].
Thus, there is a self-reinforcing system whereby homophily enhances
donor self-identity, which in turn enhances return behaviour of homo-
philous people, which then further reinforces self-identity.
Finally, there is a growing realization that ‘space’is partly defined
in terms of demography, including ethnicity, age, gender, social class
and politics and that these characteristics influence who will be likely
to enter these spaces [14, 19]. For example, if blood donors are per-
ceived as being White, then ethnic minorities will be less willing to
enter spaces where blood donation occurs.
WHO ARE THE DONORS?
So, what are the current characteristics of voluntary blood donors?
Regarding demography, in the UK, blood donors tend to be White in
their late 30s to mid-40s, with females slightly outweighing males [5].
Data from other countries indicate that blood donors are of higher
socioeconomic and educational status and are educated to at least
18 years [20]. While there are no data on blood donors’political
views, organ donors, who are also more likely to be blood donors, typ-
ically express a more politically left viewpoint [21]. If the prototype
reflects these objective characteristics, people should view donors as
equally likely to be male or female, of higher social status, educated,
politically left, white and in their early 40s.
Therefore, in this article, we explore the perceived prototypical
blood donor, calculate homophily scores for people from different cul-
tural, social and health backgrounds to quantify their similarity to the
prototypical donor and investigate whether those homophily scores
predict decisions to donate.
METHOD
Sampling
Participants were recruited via (i) Prolific (https://www.prolific.com/
about/) (18–23 November 2021), (ii) the UK Sickle Cell Society (23–
29 November 2021) and (iii) UK Thalassaemia Society (22–29
November 2021). A two-stage sampling process was adopted for the
Prolific sample. An initial gender-balanced UK adult sample was
recruited, and the second was a UK adult sample of non-heterosexual,
non-asexual identifying MSM. The samples were collected consecu-
tively, and additional screening was performed to ensure no repeat
recruitment. MSM were oversampled to explore awareness and
beliefs about the (For the Assessment of Individualised Risk) FAIR pro-
ject (not the focus of this paper). All respondents were paid £1.00 for
participation, consistent with Prolific guidelines. The UK Sickle Cell
Society sent the link to all their relevant social media channels and
their registered members’email list and posted it on their dedicated
blood donation awareness pages, ‘Give Blood, Spread Love, England.’
(https://www.instagram.com/givebloodspreadlove/). For the UK Thal-
assaemia Society, the link was distributed on all their relevant social
media channels (Twitter, Facebook), their registered members’email
list (there are 1600, including people with thalassemia, parents and
doctors) and 4000 on their social media accounts. Responses were
collected from 22 to 29 November 2021.
The survey
The survey was programmed in Qualtrics (https://www.qualtrics.com/uk/).
The key variables used in this paper are described below (see
Supplementary File S1 for the full survey focus and sampling).
Demographics
Demographic information on age, gender, sexual orientation, ethnicity,
religion and UK location was collected. Participants were coded as
LGBTQ+if they reported a sexual orientation other than heterosex-
ual/straight and/or non-binary gender identity. Participants were
coded as MSM if they identified as bisexual, gay, queer, pansexual or
bi-curious and were male.
Donor history
All respondents were asked whether they had ever donated blood in
the UK (Yes/No/ I’m not sure/ Prefer not to say) and were coded as
blood donors if they responded ‘Yes’. Blood donors were subsequently
asked (i) when they last donated blood (within the last 2 months/ 2 to
12 months ago/12 months to 2 years ago/Longer than 2 years/I can-
not remember/Prefer not to say). Non-donors are those who have
never donated, lapsed donors have donated but not within the last
2 years, and current donors have donated in the last 2 years. This is a
validated and reliable estimate of past donor behaviour [11, 22].
Prototypical donor
To assess what participants perceived a typical donor to be like in
terms of demography, we asked, ‘In your mind, what does the
BLOOD DONOR HOMOPHILY 1225
14230410, 2024, 12, Downloaded from https://onlinelibrary.wiley.com/doi/10.1111/vox.13731 by Cornell University E-Resources & Serials Department, Wiley Online Library on [24/02/2025]. See the Terms and Conditions (https://onlinelibrary.wiley.com/terms-and-conditions) on Wiley Online Library for rules of use; OA articles are governed by the applicable Creative Commons License

‘typical’blood donor look like across the following demographic
categories?’They then selected one category for age (18–29, 30–
44, 45+), using these categories because the proportion of donors
aged 45 and over has increased in recent years (from 48.7% in
2018/19 to 51.1% in 2022/2023, NHSBT 2024). They also select
one category for each of the following: gender (male, female); eth-
nicity (Asian, Black, Mixed, Other, White); education level (no-qualifi-
cation, General Certificate of Secondary Education (GCSE) or
equivalent, A levels or equivalent, degree or equivalent); social class
(working class, middle class, upper class) and political affiliation
(left-wing, right-wing).
Homophily Index
To index homophily, we designate π=prototype demographic cat-
egorization and σ=person actual self-ascribed demographic cate-
gorization. Then, in a specific dimension, if π–σ=0, homophily,
η=1, else 0. Then, overall homophily, Η=Σ(η). We calculated
homophily scores using the demographic data available for both
the respondents and their prototype judgements: age, gender and
ethnicity. Thus, we have three dimension-specific homophily
scores each with a value 0 (=non-similarity) or 1 (=the perceived
donor categorization and participant categorization are the same).
The total homophily scores, Η,rangefrom0to3,where0indi-
cates that the respondent shares neither age group, gender, nor
ethnicity with a prototype donor, and 3 indicates that the respon-
dent shares all three. We applied unit weighting to each demo-
graphic characteristic when assessing the overall homophily score.
While some demographic characteristics may have greater
salience, there are no previous data in this domain to estimate or
justify a specific weighting. Therefore, we chose unit weighting in
this case.
Active commitment to donate blood
Evidence shows that an active commitment to donate is an extremely
strong predictor of subsequent donations (Ferguson et al., 2023). As
such, it is useful to identify predictors of making an active commit-
ment to donate. To assess this, we stated:
In the UK, men can donate blood every 12 weeks, and
women every 16 weeks. If you were to become a
blood donor, would you expect to donate blood once
or multiple times?
Participants then selected one of the following: Once, Multiple
times, I’m not sure or prefer not to say. Selecting once or
multiple times indicated an active decision to donate and selecting I’m
not sure indicated hesitancy and indecision. This is a reliable index of
future behaviour [23, 24].
Ethics
This survey study was approved by the School of Psychology, the Uni-
versity of Nottingham., Ethics Review Board (F1308) on the 15
th
of
November 2021.
Power estimates
A small effect size is observed for cognitive and emotional factors on
emotions and donor behavioural propensity [23–25]. Thus, to achieve
0.80 power, with an αof 0.05, requires 332 participants.
RESULTS
Sample
In total, 804 participants were recruited; four respondents did not
provide full informed consent, 11 dropped out after receiving the par-
ticipant information sheet and 4 dropped out immediately after pro-
viding informed consent, giving a final sample of 785 observations. A
Combined Patient Group (CPG) comprised participants who reported
living with either thalassaemia or sickle cell.
Table 1provides the sample characteristics (Supplementary
File S2 and Table S1 provides a sample breakdown and representa-
tiveness analysis). Excluding the oversampling of MSM and the patient
sample, the sample was younger (median 34) than the UK population
in 2010 (median 40) and included more White people (89% vs 82%),
but was broadly representative by location and gender. This pattern
was the same for the full sample, except the oversampling of MSM
increased the proportion of men in the sample.
The Prototypical UK Blood Donor
Table 2categorizes the prototypical donors as seen for the total sam-
ple, as well as by MSM, patients, current donors and ethnicity. Overall,
the prototypical UK donor is perceived to be 30–44 years old, White,
educated to A level (high school) or degree level, middle class and left-
wing. There is no clear perception that donors are more likely to be
male or female.
Homophily
Figure 1shows the homophily scores by sample characteristics (see
Supplementary File S3 and Table S2 for exact figures for Figure 1).
We see that this is 2 out of 3 for the overall sample. Current donors
have the highest overall homophily score of 2.15 out of 3, significantly
higher than non-donors but similar to lapsed donors. This is driven by
the ethnicity homophily score, in which current and lapsed donors
1226 FERGUSON ET AL.
14230410, 2024, 12, Downloaded from https://onlinelibrary.wiley.com/doi/10.1111/vox.13731 by Cornell University E-Resources & Serials Department, Wiley Online Library on [24/02/2025]. See the Terms and Conditions (https://onlinelibrary.wiley.com/terms-and-conditions) on Wiley Online Library for rules of use; OA articles are governed by the applicable Creative Commons License

have a higher average ethnicity homophily score and are thus more
likely to perceive the prototypical donor’s ethnicity as the same as
their own ethnicity. Patients had the lowest homophily score of 1.22,
which is significantly lower than non-patients and, again, this is pri-
marily related to ethnicity homophily. Patients view themselves as less
similar in ethnicity to their perception of the prototypical donor. MSM
had a higher homophily score (2.04) than non-MSM, driven by the
gender homophily. Thus, MSM see their gender (men) as similar to
their perception of the gender of the prototypical donor. Women
have a higher homophily score than men, which is also driven by the
gender homophily scores, with women perceiving themselves as more
similar to the prototypical donor in terms of gender. Homophily also
varied by ethnicity, with Asian, Black, mixed and other ethnicities all
having lower homophily scores than White participants.
Predicting donation decisions
Seventy-eight people said they would donate once, 293 many times,
72 were unsure and two preferred not to say. We explored, using a
multi-nominal regression model, the extent to which the overall
homophily score predicts the active decision to make one or more
TABLE 1 Summary descriptive statistics.
Demographics Freq Mean/% SD Min Max n
Age 35.77 12.77 18 81 779
Gender
Male 518 66% 0 1 780
Female 251 32% 0 1 780
Non-binary 11 1.5% 0 1 780
Prefer not to say 3 0.5%
Sexual orientation
LGBTQ+328 42% 0 1 775
Straight 447 58% 0 1 775
MSM
MSM 268 35% 0 1 767
Non-MSM 499 65% 0 1 767
Ethnicity
Asian 63 8% 0 1 772
Black 23 3% 0 1 772
Mixed 24 3% 0 1 772
Other 13 2% 0 1 772
White 649 84% 0 1 772
Location
England 660 85% 0 1 781
Scotland 75 10% 0 1 781
Wales 32 4% 0 1 781
Northern Ireland 14 2% 0 1 781
Blood donation
Non-donors 546 70% 0 1 776
Lapsed donors 131 17% 0 1 776
Current donor 99 13% 0 1 776
Recipients of donated blood
Recipient of donated blood/blood products 77 10% 0 1 768
Sickle cell 4 1% 0 1 785
Thalassaemia 36 5% 0 1 785
Ineligible to donate 138 18% 0 1 785
Friend/family member with sickle cell disease 27 4% 0 1 724
Friend/family member with thalassaemia 39 5% 0 1 710
Friend/family member who is a blood recipient 284 46% 0 1 616
Abbreviations: Freq, frequency; max, maximum; min, minimum; MSM, men-who-have-sex-with-men.
BLOOD DONOR HOMOPHILY 1227
14230410, 2024, 12, Downloaded from https://onlinelibrary.wiley.com/doi/10.1111/vox.13731 by Cornell University E-Resources & Serials Department, Wiley Online Library on [24/02/2025]. See the Terms and Conditions (https://onlinelibrary.wiley.com/terms-and-conditions) on Wiley Online Library for rules of use; OA articles are governed by the applicable Creative Commons License

TABLE 2 Prototypical donors as seen by sub-groups.
Responders sub-groups
All MSM Patients
Current
donors White
Non-
White Asian Black Mixed Other
Prototype categories
Sex
Female 404
(51.5)
127
(47.4)
15 (37.5) 55 (55.6) 343
(52.9)
55 (45.2) 28
(48.3)
14
(60.9)
10
(41.7)
3 (23.1)
Male 381
(48.3)
141
(52.6)
25
(62.5)
44 (44.4) 306
(47.1)
67 (54.8) 34
(51.7)
9 (39.1) 14
(58.3)
10
(76.9)
pvalue 0.438 0.427 0.154 0.315 0.158 0.319 0.526 0.405 0.541 0.092
Age (years)
18–29 235
(30.4)
86 (32.3) 8 (22.9) 29 (29.3) 177
(27.5)
56 (47.5) 30
(50.8)
13
(56.5)
9 (37.5) 4 (33.3)
30–44 419
(54.3)
138
(51.9)
20
(57.1)
52 (52.5) 360
(56.0)
51 (43.2) 25
(42.4)
8 (34.8) 10
(41.7)
8 (66.6)
45+118
(15.3)
42 (15.8) 7 (20.0) 18 (18.2) 106
(16.5)
11 (9.2) 4 (6.8) 2 (8.7) 5 (20.8) 0 (0)
pvalue <0.001 <0.001 0.011 <0.001 <0.001 <0.001 <0.001 0.019 0.417 0.248
Ethnicity
Asian 12 (1.6) 0 (0) 1 (3.0) 1 (1.0) 0 (0.0) 12 (10.3) 12
(20.7)
0 (0.0) 0 (0.0) 0 (0.0)
Black 7 (0.9) 0 (0) 2 (6.1) 0 (0) 0 (0) 7 (6.0) 0 (0.0) 7 (31.8) 0 (0.0) 0 (0.0)
Mixed 49 (6.4) 16 (6.0) 5 (15.2) 3 (3.0) 32 (5.0) 14 (12.1) 5 (8.6) 1 (4.5) 8 (33.3) 0 (0.0)
Other 18 (2.3) 7 (2.6) 3 (9.1) 3 (3.0) 12 (1.9) 5 (4.3) 2 (3.4) 1 (4.5) 0 (0.0) 2 (16.7)
White 681
(88.8)
243
(91.4)
22
(66.7)
92 (93) 596
(93.1)
78 (67.2) 39
(67.2)
13
(59.1)
16
(66.6)
10
(83.3)
pvalue <0.001 <0.001 <0.001 <0.001 <0.001 <0.001 <0.001 <0.001 0.102 0.021
Education
No qualifications 11 (1.5) 3 (1.1) 2 (7.1) 1 (1.0) 10 (1.6) 1 (0.9) 0 (0.0) 1 (4.8) 0 (0.0) 0 (0.0)
GCSE or equivalent 120
(16.0)
45 (17.1) 2 (7.1) 17 (17.5) 108
(17.1)
11 (10.1) 5 (9.1) 2 (9.5) 3 (13.0) 1 (10.0)
A level or equivalent 315
(42.1)
114
(43.3)
8 (28.6) 43 (44.3) 274
(43.8)
38 (34.9) 22
(40.0)
6 (28.6) 6 (26.1) 4 (40.0)
Degree
or equivalent
303
(40.5)
101
(38.4)
16
(57.1)
36 (37.1) 240
(38.0)
59 (54.1) 28
(50.9)
12
(57.1)
14
(60.9)
5 (50.0)
pvalue <0.001 <0.001 <0.001 <0.001 <0.001 <0.001 <0.001 0.003 0.015 0.273
Social class
Working class 214
(27.9)
66 (24.8) 6 (18.2) 23 (23.2) 177
(27.7)
35 (30.2) 15
(25.9)
7 (31.8) 11
(45.8)
2 (16.7)
Middle class 541
(70.5)
198
(74.4)
27
(81.8)
73 (73.7) 465
(71.3)
76 (65.5) 40
(60.0)
14
(63.6)
12
(50.0)
10
(83.3)
Upper class 12 (1.6) 2 (0.8) 0 (0.0) 3 (3.0) 7 (1.1) 5 (4.3) 3 (5.2) 1 (4.5) 1 (4.2) 0 (0.0)
pvalue <0.001 <0.001 <0.001 <0.001 <0.001 <0.001 <0.001 0.003 0.010 0.021
Political ideology
Left-wing 868
(84.7)
224
(85.2)
21
(72.4)
86 (88.7) 543
(85.6)
88 (80.0) 43
(76.8)
16
(76.2)
19
(82.6)
10 (100)
Right-wing 115
(15.3)
39 (14.8) 8 (27.6) 11 (11.3) 91 (14.4) 22 (20.0) 13
(23.2)
5 (23.8) 4 (17.4) 0 (0.0)
pvalue <0.001 <0.001 0.024 <0.001 <0.001 <0.001 <0.001 0.027 0.003 0.002
Note: A binomial test was used for dichotomous variables and chi-square for multi-category variables within the demographic target category. The figures in blod
indicate the largst number in that category.
Abbreviation: MSM, men-who-have-sex-with-men. GCSE, General Certificate of Secondary Education
1228 FERGUSON ET AL.
14230410, 2024, 12, Downloaded from https://onlinelibrary.wiley.com/doi/10.1111/vox.13731 by Cornell University E-Resources & Serials Department, Wiley Online Library on [24/02/2025]. See the Terms and Conditions (https://onlinelibrary.wiley.com/terms-and-conditions) on Wiley Online Library for rules of use; OA articles are governed by the applicable Creative Commons License

donations compared to uncertainty about donating. The results show
that a homophily score of two or three predicts an active decision to
make more than one donation, compared with feeling uncertain about
donating (Table 3: This effect is robust to the inclusion of demo-
graphic and prototype information as controls; see Supplementary
File S4).
FIGURE 1 Homophily scores general (panel a) and specific (panel b) by sub-groups. p=exact pvalue.
TABLE 3 Multinominal regression for active donation decisions on overall homophily scores in eligible non-donors (n=420).
Coefficient (SE) zpvalue
95% CI
Lower Upper
Uncertain
Donate once
Homophily score
1 0.2336 (0.8316) 0.28 0.779 1.3962 1.8634
2 0.4547 (0.8168) 0.56 0.578 1.1462 2.0557
3 0.7646 (0.8206) 0.93 0.351 0.8437 2.3729
Constant 0.2877 (0.7638) 0.38 0.706 1.7846 1.2092
Donate many times
Homophily score
1 1.0371 (0.7194) 1.44 0.149 2.4471 0.0373
2 1.4394 (0.7099) 2.03 0.043 0.0478 2.8301
3 1.4190 (0.7185) 1.97 0.048 0.0107 2.8274
Constant 0.2231 (0.6708) 0.33 0.739 1.0916 1.5379
Note: Eligible non-donors do not include recipients of blood. This is a multinomial regression model with ‘Uncertain about donation’as the reference
category and, within the homophily scores, zero is the reference category.
Abbreviations: CI, confidence interval.
BLOOD DONOR HOMOPHILY 1229
14230410, 2024, 12, Downloaded from https://onlinelibrary.wiley.com/doi/10.1111/vox.13731 by Cornell University E-Resources & Serials Department, Wiley Online Library on [24/02/2025]. See the Terms and Conditions (https://onlinelibrary.wiley.com/terms-and-conditions) on Wiley Online Library for rules of use; OA articles are governed by the applicable Creative Commons License

DISCUSSION
The prototypical UK blood donor is seen as 30–44 years old, White,
educated to A level (high-school) or degree level, middle class and
politically left-wing. We explored the degree of homophily with this
prototype across a set of key stakeholders, including donors and non-
donors, to better understand the role of homophily with respect to
donor retention (donors) and recruitment (non-donors). Recruiting
people from ethnic minorities is a major focus of many blood collec-
tion agencies; as such, we explored homophily from the perspective
of a number of ethnic minorities (Asian, Black and Mixed). Recent pol-
icy changes in the UK (the FAIR project) and across the world with
respect to individualized risk assessment of sexual behaviour mean
that previous deferral policies for MSM no longer apply [6]. Therefore,
we explored if MSM perceive the prototypical donor as like them. In
general, greater homophily should be associated with a greater will-
ingness to become or remain a donor. Finally, we explored the patient
perspective from the vantage point of long-term recipients of blood
for those with sickle cell or thalassaemia. These recipients require
multiple transfusions, and the efficacy of transfusions increases with
well-matched blood from ethnic minority donors. As sickle cell and
thalassaemia are more prevalent in Black and Asian communities,
lower homophily with the prototypical donor may lead to recipients’
concerns about the efficacy of their current and future treatment.
Current donors perceive themselves as being most similar to the
prototype donor, followed by MSM, with blood recipients being
the least similar. People from ethnic minorities also have low homo-
phily scores. As greater homophily increases the probability of making
an active decision to be a repeat donor, the UK prototypical donor
accurately reflects, and is likely driven by, the aggregate demographic
profile of UK blood donors [26]. Perceptions of prototypical donors
are associated with the decision to donate via the homophily score,
with smaller perceived differences between a person’s prototype and
their own personal demography increasing their likelihood of
donating.
While the perception that the prototypical UK blood donor is 30–
44 years old, White, college-educated, middle class and left-wing
reflects the demography of UK blood donors [26], this is not simply a
reflection of the UK’s wider demography, as there are demographic
profiles for different philanthropic acts. For example, volunteers and
those who donate money to charity tend to be older (65+years), with
an even distribution across ethnicity [27–29].
Within the UK, White people constitute the largest ethnic group
and, as such, many social, institutional and communal spaces become
defined as White spaces. Nonetheless, there are spaces defined as
Black and Asian, including clubs and cafes [29–32]. However, based
on the prototypical donor, blood donation centres, like many UK insti-
tutions, are not. With that in mind, the perception of the prototypical
donor may deter people from ethnic minorities and younger people.
These are two groups blood services want to recruit [2, 5, 8]. One
clear implication for blood services is that designing campaigns and
strategies to change donor demography (Route A Interventions in
Figure 2)[33] addresses only half the picture. Success with Route A
interventions will, over time, change the aggregate donor demography
and, ultimately, what the prototypical donor is perceived to
be. However, interventions must also be considered to address how
people perceive blood donation/donors (Route B Interventions in
Figure 2). Fortunately, some evidence suggests prototypes can be
malleable [34].
We initially consider what innovations are suggested by route
A. Many campaigns and strategies have been implemented to recruit
and retain more donors from ethnic minorities and younger age
groups, and some have been successful [33]. As these have been
reviewed and discussed at length, we focus on novel implications aris-
ing from knowing the UK prototypical donor.
Donors are seen as older, so blood donation is less likely to be
perceived as relevant for young people [35], who are also less likely to
have received a blood transfusion [36] or to know people who need a
transfusion [37]. This implies the need to make the notion of blood
donation salient for younger people. One way is to implement ‘cogni-
tive time travel’and have younger people consider their future selves
and link to other future concerns important to younger generations,
such as climate change [37].
The perception that the prototypical UK blood donor is middle
class may be a previously unrecognized barrier to donors from
working- and upper-class people. Social class, especially within the
UK, is a strong social force with respect to group formation, social
identity and behaviour [38]. A drive for wider social class inclusion will
likely impact greater ethnicity and educational inclusions, as these
characteristics are geographically clustered and related [39]. Blood
drives and campaigns generally focused across wider geographical and
social areas may be worth considering.
A novel and interesting finding is the perception that the proto-
typical UK blood donor is left-wing. Left-wing ideology, compared
with right-wing ideology, is associated with increased compassion for
others [40], which taps into wider associations of compassion, altru-
ism and helping those in need [25]. Unfortunately, we do not know
the current political ideology of UK blood donors. Without knowing
this, it is difficult to propose effective strategies. However, having pol-
iticians from all ideologies jointly endorse blood donation as a com-
passionate act may encourage wider diversity of donors.
Prior research has identified a wide set of barriers to blood dona-
tion including psychological concerns (anxiety, phobia of needles and
blood), structural issues (inconvenience, location and time), as well as
issues specific to minorities, such as prejudice and differential deferral
[9–12]. We show that homophily should be added as a structural and
specific barrier.
Below, we explore how this barrier may be addressed, focusing
on the types of intervention suggested by route B. As blood donors
are both perceived as White and the majority are White, the percep-
tion of blood donation as a White activity in a White space will act as
a barrier to ethnic minorities becoming blood donors [1].
Potential solutions could involve locating blood centres in geo-
graphical areas where the density of ethnic minorities is high. This
could be enhanced further by increasing the diversity of donor centre
staff. Ideally, blood donor centres should be co-designed with
1230 FERGUSON ET AL.
14230410, 2024, 12, Downloaded from https://onlinelibrary.wiley.com/doi/10.1111/vox.13731 by Cornell University E-Resources & Serials Department, Wiley Online Library on [24/02/2025]. See the Terms and Conditions (https://onlinelibrary.wiley.com/terms-and-conditions) on Wiley Online Library for rules of use; OA articles are governed by the applicable Creative Commons License

members of the local ethnic minority communities to make these
spaces more culturally relevant, welcoming and familiar. NHSBT’s
work with the new co-designed Brixton Blood Centre in London is an
excellent example.
The donor centre location is also important in terms of how politi-
cal ideology influences blood donor behaviour. What is important
concerning political ideology and blood donor behaviour is not the
absolute ideology (left-wing, right-wing) but rather partisanship, with
individuals less likely to donate blood when their political ideology is
very different from the representative political ideology of their
area [41]. Specifically, those who perceive themselves as political out-
liers are less likely to donate blood. Therefore, political ideology is an
important consideration for blood services. Again, this is another rea-
son for blood donation centres to consider where their donor centres
are placed and the importance of co-designing with the local demog-
raphy and developing community-based partnerships and funding
schemes.
Donor services need to change the perception of blood donation
as an exclusively middle-aged activity, especially if they wish to recruit
younger donors [42]. One possible strategy is to normalize and repre-
sent blood donation as a positive, socially normative activity through
social media (e.g., Instagram, TikTok, BeReal or Snapchat posts). Blood
donation could be presented as an aspirational and community-
building activity for young people and made relevant to them.
This is a primarily descriptive study, and we make no claims of
causality. We look at the prototype as an antecedent to recruitment
but acknowledge that there are many complexities to donor recruit-
ment. However, the implications of these results underscore the
importance of the blood donor prototype and homophily, which
should now be considered in future work.
The study has some limitations. The sample was not representa-
tive by ethnicity and age; however, the consistency of the findings by
age, gender and ethnicity supports the contention that this did not
affect the results. We also acknowledge that the age categories were
not uniform, which may have contributed to the prototypical age
effect being middle age; future research would benefit from incorpo-
rating a more comprehensive range of evenly distributed age bands.
We assessed active decisions to commit to donate blood as this is a key
predictor of actual donation [24]. As such, we did not assess directly if
people were completely unwilling to donate, and this should be
explored in future studies. Finally, causality needs to be explored and
the use of instrumental variable models, propensity score matching
and Directed Acyclic Graphs (DAG)s can all be considered [43, 44].
ACKNOWLEDGEMENTS
E.F., S.B., C.L., C.S., A.B., S.R.B., C.R., K.D., R.M. and T.W. designed the
study; E.F. and S.B. analysed data 1; E.F. drafted the first version with
S.B., C.L., C.S., A.B., S.R.B., C.R., K.D., R.M., T.W., R.M. and M.C.,
FIGURE 2 Theoretical and practical schema. The schema shows that homophily, defined as the difference between the perceived
prototypical donor and the person’s own demographic characteristics, drives donation decisions. This role for homophily highlights the dynamic
relation between the prototypical donor and actual donor demography within a country. That is, actual demography predicts the prototype, but
changing the perceived prototype (Route B) alters homophily and recruitment, altering the actual donor demography within a country and, thus,
the prototype. Hence, there is a dynamic reinforcing link between the prototype and actual donor demography. This dynamic link can also be
influenced by directly attracting a wider demography to donor panels (Route A).
BLOOD DONOR HOMOPHILY 1231
14230410, 2024, 12, Downloaded from https://onlinelibrary.wiley.com/doi/10.1111/vox.13731 by Cornell University E-Resources & Serials Department, Wiley Online Library on [24/02/2025]. See the Terms and Conditions (https://onlinelibrary.wiley.com/terms-and-conditions) on Wiley Online Library for rules of use; OA articles are governed by the applicable Creative Commons License

providing detailed feedback and revising the paper; all authors
approved the final version.
This was funded by an ESRC-IAA grant (No. RA1182) to C.S.,
A.B. and E.F., E.F. gratefully acknowledges the financial support from
the NIHR Blood and Transplant Research Unit in Donor Health and
Behaviour (NIHR203337). R.M. is funded as a postdoctoral fellow by
the NIHR Blood and Transplant Research Unit in Donor Health and
Behaviour grant (NIHR203337). The views expressed here are solely
those of the authors and do not reflect the funding organization or
any of the organizations and groups involved in this research.
CONFLICT OF INTEREST STATEMENT
The authors declare no conflicts of interest.
DATA AVAILABILITY STATEMENT
The data that support the findings of this study are available from the
corresponding author upon reasonable request.
ORCID
Eamonn Ferguson https://orcid.org/0000-0002-7678-1451
Sarah Bowen https://orcid.org/0000-0001-8987-8343
Richard Mills https://orcid.org/0000-0002-1161-5815
Claire Reynolds https://orcid.org/0000-0003-3452-0832
Katy Davison https://orcid.org/0000-0002-6337-892X
Roanna Maharaj https://orcid.org/0009-0008-6603-5827
Chris Starmer https://orcid.org/0000-0001-7705-0127
Abigail Barr https://orcid.org/0000-0002-1241-9162
Susan R. Brailsford https://orcid.org/0000-0003-2856-0387
REFERENCES
1. Au A. A theoretical examination of Homophily beyond focus theory:
causes, consequences, and new directions. SAGE Open. 2023;13:
215824402311739.
2. McPherson M, Smith-Lovin L, Cook JM. Birds of a feather: homo-
phily in social networks. Ann Rev Sociology. 2001;27:415–44.
3. Ertu G, Brennecke J, Kovács B, Zou T. What does homophily do? A
review of the consequences of homophily. Acad Manag Anns. 2022;
16:38–69.
4. Shaz BH, Zimring JC, Demmons DG, Hillyer CD. Blood donation and
blood transfusion: special considerations for African Americans.
Trans Med Rev. 2008;22:202–14.
5. NHSBT. Call for more Millennials and Gen Zs to give blood as NHS
reveals most donors are over 45. Available from: https://www.blood.co.
uk/news-and-campaigns/news-and-statements/call-for-more-millennials-
and-gen-zs-to-give-blood/#::text=The%20NHS%20is%20calling%20
for,in%20the%20majority%20since%202018. Last accessed 26 Apr 2024.
6. NHS Blood and Tranplant. Can donor selection policy move from a
population-based donor selection policy to one based on a more
individualised risk assessment? Conclusions from the For the Assess-
ment of Individualised Risk (FAIR) group. Available from: https://
nhsbtdbe.blob.core.windows.net/umbraco-assets-corp/21001/fair_
sabto_20201211.pdf. Last accessed 22/07/24.
7. Akay A, Constant A, Giulietti C, Guzi M. Ethnic diversity and well-
being. J Popul Econ. 2017;30:265–306.
8. Greinacher A, Weitmann K, Lebsa A, Alpen U, Gloger D,
Stangenberg W, et al. A population-based longitudinal study on the
implications of demographics on future blood supply. Transfusion.
2016;56:2986–94.
9. Bednall TC, Bove LL. Donating blood: a meta-analytic review of self-
reported motivators and deterrents. Transfus Med Rev. 2011;25:
317–34.
10. Fogarty H, Sardana M, Sheridan L, Chieng P, Kelly S, Ngwenya N,
et al. Motivators and barriers to blood donation among potential
donors of African and Caucasian ethnicity. Blood Transfus. 2023;21:
13–23.
11. Ferguson E, Dawe-Lane E, Khan Z, Reynolds C, Davison K, Edge D,
et al. Trust and distrust: Identifying recruitment targets for ethnic
minority blood donors. Transfus Med. 2022;32:276–87.
12. Ferguson E, Dawe-Lane E, Ajayi O, Osikomaiya B, Mills R,
Okubanjo A. The importance of need-altruism and kin-altruism to
blood donor behaviour for Black and White people. Transfus Med.
2024;34:112–23.
13. Gerrard M, Gibbons FX, Houlihan AE, Stock ML, Pomery EA. A dual-
process approach to health risk decision making: the prototype will-
ingness model. Dev Rev. 2008;28:29–61.
14. Anderson E. The white space. Sociology Race Ethnic. 2015;1:10–21.
15. Edwards AR, Masser BM, Barlow FK. Psychological ownership and
identity motives in blood donation. Vox Sang. 2023;118:616–23.
16. Charng H, Piliavin JA, Callero PL. Role identity and reasoned action
in the prediction of repeated behavior. Soc Psychol Quart. 1988;198:
303–17.
17. Ferguson E, Bibby PA. Predicting future blood donor returns: past
behavior, intentions, and observer effects. Health Psychol. 2002;21:
513–8.
18. Valentine K. Citizenship, identity. Blood Donation Body Soc. 2005;
11:113–28.
19. Pinckney HP, Mowatt RA, Outley C, Brown A, Floyd MF, Black KL.
Black spaces/white spaces: Black lives, leisure, and life politics. Lei-
sure Sci. 2018;40:267–87.
20. Zucoloto ML, Gonçalez T, Custer B, McFarland W, Martinez EZ.
Comparison of the demographic and social profile of blood donors
and nondonors in Brazil. Health Soc Care Community. 2019;27:
330–6.
21. Merz EM, van den Hurk K, de Kort WLAM. Organ donation registra-
tion and decision-making among current blood donors in The
Netherlands. Prog Transplant. 2017;27:266–72.
22. Bertalli NA, Allen KJ, McLare CE, Turkovic L, Osborne NJ,
Constantine CC, et al. A comparison of self-reported and record-
linked blood donation history in an Australian cohort. Transfusion.
2011;51:2189–98.
23. Ferguson E, Edwards ARA, Masser BM. Simple reciprocal fairness
message to enhance non-Donor’s willingness to donate blood. Anns
Behav Med. 2022;56:88–9.
24. Ferguson E, Farrell K, Lawrence C. Blood donation is an act of benev-
olence rather than altruism. Health Psychol. 2008;27:327–36.
25. Ferguson E, Lawrence C, Bowen S, Gemell CN, Rozsa A, Niekrasz K,
et al. Warming up cool cooperators. Nat Hum Behav. 2023;7:
1917–32.
26. Lattimore S, Wickenden C, Brailsford SR. Blood donors in England
and North Wales: demography and patterns of donation. Transfu-
sion. 2015;55:91–9.
27. NCVO. UK Civil Society Almanac 2023. Available from: https://www.
ncvo.org.uk/news-and-insights/news-index/uk-civil-society-almanac-
2023/volunteering/what-are-the-demographics-of-volunteers/#::
text=Rates%20of%20informal%20volunteering%20at,those%20aged
%2075%20and%20above. Last accessed 17 Apr 2024.
28. UK Government. Volunteering. Available from: https://www.
ethnicity-facts-figures.service.gov.uk/culture-and-community/civic-
participation/volunteering/latest/. Last accessed 17 Apr 2024.
29. Community, and Life Style Survey 2012/22. Volunteering and chari-
table giving. 2023 Available from: https://www.gov.uk/government/
statistics/community-life-survey-202122/community-life-survey-202122-
volunteering-and-charitable-giving. Last accessed 17 Apr 2024.
1232 FERGUSON ET AL.
14230410, 2024, 12, Downloaded from https://onlinelibrary.wiley.com/doi/10.1111/vox.13731 by Cornell University E-Resources & Serials Department, Wiley Online Library on [24/02/2025]. See the Terms and Conditions (https://onlinelibrary.wiley.com/terms-and-conditions) on Wiley Online Library for rules of use; OA articles are governed by the applicable Creative Commons License

30. LBC. British countryside is a ‘racist and colonial’white space, wildlife
charities claim. 2023 Available from: https://www.lbc.co.uk/news/
british-countryside-racist-colonial-white-space/. Last accessed
26 Apr 2024.
31. American Philosophical Association Blog. Black spaces in Britain: on
the windrush and small axe. 2012 Available from: https://blog.
apaonline.org/2021/01/19/black-spaces-in-britain-on-the-windrush-
and-small-axe/. Last accessed 26 Apr 2024.
32. Phillips D, Davis C, Ratcliffe P. British Asian narratives of urban
space. Trans Inst Br Geog. 2007;32:217–34.
33. Makin JK, Francis KL, Polonsky MJ, Renzaho AMN. Interventions to
increase blood donation among ethnic/racial minorities: a systematic
review. J Environ Pub Health. 2019;2019:6810959.
34. Blair IV. The malleability of automatic stereotypes and prejudice.
Pers Soc Psychol Rev. 2002;6:242–61.
35. Davet N. Young people and older people negotiating urban spaces in
Sweden: enacting age, public spacing and belonging through interge-
nerational encounters. Child Geog. 2022;20:876–88.
36. Brown CH, Savage WJ, Masear CG, Walston JD, Tian J,
Colantuoni E, et al. Odds of transfusion for older adults compared to
younger adults undergoing surgery. Anesth Analg. 2014;118:
1168–78.
37. Cegolon L, Lange JH HWC. Climate change, emerging infections and
blood donations. J Travel Med. 2017;24:taw098.
38. Manstead ASR. The psychology of social class: how socioeconomic
status impacts thought, feelings, and behaviour. Br J Soc Psychol.
2018;57:267–91.
39. Havighurst RJ. The relative importance of social class and ethnicity in
human development. Hum Dev. 1976;19:56–64.
40. Ferguson E, Quigley E, Powell G, Stewart L, Harrison F, Tallentire H.
To help or punish in the face of unfairness: men and women prefer
mutually-beneficial strategies over punishment in a sexual selection
context. R Soc Open Sci. 2019;6:181441.
41. Pelc K, Kim SE. Does political diversity inhibit blood donations? 2024
Available from: https://ssrn.com/abstract=4684912. Last accessed
26 Apr 2024.
42. Zou S, Musavi F, Notari EP, Fang CT, ARCNET Research Group.
Changing age distribution of the blood donor population in the
United States. Transfusion. 2008;48:251–7.
43. Yohari C. Homophily and status difference in the angel investor mar-
ket. Conference: Academy of Management Proceedings. 2023(1);
2023. https://doi.org/10.5465/AMPROC.2023.12bp
44. Liu L, Tchetgen E. Regression-based negative control of homophily in
dyadic peer effect analysis. Biometrics. 2022;78:668–78.
SUPPORTING INFORMATION
Additional supporting information can be found online in the Support-
ing Information section at the end of this article.
How to cite this article: Ferguson E, Bowen S, Mills R,
Reynolds C, Davison K, Lawrence C, et al. The prototypical UK
blood donor, homophily and blood donation: Blood donors are
like you, not me. Vox Sang. 2024;119:1223–33.
BLOOD DONOR HOMOPHILY 1233
14230410, 2024, 12, Downloaded from https://onlinelibrary.wiley.com/doi/10.1111/vox.13731 by Cornell University E-Resources & Serials Department, Wiley Online Library on [24/02/2025]. See the Terms and Conditions (https://onlinelibrary.wiley.com/terms-and-conditions) on Wiley Online Library for rules of use; OA articles are governed by the applicable Creative Commons License

ORIGINAL ARTICLE
Regular whole blood donation and gastrointestinal, breast,
colorectal and haematological cancer risk among blood donors
in Australia
Md Morshadur Rahman
1,2
| Andrew Hayen
1
| John K. Olynyk
3,4
|
Anne E. Cust
5,6
| David O. Irving
1,2
| Surendra Karki
2,7
1
School of Public Health, University of Technology Sydney, Sydney, New South Wales, Australia
2
Research and Development, Australian Red Cross Lifeblood, Sydney, New South Wales, Australia
3
Curtin Medical School, Curtin University, Bentley, Western Australia, Australia
4
Fiona Stanley Hospital, Murdoch, Western Australia, Australia
5
The Daffodil Centre, The University of Sydney, a joint venture with Cancer Council NSW, Sydney, New South Wales, Australia
6
Sydney School of Public Health, Faculty of Medicine and Health, The University of Sydney, Sydney, New South Wales, Australia
7
School of Population Health, University of New South Wales, Sydney, New South Wales, Australia
Correspondence
Surendra Karki, Australian Red Cross
Lifeblood, Sydney, NSW, Australia.
Email: skarki@redcrossblood.org.au
Funding information
Australian governments fund Australian Red
Cross Lifeblood to provide blood, blood
products and services to the Australian
community; University of New South Wales
Open access publishing facilitated by
University of New South Wales, as part of the
Wiley - University of New South Wales
agreement via the Council of Australian
University Librarians.
Abstract
Background and Objectives: Several studies have suggested that blood donors have
lower risk of gastrointestinal and breast cancers, whereas some have indicated an
increased risk of haematological cancers. We examined these associations by appro-
priately adjusting the ‘healthy donor effect’(HDE).
Materials and Methods: We examined the risk of gastrointestinal/colorectal, breast
and haematological cancers in regular high-frequency whole blood (WB) donors using
the Sax Institute’s 45 and Up Study data linked with blood donation and other
health-related data. We calculated 5-year cancer risks, risk differences and risk ratios.
To mitigate HDE, we used 5-year qualification period to select the exposure groups,
and applied statistical adjustments using inverse probability weighting, along with
other advanced doubly robust g-methods.
Results: We identified 2867 (42.4%) as regular high-frequency and 3888 (57.6%) as
low-frequency donors. The inverse probability weighted 5-year risk difference
between high and low-frequency donors for gastrointestinal/colorectal cancer was
0.2% (95% CI, 0.1% to 0.5%) with a risk ratio of 1.25 (0.83–1.68). For breast cancer,
the risk difference was 0.2% (0.9% to 0.4%), with a risk ratio of 0.87 (0.48–1.26).
Regarding haematological cancers, the risk difference was 0.0% (0.3% to 0.5%) with
a risk ratio of 0.97 (0.55–1.40). Our doubly robust estimators targeted minimum loss-
based estimator (TMLE) and sequentially doubly robust (SDR) estimator, yielded simi-
lar results, but none of the findings were statistically significant.
Received: 26 May 2024 Revised: 21 August 2024 Accepted: 22 August 2024
DOI: 10.1111/vox.13734
This is an open access article under the terms of the Creative Commons Attribution-NonCommercial License, which permits use, distribution and reproduction in any
medium, provided the original work is properly cited and is not used for commercial purposes.
© 2024 The Author(s). Vox Sanguinis published by John Wiley & Sons Ltd on behalf of International Society of Blood Transfusion.
1234 Vox Sanguinis. 2024;119:1234–1244.
wileyonlinelibrary.com/journal/vox

Conclusion: After applying methods to mitigate the HDE, we did not find any statisti-
cally significant differences in the risk of gastrointestinal/colorectal, breast and hae-
matological cancers between regular high-frequency and low-frequency WB donors.
Keywords
blood donor, cancer, HDE, healthy donor effect, malignancy, whole blood
Highlights
•We used the ‘qualification period’method along with advanced statistical methods, such as
inverse probability weighting, and doubly robust g-methods with ensemble machine learning
algorithms, to mitigate the impact of the ‘healthy donor effect’.
•We found that regular high-frequency whole blood donation does not significantly alter the
cancer risk.
•Studies with relevant data on ongoing health of donors are required to produce unbiased
results when examining the effect of blood donation on long-term health outcomes.
INTRODUCTION
Studies have suggested that the level of iron in the human body may
affect the occurrence of cancers [1–7]. Due to loss of iron from the
body after each whole blood (WB) donation, it has been hypothesised
that frequent WB blood donors may have different risk of cancers
compared to less-frequent donors or non-donors [6]. Studies have
also indicated that temporary immune system alterations such as low-
ering of the level and activity of natural killer cells and enhanced cell
proliferation after each blood donation, could affect the risk of hae-
matological cancers [8, 9]. In relation to the level of iron in the body, it
has been observed that in iron overload diseases like hereditary
hemochromatosis there is increased risk of hepatocellular carcinoma,
particularly in patients with liver cirrhosis [10], and potentially other
type of cancers such as colorectal cancer [5, 11].
Studies conducted in blood donors have reported contraindica-
tory findings in relation to the risk of cancers. Several studies have
reported that the risk of cancers is lower or not different in donors
compared to general population or less-frequent donors [6, 12–15].
However, some have also reported a higher incidence of overall can-
cers or some particular cancers among blood donors compared to the
general population [6, 13, 14, 16].
The results from many of the above studies may have been
impacted by a bias called the ‘healthy donor effect (HDE)’. This bias
arises when healthier people self-select to donate blood. Further
health screening by blood collection agencies to ensure that donors
are eligible to give blood compounds this effect. Comparison of this
relatively healthier group without adequate adjustments for health
differences from the non-donor population (or with low-frequency
donors) usually suggests that blood donors have a lower risk of almost
any health outcome measured [17].
In this study, we examined the possible association between reg-
ular high-frequency WB donation and the risk of gastrointestinal/
colorectal, breast and haematological cancers among blood donors in
Australia. To mitigate the HDE, we utilized a 5-year qualification
period method, similar to the ‘qualification period’method described
by Peffer et al. and applied several statistical adjustments in the ana-
lyses [18]. The ‘qualification period’refers to the time period during
which the donor must be actively donating blood and must fulfil other
qualifying criteria. This method identifies active donors (enabling the
within donor comparison) within a defined time period and also sepa-
rates the exposure period and follow-up period, which further reduces
the reverse causation bias as the exposure and outcome cannot influ-
ence each other.
METHODS
Data sources and linkage
In this study, we used the Sax Institute’s 45 and Up Study data, linked
to other electronic health datasets—the Australian Red Cross Life-
blood Donor data, Registry of Birth, Deaths and Marriages-Deaths
Registrations (RBDM), New South Wales Cancer Registry (NSWCR)
and Medicare Benefit Schedule (MBS) data.
The Sax Institute’s 45 and Up Study enrolled 267,357 individuals
aged 45 years or above in New South Wales, Australia, between 2005
and 2009 [19]. The study recruited prospective participants through
random selection from the Services Australia Medicare enrolment
database, which includes all Australian and New Zealand citizens and
Australian permanent residents, resulting in a participation rate of
19.2% [20]. People aged 80 years and above and people living in rural
and remote areas were oversampled [19]. Participants completed an
initial questionnaire that covered a wide range of topics, including
socio-demographic information, health status, lifestyle choice and
behaviours. Additionally, they provided consent for their data to be
linked with various administrative datasets, allowing for long-term
follow-up analysis.
Australian Red Cross Lifeblood is the sole agency responsible for
collecting, processing and distributing blood and blood products in
BLOOD DONATION AND VARIOUS CANCER RISKS 1235
14230410, 2024, 12, Downloaded from https://onlinelibrary.wiley.com/doi/10.1111/vox.13734 by Cornell University E-Resources & Serials Department, Wiley Online Library on [24/02/2025]. See the Terms and Conditions (https://onlinelibrary.wiley.com/terms-and-conditions) on Wiley Online Library for rules of use; OA articles are governed by the applicable Creative Commons License

Australia. It also keeps track of donor data in a central system called
the National Blood Management System (NBMS). Before 2007, the
methods used by Lifeblood to store donor data varied. However, after
a national merger in 2007 of what was to that time separate, state-
based sets of donor data, all donor information was consolidated within
the NBMS. However, for New South Wales (NSW) complete records
for blood donations were available from 1 June 2002. Therefore, for
the purpose of data linkage, the dataset used included blood donation
information spanning from 1 June 2002, to 31 December 2018.
The NSWCR keeps track of individuals diagnosed with cancer in
NSW. Since 1972, the NSWCR has maintained comprehensive
records that include demographic information, incidence data and
death details for individuals who have been diagnosed with cancer. In
our study, we used this dataset to ascertain the occurrence and date
of cancer diagnosis. The data were complete up to December 2015.
The details of other datasets and the linkage process is presented in
the Supporting Information: Data S1 and also described elsewhere [21].
Study population, qualification period
We employed a 5-year qualification period to select the participants
and determine exposure status inspired by the method used by Peffer
and colleagues [22] (Figure 1). The qualification period refers to the
time in which the donor is needed to actively give blood while satisfy-
ing other requirements for eligibility to donate. In our analysis, this
qualification period includes the time period 3 years before the enrol-
ment into the 45 and Up Study data and 2 years thereafter. For our
analysis, donors must have made at least one WB donation on the first
and fifth years of the qualification period and be alive and cancer-free
for the full 5-year period. The qualification period method can also be
described as ‘exposure window’method, as described and used by
Edgren et al.; however, the qualification period method implemented in
this study includes specific qualification criteria that ensure donors are
active donors during the time period of exposure assessment as well as
are free of the study outcome being measured [6]. We excluded donors
who performed any plasma or platelet donation during the 5-year win-
dow to keep only WB donors for the analysis. Donors who had cancers
before the start of qualification period were also excluded.
Exposure variable
We considered several exposure scenarios to measure the frequency
and regularity of blood donations made by participants during each
year of qualification period (i) at least one WB donation during
each year of qualification period versus others, (ii) at least two WB
donation during each year of qualification period versus others and
(iii) at least three WB donation during each year of qualification period
versus others.
Ascertainment of WB donation
Utilizing linked Lifeblood donation history data, instances of a WB
donations were determined. If a person successfully donated a unit of
WB, the individual was regarded as a WB donor.
Ascertainment of cancer
The primary outcomes of this study were gastrointestinal, colorectal,
breast and haematological cancers. All the cancer information was
ascertained from the linked NSWCR dataset. By using the interna-
tional classification of disease 10th revision (ICD10) codes, an indi-
vidual was confirmed to have experienced either gastrointestinal or
colorectal cancer if the cancer diagnosis codes were C15 (oesopha-
geal) or C16 (stomach) or C17 (small intestinal) or C22 (liver) or
C23-C24 (gallbladder) or C25 (pancreatic) or C18 (colon) or
C19-C21 (rectal). Moreover, an individual was confirmed to have
experienced breast cancer if the diagnosis code was C50 (Breast).
Furthermore, an individual was confirmed to have experienced hae-
matological malignancy if the diagnosis codes were C920 (acute
myeloid leukaemia) or C910 (acute lymphoblastic leukaemia) or C81
(Hodgkin lymphoma) or C8890 (multiple myeloma) or C82 (non-
Hodgkin lymphoma) or C919 (other lymphoid leukaemia) or C929
(other myeloid leukaemia) or C94 (other specified leukaemia)
(Table 1). We only considered the first diagnosed cancer for this
analysis if a person had multiple malignancies over the follow-up
period.
FIGURE 1 The 5-year qualification period and follow-up period.
1236 RAHMAN ET AL.
14230410, 2024, 12, Downloaded from https://onlinelibrary.wiley.com/doi/10.1111/vox.13734 by Cornell University E-Resources & Serials Department, Wiley Online Library on [24/02/2025]. See the Terms and Conditions (https://onlinelibrary.wiley.com/terms-and-conditions) on Wiley Online Library for rules of use; OA articles are governed by the applicable Creative Commons License

Follow-up period
The follow-up period commenced from the last day of the qualifica-
tion period and ended at the conclusion of either 5 years from the
start of the follow-up, the death date or the cancer diagnosis date,
whichever occurred first. This end date of follow-up was chosen to
enable us to study the 5-year risk of cancer. For sensitivity analyses,
we also considered an administrative end date of the follow-up, so
that the study started from the last day of the qualification period and
ended on 30 December 2015 (corresponding to available cancer regis-
try data), death date or cancer diagnosis death, whichever occurred
first.
Potential confounding factors
A number of demographic/socioeconomic, health status and blood
donation-related variables were considered as potential confounding
factors. The demographic/socioeconomic variables were age, sex
(male, female), geographical location (metro, regional/remote), educa-
tion (no formal education, school to diploma, university) and gross
annual household income (<20 k, 20–39 k, 40–69 k, 70 k+Australian
dollars). The health status-related variables were body mass index
(body mass index [BMI]—underweight, normal, overweight, obese),
self-reported general health (excellent, very good, good, fair/poor),
smoking status (never, former, regular), daily alcohol intake (≤1/day,
>1/day), weekly physical activity (<1, ≥1), daily fruit or raw vegetable
consumption (0–2, 3–4, 5+), intake of multivitamins and minerals (no,
yes), consumption of red meat (<5/week, ≥5/week), consumption of
processed meat (<3/week, ≥3/week), number of general practice
(GP) visits in the last 1 year, number of specialist consultations and
pathology test referrals in the last 1 year, family history of cancers
(no, yes) and any cancer screening (no, yes). Blood donation-related
variables were average blood pressure levels during the qualification
period, average haemoglobin level during the qualification period and
blood group. The detailed derivation of the variables is given in
Table S1.
Ethics approval
The 45 and Up Study received approval from the Human Research
Ethics Committee (HREC) at the University of NSW. Additionally, this
specific study was approved by the NSW Population Health Services
Research Ethics Committee and Lifeblood Ethics Committee.
Statistical methods
We calculated 5-year cancer risk, risk difference and risk ratio (RR) by
inverse probability weighting (IPW) of a marginal structural model for
gastrointestinal and colorectal cancers together and for breast and
haematological cancers separately. We fitted a pooled logistic regres-
sion model by adding a constant plus linear and quadratic terms of
time and also linear and quadratic product terms of donation status
and time. The baseline covariates were adjusted by calculating the
inverse probability weights and then using the weights in the outcome
regression model. The IPW was truncated at the 99th percentile to
remove any extreme weights from outliers. Finally, we used non-
parametric bootstrapping with 500 samples to calculate all the 95%
CIs. Inverse probability weighted Kaplan–Meier survival curves were
also plotted for the cancer outcomes with three different exposure
definitions.
We also utilized two alternative g-methods, namely the targeted
minimum loss-based estimator (TMLE) and the sequentially doubly
robust (SDR) estimators, to compute 5-year cancer risk, risk difference
and RRs [23, 24]. These estimators, including IPW, rely on two mathe-
matical models: the treatment model and the outcome model, both of
which are functions of the confounding variables. The IPW is a singly
robust estimator, as its accuracy depends on correctly specifying the
treatment model. On the other hand, TMLE and SDR are doubly
robust estimators, meaning that their estimates remain unbiased even
if one of the treatment or outcome models is misspecified.
Additionally, the inverse probability weighted marginal structural
models can produce a biased estimate if affected by violations of the
positivity assumption. In contrast, doubly robust estimators often pro-
duce less biased results than IPW estimators, even if the positivity
assumption is extremely violated [25, 26]. Moreover, these doubly
robust estimators have the advantage of being able to utilize machine
learning algorithms to fit the treatment and outcome models, allowing
them to capture complex associations that may not be possible with
simple regression-based approaches [24, 27]. As blood donation
behaviour is assumed to be time-varying in nature, we also estimated
time-varying TMLE and SDR estimators in one of the sensitivity ana-
lyses. We used the R package ‘SuperLearner’version 2.0–29 and
‘lmtp’version 1.4.0 to implement this analysis [28].
A few variables had missing values (maximum of approximately
16%). Although we assumed that the data were missing at random,
we still did multiple imputations to calculate missing values, as
TABLE 1 International classification of diseases 10th revision
(ICD10) codes used to ascertain cancer cases.
Cancer group ICD10 codes
Gastrointestinal or
colorectal cancer
C15 (oesophageal)
C16 (stomach)
C17 (small intestinal)
C22 (liver)
C23-C24 (gallbladder)
C25 (pancreatic)
C18 (colon)
C19–C21 (rectal)
Brest cancer C50 (Breast)
Haematological
malignancies
C920 (acute myeloid leukaemia)
C910 (acute lymphoblastic leukaemia)
C81 (Hodgkin lymphoma) C8890 (multiple
myeloma) C82 (non-Hodgkin lymphoma)
C919 (other lymphoid leukaemia)
C929 (other myeloid leukaemia)
C94 (other specified leukaemia)
BLOOD DONATION AND VARIOUS CANCER RISKS 1237
14230410, 2024, 12, Downloaded from https://onlinelibrary.wiley.com/doi/10.1111/vox.13734 by Cornell University E-Resources & Serials Department, Wiley Online Library on [24/02/2025]. See the Terms and Conditions (https://onlinelibrary.wiley.com/terms-and-conditions) on Wiley Online Library for rules of use; OA articles are governed by the applicable Creative Commons License

TABLE 2 Characteristics of the study participants.
Characteristics At least 2 whole blood donations in each year of the qualification period
No (low frequency) Yes (regular high frequency)
Participants, n(%) 3888 (57.6) 2867 (42.4)
Sex, n(%)
Male 1717 (44.2) 1585 (55.3)
Female 2171 (55.8) 1282 (44.7)
Age at baseline, mean (SD) 57.72 (6.68) 60.3 (6.9)
Haemoglobin, g/dL, mean (SD) 140.99 (10.36) 143.38 (9.86)
Systolic blood pressure, mean (SD) 127.39 (12.05) 128.66 (11.17)
Diastolic blood pressure, mean (SD) 76.95 (6.84) 77.26 (6.25)
Total no. of WB donation in qualification period, mean(SD) 9.78 (3.56) 16.85 (2.65)
Blood group, n(%)
Non-O 1976 (50.8) 1401 (48.9)
O 1912 (49.2) 1466 (51.1)
Body mass index, kg/m
2
,n(%)
Underweight 10 (0.3) 8 (0.3)
Normal 1306 (33.6) 897 (31.3)
Overweight 1527 (39.3) 1231 (42.9)
Obese 793 (20.4) 577 (20.1)
Missing 252 (6.5) 154 (5.4)
Body mass index, kg/m
2
, mean (SD) 26.92 (4.35) 27.08 (4.21)
Smoking status, n(%)
Never 2435 (62.6) 1884 (64.3)
Former 1282 (33.0) 921 (32.1)
Regular 157 (4.0) 90 (3.1)
Missing 14 (0.4) 12 (0.4)
Self-rated health, n(%)
Excellent 1040 (26.8) 850 (29.7)
Very good 1791 (46.1) 1361 (47.5)
Good 854 (22.0) 564 (19.7)
Fair/poor 130 (3.3) 57 (2.0)
Missing 73 (1.9) 35 (1.2)
Alcohol consumption/day, n(%)
None 877 (22.6) 600 (20.9)
≤1/day 1521 (39.1) 1100 (38.4)
>1/day 1461 (37.6) 1148 (40.0)
Missing 29 (0.8) 19 (0.7)
Vigorous physical activity in the last week, n(%)
<1 1415 (36.4) 964 (33.6)
1–3 1331 (34.2) 967 (33.7)
4+660 (17.0) 603 (21.1)
Missing 482 (12.4) 333 (11.6)
Education level, n(%)
No formal education 215 (5.5) 175 (6.1)
School to Diploma 2432 (62.6) 1927 (67.2)
University 1213 (31.2) 747 (26.1)
Missing 28 (0.7) 18 (0.6)
1238 RAHMAN ET AL.
14230410, 2024, 12, Downloaded from https://onlinelibrary.wiley.com/doi/10.1111/vox.13734 by Cornell University E-Resources & Serials Department, Wiley Online Library on [24/02/2025]. See the Terms and Conditions (https://onlinelibrary.wiley.com/terms-and-conditions) on Wiley Online Library for rules of use; OA articles are governed by the applicable Creative Commons License

removing participants with missing values would lower the number of
cases for analysis. The imputation was a fully conditional specification
that used classification and regression trees and was implemented by
the R package ‘mice’version 3.16.0 (used method =‘cart’in the mice
function) [29].
We used R version 4.2.2 to conduct all the statistical analyses.
TABLE 2 (Continued)
Characteristics At least 2 whole blood donations in each year of the qualification period
No (low frequency) Yes (regular high frequency)
Annual household income, n(%)
<20 k 313 (8.1) 257 (9.0)
20–39 k 521 (13.4) 503 (17.5)
40–69 k 954 (25.5) 762 (26.6)
70 k+1484 (38.2) 901 (31.4)
Missing 616 (15.8) 444 (15.5)
Location, n(%)
Major city 1909 (49.1) 1161 (40.5)
Regional/Remote 1888 (48.6) 1646 (57.4)
Missing 91 (2.3) 60 (2.1)
Daily fruits/vegetable consumed, n(%)
0–2 229 (5.9) 160 (5.6)
3–4 928 (23.9) 688 (24.0)
5+2259 (58.1) 1685 (58.8)
Missing 472 (12.1) 334 (11.7)
Taking any vitamin or mineral supplement, n(%)
No 2975 (76.5) 2236 (78.0)
Yes 912 (23.5) 631 (22.0)
Missing <5 (<0.0) <5 (<0.0)
Consumption of red meat, n(%)
<5/week 2954 (76.0) 2134 (74.4)
≥5/week 865 (22.3) 697 (24.3)
Missing 68 (1.8) 36 (1.3)
Consumption of processed meat, n(%)
<3/week 2869 (73.8) 2097 (73.1)
≥3/week 577 (14.8) 459 (16.0)
Missing 442 (11.4) 311 (10.9)
Family history of cancer, n(%)
No 2058 (52.9) 1517 (52.9)
Yes 1830 (47.1) 1350 (47.1)
Cancer screening, n(%)
No 421 (10.8) 301 (10.5)
Yes 3428 (88.2) 2545 (88.8)
Missing 39 (1.0) 21 (0.7)
No. of GP visits in the past 1 year, mean (SD) 4.68 (4.15) 4.15 (3.41)
No. of referrals in the past 1 year, mean (SD) 2.84 (2.69) 2.51 (2.35)
Outcomes
Gastrointestinal/colorectal, n(%) 25 (0.6) 27 (0.9)
Breast
a
,n(%) 40 (1.8) 21 (1.6)
Haematological, n(%) 23 (0.6) 20 (0.7)
Abbreviation: GP, general practice.
a
Breast cancer cases are calculated only from female donors.
BLOOD DONATION AND VARIOUS CANCER RISKS 1239
14230410, 2024, 12, Downloaded from https://onlinelibrary.wiley.com/doi/10.1111/vox.13734 by Cornell University E-Resources & Serials Department, Wiley Online Library on [24/02/2025]. See the Terms and Conditions (https://onlinelibrary.wiley.com/terms-and-conditions) on Wiley Online Library for rules of use; OA articles are governed by the applicable Creative Commons License

FIGURE 2 Weighted survival curves for a 5-year follow-up period for gastrointestinal/colorectal, breast and haematological cancers.
1240 RAHMAN ET AL.
14230410, 2024, 12, Downloaded from https://onlinelibrary.wiley.com/doi/10.1111/vox.13734 by Cornell University E-Resources & Serials Department, Wiley Online Library on [24/02/2025]. See the Terms and Conditions (https://onlinelibrary.wiley.com/terms-and-conditions) on Wiley Online Library for rules of use; OA articles are governed by the applicable Creative Commons License

RESULTS
Table 2shows the distribution of various characteristics of 6755 WB
donors, of whom 2667 (42.4%) donated at least two WB units in each
year of the qualification period (regular high-frequency donors),
whereas 3888 (57.6%) donated less than two WB donations in any of
the qualification year. Regular high-frequency donors were mostly
male (55.3%) and also slightly older (average age 60.3 years) than low-
frequency donors. Among the donors, 25/3888 (0.6%) from the low-
frequency blood donor group were diagnosed with gastrointestinal/
colorectal cancer during 5 years of follow-up, whereas 27/2867
(0.9%) were diagnosed with gastrointestinal/colorectal cancer in the
high-frequency donor group. Among 3453 female donors, 40 (1.8%)
breast cancer cases were identified from the low-frequency donor
group and 21 (1.6%) from the high-frequency donor group during the
5-year follow-up period. For haematological cancer, we found
23 (0.6%) incident cases from the low-frequency donor group and
20 (0.7%) from the high-frequency donor group during the 5-year
follow-up period. The detailed information about the variables in
Table 2can be found in the Table S1. Figure 2shows no significant
risk differences between low and high-frequency donors in the
inverse probability weighted Kaplan Meyer survival curves for gastro-
intestinal/colorectal, breast and haematological cancers over a 5-year
follow-up..
Table 3presents the estimated 5-year cancer risk for gastrointes-
tinal/colorectal, breast and haematological cancer, their risks, risk dif-
ferences and RRs calculated by IPW, TMLE and SDR estimators. The
IPW risk of gastrointestinal/colorectal cancer was 0.9% (95% confi-
dence interval [CI], 0.6%–1.2%) for high-frequency donors and 0.7%
(95% CI, 0.5%–0.9%) for low-frequency donors which resulted in the
risk difference of 0.2% (95% CI, 0.1% to 0.5%) and RR of 1.25 (95%
CI, 0.83–1.68). We found almost identical results from TMLE; the risk
for high-frequency donors was 0.9% (95% CI, 0.7%–1.1%) and the
risk for low-frequency donors was 0.7% (95% CI, 0.5–0.9), which
resulted in risk difference of 0.2% (95% CI, 0.1% to 0.5%) and RR of
1.25 (95% CI, 0.86–1.81). The SDR estimator produced almost similar
results (Table 3) to IPW and TMLE. The IPW risk of breast cancer was
1.6% (1.1%, 2.2%) for high-frequency donors and 1.9% (95% CI,
1.5%–2.3%) for low-frequency donors, which resulted in the risk dif-
ference of 0.2% (0.9% to 0.4%) and the RR of 0.87 (0.48–1.26).
Moreover, the IPW risk of haematological cancer was 0.6% (95% CI,
0.4%–0.8%) for high-frequency donors and 0.6% (95% CI, 0.5%–0.8%)
for low-frequency donors, which produced a risk difference of 0.0%
(95% CI, 0.3% to 0.2%) and RR of 0.97 (95% CI, 0.55–1.40). The
TMLE produced almost similar results; risk of 0.6% (95% CI, 0.5%–
0.8%) for high-frequency donors, risk of 0.6% (95% CI, 0.5%–0.8%)
for low-frequency donors and risk difference of 0.0% (95% CI, 0.3%
to 0.2%) and RR of 0.96 (0.66–1.40). The SDR estimator produced
similar results to IPW and TMLE, except the RR was slightly higher
than both estimators (RR, 1.01 [95% CI, 0.71–1.43]). None of the
results for both gastrointestinal/colorectal and haematological cancer
were statistically significant, indicating no increased/decreased risk of
gastrointestinal/colorectal and haematological cancers among blood
donors.
Sensitivity analysis
We found similar results to our main analysis when we ended the
follow-up on 31 December 2015 instead of a fixed 5-year follow-up
for each participant. The IPW RR for this analysis was 1.27 (95% CI,
0.74–1.80) for gastrointestinal/colorectal cancer, 0.99 (95% CI, 0.59–
1.39) for breast cancer and 0.92 (95% CI, 0.53–1.30) for haematologi-
cal cancer. For different exposure definitions, we also found similar
TABLE 3 Estimated 5-year cancer risk, risk difference and risk ratios for high- and low-frequency donors.
Outcomes Models
Risk, % (95% CI)
Risk difference, % (95% CI) Risk ratio (95% CI)
Low frequency High frequency
Gastrointestinal/colorectal
a
IPW 0.7 (0.5 to 0.9) 0.9 (0.6 to 1.2) 0.2 (0.1 to 0.5) 1.25 (0.83 to 1.68)
TMLE 0.7 (0.5 to 0.9) 0.9 (0.7 to 1.1) 0.2 (0.1 to 0.5) 1.25 (0.86 to 1.81)
SDR 0.8 (0.6 to 0.9) 1.0 (0.7 to 1.2) 0.2 (0.1 to 0.5) 1.27 (0.89 to 1.80)
Breast
b
IPW 1.9 (1.5 to 2.3) 1.6 (1.1 to 2.2) 0.2 (0.9 to 0.4) 0.87 (0.48 to 1.26)
TMLE 1.9 (1.5 to 2.3) 1.7 (1.4 to 2.0) 0.2 (0.7 to 0.3) 0.89 (0.67 to 1.19)
SDR 2.0 (1.6 to 2.4) 1.7 (1.4 to 2.0) 0.3 (0.8 to 0.3) 0.86 (0.65 to 1.14)
Haematological
a
IPW 0.6 (0.5 to 0.8) 0.6 (0.4 to 0.8) 0.0 (0.3 to 0.2) 0.97 (0.55 to 1.40)
TMLE 0.6 (0.5 to 0.8) 0.6 (0.5 to 0.8) 0.0 (0.3 to 0.2) 0.96 (0.66 to 1.40)
SDR 0.7 (0.5 to 0.9) 0.7 (0.6 to 0.9) 0.0 (0.2 to 0.3) 1.01 (0.71 to 1.43)
Abbreviations: CI, confidence interval; IPW, inverse probability weighting; SDR, sequentially doubly robust; TMLE, targeted minimum loss-based estimator.
a
Adjusted for sex, age, haemoglobin, systolic blood pressure, diastolic blood pressure, blood group, body mass index (BMI), smoking status, self-rated
health, alcohol consumption, education, annual income, physical activity, daily consumption of fruits and vegetables, vitamin/mineral intake, red meat
consumption, processed meat consumption, family history of cancer, cancer screening, location, no. of general practice (GP) visits in the past 1 year, no. of
referrals in the past 1 year.
b
Adjusted for all the variables in a except for sex.
BLOOD DONATION AND VARIOUS CANCER RISKS 1241
14230410, 2024, 12, Downloaded from https://onlinelibrary.wiley.com/doi/10.1111/vox.13734 by Cornell University E-Resources & Serials Department, Wiley Online Library on [24/02/2025]. See the Terms and Conditions (https://onlinelibrary.wiley.com/terms-and-conditions) on Wiley Online Library for rules of use; OA articles are governed by the applicable Creative Commons License

results, except for breast cancer risk, where RR (0.5 [95% CI, 0.03–
0.96]) was significantly lower for high-frequency donors when consid-
ered at least three donations per every qualification year vs other
donation categories. For all other sensitivity analyses, we did not find
any statistically significant association. The detail results and descrip-
tion of the sensitivity analyses can be found in Tables S2–S4.
DISCUSSION
In this study, we examined the association between regular high-
frequency WB donation and the risk of gastrointestinal/colorectal,
breast and haematological malignancies among Australian blood
donors. We did not find a statistically significant relationship between
regular high-frequency WB donations and risk of developing the vari-
ous cancer outcomes studied.
We used the 5-year qualification period technique to ascertain
the exposure (high-frequency donor) and control (low-frequency
donor) groups, which is comparable to the qualification period method
used by Peffer et al. [18]. It is likely that the HDE has a substantial
impact on the studies that only used the lifetime number of donations
to determine exposure status. Thus, Peffer et al., in their study, only
included active donors and separated the exposure period from the
follow-up period in their analysis, which can significantly reduce
the HDE [18]. Similar to Peffer et al. our 5-year qualification period
method likely has a comparable effect on lowering the HDE. In addi-
tion, we had access to several other health-related variables to adjust
for the effect of HDE in our analysis. Although Peffer et al. have used
a three-category exposure variable based on the tertiles of donations
made during the 10-year qualification period and we have categorized
the exposure variable that was based on the frequency and consis-
tency of the donation pattern, these differences are likely to have only
a minor impact while comparing the studies.
Several studies have examined the incidence of cancer among
blood donors. Many of these studies have reported a lower risk of
cancer occurrence and mortality among blood donors [13, 14, 30]. In
a Scandinavian study, researchers utilized a nested case–control
design to investigate the impact of iron depletion through blood dona-
tion on Swedish and Danish donors [6]. The study found a trend
towards a reduced risk of liver, lung, colon, stomach and oesophageal
cancers in males with a latency period of 3 to 7 years, comparing the
lowest to highest estimated iron loss from donations. Nevertheless,
the authors acknowledged their inability to account for several impor-
tant confounding factors, such as smoking, alcohol consumption,
nutrition, physical activity, anthropometric measures and occupational
exposures, which might have influenced the observed results [6].
Another study from the United States reported there is no difference
in the risk of colorectal cancer in regular male blood donors compared
to non-donors [12]. Although they did not use any established
method to reduce the impact of HDE, our findings of gastrointestinal
and colon cancer are consistent with their findings.
Although none of our findings were statistically significant, our
point estimates for gastrointestinal/colorectal cancer in the main
analysis were slightly higher than the null value (IPW RR, 1.25 [95% CI,
0.83–1.68]). Increased cancer risk in high-frequency donors has been
reported in prior studies, but none of them could conclusively report
the association as causal [6, 15]. In one of our sensitivity analysis, we
defined the high-frequency exposure group with at least one and three
donations each year of the qualification period which ruled out the
possibility of an increased risk that could not be detected by our sam-
ple. In addition to that, time-varying TMLE and SDR estimators also
found almost zero risk differences among high and low-frequency
donors. Moreover, because of blood donors’continuous screening dur-
ing their donation career and comparatively higher health conscious-
ness, it is not uncommon to have more cancer detection among
frequent blood donors compared to casual donors [15, 16].
Our study has several strengths. First, the use of a qualification
period method decreased the HDE by comparing cancer outcomes
among active donor populations with a continuous donation career
and presumably less variance in health status. Second, our data link-
age allowed us to adjust for a variety of potential confounding vari-
ables, something that was lacking in the majority of previous studies.
In addition, we utilized doubly robust statistical models, such as TMLE
and SDR, which incorporated machine learning algorithms to deter-
mine the risk estimates. As the findings of our IPW model and our
doubly robust models are nearly identical, our treatment and outcome
models are less likely to have been misspecified.
Our study also has limitations. The majority of participants were
older adults. As a result, the findings of this study may not be general-
ized to all blood donors. However, the representativeness of the
45 and Up Study (19% response rate) is unlikely to be of importance
as our study examined the relative risks [20, 31]. Due to the fact that
our donation records are only available on or after June 2002, we
were unable to analyse the duration since the first donation or the
cumulative impact of the entire donation history. Moreover, com-
pared to some previous studies, our sample size is somewhat small,
and our follow-up period is also shorter (a maximum of 5 years),
resulting in a smaller number of events. This may cause lower statisti-
cal power to detect clinically important small effect sizes. Because of
the smaller number of events, we also did not conduct a sex-stratified
analysis, which may be relevant for iron-induced outcomes. However,
given the majority of the female participant in the study are older and
likely reached menopause, the differences by sex should be minimal.
In conclusion, we did not find any convincing evidence of an
altered risk of gastrointestinal/colorectal, breast and haematological
malignancy among high-frequency WB donors donating regularly. Fur-
ther exploration is needed with a longer follow-up time to better
understand the relationship between these cancer outcomes and reg-
ular high-frequency WB donation.
ACKNOWLEDGEMENTS
This study utilized data collected from the 45 and Up Study, which is
administered by the Sax Institute in collaboration with major partner
Cancer Council NSW and partners, the Heart Foundation and the
NSW Ministry of Health. We express our gratitude to the numerous
participants of the 45 and Up Study, as well as those who selflessly
1242 RAHMAN ET AL.
14230410, 2024, 12, Downloaded from https://onlinelibrary.wiley.com/doi/10.1111/vox.13734 by Cornell University E-Resources & Serials Department, Wiley Online Library on [24/02/2025]. See the Terms and Conditions (https://onlinelibrary.wiley.com/terms-and-conditions) on Wiley Online Library for rules of use; OA articles are governed by the applicable Creative Commons License

donated blood to save lives. We acknowledge Services Australia for
granting us access to the Medicare claims data. The linked data were
securely managed and accessed through the Sax Institute’s Secure
Unified Research Environment (SURE). We also extend our thanks to
CHeReL for providing the linked data (www.cherel.org.au).
M.M.R. analysed the data and wrote the first draft of the manu-
script; M.M.R, S.K. and A.H. conceptualized and designed the study;
A.E.C., J.K.O., D.O.I., A.H. and S.K. reviewed and edited the manu-
script; A.H. and S.K. supervised the research study.
The Australian governments fund Australian Red Cross Life-
blood to ensure the provision of blood, blood products and services
to the Australian population. A.E.C. is funded by an NHMRC Investi-
gator Grant #2008454. WOA Institution: University of New South
Wales. Consortia Name: CAUL 2023. Open access publishing facili-
tated by University of New South Wales, as part of the Wiley - Uni-
versity of New South Wales agreement via the Council of
Australian University Librarians.
CONFLICT OF INTEREST STATEMENT
The authors declare no conflicts of interest.
DATA AVAILABILITY STATEMENT
Available from the Sax Institute upon request but subject to
approvals.
ORCID
Md Morshadur Rahman https://orcid.org/0000-0002-6610-4043
Surendra Karki https://orcid.org/0000-0003-1561-4171
REFERENCES
1. Huang X. Iron overload and its association with cancer risk in
humans: evidence for iron as a carcinogenic metal. Mutat Res. 2003;
533:153–71.
2. Halliwell B, Gutteridge JMC. Oxygen free radicals and iron in relation
to biology and medicine: some problems and concepts. Arch Bio-
chem Biophys. 1986;246:501–14.
3. Selby JV, Friedman GD. Epidemiologic evidence of an association
between body iron stores and risk of cancer. Int J Cancer. 1988;41:
677–82.
4. Knekt P, Reunanen A, Takkunen H, Aromaa A, Heliövaara M,
Hakuunen T. Body iron stores and risk of cancer. Int J Cancer. 1994;
56:379–82.
5. Nelson RL. Iron and colorectal cancer risk: human studies. Nutr Rev.
2001;59:140–8.
6. Edgren G, Reilly M, Hjalgrim H, Tran TN, Rostgaard K, Adami J, et al.
Donation frequency, iron loss, and risk of cancer among blood
donors. J Natl Cancer Inst. 2008;100:572–9.
7. Wen CP, Lee JH, Tai Y-P, Wen C, Wu SB, Tsai MK, et al. High serum
iron is associated with increased cancer risk. Cancer Res. 2014;74:
6589–97.
8. Marquet RL, Hoynck van Papendrecht MA, Busch OR, Jeekel J.
Blood donation leads to a decrease in natural killer cell activity: a
study in normal blood donors and cancer patients. Transfusion.
1993;33:368–73.
9. Ishii K, Birmann BM, Zhang X, Giovannucci E, Bertrand KA. A pro-
spective analysis of blood donation history and risk of non-Hodgkin
lymphoma. Leuk Lymphoma. 2016;57:1423–8.
10. Kowdley KV. Iron, hemochromatosis, and hepatocellular carcinoma.
Gastroenterology. 2004;127:S79–86.
11. Agudo A, Bonet C, Sala N, Munoz X, Aranda N, Fonseca-
Nunes A, et al. Hemochromatosis (HFE) gene mutations and risk
of gastric cancer in the European Prospective Investigation into
Cancer and Nutrition (EPIC) study. Carcinogenesis. 2013;34:
1244–50.
12. Zhang X, Ma J, Wu K, Chan AT, Fuchs CS, Giovannucci EL. Blood
donation and colorectal cancer incidence and mortality in men. PLoS
One. 2012;7:e39319.
13. Merk K, Mattsson B, Mattsson A, Holm G, Gullbring B, Björkholm M.
The incidence of cancer among blood donors. Int J Epidemiol. 1990;
19:505–9.
14. Edgren G, Tran TN, Hjalgrim H, Rostgaard K, Shanwell A,
Titlestad K, et al. Improving health profile of blood donors as a
consequence of transfusion safety efforts. Transfusion. 2007;47:
2017–24.
15. Zhao J, Dahlén T, Brynolf A, Edgren G. Risk of hematological malig-
nancy in blood donors: a nationwide cohort study. Transfusion.
2020;60:2591–6.
16. Vahidnia F, Hirschler NV, Agapova M, Chinn A, Busch MP,
Custer B. Cancer incidence and mortality in a cohort of US
blood donors: a 20-year study. J Cancer Epidemiol. 2013;2013:
814842.
17. Atsma F, Veldhuizen I, Verbeek A, de Kort W, de Vegt F. Healthy
donor effect: its magnitude in health research among blood donors.
Transfusion. 2011;51:1820–8.
18. Peffer K, den Heijer M, de Kort WL, Verbeek AL, Atsma F. Cardio-
vascular risk in 159 934 frequent blood donors while addressing the
healthy donor effect. Heart. 2019;105:1260–5.
19. 45 and Up Study Collaborators, Banks E, Redman S, Jorm L,
Armstrong B, Bauman A, et al. Cohort profile: the 45 and up study.
Int J Epidemiol. 2008;37:941–7.
20. Bleicher K, Summerhayes R, Baynes S, Swarbrick M, Navin
Cristina T, Luc H, et al. Cohort profile update: the 45 and up study.
Int J Epidemiol. 2023;52:e92–e101.
21. Karki S, Bell KJL, Hayen A, Liu B, Cust AE, Olynyk JK, et al. Regular
high-frequency whole blood donation and risk of cardiovascular dis-
ease in middle-aged and older blood donors in Australia. Transfusion.
2023;63:1012–22.
22. Peffer K. Blood donation and cardiovascular disease. Addressing the
healthy donor effect. (Doctoral dissertation, Radboud University Nij-
megen) 2015. https://hdl.handle.net/2066/149279
23. Luedtke AR, Sofrygin O, van der Laan MJ, Carone M. Sequential dou-
ble robustness in right-censored longitudinal models. arXiv. 2017.
https://doi.org/10.48550/arXiv.1705.02459
24. van der Laan MJ, Rose S. Targeted learning in data science: causal
inference for complex longitudinal studies. Cham, Switzerland:
Springer; 2018.
25. Brooks JC, van der Laan MJ, Singer DE, Go AS. Targeted mini-
mum loss-based estimation of causal effects in right-censored
survival data with time-dependent covariates: warfarin, stroke,
and death in atrial fibrillation. J Causal Inference. 2013;1:
235–54.
26. Tran L, Yiannoutsos C, Wools-Kaloustian K, Siika A, Van Der Laan M,
Petersen M. Double robust efficient estimators of longitudinal treat-
ment effects: comparative performance in simulations and a case
study. Int J Biostat. 2019;15:20170054.
27. Chernozhukov V, Chetverikov D, Demirer M, Duflo E, Hansen C,
NeweyW,etal.Double/debiased machine learning for treat-
ment and structural parameters. Oxford: Oxford University
Press; 2018.
28. Hoffman KL, Salazar-Barreto D, Rudolph KE, Díaz I. Introducing lon-
gitudinal modified treatment policies: a unified framework for
BLOOD DONATION AND VARIOUS CANCER RISKS 1243
14230410, 2024, 12, Downloaded from https://onlinelibrary.wiley.com/doi/10.1111/vox.13734 by Cornell University E-Resources & Serials Department, Wiley Online Library on [24/02/2025]. See the Terms and Conditions (https://onlinelibrary.wiley.com/terms-and-conditions) on Wiley Online Library for rules of use; OA articles are governed by the applicable Creative Commons License

studying complex exposures. arXiv. 2023. https://doi.org/10.48550/
arXiv.2304.09460
29. Van Buuren S, Groothuis-Oudshoorn K. Mice: multivariate
imputation by chained equations in R. J Stat Softw. 2011;45:
1–67.
30. Lasek W, Jakobisiak M, Stoklosa T. Decreased natural killer cell activ-
ity in whole-blood donors does not seem to result in increased can-
cer incidence. Transfusion. 1994;34:359–60.
31. Mealing NM, Banks E, Jorm LR, Steel DG, Clements MS, Rogers KD.
Investigation of relative risk estimates from studies of the same pop-
ulation with contrasting response rates and designs. BMC Med Res
Methodol. 2010;10:1–12.
SUPPORTING INFORMATION
Additional supporting information can be found online in the Support-
ing Information section at the end of this article.
How to cite this article: Rahman MM, Hayen A, Olynyk JK,
Cust AE, Irving DO, Karki S. Regular whole blood donation and
gastrointestinal, breast, colorectal and haematological cancer
risk among blood donors in Australia. Vox Sang. 2024;119:
1234–44.
1244 RAHMAN ET AL.
14230410, 2024, 12, Downloaded from https://onlinelibrary.wiley.com/doi/10.1111/vox.13734 by Cornell University E-Resources & Serials Department, Wiley Online Library on [24/02/2025]. See the Terms and Conditions (https://onlinelibrary.wiley.com/terms-and-conditions) on Wiley Online Library for rules of use; OA articles are governed by the applicable Creative Commons License

ORIGINAL ARTICLE
Questions on travel and sexual behaviours negatively impact
ethnic minority donor recruitment: Effect of negative word-
of-mouth and avoidance
Eamonn Ferguson
1,2
| Richard Mills
1,2
| Erin Dawe-Lane
1,3
|
Zaynah Khan
1,4
| Claire Reynolds
5
| Katy Davison
6
| Dawn Edge
7
|
Robert Smith
1,2
| Niall O’Hagan
1
| Roshan Desai
1
| Mark Croucher
8
|
Nadine Eaton
9
| Susan R. Brailsford
5
1
School of Psychology, University of
Nottingham, Nottingham, United Kingdom
2
National Institute for Health and Care
Research Blood and Transplant Research Unit
in Donor Health and Behaviour, University of
Cambridge, Cambridge, United Kingdom
3
Clinical, Educational and Health Psychology,
Psychology and Language Sciences, University
College London, London, United Kingdom
4
Research Support Officer, Institute of Mental
Health, Nottinghamshire Healthcare NHS
Foundation Trust, United Kingdom
5
NHS Blood and Transplant/UK Health
Security Agency Epidemiology Unit, NHSBT,
London, United Kingdom
6
NHS Blood and Transplant/UK Health
Security Agency Epidemiology Unit, UKHSA,
London, United Kingdom
7
Equality, Diversity & Inclusion Research Unit
(EDI-RU), Greater Manchester Mental Health
(GMMH) NHS Trust. Biomedical Research
Centre, Manchester Academic Health Science
Centre, Manchester, United Kingdom
8
NHS Blood and Transplant, Donor Experience
Services, London, United Kingdom
9
NHS Blood and Transplant, Marketing,
Transfusions, Bristol, United Kingdom
Correspondence
Eamonn Ferguson, School of Psychology,
University of Nottingham, Nottingham, UK.
Email: eamonn.ferguson@nottingham.ac.uk
Funding information
NHS Blood and Transplant, Grant/Award
Number: TF082; NIHR Blood and Transplant
Research Unit in Donor Health and Behaviour,
Grant/Award Number: NIHR203337
Abstract
Background and Objectives: Donor selection questions differentially impacting eth-
nic minorities can discourage donation directly or via negative word-of-mouth. We
explore the differential impact of two blood safety questions relating to (i) sexual
contacts linked to areas where human immunodeficiency virus (HIV) rates are high
and (ii) travelling to areas where malaria is endemic. Epidemiological data are used to
assess infection risk and the need for these questions.
Materials and Methods: We report two studies. Study 1 is a behavioural study on
negative word-of-mouth and avoiding donation among ethnic minorities (n=981
people from National Health Service Blood and Transplant (NHSBT) and the general
population: 761 were current donors). Study 2 is an epidemiology study (utilizing
NHSBT/UK Health Security Agency (UKHSA) surveillance data on HIV-positive
donations across the UK blood services between1996 and 2019) to assess whether
the sexual risk question contributes to reducing HIV risk and whether travel deferral
was more prevalent among ethnic minorities (2015–2019). Studies 1 and 2 provide
complementary evidence on the behavioural impact to support policy implications.
Results: A high proportion of people from ethnic minorities were discouraged from
donating and expressed negative word-of-mouth. This was mediated by perceived
racial discrimination within the UK National Health Service. The number of donors
with HIV who the sexual contact question could have deferred was low, with
between 8% and 9.3% of people from ethnic minorities deferred on travel compared
with 1.7% of White people.
Conclusion: Blood services need to consider ways to minimize negative word-of-
mouth, remove questions that are no longer justified on evidence and provide justifi-
cation for those that remain.
Received: 9 April 2024 Revised: 20 September 2024 Accepted: 21 September 2024
DOI: 10.1111/vox.13748
This is an open access article under the terms of the Creative Commons Attribution License, which permits use, distribution and reproduction in any medium,
provided the original work is properly cited.
© 2024 The Author(s). Vox Sanguinis published by John Wiley & Sons Ltd on behalf of International Society of Blood Transfusion.
Vox Sanguinis. 2024;119:1245–1256. wileyonlinelibrary.com/journal/vox 1245

Keywords
blood donation, donor behaviour, ethnicity, HIV, sexual behaviour, travel
Highlights
•Donor selection questions on travel and sexual contact linked to human immunodeficiency
virus (HIV)-endemic areas negatively impact ethnic minorities in terms of increased negative
word-of-mouth and reduced willingness to donate.
•A total of 34% of Black non-donors decided not to donate because of the sexual contact
question, with 17% of Black non-donors telling others not to. The travel question resulted in
17% of Black non-donors deciding not to donate and 11.3% telling others not to. These
effects were mediated through increased perceived racial discrimination within the National
Health Service.
•Surveillance data show that the number of donors with HIV attributed to sex with a higher
risk partner from an endemic area is low. Travel questions disproportionately impact ethnic
minorities, with 8%–9.3% of people advised not to attend to donate compared with 1.7% of
White donors.
INTRODUCTION
While greater diversity within donor panels is clinically beneficial, dis-
proportionately fewer people from ethnic minorities donate within
countries in the global north [1]. One contributory factor we explore
is the negative impact of deferral arising from blood donor selection
questions differentially impacting ethnic minorities [2]. We explore
this negative impact in terms of reduced propensity to donate (avoid-
ance) [2, 3] and negative word-of-mouth (
N
WoM) [4, 5].
Consequence of deferral: Personal avoidance
and
N
WoM
Deferral (i.e., being temporarily or permanently not allowed to donate
blood) reduces the likelihood of a person donating again [3] and may
have a wider social impact through
N
WoM in terms of telling others
not to donate [4–6]. Information through
N
WoM is a major concern
because it (i) is more believable than positive WoM (
P
WoM)
(e.g., information that would encourage and support blood donation)
[4, 5, 7], (ii) spreads widely and quickly [8] and (iii) is hard to counter-
act [9, 10]. This is especially true if deferral is perceived as discrimina-
tory and unjust [10]. While the negative impact of
N
WoM on
productivity is well documented in the business community [4, 5], less
is known about
N
WoM in the voluntary sector [11] and blood dona-
tion in particular [6, 12–17].
For blood donation,
P
WoM encourages (i) recruitment ([6, 13, 14]
but see [12]), (ii) positive donor attitudes [15] and (iii) subsequent
P
WoM [16]. While
N
WoM based on deferral has been reported [17],
the impact of
N
WoM on blood donation has not been explored. This
article addresses this gap in the literature. We explored
N
WoM arising
from blood donor selection questions that differentially impact ethnic
minority communities in the United Kingdom (UK) in 2019, predicting
that
N
WoM will be higher among ethnic minorities.
In terms of better understanding the mechanisms driving
N
WoM for ethnic minorities, we propose that perceived racial dis-
crimination within the UK National Health Service (NHS) and social
isolation mediate the link between ethnicity and
N
WoM. People
from ethnic minorities report greater perceived racial discrimina-
tion within health services in the United Kingdom and worldwide
[18-19], and greater social isolation is linked to feelings of margin-
alization [20, 21]. Thus, enhanced racial discrimination and isolation
should foster greater
N
WoM by confirming these opinions and
experiences [20].
Awareness: Safety, family and need
We examine three aspects of awareness that should reduce the nega-
tive impact of questions: safety, family and need. Awareness that
these questions are asked to ensure blood safety should mitigate neg-
ative impacts by providing a potential justification for their inclu-
sion [22]. Similarly, knowing family members who donate should also
reduce negative impacts by helping to normalize donation [23, 24].
Finally, awareness of the need for well-matched blood should also act
as a mitigator by reinforcing the importance of the need for a diverse
donor pool [19].
Sex and travel questions in the United Kingdom
We explore the effect of
N
WoM and avoidance in two donor selection
questions in the UK, which are more likely to impact people from eth-
nic minorities, using behavioural (Study 1) and epidemiological (Study
2) data collected from UK donors. The first question asked if, in the
last 3 months, the potential donor has had sex with anyone who may
ever have had sex in parts of the world where human immunodefi-
ciency virus (HIV)/acquired immunodeficiency syndrome (AIDS) is
1246 FERGUSON ET AL.
14230410, 2024, 12, Downloaded from https://onlinelibrary.wiley.com/doi/10.1111/vox.13748 by Cornell University E-Resources & Serials Department, Wiley Online Library on [24/02/2025]. See the Terms and Conditions (https://onlinelibrary.wiley.com/terms-and-conditions) on Wiley Online Library for rules of use; OA articles are governed by the applicable Creative Commons License

common, including most countries in Africa: Termed the higher risk
partner from sub-Saharan Africa question (HRP-SSA). If potential
donors answered ‘Yes’to the HRP-SSA question, they were asked
not to donate, although, in England, the deferral could be removed if
they had a regular partner willing to give a sample for testing. The sec-
ond question asked if the potential donor had travelled recently. If
they have returned from a tropical area affected by chikungunya, den-
gue, yellow fever or zika, this resulted in a 1-month deferral, and
returning from the malarious area (e.g., parts of Africa) in a 4-month
deferral followed by additional testing. While these processes, in place
for many years, are intended to enhance blood safety, behaviourally,
they differentially affect people from ethnic minorities who are more
likely to have travelled to Africa, Asia and South America. Indeed, pre-
vious findings show that White donors had the lowest proportions of
deferral at 2%, with 15% of donors of Indian ethnicity, 10%
of Pakistani ethnicity donors and 8% of Black African donors advised
not to attend [25].
Behavioural and epidemiological evidence for policy
impacts
Any behavioural impacts, as evidenced by avoidance and
N
WoM,
would suggest that these questions should be removed or changed.
However, the behavioural evidence only tells half the story, and to
support policy change, it is also necessary to show no direct impact
on donor safety. Therefore, triangulation with epidemiological data
is essential. Thus, we explore the effects of the HRP-SSA question
on the incidence of HIV in donors up to 2019 and discuss how
many people from ethnic minorities are deferred on the travel
question.
Historical context
The questions examined in this article were in place in 2019 on the
donor health check (DHC) at the time. At the time the screening ques-
tionnaire in England, Northern Ireland and Scotland were pencil and
paper, and in Wales, electronic, but they ask the same questions with
slight differences in wording. The work reported in this article contrib-
uted to the subsequent removal (HRP-SSA) or led to an update of
pre-donation information concerning the importance of the travel
questions as part of the For the Assessment of Individualised Risk
(FAIR) 2 initiative with NHS Blood and Transplant (NHSBT) (https://
www.blood.co.uk/news-and-campaigns/news-and-statements/fair-
steering-group; NHSBT is a special health authority that is part of
the NHS. It is responsible for blood donation services in England)
and, as a consequence, has enhanced inclusivity and equity. We
report these data to show how triangulation across behaviour and
epidemiology data provides robust evidence for policy change.
Also, the behavioural data we report here (Study 1) extends previ-
ous reports by exploring the mediating role of perceived racial dis-
crimination and social isolation and the social network of donors.
Aims and hypotheses
We tested the following behavioural hypotheses (Study 1). The
HRP-SSA and travel questions will result in greater reported avoid-
ance and
N
WoM in ethnic minorities (H1). People from ethnic
minorities will perceive greater racial discrimination within the
NHS and greater social isolation (H2). The link between ethnic
minorities with avoidance and
N
WoM will be mediated by per-
ceived racial discrimination within the NHS (H3a)andsocialisola-
tion (H3b). Knowing family members who have donated blood
(H4a), being aware that the questions are asked to enhance safety
(H4b) and being aware of the need for well-matched blood (H4c)
will ameliorate any adverse effects of the HRP-SSA and travel
questions. Using epidemiological and donor management data
(Study 2), we (i) examined the number of UK donors with HIV who
later reported a potential HRP-SSA partner and (ii) tested the
hypothesis that people from ethnic minorities were more likely to
be deferred by the travel question (H5).
STUDY 1: BEHAVIOURAL EFFECTS ON
N
WOM AND AVOIDANCE
Methods
Design and sampling procedure
Six thousand (3500 from ethnic minorities and 2500 from White
backgrounds) current donors who had donated within the last 2 years
were randomly selected from the NHSBT database (ethnicity data
were 99% complete in 2019). Non-donors were recruited through a
market research company (Code 3: www.code3research.co.uk: 8600
were randomly selected with 4300 from ethnic minorities and 4300
White people). Initial surveys and reminders were sent out between
14 June 2019 and the 2 August 2019 (see [11] and Supplementary
File S1).
Coding ethnicity
Self-described ethnicity was coded using the UK Office of National
Statistics (ONS) criteria (Supplementary File S2).
Materials
Supplementary File S3 provides the survey description, and Supple-
mentary File S4 contains details of the measures.
Racial discrimination within the NHS
This was assessed with three items (e.g., ‘Racial discrimination in a
doctor’s surgery is common’: Supplementary File S4 for all items)
(from [26]), summed to give a single scale with higher scores equating
NEGATIVE WORD-OF-MOUTH, AVOIDANCE AND RECRUITING ETHNIC MINORITY DONORS 1247
14230410, 2024, 12, Downloaded from https://onlinelibrary.wiley.com/doi/10.1111/vox.13748 by Cornell University E-Resources & Serials Department, Wiley Online Library on [24/02/2025]. See the Terms and Conditions (https://onlinelibrary.wiley.com/terms-and-conditions) on Wiley Online Library for rules of use; OA articles are governed by the applicable Creative Commons License

to greater discrimination (α=0.84, M=6.75, SD =2.58, mode =6,
range =3–15).
Social inclusion
We assess this with two items (e.g., ‘Overall, how strongly do you feel
about the extent to which you are included in broader society in the
UK’: Supplementary File S4 for all items) [27, 28], totalled with higher
scores equating to greater social inclusion (α=0.73, M=6.87,
SD =1.82, mode =8, range =2–10).
Both the perceived racial discrimination and social isolation ques-
tions were scored on a five-point Likert-type scale (1 =Strongly Dis-
agree, 2 =Disagree, 3 =Neither Disagree nor Agree, 4 =Agree and
5=Strongly Agree).
Family/community connections with blood donation
We asked, ‘Do you know any people from the following groups who
have donated blood?’(i) your family, (ii) your friends, (iii) your work col-
leagues and (iv) your neighbourhoods (Yes =1, No/Don’tKnow=0).
Awareness of need for ethnic minority blood
We asked, ‘Were you aware that blood from ethnic minority groups is
needed to treat diseases like Sickle Cell and Thalassemia?
(Yes =0, No =1).’
Evaluation tasks for the 2019 HRP-SSA and travel
questions
All participants were presented with the following stem:
Before donating blood everyone must read an informa-
tion booklet and complete a form which asks questions
about lifestyle, health, and travel. In one question, those
presenting to donate blood are asked …
Participants were then presented with the following specific wording
for the following:
1. the HRP-SSA question,
…if in the last three months, they have ‘had sex with
anyone who may ever have had sex in parts of the world
where AIDS/HIV is very common (this includes most
countries in Africa)?’If they answer Yes, they are asked
not to donate unless their partner is able to give a sam-
ple for testing.
2. the Travel question,
…if they have travelled outside the UK in the last
12 months or since their last donation. Specifically, if
donors have returned from an area where there is
malaria, including many parts of Africa, Asia, and South
America in the last 4 months they are asked not to
donate.
After reading the HRP-SSA questions, participants answered ques-
tions on awareness and the two primary outcomes of avoidance and
N
WoM. This was repeated for the Travel question.
Awareness of safety
Participants were asked: ‘This question needs to be asked to keep
blood safe for patients’(Safety) and ‘The reason for asking this needs
to be explained to the donor’(Need).
Primary outcome measures
Participants were also asked: (i) ‘This question would put me off want-
ing to donate blood’(Avoidance) and (ii) ‘question makes me want to
tell others not to donate’(
N
WoM).
Awareness and outcome measures were assessed on a five-point
Likert-type scale (1 =Strongly Disagree, 2 =Disagree, 3 =Neither
Disagree nor Agree, 4 =Agree and 5 =Strongly Agree).
Analytical strategy
Perceived racial discrimination and social inclusion were normalized using
theformulaeinSupplementaryFileS5. As the outcomes are correlated,
seemingly unrelated regression (SUR) models accounted for this overlap
in the residual error. Models were specified in SPSS-28 and Stata-18, with
all p-values two-tailed. Power calculations showed that the sample size
provides 80% power (Supplementary File S5).
Results
The final sample consisted of 981 participants, of which 182 were
Asian, 141 Black, 158 mixed ethnicity, 24 other, 456 White and
20 missing. In total, 761 were current donors, 633 were female,
339 were male and 9 were missing, and the mean age was 44.65 years
(SD =14.57) (Supplementary File S2 for full details). There were
719 responses from NHSBT (12% response rate), 254 from code
3 (3% response rate) and 8 from the community sample. Donors were
less likely to be Black and women (Table S2 for details).
1248 FERGUSON ET AL.
14230410, 2024, 12, Downloaded from https://onlinelibrary.wiley.com/doi/10.1111/vox.13748 by Cornell University E-Resources & Serials Department, Wiley Online Library on [24/02/2025]. See the Terms and Conditions (https://onlinelibrary.wiley.com/terms-and-conditions) on Wiley Online Library for rules of use; OA articles are governed by the applicable Creative Commons License

Hypothesis 1. HRP-SSA and travel questions result in
greater avoidance and
N
WoM for ethnic minorities.
To explore H1, we grouped responses for the HRP-SSA and
Travel questions into three combined categories: (i) ‘strongly dis-
agree/disagree’, (ii) ‘neither’and (iii) ‘strongly agree/agree’.
Figure 1shows the percentage of responses in the ‘strongly
agree/agree’category by ethnicity for the whole sample, current
donors and non-current-donors (Supplementary File S6 for per-
centages for all categories by ethnicity and donor experience). For
the HRP-SSA and Travel questions, Black people were significantly
more likely to ‘strongly agree/agree’for ‘avoidance’,reaching
34% of Black non-donors. Regarding
N
WoM, Black people were
significantly more likely to endorse ‘strongly agree/agree’for
N
WoM, with this being 17.4% for Black non-donors. These findings
support H1.
Table 1shows that the predictions from H1 are robust in con-
trolling for demographic factors, safety, need, awareness, discrimi-
nation, social inclusion, and family/community connections to
blood donation. That is, after reading the HRP-SSA question, Black
people were more likely to say they would avoid donation com-
pared to White people. Similarly, after reading the travel question
(Table 1), Black people were more likely to say they would avoid
donating compared to White people.
The results in Table 1also show that following the HRP-SSA
question, avoidance was also higher if people (i) felt that the
inclusion of the HRP-SSA question needed explaining, (ii) were
less aware of the need for blood from ethnic minorities, and (iii)
knew a family member who has donated blood. Avoidance was
lower following the HRP-SSA question if people (i) believed the
question was included to ensure safety and (ii) were current
donors. Concerning
N
WOM, people from Asian, Black, and Mixed
ethnicities are more likely to say that they will tell others not to
donate compared to White people.
N
WOM was higher if people
(i) were older, (ii) felt more socially isolated, and (iii) knew a fam-
ily member who had donated blood.
N
WOM was lower for cur-
rent donors.
Table 2also shows that following the travel question, avoidance
was higher if people (i) felt that the inclusion of the Travel question
needed explaining and (ii) perceived greater racial discrimination
within the NHS. Avoidance was lower if people (i) believed the ques-
tion was included to ensure blood safety and (ii) were current
donors. For
N
WOM, Asian and Black people were more likely to say
that they would tell others not to donate compared to White people.
N
WOM was also higher if people (i) were older and (ii) knew a family
member had donated blood.
N
WOM was lower for current blood
donors, and if people felt the question was needed to ensure blood
safety.
Hypothesis 2. Greater discrimination within the NHS
and social isolation will be observed in ethnic minorities.
Supporting H2,Figure2shows that perceived discrimi-
nation within the NHS is higher in all ethnic minorities compared
FIGURE 1 Percentages endorsing strongly agree/agree by ethnicity and donor status. HRP-SSA, higher risk partner from sub-Saharan Africa
question
N
WOM, negative word-of-mouth.
NEGATIVE WORD-OF-MOUTH, AVOIDANCE AND RECRUITING ETHNIC MINORITY DONORS 1249
14230410, 2024, 12, Downloaded from https://onlinelibrary.wiley.com/doi/10.1111/vox.13748 by Cornell University E-Resources & Serials Department, Wiley Online Library on [24/02/2025]. See the Terms and Conditions (https://onlinelibrary.wiley.com/terms-and-conditions) on Wiley Online Library for rules of use; OA articles are governed by the applicable Creative Commons License

with White people and higher in Black people than people of
Asian and Mixed ethnicities. Social inclusion is lowered in
people of Black and Mixed ethnicities compared to White
people, with social inclusion lower in Black compared with Asian
people.
Hypothesis 3a,b. Mediation by perceived racial dis-
crimination and social isolation.
Figure 3shows the parallel mediation models for avoidance
and
N
WoM. Consistent with H3a, for people from ethnic
TABLE 1 Seemingly unrelated regression models for avoidance and negative word-of-mouth for sexual behaviour.
Coefficient
Robust
pvalue
95% CI
SE Lower Upper
Outcome: avoidance
Gender (male) 0.0727778 0.0644469 0.259 0.0535358 0.1990913
Age 0.0026539 0.0026017 0.308 0.0024454 0.0077532
Need to explain why the question is included 0.0887023 0.0242322 0.000 0.041208 0.1361966
The question is to ensure safe blood 0.5562526 0.0481966 0.000 0.6507163 0.461789
Ethnicity (comparison is White)
Mixed 0.1410763 0.0934134 0.131 0.0420106 0.3241632
Asian 0.1166425 0.0847232 0.169 0.049412 0.282697
Black 0.4077688 0.1092357 0.000 0.1936707 0.6218669
Not aware that ethnic blood is needed 0.1597154 0.0779128 0.040 0.007009 0.3124217
Current donor (yes) 0.3362416 0.0813097 0.000 0.4956056 0.1768777
Social inclusion 0.244049 0.1418597 0.085 0.5220889 0.0339909
Racial discrimination within NHS 0.1983081 0.1698497 0.243 0.1345912 0.5312074
Family member has donated blood (yes) 0.176632 0.0627878 0.005 0.0535701 0.2996939
Friends has donated blood (yes) 0.0773226 0.0739411 0.296 0.0675993 0.2222444
Work colleague has donate blood (yes) 0.0763502 0.0683174 0.264 0.2102499 0.0575494
Neighbour has donated blood (yes) 0.0634793 0.084325 0.452 0.2287533 0.1017947
Constant 3.84191 0.3300852 0.000 3.194955 4.488865
R
2
0.29
Outcome: negative word-of-mouth
Gender (male) 0.0666061 0.0520117 0.200 0.0353349 0.1685471
Age 0.0055602 0.0021063 0.008 0.0014318 0.0096885
Need to explain why the question is included 0.0203251 0.0179531 0.258 0.0148624 0.0555127
The question is to ensure safe blood 0.3599031 0.0429607 0.000 0.4441046 0.2757016
Ethnicity (Comparison is White)
Mixed 0.2015463 0.0753653 0.007 0.053833 0.3492597
Asian 0.2118931 0.0676564 0.002 0.079289 0.3444972
Black 0.4621369 0.0899145 0.000 0.2859077 0.6383662
Not aware that ethnic blood is needed 0.09908 0.0584038 0.090 0.0153894 0.2135493
Current donor (yes) 0.2778558 0.0688061 0.000 0.4127133 0.1429982
Social inclusion 0.3395684 0.1274423 0.008 0.5893507 0.089786
Racial discrimination 0.0293386 0.1378402 0.831 0.2408232 0.2995005
Family member has donated blood (yes) 0.1535602 0.0539083 0.004 0.0479019 0.2592184
Friends Has donated blood (yes) 0.0427983 0.0545869 0.433 0.06419 0.1497867
Work colleague has donate blood (yes) 0.0682494 0.0549802 0.214 0.1760086 0.0395098
Neighbour has donated blood (yes) 0.0230505 0.0759652 0.762 0.1258384 0.1719395
Constant 2.946199 0.2618483 0.000 2.432986 3.459413
R
2
0.29
Note: Breusch–Pagan test of independence: χ
2
(1) =268.702, p=0.0000 (n=853).
Note: Figures in bold highlight the statistically significant effects. Coefficients in bold are all significant effects.
Abbreviations: CI, confidence interval; NHS, National Health Service; SE, standard deviation.
1250 FERGUSON ET AL.
14230410, 2024, 12, Downloaded from https://onlinelibrary.wiley.com/doi/10.1111/vox.13748 by Cornell University E-Resources & Serials Department, Wiley Online Library on [24/02/2025]. See the Terms and Conditions (https://onlinelibrary.wiley.com/terms-and-conditions) on Wiley Online Library for rules of use; OA articles are governed by the applicable Creative Commons License

minorities, there was a significant indirect effect on both avoid-
ance and
N
WoM via perceptions of higher racial discrimination.
H3b was not supported as there was no indirect effect via
social inclusion (Supplementary File S7 for more details).
Hypothesis 4a–c. Ameliorates effects of awareness.
Figure 4shows that family, friends and colleagues are more likely
to be blood donors than neighbours. For White people, compared with
TABLE 2 Seemingly unrelated regression models for avoidance and negative word-of-mouth for travel abroad.
Coefficient
Robust
pvalue
95% CI
SE Lower Upper
Outcome: avoidance
Gender male 0.0786634 0.0497895 0.114 0.0189222 0.1762489
Age 0.0014635 0.001945 0.452 0.0023487 0.0052757
Need to explain 0.0548282 0.0169459 0.001 0.0216148 0.0880415
The question is to ensure safe blood 0.6196312 0.0485242 0.000 0.7147368 0.5245255
Ethnicity (comparison is White)
Mixed 0.0709655 0.0608869 0.244 0.0483705 0.1903016
Asian 0.047944 0.0680526 0.481 0.0854367 0.1813247
Black 0.2804929 0.084801 0.001 0.114286 0.4466998
Not aware that ethnic blood is needed 0.0368851 0.049103 0.453 0.0593549 0.1331251
Current donor (yes) 0.2600327 0.0676046 0.000 0.3925352 0.1275302
Social inclusion 0.1897651 0.1242415 0.127 0.433274 0.0537437
Racial discrimination within NHS 0.2751077 0.1308768 0.036 0.0185938 0.5316216
Family member has donated blood (yes) 0.0475548 0.0465199 0.307 0.0436225 0.1387322
Friends has donated blood (yes) 0.0210827 0.0508747 0.679 0.0786298 0.1207952
Work colleague has donate blood (yes) 0.0634191 0.0459313 0.167 0.1534428 0.0266046
Neighbour has donated blood (yes) 0.0235403 0.0545463 0.666 0.1304491 0.0833684
Constant 4.229541 0.291407 0.000 3.658394 4.800689
R
2
0.37
Outcome: negative word-of-mouth
Gender (male) 0.0334401 0.0461587 0.469 0.0570293 0.1239096
Age 0.0056782 0.0019385 0.003 0.0018787 0.0094777
Need to explain 0.0091406 0.017519 0.602 0.0251961 0.0434773
The question is to ensure safe blood 0.5002299 0.0543796 0.000 0.6068119 0.3936478
Ethnicity (comparison is White)
Mixed 0.0704963 0.054624 0.197 0.0365648 0.1775574
Asian 0.1490424 0.0601033 0.013 0.0312421 0.2668427
Black 0.4367506 0.0924292 0.000 0.2555927 0.6179085
Not aware that ethnic blood is needed 0.0125074 0.0438354 0.775 0.0734085 0.0984233
Current donor (yes) 0.1644094 0.0649275 0.011 0.2916649 0.0371538
Social inclusion 0.1327164 0.1149905 0.248 0.3580936 0.0926608
Racial discrimination within NHS 0.2428332 0.1325711 0.067 0.0170014 0.5026677
Family member has donated blood (yes) 0.0892877 0.0451744 0.048 0.0007475 0.1778278
Friends has donated blood (yes) 0.0844568 0.0470661 0.073 0.1767045 0.007791
Work colleague has donate blood (yes) 0.0249093 0.0441789 0.573 0.1114984 0.0616798
Neighbour has donated blood (yes) 0.047215 0.0566966 0.405 0.0639082 0.1583383
Constant 3.495889 0.2959177 0.000 2.915901 4.075877
R
2
0.31
Note: Breusch–Pagan test of independence: χ
2
(1) =277.549, p=0.0000 (n=850).
Note: Figures in bold highlight the statistically significant effects. Coefficients in bold are all significant effects.
Abbreviations: CI, confidence interval; NHS, National Health Service; SE, standard deviation.
NEGATIVE WORD-OF-MOUTH, AVOIDANCE AND RECRUITING ETHNIC MINORITY DONORS 1251
14230410, 2024, 12, Downloaded from https://onlinelibrary.wiley.com/doi/10.1111/vox.13748 by Cornell University E-Resources & Serials Department, Wiley Online Library on [24/02/2025]. See the Terms and Conditions (https://onlinelibrary.wiley.com/terms-and-conditions) on Wiley Online Library for rules of use; OA articles are governed by the applicable Creative Commons License

all ethnic communities, family members are more likely to be blood
donors. White people are also more likely to have friends as donors than
Black people, work colleagues who donate compared with people of
mixed ethnicity and neighbours who donate compared to Asian people.
Table 1showsthatavoidancewasalsohigher if people (i) were less
aware of the need for blood from ethnic minorities (supporting H4c)and
(ii) knew a family member who has donated blood (not supporting H4a).
Avoidance was lower if people believed the question was included to
FIGURE 2 Levels of perceived racial discrimination within the NHS (Panel A) and social inclusion (Panel B). Panel (A) reports levels
of perceived racial discrimination in the NHS on a standardized 0–1 scale where 1 is 100% complete discrimination and 0 is little to
none. Panel (B) reports on perceived social inclusion on a standardized 0–1 scale where 1 is 100% inclusion 0 is little to none
(exclusion). For Panel (A), the non-overlapping 95% confidence interval (CI) indicates that all ethnic groups are significantly different
from each other in terms of perceived racial discrimination in the NHS (except Asian and Mixed group). For Panel (B), the pattern of
the 95% CI indicates that people from Black and Mixed ethnicities are not significantly different from each other, nor are Asian and
White people, but both Asian and White people are significantly different from Black and also White people are significantly different
from people with Mixed ethnicity. Differences in Panel (A) and (B) are reported using Bonferroni post hoc tests.
FIGURE 3 Parallel mediation models for ethnicity on avoidance and negative feedback via perceived ethnicity: White =comparison; sex
(0 =female, 1 =male), current donor (0 =non-donors, 1 =current donor). HRP-SSA, higher risk partner from sub-Saharan Africa question;
N
WoM, negative word-of-mouth.
1252 FERGUSON ET AL.
14230410, 2024, 12, Downloaded from https://onlinelibrary.wiley.com/doi/10.1111/vox.13748 by Cornell University E-Resources & Serials Department, Wiley Online Library on [24/02/2025]. See the Terms and Conditions (https://onlinelibrary.wiley.com/terms-and-conditions) on Wiley Online Library for rules of use; OA articles are governed by the applicable Creative Commons License

ensure safety (supporting H4b).
N
WoM was higher if people (i) knew a
family member who had donated blood (not supporting H4a)andlowerif
they believed the question was included to ensure safety of blood (sup-
porting H4b). For the Travel question (Table 2) both avoidance and
N
WOM were lower when people believed the question was included to
ensure blood safety (supporting H4b), and
N
WOM was higher if people
knew a family member who had donated blood (not suppressing H4a).
There were no moderating effects of knowing a family member
who donates (see Supplementary files S8–S10 for details). However,
there is a significant interaction between ethnicity and donor status
on
N
WoM, such that Black and Mixed current donors are less likely to
tell others not to donate than Black and Mixed non-donors (see Sup-
plementary File S8; Figure S1).
STUDY 2: EPIDEMIOLOGY OF HRP-SSA ON
HIV RATES AND TRAVEL QUESTIONS
ON DEFERRAL
Methods
All UK donations are tested for markers of HIV and other blood-borne
viruses. Based on this routine surveillance for the four UK blood services,
data for each donor with confirmed HIV identified through donation
screening in the United Kingdom from 1996 to 2019 were extracted from
the joint NHSBT/UK Health Security Agency (UKHSA) Epidemiology Unit
database [29]. Data fields included the confirmatory testing results, index
donation date, most recent previous donation, gender, age, ethnicity,
country of birth, probable exposure route and compliance. Data on
partners giving samples to NHSBT and deferral data from donation ses-
sions were provided on a one-off basis by each blood service where avail-
able from their donor management system. Annual data on malaria
deferrals advised by the National Call Centre between 2015 and 2019
were provided by ethnic background and compared with annual data on
donors making whole blood donations, calculating the deferrals as a per-
centage of donations made by each ethnic background (as in [29]).
Results
The detailed results are in Table 3. The proportion of UK
donors with HIV attributed to HRP-SSA has decreased
over time, with HRP-SSA being assigned as the possible expo-
sure in 24% of donors with HIV between 1996 and 2019 and
10% (5/49) of donors with HIV between 2015 and 2019. Look-
ing at recent HIV acquired within 12 months, 14% (19/132)
reported HRP-SSA for 1996–2019 and 8% (1/12) for 2015–
2019. Of these 19 donors with recent HIV, 6 reported a regular
partner who may have had sex in Africa as their only risk. Of
the 132 donors with recent HIV, 6 were detected in the win-
dow period i.e. HIV antibody negative, RNA positive, indicating
that HIV was acquired extremely recently. Three of these
FIGURE 4 Percentage of family, friends, work colleagues and neighbours who are blood donors by ethnicity.
NEGATIVE WORD-OF-MOUTH, AVOIDANCE AND RECRUITING ETHNIC MINORITY DONORS 1253
14230410, 2024, 12, Downloaded from https://onlinelibrary.wiley.com/doi/10.1111/vox.13748 by Cornell University E-Resources & Serials Department, Wiley Online Library on [24/02/2025]. See the Terms and Conditions (https://onlinelibrary.wiley.com/terms-and-conditions) on Wiley Online Library for rules of use; OA articles are governed by the applicable Creative Commons License

reported HRP-SSA, including one with another possible expo-
sure, the most recent in 2008. (Supplementary File S11 for
additional data). The number of partners of potential donors
who gave samples, allowing their partner to donate, was small,
60 in England in 2020, but none were found to be living
with HIV. Other countries within the UK deferred without
an option for partner testing. There were around 50 and
16 deferrals on session annuallyinScotlandandWales,
respectively.
Hypothesis 5. People from ethnic minorities were
more likely to be deferred after travel.
From 2015 to 2019, the average percentage of Asian-Indian
people who were advised not to donate out of those making a
donation was 8.2% (range =6.3%–14.9%), Asian-Pakistani 9.3%
(range =6.8%–12.3%), Black-African 8.0% (range =5.2%–9.9%)
and White 1.7% (range =1.5%–2.0%). These are similar to the fig-
ures recorded in 2015 when the malaria deferral was six
months [25].
DISCUSSION
Theresultsareclear:thosefromethnicminoritiesaremorelikelytobe
put off donating and discourage others after reading the HRP-SSA and
travel questions used in the United Kingdom in 2019. These effects were
mediated through perceived racial discrimination within the NHS. Thus,
there are clear negative behavioural effects associated with these 2019
questions. The epidemiology data showed that the HRP-SSA question
was linked to a small proportion of HIV+donations and was part of a
downward trend. Thus, the combined behavioural and epidemiology data
indicated that the removal of the HRP-SSA question was justified and
safe, and indeed based, in part, on these data, this question was removed
from Scotland, Wales, Northern Ireland and England in 2021 as part
of the FAIR project (https://www.blood.co.uk/news-and-campaigns/
news-and-statements/fair-steering-group/).
The spread of avoidance and
N
WoM
The impact of avoidance and
N
WoM in the community can spread
quickly. Avoidance can result in the lone-wolf effect, whereby observ-
ing others choosing not to act sends a social signal that not donating
is preferred [30].
N
WoM also spreads quickly through communities [8].
Thus, the summative effect of the lone-wolf effect and
N
WoM, rein-
forced by perceived racial discrimination within the NHS, creates a
complex social milieu for recruitment.
We initially hypothesized that knowing a family member who
donates would mitigate these negative effects. However, we observe
the opposite: knowing family members directly enhances the negative
impact. There are several possibilities for this. First, people may feel
these questions are unjustified and, as such, are upset on behalf of
their families. Second, as they already know others who donate, they
may feel less need to donate or encourage others. Third, they may
know a family member who has been deferred.
TABLE 3 HIV in blood donors, all and recent infection, UK
2015–2019.
HIV all
HIV
recent
% which
are recent
% of recent
infections
Total 49 12 24.5
NAT pick up - 1
Seroconversion - 10
Gender
Male 31 11 35.5 91.7
Female 18 1 5.6 8.3
Donor type
New 24 2 8.3 16.7
Repeat 25 10 40.0 83.3
Age 0.0
Age-range 18–71 28–60
Median age 37 42.5
Ethnicity
Asian 5 1 20.0 8.3
Black 2 0 0.0 0.0
Not known 1 0 0.0 0.0
Other 2 0 0.0 0.0
White 39 11 28.2 91.7
Born
United Kingdom 31 4 12.9 33.3
Europe 6 2 33.3 16.7
Asia 2 1 50.0 8.3
Africa 1 0 0.0 0.0
Other 2 0 0.0 0.0
Not known 7 5 71.4 41.7
Acquired infection
United Kingdom 29 8 27.6 66.7
Europe 5 2 40.0 16.7
Asia 3 1 33.3 8.3
Africa 1 0 0.0 0.0
Other 0 0 -
Not known 9 1 11.1 8.3
Risk group
GBM 13 6 46.2 50.0
Heterosexual sex 23 3 13.6 25.0
HRP-SSA 5 1 20.0 8.3
HRP-other 3 1 20.0 8.3
Other 1 0 0.0
Not known 4 1 25.0 8.3
Abbreviations: HIV, human immunodeficiency virus; HRP-SSA, higher risk
partner from sub-Saharan Africa; GBM, gay and bisexual men; NAT,
nucleic acid test.
1254 FERGUSON ET AL.
14230410, 2024, 12, Downloaded from https://onlinelibrary.wiley.com/doi/10.1111/vox.13748 by Cornell University E-Resources & Serials Department, Wiley Online Library on [24/02/2025]. See the Terms and Conditions (https://onlinelibrary.wiley.com/terms-and-conditions) on Wiley Online Library for rules of use; OA articles are governed by the applicable Creative Commons License

Practical and clinical implications
In terms of the Travel question, malaria antibody testing was intro-
duced consistently in England from 2001 as a way of reducing the
deferral burden on Black and Asian donors. This deferral and testing
strategy has been reviewed and reduced to the shortest deferral time
that is thought safely possible under the current antibody testing
strategy at 4 months post-travel [31]. In terms of people calling to
check eligibility on the grounds of travel before donation, the NHSBT
National Call Centre data showed that between 2015 and 2019, Asian
and Black donors were more likely to be advised not to donate due to
travel than White donors, with figures consistent with a previous
observation made under 6-month deferral [25].
Providing a rationale for the pre-donation questions can reduce
their negative impact. Thus, blood services must provide clear infor-
mation about why these questions are needed and that they only
remain if the evidence supports them. Each UK blood service explains
on its website that the questions are to keep recipients and donors
safe. Further work is underway to simplify the travel questions and
study ways to prompt donors to disclose relevant history. Services
may encourage
P
WoM as a potential to counter-act
N
WoM; how-
ever, people acting altruistically are reluctant to use
P
WoM pub-
licly [16],anditmaynotbeeffectiveanyway(see[12]). An optimal
strategy, however, may be to intervene earlier downstream to cre-
ate a positive experience for all donors, not just in terms of the
social ambience of the centres and staff but more structurally in
terms of how and when deferral questions are asked, what is asked
and the ethnicity of staff.
Finally, perceived racial discrimination within the NHS was an
important mechanism supporting
N
WoM in ethnic minorities. It is
beyond the capacity of blood services to address this wider socio-
political issue. However, this discrimination should be recognized and
publicly acknowledged in terms of openness and transparency.
Caveats
As these findings are UK-specific, generalizability should not be assumed.
Blood services with similar questions should evaluate them for similar
negative impacts, considering the appropriate local HIV epidemiology and
the behavioural impact. We did not assess donor knowledge and atti-
tudes, and further work should explore how these influence
P
WoM as a
function of ethnicity and other demographics. Finally, it should also be
noted that the number of non-donors is small.
ACKNOWLEDGEMENTS
E.F., S.R.B., K.D. and C.R. designed Study 1; E.F., S.R.B., K.D., C.R.,
D.E. and Z.K. designed and conducted Study 2; K.D. and C.R. analysed
data for study 1. E.F. and E.D.L. analysed the data for study 1.
E.F. drafted the first version with E.D.L., D.E., K.D., C.R., N.O.H., R.M.,
R.S., Z.K., R.D., S.R.B., N.E. and M.C., providing detailed feedback and
revisions to the paper. All authors reviewed the manuscript
and approved the final version.
This work was funded by NHSBT Trust Fund (TF082) grant.
E.F. acknowledges financial support from the NIHR Blood and Trans-
plant Research Unit in Donor Health and Behaviour (NIHR203337),
who also fund R.M. and R.S. N.O.H. and R.D. are funded by grants
from NHSBT. The views expressed here are solely those of the
authors and do not reflect the funding organization or any of the orga-
nizations and groups involved in this research.
CONFLICT OF INTEREST STATEMENT
The authors declare no conflicts of interest.
DATA AVAILABILITY STATEMENT
Data reported in this paper are available from the first author on
request.
ORCID
Eamonn Ferguson https://orcid.org/0000-0002-7678-1451
Richard Mills https://orcid.org/0000-0002-1161-5815
Erin Dawe-Lane https://orcid.org/0000-0002-8479-6696
Claire Reynolds https://orcid.org/0000-0003-3452-0832
Katy Davison https://orcid.org/0000-0002-6337-892X
Dawn Edge https://orcid.org/0000-0003-1139-6613
Robert Smith https://orcid.org/0009-0008-9888-4110
Niall O’Hagan https://orcid.org/0009-0007-9796-3215
Roshan Desai https://orcid.org/0009-0005-8870-4989
Susan R. Brailsford https://orcid.org/0000-0003-2856-0387
REFERENCES
1. Shaz BH, Zimring JC, Demmons DG, Hillyer CD. Blood donation and
blood transfusion: special considerations for African Americans.
Transfus Med Rev. 2008;22:202–14.
2. Mwamba N, Puplampu KP. Blood, it’s in you to give, just don’tbean
African: the Canadian blood system and the African Indefinite Defer-
ral Policy, 1997 to 2018. Identities. 2023;31:1–19.
3. Halperin D, Baetens J, Newman B. The effect of short-term, tempo-
rary deferral on future blood donation. Transfusion. 1998;38:181–3.
4. Ribeiro DA, Kalro AD. Four decades of negative word-of-mouth and
negative electronic word-of-mouth: a morphological analysis. Int J
Consum Stud. 2023;47:2528–52.
5. Rosario AB, Sotgiu F, De Valck K, Bijmolt THA. The effect of elec-
tronic word of mouth sales: a meta-analytic review of platform, prod-
uct, and metric factors. J Market Res. 2016;53:297–318.
6. Martin S, Greiling D, Leibetseder N. Effects of word-of-mouth on
the behavior of Austrian blood donors: a case study of the red
cross blood donation service. Health Promot Int. 2019;34:
429–39.
7. Ito TA, Larsen JT, Smith NK, Cacioppo JT. Negative information
weighs more heavily on the brain: the negativity bias in evaluative
categorisations. J Pers Soc Psychol. 1998;75:887–900.
8. Johnson NF, Velásquez N, Restrepo NJ, Leahy R, Gabriel N, El
Oud S, et al. The online competition between pro- and anti-
vaccination views. Nature. 2020;582:230–3.
9. Fay N, Walker B, Kashima Y, Perfors A. Socially situated transmis-
sion: the bias to transmit negative information is moderated by the
social context. Cognit Sci. 2021;45:e13033.
10. Arruda Filho EJM, Barcelos ADA. Negative online word-of-mouth:
Consumers’retaliation in the digital world. J Glob Mark. 2020;2020:
19–37.
NEGATIVE WORD-OF-MOUTH, AVOIDANCE AND RECRUITING ETHNIC MINORITY DONORS 1255
14230410, 2024, 12, Downloaded from https://onlinelibrary.wiley.com/doi/10.1111/vox.13748 by Cornell University E-Resources & Serials Department, Wiley Online Library on [24/02/2025]. See the Terms and Conditions (https://onlinelibrary.wiley.com/terms-and-conditions) on Wiley Online Library for rules of use; OA articles are governed by the applicable Creative Commons License

11. Feng Y, Du L, Ling Q. How social media strategies of nonprofit orga-
nizations affect consumer donation intention and word-of-mouth.
Soc Behav Pers. 2017;45:1775–86.
12. Schröder JM, Merz EM, Suanet B, Wiepking P. Did you donate? Talk-
ing about donations predicts compliance with solicitations for dona-
tions. PLoS One. 2023;18:e0281214.
13. Peedin AR, Park YA, Mazepa MA, Siniard RC, Neish T, Raval JS. The
impact of an undergraduate biology class on donor recruitment at a
hospital-based blood donor center. Am J Clin Pathol. 2020;153:
368–73.
14. Sundermann LM. Share experiences: receiving word of mouth
and its effect on relationships with donors. J Serv Mark. 2018;32:
322–33.
15. Rahay I, Hermawan H, Ekasari A. Electronic effects of word of mouth
and perceived value on blood donor intention: theory of planned
behavior. Int J Humanit Educ Soc Sci. 2023;3:3.
16. Previte J, Russell-Bennett R, Mulcahy R, Hartel C. The role of emo-
tional value for reading and giving eWoM in altruistic services. J Bus
Res. 2019;99:157–66.
17. Ramondt S, Kerkhof P, Merz EM. Blood donation narratives on
social media: A topic modeling study. Transfus Med Rev. 2022;
36:58–65.
18. Ferguson E, Dawe-Lane E, Khan Z, Reynolds C, Davison K,
Edge D, et al. Trust and distrust: Identifying recruitment targets
for ethnic minority blood donors. Transfus Med. 2022;32:
276–87.
19. Hamed S, Bradby H, Ahlberg BM, Thapar-Björkert S. Racism in
healthcare: a scoping review. BMC Public Health. 2022;22:988.
20. Klinkenberg EF, Huis In ’t Veld EMJ, de Wit PD, de Kort WLAM,
Fransen MP. Barriers and motivators of Ghanaian and
African-Surinamese migrants to donate blood. Health Soc Care Com-
munity. 2019;27:748–56.
21. Polonsky MJ, Brijnath B, Renzaho AM. "They don’t want our blood":
social inclusion and blood donation among African migrants in
Australia. Soc Sci Med. 2011;73:336–42.
22. Scheidmeir M, Kubiak T, Luszczynsk A, Wendt J, Scheller DA,
Meshkovska B, et al. Acceptability of policies targeting dietary
behaviours and physical activity: a systematic review of tools and
outcomes. Euro J Pub Health. 2022;32:iv32–49.
23. Beerli-Palacio A, Martín-Santana JD. Model explaining the predispo-
sition to donate blood from the social marketing perspective. Int J
Nonprofit Volunt Sect Mark. 2009;14:205–14.
24. Ferguson E, Hill A, Lam M, Reynolds C, Davison K, Lawrence C, et al.
Typology of blood donor motivations. Transfusion. 2020;60:
2010–20.
25. Reynolds C, Cieply L, Sell J, Brailsford SR. Who do we gain? Enhance-
ment of blood supplies by additional testing for donors who travel.
Transfus Med. 2019;29:325–31.
26. LaVeist TA, Nickerson KJ, Bowie JV. Attitudes about racism, medical
mistrust, and satisfaction with care among African American and
white cardiac patients. Med Care Res Rev. 2000;57:146–61.
27. Huxley P, Evans S, Madge S, Webber M, Burchardt T, McDaid D,
et al. Development of a social inclusion index to capture subjective
and objective life domains (phase II): psychometric development
study. Health Technol Assess. 2012;16:iii–241.
28. U.K. Department for Communities and Local Government. Citizenship
survey (2010–2011). Neighbourhood and community life survey
(2020–21). Available from: https://www.gov.uk/government/statistics/
community-life-survey-202021-neighbourhood-and-community/
neighbourhood-and-community-community-life-survey-202021#:~:
text=Respondents%20were%20asked%20how%20strongly,2019%
2F20%20(63%25). Last accessed 8 Apr 2024.
29. Reynolds C, Davison KL, Brailsford SR. Safe supplies: few infections
in UK blood and tissue donors. Transfus Med. 2019;29:239–46.
30. Ferguson E, Shichma R, Tan JH. Lone wolf defectors undermine the
power of the opt-out default. Sci Res. 2020;10:8973.
31. Kitchen AD, Lowe PH, Lalloo K, Chiodini PL. Evaluation of a malarial
antibody assay for use in the screening of blood and tissue products
for clinical use. Vox Sang. 2004;87:150–5.
SUPPORTING INFORMATION
Additional supporting information can be found online in the Support-
ing Information section at the end of this article.
How to cite this article: Ferguson E, Mills R, Dawe-Lane E,
Khan Z, Reynolds C, Davison K, et al. Questions on travel and
sexual behaviours negatively impact ethnic minority donor
recruitment: Effect of negative word-of-mouth and avoidance.
Vox Sang. 2024;119:1245–56.
1256 FERGUSON ET AL.
14230410, 2024, 12, Downloaded from https://onlinelibrary.wiley.com/doi/10.1111/vox.13748 by Cornell University E-Resources & Serials Department, Wiley Online Library on [24/02/2025]. See the Terms and Conditions (https://onlinelibrary.wiley.com/terms-and-conditions) on Wiley Online Library for rules of use; OA articles are governed by the applicable Creative Commons License

ORIGINAL ARTICLE
Extending the post-thaw shelf-life of cryoprecipitate when
stored at refrigerated temperatures
Kelly M. Winter
1
| Rachel G. Webb
1
| Eugenia Mazur
1
|
Peta M. Dennington
2
| Denese C. Marks
1,3
1
Research and Development, Australian Red Cross Lifeblood, Alexandria, New South Wales, Australia
2
Pathology Services, Australian Red Cross Lifeblood, Alexandria, New South Wales, Australia
3
Sydney Medical School, The University of Sydney, Camperdown, New South Wales, Australia
Correspondence
Kelly M. Winter, Australian Red Cross
Lifeblood, 17 O’Riordan St, Alexandria, NSW
2015, Australia.
Email: kwinter@redcrossblood.org.au
Funding information
Australian Government
Abstract
Background and Objectives: The post-thaw shelf-life of cryoprecipitate is 6 h, lead-
ing to high wastage. Storage of thawed cryoprecipitate at refrigerated temperatures
may be feasible to extend the shelf-life. This study aimed to evaluate the quality of
thawed cryoprecipitate stored at 1–6C for up to 14 days.
Materials and Methods: Cryoprecipitate (mini- and full-size packs derived from both
apheresis and whole blood [WB] collections) was thawed, immediately sampled and
then stored at 1–6C for up to 14 days. Mini-packs were sampled at 6, 24, 48 and
72 h, day 7 and 14; full-size cryoprecipitate was sampled on day 3, 5 or 7. Coagula-
tion factors (F) II, V, VIII, IX, X and XIII, von Willebrand factor (VWF) and fibrinogen
were measured using a coagulation analyser. Thrombin generation was measured by
calibrated automated thrombogram.
Results: FVIII decreased during post-thaw storage; this was significant after 24 h for
WB (p=0.0002) and apheresis (p< 0.0001). All apheresis and eight of 20 WB cryo-
precipitate met the FVIII specification (≥70 IU/unit) on day 14 post-thaw. Fibrinogen
remained stable for 48 h, and components met the specification on day 14 post-
thaw. There were no significant differences in VWF (WB p=0.1292; apheresis
p=0.1507) throughout storage. There were small but significant decreases in throm-
bin generation lag time, endogenous thrombin potential and time to peak for both
WB and apheresis cryoprecipitate.
Conclusion: Whilst coagulation factors in cryoprecipitate decreased after post-thaw
storage, the thawed cryoprecipitate met the Council of Europe specifications when
stored at refrigerated temperatures for 7 days.
Keywords
coagulation factors, cryoprecipitate, fibrinogen, re-precipitation, von Willebrand factor
Received: 1 May 2024 Revised: 23 July 2024 Accepted: 29 August 2024
DOI: 10.1111/vox.13736
This is an open access article under the terms of the Creative Commons Attribution-NonCommercial License, which permits use, distribution and reproduction in any
medium, provided the original work is properly cited and is not used for commercial purposes.
© 2024 Australian Red Cross Lifeblood. Vox Sanguinis published by John Wiley & Sons Ltd on behalf of International Society of Blood Transfusion.
Vox Sanguinis. 2024;119:1257–1267. wileyonlinelibrary.com/journal/vox 1257

Highlights
•Cryoprecipitate stored at 1–6C for 7 days meets quality specifications for coagulation factor
(F) VIII (≥70 IU/unit), von Willebrand factor (>100 IU/unit) and fibrinogen (≥140 mg/unit).
•Fibrinogen concentrations remained stable for the first 48 h during post-thaw storage, with a
gradual decrease over 14 days of storage (41% for apheresis- and 26% for WB-derived
cryoprecipitate).
•The data from this study support extending the post-thaw shelf-life of cryoprecipitate from
6 to 72 h when stored at 1–6C.
INTRODUCTION
Cryoprecipitate is a blood component produced from WB- and
apheresis-derived fresh-frozen plasma (FFP). It contains high concentra-
tions of fibrinogen, von Willebrand factor (VWF), factor (F) XIII, fibro-
nectin and FVIII [1]. Due to natural variation between donors, there is a
broad range of coagulation factor concentrations in cryoprecipitate [2].
Cryoprecipitate is primarily used for fibrinogen replacement in patients
with acquired fibrinogen deficiency, such as in severe trauma [3]. In
particular, there is high demand for group AB cryoprecipitate as this
component is used early in massive transfusion protocols [4]. More
recently, cryoprecipitate transfusion has been replaced with fibrinogen
concentrate. However, this is not available in all parts of Australia, and
some hospitals prefer to use cryoprecipitate due to lower cost or
because of a lack of data to support fibrinogen concentrate superior-
ity [5]. Therefore, demand for cryoprecipitate is still high.
Cryoprecipitate is produced by slowly thawing FFP at 1–6C
overnight, then collecting and refreezing the insoluble precipitate as
cryoprecipitate. It can be stored frozen (<25C) for up to 3 years [6].
However, in Australia, the frozen shelf-life is 12 months. Cryoprecipi-
tate can be derived from either whole blood (WB) or apheresis FFP. A
recommended adult dose of cryoprecipitate is 10 WB- or
4apheresis-derived cryoprecipitate units [4], and, therefore, pools
of cryoprecipitate are more commonly used. However, pooled cryo-
precipitate is not available in Australia. Upon thawing, cryoprecipitate
is stored at ambient temperature (20–24C) for up to 6 h [7], or 4 h in
the case of pooled cryoprecipitate product [8]. The short shelf-life of
thawed cryoprecipitate leads to high wastage of this component [9].
Australian Red Cross Lifeblood reported that approximately 8% of all
units issued between December 2022 and November 2023 were dis-
carded [10]. Cryoprecipitate wastage in other countries varies with
reported rates ranging from 3% to 33% [8, 9, 11], depending on the
type of hospital (e.g., trauma centre, teaching facility, private) and
location (e.g., regional versus city). An audit into cryoprecipitate wast-
age at five hospitals in South Australia found avoidable causes of
cryoprecipitate wastage accounted for 92.2% of total wastage, with
the main reasons being that units were thawed but not used (69.1%)
or post-thaw time had expired (13.2%) [12].
The limited post-thaw shelf-life of cryoprecipitate is due to con-
cerns regarding coagulation factor degradation, particularly FVIII levels
declining rapidly upon thawing [13, 14], and the risk of bacterial prolif-
eration. There have been a number of studies investigating the effect
of extension of cryoprecipitate storage on factor stability, including
one from our laboratory that found the quality of thawed cryoprecipi-
tate was maintained out to 5 days when stored at ambient tempera-
ture [15]. Others have also demonstrated that thawed pooled
cryoprecipitate remains stable up to 72 h when maintained at ambient
temperature [16]. Although it has also been reported that room tem-
perature (RT) storage results in less factor degradation than cold stor-
age [13, 14, 17, 18], the risk of bacterial proliferation with RT storage
is of concern.
Cold (1–6C) storage of thawed cryoprecipitate is a promising
alternative to RT storage, as it would minimize the rate of any poten-
tial bacterial proliferation [19–21]. Studies have shown that despite
significant decreases in FVIII and fibrinogen concentrations, these
were still within an acceptable range for up to 5 days [13, 20]. Others
have investigated cold storage of cryoprecipitate for up to 35 days,
after which adequate factor levels and sterility were maintained [21].
However, cryoprecipitate was stored in tubes rather than blood stor-
age bags in this study, which does not replicate typical storage condi-
tions and therefore the findings are not directly applicable to hospital
settings.
Association for the Advancement of Blood & Biotherapies (AABB)
standards, Council of Europe (CoE) and Australian and New Zealand
Society of Blood Transfusion (ANZSBT) guidelines currently allow the
use of thawed FFP that has been stored for up to 5 days at 1–6C,
which carries the same risk profile for bacterial contamination as cold
storage of thawed cryoprecipitate [6, 22, 23].
Extending the post-thaw shelf-life of thawed cryoprecipitate
would reduce in-hospital product wastage, thus reducing the number
of cryoprecipitate components required to meet demand. To change
current recommendations and practice, it must be demonstrated that
the components meet quality standards and that coagulation factor
integrity can be maintained. Therefore, the purpose of this study was
to evaluate the post-thaw quality of cryoprecipitate stored at 1–6C
for 14 days by assessing levels of fibrinogen, coagulation factors (FII,
FV, FVIII, FIX, FX and FXIII), VWF, complement components and
potential for thrombin generation, thus demonstrating efficacy.
MATERIALS AND METHODS
This study was approved by the Australian Red Cross Lifeblood
Human Research Ethics Committee (2015#19-LNR).
1258 WINTER ET AL.
14230410, 2024, 12, Downloaded from https://onlinelibrary.wiley.com/doi/10.1111/vox.13736 by Cornell University E-Resources & Serials Department, Wiley Online Library on [24/02/2025]. See the Terms and Conditions (https://onlinelibrary.wiley.com/terms-and-conditions) on Wiley Online Library for rules of use; OA articles are governed by the applicable Creative Commons License

Mini-packs
Sixty WB- and 40 apheresis-derived cryoprecipitate components
were obtained from the frozen inventory in our processing centre,
with an equal mixture of group O and non-group O components.
Cryoprecipitate was thawed in a 37C water bath, then visually
inspected for turbidity, clots, fibrin strands, red cell contamination or
any other discolouration; if present, cryoprecipitate was excluded
from the study. Thawed cryoprecipitate was pooled and split as per
Figure 1to create mini-packs (150 mL paediatric transfer bag, Ter-
umo, Tokyo, Japan), each containing approximately 9 mL of cryopreci-
pitate. Immediately after pooling and splitting, a mini-pack of
cryoprecipitate was sampled (baseline), aliquoted (1 mL) in Eppen-
dorf tubes and frozen at 80C until subsequent testing was per-
formed. The remaining bags were refrigerated at 1–6C for up to
14 days. At each time point, 6, 24, 48, 72 h, day 7 and day 14 post-
thaw, a mini-pack was removed from 1 to 6C storage and warmed in
a37
C water bath for 5 min to solubilize any precipitate, then further
aliquoted (1 mL) in Eppendorf tubes and frozen at 80C until sub-
sequent testing was performed.
Full-size packs
Twelve WB- and 12 apheresis-derived cryoprecipitate components
were obtained from inventory (all blood group A). The
components were randomly allocated to one of three groups: day 3, 5
or 7 (n=4 per group). Cryoprecipitate was thawed in a 37C water
bath, each component was sampled immediately upon thawing (base-
line), then stored at 1–6C. On the allocated day, the cryoprecipitate
was visually inspected for precipitate and placed in a 37C water bath
for 5 min to re-dissolve the precipitate. The cryoprecipitate was
FIGURE 1 Diagrammatic representation of the pool, split and sampling design of the study. APH, apheresis; WB, whole blood.
EXTENDING POST-THAW SHELF-LIFE OF CRYOPRECIPITATE 1259
14230410, 2024, 12, Downloaded from https://onlinelibrary.wiley.com/doi/10.1111/vox.13736 by Cornell University E-Resources & Serials Department, Wiley Online Library on [24/02/2025]. See the Terms and Conditions (https://onlinelibrary.wiley.com/terms-and-conditions) on Wiley Online Library for rules of use; OA articles are governed by the applicable Creative Commons License

sampled, and the aliquots (1 mL) in Eppendorf tubes were frozen at
80C for subsequent coagulation testing. Full-size packs were tested
for fibrinogen, FV, FVIII and VWF activity only.
Filtering
Four units each of WB- and apheresis-derived full-size cryoprecipitate
components were further filtered on day 3, 5 and 7 using an Infuso-
mat Space Line filter (Braun; Melsungen, Germany), to mimic intrave-
nous administration, and remove any re-precipitated material that
could not be re-dissolved. In a clinical setting, this filtration would be
performed prior to transfusion, and it was therefore necessary to
determine whether the cryoprecipitate components retained mini-
mum required coagulation properties for transfusion after thawing,
storage and filtration. Unfiltered and filtered cryoprecipitate samples
were tested for fibrinogen, FV, FVIII and VWF activity only.
Testing
Coagulation factors (FII, FV, FVIII, FIX, FX and FXIII), fibrinogen and
VWF antigen levels were measured using an automated coagulation
analyser (STA Compact; Diagnostica Stago Ltd, Asnieres, France).
These factors were tested using one stage clotting assays or two-
point immune-turbidimetric assay for FXIII and VWF, with STA and
Kamiya Biomedical reagents according to the manufacturer’s instruc-
tions and standardized using reference plasma.
Complement components, C3a and C5a, were measured using a
solid-phase sandwich enzyme-linked immunosorbent assay
(BD Biosciences; San Jose, CA, USA) according to the manufacturer’s
instructions.
Thrombin generation was measured using a calibrated automated
thrombogram (Thrombinoscope BV, Maastricht, The Netherlands) and
the PPP reagent (Thrombinoscope). The lag time, endogenous throm-
bin potential (ETP), peak height and time to peak (TTP) were calcu-
lated by the thrombogram software.
Bacterial contamination screening
Additional mini-packs were created for terminal bacterial burden sam-
pling after day 14 of sampling. These were pooled and tested using an
automated bacterial contamination screening system (Bac T/Alert Vir-
tuo; BioMérieux, Durham, NC, USA) with both aerobic and anaerobic
bottles, as per manufacturer’s instructions.
Statistical analysis
Data are presented as the mean ± standard deviation (SD). A one-way
repeated measure analysis of variance was used to compare data from
within the two groups (apheresis or WB-derived cryoprecipitate) using
Prism 9.4.1 (GraphPad Software, Inc., La Jolla, CA, USA), with post
hoc Bonferroni tests used to determine differences within the groups
at each time point. A paired t-test was used to determine differences
in full-size cryoprecipitate components between baseline and selected
time points using Excel (Microsoft 365, Redmond, WA, USA). A paired
t-test was also used to determine differences between filtered and
unfiltered cryoprecipitate. A p-value <0.05 was considered significant
using Excel.
RESULTS
Mini-packs
The mean volumes immediately after thawing were 37 ± 2 mL and
60 ± 2 mL for WB- and apheresis-derived cryoprecipitate, respec-
tively. Following pooling and splitting into the mini-packs, the mean
volume was 8.4 ± 1.9 and 9.7 ± 1.7 mL for WB- and apheresis-derived
cryoprecipitate, respectively. The mean volume of the original parent
packs, rather than the volume of the mini-packs, was used to calculate
the concentration per unit to determine if the components met
specifications.
FVIII concentrations decreased in both WB- and apheresis-
derived cryoprecipitate during post-thaw storage at 1–6C and were
significantly lower than baseline after only 24 h, as shown in
Figure 2a,b. Fibrinogen concentrations remained stable for the first
48 h during post-thaw storage, after which there was a gradual
decrease over 14 days of storage (Figure 2c,d). Figure 2e,f demon-
strates there was little difference in VWF concentrations of thawed
cryoprecipitate during 14-day storage at 1–6C. Importantly, all
apheresis-derived cryoprecipitate components met the CoE specifica-
tions at all time points [6], and the WB-derived cryoprecipitate met
these specifications up to day 7 post-thaw (≥70 IU/unit for FVIII,
≥140 mg/unit for fibrinogen and >100 IU/unit for VWF) [6].
There were small but significant decreases in FII concentrations
and significant decreases in FV concentrations in both WB- and
apheresis-derived post-thaw cryoprecipitate (Figure 3a–d). There was
little difference in FX and FXIII concentrations in WB-derived cryo-
precipitate during storage, whilst there were significant increases in
FX and decreases in FXIII concentrations in apheresis-derived cryo-
precipitate (Figure 3e–h).
Complement components C3a and C5a both significantly
increased in post-thaw cryoprecipitate during storage at 1–6C
(Figure 4a–d). C3a concentrations were up to ninefold higher in WB-
and fivefold higher in apheresis-derived cryoprecipitate by day 14 of
storage.
There were no significant differences in thrombin peak height
over storage in WB- and apheresis-derived cryoprecipitate
(Figure 5a,b). However, there was a small but significant decrease in
lag time, ETP and TTP, with a more pronounced decline in lag time
and TTP in apheresis-derived cryoprecipitate (Figure 5c–h).
Bacterial growth was not detected in any of the pooled
aliquots.
1260 WINTER ET AL.
14230410, 2024, 12, Downloaded from https://onlinelibrary.wiley.com/doi/10.1111/vox.13736 by Cornell University E-Resources & Serials Department, Wiley Online Library on [24/02/2025]. See the Terms and Conditions (https://onlinelibrary.wiley.com/terms-and-conditions) on Wiley Online Library for rules of use; OA articles are governed by the applicable Creative Commons License

Full-size packs
There was a large variation in coagulation factor results for full-size
WB- and apheresis-derived cryoprecipitate, due to the small sample
size in each group (n=4; Table 1). There were small, and in some
cases significant, decreases in concentrations of fibrinogen, FV and
FVIII in the post-thaw cryoprecipitate after 3, 5 or 7 days. VWF
remained stable during the post-thaw storage.
Filtration of precipitated cryoprecipitate did not significantly alter
the fibrinogen, FV, FVIII and VWF concentrations in WB- and
FIGURE 2 Factor (FVIII), fibrinogen and von Willebrand factor (VWF) concentrations in apheresis- and whole blood-derived cryoprecipitate
following thawing and subsequent storage at 1–6C. (a) FVIII, (c) fibrinogen and (e) VWF concentrations in cryoprecipitate were measured by
coagulation analyser and calculated per unit based on mean cryoprecipitate volumes. (b) FVIII, (d) fibrinogen and (f) VWF percentage change to
baseline. Black dotted lines represent minimum specifications (FVIII ≥70 IU/unit, fibrinogen ≥140 mg/unit, VWF > 100 IU/unit). Bar graphs
represent the mean ± standard deviation (SD) (n=20, except for D2 n=16). D0 denotes 6 h post-thaw. B, baseline. *Time point significantly
differs from baseline using a one-way ANOVA.
EXTENDING POST-THAW SHELF-LIFE OF CRYOPRECIPITATE 1261
14230410, 2024, 12, Downloaded from https://onlinelibrary.wiley.com/doi/10.1111/vox.13736 by Cornell University E-Resources & Serials Department, Wiley Online Library on [24/02/2025]. See the Terms and Conditions (https://onlinelibrary.wiley.com/terms-and-conditions) on Wiley Online Library for rules of use; OA articles are governed by the applicable Creative Commons License

FIGURE 3 Factor (F) II, FV, FX and FXII concentrations in apheresis- and whole blood-derived cryoprecipitate following thawing and
subsequent storage at 1–6C. (a) FII, (c) FV, (e) FX and (g) FXIII concentrations in cryoprecipitate were measured by coagulation analyser and
calculated per unit based on mean cryoprecipitate volumes. (b) FII, (d) FV, (f) FX and (h) FXIII percentage change to baseline. Data points
represent the mean ± standard deviation (SD) (n=20, except for D2 n=16). D0 denotes 6 h post-thaw. B, baseline. *Time point significantly
differs from baseline using a one-way ANOVA.
1262 WINTER ET AL.
14230410, 2024, 12, Downloaded from https://onlinelibrary.wiley.com/doi/10.1111/vox.13736 by Cornell University E-Resources & Serials Department, Wiley Online Library on [24/02/2025]. See the Terms and Conditions (https://onlinelibrary.wiley.com/terms-and-conditions) on Wiley Online Library for rules of use; OA articles are governed by the applicable Creative Commons License

apheresis-derived cryoprecipitate stored at 1–6C for 3, 5 or 7 days
post-thaw (Table 2). The exception was observed in WB-derived cryo-
precipitate on day 7, where filtration reduced the concentration of
VWF from 215 ± 33 to 199 ± 25 IU/unit (p=0.0464).
DISCUSSION
This study has determined the quality of thawed cryoprecipitate
stored at 1–6C for up to 14 days. The coagulation properties of
the cryoprecipitate gradually deteriorated over extended storage,
whilst the thrombin generation potential was maintained. VWF
concentrations were also consistent over the 14 days of storage
at 1–6C. Fibrinogen concentrations were stable for the first
2 days then decreased significantly during extended post-thaw
storage.
FVIII concentrations decreased by 15% and 21%, respectively, for
apheresis- and WB-derived cryoprecipitate between 6 h (current
expiry) and day 7 in our study. These data are consistent with a previ-
ous study, where a 14%–22% decline in FVIIIC concentrations
between 6 h and day 5 for RT and cold-stored cryoprecipitate was
observed [20]. Other studies have reported much greater decreases in
FVIII concentrations; by 17% after only 24 h [22]; however, this study
stored the cryoprecipitate at RT for 6 h before transferring to 1–6C
for up to 24 h, suggesting the additional RT storage has escalated
FVIII loss, with a 50% decrease by day 3 post-thaw [21] for both RT
and cold-stored cryoprecipitate. This is particularly evident where the
cryoprecipitate was pools of six and the sample size was small, result-
ing in large error bars.
Cryoprecipitate is most commonly transfused for the fibrinogen
content [5]. Fibrinogen concentration was maintained during
extended storage, demonstrating it is still suitable for transfusion
when fibrinogen is needed. Our results concur with other studies,
which showed that fibrinogen concentrations remain unchanged from
0 to 24 h post-thaw when stored at refrigerated tempera-
tures [20–22].
In our study, there was a 5% decrease in FXIII concentration in
apheresis-derived cryoprecipitate by day 3, with an 8% decrease by
day 7. FXIII was maintained in WB-derived cryoprecipitate until day
3 and had decreased by 4% at day 7. Thomson et al. reported a 4%
FIGURE 4 Complement components C3a and C5a concentrations in apheresis- and whole blood-derived cryoprecipitate following thawing
and subsequent storage at 1–6C. (a) C3a and (c) C5a concentrations in cryoprecipitate were measured by enzyme-linked immunosorbent assay
and calculated per unit based on mean cryoprecipitate volumes. (b) C3a and (d) C5a percentage change to baseline. Data points represent the
mean ± standard deviation (SD) (n=20, except for D2 n=16). D0 denotes 6 h post-thaw. B, baseline. *Apheresis time point significantly differs
from baseline using a one-way ANOVA.
EXTENDING POST-THAW SHELF-LIFE OF CRYOPRECIPITATE 1263
14230410, 2024, 12, Downloaded from https://onlinelibrary.wiley.com/doi/10.1111/vox.13736 by Cornell University E-Resources & Serials Department, Wiley Online Library on [24/02/2025]. See the Terms and Conditions (https://onlinelibrary.wiley.com/terms-and-conditions) on Wiley Online Library for rules of use; OA articles are governed by the applicable Creative Commons License

FIGURE 5 Thrombin generation potential of apheresis- and whole blood-derived cryoprecipitate following thawing and subsequent storage
at 1–6C. (a) Peak height (c) lag time, (e) endogenous thrombin potential (ETP) and (g) time to peak (TTP) were measure by calibrated automated
thrombogram. (b) Peak height, (d) lag time, (f) ETP and (h) TTP percentage change to baseline. Data points represent the mean ± standard
deviation (SD) (n=20, except for D2 n=16). D0 denotes 6 h post-thaw. B, baseline. *Apheresis time point significantly differs from baseline
using a one-way analysis of variance.
1264 WINTER ET AL.
14230410, 2024, 12, Downloaded from https://onlinelibrary.wiley.com/doi/10.1111/vox.13736 by Cornell University E-Resources & Serials Department, Wiley Online Library on [24/02/2025]. See the Terms and Conditions (https://onlinelibrary.wiley.com/terms-and-conditions) on Wiley Online Library for rules of use; OA articles are governed by the applicable Creative Commons License

decrease in FXIII concentration during 5 days of extended storage;
however, this was not significant [20]. The most significant decrease
in coagulation factors was observed in FV, reaching significance by
24 h in WB-derived cryoprecipitate and by 48 h post-thaw in the
apheresis-derived cryoprecipitate. This observed reduction is not
unexpected, as FV is a known labile factor and has been reported to
decline rapidly in plasma during the time to freezing and in liquid
stored plasma [24, 25].
C3a concentrations increased during storage at 1–6C; by 24 h,
it was significantly higher than baseline for WB-derived cryopreci-
pitate and similarly by 72 h for apheresis-derived cryoprecipitate.
C3a is known to be activated in liquid stored plasma, up to three-
fold by day 7 [26]and10-foldbyday35dayinstoredplasmaand
WB [27, 28]. C3a is also rapidly cleared from the circulation after
transfusion [26]. Trauma has been shown to activate the comple-
ment system, whereby the degree of activation is dependent upon
the severity of injury [29–31]. Transfusion of cryoprecipitate with a
high concentration of C3a can either have an immunosuppressive
effect or exaggerate the activation of the complement system [26].
Elevated C3a levels can lead to multiple organ failure and thus C3a
could be used as a predictor of prognosis [32]. Transfusion of autol-
ogous stored plasma (14 days) that had a threefold increase in C3a
concentration during storage did not lead to any adverse transfu-
sion reactions in patients [26], thus suggesting the patient trauma
severity rather than the blood transfusion was a greater
contributor.
Thrombin generation is also an important property of cryopre-
cipitate and its function. Our data indicated a slight decrease in
thrombin generation potential during post-thaw storage of cryopre-
cipitate at 1–6C. This was not different to that reported by
others [21], although the degradation was more pronounced in our
study.
A key observation made during this study was the re-precipitation
of the cryoprecipitate during cold storage. Despite warming the com-
ponents to 37C, not all the precipitate could be re-dissolved or
stayed dissolved. The degree of re-precipitation was dependent on
the post-thaw storage duration, the individual donation and the
source of plasma used for the cryoprecipitate (WB- or apheresis-
derived). Apheresis-derived cryoprecipitate was more susceptible to
re-precipitation, presumably due to higher fibrinogen content. The
precipitate in most of the cryoprecipitate components could be easily
dissolved until day 3, after which it became increasingly difficult to re-
dissolve. Similar issues have been mentioned in published literature,
although an extensive discussion of the problem was not provided
[20–22]. Whilst we are unsure of the composition of the re-
precipitation, we observed over 30% loss of fibrinogen after day 5 of
cold storage, suggesting that the precipitate is likely composed of
fibrinogen/fibrin, which slowly precipitates during extended cold
storage.
It is possible that a cryoprecipitate component that is not fully re-
dissolved could still be transfusible following in-line filtration at the
time of transfusion. A small sub-set of cryoprecipitate components
that underwent filtration showed there were no significant
TABLE 1 Coagulation factors in full-size apheresis- and whole blood-derived cryoprecipitate following storage at 1–6C.
Baseline Day 3 p-Value Baseline Day 5 p-Value Baseline Day 7 p-Value
Apheresis
Fibrinogen (mg/unit) (% change) 1006 ± 372 812 ± 140 (15 ± 16) 0.2119 817 ± 116 544 ± 51 (32 ± 16) 0.0391 931 ± 140 543 ± 78 (41 ± 6) 0.0045
Factor V (IU/unit) (% change) 59 ± 11 51 ± 6 (12 ± 7) 0.0630 68 ± 10 56 ± 10 (18 ± 7) 0.0227 72 ± 15 49 ± 16 (31 ± 15) 0.0310
Factor VIII (IU/unit) (% change) 322 ± 57 269 ± 73 (18 ± 11) 0.0550 262 ± 35 208 ± 27 (20 ± 3) 0.0027 322 ± 61 258 ± 42 (19 ± 8) 0.0332
VWF (IU/unit) (% change) 626 ± 155 606 ± 181 (4 ± 7) 0.3305 498 ± 135 478 ± 130 (4 ± 7) 0.3748 659 ± 134 636 ± 117 (3 ± 4) 0.2043
Whole blood
Fibrinogen (mg/unit) (% change) 310 ± 118 336 ± 107 (10 ± 8) 0.1315 281 ± 66 253 ± 31 (8 ± 12) 0.2707 262 ± 28 202 ± 29 (23 ± 9) 0.0208
Factor V (IU/unit) (% change) 35 ± 3 27 ± 2 (22 ± 2) 0.0015 26 ± 7 16 ± 4 (39 ± 5) 0.0095 28 ± 7 17 ± 4 (40 ± 8) 0.0095
Factor VIII (IU/unit) (% change) 184 ± 22 151 ± 18 (18 ± 3) 0.0032 146 ± 21 128 ± 30 (13 ± 11) 0.0650 109 ± 35 86 ± 26 (20 ± 9) 0.0478
VWF (IU/unit) (% change) 364 ± 16 374 ± 33 (3 ± 6) 0.4465 245 ± 33 247 ± 38 (1 ± 3) 0.7228 243 ± 76 237 ± 85 (4 ± 8) 0.5933
Note: Data are mean ± SD, n=4. % change is the difference at time point compared to baseline. p-value determined using a paired t-test between baseline and selected time point. A p-value <0.05 is considered
significant and highlighted in bold.
Abbreviation: VWF, von Willebrand factor.
EXTENDING POST-THAW SHELF-LIFE OF CRYOPRECIPITATE 1265
14230410, 2024, 12, Downloaded from https://onlinelibrary.wiley.com/doi/10.1111/vox.13736 by Cornell University E-Resources & Serials Department, Wiley Online Library on [24/02/2025]. See the Terms and Conditions (https://onlinelibrary.wiley.com/terms-and-conditions) on Wiley Online Library for rules of use; OA articles are governed by the applicable Creative Commons License

differences in the pre- and post-filter groups, and all filtered cryopre-
cipitate would meet specifications for fibrinogen, FVIII and VWF.
One limitation of the study was the sample volume; it was not
feasible to use a standard single or pooled cryoprecipitate component
for each time point. This component is always in high demand and
availability is limited. Although the sample size for full-size cryopreci-
pitate components was small, they had similar coagulation properties
and re-precipitation after 3, 5 and 7 days, as observed for the mini-
packs. A further limitation of the study was freezing the aliquots for
coagulation testing; whilst this meant an additional freeze–thaw cycle,
it eliminated any inter-assay variation.
In developed countries, the clinical implications of decreased in
FVIII in cold-stored cryoprecipitate are minimal, as cryoprecipitate is
no longer transfused to increase FVIII. The recommended adult dose
of cryoprecipitate is 10 units of WB-derived cryoprecipitate or 4 aphe-
resis units of cryoprecipitate, which should equate to 3–4 g of fibrino-
gen [4]. The loss of fibrinogen concentration up to 15% after 72 h is
high, however cryoprecipitate fibrinogen concentrations well exceed
the minimum requirement, meeting the specification even after 72 h
of storage.
In conclusion, the data from this study demonstrates that the
quality of cryoprecipitate stored at 1–6C for up to 7 days post-thaw
meets specifications for cryoprecipitate. However, a 72 h post-thaw-
shelf-life for cryoprecipitate is recommended as being optimal, due to
the re-precipitation that occurs when stored for longer periods at
refrigerated temperatures.
ACKNOWLEDGEMENTS
The authors wish to acknowledge Australian Red Cross Lifeblood
donors for their valuable donations and the Sydney Manufacturing
Team for their assistance during the study.
K.M.W., D.C.M. and P.M.D. designed the research study; K.M.W.,
R.G.W. and E.M. performed the research and analysed the data;
K.M.W. and E.M. wrote the first draft of the manuscript;
D.C.M. supervised the research and edited the manuscript; all authors
critically reviewed the manuscript.
Australian government funds Australian Red Cross Lifeblood to
provide blood, blood products and services to the Australian
community.
CONFLICT OF INTEREST STATEMENT
Denese C. Marks has received research funding from Cryogenics
Holdings in the past 2 years. Other authors have no conflict of inter-
ests to declare.
DATA AVAILABILITY STATEMENT
Research data are not shared.
ORCID
Kelly M. Winter https://orcid.org/0000-0001-8423-3618
Rachel G. Webb https://orcid.org/0009-0001-8228-4742
Peta M. Dennington https://orcid.org/0000-0001-7757-748X
Denese C. Marks https://orcid.org/0000-0002-3674-6934
TABLE 2 Coagulation factor concentrations for apheresis- and whole blood-derived cryoprecipitate before and after filtration.
Apheresis Whole blood
Unfiltered Filtered p-Value Unfiltered Filtered p-Value
Fibrinogen (mg/unit)
Day 3 881 ± 159 858 ± 195 0.4998 284 ± 65 288 ± 65 0.7193
Day 5 897 ± 228 864 ± 215 0.3634 279 ± 85 262 ± 51 0.4130
Day 7 745 ± 138 745 ± 138 1.0000 225 ± 43 231 ± 28 0.5886
Factor V (IU/unit)
Day 3 56 ± 8 60 ± 6 0.3575 20 ± 1 19 ± 2 0.2152
Day 5 51 ± 8 47 ± 7 0.0689 15 ± 1 14 ± 1 0.2152
Day 7 41 ± 7 42 ± 6 0.2394 12 ± 1 12 ± 1 0.3910
Factor VIII (IU/unit)
Day 3 300 ± 63 289 ± 52 0.4362 117 ± 20 117 ± 18 1.0000
Day 5 282 ± 49 293 ± 66 0.3541 102 ± 16 101 ± 17 0.4765
Day 7 267 ± 73 282 ± 81 0.2532 103 ± 26 99 ± 11 0.6286
von Willebrand factor (IU/unit)
Day 3 538 ± 135 468 ± 165 0.1209 218 ± 28 221 ± 30 0.3769
Day 5 542 ± 148 525 ± 210 0.7633 218 ± 28 213 ± 31 0.1849
Day 7 519 ± 117 533 ± 173 0.6453 215 ± 33 199 ± 25 0.0464
Note: Data are mean ± SD, n=4. p-value determined using a paired t-test for unfiltered and filtered samples at each time point. A p-value <0.05 is
considered significant and highlighted in bold.
Abbreviation: SD, standard deviation.
1266 WINTER ET AL.
14230410, 2024, 12, Downloaded from https://onlinelibrary.wiley.com/doi/10.1111/vox.13736 by Cornell University E-Resources & Serials Department, Wiley Online Library on [24/02/2025]. See the Terms and Conditions (https://onlinelibrary.wiley.com/terms-and-conditions) on Wiley Online Library for rules of use; OA articles are governed by the applicable Creative Commons License

REFERENCES
1. Australian Red Cross Lifeblood, editor. Blood component informa-
tion: an extension of blood component labels. Australian Red Cross
Lifeblood; 2023. Available from: https://www.lifeblood.com.au/
sites/default/files/resource-library/2021-12/78.-Blood_Component_
Information_1.pdf. Last accessed 9 Jan 2024.
2. Stanford S, Roy A, Cecil T, Hegener O, Schulz P, Turaj A, et al. Differ-
ences in coagulation-relevant parameters: comparing cryoprecipitate
and a human fibrinogen concentrate. PLoS One. 2023;18:e0290571.
3. Callum J, Karkouti K, Lin Y. Cryoprecipitate: the current state of
knowledge. Transfus Med Rev. 2009;23:177–88.
4. National Blood Authority. Patient blood management guidelines: mod-
ule 1 critical bleeding/massive transfusion. Commonwealth of Australia;
2011. Available from: https://www.blood.gov.au/sites/default/files/
documents/2024-06/pbm-guideline-adults-with-critical-bleeding.pdf.
Last Accessed 9 Jan 2024.
5. Crispin P, Hicks S, Coupland LA, Ali S, Gardiner EE. Cryoprecipitate
as an alternative to platelet transfusion in thrombocytopenia.
eJHaem. 2022;3:80–5.
6. European Directorate for the Quality of Medicines & HealthCare.
Guide to the preparation, use and quality assurance of blood compo-
nents. 19th ed. Strasbourg: Council of Europe; 2017.
7. Australian Red Cross Lifeblood. Use of cryoprecipitate. 2020 Avail-
able from: Lifeblood.com.au. Last Accessed 9 Jan 2024.
8. Dunbar NM, Olson NJ, Szczepiorkowski ZM, Martin ED,
Tysarcyk RM, Triulzi DJ, et al. Blood component transfusion and
wastage rates in the setting of massive transfusion in three regional
trauma centers. Transfusion. 2017;57:45–52.
9. Burk C, Eliason K, Doney A, Mountjoy J, Dalia A. Perioperative cryo-
precipitate waste reduction. J Med Syst. 2021;45:37.
10. Blood Matters. Blood component wastage. Available from: https://
www.health.vic.gov.au/patient-care/blood-component-wastage. Last
accessed 9 Jan 2024.
11. Far RM, Rad FS, Abdolazimi Z, Kohan MMD. Determination of rate
and causes of wastage of blood and blood products in Iranian hospi-
tals. Turk J Hematol. 2014;31:161–7.
12. Roxby D, Sinha R. The time to supply cryoprecipitate and wastage
rates—are they acceptable? Vox Sang. 2016;2016:264.
13. Saxena S, Odono V, Francis R, Endahl G, Shulman I. Can storage of
thawed cryoprecipitate be extended to more than six hours?
Am J Clin Pathol. 1990;94:203–6.
14. Spivey M, Jeter E, Lazarchick J, Kizer J, Spivey L. Postfiltration factor
VIII and fibrinogen levels in cryoprecipitate stored at room tempera-
ture and at 1-6 degrees C. Transfusion. 1992;32:340–3.
15. Winter K, Hyland R, Tan S, Webb R, Davis A, Dennington P, et al.
Extending the post-thaw shelf-life of cryoprecipitate. Vox Sang.
2016;11:158.
16. Green L, Backholer L, Wiltshire M, Platton S, Stanworth SJ,
Cardigan R. The hemostatic properties of thawed pooled cryoprecipi-
tate up to 72 hours. Transfusion. 2016;56:1356–61.
17. Sheffield WP, Bhakta V, Jenkins C. Stability of coagulation protein
activities in single units or pools of cryoprecipitate during storage at
20-24oC for up to 24 h. Vox Sang. 2016;110:12–9.
18. Lokhandwala P, O’Neal A, Patel E, Brunker P, Gehrie E, Zheng G,
et al. Hemostatic profile and safety of pooled cryoprecipitate up to
120 hours after thawing. Transfusion. 2018;58:1126–31.
19. Ketter PM, Kamucheka R, Arulanadam B, Akers K, Cap AP. Platelet
enhancement of bacterial growth during room temperature storage:
mitigation through refrigeration. Transfusion. 2019;59:1479–89.
20. Thomson C, Sobieraj-Teague M, Scott D, Duncan E, Abraham S,
Roxby D. Extending the post-thaw viability of cryoprecipitate. Trans-
fusion. 2021;61:1578–85.
21. Fenderson JL, Meledeo MA, Rendo MJ, Peltier GC, McIntosh CS,
Davis KW, et al. Hemostatic characteristics of thawed, pooled cryo-
precipitate stored for 35 days at refrigerated and room tempera-
tures. Transfusion. 2019;59:1560–7.
22. Soundar EP, Reyes M, Korte L, Bracey A. Characteristics of thawed
pooled cryoprecipitate stored at refrigerated temperature for
24 hours. Blood Transfus. 2018;16:443–6.
23. Australian & New Zealand Society of Blood Transfusion Ltd, editor.
Extended life plasma: A framework for preparation, storage and use.
2nd ed. Australian & New Zealand Society of Blood Transfusion Ltd;
2013. Available from: https://anzsbt.org.au/wp-content/uploads/
2018/06/ELP_Publication_Corrected_Sept2013.pdf. Last Accessed
9 Jan 2024.
24. Dogra M, Sidhu M, Vasudev R, Dogra A. Comparative analysis of activ-
ityofcoagulationfactorsVandVIIIandleveloffibrinogeninfreshfro-
zen plasma and frozen plasma. Asian J Transfus Sci. 2015;9:6–8.
25. Simon TL. Changes in plasma coagulation factors during blood stor-
age. Plasma Ther Transfus Tech. 1988;9:309–15.
26. Norda R, Schött U, Berséus O, Åkerblom O, Nilsson B, Ekdahl KN,
et al. Complement activation products in liquid stored plasma and
C3a kinetics after transfusion of autologous plasma. Vox Sang. 2012;
102:125–33.
27. Hyllner M, Arnestad JP, Bengtson JP, Rydberg L, Bengtsson A. Com-
plement activation during storage of whole blood, red cells, plasma,
and buffy coat. Transfusion. 1997;37:264–8.
28. Hyllner M, Tylman M, Bengtson JP, Rydbergy L, Bengtsson A. Com-
plement activation in prestorage leucocyte-filtered plasma. Transfus
Med. 2004;14:45–52.
29. Ketai LH, Grum CM. C3a and adult respiratory disease syndrome
after massive transfusion. Crit Care Med. 1986;14:1001–3.
30. Roumen RMH, Redl H, Schlag G, Zilow G, Sandtner W, Koller W,
et al. Inflammatory mediators in relation to the development of
mulitple organ failure in patients afer severe blunt trauma. Crit Care
Med. 1995;29:474–80.
31. Selberg O, Hecker H, Martin M, Klos A, Bautsch W, Kohl J. Discrimina-
tion of sepsis and systemic inflammatory response syndrome by deter-
mination of circulating plasma concentrations of procalcitonin, protein
complement 3a and interleukin-6. Crit Care Med. 2000;28:2793–8.
32. Satyam A, Graef ER, Lapchak PH, Tsokos MG, Lucca JJD, Tsokos GC.
Complement and coagulation cascades in trauma. Acute Med Surg.
2019;6:329–35.
How to cite this article: Winter KM, Webb RG, Mazur E,
Dennington PM, Marks DC. Extending the post-thaw shelf-life
of cryoprecipitate when stored at refrigerated temperatures.
Vox Sang. 2024;119:1257–67.
EXTENDING POST-THAW SHELF-LIFE OF CRYOPRECIPITATE 1267
14230410, 2024, 12, Downloaded from https://onlinelibrary.wiley.com/doi/10.1111/vox.13736 by Cornell University E-Resources & Serials Department, Wiley Online Library on [24/02/2025]. See the Terms and Conditions (https://onlinelibrary.wiley.com/terms-and-conditions) on Wiley Online Library for rules of use; OA articles are governed by the applicable Creative Commons License

ORIGINAL ARTICLE
Introduction of 7-day amotosalen/ultraviolet A light pathogen-
reduced platelets in Honduras: Impact on platelet availability
in a lower middle-income country
Marcelo Pedraza
1
| Julio Mejia
1
| John P. Pitman
2
| Glenda Arriaga
1
1
Programa Nacional de Sangre, Cruz Roja Hondureña (Honduran Red Cross [HRC]), Tegucigalpa, Honduras
2
Scientific and Medical Affairs, Cerus Corporation, Concord, California, USA
Correspondence
Glenda Arriaga, Cruz Roja Hondureña, 7 calle
entre 1 y 2 ave, Comayaguela M.D.C,
Tegucigalpa, Honduras.
Email: glenda.arriaga@cruzroja.org.hn
Funding information
The authors received no specific funding for
this work.
Abstract
Background and Objectives: Honduras became the first lower middle-income coun-
try (LMIC) to adopt amotosalen/UVA pathogen-reduced (PR) platelet concentrates
(PCs) as a national platelet safety measure in 2018. The Honduran Red Cross (HRC)
produces 70% of the national platelet supply using the platelet-rich plasma (PRP)
method. Between 2015 and 2018, PCs were screened with bacterial culture and
issued as individual, non-pooled PRP units with weight-based dosing and 5-day
shelf-life. PR PCs were produced in six-PRP pools with a standardized dose
(≥3.0 10
11
), no bacterial screening and 7-day shelf-life. Gamma irradiation and leu-
koreduction were not used.
Materials and Methods: PC production and distribution data were retrospectively
analysed in two periods. Period 1 (P1) included 3 years of PRP PCs and a transition
year (2015–18). Period 2 (P2) included 5 years of PR PCs (2019–23). PC doses were
standardized to an equivalent adult dose for both periods. Descriptive statistics were
calculated.
Results: HRC produced 10% more PC doses per year on average in P2 compared to
P1. Mean annual waste at HRC declined from 23.9% in P1 to 1.1% in P2. Two urban
regions consumed 96% of PC doses in P1 and 88.3% in P2. PC distributions
increased in 14/18 regions.
Conclusion: Standardized dosage, PR and 7-day shelf-life increased PC availability,
reduced waste, eliminated bacterial screening and avoided additional costs for arbo-
viral testing, leukoreduction and irradiation. Access to PC transfusion remains limited
in Honduras; however, the conversion to pooled PR PCs illustrates the potential to
sustainably expand PC distribution in an LMIC.
Keywords
amotosalen, Honduras, pathogen reduction, platelets
Received: 16 July 2024 Revised: 30 August 2024 Accepted: 9 September 2024
DOI: 10.1111/vox.13740
This is an open access article under the terms of the Creative Commons Attribution License, which permits use, distribution and reproduction in any medium,
provided the original work is properly cited.
© 2024 The Author(s). Vox Sanguinis published by John Wiley & Sons Ltd on behalf of International Society of Blood Transfusion.
1268 Vox Sanguinis. 2024;119:1268–1277.
wileyonlinelibrary.com/journal/vox

Highlights
•Amotosalen/UVA pathogen-reduced (PR) platelet concentrates (PCs) have been used sus-
tainably as the national standard in Honduras since 2018.
•Standardized pooling and dosing reduced PC waste.
•The 7-day shelf-life of PR PCs allowed expanded distribution of platelets to rural areas of a
lower middle-income country.
INTRODUCTION
Platelet transfusion is an important supportive therapy for thrombocy-
topenic patients, including haematology/oncology patients, to prevent
or treat bleeding associated with various chemotherapies, organ trans-
plantation and haematopoietic stem-cell transplantation (HSCT);
trauma patients with active haemorrhage or patients with bleeding
disorders [1]. Platelets are collected and transfused worldwide, how-
ever, platelet supplies vary dramatically between countries, most
notably between upper income and lower middle income countries
(LMIC) [2]. The World Bank defines LMIC as countries with per capita
gross national income (GNI) between $1136 and $4465 [3].
Honduras is an LMIC with a population of approximately 10 mil-
lion people in Central America. Approximately half of the population
resides in three large urban areas, including the capital city, Teguci-
galpa (Figure 1).
A number of transfusion-transmissible arboviral and other vector-
borne diseases are endemic to Honduras, including dengue virus, chi-
kungunya virus and Chagas disease [4, 5]. Data on arboviral preva-
lence in Honduran blood donors are not available; however, arboviral
risk in blood donors has been established in endemic areas elsewhere
in Latin America and the Caribbean [6–8]. Other blood-borne patho-
gens, including human immunodeficiency virus (HIV), hepatitis B and
C viruses (HBV, HCV), human T-lymphotropic virus (HTLV) and
FIGURE 1 Geographic distribution of Honduran population expressed as persons per square kilometre; identification of high and low
population areas and locations of Red Cross blood centres in relation to population centres.
PATHOGEN-REDUCED PLATELETS IN HONDURAS 1269
14230410, 2024, 12, Downloaded from https://onlinelibrary.wiley.com/doi/10.1111/vox.13740 by Cornell University E-Resources & Serials Department, Wiley Online Library on [24/02/2025]. See the Terms and Conditions (https://onlinelibrary.wiley.com/terms-and-conditions) on Wiley Online Library for rules of use; OA articles are governed by the applicable Creative Commons License

syphilis have been documented in Honduran blood donors at rela-
tively high levels. A serosurvey of Honduran blood donors conducted
between 2014 and 2016 found that >2% of 48,567 donors were
infected with a transfusion-transmissible infection (TTI) [9]. Bacterial
contamination of platelets is not widely documented in Latin America
due to limited haemovigilance [10]; however, hospital-based haemovi-
gilance systems have documented transfusion-transmitted bacterial
infections (TTBIs) in Brazil and Colombia [11, 12]. A 2021 review esti-
mated that actual TTBI rates in Latin American countries could be 7–
29 times higher than reported estimates [13].
The Honduran Red Cross (HRC) is responsible for collecting,
preparing and distributing 70% of the national blood supply,
including platelets. The balance of labile blood products are pro-
duced by hospital blood banks. HRC is reimbursed for blood compo-
nents transfused in public hospitals from governmental budgets
assigned to the Secretary of Health and the Secretary for Social
Security, which operate the national network of public hospitals.
Out-of-pocket reimbursements are paid by patients transfused in
the private sector.
HRC operates three blood centres: The National Blood Centre in
Tegucigalpa and Regional Blood Centres in La Ceiba (Atlántida region)
and San Pedro Sula (Cortés region) (Figure 1). HRC collects >47,000
whole blood donations per year, mostly (>70%) from family-
replacement donors [2, 9]. Two of the three HRC blood centres
(Tegucigalpa and San Pedro Sula) have been accredited by the Associ-
ation for the Advancement of Blood and Biotherapies (AABB) since
2000. A small number of apheresis platelets are produced each year;
the majority of the national platelet supply is produced from platelet-
rich plasma (PRP). Before the introduction of pathogen reduction,
platelets were produced as individual PRP units (PRPs), which were
prescribed using a weight-based formula.
Leukoreduction and gamma irradiation were not used for platelet
concentrate (PC) production in Honduras during the entire study
period.
All whole blood donations are screened for HIV, HBV and HCV
with an electro-chemiluminescence assay (ECLIA). To reduce the risk
of window period infections, HRC uses nucleic acid testing (NAT) to
re-screen donations with a negative ECLIA result. Serological assays
are also used to screen donations for syphilis, HTLV-1 and 2 and hep-
atitis B core antigen. HRC introduced bacterial culture screening with
the BacT/Alert system (bioMérieux, Marcy l’
Etoile, France) for all
platelets in 2015. Aerobic bottles were inoculated with a 7–10 mL
sample between 12 and 24 h post-collection and incubated for at
least 12 h prior to release. In 2016, challenges with reagent procure-
ment and concerns about emerging and other non-bacterial infectious
risks such as Zika virus [14] led the HRC to evaluate the amotosalen/
UVA pathogen reduction technology (INTERCEPT
®
Blood System,
Cerus Corporation, Concord, California, USA) as an enhanced safety
measure for platelets. The HRC implemented amotosalen/UVA patho-
gen reduction for 100% of the PCs produced by HRC blood centres in
2018. This article describes the Honduran experience as the first
LMIC to implement pathogen-reduced (PR) PCs at a national scale and
sustain the practice for 5 years.
MATERIALS AND METHODS
Whole blood collections, PC production and distribution data were
retrospectively extracted from HRC databases and stratified by year,
region and type of PC. Data were further stratified into 2 discrete
time periods. Period 1 (P1) covered 3 years of conventional PRP PC
production (2015–2017) plus the transition year (2018). Period
2 (P2) covered the first 5 complete years of pooled PR PC production
and distribution (2019–2023). PC doses were standardized to an
equivalent adult dose for both periods: PRP doses in P1 were based
on a 1 PRP per 10 kg dosing formula and a mean adult (male and
female) weight estimate of 68 kg [15]. Pooled PR PC doses produced
in P2 were prepared with six non-leukoreduced, non-irradiated PRPs
and a standardized target dose of ≥3.0 10
11
(Figure 2).
HRC conducted a validation study in 2018 to assess the quality
of PCs prepared and stored with the INTERCEPT Blood System for
Platelets. The study measured PC volume, platelet concentration
(10
9
/L), platelet dose (10
11
) and pH through storage day 7.
Acost–benefit analysis was performed based on the model of
anticipated savings associated with pathogen reduction technology
described by McCullough et al. [16]. Baseline costs included the use
of a quadruple bag collection system for PRP production, consum-
ables for bacterial culture screening and estimated costs associated
with false positive results. Pathogen reduction costs assumed the
use of a triple bag collection system with pooling sets and consum-
ables, for example, sterile docking seals; the elimination of bacterial
screening; the use of INTERCEPT large volume (LV) processing sets
and savings associated with reduced processing and transfusion
reaction costs. Additional savings included the avoidance of imple-
menting gamma irradiation to prevent transfusion-associated graft-
versus-host disease (TA-GVHD) and leukoreduction to reduce the
risk of cytomegalovirus (CMV) infection, alloimmunization and clini-
cal refractoriness [17]. Future cost-savings associated with avoided
future testing costs were also estimated. All costs (in US Dollars)
were based on actual 2017 prices and estimated prices listed by
McCullough et al.
Population estimates (national and for 18 regions) were derived
from the Honduran National Institute of Statistics [18]. Descriptive
statistics (means, ranges) were calculated for two-period comparisons
and multi-year trends. No statistical testing was performed. Maps
were produced with QGIS version 3.36.1 (QGIS.org).
RESULTS
A total of 28,449 equivalent PRP PC doses were produced during the
9-year study period (11,865, 41.7% in P1; 16,584, 58.3% in P2). On
average, 2996 PC doses were produced annually in P1 versus 3317
produced per year in P2 (+11.8%). The proportion of PC doses distrib-
uted for transfusion increased from 64.6% (1844 / 2854) in 2015
when shelf-life was limited to 5 days (>35% waste) to 98.8% (3126 /
3164) in 2023 after the extension of shelf-life to 7 days (1.2%
waste). Annual PC waste at HRC decreased from 23.9% per year on
1270 PEDRAZA ET AL.
14230410, 2024, 12, Downloaded from https://onlinelibrary.wiley.com/doi/10.1111/vox.13740 by Cornell University E-Resources & Serials Department, Wiley Online Library on [24/02/2025]. See the Terms and Conditions (https://onlinelibrary.wiley.com/terms-and-conditions) on Wiley Online Library for rules of use; OA articles are governed by the applicable Creative Commons License

average in P1 to 1.1% per year in P2 (Table 1). The majority of expira-
tions in P1 occurred at the HRC production centre before release.
Most expirations in P2 occurred at the receiving hospital after distri-
bution from the HRC production centre. Platelets were released on
the afternoon of Day 1 post-collection on average in both periods
(Figure 4).
No cases of TA-GVHD were documented in either period.
Whole blood collections increased by 49% in 2023 compared
with 2015. This increase was driven in large measure by overall popu-
lation growth between 2015 and 2023. On a national basis, mean
annual whole blood collections (450 mL) did not change substan-
tially when factored against population growth: 4.0 whole blood
(WB) collections per 1000 population in P1 versus 4.4 per 1000 popu-
lation in P2 (Table 2).
Population growth and geographic distribution of
PC doses
The national population of Honduras grew 13.7% between 2015 and
2023, increasing from approximately 8,574,532 in 2015 to 9,743,373
in 2023, according to estimates derived from the 2013 Honduran
Census [18]. Annual population growth by region averaged 1.6%
(range: 1.2%–2.5%). Urban areas in three regions (Francisco Morazán,
Cortés and Atlántida) accounted for 42% of the national population
throughout the 9-year study period.
Two regions (Francisco Morazán and Cortés) accounting for
37% of the national population consumed 96% of PC doses in P1
and 88.3% in P2 (Table 3). In 2015, only 10 of 18 regions reported
receiving one or more PRP doses per year. By 2023, 14 of 18 regions
Whole Blood
donation
1st centrifuge
‘Soft spin’ to
separate PRP from
red blood cells
Transfer platelet
rich plasma
(PRP) to
satellite bag
2nd centrifuge
“Hard spin” to
separate platelet
concentrate
1 2 3 4
Transfer
platelet
concentrate to
final PRP PC
storage bag
(60 ml)
5
6a
Period 1:
PRP PC dosing based on
patient weight: 1 PRP PC
per 10 kg. Non-standard
dose; patients may be
exposed to >6 donors.
6b
Period 2:
6-PRP PCs pooled to
create a single (350 ml)
pooled unit.
Standard dose: ≥3x10¹¹
6-PRP
pool
FIGURE 2 Procedure used to produce platelet components in Honduras: The platelet-rich plasma (PRP) method. PC, platelet concentrate.
TABLE 1 Nine-year summary of PC production, distribution and waste, Honduran Red Cross, 2015–2023.
Individual PRPs +2018 transition (P1) Pooled amotosalen/UVA PCs (P2)
2015 2016 2017 2018
a
2019 2020 2021 2022 2023
PC doses produced N2854 3283 2910 2818 3316 2826 3914 3364 3164
Mean 2966 3317
PC doses distributed N1844 2223 2166 2752 3278 2791 3884 3330 3126
Mean 2246 3282
Estimated waste (%) % 35.4% 32.3% 25.6% 2.3% 1.1% 1.2% 0.8% 1.0% 1.2%
Mean 23.9% 1.1%
%PR 0%0%0%10% 100% 100% 100% 100% 100%
Platelet shelf-life (days) 5 5/7 7
Abbreviations: PC, platelet concentrate; PR, pathogen-reduced; PRP, platelet-rich plasma.
a
Pathogen reduction transition year. The grey shading is meant to highlight 2018 as the year HRC transitioned to pathogen reduction, that is, in this year
the data reflect 10% PR and 90% conventional, vs. 100% of conventional in 2015-2017 and 100% PR in 2019-2023.
PATHOGEN-REDUCED PLATELETS IN HONDURAS 1271
14230410, 2024, 12, Downloaded from https://onlinelibrary.wiley.com/doi/10.1111/vox.13740 by Cornell University E-Resources & Serials Department, Wiley Online Library on [24/02/2025]. See the Terms and Conditions (https://onlinelibrary.wiley.com/terms-and-conditions) on Wiley Online Library for rules of use; OA articles are governed by the applicable Creative Commons License

received at least 1 PR PC dose per year. Two low population regions
(Lempira [360,000 pop.] and Ocotepeque [168,000 pop.]) received
no PC doses in either period (Figure 3).
Local validation of the amotosalen/UVA system and
operational changes
The HRC validation study (n=30 pools of six PRPs) confirmed
that locally produced PR PCs met production parameters and
acceptance criteria established by the manufacturer [19] and AABB
Standards [20] (Table 4). Routine swirling and visual inspection
procedures were also in place during both study periods. Certain
workflow changes were required to accommodate the pathogen
reduction process, which included PRP pooling, sterile docking to
the INTERCEPT LV processing kit, illumination in the INTERCEPT
Illuminator device and a 16-h hold for the adsorption of residual
amotosalen and photo-products. These additional steps delayed PR
PC release times by approximately 3 h compared with the routine
process used to prepare individual PRP units; however, workflow
changes had minimal impact on blood centre shift schedules and
remained aligned with the HRC NAT and serology testing sched-
ules (Figure 4).
Cost–benefit analysis
As predicted by the McCullough et al. model, per dose costs were
$100 higher in the pathogen reduction scenario compared with
the baseline scenario ($74/dose baseline vs. $175/dose pathogen
reduction). The increased costs were all associated with the addi-
tion of pooling sets and INTERCEPT Processing Sets. However,
these increases were off-set in the model by immediate savings
achieved through the elimination of false-positive bacterial screen-
ing results and savings associated with the avoidance of adding
Zika virus screening for platelets. Additionally, the model captured
savings associated with a reduction in the number of WB units
required to produce PR PCs compared with the number of WB
donations to produce single PRP units for a comparable number of
‘doses’using the previous weight-based dosing formula, reduced
costs associated with TTIs and increased cost-recovery linked to
reduced waste. When these additional savings were accounted for,
per dose costs only increased by $39. The avoidance of future
costs associated with the potential introduction of gamma irradia-
tion or CMV screening (neither of which were available in
Honduras), and tests for certain emerging infectious diseases also
contributed to a conclusion that pathogen reduction could be
introduced and sustained in a cost-neutral manner.
DISCUSSION
The introduction of PR PCs with the amotosalen/UVA technology
allowed the HRC to provide more PCs to patients in a wider geo-
graphical area with reduced waste, and no impact on overall whole
blood collection requirements. The amotosalen/UVA pathogen reduc-
tion technology also added evidence-based protection against bacte-
rial [21, 22] and arboviral TTIs [23] without additional laboratory
testing. For example, a 2023 meta-analysis by Giménez-Richarte et al.
summarized pathogen inactivation studies showing the amotosalen/
UVA technology achieved high levels of inactivation (≥4 log
10
,as
recommended by the World Health Organization [24]) against Chikun-
gunya (≥6.29 log
10
), Dengue (≥4.33 log
10
) and Zika (≥6.29 log
10
)
viruses, three endemic arboviruses with epidemic potential in Latin
America [25]. Likewise, in 2021 McDonald et al. demonstrated the
amotosalen/UVA technology’s capacity to achieve full inactivation of
nine bacterial species commonly associated with TTBI through the
end of 7-days’storage [22].
As the first LMIC blood centre to adopt pathogen reduction as
the standard of care for the majority of PCs produced, HRC has dem-
onstrated the feasibility of implementing and sustaining pathogen
reduction as a replacement for bacterial culture screening on a
national scale. The HRC experience also shows how an LMIC may
accrue additional safety benefits from pathogen reduction while
TABLE 2 National RBC and PC production by population.
Period 1 (P1) Period 2 (P2)
2015 2016 2017 2018 2019 2020 2021 2022 2023
Population (pop.) 8,574,532 8,701,014 8,866,351 9,012,229 9,158,345 9,304,380 9,450,711 9,597,042 9,743,373
RBCs
a
32,055 33,347 36,332 38,267 41,103 30,354 41,593 46,733 47,956
PC doses 2854 3283 2910 2818 3316 2826 3914 3364 3164
RBC per 1000 population
(pop.)
3.7 3.8 4.1 4.2 4.5 3.3 4.4 4.9 4.9
PC per 1000 pop. 0.33 0.38 0.33 0.31 0.36 0.30 0.41 0.35 0.32
Mean PC/1000 pop. 0.23 0.34
Mean RBC/1000 pop. 4.0 4.4
Abbreviation: PC, platelet concentrate.
a
Red blood cells (RBCs) are used as a proxy for whole blood (WB) collections as 97%–99% of WB collections were processed into RBCs each year.
1272 PEDRAZA ET AL.
14230410, 2024, 12, Downloaded from https://onlinelibrary.wiley.com/doi/10.1111/vox.13740 by Cornell University E-Resources & Serials Department, Wiley Online Library on [24/02/2025]. See the Terms and Conditions (https://onlinelibrary.wiley.com/terms-and-conditions) on Wiley Online Library for rules of use; OA articles are governed by the applicable Creative Commons License

avoiding future costs. Specifically, leukoreduction, gamma irradiation
and CMV screening were not used in Honduras prior to pathogen
reduction and have not been introduced since the adoption of
pathogen reduction. In addition to reduced risk of viral, bacterial and
protozoan threats, the amotosalen/UVA pathogen reduction may be
used as an alternative to gamma irradiation for the prevention of TA-
TABLE 3 Platelet Distribution by Region, Honduras, 2015–23.
Period 1 (P1) Period 2 (P2) Mean by period
Region 2015 2016 2017 2018 2019 2020 2021 2022 2023 P1 P2 Change (+/)
Atlántida 23 19 41 44 259 215 254 161 142 32 206 +
Choluteca 00000500702+
Colón 001063011809+
Comayagua 06387154124410+
Copán 02401783023214+
Cortés 964 1122 1169 1215 1318 1367 1847 1579 1589 1117 1540 +
El Paraíso 101112103180112+
Francisco Morazán 805 1036 886 661 1448 977 1556 1541 1275 847 1359 +
Gracias a Dios 200053110104+
Intibucá 01000030101+
Islas de la Bahía 317246134837+
LaPaz 10000081002+
Lempira 00000000000nc
Ocotepeque 00000000000nc
Olancho 11010200912+
Santa Bárbara 38 32 46 4 5 28 4 8 35 30 16
Valle 00000011201+
Yoro 71224825234+
National 1844 2221 2158 1938 3069 2673 3743 3340 3126 2040 3190
Abbreviation: nc, no change.
Note: The bold values represent the national totals of each year.
FIGURE 3 Evolution of national platelet distribution by region in Honduras, 2015 and 2023. PC, platelet concentrate.
PATHOGEN-REDUCED PLATELETS IN HONDURAS 1273
14230410, 2024, 12, Downloaded from https://onlinelibrary.wiley.com/doi/10.1111/vox.13740 by Cornell University E-Resources & Serials Department, Wiley Online Library on [24/02/2025]. See the Terms and Conditions (https://onlinelibrary.wiley.com/terms-and-conditions) on Wiley Online Library for rules of use; OA articles are governed by the applicable Creative Commons License

GVHD and may replace CMV testing and leukoreduction for preven-
tion of transfusion transmitted CMV infection [26–28]. The successful
elimination of bacterial culture screening and irradiation with the
introduction of amotosalen/UVA PR PCs for HSCT patients was
described in 2019 by Sim et al. in a setting where leukoreduction was
not used for platelets. A total of 33 patients received 76 non-
leukoreduced and non-irradiated PR PCs without bacterial culture
screening. Thirty-one (31) control patients were transfused with
89 bacterial screened and irradiated PCs. The primary efficacy
endpoint—1-h corrected count increment (CCI)—was comparable in
both cohorts which were followed for 100 days post-transfusion. The
rate of transfusion reactions (the primary safety endpoint) was
reduced in the test cohort, but not significantly. The study also found
that clinical refractoriness and refractory transfusions were signifi-
cantly lower in the test cohort ( p=0.05 and p=0.02, respectively),
with no TA-GVHD in either cohort and comparable rates of 100 day
engraftment, mortality and infectious disease incidence in both
cohorts [17].
Platelets remain a scarce commodity in Honduras, where <1 PC
dose is available per 1000 population (by comparison up to eight
PC doses are distributed per 1000 population per year in the
United States [29]). PC distribution remains focused on urban areas,
and barriers to PC distribution including inclement weather, poor roads
and mountainous terrain were present in both P1 and P2. However,
with up to 2 days’of additional shelf-life, the introduction of pathogen
reduction allowed a measurable increase in the availability of PCs in
rural areas (4% in P1 vs. 12% in P2), where the Honduran Ministry
of Health operates a network of general and basic hospitals [30].
While the true burden of cancer and other oncological conditions
that may require acute or prophylactic platelet transfusion is unknown
in Honduras, the incidence of multiple types of cancers (and need for
supportive therapies) is projected to increase in LMICs in the coming
decades [31]. Limited access to healthcare commodities and proce-
dures and challenges with transportation have already been identified
as key factors in delayed cancer diagnoses and treatments [32], aban-
donment of cancer therapy [33, 34] and poor cancer outcomes [35]in
Honduras. Increased availability of PR PCs with a 7-day shelf-life
in regional hospitals may help mitigate the impact of barriers to
healthcare in rural areas [36, 37] and reduce pressure on urban hospi-
tals where medical indications for transfusion compete with transfu-
sion requirements for high levels of trauma due to violence and traffic
accidents which may also require blood products [38, 39].
TABLE 4 Results of HRC PR PC validation study, 2018.
N=30 pools of
six PRPs Sample size
Volume
(mL)
a
Platelet concentration
(10
9
/L)
a
Platelet dose
(10
11
)
a
pH
a,b
RBC
Acceptance criteria
(ranges)
Variable (20–60) 255–420 1050–2100 2.5–7.0 6.4–8.0 <4 10
6
/mL for 300–
420 mL units or
<4 10
5
/mL for 255–
420 mL units
Mean (high/low
daily range)
N=30 pools of
six PRPs
304 (280–
320)
1245 (1020–1690) 3.8 (3.1–5.1) 7.3 (7.0–
8.0)
All units within acceptance
criteria
Median (IQR) 304 (8) 1188 (207) 3.6 (0.6) 7.0 (0.4)
Abbreviations: IQR, interquartile range; PC, platelet concentrate; PR, pathogen-reduced; PRP, platelet-rich plasma; RBC, red blood cells.
a
Results of the validation study fell within acceptance ranges established by the manufacturer and AABB Standards for the production of pathogen-
reduced platelets.
b
pH values were measured daily post-collection up to day 7.
Day 0 Day 1
08h00 10h00 12h00 14h00 16h00 18h00 20h00 22h00 00h00 02h00 04h00 06h00 08h00 10h00 12h00 14h00 16h00 18h00 20h00 22h00
Individual PRP
Amotosalen/UVA PRP
Workflow
Day / Time
Testing
Release
~14h00
Release
~17h00
Pool
and PR
PRP Production
Overnight RestPRP Collection
PRP Collection Compound Adsorption Device (CAD)
(16 h)
First and second shifts
Serology and ABO
grouping
Nucleic Acid
Testing (NAT)
FIGURE 4 Honduran Red Cross (HRC) platelet production workflow and timeline before and after implementation of 100% pathogen-
reduced (PR) platelets. NAT, nucleic acid testing; PRP, platelet-rich plasma.
1274 PEDRAZA ET AL.
14230410, 2024, 12, Downloaded from https://onlinelibrary.wiley.com/doi/10.1111/vox.13740 by Cornell University E-Resources & Serials Department, Wiley Online Library on [24/02/2025]. See the Terms and Conditions (https://onlinelibrary.wiley.com/terms-and-conditions) on Wiley Online Library for rules of use; OA articles are governed by the applicable Creative Commons License

The introduction of amotosalen/UVA PR PCs in Honduras was
accompanied by a major clinical shift in platelet dosing guidelines and
an extension of PC shelf-life from 5 to 7 days. The move from pre-
sumptive PC dosing based on patient weight to a standardized plate-
let dose per unit was well received by clinicians and has been shown
in other LMIC settings to improve transfusion practice [40]. A clinical
audit of platelet transfusion practice with standardized dosing is
needed to understand the full clinical impact of this change in
Honduras. A similar audit conducted over a 6-year period in a large
academic hospital in Mexico found that up to 25% of platelet transfu-
sions were ‘inappropriate’when assessed against British Society for
Haematology guidelines, despite local training [41].
The HRC decision to adopt pathogen reduction for all PCs was
driven by concerns about the limitations of culture screening as a
guard against non-bacterial TTIs [23] and made in the context of eco-
nomic and logistical barriers to sustaining bacterial culture as a safety
measure.
Since adopting pathogen reduction, HRC has worked with the
amotosalen/UVA technology’s manufacturer to limit year-on-year price
increases and ensure a continuous supply of processing kits (since
2018 no PR stock-outs have occurred). The introduction of pathogen
reduction in Honduras also occurred during a period of substantial
growth in government expenditure on health, driven in large part by
the coronavirus disease 2019 (COVID-19) pandemic. Between 2020
and 2023, public spending on hospital services increased >30%, with
spending on materials and supplies rising by 50% [42]. A fuller finan-
cial analysis is required to describe the impact of pathogen reduction
within the overall growth of public sector spending on healthcare, vali-
date savings accrued from the elimination of bacterial culture screening
and estimate the avoidance of future costs associated with gamma irra-
diation, leukoreduction and CMV testing. Pending such an analysis real
world cost savings or cost-recovery opportunities may be inferred
given the clinical and operational changes achieved in Honduras and
cost modelling done in Canada and with a different pathogen reduction
technology in another LMIC [43, 44]. Additional cost savings may
include, for example the following:
1. Cost-recovery from the higher number of transfusable units due to
reduced waste.
2. Reduced healthcare costs associated with extended hospitaliza-
tions and specialty care associated with TTBI and emerging infec-
tious diseases.
Additional research is also needed to assess patient safety trends
in Honduras and compare the Honduran experience with positive clin-
ical and safety trends described in other countries where the amoto-
salen/UVA technology has been adopted as the standard of
care [45–48].
This study is subject to several limitations. First, retrospective
data may be subject to uncontrollable reporting biases, especially
related to the distribution of blood components. It was beyond
the scope of this study, for example, to track each ‘distributed’
unit to confirm transfusion. As a result, wastage rates presented
here may underestimate levels of un-used PC doses at the bed-
side. Second, the use of a mean adult weight (68 kg) to calculate
the number of PRP PC doses in P1 may have produced under- or
over-estimates depending on the actual ratios of male and female
adults transfused in a given region or hospital. This method also
underestimates paediatric PC transfusions. While standardized
dosing with six-pool PRP PCs reduced the number of WB dona-
tions required to meet annual PC production quotas, the extent of
this reduction is difficult to quantify. Third, individual patient out-
comes were not available to assess the clinical benefit of
increased access to PC transfusion in rural hospitals. Fourth, while
clinicians reported preferring the new standard dosing system,
data were not available to determine the number of PCs trans-
fused per patient or other measures of appropriate PC transfusion
practices in either period. Fifth, the economic analysis performed
in 2017 does not account for inflation or other macroeconomic
changes during the ensuing years; a fuller accounting of routine
operating costs is warranted.
Despite these limitations, the HRC experience provides real world
evidence of the feasibility of implementing and sustaining the amoto-
salen/UVA pathogen reduction technology with standardization of PC
production and dosing, elimination of bacterial screening, avoidance
of gamma irradiation and leukoreduction and 7-day shelf-life exten-
sion in an LMIC. Sustaining pathogen reduction as a routine blood
centre process over a 5-year period is particularly striking in
Honduras, where per capita spending on health by the government is
the lowest in the Latin America region. While public spending on
health in Honduras has increased since 2010, Honduras continues to
lag its neighbours in the region by a substantial margin [49]. This
experience may provide insights and reassurance to other LMIC that
pathogen reduction is not a cost-prohibitive intervention when con-
sidered in the context of immediate cost savings, opportunities for
cost-recovery and the avoidance of future costs, especially those
associated with the introduction of gamma irradiation and leukore-
duction technologies or severe clinical outcomes in patients.
ACKNOWLEDGEMENTS
The authors thank the Global Advisory Panel on Corporate Gover-
nance and Risk Management of Blood Services in Red Cross and Red
Crescent Societies (GAP), as well as Dr. Elizabeth Vinelli, former HRC
Medical Director, and Dr. Rudolf Schwabe of the Swiss Red Cross for
technical assistance between 2012 and 2017 in support of HRC’s
quality management systems.
M.P. and G.A. conceived of the study and designed the manu-
script with J.P.P. All authors contributed to data analysis and prepara-
tion and review of the manuscript.
CONFLICT OF INTEREST STATEMENT
J.P.P. is an employee and shareholder of Cerus Corporation.
DATA AVAILABILITY STATEMENT
Data sharing not applicable to this article as no datasets were gener-
ated or analysed during the current study.
PATHOGEN-REDUCED PLATELETS IN HONDURAS 1275
14230410, 2024, 12, Downloaded from https://onlinelibrary.wiley.com/doi/10.1111/vox.13740 by Cornell University E-Resources & Serials Department, Wiley Online Library on [24/02/2025]. See the Terms and Conditions (https://onlinelibrary.wiley.com/terms-and-conditions) on Wiley Online Library for rules of use; OA articles are governed by the applicable Creative Commons License

ORCID
John P. Pitman https://orcid.org/0000-0001-5983-7241
REFERENCES
1. McCullough J. Overview of platelet transfusion. Semin Hematol.
2010;47:235–42.
2. World Health Organization. Global status report on blood safety and
availability 2016. Geneva: Switzerland, World Health Organization;
2017.
3. The World Bank. The World Bank in middle income countries. Avail-
able from: https://www.worldbank.org/en/country/mic/overview.
Last accessed 10 Jun 2024
4. Mejía M, Shu PY, Ji DD. Accuracy of dengue, chikungunya, and Zika
diagnoses by primary healthcare physicians in Tegucigalpa,
Honduras. BMC Infect Dis. 2023;23:371.
5. Hashimoto K, Zúniga C, Nakamura J, Hanada K. Integrating an infec-
tious disease programme into the primary health care service: a ret-
rospective analysis of Chagas disease community-based surveillance
in Honduras. BMC Health Serv Res. 2015;15:116.
6. Giménez-Richarte ´
A, de Salazar MO, Arbona C, Giménez-
Richarte MP, Collado M, Fernández PL, et al. Prevalence of chi-
kungunya, dengue and Zika viruses in blood donors: a systematic
literature review and meta-analysis. Blood Transfus. 2022;20:
267–80.
7. Cáceres A, Urbina A, Rodriguez A, Rodríguez D, Ospina L, Flórez I,
et al. P-BB-70 jsimultaneous detection of dengue, Zika and chikun-
gunya viruses in blood donors during two different epidemiological
periods in Colombia. Transfusion. 2023;63:140A–141A.
8. Petersen LR, Tomashek KM, Biggerstaff BJ. Estimated prevalence of
dengue viremia in Puerto Rican blood donations, 1995 through
2010. Transfusion. 2012;52:1647–51.
9. Hernández-Arriaga G, Ruglas K, Alas-Pineda C, Chinchilla-López C,
Arriaga-Mendoza G, Bejarano-Cáceres S, et al. Prevalence of infec-
tious diseases and its associated factors among the blood donors of
the Honduran Red Cross—northern region between 2014 and 2016.
PLoS One. 2018;13:e0207338.
10. Ramirez-Arcos S, McDonald CP, Benjamin RJ, ISBT Working Party
Transfusion-Transmitted Infectious Diseases Bacterial Subgroup.
Survey for bacterial testing of platelet components in Latin America.
ISBT Sci Ser. 2017;12:336–9.
11. Salamanca-Pachon M, Guayacan-Fuquene NI, Garcia-Otalora MA.
Septic transfusion reactions involving Burkholderia cepacia complex:
A review. Microorganisms. 2023;12:40.
12. Cunha G, Le˜ao L, Pimenta F. Bacterial contamination of random-
donor platelets in a university hospital in the midwestern region of
Brazil. Transfusion. 2008;48:282–5.
13. García-Otálora M-A, Núñez-Ahumada M-A, Kuperman S, Oliveira-
Leit˜ao L, Silveira F, Martins R, et al. Bacterial contamination and sep-
sis associated with transfusion: current status in Latin America. Ann
Blood. 2021;6. https://aob.amegroups.org/article/view/6441
(on. Last accessed 10 Jun 2024
14. Ikejezie J, Shapiro C, Kim J, Chiu M, Almiron M, Ugarte C, et al. Zika
virus transmission—region of the Americas, May 15, 2015-Decemer
15, 2016. MMWR Morb Mortal Wkly Rep. 2017;66:329–34.
15. Walpole SC, Prieto-Merino D, Edwards P, Cleland J, Stevens G,
Roberts I. The weight of nations: an estimation of adult human bio-
mass. BMC Public Health. 2012;12:439.
16. McCullough J, Goldfinger D, Gorlin J, Riley WJ, Sandhu H, Stowell C,
et al. Cost implications of implementation of pathogen-inactivated
platelets. Transfusion. 2015;55:2312–20.
17. Sim J, Tsoi WC, Lee CK, Leung R, Lam CCK, Koontz C, et al. Transfu-
sion of pathogen-reduced platelet components without leukoreduc-
tion. Transfusion. 2019;59:1953–61.
18. Instituto Nacional de Estadística Honduras Proyecciones de
Población por Departamento 2013–2030. Tegucigalpa, Honduras.
2013.
19. Cerus Corporation. INTERCEPT platelets technical data sheet. Avail-
able from: https://interceptbloodsystem.com/en/resources/
category/technical-data-sheets
20. Association for the Advancement of Blood and Biotherapies (AABB).
Standards for blood banks and transfusion services. Bethesda: Asso-
ciation for the Advancement of blood and biotherapies (AABB);
2014–2024.
21. Benjamin RJ, Braschler T, Weingand T, Corash LM. Hemovigilance
monitoring of platelet septic reactions with effective bacterial pro-
tection systems. Transfusion. 2017;57:2946–57.
22. McDonald CP, Bearne J, Aplin K, Sawicka D. Assessing the inactiva-
tion capabilities of two commercially available platelet component
pathogen inactivation systems: effectiveness at end of shelf life. Vox
Sang. 2021;116:416–24.
23. Lanteri MC, Santa-Maria F, Laughhunn A, Girard YA, Picard-
Maureau M, Payrat JM, et al. Inactivation of a broad spectrum of
viruses and parasites by photochemical treatment of plasma and
platelets using amotosalen and ultraviolet A light. Transfusion. 2020;
60:1319–31.
24. World Health Organization. WHO guidelines on viral inactivation
and removal procedures intended to assure the viral safety of human
blood plasma products, annex 4. Geneva, Switzerland: World Health
Organization; 2004. p. 150–224.
25. Giménez-Richarte ´
A, Ortiz de Salazar MI, Giménez-Richarte MP,
Larrea L, Arbona C, Marco P, et al. Pathogen inactivation methods to
prevent transfusion-transmissible arboviruses: A systematic review
and meta-analysis. Trop Med Int Health. 2023;28:262–74.
26. Roback JD, Conlan M, Drew WL, Ljungman P, Nichols WG,
Preiksaitis JK. The role of photochemical treatment with amotosalen
and UV-A light in the prevention of transfusion-transmitted cyto-
megalovirus infections. Transfus Med Rev. 2006;20:45–56.
27. Cerus Corporation. INTERCEPT
®
blood system for platelets instruc-
tions for use. Available from https://interceptbloodsystem.com/en/
resources/category/instructions-use. Last accessed 10 Jun 2024
28. Li M, Irsch J, Corash L, Benjamin RJ. Is pathogen reduction an accept-
able alternative to irradiation for risk mitigation of transfusion-
associated graft versus host disease? Transfus Apher Sci. 2022;61:
103404.
29. Free RJ, Sapiano MRP, Chavez Ortiz JL, Stewart P, Berger J,
Basavaraju SV. Continued stabilization of blood collections and
transfusions in the United States: findings from the 2021 National
Blood Collection and Utilization Survey. Transfusion. 2023;63:
S8–s18.
30. Ministerio de Salud Honduras. Regiones y Hospitales. Available from
https://www.salud.gob.hn/sshome/index.php/regiones-y-hospitales.
Last accessed 10 Jun 2024
31. Sung H, Ferlay J, Siegel RL, Laversanne M, Soerjomataram I, Jemal A,
et al. Global cancer statistics 2020: GLOBOCAN estimates of inci-
dence and mortality worldwide for 36 cancers in 185 countries. CA
Cancer J Clin. 2021;71:209–49.
32. Sánchez JA, Handal MG, Vílchez Rodriguez JF, Mejía SI, Pagoaga AP.
Time intervals from onset of clinical manifestations to treatment in
patients with cancer at hospital General san Felipe, Tegucigalpa,
Honduras. J Glon Oncol. 2019;5:1–7.
33. Gupta S, Antillon FA, Bonilla M, Fu L, Howard SC, Ribeiro RC, et al.
Treatment-related mortality in children with acute lymphoblastic leu-
kemia in Central America. Cancer. 2011;117:4788–95.
34. Gupta S, Bonilla M, Valverde P, Fu L, Howard SC, Ribeiro RC, et al.
Treatment-related mortality in children with acute myeloid leukaemia
in Central America: incidence, timing and predictors. Eur J Cancer.
1990;2012:1363–9.
1276 PEDRAZA ET AL.
14230410, 2024, 12, Downloaded from https://onlinelibrary.wiley.com/doi/10.1111/vox.13740 by Cornell University E-Resources & Serials Department, Wiley Online Library on [24/02/2025]. See the Terms and Conditions (https://onlinelibrary.wiley.com/terms-and-conditions) on Wiley Online Library for rules of use; OA articles are governed by the applicable Creative Commons License

35. Montalván EE, Montalván DM, Urrutia SA, Rodríguez AA,
Sandoval H, Sauceda PO, et al. Survival of gastric cancer in
Western Honduras pilot study: 2002-2012. Rev Méd Hondur.
2017;85:6–10.
36. Pearson CA, Stevens MP, Sanogo K, Bearman GM. Access and bar-
riers to healthcare vary among three neighboring communities in
northern Honduras. Int J Family Med. 2012;2012:298472.
37. Zambrano LI, Fuentes-Barahona IC, Henriquez-Marquez KI,
Vasquez-Bonilla WO, Sierra M, Muñoz-Lara F, et al. COVID-19 and
hurricanes: the impact of natural disasters during a pandemic in
Honduras, Central America. Prehosp Disaster Med. 2021;36:246–8.
38. Kinder F, Mehmood S, Hodgson H, Giannoudis P, Howard A. Barriers
to trauma Care in South and Central America: a systematic review.
Eur J Orthop Surg Traumatol. 2022;32:1163–77.
39. Rodriguez C, Bonilla-Escobar FJ, Restrepo-Lopera C, Markovtsova A,
Medina MT, Puyana JC. A trauma registry experience from the main
referral center of Honduras: A call for action. Injury. 2019;50:883–9.
40. Chenna D, Shastry S, Baliga P. Use of platelet components: an obser-
vational audit at a tertiary care centre. Natl Med J India. 2021;34:
197–200.
41. Jaime-Pérez JC, García-Salas G, Turrubiates-Hernández GA,
Alvarado-Navarro DM, Marfil-Rivera LJ, Gómez-Almaguer D. An
audit of platelet transfusion indications in acute leukaemia patients:
six-year experience at an academic centre. Blood Transfus. 2021;19:
37–44.
42. Gobierno de la Republica de Honduras. Honduras inversiones. Avail-
able from: https://hondurasinversiones.gob.hn/PerfilEntidad?
codEntidad=60. Last accessed 10 Jun 2024.
43. Russell WA, Owusu-Ofori S, Owusu-Ofori A, Micah E, Norman B,
Custer B. Cost-effectiveness and budget impact of whole blood
pathogen reduction in Ghana. Transfusion. 2021;61:3402–12.
44. Grégoire Y, Delage G, Custer B, Rochette S, Renaud C, Lewin A, et al.
Cost-effectiveness of pathogen reduction technology for plasma and
platelets in Québec: a focus on potential emerging pathogens. Trans-
fusion. 2022;62:1208–17.
45. Richard P, Pouchol E, Sandid I, Aoustin L, Lefort C, Chartois AG, et al.
Implementation of amotosalen plus ultraviolet A-mediated pathogen
reduction for all platelet concentrates in France: impact on the risk
of transfusion-transmitted infections. Vox Sang. 2024;119:212–8.
46. Jutzi M, Mansouri Taleghani B, Rueesch M, Amsler L, Buser A.
Nationwide implementation of pathogen inactivation for all platelet
concentrates in Switzerland. Transfus Med Hemother. 2018;45:
151–6.
47. Infanti L, Holbro A, Passweg J, Bolliger D, Tsakiris DA, Merki R, et al.
Clinical impact of amotosalen-ultraviolet A pathogen-inactivated
platelets stored for up to 7 days. Transfusion. 2019;59:3350–61.
48. Iannone A, Cumming M, Osinski A, Brandeburg C, Schultz J, Slider A,
et al. How do we use the National Healthcare Safety Network for
Hemovigilance in Massachusetts? Transfusion. 2024;64:200–9.
49. World Health Organization. Global Health Expenditure Database
domestic general government health expenditure per capita, PPP
(current international $)—Honduras. Available from: https://data.
worldbank.org/. Last accessed 10 Jun 2024.
How to cite this article: Pedraza M, Mejia J, Pitman JP,
Arriaga G. Introduction of 7-day amotosalen/ultraviolet A light
pathogen-reduced platelets in Honduras: Impact on platelet
availability in a lower middle-income country. Vox Sang. 2024;
119:1268–77.
PATHOGEN-REDUCED PLATELETS IN HONDURAS 1277
14230410, 2024, 12, Downloaded from https://onlinelibrary.wiley.com/doi/10.1111/vox.13740 by Cornell University E-Resources & Serials Department, Wiley Online Library on [24/02/2025]. See the Terms and Conditions (https://onlinelibrary.wiley.com/terms-and-conditions) on Wiley Online Library for rules of use; OA articles are governed by the applicable Creative Commons License

ORIGINAL ARTICLE
Evaluation of the progress of a decade-long haemovigilance
programme in India
Akanksha Bisht
1
| Gopal Kumar Patidar
2
| Satyam Arora
3
| Neelam Marwaha
4
1
Haemovigilance Programme of India (HvPI),
National Institute of Biologicals, Ministry of
Health and Family Welfare, Government of
India, Noida, Uttar Pradesh, India
2
Department of Transfusion Medicine, All
India Institute of Medical Sciences, New Delhi,
India
3
Department of Transfusion Medicine, Post
Graduate Institute of Child Health (PGICH),
Noida, Uttar Pradesh, India
4
Department of Transfusion Medicine, Post
Graduate Institute of Medical Education and
Research (PGIMER), Chandigarh, India
Correspondence
Gopal Kumar Patidar, Department of
Transfusion Medicine, All India Institute of
Medical Sciences, New Delhi, India.
Email: drgpatidar@gmail.com
Funding information
The authors received no specific funding for
this work.
Abstract
Background and Objectives: Implementation of national haemovigilance pro-
grammes has significantly improved donor and recipient safety. Recently, India com-
pleted a decade of successful implementation of its national haemovigilance
programmes. The national programme is still enrolling more blood centres. This study
aimed to highlight the strengths and weaknesses of Haemovigilance Programme of
India (HvPI), thereby providing valuable insights for future initiatives.
Materials and Methods: The National Coordinating Centre (NCC) conducted a multi-
centre, cross-sectional questionnaire-based survey among the reporting blood centres
(January to April 2022). The survey consisted of three sections with a total of 27 questions
focusing on the demographics of the participant blood centre as well as the impact on the
recipient and donor haemovigilance. The survey was sent to 733 blood centres regularly
reporting to the donor and recipient HvPI through Donor and Hemovigil Software.
Results: Total 296 responses were received (response rate of 40.4%) with maximum
participation of private non-teaching hospital-based blood centres (33.8%). After
their involvement in recipient HvPI, 85.7% of the respondents reported changes in
their blood centre’s work procedures, with the maximum improvement seen in the
documentation of transfusion reactions (92.7%). Out of the 278 respondents who
participated in donor HvPI, 89.9% (250) found that their blood centre’s policies or
work process changed as a result of their involvement in the programme.
Conclusion: In conclusion, our haemovigilance programme facilitates national collab-
oration for learning and sharing experiences, leading to improved policies and prac-
tices in reducing adverse reactions for both recipients and donors.
Keywords
effectiveness, feedback, haemovigilance, improvement
Highlights
•The implementation of national haemovigilance programmes has notably enhanced donor
and recipient safety, reflecting a decade of successful execution in India.
•A cross-sectional questionnaire-based survey conducted among reporting blood centres
revealed substantial changes in work procedures, particularly in documentation of transfu-
sion reactions, following involvement in the recipient haemovigilance programme.
•The study demonstrates a high percentage of respondents reporting changes in their blood centre’s
policies or work processes due to participation in the haemovigilance programme, highlighting its
effectiveness in driving tangible improvements for both recipients and donors.
Received: 7 May 2024 Revised: 15 September 2024 Accepted: 16 September 2024
DOI: 10.1111/vox.13741
1278 © 2024 International Society of Blood Transfusion. Vox Sanguinis. 2024;119:1278–1284.wileyonlinelibrary.com/journal/vox

INTRODUCTION
Haemovigilance encompasses surveillance procedures that cover the
entire transfusion process, from blood collection to recipient follow-
up, to collect and evaluate information on unexpected or unfavour-
able effects of labile blood products [1]. The ultimate goal of any hae-
movigilance programme is to provide evidence-based guidelines to
prevent adverse reactions in donors or recipients. By analysing hae-
movigilance data, it is possible to understand the cause, frequency
and clinical outcomes of adverse events, leading to changes in poli-
cies, practices and products that enhance donor and recipient safety.
To ensure patient safety and promote public health, a centralized
haemovigilance programme, the Haemovigilance Programme of India
(HvPI), was launched in the country in December 2012 [2]. The pri-
mary goal of HvPI was to develop guidelines and policies aimed at
reducing and preventing adverse transfusion reactions by increasing
awareness and promoting the reporting of these reactions. The
National Blood Donor Vigilance Programme (NBDVP) was also
launched on 14 June 2015 to monitor adverse reactions or incidents
during the blood collection process [3]. Similar to HvPI, NBDVP was
also designed to prevent adverse reactions associated with blood
donation. The National Institute of Biologicals (NIB), Noida, serves as
the National Coordinating Centre (NCC) for both programmes [2].
Currently, both the recipient and donor haemovigilance programmes
have enrolled 1448 blood centres each. NCC has already published
several articles on implementing the national programme and adverse
transfusion and donor reactions [4, 5]. Through national and interna-
tional haemovigilance programmes, various changes have been noted
worldwide, which have helped to enhance donor and recipient safety.
Although haemovigilance programmes have been implemented
for over a decade, not all blood centres in the country have enrolled in
HvPI. To assess the programme’s progress, HvPI designed a survey to
evaluate the impact of its implementation in enrolled blood centres.
The survey was aimed to identify policy changes in participant blood
centres to reduce adverse reactions in donors and recipients, suggest
areas for improving data collection and accuracy and determine the
future course of action based on the survey results.
This study aimed to know whether the programme is achieving its
intended goals such as awareness and acceptability of the programme
and making a positive impact in reducing adverse events and to gather
feedback from participants and stakeholders to identify areas where
the HvPI programme can be improved including understanding the
challenges and target enhancements. Through this comprehensive
assessment, we aimed to highlight both the programme’s strengths
and weaknesses, thereby providing valuable insights for future
initiatives.
MATERIALS AND METHODS
The NCC conducted a multi-centre, cross-sectional survey in India
between January and April 2022 on behalf of HvPI. The survey was
questionnaire-based, consisting of three sections and a total of
27 questions. The first section collected demographic information
from participating sites with eight questions. The second section had
11 questions related to recipient haemovigilance, and the third
section had eight questions related to donor haemovigilance. The sur-
vey was sent to 733 blood centres in India actively participated in the
donor and recipient HvPI and regularly reported the data. The survey
was distributed by NCC through Google form. Participation was vol-
untary, and two reminders were sent to complete the survey. The col-
lected data were anonymized to protect individuals’identification, and
descriptive statistics were applied, expressing variables in numbers
and percentages.
RESULTS
Out of the 733 blood centres surveyed, 296 provided a comprehen-
sive response, with a response rate of 40.4%. The data showed a
notably higher response from private non-teaching (33.8%) and teach-
ing (30.1%) hospital-based blood centres, compared with government
teaching (19.2%) and non-teaching (4.4%) hospital-based blood cen-
tres. Additionally, standalone blood centres accounted for 12.5% of
the responses (Figure 1).
Of the total respondents (n=296), 91.5% (271) participated in
both donor and recipient HvPI, whereas 6.1% [16] were only in recipi-
ent and 2.4% [7] were only in donor HvPI. Maximum participation in
HvPI was reported in the last 3–5 years for both recipient (46.7%) and
donor (47.8%) (Table 1).
The majority of respondents (87.5%) reported that the doctor in-
charge or resident doctors were responsible for data validation for
submission in HvPI, while only 52.7% of them entered the data
directly (Figure 1).
Recipient haemovigilance
Since enrolment, 85.7% of blood centre reported improvements,
whereas 85.1% reported policy changes in their blood centres after
the implementation of recipient HvPI (Tables 2and 3).
We observed that almost 96% of the respondents took various
measures to reduce the time gap between the issue and transfusion
of blood components, with 69.6% of them stopping the bulk issue of
components altogether at a time (Figure 2). For motivating clinicians
to improve reporting of transfusion reactions to blood centres, the
74.1% respondents discussed the issue in hospital transfusion com-
mittees and sent messages to the clinicians (Figure 3).
Donor haemovigilance
Out of the 278 respondents who participated in donor HvPI, 89.9%
(250) found that their blood centre’s policies or work process changed
as a result of their involvement in the programme (Table 4). Around
75.5% respondents found recently published donor haemovigilance
PROGRESS OF HAEMOVIGILANCE PROGRAMME 1279
14230410, 2024, 12, Downloaded from https://onlinelibrary.wiley.com/doi/10.1111/vox.13741 by Cornell University E-Resources & Serials Department, Wiley Online Library on [24/02/2025]. See the Terms and Conditions (https://onlinelibrary.wiley.com/terms-and-conditions) on Wiley Online Library for rules of use; OA articles are governed by the applicable Creative Commons License

data to be beneficial in changing policies at their blood centre, and
96.8% believed that delayed or long-term effects of blood donation
should be studied and included in the donor HvPI (Figure 4). Overall,
respondents provided several suggestions to improve both the recipi-
ent and donor HvPI mentioned in Table S1.
DISCUSSION
Haemovigilance data can improve awareness of adverse reactions and
inform preventative strategies. The programme was initiated in
France in 1994 and has been adopted globally in various forms such
as voluntary or mandatory [6]. In India, a voluntary haemovigilance
programme began in 2012, expanding to include donor-related
adverse reactions in 2015. Almost a decade after the implementation
of HvPI programme, this was the first online survey to assess the
effectiveness of the HvPI programme and gather feedback for future
improvement.
This kind of survey helps in making evidence-based decisions
about the HvPI programme and allocating resources effectively. Sur-
veys enable organizations to compare their programme’s effectiveness
against industry benchmarks or best practices. Sharing survey results
allows for open communication about the programme’s outcomes,
successes and areas in need of attention.
In our survey, only 40.4% of blood centres participated in both
donor and recipient haemovigilance. The low participation rate under-
scores the need for increased awareness and advocacy regarding the
importance of haemovigilance programme among blood centres. Most
of the participation was from private hospital-based blood centres,
which are registered in HvPI as a mandatory requirement for accredi-
tation. In almost 90% of the participants, doctor in-charge or resident
doctors validated adverse reactions, and technical staff were responsi-
ble for data validation and entry. This finding underscores the impor-
tance of doctors in accurately diagnosing and validating adverse
reactions. Doctors’involvement in the validation process ensures that
adverse events are properly identified and classified, allowing for
appropriate management and follow-up measures to be implemented.
Additionally, the involvement of technical staff in data validation and
entry highlights the collaborative nature of haemovigilance efforts,
where interdisciplinary teams work together to ensure the reliability
and quality of data collected.
We have observed various improvements in recipient haemovigi-
lance in participating blood centres after enrolment in HvPI. Blood
centres conveyed the importance of reporting adverse transfusion
reactions, which can help in developing transfusion policies, documen-
tation and investigation of reactions [7,8]. Approximately 85% of
respondents reported significant changes in the policies and proce-
dures of their blood centres. Respondents implemented active haemo-
vigilance at their workplaces, resulting in increased reporting of
adverse reactions, reduced near-miss errors and improved patient
safety. To increase reporting of adverse reactions, institutions should
raise awareness, use HTC assistance and designate existing nurses as
specialized haemovigilance nurses to oversee every transfusion and
upload adverse reaction data to the NCC regularly [9].
87.5%
0.7%
10.1%
0.7 1%
52.7%
2.4%
33.4%
4.1% 7.4%
0.00%
10.00%
20.00%
30.00%
40.00%
50.00%
60.00%
70.00%
80.00%
90.00%
100.00%
Doctor
inchar
g
e/resident
Nurse Technician Counsellor Data entry
o
p
erator
Data Validation Data entry
FIGURE 1 Responsibility for validation and entry of haemovigilance data.
TABLE 1 Years of participation in recipient and donor haemovigilance.
S. no. Number of years Recipient haemovigilance (n=289) Donor haemovigilance (n=278)
1. 0–2 74 (25.6%) 98 (35.3%)
2. 3–5 135 (46.7%) 133 (47.8%)
3. 6–10 80 (27.7%) 47 (16.9%)
1280 BISHT ET AL.
14230410, 2024, 12, Downloaded from https://onlinelibrary.wiley.com/doi/10.1111/vox.13741 by Cornell University E-Resources & Serials Department, Wiley Online Library on [24/02/2025]. See the Terms and Conditions (https://onlinelibrary.wiley.com/terms-and-conditions) on Wiley Online Library for rules of use; OA articles are governed by the applicable Creative Commons License

We have also observed that blood centres took appropriate steps
to reduce the adverse reactions. Numerous haemovigilance pro-
grammes on a global scale have already recommended avoiding the
utilization of plasma multiparous women to prevent transfusion-
related acute lung injury (TRALI) [10]. Nearly half of respondents
stopped using multiparous female plasma for transfusion. Almost 30%
of respondents adopted a restrictive transfusion strategy to prevent
transfusion-associated circulatory overload (TACO), as a previous
study has shown that restrictive transfusion policies lead to
comparable clinical outcomes when compared with liberal policies,
with the added benefit of causing less volume overload in
recipients [11].
TABLE 2 Improvement observed and policy changes by
respondents after establishment of recipient HvPI.
Improvements
observed (n=289) Policy changes (n=248)
Better documentation of a
transfusion reaction (n=230)
(79.6%)
Enhance the donor medical
screening programme (n=175)
(70.6%)
Increased awareness and
assistance through Hospital
Transfusion Committee
(n=156) (54%)
Enhance donor arm disinfection
(n=132) (53.2%)
Implementation of active
haemovigilance programme
(n=143) (49.5%)
Improve the cleanliness of blood
and blood component storage
areas (n=83) (33.5%)
Improve technical resources and
facilities for transfusion reaction
workup (n=125) (43.3%)
Improve technical resources and
facilities for transfusion reaction
workup (n=125) (50.4%)
Increased reporting of adverse
transfusion reactions (n=124)
(42.9%)
Blood component quality check is
performed on a regular basis
(n=116) (46.8%)
Reduction in near miss errors
(n=88) (30.5%)
Establishment of a bacterial
screening facility for blood
components (n=74) (29.8%)
Modifications in blood and
blood components for
prevention of adverse
transfusion reaction (n=77)
(26.6%)
100% donor antibody screening
(n=81) (32.7%)
Reduction of ABO incompatible
transfusion reaction (n=58)
(20.1%)
100% antibody screening testing
on patients (n=66) (26.6%)
Reduction of septic transfusion
reactions (n=46) (15.9%)
From manual cross-matching to
automated cross-matching
(n=57) (23%)
Recruitment/designation of
specialized haemovigilance
nurse (n=27) (9.3%)
Others (quality assurance
department and director BTS,
implement blood safety officer
post,improvement in donor
vigilance,most of practices
already in place and training of
hospital staff on ATR)(n=5)
(1.7%)
Others (better documentation,
practices /policies already in place,
revised transfusion reaction forms,
increased awareness,temperature
and times monitoring, etc.) (n=27)
(10.9%)
Abbreviations: ATR, adverse transfusion reactions; BTS, blood transfusion
services; HvPI, Haemovigilance Programme of India.
TABLE 3 Steps taken for the prevention of adverse transfusion
reactions after implementation of recipient HvPI.
S.
no Steps taken
Participant
responses
A. Prevention of pulmonary complications (n=289)
1. Refrain from utilizing multiparous female
plasma for transfusions
138 (47.8%)
2. Restrictive transfusion policy for high-risk
patients
83 (28.7%)
3. Advice diuretics for high-risk patients 40 (13.8%)
4. Start using paediatric bag aliquots for small
volume patients
63 (21.8%)
5. Others (use of inline filter, use of PAS, plasma
reduction in apheresis platelets)
22 (7.6%)
6. None of the above 78 (29.9%)
B. Prevention of febrile complications (n=289)
1. Start using leukoreduced blood components 130 (45%)
2. Advise premeditations to high-risk patients 81 (28%)
3. Start bacterial screening facility for monthly
quality control
108 (37.4%)
4. Increase frequency in cleaning of the blood
storage area
120 (41.5%)
5. Others (improve documentation, pre-
transfusion vital check, education of staff)
20 (6.9%)
6. None of the above 53 (18.3%)
C. Prevention of haemolytic transfusion reaction (n=289)
1. Start donor antibody screening facility 113 (39.1%)
2. Start patient antibody screening facility 94 (32.5%)
3. More vigilance for near miss events 141 (48.8%)
4. Improve donor and patient identification
system
161 (55.7%)
5. Clinicians are being trained to prevent
incorrect storage, warming or transfusion of
blood components, which can result in non-
immune haemolysis
159 (55%)
6. Improve bedside transfusion practices 155 (53.6%)
7. Others (implementation of RFID system,
barcode-labelled boxes, buffycoat removal)
14 (4.8%)
8. None of the above 29 (10%)
D. Prevention of the allergic or anaphylactic reactions (n=289)
1. Advise premedication for high-risk patients 185 (64%)
2. Issue of washed red cells or platelet
components
59 (20.4%)
3. Advise to use plasma alternatives in large
volume transfusion
93 (32.2%)
4. Others (PAS in SDAP, close monitoring of
transfusion)
24 (8.3%)
5. None of the above 12 (4.2%)
Abbreviations: HvPI, Haemovigilance Programme of India; PAS, platelet
additive solution; RFID, radiofrequency identifications; SDAP, single-
donor apheresis platelets.
PROGRESS OF HAEMOVIGILANCE PROGRAMME 1281
14230410, 2024, 12, Downloaded from https://onlinelibrary.wiley.com/doi/10.1111/vox.13741 by Cornell University E-Resources & Serials Department, Wiley Online Library on [24/02/2025]. See the Terms and Conditions (https://onlinelibrary.wiley.com/terms-and-conditions) on Wiley Online Library for rules of use; OA articles are governed by the applicable Creative Commons License

Our study found that the implementation of HvPI led to improved
identification systems, increased vigilance for near-miss errors, enhanced
immune-haematological practices and reduced non-immune causes for
the prevention of haemolytic transfusion reactions. Blood centres
achieved this using manual or automated identification methods, pre-
transfusion antibody screening, staff education on proper storage and
warming of blood components and safe transfusion practices.
Allergic or anaphylactic reactions arise from allergens, specifically
protein contents in the blood or blood components, that the recipient
is allergic to [12]. On the findings of previous HvPI reports, 64% blood
centres advised recipients to be pre-medicated to prevent allergic or
anaphylactic reactions caused by protein contents in the blood and
blood components. Additionally, 8.3% employ modern solutions such
as plasma additive solutions.
Encouraging clinicians to report adverse reactions to the blood
centre is the most critical aspect of haemovigilance programme imple-
mentation and administration [13]. In our study, we found that blood
centres used tailored approaches such as organizing continous
medical education (CME), one-on-one conversations, discussions
in hospital transfusion committees, preparing guidance docu-
ments, recruiting haemovigilance nurses and actively monitoring
each transfusion.
Several valuable suggestions were made by participants for
improving the country’s haemovigilance programme in the future.
These included continuing education or certificate courses for clini-
cians and blood centre personnel, recruitment of a haemovigilance
nurse and initiate an active haemovigilance programme. Some
responders suggested mandating adverse reaction reporting in HvPI
and implementing additional programmes for reporting stem cell
donation adverse reactions and haemovigilance in blood storage cen-
tres and district-level hospitals. Others suggested defining adverse
reactions objectively and collecting data online for cross-comparison
between different blood centres.
We have also observed various appropriate improvements in
blood centres to reduce the adverse reactions in blood donor. Adverse
reactions in donors discourage future giving, especially among young
69.60%
35.30%
10.00%
5.90% 3.10%
Stopped bulk
issuing
Started using
tracking system
Started blood
storage near to
critical user area
such as OTs or ICUs.
Others* None
FIGURE 2 Steps taken to reduce the time gap between the issue and transfusion of blood component. *Others: Practice already in place,
clinician education, random clinical audits training of staff. ICUs, intensive care units; OTs, operation theatres.
43.60%
54.30%
74.10%
36.70%
8.70%
44.30%
1.40%
3.80%
0.00% 10.00% 20.00% 30.00% 40.00% 50.00% 60.00% 70.00% 80.00%
Continuous medical educations
One-to-one conversation
Discussion in Hospital Transfusion Committee
Preparation of guidance document
Recruitment of haemovigilance nurse
Active haemovigilance
Others*
None
Participant responses
FIGURE 3 Measures taken for motivation of the clinicians to improve reporting of adverse reactions. *Others: arranging lectures, formation
of hospital haemovigilance committee and mandatory fill-up of transfusion reaction form.
1282 BISHT ET AL.
14230410, 2024, 12, Downloaded from https://onlinelibrary.wiley.com/doi/10.1111/vox.13741 by Cornell University E-Resources & Serials Department, Wiley Online Library on [24/02/2025]. See the Terms and Conditions (https://onlinelibrary.wiley.com/terms-and-conditions) on Wiley Online Library for rules of use; OA articles are governed by the applicable Creative Commons License

and first-time donors [14]. Almost 90% of respondents reported pol-
icy changes from their participation in the NBDVP. Strategies to
reduce adverse reactions include strict medical questionnaires, donor
centre improvements, prevention techniques and better after-
care [15]. Blood centres also offer extra care for donors with past
reactions and expanded staff training.
Almost 75% of respondents used NBDVP statistics to change
protocols and reduce donor adverse reactions. Regular publishing of
haemovigilance data is critical for exchanging ideas and experiences.
Almost 97% of respondents want an investigation into the delayed or
long-term effects of blood donation. One-third initiated post-donation
follow-up to track delayed reactions, and 80% are aware of donor
adverse reaction severity grading tools. Respondents suggested
improving the NBDVP by focusing on apheresis, disseminating guide-
lines based on data, implementing a severity grading tool and improv-
ing reporting forms and CME for participating centres.
Haemovigilance has shown significant improvements over time,
revealing gaps in understanding of transfusion-related adverse events
and prompting enhanced donor health selection and screening proto-
cols [16,17]. Data from our study suggested priority topics for future
research and emphasized the importance of rigorous clinical
decision-making to achieve the best outcomes for patients. Based on
the suggestions by participants. we will plan to increase the clinician’s
awareness by CME or personal interventions. We will also plan to
increase international collaboration for universalising the adverse reac-
tions definitions and imputability criteria. We will also increase the
enrolment of the blood centres in HvPI, by creating more awareness
and trying to make it mandatory with the regulatory interventions.
Our study had limitations that may have affected the generaliz-
ability of our findings. Email as a distribution method and unclear qual-
ifications of respondents may have influenced the results. Subjective
bias due to complex phrasing, as well as selection, recall and desirabil-
ity bias, may have also played a role. Additionally, incomplete
responses from some respondents resulted in varying denominators
for different calculations. Although many centres were enrolled, only
733 were actively reporting to the nodal centre at the time of the
study. Therefore, the survey was sent only to these actively partici-
pating members. Although the programme was implemented a decade
ago, initial participation was limited due to a lack of awareness. As
most participants joined during these recent years, this may slightly
skew the results, leading to a one-sided distribution curve.
TABLE 4 Measures taken by respondents for reduction of donor
adverse reactions after implementation of NBDVP.
S.
no. Changes
Participant
responses
(n=250)
1. More stringent donor medical
questionnaire
170 (68%)
2. Make the blood donation centre
environment more pleasant for donors
160 (64%)
3. Donor anxiety reduction measures, that is,
multimedia visuals measure, appointment
of counsellor for bedside counselling of
donor etc.
141 (56.4%)
4. Implementation of prevention strategies
such as pre-donation water intake, applied
muscle tension or both
163 (65.2%)
5. Special care to donors who had already
history of adverse reaction in previous
donation
171 (68.4%)
6. Increased and regular training of the staff
for phlebotomy techniques
169 (67.6%)
7. Improve post-donation care and vigilance
for at least up to 30 min from donation
157 (62.8%)
8. Early identification and management of
first reaction to prevent secondary
reaction or injury
139 (55.6%)
9. None 3 (1.2%)
10. Others
a
5 (2%)
Abbreviation: NBDVP, National Blood Donor Vigilance Programme.
a
Others: Already in practice.
75.53%
96.76%
33.81%
79.13%
24.48%
3.24%
32.37%
20.86%
33.81%
0% 20% 40% 60% 80% 100% 120%
Did you nd the recently published
national donor haemovigilance data
benecial in changing any policies at
your blood centre?
Do you believe that the delayed or
long-term effects of blood donation
should be studied and included in the
Donor Vigilance programme?
After implementing a donor haemovigilance
programme in your institution, did you begin
post-donation follow-up with blood donors to
monitor for delayed adverse reactions?
Are you aware with donor adverse
reaction severity grading tools?
Yes No Not a
pp
licable
FIGURE 4 Various responses.
PROGRESS OF HAEMOVIGILANCE PROGRAMME 1283
14230410, 2024, 12, Downloaded from https://onlinelibrary.wiley.com/doi/10.1111/vox.13741 by Cornell University E-Resources & Serials Department, Wiley Online Library on [24/02/2025]. See the Terms and Conditions (https://onlinelibrary.wiley.com/terms-and-conditions) on Wiley Online Library for rules of use; OA articles are governed by the applicable Creative Commons License

In conclusion, our haemovigilance programme facilitates national
collaboration for learning and sharing experiences, leading to
improved policies and practices in reducing adverse reactions for both
recipients and donors. Survey findings indicate about blood centres
efforts to improve awareness and reporting of transfusion-related
reactions among clinicians. Respondents suggest mandatory haemovi-
gilance programme, certificate courses and inclusion of missing fields
like delayed reactions. Blood centres aim to raise awareness among
clinicians and recruit haemovigilance nurses. Hence evaluation of our
national haemovigilance programme and reporting centres feedback
has made a positive impact both in the blood centres and future
expansion policy at the national level.
ACKNOWLEDGEMENTS
We would like to acknowledge to all the blood centres of the country
who have participated in this survey.
N.M. conceptualized the study; A.B. distributed the survey ques-
tionnaires to blood centres; G.K.P. and S.A. analysed the data;
G.K.P. drafted the initial manuscript; and all authors contributed to
reviewing and finalizing the manuscript.
CONFLICT OF INTEREST STATEMENT
The authors declare no conflicts of interest.
DATA AVAILABILITY STATEMENT
The data for this study are held by the corresponding author and can
be made available upon request. If deemed necessary, the data will be
submitted to the journal for review.
ORCID
Gopal Kumar Patidar https://orcid.org/0000-0001-9681-3898
Satyam Arora https://orcid.org/0000-0002-9048-5624
REFERENCES
1. De Vries RR, Faber JC, Strengers PF, Board of the International Hae-
movigilance Network. Haemovigilance: an effective tool for improv-
ing transfusion practice. Vox Sang. 2011;100:60–7.
2. Bisht A, Marwaha N, Kaur R, Gupta D, Singh S. Haemovigilance Pro-
gramme of India: analysis of transfusion reactions reported from
January 2013 to April 2016 and key recommendations for blood
safety. Asian J Transfus Sci. 2018;12:1–7.
3. Bisht A, Singh S, Marwaha N. National Blood Donor Vigilance Pro-
gramme: India. Asian J Transfus Sci. 2016;10:1–2.
4. Bisht A, Marwaha N, Kaur R, Gupta D, Chhabra R. Haemovigilance Pro-
gramme of India: comparative analysis of transfusion reactions reported
over a 5-year period through two reporting formats and key recommen-
dations for blood safety. Asian J Transfus Sci. 2020;14:103–16.
5. Bisht A, Marwaha N, Arora S, Patidar GK, Chhabra R. National Blood
Donor Vigilance Programme of India: analysis of donor adverse reac-
tions reported during initial 2 years of implementation (2016 and
2017). Asian J Transfus Sci. 2021;15:1–11.
6. Renaudier P, The French Haemovigilance Network: From the blood
scandal to epidemiologic survillance of the transfusion chain. In:
Vries RRP & Faber JC, editors. Hemovigilance: An effective Tools for
Improving Transfusion Safety. Chichester, West Sussex, UK: John
Wiley and Sons, Ltd; 2012. p. 147–158.
7. Bust L. Importance of documentation in GMP. ISBT Sci Ser. 2013;8:
16–8.
8. Jain A, Kaur R. Hemovigilance and blood safety. Asian J Transfus Sci.
2012;6:137–8.
9. Dhiman Y, Raturi M, Kala M, Kusum A. Significance of mandating a
dedicated hemovigilance nurse and objectification of ‘imputability’
levels. Experience from a hospital-based blood centre in India. Trans-
fus Clin Biol. 2023;30:96–102.
10. Kuldanek SA, Kelher M, Silliman CC. Risk factors, management, and
prevention of transfusion-related acute lung injury: a comprehensive
update. Expert Rev Hematol. 2019;12:773–85.
11. Roubinian NH, Hendrickson JE, Triulzi DJ, Gottschall JL,
Michalkiewicz M, Chowdhury D, et al. Transfusion-associated circu-
latory overload: current risk factors and outcomes. Crit Care Med.
2018;46:577–85.
12. Hirayama F. Current understanding of allergic transfusion reactions:
incidence, pathogenesis, laboratory tests, prevention, and treatment.
Br J Haematol. 2013;160:434–44.
13. Patidar GK, Kaur D. Audit and education: roles in safe transfusion
practise. Asian J Transfus Sci. 2018;12:141–5.
14. Wong HK, Chu CCY, Lau CW, Leung JNS, Lee IYM, Lee CK. Vasova-
gal reaction in blood donors: prediction and its impact on donor
return. ISBT Sci Ser. 2018;13:421–8.
15. Fisher SA, Allen D, Dorée C, Naylor J, Di Angelantonio E,
Roberts DJ. Interventions to minimise vasovagal reactions in blood
donors: a systematic review and meta-analysis. Transfus Med.
2016;26:15–33.
16. Faber JC, Nascimento F. Achievements through hemovigilance. In:
De Vries RRP, Faber JC, editors. Hemovigilance: an effective tool for
improving transfusion safety. Chichester: John Wiley and Sons, Ltd.;
2012. p. 281–304.
17. Steinsvåg CT, Espinosa A, Flesland Ø. Eight years with haemovigi-
lance in Norway. What have we learnt? Transfus Apher Sci. 2013;49:
548–52.
SUPPORTING INFORMATION
Additional supporting information can be found online in the Support-
ing Information section at the end of this article.
How to cite this article: Bisht A, Patidar GK, Arora S,
Marwaha N. Evaluation of the progress of a decade-long
haemovigilance programme in India. Vox Sang. 2024;119:
1278–84.
1284 BISHT ET AL.
14230410, 2024, 12, Downloaded from https://onlinelibrary.wiley.com/doi/10.1111/vox.13741 by Cornell University E-Resources & Serials Department, Wiley Online Library on [24/02/2025]. See the Terms and Conditions (https://onlinelibrary.wiley.com/terms-and-conditions) on Wiley Online Library for rules of use; OA articles are governed by the applicable Creative Commons License

ORIGINAL ARTICLE
Autoantibodies to ADAMTS13 in human immunodeficiency
virus-associated thrombotic thrombocytopenic purpura
Muriel Meiring
1,2
| Mmakgabu Khemisi
1,2
| Susan Louw
2,3
|
Palanisamy Krishnan
1
1
Department of Haematology and Cell Biology, Faculty of Health Sciences, University of the Free State, Bloemfontein, South Africa
2
Universitas Business Unit, National Health Laboratory Service, Bloemfontein, South Africa
3
Department of Molecular Medicine and Haematology, University of the Witwatersrand, Johannesburg, South Africa
Correspondence
Muriel Meiring, Department of Haematology
and Cell Biology, Faculty: Health Sciences, PO
Box 339, Bloemfontein 9300, South Africa.
Email: meiringsm@ufs.ac.za
Funding information
National Research Foundation, Grant/Award
Number: SRUG210217586912
Abstract
Background and Objectives: Thrombotic thrombocytopenic purpura (TTP) is a
potentially fatal thrombotic microangiopathic disorder that can result from human
immunodeficiency virus (HIV) infection. The pathogenesis involves a deficiency of
the von Willebrand factor (vWF) cleaving protease ADAMTS13 (a disintegrin and
metalloprotease with thrombospondin motifs member 13) and the presence of anti-
ADAMTS13 autoantibodies. However, there is insufficient information regarding the
epitope specificity and reactivity of these autoantibodies. This study aimed to per-
form epitope-mapping analysis to provide novel insights into the specific epitopes on
ADAMTS13 domains affected by autoantibodies.
Materials and Methods: The study analysed 59 frozen citrate plasma samples from
HIV-associated TTP patients in South Africa, measuring ADAMTS13 activity using
Technozyme
®
ADAMTS13 activity test, total immunoglobulin (Ig) M and IgA anti-
bodies levels using ELISA kit and purifying IgG antibodies using NAb™Protein G spin
columns. A synthetic ADAMTS13 peptide library was used for epitope mapping.
Results: Overall, 90% of samples showed anti-ADAMTS13 IgG autoantibodies, with
64% of these antibodies being inhibitory, as revealed by mixing studies. Samples with
ADAMTS13 antigen levels below 5% showed high anti-ADAMTS13 IgG autoanti-
body titres (≥50 IU/mL), whereas those with 5%–10% levels had low autoantibody
titres (<50 IU/mL).The metalloprotease, cysteine-rich and spacer domains were
100% involved in binding anti-ADAMTS13 IgG antibodies, with 58% of samples con-
taining antibodies binding to the C-terminal part of the ADAMTS13 disintegrin-like
domain, indicating different pathogenic mechanisms.
Conclusion: The metalloprotease, cysteine-rich and spacer domains are the primary
targets for anti-ADAMTS13 IgG autoantibodies in patients with HIV-associated TTP.
These findings suggest potential effects on the proteolytic activity of ADAMTS13,
highlighting the complex nature of the pathogenic mechanisms involved.
Received: 19 February 2024 Revised: 13 August 2024 Accepted: 4 September 2024
DOI: 10.1111/vox.13738
This is an open access article under the terms of the Creative Commons Attribution License, which permits use, distribution and reproduction in any medium,
provided the original work is properly cited.
© 2024 The Author(s). Vox Sanguinis published by John Wiley & Sons Ltd on behalf of International Society of Blood Transfusion.
Vox Sanguinis. 2024;119:1285–1294. wileyonlinelibrary.com/journal/vox 1285

Keywords
ADAMTS13, autoantibodies, HIV, thrombotic thrombocytopenic purpura
Highlights
•The metalloprotease, cysteine-rich and spacer domains of ADAMTS13 (a disintegrin and
metalloprotease with thrombospondin motifs member 13) were constantly (100%) involved
in binding anti-ADAMTS13 immunoglobulin (Ig) G antibodies in human immunodeficiency
virus (HIV)-associated thrombotic thrombocytopenic purpura (TTP).
•All HIV-associated TTP patients showed IgG autoantibody binding to amino acid residues
645–684 from the spacer domain, suggesting an epitope area with the amino acid sequence
‘QEDADIQVYRRYGEEYGNLTRPDITFTYFQ’at positions 650–669.
•Anti-ADAMTS13 IgG antibodies were found in 90% of patients with HIV-associated TTP
(53/59), whereas anti-ADAMTS13 IgM antibodies were found in 30% of HIV-associated TTP
patients and 64% contained anti-ADAMTS13 IgA antibodies.
INTRODUCTION
Thrombotic thrombocytopenic purpura (TTP), a rare but severe
haematologic disease, is a member of a closely related group of dis-
orders, thrombotic microangiopathies (TMA). TMA is a group of dis-
ease that has microangiopathic haemolytic anaemia and
thrombocytopenia due to the formation of microvascular platelet
rich thrombi, which causes ischaemic organ dysfunction such as
reduction in kidney function and neurological symptoms. TTP is a
prevalent systemic TTP that significantly affects the central ner-
vous system and kidneys, although to a lesser extent [1]. Recent
investigations reveal that one of the major abnormalities in chronic
relapsing TTP is the absence function of a metalloproteinase
enzyme, ADAMTS13 (a disintegrin and metalloprotease with
thrombospondin motifs member 13). This enzyme controls the gen-
eration of specific large forms of von Willebrand factor (vWF)
known as ultra-large vWF multimers (UL-vWF), which interacts
with platelets for haemostasis. Defects or deficiencies (<10%) of
ADAMTS13 leads to the accumulation of UL-vWF multimers in the
circulation, eventually forming vWF-platelet-rich thrombi under
high shear stress conditions manifesting phenotypically as TTP
[2–5]. Autoantibodies to ADAMTS13 can either inhibit or increase
the protease’s clearance from the circulation, binding to various
protease domains, with the cys-rich/spacer domain being consis-
tently active. A study on patients with acquired TTP found anti-
spacer autoantibodies target three hotspot areas [6–8].
The characteristically described forms of TTP are rare but a
similar condition is now frequently observed in patients infected
with the human immunodeficiency virus (HIV) in Sub-Saharan
Africa since the 1980s, the country with the highest HIV infection
incidence and also high HIV-associated with TTP [9, 10]. Recurrent
episodes have been identified in HIV-related TTP at a rate of up to
60% and a mortality rate of between 10% and 30%, which is high,
compared with non-HIV TTP patients. These high mortality rates
can be explained by situations such as diagnostic uncontrollable,
inability to identify patients at risk and inadequate resources.
Hence, diagnostic and prognostic biomarkers need to be estab-
lished in HIV-associated TTP [11, 12]. TTP is seen in acquired
immunodeficiency syndrome patients with a low helper T cells
(CD4+) count (<200 cells/μL) and high viral loads, and the inci-
dence of HIV-associated TTP was expected to decline with wide-
spread access to anti-retroviral therapy (ART). However, cases of
TTP in HIV infection are still prevalent in South Africa, despite
increased access to ART [13–15]. Recently, TTP is being observed
even in HIV infected patients with viral loads below the detectable
limit on ART, but the exact primary pathogenesis is not clear
[16, 17]. The transmission of HIV-associated TTP is prospective
linked to various mechanisms related to the viral infection. The
HIV endothelial cell dysfunction has been considered as important
in the pathogenesis of HIV-associated TTP. Although some studies
suggested that endothelial dysfunction may not be the primary
cause of TTP, rather that vascular agitation may be the conse-
quence of TTP. The autoimmune dysfunction with autoantibody
production and abnormal T-cell responses may contribute signifi-
cantly to the reduction of ADAMTS13 in HIV-associated TTP. HIV
infection with a low CD4+lymphocyte count and a high viral load
are associated with an increased incidence of ADAMTS13 autoan-
tibodies [18, 19]. Furthermore, the presence of ADAMTS13 auto-
antibodies may contribute to severe ADAMTS13 deficiency and
trigger HIV-associated TTP. Several studies have confirmed the
importance of autoantibodies to ADAMTS13 in the pathogenesis
of HIV-associated TTP. In some HIV-associated TTP cases,
acquired ADAMTS13 deficiency may occur in the absence of
detectable autoantibodies/ autoantibodies that inhibit
ADAMTS13 [20]. Even though many reports are discussed in auto-
antibodies to ADAMTS13 in HIV-associated TTP as well as in HIV
infected people without TTP, but the binding specificity of these
autoantibodies however remains unknown. The detection of
ADAMTS13 autoantibodies and defining their epitopes on the
ADAMTS13proteininHIV-associatedTTPpatientsmaybeofclin-
ical value with disease prognostication and treatment efficacy
assessment.
1286 MEIRING ET AL.
14230410, 2024, 12, Downloaded from https://onlinelibrary.wiley.com/doi/10.1111/vox.13738 by Cornell University E-Resources & Serials Department, Wiley Online Library on [24/02/2025]. See the Terms and Conditions (https://onlinelibrary.wiley.com/terms-and-conditions) on Wiley Online Library for rules of use; OA articles are governed by the applicable Creative Commons License

METHODS AND MATERIALS
HIV-associated TTP plasma samples
A study in South Africa examined 59 frozen, anonymized citrate
plasma samples from HIV-associated TTP patients. The samples were
collected from across the country and sent to the Specialized Hae-
mostasis laboratory at the University of the Free State. The samples
were collected before treatment, and it is stored at 80C for at least
a year for further research. The study received ethical approval from
the University of the Free State’s Health Science reserach Ethics
Committee (UFS-HSD2019/0027/3007). The study involved National
Health Laboratory Service samples, identified by unique laboratory
numbers, de-identified using a double-blind technique and given ran-
dom research numbers. The research was conducted with permission
from the Free State Department of Health Provincial Research Com-
mittee and blood samples from the National Health Laboratory Ser-
vice (FS-201903-005).
Mixing study
The study aimed to identify neutralizing immunoglobulin (Ig) G auto-
antibodies to ADAMTS13 in HIV-associated TTP plasma samples with
ADAMTS13 activity levels below 10%. The Technozyme
®
ADAMTS13 activity test was used to measure ADAMTS13 activity in
samples and pooled normal plasma (PNP). The results showed normal
ADAMTS13 activity levels in PNP, ranging from 50% to 150%. How-
ever, no correction was shown in the mixing test, indicating the pres-
ence of an inhibitor, resulting in less than 50% ADAMTS13 activity.
The Bethesda technique was used to measure the potency of
neutralizing anti-ADAMTS13 antibodies. A Bethesda unit (BU) is the
concentration of an inhibitor in plasma that reduces ADAMTS13
activity by 50% in PNP. Residual activity of 25%–75% indicates an
inhibitor, whereas over 75% activity indicates the absence of a clini-
cally significant inhibitor. The strength of neutralizing anti-
ADAMTS13 antibodies was evaluated using a modified Bethesda
test [21].
The study utilized HIV-associated TTP plasma samples treated at
56C for an hour to remove endogenous ADAMTS13 activity. Sam-
ples with strong inhibitors were diluted with saline and PNP and incu-
bated at 25C for 2 h; PNP served as a negative control. ADAMTS13
activity was measured using the Technozyme
®
ADAMTS13 activity
assay.
Total IgM and IgA antibodies
The study examined IgM and IgA antibodies in samples with a positive
titre of anti-ADAMTS13 IgG antibodies. Total plasma Ig levels were
measured using a commercially available ELISA kit from Bethyl Labo-
ratories. The test was conducted in two separate studies using ELISA
96-well plates pre-coated with either IgM or IgA anti-human
antibodies. The standard and samples was diluted using dilution buffer
according to the manufacturer’s instructions. The study involved
duplicate wells with standard and sample solutions, incubating them
at room temperature for an hour, washing them four times with wash
buffer, adding anti-human IgM/IgA detection antibody, incubating for
1 h, adding horseradish peroxidase (HRP) solution and adding tetra-
methylbenzidine substrate solution. The reaction was stopped with
adding stop solution, and the absorbance was measured at 450 nm
using a microplate reader. The manufacturer estimated IgM and IgA
concentrations in samples using an extrapolated standard curve, with
representative reference ranges for healthy individuals for IgA is 1.1–
2.6 mg/mL and for IgM is 0.23–1.4 mg/mL in sodium citrate
plasma [6].
Extraction of IgG autoantibodies
The study purified total IgG antibodies from 53 HIV-associated TTP
plasma samples using NAb™Protein G spin columns. Positive
anti-ADAMTS13 IgG antibody titres were used for analysis. Protein
content and purity of eluted IgG fractions were measured using a Bio-
Drop spectrophotometer. Fractions with an absorbance ratio of less
than 0.6 showed no nucleic acid contamination. The purified anti-
bodies were dialyzed in phosphate buffered saline (PBS) to eliminate
low molecular weight compounds and salt contamination. The eluted
pure IgG protein was pooled and stored at 4C. The absorbance of
the samples were measured at 260/280.
Epitope mapping studies of anti-ADAMTS13 IgG
antibodies
Synthetic peptides
GenScript™has developed a synthetic peptide library from the
ADAMTS13 protein, containing 105 biotinylated peptides. The library
was screened for linear B-cell epitopes using an ELISA-based method.
The peptide library includes domains influencing ADAMTS13 function
and vWF binding under static conditions. The N terminus of the syn-
thesized peptides was biotinylated. To minimize costs, the library
included domains that significantly contribute to ADAMTS13 function
and vWF binding under static conditions. The peptides were designed
in a 20-mer/15-mer overlapping format with an offset of 5 amino
acids (Figure 1). The peptides were extracted as a lyophilized powder
with over 75% purity and stored at 20C. Peptide names were
derived from domain names, and the amino acid locations were com-
pared to the full-length ADAMTS13 protein coding region (Table 1).
Developing a peptide ELISA
A peptide ELISA was developed using artificial peptides from a library
and a monoclonal antibody specific to the Fc-region of the
ADAMTS13 AUTOANTIBODIES IN HIV–TTP 1287
14230410, 2024, 12, Downloaded from https://onlinelibrary.wiley.com/doi/10.1111/vox.13738 by Cornell University E-Resources & Serials Department, Wiley Online Library on [24/02/2025]. See the Terms and Conditions (https://onlinelibrary.wiley.com/terms-and-conditions) on Wiley Online Library for rules of use; OA articles are governed by the applicable Creative Commons License

anti-human IgG antibody. Overall, 53 HIV-associated TTP plasma
samples were used to generate purified ADAMTS13 IgG autoanti-
bodies, which were used to identify potential epitope sites.
Peptide ELISA
Epitope mapping studies were conducted on 105 overlapping biotiny-
lated peptides in a peptide library to monitor binding events in each
patient’s purified IgG sample using Peptide ELISA, with all synthetic
peptides tested individually, with a purity of over 75%.
A 96-well ELISA plate first pre-coated with 100 μL/well of strep-
tavidin (200 ng/mL, GenScript
®
, USA) was diluted in PBS buffer and
incubated overnight at 4C, and the plates were washed four times
using washing buffer (PBS/0.05% Tween-20 [pH 7.4]). After washing,
the plates were blocked with 200 μL/well of blocking buffer for 2 h at
37C. After incubation, the plates were washed again and 100 μL/well
of each diluted peptide was added to the precoated plate and incu-
bated at 37C for 2 h. After incubation, the plates were washed. Then
the plates were blocked again with 200 μL/well of blocking buffer for
2 h at 37C. Following another washing step, 100 μL/well of the puri-
fied IgG antibody from each patient was diluted in duplicate to each
plate. The plates were incubated for 1 h at 37C and then washed
again. Then, 100 μL/well of an HRP-conjugated monoclonal anti-
human IgG antibody (Abcam
®
) was added for detection. The plates
were incubated for 1 h at room temperature, followed by another
wash. Finally, 100 μL/well of the O-phenylenediamine dihydrochlor-
ide substrate was added and incubated for 10 min at room tempera-
ture; thereafter 30 μL/well stop solution (4 M H
2
SO
4
) was added to
stop the reaction, and the absorbance was measured at 490–630 nm.
The study involved subtracting the mean optical density at
490 nm (OD
490
) value of two blanks from all other OD
490
values, with
FIGURE 1 Overlapping linear peptide sequences from the metalloprotease domain 75–150. The designed peptides are 20 amino acids long
with 15 overlapping amino acids and an offset of 5 amino acids.
TABLE 1 The ADAMTS13 domain groupings selected for
designing a peptide library.
Domain grouping
Position in
ADAMTS13
amino acid
sequence Structure–function
Metalloprotease–
disintegrin
domains
75–383 Catalytic domains.
Cysteine-rich
spacer domains
440–680 Critical role in substrate
recognition and binding,
promoting proteolysis of
vWF by ADAMTS13
Abbreviations: ADAMTS, a disintegrin and metalloprotease with
thrombospondin motifs member 13; vWF, von Willebrand factor.
TABLE 2 Laboratory inclusion criteria for HIV-associated TTP
diagnosis.
Laboratory test (units)
Laboratory findings
Normal
values/
ranges HIV–TTP patients
Full blood count
Schistocytes on
morphological examination
of slide
Absent Present
Platelet count (10
9
/L) 150–450 <100
Haemoglobin (g/dL) 12.1–17.2 <12.1
Lactate dehydrogenase (LDH)
(U/L)
100–190 Elevated and
frequently >800
Creatinine (μg/L) 49–90 >90
Coombs test Negative Negative
ADAMTS13 antigen levels (%) 50–150 Usually <5
ADAMTS13 activity (%) 50–150 Usually <10
ADAMTS13 autoantibodies Negative Positive
HIV status Negative Positive
Anti-retroviral therapy (ART)
at presentation
N/A Either ART naïve or
on ART therapy
Helper T cells (CD4+count,
cells/mm
3
)
500–1500 219.372
Abbreviations: ADAMTS, a disintegrin and metalloprotease with
thrombospondin motifs member 13; HIV, human immunodeficiency virus;
TTP, thrombotic thrombocytopenic purpura.
1288 MEIRING ET AL.
14230410, 2024, 12, Downloaded from https://onlinelibrary.wiley.com/doi/10.1111/vox.13738 by Cornell University E-Resources & Serials Department, Wiley Online Library on [24/02/2025]. See the Terms and Conditions (https://onlinelibrary.wiley.com/terms-and-conditions) on Wiley Online Library for rules of use; OA articles are governed by the applicable Creative Commons License

each plate having a negative control. Samples with OD
490
values
greater than the cut-off value were considered positive binding to the
peptide, whereas those with OD
490
values less than the cut-off value
were considered no binding to the respective peptide.
Data analysis
The data were assessed using GraphPad Prism software version 6. Sta-
tistical analysis involved the application of a student-Ttest, and a
p-value of <0.05 was deemed to indicate statistical significance.
RESULTS
Laboratory inclusion criteria for HIV-associated TTP
diagnosis
The Table 2shows that the diagnostic criteria for HIV-associated TTP
include laboratory findings of HIV infection, thrombocytopenia, micro-
angiopathic haemolytic anaemia and elevated serum lactate dehydro-
genase levels. A creatinine test was also used to assess renal function,
with renal impairment considered when creatinine levels were above
90.0 μg/L.
Anti-ADAMTS13 IgG antibody concentration and
Bethesda inhibitory (BU) activity were measured in
HIV-associated TTP plasma samples
Mixing tests were conducted on HIV-associated TTP patient
samples with ADAMTS13 activity below 10% and positive
anti-ADAMTS13 IgG antibody titre. Overall, 53 samples showed
inhibitory anti-ADAMTS13 IgG antibodies, with non-inhibitory
17, low inhibition 17 and high inhibition 19, respectively. Table 3
shows concentrations and Bethesda Units (BU) for non-inhibitory,
mild inhibitory and high inhibitory of autoantibody titres.
Determination of total IgM and IgA in HIV-associated
TTP plasma samples
Table 4shows the total IgM and IgA antibody concentrations in HIV-
associated TTP patient (53) samples.
Determination of anti-ADAMTS13 IgM and IgA
antibodies
Figure 2shows the percentage of patients with anti-ADAMTS13 IgM
and IgA antibodies in HIV-associated TTP plasma samples.
TABLE 3 The concentration of anti-ADAMTS13 IgG antibody in
HIV-associated TTP plasma samples.
Anti-
ADAMTS13
IgG
antibodies
Number
of
samples
Median anti-
ADAMTS13 IgG
antibody titre
(μg/mL)
Median Bethesda
unit (BU/mL)
Non-
inhibitory
17/53 26 (17–223) <0.5
Low
inhibition
<5 BU
17/53 42 (18–86) 1.85 (0.64–4.54)
Strong
inhibition
>5 BU
19/53 96 (32–175) 9.74 (5.10–17.92)
Note: Results are expressed as mean ± SD, p< 0.05; median anti-
ADAMTS13 IgG antibodies concentration units are expressed as μg/mL
and median Bethesda unit is expressed as BU/mL.
Abbreviations: ADAMTS, a disintegrin and metalloprotease with
thrombospondin motifs member 13; HIV, human immunodeficiency virus;
Ig, immunoglobulin; TTP, thrombotic thrombocytopenic purpura.
TABLE 4 Determination of total IgM and IgA in HIV-associated
TTP plasma samples.
Parameter HIV-associated TTP (n=53)
Median IgM level (ranges)
Mean ± SD
1.6 (1.05–2.35) mg/mL
1.59 ± 0.27
Median IgA level (ranges)
Mean ± SD
1.85 (1.06–2.98) mg/mL
2.10 ± 0.60
Note: Results are expressed as mean ± SD, p< 0.05, IgM and IgA
antibodies concentration expressed as mg/mL.
Abbreviations: HIV, human immunodeficiency virus; Ig, immunoglobulin; n,
number of samples; TTP, thrombotic thrombocytopenic purpura.
30%
64%
28%
0
10
20
30
40
50
60
70
80
anti-ADAMTS13 IgM anti-ADAMTS13 IgA anti-ADAMTS13 IgM and
IgA
Percentage %
HIV-associated TTP
FIGURE 2 Percentage of human immunodeficiency virus (HIV)-
associated thrombotic thrombocytopenic purpura (TTP) patients with
positive anti-ADAMTS13 (a disintegrin and metalloprotease with
thrombospondin motifs member 13) immunoglobulin (Ig) M, IgA and
both IgM and IgA autoantibody levels: Results are expressed as
percentage (%).
ADAMTS13 AUTOANTIBODIES IN HIV–TTP 1289
14230410, 2024, 12, Downloaded from https://onlinelibrary.wiley.com/doi/10.1111/vox.13738 by Cornell University E-Resources & Serials Department, Wiley Online Library on [24/02/2025]. See the Terms and Conditions (https://onlinelibrary.wiley.com/terms-and-conditions) on Wiley Online Library for rules of use; OA articles are governed by the applicable Creative Commons License

Binding of purified IgG antibodies to linear overlapping
ADAMTS13 peptides using peptide ELISA
Table 5reveals that 94% of HIV-associated TTP patient plasma sam-
ples have IgG autoantibodies that bind to linear peptides from all four
ADAMTS13 proximal domains. In total, 42% of samples have IgG
autoantibodies bound to the metalloprotease domain, whereas 58%
are bound to both metalloprotease and disintegrin-like domains. None
respond solely to the disintegrin-like domain, but 98% respond to
cysteine-rich and spacer domains.
Figure 3shows the percentage of HIV-associated TTP samples with
ADAMTS domain-specific autoantibodies, with ADAMTS13 metallopro-
tease, disintegrin-likes, cysteine-rich and spacer domains as predominant
antibody binding targets. Table 6summarizes immunoglobulin IgG auto-
antibody binding data and linear ADAMTS13 peptide epitopes.
Table 7shows potential antigenic regions in metalloprotease and
disintegrin-like domains, while Table 8shows potential antigenic
regions in cysteine-rich and spacer domains.
TABLE 5 ADAMTS13 domains with reactivity towards IgG
antibodies of individual HIV-associated TTP plasma samples.
ADAMTS13 domains
HIV-associated TTP
plasma (n=53)
Metalloprotease domain only 22/53 (42%)
Disintegrin-like domain only 0/53 (0%)
Both metalloprotease and disintegrin-like
domains together
31/53 (58%)
Cysteine-rich domain only 0/53 (0%)
Spacer domain only 1/53 (2%)
Both cistein-rich and spacer domains
together
52/53 (98%)
All four ADAMTS13 domains together 31/53 (78%)
Note: All results units are expressed as percentages (%).
Abbreviations: ADAMTS, a disintegrin and metalloprotease with
thrombospondin motifs member 13; HIV, human immunodeficiency virus;
Ig, immunoglobulin; n, number of samples; TTP, thrombotic
thrombocytopenic purpura.
TABLE 6 Shared and non-shared linear ADAMTS13 peptide epitope regions that bind to IgG autoantibodies isolated from HIV-associated
TTP patients.
Binding domains
Metalloprotease domain aa
epitope regions
Disintegrin-link domain aa
epitope regions
Cysteine-rich domain aa
epitope regions
Spacer domain amino
aa regions
Shared epitope
regions
75–80 169–189 445–479 595–619
125–139 320–345 455–469 625–649
200–224 350–379 475–504 650–669
260–284 340–379
Non-shared
epitope regions
80–124 275–304 505–529 560–586
220–244 290–324 540–564
240–26 355–376
365–374
Abbreviations: aa, amino acid; ADAMTS, a disintegrin and metalloprotease with thrombospondin motifs member 13; HIV, human immunodeficiency virus;
Ig, immunoglobulin; n, number of samples; TTP, thrombotic thrombocytopenic purpura.
FIGURE 3 Percentage of human immunodeficiency virus (HIV)-associated thrombotic thrombocytopenic purpura (TTP) samples with
ADAMTS13 (a disintegrin and metalloprotease with thrombospondin motifs member 13) domain-specific autoantibodies: Cys, cysteine-rich
domain; Dis, disintegrin-like domain; MP, metalloprotease domain; N, N-terminal side; P, propeptide; Spacer, Spacer domain; TSP1,
thrombospondin motif 1.
1290 MEIRING ET AL.
14230410, 2024, 12, Downloaded from https://onlinelibrary.wiley.com/doi/10.1111/vox.13738 by Cornell University E-Resources & Serials Department, Wiley Online Library on [24/02/2025]. See the Terms and Conditions (https://onlinelibrary.wiley.com/terms-and-conditions) on Wiley Online Library for rules of use; OA articles are governed by the applicable Creative Commons License

DISCUSSION
TTP is a prevalent type of TTP in Sub-Saharan Africa; it is primarily
caused by HIV infection. The ADAMTS13 protein plays a central role
in the pathogenesis of acquired TTP, with autoantibodies targeting
this enzyme often being the primary cause of severe ADAMTS13 defi-
ciency in HIV-associated TTP [9]. Several studies have underscored
the importance of measuring autoantibodies to ADAMTS13 in
managing patients with TTP. However, the ADAMTS13 autoantibody
status in HIV-associated TTP patients has not yet been fully investi-
gated [20, 22].
The laboratory inclusion criteria used for this diagnosis are sum-
marized from multiple published studies [23, 24]. TTP is a common
condition in patients with advanced HIV disease the severe deficiency
of ADAMTS13, lower platelet, haemoglobin, CD4+T-cell count and
high level of plasma lactate dehydrogenase (LDH) and creatinine levels
TABLE 7 Linear peptides with potential antigenic regions in the metalloprotease (MP) and disintegrin (Dis)-like domains.
Peptide name Peptide sequence Position
HIV-associated TTP patient
group (n=53)
MP1 AAGGILHLELLVAVGPDVFQ 75–94 53/53 (100%)
MP1–MP8 LHLELLVAVGPDVFQAHQEDTERYVLTNLNIGAELLR DPSLGAQFRVHLV 80–129 0/53
MP9–MP10 LRDPSLGAQFRVHLVKMVILTEPEG 115–139 53/53 (100%)
MP9–MP12 LRDPSLGAQFRVHLVKMVILTEPEGAPNITANLTS 125–149 0/53
MP18–MP21 TINPEDDTDPGHADLVLYITRFDLELPDGNRQVRG 160–194 15/53 (28%)
MP19–MP20 DDTDPGHADLVLYITRFDLELPDGN 165–189 37/53 (70%)
MP19–MP21 DDTDPGHADLVLYITRFDLELPDGNRQVRG 165–194 4/53 (8%)
MP25–MP28 VTQLGGACSPTWSCLITEDTGFDLGGVTIAHEIGHS 195–229 10/53 (19%)
MP29–MP34 GFDLGVTIAHEIGHSFGLEHDGAPGSGCGPSGHVMASDGAAPRAG 215–249 0/53
MP33–MP36 DGAPGSGCGPSGHVMASDGAAPRAGLAWSPCSRRQ 235–269 3/53 (6%)
MP37–MP39 APRAGLAWSPCSRRQLLSLLSAGRARCVWD 255–284 26/53 (49%)
MP37–MP/
Dis40
APRAGLAWSPCSRRQLLSLLSAGRARCVWDPPRPQ 255–289 25/53 (47%)
MP40–MP/
Dis44
LLSLLSAGRARCVWDPPRPQPGSAGHPPDAQPGLY YSANE 270–304 0/53
MP/Dis41–
Dis44
SAGRARCVWDPPRPQPGSAGHPPDAQPGLYYSANE 275–309 0/53
MP/Dis43–
Dis46
PPRPQPGSAGHPPDAQPGLYYSANEQCRVAFGPKA 285–319 1/53 (2%)
Dis44–Dis47 PGSAGHPPDAQPGLYYSANEQCRVAFGPKAVACTF 290–324 2/53 (4%)
Dis45–Dis48 HPPDAQPGLYYSANEQCRVAFGPKAVACTFAREHL 295–334 1/53 (2%)
Dis49–Dis52 FGPKAVACTFAREHLDMCQALSCHTDPLDQSSCSR 315–349 4/53 (7%)
Dis49–Dis/
TSP1 59
FGPKAVACTFAREHLDMCQALSCHTDPLDQSSCSR
LLVPLDGTECCGVEKWCSKGRCRSLVELTPIAAVH
315–383 5/53 (9%)
Dis53–Dis58 LSCHTDPLDQSSCSRLLVPLLDGTECCGVEKWCSKGRCRSLVELTP 335–379 5/53 (9%)
Dis53–Dis/
TSP1 59
LSCHTDPLDQSSCSRLLVPLDGTECCGVEKWCSKGRCRSLVELTPIAAVH 335–383 5/53 (9%)
Dis55–Dis/
TSP1 59
SSCSRLLVPLLDGTECGVEKWCSKGRCRSLVELTP IAAVH 345–383 2/53 (4%)
Dis56–Dis/
TSP1 59
LLVPLLDGTECGVEKWCSKGRCRSLVELTPIAAVH 350–383 2/53 (4%)
Dis57–Dis/
TSP1 59
LDGTECGVEKWCSKGRCRSLVELTPIAAVH 355–383 1/53 (2%)
Dis58–Dis/
TSP1 59
CGVEKWCSKGRCRSLVELTPIAAVH 360–383 253 (4%)
Dis/TSP1 59 WCSKGRCRSLVELTPIAAVH 365–33 11/53 (21%)
Note: Amino acid residues in the overlapping regions of antigenic peptides in red. Peptide names are derived from the relevant domain names and amino
acid position relative to the coding region of full-length ADAMTS13 protein.
Abbreviations: ADAMTS, a disintegrin and metalloprotease with thrombospondin motifs member 13; HIV, human immunodeficiency virus; n, number of
samples; TTP, thrombotic thrombocytopenic purpura.
ADAMTS13 AUTOANTIBODIES IN HIV–TTP 1291
14230410, 2024, 12, Downloaded from https://onlinelibrary.wiley.com/doi/10.1111/vox.13738 by Cornell University E-Resources & Serials Department, Wiley Online Library on [24/02/2025]. See the Terms and Conditions (https://onlinelibrary.wiley.com/terms-and-conditions) on Wiley Online Library for rules of use; OA articles are governed by the applicable Creative Commons License

[25, 26]. This study also find similar representing severe deficiency of
ADAMTS13 antigen and activity levels, lower platelet count,
decreased haemoglobin, low CD4+T-cell counts and elevated LDH
and creatinine levels in HIV-associated TTP patients.
The frequency of autoantibodies in acquired TTP patients sug-
gesting that an immune-mediated activity against ADAMTS13 is pre-
sent in almost all patients presenting with HIV-associated TTP
[22, 27]. Increased anti-ADAMTS13 IgG antibody titres are associated
with poor prognosis in TTP patients [20]. In concurrence with the pre-
vious reports, in the current investigation, the anti-ADAMTS13 IgG
concentration was assessed in 90% of the positive anti-ADAMTS13
IgG antibodies in this HIV-associated TTP (53/59) plasma, this indi-
cates the immune-mediated activity against HIV-associated TTP
patients.
This study also investigated the laboratory evidence of autoim-
munity in HIV-associated TTP plasma samples by also measuring
IgM and IgA titres to emphasize the relationship between the dis-
ease and the immunological parameters. A relationship between
autoantibodies and CD4+T-lymphocyte count has previously been
documented [19, 23, 24]. It is reported that autoantibodies can trig-
ger T-cell apoptosis by crosslinking Ig-related T-cell membrane mole-
cules and envelope glycoprotein, a glycoprotein on the HIV
envelope, resulting in CD4+T-cell reduction with loss of integrity of
the immune system [25, 26]. Emerging data demonstrate that the
HIV-associated TTP plasma samples were detected with slightly
increased plasma IgM and IgA antibodies and had a CD4+count of
less than normal ranges. HIV infection therefore prompts patients to
autoimmune responses. Autoantibodies have prognostic significance
in infectious diseases such as infections with HIV and have diagnos-
tic value in HIV-associated TTP.
The IgG antibodies are primarily involved in the pathogenesis of
other acquired forms of TTP by causing decreased ADAMTS13 pro-
tein in plasma, but these antibodies have not been characterized in
acquired HIV-associated TTP. The selected ADAMTS13 proximal
domains include the metalloprotease, disintegrin-like, cysteine-rich
and spacer domains interact with unravelled vWF substrate and are
necessary for the proteolytic activity of ADAMTS13. Furthermore,
their activity towards vWF fragments under static conditions has been
evaluated and representing the specific effects on ADAMTS13 activ-
ity [6, 27]. The results of the current study show that all IgG anti-
bodies isolated from 53 HIV-associated TTP plasma samples had
multiple binding sites on the four functional domains of ADAMTS13
probed. Our epitope-mapping studies indicated that anti-ADAMTS13
IgG antibodies identified similar immuno-dominant epitopes in the
HIV-associated TTP group but additional binding sites were also iden-
tified in this group. We also observed that the cysteine-rich and
spacer domains strong major binding sites in the HIV-associate TTP
patients.
TABLE 8 Linear peptides with potential antigenic regions detected from the Cysteine-rich (Cys) and Spacer (Spa) domains.
Peptide name Peptide sequence Position
HIV-associated TTP
group n=53
Cys1–Cys4 KTQLEFMSQQCARTDGQPLRSSPGGASFYHWGAAV 440–474 2/53 (4%)
Cys3–Cys6 CARTDGQPLRSSPGGASFYHWGAAVPHSQGGDALCR 450–484 8/53 (15%)
Cys2–Cys5 FMSQQCARTDGQPLRSSPGGASFYHWGAAVPHSQG 445–479 23/53 (43%)
Cys3–Cys5 CARTDGQPLRSSPGGASFYHWGAAVPHSQG 450–479 6/53 (11%)
Cys3–Cys10 CARTDGQPLRSSPGGASFYHWGAAVPHSQGDALCR
HMCRAIGESFIMKRGHMCRAIGESFIMKRGDSFLD
450–504 4/53 (8%)
Cys7–Cys10 WGAAVPHSQGDALCRHMCRAIGESFDALCRHMCR AIGESFIMKRGDSFLD 470–504 11/53 (21%)
Cys13–Cys16 DSFLDGTRCMPSGPREDGTLSLCVSGSCRTFGCDG 500–534 7/53 (13%)
Cys17–Cys/
Spa20
SLCVSGSCRTFGCDGRMDSQQVWDRFCQVCGGGDNST 520–554 29/53 (55%)
Cys18–Cys/
Spa20
GSCRTFGCDGRMDSQQVWDRCQVCGGDNST 525–554 1/53 (2%)
Cys13–Cys/
Spa20
DSFLDGTRCMPSGPREDGTLSLCVSGSCRTFGCDG RMDSQQVWDRCQVCGGDNST 500–554 5/53 (9%)
Spa24–Spa 28 CSPRKGSFTAGRAREYVTFLTVTPNLTSVYIANHRPLFTH 555–594 1/53 (2%)
Spa31–Spa 34 PLFTHLAVRIGGRYVVAGKMSISPNTTYPSLLEDG 590–624 40/53 (75%)
Spa31–Spa39 PLFTHLAVRIGGRYVVAGKMSISPNTTYPSLLEDGRVEYR VALTEDRLPRLEEIRIWGPL 590–649 2/53 (4%)
Spa37–Spa40 LLEDGRVEYRVALTEDRLPRLEEIRIWGPLQEDAD 620–654 27/53 (51%)
Spa42–Spa/
TSP2 46
IWGPLQEDADIQVYRRYGEEYGNLTRPDITFTYFQPKPRQ 645–684 53/53 (100%)
Note: Amino acid residues in the overlapping regions of antigenic peptides are highlighted in red. Peptide names are derived from the relevant domain
names and the relevant amino acid position relative to the coding region of full-length ADAMTS13 protein.
Abbreviations: ADAMTS, a disintegrin and metalloprotease with thrombospondin motifs member 13; HIV, human immunodeficiency virus; n, number of
samples; TTP, thrombotic thrombocytopenic purpura.
1292 MEIRING ET AL.
14230410, 2024, 12, Downloaded from https://onlinelibrary.wiley.com/doi/10.1111/vox.13738 by Cornell University E-Resources & Serials Department, Wiley Online Library on [24/02/2025]. See the Terms and Conditions (https://onlinelibrary.wiley.com/terms-and-conditions) on Wiley Online Library for rules of use; OA articles are governed by the applicable Creative Commons License

The propeptide metalloprotease domain is reported to function
as a molecular safeguard of ADAMTS13 and does not affect the enzy-
matic action of the protein or its expression levels [28], and it also
detected IgG antibodies binding the propeptide domain in 20% of
acquired TTP plasma samples [7]. This study also identified the first
immune-dominant epitope regions in the metalloprotease domain. All
the HIV-associated TTP samples showed reactivity to the first peptide
of the metalloprotease domain. The potential epitope region was
identified and comprised of amino acids ‘AAGGI’at position 75–80 in
the full ADAMTS13 nucleotide sequence. These amino acid residues
are located on the C-terminal part of the propeptide domain on the
ADAMTS13 protein.
The metalloprotease domain regions contain the ADAMTS13 cat-
alytic sequence as well as ADAMTS13 sub-sites, which are important
for ADAMTS13 interaction with vWF and disintegrin-like domain has
been reported to significantly increase the cleavage efficiency and
specificity of ADAMTS13 [29]. In concurrence with the previous
reports, we observed the disintegrin-like domain contains exocites at
Arg349 and Leu350 residues that form weaker interactions with the
unravelled vWF A2 domain residues at Asp1614 and Ala1612 close to
the cleavage site. Thus, antibodies that bind to both the metallopro-
tease domain and the disintegrin-like domain may affect the ability of
the ADAMTS13 protease to interact with the vWF substrate.
Furthermore, the metalloprotease domain was identified as the most
antigenic region when compared to the disintegrin-like domain in
HIV-associated TTP group.
The cysteine-rich and spacer domains are constantly involved in
antibody binding in patients with acquired TTP [7, 8, 30, 31]. The
cysteine-rich and spacer domain have been found valuable for effi-
cient in vivo vWF ADAMTS13 proteolysis. The spacer domain is
essential for proteolysis of full-length vWF under flow conditions
[29, 32, 33], and data in the present study also agree with the
previous studies also found that 98% of HIV-associated TTP patient
samples had IgG autoantibodies that bind to both the cysteine-rich as
well as the spacer domains. This IgG autoantibodies that bind to these
domains may interfere with ADAMTS13–vWF interaction.
Limitation of this study includes the overlapping peptide library
derived from the ADAMTS13 protein, synthesized by GenScript
(USA), consisting of 105 biotinylated peptides. These peptides were
designed to identify linear B-cell epitopes using an ELISA-based
method. Due to the high costs of peptide libraries for large proteins,
only specific domains of ADAMTS13—the metalloprotease,
disintegrin-like, cysteine-rich and spacer domains were selected,
based on their functional significance and binding to vWF under static
conditions.
In conclusion, this study showed that the ADAMTS13 proximal
domains contain various epitope regions for anti-ADAMTS13 IgG
autoantibody interaction in HIV-associated TTP patients. Therefore, it
is evident that a polyclonal mixture of anti-ADAMTS13 IgG antibodies
is present in HIV-associated TTP patients with similar binding patterns
interacting with specific epitopes in the ADAMTS13 proximal
domains. These include amino acid residues 125–139, 169–189,
200–224, 220–244 and 260–284 in the metalloprotease domain,
445–504 and 505–564 in the cysteine-rich domain and 650–669,
590–624 and 625–649 in the spacer domain. This study has improved
our understanding of the immunological response potentially involved
in HIV-associated TTP. This study also recommends screening for
inhibitory anti-ADAMTS13 IgG autoantibodies to characterize the
pathophysiology of HIV-associated TTP.
ACKNOWLEDGEMENTS
M.M., M.K. and S.L. contributed to the project’s design; M.M. and
M.K. performed the overall experiments and analysed the data;
M.M. and P.K. wrote the manuscript. All authors contributed to manu-
script proofreading.
We thank the National Research Foundation of South Africa for
the financial support with Research Grand no: SRUG210217586912.
CONFLICT OF INTEREST STATEMENT
The authors declare no conflicts of interest.
DATA AVAILABILITY STATEMENT
The data for this manuscript are available upon reasonable request
and is subject to ethics committee approval.
ORCID
Muriel Meiring https://orcid.org/0000-0002-5202-7702
Susan Louw https://orcid.org/0000-0002-4315-1496
REFERENCES
1. Moake JL. Thrombotic microangiopathies. N Engl J Med. 2002;347:
589–600.
2. Zheng X, Chung D, Takayama TK, Majerus EM, Sadler JE,
Fujikawa K. Structure of von Willebrand factor-cleaving protease
(ADAMTS13), a metalloprotease involved in thrombotic thrombocy-
topenic purpura. J Biol Chem. 2001;276:41059–63.
3. Reese JA, Muthurajah DS, Hovinga JA, Vesely SK, Terrell DR,
George JN. Children and adults with thrombotic thrombocytopenic
purpura associated with severe, acquired Adamts13 deficiency: com-
parison of incidence, demographic and clinical features. Pediatr
Blood Cancer. 2013;60:1676–82.
4. Scully M, Yarranton H, Liesner R, Cavenagh J, Hunt B, Benjamin S,
et al. Regional UK TTP registry: correlation with laboratory ADAMTS
13 analysis and clinical features. B J Haematol. 2008;142:819–26.
5. Peyvandi F, Lavoretano S, Palla R, Feys HB, Vanhoorelbeke K,
Battaglioli T, et al. ADAMTS13 and anti-ADAMTS13 antibodies as
markers for recurrence of acquired thrombotic thrombocytopenic
purpura during remission. Haematologica. 2008;93:232–9.
6. Thomas MR, de Groot R, Scully MA, Crawley JT. Pathogenicity of
anti-ADAMTS13 autoantibodies in acquired thrombotic thrombocy-
topenic purpura. EBioMedicine. 2015;2:942–52.
7. Klaus C, Plaimauer B, Studt JD, Dorner F, Lämmle B, Mannucci PM,
et al. Epitope mapping of ADAMTS13 autoantibodies in acquired
thrombotic thrombocytopenic purpura. Blood. 2004;103:4514–9.
8. Luken BM, Turenhout EA, Kaijen PH, Greuter MJ, Pos W, van
Mourik JA, et al. Amino acid regions 572–579 and 657–666 of the
spacer domain of ADAMTS13 provide a common antigenic core
required for binding of antibodies in patients with acquired TTP.
Thromb Haemost. 2006;96:295–301.
ADAMTS13 AUTOANTIBODIES IN HIV–TTP 1293
14230410, 2024, 12, Downloaded from https://onlinelibrary.wiley.com/doi/10.1111/vox.13738 by Cornell University E-Resources & Serials Department, Wiley Online Library on [24/02/2025]. See the Terms and Conditions (https://onlinelibrary.wiley.com/terms-and-conditions) on Wiley Online Library for rules of use; OA articles are governed by the applicable Creative Commons License

9. Swart L, Schapkaitz E, Mahlangu JN. Thrombotic thrombocytopenic
purpura: a 5-year tertiary care centre experience. J Clin Apher. 2019;
34:44–50.
10. Gunther K, Garizio D, Nesara P. ADAMTS13 activity and the pres-
ence of acquired inhibitors in human immunodeficiency virus–related
thrombotic thrombocytopenic purpura. Transfusion. 2007;47:
1710–6.
11. Boro J, Pavenski K, Ambler KL, Leitch HA, Hicks LK. HIV-associated
thrombotic thrombocytopenic purpura. Blood. 2011;118:4677.
12. Rock GA, Shumak KH, Buskard NA, Blanchette VS, Kelton JG,
Nair RC, et al. Comparison of plasma exchange with plasma infusion
in the treatment of thrombotic thrombocytopenic purpura. N Engl J
Med. 1991;325:393–7.
13. Hart D, Sayer R, Miller R, Edwards S, Kelly A, Baglin T, et al. Human
immunodeficiency virus associated thrombotic thrombocytopenic
purpura–favourable outcome with plasma exchange and prompt ini-
tiation of highly active antiretroviral therapy. B J Haematol. 2011;
153:515–9.
14. Benjamin M, Terrell DR, Vesely SK, Voskuhl GW, Dezube BJ, Kremer
Hovinga JA, et al. Frequency and significance of HIV infection among
patients diagnosed with thrombotic thrombocytopenic purpura. Clin
Infect Dis. 2009;48:1129–37.
15. Becker S, Fusco G, Fusco J, Balu R, Gangjee S, Brennan C, et al. HIV-
associated thrombotic microangiopathy in the era of highly active
antiretroviral therapy: an observational study. Clin Infect Dis. 2004;
39:S267–75.
16. Louw S, Gounden R, Mayne ES. Thrombotic thrombocytopenic pur-
pura (TTP)-like syndrome in the HIV era. Thromb J. 2018;16:1–7.
17. Novitzky N, Thomson J, Abrahams L, Du Toit C, McDonald A.
Thrombotic thrombocytopenic purpura in patients with retroviral
infection is highly responsive to plasma infusion therapy. B J Haema-
tol. 2005;128:373–9.
18. Massabki PS, Accetturi C, Nishie IA, da Silva NP, Sato EI, Andrade LE.
Clinical implications of autoantibodies in HIV infection. AIDS. 1997;
11:1845–50.
19. Chen J, Wang L, Chen JJ, Sahu GK, Tyring S, Ramsey K, et al. Detection
of antibodies to human immunodeficiency virus (HIV) that recognize
conformational epitopes of glycoproteins 160 and 41 often allows for
early diagnosis of HIV infection. J Infect Dis. 2002;186:321–31.
20. Alwan F, Vendramin C, Liesner R, Clark A, Lester W, Dutt T, et al.
Characterization and treatment of congenital thrombotic thrombocy-
topenic purpura. Blood. 2019;133:1644–51.
21. Vendramin C, Thomas M, Westwood JP, Scully M. Bethesda assay
for detecting inhibitory anti-ADAMTS13 antibodies in immune-
mediated thrombotic thrombocytopenic purpura. TH Open. 2018;2:
e329–33.
22. Tsai HM, Raoufi M, Zhou W, Guinto E, Grafos N, Ranzurmal S, et al.
ADAMTS13-binding IgG are present in patients with thrombotic
thrombocytopenic purpura. Thromb Haemost. 2006;95:886–92.
23. Susal C, Daniel V, Oberg HH, Terness P, Huth-Kuhne A,
Zimmerman R, et al. Striking inverse association of IgG-anti-fab
gamma antibodies and CD4 cell counts in patients with acquired
immunodeficiency syndrome (AIDS)/AIDS-related complex. Blood.
1992;79:954–7.
24. McHeyzer-Williams LJ, Pelletier N, Mark L, Fazilleau N, McHeyzer-
Williams MG. Follicular helper T cells as cognate regulators of B cell
immunity. Curr Opin Immunol. 2009;21:266–73.
25. Kopelman RG, Zolla-Pazner S. Association of human immunodefi-
ciency virus infection and autoimmune phenomena. Am J Med.
1988;84:82–8.
26. Gentric A, Blaschek M, Julien C, Jouquan J, Pennec Y, Berthelot JM,
et al. Nonorgan-specific autoantibodies in individuals infected with
type 1 human immunodeficiency virus. Clin Immunol Immunopathol.
1991;59:487–94.
27. Ferrari S, Mudde GC, Rieger M, Veyradier A, Hovinga JK,
Scheiflinger F. IgG subclass distribution of anti-ADAMTS13 anti-
bodies in patients with acquired thrombotic thrombocytopenic pur-
pura. J Thromb Haemost. 2009;7:1703–10.
28. Majerus EM, Zheng X, Tuley EA, Sadler JE. Cleavage of the
ADAMTS13 propeptide is not required for protease activity. J Biol
Chem. 2003;278:46643–8.
29. de Groot R, Ryu JY, Jaring M, Luken BM, Lane DA, Crawley JTB.
vWF proteolysis by adamts13 is dependent on cooperation between
the ADAMTS13 cysteine-rich domain loop Q456-Q478 and the
spacer domain. J Thromb Haemost. 2011;9:307.
30. Zheng XL, Wu HM, Shang D, Falls E, Skipwith CG, Cataland SR, et al.
Multiple domains of ADAMTS13 are targeted by autoantibodies
against ADAMTS13 in patients with acquired idiopathic thrombotic
thrombocytopenic purpura. Haematologica. 2010;95:1555–62.
31. Soejima K, Matsumoto M, Kokame K, Yagi H, Ishizashi H, Maeda H,
et al. ADAMTS13 cysteine-rich/spacer domains are functionally
essential for von Willebrand factor cleavage. Blood. 2003;102:
3232–7.
32. Jin SY, Skipwith CG, Zheng XL. Amino acid residues Arg659, Arg660,
and Tyr661 in the spacer domain of ADAMTS13 are critical for
cleavage of von Willebrand factor. Blood. 2010;115:2300–10.
33. Majerus EM, Anderson PJ, Sadler JE. Binding of ADAMTS13 to von
Willebrand factor. J Biol Chem. 2005;280:21773–8.
How to cite this article: Meiring M, Khemisi M, Louw S,
Krishnan P. Autoantibodies to ADAMTS13 in human
immunodeficiency virus-associated thrombotic
thrombocytopenic purpura. Vox Sang. 2024;119:1285–94.
1294 MEIRING ET AL.
14230410, 2024, 12, Downloaded from https://onlinelibrary.wiley.com/doi/10.1111/vox.13738 by Cornell University E-Resources & Serials Department, Wiley Online Library on [24/02/2025]. See the Terms and Conditions (https://onlinelibrary.wiley.com/terms-and-conditions) on Wiley Online Library for rules of use; OA articles are governed by the applicable Creative Commons License

ORIGINAL ARTICLE
Frequency of human platelet antigens (HPA) in the Greek
population as deduced from the first registry of HPA-typed
blood donors
Georgios Kaltsounis | Evangelia Boulomiti | Dimitroula Papadopoulou |
Dimitrios Stoimenis | Fotios Girtovitis | Eleni Hasapopoulou-Matamis
Blood Center, AHEPA University General
Hospital of Thessaloniki, Thessaloniki, Greece
Correspondence
Georgios Kaltsounis, AHEPA University
General Hospital, St. Kyriakidi 1, 54636
Thessaloniki, Greece.
Email: gkaltsoux@yahoo.gr and georgios.
kaltsounis84@gmail.com
Funding information
The authors received no specific funding for
this work.
Abstract
Background and Objectives: Human platelet antigens (HPA) play a central role in
foetal and neonatal alloimmune thrombocytopenia (FNAIT), post-transfusion purpura
and some cases of platelet therapy refractoriness. The frequency distribution of HPA
had not been studied in the Greek population before we started to create a registry
of HPA-typed apheresis platelet donors. The aim of this study was the determination
of the frequency of various HPA in the Greek population, through the establishment
of a registry of typed donors.
Materials and Methods: Here, we report on the first 1000 platelet donors of Greek
origin who gave informed consent and were genotyped for 12 pairs of antithetical
HPA by Single Specific Primer-Polymerase Chain Reaction (SSP-PCR), including
HPA-1, HPA-3, HPA-5 and HPA-15. Antigen frequencies are reported, and allele fre-
quencies were calculated and compared with other European and non-European
populations. Tested donors cover all ABO and Rhesus D antigen spectrum.
Results: Antigen and allele frequencies are very similar to other White populations.
The frequency of HPA-1bb is 2.9% in our study, and the frequency of HPA-2b,
HPA-4b, HPA-9b and HPA-15b is also slightly higher than in other literature reports,
while the frequency of HPA-15b was found higher than that of HPA-15a.
Conclusion: We report antigen and allele frequencies for a large array of clinically sig-
nificant HPA for the first time in the Greek population. Frequencies are consistent
with other European populations. This registry of HPA-typed platelet donors, avail-
able to donate on demand, is an important asset for the treatment of FNAIT cases in
Greece.
Keywords
alloimmune thrombocytopenia, donor registry, FNAIT, HPA frequency distribution, HPA
genotyping, platelet antigens
Highlights
•This is the first study, to the best of our knowledge, investigating antigen and allele frequen-
cies of human platelet antigens (HPA) in the Greek population.
Received: 28 April 2024 Revised: 2 August 2024 Accepted: 4 September 2024
DOI: 10.1111/vox.13739
Vox Sanguinis. 2024;119:1295–1300. wileyonlinelibrary.com/journal/vox © 2024 International Society of Blood Transfusion. 1295

•A registry of HPA-typed apheresis platelet donors was created in Greece, in order to assist in
the timely provision of platelets in cases of neonatal alloimmune thrombocytopenia and
refractoriness to platelet transfusion therapy.
•The allele frequencies found in this registry are similar to other European populations; how-
ever, a slightly higher frequency of HPA-1bb could indicate an increased risk of foetal and
neonatal alloimmune thrombocytopenia cases in Greece due to HPA-1a alloimmunization.
INTRODUCTION
Human platelet antigens (HPA) are specific antigens found on the sur-
face of platelets. They are formed as a result of various single-
nucleotide variations (SNV) in genes that encode proteins found on
platelet membranes [1]. According to the established nomenclature,
all human platelet antigens identified to date are numbered and orga-
nized into 35 biallelic systems of antithetical antigens (HPA-1 to
HPA-35), in which the high-frequency antigen is designated by the
superscript ‘a’and the low frequency antigen with the superscript
‘b’[2]. In case an alloantibody against the antithetical antigen has not
been reported, a ‘w’designation is added after the antigen name [3–7].
Exposure to alloantigens, mainly through pregnancy or transfu-
sion, can lead to the formation of antibodies. Alloantibodies against
these antigens can be clinically significant in foetal and neonatal
alloimmune thrombocytopenia (FNAIT), post-transfusion purpura
(PTP) and non-human leukocyte antigen (HLA) refractoriness to plate-
let transfusion therapy [8, 9]. In such cases, transfusion of HPA-
compatible platelets donated by previously typed donors can have
very significant clinical impact [10].
Furthermore, the determination of the distribution of human
platelet antigens and the frequency of the respective gene alleles can
be very interesting in the context of genetic population studies, as dif-
ferences among various populations may reflect natural selective
pressure and could guide public health policies, such as population
screening programmes for the prevention and management of FNAIT
[11–13]. No such extended study has been performed to date in the
population of Greece, except for small scale studies on the frequency
of HPA-1a and HPA-1b [14, 15].
Establishing a registry of voluntary non-remunerated platelet
donors typed for a vast selection of HPA is a very crucial component
in the timely and successful treatment of FNAIT cases, as these
donors can be summoned to donate upon request, according to their
optimal combined HPA, ABO and Rhesus D antigen (RhD) compatibil-
ity [8–10, 16, 17]. In the same way, cases of PTP and refractoriness to
platelet transfusion therapy not due to anti-HLA antibodies may also
be supported with transfusion of HPA-compatible platelets [18–22].
MATERIALS AND METHODS
Since September 2019, all donors visiting our centre for platelet
apheresis were informed about the aims of the registry we intended
to create. Most of them gave informed written consent to be HPA-
typed and provided an additional blood sample for that cause.
They were genotyped using a commercial Single Specific Primer-
Polymerase Chain Reaction (SSP-PCR) kit. Seventy-seven samples
(7.7% of the dataset) were kindly provided by the blood bank depart-
ments of other hospitals that perform platelet apheresis in the wider
area of Northern Greece, provided that donors had given informed
consent.
Each donor was genotyped for a total of 12 sets of two antitheti-
cal antigens, specifically HPA-1a/b, HPA-2a/b, HPA-3a/b, HPA-4a/b,
HPA-5a/b, HPA-6a/b, HPA-8a/b, HPA-9a/b, HPA-11a/b, HPA-15a/
b, HPA-21a/b and HPA-27a/b. Results were recorded both in the
hospital laboratory information system (LIS) and in Microsoft Excel
spreadsheet; all agarose gels were photographed under ultraviolet
light, and images were saved in electronic files.
Antigen frequencies were calculated and also allele frequencies
were calculated based on antigen frequencies. Results were compared
with literature reports regarding other European populations.
DNA extraction
The commercial kit Ready DNA Isolation Spin Kit (Inno-train, Kron-
berg im Taunus, Hessen, Germany) was used according to the manu-
facturer’s instructions. Sample material was 200 μL Proteinase
K-treated whole blood, and the expected yield was 5–10 μg of geno-
mic DNA, given that all blood samples were analysed before the plate-
let apheresis procedure and contained 5–10 10
3
white blood cells/
μL. All DNA samples were stored frozen at 70C.
Single specific primer-polymerase chain reaction
The commercial kit HPA-Ready Gene plus (inno-train, Kronberg im
Taunus, Hessen, Germany) was used according to the manufacturer’s
instructions. For each reaction, 1 μL of extracted DNA (concentration
25–50 ng/μL) was added to the Mastermix. The PCR program was
94C for 2 min, 5 cycles of 94C for 20 s and 70C for 60 s, 10 cycles
of 94C for 20 s followed by 65C for 60 s and 72C for 45 s,
20 cycles of 94C for 20 s followed by 61C for 50 s and 72C for
45 s and finally 72C for 5 min.
Agarose gel electrophoresis
Band evaluation was performed by agarose gel electrophoresis. For
each donor sample that included 24 reactions, a negative control and
1296 KALTSOUNIS ET AL.
14230410, 2024, 12, Downloaded from https://onlinelibrary.wiley.com/doi/10.1111/vox.13739 by Cornell University E-Resources & Serials Department, Wiley Online Library on [24/02/2025]. See the Terms and Conditions (https://onlinelibrary.wiley.com/terms-and-conditions) on Wiley Online Library for rules of use; OA articles are governed by the applicable Creative Commons License

molecular weight marker per row of samples, a 2% agarose gel with
1Tris/Borate/EDTA buffer was prepared. Ethidium bromide was
added to a final concentration of 0.7 μg/mL. Bands were visualized
and evaluated under ultraviolet (UV) light.
Ethics statement
In this article, we exclusively address anonymized data collected as
part of genotyping of platelet donors after written informed consent.
RESULTS
The results of 1000 genotyped Greek donors are reported here.
Donations and sample analysis were performed during the period
September 2019–December 2023. Results in which one or more reac-
tions failed (internal control was negative) or were inconclusive were
filtered out (22 donors were filtered out for these reasons). Moreover,
given that the scope of this report is to reflect the Greek population,
results coming from donors who were not of Greek origin are not
reported here. As nationality is not always formally recorded during
donor examination, Greek origin was assumed based on combination
of full name, fathers’name, mother’s name and place of birth as
recorded on donors’formal identification documents, (49 donors were
filtered out because of assumed non-Greek origin of at least one par-
ent). A total of 1071 donors were genotyped. Platelet donors that
were genotyped were randomly selected with no bias. Results are
shown in Table 1.
Allele frequencies were calculated and Hardy–Weinberg analysis
for each pair of antithetical antigens is shown in Table 2.
All donors were also tested for ABO and RhD phenotype, results
are shown in Table S1. Phenotype distribution is very similar to pub-
lished results for the Greek population [24], which is an indirect indi-
cation that tested donors were selected without bias. Nevertheless,
given that the ABO and RHD genes are located in chromosomes 9 and
1, respectively, and none of the genes that express the tested HPA
antigens are located in those chromosomes, the distribution of ABO
and RhD is not expected to have any impact on the frequencies of
HPA in our population.
TABLE 1 Frequency of human platelet antigens (HPA) in Greek platelet donors (n=1000).
HPA (n=1000) Positive Homozygous Heterozygous Negative White people [23]
HPA-1a 97.1% 69.0% 28.1% 2.9% 98%
HPA-1b 31.0% 2.9% 28.1% 69.0% 28%
HPA-2a 97.9% 74.5% 23.4% 2.1% 99%
HPA-2b 25.5% 2.1% 23.4% 74.5% 15%
HPA-3a 85.0% 37.4% 47.6% 15.0% 85%
HPA-3b 62.6% 15.0% 47.6% 37.4% 63%
HPA-4a 99.9% 99.8% 0.1% 0.1% >99.9%
HPA-4b 0.2% 0.1% 0.1% 99.8% <0.1%
HPA-5a 97.7% 77.3% 20.4% 2.3% 98%
HPA-5b 22.7% 2.3% 20.4% 77.3% 21%
HPA-6a 99.9% 99.1% 0.8% 0.1% >99%
HPA-6b 0.9% 0.1% 0.8% 99.1% <1%
HPA-8a 100.0% 100.0% 0.0% 0.0% >99%
HPA-8b 0.0% 0.0% 0.0% 100.0% <1%
HPA-9a 100.0% 98.9% 1.1% 0.0% >99%
HPA-9b 1.1% 0.0% 1.1% 98.9% <1%
HPA-11a 100.0% 100.0% 0.0% 0.0% >99%
HPA-11b 0.0% 0.0% 0.0% 100.0% <1%
HPA-15a 72.7% 22.6% 50.1% 27.3% 77%
HPA-15b 77.4% 27.3% 50.1% 22.6% 65%
HPA-21a 100.0% 100.0% 0.0% 0.0% >99%
HPA-21b 0.0% 0.0% 0.0% 100.0% <1%
HPA-27a 100.0% 100.0% 0.0% 0.0% >99%
HPA-27b 0.0% 0.0% 0.0% 100.0% <1%
Note: Literature reports on the frequency of each human platelet antigen (HPA) for people of European ancestry who live in North America is shown for
reasons of comparison.
FREQUENCY OF HPA IN GREECE 1297
14230410, 2024, 12, Downloaded from https://onlinelibrary.wiley.com/doi/10.1111/vox.13739 by Cornell University E-Resources & Serials Department, Wiley Online Library on [24/02/2025]. See the Terms and Conditions (https://onlinelibrary.wiley.com/terms-and-conditions) on Wiley Online Library for rules of use; OA articles are governed by the applicable Creative Commons License

Antigen frequencies were compared with literature reports
regarding other populations, as shown in Table S2. The same compari-
son was performed for allele frequencies, as shown in Table S3.
DISCUSSION
A registry of voluntary non-remunerated platelet donors typed for a
vast selection of HPA is a very important asset for a blood centre, as
it can contribute significantly to the proper and timely treatment of
FNAIT, refractoriness to platelet transfusion therapy and PTP [8,
18, 19]. It could also provide platelet panel donors useful for platelet
serology assays. In our study, over the course of approximately
4 years, more than 1000 platelet donors spanning all ABO and RhD
phenotypes were typed for HPA, and the majority of these donors are
expected to be available to donate on demand for many years to
come. Several cases of suspected FNAIT and refractoriness to platelet
transfusion therapy were investigated (7 and 2 cases, respectively)
and HPA-compatible platelets were administered. The treatment of
neonatal alloimmune thrombocytopenia and the prevention of its
potential devastating effects on affected neonates makes the registry
invaluable for the national healthcare system.
Moreover, this registry offered the possibility to study antigen
and allele frequencies of HPA in the Greek population for the first
time. The large number of tested individuals (n=1000 subjects) is
particularly significant, as most similar reports on other European
populations have examined much fewer individuals, and this has per-
haps allowed for the detection of low frequency antigens. Comparison
of our results with other populations demonstrates the genetic simi-
larity of Greeks with other White populations.
Although the frequency of most antigens is very similar to other
literature reports, there are some interesting deviations. Low fre-
quency antigens such as HPA-2b, HPA-4b and HPA-9b are detected
in higher frequency compared to other European populations. In addi-
tion to that, the frequency of HPA-15b is higher than that of HPA-
15a, which is contradictory not only to many other literature reports
but also to the nomenclature convention that dictates the attribution
of the superscript ‘a’to the high-frequency antigen. On the other
hand, despite the large number of samples, no samples were found
positive for HPA-8b, HPA-11b, HPA-21b and HPA-27b. Proper statis-
tical analysis and perhaps larger scale studies could indicate whether
these differences are actually statistically significant in terms of popu-
lation genetics.
The main limitation of this study was that all tested individuals
reside in North Greece and the vast majority of them (98.5%) are
located in one major city, Thessaloniki. As a result, this distribution
may not be precisely representative of the entire Greek population,
especially of the southern part of the country. Moreover, although all
tested donors are of Greek origin, their detailed ancestral background
was not further explored. Given the historical background of massive
internal migration within the territory of Greece over the last century
and the mixed population makeover of Thessaloniki, we believe that
this distribution can be quite representative of an extended mixture
of people of Greek origin.
Focusing on the frequency of HPA-1a, in this study, we found a
slightly higher frequency of HPA-1a negative individuals than in many
other European populations, which is important as most FNAIT cases
are caused by HPA-1a alloantibodies. Previous studies have calculated
the risk of antibody formation in HPA-1a negative women during
reproductive age to be around 8.6%–9.7% [25, 26]. The incidence of
severe FNAIT (defined as platelet count <50 10
9
/L) was estimated to
be 0.04%, whereas the incidence of intracranial haemorrhage (ICH) var-
ies from 9.9%–25% of the severe FNAIT cases, based on antenatal and
postnatal screening studies [27]. The frequency of HPA-1a-negative
individuals (thus also pregnant women potentially at risk for FNAIT) in
those White populations was 2.1% [10], so a frequency of 2.9% HPA-
1bb in the Greek population could potentially indicate higher risk of
severe FNAIT in this population. Unfortunately, the incidence of FNAIT
cases in Greece remains unknown to date as only scarce cases have
been reported [28], so this assumption is only theoretical.
Increased risk of HPA-1a alloimmunization has been reported in
women carrying certain human leucocyte antigens class II, more
TABLE 2 Distribution of allele frequencies and Hardy–Weinberg
analysis (n/a =not applicable).
HPA Allele frequency χ
2
pvalue
HPA-1a 0.8305 0.0037 0.998
HPA-1b 0.1695
HPA-2a 0.8620 0.2704 0.874
HPA-2b 0.1380
HPA-3a 0.6120 0.0052 0.997
HPA-3b 0.3880
HPA-4a 0.9985 n/a n/a
HPA-4b 0.0015
HPA-5a 0.8750 4.5466 0.103
HPA-5b 0.1250
HPA-6a 0.9950 n/a n/a
HPA-6b 0.0050
HPA-8a 1.0000 n/a n/a
HPA-8b 0.0000
HPA-9a 0.9945 0.0306 0.9848
HPA-9b 0.0055
HPA-11a 1.0000 n/a n/a
HPA-11b 0.0000
HPA-15a 0.4765 0.0178 0.991
HPA-15b 0.5235
HPA-21a 1.0000 n/a n/a
HPA-21b 0.0000
HPA-27a 1.0000 n/a n/a
HPA-27b 0.0000
Abbreviation: HPA, human platelet antigens.
1298 KALTSOUNIS ET AL.
14230410, 2024, 12, Downloaded from https://onlinelibrary.wiley.com/doi/10.1111/vox.13739 by Cornell University E-Resources & Serials Department, Wiley Online Library on [24/02/2025]. See the Terms and Conditions (https://onlinelibrary.wiley.com/terms-and-conditions) on Wiley Online Library for rules of use; OA articles are governed by the applicable Creative Commons License

importantly HLA-DRB3*01:01 but also HLA-DRB4*01:01 and HLA-
DQB1*02:01 [29–31], so further studies on the frequency distribution
of HLA class I and II alleles in the Greek population could offer further
valuable insight in the estimation of FNAIT risk in this population [32].
ACKNOWLEDGEMENTS
The authors gratefully acknowledge the contribution of the donor
apheresis nursing staff of AHEPA Blood Center, as well as the assis-
tance of the Blood Banks of ‘Hippokrateion’General Hospital of
Thessaloniki, ‘Koutlimpaneion & Triantafyllion’General Hospital
of Larissa and University General Hospital of Alexandroupolis that
kindly provided donor samples. Last but not least, the technical assis-
tance provided by Chrysi Verrou was highly appreciated.
G.K. designed the study, contributed to sample analysis, per-
formed data analysis and wrote the first draft of the manuscript; E.B.,
D.P. and D.S. contributed to sample analysis; F.G. contributed to writ-
ing the draft manuscript; E.H.-M. conceived the study and reviewed
the manuscript; all authors reviewed and approved the final
manuscript.
CONFLICT OF INTEREST STATEMENT
The authors declare no conflicts of interest.
DATA AVAILABILITY STATEMENT
The data that support the findings of this study are available from the
corresponding author upon reasonable request.
ORCID
Georgios Kaltsounis https://orcid.org/0000-0001-8803-9273
Dimitrios Stoimenis https://orcid.org/0000-0002-0799-4752
REFERENCES
1. Curtis BR, McFarland JG. Human platelet antigens–2013. Vox Sang.
2014;106:93–102.
2. Versiti. Human platelet antigen (HPA) database. Available from:
https://versiti.org/products-services/human-platelet-antigen-hpa-
database. Last accessed 1 Aug 2024.
3. Metcalfe P, Watkins NA, Ouwehand WH, Kaplan C, Newman P,
Kekomaki R, et al. Nomenclature of human platelet antigens. Vox
Sang. 2003;85:240–5.
4. von dem Borne AEG, Décary F. ICSH/ISBT working party on platelet
serology. Vox Sang. 1990;58:176.
5. Mueller-Eckhardt C, Kiefel V, Santoso S. Review and update of
platelet alloantigen systems. Transfus Med Rev. 1990;4:98–109.
6. Newman PJ. Nomenclature of human platelet alloantigens: a problem
with the HPA system? Blood. 1994;83:1447–51.
7. Santoso S, Kiefel V. Human platelet-specific alloantigens: update.
Vox Sang. 1998;74:249–53.
8. Sachs UJ. Fetal/neonatal alloimmune thrombocytopenia. Thromb
Res. 2013;131:S1–S46.
9. Rozman P. Platelet antigens. The role of human platelet alloantigens
(HPA) in blood transfusion and transplantation. Transpl Immunol.
2002;10:165–81.
10. de Vos TW, Winkelhorst D, de Haas M, Lopriore E, Oepkes D.
Epidemiology and management of fetal and neonatal alloimmune
thrombocytopenia. Transfus Apher Sci. 2020;59:102704.
11. Wilson J, Jungner G. Principles and practice of screening for disease.
Vol 34. Geneva, Switzerland: World Health Organization. Public
Health Papers; 1968. p. 168.
12. Andermann A, Blancquaert I, Beauchamp S, Déry V. Revisiting Wil-
son and Jungner in the genomic age: a review of screening criteria
over the past 40 years. Bull World Health Organ. 2008;86:317–9.
13. Goldman M, Décary F, David M. Should all pregnant women be
tested for their platelet PLA (Zw, HPA-1) phenotype? Br J Haematol.
1994;87:670–1.
14. Politou M, Gialleraki A, Rallidis L, Anastasiou G, Travlou A. HPA-1
allelic frequencies in the Greek population. Transfus Med. 2009;19:
53–4.
15. Gialeraki A, Politou M, Rallidis L, Merkouri E, Markatos C,
Kremastinos D, et al. Prevalence of prothrombotic polymorphisms in
Greece. Genet Test. 2008;12:541–7.
16. Peterson JA, McFarland JG, Curtis BR, Aster RH. Neonatal alloim-
mune thrombocytopenia: pathogenesis, diagnosis and management.
Br J Haematol. 2013;161:3–14.
17. Winkelhorst D, Oepkes D. Foetal and neonatal alloimmune thrombo-
cytopenia. Best Pract Res Clin Obstet Gynaecol. 2019;58:15–27.
18. Waters AH. Post-transfusion purpura. Blood Rev. 1989;3:83–7.
19. Mueller-Eckhardt C. Post-transfusion purpura. Br J Haematol. 1986;
64:419–24.
20. Stanworth SJ, Navarrete C, Estcourt L, Marsh J. Platelet refractori-
ness - practical approaches and ongoing dilemmas in patient manage-
ment. Br J Haematol. 2015;171:297–305.
21. Saris A, Pavenski K. Human leukocyte antigen alloimmunization and
alloimmune platelet refractoriness. Transfus Med Rev. 2020;34:
250–7.
22. Hod E, Schwartz J. Platelet transfusion refractoriness. Br J Haematol.
2008;142:348–60.
23. Stroncek D, Vassallo R. Platelet and granulocyte antigens and anti-
bodies. In: Cohn C, Delaney M, Johnson S, Katz L, editors. Manual of
American Association of Blood Banks. 20th ed. Bethesda, Maryland:
American Association of Blood Banks; 2020. p. 525–46.
24. Lialiaris TS, Digkas E, Kareli D, Pouliliou S, Asimakopoulos B,
Pagonopoulou O, et al. Distribution of ABO and Rh blood groups in
Greece: an update. Int J Immunogenet. 2011;38:1–5.
25. Kamphuis MM, Paridaans N, Porcelijn L, De Haas M, Van Der
Schoot CE, Brand A, et al. Screening in pregnancy for fetal or neona-
tal alloimmune thrombocytopenia: systematic review. BJOG. 2010;
117:1335–43.
26. Dębska M, Uhrynowska M, Guz K, Kope
c I, Lachert E, Orzińska A,
et al. Identification and follow-up of pregnant women with platelet-
type human platelet antigen (HPA)-1bb alloimmunized with fetal
HPA-1a. Arch Med Sci. 2018;14:1041–7.
27. Kamphuis MM, Paridaans NP, Porcelijn L, Lopriore E, Oepkes D. Inci-
dence and consequences of neonatal alloimmune thrombocytopenia:
a systematic review. Pediatrics. 2014;133:715–21.
28. Giouleka S, Tsakiridis I, Zachomitros F, Mamopoulos A,
Kalogiannidis I, Athanasiadis A, et al. Fetal and neonatal alloimmune
thrombocytopenia: a rare case report of prenatal treatment. Clin
Case Rep. 2023;11:e7806.
29. Kjeldsen-Kragh J, Skogen B. Mechanisms and prevention of
Alloimmunization in pregnancy. Obstet Gynecol Surv. 2013;68:
526–32.
30. L’Abbé D, Tremblay L, Filion M, Busque L, Goldman M, Décary F,
et al. Alloimmunization to Platelet antigen HPA-1a (PIA1) is strongly
associated with both HLA-DRB3*0101 and HLA-DQB1*0201. Hum
Immunol. 1992;34:107–14.
31. Loewenthal R, Rosenberg N, Kalt R, Dardik R, Landau M, Yahalom V,
et al. Compound heterozygosity of HLA-DRB3* 01:01 and
HLA-DRB4 * 01:01 as a potential predictor of fetal neonatal alloim-
mune thrombocytopenia. Transfusion. 2013;53:344–52.
FREQUENCY OF HPA IN GREECE 1299
14230410, 2024, 12, Downloaded from https://onlinelibrary.wiley.com/doi/10.1111/vox.13739 by Cornell University E-Resources & Serials Department, Wiley Online Library on [24/02/2025]. See the Terms and Conditions (https://onlinelibrary.wiley.com/terms-and-conditions) on Wiley Online Library for rules of use; OA articles are governed by the applicable Creative Commons License

32. Mallis P, Siorenta A, Stamathioudaki E, Vrani V, Paterakis G. Fre-
quency distribution of HLA class I and II alleles in Greek population
and their significance in orchestrating the National Donor Registry
Program. Int J Immunogenet. 2024;51:164–72.
SUPPORTING INFORMATION
Additional supporting information can be found online in the Support-
ing Information section at the end of this article.
How to cite this article: Kaltsounis G, Boulomiti E,
Papadopoulou D, Stoimenis D, Girtovitis F,
Hasapopoulou-Matamis E. Frequency of human platelet
antigens (HPA) in the Greek population as deduced from the
first registry of HPA-typed blood donors. Vox Sang. 2024;119:
1295–300.
1300 KALTSOUNIS ET AL.
14230410, 2024, 12, Downloaded from https://onlinelibrary.wiley.com/doi/10.1111/vox.13739 by Cornell University E-Resources & Serials Department, Wiley Online Library on [24/02/2025]. See the Terms and Conditions (https://onlinelibrary.wiley.com/terms-and-conditions) on Wiley Online Library for rules of use; OA articles are governed by the applicable Creative Commons License

ORIGINAL ARTICLE
Ethnic diversity in Chilean blood groups: A comprehensive
analysis of genotypes, phenotypes, alleles and the
immunogenic potential of antigens in northern, southern
and central regions
María Antonieta Núñez Ahumada
1
| Fernando Pontigo Gonzalez
2
|
Carlos Arancibia Aros
3
| Andrea Canals
4
| Lilian Jara Soza
5
| Valeska Rodriguez
6
|
Catalina Vargas
7
| Edgardo Saa
1
| Lilian Castilho
8
1
Blood Bank, Clínica Santa María, Santiago, Metropolitan Region, Chile
2
Molecular Biology Laboratory, Blood Bank of Clínica Santa María, Santiago, Metropolitan Region, Chile
3
Immunohematology Laboratory, Blood Bank of Clínica Santa María, Santiago, Metropolitan Region, Chile
4
Biostatistics of the Biostatistics Program, School of Public Health, University of Chile, Santiago, Metropolitan Region, Chile
5
Human Genetics Program, Institute of Biomedical Sciences, School of Medicine, University of Chile, Santiago, Metropolitan Region, Chile
6
Blood Bank, Hospital Juan Noé Crevani, Arica, Arica y Parinacota Region, Chile
7
Blood Bank, Hospital Clinico Magallanes, Punta Arenas, Magallanes Region, Chile
8
Laboratory of Molecular Biology of Blood Groups, UNICAMP, Sao Paulo, Campinas, Brazil
Correspondence
María Antonieta Núñez Ahumada, Blood Bank
of Clínica Santa María, Av. Santa Maria
500, Providencia, Ciudad Santiago, Chile.
Email: antonieta.tm@gmail.com
Funding information
The authors received no specific funding for
this work.
Abstract
Background and Objectives: The available information on blood groups in the
Chilean population is derived from studies on aboriginal cohorts and routine serologi-
cal test results. The purpose of this study is to conduct a comprehensive analysis of
genotypes, phenotypes and blood group alleles in donors from northern, central and
southern Chile using molecular methods.
Materials and Methods: Overall, 850 samples from donors in northern, central and
southern Chile were genotyped. Allelic, genotypic and antigenic frequencies were
calculated and compared among regions. Of these, 602 samples were analysed by
haemagglutination, and discrepancies found between phenotypes and genotypes
were investigated. The immunogenic potential of antigens was calculated by the
Giblett equation, using the antigenic frequencies of donors from Santiago and the
alloantibody frequencies of patients from the same region.
Results: Alleles of low prevalence, variant alleles and those responsible for the
absence of high-prevalence antigens were found. Significant differences were
observed between the antigenic frequencies of the three regions. Discrepancies
between serologic and molecular results were mostly attributed to the molecular
background affecting antigen expression. In the calculation of the immunogenic
potential of antigens, the highest value was attributed to the Di
a
antigen.
Received: 30 May 2024 Revised: 1 August 2024 Accepted: 20 September 2024
DOI: 10.1111/vox.13746
Vox Sanguinis. 2024;119:1301–1309. wileyonlinelibrary.com/journal/vox © 2024 International Society of Blood Transfusion. 1301

Conclusion: These findings represent the first molecular characterization of blood
group antigens in Chileans. Our results highlight the necessity of using molecular
tools to explore the genotypes underlying variant phenotypes, low-frequency
antigens and antigens lacking specific antisera that cannot be detected by haemag-
glutination. Additionally, they emphasize the importance of understanding the
distribution of blood groups among different populations.
Keywords
antigenic frequencies, blood group antigen, genotype blood groups
Highlights
•Antigens, alleles and genotypes of clinical importance not previously described were found.
•The presence of these phenotypes impacts transfusion safety, leads to problems in pre-
transfusion studies and increases the difficulty in finding compatible red blood cell units.
•There are significant statistical differences among the three areas studied, which could have
an impact on alloimmunization.
•In the calculation of the immunogenic potential of antigens, the highest value was attributed
to the Di
a
antigen.
INTRODUCTION
There are more than 300 polymorphic antigens on the red blood cell
(RBC) membrane that can be incompatible between a blood donor
and a transfusion recipient or between a mother and her child during
pregnancy, potentially causing alloimmunization and eventually lead-
ing to haemolytic transfusion reaction (HTR) or haemolytic disease of
the fetus and newborn (HDFN), respectively [1]. Blood transfusion
plays a crucial role in the treatment of various diseases; approximately
15% of inpatients undergo blood transfusion, and about 1% of trans-
fused products result in severe HTR in alloimmunized patients due to
blood group incompatibility [2]. Between 2017 and 2021, the US
Food and Drug Administration (FDA) reports that 21% of transfusion-
related deaths were caused by HTR resulting from blood group
incompatibility [3]. Despite existing strategies to mitigate this adverse
transfusion effect, prevention of RBC alloimmunization remains an
unsolved challenge.
Alloimmunization is a complex adverse event related to transfu-
sion, resulting from diverse factors such as donor and patient antigen
mismatches, the recipient’s immunological status, underlying inflam-
mation, the immunomodulatory effects of transfused erythrocytes on
the recipient’s immune system and genetic factors.
In Chile, patients undergoing transfusion therapy are at high risk
of alloimmunization since most receive only ABO and RhD-matched
blood [4]. The ethnic background of both patients and donors can
impact transfusion outcomes. Therefore, understanding of the blood
groups present in the population is critical for implementing extended
phenotype/genotype matching, aiming to reduce alloimmunization
rates and improve patient outcomes [4].
No molecular studies of blood groups have been performed in the
Chilean population to detect clinically significant genotypes and to
predict phenotypes for which there are no antisera. The existing
information comes from prospective studies carried out mainly in
small groups of aborigines, which have anthropological objectives or
from retrospective information gathered from the results of routine
serological studies conducted in different blood banks, these studies
are limited by the variable availability of reagents between blood
banks of different health centres, and serological studies are restricted
to identifying antigenic specificities for which antisera exist. Addition-
ally, they are conditioned by the sensitivity of the technique, which
may not detect weak variants [5–9]. Knowledge of the blood groups
present in a population is essential for selecting the most appropriate
reagents and phenotyping techniques to ensure patient safety. As
serological reagents have limitations, it is relevant to conduct studies
using molecular methods.
Chileans have varying proportions of European, Native American
and, to a lesser extent, West African and East Asian ancestry [10].
Given the ethnic background of the Chilean population and the
recent increase in immigration to Chile, it is possible to find previ-
ously undescribed genotypes, alleles and phenotypes due to the lack
of molecular methods, and it is also plausible that there are signifi-
cant differences in blood group frequencies in different regions
of the country, variations that could increase the risk of
alloimmunization [11].
As a comprehensive molecular analysis of blood group genotypes,
alleles and phenotypes in the Chilean population has not yet been
performed, this study represents the first in-depth examination using
genotyping techniques. Consequently, the objectives of this study
were to provide data on the genotypic, allelic and antigenic frequen-
cies of 11 blood systems in a cohort of Chilean blood donors from the
Northern, Central and Southern regions, to compare the frequencies
between regions and with those documented in Europeans and Afro-
descendants, to evaluate the concordance between the serological
phenotype and the phenotype predicted from the genotype.
1302 NÚÑEZ AHUMADA ET AL.
14230410, 2024, 12, Downloaded from https://onlinelibrary.wiley.com/doi/10.1111/vox.13746 by Cornell University E-Resources & Serials Department, Wiley Online Library on [24/02/2025]. See the Terms and Conditions (https://onlinelibrary.wiley.com/terms-and-conditions) on Wiley Online Library for rules of use; OA articles are governed by the applicable Creative Commons License
Additionally, we estimated the immunogenic potential of clinically rel-
evant antigens.
MATERIALS AND METHODS
Blood samples
Three different groups of Chilean donors were enrolled in this study.
A total of 850 blood samples were randomly collected from three
regions: 212 from Arica (Northern), 515 from Santiago (Central) and
123 from Punta Arenas (Southern). Two etylenediaminetetra-acetic
acid (EDTA) samples were collected from each donor, samples from
cities in northern and southern Chile were shipped by air for proces-
sing in the Immunohematology and Blood Group Molecular Laborato-
ries of the Santa María Clinic Blood Bank, located in Santiago, in the
Central zone, Metropolitan region.
The inclusion criteria were (1) to be Chilean, considering Chilean
nationality and fixed residence in Chile, (2) to meet the requirements
to donate blood according to the general technical regulation
NGS146 that regulates the care of donors in Chile and (3) to have
signed the informed consent form agreeing to participate in the study.
Ethical approval was obtained from the ethics committee at the
Tarapacá University, Arica, I region (North zone); Santa María Clinic,
Metropolitan region (Central zone); Magallanes University, Punta
Arenas, XII region (South zone) and the Chile University, Santiago to
Chile.
Molecular methods
DNA was extracted from the EDTA-anticoagulated whole blood sam-
ples using the QIAamp DNA mini kit (Qiagen, USA). DNA concentra-
tion was measured on the Qubit fluorometer and was acceptable in
the range between 10 and 100 ng/μL. Extracted DNA was stored at
80C until testing.
Two commercial platforms were employed to genotype the sam-
ples: HEA BeadChip (Bioarray Solutions, Immucor, Warren, NJ, USA)
and ID CORE XT (Grifols, Spain) [12, 13]. A total of 602 samples
(212 from Arica, 328 from Santiago and 123 from Punta Arenas city)
were genotyped by the HEA Beadchip, which analyses 38 RBC anti-
gens of the following 11 blood group systems: RH, KEL, JK, FY, MNS,
DI, DO, CO, LU, LW and SC using 24 single-nucleotide polymorphism
(SNPs). The 187 remaining samples from Santiago were genotyped by
IDCORE XT, utilizing Luminex xMAP technology that includes 29 SNPs
responsible for the expression of 37 RBC antigens of the following
10 blood group systems (RH, KEL, JK, FY, MNS, DI, DO, CO, YT
and LU).
RHD and RHCE gene variants from samples exhibiting discrepan-
cies between molecular and serological methods were analysed by the
RHD and RHCE BeadChips (Bioarray Solutions, Immucor) [14] in a ref-
erence laboratory.
Results for all blood group systems were expressed in accordance
with the International Society of Blood Transfusion (ISBT) nomencla-
ture of blood groups, alleles and phenotypes [15]. Rare blood group
donors are defined as those that are negative for high-prevalence
antigens (<1:1000).
Serological methods
The 602 samples genotyped with the HEA BeadChip platform [12]
were previously serologically phenotyped by tube or using the auto-
mated NeoGalileo equipment (Immucor, Norcross, GA, USA) with
monoclonal and polyclonal antisera according to the manufacturer’s
instructions for the following blood group antigens: Rh (C, c, E, e), KEL
(k), JK (Jk
a
,Jk
b
), FY (Fy
a
,Fy
b
), DI (Di
a
), MNS (M, N, S, s) and LU (Lu
a
,
Lu
b
). The 187 samples that were genotyped using ID CORE XT [13]
were not phenotyped through serological methods because we did
not have all the necessary antisera available when the samples were
processed.
Predicted phenotypes based on genotypes were compared with
results from serological phenotyping, and any discrepancies were ana-
lysed. A discrepancy was defined as a situation where genotype
results were positive but serology results were negative, or vice versa.
Statistical analysis
Antigenic and allelic frequencies for each region were estimated using
direct counting and presented as percentages. Fisher’s test was
employed to assess whether statistically significant differences
existed among antigenic frequencies of Chilean blood donors in the
three regions studied. Furthermore, the RBC antigenic frequencies of
each region were compared with those reported for individuals
of Caucasian and Afro-descendant backgrounds. p-values <0.05 were
considered indicative of significance.
Calculation of the immunogenic potential of antigens
For this calculation, the ‘Giblett equation’was applied [16]. This equa-
tion included in the analysis only those RBC antigens for which both
antigen and clinically significant antibody frequency data were avail-
able. RBC antigen frequencies predicted from the genotype data col-
lected in Santiago were used. Alloantibody frequencies were obtained
from 502 patients with one or more irregular antibodies identified at
the same centre. Data were obtained from the statistics module of
the Hematos software used in the Blood Bank during the same period
as the donors’genotyping. The alloimmunized patients included in the
study were from the same region as the donors.
The ‘Giblett equation’is a widely used method for estimating the
immunogenic potential of blood group antigens. This calculation
involves dividing the total number of antibodies of a specific type by
GENOTYPING OF BLOOD GROUP SYSTEMS IN CHILEANS 1303
14230410, 2024, 12, Downloaded from https://onlinelibrary.wiley.com/doi/10.1111/vox.13746 by Cornell University E-Resources & Serials Department, Wiley Online Library on [24/02/2025]. See the Terms and Conditions (https://onlinelibrary.wiley.com/terms-and-conditions) on Wiley Online Library for rules of use; OA articles are governed by the applicable Creative Commons License

the probability that an antigen-negative individual will receive transfu-
sions of antigen-positive red blood cells. The resulting value is then
normalized relative to the immunogenic potential of K antigen by
dividing it by the corresponding value for K [16].
RESULTS
In the 850 donors studied from the 3 zones of the country, we found
55 different genotypes and 35 alleles from 11 blood group systems.
Within these, uncommon alleles coding for low-frequency antigens
(LFA), absence of high-frequency antigens (HFA) and partial and
weakly expressed antigens were found.
In the Rh system, 14 genotypes were identified, 6 of which
included the RHCE*01.20.01 allele or the RHCE*01.20.03 allele, all of
which were in heterozygosis. Table 1displays the number of donors
and genotypes in which each allele was found, along with the corre-
sponding nucleotide, amino acid changes and associated phenotypes.
Eight genotypes were found in the FY system. Among these, five
genotypes were observed in 54 (6.3%) donors with the FY*02W.01
allele or the FY*02N.01 allele, of which 13 (1.5%) were carriers of the
FY*02W.01 allele, and 41 (4.8%) of the FY*02N.01 allele, two (0.2%)
of the latter had a homozygous genotype (FY*02N.01/FY*02N.01) and
were therefore classified as carriers of the Fy null phenotype. Table 2
displays the donors and their respective genotypes containing either
the FY*02N.01 or FY*02W.01 alleles.
In the other systems studied, donors with infrequent genotypes
and alleles were also identified. Table 3shows the homozygous geno-
types responsible for the absence of HFA in KEL, LU, DI, YT blood
group systems, found in Chilean donors. Additionally, other rare alleles
associated with LFA were detected. Table 4displays the alleles, geno-
types and LFA occurrences found in the donors studied.
None of the alleles, genotypes and phenotypes described in
Tables 1–4had been previously described in Chileans. Details of the
genotypes and alleles identified in all donors studied and the frequen-
cies at which they were found in the three areas studied are shown in
Tables S1 and S2.
Antigens predicted from genotypes: Frequencies and
statistical analysis
Table 5displays the frequencies of blood system antigens: RhCE, KEL,
JK, FY, MNS, LU, DI, CO, DO, LW and SC obtained from molecular
studies of blood donors from the northern (Arica), central (Santiago)
and southern (Punta Arenas) regions of Chile. To the left of Table 5is
TABLE 1 Nucleotide and amino acid change, phenotypes and genotypes associated with RHCE*01.20.01 and RHCE*01.20.03 alleles from the
Chilean donors.
Allele
name ISBT
Nucleotide
change
Predicted amino acid
change Phenotypes Donors (n)
Genotypes with RHCE*01.20
alleles
RHCE*01.20.01 733 C>G Leu245Val c +partial, e +partial,
V+VS+,hr
B
pos., weak or
neg.
15 RHCE*01/RHCE*01.20.01
RHCE* 02/RHCE*01.20.01
RHCE*03/RHCE*01.20.01
RHCE*04/RHCE*01.20.01
RHCE*01.20.03 48 G>C
733 C>G
1006 G>T
Trp16Cys
Leu245Val
Gly336Cys
c+partial, e +partial,
VVS+,hr
B
4RHCE*01/RHCE*01.20.03
RHCE*03/RHCE*01.20.03
TABLE 2 Nucleotide and amino acid change, phenotypes and genotypes associated with FY*02W.01 and FY*02N.01 alleles from the Chilean
donors.
Allele name ISBT Nucleotide change Predicted amino acid change Phenotypes Donors (n) Genotypes
FY*02W.01 265 C>T Arg89Cys Fy
b
weak 8 FY*01/FY*02W.01
5FY*02/FY*02W.01
FY*02N.01 -67 T>C 0 Fy
a
29 FY*01/FY*02N.01
Fy
b
10 FY*02/FY*02N.01
Silent 2 FY*02N.01/FY*02N.01
TABLE 3 Rare phenotypes of the KEL, LU, DI and YT blood systems present in Chilean donors.
System Phenotypes Genotypes Nucleotide change Predicted amino acid change Donors (n)
KEL K+kKEL*01.01/KEL*01.01 578 C>T Thr193Met 1
DI Di(a+b)DI*01/DI*01 2561 C>T Pro854Leu 2
LU Lu(a+b)LU*01/LU*01 230 G>A Arg77His 1
YT Yt(ab+)YT*02/YT*02 1057 C>A His353Asn 2
1304 NÚÑEZ AHUMADA ET AL.
14230410, 2024, 12, Downloaded from https://onlinelibrary.wiley.com/doi/10.1111/vox.13746 by Cornell University E-Resources & Serials Department, Wiley Online Library on [24/02/2025]. See the Terms and Conditions (https://onlinelibrary.wiley.com/terms-and-conditions) on Wiley Online Library for rules of use; OA articles are governed by the applicable Creative Commons License

a map of Chile, highlighting in red the areas from which the samples
were obtained.
In the 187 samples studied from Santiago donors by the ID CORE
platform, RBC antigen frequencies were also calculated for: Mi
a
(0.5%), Yt
a
(98.9%) and Yt
b
(10.7%).
As expected, due to the heterogeneous nature of the miscegena-
tion that formed the Chilean population across the country, significant
statistical differences were observed in the frequencies of eight anti-
gens across five blood group systems (RhCE, FY, JK, MNS and DO)
among Chilean blood donors residing in the three regions studied.
Table 6presents the p-values resulting from the statistical compari-
sons, with statistically significant differences highlighted in bold. Anti-
genic frequencies with values of 0 or 100% were excluded from the
analysis.
In all the statistical analyses performed, significant statistical dif-
ferences were found between all the frequencies obtained in the
three areas studied, and those reported in Caucasians and
Afro-descendants. The above except for the LU and DO blood system
antigens between Punta Arena–Caucasians and Punta Arenas–Afro-
descendants and in the DO system antigens between Arica–Afro-
descendants’frequencies.
Discrepancies between genotyping and phenotyping
Six hundred and six samples from the three areas genotyped by the
HEA Bead Chip platform were subsequently phenotyped with anti-
sera. Discrepancies between genotype and phenotype were observed
in 10 samples from Arica and Santiago for four antigens (Fy
b
, C, e and
M). All identified discrepancies were attributed to negative results in
the serological method and positive results in the molecular method.
The concordance rate between serological and molecular methods is
presented in Table 7. In three of the six donors with discrepancies
in C, the cause could not be identified with the studies conducted. In
a subsequent sample from donor 4, the serological study was
repeated with 2 anti-C clones, yet the C antigen remained undetected.
Consequently, sequencing is required to resolve this discrepancy.
The RH*01.01 allele present in donor 5 encodes a weak e antigen.
However, the serological test returned a positive result, likely because the
RH*01.01 allele can lead to weaker expression of the e antigen,
depending on the serological methodology employed. For donors
5 and 6, no additional samples were obtained to repeat the serological
study, and the discrepancies with the RHCE genotype (RHCE Bead-
chip) were left unexplained. In both cases, sequencing is necessary to
resolve the discrepancies.
The immunogenic potential of antigens
Figure 1illustrates the frequencies of antigens and antibodies specific
to the antigens K, Di
a
,E,C,e,c,Fy
a
,Kp
a
,Jk
a
,Lu
a
,Jk
b
,S,Fy
b
and s,
which were used for calculating immunogenicity. The corresponding
values, multiplied by 1 factor of 100 are depicted in Figure 2, with the
highest value attributed to the Di
a
antigen.
DISCUSSION
This study represents the first implementation of molecular methods
to characterize the genotypes, alleles and antigens of blood groups in
donors from the Northern, Central and Southern zones of Chile.
Within this investigation, previously unreported antigens lacking
TABLE 4 Alleles encoding LFA, antigens and genotypes detected in Chilean donors.
System Allele encoding LFA LFA Genotypes Donors (n)
RhCE RHCE*01.20.01 V+VS+RHCE*03/01.20.01 15
RHCE*01/01.20.01
RHCE*02/01.20.01
RHCE*04/01.20.01
RHCE*01.20.03 VS+RHCE*01.39/01.20.03 4
RHCE*03/01.20.03
KEL KEL*01.03 Kp
a
KEL*01.03 /KEL*01.04 18
KEL*02.06 Js
a
KEL*02.06/KEL*02.05 2
MNS GYP*501 Mi
a
GYPB*03/GYP*501 1
DI DI*01 Di
a
DI*01/DI*02 2
DI*01/DI*01 28
LU LU*01 Lu
a
LU*01/LU*01 1
LU*01/LU*02 25
CO CO*02 Co
b
CO*01/CO*02 40
SC SC*02 Sc2 SC*01/SC*02 5
Abbreviation: LFA, low-frequency antigen.
GENOTYPING OF BLOOD GROUP SYSTEMS IN CHILEANS 1305
14230410, 2024, 12, Downloaded from https://onlinelibrary.wiley.com/doi/10.1111/vox.13746 by Cornell University E-Resources & Serials Department, Wiley Online Library on [24/02/2025]. See the Terms and Conditions (https://onlinelibrary.wiley.com/terms-and-conditions) on Wiley Online Library for rules of use; OA articles are governed by the applicable Creative Commons License

TABLE 5 Antigenic frequencies of the blood systems: RH, KEL, JK, FY, MNS, LU, DI, CO, DO, LW and SC studied in donors from northern, central and southern Chile.
The RBC antigen frequencies (%)
Arica
n=212
CEc e VVSKk Kp
a
Kp
b
Js
a
Js
b
Fy
a
Fy
b
Jk
a
Jk
b
MN
73.1 49.1 74.1 87.7 0.9 1.9 4.2 100 1.4 100 0.5 100 84.9 57.5 67 84.9 88.2 55.7
SsULu
a
Lu
b
Di
a
Di
b
Co
a
Co
b
Do
a
Do
b
Hy Jo
a
LW
a
LW
b
Sc1 Sc2
42 92.5 100 1.4 100 4.2 100 100 3.8 51.9 92 100 100 100 0 100 0.5
Santiago
n=515
CEc e VVSKk Kp
a
Kp
b
Js
a
Js
b
Fy
a
Fy
b
Jk
a
Jk
b
MN
60.2 38 74.9 95.5 1.7 2.1 6.0 99.8 1.2 100 0.2 100 73.6 68 70.7 82.7 86 61.5
SsULu
a
Lu
b
Di
a
Di
b
Co
a
Co
b
Do
a
Do
b
Hy Jo
a
LW
a
LW
b
Sc1 Sc2
51.8 92.6 100 3.5 99.8 3.9 99.6 100 6.2 59.4 88.5 100 100 100 0 100 0.2
Punta Arenas
n=123
CEc e VVSKk Kp
a
Kp
b
Js
a
Js
b
Fy
a
Fy
b
Jk
a
Jk
b
MN
82.1 43.1 81.3 94.3 3.3 3.3 3.3 100 1.6 100 0 100 80.5 74 63.4 90.2 85.4 57.7
SsULu
a
Lu
b
Di
a
Di
b
Co
a
Co
b
Do
a
Do
b
Hy Jo
a
LW
a
LW
b
Sc1 Sc2
32.5 93.5 100 4.1 100 0.8 100 100 1.6 60.2 86.2 100 100 100 0 100 2.4
Abbreviation: RBC, red blood cell. In the gray rows are the names of blood group antigens included in the study.
1306 NÚÑEZ AHUMADA ET AL.
14230410, 2024, 12, Downloaded from https://onlinelibrary.wiley.com/doi/10.1111/vox.13746 by Cornell University E-Resources & Serials Department, Wiley Online Library on [24/02/2025]. See the Terms and Conditions (https://onlinelibrary.wiley.com/terms-and-conditions) on Wiley Online Library for rules of use; OA articles are governed by the applicable Creative Commons License

corresponding antisera, as well as LFA, weak variants, null phenotypes
and rare blood group phenotypes, were recognized. Notably, geno-
types harbouring alleles that affect antigen expression or inactivate
antigen expression in the RH and FY systems were identified. Specifi-
cally, alleles RHCE*01.20.01 and RHCE*01.20.03 were identified,
producing partial phenotypes of the c and e antigens on the RhCE
protein. Additionally, these alleles are responsible for the expression
of the LFA V and VS. RHCE*01.20.01 also associated with the expres-
sion of hr
B
antigen, unlike RHCE*01.20.03, which lacks hrB expres-
sion [17]. The FY*01W.01 allele, identified in 13 donors, resulted in
weak antigen expression, which may not always be detected by
serological methods. Conversely, the FY*02N.01 allele, present in
41 donors, is a silent allele. This allele features a T>C change within
the promoter region of the gene, located 33 bp upstream of the
erythroid transcription start point and 67 bp upstream of the major
translation start codon (position 67). This mutation occurs within a
GATA consensus sequence, disrupting the binding of the erythroid-
specific GATA-1 transcription factor and consequently preventing gene
expression in erythroid cells while maintaining expression in other cell
types [18]. Furthermore, two donors exhibited the Fy null phenotype
TABLE 6 p-Value obtained from statistical analyses between antigenic frequencies of Arica–Santiago, Santiago–Punta Arenas and
Arica–Punta Arenas.
p-Value
Antigens C E e Fy
a
Fy
b
Jk
a
SDo
b
Arica–Santiago 0.472 0.006 0.005 0.005 0.006 0.379 0.018 <0.001
Santiago–Punta Arenas 0.007 0.34 0.64 0.287 0.277 <0.001 0.0001 0.027
Arica–Punta Arenas 0.031 <0.001 0.058 0.362 0.003 <0.001 0.103 0.095
Note: Statistically significant differences are highlighted in bold.
TABLE 7 Concordance rate between serological and molecular antigen detection.
Antigen
Donors
(n)
Concordance
rate (%) Genotypes
Fy
b
3 99.5 FY*01/FY*02W.01
C
Donors 1, 2 and 3 are also VS+and e antigen
discrepant
6 99.0 (C)
99.5 (e)
Donors 1 and 2:RHCE*03/RHCE*01.20.03
Donor 3: RHCE*01/RHCE*01.20.03
Donor 4: RHCE*01/RHCE*01
Donor 5: RHCE*01/RHCE*01.01
Donor 6: RHCE*03/RHCE*01
M 1 99.8 It was not possible to obtain a new sample to
repeat.
FIGURE 1 Erythrocyte antigen frequencies in Santiago donors and alloantibody frequencies in Santiago patients.
GENOTYPING OF BLOOD GROUP SYSTEMS IN CHILEANS 1307
14230410, 2024, 12, Downloaded from https://onlinelibrary.wiley.com/doi/10.1111/vox.13746 by Cornell University E-Resources & Serials Department, Wiley Online Library on [24/02/2025]. See the Terms and Conditions (https://onlinelibrary.wiley.com/terms-and-conditions) on Wiley Online Library for rules of use; OA articles are governed by the applicable Creative Commons License

due to a homozygous genotype for the FY*02N.01 allele. While this phe-
notype is common among Africans, it is rare in other populations.
In the blood systems KEL, LU, DI, YT homozygous genotypes
responsible for the absence of HFA, also known as rare, were identified.
The identification and recruitment of blood donors with rare phenotypes,
is crucial for providing safe transfusion therapy to patients with these
phenotypes. While there are highly effective rare blood donor registry
programmes worldwide, not all regions have the same level of availabil-
ity. In Chile, only the Santa Maria Clinic has such a registry, which is
partly formed by the donors identified in this study. Additionally, there is
an Ibero-American initiative to establish a registry of rare blood donors
capable of supplying Latin American countries and providing rare blood
to patients in the region who need it [19].
The molecular study facilitated the detection of LFA, for which
corresponding antisera are unavailable. All identified LFAs have been
implicated in acute or delayed HTR or HDFN and had not been previ-
ously described in Chileans. The presence of the V, VS and Js
a
anti-
gens can be attributed to the West African ancestry of Chileans which
accounts for close to 2.5% [10]. The donor who presented the Mi
a
antigen indicated that he is unaware of having any Asian ancestry,
noting that his parents, grandparents and great-grandparents are
Chilean, with the exception of his great-grandmother, who was Italian.
However, it is important to consider that Chileans have approximately
1.7% East Asian ancestry, likely a result of the Asian individuals who
arrived during the colonization of Chile [10]. Similarly, the presence of
the Di
a
antigen is attributed to the Native American ancestry of the
Chilean people, which comprises 38.7% [10], the higher frequency of
this antigen in the northern zone aligns with previous findings
reported by Etcheverry et al. [5] who observed that only the Atacame-
ños (Amerindian-natives of the northern zone) presented the Di
a
anti-
gen, with a frequency of 12.5%.
LFA Sc2 was detected in all three regions studied, with the fre-
quency found in Punta Arenas (2.4%) being higher than those
reported in other countries, such as Canada, England, Germany,
Czech Republic and Japan, where frequencies range from 0.5% in
Japan to 1.7% in Canada [1]. While there are few reports of HTR and
HDFN caused by anti-Sc2, it is noteworthy that one of the three
reports of HDFN originated from Chile [20]. Due to the limited avail-
ability of molecular methods to detect these antigens in Chile, the role
of LFA in HTR and HDFN may be underestimated. Additionally, iden-
tifying specific antibodies against LFA poses a challenge, as these anti-
gens are rarely present in commercial RBCs. Failure to detect them
may result in HTR in a previously alloimmunized patient.
Statistically significant differences were found between the frequen-
cies of certain antigens in the RhCE, FY, MNS, DI, JK and DO blood sys-
tems across the three regions. These differences can be attributed to the
heterogeneity of the Chilean population, characterized by a mixture in
different proportions throughout the country of various native Amerin-
dian peoples, European and African ancestry [5, 10].
Disparities in antigen frequencies among the three regions of the
country increase the risk of alloimmunization. This risk is particularly
significant given Chile’s geography layout—a long and narrow country—
where the most advanced healthcare facilities are concentrated in Santi-
ago, located in the Central zone. Consequently, patients requiring organ
transplants, haematopoietic progenitor transplants, cardiovascular surgery
and other transfusion-dependent procedures from the Northern and
Southern zones, are often transferred to Santiago. This find may suggest
that patients from the North and South of the country face an increased
risk of alloimmunization when transfused with RBC from donors in the
Central zone, although haemovigilance data are required to confirm this.
Discrepancies between serological and molecular studies in
10 donors revealed the presence of weakly expressed antigens that are
not detectable by serology. Three of these donors presented the allele
FY*01W.01, which encodes a weak Fy
b
antigen. This highlights that for
certain antigens with weak expression, the serological method lacks the
necessary sensitivity. Additionally, three discrepant samples in the C
FIGURE 2 The calculation of the immunogenic potential of antigens performed with the antigenic frequencies of donors from Santiago and
the frequency of antibodies of the same specificity from patients treated at the same institution.
1308 NÚÑEZ AHUMADA ET AL.
14230410, 2024, 12, Downloaded from https://onlinelibrary.wiley.com/doi/10.1111/vox.13746 by Cornell University E-Resources & Serials Department, Wiley Online Library on [24/02/2025]. See the Terms and Conditions (https://onlinelibrary.wiley.com/terms-and-conditions) on Wiley Online Library for rules of use; OA articles are governed by the applicable Creative Commons License

antigenrevealedtheRHCE*01.20.03 variant allele of the RHCE gene that
had not been previously documented in Chileans, underscoring the
importance of molecular methods to identify such variants.
Understanding immunogenicity is crucial for prioritizing which
antigens should be routinely studied and determining the level of
compatibility that RBCs should have in transfusion. In assessing the
immunogenic potential of antigens, the Di
a
antigen yielded the highest
value, which is a significant finding, especially given that this antigen
and its corresponding antibody are not routinely identified in Chile.
This result strongly supports the inclusion of Di
a
antigen testing in the
typing of Chilean donors and underscores the need for mandatory use
of red blood cells capable of detecting anti-Di
a
antibodies.
In conclusion, this study conducted using molecular methods rep-
resents the first comprehensive and invaluable dataset on the pheno-
type, genotype and alleles present in Chileans, which cannot be
studied by serological methods alone. This information can play crucial
roles, the provision of compatible blood for alloimmunized patients,
guiding the prioritization of antigens for further study and potentially
establishing a rare donor programme in Chile. The insights gained
from this research significantly contribute to enhancing transfusion
practices and blood banking strategies in the Chilean context.
ACKNOWLEDGEMENTS
M.A.N.A. designed, conducted the research, analysed the data, wrote
the first draft of the manuscript and performed part of the molecular
and serological studies; F.P.G. performed the molecular studies;
C.A.A. performed the serological studies; A.C. performed statistical
analyses; L.J.S. supervised the investigation and reviewed and edited
the manuscript; V.R. Collected donor samples from Arica and sent
them to Santiago; C.V. collected donor samples from Punta Arenas
and sent them to Santiago; E.S. managed the purchase of reagents
and supplies and the transfer of samples from Arica and Punta Arenas
to Santiago; L.M.C. reviewed and edited the manuscript.
CONFLICT OF INTEREST STATEMENT
The authors declare no conflicts of interest.
DATA AVAILABILITY STATEMENT
The data that support the findings of this study are available from the
corresponding author upon reasonable request.
ORCID
María Antonieta Núñez Ahumada https://orcid.org/0000-0003-
0180-3342
REFERENCES
1. Daniels G. Human blood groups. 3rd ed. Bristol, UK: Wiley Blackwell;
2013.
2. Panch SR, Montemayor-Garcia C, Klein HG. Hemolytic transfusion
reactions. N Engl J Med. 2019;381:150–62.
3. US FDA. Fatalities reported to FDA following blood collection and
transfusion annual summary for fiscal year. 2021 Available from:
https://www.fda.gov/vaccines-blood-biologics/report-problem-center-
biologics-evaluation-research/transfusiondonation-fatalities. Last
accessed 28 May 2024.
4. Hendrickson JE, Tormey CA, Shaz BH. Red blood cell alloimmuniza-
tion mitigation strategies. Transfus Med Rev. 2014;28:137–44.
5. Etcheverry R, Guzmán C, Hille A, Nagel R, Covarrubias E, Regonesi C.
Investigation of blood groups and other blood genetic traits in indige-
nous people in Chile. Rev Med Chil. 1967;95:599–614.
6. Harb Z, Llop E, Moreno R, Quiroz D. Coastal populations of Chile:
genetic markers in four localities. Rev Med Chil. 1998;126:
753–60.
7. Acuna M, Llop E, Rothhammer F. Genetic composition of Chilean
population: rural communities of Elqui, Limari and Choapa valleys.
Rev Med Chil. 2000;128:593–600.
8. Henríquez H, Moraga M, Llop E, Rothhammer F. Molecular genetic
characterization of the inhabitants of Caleta Paposo, the last Chango
stronghold in Chile. Rev Med Chil. 2004;132:663–72.
9. Aburto A, Zapata D, Retamales E, Moscoso H, Canales C, Escobar C.
Erythrocyte antigens and antibodies in the Chilean population.
Immunohematology. 2021;37:151–6.
10. Homburger JR, Moreno-Estrada A, Gignoux CR, Nelson D, Sanchez E,
Ortiz-Tello P, et al. Genomic insights into the ancestry and demographic
history of South America. PLoS Genet. 2015;11:1–18.
11. Vichinsky EP, Earles A, Johnson RA, Hoaga MS, Lubin A. Alloimmuni-
zation in sickle cell anemia and transfusion of racially un-matched
blood. N Engl J Med. 1990;322:1617–21.
12. Hashmi G, Shariff T, Seul M, Vissavajjhala P, Hue-Roye K, Charles-
Pierre D, et al. A flexible array format for large-scale, rapid blood
group DNA typing. Transfusion. 2005;45:680–8.
13. López M, Apraiz I, Rubia M, Piedrabuena M, Azkarate M,
Veldhuisen B, et al. Performance evaluation study of ID CORE XT, a
high throughput blood group genotyping platform. Blood Transfus.
2018;16:193–9.
14. Sippert E, Fujita C, Machado D, Guelsin G, Gaspardi AC, Pellegrino J
Jr, et al. Variant RH alleles and Rh immunisation in patients with
sickle cell disease. Blood Transfus. 2015;13:72–7.
15. Red Cell Immunogenetics and Blood Group Terminology ISBT
Working Party. Names for blood group alleles. Available from:
https://www.isbtweb.org/isbt-working-parties/rcibgt.html.Last
accessed 2 Jul 2024.
16. Stack G. Immunogenicity of blood group antigens: a mathematical
model corrected for antibody evanescence with exclusion of natu-
rally occurring and pregnancy-related antibodies. Blood. 2009;
114:4279–82.
17. Gaspardi A, Sippert E, De Macedo M, Pellegrino J, Costa F, Castilho L.
Clinically relevant RHD-CE genotypes in patients with sickle cell disease
and in African Brazilian donors. Blood Transfus. 2016;14:449–54.
18. Meny G. The Duffy blood group system: a review. Immunohematol-
ogy. 2010;26:51–6.
19. Nance S. How to find, recruit and maintain rare blood donors. Curr
Opin Hematol. 2009;16:503–50.
20. Núñez MA, Arancibia C, Villalobos C, Pontigo F, Abarca V,
Sandoval M, et al. A mild case of hemolytic disease of the fetus and
newborn due to anti-Sc2. Immunohematology. 2021;37:122–5.
SUPPORTING INFORMATION
Additional supporting information can be found online in the Support-
ing Information section at the end of this article.
How to cite this article: Núñez Ahumada MA, Gonzalez FP,
Aros CA, Canals A, Soza LJ, Rodriguez V, et al. Ethnic diversity
in Chilean blood groups: A comprehensive analysis of
genotypes, phenotypes, alleles and the immunogenic potential
of antigens in northern, southern and central regions. Vox
Sang. 2024;119:1301–9.
GENOTYPING OF BLOOD GROUP SYSTEMS IN CHILEANS 1309
14230410, 2024, 12, Downloaded from https://onlinelibrary.wiley.com/doi/10.1111/vox.13746 by Cornell University E-Resources & Serials Department, Wiley Online Library on [24/02/2025]. See the Terms and Conditions (https://onlinelibrary.wiley.com/terms-and-conditions) on Wiley Online Library for rules of use; OA articles are governed by the applicable Creative Commons License

LETTER TO THE EDITOR
Outpatient elective intravenous hydration therapy: Should
blood donors be deferred for medical spa hydration?
Intravenous (IV) hydration therapy (i.e., IV drip therapy) may be
broadly defined as non-medically indicated infusion and/or injection
of fluid that may contain supplements, vitamins and/or minerals into
the venous peripheral system. This elective procedure has gained sig-
nificant popularity in the United States and is being increasingly
offered at various sites including medical spas, aesthetic clinics and IV
hydration clinics, as well as through mobile on-demand services.
These establishments market IV hydration therapy for various ‘medi-
cal applications’, including the amelioration of the aftereffects of alco-
hol intoxication (i.e., ‘hangover cures’), detoxification of the body,
libido enhancement, immunologic boosting, vitamin supplementation
and improvement of mood and energy levels. Despite their geographic
ubiquity and therapeutic claims, these entities are not federally regu-
lated. Regulatory oversight of IV drip therapy among US states varies
considerably, including whether it is defined as a medical prac-
tice [1–4].
The US Food and Drug Administration (FDA) has raised concerns
about IV hydration therapy practices given the lack of evidence-based
benefit in the setting of legitimate, potentially fatal, risks, particularly
infection [5]. Specifically, the FDA has noted that sterile compounding
activities, such as adding vitamins to IV infusion bags, are commonly
performed at IV hydration therapy clinics and medical spas. However,
as these establishments offering IV hydration therapy are not regis-
tered with the FDA, it is not known (1) how many of these establish-
ments exist; (2) whether they are preparing, packing or storing the IV
products under sanitary conditions; (3) if a licensed practitioner is on-
site to evaluate patients and write prescriptions for the products or
(4) whether their compounding practices comply with section 503A of
the Food, Drug, and Cosmetic (FD&C) Act or applicable state regula-
tions [6]. Any facility performing these processes under insanitary
conditions significantly increases the risk of product contamination,
which may cause—and has already resulted in—serious patient illness,
hospitalization and/or death [6].
In addition to the risks for the IV hydration therapy recipient,
there is the potential for transmissible risk to other individuals if the
recipient later donates blood. Individuals who are inadvertently inocu-
lated with bacterial or fungal organisms during the IV hydration ther-
apy procedure would likely display signs of illness resulting in blood
donation deferral. However, there is the theoretical risk of transmis-
sion of HIV and viral hepatitis if sterility and aseptic administration
practices between individuals and by the provider are not maintained.
The possibility of harm underlying this theoretical risk is akin to an
individual donating blood after receipt of a tattoo or body piercing
from an unregulated establishment, particularly if the components
used to administer the IV hydration therapy are re-used and/or are
not sterilized between recipients. Conceivably, individuals undergoing
IV hydration therapy could present for blood donation during the win-
dow periods in which these high-risk viral infections cannot be reliably
detected.
At present, there are no uniform federal regulations, and consoli-
dation of state-by-state legislative oversight for IV hydration is lim-
ited. Variations in state regulations regarding who can own an IV
hydration establishment, as well as who can order, initiate and over-
see an IV hydration procedure further complicate the myriad of prac-
tices across the United States. For example, the state of Kentucky
differentiates between ‘ambulatory infusion agencies’, which are reg-
ulated, and ‘IV hydration clinics’(mobile or freestanding), which are
not regulated [7]. In Florida, although a physician licence is required
for an individual to serve as ‘medical director’, anyone can own an IV
hydration clinic, and a variety of non-physician individuals are allowed
to compound and administer the therapy [8]. As such, readers are
encouraged to consult individual state statutes pertaining to the prac-
tice of medicine to ascertain the details of IV hydration therapy
practices in their state.
Given the variability in IV hydration therapy practices and the lack
of consistent regulatory oversight, there may be confusion among
individuals and blood collection organizations regarding if and when
an individual can donate blood following receipt of IV hydration ther-
apy. These questions are not explicitly addressed by current Associa-
tion for the Advancement of Blood and Biotherapies (AABB)
Standards for donor eligibility or the blood donor history question-
naire (DHQ). AABB Standards require inspection of the donor for stig-
mata of parenteral drug use, as well as assessment for the ‘use of a
needle to administer nonprescription drugs’[9]. The DHQ assesses
for risk factors associated with transfusion-transmitted infections by
querying if a donor has ‘used needles to inject drugs, steroids, or any-
thing not prescribed by [their] doctor’within the past 3 months [10].
In US states that permit elective IV hydration therapy without pre-
scriptions or licensed supervision, it is possible for individuals to
receive unlicensed, non-prescription IV hydration therapies, which
may affect their blood donation eligibility—perhaps for 3 months or
indefinitely. In conjunction with the longstanding blood donor physical
examination of the antecubital region for signs of intravenous punc-
ture site requirement [10], a potential new question for the AABB
Received: 9 July 2024 Revised: 20 August 2024 Accepted: 21 September 2024
DOI: 10.1111/vox.13744
1310 © 2024 International Society of Blood Transfusion. Vox Sanguinis. 2024;119:1310–1312.wileyonlinelibrary.com/journal/vox

DHQ my take the form of ‘In the past 3 months have you received
recreational intravenous (IV) hydration therapy?’. This or a similar
question may assist in identifying individuals who may pose a higher
risk due to receipt of IV hydration therapy.
In addition to a lack of explicit questions in the AABB DHQ, no
currently available state-by-state regulatory clearinghouse exists to
guide blood donation centres for IV hydration. Candidate donors may
also be unaware of the conditions, oversight and regulations pertain-
ing to their individual recreational practices. Unlike tattoo practices
wherein blood collection centres have proactively identified which
states do and do not regulate themselves [11], no such resource exists
for IV hydration therapy. Thus, the blood collection industry would
greatly benefit from real-time expert consensus data, including a com-
prehensive document of state regulations that could be immediately
made available if a candidate blood donor affirmed a recent history of
IV hydration.
The IV hydration therapy market within the cosmetic field is a
multibillion-dollar industry [12]. With increasing access to consumers
through mobile and in-house IV hydration therapy services, the mar-
ket is poised to grow in the next several years [12]. As such, the num-
ber of blood donors who may receive IV hydration therapy could
increase. This parallels other contemporary practices in this homeo-
pathic and ‘holistic’space, such as the use of platelet-rich plasma
(PRP), which may be administered either via venipuncture or even
intravenously. Presently, wide variability exists in what is deemed allo-
geneic PRP and the potential medical benefit [13]. Despite uncon-
trolled trials addressing medical efficacy of allogeneic PRP, we believe
receipt of blood products/derivatives and other ‘IV therapies’should
fall under current blood deferral practices.
Public trust in the blood supply is an area of intense scrutiny, and
historic precedent dictates that blood centres and regulatory bodies
take all necessary steps to ensure the safety of blood products. There-
fore, we suggest that increased regulatory oversight of both IV hydra-
tion products themselves, and the establishments that provide these
services, as well as clarification from regulatory bodies and the blood
collection industry regarding the suitability of blood donors who have
received IV hydration therapy, are warranted. In the interim, we advo-
cate for a 3-month donation deferral for individuals after their most
recent IV hydration therapy from any establishment that is not cur-
rently regulated at the US state level.
ACKNOWLEDGEMENTS
G.S.B. conceived of the project and authored the manuscript with J.
W.J. B.D.A., C.A.F.V. and L.D.S. critically reviewed, revised, and
editted manuscript.
FUNDING INFORMATION
The authors received no specific funding for this work.
CONFLICT OF INTEREST STATEMENT
J.W.J. serves on the International Society of Blood Transfusion (ISBT)
Transfusion Transmitted Infectious Diseases Working Party. The
views expressed herein are his alone and do not represent the views
of ISBT or the working party. The other authors declare no conflicts
of interest.
DATA AVAILABILITY STATEMENT
Data sharing is not applicable to this article as no new data were cre-
ated or analyzed in this study.
Garrett S. Booth
1
Brian D. Adkins
2
Cristina A. Figueroa Villalba
3
Laura D. Stephens
4
Jeremy W. Jacobs
1
1
Department of Pathology, Microbiology & Immunology, Vanderbilt
University Medical Center, Nashville, Tennessee, USA
2
Department of Pathology, University of Texas Southwestern Medical
Center, Dallas, Texas, USA
3
Department of Laboratory Medicine, Yale School of Medicine, New
Haven, Connecticut, USA
4
Department of Pathology, University of California San Diego, La Jolla,
California, USA
Correspondence
Garrett S. Booth, Department of Pathology, Microbiology &
Immunology, Vanderbilt University Medical Center,
Nashville, TN, USA.
Email: garrett.s.booth@vumc.org
REFERENCES
1. Middleton J. Med spa industry largely unregulated as use increases.
American Family Physician. 2024 Available from: https://www.aafp.
org/pubs/afp/afp-community-blog/entry/med-spa-industry-largely-
unregulated-as-use-increases.html. Last accessed 15 May 2024.
2. American Med Spa Association. Update to laws regarding IV therapy
in medical spas. Available from: https://americanmedspa.org/blog/
update-to-laws-regarding-iv-therapy-in-medical-spas. Last accessed
15 May 2024.
3. American Med Spa Association. More states release guidance for IV
therapy following Alabama’s declaratory ruling. Available from:
https://americanmedspa.org/blog/more-states-release-guidance-for-
iv-therapy-following-alabamas-declaratory-ruling. Last accessed
15 May 2024.
4. Kaysen R. At-home IV drips are the latest luxury building amenity.
New York Times. Available from: https://www.nytimes.com/2024/
05/14/realestate/iv-drip-therapy-luxury-building.html. Last accessed
7 Jul 2024.
5. NPR. The FDA has raised alarms about wellness IV treatments at
unregulated med spas. Available from: https://www.npr.org/
2024/01/05/1223193931/the-fda-has-raised-alarms-about-well
ness-iv-treatments-at-unregulated-med-spas. Last accessed
15 May 2024.
6. United States FDA. FDA highlights concerns with compounding of
drug products by medical offices and clinics under insanitary
conditions. Available from: https://www.fda.gov/drugs/human-drug-
LETTER TO THE EDITOR 1311
14230410, 2024, 12, Downloaded from https://onlinelibrary.wiley.com/doi/10.1111/vox.13744 by Cornell University E-Resources & Serials Department, Wiley Online Library on [24/02/2025]. See the Terms and Conditions (https://onlinelibrary.wiley.com/terms-and-conditions) on Wiley Online Library for rules of use; OA articles are governed by the applicable Creative Commons License

compounding/fda-highlights-concerns-compounding-drug-products-
medical-offices-and-clinics-under-insanitary. Last accessed 7 Jul
2024.
7. Kentucky Board of Nursing. Ambulatory infusion agencies vs iv
hydration clinics. Available from: https://kbn.ky.gov/advanced-
practice-registered-nurse/Pages/ambulatory-infusion-agencies-vs-iv-
hydration-clinics.aspx. Last accessed 20 Aug 2024.
8. Florida Department of State, Florida Administrative Code and Florida
Administrative Register. Administration of intravenous therapy by licensed
practical nurses. Available from: https://www.flrules.org/gateway/
ChapterHome.asp?Chapter=64B9-12. Last accessed 20 Aug 2024.
9. AABB. Fundamental standards for blood collection and transfusion.
Available from: https://www.aabb.org/docs/default-source/default-
document-library/standards/fundamental-standards-for-blood-collection-
and-transfusion.pdf. Last accessed 8 Jul 2024.
10. AABB. Full-Length Blood Donor History Questionnaire (DHQ) v4.0.
Available from: https://www.aabb.org/docs/default-source/default-
document-library/resources/dhq-v4-0/pdfs/dhq-v4-0.pdf?sfvrsn=
c8022a9f_0. Last accessed 15 May 2024.
11. American Red Cross. Can I donate blood if I have a tattoo or body
piercings? Available from: https://www.redcrossblood.org/local-
homepage/news/article/donor-eligibility-tatoos-piercings-rcbs.html.
Last accessed 20 Aug 2024.
12. Grand View Research. IV hydration therapy market size & trends.
Available from: https://www.grandviewresearch.com/industry-
analysis/iv-hydration-therapy-market-report. Last accessed 7 Jul
2024.
13. Akbarzadeh S, McKenzie MB, Rahman MM, Cleland H. Allogeneic
platelet-rich plasma: is it safe and effective for wound repair? Eur
Surg Res. 2021;62:1–9.
1312 LETTER TO THE EDITOR
14230410, 2024, 12, Downloaded from https://onlinelibrary.wiley.com/doi/10.1111/vox.13744 by Cornell University E-Resources & Serials Department, Wiley Online Library on [24/02/2025]. See the Terms and Conditions (https://onlinelibrary.wiley.com/terms-and-conditions) on Wiley Online Library for rules of use; OA articles are governed by the applicable Creative Commons License

EVENTS
See also: https://www.isbtweb.org/events.html
21 December 2024 International Symposium on Neonatal & Pediatric Transfusion. https://docs.google.com/forms/d/e/1FAIpQLSd7fKVNOVVO-
wTP9B3czRjRe7-J1EWw0entl_NPw6x97St4_A/viewform
14–15 January 2025 EDQM Blood Conference: Innovation in Blood Establishment Processes. https://www.edqm.eu/en/edqm-blood-conference
Received: 25 October 2024 Revised: 25 October 2024 Accepted: 25 October 2024
DOI: 10.1111/vox.13782
Vox Sanguinis. 2024;119:1313. wileyonlinelibrary.com/journal/vox © 2024 International Society of Blood Transfusion. 1313


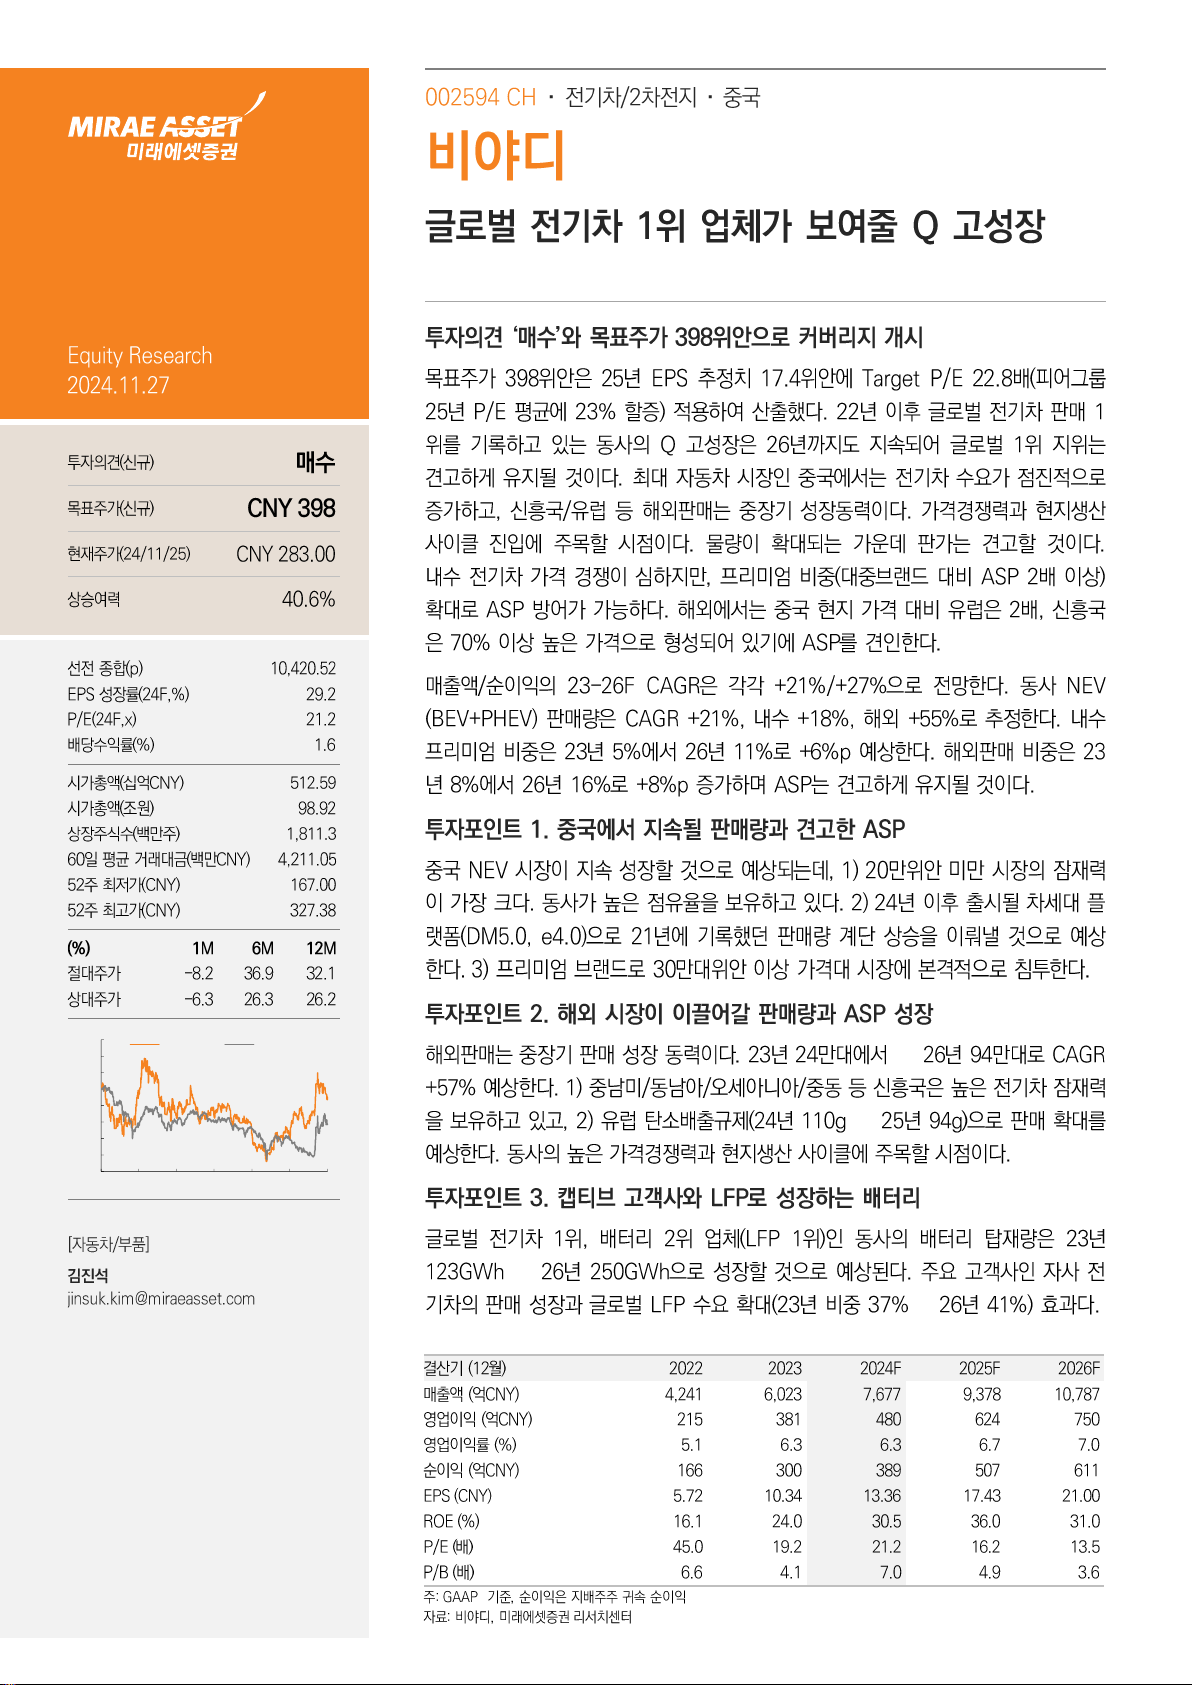


![A Yankee in Canada, by Henry D. Thoreau [Review]](https://s3.us-east-1.amazonaws.com/outstation.idea/pdf-mt/2049640040237207552/pdf/93517280-9ee7-4ed8-9e32-10de03fa11f5/imgs/page1.png)