Appetite and Energy Intake in Laboratory and Free-Living Conditions Remain Consistent Across Menstrual Cycle Phases when Using Precise Measurement Methods PDF Free Download
1 / 20/20
100%

Title: Appetite and Energy Intake in Laboratory and Free-Living Conditions Remain
1
Consistent Across Menstrual Cycle Phases when Using Precise Measurement Methods
2
Authors
3
Miranda Smith, MSc1,2, Maryam Aghayan, MSc2,3, Jonathan Little, PhD2,3, Jerilynn Prior,
4
MD4,5,6, Tamara R Cohen, RD, PhD7,8, Zoë Soon, PhD1, Hephzibah Bomide1,2, Sarah
5
Purcell, PhD2,3
6
1Irving K. Barber Faculty of Science, Department of Biology, The University of British
7
Columbia - Okanagan Campus, Kelowna, BC, V1V 1V7, Canada
8
2Faculty of Medicine, Department of Medicine, Southern Medical Program, Centre for
9
Chronic Disease Prevention and Management, Kelowna, BC, V1V 1V7, Canada
10
3Faculty of Health and Social Development, School of Health and Exercise Sciences, The
11
University of British Columbia – Okanagan Campus, Kelowna, BC, V1V 1V7, Canada
12
4Faculty of Medicine, School of Population and Public Health, The University of British
13
Columbia, Vancouver, BC, V6T 1Z2, Canada
14
5Womens Health Research Network, Vancouver, BC, V6H 3N1, Canada
15
6Faculty of Medicine, Department of Medicine, Division of Endocrinology, Centre for
16
Menstrual Cycle and Ovulation Research, The University of British Columbia, Vancouver,
17
BC, V5Z 1M9, Canada
18
7Faculty of Land and Food Systems, The University of British Columbia, Vancouver, BC,
19
V6T 1Z4, Canada
20
8BC Children’s Hospital Research Institute, Healthy Starts, Vancouver, BC, V5Z 4H4, BC,
21
Canada
22
23
Corresponding author: Sarah A. Purcell. The University of British Columbia Faculty of
24
Medicine Centre for Chronic Disease Prevention and Management 1088 Discovery Ave,
25
Kelowna, BC, V1V 1V7, Canada. E-mail address: sarah.purcell@ubc.ca
26
Abbreviations
27
AUC, area under the curve; BMI, body mass index; Kcal, kilocalorie; PFC, prospective food
28
consumption; RMR, resting metabolic rate; VAS, visual analog scale
29
30
31
32
33
34
35
All rights reserved. No reuse allowed without permission.
(which was not certified by peer review) is the author/funder, who has granted medRxiv a license to display the preprint in perpetuity.
The copyright holder for this preprintthis version posted March 4, 2025. ; https://doi.org/10.1101/2025.02.28.25323098doi: medRxiv preprint
NOTE: This preprint reports new research that has not been certified by peer review and should not be used to guide clinical practice.

Abstract
36
Self-reported dietary intake varies across menstrual cycle phases, but objective assessments of
37
dietary intake together with appetite and resting metabolic rate (RMR) are limited. This study
38
aimed to assess differences in appetite, dietary intake, and RMR during two hormonally-distinct
39
menstrual cycle phases in laboratory and free-living settings.
40
41
Healthy premenopausal females with predictable normal-length menstrual cycles completed two
42
study visits: one in the late-follicular and one in the mid-luteal phase. Menstrual cycle phases
43
were identified using urinary luteinizing hormone surge and cycle days. Participants consumed a
44
2-day energy- and macronutrient-balanced run-in diet prior to each visit. RMR was measured
45
with indirect calorimetry, followed by appetite ratings before and after a standardized breakfast,
46
and completed a food cravings questionnaire. Appetite was also tracked for 2.5 days post-visit in
47
a free-living environment. Ad libitum energy and macronutrient intake were measured using pre-
48
weighed plus weighing of uneaten food at an in-laboratory lunch meal, as well as during the 2.5-
49
day free-living period.
50
51
Eighteen participants were included (age: 21±4 years; body mass index: 21.2±1.5 kg/m2). There
52
were no differences between in-laboratory ad libitum energy or macronutrient intakes, appetite,
53
or food cravings between phases. RMR did not differ between phases, although the mid-luteal
54
phase RMR trended toward higher (104±218 kcal/day higher; P=0.074). No main nor interaction
55
effects for phase and time were observed for free-living dietary intake nor appetite ratings.
56
Accurate measurements show no differences in appetite or energy intake between menstrual
57
cycle phases, though RMR may be slightly elevated in the luteal phase.
58
59
Keywords: Energy balance, energy expenditure, dietary patterns, food intake, ovarian sex
60
hormones
61
62
63
64
65
66
All rights reserved. No reuse allowed without permission.
(which was not certified by peer review) is the author/funder, who has granted medRxiv a license to display the preprint in perpetuity.
The copyright holder for this preprintthis version posted March 4, 2025. ; https://doi.org/10.1101/2025.02.28.25323098doi: medRxiv preprint
Introduction
67
Characterizing energy balance (i.e., dietary intake, energy expenditure) and its determinants is
68
crucial for understanding the mechanisms of body weight regulation (1). Sex steroid hormones
69
(i.e., estrogens and progesterone) may affect different aspects of energy balance parameters
70
(2,3). This influence is particularly evident across the menstrual cycle, during which high
71
estrogen and low progesterone occur in the late-follicular phase and moderate estrogen and high
72
progesterone occur in the mid-luteal phase (4–6). These dynamic hormonal fluctuations may
73
drive changes in appetite, dietary intake, and resting metabolic rate (RMR), contributing to
74
variations in energy balance.
75
Previous research has found that hunger, dietary intake, and RMR tend be highest in the mid-
76
luteal phase of the menstrual cycle (7–13). However, much of this research has relied on self-
77
reported dietary intake, which is susceptible to bias and measurement error (14–16).
78
Furthermore, many studies have used self-reported measures to identify menstrual cycle phases,
79
which can misclassify phases and substantially impact the interpretation of energy balance in
80
different hormonal states (8,10,17–26). Moreover, few studies have measured dietary intake
81
together with energy expenditure, limiting the interpretation and generalizability of the findings
82
within the broader framework of energy balance.
83
This study aimed to address these knowledge gaps by comparing appetite sensations,
84
objectively-measured dietary intake, and RMR between late-follicular versus mid-luteal phases
85
of the menstrual cycle in healthy premenopausal females. We hypothesized that hunger,
86
prospective food consumption, dietary intake, and RMR would be higher, while satiety would be
87
lower, in the mid-luteal phase compared to the late-follicular phase.
88
Methods
89
Participants
90
Participants were recruited from the greater Kelowna community from May 2022 – September
91
2024. Healthy, premenopausal females aged 18-35 years with normal body weight (18.5-
92
24.9kg/m2) were eligible. Other major inclusion criteria included: nulliparity; regular normal-
93
length and ovulatory menstrual cycles, as indicated by self-reported menstrual cycle length
94
between 21-38 days for the past 3 cycles and ovulation identified via urinary luteinizing hormone
95
All rights reserved. No reuse allowed without permission.
(which was not certified by peer review) is the author/funder, who has granted medRxiv a license to display the preprint in perpetuity.
The copyright holder for this preprintthis version posted March 4, 2025. ; https://doi.org/10.1101/2025.02.28.25323098doi: medRxiv preprint
(LH); being sedentary or recreationally active, defined as < 300 minutes of moderate or vigorous
96
intensity exercise per week; not currently pregnant or lactating or planning to become pregnant
97
or lactate in the next 12 weeks; and ability to fast for 12 hours prior to each study visit. Major
98
exclusion criteria included: presence of a major chronic disease (e.g., cardiovascular diseases,
99
diabetes, cancer, thyroid disease, etc.); use of oral contraceptive pills or any hormone-related
100
medication; progestin-releasing intrauterine device; or medications that may affect appetite,
101
energy balance, or sleep in the past six months. Individuals who used tobacco or nicotine,
102
worked night shifts, had a history of extensive weight loss or weight loss surgery, or had food
103
intolerances or allergies that could not be accommodated were also excluded. Other exclusion
104
criteria included current or past history of eating disorders including anorexia nervosa, bulimia,
105
binge eating disorder (self-report or score >20 on the Eating Attitudes Test – 26 questionnaire
106
(27)), current severe depression or history of severe depression within the previous year (self-
107
report or 30 score > 30 on Beck Depression Inventory (28) or alcohol or drug abuse (score >1 or
108
>2 with prior principal investigator approval on the cut-annoyed-guilty-eye-opener (29)). The
109
project was approved by the University of British Columbia Clinical Research Ethics Board (ID:
110
#H22-00874) and all participants provided signed consent prior to the study.
111
Study design
112
This study consisted of a screening and baseline visit and two study visits – one in the late-
113
follicular phase and one in the mid-luteal phase of the menstrual cycle. Participants were
114
provided with a two-day energy-balanced diet before each study visit day. Appetite sensations,
115
objective (weighed) dietary intake, and RMR were measured during each of these study visits as
116
described below. Appetite sensations and objective dietary intake were also measured for 2.5
117
days following each study visit.
118
Screening and baseline visit
119
Individuals who were eligible and provided written informed consent completed a screening and
120
baseline visit to familiarize participants with the physical space in which they would complete
121
the study visits, measure body composition, assess menstrual cycle history, and review
122
instructions for measuring ovulation. Height and weight were measured using a stadiometer and
123
digital scale, respectively. Percent body fat was measured using dual-energy x-ray
124
All rights reserved. No reuse allowed without permission.
(which was not certified by peer review) is the author/funder, who has granted medRxiv a license to display the preprint in perpetuity.
The copyright holder for this preprintthis version posted March 4, 2025. ; https://doi.org/10.1101/2025.02.28.25323098doi: medRxiv preprint
absorptiometer (Hologic, Horizon DXA system, Auto Whole-Body Fan Beam, version 13.4.2.,
125
Bedford, MA, USA) to characterize the population.
126
Each participant provided their menstrual cycle history using a study-specific form to assess
127
menstrual cycle consistency for the past three months and to predict future ovulation and
128
menstrual cycle phases. At the end of the screening and baseline visit, participants were given
129
LH urine test strips with disposable collection cups to prospectively identify ovulation. Using
130
their previous menstrual cycle history, participants were asked to use the LH tests each day
131
during a 7-day period in which ovulation was likely to occur. A positive ovulation test was used
132
to ‘anchor’ study visits, with the late-follicular phase study visit scheduled 1-5 days before the
133
next predicted ovulation date and the mid-luteal phase study scheduled 6-10 days after the
134
estimated ovulation date. A minimum of one positive urinary LH test was required prior to
135
completing any study visit. Participants were asked to track their LH throughout the entire
136
duration they were enrolled throughout the study.
137
Experimental sessions
138
Run-in energy balanced diet
139
Because dietary intake in previous days may impact appetite and dietary intake on subsequent
140
days (30), participants were provided with food to support a run-in energy-balanced diet in free-
141
living settings two days before each study visit. The energy content of the run-in diets was
142
calculated using the Dietary Reference Intakes (31) with the physical activity coefficient selected
143
based on each participant’s self-reported activity level (collected at the screening and baseline
144
visit). The macronutrient content of the run-in diet was 50% carbohydrates, 30% fat, and 20%
145
protein. During this period, participants were asked to abstain from consuming any foods not
146
provided to them, but were permitted to consume beverages (e.g., tea, coffee, diet soda) if it did
147
not contain energy. If participants did consume food or calorie-containing beverages not
148
provided to them, they were instructed to send detailed information about the food (e.g., the
149
nutrition label, photos, description) via email and return the packaging to the study team.
150
Participants were given the same energy- and macronutrient-adjusted meals and snacks to
151
consume before each study visit. Four meals were prepared by a local third-party company in
152
Kelowna (Meal Prep 4 U), which were supplemented with a breakfast meal (i.e., a combination
153
of peanut butter and jelly bagels, granola with yogurt, toast with butter or jam, and egg bites) and
154
All rights reserved. No reuse allowed without permission.
(which was not certified by peer review) is the author/funder, who has granted medRxiv a license to display the preprint in perpetuity.
The copyright holder for this preprintthis version posted March 4, 2025. ; https://doi.org/10.1101/2025.02.28.25323098doi: medRxiv preprint
various snacks (e.g., granola bars, apples, bananas, trail mix, hummus, yogurt, juice boxes) for
155
each day, based on participant preferences and estimated energy requirements.
156
Study visits
157
Before each study visit, participants were asked to refrain from vigorous exercise for 48 hours,
158
avoid alcohol for 24 hours, and avoid calorie or caffeine-containing food and beverages for 12
159
hours. Each study visit was scheduled to begin between 7:30-9:30 am, with similar start times
160
(within one hour) for each study visit.
161
RMR was measured using an indirect calorimeter with a face mask (Parvomedics TrueOne 2400,
162
Murray, Utah). Gas analyzers and the flow meter were calibrated prior to each test according to
163
manufacturer’s instructions. Before each test, participants lay supine in a quiet, thermoneutral
164
(20-24°C) room for 20-25 minutes. Respiratory gas exchange was measured for 20-25 minutes.
165
The last 15 minutes of data were averaged after inspection and exclusion of data that did not
166
meet quality control targets (i.e., minute-by-minute coefficient of variation <10% for volume of
167
O2 and CO2 and RMR).
168
Following RMR testing, participants rated sensations of hunger, satiety, and prospective food
169
consumption (PFC) (32) using sliding VAS, which were covertly scored on a scale of 0-100 on a
170
computer or iPad using Research Electronic Data Capture (REDCap). These ratings were
171
completed again 30, 60, 90, 120, 150, and 180 minutes after the breakfast meal. Between VAS
172
and questionnaires, participants could complete light work on their computer, read, work, or
173
watch television and were asked to do similar activities at each study visit. Area under the curve
174
was calculated to describe differences in appetite sensations between menstrual cycle phases
175
using the trapezoidal method (33). After the 120-minute VAS assessment, participants completed
176
the 15-item Food Cravings Questionnaire – State (34). Higher scores indicated more intense food
177
cravings in that moment.
178
After the fasted VAS, participants were given a standardized breakfast meal consisting of 25% of
179
the individual's total daily estimated energy requirements (31) and the same macronutrient ratio
180
as the run-in diet (50% carbohydrates, 30% fat, and 20% protein). Each breakfast consisted of a
181
combination of toast, butter, egg quiche, fruit, yogurt and/or juice, depending on participant
182
preference and energy and macronutrient requirements. Participants consumed this meal with no
183
distractions to avoid influence from external stimuli. Participants were permitted to drink water
184
All rights reserved. No reuse allowed without permission.
(which was not certified by peer review) is the author/funder, who has granted medRxiv a license to display the preprint in perpetuity.
The copyright holder for this preprintthis version posted March 4, 2025. ; https://doi.org/10.1101/2025.02.28.25323098doi: medRxiv preprint
ad libitum during and after the breakfast meal. At the end of the 180-minute VAS, participants
185
were provided with an in-laboratory lunch meal in which each food was weighed before and
186
after consumption to objectively measure ad libitum dietary intake. This meal provided
187
approximately 1800 kcal, of which approximately 60% were from carbohydrates, 30% were
188
from fat, and 10% were from protein. Items included spaghetti, meatballs (or non-meat
189
alternative), marinara sauce, a green vegetable with butter (e.g., broccoli) or green leafy
190
vegetables, Italian dressing, ranch dressing, a medium apple, a packet of cookies, regular soda,
191
and diet soda. For this meal, participants were asked to consume as much or as little as they
192
would like until they were comfortably full and could request more of any item. This meal was
193
consumed in a quiet room with no external distractions.
194
At the completion of each study visit, participants began their free-living period, in which they
195
were provided pre-weighed food in excess of their estimated energy requirements for the
196
remainder of the study visit day and for two subsequent days. The provided foods consisted of 4-
197
6 pre-prepared meals with known energy and macronutrient content from a local company, quick
198
breakfast and alternative meal options (e.g., bread and frozen egg quiches, instant macaroni and
199
cheese) and several fresh and packaged foods that could serve as snacks or meal supplements
200
(e.g., fresh and canned fruit, granola bars, chips, assorted candies, oatmeal packets, egg bites,
201
brown and white rice, mac and cheese). While the content of the diet varied slightly based on
202
participant preferences, the total energy provided was approximately 10,500 kcal (~4,200
203
kcal/day). Similar to the in-laboratory lunch meal, participants were instructed to consume as
204
much or as little of the foods and beverages provided as they wanted and exclusively consume
205
foods provided by the laboratory. Participants were provided with the same foods for each free-
206
living ad libitum period. To confirm ad libitum dietary intake, participants were instructed to
207
take before and after photographs of all food and beverages they consumed using their phone.
208
Photos were uploaded directly to REDCap using a personal link, which recorded the time in
209
which foods were consumed. At the end of the 2.5-day period, participants were asked to bring
210
back all food and wrappers/containers so all items could be weighed by the research team.
211
Dietary energy and macronutrient intake were assessed using Food Processor Nutrition Analysis
212
Software (version 11.1; ESHA Research, Salem, OR), with entries confirmed by a research
213
assistant. Daily free-living energy intake was expressed as kcal/day and adjusted for RMR
214
(energy intake / RMR, kcal/day) To explore free-living appetite, participants also provided VAS
215
All rights reserved. No reuse allowed without permission.
(which was not certified by peer review) is the author/funder, who has granted medRxiv a license to display the preprint in perpetuity.
The copyright holder for this preprintthis version posted March 4, 2025. ; https://doi.org/10.1101/2025.02.28.25323098doi: medRxiv preprint
of hunger, satiety, and PFC in REDCap before and after each meal or snack, which were
216
averaged across days.
217
Statistical analyses
218
The sample size for this study was determined based on anticipated differences in-laboratory ad
219
libitum dietary intake between the late-follicular and mid-luteal phases of the menstrual cycle
220
(primary objective). We anticipated an effect size of 0.800, consistent with previous research
221
using similar methods that detected differences in energy intake at a single meal between
222
menstrual cycle phases that would be relevant for future nutrition strategies or care (i.e., 141 ±
223
176 kcal at a single meal (8)). A sample size of n = 14 would provide 80% power to detect mean
224
differences in energy intake between phases using a two-tailed paired t-test with a significance
225
level (α) of .05.
226
Statistical analyses were conducted using SPSS (IBM SPSS Statistics, version 29.0.00.0,
227
Chicago, IL, USA). Distribution of data was assessed using the Shapiro-Wilk test of normality.
228
Linear mixed effect models with unstructured covariance compared outcomes between menstrual
229
cycle phases while maximizing statistical power in the presence of missing data. Models
230
included participants as random effects and menstrual cycle phase (late-follicular or mid-luteal)
231
as a fixed effect; in the case of VAS and free-living appetite and dietary intake data, time
232
(fasting, 30, 60, 90, 120, 150, and 180 minutes for VAS; days 1, 2, and 3 for free-living data) and
233
their interaction terms were also included as fixed effects with an unstructured covariance
234
structure. Models with free-living appetite ratings included free-living energy intake as a
235
covariate. In cases where model residuals were not normally distributed, data were log-
236
transformed and re-analyzed, but absolute mean values were presented for ease of translation.
237
Data are presented as mean ± SD or mean ± SE unless indicated otherwise.
238
Results
239
Participant characteristics
240
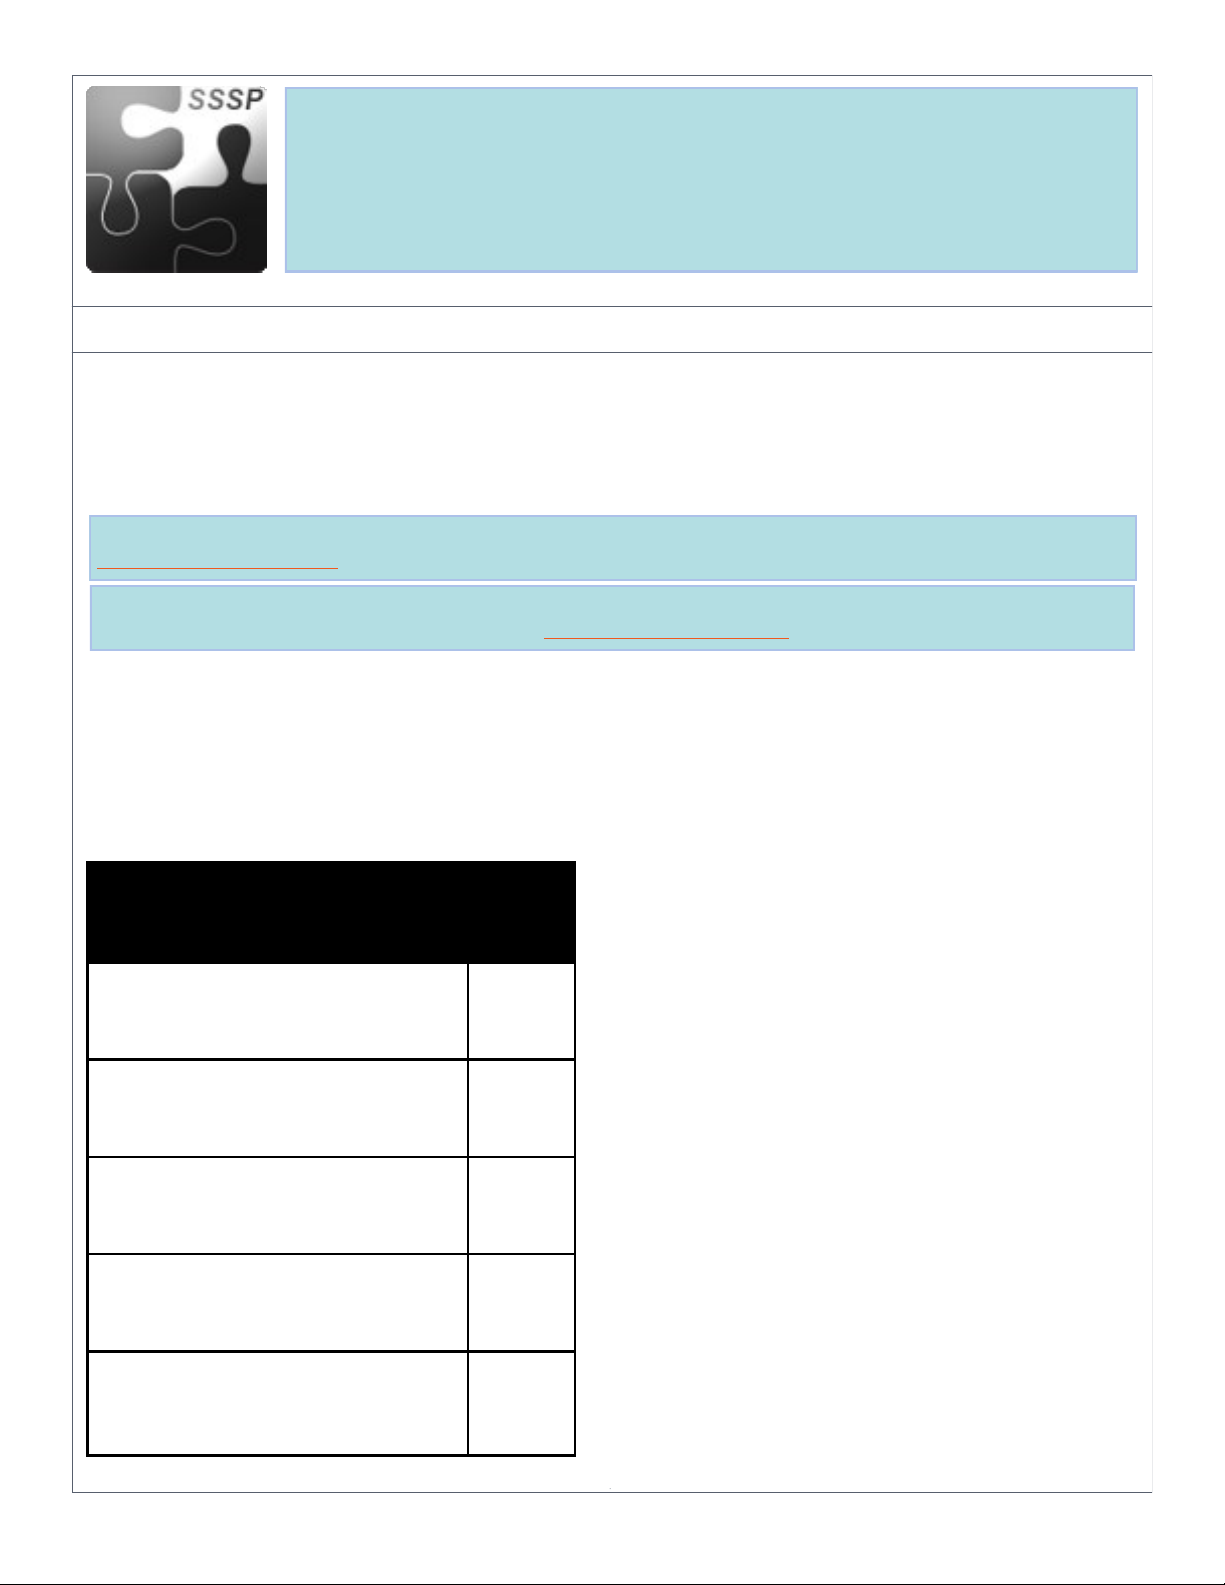
Baseline characteristics of study participants are shown in Table 1. Thirty-one females were
241
enrolled, although 13 were excluded before the first study visit due to scheduling conflicts (n =
242
6), exclusionary survey score (n = 3), dietary restrictions (n = 2), and non-response (n = 2). Of
243
the remaining 18 participants, 2 completed one visit. Four individuals had missing data for in-
244
All rights reserved. No reuse allowed without permission.
(which was not certified by peer review) is the author/funder, who has granted medRxiv a license to display the preprint in perpetuity.
The copyright holder for this preprintthis version posted March 4, 2025. ; https://doi.org/10.1101/2025.02.28.25323098doi: medRxiv preprint

laboratory ad libitum dietary intake, 7 had missing data for ad libitum dietary across a 2.5-day
245
free-living period and 6 had missing RMR data in one of the visits. There was complete data
246
from 14 participants for our primary outcome (in-laboratory ad libitum dietary intake). Data from
247
all 18 participants were included in analyses. All 18 participants had a positive ovulation test
248
(i.e., confirmed by a LH urine test) prior to their first visit. Eight participants had their first visit
249
in the late-follicular phase.
250
Table 1. Participant characteristics (n = 18)
Characteristic
Mean ± SD or n (%)
Age (years)
21 [19-24]*
Race
Black
White
East Asian
Middle Eastern
1 (6%)
13 (72%)
2 (11%)
2 (11%)
BMI (kg/m2)
21.2 ± 1.5
Percent body fat
25.0 ± 4.5
Mean cycle length (days)
30.7 ± 3.0
Number of confirmed ovulation tests
1
2
3
4
5 (28%)
10 (56%)
2 (11%)
1 (6%)
**Age (years) reported in median [interquartile range]. All
other data are reported as mean ± SD or number (%). BMI:
body mass index.
251
Appetite sensations
252
VAS ratings of in-laboratory hunger, satiety, and PFC are shown in Figure 1 and
253
Supplementary Table 1. As expected, there was a main effect of time on all VAS (all P<0.05).
254
There were no main effects of phase or phase x time interactions among the VAS, nor were there
255
effects of phase on AUC values of appetite or food cravings score (Supplementary Table 2).
256
There were also no differences in free-living ratings of hunger, satiety, or PFC (Supplementary
257
Table 3).
258
All rights reserved. No reuse allowed without permission.
(which was not certified by peer review) is the author/funder, who has granted medRxiv a license to display the preprint in perpetuity.
The copyright holder for this preprintthis version posted March 4, 2025. ; https://doi.org/10.1101/2025.02.28.25323098doi: medRxiv preprint
(insert Figure 1 here)
259
Dietary intake and resting metabolic rate
260
There were no differences in-laboratory ad libitum energy intake (Figure 2) or macronutrient
261
intake (Supplementary Table 2) between menstrual cycle phases. There were also no main
262
(phase, time) or interaction (phase x time) effects for free-living dietary intake, Supplementary
263
Table 2 and Supplementary Table 4. There were no differences in RMR between phases,
264
although there was a trend towards greater RMR in the luteal phase (104 ± 218 kcal higher in the
265
luteal phase, P=0.074, Supplementary Table 2).
266
(insert Figure 2 here)
267
Discussion
268
This study challenges the prevailing notion that appetite and energy intake consistently
269
increase during the luteal phase of the menstrual cycle. Despite common claims in previous
270
research that suggest hormonal fluctuations lead to heightened orexigenic appetite sensations and
271
greater energy intake in the luteal phase (8,10,12,17,19,22–25,35–37), our findings show no
272
significant differences in energy intake or appetite sensations, whether measured in controlled
273
laboratory conditions or real-world settings. This suggests that the menstrual cycle phase may
274
not exert as robust an effect on energy intake as previously suggested, particularly when both
275
menstrual phase and energy intake are measured with high accuracy.
276
Our findings suggest that differences in dietary intake reported in previous studies ma not
277
be solely due to biological differences, but also differences in study design, particularly in the
278
methods used to assess dietary intake and menstrual cycles. A major factor influencing
279
discrepancies across studies is the reliance on self-reported dietary intake, which is prone to
280
underreporting and bias (15). Self-reported energy intake has been estimated to be up to 522
281
kcal/day lower in the follicular phase compared to the luteal phase (22). Interestingly, studies
282
using self-reported methods, such as 24-hour dietary recalls and food diaries, often report higher
283
energy intake during the luteal phase (17,19,20,22,24,25,35–37), while studies utilizing weighed
284
food intake methods report smaller (87-207 kcal/day) or no differences (10,23). While
285
speculative, it is possible that some of this discrepancy may be due to societal perceptions of
286
dietary intake across the menstrual cycle and media messages suggesting that it is normal for
287
All rights reserved. No reuse allowed without permission.
(which was not certified by peer review) is the author/funder, who has granted medRxiv a license to display the preprint in perpetuity.
The copyright holder for this preprintthis version posted March 4, 2025. ; https://doi.org/10.1101/2025.02.28.25323098doi: medRxiv preprint
females to consume more before menstruation because of pre-menstrual syndrome may
288
contribute to self-reported energy intake inaccuracies.
289
Another important consideration for interpretation of our data in the context of the wider
290
literature is menstrual phase classification. Many prior studies have relied primarily on self-
291
reported onset of menses to determine menstrual cycle phase (8,10,17–26), which can be
292
inaccurate due to variability in cycle length, ovulation, and subclinical ovulatory disturbances
293
(38,39). This is particularly relevant because relying on a fixed 28-day cycle or averaging
294
previous cycles may lead to significant misclassification of menstrual cycle phase. Even small
295
variations in cycle length can lead to substantial shifts in hormone levels, potentially altering the
296
conclusions drawn from the data (40). For example, in a study of 39 healthy premenopausal
297
women, excluding participants with misclassified cycle phases (based on self-report vs.
298
retrospective serum hormone analysis) revealed higher energy and protein intake during the
299
luteal phase (41). This study showed that 44% of cycles could be misclassified when relying on
300
cycle history without more objective techniques, and that including such misclassified cycles
301
may alter conclusions about phase-related differences in energy intake. Studies that objectively
302
confirm menstrual phase through hormonal verification, as done in this study, are likely to yield
303
more precise comparisons. Additionally, failure to account for previous day’s dietary intake and
304
providing the same breakfast meal to all participants before postprandial appetite and energy
305
intake assessments can introduce errors, as prior dietary intake (30) and individual differences in
306
energy requirements are key factors influencing subsequent intake (42).
307
No significant differences in appetite sensations were observed in either a controlled
308
laboratory or free-living environment, as assessed by VAS. Despite the trends generally aligning
309
with expectations—namely, increased hunger in the luteal phase (8) — our findings are
310
consistent with other research showing no significant difference in appetite VAS between phases
311
(9,11). However, it is important to consider that VAS may not be sensitive enough to capture the
312
full complexity and depth of appetite regulation (43). Furthermore, appetite sensations may not
313
directly relate to self-reported energy intake (44). In free-living conditions, which are inherently
314
challenging to quantify, no phase-specific differences were detected, although the methodology
315
used to assess free-living appetite in this study has not been formally validated.
316
Previous studies have reported differences in various components of appetite related to
317
food cravings across the menstrual cycle. For example, some evidence suggests that females
318
All rights reserved. No reuse allowed without permission.
(which was not certified by peer review) is the author/funder, who has granted medRxiv a license to display the preprint in perpetuity.
The copyright holder for this preprintthis version posted March 4, 2025. ; https://doi.org/10.1101/2025.02.28.25323098doi: medRxiv preprint
experience a stronger preference for high-fat and high-sugar foods during the late-luteal phase
319
(45) and a greater desire for foods rich in sugar, salt, and fat during the premenstrual period (26).
320
Increased explicit wanting for high-fat foods (46), higher consumption of sweet foods (47), and
321
greater intake of sugar-containing beverages (21) have also been reported in the luteal phase,
322
potentially driven by hormonal fluctuations, such as elevated progesterone levels (48). Despite
323
these findings, the current study did not observe significant differences in food cravings between
324
phases, although the trends were in the expected direction. This may be due to the limitations of
325
the Food Craving Questionnaire – State, which only partially measures aspects of food cravings,
326
particularly those linked to hedonic or emotional responses, and does not comprehensively
327
account for all dimensions of appetite. Additionally, the insufficient statistical power for this
328
specific portion of the study may have limited the ability to detect significant differences.
329
We observed a non-significant increase in RMR during the luteal phase that was
330
approximately 100 kcal/day higher than in the follicular phase. Previous studies have reported
331
mixed findings, showing differences ranging from no effect to approximately 50–100 kcal/day
332
greater in the luteal phase (7,20,49). This increase may be attributed to the thermogenic effects of
333
progesterone, which is greatest in the mid-luteal phase(50). For context, energy intake in the
334
current was approximately 200 kcal/day higher in the luteal phase (although not significant),
335
exceeding the observed increase in RMR. Persistent discrepancies in energy balance over
336
prolonged periods could potentially lead to weight gain, though it remains unclear whether
337
fluctuations in endogenous sex hormones directly influence long-term weight regulation, or if the
338
increased energy balance observed in the luteal phase is counterbalanced by compensatory
339
mechanisms during the follicular phase.
340
Strengths of this study include the use of objective and accurate methods to identify
341
menstrual cycle phases and assess dietary intake in both controlled laboratory and free-living
342
settings, alongside measurements of appetite and RMR—representing a novel approach with
343
rigorous methodology. However, some limitations should be noted. The study was powered only
344
to detect differences in in-laboratory energy intake, although many previous studies have used
345
comparable or smaller sample sizes. Additionally, hormonal markers of appetite, which may
346
vary across menstrual phases, were not measured. During the 2.5-day period, participants were
347
provided with meals and snacks exceeding their caloric needs to minimize boredom, but some
348
evidence suggests that providing large portions of food may lead to spontaneous overeating .
349
All rights reserved. No reuse allowed without permission.
(which was not certified by peer review) is the author/funder, who has granted medRxiv a license to display the preprint in perpetuity.
The copyright holder for this preprintthis version posted March 4, 2025. ; https://doi.org/10.1101/2025.02.28.25323098doi: medRxiv preprint
Moreover, the study focused solely on healthy, young females with a normal BMI, limiting its
350
generalizability to other populations.
351
In conclusion, this study challenges the assumption that appetite and energy intake
352
consistently increase during the luteal phase of the menstrual cycle. Despite general trends
353
aligning with previous research—such as increased hunger, energy intake, and RMR during the
354
luteal phase—no significant differences were observed in either laboratory or free-living settings.
355
These findings suggest that menstrual phase may not have as strong an effect on energy intake as
356
previously thought, particularly when both cycle phase and dietary intake are assessed
357
accurately. These results underscore the importance of refining measurement techniques and
358
highlight the need for further research to explore the complex relationship between hormonal
359
fluctuations and appetite regulation.
360
361
Acknowledgements: We would like to sincerely thank Dr. Ali McManus and Dr. Neil Eves at
362
the University of British Columbia Okanagan for their generous support in providing access to
363
their equipment for the study visits.
364
365
Funding: None
366
367
Declaration of competing interest
368
The authors declare that they have no financial or personal relationships with other people
369
or organizations that could inappropriately influence or bias the work in this paper.
370
371
Author contributions
372
Sarah Purcell, Jonathan Little, and Jerilynn Prior designed the study. Miranda Smith and
373
Maryam Aghayan contributed to the data collection. Tamara Cohen and Zoë Soon provided
374
critical input for this study’s methods. Hephzibah Bomide contributed to the data analysis.
375
Miranda Smith was responsible for most of the data collection and analysis and wrote the
376
first draft of the manuscript. All authors edited subsequent drafts and approved the final
377
article.
378
379
380
All rights reserved. No reuse allowed without permission.
(which was not certified by peer review) is the author/funder, who has granted medRxiv a license to display the preprint in perpetuity.
The copyright holder for this preprintthis version posted March 4, 2025. ; https://doi.org/10.1101/2025.02.28.25323098doi: medRxiv preprint
Figure captions
381
Figure 1. Time course change of hunger (A), satiety (C), and prospective food consumption
382
(PFC; E) after a standardized meal. Area under the curve (AUC) for hunger (B), satiety (D),
383
and PFC (F) are also included. Values are mean ± SE. N = 17 late-follicular, n = 17 mid-luteal.
384
Figure 2. Mean energy intake (kcal) at a single meal between the late-follicular and mid-
385
luteal phases of the menstrual cycle. Values are mean ± SE. N = 16 late-follicular, n = 14 mid-
386
luteal.
387
388
References
389
1. Hall KD, Heymsfield SB, Kemnitz JW, Klein S, Schoeller DA, Speakman JR. Energy
390
balance and its components: implications for body weight regulation123. Am J Clin Nutr.
391
2012 Apr;95(4):989–94.
392
2. Hirschberg AL. Sex hormones, appetite and eating behaviour in women. Maturitas. 2012
393
Mar;71(3):248–56.
394
3. Mauvais-Jarvis F, Clegg DJ, Hevener AL. The role of estrogens in control of energy balance
395
and glucose homeostasis. Endocr Rev. 2013 Jun;34(3):309–38.
396
4. Holesh JE, Bass AN, Lord M. Physiology, Ovulation. In: StatPearls [Internet]. Treasure
397
Island (FL): StatPearls Publishing; 2024 [cited 2024 Dec 27]. Available from:
398
http://www.ncbi.nlm.nih.gov/books/NBK441996/
399
5. Reed BG, Carr BR. The Normal Menstrual Cycle and the Control of Ovulation. In: Feingold
400
KR, Anawalt B, Blackman MR, Boyce A, Chrousos G, Corpas E, et al., editors. Endotext
401
[Internet]. South Dartmouth (MA): MDText.com, Inc.; 2000 [cited 2024 Dec 27]. Available
402
from: http://www.ncbi.nlm.nih.gov/books/NBK279054/
403
6. Stricker R, Eberhart R, Chevailler MC, Quinn FA, Bischof P, Stricker R. Establishment of
404
detailed reference values for luteinizing hormone, follicle stimulating hormone, estradiol,
405
and progesterone during different phases of the menstrual cycle on the Abbott ARCHITECT
406
analyzer. Clin Chem Lab Med. 2006;44(7):883–7.
407
7. Benton MJ, Hutchins AM, Dawes JJ. Effect of menstrual cycle on resting metabolism: A
408
systematic review and meta-analysis. PloS One. 2020;15(7):e0236025.
409
8. Brennan IM, Feltrin KL, Nair NS, Hausken T, Little TJ, Gentilcore D, et al. Effects of the
410
phases of the menstrual cycle on gastric emptying, glycemia, plasma GLP-1 and insulin, and
411
All rights reserved. No reuse allowed without permission.
(which was not certified by peer review) is the author/funder, who has granted medRxiv a license to display the preprint in perpetuity.
The copyright holder for this preprintthis version posted March 4, 2025. ; https://doi.org/10.1101/2025.02.28.25323098doi: medRxiv preprint
energy intake in healthy lean women. Am J Physiol Gastrointest Liver Physiol. 2009
412
Sep;297(3):G602-610.
413
9. Campolier M, Thondre SP, Clegg M, Shafat A, Mcintosh A, Lightowler H. Changes in PYY
414
and gastric emptying across the phases of the menstrual cycle and the influence of the
415
ovarian hormones. Appetite. 2016 Dec 1;107:106–15.
416
10. Lissner L, Stevens J, Levitsky DA, Rasmussen KM, Strupp BJ. Variation in energy intake
417
during the menstrual cycle: implications for food-intake research. Am J Clin Nutr. 1988
418
Oct;48(4):956–62.
419
11. McCarthy SF, Townsend LK, McKie GL, Bornath DPD, Islam H, Gurd BJ, et al. Differential
420
changes in appetite hormones post-prandially based on menstrual cycle phase and oral
421
contraceptive use: A preliminary study. Appetite. 2024 Jul 1;198:107362.
422
12. Pelkman CL, Chow M, Heinbach RA, Rolls BJ. Short-term effects of a progestational
423
contraceptive drug on food intake, resting energy expenditure, and body weight in young
424
women. Am J Clin Nutr. 2001 Jan;73(1):19–26.
425
13. Tucker JAL, McCarthy SF, Bornath DPD, Khoja JS, Hazell TJ. The Effect of the Menstrual
426
Cycle on Energy Intake: A Systematic Review and Meta-analysis. Nutr Rev. 2024 Jul
427
15;nuae093.
428
14. Bailey RL. Overview of dietary assessment methods for measuring intakes of foods,
429
beverages, and dietary supplements in research studies. Curr Opin Biotechnol. 2021
430
Aug;70:91–6.
431
15. Burrows TL, Ho YY, Rollo ME, Collins CE. Validity of Dietary Assessment Methods When
432
Compared to the Method of Doubly Labeled Water: A Systematic Review in Adults. Front
433
Endocrinol. 2019;10:850.
434
16. Poslusna K, Ruprich J, de Vries JHM, Jakubikova M, van’t Veer P. Misreporting of energy
435
and micronutrient intake estimated by food records and 24 hour recalls, control and
436
adjustment methods in practice. Br J Nutr. 2009 Jul;101 Suppl 2:S73-85.
437
17. Barr SI, Janelle KC, Prior JC. Energy intakes are higher during the luteal phase of ovulatory
438
menstrual cycles. Am J Clin Nutr. 1995 Jan;61(1):39–43.
439
18. Bryant M, Truesdale KP, Dye L. Modest changes in dietary intake across the menstrual
440
cycle: implications for food intake research. Br J Nutr. 2006 Nov;96(5):888–94.
441
All rights reserved. No reuse allowed without permission.
(which was not certified by peer review) is the author/funder, who has granted medRxiv a license to display the preprint in perpetuity.
The copyright holder for this preprintthis version posted March 4, 2025. ; https://doi.org/10.1101/2025.02.28.25323098doi: medRxiv preprint
19. Cheikh Ismail LI, Al-Hourani H, Lightowler HJ, Aldhaheri AS, Henry CJK. Energy and
442
nutrient intakes during different phases of the menstrual cycle in females in the United Arab
443
Emirates. Ann Nutr Metab. 2009;54(2):124–8.
444
20. Elliott SA, Ng J, Leow MKS, Henry CJK. The influence of the menstrual cycle on energy
445
balance and taste preference in Asian Chinese women. Eur J Nutr. 2015 Dec;54(8):1323–32.
446
21. Fong AK, Kretsch MJ. Changes in dietary intake, urinary nitrogen, and urinary volume
447
across the menstrual cycle. Am J Clin Nutr. 1993 Jan;57(1):43–6.
448
22. Gil YRC, Fagundes RLM, Santos E, Calvo MCM, Bernardine JD. Relation of menstrual
449
cycle and alimentary consumption of women. E-SPEN Eur E-J Clin Nutr Metab. 2009
450
Oct;4(5):e257–60.
451
23. Gong EJ, Garrel D, Calloway DH. Menstrual cycle and voluntary food intake. Am J Clin
452
Nutr. 1989 Feb;49(2):252–8.
453
24. Kammoun I, Ben Saâda W, Sifaou A, Haouat E, Kandara H, Ben Salem L, et al. Change in
454
women’s eating habits during the menstrual cycle. Ann Endocrinol. 2017 Feb;78(1):33–7.
455
25. Maury-Sintjago E, Rodríguez-Fernández A, Parra-Flores J, Ruíz-De la Fuente M. Obese
456
Women Have a High Carbohydrate Intake without Changes in the Resting Metabolic Rate in
457
the Luteal Phase. Nutrients. 2022 May 10;14(10):1997.
458
26. Souza LB de, Martins KA, Cordeiro MM, Rodrigues Y de S, Rafacho BPM, Bomfim RA.
459
Do Food Intake and Food Cravings Change during the Menstrual Cycle of Young Women?
460
Rev Bras Ginecol E Obstet Rev Fed Bras Soc Ginecol E Obstet. 2018 Nov;40(11):686–92.
461
27. Garner DM, Olmsted MP, Bohr Y, Garfinkel PE. The eating attitudes test: psychometric
462
features and clinical correlates. Psychol Med. 1982 Nov;12(4):871–8.
463
28. Beck AT, Steer RA, Ball R, Ranieri W. Comparison of Beck Depression Inventories -IA and
464
-II in psychiatric outpatients. J Pers Assess. 1996 Dec;67(3):588–97.
465
29. Brown RL, Rounds LA. Conjoint screening questionnaires for alcohol and other drug abuse:
466
criterion validity in a primary care practice. Wis Med J. 1995;94(3):135–40.
467
30. Bray GA, Flatt JP, Volaufova J, Delany JP, Champagne CM. Corrective responses in human
468
food intake identified from an analysis of 7-d food-intake records. Am J Clin Nutr. 2008
469
Dec;88(6):1504–10.
470
All rights reserved. No reuse allowed without permission.
(which was not certified by peer review) is the author/funder, who has granted medRxiv a license to display the preprint in perpetuity.
The copyright holder for this preprintthis version posted March 4, 2025. ; https://doi.org/10.1101/2025.02.28.25323098doi: medRxiv preprint
31. Read “Dietary Reference Intakes for Energy, Carbohydrate, Fiber, Fat, Fatty Acids,
471
Cholesterol, Protein, and Amino Acids” at NAP.edu [Internet]. [cited 2024 Dec 27].
472
Available from: https://nap.nationalacademies.org/read/10490/chapter/1
473
32. Flint A, Raben A, Blundell JE, Astrup A. Reproducibility, power and validity of visual
474
analogue scales in assessment of appetite sensations in single test meal studies. Int J Obes
475
Relat Metab Disord J Int Assoc Study Obes. 2000 Jan;24(1):38–48.
476
33. Allison DB, Paultre F, Maggio C, Mezzitis N, Pi-Sunyer FX. The Use of Areas Under
477
Curves in Diabetes Research. Diabetes Care. 1995 Feb 1;18(2):245–50.
478
34. Cepeda-Benito A, Gleaves DH, Williams TL, Erath SA. The development and validation of
479
the state and trait food-cravings questionnaires. Behav Ther. 2000;31(1):151–73.
480
35. Johnson WG, Corrigan SA, Lemmon CR, Bergeron KB, Crusco AH. Energy regulation over
481
the menstrual cycle. Physiol Behav. 1994 Sep;56(3):523–7.
482
36. Li ET, Tsang LB, Lui SS. Menstrual cycle and voluntary food intake in young Chinese
483
women. Appetite. 1999 Aug;33(1):109–18.
484
37. Martini MC, Lampe JW, Slavin JL, Kurzer MS. Effect of the menstrual cycle on energy and
485
nutrient intake. Am J Clin Nutr. 1994 Dec;60(6):895–9.
486
38. Schmalenberger KM, Tauseef HA, Barone JC, Owens SA, Lieberman L, Jarczok MN, et al.
487
How to study the menstrual cycle: Practical tools and recommendations.
488
Psychoneuroendocrinology. 2021 Jan;123:104895.
489
39. Noordhof DA, Taylor MY, De Martin Topranin V, Engseth TP, Sandbakk Ø, Osborne JO.
490
Agreement Between the 2- and 3-Step Methods for Identifying Subtle Menstrual
491
Disturbances. Int J Sports Physiol Perform. 2024 Sep 1;19(9):953–7.
492
40. Fehring RJ, Schneider M, Raviele K. Variability in the Phases of the Menstrual Cycle. J
493
Obstet Gynecol Neonatal Nurs. 2006 May;35(3):376–84.
494
41. Chung SC, Bond EF, Jarrett ME. Food intake changes across the menstrual cycle in
495
Taiwanese women. Biol Res Nurs. 2010 Jul;12(1):37–46.
496
42. Trumbo P, Schlicker S, Yates AA, Poos M. Dietary Reference Intakes for Energy,
497
Carbohydrate, Fiber, Fat, Fatty Acids, Cholesterol, Protein and Amino Acids. J Am Diet
498
Assoc. 2002 Nov 1;102(11):1621–30.
499
All rights reserved. No reuse allowed without permission.
(which was not certified by peer review) is the author/funder, who has granted medRxiv a license to display the preprint in perpetuity.
The copyright holder for this preprintthis version posted March 4, 2025. ; https://doi.org/10.1101/2025.02.28.25323098doi: medRxiv preprint
43. Gibbons C, Hopkins M, Beaulieu K, Oustric P, Blundell JE. Issues in Measuring and
500
Interpreting Human Appetite (Satiety/Satiation) and Its Contribution to Obesity. Curr Obes
501
Rep. 2019;8(2):77–87.
502
44. Doucet E, St-Pierre S, Alméras N, Tremblay A. Relation between appetite ratings before and
503
after a standard meal and estimates of daily energy intake in obese and reduced obese
504
individuals. Appetite. 2003 Apr;40(2):137–43.
505
45. McVay MA, Copeland AL, Newman HS, Geiselman PJ. Food cravings and food cue
506
responding across the menstrual cycle in a non-eating disordered sample. Appetite. 2012
507
Oct;59(2):591–600.
508
46. McNeil J, Cameron JD, Finlayson G, Blundell JE, Doucet É. Greater overall olfactory
509
performance, explicit wanting for high fat foods and lipid intake during the mid-luteal phase
510
of the menstrual cycle. Physiol Behav. 2013 Mar;112–113:84–9.
511
47. Bowen DJ, Grunberg NE. Variations in food preference and consumption across the
512
menstrual cycle. Physiol Behav. 1990 Feb;47(2):287–91.
513
48. Krishnan S, Tryon RR, Horn WF, Welch L, Keim NL. Estradiol, SHBG and leptin interplay
514
with food craving and intake across the menstrual cycle. Physiol Behav. 2016 Oct
515
15;165:304–12.
516
49. Lariviere F, Moussalli R, Garrel DR. Increased leucine flux and leucine oxidation during the
517
luteal phase of the menstrual cycle in women. Am J Physiol-Endocrinol Metab [Internet].
518
1994 Sep 1 [cited 2025 Feb 11]; Available from:
519
https://journals.physiology.org/doi/10.1152/ajpendo.1994.267.3.E422
520
50. Baker FC, Siboza F, Fuller A. Temperature regulation in women: Effects of the menstrual
521
cycle. Temperature. 2020 Jul 2;7(3):226–62.
522
All rights reserved. No reuse allowed without permission.
(which was not certified by peer review) is the author/funder, who has granted medRxiv a license to display the preprint in perpetuity.
The copyright holder for this preprintthis version posted March 4, 2025. ; https://doi.org/10.1101/2025.02.28.25323098doi: medRxiv preprint