Artificial Intelligence Index Report 2025 PDF Free Download
1 / 457


/457
100%

Articial Intelligence
Index Report 2025

Articial Intelligence
Index Report 2025
1
Welcome to the eighth edition of the AI Index report. The 2025 Index is our most comprehensive to date and arrives at an
important moment, as AI’s inuence across society, the economy, and global governance continues to intensify. New in
this year’s report are in-depth analyses of the evolving landscape of AI hardware, novel estimates of inference costs, and
new analyses of AI publication and patenting trends. We also introduce fresh data on corporate adoption of responsible AI
practices, along with expanded coverage of AI’s growing role in science and medicine.
Since its founding in 2017 as an oshoot of the One Hundred Year Study of Articial Intelligence, the AI Index has been
committed to equipping policymakers, journalists, executives, researchers, and the public with accurate, rigorously validated,
and globally sourced data. Our mission has always been to help these stakeholders make better-informed decisions about the
development and deployment of AI. In a world where AI is discussed everywhere—from boardrooms to kitchen tables—this
mission has never been more essential.
The AI Index continues to lead in tracking and interpreting the most critical trends shaping the eld—from the shifting
geopolitical landscape and the rapid evolution of underlying technologies, to AI’s expanding role in business, policymaking,
and public life. Longitudinal tracking remains at the heart of our mission. In a domain advancing at breakneck speed, the Index
provides essential context—helping us understand where AI stands today, how it got here, and where it may be headed next.
Recognized globally as one of the most authoritative resources on articial intelligence, the AI Index has been cited in major
media outlets such as The New York Times, Bloomberg, and The Guardian; referenced in hundreds of academic papers;
and used by policymakers and government agencies around the world. We have briefed companies like Accenture, IBM,
Wells Fargo, and Fidelity on the state of AI, and we continue to serve as an independent source of insights for the global AI
ecosystem.
Introduction to the
AI Index Report 2025

Articial Intelligence
Index Report 2025
2
As AI continues to reshape our lives, the corporate world, and public discourse, the AI Index continues to track its progress—
oering an independent, data-driven perspective on AI’s development, adoption, and impact, across time and geography.
What a year 2024 has been for AI. The recognition of AI’s role in advancing humanity’s knowledge is reected in Nobel prizes in
physics and chemistry, and the Turing award for foundational work in reinforcement learning. The once-formidable Turing Test
is no longer considered an ambitious goal, having been surpassed by today’s sophisticated systems. Meanwhile, AI adoption has
accelerated at an unprecedented rate, as millions of people are now using AI on a regular basis both for their professional work
and leisure activities. As high-performing, low-cost, and openly available models proliferate, AI’s accessibility and impact are set
to expand even further.
After a brief slowdown, corporate investment in AI rebounded. The number of newly funded generative AI startups nearly
tripled, and after years of sluggish uptake, business adoption accelerated signicantly in 2024. AI has moved from the margins
to become a central driver of business value.
Governments, too, are ramping up their involvement. Policymakers are no longer just debating AI—they’re investing in it. Several
countries launched billion-dollar national AI infrastructure initiatives, including major eorts to expand energy capacity to
support AI development. Global coordination is increasing, even as local initiatives take shape.
Yet trust remains a major challenge. Fewer people believe AI companies will safeguard their data, and concerns about fairness
and bias persist. Misinformation continues to pose risks, particularly in elections and the proliferation of deepfakes. In response,
governments are advancing new regulatory frameworks aimed at promoting transparency, accountability, and fairness. Public
attitudes are also shifting. While skepticism remains, a global survey in 2024 showed a notable rise in optimism about AI’s
potential to deliver broad societal benets.
AI is no longer just a story of what’s possible—it’s a story of what’s happening now and how we are collectively shaping the
future of humanity. Explore this year’s AI Index report and see for yourself.
Yolanda Gil and Raymond Perrault
Co-directors, AI Index Report
Message From the Co-directors

Articial Intelligence
Index Report 2025
3
Top Takeaways
1. AI performance on demanding benchmarks continues to improve. In 2023, researchers introduced new
benchmarks—MMMU, GPQA, and SWE-bench—to test the limits of advanced AI systems. Just a year later, performance sharply
increased: scores rose by 18.8, 48.9, and 67.3 percentage points on MMMU, GPQA, and SWE-bench, respectively. Beyond
benchmarks, AI systems made major strides in generating high-quality video, and in some settings, language model agents even
outperformed humans in programming tasks with limited time budgets.
2. AI is increasingly embedded in everyday life. From healthcare to transportation, AI is rapidly moving from the lab
to daily life. In 2023, the FDA approved 223 AI-enabled medical devices, up from just six in 2015. On the roads, self-driving cars
are no longer experimental: Waymo, one of the largest U.S. operators, provides over 150,000 autonomous rides each week, while
Baidu’s aordable Apollo Go robotaxi eet now serves numerous cities across China.
3. Business is all in on AI, fueling record investment and usage, as research continues to show strong
productivity impacts. In 2024, U.S. private AI investment grew to $109.1 billion—nearly 12 times China’s $9.3 billion and
24 times the U.K.’s $4.5 billion. Generative AI saw particularly strong momentum, attracting $33.9 billion globally in private
investment—an 18.7% increase from 2023. AI business usage is also accelerating: 78% of organizations reported using AI in
2024, up from 55% the year before. Meanwhile, a growing body of research conrms that AI boosts productivity and, in most
cases, helps narrow skill gaps across the workforce.
4. The U.S. still leads in producing top AI models—but China is closing the performance gap. In 2024, U.S.-
based institutions produced 40 notable AI models, compared to China’s 15 and Europe’s three. While the U.S. maintains its lead
in quantity, Chinese models have rapidly closed the quality gap: performance dierences on major benchmarks such as MMLU
and HumanEval shrank from double digits in 2023 to near parity in 2024. China continues to lead in AI publications and patents.
Model development is increasingly global, with notable launches from the Middle East, Latin America, and Southeast Asia.
5. The responsible AI ecosystem evolves—unevenly. AI-related incidents are rising sharply, yet standardized RAI
evaluations remain rare among major industrial model developers. However, new benchmarks like HELM Safety, AIR-Bench,
and FACTS oer promising tools for assessing factuality and safety. Among companies, a gap persists between recognizing RAI
risks and taking meaningful action. In contrast, governments are showing increased urgency: In 2024, global cooperation on AI
governance intensied, with organizations including the OECD, EU, U.N., and African Union releasing frameworks focused on
transparency, trustworthiness, and other core responsible AI principles.

Articial Intelligence
Index Report 2025
4
Top Takeaways (cont’d)
6. Global AI optimism is rising—but deep regional divides remain. In countries like China (83%), Indonesia (80%),
and Thailand (77%), strong majorities see AI products and services as more benecial than harmful. In contrast, optimism remains
far lower in places like Canada (40%), the United States (39%), and the Netherlands (36%). Still, sentiment is shifting: Since 2022,
optimism has grown signicantly in several previously skeptical countries, including Germany (+10%), France (+10%), Canada
(+8%), Great Britain (+8%), and the United States (+4%).
7. AI becomes more ecient, aordable, and accessible. Driven by increasingly capable small models, the inference
cost for a system performing at the level of GPT-3.5 dropped over 280-fold between November 2022 and October 2024. At
the hardware level, costs have declined by 30% annually, while energy eciency has improved by 40% each year. Open-weight
models are closing the gap with closed models, reducing the performance dierence from 8% to just 1.7% on some benchmarks
in a single year. Together, these trends are rapidly lowering the barriers to advanced AI.
8. Governments are stepping up on AI—with regulation and investment. In 2024, U.S. federal agencies introduced
59 AI-related regulations—more than double the number in 2023—and issued by twice as many agencies. Globally, legislative
mentions of AI rose 21.3% across 75 countries since 2023, marking a ninefold increase since 2016. Alongside growing attention,
governments are investing at scale: Canada pledged $2.4 billion, China launched a $47.5 billion semiconductor fund, France
committed €109 billion, India pledged $1.25 billion, and Saudi Arabia’s Project Transcendence represents a $100 billion initiative.
9. AI and computer science education is expanding—but gaps in access and readiness persist. Two-thirds
of countries now oer or plan to oer K–12 CS education—twice as many as in 2019—with Africa and Latin America making
the most progress. In the U.S., the number of graduates with bachelor’s degrees in computing has increased 22% over the last
10 years. Yet access remains limited in many African countries due to basic infrastructure gaps like electricity. In the U.S., 81% of
K–12 CS teachers say AI should be part of foundational CS education, but less than half feel equipped to teach it.
10. Industry is racing ahead in AI—but the frontier is tightening. Nearly 90% of notable AI models in 2024 came
from industry, up from 60% in 2023, while academia remains the top source of highly cited research. Model scale continues to
grow rapidly—training compute doubles every ve months, datasets every eight, and power use annually. Yet performance gaps
are shrinking: the Elo skill score dierence between the top and 10th-ranked models fell from 11.9% to 5.4% in a year, and the top
two are now separated by just 0.7%. The frontier is increasingly competitive—and increasingly crowded.

Articial Intelligence
Index Report 2025
5
Top Takeaways (cont’d)
11. AI earns top honors for its impact on science. AI’s growing importance is reected in major scientic awards:
Two Nobel Prizes recognized work that led to deep learning (physics) and to its application to protein folding (chemistry),
while the Turing Award honored groundbreaking contributions to reinforcement learning.
12. Complex reasoning remains a challenge. AI models excel at tasks like International Mathematical Olympiad
problems but still struggle with complex reasoning benchmarks like PlanBench. They often fail to reliably solve logic tasks even
when provably correct solutions exist, limiting their eectiveness in high-stakes settings where precision is critical.

Articial Intelligence
Index Report 2025
6
Chair Members
Raymond Perrault
SRI International
Chair-elect
Yolanda Gil
University of Southern
California, Information
Sciences Institute
Research Manager and Editor-in-Chief
Nestor Maslej, Stanford University
Research Associate
Loredana Fattorini, Stanford University
Aliated Researchers
Elif Kiesow Cortez, Stanford Law School Research Fellow
Julia Betts Lotufo, Researcher
Anka Reuel, Stanford University
Alexandra Rome, Researcher
Angelo Salatino, Knowledge Media Institute,
The Open University
Lapo Santarlasci, IMT School for Advanced Studies Lucca
Erik Brynjolfsson
Stanford University
Jack Clark
Anthropic, OECD
John Etchemendy
Stanford University
Katrina Ligett
Hebrew University
Terah Lyons
JPMorgan Chase & Co.
James Manyika
Google, University of
Oxford
Juan Carlos Niebles
Stanford University,
Salesforce
Steering Committee
Sta and Researchers
Vanessa Parli
Stanford University
Yoav Shoham
Stanford University,
AI21 Labs
Russell Wald
Stanford University
Tobi Walsh
UNSW Sydney
Graduate Researchers
Emily Capstick, Stanford University
Malou van Draanen Glismann, Stanford University
Njenga Kariuki, Stanford University
Undergraduate Researchers
Armin Hamrah, Claremont McKenna College
Sukrut Oak, Stanford University
Ngorli Fii Paintsil, Stanford University
Andrew Shi, Stanford University

Articial Intelligence
Index Report 2025
7
The AI Index was conceived within the One Hundred Year Study on Articial Intelligence (AI100).
The AI Index welcomes feedback and new ideas for next year. Contact us at nmaslej@stanford.edu.
The AI Index acknowledges that while authored by a team of human researchers, its writing process was aided by AI tools.
Specically, the authors used ChatGPT and Claude to help tighten and copy edit initial drafts. The workow involved authors
writing the original copy and utilizing AI tools as part of the editing process.
Nestor Maslej, Loredana Fattorini, Raymond Perrault, Yolanda Gil, Vanessa Parli, Njenga Kariuki, Emily Capstick, Anka Reuel, Erik
Brynjolfsson, John Etchemendy, Katrina Ligett, Terah Lyons, James Manyika, Juan Carlos Niebles, Yoav Shoham, Russell Wald,
Tobi Walsh, Armin Hamrah, Lapo Santarlasci, Julia Betts Lotufo, Alexandra Rome, Andrew Shi, Sukrut Oak. “The AI Index 2025
Annual Report,” AI Index Steering Committee, Institute for Human-Centered AI, Stanford University, Stanford, CA, April 2025.
The AI Index 2025 Annual Report by Stanford University is licensed under Attribution-NoDerivatives 4.0 International.
The AI Index 2025 Report is supplemented by raw data and an interactive tool. We invite each reader to use the data and the
tool in a way most relevant to their work and interests.
• Raw data and charts: The public data and high-resolution images of all the charts in the report are available on
Google Drive.
• Global AI Vibrancy Tool: Compare the AI ecosystems of over 30 countries. The Global AI Vibrancy tool will be
updated in the summer of 2025.
The AI Index is an independent initiative at the Stanford Institute for Human-Centered Articial Intelligence (HAI).
How to Cite This Report
Public Data and Tools
AI Index and Stanford HAI

Articial Intelligence
Index Report 2025
8
Supporting Partners
Analytics and Research Partners
Articial Intelligence
Index Report 2025
9
Introduction
Loredana Fattorini, Yolanda Gil, Nestor Maslej, Vanessa Parli, Ray Perrault
Chapter 1: Research and Development
Nancy Amato, Andrea Brown, Ben Cottier, Lucía Ronchi Darré, Virginia Dignum, Meredith Ellison, Robin Evans, Loredana Fattorini,
Yolanda Gil, Armin Hamrah, Katrina Ligett, Nestor Maslej, Maurice Pagnucco, Ngorli Fii Paintsil, Vanessa Parli, Ray Perrault,
Robi Rahman, Christine Raval, Vesna Sabljakovic-Fritz, Angelo Salatino, Lapo Santarlasci, Andrew Shi, Nathan Sturtevant, Daniel
Weld, Kevin Xu, Meg Young
Chapter 2: Technical Performance
Rishi Bommasani, Erik Brynjolfsson, Loredana Fattorini, Tobi Gertsenberg, Yolanda Gil, Noah Goodman, Nicholas Haber, Armin
Hamrah, Sanmi Koyejo, Percy Liang, Katrina Ligett, Nestor Maslej, Juan Carlos Niebles, Sukrut Oak, Vanessa Parli, Marco Pavone,
Ray Perrault, Anka Reuel, Andrew Shi, Yoav Shoham, Toby Walsh
Chapter 3: Responsible AI
Medha Bankhwal, Emily Capstick, Dmytro Chumachenko, Patrick Connolly, Natalia Dorogi, Loredana Fattorini, Ann Fitz-Gerald,
Yolanda Gil, Armin Hamrah, Ariel Lee, Katrina Ligett, Shayne Longpre, Natasha Maniar, Nestor Maslej, Katherine Ottenbreit,
Halyna Padalko, Vanessa Parli, Ray Perrault, Brittany Presten, Anka Reuel, Roger Roberts, Andrew Shi, Georgio Stoev, Shekhar
Tewari, Dikshita Venkatesh, Cayla Volandes, Jakub Wiatrak
Chapter 4: Economy
Medha Bankhwal, Erik Brynjolfsson, Mar Carpanelli, Cara Christopher, Michael Chui, Natalia Dorogi, Heather English, Murat
Erer, Loredana Fattorini, Yolanda Gil, Heather Hanselman, Rosie Hood, Vishy Kamalapuram, Kory Kantenga, Njenga Kariuki,
Akash Kaura, Elena Magrini, Nestor Maslej, Katherine Ottenbreit, Vanessa Parli, Ray Perrault, Brittany Presten, Roger Roberts,
Cayla Volandes, Casey Weston, Hansen Yang
Chapter 5: Science and Medicine
Russ Altman, Kameron Black, Jonathan Chen, Jean-Benoit Delbrouck, Joshua Edrich, Loredana Fattorini, Alejandro Lozano,
Yolanda Gil, Ethan Goh, Armin Hamrah, Fateme Nateghi Haredasht, Tina Hernandez-Boussard, Yeon Mi Hwang, Rohan Koodli,
Arman Koul, Curt Langlotz, Ashley Lewis, Chase Ludwig, Stephen P. Ma, Abdoul Jalil Djiberou Mahamadou, David Magnus,
James Manyika, Nestor Maslej, Gowri Nayar, Madelena Ng, Sophie Ostmeier, Vanessa Parli, Ray Perrault, Malkiva Pillai, Ossian
Karl-Johan Ferdinand Rabow, Sean Riordan, Brennan Geti Simon, Kotoha Togami, Artem Trotsyuk, Maya Varma, Quinn Waeiss,
Betty Xiong
Chapter 6: Policy
Elif Kiesow Cortez, Loredana Fattorini, Yolanda Gil, Julia Betts Lotufo, Vanessa Parli, Ray Perrault, Alexandra Rome, Lapo
Santarlasci, Georgio Stoev, Russell Wald, Daniel Zhang
The AI Index would like to acknowledge the following individuals by chapter and section for their contributions of data,
analysis, advice, and expert commentary included in the AI Index Report 2025:
Contributors

Articial Intelligence
Index Report 2025
10
Chapter 7: Education
John Etchemendy, Loredana Fattorini, Lili Gangas, Yolanda Gil, Rachel Goins, Laura Hinton, Sonia Koshy, Kirsten Lundgren,
Nestor Maslej, Lisa Cruz Novohatski, Vanessa Parli, Ray Perrault, Allison Scott, Andreen Soley, Bryan Twarek, Laurens Vehmeijer
Chapter 8: Public Opinion
Emily Capstick, John Etchemendy, Loredana Fattorini, Yolanda Gil, Njenga Kariuki, Nestor Maslej, Vanessa Parli, Ray Perrault
Organizations
Contributors (cont’d)
The AI Index would like to acknowledge the following individuals by chapter and section for their contributions of data,
analysis, advice, and expert commentary included in the AI Index Report 2025:
Accenture
Arnab Chakraborty, Patrick Connolly, Shekhar Tewari,
Dikshita Venkatesh, Jakub Wiatrak
Epoch AI
Ben Cottier, Robi Rahman
GitHub
Lucía Ronchi Darré, Kevin Xu
Lightcast
Cara Christopher, Elena Magrini
LinkedIn
Mar Carpanelli, Akash Kaura, Kory Kantenga,
Rosie Hood, Casey Weston
McKinsey & Company
Medha Bankhwal, Natalia Dorogi, Natasha Maniar,
Katherine Ottenbreit, Brittany Presten, Roger Roberts,
Cayla Volandes
Quid
Heather English, Hansen Yang
The AI Index also thanks Jeanina Matias, Nancy King, Carolyn Lehman, Shana Lynch, Jonathan Mindes, and Michi Turner
for their help in preparing this report; Christopher Ellis for his help in maintaining the AI Index website; and Annie Benisch,
Stacey Sickels Boyce, Marc Gough, Caroline Meinhardt, Drew Spence, Casey Weston, Madeleine Wright, and Daniel Zhang
for their work in helping promote the report.

Articial Intelligence
Index Report 2025
11
Report Highlights 12
Chapter 1 Research and Development 24
Chapter 2 Technical Performance 81
Chapter 3 Responsible AI 160
Chapter 4 Economy 214
Chapter 5 Science and Medicine 280
Chapter 6 Policy and Governance 323
Chapter 7 Education 364
Chapter 8 Public Opinion 394
Appendix 414
ACCESS THE PUBLIC DATA
Table of Contents
Articial Intelligence
Index Report 2025

Articial Intelligence
Index Report 2025
12
Report Highlights
1. Industry continues to make signicant investments in AI and leads in notable AI model development,
while academia leads in highly cited research. Industry’s lead in notable model development, highlighted in the two
previous AI Index reports, has only grown more pronounced, with nearly 90% of notable models in 2024 (compared to 60%
in 2023) originating from industry. Academia has remained the single leading institutional producer of highly cited (top 100)
publications over the past three years.
2. China leads in AI research publication totals, while the United States leads in highly inuential research.
In 2023, China produced more AI publications (23.2%) and citations (22.6%) than any other country. Over the past three years,
U.S. institutions have contributed the most top-100-cited AI publications.
3. AI publication totals continue to grow and increasingly dominate computer science. Between 2013 and
2023, the total number of AI publications in venues related to computer science and other scientic disciplines nearly tripled,
increasing from approximately 102,000 to over 242,000. Proportionally, AI’s share of computer science publications has risen
from 21.6% in 2013 to 41.8% in 2023.
4. The United States continues to be the leading source of notable AI models. In 2024, U.S.-based institutions
produced 40 notable AI models, signicantly surpassing China’s 15 and Europe’s combined total of three. In the past decade,
more notable machine learning models have originated from the United States than any other country.
5. AI models get increasingly bigger, more computationally demanding, and more energy intensive.
New research nds that the training compute for notable AI models doubles approximately every ve months, dataset sizes
for training LLMs every eight months, and the power required for training annually. Large-scale industry investment continues
to drive model scaling and performance gains.
6. AI models become increasingly cheaper to use. The cost of querying an AI model that scores the equivalent of
GPT-3.5 (64.8) on MMLU, a popular benchmark for assessing language model performance, dropped from $20.00 per million
tokens in November 2022 to just $0.07 per million tokens by October 2024 (Gemini-1.5-Flash-8B)—a more than 280-fold
reduction in approximately 18 months. Depending on the task, LLM inference prices have fallen anywhere from 9 to 900 times
per year.
CHAPTER 1:
Research and Development

Articial Intelligence
Index Report 2025
13
Report Highlights
7. AI patenting is on the rise. Between 2010 and 2023, the number of AI patents has grown steadily and signicantly,
ballooning from 3,833 to 122,511. In just the last year, the number of AI patents has risen 29.6%. As of 2023, China leads in total
AI patents, accounting for 69.7% of all grants, while South Korea and Luxembourg stand out as top AI patent producers on a
per capita basis.
8. AI hardware gets faster, cheaper, and more energy ecient. New research suggests that machine learning
hardware performance, measured in 16-bit oating-point operations, has grown 43% annually, doubling every 1.9 years. Price
performance has improved, with costs dropping 30% per year, while energy eciency has increased by 40% annually.
9. Carbon emissions from AI training are steadily increasing. Training early AI models, such as AlexNet (2012), had
modest amounts of carbon emissions at 0.01 tons. More recent models have signicantly higher emissions for training: GPT-3
(2020) at 588 tons, GPT-4 (2023) at 5,184 tons, and Llama 3.1 405B (2024) at 8,930 tons. For perspective, the average American
emits 18 tons of carbon per year.
1. AI masters new benchmarks faster than ever. In 2023, AI researchers introduced several challenging new
benchmarks, including MMMU, GPQA, and SWE-bench, aimed at testing the limits of increasingly capable AI systems. By 2024,
AI performance on these benchmarks saw remarkable improvements, with gains of 18.8 and 48.9 percentage points on MMMU
and GPQA, respectively. On SWE-bench, AI systems could solve just 4.4% of coding problems in 2023—a gure that jumped
to 71.7% in 2024.
2. Open-weight models catch up. Last year’s AI Index revealed that leading open-weight models lagged signicantly
behind their closed-weight counterparts. By 2024, this gap had nearly disappeared. In early January 2024, the leading closed-
weight model outperformed the top open-weight model by 8.0% on the Chatbot Arena Leaderboard. By February 2025, this gap
had narrowed to 1.7%.
CHAPTER 1:
Research and Development (cont’d)
CHAPTER 2:
Technical Performance

Articial Intelligence
Index Report 2025
14
3. The gap closes between Chinese and U.S. models. In 2023, leading American models signicantly outperformed
their Chinese counterparts—a trend that no longer holds. At the end of 2023, performance gaps on benchmarks such as MMLU,
MMMU, MATH, and HumanEval were 17.5, 13.5, 24.3, and 31.6 percentage points, respectively. By the end of 2024, these
margins had narrowed substantially to 0.3, 8.1, 1.6, and 3.7 percentage points.
4. AI model performance converges at the frontier. According to last year’s AI Index, the Elo score dierence
between the top and 10th-ranked model on the Chatbot Arena Leaderboard was 11.9%. By early 2025, this gap had narrowed to
5.4%. Likewise, the dierence between the top two models shrank from 4.9% in 2023 to just 0.7% in 2024. The AI landscape is
becoming increasingly competitive, with high-quality models now available from a growing number of developers.
5. New reasoning paradigms like test-time compute improve model performance. In 2024, OpenAI
introduced models like o1 and o3 that are designed to iteratively reason through their outputs. This test-time compute
approach dramatically improved performance, with o1 scoring 74.4% on an International Mathematical Olympiad qualifying
exam, compared to GPT-4o’s 9.3%. However, this enhanced reasoning comes at a cost: o1 is nearly six times more expensive
and 30 times slower than GPT-4o.
6. More challenging benchmarks are continually being proposed. The saturation of traditional AI benchmarks like
MMLU, GSM8K, and HumanEval, coupled with improved performance on newer, more challenging benchmarks such as MMMU
and GPQA, has pushed researchers to explore additional evaluation methods for leading AI systems. Notable among these are
Humanity’s Last Exam, a rigorous academic test where the top system scores just 8.80%; FrontierMath, a complex mathematics
benchmark where AI systems solve only 2% of problems; and BigCodeBench, a coding benchmark where AI systems achieve a
35.5% success rate—well below the human standard of 97%.
7. High-quality AI video generators demonstrate signicant improvement. In 2024, several advanced AI models
capable of generating high-quality videos from text inputs were launched. Notable releases include OpenAI’s SORA, Stable
Video Diusion 3D and 4D, Meta’s Movie Gen, and Google DeepMind’s Veo 2. These models produce videos of signicantly
higher quality compared to those from 2023.
CHAPTER 2:
Technical Performance (cont’d)
Report Highlights

Articial Intelligence
Index Report 2025
15
8. Smaller models drive stronger performance. In 2022, the smallest model registering a score higher than 60% on
MMLU was PaLM, with 540 billion parameters. By 2024, Microsoft’s Phi-3-mini, with just 3.8 billion parameters, achieved the
same threshold—the equivalent of a 142-fold reduction in two years.
9. Complex reasoning remains a problem. Even though the addition of mechanisms such as chain-of-thought
reasoning has signicantly improved the performance of LLMs, these systems still cannot reliably solve problems for which
provably correct solutions can be found using logical reasoning, such as arithmetic and planning, especially on instances larger
than those they were trained on. This has a signicant impact on the trustworthiness of these systems and their suitability in
high-risk applications.
10. AI agents show early promise. The launch of RE-Bench in 2024 introduced a rigorous benchmark for evaluating
complex tasks for AI agents. In short time-horizon settings (two-hour budget), top AI systems score four times higher than
human experts, but as the time budget increases, human performance surpasses AI—outscoring it two to one at 32 hours.
AI agents already match human expertise in select tasks, such as writing Triton kernels, while delivering results faster and at
lower costs.
1. Evaluating AI systems with responsible AI (RAI) criteria is still uncommon, but new benchmarks are
beginning to emerge. Last year’s AI Index highlighted the lack of standardized RAI benchmarks for LLMs. While this issue
persists, new benchmarks such as HELM Safety and AIR-Bench help to ll this gap.
2. The number of AI incident reports continues to increase. According to the AI Incidents Database, the number of
reported AI-related incidents rose to 233 in 2024—a record high and a 56.4% increase over 2023.
CHAPTER 2:
Technical Performance (cont’d)
CHAPTER 3:
Responsible AI
Report Highlights

Articial Intelligence
Index Report 2025
16
3. Organizations acknowledge RAI risks, but mitigation eorts lag. A McKinsey survey on organizations’ RAI
engagement shows that while many identify key RAI risks, not all are taking active steps to address them. Risks including
inaccuracy, regulatory compliance, and cybersecurity were top of mind for leaders with only 64%, 63%, and 60% of respondents,
respectively, citing them as concerns.
4. Across the globe, policymakers demonstrate a signicant interest in RAI. In 2024, global cooperation on AI
governance intensied, with a focus on articulating agreed-upon principles for responsible AI. Several major organizations—
including the OECD, European Union, United Nations, and African Union—published frameworks to articulate key RAI concerns
such as transparency and explainability, and trustworthiness.
5. The data commons is rapidly shrinking. AI models rely on massive amounts of publicly available web data for training.
A recent study found that data use restrictions increased signicantly from 2023 to 2024, as many websites implemented new
protocols to curb data scraping for AI training. In actively maintained domains in the C4 common crawl dataset, the proportion
of restricted tokens jumped from 5–7% to 20–33%. This decline has consequences for data diversity, model alignment, and
scalability, and may also lead to new approaches to learning with data constraints.
6. Foundation model research transparency improves, yet more work remains. The updated Foundation
Model Transparency Index—a project tracking transparency in the foundation model ecosystem—revealed that the average
transparency score among major model developers increased from 37% in October 2023 to 58% in May 2024. While these gains
are promising, there is still considerable room for improvement.
7. Better benchmarks for factuality and truthfulness. Earlier benchmarks like HaluEval and TruthfulQA, aimed at
evaluating the factuality and truthfulness of AI models, have failed to gain widespread adoption within the AI community. In
response, newer and more comprehensive evaluations have emerged, such as the updated Hughes Hallucination Evaluation
Model leaderboard, FACTS, and SimpleQA.
8. AI-related election misinformation spread globally, but its impact remains unclear. In 2024, numerous
examples of AI-related election misinformation emerged in more than a dozen countries and across over 10 social media
platforms, including during the U.S. presidential election. However, questions remain about the measurable impacts of this
problem, with many expecting misinformation campaigns to have aected elections more profoundly than they did.
CHAPTER 3:
Responsible AI (cont’d)
Report Highlights

Articial Intelligence
Index Report 2025
17
9. LLMs trained to be explicitly unbiased continue to demonstrate implicit bias. Many advanced LLMs—
including GPT-4 and Claude 3 Sonnet—were designed with measures to curb explicit biases, but they continue to exhibit
implicit ones. The models disproportionately associate negative terms with Black individuals, more often associate women with
humanities instead of STEM elds, and favor men for leadership roles, reinforcing racial and gender biases in decision making.
Although bias metrics have improved on standard benchmarks, AI model bias remains a pervasive issue.
10. RAI gains attention from academic researchers. The number of RAI papers accepted at leading AI conferences
increased by 28.8%, from 992 in 2023 to 1,278 in 2024, continuing a steady annual rise since 2019. This upward trend highlights
the growing importance of RAI within the AI research community.
CHAPTER 3:
Responsible AI (cont’d)
Report Highlights
1. Global private AI investment hits record high with 26% growth. Corporate AI investment reached $252.3 billion
in 2024, with private investment climbing 44.5% and mergers and acquisitions up 12.1% from the previous year. The sector has
experienced dramatic expansion over the past decade, with total investment growing more than thirteenfold since 2014.
2. Generative AI funding soars. Private investment in generative AI reached $33.9 billion in 2024, up 18.7% from 2023 and
over 8.5 times higher than 2022 levels. The sector now represents more than 20% of all AI-related private investment.
3. The U.S. widens its lead in global AI private investment. U.S. private AI investment hit $109.1 billion in 2024, nearly
12 times higher than China’s $9.3 billion and 24 times the U.K.’s $4.5 billion. The gap is even more pronounced in generative AI,
where U.S. investment exceeded the combined total of China and the European Union plus the U.K. by $25.4 billion, expanding
on its $21.8 billion gap in 2023.
4. Use of AI climbs to unprecedented levels. In 2024, the proportion of survey respondents reporting AI use by their
organizations jumped to 78% from 55% in 2023. Similarly, the number of respondents who reported using generative AI in at least
one business function more than doubled—from 33% in 2023 to 71% last year.
CHAPTER 4:
Economy

Articial Intelligence
Index Report 2025
18
5. AI is beginning to deliver nancial impact across business functions, but most companies are early in
their journeys. Most companies that report nancial impacts from using AI within a business function estimate the benets
as being at low levels. 49% of respondents whose organizations use AI in service operations report cost savings, followed by
supply chain management (43%) and software engineering (41%), but most of them report cost savings of less than 10%. With
regard to revenue, 71% of respondents using AI in marketing and sales report revenue gains, 63% in supply chain management,
and 57% in service operations, but the most common level of revenue increases is less than 5%.
6. Use of AI shows dramatic shifts by region, with Greater China gaining ground. While North America
maintains its leadership in organizations’ use of AI, Greater China demonstrated one of the most signicant year-over-year
growth rates, with a 27 percentage point increase in organizational AI use. Europe followed with a 23 percentage point increase,
suggesting a rapidly evolving global AI landscape and intensifying international competition in AI implementation.
7. China’s dominance in industrial robotics continues despite slight moderation. In 2023, China installed
276,300 industrial robots, six times more than Japan and 7.3 times more than the United States. Since surpassing Japan in
2013, when China accounted for 20.8% of global installations, its share has risen to 51.1%. While China continues to install
more robots than the rest of the world combined, this margin narrowed slightly in 2023, marking a modest moderation in its
dramatic expansion.
8. Collaborative and interactive robot installations become more common. In 2017, collaborative robots
represented a mere 2.8% of all new industrial robot installations, a gure that climbed to 10.5% by 2023. Similarly, 2023 saw a
rise in service robot installations across all application categories except medical robotics. This trend indicates not just an overall
increase in robot installations but also a growing emphasis on deploying robots for human-facing roles.
9. AI is driving signicant shifts in energy sources, attracting interest in nuclear energy. Microsoft announced
a $1.6 billion deal to revive the Three Mile Island nuclear reactor to power AI, while Google and Amazon have also secured
nuclear energy agreements to support AI operations.
10. AI boosts productivity and bridges skill gaps. Last year’s AI Index was among the rst reports to highlight research
showing AI’s positive impact on productivity. This year, additional studies reinforced those ndings, conrming that AI boosts
productivity and, in most cases, helps narrow the gap between low- and high-skilled workers.
CHAPTER 4:
Economy (cont’d)
Report Highlights

Articial Intelligence
Index Report 2025
19
1. Bigger and better protein sequencing models emerge. In 2024, several large-scale, high-performance protein
sequencing models, including ESM3 and AlphaFold 3, were launched. Over time, these models have grown signicantly in size,
leading to continuous improvements in protein prediction accuracy.
2. AI continues to drive rapid advances in scientic discovery. AI’s role in scientic progress continues to expand.
While 2022 and 2023 marked the early stages of AI-driven breakthroughs, 2024 brought even greater advancements, including
Aviary, which trains LLM agents for biological tasks, and FireSat, which signicantly enhances wildre prediction.
3. The clinical knowledge of leading LLMs continues to improve. OpenAI’s recently released o1 set a new state-
of-the-art 96.0% on the MedQA benchmark—a 5.8 percentage point gain over the best score posted in 2023. Since late
2022, performance has improved 28.4 percentage points. MedQA, a key benchmark for assessing clinical knowledge, may be
approaching saturation, signaling the need for more challenging evaluations.
4. AI outperforms doctors on key clinical tasks. A new study found that GPT-4 alone outperformed doctors—both
with and without AI—in diagnosing complex clinical cases. Other recent studies show AI surpassing doctors in cancer detection
and identifying high-mortality-risk patients. However, some early research suggests that AI-doctor collaboration yields the best
results, making it a fruitful area of further research.
5. The number of FDA-approved, AI-enabled medical devices skyrockets. The FDA authorized its rst AI-enabled
medical device in 1995. By 2015, only six such devices had been approved, but the number spiked to 223 by 2023.
6. Synthetic data shows signicant promise in medicine. Studies released in 2024 suggest that AI-generated
synthetic data can help models better identify social determinants of health, enhance privacy-preserving clinical risk prediction,
and facilitate the discovery of new drug compounds.
7. Medical AI ethics publications are increasing year over year. The number of publications on ethics in medical AI
nearly quadrupled from 2020 to 2024, rising from 288 in 2020 to 1,031 in 2024.
CHAPTER 5:
Science and Medicine
Report Highlights

Articial Intelligence
Index Report 2025
20
8. Foundation models come to medicine. In 2024, a wave of large-scale medical foundation models were released,
ranging from general-purpose multimodal models like Med-Gemini to specialized models such as EchoCLIP for echocardiology,
VisionFM for ophthalmology, and ChexAgent for radiology.
9. Publicly available protein databases grow in size. Since 2021, the number of entries in major public protein science
databases has grown signicantly, including UniProt (31%), PDB (23%), and AlphaFold (585%). This expansion has important
implications for scientic discovery.
10. AI research recognized by two Nobel Prizes. In 2024, AI-driven research received top honors, with two Nobel
Prizes awarded for AI-related breakthroughs. Google DeepMind’s Demis Hassabis and John Jumper won the Nobel Prize in
Chemistry for their pioneering work on protein folding with AlphaFold. Meanwhile, John Hopeld and Georey Hinton received
the Nobel Prize in Physics for their foundational contributions to neural networks.
1. U.S. states are leading the way on AI legislation amid slow progress at the federal level. In 2016, only one
state-level AI-related law was passed, increasing to 49 by 2023. In the past year alone, that number more than doubled to 131.
While proposed AI bills at the federal level have also increased, the number passed remains low.
2. Governments across the world invest in AI infrastructure. Canada announced a $2.4 billion AI infrastructure
package, while China launched a $47.5 billion fund to boost semiconductor production. France committed $117 billion to AI
infrastructure, India pledged $1.25 billion, and Saudi Arabia’s Project Transcendence includes a $100 billion investment in AI.
3. Across the world, mentions of AI in legislative proceedings keep rising. Across 75 countries, AI mentions
in legislative proceedings increased by 21.3% in 2024, rising to 1,889 from 1,557 in 2023. Since 2016, the total number of AI
mentions has grown more than ninefold.
CHAPTER 5:
Science and Medicine (cont’d)
CHAPTER 6:
Policy and Governance
Report Highlights

Articial Intelligence
Index Report 2025
21
4. AI safety institutes expand and coordinate across the globe. In 2024, countries worldwide launched international
AI safety institutes. The rst emerged in November 2023 in the U.S. and the U.K. following the inaugural AI Safety Summit. At
the AI Seoul Summit in May 2024, additional institutes were pledged in Japan, France, Germany, Italy, Singapore, South Korea,
Australia, Canada, and the European Union.
5. The number of U.S. AI-related federal regulations skyrockets. In 2024, 59 AI-related regulations were
introduced—more than double the 25 recorded in 2023. These regulations came from 42 unique agencies, twice the 21 agencies
that issued them in 2023.
6. U.S. states expand deepfake regulations. Before 2024, only ve states—California, Michigan, Washington, Texas,
and Minnesota—had enacted laws regulating deepfakes in elections. In 2024, 15 more states, including Oregon, New Mexico,
and New York, introduced similar measures. Additionally, by 2024, 24 states had passed regulations targeting deepfakes.
1. Access to and enrollment in high school computer science (CS) courses in the U.S. has increased slightly
from the previous school year, but gaps remain. Student participation varies by state, race and ethnicity, school size,
geography, income, gender, and disability.
2. CS teachers in the U.S. want to teach AI but do not feel equipped to do so. Despite the 81% of CS teachers
who agree that using AI and learning about AI should be included in a foundational CS learning experience, fewer than half of
high school CS teachers feel equipped to teach AI.
3. Two-thirds of countries worldwide oer or plan to oer K–12 CS education. This fraction has doubled since
2019, with African and Latin American countries progressing the most. However, students in African countries have the least
amount of access to CS education due to schools’ lack of electricity.
CHAPTER 6:
Policy and Governance (cont’d)
CHAPTER 7:
Education
Report Highlights

Articial Intelligence
Index Report 2025
22
4. Graduates who earned their master’s degree in AI in the U.S. nearly doubled between 2022 and 2023.
While increased attention on AI will be slower to emerge in the number of bachelor’s and PhD degrees, the surge in master’s
degrees could indicate a developing trend for all degree levels.
5. The U.S. continues to be a global leader in producing information, technology, and communications
(ICT) graduates at all levels. Spain, Brazil, and the United Kingdom follow the U.S. as top producers at various levels, while
Turkey boasts the best gender parity.
1. The world grows cautiously optimistic about AI products and services. Among the 26 nations surveyed by
Ipsos in both 2022 and 2024, 18 saw an increase in the proportion of people who believe AI products and services oer more
benets than drawbacks. Globally, the share of individuals who see AI products and services as more benecial than harmful has
risen from 52% in 2022 to 55% in 2024.
2. The expectation and acknowledgment of AI’s impact on daily life is rising. Around the world, two thirds
of people now believe that AI-powered products and services will signicantly impact daily life within the next three to ve
years—an increase of 6 percentage points since 2022. Every country except Malaysia, Poland, and India saw an increase in this
perception since 2022, with the largest jumps in Canada (17%) and Germany (15%).
3. Skepticism about the ethical conduct of AI companies is growing, while trust in the fairness of AI is
declining. Globally, condence that AI companies protect personal data fell from 50% in 2023 to 47% in 2024. Likewise, fewer
people today believe that AI systems are unbiased and free from discrimination compared to last year.
4. Regional dierences persist regarding AI optimism. First reported in the 2023 AI Index, signicant regional
dierences in AI optimism endure. A large majority of people believe AI-powered products and services oer more benets than
drawbacks in countries like China (83%), Indonesia (80%), and Thailand (77%), while only a minority share this view in Canada
(40%), the United States (39%), and the Netherlands (36%).
CHAPTER 7:
Education (cont’d)
CHAPTER 8:
Public Opinion
Report Highlights

Articial Intelligence
Index Report 2025
23
5. People in the United States remain distrustful of self-driving cars. A recent American Automobile Association
survey found that 61% of people in the U.S. fear self-driving cars, and only 13% trust them. Although the percentage who expressed
fear has declined from its 2023 peak of 68%, it remains higher than in 2021 (54%).
6. There is broad support for AI regulation among local U.S. policymakers. In 2023, 73.7% of local U.S.
policymakers—spanning township, municipal, and county levels—agreed that AI should be regulated, up signicantly from
55.7% in 2022. Support was stronger among Democrats (79.2%) than Republicans (55.5%), though both registered notable
increases over 2022.
7. AI optimism registers sharp increase among countries that previously showed the most skepticism.
Globally, optimism about AI products and services has increased, with the sharpest gains in countries that were previously the
most skeptical. In 2022, Great Britain (38%), Germany (37%), the United States (35%), Canada (32%), and France (31%) were
among the least likely to view AI as having more benets than drawbacks. Since then, optimism has grown in these countries by
8%, 10%, 4%, 8%, and 10%, respectively.
8. Workers expect AI to reshape jobs, but fear of replacement remains lower. Globally, 60% of respondents
agree that AI will change how individuals do their job in the next ve years. However, a smaller subset of respondents, 36%,
believe that AI will replace their jobs in the next ve years.
9. Sharp divides exist among local U.S. policymakers on AI policy priorities. While local U.S. policymakers
broadly support AI regulation, their priorities vary. The strongest backing is for stricter data privacy rules (80.4%), retraining for
the unemployed (76.2%), and AI deployment regulations (72.5%). However, support drops signicantly for a law enforcement
facial recognition ban (34.2%), wage subsidies for wage declines (32.9%), and universal basic income (24.6%).
10. AI is seen as a time saver and entertainment booster, but doubts remain on its economic impact. Global
perspectives on AI’s impact vary. While 55% believe it will save time, and 51% expect it will oer better entertainment options,
fewer are condent in its health or economic benets. Only 38% think AI will improve health, whilst 36% think AI will improve the
national economy, 31% see a positive impact on the job market, and 37% believe it will enhance their own jobs.
CHAPTER 8:
Public Opinion (cont’d)
Report Highlights

Articial Intelligence
Index Report 2025
CHAPTER 1:
Research and Development

Table of Contents 25
Overview 26
Chapter Highlights 27
1.1 Publications 29
Overview 29
Total Number of AI Publications 29
By Venue 31
By National Aliation 32
By Sector 36
By Topic 38
Top 100 Publications 39
By National Aliation 39
By Sector 40
By Organization 41
1.2 Patents 42
Overview 42
By National Aliation 43
1.3 Notable AI Models 46
By National Aliation 46
By Sector 47
By Organization 49
Model Release 50
Parameter Trends 52
Compute Trends 56
Highlight: Will Models Run
Out of Data? 59
Inference Cost 64
Training Cost 65
1.4 Hardware 68
Overview 68
Highlight: Energy Eciency and
Environmental Impact 71
1.5 AI Conferences 75
Conference Attendance 75
1.6 Open-Source AI Software 77
Projects 77
Stars 79
Chapter 1: Research and Development
Articial Intelligence
Index Report 2025
ACCESS THE PUBLIC DATA

Table of Contents 26
Articial Intelligence
Index Report 2025
Chapter 1 Preview
This chapter explores trends in AI research and development, beginning with an
analysis of AI publications, patents, and notable AI systems. These topics are examined
through the lens of the countries, organizations, and sectors producing them. The
chapter also covers AI model training costs, AI conference attendance, and open-
source AI software. New additions this year include proles of the evolving AI hardware
ecosystem, an assessment of AI training’s energy requirements and environmental
impact, and a temporal analysis of model inference costs.
Overview
CHAPTER 1:
Research and Development
Articial Intelligence
Index Report 2025

Table of Contents 27
Articial Intelligence
Index Report 2025
Chapter 1 Preview
Chapter Highlights
1. Industry continues to make signicant investments in AI and leads in notable AI model development,
while academia leads in highly cited research. Industry’s lead in notable model development, highlighted in the two
previous AI Index reports, has only grown more pronounced, with nearly 90% of notable models in 2024 (compared to 60%
in 2023) originating from industry. Academia has remained the single leading institutional producer of highly cited (top 100)
publications over the past three years.
2. China leads in AI research publication totals, while the United States leads in highly inuential research.
In 2023, China produced more AI publications (23.2%) and citations (22.6%) than any other country. Over the past three years,
U.S. institutions have contributed the most top-100-cited AI publications.
3. AI publication totals continue to grow and increasingly dominate computer science. Between 2013 and
2023, the total number of AI publications in venues related to computer science and other scientic disciplines nearly tripled,
increasing from approximately 102,000 to over 242,000. Proportionally, AI’s share of computer science publications has risen
from 21.6% in 2013 to 41.8% in 2023.
4. The United States continues to be the leading source of notable AI models. In 2024, U.S.-based institutions
produced 40 notable AI models, signicantly surpassing China’s 15 and Europe’s combined total of three. In the past decade,
more notable machine learning models have originated from the United States than any other country.
5. AI models get increasingly bigger, more computationally demanding, and more energy intensive.
New research nds that the training compute for notable AI models doubles approximately every ve months, dataset sizes
for training LLMs every eight months, and the power required for training annually. Large-scale industry investment continues
to drive model scaling and performance gains.
CHAPTER 1:
Research and Development
Articial Intelligence
Index Report 2025

Table of Contents 28
Articial Intelligence
Index Report 2025
Chapter 1 Preview
Chapter Highlights (cont’d)
CHAPTER 1:
Research and Development
Articial Intelligence
Index Report 2025
6. AI models become increasingly aordable to use. The cost of querying an AI model that scores the equivalent
of GPT-3.5 (64.8) on MMLU, a popular benchmark for assessing language model performance, dropped from $20.00 per
million tokens in November 2022 to just $0.07 per million tokens by October 2024 (Gemini-1.5-Flash-8B)—a more than 280-
fold reduction in approximately 18 months. Depending on the task, LLM inference prices have fallen anywhere from 9 to 900
times per year.
7. AI patenting is on the rise. Between 2010 and 2023, the number of AI patents has grown steadily and signicantly,
ballooning from 3,833 to 122,511. In just the last year, the number of AI patents has risen 29.6%. As of 2023, China leads in total
AI patents, accounting for 69.7% of all grants, while South Korea and Luxembourg stand out as top AI patent producers on a per
capita basis.
8. AI hardware gets faster, cheaper, and more energy ecient. New research suggests that machine learning
hardware performance, measured in 16-bit oating-point operations, has grown 43% annually, doubling every 1.9 years. Price
performance has improved, with costs dropping 30% per year, while energy eciency has increased by 40% annually.
9. Carbon emissions from AI training are steadily increasing. Training early AI models, such as AlexNet (2012), had
modest amounts of carbon emissions at 0.01 tons. More recent models have signicantly higher emissions for training: GPT-3
(2020) at 588 tons, GPT-4 (2023) at 5,184 tons, and Llama 3.1 405B (2024) at 8,930 tons. For perspective, the average American
emits 18 tons of carbon per year.

Table of Contents 29
Articial Intelligence
Index Report 2025
Chapter 1 Preview
242.74
2013 2014 2015 2016 2017 2018 2019 2020 2021 2022 2023
0
50
100
150
200
250
Number of AI publications in CS (in thousands)
Number of AI publications in CS worldwide, 2013–23
Source: AI Index, 2025 | Chart: 2025 AI Index report
1.1 Publications
The gures below show the global count of English-language
AI publications from 2010 to 2023, categorized by aliation
type, publication type, and region. New to this year’s report,
the AI Index includes a section analyzing trends among the
100 most-cited AI publications, which can oer insights
into particularly high-impact research. This year, the AI
Index analyzed AI publication trends using the OpenAlex
database. As a result, the numbers in this year’s report dier
slightly from those in previous editions.1 Given that there is a
signicant lag in the collection of publication metadata, and
that in some cases it takes until the middle of any given year
to fully capture the previous year’s publications, in this year’s
report, the AI Index team elected to examine publication
trends only through 2023.
Overview
The following section reports on trends in the total number of
English-language AI publications.
Total Number of AI Publications
Figure 1.1.1 displays the global count of AI publications. These
are the publications with a computer science (CS) label in the
OpenAlex catalog that were classied by the AI Index as being
related to AI.2 Between 2013 and 2023, the total number of AI
1.1 Publications
Chapter 1: Research and Development
Figure 1.1.1
1 OpenAlex is a fully open catalog of scholarly metadata, including scientic papers, authors, institutions, and more. The AI Index used OpenAlex as a bibliographic database and
automatically classied AI-related research using the latest version of the CSO Classier. In previous years, the Index relied on third-party providers with dierent underlying data sources
and classication methods. As a result, this year’s ndings dier slightly from those included in previous reports. Additionally, the AI Index applied the classier only to papers that OpenAlex
categorized under the broad eld of computer science. This approach may have led to an undercount of AI-related publications by excluding research from elds like social sciences that
employ AI methodologies but fall outside the computer science–designated classication.
2 The CSO Classier (v3.3) is an automated text classication system designed to categorize research papers in computer science using a comprehensive ontology of 15,000 topics and
166,000 relationships, including emerging elds like GenAI, LLMs, and prompt engineering. It processes metadata (such as title and abstract) through three modules: a syntactic module for
exact topic matches, a semantic module leveraging word embeddings to infer related topics, and a post-processing module that renes results by ltering outliers and adding relevant higher-
level areas.

Table of Contents 30
Articial Intelligence
Index Report 2025
Chapter 1 Preview
publications more than doubled, rising from approximately
102,000 in 2013 to more than 242,000 in 2023. The increase
over the last year was a meaningful 19.7%. Many elds within
computer science, from hardware and software engineering
to human-computer interaction, are now contributing to
AI. As a result, the observed growth reects a broader and
increased interest in AI across the discipline.
2013 2014 2015 2016 2017 2018 2019 2020 2021 2022 2023
0%
5%
10%
15%
20%
25%
30%
35%
40%
45%
AI publications in CS (% of total)
41.76%
AI publications in CS (% of total) worldwide, 2013–23
Source: AI Index, 2025 | Chart: 2025 AI Index report
Figure 1.1.2
1.1 Publications
Chapter 1: Research and Development

Table of Contents 31
Articial Intelligence
Index Report 2025
Chapter 1 Preview
Figure 1.1.2 shows the proportion of computer science
publications in the OpenAlex corpus classied as AI-related.
Figure 1.1.2 features the same data included in Figure 1.1.1 but
in a proportional form. The share of AI publications has grown
signicantly, almost doubling from 2013 to 2023.
By Venue
AI researchers publish their work across various venues.
Figure 1.1.3 visualizes the total number of AI publications
by venue type. In 2023, journals accounted for the largest
share of AI publications (41.8%), followed by conferences
(34.3%). Even though the total number of journal and
conference publications has increased since 2013, the share
of AI publications in journals and conferences has steadily
declined, from 52.6% and 36.4% in 2013 to 41.8% and
34.3%, respectively, in 2023. Conversely, AI publications in
repositories like arXiv have seen a growing share.
1.1 Publications
Chapter 1: Research and Development
2013 2014 2015 2016 2017 2018 2019 2020 2021 2022 2023
0
20
40
60
80
100
Number of AI publications in CS (in thousands)
0.96, Dissertation
1.64, Other
10.73, Book
44.54, Repository
83.30, Conference
101.57, Journal
Number of AI publications in CS by venue type, 2013–23
Source: AI Index, 2025 | Chart: 2025 AI Index report
Figure 1.1.3

Table of Contents 32
Articial Intelligence
Index Report 2025
Chapter 1 Preview
By National Aliation
Figure 1.1.4 visualizes AI publications over time by region.3
In 2023, East Asia and the Pacic led AI research output,
accounting for 34.5% of all AI publications, followed by
Europe and Central Asia (18.2%) and North America (10.3%).4
While Figure 1.1.4 examines the geographic distribution of
AI publications, identifying which regions produce the most
research, Figure 1.1.5 focuses on citations, measuring the share
of total AI publication citations attributed to work originating
from each region. As of 2023, AI publications from East Asia
and the Pacic accounted for the largest share of AI article
citations at 37.1% (Figure 1.1.5). In 2017, citation shares from
East Asia and the Pacic and North America were roughly
equal, but since then, North American and European citation
shares have declined, while East Asia and the Pacic’s share
has risen sharply.
1.1 Publications
Chapter 1: Research and Development
2013 2014 2015 2016 2017 2018 2019 2020 2021 2022 2023
0%
5%
10%
15%
20%
25%
30%
35%
AI publications in CS (% of total)
0.89%, Sub-Saharan Africa
1.66%, Latin America and the Caribbean
5.18%, Middle East and North Africa
9.98%, South Asia
10.31%, North America
18.15%, Europe and Central Asia
19.37%, Unknown
34.46%, East Asia and Pacic
AI publications in CS (% of total) by region, 2013–23
Source: AI Index, 2025 | Chart: 2025 AI Index report
Figure 1.1.4
3 Regions in this chapter are classied according to the World Bank analytical grouping. The AI Index determines the country aliation of authors using the “countries” eld from the
authorship data. This eld lists all the countries an author is aliated with, as retrieved from OpenAlex based on institutional aliations. These aliations can be explicitly stated in the paper
or inferred from the author’s most recent publications. When counting publications by country, the AI Index assigns one count to each country linked to the publication. For example, if a
paper has three authors, two aliated with institutions in the U.S. and one in China, the publication is counted once for the U.S. and once for China.
4 A publication may have an “unknown” country aliation when the author’s institutional aliation is missing or incomplete. This issue arises due to various factors, including unstructured or
omitted institution names, platform functional deciencies, group authorship practices, unstandardized aliation labeling, document type inconsistencies, or the author’s limited publication
record. The problem as it relates to OpenAlex is addressed in this paper; however, the issue of missing institutions pertains to other bibliographic databases as well.

Table of Contents 33
Articial Intelligence
Index Report 2025
Chapter 1 Preview
1.1 Publications
Chapter 1: Research and Development
2013 2014 2015 2016 2017 2018 2019 2020 2021 2022 2023
0%
5%
10%
15%
20%
25%
30%
35%
40%
AI publication citations in CS (% of total)
0.89%, Sub-Saharan Africa
1.35%, Latin America and the Caribbean
7.55%, Unknown
7.69%, South Asia
7.97%, Middle East and North Africa
15.59%, North America
21.88%, Europe and Central Asia
37.07%, East Asia and Pacic
AI publication citations in CS (% of total) by region, 2013–23
Source: AI Index, 2025 | Chart: 2025 AI Index report
Figure 1.1.5

Table of Contents 34
Articial Intelligence
Index Report 2025
Chapter 1 Preview
In 2023, China was the global leader in AI article publications,
accounting for 23.2% of the total, compared to 15.2% from
Europe and 9.2% from India (Figure 1.1.6).5 Since 2016, China’s
share has steadily increased, while the proportion attributed
to Europe has declined. AI publications attributed to the
United States remained relatively stable until 2021 but have
shown a slight decline since then.
2013 2014 2015 2016 2017 2018 2019 2020 2021 2022 2023
0%
5%
10%
15%
20%
25%
AI publications in CS (% of total)
9.20%, United States
9.22%, India
15.22%, Europe
20.65%, Unknown
22.51%, Rest of the world
23.20%, China
AI publications in CS (% of total) by select geographic areas, 2013–23
Source: AI Index, 2025 | Chart: 2025 AI Index report
Figure 1.1.66
1.1 Publications
Chapter 1: Research and Development
5 For the “Europe” designation in this and other chapters of the report, the AI Index follows the list of countries dened by the United Nations Statistics Division.
6 To maintain concision, the AI Index visualized results for a select group of countries. However, full results for all countries will be available on the AI Index’s Global Vibrancy Tool, which is set
to be updated in summer 2025. For immediate access to country-specic research and development data, please contact the AI Index team.

Table of Contents 35
Articial Intelligence
Index Report 2025
Chapter 1 Preview
In 2023, Chinese AI publications accounted for 22.6% of all AI citations, followed by Europe at 20.9% and the United States at
13.0% (Figure 1.1.7). As with total AI publications, the late 2010s marked a turning point when China surpassed Europe and the
U.S. as the leading source of AI publication citations.
2013 2014 2015 2016 2017 2018 2019 2020 2021 2022 2023
0%
5%
10%
15%
20%
25%
30%
35%
AI publication citations in CS (% of total)
6.10%, India
7.54%, Unknown
13.03%, United States
20.90%, Europe
22.60%, China
29.83%, Rest of the world
AI publication citations in CS (% of total) by select geographic areas, 2013–23
Source: AI Index, 2025 | Chart: 2025 AI Index report
Figure 1.1.7
1.1 Publications
Chapter 1: Research and Development

Table of Contents 36
Articial Intelligence
Index Report 2025
Chapter 1 Preview
By Sector
Academic institutions remain the primary source of AI
publications worldwide (Figure 1.1.8). In 2013, they accounted
for 85.9% of all AI publications, a gure that remained high,
at 84.9%, in 2023. Industry contributed 7.1% of AI publications
in 2023, followed by government institutions at 4.9% and
nonprot organizations at 1.7%.
2013 2014 2015 2016 2017 2018 2019 2020 2021 2022 2023
0%
10%
20%
30%
40%
50%
60%
70%
80%
90%
AI publications in CS (% of total)
1.35%, Other
1.70%, Nonprot
4.90%, Government
7.14%, Industry
84.91%, Academia
AI publications in CS (% of total) by sector, 2013–23
Source: AI Index, 2025 | Chart: 2025 AI Index report
Figure 1.1.87
1.1 Publications
Chapter 1: Research and Development
7 For Figures 1.1.8 and 1.1.9, publications with unknown aliations were excluded from the nal visualization.

Table of Contents 37
Articial Intelligence
Index Report 2025
Chapter 1 Preview
AI publications emerge from various sectors in diering
proportions across geographic regions. In the United States,
a higher share of AI publications (16.5%) comes from industry
compared to China (8.0%) (Figure 1.1.9). Among major
geographic areas, China has the highest percentage of AI
publications originating from the education sector (84.5%).
75.61%
16.49%
4.02%
3.88%
79.49%
9.62%
6.79%
4.09%
84.45%
8.02%
6.96%
0.58%
0% 10% 20% 30% 40% 50% 60% 70% 80% 90%
Government
Nonprot
Industry
Academia
United States
Europe
China
AI publications (% of total)
AI publications in CS (% of total) by sector and select geographic areas, 2023
Source: AI Index, 2025 | Chart: 2025 AI Index report
Figure 1.1.9
1.1 Publications
Chapter 1: Research and Development

Table of Contents 38
Articial Intelligence
Index Report 2025
Chapter 1 Preview
By Topic
Machine learning was the most prevalent research topic in
AI publications in 2023, comprising 75.7% of publications,
followed by computer vision (47.2%), pattern recognition
(25.9%) and natural language processing (17.1%) (Figure
1.1.10). Over the past year, there has been a sharp increase in
publications on generative AI.
2013 2014 2015 2016 2017 2018 2019 2020 2021 2022 2023
0
50
100
150
Number of AI publications (in thousands)
5.25, Robotics
11.28, Multi-agent systems
12.00, Logic and reasoning
13.07, Generative AI
17.34, Evolutionary computation
21.82, Knowledge based systems
41.40, Natural language processing
62.90, Pattern recognition
114.61, Computer vision
183.78, Machine learning
Number of AI publications by select top topics, 2013–23
Source: AI Index, 2025 | Chart: 2025 AI Index report
Figure 1.1.108
1.1 Publications
Chapter 1: Research and Development
8 The AI Index categorized papers using its own topic classier. It is possible for a single publication to be assigned multiple topic labels.

Table of Contents 39
Articial Intelligence
Index Report 2025
Chapter 1 Preview
50
34
7
7
6
6
5
4
4
4
59
34
7
6
4
4
3
3
2
1
64
33
10
8
7
7
4
3
1
1
0 2 4 6 8 10 12 14 16 18 20 22 24 26 28 30 32 34 36 38 40 42 44 46 48 50 52 54 56 58 60 62 64 66
Singapore
Israel
United Arab Emirates
United Kingdom
South Korea
Canada
Hong Kong
Germany
China
United States
2023
2022
2021
Number of highly cited publications in top 100
Number of highly cited publications in top 100 by select geographic areas, 2021–23
Source: AI Index, 2025 | Chart: 2025 AI Index report
Figure 1.1.11
Top 100 Publications
While tracking total AI publications provides a broad view of
research activity, focusing on the most-cited papers oers a
perspective of the eld’s most inuential work. This analysis
sheds light on where some of the most groundbreaking and
inuential AI research is emerging. This year, the AI Index
identied the 100 most-cited AI publications in 2021, 2022,
and 2023, using citation data from OpenAlex. This analysis
was further supplemented with insights from Google Scholar
and Semantic Scholar.9 Some of the most highly cited AI
publications in 2023 included OpenAI’s GPT-4 technical
report, Meta’s Llama 2 technical report, and Google’s PaLM-E
technical report. It is important to note that due to citation
lag, the most-cited papers in this year’s report may change
in future editions.
By National Aliation
Figure 1.1.11 illustrates the geographic distribution of the top
100 most-cited AI publications by year. From 2021 to 2023,
the U.S. consistently had the highest number of top-cited
publications, with 64 in 2021, 59 in 2022, and 50 in 2023.10
In each of these years, China ranked second. Since 2021, the
U.S. share of top AI publications has gradually declined.
1.1 Publications
Chapter 1: Research and Development
9 The full methodological guide can be accessed in the Appendix, along with the list of the top 100 articles.
10 A publication can have multiple authors from dierent countries or organizations. For example, if a paper includes authors from multiple countries, each country is credited once. As a
result, the totals in this section’s gures exceed 100.

Table of Contents 40
Articial Intelligence
Index Report 2025
Chapter 1 Preview
42
7
25 24
2
27
19
35
17
34
17
31
17
1
Academia Industry Industry and academia Mixed Other
0
5
10
15
20
25
30
35
40
45
2023
2022
2021
Sector
Number of highly cited publications in top 100
Number of highly cited publications in top 100 by sector, 2021–23
Source: AI Index, 2025 | Chart: 2025 AI Index report
Figure 1.1.1211
By Sector
Academia consistently produces the most top-cited AI
publications, with 42 in 2023, 27 in 2022, and 34 in 2021
(Figure 1.1.12). Notably, there was a sharp decline in industry
contributions, with the number of top 100 publications
dropping from 17 in 2021 and 19 in 2022 to just 7 in 2023.
As AI research grows more competitive, many industrial AI
labs are publishing less frequently or disclosing fewer details
about their research in their publications.
1.1 Publications
Chapter 1: Research and Development
11 The “mixed” designation includes all intersector collaborations that are not industry and academia (e.g., industry and government, academia and nonprot). Some institutions lack data
for 2021 because they did not have papers included in the top 100 that year. Since papers can have multiple authors from dierent institutions, the total institutional tags in Figure 1.1.12 may
exceed 100. Also, because two of the papers had authors with an unknown sectoral aliation, the total sum of publications in Figure 1.1.12 is 98.

Table of Contents 41
Articial Intelligence
Index Report 2025
Chapter 1 Preview
By Organization
Figure 1.1.13 highlights the organizations that produced the
top 100 most-cited AI publications from 2021 to 2023. Some
organizations may have empty bars on the chart if they lacked
a top 100 publication in a given year. Additionally, Figure 1.1.13
highlights only the top 10 institutions, though many others
contribute signicant research.
Google led each year, but it tied with Tsinghua University in
2023, when both contributed eight publications to the top
100. In 2023, Carnegie Mellon University was the highest-
ranked U.S. academic institution.
8 8
6 6
5 5 5
4 4 4
20
10
99
4
33
22 2
15
10
7
5
2 2
1
Google
Tsinghua
University
Carnegie Mellon
University
Microsoft
Beijing Academy of
Articial Intelligence
Hong Kong University of
Science and Technology
Shanghai
AI Laboratory
Chinese Academy
of Sciences
Meta
Nvidia
0
2
4
6
8
10
12
14
16
18
20
22
2023
2022
2021
Organization
Number of highly cited publications in top 100
Number of highly cited publications in top 100 by organization, 2021–23
Source: AI Index, 2025 | Chart: 2025 AI Index report
Figure 1.1.13
1.1 Publications
Chapter 1: Research and Development

Table of Contents 42
Articial Intelligence
Index Report 2025
Chapter 1 Preview
This section examines trends over time in global
AI patents, which can reveal important insights
into the evolution of innovation, research, and
development within AI. Additionally, analyzing
AI patents can reveal how these advances are
distributed globally. Similar to the publications
data, there is a noticeable delay in AI patent
data availability, with 2023 being the most
recent year for which data is accessible. The
data in this section is sourced from patent-
level bibliographic records in PATSTAT Global,
a comprehensive database provided by the
European Patent Oce (EPO).12
122.51
2010 2011 2012 2013 2014 2015 2016 2017 2018 2019 2020 2021 2022 2023
0
20
40
60
80
100
120
Number of AI patents granted (in thousands)
Number of AI patents granted worldwide, 2010–23
Source: AI Index, 2025 | Chart: 2025 AI Index report
Figure 1.2.1
1.2 Patents
Overview
Figure 1.2.1 examines the global growth in granted AI patents from 2010 to
2023. Over the past dozen years, the number of AI patents has grown steadily
and signicantly, increasing from 3,833 in 2010 to 122,511 in 2023. In the last
year, the number of AI patents has risen 29.6%.
1.2 Patents
Chapter 1: Research and Development
12 More details on the methodology behind the patent analysis in this section can be found in the Appendix.

Table of Contents 43
Articial Intelligence
Index Report 2025
Chapter 1 Preview
2010 2011 2012 2013 2014 2015 2016 2017 2018 2019 2020 2021 2022 2023
0%
10%
20%
30%
40%
50%
60%
70%
80%
90%
Granted AI patents (% of world total)
0.02%, Sub-Saharan Africa
0.02%, Middle East and North Africa
0.04%, Latin America and the Caribbean
0.15%, Rest of the world
0.37%, South Asia
2.77%, Europe and Central Asia
14.23%, North America
82.40%, East Asia and Pacic
Granted AI patents (% of world total) by region, 2010–23
Source: AI Index, 2025 | Chart: 2025 AI Index report
By National Aliation
Figure 1.2.2 showcases the regional breakdown of granted
AI patents, as in the number of patents led in dierent
regions across the world. As of 2023, the bulk of the world’s
granted AI patents (82.4%) originated from East Asia and
the Pacic, with North America being the next largest
contributor at 14.2%. Since 2010, the gap in AI patent grants
between East Asia and the Pacic and North America has
steadily widened.
Figure 1.2.213
1.2 Patents
Chapter 1: Research and Development
13 Patent standards and laws vary across countries and regions, so these charts should be interpreted with caution. More detailed country-level patent information will be released in a
subsequent edition of the AI Index’s Global Vibrancy Tool.

Table of Contents 44
Articial Intelligence
Index Report 2025
Chapter 1 Preview
Disaggregated by geographic area, the majority of the
world’s granted AI patents are from China (69.7%) and the
United States (14.2%) (Figure 1.2.3). The share of AI patents
originating from the United States has declined from a peak
of 42.8% in 2015.
Figure 1.2.3 and Figure 1.2.4 document which countries lead
in AI patents per capita. In 2023, the country with the most
granted AI patents per 100,000 inhabitants was South Korea
(17.3), followed by Luxembourg (15.3) and China (6.1) (Figure
1.2.3). Figure 1.2.5 highlights the change in granted AI patents
per capita from 2013 to 2023. Luxembourg, China and
Sweden experienced the greatest increase in AI patenting
per capita during that time period.
Figure 1.2.3
2010 2011 2012 2013 2014 2015 2016 2017 2018 2019 2020 2021 2022 2023
0%
10%
20%
30%
40%
50%
60%
70%
Granted AI patents (% of world total)
0.37%, India
2.77%, Europe
13.00%, Rest of the world
14.16%, United States
69.70%, China
Granted AI patents (% of world total) by select geographic areas, 2010–23
Source: AI Index, 2025 | Chart: 2025 AI Index report
1.2 Patents
Chapter 1: Research and Development

Table of Contents 45
Articial Intelligence
Index Report 2025
Chapter 1 Preview
Figure 1.2.4
Figure 1.2.5
0.27
0.38
0.40
0.43
0.47
0.52
0.74
0.97
0.98
1.22
4.58
5.20
6.08
15.31
17.27
0 1 2 3 4 5 6 7 8 9 10 11 12 13 14 15 16 17 18
Greece
Australia
Netherlands
France
Denmark
United Kingdom
Sweden
Finland
Singapore
Germany
Japan
United States
China
Luxembourg
South Korea
Granted AI patents (per 100,000 inhabitants)
Granted AI patents per 100,000 inhabitants by country, 2023
Source: AI Index, 2025 | Chart: 2025 AI Index report
230%
240%
365%
463%
580%
730%
1,028%
1,043%
1,097%
1,653%
2,546%
2,851%
3,453%
6,317%
8,216%
0% 1,000% 2,000% 3,000% 4,000% 5,000% 6,000% 7,000% 8,000%
Denmark
Australia
Japan
France
United States
United Kingdom
Netherlands
South Korea
Germany
Finland
Singapore
Greece
Sweden
China
Luxembourg
% change of granted AI patents (per 100,000 inhabitants)
Source: AI Index, 2025 | Chart: 2025 AI Index report
Percentage change of granted AI patents per 100,000 inhabitants by country, 2013 vs. 2023
1.2 Patents
Chapter 1: Research and Development

Table of Contents 46
Articial Intelligence
Index Report 2025
Chapter 1 Preview
1
1
1
1
3
15
40
0 5 10 15 20 25 30 35 40
South Korea
Saudi Arabia
Israel
Canada
France
China
United States
Number of notable AI models
Number of notable AI models by select geographic
areas, 2024
Source: Epoch AI, 2025 | Chart: 2025 AI Index report
2003
2006
2009
2012
2015
2018
2021
2024
0
10
20
30
40
50
60
70
Number of notable AI models
3, Europe
15, China
40, United States
Number of notable AI models by select geographic
areas, 2003–24
Source: Epoch AI, 2025 | Chart: 2025 AI Index report
1.3 Notable AI Models
By National Aliation
To illustrate the evolving geopolitical landscape of AI, the AI Index shows
the country of origin of notable models. Figure 1.3.1 displays the total number
of notable AI models attributed to the location of researchers’ aliated
institutions.16 In 2024, the United States led with 40 notable AI models,
followed by China with 15 and France with three. All major geographic
groups, including the United States, China, and Europe, reported releasing
fewer notable models in 2024 than in the previous year (Figure 1.3.2). Since
2003, the United States has produced more models than other major
countries such as the United Kingdom, China, and Canada (Figure 1.3.3).
It is dicult to pinpoint the exact cause of the decline in total model
releases, but it may stem from a combination of factors: increasingly large
training runs, the growing complexity of AI technology, and the heightened
challenge of developing new modeling approaches. Epoch AI’s curation of
Figure 1.3.117 Figure 1.3.2
This section explores notable AI models.14 Epoch AI,
an AI Index data provider, uses the term “notable
machine learning models” to designate particularly
inuential models within the AI/machine learning
ecosystem. Epoch maintains a database of 900
AI models released since the 1950s, selecting
entries based on criteria such as state-of-the-art
advancements, historical signicance, or high
citation rates. Since Epoch manually curates
the data, some models considered notable by
some may not be included. Analyzing these
models provides a comprehensive overview of
the machine learning landscape’s evolution, both
in recent years and over the past few decades.15
Some models may be missing from the dataset;
however, the dataset can reveal trends in relative
terms. Examples of notable AI models include
GPT-4o, Claude 3.5, and AlphaGeometry.
Within this section, the AI Index explores trends
in notable models from various perspectives,
including country of origin, originating
organization, gradient of model release, parameter
count, and compute usage. The analysis concludes
with an examination of machine learning training
as well as inference costs.
1.3 Notable AI Models
Chapter 1: Research and Development
14 “AI system” refers to a computer program or product based on AI, such as ChatGPT. “AI model” includes a collection of parameters whose values are learned during training, such as GPT-4.
15 New and historic models are continually added to the Epoch AI database, so the total year-by-year counts of models included in this year’s AI Index might not exactly match those
published in last year’s report. The data is from a snapshot taken on March 17, 2025.
16 A machine learning model is associated with a specic country if at least one author of the paper introducing it has an aliation with an institution based in that country. In cases where a
model’s authors come from several countries, double-counting can occur.
17 This chart highlights model releases from a select group of geographic areas. More comprehensive data on model releases by country will be available in the upcoming AI Index Global
Vibrancy Tool release.

Table of Contents 47
Articial Intelligence
Index Report 2025
Chapter 1 Preview
1–10
11–20
21–60
61–100
101–560
Number of notable AI models by geographic area, 2003–24 (sum)
S
ource: Epoch AI, 2025 | Chart: 2025 AI Index report
notable models may overlook releases from certain countries
that receive less coverage. The AI Index, in cooperation with
Epoch, is committed to improving global representation in
the AI model ecosystem. If readers believe that models from
specic countries are missing, they are encouraged to contact
the AI Index team, which will work to address the issue.
Figure 1.3.3
1.3 Notable AI Models
Chapter 1: Research and Development
By Sector
Figure 1.3.4 illustrates the sectoral origin of notable AI releases
by the year the models were released. Epoch categorizes
models based on their source: Industry includes companies
such as Google, Meta, and OpenAI; academia covers
universities like Tsinghua, MIT, and Oxford; government
refers to state-aliated research institutes like the UK’s Alan
Turing Institute for AI and Abu Dhabi’s Technology Innovation
Institute; and research collectives encompass nonprot AI
research organizations such as the Allen Institute for AI and
the Fraunhofer Institute.
Until 2014, academia led in terms of releasing machine
learning models. Since then, industry has taken the lead.
According to Epoch AI, in 2024, industry produced 55 notable
AI models. That same year, Epoch AI identied no notable
AI models originating from academia (Figure 1.3.5).18 Over
time, industry-academia collaborations have contributed to
a growing number of models. The proportion of notable AI
models originating from industry has steadily increased over
the past decade, growing to 90.2% in 2024.
18 This gure should be interpreted with caution. A count of zero academic models does not mean that no notable models were produced by academic institutions in 2023, but rather that
Epoch AI has not identied any as notable. Additionally, academic publications often take longer to gain recognition, as highly cited papers introducing signicant architectures may take
years to achieve prominence.

Table of Contents 48
Articial Intelligence
Index Report 2025
Chapter 1 Preview
2003
2004
2005
2006
2007
2008
2009
2010
2011
2012
2013
2014
2015
2016
2017
2018
2019
2020
2021
2022
2023
2024
0%
20%
40%
60%
80%
100%
Notable AI models (% of total)
0.00%, Academia
0.00%, Academia–government collaboration
0.00%, Academia–research collective collaboration
0.00%, Research collective
0.00%, Industry–research collective collaboration
0.00%, Government
1.64%, Industry–government collaboration
8.20%, Industry–academia collaboration
90.16%, Industry
Notable AI models (% of total) by sector, 2003–24
Source: Epoch AI, 2025 | Chart: 2025 AI Index report
2003
2004
2005
2006
2007
2008
2009
2010
2011
2012
2013
2014
2015
2016
2017
2018
2019
2020
2021
2022
2023
2024
0
10
20
30
40
50
60
Number of notable AI models
0, Academia
0, Academia–government collaboration
0, Academia–research collective collaboration
0, Research collective
0, Industry–research collective collaboration
0, Government
1, Industry–government collaboration
5, Industry–academia collaboration
55, Industry
Number of notable AI models by sector, 2003–24
Source: Epoch AI, 2025 | Chart: 2025 AI Index report
Figure 1.3.4
Figure 1.3.5
1.3 Notable AI Models
Chapter 1: Research and Development

Table of Contents 49
Articial Intelligence
Index Report 2025
Chapter 1 Preview
7
7
6
4
4
4
3
3
2
2
2
2
2
2
2
0 1 2 3 4 5 6 7
Zhipu AI
Writer
UC Berkeley
Tencent
MIT
DeepSeek
ByteDance
Mistral AI
Anthropic
Nvidia
Meta
Apple
Alibaba
OpenAI
Google
Academia
Industry
Number of notable AI models
Number of notable AI models by organization, 2024
Source: Epoch AI, 2025 | Chart: 2025 AI Index report
187
82
39
36
25
25
22
22
17
16
15
15
15
14
12
0 10 20 30 40 50 60 70 80 90 100 110 120 130 140 150 160 170 180 190
Allen Institute for AI
Alibaba
University of Washington
Salesforce
MIT
University of Oxford
Nvidia
UC Berkeley
Tsinghua University
Stanford University
Carnegie Mellon University
OpenAI
Microsoft
Meta
Google
Academia
Industry
Research collective
Number of notable AI models
Number of notable AI models by organization, 2014–24 (sum)
Source: Epoch AI, 2025 | Chart: 2025 AI Index report
By Organization
Figure 1.3.6 and Figure 1.3.7 highlight the organizations leading
in the production of notable machine learning models in 2024
and over the past decade. In 2024, the top contributors were
Google (7), OpenAI (7 models), and Alibaba (6). Since 2014,
Google has led with 187 notable models, followed by Meta (82)
and Microsoft (39). Among academic institutions, Carnegie
Mellon University (25), Stanford University (25), and Tsinghua
University (22) have been the most prolic since 2014.
Figure 1.3.619
Figure 1.3.7
1.3 Notable AI Models
Chapter 1: Research and Development
19 In the organizational tally gures, research published by DeepMind is classied under Google.

Table of Contents 50
Articial Intelligence
Index Report 2025
Chapter 1 Preview
Model Release
Machine learning models are released under various
access types, each with varying levels of openness and
usability. API access models, like OpenAI’s o1, allow users
to interact with models via queries without direct access
to their underlying weights. Open weights (restricted use)
models, like DeepSeek’s-V3, provide access to their weights
but impose limitations, such as prohibiting commercial
use or redistribution. Hosted access (no API) models, like
Gemini 2.0 Pro, refer to models available through a platform
interface but without programmatic access. Open weights
(unrestricted) models, like AlphaGeometry, are fully open,
allowing free use, modication, and redistribution. Open
weights (noncommercial) models, like Mistral Large 2, share
their weights but restrict use to research or noncommercial
purposes. Lastly, unreleased models, like ESM3 98B, remain
proprietary, accessible only to their developers or select
partners. The unknown designation refers to models that
have unclear or undisclosed access types.
Figure 1.3.8 illustrates the dierent access types under which
models have been released.20 In 2024, API access was the
most common release type, with 20 of 61 models made
available this way, followed by open weights with restricted
use and unreleased models.
Figure 1.3.9 visualizes machine learning model access types
over time from a proportional perspective. In 2024, most AI
models were released via API access (32.8%), which has seen
a steady rise since 2020.
12
20
9
10
12
16
11
10
27
27
32 20
20
10 19
23
36
21
19
22
14
10
30 19
36
38
17
13
26
30
32
28
50
58
51
72
54
75
86
105
61
2014 2015 2016 2017 2018 2019 2020 2021 2022 2023 2024
0
20
40
60
80
100
120
API access Hosted access (no API) Open weights (noncommercial)
Open weights (restricted use) Open weights (unrestricted) Unreleased
Unknown
Number of notable AI models
Number of notable AI models by access type, 2014–24
Source: Epoch AI, 2025 | Chart: 2025 AI Index report
Figure 1.3.821
1.3 Notable AI Models
Chapter 1: Research and Development
20 Hosted access refers to using computing resources or services (such as software, hardware, or storage) provided remotely by a third party, rather than personally owning or managing
them. Instead of running software or infrastructure locally, hosted access involves accessing these resources via the cloud or another remote service, typically over the internet. For example,
using GPUs through platforms like AWS, Google Cloud, or Microsoft Azure—rather than running them on one’s own hardware—is considered hosted access.
21 Not all models in the Epoch database are categorized by access type, so the totals in Figures 1.3.8 through 1.3.10 may not fully align with those reported elsewhere in the chapter.

Table of Contents 51
Articial Intelligence
Index Report 2025
Chapter 1 Preview
1.3 Notable AI Models
Chapter 1: Research and Development
2014 2015 2016 2017 2018 2019 2020 2021 2022 2023 2024
0%
10%
20%
30%
40%
50%
60%
70%
80%
90%
100%
Notable AI models (% of total)
3.28%, Unknown
8.20%, Hosted access (no API)
9.84%, Open weights (noncommercial)
11.48%, Open weights (unrestricted)
16.39%, Unreleased
18.03%, Open weights (restricted use)
32.79%, API access
Notable AI models (% of total) by access type, 2014–24
Source: Epoch AI, 2025 | Chart: 2025 AI Index report
16
33
22
29
16 13
11
9
11
15
26
24
29
28
37
37
30 21
37
40
19
14 38
48
18
32
28
50
58
51
72
54
75
86
105
61
2014 2015 2016 2017 2018 2019 2020 2021 2022 2023 2024
0
20
40
60
80
100
120
Open source Open (restricted use) Open (noncommercial) Unreleased Unknown
Number of notable AI models
Number of notable AI models by training code access type, 2014–24
Source: Epoch AI, 2025 | Chart: 2025 AI Index report
Figure 1.3.9
Figure 1.3.10
In traditional open-source software releases, all components,
including the training code, are typically made available.
However, this is often not the case with AI technologies,
where even developers who release model weights may
withhold the training code. Figure 1.3.10 categorizes notable
AI models by the openness of their code release. In 2024,
the majority—60.7%—were launched without corresponding
training code.

Table of Contents 52
Articial Intelligence
Index Report 2025
Chapter 1 Preview
2003 2004 2005 2006 2007 2008 2009 2010 2011 2012 2013 2014 2015 2016 2017 2018 2019 2020 2021 2022 2023 2024
100
10
K
1M
100M
10B
1T
Academia
Academia–government
Industry
Industry–research collective
Industry–academia
Government
Research collective
Publication date
Number of parameters (log scale)
Number of parameters of notable AI models by sector, 2003–24
Source: Epoch AI, 2025 | Chart: 2025 AI Index report
Parameter Trends
Parameters in machine learning models are numerical
values learned during training that determine how a model
interprets input data and makes predictions. Models with
more parameters require more data to be trained, but they
can take on more tasks and typically outperform models with
fewer parameters.
Figure 1.3.11 demonstrates the parameter count of machine
learning models in the Epoch dataset, categorized by
the sector from which the models originate. Figure 1.3.12
visualizes the same data, but for a smaller selection of notable
models. Parameter counts have risen sharply since the early
2010s, reecting the growing complexity of their architecture,
greater availability of data, improvements in hardware, and
proven ecacy of larger models. High-parameter models are
particularly notable in the industry sector, underscoring the
substantial nancial resources available to industry to cover
the computational costs of training on vast volumes of data.
Several of the gures below use a log scale to reect the
exponential growth in AI model parameters and compute in
recent years.
Figure 1.3.11
1.3 Notable AI Models
Chapter 1: Research and Development

Table of Contents 53
Articial Intelligence
Index Report 2025
Chapter 1 Preview
1.3 Notable AI Models
Chapter 1: Research and Development
AlexNet
DeepSeek-V3
Qwen2.5-72B
Mistral Large 2
Llama 2-70B
PaLM (540B)
Megatron-Turing NLG 530B
GPT-3 175B (davinci)
BERT-Large
Transformer
ERNIE 3.0 Titan
RoBERTa Large
2012 2013 2014 2015 2016 2017 2018 2019 2020 2021 2022 2023 2024
100M
1B
10B
100B
1T Academia Industry Industry–academia
Publication date
Number of parameters (log scale)
Number of parameters of select notable AI models by sector, 2012–24
Source: Epoch AI, 2025 | Chart: 2025 AI Index report
Figure 1.3.12

Table of Contents 54
Articial Intelligence
Index Report 2025
Chapter 1 Preview
2010 2011 2012 2013 2014 2015 2016 2017 2018 2019 2020 2021 2022 2023 2024
10
K
1M
100M
10B
1T
100T
Publication date
Training dataset size (tokens - log scale)
Training dataset size of notable AI models, 2010–24
Source: Epoch AI, 2025 | Chart: 2025 AI Index report
Llama 3.1-405B
Transformer
GPT-3 175B (davinci)
DeepSeek-V3
PaLM (540B)
GPT-4
AlexNet
Qwen2.5-72B
Figure 1.3.13
1.3 Notable AI Models
Chapter 1: Research and Development
As model parameter counts have increased, so has the volume
of data used to train AI systems. Figure 1.3.13 illustrates the
growth in dataset sizes used to train notable machine learning
models. The Transformer model, released in 2017 and widely
credited with sparking the large language model revolution,
was trained on approximately 2 billion tokens. By 2020,
GPT-3 175B—one of the models underpinning the original
ChatGPT—was trained on an estimated 374 billion tokens.
In contrast, Meta’s agship LLM, Llama 3.3, released in the
summer of 2024, was trained on roughly 15 trillion tokens.
According to Epoch AI, LLM training datasets double in size
approximately every eight months.

Table of Contents 55
Articial Intelligence
Index Report 2025
Chapter 1 Preview
Training models on increasingly large datasets has led to
signicantly longer training times (Figure 1.3.14). Some
state-of-the-art models, such as Llama 3.1-405B, required
approximately 90 days to train—a typical window by today’s
standards. Google’s Gemini 1.0 Ultra, released in late 2023,
took around 100 days. This stands in stark contrast to AlexNet,
one of the rst models to leverage GPUs for enhanced
performance, which trained in just ve to six days in 2012.
Notably, AlexNet was trained on far less advanced hardware.
2010 2011 2012 2013 2014 2015 2016 2017 2018 2019 2020 2021 2022 2023 2024
0.1
1
10
100
Publication date
Training length (days - log scale)
Training length of notable AI models, 2010–24
Source: Epoch AI, 2025 | Chart: 2025 AI Index report
AlexNet
Transformer
BERT-Large
RoBERTa Large
GPT-3 175B (davinci)
Megatron-Turing NLG 530B
PaLM (540B) GPT-4
Llama 3.1-405B
Figure 1.3.14
1.3 Notable AI Models
Chapter 1: Research and Development

Table of Contents 56
Articial Intelligence
Index Report 2025
Chapter 1 Preview
Compute Trends
The term “compute” in AI models denotes the computational
resources required to train and operate a machine learning
model. Generally, the complexity of the model and the size
of the training dataset directly inuence the amount of
compute needed. The more complex a model is, and the
larger the underlying training data, the greater the amount of
compute required for training. Before the nal training run,
researchers conduct numerous test runs throughout the R&D
phase. While training a single model is relatively inexpensive,
the cumulative cost of multiple R&D runs and the necessary
datasets quickly becomes signicant. These gures reect
only the nal training run, not the entire R&D process.
Figure 1.3.15 visualizes the training compute required for
notable machine learning models over the past 22 years.
Recently, the compute usage of notable AI models has
increased exponentially.22 Epoch estimates that the training
compute of notable AI models doubles roughly every ve
months. This trend has been especially pronounced in the last
ve years. This rapid rise in compute demand has important
implications. For instance, models requiring more computation
often have larger environmental footprints, and companies
typically have more access to computational resources than
academic institutions. For reference, Chapter 2 of the AI
Index analyzes the relationship between improvements in
computational resources and model performance.
2003 2004 2005 2006 2007 2008 2009 2010 2011 2012 2013 2014 2015 2016 2017 2018 2019 2020 2021 2022 2023 2024
100μ
0.01
1
100
10
K
1M
100M
10B
Academia Industry Industry–academia Academia–government
Industry–research collective Government Research collective
Publication date
Training compute (petaFLOP - log scale)
Training compute of notable AI models by sector, 2003–24
S
ource: Epoch AI, 2025 | Chart: 2025 AI Index report
Figure 1.3.1523
22 FLOP stands for “oating-point operation.” A oating-point operation is a single arithmetic operation involving oating-point numbers, such as addition, subtraction, multiplication, or
division. The number of FLOP a processor or computer can perform per second is an indicator of its computational power. The higher the FLOP rate, the more powerful the computer. The
number of oating-point operations used to train an AI model reects its requirement for computational resources during development.
23 Estimating training compute is an important aspect of AI model analysis, yet it often requires indirect measurement. When direct reporting is unavailable, Epoch estimates compute by
using hardware specications and usage patterns or by counting arithmetic operations based on model architecture and training data. In cases where neither approach is feasible, benchmark
performance can serve as a proxy to infer training compute by comparing models with known compute values. Full details of Epoch’s methodology can be found in the documentation section
of their website.
1.3 Notable AI Models
Chapter 1: Research and Development

Table of Contents 57
Articial Intelligence
Index Report 2025
Chapter 1 Preview
Figure 1.3.16 highlights the training compute of notable
machine learning models since 2012. For example, AlexNet,
one of the models that popularized the now standard practice
of using GPUs to improve AI models, required an estimated
470 petaFLOP for training.24 The original Transformer,
released in 2017, required around 7,400 petaFLOP. OpenAI’s
GPT-4o, one of the current state-of-the-art foundation
models, required 38 billion petaFLOP. Creating cutting-
edge AI models now demands a colossal amount of data,
computing power, and nancial resources that are not
available to academia. Most leading AI models are coming
from industry, a trend that was rst highlighted in last year’s
AI Index. Although the gap has slightly narrowed this year,
the trend persists.
24 A petaFLOP (PFLOP) is a unit of computing power equal to one quadrillion (10¹⁵) oating-point operations per second.
1.3 Notable AI Models
Chapter 1: Research and Development
DeepSeek-V3
Qwen2.5-72B
Llama 2-70B
Claude 2
PaLM (540B)
Megatron-Turing NLG 530B
GPT-3 175B (davinci)
RoBERTa Large
BERT-Large
Transformer
Segment Anything Model
AlexNet
GPT-4
2012 2013 2014 2015 2016 2017 2018 2019 2020 2021 2022 2023 2024
1000
10
K
100
K
1M
10M
100M
1B
10B
100B
Language Vision Multimodal
Publication date
Training compute (petaFLOP - log scale)
Mistral Large 2
Claude 3.5 Sonnet
Gemini 1.5 Pro GPT-4o
ERNIE 3.0 Titan
Training compute of notable AI models by domain, 2012–24
Source: Epoch AI, 2025 | Chart: 2025 AI Index report
Figure 1.3.16

Table of Contents 58
Articial Intelligence
Index Report 2025
Chapter 1 Preview
1.3 Notable AI Models
Chapter 1: Research and Development
The launch of DeepSeek’s V3 model in December 2024
garnered signicant attention, particularly because it
achieved exceptionally high performance while requiring
far fewer computational resources than many leading LLMs.
Figure 1.3.17 compares the training compute of notable
machine learning models from the United States and China,
highlighting a key trend: Top-tier AI models from the U.S.
have generally been far more computationally intensive than
Chinese models. According to Epoch AI, the top 10 Chinese
language models by training compute have scaled at a rate
of about three times per year since late 2021—considerably
slower than the ve times per year trend observed in the rest
of the world since 2018.
2018 2019 2020 2021 2022 2023 2024
100
1000
10
K
100
K
1M
10M
100M
1B
10B
100B
United States
China
Publication date
Training compute (petaFLOP – log scale)
GPT-4
GPT-3 175B (davinci)
Grok-2
Claude 3.5 Sonnet
DeepSeek-V3
Doubao-pro
ERNIE 3.0 Titan
Qwen2.5-72B
Training compute of select notable AI models in the United States and China, 2018–24
Source: Epoch AI, 2025 | Chart: 2025 AI Index report
Figure 1.3.17

Table of Contents 59
Articial Intelligence
Index Report 2025
Chapter 1 Preview
Highlight:
Will Models Run Out of Data?
One of the key drivers of substantive algorithmic
improvements in AI systems has been the scaling
of models and their training on ever-larger datasets.
However, as the supply of internet training data becomes
increasingly depleted, concerns have grown about the
sustainability of this scaling approach and the potential
for a data bottleneck, where returns to scale diminish.
Last year’s AI Index explored various factors in this
debate, including the availability of existing internet data
and the potential for training models on synthetic data.
New research this year suggests that the current stock of
data may last longer than previously expected.
Epoch AI has updated its previous estimates for when AI
researchers might run out of data. In its latest research,
the team estimated the total eective stock of data
available for training models according to token count
(Figure 1.3.18). Common Crawl, an open repository of web
crawl data frequently used in AI training, is estimated to
contain a median of 130 trillion tokens. The indexed web
holds approximately 510 trillion tokens, while the entire
web contains around 3,100 trillion. Additionally, the total
stock of images is estimated at 300 trillion, and video at
1,350 trillion.
130T
510T
3,100T
300T
1,350T
Common Crawl Index web Whole web
(incl. private data)
Images Video
300T
1000T
3000T
Data source
Number of tokens (median - log scale)
Estimated median data stocks
Source: Epoch AI, 2025 | Chart: 2025 AI Index report
Figure 1.3.18
1.3 Notable AI Models
Chapter 1: Research and Development

Table of Contents 60
Articial Intelligence
Index Report 2025
Chapter 1 Preview
The Epoch AI research team projects, with an 80%
condence interval, that the current stock of training
data will be fully utilized between 2026 and 2032 (Figure
1.3.19). Several factors inuence the point in time when
data is likely to run out. One key factor is the historical
growth of dataset sizes, which depends on how
many people generate and contribute content to the
internet. Another important factor is computer usage.
If models are trained in a compute-optimal manner, the
available data stock can last longer. However, if models
are overtrained to achieve more compute-ecient
inference performance, the stock is likely to be depleted
sooner. When AI models are overtrained, meaning they
are trained for an extended period beyond the typical
point of diminishing returns, they may achieve more
compute-ecient inference—that is, they can process
prompts (make predictions, generate text, etc.) using
less computational power. However, this comes at a
cost: The stock (i.e., data available to train the model)
may be depleted more quickly.
Llama 3.1-405B
DBRX
Falcon-180B
PaLM (540B)
FLAN 137B
GPT-3 175B (davinci)
2020 2022 2024 2026 2028 2030 2032 2034
10B
100B
1T
10T
100T
10
15
Estimated stock of data
Median date of full stock utilization
(5x overtraining)
Median date of full stock utilization
Publication date
Eective stock (number of tokens - log scale)
Projections of the stock of public text and data usage
Source: Epoch AI, 2025 | Chart: 2025 AI Index report
Figure 1.3.19
1.3 Notable AI Models
Chapter 1: Research and Development
Highlight:
Will Models Run Out of Data? (cont’d)

Table of Contents 61
Articial Intelligence
Index Report 2025
Chapter 1 Preview
These projections dier slightly from Epoch’s earlier
estimates, which predicted that high-quality text data
would be depleted by 2024. The revised projections
reect an updated methodology that incorporates new
research showing that web data performs better than
curated corpora and that models can be trained on
the same datasets multiple times. The realization that
carefully ltered web data is eective and that repeated
training on the same dataset is viable has expanded
estimates of the available data stock. As a result, the
Epoch researchers pushed back their forecasts of when
data depletion might occur.
Using synthetic data—data generated by AI models
themselves—to train models has also been suggested
as a solution to potential data shortages. The 2024 AI
Index suggests there are limitations associated with
this approach, namely that models trained this way are
likely to lose representation of the tails of distributions
when performing repeated training cycles on synthetic
data. This leads to degraded model output quality. This
phenomenon was observed across dierent model
architectures, including variational autoencoders (VAEs),
Gaussian mixture models (GMMs), and LLMs. However,
newer research suggests that when synthetic data is
layered on top of real data, rather than replacing it, the
model collapse phenomenon does not occur. While this
accumulation does not necessarily improve performance
or reduce test loss (lower test loss indicates better model
performance), it also does not result in the same degree of
degradation as outright data replacement (Figure 1.3.20).
1 2 3 4 5
1.6
1.8
2
2.2
2.4
2.6
2.8
1 2 3 4 5
1.6
1.8
2
2.2
2.4
2.6
2.8
Llama-2 (126M) Llama-2 (42M) Llama-2 (12M) GPT-2 (9M)
Model-tting iteration Model-tting iteration
Cross entropy (test) ↓
Replace Accumulate
Eect of data accumulation on language models pretrained on TinyStories
Source: Gerstgrasser et al., 2024 | Chart: 2025 AI Index report
Figure 1.3.20
1.3 Notable AI Models
Chapter 1: Research and Development
Highlight:
Will Models Run Out of Data? (cont’d)

Table of Contents 62
Articial Intelligence
Index Report 2025
Chapter 1 Preview
This year, there have been advances in generating
high-delity synthetic data. However, synthetic data is
still generally distinguishable from real data, and there
is no existing scalable method to achieve the same
performance training LLMs on synthetic data compared
to real data. A team of Slovenian researchers compared
the performance of models trained on synthetic and real
data across multiple architectures and datasets. They
evaluated how well synthetic relational data preserves key
characteristics of the original data (“delity”) and remains
useful for downstream tasks (“utility”). They found that
most methods are systematically detectable as synthetic,
especially once relational information is considered.
Furthermore, performance typically deteriorates
compared to real data–trained models, but some methods
still yield moderately good predictive scores. In a few
experiments, synthetic data outperformed real data such
as using Synthetic Data Vault (SDV) vs. Walmart data to
train an XGBoost classier. The researchers showed that
training on the synthetic dataset achieves a lower mean
squared error (MSE). There is also evidence that synthetic
data shows promise in the healthcare domain. More
specically, some model architectures lead to enhanced
performance on classication and prediction tasks by
training on synthetically augmented datasets, increasing
F1 scores or AUROC by 5%–10% on minority classes.25
There are concerns around the quality and delity of
synthetically generated data, as LLMs are known to
hallucinate and provide factually incorrect outputs. When
training on hallucinated content in datasets, models can
experience compounded degradation in output quality.
New techniques have been developed to combat this
issue. For example, researchers from Stanford and the
University of North Carolina at Chapel Hill have used
automated fact-checking and condence scores to rank
factuality scores of model response pairs. The FactTune-
FS methods introduced by these researchers have tended
to outperform other RLHF and decoding-based methods
for factuality improvement (Figure 1.3.21). Human-in-the-
loop approaches to label preferred responses have also
been used to align language models. While promising,
the human-in-the-loop approaches tend to be more
expensive. Finally, post hoc ltering and debiasing
methods can be used to remove anomalies in synthetic
data before the training stage.
1.3 Notable AI Models
Chapter 1: Research and Development
Highlight:
Will Models Run Out of Data? (cont’d)
25 AUROC (area under the receiver operating characteristic) curve is a widely used metric for evaluating AI model performance, particularly in classication tasks.

Table of Contents 63
Articial Intelligence
Index Report 2025
Chapter 1 Preview
As the prevalence of synthetic data grows, particularly
with an increasing share of web content being AI-
generated, future models will inevitably be trained on
non-human-generated material. While synthetic data
oers the advantage of a near-innite supply, eectively
leveraging it for model training requires a deeper
understanding of its impact on learning dynamics and
performance. One approach to expanding datasets is
data augmentation, which modies real data—such as
tilting or image mixing—to create new variations while
preserving essential characteristics. Both synthetic data
generation and data augmentation present opportunities
to enhance AI models, but their eective use demands
further research.
1.3 Notable AI Models
Chapter 1: Research and Development
Highlight:
Will Models Run Out of Data? (cont’d)
56.80%
66.90% 69.60%
70.10%
74.80%
75.40% 76.00%
78.30% 81.20% 84.60%
89.50%
SFT
ITI
DOLA
FactTune-MC
FactTune-FS
SFT
ITI
DOLA
Chat
FactTune-MC
FactTune-FS
Llama-1 Llama-2
0%
20%
40%
60%
80%
100%
Base model and method
Percentage of correct answers
Factual accuracy: percentage of correct answers in biographies
Source: Tian et al., 2023 | Chart: 2025 AI Index report
Figure 1.3.21

Table of Contents 64
Articial Intelligence
Index Report 2025
Chapter 1 Preview
Inference Cost
Last year’s AI Index highlighted the rapidly rising training costs
of frontier LLM systems. This year, in addition to updating its
analysis on training costs, the Index examines how inference
costs for frontier systems have evolved over time. Inference
costs refer to the expense of querying a trained model, and
they are typically measured in USD per million tokens. Data on
AI token pricing comes from both Articial Analysis and Epoch
AI’s proprietary database on API pricing. The reported price is
a 3:1 weighted average of input and output token prices.
To analyze inference costs, the AI Index worked with
Epoch to measure how costs have decreased for a xed
AI performance threshold. This standardized approach
facilitates a more accurate comparison. While newer models
may cost more, they also tend to perform signicantly
better—so comparing them directly to older, less capable
models can obscure the real trend: AI performance per dollar
has improved substantially. For instance, the inference cost
for an AI model scoring the equivalent of GPT-3.5 (64.8)
on MMLU, a popular benchmark for assessing language
model performance, dropped from $20 per million tokens in
November 2022 to just $0.07 per million tokens by October
2024 (Gemini-1.5-Flash-8B)—a more than 280-fold reduction
in approximately 1.5 years. A similar trend is evident in the
cost of models scoring above 50% on GPQA, a substantially
more challenging benchmark than MMLU. There, inference
costs declined from $15 per million tokens in May 2024 to
$0.12 per million tokens by December 2024 (Phi 4). Epoch AI
estimates that, depending on the task, LLM inference costs
have been falling anywhere from nine to 900 times per year.
GPT-3.5
Llama-3.1-Instruct-8B Gemini-1.5-Flash-8B
GPT-4o-2024-05
P
Claude-3.5-Sonnet-2024-06
hi 4
GPT-4-0314
DeepSeek-V3
2022-Sep 2023-Jan 2023-May 2023-Sep 2024-Jan 2024-May 2024-Sep 2025-Jan
0.1
1
10
GPT-3.5 level+ in multitask language understanding (MMLU) GPT-4o level+ in PhD-level science questions (GPQA Diamond)
GPT-4 level+ in code generation (HumanEval) GPT-4o level+ in LMSYS Chatbot Arena Elo
Publication date
Inference price (in USD per million tokens - log scale)
Inference price across select benchmarks, 2022–24
Source: Epoch AI, 2025; Articial Analysis, 2025 | Chart: 2025 AI Index report
Figure 1.3.22
1.3 Notable AI Models
Chapter 1: Research and Development

Table of Contents 65
Articial Intelligence
Index Report 2025
Chapter 1 Preview
The inference cost to achieve a given level of performance has
declined notably over time. However, state-of-the-art models
remain more expensive than some of the previously mentioned
alternatives. Figure 1.3.23 illustrates the cost per million tokens
for leading models from developers such as OpenAI, Meta, and
Anthropic.26 These top-tier models are generally priced higher
than smaller models from the same companies, reecting the
premium required for cutting-edge performance.
60.00
15.00
6.00 5.00 3.50 2.19
o1 Claude 3.5 Sonnet
(Oct 2024)
Mistral Large 2
(Nov 2024)
Gemini 1.5 Pro
(Sep 2024)
Llama 3.1 405B DeepSeek R1
0
10
20
30
40
50
60
Model
Output price (in USD per million tokens)
Output price per million tokens for select models
S
ource: Articial Analysis, 2025 | Chart: 2025 AI Index report
Figure 1.3.23
1.3 Notable AI Models
Chapter 1: Research and Development
26 The Index visualizes a selection of state-of-the-art models with publicly available pricing as of February 2025. Since publication, newer models may have been released and pricing may
have changed.
27 Some reports have disputed the stated cost of DeepSeek-V3, arguing that when factoring in employee salaries, capital expenditures, and research expenses, the actual development costs
were signicantly higher.
28 A detailed report on Epoch’s research methodology is available in this paper.
Training Cost
A frequent discussion around foundation models pertains to
their high training costs. While AI companies rarely disclose
exact gures, costs are widely estimated to reach into the
millions of dollars—and continue to rise. OpenAI CEO Sam
Altman, for instance, indicated that training GPT-4 exceeded
$100 million. In July 2024, Anthropic CEO Dario Amodei noted
that model training runs costing around $1 billion were already
underway. Even more recent models, such as DeepSeek-V3,
reportedly cost less—about $6 million—but overall, training
remains extremely expensive.27
Understanding the costs associated with training AI models
remains important, yet detailed cost information remains
scarce. Last year, the AI Index published initial estimates on
the costs of training foundation models. This year, the AI Index
once again partnered with Epoch AI to update and rene
these estimates. To calculate costs for cutting-edge models,
the Epoch team analyzed factors such as training duration,
hardware type, quantity, and utilization rates, relying on
information from academic publications, press releases, and
technical reports.28

Table of Contents 66
Articial Intelligence
Index Report 2025
Chapter 1 Preview
670 160K 4M 6M
1M
12M
79M
29M
3M
26M
192M
41M
170M
107M
Transformer
RoBERTa Large
GPT-3 175B (davinci)
Megatron-Turing NLG 530B
LaMDA
PaLM (540B)
GPT-4
PaLM 2
Llama 2-70B
Falcon-180B
Gemini 1.0 Ultra
Mistral Large
Llama 3.1-405B
Grok-2
2017 2019 2020 2021 2022 2023 2024
0
50M
100M
150M
200M
Training cost (in US dollars)
Estimated training cost of select AI models, 2019–24
Source: Epoch AI, 2024 | Chart: 2025 AI Index report
Figure 1.3.24
1.3 Notable AI Models
Chapter 1: Research and Development
29 The cost gures reported in this section are ination-adjusted.
Figure 1.3.24 visualizes the estimated training cost associated
with select AI models, based on cloud compute rental prices.
Figure 1.3.25 visualizes the training cost of all AI models for
which the AI Index has estimates.
AI Index estimates validate suspicions that in recent years
model training costs have signicantly increased. For
example, in 2017, the original Transformer model, which
introduced the architecture that underpins virtually every
modern LLM, cost around $670 to train. RoBERTa Large,
released in 2019, which achieved state-of-the-art results on
many canonical comprehension benchmarks like SQuAD
and GLUE, cost around $160,000 to train. Fast-forward to
2023, and training costs for OpenAI’s GPT-4 were estimated
around $79 million.
One of the few 2024 models for which Epoch could estimate
training costs was Llama 3.1-405B, with an estimated cost of
$170 million. As the AI landscape grows more competitive,
companies are disclosing less about their training processes,
making it increasingly dicult to estimate computational
costs.
As established in previous AI Index reports, there is a direct
correlation between the training costs of AI models and their
computational requirements. As illustrated in Figure 1.3.26,
models with greater computational training needs cost
substantially more to train.

Table of Contents 67
Articial Intelligence
Index Report 2025
Chapter 1 Preview
Llama 3.1-405B
Nemotron-4 340B
Gemini 1.0 Ultra
Inection-2
Falcon-180B
Llama 2-70B
PaLM 2
GPT-4
LLaMA-65B
GPT-3.5
BLOOM-176B
PaLM (540B)
LaMDA
HyperCLOVA 82B
Meta Pseudo Labels
Switch
GPT-3 175B (davinci)
AlphaStar
Megatron-BERT
RoBERTa Large
BigGAN-deep 512×512
JFT
Xception
GNMT
2016 2017 2018 2019 2020 2021 2022 2023 2024
10
K
100
K
1M
10M
100M
Publication date
Training cost (in US dollars - log scale)
Estimated training cost of select AI models, 2016–24
Source: Epoch AI, 2024 | Chart: 2025 AI Index report
Grok-2
Llama 3.1-405B
Mistral Large
Gemini 1.0 Ultra
Falcon-180B
Llama 2-70B
PaLM 2
GPT-4
PaLM (540B)
LaMDA
Megatron-Turing NLG 530B
GPT-3 175B (davinci)
RoBERTa Large
10M 100M 1B 10B 100B
100
K
1M
10M
100M
Training compute (petaFLOP - log scale)
Training cost (in US dollars - log scale)
Estimated training cost and compute of select AI models
Source: Epoch AI, 2024 | Chart: 2025 AI Index report
Figure 1.3.25
Figure 1.3.26
1.3 Notable AI Models
Chapter 1: Research and Development

Table of Contents 68
Articial Intelligence
Index Report 2025
Chapter 1 Preview
Hardware advancements play a critical role
in driving AI progress. While scaling models
and training on larger datasets have led to
signicant performance improvements,
these advances have largely been enabled by
improvements in hardware—particularly the
development of more powerful and ecient
GPUs (graphics processing units). GPUs
accelerate complex computations, allowing
models to process vast amounts of data in
parallel and signicantly reducing training
time. This section of the Index leverages
data from Epoch AI to analyze key trends in
machine learning hardware and its impact on
AI development.
While this section currently emphasizes
compute performance (FLOP/s), network
bandwidth—the speed at which GPUs
communicate—is equally critical. Although
data on network bandwidth of data centers
is limited, future editions of the AI Index will
aim to include this information.
1.4 Hardware
Overview
Figure 1.4.1 illustrates the peak computational performance of ML hardware
across dierent precision types, where precision refers to the number of bits
used to represent numerical values, particularly oating-point numbers, in
computations. The choice of precision depends on the specic goal. For instance,
lower-precision hardware, which requires fewer bits and has lower memory
bandwidth, is ideal for optimizing computation speed and energy eciency. This
is particularly benecial for AI models running on edge or mobile devices or in
scenarios where inference speed is a priority. On the other hand, higher-precision
hardware preserves greater numerical accuracy, making it essential for scientic
computing and applications sensitive to precision errors. Of the precisions
visualized in the gures below, FP32 has the highest precision, TF32 oers
medium-high precision, and Tensor-FP16/BF16 and FP16 are lower-precision
formats optimized for speed and eciency.
Measured in 16-bit oating-point operations, Epoch estimates that machine learning
hardware performance has grown over the period 2008–2024 at an annual rate of
approximately 43%, doubling every 1.9 years. According to Epoch, this progress
has been driven by increased transistor counts, advancements in semiconductor
manufacturing, and the development of specialized hardware for AI workloads.
2008 2009 2010 2011 2012 2013 2014 2015 2016 2017 2018 2019 2020 2021 2022 2023 2024
10B
100B
1T
10T
100T
10
15
10
16
FP32
FP16
TF32 (19-bit) Tensor-FP16/BF16
Publication date
Performance (FLOP/s - log scale)
Peak computational performance of ML hardware for dierent precisions, 2008–24
Source: Epoch AI, 2025 | Chart: 2025 AI Index report
Figure 1.4.1
1.4 Hardware
Chapter 1: Research and Development

Table of Contents 69
Articial Intelligence
Index Report 2025
Chapter 1 Preview
1.87×10
13
1.25×10
14
3.12×10
14
9.89×10
14
P100 V100 A100 H100
2016 2017 2020 2022
0
0.2×10
15
0.4×10
15
0.6×10
15
0.8×10
15
1×10
15
Hardware
Performance (FLOP per second)
Performance of leading Nvidia data center GPUs for machine learning
Source: Epoch AI, 2025 | Chart: 2025 AI Index report
The price-performance of leading machine learning
hardware has steadily improved. Figure 1.4.2 illustrates the
performance of selected Nvidia data center GPUs—among
the most commonly used for AI training—in FLOP per
second. Figure 1.4.3 visualizes the price-performance of
those same GPUs, measured in FLOP per second per dollar.
For example, the H100 GPU, announced in March 2022,
achieves 22 billion FLOP per second per dollar, which is
approximately 1.7 times the price-performance of the A100
(launched in June 2020) and 16.9 times that of the P100
(released in April 2016). Epoch estimates that hardware with
a xed performance level decreases in cost by 30% annually,
making AI training increasingly aordable, scalable, and
conducive to model improvements.
Figure 1.4.2
1.4 Hardware
Chapter 1: Research and Development

Table of Contents 70
Articial Intelligence
Index Report 2025
Chapter 1 Preview
Figure 1.4.4, based on the Epoch AI notable machine learning
models dataset, examines the hardware used to train notable
machine learning models. As of 2024, the most commonly
reported hardware was the A100, used by 64 models, followed
by the V100. An increasing number of models are now being
trained on the H100, with 15 reported by the end of 2024.
1.30×10
9
6.70×10
9
1.30×10
10
2.20×10
10
1×10⁹5×10⁹1×10¹⁰1.5×10¹⁰2×10¹⁰
H100
A100
V100
P100
FLOP per second per dollar
Hardware
Price-performance of leading Nvidia data center GPUs for machine learning
Source: Epoch AI, 2025 | Chart: 2025 AI Index report
2017 2018 2019 2020 2021 2022 2023 2024
0
10
20
30
40
50
60
Publication date
Cumulative number of notable AI models
6, P100
15, H100
25, TPU v4
37, Other
47, TPU v3
56, V100
65, A100
Cumulative number of notable AI models trained by accelerator, 2017–24
Source: Epoch AI, 2025 | Chart: 2025 AI Index report
Figure 1.4.3
Figure 1.4.4
1.4 Hardware
Chapter 1: Research and Development

Table of Contents 71
Articial Intelligence
Index Report 2025
Chapter 1 Preview
Highlight:
Energy Eciency and Environmental Impact
Training AI systems requires substantial energy, making
the energy eciency of machine learning hardware
a critical factor. Epoch AI reports that ML hardware
has become increasingly energy ecient over time,
improving by approximately 40% per year. Figure 1.4.5
illustrates the energy eciency of Tensor-FP16 precision
hardware, measured in FLOP/s per watt. For instance, the
Nvidia B100, released in March 2024, achieved an energy
eciency of 2.5 trillion FLOP/s per watt, compared to
the Nvidia P100, released in April 2016, which reported
74 billion FLOP/s per watt. This means the B100 is 33.8
times more energy ecient than the P100.
1.4 Hardware
Chapter 1: Research and Development
2016 2017 2018 2019 2020 2021 2022 2023 2024
1B
10B
100B
1T
Leading hardware
Non-leading hardware
Publication date
Energy eciency (FLOP/s per watt - log scale)
NVIDIA P100
Google TPU v2
Google TPU v3
Google TPU v4
NVIDIA Tesla V100 SXM2 32 GB
Google TPU v4i
NVIDIA A100
Google TPU v5e
NVIDIA B100
NVIDIA H100 SXM5 80GB
NVIDIA GB200 NVL2
NVIDIA B200
Energy eciency of leading machine learning hardware, 2016–24
Source: Epoch AI, 2025 | Chart: 2025 AI Index report
Figure 1.4.5

Table of Contents 72
Articial Intelligence
Index Report 2025
Chapter 1 Preview
Despite signicant improvements in the energy eciency
of AI hardware, the overall power consumption required
to train AI systems continues to rise rapidly. Figure 1.4.6
illustrates the total power draw, measured in watts, for
training various state-of-the-art AI models. For example,
the original Transformer, introduced in 2017, consumed
an estimated 4,500 watts. In contrast, PaLM, one of
Google’s rst agship LLMs, had a power draw of 2.6
million watts—almost 600 times that of the Transformer.
Llama 3.1-405B, released in the summer of 2024,
required 25.3 million watts, consuming over 5,000 times
more power than the original Transformer. According to
Epoch AI, the power required to train frontier AI models
is doubling annually. The rising power consumption of
AI models reects the trend of training on increasingly
larger datasets.
Unsurprisingly, given that the total amount of power
used to train AI systems has increased over time, so
has the amount of carbon emitted by the models. Many
factors determine the amount of carbon emitted by AI
systems, including the number of parameters in a model,
the power usage eectiveness of a data center, and the
grid carbon intensity.30
1.4 Hardware
Chapter 1: Research and Development
Llama 3.1-405B
GPT-4
PaLM (540B)
GPT-3 175B (davinci)
2011 2012 2013 2014 2015 2016 2017 2018 2019 2020 2021 2022 2023 2024
1000
10
K
100
K
1M
10M
Publication date
Total power draw required (watts - log scale)
Total power draw required to train frontier models, 2011–24
S
ource: Epoch AI, 2025 | Chart: 2025 AI Index report
Figure 1.4.6
Highlight:
Energy Eciency and Environmental Impact (cont’d)
30 Power usage eectiveness (PUE) is a metric used to evaluate the energy eciency of data centers. It is the ratio of the total amount of energy used by a computer data center facility,
including air conditioning, to the energy delivered to computing equipment. The higher the PUE, the less ecient the data center.

Table of Contents 73
Articial Intelligence
Index Report 2025
Chapter 1 Preview
Figure 1.4.7 illustrates the carbon emissions of selected
AI models, sorted by their release year. To estimate
these emissions, the AI Index used carbon data
published by model developers and supplemented it
with calculations from a widely used online AI training
emissions calculator. This step was necessary as
many developers do not disclose their models’ carbon
footprints. The calculator estimates emissions based
on the type of hardware used for training, total training
hours, cloud provider, and training region.31
The carbon emissions from training frontier AI models
have steadily increased over time. While AlexNet’s
emissions were negligible, GPT-3 (released in 2020)
reportedly emitted around 588 tons of carbon during
training, GPT-4 (2023) emitted 5,184 tons, and Llama 3.1
405B (2024) emitted 8,930 tons. DeepSeek V3, released
in 2024, and whose performance is comparable to
OpenAI’s o1, is estimated to have emissions comparable
to the GPT-3, released ve years ago. For context, on
average, Americans emit 18.08 tons of carbon per capita
per year.
1.4 Hardware
Chapter 1: Research and Development
0.01 0.31 2.60 5.50
588
1,432
301
2,973
5,184
597
8,930
AlexNet
VGG16
BERT-Large
RoBERTa Large
GPT-3
Megatron-Turing NLG
GLM-130B
Falcon-180B
GPT-4
DeepSeek v3
Llama 3.1 405B
2012 2014 2018 2019 2020 2021 2022 2023 2024
0
2,000
4,000
6,000
8,000
Carbon emissions (tons of CO₂ equivalent)
Estimated carbon emissions from training select AI models and real-life activities, 2012–24
Source: AI Index, 2025; Strubell et al., 2019 | Chart: 2025 AI Index report
Air travel (1 passenger, NY↔SF): 0.99
Human life (avg., 1 year): 5.51
American life (avg., 1 year): 18.08
Car usage (avg., incl. fuel, 1 lifetime): 63
Figure 1.4.7
Highlight:
Energy Eciency and Environmental Impact (cont’d)
31 The AI Index sourced input data—such as training hardware and duration—for the emissions calculator from various online sources. To validate the accuracy of the calculator, the Index
compared the calculator’s estimates with actual emissions reported by developers and found that the results were largely consistent. The full estimation methodology is detailed in the
Appendix.

Table of Contents 74
Articial Intelligence
Index Report 2025
Chapter 1 Preview
1.4 Hardware
Chapter 1: Research and Development
AlexNet
VGG16
BERT-Large RoBERTa Large
GPT-3
Megatron-Turing NLG
GLM-130B Falcon-180B
GPT-4
DeepSeek v3
Llama 3.1 405B
0.01 0.1 1 10 100 1000 10
K
1B
1T
Carbon emissions (tons of CO₂ equivalent - log scale)
Number of parameters (log scale)
Estimated carbon emissions and number of parameters by select AI models
S
ource: AI Index, 2025 | Chart: 2025 AI Index report
Figure 1.4.8
Highlight:
Energy Eciency and Environmental Impact (cont’d)

Table of Contents 75
Articial Intelligence
Index Report 2025
Chapter 1 Preview
1.5 AI Conferences
Conference Attendance
Figure 1.5.1 graphs attendance at a selection of AI conferences
since 2010. In 2020 the pandemic forced conferences to be
held fully online, increasing attendance signicantly. This was
followed by a decline in attendance, likely due to the shift
back to in-person formats, returning attendance in 2022 to
prepandemic levels. Since then, there has been a steady
growth in conference attendance, increasing almost 21.7%
from 2023 to 2024.32 Since 2014, the annual number of
attendees has risen by more than 60,000, reecting not just
a growing interest in AI research but also the emergence of
new AI conferences.
Neural Information Processing Systems (NeurIPS) remains
the most attended AI conference, attracting almost 20,000
participants in 2024 (Figure 1.5.2 and Figure 1.5.3). Among the
major AI conferences, NeurIPS, CVPR, ICML, ICRA, ICLR,
IROS and AAAI experienced increases in attendance over
the last year.
AI conferences serve as essential platforms
for researchers to present their ndings and
network with peers and collaborators. Over
the past two decades, these conferences
have expanded in scale, quantity, and
prestige. This section explores trends in
attendance at major AI conferences.
1.5 AI Conferences
Chapter 1: Research and Development
2010 2011 2012 2013 2014 2015 2016 2017 2018 2019 2020 2021 2022 2023 2024
10
20
30
40
50
60
70
80
90
Number of attendees (in thousands)
73.26
Attendance at select AI conferences, 2010–24
Source: AI Index, 2024 | Chart: 2025 AI Index report
Figure 1.5.1
32 This data should be interpreted with caution given that many conferences in the last few years have had virtual or hybrid formats. Conference organizers report that measuring the exact
attendance numbers at virtual conferences is dicult, as virtual conferences allow for higher attendance of researchers from around the world. The AI Index reports total attendance gures,
encompassing virtual, hybrid, and in-person participation. The conferences for which the AI Index tracked data include AAAI, AAMAS, CVPR, EMNLP, FAccT, ICAPS, ICCV, ICLR, ICML,
ICRA, IJCAI, IROS, KR, NeurIPS, and UAI.

Table of Contents 76
Articial Intelligence
Index Report 2025
Chapter 1 Preview
1.5 AI Conferences
Chapter 1: Research and Development
2010 2011 2012 2013 2014 2015 2016 2017 2018 2019 2020 2021 2022 2023 2024
0
5
10
15
20
25
30
Number of attendees (in thousands)
3.50, EMNLP
5.15, AAAI
5.20, IROS
6.53, ICLR
7.00, ICRA
9.10, ICML
12.00, CVPR
19.76, NeurIPS
Attendance at large conferences, 2010–24
Source: AI Index, 2024 | Chart: 2025 AI Index report
2010 2011 2012 2013 2014 2015 2016 2017 2018 2019 2020 2021 2022 2023 2024
0.00
0.50
1.00
1.50
2.00
2.50
3.00
3.50
Number of attendees (in thousands)
0.20, KR
0.24, ICAPS
0.43, UAI
0.63, AAMAS
0.69, FaccT
2.84, IJCAI
Attendance at small conferences, 2010–24
Source: AI Index, 2024 | Chart: 2025 AI Index report
Figure 1.5.233
Figure 1.5.3
33 The signicant spike in ICML attendance in 2021 was likely due to the conference being held virtually that year.

Table of Contents 77
Articial Intelligence
Index Report 2025
Chapter 1 Preview
1.6 Open-Source AI Software
Projects
A GitHub project comprises a collection of les, including source code,
documentation, conguration les, and images, that together make up a software
project. Figure 1.6.1 looks at the total number of GitHub AI projects over time.35
Since 2011, the number of AI-related GitHub projects has consistently increased,
growing from 1,549 in 2011 to approximately 4.3 million in 2024. Notably, there was
a sharp 40.3% rise in the total number of GitHub AI projects in the last year alone.
GitHub is a web-based platform that enables
individuals and teams to host, review, and
collaborate on code repositories. Widely used
by software developers, GitHub facilitates
code management, project collaboration,
and open-source software support. This
section draws on data from GitHub that
provides insights into broader trends in
open-source AI software development not
reected in academic publication data.34
1.6 Open-Source AI Software
Chapter 1: Research and Development
2011 2012 2013 2014 2015 2016 2017 2018 2019 2020 2021 2022 2023 2024
0.00
0.50
1.00
1.50
2.00
2.50
3.00
3.50
4.00
4.50
Number of AI projects (in millions)
4.32
Number of GitHub AI projects, 2011–24
Source: GitHub, 2024 | Chart: 2025 AI Index report
Figure 1.6.1
34 This year, GitHub updated its methodology to capture a broader range of AI-related topics, including more recent developments. As a result, the gures in this year’s AI Index may not align
with those from previous editions. Chinese researchers often use alternative sites to GitHub for code sharing, such as Gitee and GitCode, but the data from those sites is not included in this
report. A full methodological description is available in the Appendix.
35 GitHub used AI-topic classication methods to identify AI-related repositories. Details on the methodology are available in the Appendix.

Table of Contents 78
Articial Intelligence
Index Report 2025
Chapter 1 Preview
Figure 1.6.2 reports GitHub AI projects by geographic
area since 2011. As of 2024, a signicant share of GitHub
AI projects were located in the United States, accounting
for 23.4% of contributions. India was the second largest
contributor with 19.9%, followed closely by Europe, which
accounted for 19.5%. Notably, the share of open-source AI
projects on GitHub from U.S.-based developers has declined
since 2016 and appears to have stabilized in recent years.
1.6 Open-Source AI Software
Chapter 1: Research and Development
2011 2012 2013 2014 2015 2016 2017 2018 2019 2020 2021 2022 2023 2024
0%
10%
20%
30%
40%
50%
60%
AI projects (% of total)
2.08%, China
19.15%, Europe
19.91%, India
23.42%, United States
35.43%, Rest of the world
GitHub AI projects (% of total) by geographic area, 2011–24
Source: GitHub, 2024 | Chart: 2025 AI Index report
Figure 1.6.2

Table of Contents 79
Articial Intelligence
Index Report 2025
Chapter 1 Preview
Stars
GitHub users can show their interest in a repository by
“starring” it, a feature similar to liking a post on social
media, which signies support for an open-source project.
Among the most starred repositories are libraries such as
TensorFlow, OpenCV, Keras, and PyTorch, which enjoy
widespread popularity among software developers in the
broader developer community beyond AI. TensorFlow, Keras,
and PyTorch are popular libraries for building and deploying
machine learning models, while OpenCV oers a variety
of tools for computer vision, such as object detection and
feature extraction.
The total number of stars for AI-related projects on GitHub
continued to rise last year, increasing from 14.0 million in
2023 to 17.7 million in 2024 (Figure 1.6.3).36 This follows a
particularly sharp rise from 2022 to 2023, when the total
more than doubled.
1.6 Open-Source AI Software
Chapter 1: Research and Development
2011 2012 2013 2014 2015 2016 2017 2018 2019 2020 2021 2022 2023 2024
0
2
4
6
8
10
12
14
16
18
Number of GitHub stars (in millions)
17.64
Number of GitHub stars in AI projects, 2011–24
Source: GitHub, 2024 | Chart: 2025 AI Index report
Figure 1.6.3
36 Figure 1.6.3 shows new stars given to GitHub projects within a year, not the total accumulated over time.

Table of Contents 80
Articial Intelligence
Index Report 2025
Chapter 1 Preview
In 2024, the United States led in receiving the highest number
of GitHub stars, totaling 21.1 million (Figure 1.6.4). All major
geographic regions sampled, including Europe, China, and
India, saw a year-over-year increase in the total number of
GitHub stars awarded to projects located in their countries.
1.6 Open-Source AI Software
Chapter 1: Research and Development
2011 2012 2013 2014 2015 2016 2017 2018 2019 2020 2021 2022 2023 2024
0
5
10
15
20
Number of cumulative GitHub stars (in millions)
3.67, China
4.06, India
10.29, Europe
16.39, Rest of the world
21.08, United States
Number of GitHub stars by geographic area, 2011–24
Source: GitHub, 2024 | Chart: 2025 AI Index report
Figure 1.6.4

Articial Intelligence
Index Report 2025
CHAPTER 2:
Technical Performance

83Table of Contents
Overview 84
Chapter Highlights 85
2.1 Overview of AI in 2024 87
Timeline: Signicant Model and
Dataset Releases 87
State of AI Performance 93
Overall Review 93
Closed vs. Open-Weight Models 94
US vs. China Technical Performance 96
Improved Performance From
Smaller Models 98
Model Performance Converges
at the Frontier 99
Benchmarking AI 100
2.2 Language 103
Understanding 104
MMLU: Massive Multitask
Language Understanding 104
Generation 105
Chatbot Arena Leaderboard 105
Arena-Hard-Auto 107
WildBench 108
Highlight: o1, o3, and Inference-
Time Compute 110
MixEval 112
RAG: Retrieval Augment Generation 113
Berkeley Function Calling Leaderboard 113
MTEB: Massive Text Embedding
Benchmark 115
Highlight: Evaluating Retrieval
Across Long Contexts 117
2.3 Image and Video 119
Understanding 119
VCR: Visual Commonsense Reasoning 119
MVBench 120
Generation 122
Chatbot Arena: Vision 123
Highlight: The Rise of Video
Generation 124
2.4 Speech 126
Speech Recognition 126
LSR2: Lip Reading Sentences 2 126
2.5 Coding 128
HumanEval 128
SWE-bench 129
BigCodeBench 130
Chatbot Arena: Coding 131
2.6 Mathematics 132
GSM8K 132
MATH 133
Chatbot Arena: Math 134
FrontierMath 134
Highlight: Learning and
Theorem Proving 136
2.7 Reasoning 137
General Reasoning 137
MMMU: A Massive Multi-discipline
Multimodal Understanding and
Reasoning Benchmark for Expert AGI 137
GPQA: A Graduate-Level Google-Proof
Q&A Benchmark 138
ARC-AGI 139
Humanity’s Last Exam 141
Planning 143
PlanBench 143
Chapter 2: Technical Performance
Articial Intelligence
Index Report 2025

84Table of Contents
2.8 AI Agents 144
VisualAgentBench 144
RE-Bench 145
GAIA 147
2.9 Robotics and Autonomous Motion 148
Robotics 148
RLBench 148
Highlight: Humanoid Robotics 150
Highlight: DeepMind’s Developments 151
Highlight: Foundation Models
for Robotics 154
Self-Driving Cars 155
Deployment 155
Technical Innovations and
New Benchmarks 156
Safety Standards 157
Chapter 2: Technical Performance (cont’d)
Articial Intelligence
Index Report 2025
ACCESS THE PUBLIC DATA

85
Articial Intelligence
Index Report 2025
Table of Contents Chapter 2 Preview
The Technical Performance section of this year’s AI Index provides a comprehensive
overview of AI advancements in 2024. It begins with a high-level summary of AI
technical progress, covering major AI-related launches, the state of AI capabilities, and
key trends—such as the rising performance of open-weight models, the convergence
of frontier model performance, and the improving quality of Chinese LLMs. The
chapter then examines the current state of various AI capabilities, including language
understanding and generation, retrieval-augmented generation, coding, mathematics,
reasoning, computer vision, speech, and agentic AI. New this year are signicantly
expanded analyses of performance trends in robotics and self-driving cars.
Overview
CHAPTER 2:
Technical Performance
Articial Intelligence
Index Report 2025

86
Articial Intelligence
Index Report 2025
Table of Contents Chapter 2 Preview
Chapter Highlights
1. AI masters new benchmarks faster than ever. In 2023, AI researchers introduced several challenging new
benchmarks, including MMMU, GPQA, and SWE-bench, aimed at testing the limits of increasingly capable AI systems. By 2024,
AI performance on these benchmarks saw remarkable improvements, with gains of 18.8 and 48.9 percentage points on MMMU
and GPQA, respectively. On SWE-bench, AI systems could solve just 4.4% of coding problems in 2023—a gure that jumped
to 71.7% in 2024.
4. AI model performance converges at the frontier. According to last year’s AI Index, the Elo score dierence between
the top and 10th-ranked model on the Chatbot Arena Leaderboard was 11.9%. By early 2025, this gap had narrowed to just
5.4%. Likewise, the dierence between the top two models shrank from 4.9% in 2023 to just 0.7% in 2024. The AI landscape is
becoming increasingly competitive, with high-quality models now available from a growing number of developers.
2. Open-weight models catch up. Last year’s AI Index revealed that leading open-weight models lagged signicantly
behind their closed-weight counterparts. By 2024, this gap had nearly disappeared. In early January 2024, the leading closed-
weight model outperformed the top open-weight model by 8.04% on the Chatbot Arena Leaderboard. By February 2025, this
gap had narrowed to 1.70%.
3. The gap between Chinese and US models closes. In 2023, leading American models signicantly outperformed
their Chinese counterparts—a trend that no longer holds. At the end of 2023, performance gaps on benchmarks such as MMLU,
MMMU, MATH, and HumanEval were 17.5, 13.5, 24.3, and 31.6 percentage points, respectively. By the end of 2024, these
dierences had narrowed substantially to just 0.3, 8.1, 1.6, and 3.7 percentage points.
5. New reasoning paradigms like test-time compute improve model performance. In 2024, OpenAI introduced
models like o1 and o3 that are designed to iteratively reason through their outputs. This test-time compute approach dramatically
improved performance, with o1 scoring 74.4% on an International Mathematical Olympiad qualifying exam, compared to GPT-
4o’s 9.3%. However, this enhanced reasoning comes at a cost: o1 is nearly six times more expensive and 30 times slower than
GPT-4o.
CHAPTER 2:
Technical Performance
Articial Intelligence
Index Report 2025

87
Articial Intelligence
Index Report 2025
Table of Contents Chapter 2 Preview
Chapter Highlights (cont’d)
6. More challenging benchmarks are continually proposed. The saturation of traditional AI benchmarks like MMLU,
GSM8K, and HumanEval, coupled with improved performance on newer, more challenging benchmarks such as MMMU and
GPQA, has pushed researchers to explore additional evaluation methods for leading AI systems. Notable among these are
Humanity’s Last Exam, a rigorous academic test where the top system scores just 8.80%; FrontierMath, a complex mathematics
benchmark where AI systems solve only 2% of problems; and BigCodeBench, a coding benchmark where AI systems achieve a
35.5% success rate—well below the human standard of 97%.
9. Complex reasoning remains a problem. Even though the addition of mechanisms such as chain-of-thought
reasoning has signicantly improved the performance of LLMs, these systems still cannot reliably solve problems for which
provably correct solutions can be found using logical reasoning, such as arithmetic and planning, especially on instances larger
than those they were trained on. This has a signicant impact on the trustworthiness of these systems and their suitability in
high-risk applications.
7. High-quality AI video generators demonstrate signicant improvement. In 2024, several advanced AI models
capable of generating high-quality videos from text inputs were launched. Notable releases include OpenAI’s SORA, Stable
Video 3D and 4D, Meta’s Movie Gen, and Google DeepMind’s Veo 2. These models produce videos of signicantly higher quality
compared to those from 2023.
8. Smaller models drive stronger performance. In 2022, the smallest model registering a score higher than 60% on
MMLU was PaLM, with 540 billion parameters. By 2024, Microsoft’s Phi-3-mini, with just 3.8 billion parameters, achieved the
same threshold. This represents a 142-fold reduction in over two years.
10. AI agents show early promise. The launch of RE-Bench in 2024 introduced a rigorous benchmark for evaluating
complex tasks for AI agents. In short time-horizon settings (two-hour budget), top AI systems score four times higher than human
experts, but as the time budget increases, human performance surpasses AI—outscoring it two to one at 32 hours. AI agents
already match human expertise in select tasks, such as writing Triton kernels, while delivering results faster and at lower costs.
CHAPTER 2:
Technical Performance
Articial Intelligence
Index Report 2025

88
Articial Intelligence
Index Report 2025
Table of Contents Chapter 2 Preview
Timeline: Signicant Model and Dataset Releases
As chosen by the AI Index Steering Committee, here are some of the most notable model and dataset releases of 2024.
2.1 Overview of AI in 2024
The Technical Performance chapter begins with a high-
level overview of signicant model releases in 2024 and
reviews the current state of AI technical performance.
2.1 Overview of AI in 2024
Chapter 2: Technical Performance
Date Name Category Creator(s) Signicance Image
Jan 19, 2024 Stable LM 2 LLM Stability AI Stability’s latest language model builds
on the original Stable LM, oering
enhanced performance. With only 1.6
billion parameters, it is designed to run
eciently on portable devices such as
laptops and smartphones.
Figure 2.1.1
Source: Wikipedia, 2025
Feb 8, 2024 Aya Dataset Dataset Cohere for
AI, Beijing
Academy of
AI, Cohere,
Binghamton
University
A collection of 513 million prompt-
completion pairs spanning 114
languages, released as part of Cohere’s
Aya initiative. This paper and its
accompanying dataset represent
signicant milestones in multilingual
instruction tuning.
Figure 2.1.2
Source: Cohere, 2025
Feb 15, 2024 Gemini 1.5 Pro LLM Google
DeepMind
Google’s Gemini model set a new
benchmark with its 1M token context
window, far exceeding GPT-4 Turbo’s
128K token limit. Figure 2.1.3
Source: Google, 2024
Feb 20, 2024 SDXL-Lightning Text-to-
image
ByteDance Developed by ByteDance, the creators
of TikTok, this model was among the
fastest text-to-image systems at its
release, generating high-quality synthetic
images in under a second. Its speed was
achieved through progressive adversarial
distillation, unlike other models that rely
on diusion-based techniques.
Figure 2.1.4
Source: Hugging Face, 2025
Mar 4, 2024 Claude 3 LLM Anthropic Anthropic’s latest LLM outperforms
GPT-4 and Gemini on nearly all industry
benchmarks, reduces incorrect prompt
refusals, and delivers signicantly higher
accuracy.
Figure 2.1.5
Source: Anthropic, 2025

89
Articial Intelligence
Index Report 2025
Table of Contents Chapter 2 Preview
2.1 Overview of AI in 2024
Chapter 2: Technical Performance
Mar 7, 2024 Inection-2.5 LLM Inection AI Inection’s agship product, “Pi,”
featured an exceptional model with
GPT-4–level performance while using
only 40% of its computing resources.
Just two weeks after the model’s release,
Microsoft acquired Inection for $650
million.
Figure 2.1.6
Source: Inection, 2025
Mar 19, 2024 Moirai and
LOTSA
Model/
dataset
Salesforce Salesforce unveils Moirai, a foundation
model for universal forecasting,
alongside LOTSA—a diverse, large-
scale time series dataset with 27 billion
observations spanning nine domains.
Figure 2.1.7
Source: Salesforce, 2025
Mar 27, 2024 DBRX LLM Databricks Databricks’ open-source mixture-of-
experts (MoE) LLM is a ne-grained
model, surpassing similar small MoE
models like Mixtral and Grok. This
transformer decoder-only model features
132B parameters (36B active per input)
and was trained on 12 trillion tokens.
Figure 2.1.8
Source: Databricks, 2025
Apr 2, 2024 Stable Audio 2 Text-to-
song and
song-to-
song
Stability AI The latest version of Stable Audio,
Stability’s AI-powered song generator,
now supports audio-to-audio
functionality. Users can upload songs and
manipulate them using natural language
prompts for seamless customization.
Figure 2.1.9
Source: Stability AI, 2025
Apr 17, 2024 Llama 3 LLM Meta The Llama 3 series debuts with 8B and
70B parameter text-based models,
ranking among the highest performing
models of their size to date.
Figure 2.1.10
Source: Meta, 2025
May 13, 2024 GPT-4o Multimodal OpenAI GPT-4o is a new multimodal model
capable of processing inputs in any
combination of text, audio, images, and
video, and generating outputs in the
same formats. It responds to audio in
as little as 320 milliseconds, matching
human response times.
Figure 2.1.11
Source: OpenAI, 2024

90
Articial Intelligence
Index Report 2025
Table of Contents Chapter 2 Preview
2.1 Overview of AI in 2024
Chapter 2: Technical Performance
Jun 7, 2024 Qwen2 LLM Alibaba Qwen2, developed by China’s Alibaba,
is a series of advanced base and
instruction-tuned models. These models
rival competitors like Llama 3-70B and
Mixtral-8x22B in performance across
numerous benchmarks.
Figure 2.1.12
Source: Qwen, 2024
Jun 17, 2024 Runway Gen-3 Text-to-
video and
image-to-
video
Runway Runway’s upgraded video generation
model sets a new standard for the
eld, particularly excelling in creating
photorealistic humans with vivid and
expressive emotionality.
Figure 2.1.13
Source: Runway, 2024
Jul 23, 2024 Llama 3.1 405B LLM Meta Meta has released its largest model to
date, the nal in the Llama 3.1 family,
featuring 405B parameters. Upon its
release, it became the most capable
openly available foundation model,
rivaling many closed models across a
variety of benchmarks. Figure 2.1.14
Source: Meta, 2024
Aug 12, 2024 Falcon Mamba LLM Technology
Innovation
Institute in
Abu Dhabi
A powerful new 7B parameter model,
built on the Mamba State Space
Language Model (SSLM) architecture,
enables Falcon—one of the few
government-created AI models—to
dynamically adjust parameters and lter
out irrelevant inputs, making it more
ecient than transformer-based models.
Figure 2.1.15
Source: Hugging Face, 2025
Aug 13, 2024 Grok-2 Text-to-text
and text-to-
image
xAI Developed by xAI, Grok is an advanced
text- and image-generation model that
excels in image creation, advanced
reasoning, and problem-solving. Its
launch was particularly notable, as
it quickly rivaled the performance
of leading models despite xAI being
founded only in March 2023.
Figure 2.1.16
Source: xAI, 2025

Articial Intelligence
Index Report 2025
Table of Contents Chapter 2 Preview 91
2.1 Overview of AI in 2024
Chapter 2: Technical Performance
Aug 15, 2024 Imagen 3 Text-to-
image
Google Labs Google’s updated AI image generator
achieves the highest Elo score on
the GenAI-Bench image benchmark,
setting a new standard for quality in AI-
generated visuals.
Figure 2.1.17
Source: Google, 2025
Aug 22, 2024 Jamba 1.5 LLM AI21 Labs The rst LLM to combine state-space
models with transformers, delivering
high-quality results for text-based
applications. This hybrid approach
signicantly enhances speed while
preserving the quality of outputs. Figure 2.1.18
Source: AI21, 2025
Aug 29, 2024 SynthID v2 Tool Google SynthID v2 is the updated version of
SynthID, Google’s watermarking and
identication software. It now supports
AI-generated content across images,
video, audio, and text, and oers
enhanced tracking and verication
capabilities.
Figure 2.1.19
Source: Google, 2025
Sep 11, 2024 NotebookLM
Podcast Tool
Text-to-
podcast
Google Labs The second end-to-end AI podcast
generator to hit the market, following
Synthpod, went viral. It gained popularity
among students leveraging NotebookLM
for studying and tech employees using it
to listen to AI-generated summaries.
Figure 2.1.20
Source: Google, 2025
Sep 12, 2024 o1-preview Language,
math,
biology
OpenAI OpenAI’s rst model in the “o series” is
designed for advanced reasoning and
tackling complex tasks. It is signicantly
more powerful than GPT, particularly in
math, science, and coding.
Figure 2.1.21
Source: OpenAI, 2025
Sep 17, 2024 NVLM (D, H, X) Vision,
language
Nvidia Nvidia released three open-access
models for vision-language tasks,
achieving top scores on OCRBench (for
optical character recognition) and VQAv2
(for natural language understanding).
Figure 2.1.22
Source: Dai et al., 2024

92
Articial Intelligence
Index Report 2025
Table of Contents Chapter 2 Preview
2.1 Overview of AI in 2024
Chapter 2: Technical Performance
Sep 19, 2024 Qwen2.5 LLM Alibaba Qwen2.5, the latest series of foundation
models from Chinese e-commerce giant
Alibaba, includes a range of ecient
smaller models and specialized coding
and math models designed for targeted
functionality.
Figure 2.1.23
Source: Qwen, 2025
Oct 16, 2024 Ministral LLM Mistral Ministral is a pair of compact models (3B
and 8B parameters) that outperformed
Gemma and Llama models of similar
size across all major industry-recognized
benchmarks.
Figure 2.1.24
Source: Mistral, 2025
Oct 22, 2024 Anthropic
Computer Use
Agentic
Capability
Anthropic Anthropic Computer Use is a
groundbreaking computer control feature
for Claude 3.5 Sonnet users, allowing
Claude to move the cursor, type, and
autonomously complete tasks on the
user’s computer in real time. Figure 2.1.25
Source: Anthropic, 2025
Oct 28, 2024 Apple
Intelligence
iPhone
feature
Apple Apple’s suite of AI-powered features
includes Image Playground (for image
creation), Genmoji (for custom emoji
creation), Siri integration with ChatGPT,
and more.
Figure 2.1.26
Source: Apple, 2025
Dec 3, 2024 Nova Pro Multimodal Amazon Nova Pro is the most powerful model
in Amazon Web Services’ Nova family,
capable of processing both visual and
textual information. It especially excels at
analyzing nancial documents.
Figure 2.1.27
Source: Amazon, 2025
Dec 11, 2024 Gemini 2 LLM Google
DeepMind
The improved version of Gemini,
Google’s LLM, now includes computer
control along with image and audio
generation capabilities. It is twice as fast
as Gemini 1.5 Pro and oers signicantly
enhanced performance in coding and
image analysis.
Figure 2.1.28
Source: Google, 2025

93
Articial Intelligence
Index Report 2025
Table of Contents Chapter 2 Preview
2.1 Overview of AI in 2024
Chapter 2: Technical Performance
Dec 12, 2024 Sora Text-to-
video
OpenAI OpenAI’s highly anticipated video
generation model can create videos up
to 20 seconds long at 1080p resolution
for ChatGPT Pro users (and ve seconds
at 720p for ChatGPT Plus users). Sora
demos had been circulating at tech
meetups since early 2024, but OpenAI
delayed the ocial release to improve
model safety.
Figure 2.1.29
Source: OpenAI, 2025
Dec 13, 2024 Global MMLU Dataset Cohere A multilingual evaluation set featuring
professionally translated MMLU
questions across 42 languages, designed
to serve as a more global AI benchmark.
It evaluates AI performance in diverse
languages while addressing Western
biases in the original MMLU dataset,
where an estimated 28% of questions
rely on Western cultural knowledge.
Figure 2.1.30
Source: Singh et al., 2025
Dec 20, 2024 o3 (beta) Multimodal OpenAI OpenAI’s newest frontier model, released
for safety testing by AI researchers,
outperforms all previous models in SWE,
competition code, competition math,
PhD-level science, and research math
benchmarks. It also set a new record
on the ARC-AGI benchmark, achieving
87.5% on the ARC Prize team’s private
holdout set.
Figure 2.1.31
Source: VentureBeat, 2025
Dec 27, 2024 DeepSeek-V3 LLM DeepSeek DeepSeek V3, an open-source model
developed with signicantly fewer
computing resources than state-of-the-
art models, outperforms leading models
on benchmarks like MMLU and GPQA.
Figure 2.1.32
Source: Dirox, 2025

94
Articial Intelligence
Index Report 2025
Table of Contents Chapter 2 Preview
State of AI Performance
In this section, the AI Index oers a high-level view into major
AI trends that occurred in 2024.
Overall Review
Last year’s AI Index highlighted that AI had already surpassed
human performance across many tasks, with only a few
exceptions, such as competition-level mathematics and visual
commonsense reasoning. Over the past year, AI systems
have continued to improve, exceeding human performance
on several of these previously challenging benchmarks.
Figure 2.1.33 illustrates the progress of AI systems relative
to human baselines for eight AI benchmarks corresponding
to 11 tasks (e.g., image classication or basic-level reading
comprehension).1 The AI Index team selected one benchmark
to represent each task. This year, the AI Index team added
newly released benchmarks, such as GPQA Diamond and
MMMU, to showcase the progress of AI systems in tackling
extremely challenging cognitive tasks.
1 An AI benchmark is a standardized test used to evaluate the performance and capabilities of AI systems on specic tasks. For example, ImageNet is a canonical AI benchmark that features
a large collection of labeled images, and AI systems are tasked with classifying these images accurately. Tracking progress on benchmarks has been a standard way for the AI community to
monitor the advancement of AI systems.
2 In Figure 2.1.33, the values are scaled to establish a standard metric for comparing dierent benchmarks. The scaling function is calibrated such that the performance of the best model for
each year is measured as a percentage of the human baseline for a given task. A value of 105% indicates, for example, that a model performs 5% better than the human baseline
2.1 Overview of AI in 2024
Chapter 2: Technical Performance
2012 2013 2014 2015 2016 2017 2018 2019 2020 2021 2022 2023 2024
0%
20%
40%
60%
80%
100%
120%
Image classication (ImageNet Top-5) Visual reasoning (VQA)
Medium-level reading comprehension (SQuAD 2.0) English language understanding (SuperGLUE)
Multitask language understanding (MMLU) Competition-level mathematics (MATH)
PhD-level science questions (GPQA Diamond) Multimodal understanding and reasoning (MMMU)
Performance relative to the human baseline (%)
Human baseline
Select AI Index technical performance benchmarks vs. human performance
Source: AI Index, 2025 | Chart: 2025 AI Index report
Figure 2.1.332

95
Articial Intelligence
Index Report 2025
Table of Contents Chapter 2 Preview
3 The benchmark data in this gure, along with those in other sections of this chapter, was collected in early January 2025. Since the publication of the AI Index, individual benchmark scores
may have improved.
4 In the software community, “open source” refers to software released under a license that grants users the right to use, study, modify, and distribute both the software and its source code
freely. Open-weight models, though more accessible than closed-weight models, are not necessarily fully open source, as the underlying code or training data is often withheld.
2.1 Overview of AI in 2024
Chapter 2: Technical Performance
As of 2024, there are very few task categories where human
ability surpasses AI. Even in these areas, the performance gap
between AI and humans is shrinking rapidly. For example, on
MATH, a benchmark for competition-level mathematics,
state-of-the-art AI systems are now 7.9 percentage points
ahead of human performance, a signicant improvement
from the 0.3-point gap in 2024.3 Similarly, on MMMU, a
benchmark for complex, multidisciplinary, expert-level
questions, the best 2024 model, o1, scored 78.2%, only 4.4
points below the human benchmark of 82.6%. Conversely,
at the end of 2023, Google Gemini scored 59.4%, further
illustrating the rapid advancements in AI performance on
cognitively demanding tasks.
Closed vs. Open-Weight Models
AI models can be released with dierent levels of openness.
Certain models, like Google’s Med-Gemini, remain entirely
closed, accessible only to their developers. Meanwhile,
models such as OpenAI’s GPT-4o and Anthropic’s Claude 3.5
provide limited public access through APIs. However, weights
for these models are not released, preventing independent
modication or thorough public scrutiny. In contrast, weights
for Meta’s Llama 3.3 and Stable Video 4D are fully available,
allowing anyone to modify and use them freely.4
Perspectives on open versus closed-weight AI models are
sharply divided. Advocates of open-weight models highlight
their potential to reduce market monopolies, spur innovation,
improve security and robustness, and enhance transparency
within the AI ecosystem. For example, Meta’s Llama models
have been leveraged to create tools like Meditron, power
military applications, and drive the development of numerous
open-weight models worldwide. However, critics warn that
open-weight models pose signicant security risks, including
the spread of disinformation and the creation of bioweapons,
arguing for a more cautious and controlled approach.
Last year’s AI Index highlighted a notable performance gap
between closed and open-weight LLM models. Figure 2.1.34
illustrates the performance trends of the top closed-weight
and open-weight LLMs on the Chatbot Arena Leaderboard,
a public platform for benchmarking LLM performance.
In early January 2024, the leading closed-weight model
outperformed the top open-weight model by 8.0%. By
February 2025, this gap had narrowed to 1.7%.
The same trend is evident across other question-answering
benchmarks. In 2023, closed-weight models consistently
outperformed open-weight counterparts on nearly every
major benchmark—MMLU, HumanEval, MMMU, and MATH.
However, by 2024, the gap had narrowed signicantly (Figure
2.1.35). For instance, in late 2023, closed-weight models led
open models on MMLU by 15.9 points, but by the end of
2024, that dierence had shrunk to just 0.1 percentage point.
This rapid improvement was largely driven by Meta’s summer
release of Llama 3.1, followed by the launch of other high-
performing open-weight models, such as DeepSeek’s V3.

96
Articial Intelligence
Index Report 2025
Table of Contents Chapter 2 Preview
2.1 Overview of AI in 2024
Chapter 2: Technical Performance
2024-Jan
2024-Feb
2024-Mar
2024-Apr
2024-May
2024-Jun
2024-Jul
2024-Aug
2024-Sep
2024-Oct
2024-Nov
2024-Dec
2025-Jan
2025-Feb
1,100
1,150
1,200
1,250
1,300
1,350
1,400
Score
1,362, open
1,385, closed
Performance of top closed vs. open models on LMSYS Chatbot Arena
Source: LMSYS, 2025 | Chart: 2025 AI Index report
2022 2023 2024
0%
20%
40%
60%
80%
100%
2022 2023 2024
0%
20%
40%
60%
80%
100%
2022 2023 2024
0%
20%
40%
60%
80%
100%
2022 2023 2024
0%
20%
40%
60%
80%
100%
Closed Open
Average accuracy
Overall accuracy
Accuracy
Pass@1
General language: MMLU General reasoning: MMMU
Mathematical reasoning: MATH Coding: HumanEval
Performance of top closed vs. open models on select benchmarks
Source: AI Index, 2025 | Chart: 2025 AI Index report
Figure 2.1.34
Figure 2.1.35

97
Articial Intelligence
Index Report 2025
Table of Contents Chapter 2 Preview
US vs. China Technical Performance
The United States has historically dominated AI research and
model development, with China consistently ranking second.
Recent evidence, however, suggests the landscape is rapidly
changing and that China-based models are catching up to
their U.S. counterparts.
In 2023, leading American models signicantly outperformed
their Chinese counterparts. On the LMSYS Chatbot Arena,
the top U.S. model outperformed the best Chinese model
by 9.3% in January 2024. By February 2025, this gap had
narrowed to just 1.7% (Figure 2.1.36). At the end of 2023,
on benchmarks such as MMLU, MMMU, MATH, and
HumanEval, the performance gaps were 17.5, 13.5, 24.3, and
31.6 percentage points, respectively (Figure 2.1.37). By the
end of 2024, these dierences had narrowed signicantly
to just 0.3, 8.1, 1.6, and 3.7 percentage points. The launch
of DeepSeek-R1 garnered attention for another reason: The
company reported achieving its results using only a fraction
of the hardware resources typically required to train such a
model. Beyond impacting U.S. stock markets, DeepSeek’s
R1 launch raised doubts about the eectiveness of U.S.
semiconductor export controls.
2.1 Overview of AI in 2024
Chapter 2: Technical Performance
2024-Jan
2024-Feb
2024-Mar
2024-Apr
2024-May
2024-Jun
2024-Jul
2024-Aug
2024-Sep
2024-Oct
2024-Nov
2024-Dec
2025-Jan
2025-Feb
1,100
1,150
1,200
1,250
1,300
1,350
1,400
Score
1,362, China
1,385, United States
Performance of top United States vs. Chinese models on LMSYS Chatbot Arena
Source: LMSYS, 2025 | Chart: 2025 AI Index report
Figure 2.1.36

98
Articial Intelligence
Index Report 2025
Table of Contents Chapter 2 Preview
2.1 Overview of AI in 2024
Chapter 2: Technical Performance
2022 2023 2024
0%
20%
40%
60%
80%
100%
2022 2023 2024
0%
20%
40%
60%
80%
100%
2022 2023 2024
0%
20%
40%
60%
80%
100%
2022 2023 2024
0%
20%
40%
60%
80%
100%
United States China
Average accuracy
Overall accuracy
Accuracy
Pass@1
General language: MMLU General reasoning: MMMU
Mathematical reasoning: MATH Coding: HumanEval
Performance of top United States vs. Chinese models on select benchmarks
Source: AI Index, 2025 | Chart: 2025 AI Index report
Figure 2.1.37

99
Articial Intelligence
Index Report 2025
Table of Contents Chapter 2 Preview
Improved Performance From Smaller Models
Recent AI progress has been driven by scaling—the idea
that increasing model size and training data improves
performance. While scaling has signicantly boosted AI
capabilities, a notable recent trend is the emergence of
smaller high-performing models. Figure 2.1.38 illustrates the
reduction in size of the smallest model that scores above 60%
on MMLU, a widely used language model benchmark. For
context, early models powering ChatGPT, such as GPT-3.5
Turbo, scored around 70% on MMLU. In 2022, the smallest
model surpassing 60% on MMLU was PaLM, with 540 billion
parameters. By 2024, Microsoft’s Phi-3 Mini, with just 3.8
billion parameters, achieved the same threshold, marking a
142-fold reduction in model size over two years.
2024 was a breakthrough year for smaller AI models. Nearly
every major AI developer released compact, high-performing
models, including GPT-4o mini, o1-mini, Gemini 2.0 Flash,
Llama 3.1 8B, and Mistral Small 3.5 The rise of small models
is signicant for several reasons. It demonstrates increasing
algorithmic eciency, allowing developers to achieve more
with less data and at lower training cost. These eciency
gains, combined with growing datasets, could lead to
even higher-performing models. Additionally, inference on
smaller models is typically faster and less expensive. Their
emergence also lowers the barrier to entry for AI developers
and businesses looking to integrate AI into their operations.
2.1 Overview of AI in 2024
Chapter 2: Technical Performance
PaLM
LLaMA-65B
Llama 2 34B
Mistral 7B
Phi-3-mini
2022-May 2022-Sep 2023-Jan 2023-May 2023-Sep 2024-Jan 2024-May
10B
100B
Publication date
Number of parameters (log scale)
Smallest AI models scoring above 60% on MMLU, 2022–24
Source: Abdin et al., 2024 | Chart: 2025 AI Index report
Figure 2.1.38
5 These are just a few of the small models launched in 2024.

100
Articial Intelligence
Index Report 2025
Table of Contents Chapter 2 Preview
Model Performance Converges at the Frontier
In recent years, AI model performance at the frontier has
converged, with multiple providers now oering highly
capable models. This marks a shift from late 2022, when
ChatGPT’s launch—widely seen as AI’s breakthrough
into public consciousness—coincided with a landscape
dominated by just two major players: OpenAI and Google.
OpenAI, founded in 2015, released GPT-3 in 2020, while
Google introduced models like PaLM and Chinchilla in 2022.
Since then, new players have entered the scene, including
Meta with its Llama models, Anthropic with Claude, High-
Flyer’s DeepSeek, Mistral’s Le Chat, and xAI with Grok.
As competition has intensied, model performance has
increasingly converged (Figure 2.1.39). According to last year’s
AI Index, the performance gap between the highest- and
10th-ranked models on the Chatbot Arena Leaderboard—a
widely used AI ranking platform—was 11.9%. By early 2025, it
had narrowed to 5.4%. Similarly, the dierence between the
top two models fell from 4.9% in 2023 to just 0.7% in 2024.
The AI landscape is becoming more competitive, validating
2023 predictions that AI companies lack a technological
moat to shield them from rivals.
2.1 Overview of AI in 2024
Chapter 2: Technical Performance
Figure 2.1.39
2024-Jan
2024-Feb
2024-Mar
2024-Apr
2024-May
2024-Jun
2024-Jul
2024-Aug
2024-Sep
2024-Oct
2024-Nov
2024-Dec
2025-Jan
2025-Feb
1,050
1,100
1,150
1,200
1,250
1,300
1,350
1,400
Score
1,252, Mistral AI
1,269, Meta
1,284, Anthropic
1,288, xAI
1,362, DeepSeek
1,366, OpenAI
1,385, Google
Performance of top models on LMSYS Chatbot Arena by select providers
Source: LMSYS, 2025 | Chart: 2025 AI Index report

101
Articial Intelligence
Index Report 2025
Table of Contents Chapter 2 Preview
Benchmarking AI
For years, the AI Index has used benchmarks to monitor the
technical progress of AI systems over time. While benchmarks
remain a key tool in this eort, it is important to acknowledge
their limitations and guide the community toward more
eective benchmarking practices.
As noted in last year’s AI Index, many prominent AI benchmarks
are reaching saturation. With AI systems advancing rapidly,
even newly designed, more challenging tests often remain
relevant for only a few years. Some experts suggest that the
era of new academic benchmarks may be coming to an end.
To truly assess the capabilities of AI systems, more rigorous
and comprehensive evaluations are needed.
Additionally, when model developers release new models, they
typically report benchmark scores, which are often accepted at
face value by the broader community. However, this approach
has aws. In some cases, companies use nonstandard
prompting techniques, making model-to-model comparisons
unreliable. For example, when Google launched Gemini Ultra,
it reported an MMLU benchmark score using a chain-of-
thought prompting technique that other developers did not
use. Additionally, third-party researchers have documented
cases where models perform worse in independent testing
compared with the results rst reported by their developers.
There are critical aspects of intelligence that do not easily
lend themselves to benchmarking. Benchmarks are eective
for evaluating certain intelligent capabilities, such as vision
and language, where tasks are discrete—e.g., classifying an
image correctly or answering a multiple-choice question.
However, developing benchmarks is more challenging in
areas of AI such as multi-agent systems and human-AI
interaction because of factors including the variability in
human behaviors and the sheer diversity of correct answers.
In addition, AI advances have traditionally been evaluated in
competitions designed to measure human performance, such
as games and other open challenges posed to humans or
machines. Games such as chess and poker involve signicant
intelligence, and AI systems have improved over the decades
to the point of defeating the best humans at increasingly
complex games. Games with a physical component or team
capabilities are also a good measure of progress for AI, and
the robotics community has embarked on challenging game
competitions such as RoboCup for soccer-playing robots.
Another area of AI where competitions are used involves
coordination and teamwork where multi-agent systems
demonstrate advances in distributed reasoning.
Benchmarks have been developed by the AI community
for a very long time. Signicant advances in AI have been
possible because dierent approaches and methods could
be evaluated against the same gold standard represented
by a benchmark. In machine learning, benchmarks with
dierent kinds of data in diverse domains have enabled
signicant advances. Many of these benchmarks are
evaluated automatically by a third party without releasing the
test data to the AI developers, which makes the evaluations
more trustworthy. One interesting recent trend is that
various benchmark tasks are addressed by the same model.
For example, natural language was addressed for many
years as a collection of separate tasks (e.g., understanding,
generation, question answering), each with its own models
and each with its own benchmarks. Similarly, speech tasks
were benchmarked separately from language understanding
or generation tasks. Today, the same model can address
all language tasks, and, in some cases, a single model can
address language, images, and multimodal tasks. This is a
very important AI advance concerning the integration of
otherwise separate intelligent tasks and capabilities.
The rapid progress of AI systems, evidenced by their consistent
outperformance on benchmarks, is perhaps best illustrated
by the diminishing relevance of the well-known and long-
standing challenge for AI: the Turing test. Originally proposed
in Alan Turing’s 1950 paper “Computing Machinery and
Intelligence,” the test evaluates a machine’s ability to exhibit
humanlike intelligence. In it, a human judge engages in a text-
based conversation with both a machine and a human; if the
2.1 Overview of AI in 2024
Chapter 2: Technical Performance

102
Articial Intelligence
Index Report 2025
Table of Contents Chapter 2 Preview
judge cannot reliably distinguish between them, the machine
is said to have passed the Turing test. Recent evidence
suggests that LLMs have advanced so signicantly that people
struggle to dierentiate the best-performing language models
from a human, signaling that modern AI models can pass the
Turing test. While the merits and shortfalls of this test have
long been debated, it remains an important historical and
cultural benchmark for machine intelligence. The questioning
of its relevance highlights the remarkable progress of LLMs in
recent years and the evolving perception of eective computer
science benchmarks and AI measurement.
In robotics, many models have emerged that address
interacting with the physical world and reasoning about natural
laws. A number of robotics benchmarks, such as ARMBench,
focus on perception tasks. However, other benchmarks, such
as VIMA-Bench, assess robot performance in simulated
environments where they simultaneously incorporate
perception, communication, and deep learning.
Benchmarks can also suer from contamination, where LLMs
encounter test questions that were present in their training
data. A recent study by Scale found signicant contamination
in the performance of many LLMs on GSM8K, a widely
used mathematics benchmark. Some researchers have
sought to combat these contamination issues by introducing
benchmarks like LiveBench, which are periodically updated
with new questions from unfamiliar sources that LLMs are
unlikely to have seen in their training data.
Lastly, research has shown that many benchmarks are poor-
ly constructed. In BetterBench, researchers systematically
analyzed 24 prominent benchmarks and identied systemic
deciencies: 14 failed to report statistical signicance, 17
lacked scripts for result replication, and most suered from
inadequate documentation, limiting their reproducibility and
eectiveness in evaluating models. Despite widespread use,
benchmarks like MMLU demonstrated poor adherence to
quality standards, while others, such as GPQA, performed
signicantly better. To address these issues, the paper pro-
posed a 46-criteria framework covering all phases of bench-
mark development—design, implementation, documenta-
tion, and maintenance (Figure 2.1.40). It also introduced a
publicly accessible repository to enable continuous updates
and improve benchmark comparability. Figure 2.1.41, from
BetterBench, assesses many prominent benchmarks on their
usability and design. These ndings underscore the need for
standardized benchmarking to ensure reliable AI evaluation
and to prevent misleading conclusions about model per-
formance. Benchmarks have the potential to shape policy
decisions and inuence procurement decisions within or-
ganizations highlighting the importance of consistency and
rigor in evaluation.
2.1 Overview of AI in 2024
Chapter 2: Technical Performance
Five stages of the benchmark lifecycle
Source: Reuel et al., 2024
Figure 2.1.40

103
Articial Intelligence
Index Report 2025
Table of Contents Chapter 2 Preview
2.1 Overview of AI in 2024
Chapter 2: Technical Performance
BBQ
BOLD
MMLU
ARC-Challenge
WinoGrande
GSM8K
HellaSwag
AgentBench
GPQA
BIG-bench
Procgen
Wordcraft
RL Unplugged
FinRL-Meta
SafeBench
ALE
0 5 10 15 20
0
5
10
15
Foundation models
Non-foundation models
Design score
Usability score
MedMNIST v2
TruthfulQA
MLCommons AI Safety v0.5
Machiavelli
PDEBench
DecodingTrust
HumanEval
Design vs. usability scores across select benchmarks
Source: Reuel et al., 2024 | Chart: 2025 AI Index report
Figure 2.1.41
In this chapter, the AI Index continues to report on
benchmarks, recognizing their importance in tracking AI’s
technical progress. As a standard practice, the Index sources
benchmark scores from leaderboards, public repositories
such as Papers With Code and RankedAGI, as well as
company papers, blog posts, and product releases. The Index
operates under the assumption that the scores reported by
companies are accurate and factual. The benchmark scores
in this section are current as of mid-February 2025. However,
since the publication of the AI Index, newer models may have
been released that surpass current state-of-the-art scores.

104
Articial Intelligence
Index Report 2025
Table of Contents Chapter 2 Preview
2.2 Language
Chapter 2: Technical Performance
2.2 Language
Natural language processing (NLP) enables computers to
understand, interpret, generate, and transform text. Current
state-of-the-art models, such as OpenAI’s GPT-4o, Anthropic’s
Claude 3.5, and Google’s Gemini, are able to generate uent
and coherent prose and display high levels of language
understanding ability (Figure 2.2.1). Unlike earlier versions,
which were restricted to text input and output, newer language
models can now reason across a growing range of input and
output modalities, including audio, images, and goal-oriented
tasks (Figure 2.2.2).
A sample output from GPT-4o
Source: AI Index, 2025
Figure 2.2.1
Figure 2.2.2
Gemini 2.0 in an agentic workow
Source: AI Index, 2025

105
Articial Intelligence
Index Report 2025
Table of Contents Chapter 2 Preview
2019 2020 2021 2022 2023 2024
0%
10%
20%
30%
40%
50%
60%
70%
80%
90%
100%
Average accuracy
92.30%
MMLU: average accuracy
Source: Papers With Code, 2025 | Chart: 2025 AI Index report
89.8%, human baseline
2.2 Language
Chapter 2: Technical Performance
Understanding
English language understanding challenges AI systems to
understand the English language in various ways, such as
reading comprehension and logical reasoning.
MMLU: Massive Multitask Language Understanding
The Massive Multitask Language Understanding (MMLU)
benchmark assesses model performance in zero-shot or few-
shot scenarios across 57 subjects, including the humanities,
STEM, and the social sciences (Figure 2.2.3). MMLU has
emerged as a premier benchmark for assessing LLM
capabilities: Many state-of-the-art models like GPT-4o, Claude
3.5, and Gemini 2.0 have been evaluated against MMLU.
The MMLU benchmark was created in 2020 by a team of
researchers from UC Berkeley, Columbia University, University
of Chicago, and University of Illinois Urbana-Champaign.
The highest recorded score on MMLU, 92.3%, was achieved
by OpenAI’s o1-preview model in September 2024. For
comparison, GPT-4, launched in March 2023, scored 86.4%
on the benchmark. Notably, one of the earliest models
tested on MMLU, RoBERTa, achieved just 27.9% in 2019
(Figure 2.2.4). This latest state-of-the-art result represents a
remarkable 64.4 percentage point increase over ve years.
Figure 2.2.3
Figure 2.2.4
A sample question from MMLU
Source: Hendrycks et al., 2021

106
Articial Intelligence
Index Report 2025
Table of Contents Chapter 2 Preview
71.59% 71.85% 72.55% 73.11% 73.30% 74.68% 75.46% 75.70% 75.87% 76.24% 77.64% 77.90% 78.00% 80.30% 84.00%
Qwen2.5-72B
Grok-2-mini
GPT-4o (2024-05-13)
Athene-V2-Chat (0-shot)
Llama-3.1-405B-Instruct
GPT-4o (2024-08-06)
Grok-2
MiniMax-Text-01
DeepSeek-V3
Gemini-2.0-Flash-exp
Claude-3.5-Sonnet (2024-10-22)
GPT-4o (2024-11-20)
Claude-3.5-Sonnet (2024-06-20)
GPT-o1-mini
DeepSeek-R1
0%
20%
40%
60%
80%
100%
Overall accuracy
MMLU-Pro: overall accuracy
Source: MMLU-Pro Leaderboard, 2025 | Chart: 2025 AI Index report
2.2 Language
Chapter 2: Technical Performance
Despite its prominence, MMLU has faced notable criticisms.
These include claims that the benchmark contains erroneous
or overly simplistic questions, which may not challenge
increasingly advanced systems. In 2024, a team of researchers
from the University of Toronto, University of Waterloo, and
Carnegie Mellon introduced MMLU-Pro, a more challenging
variant of MMLU. This version eliminates noisy and trivial
questions, expands complex ones, and increases the number
of answer choices available to models. Figure 2.2.5 highlights
performance trends on MMLU-Pro, with DeepSeek-R1
posting the highest score to date (84.0%).
Additionally, concerns have been raised about the testing
landscape. Developers sometimes report MMLU scores
using nonstandard prompting techniques that boost
performance but can lead to misleading comparisons.
Furthermore, evidence suggests that publicly reported scores
by developers can dier—sometimes by as much as ve
percentage points—from those later evaluated by academic
researchers. As such, MMLU performance results should be
interpreted with caution.
Generation
In generation tasks, AI models are tested on their ability to
produce uent and practical language responses.
Chatbot Arena Leaderboard
The rise of capable LLMs has made it increasingly important
to understand which models are preferred by the general
public. Launched in 2023, the Chatbot Arena Leaderboard
from LMSYS is one of the rst comprehensive evaluations
of public LLM preference. The leaderboard allows users to
query two anonymous models and vote for the preferred
generations (Figure 2.2.6). By early 2025, the platform had
accumulated over 1 million votes, with users ranking one of
Google’s Gemini models as the community’s most preferred
choice.
Figure 2.2.5

107
Articial Intelligence
Index Report 2025
Table of Contents Chapter 2 Preview
Gemini-1.5-Pro-002
Step-2-16K-Exp
o1-mini
DeepSeek-V3
o1-preview
o1-2024-12-17
Gemini-2.0-Flash-Exp
Gemini-2.0-Flash-Thinking-Exp-1219
ChatGPT-4o-latest (2024-11-20)
Gemini-Exp-1206
1,300
1,310
1,320
1,330
1,340
1,350
1,360
1,370
1,380
Model
Elo rating
LMSYS Chatbot Arena for LLMs: Elo rating (overall)
Source: LMSYS, 2025 | Chart: 2025 AI Index report
2.2 Language
Chapter 2: Technical Performance
Figure 2.2.7 provides a snapshot of the top 10 models on the
Chatbot Arena Leaderboard as of January 2025. Interestingly,
the performance gap between top leaderboard models has
narrowed over time. In 2023, according to data from the 2024
AI Index, the dierence in Arena scores between the top
model and the 10th-ranked model was 11.9%.6 By 2025, this
gap had decreased to just 5.4%. This convergence highlights
a growing parity in the quality of recent LLMs.
Figure 2.2.7
A sample model response on the Chatbot Arena Leaderboard
Source: Chatbot Arena Leaderboard, 2024
Figure 2.2.6
6 The Arena score is a relative ranking system used by the Arena Leaderboard to compare model performance. For more details on the scoring methodology, refer to the paper introducing
the Chatbot Arena Leaderboard.

108
Articial Intelligence
Index Report 2025
Table of Contents Chapter 2 Preview
Arena-Hard-Auto
One of the challenges in developing new benchmarks to keep
pace with rapidly improving AI capabilities is that creating
high-quality, human-curated benchmarks is often expensive
and time-consuming. In response, this year saw the launch of
BenchBuilder. Created by a team of UC Berkeley researchers,
BenchBuilder leverages LLMs to create an automated
pipeline for curating high-quality, open-ended prompts from
large, crowdsourced datasets. BenchBuilder can be used
to update or create new benchmarks without signicant
human involvement. This tool was used by the LMSYS team
to develop Arena-Hard-Auto, a benchmark designed to
evaluate instruction-tuned LLMs (Figure 2.2.8). Arena-Hard-
Auto includes 500 challenging user queries sourced from
Chatbot Arena. In this benchmark, GPT-4 Turbo serves as
the judge that compares model responses against a baseline
model (GPT-4-0314).
As of November 2024, the top-scoring models on the Arena-
Hard-Auto leaderboard were o1-mini (92.0), o1-preview
(90.4), and Claude-3.5-Sonnet (85.2) (Figure 2.2.9). Arena-
Hard-Auto also features a style control leaderboard, which
gpt-4-0125-preview
gpt-4o-2024-05-13
claude-3-5-sonnet-2024-06-20
yi-lightning
gpt-4-turbo-2024-04-09
llama-3.1-nemotron-70b-instruct
athene-v2-chat
claude-3-5-sonnet-2024-10-22
o1-preview-2024-09-12
o1-mini-2024-09-12
0
20
40
60
80
100
Model
Score
78.00 79.20 79.30 81.50 82.60 84.90 85.00 85.20 90.40 92.00
Arena-Hard-Auto with no modication
Source: LMSYS, 2025 | Chart: 2025 AI Index report
gpt-4o-2024-05-13
llama-3.1-nemotron-70b-instruct
gpt-4o-2024-08-06
athene-v2-chat
gpt-4-0125-preview
gpt-4-turbo-2024-04-09
o1-mini-2024-09-12
o1-preview-2024-09-12
claude-3-5-sonnet-2024-06-20
claude-3-5-sonnet-2024-10-22
0
20
40
60
80
100
Model
Score
69.90 71.00 71.10 72.10 73.60 74.30
79.30 81.70 82.20 86.40
Arena-Hard-Auto with style control
Source: LMSYS, 2025 | Chart: 2025 AI Index report
2.2 Language
Chapter 2: Technical Performance
Figure 2.2.9 Figure 2.2.10
Arena-Hard-Auto vs. other benchmarks
Source: Li et al., 2024
Figure 2.2.8
accounts for how the style of an LLM’s responses might
inadvertently inuence user preferences. The top model on
the style leaderboard is the November variant of Anthropic’s
Claude Sonnet 3.5 (Figure 2.2.10). Automated benchmarks
like Arena-Hard-Auto have faced criticism for uneven
question distribution, which limits their ability to provide a
comprehensive assessment of LLM capabilities. For instance,
over 50% of Arena-Hard-Auto questions focus solely on
coding and debugging.

109
Articial Intelligence
Index Report 2025
Table of Contents Chapter 2 Preview
WildBench
WildBench, developed by researchers from the Allen Institute
for AI and the University of Washington, is a benchmark
launched in 2024 to evaluate LLMs on challenging real-
world queries. The creators highlight several limitations
of existing LLM evaluations. For example, MMLU focuses
on academic questions and does not assess open-ended,
real-world problems. Similarly, benchmarks like LMSYS,
which address real-world challenges, rely heavily on human
oversight and lack consistency in evaluating all models with
the same dataset.
2.2 Language
Chapter 2: Technical Performance
Figure 2.2.11
Evaluation framework for WildBench
Source: Lin et al., 2024

110
Articial Intelligence
Index Report 2025
Table of Contents Chapter 2 Preview
WildBench addresses many shortcomings of existing
benchmarks by providing an automated evaluation framework
for LLMs, incorporating a diverse set of real-world (“in the
wild”) questions that language models are likely to encounter
(Figure 2.2.11). The questions in WildBench are meticulously
selected from over 1 million human-chatbot interactions and
are periodically updated to ensure relevance. The creators
also maintain a live leaderboard to track model performance
over time. Currently, the top-performing model on WildBench
is GPT-4o, with an Elo score of 1227.1, narrowly surpassing the
second-place model, Claude 3.5 Sonnet, which scored 1215.4
(Figure 2.2.12).
2.2 Language
Chapter 2: Technical Performance
1,176 1,179 1,181 1,182 1,185 1,188 1,192 1,196 1,197 1,199 1,209 1,210 1,215 1,215 1,227
Gemma-2-27B-it
Nemotron-4-340B-Inst
Athene-70B
Yi-Large
DeepSeek-V2-Coder
Llama-3-70B-Instruct
Gemini 1.5 Flash
Claude 3 Opus
gpt-4-0125-preview
DeepSeek-V2-Chat
Yi-Large-Preview
gpt-4-turbo-2024-04-09
Gemini 1.5 Pro
Claude 3.5 Sonnet
gpt-4o-2024-05-13
0
200
400
600
800
1,000
1,200
Model
WB-Elo (length controlled)
WildBench: WB-Elo (length controlled)
Source: WildBench Leaderboard, 2025 | Chart: 2025 AI Index report
Figure 2.2.12

111
Articial Intelligence
Index Report 2025
Table of Contents Chapter 2 Preview
Highlight:
o1, o3, and Inference-Time Compute
OpenAI’s latest two models, o1 and o3, mark a paradigm
shift in AI models’ ability to “think” and exhibit signs of
advanced reasoning. o1 and o3 have shown impressive
results across a variety of tasks, including programming,
quantum physics, and logic. The models’ advanced
reasoning capabilities are attributed to their chain-of-
thought process and ability to iteratively check answers.
This means that the models break complex problems into
smaller, more manageable steps before executing them,
enhancing the resulting output quality. For example,
when asked to decipher scrambled text, o1 will specify its
thought and reasoning process more thoroughly than GPT-
4 (Figure 2.2.13). This process, through which AI systems
iterate as they answer, has been referred to as inference or
test-time computation.
2.2 Language
Chapter 2: Technical Performance
Figure 2.2.13
Chain-of-thought thinking in o1
Source: OpenAI, 2024

112
Articial Intelligence
Index Report 2025
Table of Contents Chapter 2 Preview
Figure 2.2.14 juxtaposes the scores of GPT-4o, OpenAI’s
previous state-of-the-art model, with o1 and o1-preview on
a variety of benchmarks.7 For example, o1 outperforms GPT-
4o with a 2.8-point gain on MMLU, 34.5 points on MATH,
26.7 points on GPQA Diamond, and 65.1 points on AIME
2024, a notoriously dicult mathematics competition.
Finally, o3 demonstrates more complex reasoning than any
other AI model known today, posting an 87.5% accuracy
rate on the ARC-AGI machine intelligence benchmark and
passing the previous record of 55.5%.
While these models enhance reasoning capabilities, this
comes at a price—both a nancial and latency cost. For
example, GPT-4o costs $2.50 per 1 million input tokens
and $10 per 1 million output tokens. Conversely, o1 costs
$15 per 1 million input tokens and $60 per 1 million output
tokens.8 Moreover, o1 is approximately 40 times slower
than GPT-4o, with 29.7 seconds to rst token as opposed
to GPT-4o’s 0.72. The latency of o3, while not publicly
available, is presumably even higher. o1 and o3’s strong
capabilities are likely to continue fueling powerful AI
systems and agents.
OpenAI rst released o1-preview to ChatGPT Plus and
Teams users on Sept. 12, 2024, and released the full version
of o1 (as well as access to ChatGPT Pro, a $200 monthly
subscription enabling access to o1) on Dec. 5, 2024.
2.2 Language
Chapter 2: Technical Performance
88.00% 90.80% 92.30%
GPT-4o o1 o1-preview
0%
20%
40%
60%
80%
100%
60.30%
85.50%
94.80%
GPT-4o o1-preview o1
0%
20%
40%
60%
80%
100%
50.60%
73.30% 77.30%
GPT-4o o1-preview o1
0%
20%
40%
60%
80%
100%
9.30%
44.60%
74.40%
GPT-4o o1-preview o1
0%
20%
40%
60%
80%
100%
Pass@1
Pass@1
Pass@1
Pass@1
MMLU MATH
GPQA Diamond AIME 2024
GPT-4o vs. o1-preview vs. o1 on select benchmarks
Source: OpenAI, 2024 | Chart: 2025 AI Index report
Figure 2.2.14
7 The o1-preview model is OpenAI’s early release of o1, made available before its broader public launch.
8 o3 is currently only available to select researchers and developers via OpenAI’s safety testing program.
Highlight:
o1, o3, and Inference-Time Compute (cont’d)

113
Articial Intelligence
Index Report 2025
Table of Contents Chapter 2 Preview
MixEval
MixEval, launched by researchers at the National University of
Singapore, Carnegie Mellon University, and the Allen Institute
for AI, is another newly released benchmark designed to
address some of the aforementioned limitations in the current
eld of LLM evaluation. MixEval combines comprehensive,
well-distributed, real-world user queries, similar to those found
in Chatbot Arena, with ground-truth-based questions, like those
featured in MMLU (Figure 2.2.15). MixEval includes various
evaluation suites, with MixEval-Hard representing the more
challenging version of the benchmark. This suite focuses on
substantially harder queries, making it one of the most eective
tools for assessing how models handle complex questions.
The highest-scoring model on the MixEval-Hard benchmark
is OpenAI’s o1-preview, with a score of 72.0. In second
place is the Claude 3.5 Sonnet-0620 model, followed by the
Llama-3 1-405B-Instruct model, which scored 66.2 (Figure
2.2.16). All three models were released in 2024.
52.90 54.00 55.80 55.90 56.80 57.00 57.40 58.30 58.70
62.60 63.50 64.70 66.20 68.10
72.00
Reka Core-20240415
Claude 3 Sonnet
Qwen-Max-0428
LLaMA-3-70B-Instruct
Yi-Large-preview
Spark4.0
Mistral Large 2
Gemini 1.5 Pro-API-0514
Gemini 1.5 Pro-API-0409
GPT-4-Turbo-2024-04-09
Claude 3 Opus
GPT-4o-2024-05-13
LLaMA-3.1-405B-Instruct
Claude 3.5 Sonnet-0620
OpenAI o1-preview
0
10
20
30
40
50
60
70
Model
Score
MixEval-Hard on chat models: score
Source: MixEval Leaderboard, 2025 | Chart: 2025 AI Index report
2.2 Language
Chapter 2: Technical Performance
Figure 2.2.15
Figure 2.2.16
Evaluation framework for MixEval
Source: Ni et al., 2024

114
Articial Intelligence
Index Report 2025
Table of Contents Chapter 2 Preview
2.2 Language
Chapter 2: Technical Performance
RAG: Retrieval Augment Generation (RAG)
An increasingly common capability being tested in LLMs
is retrieval-augmented generation (RAG). This approach
integrates LLMs with retrieval mechanisms to enhance
their response generation. The model rst retrieves relevant
information from les or documents and then generates a
response tailored to the user’s query based on the retrieved
content. RAG has diverse use cases, including answering
precise questions from large databases and addressing
customer queries using information from company documents.
In recent years, RAG has received increasing attention from
researchers and companies. For example, in September
2024, Anthropic introduced Contextual Retrieval, a method
that signicantly enhances the retrieval capabilities of RAG
models. 2024 also saw the release of numerous benchmarks
for evaluating RAG systems, including Ragnarok (a RAG
arena battleground) and CRAG (Comprehensive RAG
benchmark). Additionally, specialized RAG benchmarks, such
as FinanceBench for nancial question answering, have been
developed to address specic use cases.
Berkeley Function Calling Leaderboard
The Berkeley Function Calling Leaderboard evaluates the
ability of LLMs to accurately call functions or tools. The
evaluation suite includes over 2,000 question-function-
answer pairs across multiple programming languages (such
as Python, Java, JavaScript, and REST API) and spans a
variety of testing domains (Figure 2.2.17).
Figure 2.2.179
Data composition on the Berkeley Function Calling Leaderboard
Source: Yan et al., 2024
9 In this context: AST (abstract syntax tree) refers to tasks that involve analyzing or manipulating code at the structural level, using its parsed representation as a tree of syntactic elements.
Evaluations labeled with “AST” likely test an AI model’s ability to understand, generate, or manipulate code in a structured manner. Exec (execution-based) indicates tasks that require actual
execution of function calls to verify correctness. Evaluations labeled with “Exec” likely assess whether the AI model can correctly call and execute functions, ensuring the expected outputs
are produced.

115
Articial Intelligence
Index Report 2025
Table of Contents Chapter 2 Preview
60.97 61.31 61.38 61.74 61.83 62.19 62.73 62.79 64.10 66.73 67.88 67.98 69.58 72.08 74.31
Gemini-1.5-Pro-002 (FC)
Qwen2.5-72B-Instruct (Prompt)
Amazon-Nova-Pro-v1:0 (FC)
Gemini-2.0-Flash-Exp (Prompt)
Hammer2.1-7b (FC)
Gemini-1.5-Pro-002 (Prompt)
Functionary-Medium-v3.1 (FC)
o1-mini-2024-09-12 (Prompt)
GPT-4o-mini-2024-07-18 (FC)
o1-2024-12-17 (Prompt)
GPT-4-turbo-2024-04-09 (FC)
watt-tool-8B (FC)
gpt-4o-2024-11-20 (FC)
gpt-4o-2024-11-20 (Prompt)
watt-tool-70B (FC)
0
20
40
60
80
100
Model
Overall accuracy
Berkeley Function-Calling: overall accuracy
Source: Berkeley Function-Calling Leaderboard, 2025 | Chart: 2025 AI Index report
2.2 Language
Chapter 2: Technical Performance
The top model on the Berkeley Function Calling Leaderboard
is watt-tool-70b, a ne-tuned variant of Llama-3.3-70B-
Instruct designed specically for function calling. It achieved
an overall accuracy of 74.31 (Figure 2.2.18). The next-highest-
scoring model was a November variant of GPT-4o, with a
score of 72.08. Performance on this benchmark has improved
signicantly over the course of 2024, with top models at the
end of the year achieving accuracies up to 50 points higher
than those recorded early in the year.
Figure 2.2.18

116
Articial Intelligence
Index Report 2025
Table of Contents Chapter 2 Preview
2.2 Language
Chapter 2: Technical Performance
Figure 2.2.19
10 The benchmark covers the following eight tasks: bitext mining, classication, clustering, pair classication, reranking, retrieval, semantic textual similarity, and summarization. For details on
each task, refer to the MTEB paper.
MTEB: Massive Text Embedding Benchmark
The Massive Text Embedding Benchmark (MTEB), created
by a team at Hugging Face and Cohere, was introduced in
late 2022 to comprehensively evaluate how models perform
on various embedding tasks. Embedding involves converting
data, such as words, texts, or documents, into numerical
vectors that capture rough semantic meanings and distance
between vectors. Embedding is an essential component of
RAG. During a RAG task, when users input a query, the model
transforms it into an embedding vector. This transformation
enables the model to then search for relevant information.
MTEB includes 58 datasets spanning 112 languages and
eight embedding tasks (Figure 2.2.19).10 For example, in the
bitext mining task, there are two sets of sentences from two
dierent languages, and for every sentence in the rst set,
the model is tasked to nd the best match in the second set.
Tasks in the MTEB benchmark
Source: Muennigho et al., 2023

117
Articial Intelligence
Index Report 2025
Table of Contents Chapter 2 Preview
2.2 Language
Chapter 2: Technical Performance
Figure 2.2.20
As of early 2025, the top-performing embedding model on the
MTEB benchmark was Voyage AI’s voyage-3-m-exp, with a
score of 74.03. Voyage AI is focused on creating high-quality
AI embedding models. The voyage-3-m-exp model is a variant
of the voyage-3-large, a large foundation model specically
designed for embedding tasks, and it uses strategies like
Matryoshka Representation Learning and quantization-aware
training to improve its performance. The voyage-3-m-exp
model narrowly outperformed NV-Embed-v2 (72.31), which
held the top spot for most of 2024 (Figure 2.2.20). When
the MTEB benchmark was rst introduced in late 2022, the
leading model achieved an average score of 59.5. Over the
past two years, therefore, performance on the benchmark
has meaningfully improved.
67.56 68.17 68.23 69.32 69.88 70.11 70.24 70.31 71.19 71.21 71.62 71.67 72.02 72.31 74.03
SFR-Embedding-Mistral
Linq-Embed-Mistral
voyage-large-2-instruct
NV-Embed-v1
bge-multilingual-gemma2
stella_en_400M_v5
gte-Qwen2-7B-instruct
SFR-Embedding-2_R
stella_en_1.5B_v5
LENS-d4000
LENS-d8000
bge-en-icl
jasper_en_vision_language_v1
NV-Embed-v2
voyage-3-m-exp
0
20
40
60
80
100
Model
Average score
MTEB on English subsets across 56 datasets: average score
Source: MTEB Leaderboard, 2025 | Chart: 2025 AI Index report

118
Articial Intelligence
Index Report 2025
Table of Contents Chapter 2 Preview
Highlight:
Evaluating Retrieval Across Long Contexts
2.2 Language
Chapter 2: Technical Performance
Phi3-medium (14B)
Qwen2(72B)
GradientAI/Llama3 (70B)
Command-R-plus (104B)
Yi(34B)
Llama3.1(8B)
Llama3.1(70B)
GLM4(9B)
GPT-4-1106-preview
Gemini-1.5-pro
0%
20%
40%
60%
80%
100%
Model
Weighted average score (inc.)
74.80%
79.60%82.60% 82.70% 84.80% 85.40% 85.50% 88.00%89.00%
95.50%
RULER: weighted average score (increasing)
Source: Hsieh et al., 2024 | Chart: 2025 AI Index report
Phi3-medium (14B)
Qwen2(72B)
GradientAI/Llama3 (70B)
Command-R-plus (104B)
Yi(34B)
Llama3.1(8B)
Llama3.1(70B)
GLM4(9B)
GPT-4-1106-preview
Gemini-1.5-pr
o
0
200
K
400
K
600
K
800
K
1M
Claimed Eective
Model
Context length
RULER: claimed vs. eective context length
Source: Hsieh et al., 2024 | Chart: 2025 AI Index report
Figure 2.2.21
Figure 2.2.22
As AI models have advanced, their ability to handle longer
contexts has signicantly improved. For example, models
like GPT-4 and Llama 2, released in 2023 by OpenAI and
Meta, featured context windows of 8,000 and 4,000
tokens, respectively. In contrast, more recent models such
as GPT-4o (May 2024) and Gemini 2.0 Pro Experimental
(February 2025) boast context windows ranging from 128
thousand to 2 million. These extended context windows
allow users to input and process increasingly large amounts
of data, enabling more complex and detailed interactions.
As the context windows of LLMs have expanded, evaluating
their performance in long-context settings has become
increasingly important. However, existing long-context
evaluation methods have been relatively limited. Typically,
these evaluations focus on “needle-in-the-haystack”
scenarios, where models are tasked with retrieving specic
pieces of information from lengthy texts. While useful, such
evaluations provide only a baseline assessment of a model’s
ability to function eectively in long-context environments.
In 2024, several new evaluation suites were introduced to
address the limitations of long-context model assessments
and improve their evaluation. One such benchmark is
Nvidia’s RULER, which assesses long-context performance
by examining retrieval performance and multihop reasoning,
aggregation, and question answering. Among the models
evaluated on RULER, Gemini-1.5-Pro achieved the highest
weighted performance average (95.5), followed by GPT-
4 (89.0) and GLM4(88.0) (Figure 2.2.21). The researchers
behind RULER also revealed that many models suer
performance issues in longer context settings. In fact, the
RULER team demonstrated that while most popular LLMs
claim context sizes of 32K tokens or greater, only half of
them can maintain satisfactory performance at the length
of 32K. This means that their actual operational context
windows are shorter than those claimed by their developers
(Figure 2.2.22).

119
Articial Intelligence
Index Report 2025
Table of Contents Chapter 2 Preview
2.2 Language
Chapter 2: Technical Performance
64.20 63.90
59.50 59.80 60.20
58.60
66.30
53.50
63.50 60.80
39.90
63.80
39.50
62.70
49.30
GPT-4 GPT-4o-08 Claude-3.5-Sonnet Gemini-1.5-Pro Llama-3.1-70B
0
20
40
60
80
100
8k 32k 128k
Model
Average score
HELMET: average score
Source: Yen et al., 2024 | Chart: 2025 AI Index report
Figure 2.2.23
Figure 2.2.24
HELMET (How to Evaluate Long-Context Models
Eectively and Thoroughly), an Intel and Princeton
collaboration, is another long-context evaluation
benchmark introduced in 2024. The researchers behind
HELMET were motivated by the inadequacies of existing
benchmarks, which suered from insucient coverage
of downstream tasks, context lengths too short to
test evolving long-context capabilities, and unreliable
metrics (Figure 2.2.23). Even more comprehensive than
RULER, HELMET features seven long-context evaluation
categories, including synthetic recall, passage re-ranking,
and generation with citations. Figure 2.2.24 illustrates
the average performance of several notable models
on the HELMET benchmark across 8K, 32K, and 128K
context settings. While models like GPT-4, Claude 3.5
Sonnet, and Llama 3.1-70B struggle with performance
degradation in longer context settings, others, such as
Gemini 1.5 Pro and the August variant of GPT-4, maintain
their eectiveness. The introduction of benchmarks like
RULER and HELMET highlights how the rapid evolution
of LLMs is compelling researchers to rethink and rene
evaluation methodologies.
Highlight:
Evaluating Retrieval Across Long Contexts (cont’d)
Comparing long-
context benchmarks
Source: Yen et al., 2024

120
Articial Intelligence
Index Report 2025
Table of Contents Chapter 2 Preview
Computer vision allows machines to understand images and
videos and to create realistic visuals from textual prompts
or other inputs. This technology is widely used in elds such
as autonomous driving, medical imaging, and video game
development.
2.3 Image and Video
Chapter 2: Technical Performance
2.3 Image and Video
Understanding
Vision models are evaluated on their ability to understand
and reason about the content of images and videos. Vision
understanding was one of the rst AI capabilities widely
tested during the deep learning era. ImageNet, created by
Fei-Fei Li and extensively covered in past editions of the
AI Index, served as a foundational benchmark for image
understanding. As AI systems have advanced, researchers
have shifted toward evaluating image models on more
complex and comprehensive understanding tasks, such as
those involving video or commonsense reasoning in images.
In the ImageNet era, vision algorithms were tasked with more
straightforward tasks (e.g., classifying images into predened
categories). However, modern computer vision benchmarks
like VCR and MVBench introduce more open-ended
challenges, where no xed categories or classes exist. In
these cases, algorithms process natural language questions,
identify objects from an open set of images, and generate
answers based on image content or prior knowledge.
VCR: Visual Commonsense Reasoning
Introduced in 2019 by researchers from the University
of Washington and the Allen Institute for AI, the Visual
Commonsense Reasoning (VCR) challenge tests the
commonsense visual reasoning abilities of AI systems. In this
challenge, AI systems not only answer questions based on
images but also reason about the logic behind their answers
(Figure 2.3.1). Performance in VCR is measured using the
Q->AR score, which evaluates the machine’s ability to both
select the correct answer to a question (Q->A) and choose
the appropriate rationale behind that answer (Q->R).
Figure 2.3.1
Sample question from Visual Commonsense Reasoning (VCR) challenge
Source: Zellers et al., 2018

121
Articial Intelligence
Index Report 2025
Table of Contents Chapter 2 Preview
2.3 Image and Video
Chapter 2: Technical Performance
The VCR benchmark was one of the few benchmarks routinely
featured in the AI Index where AI systems consistently
fell short of the human baseline. However, 2024 marked a
turning point, with AI systems nally reaching this baseline.
A model posted to the leaderboard in July 2024 achieved a
score of 85.0, matching the human benchmark (Figure 2.3.2).
This milestone represented a signicant 4.2% improvement
on the benchmark since 2023. Even previously challenging
benchmarks are now being surpassed.
MVBench
MVBench, introduced by a team of researchers
from Hong Kong and China in 2023, is a challenging,
multimodal, video-understanding benchmark.11
Unlike earlier video benchmarks that primarily
tested spatial understanding through static image
tasks, MVBench incorporates more complex video
tasks requiring temporal reasoning across multiple
frames (Figure 2.3.3).
2018 2019 2020 2021 2022 2023 2024
50
60
70
80
Q->AR score
85
Visual Commonsense Reasoning (VCR) task: Q->AR score
Source: VCR Leaderboard, 2025 | Chart: 2025 AI Index report
85, human baseline
Figure 2.3.2
Figure 2.3.3
Sample tasks on
MVBench
Source: Li et al., 2023
11 The researchers were aliated with the Chinese Academy of Sciences, University of Chinese Academy of Sciences, Shanghai AI Laboratory, the University of Hong Kong, Fudan University,
and Nanjing University.

122
Articial Intelligence
Index Report 2025
Table of Contents Chapter 2 Preview
2.3 Image and Video
Chapter 2: Technical Performance
As of 2024, the top model on the MVBench leaderboard is
Video-CCAM-7B-v1.2, built on the Queen 2.5-7B-Instruct
language model. Its score of 69.23 marks a signicant 14.6%
improvement on the benchmark since its introduction in
late 2023 (Figure 2.3.4). These results highlight the gradual
but steady progress in the dynamic video understanding
capabilities of AI models.
48.70% 50.90% 51.10%
54.73% 54.85% 58.10% 58.77% 60.40% 62.30% 62.80% 64.60% 65.35% 67.25% 67.42% 69.23%
interlm-7b
vicuna-7b-delta-v0
VideoChat2
Kwai-VideoLLM
ST-LLM
PLLaVA 34B
CVLM
VideoChat2_mistral
VideoChat2_HD_mistral
Video-CCAM-4B-v1.1
Video-CCAM-9B-v1.1
JT-VL-Chat
InternVideo2-8B-HD-Chat-f16
TimeMarker
Video-CCAM-7B-v1.2
0%
20%
40%
60%
80%
100%
Average accuracy
MVBench: average accuracy
Source: MVBench Leaderboard, 2025 | Chart: 2025 AI Index report
Figure 2.3.4

123
Articial Intelligence
Index Report 2025
Table of Contents Chapter 2 Preview
2.3 Image and Video
Chapter 2: Technical Performance
Generation
Image generation is the task of generating images that are
indistinguishable from real ones. As noted in last year’s AI
Index, today’s image generators are so advanced that most
people struggle to dierentiate between AI-generated images
and actual images of human faces (Figure 2.3.5). Figure 2.3.6
highlights several generations from various Midjourney model
variants from 2022 to 2025 for the prompt “a hyper-realistic
image of Harry Potter.” The progression demonstrates the
signicant improvement in Midjourney’s ability to generate
hyper-realistic images over a two-year period. In 2022, the
model produced cartoonish and inaccurate renderings of
Harry Potter, but by 2025, it could create startlingly realistic
depictions.
Figure 2.3.5
Which face is real?
Source: Which Face Is Real, 2024
Figure 2.3.6
Midjourney generations over time: “a hyper-realistic image of Harry Potter”
Source: Midjourney, 2024
V1, February
2022 V2, April 2022 V3, July 2022 V4, November 2022 V5, March 2023 V6, December 2023 V6.1, July 2024

124
Articial Intelligence
Index Report 2025
Table of Contents Chapter 2 Preview
2.3 Image and Video
Chapter 2: Technical Performance
Chatbot Arena: Vision
The AI community has increasingly embraced public
evaluation platforms, such as the Chatbot Arena
Leaderboard, to assess the capabilities of leading
AI systems, including top AI image generators. This
leaderboard also features a Vision Arena, which ranks
the performance of over 50 vision models. Users
can submit text-to-image prompts, such as “Batman
drinking a coee,” and vote for their preferred
generation (Figure 2.3.7). To date, the Vision Arena has
garnered more than 150,000 votes.
As of early 2025, the top-ranked vision model on the
leaderboard is Google’s Gemini-2.0-Flash-Thinking-
Exp-1219 (Figure 2.3.8). Similar to other Chatbot Arena
categories—such as general, coding, and math—the
leading models are closely clustered in performance.
For example, the gap between the top model and the
fourth-ranked model, ChatGPT-4o-latest (2024-11-
20), is just 3.4%.
Pixtral-Large-2411
Claude 3.5 Sonnet (20241022)
Claude 3.5 Sonnet (20240620)
Gemini-1.5-Flash-002
GPT-4o-2024-05-13
Gemini-1.5-Pro-002
ChatGPT-4o-latest (2024-11-20)
Gemini-Exp-1206
Gemini-2.0-Flash-Exp
Gemini-2.0-Flash-Thinking-Exp-1219
1,160
1,180
1,200
1,220
1,240
1,260
1,280
Model
Elo rating
LMSYS Chatbot Arena for LLMs: Elo rating (vision)
Source: LMSYS, 2025 | Chart: 2025 AI Index report
Figure 2.3.7
Figure 2.3.8
Sample from the Chatbot Vision Arena
Source: Chatbot Arena Leaderboard, 2025

125
Articial Intelligence
Index Report 2025
Table of Contents Chapter 2 Preview
2.3 Image and Video
Chapter 2: Technical Performance
Highlight:
The Rise of Video Generation
As highlighted in last year’s AI Index, recent years have
witnessed the rise of video generation models capable of
creating videos from text prompts. While earlier models
demonstrated some promise, they were plagued by
signicant limitations, such as producing low-quality
videos, omitting sound, or generating only very short
clips. However, 2024 marked a signicant leap forward in
AI video generation, with several major industry players
unveiling advanced video generation systems.
In November 2023, Stability AI launched its Stable Video
Diusion model, their rst foundation model capable of
generating high-quality videos (Figure 2.3.9). The model
follows a three-step process: text-to-image pretraining,
video pretraining, and high-quality video ne-tuning.
Shortly after, in March, Stability AI introduced Stable
Video 3D, a model designed to generate multiple 3D views
and videos of an object from a single image. In February
2024, OpenAI responded with a preview of Sora, its own
video generation model, which moved out of research
mode and became publicly accessible in December 2024.
Sora can generate 20-second videos at resolutions up to
1080p (Figure 2.3.10). As a diusion model, it creates a
base video and progressively renes it by removing noise
over multiple steps to enhance quality.
Figure 2.3.9
Figure 2.3.10
Still generations from Stable Video Diusion
Source: Stability AI, 2025
Still generation from Sora
Source: OpenAI, 2024

126
Articial Intelligence
Index Report 2025
Table of Contents Chapter 2 Preview
2.3 Image and Video
Chapter 2: Technical Performance
Other major tech players have entered the video generation
space. In October 2024, Meta unveiled the latest version of
its Movie Gen model. Unlike earlier iterations, the new Movie
Gen includes advanced instruction-based video editing
features, personalized video generation from images, and
the ability to incorporate sound into videos. Meta’s most
advanced Movie Gen model can create 16-second videos at
16 frames per second, with a resolution of 1080p. Google also
made signicant strides in 2024, launching two major video
generation models: Veo in May and Veo 2 in December.
Internal benchmarking by Google revealed that Veo 2
outperformed other leading video generators, such as Meta’s
Movie Gen, Kling v1.5, and Sora Turbo. In user comparisons,
videos generated by Veo 2 were consistently favored over
those produced by competing models (Figure 2.3.11).
Figure 2.3.11
Figure 2.3.12
Will Smith eating spaghetti, 2023 vs. 2025
Source: Pika, 2025
Highlight:
The Rise of Video Generation (cont’d)
53.80% 49.50% 54.50% 58.80%
15.60%
17.80%
15.20%
14.50%
30.60% 32.60% 30.30% 26.70%
Meta Movie Gen Kling v1.5 Minimax Sora Turbo
0%
20%
40%
60%
80%
100%
Veo preferred Ties Other preferred
Overall preference
Veo 2: overall preference
Source: DeepMind, 2024 | Chart: 2025 AI Index report
Smaller players have also made notable contributions to video generation, with models such as Runway’s Gen-3 Alpha,
Luma’s Dream Machine, and Kuaishou’s Kling 1.5. The remarkable progress in this eld is evident when comparing
videos generated in 2023 to those produced in 2024. A popular prompt on the internet, “Will Smith eating spaghetti,”
demonstrates this advancement, with videos generated in 2025 from one popular video generator Pika showcasing a
dramatic improvement in quality compared to their 2023 counterparts (Figure 2.3.12).
V1.0
December
2023
V1.5
October
2024
V2.2
February
2025

127
Articial Intelligence
Index Report 2025
Table of Contents Chapter 2 Preview
AI systems are adept at processing human speech, with
audio capabilities that include transcribing spoken words to
text and recognizing individual speakers. More recently, AI
has advanced in generating synthetic audio content.
2.4 Speech
Chapter 2: Technical Performance
2.4 Speech
Speech Recognition
Speech recognition is the ability of AI systems to identify
spoken words and convert them into text. Speech recognition
has progressed so much that today many computer programs
and texting apps are equipped with dictation devices that can
reliably transcribe speech into writing.
LSR2: Lip Reading Sentences 2
The Oxford-BBC Lip Reading Sentences 2 (LRS2) dataset,
introduced in 2017, is one of the most comprehensive public
datasets for lipreading in authentic, in-the-wild scenarios
(Figure 2.4.1). The dataset consists of audio-visual clips from
a variety of talk shows and news programs. On automatic
speech recognition (ASR) tasks, systems’ ability to transcribe
speech are evaluated on word error rate (WER), with lower
scores indicating more precise transcription.
Figure 2.4.1
Still images from the BBC lip reading sentences 2 dataset
Source: Chung et al., 2024

128
Articial Intelligence
Index Report 2025
Table of Contents Chapter 2 Preview
This year, the model Whisper-Flamingo set a new standard
on the LRS2 benchmark, achieving a word error rate of 1.3
percent, surpassing the previous state-of-the-art score of
1.5 set in 2023 (Figure 2.4.2). However, given the already
low WER, signicant further improvements appear unlikely,
suggesting that the benchmark may be nearing saturation.
2.4 Speech
Chapter 2: Technical Performance
Figure 2.4.2
2018 2019 2020 2021 2022 2023 2024
0%
1%
2%
3%
4%
5%
6%
7%
8%
Word error rate (WER)
1.30%
LRS2: word error rate (WER)
Source: Papers With Code, 2025 | Chart: 2025 AI Index report

129
Articial Intelligence
Index Report 2025
Table of Contents Chapter 2 Preview
2021 2022 2023 2024
0%
20%
40%
60%
80%
100%
Pass@1
100%
HumanEval: Pass@1
Source: Papers With Code, 2025 | Chart: 2025 AI Index report
Coding involves the generation of
instructions that computers can follow
to perform tasks. Recently, LLMs have
become procient coders, serving as
valuable assistants to computer scientists.
There is also increasing evidence that
many coders nd AI coding assistants
highly useful. As highlighted in last year’s
AI Index, LLMs have become increasingly
procient coders, to the extent that many
foundational coding benchmarks, such
as HumanEval, are slowly becoming
saturated. In response, researchers have
shifted their focus toward testing LLMs
on more complex coding challenges.
2.5 Coding
Chapter 2: Technical Performance
2.5 Coding
HumanEval
HumanEval, a benchmark introduced by OpenAI researchers in 2021, evaluates the
coding abilities of AI systems through 164 challenging, handwritten programming
problems (Figure 2.5.1). The current leader in HumanEval performance is Claude 3.5
Sonnet (HPT), which achieved a score of 100% (Figure 2.5.2).
Figure 2.5.1
Figure 2.5.2
Sample HumanEval problem
Source: Chen et al., 2023

130
Articial Intelligence
Index Report 2025
Table of Contents Chapter 2 Preview
40.67% 41.00% 41.33% 41.67% 44.67% 47.33% 48.33% 48.67% 49.00%
55.00% 53.20% 55.00% 55.40% 57.00% 57.20% 58.20% 60.20% 62.20% 62.80% 64.60%
71.70%
Agentless-1.5 +
Claude-3.5 Sonnet (2024-10-22)
Composio SWE-Kit (2024-10-30)
PatchKitty-0.9 +
Claude-3.5 Sonnet (2024-10-22)
OpenHands + CodeAct v2.1
(claude-3-5-sonnet-2024-10-22)
Kodu-v1 +
Claude-3.5 Sonnet (2024-10-22)
devlo
Globant Code Fixer Agent
Gru (2024-12-08)
Blackbox AI Agent
Isoform
Bracket.sh
Amazon Q Developer Agent
(v2024-12-02-dev)
EPAM AI/Run Developer
Agent v2024-12-12 +
Anthopic Claude 3.5 Sonnet
Gru (2024-12-08)
Emergent E1 (v2024-12-23)
devlo
Learn-by-interact
CodeStory Midwit Agent +
swe-search
Blackbox AI Agent
W&B Programmer O1 crosscheck5
o3
Lite Veried
0%
20%
40%
60%
80%
100%
Lite Veried
Model
Percent solved
SWE-bench: percent solved
Source: SWE-bench Leaderboard, 2025; OpenAI, 2024 | Chart: 2025 AI Index report
2.5 Coding
Chapter 2: Technical Performance
SWE-bench
In October 2023, researchers from Princeton and the University
of Chicago introduced SWE-bench, a dataset comprising
2,294 software engineering problems sourced from real
GitHub issues and popular Python repositories (Figure 2.5.3).
SWE-bench presents a tougher test for AI coding prociency,
demanding that systems coordinate changes across multiple
functions, interact with various execution environments,
and perform complex reasoning. SWE-bench features a Lite
subset that is curated to make evaluation more accessible and
a Veried subset that is ltered by a human annotator. The
charts below report on the Veried score.
SWE-bench highlights the rapid improvement of LLMs on
tasks that were once considered extremely demanding. At
the end of 2023, the best performing model on SWE-bench
achieved a score of just 4.4%. By early 2025, the top model,
OpenAI’s o3 model, is reported to have successfully solved
71.7% of the problems on the Veried benchmark set (Figure
2.5.4). This signicant performance increase suggests that
AI researchers may soon need to develop more challenging
coding benchmarks to eectively test LLMs.
Figure 2.5.3
Figure 2.5.4
A sample model input from SWE-bench
Source: Jimenez et al., 2023

131
Articial Intelligence
Index Report 2025
Table of Contents Chapter 2 Preview
2.5 Coding
Chapter 2: Technical Performance
Figure 2.5.5
Programming tasks in BigCodeBench
Source: Zhuo et al., 2024
30.80 31.10 31.40 32.10 32.10 32.80 33.80 34.10 34.50 35.50
Qwen2.5-Coder-32B-Instruct
GPT-4o-2024-11-20
Athene-V2-Agent
Athene-V2-Chat
GPT-4-Turbo-2024-04-09
o1-2024-12-17
(temperature=1, reasoning=medium)
DeepSeek-V3-Chat
Gemini-Exp-1206
o1-2024-12-17
(temperature=1, reasoning=low)
o1-2024-12-17
(temperature=1, reasoning=high)
0
20
40
60
80
100
Model
Pass@1 (average)
BigCodeBench on the hard set: Pass@1 (average)
Source: Hugging Face, 2025 | Chart: 2025 AI Index report
52.90 53.20 53.50 53.50 54.00 54.10 54.20 54.70 56.10 56.10
Gemini-2.0-Flash-Exp
GPT-4-Turbo-2024-04-09
Qwen2.5-Coder-32B-Instruct
GPT-4o-2024-11-20
DeepSeek-Coder-V2-Instruct
DeepSeek-V2-Chat (2024-06-28)
Gemini-Exp-1114
Gemini-Exp-1206
DeepSeek-V3-Chat
GPT-4o-2024-05-13
0
20
40
60
80
100
Model
Pass@1 (average)
BigCodeBench on the full set: Pass@1 (average)
Source: Hugging Face, 2025 | Chart: 2025 AI Index report
BigCodeBench
One limitation of existing coding benchmarks is that many
are restricted to short, self-contained algorithmic tasks or
standalone function calls. However, solving complex and
practical tasks often requires the ability to invoke diverse
functions, such as tools for data analysis or web development.
Eective coding also requires the ability to follow coding
instructions expressed in language, a task not tested by many
current coding benchmarks.
To address the limitations of existing coding benchmarks,
an international team in 2024 released BigCodeBench, a
comprehensive, diverse, and challenging benchmark for
coding evaluation (Figure 2.5.5). BigCodeBench requires
LLMs to invoke multiple function calls across 139 libraries
and seven domains, encompassing 1,140 ne-grained tasks.
Current AI systems struggle on BigCodeBench. For example,
on both the “complete” (code completion based on structured
docstrings) and “instruct” (code completion based on
natural-language instructions) tasks on the hard subset of the
benchmark, the current best model, OpenAI’s o1, achieves
an average score of just 35.5 (Figure 2.5.6). Models perform
slightly better on the full set of the benchmark (Figure 2.5.7).
BigCodeBench highlights the gap that persists for AI systems
to achieve human-level coding prociency.
Figure 2.5.6 Figure 2.5.7

132
Articial Intelligence
Index Report 2025
Table of Contents Chapter 2 Preview
Qwen2.5-plus-1127
DeepSeek-V3
Claude 3.5 Sonnet (20241022)
Gemini-2.0-Flash-Thinking-Exp-1219
Gemini-2.0-Flash-Exp
ChatGPT-4o-latest (2024-11-20)
o1-preview
o1-mini
o1-2024-12-17
Gemini-Exp-1206
1,300
1,320
1,340
1,360
1,380
Model
Elo rating
LMSYS Chatbot Arena for LLMs: Elo rating (coding)
Source: LMSYS, 2025 | Chart: 2025 AI Index report
2.5 Coding
Chapter 2: Technical Performance
Figure 2.5.8
Chatbot Arena: Coding
The Chatbot Arena LLM leaderboard now features a coding
lter, oering valuable insights into how coders and the
broader community perceive the coding capabilities of
dierent models. This public feedback adds a new dimension
to evaluating model performance. Currently, the top-rated
LLM for coding is Gemini-Exp-1206, with an arena score of
1,369, closely followed by OpenAI’s latest o1 model at 1,361.
Among Chinese models, DeepSeek-V3 leads with a score
of 1,317, trailing the highest-ranking model by 3.8% (Figure
2.5.8).

133
Articial Intelligence
Index Report 2025
Table of Contents Chapter 2 Preview
Mathematical problem-solving benchmarks evaluate AI
systems’ ability to reason mathematically. AI models can be
tested with a range of math problems, from grade-school
level to competition-standard mathematics.
2.6 Mathematics
Chapter 2: Technical Performance
Figure 2.6.1
Figure 2.6.2
Figure 2.6.1
2.6 Mathematics
GSM8K
GSM8K, introduced by OpenAI in 2021, is a dataset
containing approximately 8,000 diverse grade-school
math word problems that challenges AI models
to generate multistep solutions using arithmetic
operations (Figure 2.6.1). Alongside MMLU, GSM8K
has become a widely used benchmark for evaluating
advanced LLMs. However, recent concerns have
emerged regarding potential contamination and
saturation of the benchmark.
The top-performing model on GSM8K is a variant of
Claude Sonnet 3.5, which was optimized using the
HPT prompting strategy and achieved a 97.72% score
(Figure 2.6.2). This marks a signicant improvement
Sample problems from GSM8K
Source: Cobbe et al., 2023
2022 2023 2024
0%
20%
40%
60%
80%
100%
Accuracy
97.72%
GSM8K: accuracy
Source: Papers With Code, 2024 | Chart: 2025 AI Index report
over the previous high of 91.00% in 2023. However, in 2024, several
models from Mistral, Meta, and Qwen scored around 96%, indicating
that the GSM8K benchmark may be approaching saturation.

134
Articial Intelligence
Index Report 2025
Table of Contents Chapter 2 Preview
2.6 Mathematics
Chapter 2: Technical Performance
Figure 2.6.4
Figure 2.6.3
Sample problem from MATH dataset
Source: Hendrycks et al., 2023
2021 2022 2023 2024 2025
0%
20%
40%
60%
80%
100%
Accuracy
97.90%
MATH word problem-solving: accuracy
Source: Papers With Code, 2024; OpenAI, 2025 | Chart: 2025 AI Index report
90%, human baseline
MATH
MATH is a dataset of 12,500 challenging, competition-
level mathematics problems introduced by UC Berkeley
and University of Chicago researchers in 2021 (Figure
2.6.3). AI systems struggled on MATH when it was rst
released, managing to solve only 6.9% of the problems.
Performance has signicantly improved. In January
2025, OpenAI’s o3-mini (high) model was released
and achieved the best performance on the MATH
dataset, solving 97.9% of the problems (Figure 2.6.4). As
highlighted in last year’s AI Index, MATH was one of the
few datasets where AI systems had not yet outperformed
the human baseline. This fact no longer remains true.

135
Articial Intelligence
Index Report 2025
Table of Contents Chapter 2 Preview
2.6 Mathematics
Chapter 2: Technical Performance
Claude 3.5 Sonnet (20241022)
Gemini-1.5-Pro-002
DeepSeek-V3
ChatGPT-4o-latest (2024-11-20)
Gemini-2.0-Flash-Exp
Gemini-Exp-1206
Gemini-2.0-Flash-Thinking-Exp-1219
o1-mini
o1-preview
o1-2024-12-17
1,260
1,280
1,300
1,320
1,340
1,360
1,380
Model
Elo rating
LMSYS Chatbot Arena for LLMs: Elo rating (Math)
Source: LMSYS, 2025 | Chart: 2025 AI Index report
Chatbot Arena: Math
The Chatbot Arena includes a math lter, allowing the public
to rank models based on their performance in generating
math-related answers. The Math Arena evaluates over 181
models and has collected more than 340,000 public votes.
Unlike the general and coding arenas, where Gemini-based
models lead, the top-ranked model in the Math Arena is
OpenAI’s o1 variant, released in December 2024 (Figure
2.6.5).
FrontierMath
Members of the math community have highlighted limitations
in the current suite of math benchmarks, calling for the
development of new benchmarks to evaluate increasingly
advanced AI systems. One signicant challenge is saturation:
AI systems are approaching near-perfect performance
on benchmarks like GSM8K and MATH, which primarily
assess high school and college-level mathematics. To push
the boundaries further, researchers have voiced a need for
benchmarks that test truly advanced mathematics, including
problems in number theory, real analysis, algebraic geometry,
and category theory.
FrontierMath is a new benchmark introduced by Epoch AI
that features hundreds of original, exceptionally challenging
mathematical problems. These problems, vetted by
expert mathematicians, often require hours, days, or even
collaborative research eorts to solve. Figure 2.6.6 illustrates
sample problems included on the benchmark. Epoch AI
evaluated six leading LLMs on the FrontierMath benchmark:
o1-preview, o1-mini, GPT-4o, Claude 3.5 Sonnet, Grok 2
Beta, and Gemini 1.5 Pro 002. At the time the benchmark
was released, the best-performing model, Gemini 1.5 Pro,
managed to solve just 2.0% of the problems—a signicantly
lower success rate than it achieved on other math benchmarks
(Figure 2.6.7). However, OpenAI’s o3 model is reported
to have scored 25.2% on the benchmark. The creators of
FrontierMath hope the benchmark will remain a rigorous
challenge for cutting-edge AI systems for years to come.
Figure 2.6.5

136
Articial Intelligence
Index Report 2025
Table of Contents Chapter 2 Preview
2.6 Mathematics
Chapter 2: Technical Performance
Figure 2.6.7
Figure 2.6.6
Sample problems from FrontierMath
Source: Glazer et al., 2024
0.00% 1.00% 1.00% 2.00% 2.00%
25.20%
Grok 2 Beta GPT-4o
(2024-08-06)
o1-preview Claude 3.5 Sonnet
(2024-10-22)
Gemini 1.5 Pro
(002)
o3
0%
20%
40%
60%
80%
100%
Model
Percent solved
FrontierMath: percent solved
Source: Glazer et al., 2024; OpenAI, 2025 | Chart: 2025 AI Index report

137
Articial Intelligence
Index Report 2025
Table of Contents Chapter 2 Preview
Highlight:
Learning and Theorem Proving
DeepMind employed its systems, AlphaProof and
AlphaGeometry 2, to solve four out of six problems in
the 2024 International Mathematical Olympiad (IMO),
achieving a performance level equivalent to that of a silver
medalist. AlphaGeometry solved 25 out of 30 Olympiad
geometry problems in the benchmarking set, surpassing
the average score of an IMO silver medalist, who typically
solves 22.9 (Figure 2.6.8). The IMO, established in 1959,
is the world’s oldest and most prestigious competition for
young mathematicians.
AlphaProof is a reinforcement learning system derived from
AlphaZero, which was previously applied to chess, shogi,
and Go. It trains itself to solve problems by generating
hypotheses that are then veried using the Lean interactive
proof system. A ne-tuned Gemini model is utilized to
translate natural language problem statements into formal
representations, building a comprehensive training library.
In this year’s competition, AlphaProof successfully solved
two algebra problems and one number theory problem,
but failed to solve two combinatorics problems.
AlphaGeometry 2 is a neuro-symbolic hybrid system
featuring a language model based on Gemini and trained
on extensive synthetic data. Prior to 2024, AlphaGeometry
could solve 83% of historical IMO geometry problems.
During the 2024 competition, it solved the sole geometry
problem in just 24 seconds. For the 2024 test, competition
problems were manually translated into Lean’s formal
representation.
It remains unknown how AlphaProof and AlphaGeometry
would perform on traditional theorem-proving benchmarks
such as TPTP, which has been used since 1997 to assess
the performance of automatic theorem-proving (ATP)
systems, particularly those applied to software verication.
The AI Index reported on the state of ATP in its 2021 report.
A 2024 update of that report, based on the latest version of
TPTP containing over 25,000 problems, indicates that fully
automatic systems can now solve 89% of the problems in
TPTP v.9.0.0.
Ideally, TPTP systems could be tested on IMO problems,
and AlphaProof and AlphaGeometry on TPTP problems—
some of which have never been solved by humans, let
alone by ATP systems. Unfortunately, neither of these tests
has been conducted. The primary reason is that the logics
supported by the dierent systems dier signicantly, and
translators between them do not yet exist. Additionally,
while substantial, the TPTP library is not large enough to
serve as a training set for AlphaProof without generating a
considerable number of synthetic examples.
2.6 Mathematics
Chapter 2: Technical Performance
Figure 2.6.8
Wu’s method
Honorable mentions
Bronze medalist
Silver medalist
AlphaGeometry
Gold medalist
0
5
10
15
20
25
Number of solved problems
10.00
14.27
19.29
22.85
25.00
25.93
Number of solved geometry problems in IMO-AG-30
Source: Trinh et al., 2024 | Chart: 2025 AI Index report

138
Articial Intelligence
Index Report 2025
Table of Contents Chapter 2 Preview
2023 2024
0%
20%
40%
60%
80%
100%
Overall accuracy
78.20%
MMMU on validation set: overall accuracy
Source: MMMU Leaderboard, 2024 | Chart: 2025 AI Index report
82.60%, human expert (medium)
Reasoning in AI involves the ability of AI systems to draw logically
valid conclusions from dierent forms of information. AI systems are
increasingly being tested in diverse reasoning contexts, including
visual (reasoning about images), moral (understanding moral
dilemmas), and social reasoning (navigating social situations).
2.7 Reasoning
Chapter 2: Technical Performance
Figure 2.7.2
Figure 2.7.1
MMMU: A Massive Multi-discipline Multimodal
Understanding and Reasoning Benchmark for
Expert AGI
In recent years, the reasoning abilities of AI systems have
advanced so much that older benchmarks like SQuAD (for
textual reasoning) and VQA (for visual reasoning) have become
saturated, indicating a need for more challenging reasoning tests.
Responding to this, researchers from the United States and
Canada recently developed MMMU, the massive multi-
discipline multimodal understanding and reasoning benchmark
for expert AGI (articial general intelligence). MMMU comprises
about 11,500 college-level questions from six core disciplines: art
and design, business, science, health and medicine, humanities
and social science, and technology and engineering (Figure 2.7.1).
The question formats include charts, maps, tables, chemical
structures, and more. MMMU is among the most demanding
tests of perception, knowledge, and reasoning in AI to date. As
of January 2025, the highest-performing model is OpenAI’s o1,
achieving a score of 78.2%—a signicant improvement from the
state-of-the-art score of 59.4% reported in last year’s AI Index
(Figure 2.7.2). While this top score remains below the medium
and high human expert baselines, as with other benchmarks
covered in the Index, AI systems are rapidly closing the gap.
2.7 Reasoning
General Reasoning
General reasoning pertains to AI
systems being able to reason across
broad, rather than specic, domains.
As part of a general reasoning
challenge, for example, an AI system
might be asked to reason across
multiple subjects rather than perform
one narrow task (e.g., playing chess).
Sample MMMU questions
Source: Yue et al., 2023

139
Articial Intelligence
Index Report 2025
Table of Contents Chapter 2 Preview
2023 2024
0%
20%
40%
60%
80%
100%
Accuracy
87.70%
GPQA on the diamond set: accuracy
Source: AI Index, 2025 | Chart: 2025 AI Index report
81.20%, expert human validators
2.7 Reasoning
Chapter 2: Technical Performance
Figure 2.7.3
Figure 2.7.4
GPQA: A Graduate-Level Google-Proof Q&A Benchmark
In 2023, researchers from NYU, Anthropic, and Meta
introduced the GPQA benchmark to test general,
multisubject AI reasoning. This dataset consists of 448
dicult multiple-choice questions that cannot be easily
answered by web search. The questions were crafted
by subject-matter experts in various elds like biology,
physics, and chemistry (Figure 2.7.3). On the diamond set—
the most challenging subset of the dataset and the one
most frequently tested by AI developers—human experts
achieved an accuracy rate of 81.3%.
Last year’s AI Index reported that the best-performing AI
model, GPT-4, achieved only 38.8% on the diamond test set.
In just a year, top AI systems have made signicant strides,
with OpenAI’s o3 model, launched in December 2024,
posting a state-of-the-art score of 87.7%, a 48.9 percentage
point improvement from the state-of-the-art score in 2023
(Figure 2.7.4). In fact, o3’s score was the rst to exceed
the baseline set by expert human validators. AI systems
are rapidly advancing on challenging new benchmarks like
MMMU and GPQA, which were recently introduced to push
the limits of AI capabilities.
Sample chemistry question from GPQA
Source: Rein et al., 2023

140
Articial Intelligence
Index Report 2025
Table of Contents Chapter 2 Preview
2.7 Reasoning
Chapter 2: Technical Performance
Figure 2.7.5
Sample ARC-AGI task
Source: Chollet et al., 2025
ARC-AGI
As AI systems continue to advance, claims about the imminent
arrival of articial general intelligence (AGI) have become
more frequent. There is no universally accepted denition
of AGI. Some computer scientists dene it as AI systems
that match or surpass human cognitive abilities across a
broad range of tasks. Others emphasize that the denition
should encompass the capacity for general learning and skill
acquisition, describing AGI as a system “capable of eciently
acquiring new skills and solving novel problems for which it
was neither designed nor trained.”
ARC-AGI is a benchmark introduced in 2019 by François
Chollet, the creator of Keras, a popular open-source deep
learning library. ARC-AGI tests the ability of systems to
generalize beyond prior training. More specically, the
ARC-AGI benchmark presents AI systems with a set of
independent tasks. Each task includes demonstration or input
pairs followed by one or more test or output scenarios (Figure
2.7.5). This benchmark emphasizes generalized learning
ability: It is impossible for systems to prepare in advance,
as each task introduces a unique logic. The tasks require no
specialized world knowledge or language skills but instead
draw on assumed prior knowledge, such as the concept
of objects, basic topology, and elementary arithmetic—
concepts typically mastered by children at an early age.

141
Articial Intelligence
Index Report 2025
Table of Contents Chapter 2 Preview
2.7 Reasoning
Chapter 2: Technical Performance
Figure 2.7.6
2019 2020 2021 2022 2023 2024
0%
20%
40%
60%
80%
100%
High score
75.70%
ARC-AGI-1 on private evaluation set: high score
Source: Chollet et al., 2025; OpenAI, 2025 | Chart: 2025 AI Index report
ARC-AGI has proven to be an exceptionally challenging
benchmark. When it was rst run in 2020, the top-performing
system achieved a score of only 20% (Figure 2.7.6). Four years
later, this score had risen to just 33%. However, this year has
seen substantial progress, with OpenAI’s o3 model achieving
a score of 75.7%. In settings where o3 was allocated a high-
compute budget exceeding the benchmark’s $10,000 limit, it
achieved a score of 87.5%.
Researchers attribute the overall slow progress in previous
years to an overemphasis on scaling AI models—making
them larger and feeding them increasing amounts of training
data. While this approach improved task-specic skills,
it did little to enhance the ability of AI systems to tackle
problems without prior exposure or training data. This
year’s improvements suggest a shift in focus toward more
meaningful advancements in generalization and search
capabilities.

142
Articial Intelligence
Index Report 2025
Table of Contents Chapter 2 Preview
2.7 Reasoning
Chapter 2: Technical Performance
Humanity’s Last Exam
As highlighted in both this and last year’s AI Index,
many popular AI benchmarks, such as MMLU, GSM8K,
and HumanEval, have reached saturation. In response,
researchers have developed more challenging benchmarks
to better assess AI capabilities. Recently, members of the
team behind MMLU introduced Humanity’s Last Exam
(HLE), a new benchmark comprising 2,700 highly challenging
questions across dozens of subject areas (Figure 2.7.7). The
dataset features multimodal questions, contributed by
subject matter experts, including leading professors and
graduate-level reviewers, that resist simple internet lookups
or database retrieval. Additionally, each question was tested
against state-of-the-art LLMs before inclusion; if an existing
model could answer it, the question was rejected.
Figure 2.7.7
Same questions on HLE
Source: Phan et al., 2025

143
Articial Intelligence
Index Report 2025
Table of Contents Chapter 2 Preview
2.7 Reasoning
Chapter 2: Technical Performance
3.10% 3.90% 4.80% 5.20% 7.20% 8.80%
GPT-4o Grok-2 Clause 3.5 Sonnet Gemini 1.5 Pro Gemini 2.0 Flash Thinking o1
0%
20%
40%
60%
80%
100%
Accuracy
Humanity’s Last Exam (HLE): accuracy
Source: Phan et al., 2025 | Chart: 2025 AI Index report
Initial testing indicates that HLE is highly challenging for
current AI systems. Even top models, such as OpenAI’s
o1, score just 8.8% (Figure 2.7.8). The researchers behind
the benchmark are closely monitoring how quickly LLMs
improve, and they speculate that performance could exceed
50% by the end of 2025.
Figure 2.7.8

144
Articial Intelligence
Index Report 2025
Table of Contents Chapter 2 Preview
2.7 Reasoning
Chapter 2: Technical Performance
54.80%
35.50%
62.60%
23.80%
97.80%
0.00% 0.00%
8.00%
52.80%
Claude 3.5 (Sonnet) GPT-4o LLama 3.1 405B Gemini 1.5 Pro o1-preview
0%
20%
40%
60%
80%
100%
Blocksworld Mystery Blocksworld
Model
Instances correct
PlanBench: instances correct
Source: Valmeekam et al., 2024 | Chart: 2025 AI Index report
Planning
Planning is an intelligent task that involves reasoning
about actions that alter the world. It requires considering
hypothetical future states, including potential external
actions and other transformative events.
PlanBench
Claims have been made that LLMs can solve planning
problems. A group from Arizona State University has
proposed PlanBench, a benchmark suite containing problems
used in the automated planning community, especially those
used in the International Planning Competition. PlanBench is
designed to test LLMs on planning tasks. The benchmark tests
models on 600 problems in which a hand tries to construct
stacks of blocks when it is only allowed to move one block
at a time to a table or to the top of a clear block. After the
benchmark was released in 2022, researchers demonstrated
that models like GPT-4 and GPT-3.5 still struggled with
planning tasks.
The release of OpenAI’s o1 was met with enthusiasm from the
AI research community, as it was designed to actively reason
rather than function purely as an autoregressive LLM. When
tested on the PlanBench benchmark, o1 showed signicant
improvements, though it still struggles with reliable and
consistent planning. In the Blocksworld zero-shot evaluation
(one specic planning evaluation domain), o1 achieved a score
of 97.8%—far surpassing the next best LLM, Llama 3.1 405B
(62.6%), and dramatically outperforming GPT-4o (35.5%)
(Figure 2.7.9). In the more challenging Mystery Blocksworld
domain, where some answers are syntactically obfuscated,
o1 scored 52.8% zero-shot, compared to just 0.8% for Llama
3.1 405B. GPT-4, by contrast, scored 0%.
Planning is a combinatorial problem, and solving problems
with long solutions is expected to take more than linear time.
Not surprisingly, when tested on instances that require at
least 20 steps, o1 manages to solve just 23.6%.
Figure 2.7.9

145
Articial Intelligence
Index Report 2025
Table of Contents Chapter 2 Preview
VisualAgentBench
VisualAgentBench (VAB), launched in 2024, represents a
signicant step forward in the evaluation of agentic AI. This
benchmark reects the growing multimodality of AI models
and their increasing prociency in navigating both virtual and
embodied environments. VAB addresses the need to assess
agent performance in diverse settings that extend beyond
environments reliant solely on linguistic commands. VAB
tests agents across three broad categories of tasks: embodied
agents (operating in household and gaming environments),
GUI agents (interacting with mobile and web applications),
and visual design agents (such as CSS debugging) (Figure
2.8.1). This comprehensive approach creates a robust
evaluation suite of agents’ capabilities across varied and
dynamic contexts.
AI agents, autonomous or
semiautonomous systems designed to
operate within specic environments
to accomplish goals, represent
an exciting frontier in AI research.
These agents have a diverse range of
potential applications, from assisting
in academic research and scheduling
meetings to facilitating online
shopping and vacation booking. As
suggested by many recent corporate
releases, agentic AI has become a
topic of increasing interest in the
technical world of AI.
2.8 AI Agents
Chapter 2: Technical Performance
Figure 2.8.1
2.8 AI Agents
For decades, the topic of AI agents has been widely discussed in the AI community,
yet few benchmarks have achieved widespread adoption, including those featured
in last year’s Index, such as AgentBench and MLAgentBench. This is partly due to
the inherent complexity of benchmarking agentic tasks, which are typically more
diverse, dynamic, and variable than tasks like image classication or answering
language questions. As AI continues to evolve, it will become important to develop
eective methods to evaluate AI agents.
Tasks on VisualAgentBench
Source: Liu et al., 2024

146
Articial Intelligence
Index Report 2025
Table of Contents Chapter 2 Preview
RE-Bench
The emergence of increasingly capable agentic
AI systems has fueled predictions that AI might
soon take on the work of computer scientists
or researchers. However, until recently, there
were few benchmarks designed to rigorously
test the R&D capabilities of top-performing AI
systems. In 2024, researchers addressed this
gap with the launch of RE-Bench, a benchmark
featuring seven challenging, open-ended ML
research environments. These tasks, informed
by data from 71 eight-hour attempts by over
60 human experts, include optimizing a kernel,
conducting a scaling law experiment, and ne-
tuning GPT-2 for question answering, among
others (Figure 2.8.3).
VAB presents a signicant challenge for AI systems. The top-
performing model, GPT-4o, achieves an overall success rate of
just 36.2%, while most proprietary language models average
around 20% (Figure 2.8.2). According to the benchmark’s
authors, these results reveal that current AI models are far
from ready for direct deployment in agentic settings.
6.30 7.70 8.40 8.90 10.30 10.50 12.00
16.00
19.80 20.50 21.90
26.90
29.90
31.70
36.20
gemini-1.0-pro |58
LLaVA-1.5
CogVLM
(Fine-tuning) CogAgent
LMMs CogVLM2
LLaVA-NeXT
GLM-4V
InternVL-2
gemini-1.5-pro |48
(Prompting) gpt-4o-mini-2024-07-18
claude-3-opus
claude-3.5-sonnet
gpt-4-turbo-0409
gpt-4-vision-preview
gpt-40-2024-05-13
0
5
10
15
20
25
30
35
Model
Success rate (average)
VisualAgentBench on the test set: success rate
Source: VisualAgentBench Leaderboard, 2025 | Chart: 2025 AI Index report
2.8 AI Agents
Chapter 2: Technical Performance
Figure 2.8.2
Figure 2.8.3
RE-Bench Process and Flow
Source: Wijk et al., 2024

147
Articial Intelligence
Index Report 2025
Table of Contents Chapter 2 Preview
Researchers uncovered two key ndings when comparing the
performance of humans and frontier AI models. In short time
horizon settings, such as with a two-hour budget, the best AI
systems achieve scores four times higher than human experts
(Figure 2.8.4). However, as the time budget increases, human
performance begins to surpass that of AI. With an eight-hour
budget, human performance slightly exceeds AI, and with a
32-hour budget, humans outperform AI by a factor of two.
The researchers also note that for certain tasks, AI agents
already demonstrate expertise comparable to humans but
can deliver results signicantly faster and at a lower cost.
For example, AI agents can write custom Triton kernels more
quickly than any human expert.
30min 2h 8h 16h 32h 64h
0.00
0.20
0.40
0.60
0.80
1.00
1.20
1.40
Claude 3.5 Sonnet (Old) (Modular) Claude 3.5 Sonnet (New) (Modular) Claude 3.5 Sonnet (New) (AIDE)
o1-preview (AIDE) Human
Time budget (time limit per run x number of attempts)
Average normalized score
RE-Bench: average normalized score@k
Source: Wijk et al., 2024 | Chart: 2025 AI Index report
2.8 AI Agents
Chapter 2: Technical Performance
Figure 2.8.4

148
Articial Intelligence
Index Report 2025
Table of Contents Chapter 2 Preview
2023 2024
0%
20%
40%
60%
80%
100%
Average score
65.12%
GAIA: average score
Source: GAIA Leaderboard, 2025 | Chart: 2025 AI Index report
GAIA
GAIA is a benchmark for General AI assistants
introduced by Meta in May 2024. It consists of 466
questions designed to assess AI systems’ ability to
perform a broad range of tasks, including reasoning,
multimodal processing, web browsing, and tool use.
Unlike straightforward, exam-style questions, GAIA
challenges AI models with complex, multistep problems
that may require searching the open web, interpreting
multimodal inputs, and reasoning through intricate
scenarios (Figure 2.8.5). When researchers launched
GAIA, they found that existing LLMs lagged signicantly
behind human performance. For instance, GPT-4 with
plugins correctly answered only 15% of the questions,
compared to 92% for human respondents.
As with other recently introduced AI benchmarks,
performance on GAIA has improved rapidly. In 2024, the
top system achieved a score of 65.1%, marking a roughly
30 percentage point increase from the highest score
recorded in 2023 (Figure 2.8.6).
2.8 AI Agents
Chapter 2: Technical Performance
Figure 2.8.5
Figure 2.8.6
Sample questions on GAIA
Source: Meta, 2024

149
Articial Intelligence
Index Report 2025
Table of Contents Chapter 2 Preview
Advancements in AI over the past
decade have paved the way for
exciting new developments in the
eld of robotics. Especially with the
rise of foundation models, robots
are now able to iteratively learn from
their surroundings, adapt exibly to
new settings, and make autonomous
decisions. This section explores key
robotic benchmarks and recent trends,
including the rise of humanoids,
algorithmic advancements from
DeepMind, and the emergence
of robotic foundation models. It
concludes by studying developments
in self-driving cars.
2.9 Robotics and Automous Motion
Chapter 2: Technical Performance
Figure 2.9.1
2.9 Robotics and
Autonomous Motion
Robotics
RLBench
One of the most widely adopted benchmarks in the robotics community is RLBench
(Robot Learning Benchmark). Launched in 2019, it features 100 unique tasks of varying
complexity, from simple target reaching to opening an oven and placing a tray inside.12
Researchers typically evaluate new robotic systems on a standardized subset of 18
tasks to gauge performance. Figure 2.9.1 visualizes some of the tasks in RLBench.
Tasks on VisualAgentBench
Source: James et al., 2019
12 Target reaching in robotics refers to the process by which a robotic system moves its end-eector (such as a robotic arm or gripper) toward a specic goal position or object in space.

150
Articial Intelligence
Index Report 2025
Table of Contents Chapter 2 Preview
2022 2023 2024 2025
0%
20%
40%
60%
80%
100%
Success rate
86.80%
RLBench: success rate (18 tasks, 100 demo/task)
Source: Papers With Code, 2025 | Chart: 2025 AI Index report
2.9 Robotics and Automous Motion
Chapter 2: Technical Performance
Figure 2.9.2
As of January 2025, the top-performing model on this subset
is SAM2Act, a collaboration between researchers at the
University of Washington, Universidad Católica San Pablo,
Nvidia, and the Allen Institute for AI. SAM2Act achieved
an 86.8% success rate, marking a 2.8 percentage point
improvement over the previous state-of-the-art in 2024 and
a 66.7 percentage point increase from the leading score in
2021 (Figure 2.9.2).

151
Articial Intelligence
Index Report 2025
Table of Contents Chapter 2 Preview
Highlight:
Humanoid Robotics
2024 was a signicant year for robotics, marked by the
growing prevalence of humanoid robots—machines with
humanlike bodies designed to mimic human functions.
For example, Figure AI, a robotics startup dedicated to
developing general-purpose humanoid robots, launched
Figure 02 in 2024, its most advanced model yet. Standing
5 feet 6 inches tall, weighing 154 pounds, and capable of
handling a 44-pound payload, Figure 02 operates for up
to ve hours on a single charge. Figure robots are able
to perform complex tasks such as making coee and
assisting in automotive assembly by placing sheet metal
into a car xture (Figure 2.9.3 and Figure 2.9.4). They are
also integrated with OpenAI and can engage in speech-to-
speech reasoning, whereby the robot explains its actions
and responds to queries about its behavior. Figure’s success
follows that of other companies that released humanoid
robots, like Tesla’s Optimus, rst launched in 2002 and
redesigned in 2023, and Boston Dynamics’ Atlas humanoid.
Figure 2.9.3
Figure 2.9.4
Figure robot
making coee
Source: Figure AI
Figure robot
assisting in
automotive
assembly
Source: Figure AI
2.9 Robotics and Automous Motion
Chapter 2: Technical Performance

152
Articial Intelligence
Index Report 2025
Table of Contents Chapter 2 Preview
Highlight:
DeepMind’s Developments
In 2023, DeepMind launched two robotic models,
PaLM-E and RT-2. These models were novel in their use
of transformer-based architectures, typically found in
language modeling, and their training on both manipulation
data and language data. This dual training approach
enabled them to excel at both robotic manipulation and
text generation. In 2024, DeepMind introduced AutoRT,
an AI system that leverages large foundation models to
autonomously generate diverse training data for robots.
It coordinates multiple video-equipped robots, guiding
them through various environments, devising creative
tasks for them to perform, and meticulously documenting
these tasks (Figure 2.9.5). This documentation then serves
as training data for future robotic learning. To date, AutoRT
has generated a dataset of 77,000 robotic trials spanning
6,650 unique tasks. Greater amounts of robotic training
data will be important to improve the training of future
robotic systems.
Conversely, SARA-RT, also from Google DeepMind,
improves the eciency of transformer-based robotic
models by signicantly improving their speed. While
transformers are powerful, they are also computationally
intensive as they rely on quadratic complexity attention
mechanisms. This means that doubling the input size of
data provided to a model can quadruple computational
requirements. This challenge complicates attempts to
scale robotic models. SARA-RT addresses this challenge
Figure 2.9.5
AutoRT workow
Source: Google DeepMind, 2024
2.9 Robotics and Automous Motion
Chapter 2: Technical Performance
with a technique called “up-training,” which converts the
quadratic complexity of standard transformers into a linear
model. This method drastically reduces computational
demands while maintaining performance quality. Figure 2.9.6
compares speed tests of AI models enhanced with the SARA
technique against those without. In point cloud processing,
Figure 2.9.6
Speed
tests for
SARA vs.
non-SARA
enhanced
models
Source: Google
DeepMind, 2024

153
Articial Intelligence
Index Report 2025
Table of Contents Chapter 2 Preview
Highlight:
DeepMind’s Developments (cont’d)
2.9 Robotics and Automous Motion
Chapter 2: Technical Performance
which enables robots to interpret 3D environments, and in
image processing, SARA-based models run signicantly faster
while avoiding major increases in run-time at scale.
Other developments from DeepMind include ALOHA
(Autonomous Learning of High-level Activities) and
DemoStart. ALOHA Unleashed is a breakthrough in enabling
robots to perform intricate dexterous manipulation tasks,
such as tying shoelaces or hanging T-shirts on coat hangers—
tasks that historically have been extremely challenging for
robots. The researchers demonstrated that combining a large
imitation learning dataset with a transformer-based learning
architecture is a highly eective approach for overcoming
these diculties. The ALOHA approach enabled Google’s
robot to eectively learn a diverse range of tasks, including
hanging a shirt, stacking kitchen items, and tying shoelaces
(Figure 2.9.7). As shown in Figure 2.9.8, ALOHA-trained robots
achieved a high success rate across these tasks.
Figure 2.9.7
ALOHA-trained robot
attempting complex tasks
Source: Google DeepMind, 2024
70%
75%
40%
70%
75%
40%
75%
95%
25%
65%
95%
ShirtMessy
ShirtEasy
LaceMessy
LaceEasy
FingerReplace
GearInsert-3
GearInsert-2
GearInsert-1
RandomKitchen
-Bowl+Cup+Fork
RandomKitchen
-Bowl+Cup
RandomKitchen
-Bowl
Shirt hanging Shoelace tying Robot nger
replacement
Gear insertion Random kitchen
stack
0%
20%
40%
60%
80%
100%
Success rate
ALOHA: success rate
Source: Zhao et al., 2024 | Chart: 2025 AI Index report
Figure 2.9.8

154
Articial Intelligence
Index Report 2025
Table of Contents Chapter 2 Preview
Highlight:
DeepMind’s Developments (cont’d)
2.9 Robotics and Automous Motion
Chapter 2: Technical Performance
Similarly, DemoStart introduces a novel auto-curriculum
reinforcement learning method that enables a robotic arm
to master complex behaviors using only sparse rewards
and a limited number of demonstrations. This breakthrough
highlights the potential for robots to learn eciently with
minimal data, reducing the need for data-intensive training
and making advanced robotics more accessible and widely
adopted. DeepMind also introduced a robotic model in
2024 that was capable of reaching amateur human-level
performance in competitive table tennis (Figure 2.9.9).
Given that achieving human-level speed and performance
on real-world tasks is an important benchmark for robotics
research, this achievement is a notable step forward in
robotic ability.
Figure 2.9.9
Robots playing amateur-level table tennis
Source: Google DeepMind, 2024

155
Articial Intelligence
Index Report 2025
Table of Contents Chapter 2 Preview
2.9 Robotics and Automous Motion
Chapter 2: Technical Performance
Highlight:
Foundation Models for Robotics
In 2024, there was a strong push toward developing
foundational models for robotics—systems capable of
reasoning with language while physically operating in the
real world. Nvidia introduced GR00T (Generalist Robot
00 Technology), a general-purpose foundation model
for humanoid robots designed to understand natural
language and mimic human movements. Alongside
GR00T, Nvidia released data pipelines, simulation
frameworks, and the Thor robotics computer. Figure
2.9.10 illustrates the components of GROOT’s launch. This
robotic development suite is intended to make it easier
for the robotic community to scale and build increasingly
advanced robotics.
Nvidia was not alone in this space. Covariant launched
RFM-1, a robotic foundation model with language
capabilities and real-world maneuverability. Meanwhile,
LLaRA, developed by researchers at Stony Brook
University and the University of Wisconsin-Madison,
integrates perception, communication, and action into
a monolithic, end-to-end deep learning model. These
new models continue a trend from 2023, which saw the
launch of robotic foundation models like RT-2, PaLM-E,
and Open-X Embodiment.
Figure 2.9.10
GROOT blueprint for synthetic motion generation
Source: Nvidia, 2024

156
Articial Intelligence
Index Report 2025
Table of Contents Chapter 2 Preview
Self-Driving Cars
Self-driving vehicles have long been a goal for AI researchers
and technologists. However, their widespread adoption has
been slower than anticipated. Despite many predictions
that fully autonomous driving is imminent, widespread use
of self-driving vehicles has yet to become a reality. Still, in
recent years, signicant progress has been made. In cities
like San Francisco and Phoenix, eets of self-driving taxis
are now operating commercially. This section examines
recent advancements in autonomous driving, focusing
on deployment, technological breakthroughs and new
benchmarks, safety performance, and policy challenges.
Deployment
Self-driving cars are increasingly being deployed worldwide.
Cruise, a subsidiary of General Motors, launched its
autonomous vehicles in San Francisco in late 2022 before
having its license suspended in 2023 after a litany of safety
incidents. Waymo, a subsidiary of Alphabet, began deploying
its robotaxis in Phoenix in early 2022 and expanded to San
Francisco in 2024. The company has since emerged as one
of the more successful players in the self-driving industry: As
of January 2025, Waymo operates in four major U.S. cities—
Phoenix, San Francisco, Los Angeles, and Austin (Figure
2.9.11). Data sourced from October 2024 suggests that across
the four cities the company provides 150,000 paid rides per
week, covering over a million miles. Looking ahead, Waymo
plans to test its vehicles in 10 additional cities, including Las
Vegas, San Diego, and Miami. The company chose testing
locations, such as upstate New York and Truckee, California,
that experience snowy weather so it can assess the vehicles
in diverse driving conditions. There has also been notable
progress in self-driving trucks, with companies like Kodiak
completing its rst driverless deliveries and Aurora reporting
steady advancements, including over 1 million miles of
autonomous freight hauling on U.S. highways since 2021—
albeit with human safety drivers present. Still, challenges
remain in bringing this technology to market, with Aurora
recently announcing it would delay the commercial launch of
its eet from the end of 2024 until April 2025.
2.9 Robotics and Automous Motion
Chapter 2: Technical Performance
L
o
s
A
n
g
e
l
e
s
S
a
n
F
r
a
n
c
i
s
c
o
P
h
o
e
n
i
x
A
u
s
t
i
n
L
o
c
a
t
i
o
n
1
.
9
4
7
M
1
0
.
20
9
M
20
.
823
M
1
2
4
K
R
i
d
e
r
-
o
n
l
y
m
i
l
e
s
t
h
r
o
u
g
h
S
e
p
t
e
m
b
e
r
2
0
2
4
Waymo rider-only miles driven without a human
driver
Source: Waymo, 2024 | Table: 2025 AI Index report
China’s self-driving revolution is also accelerating, led by
companies like Baidu’s Apollo Go, which reported 988,000
rides across China in Q3 2024, reecting a 20% year-over-year
increase. In October 2024, the company was operating 400
robotaxis and announced plans to expand its eet to 1,000
by the end of 2025. Pony.AI, another Chinese autonomous
vehicle manufacturer, has pledged to scale its robotaxi eet
from 200 to at least 1,000 vehicles—with expectations that
the eet will reach 2,000 to 3,000 by the end of 2026. China
is leading the way in autonomous vehicle testing, with reports
indicating that it is testing more driverless cars than any
other country and currently rolling them out across 16 cities.
Robotaxis in China are notably aordable—even cheaper,
in some cases, than rides provided by human drivers. To
support this growth, China has prioritized establishing
national regulations to govern the deployment of driverless
cars. Beyond the self-driving revolution taking place in the
U.S. and China, European startups like Wayve are beginning
to gain traction in the industry.
Figure 2.9.11

157
Articial Intelligence
Index Report 2025
Table of Contents Chapter 2 Preview
Technical Innovations and New Benchmarks
Over the past year, self-driving technology has advanced
signicantly, both in vehicle capabilities and benchmarking
methods. In October 2024, Tesla unveiled the Cybercab, a
two-passenger autonomous vehicle without a steering wheel
or pedals, which is set for production in 2026 at a price of
under $30,000. Tesla also unveiled the Robovan, an electric
autonomous van designed to transport up to 20 passengers.
Meanwhile, Baidu’s Apollo Go launched its latest-generation
robotaxi, the RT6, across multiple cities in China (Figure 2.9.12).
With a price tag of just $30,000 and a battery-swapping system,
the RT6 represents a major step toward making self-driving
technology more cost-eective and scalable. As costs continue
to decline, the adoption of autonomous vehicles is expected to
accelerate. Notable business partnerships have also advanced
self-driving technology, including Uber’s collaboration with
WeRide—the world’s rst publicly listed robotaxi company—
to develop an autonomous ride-sharing platform in Abu Dhabi.
In 2024, several new benchmarks were introduced to evaluate
self-driving capabilities. One notable example is nuPlan,
developed by Motional. It is a large-scale, autonomous driving
dataset designed to test machine-learning-based motion
planners. The benchmark includes 1,282 hours of diverse
driving scenarios from multiple cities, along with a simulation
and evaluation framework that enables planners’ actions to
be tested in closed-loop settings. Another recent benchmark
is OpenAD, the rst real-world, open-world autonomous
driving benchmark for 3D object detection. OpenAD focuses
on domain generalization—the ability of autonomous driving
systems to adapt across diverse sensor congurations—and
open-vocabulary recognition, which allows systems to identify
previously unseen semantic categories.
Most existing benchmarks for end-to-end autonomous
driving rely on open-loop evaluation, which can be
restrictive. Open-loop settings fail to test how autonomous
agents react to real-world conditions and often lead to
models that memorize driving patterns rather than learning
to drive authentically. While closed-loop benchmarks like
Town05Long and Longest6 exist, they primarily assess basic
driving skills rather than performance in complex, interactive
scenarios. Bench2Drive is another new benchmark that
improves on these limitations by providing a comprehensive,
realistic, closed-loop testing simulation environment for end-
to-end autonomous vehicles (Figure 2.9.13). It includes a
training set with over 2 million fully annotated frames sourced
from more than 10,000 clips, as well as an evaluation suite
with 220 short routes designed to test autonomous driving
capabilities in diverse conditions. Figure 2.9.14 displays
the driving scores of various autonomous driving methods
evaluated on the Bench2Drive benchmark.13
2.9 Robotics and Automous Motion
Chapter 2: Technical Performance
13 This metric accounts for both route completion and infractions, averaging route completion percentages while applying penalties based on infraction severity. For more detail on the
driving score methodology, see Section 3 of the Bench2Drive paper.
Figure 2.9.12
Baidu’s RT-6
Source: Verge, 2024
Figure 2.9.13
An overview of Bench2Drive
Source: Jia et al., 2024

158
Articial Intelligence
Index Report 2025
Table of Contents Chapter 2 Preview
2.9 Robotics and Automous Motion
Chapter 2: Technical Performance
30.47
40.70
49.30
59.90
18.05
40.73 42.35
45.81
62.44 64.22
TCP-ctrl*
TCP*
TCP-traj w/o distillation
TCP-traj*
AD-MLP
UniAD-Tiny
VAD
UniAD-Base
ThinkTwice*
DriveAdapter*
2022 2023
0
10
20
30
40
50
60
Driving score↑
Bench2Drive: driving score
Source: Jia et al., 2024 | Chart: 2025 AI Index report
Figure 2.9.14
Safety Standards
Emerging research suggests that self-driving cars may be
safer than human-driven vehicles. Figure 2.9.15 compares
the number of reported incidents per million miles driven by
Waymo vehicles to the estimated rates if humans had driven
the same distance. The data shows that Waymo vehicles
had signicantly fewer incidents, including 1.42 fewer airbag
deployments, 3.16 fewer crashes with reported injuries, and
3.65 fewer police-reported crashes per million miles (Figure
2.9.15). Figure 2.9.16 highlights the dierences in incident
rates across various crash locations, revealing that across all
locations with available data, Waymo vehicles consistently
recorded lower rates of airbag deployments, injury-reported
crashes, and police-reported incidents.

159
Articial Intelligence
Index Report 2025
Table of Contents Chapter 2 Preview
2.9 Robotics and Automous Motion
Chapter 2: Technical Performance
1.74
0.32
4.06
0.90
5.91
2.26
Human benchmark Waymo Human benchmark Waymo Human benchmark Waymo
Airbag deployment Any-injury-reported Police-reported
0
1
2
3
4
5
6
Incidents per million miles
Waymo driver vs. human benchmarks in Phoenix and San Francisco
Source: Waymo, 2024 | Chart: 2025 AI Index report
-81%
-77%
-87%
-78%
-59%
-88%
-62%
-51%
-76%
Phoenix and San Francisco Phoenix San Francisco
−100%
−80%
−60%
−40%
−20%
0%
Airbag deployment Any-injury-reported Police-reported
Percent dierence to benchmark
Waymo driver percent dierence to human benchmark in Phoenix and San Francisco
Source: Waymo, 2024 | Chart: 2025 AI Index report
Figure 2.9.16
Figure 2.9.1514
14 Waymo’s safety data is continuously updated in real time, so the totals reported in this section may not fully align with those currently displayed on their website.

160
Articial Intelligence
Index Report 2025
Table of Contents Chapter 2 Preview
2.9 Robotics and Automous Motion
Chapter 2: Technical Performance
Swiss Re overall
driving population
Latest-generation
HDVs
Waymo Swiss Re overall
driving population
Latest-generation
HDVs
Waymo
Property damage Bodily injury
0.00
0.50
1.00
1.50
2.00
2.50
3.00
3.50
Claims frequency per million miles
Comparison of liability insurance claims by type: Waymo driver vs. human-driven vehicles
Source: Di Lillo et al., 2024 | Chart: 2025 AI Index report
Figure 2.9.17
Waymo, in collaboration with Swiss Re, one of the world’s
leading reinsurers, also conducted a study analyzing liability
claims related to collisions over several million miles driven by
its fully autonomous vehicles. The study compared Waymo’s
liability claims to human-driver baselines derived from Swiss
Re’s extensive dataset, which includes over 500,000 claims
and 200 billion miles of driving data. The results showed that
Waymo vehicles had an 88% reduction in property damage
claims and a 92% reduction in bodily injury claims (Figure
2.9.17). In real terms, across 25.3 million miles driven, Waymo
vehicles were involved in just nine property damage claims and
two bodily injury claims, whereas human drivers over the same
distance would be expected to incur 78 property damage
claims and 26 bodily injury claims. The Waymo drivers were
also signicantly safer than latest-generation human-driven
vehicles that are equipped with added safety features.

Articial Intelligence
Index Report 2025
CHAPTER 3:
Responsible AI
Text and analysis by Anka Reuel

162Table of Contents
Overview 162
Chapter Highlights 163
3.1 Background 165
Denitions 165
3.2 Assessing Responsible AI 166
AI Incidents 166
Examples 167
Limited Adoption of RAI Benchmarks 169
Factuality and Truthfulness 170
Hughes Hallucination Evaluation
Model (HHEM) Leaderboard 170
Highlight: FACTS, SimpleQA,
and the Launch of Harder
Factuality Benchmarks 171
3.3 RAI in Organizations and Businesses 173
Highlight: Longitudinal Perspective 180
3.4 RAI in Academia 184
Aggregate Trends 184
Topic Area 187
3.5 RAI Policymaking 191
3.6 Privacy and Data Governance 192
Featured Research 192
Large-Scale Audit of Dataset
Licensing and Attribution in AI 192
Data Consent in Crisis 193
3.7 Fairness and Bias 195
Featured Research 195
Racial Classication in
Multimodal Models 195
Measuring Implicit Bias in
Explicitly Unbiased LLMs 197
3.8 Transparency and Explainability 199
Featured Research 199
Foundation Model Transparency
Index v1.1 199
3.9 Security and Safety 201
Benchmarks 201
HELM Safety 201
AIR-Bench 202
Featured Research 204
Beyond Shallow Safety Alignment 204
Improving the Robustness to Persistently
Harmful Behaviors in LLMs 205
3.10 Special Topics on RAI 207
AI Agents 207
Identifying the Risks of LM Agents
With LM-Simulated Sandboxes 207
Jailbreaking Multimodal Agents
With a Single Image 207
Election Misinformation 209
AI Misinformation in the
US Elections 209
Rest of World 2024 AI-Generated
Election Content 210
Chapter 3: Responsible AI
Articial Intelligence
Index Report 2025
ACCESS THE PUBLIC DATA

163
Articial Intelligence
Index Report 2025
Table of Contents Chapter 3 Preview
Articial intelligence is now deeply integrated into nearly every aspect of our lives. It
is reshaping sectors like education, nance, and healthcare, where algorithm-driven
insights guide critical decisions. While this shift oers signicant benets, it also brings
with it notable risks. The past year has seen a continued concentration of eort on the
responsible development and deployment of AI systems.
This chapter examines trends in responsible AI (RAI) across several dimensions. It
begins by establishing key RAI denitions before assessing broadly relevant issues
such as AI incidents, standardization challenges in LLM responsibility, and benchmarks
for model factuality and truthfulness. Next, it explores RAI trends within key societal
sectors—industry, academia, and policymaking—and analyzes specic subtopics,
including privacy and data governance, fairness, transparency and explainability,
and security and safety, using benchmarks that illuminate model performance and
highlights of notable research. The chapter concludes with a study of two special RAI
topics: agentic AI and election misinformation.
Overview
CHAPTER 3:
Responsible AI
Articial Intelligence
Index Report 2025

164
Articial Intelligence
Index Report 2025
Table of Contents Chapter 3 Preview
Chapter Highlights
1. Evaluating AI systems with responsible AI criteria is still uncommon, but new benchmarks are beginning
to emerge. Last year’s AI Index highlighted the lack of standardized RAI benchmarks for LLMs. While this issue persists, new
benchmarks such as HELM Safety and AIR-Bench help to ll this gap.
2. The number of AI incident reports continues to increase. According to the AI Incidents Database, the number of
reported AI-related incidents rose to 233 in 2024—a record high and a 56.4% increase over 2023.
3. Organizations acknowledge RAI risks, but mitigation eorts lag. A McKinsey survey on organizations’ RAI
engagement shows that while many identify key RAI risks, not all are taking active steps to address them. Risks including
inaccuracy, regulatory compliance, and cybersecurity were top of mind for leaders with only 64%, 63%, and 60% of respondents,
respectively, citing them as concerns.
4. Across the globe, policymakers demonstrate a signicant interest in RAI. In 2024, global cooperation on AI
governance intensied, with a focus on articulating agreed-upon principles for responsible AI. Several major organizations—
including the OECD, European Union, United Nations, and African Union—published frameworks to articulate key RAI concerns
such as transparency and explainability, and trustworthiness.
5. The data commons is rapidly shrinking. AI models rely on massive amounts of publicly available web data for training.
A recent study found that data use restrictions increased signicantly from 2023 to 2024, as many websites implemented new
protocols to curb data scraping for AI training. In actively maintained domains in the C4 common crawl dataset, the proportion
of restricted tokens jumped from 5–7% to 20–33%. This decline has consequences for data diversity, model alignment, and
scalability, and may also lead to new approaches to learning with data constraints.
CHAPTER 3:
Responsible AI
Articial Intelligence
Index Report 2025
6. Foundation model research transparency improves, yet more work remains. The updated Foundation
Model Transparency Index—a project tracking transparency in the foundation model ecosystem—revealed that the average
transparency score among major model developers increased from 37% in October 2023 to 58% in May 2024. While these gains
are promising, there is still considerable room for improvement.

165
Articial Intelligence
Index Report 2025
Table of Contents Chapter 3 Preview
Chapter Highlights (cont’d)
9. LLMs trained to be explicitly unbiased continue to demonstrate implicit bias. Many advanced LLMs—
including GPT-4 and Claude 3 Sonnet—were designed with measures to curb explicit biases, but they continue to exhibit
implicit ones. The models disproportionately associate negative terms with Black individuals, more often associate women with
humanities instead of STEM elds, and favor men for leadership roles, reinforcing racial and gender biases in decision making.
Although bias metrics have improved on standard benchmarks, AI model bias remains a pervasive issue.
10. RAI gains attention from academic researchers. The number of RAI papers accepted at leading AI conferences
increased by 28.8%, from 992 in 2023 to 1,278 in 2024, continuing a steady annual rise since 2019. This upward trend highlights
the growing importance of RAI within the AI research community.
7. Better benchmarks for factuality and truthfulness. Earlier benchmarks like HaluEval and TruthfulQA, aimed at
evaluating the factuality and truthfulness of AI models, have failed to gain widespread adoption within the AI community. In
response, newer and more comprehensive evaluations have emerged, such as the updated Hughes Hallucination Evaluation
Model leaderboard, FACTS, and SimpleQA.
8. AI-related election misinformation spread globally, but its impact remains unclear. In 2024, numerous
examples of AI-related election misinformation emerged in more than a dozen countries and across over 10 social media
platforms, including during the U.S. presidential election. However, questions remain about measurable impacts of this problem,
with many expecting misinformation campaigns to have aected elections more profoundly than they did.
CHAPTER 3:
Responsible AI
Articial Intelligence
Index Report 2025

166
Articial Intelligence
Index Report 2025
Table of Contents Chapter 3 Preview
P
r
i
v
a
c
y
D
a
t
a
g
o
v
e
r
n
a
n
c
e
F
a
i
r
n
e
s
s
a
n
d
b
i
a
s
T
r
a
n
s
p
a
r
e
n
c
y
E
x
p
l
a
i
n
a
b
i
l
i
t
y
S
e
c
u
r
i
t
y
a
n
d
s
a
f
e
t
y
R
e
s
p
o
n
s
i
b
l
e
A
I
d
i
m
e
n
s
i
o
n
s
A
n
i
n
d
i
v
i
d
u
a
l
’
s
r
i
g
h
t
t
o
c
o
n
d
e
n
t
i
a
l
i
t
y
,
a
n
o
n
y
m
i
t
y
,
a
n
d
s
e
c
u
r
i
t
y
p
r
o
t
e
c
t
i
o
n
s
o
f
t
h
e
i
r
p
e
r
s
o
n
a
l
d
a
t
a
,
i
n
c
l
u
d
i
n
g
t
h
e
r
i
g
h
t
t
o
c
o
n
s
e
n
t
a
n
d
b
e
i
n
f
o
r
m
e
d
a
b
o
u
t
d
a
t
a
u
s
a
g
e
,
c
o
u
p
l
e
d
w
i
t
h
a
n
o
r
g
a
n
i
z
a
t
i
o
n
’
s
r
e
s
p
o
n
s
i
b
i
l
i
t
y
t
o
s
a
f
e
g
u
a
r
d
t
h
e
s
e
r
i
g
h
t
s
w
h
e
n
h
a
n
d
l
i
n
g
p
e
r
s
o
n
a
l
d
a
t
a
.
E
s
t
a
b
l
i
s
h
m
e
n
t
o
f
p
o
l
i
c
i
e
s
,
p
r
o
c
e
d
u
r
e
s
,
a
n
d
s
t
a
n
d
a
r
d
s
t
o
e
n
s
u
r
e
t
h
e
q
u
a
l
i
t
y
,
a
c
c
e
s
s
,
a
n
d
l
i
c
e
n
s
i
n
g
o
f
d
a
t
a
,
w
h
i
c
h
i
s
c
r
u
c
i
a
l
f
o
r
b
r
o
a
d
e
r
r
e
u
s
e
a
n
d
i
m
p
r
o
v
e
d
a
c
c
u
r
a
c
y
o
f
m
o
d
e
l
s
.
C
r
e
a
t
i
n
g
a
l
g
o
r
i
t
h
m
s
t
h
a
t
a
v
o
i
d
b
i
a
s
o
r
d
i
s
c
r
i
m
i
n
a
t
i
o
n
,
a
n
d
c
o
n
s
i
d
e
r
i
n
g
t
h
e
d
i
v
e
r
s
e
n
e
e
d
s
a
n
d
c
i
r
c
u
m
s
t
a
n
c
e
s
o
f
a
l
l
s
t
a
k
e
h
o
l
d
e
r
s
,
t
h
e
r
e
b
y
a
l
i
g
n
i
n
g
w
i
t
h
b
r
o
a
d
e
r
s
o
c
i
e
t
a
l
s
t
a
n
d
a
r
d
s
o
f
e
q
u
i
t
y
.
O
p
e
n
s
h
a
r
i
n
g
o
f
h
o
w
A
I
s
y
s
t
e
m
s
w
o
r
k
,
i
n
c
l
u
d
i
n
g
d
a
t
a
s
o
u
r
c
e
s
a
n
d
a
l
g
o
r
i
t
h
m
i
c
d
e
c
i
s
i
o
n
s
,
a
s
w
e
l
l
a
s
h
o
w
A
I
s
y
s
t
e
m
s
a
r
e
d
e
p
l
o
y
e
d
,
m
o
n
i
t
o
r
e
d
,
a
n
d
m
a
n
a
g
e
d
,
c
o
v
e
r
i
n
g
b
o
t
h
t
h
e
c
r
e
a
t
i
o
n
a
n
d
o
p
e
r
a
t
i
o
n
a
l
p
h
a
s
e
s
.
T
h
e
c
a
p
a
c
i
t
y
t
o
c
o
m
p
r
e
h
e
n
d
a
n
d
a
r
t
i
c
u
l
a
t
e
t
h
e
r
a
t
i
o
n
a
l
e
b
e
h
i
n
d
t
h
e
o
u
t
p
u
t
s
o
f
a
n
A
I
s
y
s
t
e
m
i
n
w
a
y
s
t
h
a
t
a
r
e
u
n
d
e
r
s
t
a
n
d
a
b
l
e
t
o
i
t
s
u
s
e
r
s
a
n
d
s
t
a
k
e
h
o
l
d
e
r
s
.
T
h
e
i
n
t
e
g
r
i
t
y
o
f
A
I
s
y
s
t
e
m
s
a
g
a
i
n
s
t
t
h
r
e
a
t
s
,
m
i
n
i
m
i
z
i
n
g
h
a
r
m
f
r
o
m
m
i
s
u
s
e
,
a
n
d
a
d
d
r
e
s
s
i
n
g
i
n
h
e
r
e
n
t
s
a
f
e
t
y
r
i
s
k
s
l
i
k
e
r
e
l
i
a
b
i
l
i
t
y
c
o
n
c
e
r
n
s
a
s
w
e
l
l
a
s
t
h
e
m
o
n
i
t
o
r
i
n
g
a
n
d
m
a
n
a
g
e
m
e
n
t
o
f
s
a
f
e
t
y
-
c
r
i
t
i
c
a
l
A
I
s
y
s
t
e
m
s
.
D
e
n
i
t
i
o
n
P
a
t
i
e
n
t
d
a
t
a
i
s
h
a
n
d
l
e
d
w
i
t
h
s
t
r
i
c
t
c
o
n
d
e
n
t
i
a
l
i
t
y
,
e
n
s
u
r
i
n
g
a
n
o
n
y
m
i
t
y
a
n
d
p
r
o
t
e
c
t
i
o
n
.
P
a
t
i
e
n
t
s
c
o
n
s
e
n
t
t
o
w
h
e
t
h
e
r
t
h
e
i
r
d
a
t
a
c
a
n
b
e
u
s
e
d
t
o
t
r
a
i
n
a
t
u
m
o
r
d
e
t
e
c
t
i
o
n
s
y
s
t
e
m
.
P
o
l
i
c
i
e
s
a
n
d
p
r
o
c
e
d
u
r
e
s
a
r
e
i
n
p
l
a
c
e
t
o
m
a
i
n
t
a
i
n
d
a
t
a
q
u
a
l
i
t
y
a
n
d
p
e
r
m
i
s
s
i
o
n
s
f
o
r
r
e
u
s
e
o
f
a
p
u
b
l
i
c
h
e
a
l
t
h
d
a
t
a
s
e
t
.
T
h
e
r
e
a
r
e
c
l
e
a
r
d
a
t
a
q
u
a
l
i
t
y
p
i
p
e
l
i
n
e
s
a
n
d
s
p
e
c
i
c
a
t
i
o
n
o
f
u
s
e
l
i
c
e
n
s
e
s
.
A
m
e
d
i
c
a
l
A
I
p
l
a
t
f
o
r
m
d
e
s
i
g
n
e
d
t
o
a
v
o
i
d
b
i
a
s
i
n
t
r
e
a
t
m
e
n
t
r
e
c
o
m
m
e
n
d
a
t
i
o
n
s
,
e
n
s
u
r
i
n
g
t
h
a
t
p
a
t
i
e
n
t
s
f
r
o
m
a
l
l
d
e
m
o
g
r
a
p
h
i
c
s
r
e
c
e
i
v
e
e
q
u
i
t
a
b
l
e
c
a
r
e
.
T
h
e
d
e
v
e
l
o
p
m
e
n
t
c
h
o
i
c
e
s
,
i
n
c
l
u
d
i
n
g
d
a
t
a
s
o
u
r
c
e
s
a
n
d
a
l
g
o
r
i
t
h
m
i
c
d
e
s
i
g
n
d
e
c
i
s
i
o
n
s
a
r
e
o
p
e
n
l
y
s
h
a
r
e
d
.
H
o
w
t
h
e
s
y
s
t
e
m
i
s
d
e
p
l
o
y
e
d
a
n
d
m
o
n
i
t
o
r
e
d
i
s
c
l
e
a
r
t
o
h
e
a
l
t
h
c
a
r
e
p
r
o
v
i
d
e
r
s
a
n
d
r
e
g
u
l
a
t
o
r
y
b
o
d
i
e
s
.
T
h
e
A
I
p
l
a
t
f
o
r
m
c
a
n
a
r
t
i
c
u
l
a
t
e
t
h
e
r
a
t
i
o
n
a
l
e
b
e
h
i
n
d
i
t
s
t
r
e
a
t
m
e
n
t
r
e
c
o
m
m
e
n
d
a
t
i
o
n
s
,
m
a
k
i
n
g
t
h
e
s
e
i
n
s
i
g
h
t
s
u
n
d
e
r
s
t
a
n
d
a
b
l
e
t
o
d
o
c
t
o
r
s
a
n
d
p
a
t
i
e
n
t
s
t
o
i
n
c
r
e
a
s
e
t
r
u
s
t
i
n
t
h
e
A
I
s
y
s
t
e
m
.
Me
a
s
u
r
e
s
a
r
e
i
m
p
l
e
m
e
n
t
e
d
t
o
p
r
o
t
e
c
t
a
g
a
i
n
s
t
c
y
b
e
r
t
h
r
e
a
t
s
a
n
d
t
o
e
n
s
u
r
e
t
h
e
s
y
s
t
e
m
’
s
r
e
l
i
a
b
i
l
i
t
y
,
m
i
n
i
m
i
z
i
n
g
r
i
s
k
s
f
r
o
m
m
i
s
u
s
e
a
n
d
s
a
f
e
g
u
a
r
d
i
n
g
p
a
t
i
e
n
t
h
e
a
l
t
h
a
n
d
d
a
t
a
.
E
x
a
m
p
l
e
Responsible AI dimensions, denitions, and examples
Source: AI Index, 2025 | Table: 2025 AI Index report
3.1 Background
Denitions
In this chapter, the AI Index explores four key dimensions of
responsible AI: privacy and data governance, transparency
and explainability, security and safety, and fairness. Other
dimensions of responsible AI, such as sustainability and
reliability, are discussed elsewhere in the report. Figure
3.1.1 oers denitions for the responsible AI dimensions
addressed in this chapter, along with an illustrative example
of how these dimensions might be practically relevant. The
“example” column examines a hypothetical platform that
employs AI to analyze medical patient data for personalized
treatment recommendations, and demonstrates how issues
like privacy, transparency, etc., could be relevant. Although
Figure 3.1.1 breaks down various dimensions of responsible
AI into specic categories to improve denitional clarity, this
chapter organizes these dimensions into the following broader
categories: privacy and data governance, transparency and
explainability, security and safety, and fairness. Since these
topics are often interrelated, the AI Index adopted this
structured approach to organization.
3.1 Background
Chapter 3: Responsible AI
Figure 3.1.1

167
Articial Intelligence
Index Report 2025
Table of Contents Chapter 3 Preview
While the responsible development, deployment, and
governance of AI received increased attention in 2024,
capturing overall trends in this area is still challenging.
This section covers some indicators relevant to
capturing responsible AI at the aggregate level.
3.2 Assessing Responsible AI
AI Incidents
The AI Incident Database (AIID) tracks instances of ethical
misuse of AI, such as autonomous cars causing pedestrian
fatalities or facial recognition systems leading to wrongful
arrests.
Current incident tracking relies on publicly available media
reports, meaning the actual number of incidents is likely
higher, as many go unreported. In 2024, discussions centered
on rening methods for dening and tracking incidents,
particularly those classied as “serious.” While no consensus
has been reached on a standard denition, these discussions
highlight the need for more detailed reporting to better
document AI-related risks and their implications.
AI-related incidents sharply increased in 2024, reaching
a record high of 233—a 56.4% increase from 2023 (Figure
3.2.1). This rise likely reects both the expanding use of AI and
heightened public awareness of its impact. Greater familiarity
with AI may also be driving more frequent reporting of
incidents to relevant databases.
233
2012 2013 2014 2015 2016 2017 2018 2019 2020 2021 2022 2023 2024
0
50
100
150
200
Number of AI incidents
Number of reported AI incidents, 2012–24
Source: AI Incident Database (AIID), 2024 | Chart: 2025 AI Index report
3.2 Assessing Responsible AI
Chapter 3: Responsible AI
Figure 3.2.11
1 The number of AI incidents is continually updated over time, including for previous years. Therefore, the totals reported in Figure 3.2.1 might not align with the more recent totals published
on the AI Incident Database.

168
Articial Intelligence
Index Report 2025
Table of Contents Chapter 3 Preview
Examples
The next section details recent AI incidents to shed light on
the ethical challenges commonly linked with AI.
Misidentications and the Human Cost of Facial
Recognition Technology (May 25, 2024)
A woman in the U.K. was wrongfully identied as a shoplifter
by the Facewatch system while shopping at a Home
Bargains store. After being publicly accused, searched, and
banned from stores using the technology, she experienced
emotional distress and worried about the long-term impact
on her reputation. Facewatch later acknowledged the error
but did not comment or issue a public apology. The case
reects broader issues with the increasing adoption of facial
recognition systems by retailers and law enforcement. While
advocates emphasize their potential to reduce crime and
enhance public safety, critics point to privacy violations,
misidentications, and the potential normalization of mass
surveillance. Despite assurances of accuracy, errors still
occur. These types of incidents also raise questions about how
system errors are acknowledged and victims compensated.
Growing threat of deepfake intimate images (Jun. 18, 2024)
Elliston Berry, a 15-year-old high school student from Texas,
became the victim of AI-generated harassment when a
male classmate used a clothes-removal app to create fake
nude images of Berry and her friends, distributing them
anonymously through social media. The realistic but falsied
images, made from photos taken from Berry’s private
Instagram account, caused her to experience feelings of fear,
shame, and anxiety, which impacted her social and academic
life. While the perpetrator faced juvenile sanctions and school
discipline, the case exposed gaps in legal and institutional
frameworks for addressing AI-driven harassment. Berry and
her family have since advocated for stronger protections, and
several bills have been introduced in the U.S. Congress to
criminalize the nonconsensual sharing of intimate images—
real or fake—and to impose removal obligations on social
media platforms. Certain countries, including Australia, have
already passed such laws.
3.2 Assessing Responsible AI
Chapter 3: Responsible AI
Figure 3.2.2
Figure 3.2.3
Source: BBC, 2024
Source: Restless Network, 2021

169
Articial Intelligence
Index Report 2025
Table of Contents Chapter 3 Preview
AI chatbot exploits deceased individual’s identity (Oct. 7,
2024)
Jennifer Ann Crecente, a high school senior murdered by an
ex-boyfriend in 2006, was brought back into public focus
when her name and image appeared in an AI chatbot on
Character.AI. Discovered by her father, Drew Crecente, via
a Google Alert, the bot—created by an unknown user—
used Jennifer Ann’s yearbook photo and described her as
a “knowledgeable and friendly AI character.” Crecente,
an advocate for awareness of teenage dating violence,
expressed outrage and distress at the unauthorized use of
his daughter’s identity, calling the experience retraumatizing.
Despite the chatbot’s removal for violating Character.AI’s
impersonation policies, the incident highlights troubling gaps
in AI platform oversight and the ethical dilemmas surrounding
digital recreations of deceased individuals.
Chatbot blamed for teenage suicide (Oct. 23, 2024)
A lawsuit against Character.AI has raised concerns about
the role of AI chatbots in mental health crises. The case
involves a 14-year-old boy, Sewell Setzer III, who died by
suicide after prolonged interactions with a chatbot character,
which reportedly provided harmful advice rather than
oering support or critical resources. The lawsuit alleges
that the chatbot, designed to engage users in deep and
personal conversations, lacked proper safeguards to prevent
dangerous interactions and encouraged Sewell to take his
life. Figure 3.2.5 highlights a screenshot of the conversation
between Sewell and “Dany” (the chatbot character), the day
of his suicide. This case speaks to the ethical challenges of
AI-driven companionship and the potential risks of deploying
conversational AI without adequate oversight. While AI
chatbots can oer emotional support, critics warn that
without guardrails, they may inadvertently reinforce harmful
behaviors or fail to intervene when users are in distress.
3.2 Assessing Responsible AI
Chapter 3: Responsible AI
Figure 3.2.4
Figure 3.2.5
Source: Business Insider, 2024
Source: Business Insider, 2024

170
Articial Intelligence
Index Report 2025
Table of Contents Chapter 3 Preview
Limited Adoption of RAI Benchmarks
Last year’s AI Index was among the rst publications to
highlight the lack of standard benchmarks for AI safety and
responsibility evaluations. While major model developers
consistently test their agship models on the same general
capabilities benchmarks—covering math, coding, and
language skills—no such standard exists for safety and
responsible AI assessments. Standardized evaluation
suites are important for enabling direct comparisons
between models. This is especially important for safety and
responsibility features, as businesses and governments are
increasingly deploying AI in real-world applications.
This year’s AI Index conrms that this trend persists. Figure
3.2.6 highlights several general capabilities benchmarks (such
as MMLU, GPQA Diamond, and MATH) used to evaluate
major models released in 2024, while Figure 3.2.7 showcases
prominent safety and responsible AI benchmarks, indicating
whether leading developers tested their models against
them. As with last year, there is clear consensus among
model developers on which general capabilities benchmarks
to use—but none on similar RAI benchmarks.
MML
U
,
MML
U
-
P
r
o
o
r
MMML
U
G
P
Q
A
o
r
G
P
Q
A
-
D
i
a
m
o
n
d
MA
T
H
-
5
0
0
A
I
ME
20
2
4
S
W
E
-
b
e
n
c
h
v
e
r
i
e
d
MMMU
C
a
p
a
b
i
l
i
t
y
b
e
n
c
h
m
a
r
k
✓
✓
✓
✓
✓
✓
o
1
✓
✓
✓
✓
✓
G
P
T
-
4
.
5
✓
✓
✓
✓
✓
D
e
e
p
S
e
e
k
-
R
1
✓
✓
✓
✓
✓
G
e
m
i
n
i
2
.
5
✓
✓
✓
✓
G
r
o
k
-
2
✓
✓
✓
✓
✓
✓
C
l
a
u
d
e
3
.
7
S
o
n
n
e
t
✓
✓
✓
Ll
a
m
a
3
.
3
Reported general capability benchmarks for popular foundation models
Source: AI Index, 2025 | Table: 2025 AI Index report
B
B
Q
H
a
r
m
B
e
n
c
h
C
y
b
e
n
c
h
S
i
m
p
l
e
Q
A
T
o
x
i
c
W
i
l
d
C
h
a
t
S
t
r
o
n
g
R
E
J
E
C
T
W
MD
P
b
e
n
c
h
m
a
r
k
M
a
k
e
Me
P
a
y
M
a
k
e
Me
S
a
y
R
e
s
p
o
n
s
i
b
l
e
A
I
b
e
n
c
h
m
a
r
k
✓
✓
✓
✓
✓
✓
o
1
✓
✓
✓
✓
✓
✓
G
P
T
-
4
.
5
✓
D
e
e
p
S
e
e
k
-
R
1
✓
G
e
m
i
n
i
2
.
5
G
r
o
k
-
2
✓
✓
✓
C
l
a
u
d
e
3
.
7
S
o
n
n
e
t
Ll
a
m
a
3
.
3
Reported safety and responsible AI benchmarks for popular foundation models
Source: AI Index, 2025 | Table: 2025 AI Index report
Figure 3.2.6
Figure 3.2.7
3.2 Assessing Responsible AI
Chapter 3: Responsible AI

171
Articial Intelligence
Index Report 2025
Table of Contents Chapter 3 Preview
This does not mean model developers neglect safety
testing—many conduct evaluations—but much like most
models are kept proprietary, these evaluations are often
internal and not standardized, making assessments and
comparisons of models dicult. External evaluators also
present challenges. For example, third-party evaluators like
Gryphon, Apollo Research, and METR assess only select
models, and their ndings cannot be widely validated by the
broader AI community.
Factuality and Truthfulness
Despite signicant progress, LLMs still face challenges with
factual inaccuracies and hallucinations, often generating
information that appears credible but is false. Notable real-
world examples include cases where lawyers submitted
court briefs containing citations fabricated by LLM systems.
Monitoring the rate of hallucinations in LLMs is therefore
important. However, some benchmarks highlighted in
previous editions of the AI Index, such as HaluEval and
TruthfulQA, have struggled to gain traction within the
AI community. In 2024, several new benchmarks were
introduced to better evaluate the factuality of these models.
Hughes Hallucination Evaluation Model (HHEM)
Leaderboard
The Hughes Hallucination Evaluation Model (HHEM)
leaderboard, developed by Vectara, assesses how
frequently LLMs introduce hallucinations when summarizing
documents. In this benchmark, models generate summaries
from documents in the CNN and Daily Mail corpus. These
summaries are then evaluated for hallucination rates. HHEM
stands out as one of the most comprehensive and up-to-date
evaluations of AI systems’ tendency to hallucinate. Recent
models, including Llama 3, Claude 3.5, and Gemini 2.0, have
all been benchmarked on the leaderboard.
Currently, the GLM-4-9b-Chat and Gemini-2.0-Flash-Exp
models are tied for the lowest hallucination rate, each at just
1.3%. The next closest models, o1-mini and GPT-4o, follow
closely, with hallucination rates of 1.4% and 1.5%, respectively
(Figure 3.2.8).
2.90% 2.80%
2.60% 2.50% 2.50% 2.40% 2.40%
1.90% 1.80% 1.70% 1.70%
1.50% 1.40% 1.30% 1.30%
ai21labs/AI21-Jamba-1.5-Mini
Qwen/Qwen2.5-7B-Instruct
Intel/neural-chat-7b-v3-3
microsoft/Orca-2-13b
microsoft/Phi-3.5-MoE-instruct
openai/o1
deepseek/deepseek-chat
openai/GPT-3.5-Turbo
openai/GPT-4
openai/GPT-4o-mini
openai/GPT-4-Turbo
openai/GPT-4o
openai/o1-mini
gemini-2.0-ash-exp
THUDM/glm-4-9b-chat
0.00%
0.50%
1.00%
1.50%
2.00%
2.50%
3.00%
Hallucination rate
HHEM: hallucination rate
Source: HHEM leaderboard, 2025 | Chart: 2025 AI Index report
Figure 3.2.8
3.2 Assessing Responsible AI
Chapter 3: Responsible AI

172
Articial Intelligence
Index Report 2025
Table of Contents Chapter 3 Preview
Highlight:
FACTS, SimpleQA, and the Launch of Harder Factuality Benchmarks
3.2 Assessing Responsible AI
Chapter 3: Responsible AI
Still generations from Stable Video Diusion
Source: Google, 2024
o1-preview
o1-mini
gpt-4o-mini
claude-3.5-haiku-20241022
gpt-4o
claude-3.5-sonnet-20241022
gemini-1.5-pro-002
gemini-1.5-ash-002
gemini-2.0-ash-exp
0%
20%
40%
60%
80%
100%
Model
Factuality score
61.70% 62.00%
71.00% 74.20%
78.80% 79.40% 80.00% 82.90% 83.60%
FACTS: factuality score
Source: FACTS leaderboard, 2025 | Chart: 2025 AI Index report
Figure 3.2.9
Figure 3.2.10
The HHEM leaderboard, while useful,
appears to be nearing saturation as model
performance improves. Additionally, its
focus on news articles and summarization
tasks limits its comprehensiveness. As
AI capabilities continue to evolve, there
is a growing need for benchmarks that
assess factuality in more challenging and
diverse contexts.
This year, several new benchmarks
were introduced for evaluating the
factuality and truthfulness of LLMs,
including Google’s FACTS Grounding.
This benchmark assesses how well
LLMs generate responses that are both
factually accurate and detailed enough
to provide satisfactory answers. As
part of FACTS, models must craft long-
form responses to user requests based
on a context document (Figure 3.2.9).
These documents cover a wide range of
domains, including nance, technology,
retail, medicine, and law. FACTS is more
complex than HHEM, requiring models
to perform tasks such as summarization,
question-and-answer generation, fact-
nding, and explanation. Responses are
evaluated by a collection of AI models—
Gemini 1.5 Pro, GPT-4o, and Claude
3.5 Sonnet—which assign a factuality
score. Currently, Gemini-2.0-Flash-Exp
holds the highest grounding score at
83.6% (Figure 3.2.10).

173
Articial Intelligence
Index Report 2025
Table of Contents Chapter 3 Preview
Highlight:
FACTS, SimpleQA, and the Launch of Harder Factuality Benchmarks
(cont’d)
3.2 Assessing Responsible AI
Chapter 3: Responsible AI
Sample questions from SimpleQA
Source: OpenAI, 2024
Figure 3.2.11
Evaluating the factuality of LLMs is challenging because
their long answers often contain multiple factual claims,
making it dicult to assess the accuracy of each one. To
address this, OpenAI researchers introduced SimpleQA, a
new benchmark for evaluating LLM factuality. SimpleQA
presents models with over 4,000 short fact-seeking
questions that are straightforward, easily gradable, and
relatively challenging. These questions span a diverse
range of topics, including history, science and technology,
art, and geography (Figure 3.2.11).
SimpleQA presents a signicant factuality challenge for
leading LLMs. The best-performing model, OpenAI’s o1-
preview, successfully answers only 42.7% of the questions
(Figure 3.2.12). Researchers also evaluated whether models
would attempt to answer certain questions, nding that
5.10% 5.70%
23.50%
28.90%
8.60%
38.20%
8.10%
42.70%
75.30% 75.00%
39.60%
35.00%
0.90% 1.00%
28.50%
9.20%
20.60%
22.90%
38.80%
44.50%
8.70%
38.00%
11.30%
47.00%
Claude-3-haiku
(2024-03-07)
Claude-3-sonnet
(2024-02-29)
Claude-3-opus
(2024-02-29)
Claude-3.5-sonnet
(2024-06-20)
GPT-4o-mini GPT-4o OpenAI o1-mini OpenAI o1-preview
0%
20%
40%
60%
80%
100%
Correct Not attempted Correct given attempted
Model
Percent of questions
SimpleQA: percent of questions
Source: Wei et al., 2024 | Chart: 2025 AI Index report
Figure 3.2.12
some, like the Claude-3 family, refrained from responding
to 75% of the prompts. Among models that attempted to
respond to questions, o1-preview scored 47.0% of “correct-
given-attempted” prompts, followed by Claude 3.5 Sonnet
at 44.5%. As expected, larger models tend to perform better
on this benchmark.

174
Articial Intelligence
Index Report 2025
Table of Contents Chapter 3 Preview
1%
2%
4%
7%
9%
10%
13%
14%
17%
21%
0% 2% 4% 6% 8% 10% 12% 14% 16% 18% 20% 22%
Other
Customer care
Internal audit/ethics
Legal
No business function
primarily responsible
Engineering
Risk/compliance
AI-specic governance
roles
Data and analytics
Information security
(cyber/fraud/privacy)
% of respondents
Business functions assigned primary responsibility for AI governance, 2024
Source: McKinsey & Company Survey, 2024 | Chart: 2025 AI Index report
Figure 3.3.12
3.3 RAI in Organizations and Businesses
As AI systems become more widely deployed in real-
world settings, understanding how businesses approach
responsible AI has become increasingly important. To explore
this, the AI Index partnered with McKinsey & Company in
2024 to conduct a survey examining the extent to which
businesses integrate RAI into their operations. The survey
dened RAI as a framework for ensuring that AI is developed
and deployed in a safe, trustworthy, and ethical manner. It
assessed RAI along the same key dimensions outlined by the
AI Index: privacy and data governance, fairness, transparency
and explainability, and security and safety. The survey polled
business leaders from over 30 countries and had a total
sample size of 759 respondents.
Figure 3.3.1 visualizes responses to questions asking
organizations which department has primary oversight for
AI governance within their organizations. Notably, no single
department dominated. The most common response was
information security (cyber/fraud/privacy) at 21%, followed
by data and analytics at 17%. Additionally, 14% of respondents
reported having dedicated AI governance roles, signaling
the growing recognition of AI governance as a distinct and
essential function within organizations.
3.3 RAI in Organizations and Businesses
Chapter 3: Responsible AI
2 The “Unknown” response option was not shown in this visualization.

175
Articial Intelligence
Index Report 2025
Table of Contents Chapter 3 Preview
68%
48%
40%
24%
25%
25%
30%
32%
30%
29%
6%
15%
18%
27%
21%
7%
10%
19%
25%
0% 20% 40% 60% 80% 100%
30B+
10B–30B
1B–10B
100M–1B
<100M
1–5M 5–10M 10–25M 25–50M
% of respondents
Revenue in USD
Investment in responsible AI by company revenue, 2024
Source: McKinsey & Company Survey, 2024 | Chart: 2025 AI Index report
Figure 3.3.2
The survey also asked organizations about their approximate
investment in operationalizing RAI over the next year,
including both capital and operating expenditures. Examples
of such investments include developing or purchasing
technical systems to comply with RAI principles, as well as
legal or professional services related to RAI. Responses to
this question are visualized in Figure 3.3.2, disaggregated by
organizational revenue size.
Larger enterprises—particularly those with annual revenues
exceeding $10 billion—demonstrated higher total investment
into RAI. Notably, 27% of organizations with $10 billion–$30
billion in revenue and 21% of those exceeding $30 billion invest
$10 million–$25 million in RAI. These ndings suggest that
larger organizations are more likely to embed RAI as a strategic
priority and to make higher absolute investments. Smaller
organizations allocated fewer dollars to RAI, but many still
reported substantial investments as a share of their revenue.
3.3 RAI in Organizations and Businesses
Chapter 3: Responsible AI

176
Articial Intelligence
Index Report 2025
Table of Contents Chapter 3 Preview
6%
7%
11%
16%
20%
34%
40%
45%
57%
60%
60%
63%
66%
0% 20% 40% 60% 80% 100%
Physical safety
Political stability
National security
Environmental impact
Workforce labor displacement
Equity and fairness
Explainability
Organizational reputation
Intellectual property infringement
Inaccuracy
Personal/individual privacy
Regulatory compliance
Cybersecurity
55%
38%
53%
46%
50%
31%
26%
12%
29%
4%
9%
3%
4%
0% 20% 40% 60% 80% 100%
% of respondents % of respondents
AI risks
Considered relevant Actively mitigated
AI risks: considered relevant vs. actively mitigated, 2024
Source: McKinsey & Company Survey, 2024 | Chart: 2025 AI Index report
Figure 3.3.3
Figure 3.3.3 presents the AI-related RAI risks that
organizations consider relevant and are actively working to
mitigate. Cybersecurity (66%), regulatory compliance (63%),
and personal privacy (60%) rank as the top concerns, yet
mitigation eorts consistently fall short. Not surprisingly, in
every risk category, fewer organizations take active steps
to mitigate risks than those that recognize them as relevant.
The gap is particularly pronounced for intellectual property
infringement (57% relevant, 38% mitigated) and organizational
reputation (45% relevant, 29% mitigated). Risks related to
explainability (40%) and fairness (34%) were selected by a
smaller share of respondents, with mitigation rates dropping
further, to 31% and 26%, respectively.
3.3 RAI in Organizations and Businesses
Chapter 3: Responsible AI

177
Articial Intelligence
Index Report 2025
Table of Contents Chapter 3 Preview
5%
11%
13%
30%
42%
0% 5% 10% 15% 20% 25% 30% 35% 40%
Unknown
10+
6–9
3–5
1–2
% of respondents
Number of AI incidents
Number of AI incidents reported by organizations, 2024
Source: McKinsey & Company Survey, 2024 | Chart: 2025 AI Index report
Figure 3.3.43
Figure 3.3.5
Figure 3.3.4 and Figure 3.3.5 present data on the number of AI incidents reported by organizations over the past year. Only
8% of surveyed organizations reported experiencing AI-related incidents. Among those aected, the majority—42%—reported
encountering just one or two incidents.
3.3 RAI in Organizations and Businesses
Chapter 3: Responsible AI
8% 89% 3%
0% 10% 20% 30% 40% 50% 60% 70% 80% 90% 100
%
R
esponses
Yes No Unknown
% of respondents
Percentage of organizations that have experienced AI incidents, 2024
S
ource: McKinsey & Company Survey, 2024 | Chart: 2025 AI Index report
3 Figure 3.3.4 uses the OECD denition of an AI incident. According to the OECD, an AI incident is dened as an event, circumstance, or series of events where the development, use, or
malfunction of one or more AI systems directly or indirectly results in any of the following harms: (a) injury or harm to the health of individuals or groups; (b) disruption of the management or
operation of critical infrastructure; (c) violations of human rights or breaches of legal obligations intended to protect fundamental, labor, or intellectual property rights; or (d) harm to property,
communities, or the environment.

178
Articial Intelligence
Index Report 2025
Table of Contents Chapter 3 Preview
Impact of responsible AI policies in organizations, 2024
Source: McKinsey & Company Survey, 2024 | Chart: 2025 AI Index report
Figure 3.3.64
When asked about the impact RAI policies have had in their organizations, 42% reported improving business operations, such as
improving eciency and lowering costs, and 34% reported increasing customer trust (Figure 3.3.6). Only 17% of organizations
feel that the results have had no signicant impact.
3.3 RAI in Organizations and Businesses
Chapter 3: Responsible AI
4 Data for respondents who selected “have not implemented” is excluded. Percentages are based only on those who chose at least one other answer. The “None” response option is not shown.

179
Articial Intelligence
Index Report 2025
Table of Contents Chapter 3 Preview
2%
3%
16%
22%
32%
40%
45%
51%
0% 5% 10% 15% 20% 25% 30% 35% 40% 45% 50%
Other
None
Lack of executive support
Organizational resistance
Technical limitations
Regulatory uncertainty
Resource or budget constraints
Knowledge and training gaps
% of respondents
Main obstacles to the implementation of responsible AI measures, 2024
Source: McKinsey & Company Survey, 2024 | Chart: 2025 AI Index report
Figure 3.3.75
Figure 3.3.7 reports the main obstacles organizations noted
to implementing RAI measures. Respondents primarily cited
knowledge and training gaps (51%), resource or budget
constraints (45%), and regulatory uncertainty (40%) as
key challenges. Encouragingly, only 16% reported a lack of
executive support as a barrier, suggesting that leadership
buy-in is not a major impediment to RAI adoption.
3.3 RAI in Organizations and Businesses
Chapter 3: Responsible AI
5 The “Unknown” response option was not shown in this visualization.

180
Articial Intelligence
Index Report 2025
Table of Contents Chapter 3 Preview
17%
19%
21%
41%
65%
0% 5% 10% 15% 20% 25% 30% 35% 40% 45% 50% 55% 60% 65%
None of the these/no change
US Presidential
Executive Order on AI
OECD AI Principles
EU AI Act
EU General Data Protection
Regulation (GDPR)
% of organizations
Percentage of organizations inuenced by AI regulations in responsible AI decision making
Source: McKinsey & Company Survey, 2024 | Chart: 2025 AI Index report
Figure 3.3.8 shows the proportion of organizations
inuenced by specic AI regulations in their RAI decision
making. Among surveyed organizations, 65% report being
inuenced by the EU General Data Protection Regulation
(GDPR), while 41% cite the EU AI Act. Smaller proportions
indicate inuence from the OECD AI Principles (21%) and
President Biden’s Executive Order on AI.
Figure 3.3.8
3.3 RAI in Organizations and Businesses
Chapter 3: Responsible AI

181
Articial Intelligence
Index Report 2025
Table of Contents Chapter 3 Preview
Highlight:
Longitudinal Perspective
3.3 RAI in Organizations and Businesses
Chapter 3: Responsible AI
In collaboration with Accenture, this year a team of
Stanford researchers ran the Global State of Responsible
AI survey, the second iteration of the inaugural survey
launched in 2024. Responses from 1,500 organizations,
each with revenues of at least $500 million, were collected
from 20 countries and 19 industries in January–February
2025.6 The objective of the survey was to gain an
understanding of the challenges of adopting RAI principles
and practices and to provide a comparison of RAI activities
across 10 dimensions over time. Because the RAI survey
was conducted in both 2024 and 2025, the data enables
a comparison of how organizational perspectives on RAI
adoption have evolved over time.
Figure 3.3.9 presents the types of incidents reported by
organizations in the RAI survey. The most common issues—
adversarial attacks and privacy violations—underscore
the urgent need for organizations to prioritize AI system
security and robust data governance. Additionally, with
51% of respondents reporting unintended decision making
and 47% citing model bias, there is ample evidence that
many organizations are struggling to anticipate and control
AI behavior—an especially troubling challenge in high-
stakes environments.
6 Details about the survey methodology can be found in Reuel et al. (2024).
46%
47%
51%
55%
56%
0% 10% 20% 30% 40% 50%
Performance failure
Model bias
Unintended decision making
Privacy violation
Adversarial attack
% of respondents
Incident type
AI-related types of incidents reported by organizations in the past two years
Source: Accenture/Stanford Joint Survey, 2025 | Chart: 2025 AI Index report
Figure 3.3.9

182
Articial Intelligence
Index Report 2025
Table of Contents Chapter 3 Preview
Highlight:
Longitudinal Perspective (cont’d)
3.3 RAI in Organizations and Businesses
Chapter 3: Responsible AI
Given their AI adoption strategy—whether, for instance,
they develop, deploy, or use generative or nongenerative
AI—respondents were asked which risks were relevant
to their organization. They were presented with a list of
14 risks and could select all that applied to them (Figure
3.3.10).7 Companies have grown signicantly more
concerned in recent years about certain risks—most
notably, nancial risks (+38 percentage points), brand and
reputational risks (+16), privacy and data-related risks (+15),
and reliability risks (+14). Conversely, some risks are now
considered less pressing, including societal risks (-7) and
socio-environmental risks (-8).
7 The full list of risks can be found in the corresponding paper.
30%
33%
34%
29%
35%
26%
12%
47%
29%
45%
51%
22%
26%
32%
35%
40%
42%
50%
52%
56%
59%
65%
0% 10% 20% 30% 40% 50% 60%
Socio-environmental risks (e.g., high
carbon footprint of systems, regional pollution)
Societal risks (e.g., threats to political
stability, national security concerns)
Client/customer risks (e.g., loss of trust,
market share, or customer satisfaction)
Diversity and nondiscrimination risks (e.g.,
fairness concerns, toxicity, discrimination,
and stereotype reproduction)
Human interaction risks (e.g., misuse by users
for the generation of deepfakes or misinformation,
overreliance of users on AI models/systems, or
physical/mental harm due to model/system usage)
Brand/reputational risks (e.g.,
damage caused to brand by AI-related incident)
Financial risks (e.g., lack of AI-related
ROI, AI-related nancial loss)
Security risks (e.g., adversarial attacks,
model theft)
Compliance and lawfulness risks (e.g.,
IP or copyright violations)
Reliability risks (e.g., output errors,
hallucinations)
Privacy and data-related risks (e.g.,
reidentication of anonymized data,
data leakage, use of data without
consent)
2025
2024
% of respondents
Risk category
Relevance of selected responsible AI risks for organizations, 2024 vs. 2025
Source: Accenture/Stanford Joint Survey, 2025 | Chart: 2025 AI Index report
Figure 3.3.10

183
Articial Intelligence
Index Report 2025
Table of Contents Chapter 3 Preview
Highlight:
Longitudinal Perspective (cont’d)
3.3 RAI in Organizations and Businesses
Chapter 3: Responsible AI
The denitions of organizational and operational
maturity are highlighted in Figure 3.3.11. Between
2024 and 2025, organizational RAI maturity
advanced notably, with more companies
securing CEO support for RAI initiatives and
improving AI risk identication, monitoring,
and control—signaling a stronger recognition
of RAI’s strategic importance (Figure 3.3.12).8 In
contrast, operational RAI maturity—focused on
practical, system-level safeguards such as bias
reduction, adversarial testing, and environmental
impact measurement—lagged behind (Figure
3.3.13). This gap highlights a disconnect between
high-level RAI commitments and their technical
implementation. While organizations are
increasingly equipped and motivated to embed
RAI into processes and policies, translating that
intent into eective system-level risk mitigation
remains a persistent challenge
8 Organizational and operational RAI maturity were calculated as dened in Reuel et al. (2024).
0 25 50 75 100
0%
2%
4%
6%
8%
10%
12%
14%
16%
18%
2025
2024
Maturity score
% of organizations
Organizational responsible AI maturity distribution,
Source: Accenture/Stanford Joint Survey, 2025 | Chart: 2025 AI Index report
2024 vs. 2025
0 25 50 75 100
0%
2%
4%
6%
8%
10%
12%
14%
2025
2024
Maturity score
% of organizations
Operational responsible AI maturity distribution,
Source: Accenture/Stanford Joint Survey, 2025 | Chart: 2025 AI Index report
2024 vs. 2025
Figure 3.3.11
Figure 3.3.12 Figure 3.3.13
Organizational and operational maturity model
Source: Reuel et al., 2024

184
Articial Intelligence
Index Report 2025
Table of Contents Chapter 3 Preview
Highlight:
Longitudinal Perspective (cont’d)
3.3 RAI in Organizations and Businesses
Chapter 3: Responsible AI
Respondents were also asked about their organization’s
attitudes and philosophies toward RAI, including views on
risk ownership, model preferences, and policy positions
(Figure 3.3.14). Across nearly all statements, responses
were fairly evenly split, even on high-prole issues such
as the safety of open- versus closed-weight models, and
whether responsibility for risk mitigation lies with model
providers or users. This broad distribution suggests that
industry lacks a unied strategic direction on RAI—likely
a reection of ongoing debates and unresolved questions
among experts. The one clear exception is the trade-o
between safety and innovation: 64% of respondents lean
toward a safety-rst approach, and yet 58% are exploring
minimally supervised agents, which may introduce
signicant risks—particularly given the current limitations
in RAI maturity.
13%
17%
18%
20%
18%
21%
23%
28%
37%
33%
32%
37%
30%
33%
30%
31%
29%
29%
34%
21%
16%
16%
21%
13%
0% 20% 40% 60% 80% 100%
“Actively exploring minimally supervised AI agents”/
“Agents are currently too risky for large-scale adoption”
“Closed-source models are safer”/
“Open-source models are safer”
“GenAI risks are the responsibility of foundation model providers”/
“GenAI risks are the responsibility of GenAI users”
“RAI risks are industry-specic”/
“RAI risks are industry-agnostic”
“Responsible AI is a compliance issue”/
“Responsible AI is a value driver for unlocking potential”
“Innovate rst, regulate later”/
“Safety rst, prevent future potential risks”
Aligns completely with the rst statement
Aligns somewhat with the rst statement
Aligns somewhat with the second statement
Aligns completely with the second statement
% of respondents
Statement pair
Organizational attitudes and philosophies surrounding responsible AI
Source: Accenture/Stanford Joint Survey, 2025 | Chart: 2025 AI Index report
Figure 3.3.14

185
Articial Intelligence
Index Report 2025
Table of Contents Chapter 3 Preview
3.4 RAI in Academia
For this year’s report, the AI Index analyzed the number of
responsible AI-related papers accepted at six leading AI
conferences: AAAI, AIES, FAccT, ICML, ICLR, and NeurIPS.
While these conferences do not represent all responsible AI
research globally, they provide insight into publication trends
among AI academics. This section presents aggregate trends
in AI publications, with subsequent sections breaking them
down by RAI subtopics. In order to identify RAI papers, the AI
Index selected papers that contained certain RAI keywords.9
Aggregate Trends
The number of RAI papers accepted at leading AI conferences
rose by 28.8%, from 992 in 2023 to 1,278 in 2024 (Figure
3.4.1).
Figure 3.4.1
329
489
644
696
992
1,278
2019 2020 2021 2022 2023 2024
0
200
400
600
800
1,000
1,200
Number of RAI papers
Number of responsible AI papers accepted at select AI conferences, 2019–24
Source: AI Index, 2025 | Chart: 2025 AI Index report
3.4 RAI in Academia
Chapter 3: Responsible AI
9 A full methodological description of this approach can be found in the Appendix.

186
Articial Intelligence
Index Report 2025
Table of Contents Chapter 3 Preview
Proportionally, the conferences with the highest share of
accepted RAI papers relative to total submissions were FAccT
(69.14%) and AIES (63.33%) (Figure 3.4.2). This aligns with
their focus: FAccT is dedicated to fairness, accountability, and
transparency, while AIES centers on AI ethics and society. At
NeurIPS, the proportion decreased from 13.8% in 2023 to
9.0% in 2024, while at ICML, it rose from 3.4% to 8.2% over
the same period.
Figure 3.4.2
2019 2020 2021 2022 2023 2024
0%
10%
20%
30%
40%
50%
60%
70%
RAI papers (% of total)
7.56%, ICLR
8.24%, ICML
9.02%, NeurIPS
13.36%, AAAI
63.33%, AIES
69.14%, FAccT
Responsible AI papers accepted (% of total) at select AI conferences by conference, 2019–24
Source: AI Index, 2025 | Chart: 2025 AI Index report
3.4 RAI in Academia
Chapter 3: Responsible AI

187
Articial Intelligence
Index Report 2025
Table of Contents Chapter 3 Preview
1–10
11–50
51–150
151–500
501–2,000
2,001–3,200
Number of responsible AI papers accepted at select AI conferences by geographic area, 2019–24 (sum)
S
ource: AI Index, 2025 | Chart: 2025 AI Index report
Figures 3.4.3 through 3.4.5 examine the geographic aliation
of RAI papers, highlighting where these papers originate.
In 2024, the United States led in RAI paper submissions
with 669, followed by China with 268 and Germany with
80. Across major geographic regions, RAI has become
an increasingly signicant academic focus. Since 2019,
the overall geographic distribution of RAI publications
has remained relatively consistent, with the United States
accounting for the most (3,158), followed by China (1,100) and
the United Kingdom (485).
Figure 3.4.3
Figure 3.4.5
Figure 3.4.3 Figure 3.4.4
31
36
39
42
46
55
67
80
268
669
0 200 400 600
Netherlands
Japan
Singapore
India
Hong Kong
Canada
United Kingdom
Germany
China
United States
Number of RAI papers
Number of responsible AI papers accepted at select
AI conferences by geographic area, 2024
Source: AI Index, 2025 | Chart: 2025 AI Index report
2019 2020 2021 2022 2023 2024
100
200
300
400
500
600
700
Number of RAI papers
268, China
298, Europe
669, United States
Number of responsible AI papers accepted at select
AI conferences by select geographic area, 2019–24
Source: AI Index, 2025 | Chart: 2025 AI Index report
3.4 RAI in Academia
Chapter 3: Responsible AI

188
Articial Intelligence
Index Report 2025
Table of Contents Chapter 3 Preview
32
97 105
48
160
71
12
17
15
43
21
21
15
13
18
36
39
124
150
92
213
186
2019 2020 2021 2022 2023 2024
0
50
100
150
200
NeurIPS ICML ICLR FAccT AIES AAAI
Number of AI privacy and data governance papers
AI privacy and data governance papers accepted at select AI conferences, 2019–24
Source: AI Index, 2025 | Chart: 2025 AI Index report
Topic Area
This section examines trends in RAI publications spanning key
topics: privacy and data governance, fairness, transparency
and explainability, and security and safety.
Over the past year, the number of accepted papers on privacy
and data governance topics decreased by 14.5% at select AI
conferences (Figure 3.4.6). Since 2019, this gure has risen
nearly vefold.
Figure 3.4.610
3.4 RAI in Academia
Chapter 3: Responsible AI
10 These gures likely underestimate the total number of AI privacy papers, as some are published in AI-focused conferences dedicated to privacy, such as the 46th IEEE Symposium on
Security and Privacy.

189
Articial Intelligence
Index Report 2025
Table of Contents Chapter 3 Preview
29 34 46
83
44
27
50
36
39
75
65
83
27
33
48
27
38
29
36
100
57
98
150
169
212
408
2019 2020 2021 2022 2023 2024
0
50
100
150
200
250
300
350
400
NeurIPS ICML ICLR FAccT AIES AAAI
Number of AI fairness and bias papers
AI fairness and bias papers accepted at select AI conferences, 2019–24
Source: AI Index, 2025 | Chart: 2025 AI Index report
In 2024, the number of fairness and bias papers accepted at select AI conferences saw a signicant increase, reaching 408—
roughly two times the 2023 gure (Figure 3.4.7). This growth highlights the increasing academic interest in fairness and bias
among researchers.
Figure 3.4.7
3.4 RAI in Academia
Chapter 3: Responsible AI

190
Articial Intelligence
Index Report 2025
Table of Contents Chapter 3 Preview
39 54 63
89
183
83
24
44
54
30
25
56
35
42
46
50
35
48
44
54
98
89
134
189
231
393
355
2019 2020 2021 2022 2023 2024
0
50
100
150
200
250
300
350
400
NeurIPS ICML ICLR FAccT AIES AAAI
Number of AI transparency and explainability papers
AI transparency and explainability papers accepted at select AI conferences, 2019–24
Source: AI Index, 2025 | Chart: 2025 AI Index report
Since 2019, the number of papers on transparency and explainability submitted to major academic conferences has increased by
a factor of four. In 2024, there were 355 transparency and explainability–related submissions at academic conferences including
AAAI, FAccT, AIES, ICML, ICLR, and NeurIPS (Figure 3.4.8).
Figure 3.4.8
3.4 RAI in Academia
Chapter 3: Responsible AI

191
Articial Intelligence
Index Report 2025
Table of Contents Chapter 3 Preview
The number of security and safety submissions to select AI conferences has sharply increased, almost doubling in the past
year—from 276 to 521 (Figure 3.4.9). This growth reects the increasing prominence of security and safety as a key focus for
responsible AI researchers.
71 43
152
88
177
33
37
41
100
32
41
51
77
79
33 65
75
64
78
120
162 168
215
285 276
521
2019 2020 2021 2022 2023 2024
0
100
200
300
400
500
NeurIPS ICML ICLR FAccT AIES AAAI
Number of AI security and safety papers
AI security and safety papers accepted at select AI conferences, 2019–24
Source: AI Index, 2025 | Chart: 2025 AI Index report
Figure 3.4.9
3.4 RAI in Academia
Chapter 3: Responsible AI

192
Articial Intelligence
Index Report 2025
Table of Contents Chapter 3 Preview
3.5 RAI Policymaking
While 2023 and early 2024 saw a proliferation of national
AI strategies and regulatory approaches, a notable trend in
2024 was the increased global cooperation on AI governance,
especially around legislating principles pertaining to responsible
AI. International bodies and multilateral agreements have
sought to establish global frameworks for responsible and
ethical AI. These eorts signal a shift toward coordinated
global action rather than isolated national initiatives. Figure
3.5.1 highlights several signicant international policymaking
initiatives or dialogues on RAI that were recently launched.11
3.5 RAI Policymaking
Chapter 3: Responsible AI
11 While AI policymaking is the focus of Chapter 6: Policy and Governance, the AI Index highlights key RAI-related policymaking events here due to their recent signicance.
Date Stakeholders Scope Description
May 2024 OECD Global The OECD updated its AI principles and rened its framework to reect the latest
advancements in AI governance. These principles emphasized building AI systems that take
into account inclusive growth, transparency, and explainability, as well as respect for the rule
of law, human rights, and democratic values.
May 2024 Council of
Europe
Europe The Council of Europe adopted a legally binding AI treaty (The Council of Europe Framework
Convention on Articial Intelligence and Human Rights, Democracy, and the Rule of Law). This
treaty was drafted to ensure that the activities within the life cycle of AI systems completely
align with human rights, democracy, and the rule of law.
Jun 2024 European Union Europe The EU passed the AI Act (EU AI Act), the rst comprehensive regulatory framework for AI
in a major global economy. The act categorizes AI by risk, regulating them accordingly and
ensuring that providers—or developers—of high-risk systems bear most of the obligations.
Jul 2024 African Union Africa The African Union launched its Continental AI Strategy (AU AI Strategy), outlining a unied
vision for AI development, ethics, and governance across the continent. The strategy
emphasizes the ethical, responsible, and equitable development of AI within Africa.
Sep 2024 United Nations Global The United Nations updated its Governing AI for Humanity report (U.N. AI Advisory Body),
outlining eorts to establish global AI governance mechanisms. The report recommends
developing a blueprint to address AI-related risks and calls on national and international
standards organizations, technology companies, civil society, and policymakers to collaborate
on AI standards.
Oct 2024 G7 Global The G7 Digital Competition Communiqué (G7 AI Cooperation) rearmed commitments to
fair and open AI markets, stressing the need for coordinated regulatory approaches. Previous
discussions focused on competition and the regulatory challenges posed by AI’s rapid growth.
Oct 2024 ASEAN and US Asia
and US
Following the 12th ASEAN-United States Summit, ASEAN-U.S. leaders issued a statement
on promoting safe, secure, and trustworthy AI. They committed to cooperating on the
development of international AI governance frameworks and standards to advance these goals.
Nov 2024 International
Network of AI
Safety Institutes
Global The rst International Network of AI Safety Institutes was established, bringing together
nine countries and the EU to formalize global AI safety cooperation. The network unites
technical organizations committed to advancing AI safety, helping governments and societies
understand the risks of advanced AI systems, and proposing solutions.
Feb 2025 Arab League Arab
Nations
The Arab Dialogue Circle on “Articial Intelligence in the Arab World: Innovative
Applications and Ethical Challenges” launched at the Arab League headquarters, focusing on
AI innovations while placing a strong emphasis on ethical considerations.
Figure 3.5.1
Notable RAI policymaking milestones
Source: AI Index, 2025

193
Articial Intelligence
Index Report 2025
Table of Contents Chapter 3 Preview
193
2,030
843
651
1,279
2,438
00 1
2,404
484
828
45
367
75
3,230
Academic-only Commercial Noncommercial Unspecied
0
500
1,000
1,500
2,000
2,500
3,000
Data Provenance GitHub Hugging Face Papers with Code
License category
Number of datasets
Accuracy of dataset license classications by select aggregators
Source: Longpre et al., 2025 | Chart: 2025 AI Index report
3.6 Privacy and Data Governance
A comprehensive denition of privacy is dicult and context-
dependent. For the purposes of this report, the AI Index denes
privacy as an individual’s right to the condentiality, anonymity,
and protection of their personal data, along with their right
to consent to and be informed about if and how their data is
used. Privacy further includes an organization’s responsibility
to ensure these rights if they collect, store, or use personal
data (directly or indirectly). Moreover, individuals should have
the right to correct their sensitive information if organizations
or governments have misrepresented this information. In
AI, this involves ensuring that personal data is handled in a
way that respects individual privacy rights—for example, by
implementing measures to protect sensitive information from
exposure, and ensuring that data collection and processing are
transparent and compliant with privacy laws like GDPR.
Data governance, on the other hand, encompasses policies,
procedures, and standards established by an organization
to ensure the quality, security, and ethical use of data within
and outside of the organization where it was created. Data
governance policies may also cover data acquired from
external sources. In the context of AI, data governance is
important for ensuring that the data used for training and
operating AI systems is accurate, fair, and used responsibly
and with consent. This is especially the case with sensitive or
personally identiable information (PII).
Featured Research
This section highlights signicant recent research on privacy
and data governance, including studies on auditing dataset
licensing and attribution, as well as research on stricter data
consent protocols.
Large-Scale Audit of Dataset Licensing and
Attribution in AI
Current foundation models are being trained on massive
amounts of data. A team of researchers conducted a large-
scale audit of over 1,800 text datasets widely used for training
such models and uncovered systemic issues in dataset
licensing and attribution. The researchers found that more
than 70% of datasets on popular dataset hosting sites lacked
adequate license information, while 50% of the licenses were
3.6 Privacy and Data Governance
Chapter 3: Responsible AI
Figure 3.6.1

194
Articial Intelligence
Index Report 2025
Table of Contents Chapter 3 Preview
miscategorized, which poses risks for the responsible usage of
that data. Figure 3.6.1 provides a detailed visualization of the
researchers’ ndings. Specically, they assigned license labels
to datasets across four categories: commercial, unspecied,
noncommercial, and academic-only. They then compared
their classications with those from popular sources such as
GitHub, Papers with Code, and Hugging Face. Oftentimes,
the data license attributions assigned by the data provenance
team diered sharply from those issued by other organizations.
License misattribution in datasets is signicant because it
creates legal and ethical risks in AI development. If datasets
used to train foundation models are mislabeled or misattributed,
AI developers may unknowingly violate copyright laws, data
usage policies, or privacy regulations. This can lead to legal
liabilities, challenges in ensuring fair compensation for data
creators, and potential biases in models due to the exclusion
of properly licensed data. Additionally, unclear licensing can
hinder transparency, accountability, and reproducibility in
AI research, which can make it dicult for researchers and
organizations to verify or audit model training data. Based
on their ndings, the authors highlight the need for clear
documentation, improved standards, and responsible licensing
practices to foster inclusivity and mitigate risks that stem from
irresponsible or unlawful data uses in AI development and
deployment.
Data Consent in Crisis
AI models rely heavily on massive, publicly available web data
for training. A recent study conducted a longitudinal audit
of consent protocols for web domains used in AI training
datasets, including C4, RenedWeb, and Dolma, analyzing
14,000 web domains. These consent protocols dene the
permissibility of data scraping for AI model training.
The researchers observed a signicant increase in data use
restrictions between 2023 and 2024, as many websites
implemented new protocols to limit data scraping for AI
training. These restrictions were primarily enforced through
updates to robots.txt les and terms of service, explicitly
prohibiting AI training use. Figure 3.6.2 shows the proportion
of websites with robots.txt restrictions, terms-of-service
restrictions, and organizational restrictions over time.12 For
example, the proportion of tokens in the top C4 web domains
with full restrictions increased from 10% in 2017 to 48% in
2024. Between 2023 and 2024 alone, this proportion rose by
25 percentage points. Figure 3.6.3 visualizes the percentage
of tokens in the top web domains of C4 by terms-of-service
restriction category from 2016 to 2024. This diminishing
consent is likely related to legal issues around fair use, such
as the New York Times lawsuit against OpenAI.
OpenAI’s crawlers encounter the highest level of restrictions,
while smaller developers face fewer barriers. The authors
highlight inconsistencies in enforcement, driven by ineective
signaling mechanisms like robots.txt and mismatches between
stated and enforced policies. These ndings highlight the
need for updated consent protocols that address AI-specic
challenges. Additionally, the study suggests a decline in publicly
available web data for AI training, with potential consequences
for data diversity, model alignment, and scalability. Many recent
AI performance gains stem from training on increasingly large
datasets. If websites become signicantly more restrictive, it
could hinder future model scaling.
3.6 Privacy and Data Governance
Chapter 3: Responsible AI
12 A robots.txt restriction refers to a rule set in a website’s robots.txt le that instructs web crawlers (such as search engine bots or AI data scrapers) on which parts of the site they are allowed
or forbidden to access.

195
Articial Intelligence
Index Report 2025
Table of Contents Chapter 3 Preview
3.6 Privacy and Data Governance
Chapter 3: Responsible AI
6% 8%
41% 44% 39% 43% 41% 42% 41% 36% 36%
12% 14%
12%
16% 11% 12% 14% 14% 12%
39% 36% 40% 35%
41% 39% 39% 38% 36%
2016 2017 2018 2019 2020 2021 2022 2023 2024
0%
10%
20%
30%
40%
50%
60%
70%
80%
90%
100%
No scraping and AI No scraping Noncommercial use only Noncompete No redistribution Unrestricted use
% of tokens
Percentage of tokens in the top web domains of C4 by terms of service restriction category, 2016–24
Source: Longpre et al., 2025 | Chart: 2025 AI Index report
Figure 3.6.3
12% 10% 9% 10% 10% 11% 12%
23%
48%
27% 27% 29% 29% 31% 30% 30%
27%
15%
5%
7% 7% 7% 7% 7% 7%
7%
6%
47% 47% 46% 44% 44% 44% 43%
36%
25%
2016 2017 2018 2019 2020 2021 2022 2023 2024
0%
10%
20%
30%
40%
50%
60%
70%
80%
90%
100%
Full restrictions Pattern-based restrictions Disallow private directories Other restrictions
Crawl delay specied Sitemap provided No restrictions or sitemap
% of tokens
Percentage of tokens in the top web domains of C4 by robots.txt restriction category, 2016–24
Source: Longpre et al., 2025 | Chart: 2025 AI Index report
Figure 3.6.2

196
Articial Intelligence
Index Report 2025
Table of Contents Chapter 3 Preview
3.7 Fairness and Bias
Featured Research
This section highlights research on the impact of racial
classication in multimodal models and the measurement of
implicit bias in explicitly unbiased LLMs.
Racial Classication in Multimodal Models
Recently, researchers have explored how dataset scaling
aects racial and gender biases in vision-language models
(VLMs). Evaluating 14 VLMs trained on LAION-400M and
LAION-2B (popular datasets for training vision-language
models) using the Chicago Face Dataset (CFD), the study
found that while models trained on larger datasets improve
human classication—reducing misidentication of
nonhuman entities like gorillas or orangutans—they also
amplify racial biases, especially in larger models. For instance,
in the larger ViT-L models, Black and Latino men were
disproportionately classied as criminals, with classication
probabilities increasing by up to 69% as dataset size grew
from 400 million to 2 billion samples. Figure 3.7.1 displays
various images alongside the model’s classication scores
for whether a face was identied as a criminal.
Figure 3.7.2 illustrates how the probability of a face being
assigned a specic label (such as animal or criminal) changes
by demographic group across various models (the smaller
ViT-B-16 and ViT-B-32 with the larger ViT-L-14) as the
pretrained dataset scales from 400 million to 2 billion images.
A higher percentage indicates a greater likelihood of a
demographic group being associated with a particular label,
3.7 Fairness and Bias
Chapter 3: Responsible AI
Fairness in AI emphasizes developing systems that are
equitable and avoid perpetuating bias or discrimination
against any individual or group. It involves considering the
diverse needs and circumstances of all stakeholders impacted
by AI use. Fairness extends beyond a technical concept and
embodies broader social standards related to equity.
Faces and their likelihood of being classied as “criminal” by model and dataset sizes
Source: Birhane et al., 2024
Figure 3.7.1

197
Articial Intelligence
Index Report 2025
Table of Contents Chapter 3 Preview
while a lower percentage signies a lesser likelihood. In the
larger model, ViT-L, increasing the training data consistently
raises the likelihood of an image being classied as a criminal.
This nding is signicant, as many model developers have
sought to aggressively scale their models in an attempt to drive
performance improvements. The researchers suggest that
when it comes to vision models, scaling may also introduce
other unintended bias problems. The authors suggest that
stereotypes in the training data may explain these results.
To address this bias, they advocate for transparent dataset
curation, detailed hyperparameter documentation, and open
access for independent audits.
Figure 3.7.213
3.7 Fairness and Bias
Chapter 3: Responsible AI
13 The y-axis labels represent dierent ethnic groups: Black male (BM), Black female (BF), Latino male (LM), Latina female (LF), white male (WM), white female (WF), Asian male (AM), and
Asian female (AF).

198
Articial Intelligence
Index Report 2025
Table of Contents Chapter 3 Preview
Measuring Implicit Bias in Explicitly Unbiased LLMs
In 2024, a team of researchers investigated implicit biases in
LLMs, particularly in those explicitly designed to be unbiased.
This research is important, as eorts to mitigate bias in LLMs
may still not suciently solve issues of implicit bias. Figure
3.7.3 illustrates an example of this phenomenon.
The study’s authors make two key contributions. First, they
introduce two new methods for detecting bias in LLMs: LLM
Implicit Bias, which identies subtle biases by analyzing
automatic associations between words or concepts, and
LLM Decision Bias, which captures model behaviors that
reect these implicit biases. Second, they investigate relative
discriminatory patterns in decision-making tasks. Applying
their methods to eight notable models—including GPT-4 and
Claude 3 Sonnet—across 21 stereotype categories (e.g., race,
gender, religion, and health), they uncover systemic implicit
biases that align with societal stereotypes. Figure 3.7.4 presents
the implicit bias scores of various LLMs across dierent
stereotype categories.14 A score signicantly above or below
50% indicates a bias toward or against a particular group.
Figure 3.7.4 suggests that LLMs disproportionately associate
negative terms with Black individuals and are more likely
to associate women with humanities over STEM elds.
The research also nds that LLMs favor men for leadership
roles, reinforcing gender biases in decision-making contexts.
Additionally, the study reveals that as models scale, implicit
biases increase, though decision bias and rejection rates
do not. This nding is signicant, as it indicates that while
bias appears to have decreased on standard benchmarks—
creating an illusion of neutrality—implicit biases remain
pervasive, potentially leading to subtle yet meaningful
discriminatory outputs.
3.7 Fairness and Bias
Chapter 3: Responsible AI
Example of implicit bias in LLMs
Source: Bai et al., 2024
Figure 3.7.3
14 This research examines both implicit and decision bias; however, only implicit bias is documented here for concision. Decision bias, for reference, is dened as a model’s bias relative to an
unbiased baseline of 50%.

199
Articial Intelligence
Index Report 2025
Table of Contents Chapter 3 Preview
racism
guilt
skin tone
weapon
black
hispanic
asian
arab
english
career
science
power
sexuality
islam
judaism
buddhism
disability
weight
age
mental ill
eating
−1.00
−0.50
0.00
0.50
1.00
racism
guilt
skin tone
weapon
black
hispanic
asian
arab
english
career
science
power
sexuality
islam
judaism
buddhism
disability
weight
age
mental ill
eating
−1.00
−0.50
0.00
0.50
1.00
racism
guilt
skin tone
weapon
black
hispanic
asian
arab
english
career
science
power
sexuality
islam
judaism
buddhism
disability
weight
age
mental ill
eating
−1.00
−0.50
0.00
0.50
1.00
racism
guilt
skin tone
weapon
black
hispanic
asian
arab
english
career
science
power
sexuality
islam
judaism
buddhism
disability
weight
age
mental ill
eating
−1.00
−0.50
0.00
0.50
1.00
racism
guilt
skin tone
weapon
black
hispanic
asian
arab
english
career
science
power
sexuality
islam
judaism
buddhism
disability
weight
age
mental ill
eating
−1.00
−0.50
0.00
0.50
1.00
racism
guilt
skin tone
weapon
black
hispanic
asian
arab
english
career
science
power
sexuality
islam
judaism
buddhism
disability
weight
age
mental ill
eating
−1.00
−0.50
0.00
0.50
1.00
racism
guilt
skin tone
weapon
black
hispanic
asian
arab
english
career
science
power
sexuality
islam
judaism
buddhism
disability
weight
age
mental ill
eating
−1.00
−0.50
0.00
0.50
1.00
racism
guilt
skin tone
weapon
black
hispanic
asian
arab
english
career
science
power
sexuality
islam
judaism
buddhism
disability
weight
age
mental ill
eating
−1.00
−0.50
0.00
0.50
1.00
Race Gender Religion Health
Implicit bias
Implicit bias
Implicit bias
Implicit bias
Implicit bias
Implicit bias
Implicit bias
Implicit bias
GPT-4 GPT-3.5 Turbo
Claude 3 Opus Claude 3 Sonnet
Llama 2 Chat 70B Llama 2 Chat 13B
Llama 2 Chat 7B Alpaca 7B
LLMs implicit bias across stereotypes in four social categories
Source: Bai et al., 2024 | Chart: 2025 AI Index report
3.7 Fairness and Bias
Chapter 3: Responsible AI
Figure 3.7.4

200
Articial Intelligence
Index Report 2025
Table of Contents Chapter 3 Preview
Transparency in AI encompasses several
aspects. Data and model transparency
involve the open sharing of development
choices, including data sources and
algorithmic decisions. Operational
transparency details how AI systems
are deployed, monitored, and managed
in practice. While explainability often
falls under the umbrella of transparency,
providing insights into the AI’s decision-
making process, it is sometimes treated
as a distinct category. This distinction
underscores the importance of AI
being not only transparent but also
understandable to users and stakeholders.
For the purposes of this chapter, the
AI Index includes explainability within
transparency, dening it as the capacity to
comprehend and articulate the rationale
behind AI decisions.
3.8 Transparency and
Explainability
Featured Research
Foundation Model Transparency Index v1.1
The Foundation Model Transparency Index v1.1 is the second iteration of a Stanford-
led project tracking transparency in model development and deployment. It
evaluates major AI model developers across three dimensions: upstream, covering
components like data and compute used for training; the model itself, referring to
the core AI system; and downstream, encompassing applications and deployments.
The latest edition reports a notable rise in transparency among foundation model
developers over six months. Figure 3.8.1 reports the FMTI scores for major model
developers in the May 2024 release of the index, and Figure 3.8.2 reports scores
across major dimensions of transparency for each developer.
3.8 Transparency and Explainability
Chapter 3: Responsible AI
0 10 20 30 40 50 60 70 80 90 100
Fuyu-8B
Titan Text Express
Gemini 1.0 Ultra
GPT-4
Claude 3
Mistral 7B
Palmyra-X
Stable Video Diusion
Llama 2
Phi-2
Granite
Jurassic-2
Luminous
StarCoder
Upstream
Model
Downstream
Score
33
42
47
49
51
55
56
58
60
62
64
75
75
85
Foundation Model Transparency Index Scores by Domain, May 2024
Source: May 2024 Foundation Model Transparency Index
Figure 3.8.1

201
Articial Intelligence
Index Report 2025
Table of Contents Chapter 3 Preview
Compared to the inaugural v1.0 index from October 2023,
which recorded an average transparency score of 37 out of
100, v1.1 saw scores increase to 58 out of 100, largely due
to developers disclosing previously nonpublic data through
submitted reports. Developers improved their scores across
89 of 100 transparency indicators, yet signicant opacity
remains in areas such as data access, copyright status, and
downstream impact. Open-source developers outperformed
closed-source counterparts on upstream transparency,
particularly in data and labor disclosures. Projects like
the FMTI are valuable in that they provide a longitudinal
perspective on the state of transparency in the AI ecosystem.
At the moment, the ndings suggest that transparency is
improving.
0% 60% 40% 0% 10% 100% 0% 60% 40% 40% 20% 20% 40% 50%
0% 43% 71% 14% 14% 100% 29% 43% 29% 100% 100% 14% 100% 43%
14% 86% 100% 0% 14% 100% 14% 100% 71% 57% 14% 14% 43% 86%
0% 100% 100% 50% 75% 100% 75% 100% 75% 100% 100% 50% 75% 100%
83% 100% 100% 83% 50% 100% 83% 100% 100% 100% 100% 50% 100% 100%
100% 67% 100% 67% 67% 100% 67% 67% 100% 100% 100% 67% 100% 33%
80% 80% 100% 80% 100% 100% 80% 60% 100% 100% 100% 100% 60% 100%
0% 57% 57% 43% 86% 100% 43% 71% 71% 29% 14% 57% 14% 14%
0% 40% 20% 20% 40% 0% 40% 80% 60% 0% 60% 60% 0% 20%
57% 86% 100% 57% 86% 100% 57% 86% 71% 71% 71% 71% 86% 71%
40% 100% 100% 80% 100% 100% 100% 40% 40% 100% 40% 80% 60% 80%
67% 100% 67% 67% 33% 100% 67% 67% 33% 67% 67% 33% 67% 33%
29% 29% 29% 0% 14% 14% 29% 0% 14% 0% 14% 14% 14% 14%
Fuyu-8B Jurassic-2 Luminous
Titan Text
Express Claude 3 StarCoder
Gemini 1.0
Ultra Granite Llama 2 Phi-2 Mistral 7B GPT-4
Stable Video
Diusion Palmyra-X
Impact
Feedback
Usage Policy
Distribution
Mitigations
Risks
Capabilities
Model Access
Model Basics
Methods
Compute
Labor
Data
Major Dimensions of Transparency
36% 73% 76% 43% 53% 86% 53% 67% 62% 66% 62% 49% 58% 57%Average
34%
50%
51%
79%
89%
81%
89%
47%
31%
77%
76%
62%
15%
Average
Foundation Model Transparency Index Scores by Major Dimensions of Transparency, May 2024
Source: May 2024 Foundation Model Transparency Index
Figure 3.8.215
3.8 Transparency and Explainability
Chapter 3: Responsible AI
15 Data, labor, compute, and methods were upstream indicators; model basics, access, capabilities, risks, and mitigations were model-level indicators; and distribution, usage policy,
feedback, and impact were downstream indicators.

202
Articial Intelligence
Index Report 2025
Table of Contents Chapter 3 Preview
This section explores three distinct
aspects of security and safety. First,
guaranteeing the integrity of AI systems
involves protecting components such
as algorithms, data, and infrastructure
against external threats like cyberattacks
or adversarial attacks. Second, safety
involves minimizing harms stemming from
the deliberate or inadvertent misuse of AI
systems. This includes concerns such as
the development of automated hacking
tools or the utilization of AI in cyberattacks.
Lastly, safety encompasses inherent risks
from AI systems themselves, such as
reliability concerns (e.g., hallucinations)
and potential risks posed by advanced AI
systems.
3.9 Security and Safety
Benchmarks
HELM Safety
Recently, academic institutions have taken the lead in addressing gaps in AI safety
benchmark standardization. Notably, Stanford’s Center for Research on Foundation
Models (CRFM) recently introduced HELM Safety, a benchmarking suite designed
to evaluate AI models against responsibility and safety metrics. HELM Safety
tests a wide range of recent models from nearly all major developers across
several responsible AI and safety benchmarks, including BBQ, SimpleSafetyTests,
HarmBench, AnthropicRedTeam, and XSTest.
3.9 Security and Safety
Chapter 3: Responsible AI
BBQ measures social bias related to protected classes under
U.S. antidiscrimination laws, while SimpleSafetyTests assesses
risks related to self-harm, physical harm, and child sexual abuse
material. HarmBench evaluates responses to prompts involving
harassment, chemical weapons production, and misinformation
using red-teaming techniques. AnthropicRedTeam examines
how models handle adversarial conversations designed to
test harmfulness, and XSTest measures the trade-o between
helpfulness and harmlessness by testing false refusals of
benign prompts and compliance with subtly harmful ones. By
introducing a standardized approach, HELM Safety provides a
more transparent and comparable framework for assessing AI
models’ responsible behavior.
Figure 3.9.1 presents the mean safety scores of various models
across all tested benchmarks, where a higher score indicates
a safer model. According to the benchmark, the safest model
currently is Claude 3.5 Sonnet, scoring 0.977, followed
closely by o1 at 0.976. Over time, some models appear to be
becoming safer. For example, GPT-3.5 Turbo (0613), released
in 2022, scored 0.853–0.123 points lower than OpenAI’s best-
performing model today.
0.96
GPT-3.5 Turbo (0613)
DeepSeek LLM Chat (67B)
DBRX Instruct
Mistral Instruct v0.3 (7B)
Command R
Mixtral Instruct (8×7B)
Llama 3.1 Instruct Turbo (70B)
Mixtral Instruct (8×22B)
Command R Plus
Llama 3.1 Instruct Turbo (8B)
DeepSeek v3
Claude 3 Haiku (2024-03-07)
Qwen1.5 Chat (72B)
Llama 3 Instruct (8B)
Llama 3 Instruct (70B)
Llama 3.1 Instruct Turbo (405B)
Gemini 1.5 Pro (001)
Gemini 1.5 Flash (001)
GPT-4o mini (2024-07-18)
Qwen2 Instruct (72B)
GPT-4o (2024-05-13)
o1-mini (2024-09-12)
GPT-4 Turbo (2024-04-09)
Claude 3 Opus (2024-02-29)
o1 (2024-12-17)
Claude 3.5 Sonnet (20240620)
DeepSeek R1
o3-mini (2025-01-31)
2023 2024 2025
0
0.2
0.4
0.6
0.8
1
Mean score
HELM Safety: mean score
0.85 0.87
0.63
0.73
0.81 0.81 0.84 0.85 0.86 0.86 0.87 0.88 0.89 0.89 0.90 0.90 0.92 0.93 0.93 0.93 0.95 0.95 0.96 0.97 0.98 0.98
0.86
Source: HELM, 2025 | Chart: 2025 AI Index report
Figure 3.9.1

203
Articial Intelligence
Index Report 2025
Table of Contents Chapter 3 Preview
AIR-Bench
AIR-Bench 2024 is a new safety benchmark that aligns
AI evaluation with real-world regulatory and corporate
frameworks. It employs a four-tier taxonomy (system and
operational risks, content safety risks, societal risks, and legal
and rights risks). Among these four broad risk categories are
314 granular microrisks. The risks studied in the benchmark
are derived from eight signicant government regulations
and 16 corporate policies. As such, AIR-Bench is designed to
assess model safety through the lens of real-world AI risks
identied by businesses and government entities.
AIR-Bench evaluates models based on their refusal rates—
the frequency with which they decline to respond to a given
prompt due to safety, ethical, or compliance concerns.
Assessments of 22 leading models revealed signicant
variability, with refusal rates ranging from 91% (Anthropic’s
Claude series) to 25% (DBRX Instruct) (Figure 3.9.2). Figure
3.9.3 visualizes refusal rates across various risk categories.
The results of AIR-Bench 2024 highlight widespread
misalignment between current models and key global
regulations, such as the EU AI Act and the U.S. Executive
Order on the Safe, Secure, and Trustworthy Development
and Use of AI. While some models demonstrated strong
safeguards in areas like hate speech and child harm, broader
inconsistencies point to the need for targeted improvements,
particularly in automated decision-making contexts.
3.9 Security and Safety
Chapter 3: Responsible AI
0.25 0.29 0.32 0.35 0.39 0.41 0.44 0.44 0.45 0.49 0.51 0.53 0.54 0.56 0.58 0.62 0.62 0.62 0.64 0.64
0.71 0.72 0.75 0.79 0.80 0.83 0.83 0.84
0.91
DBRX Instruct
Command R Plus
Command R
Mistral Large 2 (2407)
Mixtral Instruct (8×7B)
DeepSeek v3
Mixtral Instruct (8×22B)
Palmyra-X-004
o1-mini (2024-09-12)
Qwen1.5 Chat (72B)
DeepSeek LLM Chat (67B)
DeepSeek R1
Yi Chat (34B)
GPT-4o mini (2024-07-18)
Gemini 1.0 Pro (002)
Qwen2 Instruct (72B)
Llama 3.1 Instruct Turbo (8B)
GPT-4o (2024-08-06)
GPT-3.5 Turbo (0301)
GPT-4 (0613)
Llama 3 Instruct (8B)
GPT-4 Turbo (2024-04-09)
o3-mini (2025-01-31)
Gemini 1.5 Flash
o1 (2024-12-17)
Claude 3 Haiku (2024-03-07)
Gemini 1.5 Pro
Claude 3 Opus (2024-02-29)
Claude 3.5 Sonnet (2024-10-22)
0.00
0.20
0.40
0.60
0.80
1.00
Model
Refusal rate
AIR-Bench: refusal rate
Source: Zeng et al., 2024 | Chart: 2025 AI Index report
Figure 3.9.2

205
Articial Intelligence
Index Report 2025
Table of Contents Chapter 3 Preview
Featured Research
Beyond Shallow Safety Alignment
In 2024, an interdisciplinary team of computer scientists
introduced the concept of shallow safety alignment—the
idea that AI systems are often trained to be safe in supercial
and ineective ways. In many cases, a model’s safeguards
are limited to its rst few words (tokens) of response. As a
result, if a user manipulates the model to start with anything
other than a standard safety warning (e.g., “Your request
violates our terms of service”), the rest of the response
becomes signicantly more vulnerable to adversarial attacks.
For example, if a user directly asks how to build a bomb,
the model will likely refuse to answer. However, if the same
request is framed in a way that induces the model to begin
its response with “Sure, here’s a detailed guide,” it is far more
likely to continue generating harmful content.
Experiments show that even minor modications can
drastically weaken a model’s safety mechanisms. For example,
simply prelling a model’s response with nonstandard text or
applying minimal ne-tuning increased harmful output rates
from 1.5% to 87.9% after just six ne-tuning steps.16 Figure 3.9.4
shows the success rate of dierent attacks on various models
based on the number of harmful tokens prelled or inserted
into the model’s inference sequence. To address this issue,
researchers proposed two key solutions: expanding training
data to include examples where the model learns to recover
from harmful responses and redirect them toward safe refusals,
and regularizing initial word choices, ensuring that even if the
model starts with an unusual response, it still maintains its
safety constraints. These techniques signicantly improved
resistance to adversarial attacks, lowering attack success rates
to as little as 2.8% in certain cases. This research highlights a
need for deeper and more resilient alignment strategies to
prevent the manipulation of AI safety mechanisms.
3.9 Security and Safety
Chapter 3: Responsible AI
0 1 2 3 4 5 6 7 8 9 10
0%
20%
40%
60%
80%
100%
Llama 2 7B (Base) Llama 2 7B Chat (Aligned) Gemma 7B (Base) Gemma 1.1. 7B IT (Aligned)
Number of prelled harmful tokens
Attack success rate
Attack success rate vs. number of prelled harmful tokens in LLMs
Source: Qi et al., 2024 | Chart: 2025 AI Index report
Figure 3.9.4
16 A ne-tuning step in AI refers to an iteration in the process of training a pretrained model on a smaller, domain-specic dataset to improve its performance on a particular task.

206
Articial Intelligence
Index Report 2025
Table of Contents Chapter 3 Preview
0.64
0.84
1.00
0.64
0.84
1.00
0.61
0.83
1.00
MMLU MT-Bench Compliance
0.00
0.20
0.40
0.60
0.80
1.00
Llama3-8B-instruct RT RT-EAT-LAT
Evaluation metric
General performance ↑
General performance on nonadversarial data
Source: Sheshadri et al., 2024 | Chart: 2025 AI Index report
Improving the Robustness to Persistently
Harmful Behaviors in LLMs
The challenge in eliminating harmful behavior in
LLMs is that traditional training methods often
teach models to conceal such behavior rather
than removing it entirely. A new approach,
targeted latent adversarial training (LAT), takes
a more precise strategy by actively exposing a
model’s weaknesses during training to make it
more robust against adversarial attacks (Figure
3.9.5). This method outperforms previous
techniques—such as R2D2—while requiring
far less computing power. For example, in
tests against jailbreaking attempts (where
users try to bypass a model’s safeguards), LAT
reduced computational costs by 700 times
while maintaining strong performance on
regular tasks. For the Llama3-8B-instruct model
family, LAT preserved strong performance on
benchmarks like MMLU while signicantly
3.9 Security and Safety
Chapter 3: Responsible AI
Targeted latent adversarial training in LLMs
Source: Sheshadri et al., 2024
Figure 3.9.5
Figure 3.9.6
reducing vulnerability to adversarial attacks (Figure 3.9.6). This nding on
eciency is important because if improving model safety requires more
computational resources while reducing performance, fewer developers
are likely to adopt these safety-improving methods.

207
Articial Intelligence
Index Report 2025
Table of Contents Chapter 3 Preview
LAT also proved eective in removing backdoor vulnerabilities,
a type of attack where an AI model is subtly modied during
training to produce unintended—and possibly malicious—
behavior when triggered by specic inputs. Notably, LAT
eliminated these vulnerabilities even without prior knowledge
of the exact trigger. Beyond security improvements, LAT
enhances the ability to erase harmful or copyrighted
knowledge from a model and prevents it from relearning
removed content. For example, LAT signicantly reduced a
model’s ability to regenerate copyrighted text (e.g., passages
from Harry Potter) and made it less likely that knowledge
would be relearned compared to baseline methods. When
applied to sensitive knowledge areas such as biological or
cybersecurity risks, LAT eectively weakened knowledge
extraction attacks while still allowing the model to correctly
respond to over 90% of safe and benign requests. Methods
like LAT are important not only because they improve model
safety, but also because they are computationally ecient
and practical to implement.
3.9 Security and Safety
Chapter 3: Responsible AI
0.09 0.09
0.49
0.15
0.20
0.17
0.00
0.14 0.14
0.01
0.04 0.03
0.00
0.03
0.07
0.00 0.01 0.00
Direct requests PAIR Prell AutoPrompt GCG Many-shot
0.00
0.10
0.20
0.30
0.40
0.50
Llama3-8B-instruct RT RT-EAT-LAT
Attack type
Attack success rate ↓
Model resistance to jailbreaking attacks
Source: Sheshadri et al., 2024 | Chart: 2025 AI Index report
Figure 3.9.7

208
Articial Intelligence
Index Report 2025
Table of Contents Chapter 3 Preview
3.10 Special Topics on RAI
AI Agents
The development and deployment of AI agents—dened
as “articial agents with natural language interfaces, whose
function is to plan and execute sequences of actions on
behalf of a user, across one or more domains, in line with the
user’s expectations”—present unique challenges for ensuring
responsible AI. These assistants operate autonomously,
interact dynamically with their environments, and make
decisions that can have signicant ethical, legal, and societal
implications. As a result, they require specialized approaches
to address the risks they pose with respect to transparency,
accountability, and reliability; these challenges can be
amplied by the agents’ capacity for learning, adaptation,
and decision making in unstructured or evolving scenarios.
Identifying the Risks of LM Agents With LM-
Simulated Sandboxes
New research highlights that as language-model-powered
tools and agents advance, they also amplify risks such as
data breaches and nancial losses. However, current risk
assessment methods are resource-intensive and dicult to
scale. To address this, researchers introduced ToolEmu, an
environment that emulates tool execution to enable scalable
testing and automated safety evaluations (Figure 3.10.1). The
framework includes both a standard emulator for general
risk assessments and an adversarial emulator designed to
stress-test agents in extreme scenarios. Human evaluations
conrmed that 68.8% of the risks identied by ToolEmu are
plausible real-world threats. Using a benchmark of 36 toolkits
and 144 test cases, the study found that even the most safety-
optimized LM agents failed in 23.9% of critical scenarios, with
errors including dangerous commands, misdirected nancial
transactions, and trac control failures (Figure 3.10.2).
While LM agents show promise in automating complex
tool interactions, their reliability in high-stakes applications
remains a signicant concern. Suites like ToolEmu are
important for testing the reliability and safety of AI systems,
such as agents, by providing a platform to evaluate their
performance and assess their real-world risks.
Jailbreaking Multimodal Agents With a Single Image
The promise of articial agents lies in their ability to act
independently in the world to solve complex tasks. As agents
proliferate, the likelihood of interactions in increasingly
multiagent environments grows, introducing vulnerabilities
that extend beyond those of single agents. In such settings,
unforeseen interactions between agents can amplify risks,
leading to cascading failures, coordination breakdowns, or
adversarial exploitation that would be less likely in isolated
deployments.
New research from Asia explores a multiagent vulnerability
in multimodal large language model (MLLM) systems,
3.10 Special Topics on RAI
Chapter 3: Responsible AI
This section explores RAI’s connections with
agentic AI and election misinformation—two
topics that are rapidly gaining prominence.
Overview of
ToolEmu
Source: Ruan et al., 2024
Figure 3.10.1

209
Articial Intelligence
Index Report 2025
Table of Contents Chapter 3 Preview
demonstrating how jailbreaking one agent can trigger a rapid, system-
wide failure. The researchers call this phenomenon “infectious jailbreaks,”
where compromising a single agent causes harmful behavior to spread
exponentially across others. Specically, they found that injecting just one
adversarial image (e.g., an image suggesting that human beings are a disease)
into the memory of an MLLM agent could trigger an uncontrolled cascade,
spreading harmful behaviors across interconnected agents without further
intervention. The infectious jailbreak leverages interactions between agents
to compel infected agents to insert adversarial images into the memory
banks of uninfected (benign) agents. In simulations using a network of up
to 1 million LLaVA-1.5-based agents, the infection rate reached near-total
propagation within 27 to 31 interaction rounds (Figure 3.10.3).
While a theoretical containment strategy has been proposed, no practical
mitigation measures currently exist, leaving multiagent systems highly
vulnerable. The compounded risks of deploying interconnected MLLM
agents at scale make this a critical security concern. This research suggests
that while MLLM systems are an exciting avenue of AI research, they are still
highly vulnerable to low-resource jailbreaks.
3.10 Special Topics on RAI
Chapter 3: Responsible AI
62.00%
54.60%
45.00% 44.30%
39.40%
ChatGPT-3.5 Vicuna-1.5-13B Vicuna-1.5-7B Claude 2 GPT-4
0%
20%
40%
60%
80%
100%
Model
Failure incidence ↓
Failure incidence of LM agents
Source: Ruan et al., 2024 | Chart: 2025 AI Index report
Figure 3.10.217
17 The down arrow on the y-axis indicates that a lower score is better.
Infection ratio by chat round
Source: Gu et al., 2024
Figure 3.10.3

210
Articial Intelligence
Index Report 2025
Table of Contents Chapter 3 Preview
Election Misinformation
2024 was a signicant year for elections worldwide, with 4
billion people voting in national elections across countries
including the United States, the United Kingdom, Indonesia,
Mexico, and Taiwan. Last year’s AI Index examined AI’s impact
on elections, focusing on both its potential inuence and real-
world examples. This year, the topic is being revisited. While
some reports suggest that AI-driven misinformation has not
had the feared impact, others indicate it still poses a potential
risk. As a result, it is important to continually monitor and
study AI misinformation, especially as AI systems improve in
capability and grow in prominence.
AI Misinformation in the US Elections
AI could inuence elections in various ways. Recent
research highlights ethical concerns surrounding AI-driven
misinformation and examines their relevance in the recent
U.S. election.
3.10 Special Topics on RAI
Chapter 3: Responsible AI
Ethical concern Description Example
Liar’s dividend The existence of deepfake technology enables
individuals to deny genuine evidence by claiming
it is fake, thereby undermining accountability and
truth. This phenomenon erodes public trust in
legitimate evidence and fosters an environment
where even veried information is questioned.
Donald Trump and his supporters falsely claimed that
the crowd shown in a photo of Kamala Harris’ rally in
Detroit was created using AI.
Blackmail AI technology is exploited to create fabricated
content, including deepfakes, for purposes such
as sexual exploitation, nancial extortion, and
reputational sabotage. Blackmailers leverage
these tools to extract value from victims who,
understandably, struggle to persuasively debunk
the fabricated content.
The American Sunlight Project identied more than
35,000 instances of deepfake content depicting
26 members of Congress (25 of them women) on
pornographic sites.
Erosion of trust in evidence AI-generated content challenges the authenticity
of all digital media, fundamentally undermining the
notion of truth. Hyperrealistic falsications blur the
line between legitimate and false content, eroding
public condence in the integrity of information.
The Doppelganger campaign conducted by Russia
involved using cybersquatted domains resembling
legitimate news outlets, populated with AI-generated
articles, to disseminate Russian government
propaganda while concealing its origins and
misleading viewers into believing the content came
from credible media sources.
Reduction of cognitive
autonomy
AI’s capacity to analyze vast datasets enables
advanced voter proling and microtargeting,
tailoring messages to individual preferences,
behaviors, and vulnerabilities. AI can also exploit
emotional and subconscious triggers, thereby
manipulating individuals’ decision-making
processes.
The fringe candidate Jason Palmer defeated Joe Biden
in the American Samoa primary, in part by leveraging
AI-generated emails, texts, audio, and video. These AI-
driven communications were hyperpersonalized and
emotionally charged, targeting specic voter groups to
inuence their choices.
Conceptualization of ethical concerns around AI and information manipulation
Source: AI Index, 202518
18 This table was compiled by Ann Fitz-Gerald, Halyna Padalko, and Dmytro Chumachenko.

211
Articial Intelligence
Index Report 2025
Table of Contents Chapter 3 Preview
Exploitation of personal
brands
Deepfake technology is harnessed to create
unauthorized videos or images of well-known
individuals, including celebrities, public gures,
and inuencers. By stealing personal brands and
fabricating endorsements, malicious actors aim to
deceive audiences and exploit their trust in these
individuals to lend credibility to false narratives.
Fake celebrity endorsements become the latest
weapon in disinformation wars, sowing confusion
ahead of the 2024 election—for example, Donald
Trump posted an AI-generated picture of Taylor Swift,
falsely claiming she had endorsed his presidential run.
Amplication of hate
speech
AI technologies contribute to the amplication
and normalization of hate speech by creating
echo chambers and lter bubbles. These systems
reinforce preexisting biases and promote divisive
content, as they prioritize user engagement metrics
over ethical considerations.
During a disinformation campaign, Donald Trump and
several of his allies repeatedly promoted an unfounded
conspiracy theory suggesting that Haitian migrants in
Springeld, Ohio, were stealing and eating cats and
dogs. This narrative was further amplied through the
spread of related AI-generated memes designed to
evoke fear of and hostility toward Haitian communities.
Reduction in the
traceability of foreign
operations
AI enables the creation, translation, and
enhancement of linguistically perfect text that is
indistinguishable from human writing, empowering
malicious foreign actors and making their activities
untraceable. Previously, foreign disinformation
campaigns were often identiable due to grammar
mistakes by nonnative speakers, a vulnerability that
AI-generated content eectively eliminates.
OpenAI disrupted an operation dubbed “Bad
Grammar,” in which accounts linked to Russia used
ChatGPT for comment spamming on Telegram
channels. The messages, tailored with region-specic
language, mimicked diverse demographics and
political views in the United States to manipulate
discourse.
Privacy violations AI systems often rely on extensive data collection
for training, raising ethical concerns about the
misuse or exposure of personal information.
The lack of robust safeguards in managing
sensitive data can lead to violations of privacy
rights, complicating the ethical landscape of AI
deployment.
A robocall from a fake Joe Biden targeted New
Hampshire Democrats, misleading them about primary
voting. This case highlights how AI-enabled systems
can use personal data to spread disinformation and
infringe on individual privacy of potential voters.
Figure 3.10.4
3.10 Special Topics on RAI
Chapter 3: Responsible AI
Rest of World 2024 AI-Generated Election Content
Rest of World has been tracking notable cases of AI-
generated election content that occurred across the world in
2024. Their database documents 60 incidents in 15 countries
spanning four media types—audio, image, text, and video—
on 10 dierent platforms, including Facebook, Instagram, and
TikTok. Figure 3.10.5 provides further details.
Totals
Individual list
15
Bangladesh, Belarus, China, India,
Indonesia, Mexico, Pakistan, Panama,
South Africa, South Korea, Sri Lanka,
Taiwan, United States, Uruguay,
Venezuela
Countries
4
Audio, image, text, video
Media modalities
10
ChatGPT, Facebook, Instagram,
Medium, Reddit, television, TikTok,
YouTube, WhatsApp, X/Twitter
Platforms
Rest of World 2024 AI elections: summary statistics
Source: Rest of World, 2025 | Table: 2025 AI Index report
Figure 3.10.5

212
Articial Intelligence
Index Report 2025
Table of Contents Chapter 3 Preview
The following section highlights ve signicant cases from
the tracker, oering a qualitative look at the nature of AI-
generated election content in 2024.
Fake corporate support of Mexican politician (Mexico,
image, X/Twitter, Jun. 2, 2024)
On March 18, the civic organization Sociedad Civil de México
encouraged Starbucks to create a special cup to celebrate
Xóchitl Gálvez, the opposition presidential candidate.
The organization shared an AI-generated image on X of a
Starbucks coee cup with the inscription “#Xochitl2024,”
along with the hashtag #StarbucksQueremosTazaXG
(#StarbucksWeWantACupXG) (Figure 3.10.6). The next
day, Gálvez encouraged her followers on X to order a “café
sin miedo” (coee without fear), which was a play on her
campaign slogan: “For a Mexico without fear.” She invited
supporters to post photos of their coee cups and tag her
team on social media. The AI-generated image quickly gained
traction as users posted. Starbucks, however, disavowed the
designs and stated that it does not endorse political parties.
India’s incumbent party motivates campaign workers with
personalized videos (India, video, WhatsApp, Apr. 18,
2024)
On April 18, over 500 campaign volunteers for the incumbent
Bharatiya Janata Party received personalized videos from
a member of the party, created with the help of AI tools. In
the video, BJP member Shakti Singh called on volunteers
to share the party’s message with the public, emphasizing
policies such as “Clean India,” “Digital India,” and “Make In
India.” Despite noticeable edits, each video featured Singh
addressing the individual recipient by their name (Figure
3.10.7). Campaign employees involved in making the video
maintained they did not require Singh to record each name
separately but instead relied on a combination of voice-
cloning and lip-matching software.
3.10 Special Topics on RAI
Chapter 3: Responsible AI
Figure 3.10.6
Figure 3.10.7
Source: Rest of World, 2024
Source: Rest of World, 2024

213
Articial Intelligence
Index Report 2025
Table of Contents Chapter 3 Preview
Uruguay’s ‘impossible’ debate (Uruguay, video, television,
Oct. 27, 2024)
“Santo y Seña,” a general interest morning show, broadcast
what it called “the impossible debate” ahead of Uruguay’s
presidential election. The debate featured right-wing
Partido Colorado presidential candidate Andrés Ojeda and
his counterpart for the center-left alliance Frente Amplio,
“Yamandú” Orsi (Figure 3.10.8). However, Orsi did not appear
on the show but was “present” through an AI-powered
hologram with a script pulled, according to the show’s host,
from the candidate’s recent interviews. Before the debate
started, Orsi and his party went on another channel to
criticize the stunt as a “fake interview” posing “an attack on
democracy.” The next day, the host responded that the stunt
was neither fake news nor an attack on democracy; it was
merely a joke.
Deepfakes of Pakistani party leaders call for election
boycotts (Pakistan, audio and video, X/Twitter, Feb. 7, 2024)
The day before Pakistan’s general elections, a voice recording
of former prime minister and founder of the Pakistan Tehreek-
e-Insaf (PTI) party, Imran Khan, emerged on social media
(Figure 3.10.9). The voice referred to a crackdown from state
institutions on the PTI, and the speaker was heard calling for
a boycott of the elections, suggesting that there was no use in
voting. The ocial X account of the PTI denounced the audio
as fake. A video posted on the same day showed another
notable PTI leader, Yasmin Rashid, apparently also calling for
a boycott. In the clip, Rashid appeared behind bars, and the
audio alleged that Pakistan’s election commission had been
“bought.” The nonprot fact-checking organization Soch
Fact Check determined the video had been doctored.
3.10 Special Topics on RAI
Chapter 3: Responsible AI
Figure 3.10.8 Figure 3.10.9
Source: Rest of World, 2024 Source: Rest of World, 2024

214
Articial Intelligence
Index Report 2025
Table of Contents Chapter 3 Preview
United States election aected by ‘spamouage’ campaign
(China and US, image, X/Twitter, Facebook, YouTube,
TikTok, Medium, Feb. 15, 2024)
The Institute for Strategic Dialogue (ISD), a U.K.-based think
tank, uncovered actors suspected of being linked to a Chinese
government–run inuence campaign sharing AI-generated
images as part of an eort to spread misinformation ahead
of the 2024 U.S. elections. The “spamouage” campaign—a
term used to designate online operations leveraging a
network of social media accounts to promote propaganda
or misinformation—had been active since 2017, but it began
to make more noticeable use of AI image generators as it
narrowed its focus on the U.S. election. As part of its campaign,
a network of accounts shared images exacerbating political
polarization and casting doubt on the integrity of elections.
Negative posts were disproportionately targeted at President
Joe Biden (Figure 3.10.10). The ISD highlighted a particular
proliferation of these images on X.
AI-generated potholes seek to inuence South African
voters (South Africa, image, X/Twitter, Facebook,
Instagram, Reddit, May 4, 2024)
On May 4, a Facebook user posted an AI-generated image
showing a long road dotted with potholes leading to Cape
Town’s iconic Table Mountain (Figure 3.10.11). The caption under
the image suggested that, under the Democratic Alliance (DA)
party, the municipal government had failed to maintain basic
services, contributing to the deterioration of infrastructure.
Many shared the image to discourage voters in the Western
Cape from supporting the DA, which has managed the
province for 15 years. Though the original post was deleted
from Facebook, it continues to circulate on other social media
platforms. AFP Fact Check, which is housed at the Agence
France-Presse, reported that the image was AI-generated and
traced it to an Instagram user who creates AI art.
Figure 3.10.10
Figure 3.10.11
Source: Rest of World, 2024
Source: Rest of World, 2024
3.10 Special Topics on RAI
Chapter 3: Responsible AI

Articial Intelligence
Index Report 2025
CHAPTER 4:
Economy
Text and analysis by Njenga Kariuki

216Table of Contents
Overview 216
Chapter Highlights 217
4.1 What’s New in 2024: A Timeline 219
4.2 Jobs 223
AI Labor Demand 223
Global AI Labor Demand 223
US AI Labor Demand by Skill
Cluster and Specialized Skill 225
US AI Labor Demand by Sector 228
US AI Labor Demand by State 229
AI Hiring 232
AI Skill Penetration 234
AI Talent 236
Highlight: Measuring AI’s Current
Economic Integration 242
4.3 Investment 246
Corporate Investment 246
Startup Activity 247
Global Trends 247
Regional Comparison by
Funding Amount 251
Regional Comparison by
Newly Funded AI Companies 255
Focus Area Analysis 258
4.4 Corporate Activity 260
Industry Usage 260
Use of AI Capabilities 260
Deployment of Generative
AI Capabilities 264
AI’s Labor Impact 267
4.5 Robot Deployments 272
Aggregate Trends 272
Industrial Robots: Traditional
vs. Collaborative Robots 274
By Geographic Area 275
Country-Level Data on Service
Robotics 279
Chapter 4: Economy
Articial Intelligence
Index Report 2025
ACCESS THE PUBLIC DATA
217
Articial Intelligence
Index Report 2025
Table of Contents Chapter 4 Preview
The economic implications of AI came into sharper focus in 2024, with substantive
impact across many sectors. Early productivity gains from generative AI are becoming
measurable in specic tasks, while questions persist about the technology’s long-term
impact on the broader economy. The labor market has begun to show signs of AI-
driven transformation, with certain knowledge-worker roles experiencing disruption
as new AI-adjacent positions emerge. Companies across sectors and geographical
regions are moving beyond experimental AI adoption toward systematic integration.
Investment patterns reect a growing sophistication in the AI landscape, with funding
increasingly directed toward specialized applications in enterprise automation and
industry-specic solutions.
This chapter examines AI-related economic trends using data from Lightcast, LinkedIn,
Quid, McKinsey and the International Federation of Robotics (IFR). It begins by analyzing
AI-related occupations, covering labor demand, hiring trends, skill penetration, and
talent availability. The chapter then explores corporate investment in AI, including
a section focused specically on generative AI. Finally, it assesses AI’s productivity
impact as well as robot installations across various sectors.
Overview
CHAPTER 4:
Economy
Articial Intelligence
Index Report 2025

218
Articial Intelligence
Index Report 2025
Table of Contents Chapter 4 Preview
Chapter Highlights
1. Global private AI investment hits record high with 26% growth. Corporate AI investment reached $252.3 billion
in 2024, with private investment climbing 44.5% and mergers and acquisitions up 12.1% from the previous year. The sector
has experienced dramatic expansion over the past decade, with total investment growing more than thirteenfold since 2014.
4. Use of AI climbs to unprecedented levels. In 2024, the proportion of survey respondents reporting AI use by their
organizations jumped to 78% from 55% in 2023. Similarly, the number of respondents who reported using generative AI in at
least one business function more than doubled—from 33% in 2023 to 71% last year.
2. Generative AI funding soars. Private investment in generative AI reached $33.9 billion in 2024, up 18.7% from 2023
and over 8.5 times higher than 2022 levels. The sector now represents more than 20% of all AI-related private investment.
3. The U.S. widens its lead in global AI private investment. U.S. private AI investment hit $109.1 billion in 2024,
nearly 12 times higher than China’s $9.3 billion and 24 times the U.K.’s $4.5 billion. The gap is even more pronounced in
generative AI, where U.S. investment exceeded the combined total of China and the European Union plus the U.K. by $25.4
billion, expanding on its $21.8 billion gap in 2023.
5. AI is beginning to deliver nancial impact across business functions, but most companies are early in
their journeys. Most companies that report nancial impacts from using AI within a business function estimate the benets
as being at low levels. 49% of respondents whose organizations use AI in service operations report cost savings, followed by
supply chain management (43%) and software engineering (41%), but most of them report cost savings of less than 10%. With
regard to revenue, 71% of respondents using AI in marketing and sales report revenue gains, 63% in supply chain management,
and 57% in service operations, but the most common level of revenue increases is less than 5%.
6. Use of AI shows dramatic shifts by region, with Greater China gaining ground. While North America
maintains its leadership in organizations’ use of AI, Greater China demonstrated one of the most signicant year-over-year
growth rates, with a 27 percentage point increase in organizational AI use. Europe followed with a 23 percentage point
increase, suggesting a rapidly evolving global AI landscape and intensifying international competition in AI implementation.
CHAPTER 4:
Economy
Articial Intelligence
Index Report 2025

219
Articial Intelligence
Index Report 2025
Table of Contents Chapter 4 Preview
Chapter Highlights (cont’d)
7. China’s dominance in industrial robotics continues despite slight moderation. In 2023, China installed
276,300 industrial robots, six times more than Japan and 7.3 times more than the United States. Since surpassing Japan in
2013, when it accounted for 20.8% of global installations, China’s share has risen to 51.1%. While China continues to install
more robots than the rest of the world combined, this margin narrowed slightly in 2023, marking a modest moderation in its
dramatic expansion.
8. Collaborative and interactive robot installations become more common. In 2017, collaborative robots
represented a mere 2.8% of all new industrial robot installations, a gure that climbed to 10.5% by 2023. Similarly, 2023 saw
a rise in service robot installations across all application categories except medical robotics. This trend indicates not just an
overall increase in robot installations but also a growing emphasis on deploying robots for human-facing roles.
9. AI is driving signicant shifts in energy sources, attracting interest in nuclear energy. Microsoft announced
a $1.6 billion deal to revive the Three Mile Island nuclear reactor to power AI, while Google and Amazon have also secured
nuclear energy agreements to support AI operations.
10. AI boosts productivity and bridges skill gaps. Last year’s AI Index was among the rst reports to highlight
research showing AI’s positive impact on productivity. This year, additional studies reinforced those ndings, conrming that
AI boosts productivity and, in most cases, helps narrow the gap between low- and high-skilled workers.
Articial Intelligence
Index Report 2025
CHAPTER 4:
Economy

220
Articial Intelligence
Index Report 2025
Table of Contents Chapter 4 Preview
The chapter begins with an overview of some of the
most signicant AI-related economic events in 2024, as
selected by the AI Index Steering Committee.
4.1 What’s New in 2024: A Timeline
Date Event Type Image
Jan 16, 2024 Synopsys acquires Ansys for $35 billion to improve
silicon-to-systems design solutions.
Acquisition
Figure 4.1.1
Source: Synopsys, 2024
Feb 21, 2024 Reports claim that OpenAI surpassed $2 billion in
annualized revenue in December 2023.
Valuation milestone
Figure 4.1.2
Source: Inc., 2024
Feb 29, 2024 Figure AI, a humanoid robot startup, raises $675
million at a valuation of $2.6 billion.
Investment/funding
Figure 4.1.3
Source: SiliconAngle, 2024
Mar 21, 2024 Microsoft hires most of Inection AI’s sta,
including cofounders, and pays $650 million to
license Inection’s AI models.
Acquisition
Figure 4.1.4
Source: Reuters, 2024
May 1, 2024 CoreWeave, an AI cloud infrastructure startup,
secures a $1.1 billion funding round at a valuation of
$19 billion.
Investment/funding
Figure 4.1.5
Source: Fortune, 2024
4.1 What’s New in 2024: A Timeline
Chapter 4: Economy

221
Articial Intelligence
Index Report 2025
Table of Contents Chapter 4 Preview
May 21, 2024 Scale AI, a data-labeling startup, raises $1 billion
and reaches a valuation of $13.8 billion.
Investment/funding
Figure 4.1.6
Source: Reuters, 2024
Jun 11, 2024 Mistral AI, a French open-source AI model startup,
raises $640 million at a valuation of $6 billion.
Investment/funding
Figure 4.1.7
Source: TechCrunch, 2024
Jun 14, 2024 Tempus AI, a precision medicine company
leveraging AI for medical data analysis, goes
public, raising $410.7 million and achieving an
implied valuation of over $6 billion.
Investment/funding
Figure 4.1.8
Source: Reuters, 2024
Jul 22, 2024 Cohere, an AI startup specializing in enterprise
applications, raises $500 million in funding at a
valuation of $5.5 billion.
Investment/funding
Figure 4.1.9
Source: Crunchbase, 2024
Aug 2, 2024 Google hires Character.AI’s cofounders along with
research team members and licenses the startup’s
AI technology in a deal to buy out Character.AI’s
shareholders for approximately $2.5 billion.
Acquisition
Figure 4.1.10
Source: The Verge, 2024
Aug 5, 2024 Groq, an AI chip startup specializing in fast
inference, raises $640 million at a valuation of $2.8
billion.
Investment/funding
Figure 4.1.11
Source: Groq, 2024
4.1 What’s New in 2024: A Timeline
Chapter 4: Economy

222
Articial Intelligence
Index Report 2025
Table of Contents Chapter 4 Preview
Aug 12, 2024 AMD acquires Silo AI, Europe’s largest private AI
lab, for approximately $665 million.
Acquisition
Figure 4.1.12
Source: AMD, 2024
Sep 5, 2024 Safe Superintelligence (SSI) secures $1 billion in
funding.
Investment/funding
Figure 4.1.13
Source: TechCrunch, 2024
Sep 12, 2024 Salesforce launches Agentforce, a suite of
autonomous AI agents for business operations,
across its platform.
Product launch/integration
Figure 4.1.14
Source: Salesforce, 2024
Sep 20, 2024 Microsoft announces a $1.6 billion deal with
Constellation Energy to revive the Three Mile Island
nuclear reactor to power AI data centers.
Partnership
Figure 4.1.15
Source: NPR, 2024
Oct 2, 2024 OpenAI raises $6.6 billion at a valuation of $157
billion.
Investment/funding
Figure 4.1.16
Source: Axios, 2024
Oct 14, 2024 Google announces an agreement to purchase
nuclear energy from multiple small modular
reactors (SMRs) developed by Kairos Power.
Partnership
Figure 4.1.17
Source: Google, 2024
Oct 16, 2024 Amazon announces a nuclear energy plan for SMR
development with Energy Northwest, X-energy,
and Dominion Energy.
Partnership
Figure 4.1.18
Source: Amazon, 2024
4.1 What’s New in 2024: A Timeline
Chapter 4: Economy

223
Articial Intelligence
Index Report 2025
Table of Contents Chapter 4 Preview
Oct 17, 2024 Google’s NotebookLM sheds “experimental” label
and boasts millions of users and 80,000-plus
organizations.
Product launch/integration
Figure 4.1.19
Source: Google, 2024
Nov 22, 2024 Anthropic expands its partnership with AWS with
an additional $4 billion investment from Amazon,
bringing the total to $8 billion.
Partnership
Figure 4.1.20
Source: Anthropic, 2024
Dec 17, 2024 Databricks, an AI data analytics company, raises
$10 billion at a valuation of $62 billion.
Investment/funding
Figure 4.1.21
Source: TechCrunch, 2024
Dec 18, 2024 Perplexity AI, a startup focused on AI-powered
search products, raises $500 million at a valuation
of $9 billion.
Investment/funding
Figure 4.1.22
Source: AI Magazine, 2024
Dec 23, 2024 xAI announces a $6 billion funding round, bringing
the total to $12 billion at a valuation of over $40
billion.
Investment/funding
Figure 4.1.23
Source: Forbes, 2024
Dec 30, 2024 Nvidia acquires Israeli startup Run:ai for $700
million to increase its GPU optimization capability
in demanding computing environments.
Acquisition
Figure 4.1.24
Source: TechCrunch, 2024
4.1 What’s New in 2024: A Timeline
Chapter 4: Economy

224
Articial Intelligence
Index Report 2025
Table of Contents Chapter 4 Preview
4.2 Jobs
AI Labor Demand
This section analyzes the demand for AI-related skills in labor
markets, drawing on data from Lightcast. Since 2010, Lightcast
has analyzed hundreds of millions of job postings from over
51,000 websites, identifying those that require AI skills.
Global AI Labor Demand
Figure 4.2.1 and Figure 4.2.2 show the percentage of job
postings demanding AI skills. In 2024, Singapore (3.2%),
Luxembourg (2%), and Hong Kong (1.9%) led in this metric.
In 2023, AI-related jobs accounted for 1.4% of all American
job postings. In 2024, that number increased to 1.8%. Most
countries saw an increase from 2023 to 2024 in the share of
job postings requiring AI skills.
2014 2015 2016 2017 2018 2019 2020 2021 2022 2023 2024
0.00%
1.00%
2.00%
3.00%
4.00%
5.00%
AI job postings (% of all job postings)
1.25%, Netherlands
1.26%, United Kingdom
1.31%, Sweden
1.31%, Belgium
1.37%, Switzerland
1.41%, Canada
1.72%, United Arab Emirates
1.79%, United States
1.89%, Hong Kong
1.99%, Luxembourg
3.27%, Singapore
AI job postings (% of all job postings) by select geographic areas, 2014–24 (part 1)
Source: Lightcast, 2024 | Chart: 2025 AI Index report
Figure 4.2.1
4.2 Jobs
Chapter 4: Economy

225
Articial Intelligence
Index Report 2025
Table of Contents Chapter 4 Preview
4.2 Jobs
Chapter 4: Economy
2014 2015 2016 2017 2018 2019 2020 2021 2022 2023 2024
0.00%
1.00%
2.00%
3.00%
4.00%
5.00%
AI job postings (% of all job postings)
0.13%, Croatia
0.55%, New Zealand
0.65%, Chile
0.73%, Mexico
0.87%, Italy
1.06%, Austria
1.10%, France
1.14%, Australia
1.15%, Germany
1.24%, Spain
AI job postings (% of all job postings) by select geographic areas, 2014–24 (part 2)
Source: Lightcast, 2024 | Chart: 2025 AI Index report
Figure 4.2.2

226
Articial Intelligence
Index Report 2025
Table of Contents Chapter 4 Preview
2010 2011 2012 2013 2014 2015 2016 2017 2018 2019 2020 2021 2022 2023 2024
0.00%
0.20%
0.40%
0.60%
0.80%
1.00%
AI job postings (% of all job postings)
0.02%, AI ethics, governance, and regulations
0.07%, Robotics
0.09%, Visual image recognition
0.13%, Autonomous driving
0.16%, Neural networks
0.22%, Generative AI
0.23%, Natural language processing
0.92%, Machine learning
0.94%, Articial intelligence
AI job postings (% of all job postings) in the United States by skill cluster, 2010–24
Source: Lightcast, 2024 | Chart: 2025 AI Index report
US AI Labor Demand by Skill Cluster and Specialized Skill
Figure 4.2.3 highlights the most sought-after AI skills in
the U.S. labor market since 2010. Leading the demand was
articial intelligence at 0.9%, followed closely by machine
learning, also at 0.9%, and natural language processing at
0.2%. Since last year, most AI-related skill clusters tracked
by Lightcast have had an increase in market share, with the
exception of autonomous driving and robotics. Generative AI
saw the largest increase, growing by nearly a factor of four.
1 A single job posting can list multiple AI skills.
4.2 Jobs
Chapter 4: Economy
Figure 4.2.31

227
Articial Intelligence
Index Report 2025
Table of Contents Chapter 4 Preview
Figure 4.2.4 compares the top 10 specialized skills sought
in AI job postings in 2024 versus those from 2012 to 2014.2
On an absolute scale, the demand for every specialized skill
has increased over the past decade, with Python’s notable
increase in popularity highlighting its ascendance as a
preferred AI programming language.
19,886
20,330
5,371
54,035
22,157
11,861
51,304
41,842
83,826
31,782
86,990 (+337%)
88,141 (+334%)
100,881 (+1,778%)
101,127 (+87%)
102,210 (+361%)
110,620 (+833%)
119,441 (+133%)
128,938 (+208%)
193,341 (+131%)
199,213 (+527%)
0 50,000 100,000 150,000 200,000
Scalability
Agile methodology
Amazon Web Services
Project management
Automation
Data science
SQL (programming language)
Data analysis
Computer science
Python (programming language)
2024
2012–14
Number of AI job postings
Top 10 specialized skills in 2024 AI job postings in the United States, 2012–14 vs. 2024
Source: Lightcast, 2024 | Chart: 2025 AI Index report
Figure 4.2.4
4.2 Jobs
Chapter 4: Economy
2 The decision to select 2012–2014 as the point of comparison was due to the scarcity of data at the jobs/skills level from earlier years. Lightcast therefore used 2012–2014 to have a larger
sample size for a benchmark from 10 years ago with which to compare. Figure 4.2.4 juxtaposes the total number of job postings requiring certain skills from 2012 to 2014 with the total amount
in 2024.

228
Articial Intelligence
Index Report 2025
Table of Contents Chapter 4 Preview
52.23%
16.45%
4.62%
10.11%
0.44%
4.39%
0.21%
6.71%
1.33%
0.15%
60.48% (+16%)
17.76% (+8%)
5.68% (+23%)
5.14% (-49%)
2.57% (+487%)
2.01% (-54%)
1.36% (+539%)
0.95% (-86%)
0.69% (-48%)
0.67% (+356%)
0% 10% 20% 30% 40% 50% 60%
Multimodal models
Microsoft Copilot
Variational autoencoders
Retrieval augmented generation
Generative adversarial networks
Text to speech (TTS)
Prompt engineering
ChatGPT
Large language modeling
Generative articial intelligence
2024
2023
Skill share in AI job postings (%)
Share of generative AI skills in AI job postings in the United States, 2023 vs. 2024
Source: Lightcast, 2024 | Chart: 2025 AI Index report
In 2024, year-over-year U.S. job postings citing generative AI skills increased by more than a factor of three (Figure 4.2.5).
Figure 4.2.6 illustrates the proportion of AI job postings released in 2024 and 2023 that referenced particular generative AI skills.
15,741
4,956
1,393
3,047
132
1,323
64
2,021
400
44
66,635 (+323%)
19,562 (+295%)
6,263 (+350%)
5,664 (+86%)
2,834 (+2,047%)
2,213 (+67%)
1,496 (+2,238%)
1,045 (-48%)
756 (+89%)
733 (+1,566%)
0 6,000 12,000 18,000 24,000 30,000 36,000 42,000 48,000 54,000 60,000 66,000 72,000 78,000
Multimodal models
Variational autoencoders
Microsoft Copilot
Retrieval augmented generation
Text to speech (TTS)
Generative adversarial networks
Prompt engineering
ChatGPT
Large language modeling
Generative articial intelligence
2024
2023
Number of AI job postings
Generative AI skills in AI job postings in the United States, 2023 vs. 2024
Source: Lightcast, 2024 | Chart: 2025 AI Index report
Figure 4.2.5
Figure 4.2.6
4.2 Jobs
Chapter 4: Economy

229
Articial Intelligence
Index Report 2025
Table of Contents Chapter 4 Preview
0.41%
0.61%
0.87%
0.57%
0.84%
0.85%
1.76%
1.11%
1.69%
1.79%
1.39%
2.88%
3.24%
4.00%
5.19%
0.48% (+15.65%)
0.82% (+35.81%)
1.07% (+22.26%)
1.16% (+101.95%)
1.20% (+43.41%)
1.21% (+41.95%)
1.29% (-26.93%)
1.87% (+67.82%)
1.92% (+13.57%)
2.05% (+14.98%)
2.15% (+55.08%)
3.75% (+30.21%)
3.76% (+16.15%)
5.25% (+31.20%)
9.33% (+79.56%)
0% 1% 2% 3% 4% 5% 6% 7% 8% 9% 10% 11%
Waste management and administrative support services
Transportation and warehousing
Agriculture, forestry, shing and hunting
Retail trade
Wholesale trade
Real estate and rental and leasing
Public administration
Mining, quarrying, and oil and gas extraction
Management of companies and enterprises
Educational services
Utilities
Manufacturing
Finance and insurance
Professional, scientic, and technical services
Information
2024
2023
AI job postings (% of all job postings)
AI job postings (% of all job postings) in the United States by sector, 2023 vs. 2024
Source: Lightcast, 2024 | Chart: 2025 AI Index report
Figure 4.2.73
US AI Labor Demand by Sector
Figure 4.2.7 shows the percentage of U.S. job postings
requiring AI skills by industry sector from 2023 to 2024. Nearly
every sector experienced an increase in the proportion of AI
job postings in 2024 compared to 2023, except for public
administration.
3 The sector classications in Figure 4.2.7 are based on two-digit NAICS codes. For more information on the Bureau of Labor Statistics’ supersector and NAICS classications, see the
following reference.
4.2 Jobs
Chapter 4: Economy

230
Articial Intelligence
Index Report 2025
Table of Contents Chapter 4 Preview
AL
6,876
AK
2,225
AZ
12,939 AR
4,707
CA
103,375 CO
15,927
CT
8,091
DE
3,767
FL
25,211
GA
20,260
HI
2,693
ID
4,149 IL
26,131 IN
7,232
IA
4,274
KS
5,951 KY
4,341
LA
3,770
ME
2,472
MD
14,906
MA
29,097
MI
15,583
MN
10,445
MS
2,877
MO
9,138
MT
2,456
NE
3,829
NV
4,484
NH
3,100
NJ
19,504
NM
3,617
NY
37,944
NC
18,916
ND
1,606
OH
16,518
OK
4,512
OR
8,643 PA
19,294
RI
3,569
SC
5,362
SD
1,839
TN
9,184
TX
57,785
UT
6,584
VT
1,304
VA
31,186
WA
31,067
DC
10,121
WV
1,296
WI
7,415
WY
976
Source: Lightcast, 2024 | Chart: 2025 AI Index report
Number of AI job postings in the United States by state, 2024
AL
1.38%
AK
1.60%
AZ
1.50% AR
1.86%
CA
2.67% CO
1.78%
CT
1.64%
DE
3.38%
FL
1.09%
GA
1.82%
HI
1.44%
ID
1.91% IL
1.87% IN
0.97%
IA
1.06%
KS
1.52% KY
1.04%
LA
0.92%
ME
1.57%
MD
2.29%
MA
2.71%
MI
1.51%
MN
1.46%
MS
1.37%
MO
1.26%
MT
1.59%
NE
1.34%
NV
1.18%
NH
1.16%
NJ
2.07%
NM
1.30%
NY
2.19%
NC
1.52%
ND
1.22%
OH
1.19%
OK
1.09%
OR
1.54% PA
1.46%
RI
2.13%
SC
0.98%
SD
1.18%
TN
1.14%
TX
1.86%
UT
1.75%
VT
1.43%
VA
2.77%
WA
3.27%
DC
4.44%
WV
1.13%
WI
1.00%
WY
1.74%
Source: Lightcast, 2024 | Chart: 2025 AI Index report
Percentage of US states job postings in AI, 2024
Figure 4.2.8
Figure 4.2.9
US AI Labor Demand by State
Figure 4.2.8 highlights the number of
AI job postings in the United States
by state. The top three states were
California (103,375), Texas (57,785),
and New York (37,944).
Figure 4.2.9 demonstrates what
percentage of a state’s total job
postings were AI-related. The top
states according to this metric were
the District of Columbia (4.4%),
followed by Delaware (3.4%) and
Washington (3.3%).
4.2 Jobs
Chapter 4: Economy

231
Articial Intelligence
Index Report 2025
Table of Contents Chapter 4 Preview
Figure 4.2.10 examines which U.S. states
accounted for the largest proportion of
AI job postings nationwide. In 2024,
15.7% of all AI job postings in the United
States were for jobs based in California,
followed by Texas (8.8%) and New York
(5.8%).
Figure 4.2.11 illustrates trends in four
states with a signicant number of AI
job postings: Washington, California,
New York, and Texas. Each experienced
a notable increase in the share of total
AI-related job postings from 2023 to
2024.
4.2 Jobs
Chapter 4: Economy
AL
1.04%
AK
0.34%
AZ
1.96% AR
0.71%
CA
15.70% CO
2.42%
CT
1.23%
DE
0.57%
FL
3.83%
GA
3.08%
HI
0.41%
ID
0.63% IL
3.97% IN
1.10%
IA
0.65%
KS
0.90% KY
0.66%
LA
0.57%
ME
0.38%
MD
2.26%
MA
4.42%
MI
2.37%
MN
1.59%
MS
0.44%
MO
1.39%
MT
0.37%
NE
0.58%
NV
0.68%
NH
0.47%
NJ
2.96%
NM
0.55%
NY
5.76%
NC
2.87%
ND
0.24%
OH
2.51%
OK
0.69%
OR
1.31% PA
2.93%
RI
0.54%
SC
0.81%
SD
0.28%
TN
1.39%
TX
8.77%
UT
1.00%
VT
0.20%
VA
4.74%
WA
4.72%
DC
1.54%
WV
0.20%
WI
1.13%
WY
0.15%
Source: Lightcast, 2024 | Chart: 2025 AI Index report
Percentage of US AI job postings by state, 2024
2010 2011 2012 2013 2014 2015 2016 2017 2018 2019 2020 2021 2022 2023 2024
0.00%
0.50%
1.00%
1.50%
2.00%
2.50%
3.00%
Percentage of US states’ job postings in AI
1.86%, Texas
2.19%, New York
2.67%, California
3.27%, Washington
Percentage of US states’ job postings in AI by select US state, 2010–24
Source: Lightcast, 2024 | Chart: 2025 AI Index report
Figure 4.2.10
Figure 4.2.11

232
Articial Intelligence
Index Report 2025
Table of Contents Chapter 4 Preview
2010 2011 2012 2013 2014 2015 2016 2017 2018 2019 2020 2021 2022 2023 2024
0%
5%
10%
15%
20%
25%
Percentage of United States AI job postings
4.72%, Washington
5.76%, New York
8.77%, Texas
15.70%, California
Percentage of US AI job postings by select US state, 2010–24
Source: Lightcast, 2024 | Chart: 2025 AI Index report
Figure 4.2.12
Figure 4.2.12 shows how AI-related job postings have been
distributed across the top four states over time. In 2024, all
four states reversed multiyear declines in their proportion of
AI job postings—a particularly notable change in California
and New York, both of which had experienced decreases
since 2020.
4.2 Jobs
Chapter 4: Economy

233
Articial Intelligence
Index Report 2025
Table of Contents Chapter 4 Preview
23.60%
24.02%
24.24%
24.58%
24.73%
24.88%
24.97%
26.13%
26.39%
26.98%
27.31%
28.21%
28.71%
30.83%
33.39%
0% 5% 10% 15% 20% 25% 30% 35%
Latvia
Mexico
South Africa
Ireland
United States
United Arab Emirates
Singapore
Canada
Argentina
Finland
Romania
Slovenia
Saudi Arabia
Brazil
India
Relative AI hiring rate year-over-year ratio
Relative AI hiring rate year-over-year ratio by geographic area, 2024
Source: LinkedIn, 2024 | Chart: 2025 AI Index report
AI Hiring
The hiring data presented in the AI Index is based on
LinkedIn’s Economic Graph, reecting the jobs and skills
of the platform’s 1+ billion members. As such, the data is
inuenced by how members choose to use the platform,
which can vary based on professional, social, and regional
cultures, as well as overall site availability and accessibility.
The AI Index notes that Hungary, Indonesia, India, and South
Korea, included in the sample, have LinkedIn covering a
lower portion of the labor force, so insights drawn about
these countries should be interpreted with particular caution.
Figure 4.2.13 reports the relative AI hiring rate year-over-year
ratio by geographic area. The overall hiring rate is computed
as the percentage of LinkedIn members who added a new
employer in the same period the job began, divided by the
total number of LinkedIn members in the corresponding
location. Conversely, the relative AI talent hiring rate is the
year-over-year change in AI hiring relative to the overall
hiring rate in the same geographic area.4 Therefore, Figure
4.2.13 illustrates AI hiring vibrancy in those regions that have
experienced the most signicant rise in AI talent recruitment
compared to the overall hiring rate. In 2024, the countries
with the greatest relative AI hiring rates year-over-year were
India (33.4%), followed by Brazil (30.8%) and Saudi Arabia
(28.7%). This means, for example, that in 2024 in India, the
ratio of AI talent hiring relative to overall hiring grew 33.4%.
Figure 4.2.135
4 For each month, LinkedIn calculates the AI hiring rate in the geographic area, divides the AI hiring rate by the overall hiring rate in that geographic area, calculates the year-over-year change
of this ratio, and then takes the 12-month moving average using the last 12 months.
5 For brevity, the visualization only includes the top 15 countries for this metric.
4.2 Jobs
Chapter 4: Economy
Figure 4.2.14 showcases the year-over-year ratio of AI hiring
by geographic areas over the past ve years. Starting in 2024,
several South American countries like Argentina, Brazil, and
Chile have experienced notable upticks in AI hiring rates.
Other countries that have recently experienced similar rises
include Canada, India, South Africa, and the United States.

234
Articial Intelligence
Index Report 2025
Table of Contents Chapter 4 Preview
Figure 4.2.14
2018 2021 2024
0%
50%
100%
2018 2021 2024
0%
50%
100%
2018 2021 2024
0%
50%
100%
2018 2021 2024
0%
50%
100%
2018 2021 2024
0%
50%
100%
2018 2021 2024
0%
50%
100%
2018 2021 2024
0%
50%
100%
2018 2021 2024
0%
50%
100%
2018 2021 2024
0%
50%
100%
2018 2021 2024
0%
50%
100%
2018 2021 2024
0%
50%
100%
2018 2021 2024
0%
50%
100%
2018 2021 2024
0%
50%
100%
2018 2021 2024
0%
50%
100%
2018 2021 2024
0%
50%
100%
2018 2021 2024
0%
50%
100%
2018 2021 2024
0%
50%
100%
2018 2021 2024
0%
50%
100%
2018 2021 2024
0%
50%
100%
2018 2021 2024
0%
50%
100%
2018 2021 2024
0%
50%
100%
2018 2021 2024
0%
50%
100%
2018 2021 2024
0%
50%
100%
2018 2021 2024
0%
50%
100%
2018 2021 2024
0%
50%
100%
2018 2021 2024
0%
50%
100%
2018 2021 2024
0%
50%
100%
2018 2021 2024
0%
50%
100%
2018 2021 2024
0%
50%
100%
2018 2021 2024
0%
50%
100%
2018 2021 2024
0%
50%
100%
2018 2021 2024
0%
50%
100%
2018 2021 2024
0%
50%
100%
2018 2021 2024
0%
50%
100%
2018 2021 2024
0%
50%
100%
2018 2021 2024
0%
50%
100%
2018 2021 2024
0%
50%
100%
2018 2021 2024
0%
50%
100%
2018 2021 2024
0%
50%
100%
2018 2021 2024
0%
50%
100%
2018 2021 2024
0%
50%
100%
2018 2021 2024
0%
50%
100%
2018 2021 2024
0%
50%
100%
2018 2021 2024
0%
50%
100%
2018 2021 2024
0%
50%
100%
2018 2021 2024
0%
50%
100%
2018 2021 2024
0%
50%
100%
Relative AI hiring rate year-over-year ratio
Argentina Australia Austria Belgium
Brazil Canada Chile Costa Rica
Croatia Cyprus Czech Republic Denmark
Estonia Finland France Germany
Greece Hong Kong Hungary India
Indonesia Ireland Israel Italy
Latvia Lithuania Luxembourg Mexico
Netherlands New Zealand Norway Poland
Portugal Romania Saudi Arabia Singapore
Slovenia South Africa South Korea Spain
Sweden Switzerland Turkey United Arab Emirates
United Kingdom United States Uruguay
26.39% 16.78% 16.23% 10.53%
30.83% 26.12% 22.18% 17.61%
7.62% 6.86% 11.29% 20.47%
17.40% 26.98% 5.75% 9.10%
14.52% 20.83% 22.34% 33.39%
16.61% 24.58% 14.28% 19.78%
23.59% 12.20% 9.15% 24.02%
8.57% 12.72% 13.33% 13.05%
19.67% 27.31% 28.71% 24.97%
28.21% 24.24% 13.21% 18.22%
19.12% 18.43% 20.36% 24.88%
13.78% 24.73% 13.22%
Relative AI hiring rate year-over-year ratio by geographic area, 2018–24
Source: LinkedIn, 2024 | Chart: 2025 AI Index report
4.2 Jobs
Chapter 4: Economy

235
Articial Intelligence
Index Report 2025
Table of Contents Chapter 4 Preview
0.87
0.90
0.92
0.94
0.95
1.00
1.04
1.10
1.23
1.30
1.31
1.32
1.40
2.51
2.63
0.00 0.50 1.00 1.50 2.00 2.50
Israel
Italy
Netherlands
Turkey
Australia
Global
Indonesia
Spain
France
Canada
Brazil
Germany
United Kingdom
India
United States
Relative AI skill penetration rate
Relative AI skill penetration rate by geographic area, 2015–24
Source: LinkedIn, 2024 | Chart: 2025 AI Index report
AI Skill Penetration
Figure 4.2.15 and Figure 4.2.16 highlight relative AI skill
penetration. The aim of this indicator is to measure the
intensity of AI skills in a particular country or by industry or
gender. The AI skill penetration rate signals the prevalence
of AI skills across occupations or the intensity with which
LinkedIn members utilize AI skills in their jobs. For example,
the top 50 skills for the occupation of engineer are calculated
based on the weighted frequency with which they appear in
LinkedIn member proles. If, for instance, four of the skills
that engineers possess belong to the AI skill group, the
penetration of AI skills among engineers is estimated to be
8% (4/50).
For the period from 2015 to 2024, the countries with the
highest AI skill penetration rates were the United States (2.6)
and India (2.5). They were followed by the United Kingdom
(1.4), Germany (1.3), and Brazil (1.3). In the United States,
therefore, the relative penetration of AI skills was 2.6 times
greater than the global average across the same set of
occupations.
Figure 4.2.15
4.2 Jobs
Chapter 4: Economy

236
Articial Intelligence
Index Report 2025
Table of Contents Chapter 4 Preview
0.61
0.64
0.66
0.67
0.68
0.72
0.75
0.79
0.83
0.83
0.89
0.90
0.97
1.71
1.91
0.59
0.77
0.96
0.91
0.89
0.98
1.13
0.89
1.30
1.25
1.34
1.29
1.30
2.39
2.38
0.00 0.50 1.00 1.50 2.00 2.50
Saudi Arabia
Singapore
Turkey
Italy
Australia
Netherlands
Spain
Israel
Brazil
France
Germany
United Kingdom
Canada
United States
India
Male
Female
Relative AI skill penetration rate
Relative AI skill penetration rate across gender, 2015–24
Source: LinkedIn, 2024 | Chart: 2025 AI Index report
Figure 4.2.16 disaggregates AI skill penetration rates by
gender across dierent countries or regions. A country’s
rate of 1.5 for women means female LinkedIn members in
that country are 1.5 times more likely to list AI skills than the
average member in all countries pooled together across the
same set of occupations in the country. For all countries in
the sample, with the exception of Saudi Arabia, the relative
AI skill penetration rate is greater for men than women. India
(1.9), United States (1.7), and Canada (1.0) have the highest
reported relative AI skill penetration rates for women.
Figure 4.2.16
4.2 Jobs
Chapter 4: Economy

237
Articial Intelligence
Index Report 2025
Table of Contents Chapter 4 Preview
There are also notable gender dierences in AI talent
concentration. For every country included in the analysis
sample, with the exception of India and Saudi Arabia, the
concentration of AI talent was higher among men than women
(Figure 4.2.19). Israel reported the highest concentration of
female AI talent in 2024, at 1.6%.
1.98%
1.64%
1.44%
1.17%
1.16%
1.13%
1.11%
1.09%
1.07%
1.06%
1.06%
0.94%
0.93%
0.92%
0.90%
0.00% 0.50% 1.00% 1.50% 2.00%
Sweden
Hungary
Canada
Poland
Lithuania
South Korea
Netherlands
Germany
Ireland
Finland
Switzerland
Estonia
Luxembourg
Singapore
Israel
AI talent concentration
AI talent concentration by geographic area, 2024
Source: LinkedIn, 2024 | Chart: 2025 AI Index report
166%
168%
170%
171%
173%
191%
192%
192%
198%
207%
217%
219%
237%
240%
252%
0% 40% 80% 120% 160% 200% 240% 280%
Canada
United Arab Emirates
Argentina
Uruguay
Iceland
Indonesia
Denmark
Croatia
Turkey
Estonia
Brazil
Cyprus
Portugal
Costa Rica
India
% change in AI talent concentration
Source: LinkedIn, 2024 | Chart: 2025 AI Index report
Percentage change in AI talent concentration by
geographic area, 2016 vs. 2024
AI Talent
Figures 4.2.17 and 4.2.18 examine AI talent by country. A
LinkedIn member is considered to have AI talent if they
have explicitly added AI skills to their prole, work or have
worked in AI. Counts of AI talent are used to calculate talent
concentration, or the portion of members who are AI talent.
Note that concentration metrics may be inuenced by
LinkedIn coverage in these countries and should be used
with caution.
Figure 4.2.17 shows AI talent concentration in various
geographic areas. In 2024, the countries with the highest
concentrations of AI talent include Israel (2.0%), Singapore
(1.6%), and Luxembourg (1.4%). Figure 4.2.18 looks at the
percent change in AI talent concentration for a selection of
countries since 2016. During that time period, several major
economies registered substantial increases in their AI talent
pools. The countries showing the greatest increases are India
(252%), Costa Rica (240%), and Portugal (237%).
Figure 4.2.18Figure 4.2.17
4.2 Jobs
Chapter 4: Economy

238
Articial Intelligence
Index Report 2025
Table of Contents Chapter 4 Preview
2016 2020 2024
0.00%
0.20%
0.40%
2016 2020 2024
0.00%
0.50%
1.00%
2016 2020 2024
0.00%
0.50%
1.00%
2016 2020 2024
0.00%
0.50%
1.00%
2016 2020 2024
0.00%
0.20%
0.40%
2016 2020 2024
0.00%
0.50%
1.00%
2016 2020 2024
0.00%
0.20%
0.40%
0.60%
2016 2020 2024
0.00%
0.50%
1.00%
2016 2020 2024
0.00%
0.50%
1.00%
2016 2020 2024
0.00%
0.50%
1.00%
1.50%
2016 2020 2024
0.00%
0.50%
1.00%
2016 2020 2024
0.00%
0.50%
1.00%
2016 2020 2024
0.00%
1.00%
2.00%
2016 2020 2024
0.00%
1.00%
2.00%
2016 2020 2024
0.00%
0.50%
1.00%
2016 2020 2024
0.00%
0.50%
1.00%
1.50%
2016 2020 2024
0.00%
0.50%
1.00%
1.50%
2016 2020 2024
0.00%
0.50%
1.00%
2016 2020 2024
0.00%
0.50%
1.00%
2016 2020 2024
0.00%
0.50%
1.00%
1.50%
2016 2020 2024
0.00%
1.00%
2.00%
3.00%
2016 2020 2024
0.00%
0.20%
0.40%
0.60%
2016 2020 2024
0.00%
0.50%
1.00%
2016 2020 2024
0.00%
0.50%
1.00%
1.50%
2016 2020 2024
0.00%
1.00%
2.00%
2016 2020 2024
0.00%
0.20%
0.40%
2016 2020 2024
0.00%
0.50%
1.00%
1.50%
2016 2020 2024
0.00%
0.50%
1.00%
2016 2020 2024
0.00%
0.50%
1.00%
2016 2020 2024
0.00%
0.50%
1.00%
1.50%
2016 2020 2024
0.00%
0.50%
1.00%
2016 2020 2024
0.00%
0.50%
2016 2020 2024
0.00%
0.20%
0.40%
0.60%
2016 2020 2024
0.00%
1.00%
2.00%
2016 2020 2024
0.00%
0.20%
0.40%
2016 2020 2024
0.00%
0.50%
1.00%
2016 2020 2024
0.00%
0.50%
1.00%
1.50%
2016 2020 2024
0.00%
1.00%
2.00%
2016 2020 2024
0.00%
0.20%
0.40%
2016 2020 2024
0.00%
0.20%
0.40%
0.60%
2016 2020 2024
0.00%
0.50%
1.00%
2016 2020 2024
0.00%
0.50%
1.00%
2016 2020 2024
0.00%
0.20%
0.40%
Male
Female
Argentina Australia Austria Belgium
Brazil Canada Chile Costa Rica
Croatia Cyprus Czech Republic Denmark
Estonia Finland France Germany
Greece Hong Kong India Ireland
Israel Italy Latvia Lithuania
Luxembourg Mexico Netherlands New Zealand
Norway Poland Portugal Romania
Saudi Arabia Singapore South Africa Spain
Sweden Switzerland Turkey United Arab Emirates
United Kingdom United States Uruguay
0.18%
0.45%
0.52%
1.00%
0.48%
1.07%
0.39%
0.95%
0.11%
0.37%
0.61%
1.15%
0.17%
0.49%
0.45%
0.85%
0.46%
0.83%
0.59%
1.27%
0.47%
1.14%
0.44%
1.07%
0.81%
1.69%
0.75%
1.71%
0.53%
1.06%
0.65%
1.38%
0.62%
1.38%
0.52%
1.05% 0.92%
0.89% 0.75%
1.40%
1.60%
2.88%
0.29%
0.55%
0.46%
0.95%
0.74%
1.47%
0.96%
1.86%
0.18%
0.39%
0.72%
1.38%
0.46%
0.81%
0.44%
0.86%
0.59%
1.30%
0.36%
0.88%
0.47%
0.75%
0.60%
0.40% 1.35%
1.91%
0.24%
0.40%
0.37%
0.86%
0.58%
1.21%
0.70%
1.55% 0.33%
0.42% 0.55%
0.59%
0.56%
1.08%
0.51%
0.99%
0.15%
0.45%
AI talent concentration by gender and geographic area, 2016–24
Source: LinkedIn, 2024 | Chart: 2025 AI Index report
AI talent concentration
Figure 4.2.19
4.2 Jobs
Chapter 4: Economy

239
Articial Intelligence
Index Report 2025
Table of Contents Chapter 4 Preview
2016 2017 2018 2019 2020 2021 2022 2023 2024
0%
10%
20%
30%
40%
50%
60%
70%
80%
AI talent representation
30.54%, Female
69.46%, Male
Global AI talent representation, 2016–24
Source: LinkedIn, 2024 | Chart: 2025 AI Index report
Figure 4.2.20
LinkedIn also tracks the gender distribution of AI talent (Figure 4.2.20). In 2024, it estimates that 69.5% of AI professionals on the
platform are male, while 30.5% are female. This ratio has remained remarkably stable over time.
4.2 Jobs
Chapter 4: Economy
LinkedIn’s data on AI talent can also be broken down by country. In every country in the sample, men proportionally outnumber
women in AI roles (Figure 4.2.21). New Zealand and Romania have the most balanced gender distribution, while Brazil and Chile
have the least.

240
Articial Intelligence
Index Report 2025
Table of Contents Chapter 4 Preview
Figure 4.2.21
4.2 Jobs
Chapter 4: Economy
2016 2020 2024
0%
50%
100%
2016 2020 2024
0%
50%
100%
2016 2020 2024
0%
50%
100%
2016 2020 2024
0%
50%
100%
2016 2020 2024
0%
50%
100%
2016 2020 2024
0%
50%
100%
2016 2020 2024
0%
50%
100%
2016 2020 2024
0%
50%
100%
2016 2020 2024
0%
50%
100%
2016 2020 2024
0%
50%
100%
2016 2020 2024
0%
50%
100%
2016 2020 2024
0%
50%
100%
2016 2020 2024
0%
50%
100%
2016 2020 2024
0%
50%
100%
2016 2020 2024
0%
50%
100%
2016 2020 2024
0%
50%
100%
2016 2020 2024
0%
50%
100%
2016 2020 2024
0%
50%
100%
2016 2020 2024
0%
50%
100%
2016 2020 2024
0%
50%
100%
2016 2020 2024
0%
50%
100%
2016 2020 2024
0%
50%
100%
2016 2020 2024
0%
50%
100%
2016 2020 2024
0%
50%
100%
2016 2020 2024
0%
50%
100%
2016 2020 2024
0%
50%
100%
2016 2020 2024
0%
50%
100%
2016 2020 2024
0%
50%
100%
2016 2020 2024
0%
50%
100%
2016 2020 2024
0%
50%
100%
2016 2020 2024
0%
50%
100%
2016 2020 2024
0%
50%
100%
2016 2020 2024
0%
50%
100%
2016 2020 2024
0%
50%
100%
2016 2020 2024
0%
50%
100%
2016 2020 2024
0%
50%
100%
2016 2020 2024
0%
50%
100%
2016 2020 2024
0%
50%
100%
2016 2020 2024
0%
50%
100%
2016 2020 2024
0%
50%
100%
2016 2020 2024
0%
50%
100%
2016 2020 2024
0%
50%
100%
2016 2020 2024
0%
50%
100%
Male
Female
Argentina Australia Austria Belgium
Brazil Canada Chile Costa Rica
Croatia Cyprus Czech Republic Denmark
Estonia Finland France Germany
Greece Hong Kong India Ireland
Israel Italy Latvia Lithuania
Luxembourg Mexico Netherlands New Zealand
Norway Poland Portugal Romania
Saudi Arabia Singapore South Africa Spain
Sweden Switzerland Turkey United Arab Emirates
United Kingdom United States Uruguay
28.64%
71.36%
31.39%
68.61%
24.34%
75.66%
24.13%
75.87%
22.89%
77.11%
32.22%
67.78%
22.89%
77.11%
31.35%
68.65%
34.92%
65.08%
27.16%
72.84%
26.35%
73.66%
25.72%
74.28%
32.90%
67.10%
35.66%
64.34%
31.05%
68.95%
23.77%
76.23%
26.95%
73.05%
31.77%
68.23%
29.92%
70.08%
31.69%
68.31%
25.84%
74.16%
34.05%
65.94%
38.54%
61.46%
33.37%
66.63%
27.58%
72.42%
25.95%
74.05%
28.32%
71.68%
34.25%
65.75%
27.39%
72.61%
30.79%
69.21%
27.49%
72.51%
41.00%
59.00%
30.98%
69.02%
37.09%
62.91%
35.29%
64.71%
27.79%
72.21%
28.62%
71.38%
25.06%
74.94%
28.76%
71.24%
29.39%
70.61%
29.50%
70.50%
33.68%
66.32%
26.50%
73.50%
AI talent representation by gender and geographic area, 2016–24
Source: LinkedIn, 2024 | Chart: 2025 AI Index report
AI talent representation

241
Articial Intelligence
Index Report 2025
Table of Contents Chapter 4 Preview
0.95
0.97
1.07
1.14
1.26
1.30
1.48
1.61
2.09
2.13
2.17
3.15
4.13
4.67
8.92
0.00 0.50 1.00 1.50 2.00 2.50 3.00 3.50 4.00 4.50 5.00 5.50 6.00 6.50 7.00 7.50 8.00 8.50 9.00
Poland
Hong Kong
United States
Denmark
Singapore
Finland
Australia
Saudi Arabia
Austria
Germany
Ireland
Switzerland
United Arab Emirates
Cyprus
Luxembourg
Net AI talent migration (per 10,000 LinkedIn members)
Net AI talent migration per 10,000 LinkedIn members by geographic area, 2024
Source: LinkedIn, 2024 | Chart: 2025 AI Index report
Figure 4.2.22
LinkedIn data provides insights on the AI talent gained or lost
due to migration trends.6 Net ows are dened as total arrivals
minus departures within the given time period. A positive net
AI talent migration gure indicates that more talent is coming
into the geographic area than departing. A negative gure
indicates that more talent is departing than coming into
the geographic area. Figure 4.2.22 examines net AI talent
migration per 10,000 LinkedIn members by geographic area.
The geographic areas that report the greatest per capita
incoming migration of AI talent are Luxembourg (8.9), Cyprus
(4.7), and United Arab Emirates (4.1).
4.2 Jobs
Chapter 4: Economy
6 LinkedIn membership varies considerably among countries, which makes interpreting absolute movements of members from one country to another dicult. To compare migration
ows between countries fairly, migration ows are normalized for the country of interest. For example, if country A is the country of interest, all absolute net ows into and out of country
A (regardless of origin and destination countries) are normalized based on LinkedIn membership in country A at the end of each year and multiplied by 10,000. Hence, this metric indicates
relative talent migration of all other countries to and from country A.
Figure 4.2.23 documents AI talent migration data over time.
In the last few years, Israel, the Netherlands, and Canada,
among other countries, have seen declining net AI talent
migration gures, suggesting that less AI talent has been
owing into these countries. Countries with rising talent
ows include the United Arab Emirates, Saudi Arabia, and
Luxembourg.

242
Articial Intelligence
Index Report 2025
Table of Contents Chapter 4 Preview
2020 2022 2024
−1
0
1
2020 2022 2024
−1
0
1
2020 2022 2024
−1
0
1
2
3
2020 2022 2024
−1
0
1
2020 2022 2024
−1
0
1
2020 2022 2024
−1
0
1
2
3
2020 2022 2024
−1
0
1
2020 2022 2024
−1
0
1
2020 2022 2024
−1
0
1
2020 2022 2024
0
4
8
12
2020 2022 2024
−1
0
1
2020 2022 2024
−1
0
1
2020 2022 2024
0
2
4
6
2020 2022 2024
−1
0
1
2020 2022 2024
−1
0
1
2020 2022 2024
−1
0
1
2
3
2020 2022 2024
−1
0
1
2020 2022 2024
−1
0
1
2020 2022 2024
−2
−1
0
1
2020 2022 2024
−1
0
1
2020 2022 2024
−2
−1
0
1
2020 2022 2024
−1
0
1
2020 2022 2024
−1
0
1
2
3
2020 2022 2024
−2
0
2
2020 2022 2024
−1
0
1
2020 2022 2024
−1
0
1
2020 2022 2024
−1
0
1
2
3
2020 2022 2024
0
4
8
12
2020 2022 2024
−1
0
1
2020 2022 2024
−1
0
1
2
3
2020 2022 2024
−1
0
1
2020 2022 2024
−1
0
1
2020 2022 2024
−1
0
1
2020 2022 2024
−1
0
1
2020 2022 2024
−1
0
1
2020 2022 2024
−1
0
1
2020 2022 2024
−1
0
1
2
3
2020 2022 2024
−1
0
1
2020 2022 2024
−1
0
1
2020 2022 2024
−1
0
1
2020 2022 2024
−1
0
1
2020 2022 2024
−1
0
1
2020 2022 2024
−1
0
1
2
3
4
2020 2022 2024
−1
0
1
2020 2022 2024
0
2
4
6
2020 2022 2024
−1
0
1
2020 2022 2024
−1
0
1
2020 2022 2024
−1
0
1
Argentina Australia Austria* Belgium
Brazil Canada* Chile Costa Rica
Croatia Cyprus* Czech Republic Denmark
Estonia* Finland France Germany*
Greece Hong Kong Hungary* Iceland
India* Indonesia Ireland* Israel*
Italy Latvia Lithuania* Luxembourg*
Mexico Netherlands* New Zealand Norway
Poland Portugal Romania Saudi Arabia
Singapore* Slovenia South Africa South Korea
Spain Sweden Switzerland* Turkey
United Arab Emirates* United Kingdom United States Uruguay
-0.22
1.48 2.09 0.63
-0.09 0.95 -0.19 -0.28
0.01 4.67 0.70 1.14
0.13
1.30
0.34
2.13
-0.25
0.97
-1.15
0.51
-1.55 -0.07
2.17
-2.10
-0.10
0.66
0.56
8.92
-0.10 0.92 -0.23
0.55
0.95 0.42 0.06
1.61
1.26 0.36
-0.22 -0.36
0.94 0.41
3.15
-0.49
4.13 0.55 1.07
-0.05
Net AI talent migration (per 10,000 LinkedIn members)
Net AI talent migration per 10,000 LinkedIn members by geographic area, 2019–24
Source: LinkedIn, 2024 | Chart: 2025 AI Index report
Figure 4.2.237
4.2 Jobs
Chapter 4: Economy
7 Asterisks indicate that a country’s y-axis label is scaled dierently than the y-axis label for the other countries.

243
Articial Intelligence
Index Report 2025
Table of Contents Chapter 4 Preview
Highlight:
Measuring AI’s Current Economic Integration
Analysis of over 4 million real-world AI interactions
provides comprehensive empirical evidence of how AI
is being integrated across economic sectors. A recent
Anthropic study examined usage patterns of their AI
model classifying users via the U.S. Department of Labor’s
O*NET occupational framework, oering concrete data
on which industries and job functions are leveraging
AI. More specically, the Anthropic team analyzed user
conversations with their Claude.AI model to identify the
tasks and occupations most frequently using AI.
The analysis reveals that while all sectors make some
use of current AI, the dominant sectors are technical
and creative. As shown in Figure 4.2.24, computer and
mathematical occupations dominate, accounting for
37.2% of all AI interactions. Arts, design, entertainment,
sports, and media occupations follow at 10.3%, with
educational instruction and library occupations also
showing signicant adoption.
Figure 4.2.23
4.2 Jobs
Chapter 4: Economy
0.30%0.10%
0.80% 0.90%
0.90% 6.40%
1.40% 10.30%
1.60% 2.10%
1.70% 4.50%
2.00%0.50%
2.30%0.40%
2.90%0.10%
3.40% 37.20%
3.90%0.70%
4.10%0.40%
4.70%0.30%
5.80% 9.30%
5.80%2.90%
6.10%2.60%
6.60%5.90%
6.90%4.50%
8.70%0.50%
8.80%2.30%
9.10%0.30%
12.20%7.90%
0% 10% 20% 30% 40%
Farming, shing, and forestry
Legal
Life, physical, and social science
Arts, design, entertainment, sports, and media
Community and social service
Architecture and engineering
Personal care and service
Protective service
Building and grounds cleaning and maintenance
Computer and mathematical
Installation, maintenance, and repair
Construction and extraction
Healthcare support
Educational instruction and library
Production
Healthcare practitioners and technical
Business and nancial operations
Management
Food preparation and serving related
Sales and related
Transportation and material moving
Oce and administrative support
% of Claude conversations
% of US workers
Claude usage rate vs. US workforce distribution
Occupation
Occupational representation in Claude usage data vs. US workforce distribution
Source: Handa et al., 2025 | Chart: 2025 AI Index report

244
Articial Intelligence
Index Report 2025
Table of Contents Chapter 4 Preview
Highlight:
Measuring AI’s Current Economic Integration (cont’d)
4.2 Jobs
Chapter 4: Economy
The AI usage patterns demonstrate a clear connection to
wage levels and required skills. Figure 4.2.25 illustrates
that AI adoption peaks in occupations within the upper
wage quartile but drops signicantly at both wage
extremes. Jobs requiring considerable preparation
(typically bachelor’s degree-level) show 50% higher usage
than their baseline workforce representation, while both
minimal-preparation and extensive-preparation roles
show lower adoption rates.
Figure 4.2.25
Bioinformatics technicians
Computer programmers
Copywriters
Obstetricians and gynecologists
Software developers, applications
Tutors
0 50 100 150 200
0%
1%
2%
3%
4%
5%
6%
Median annual wage (in thousands of US dollars)
% of Claude conversations
Occupational usage of Claude by median annual wage
Source: Handa et al., 2025 | Chart: 2025 AI Index report

245
Articial Intelligence
Index Report 2025
Table of Contents Chapter 4 Preview
Highlight:
Measuring AI’s Current Economic Integration (cont’d)
4.2 Jobs
Chapter 4: Economy
The Anthropic study nds that approximately 36% of
occupations use AI for at least a quarter of their associated
tasks (Figure 4.2.26), indicating substantial penetration
beyond technical elds. However, deep integration
remains rare: Only about 4% of occupations show AI
usage across 75% or more of their tasks, suggesting that
wholesale automation of entire job categories is not yet
occurring.
Figure 4.2.26
Depth of AI usage across organizations
Source: Handa et al., 2025

246
Articial Intelligence
Index Report 2025
Table of Contents Chapter 4 Preview
Highlight:
Measuring AI’s Current Economic Integration (cont’d)
4.2 Jobs
Chapter 4: Economy
The analysis reveals how AI is being used within
organizations. As shown in Figure 4.2.27, 57% of AI
interactions demonstrate augmentative patterns
(enhancing human capabilities) while 43% show
automation patterns. This split suggests current AI
implementation tends toward complementing rather than
replacing human workers. The study nds that cognitive
skills like critical thinking and writing show high presence
in AI interactions, while physical and managerial skills
show minimal presence (Figure 4.2.28).
31.33% 23.27%
14.80% 27.75%
0% 10% 20% 30% 40% 50% 60%
Automation
Augmentation
Validation Task iteration Learning Feedback loop Directive
% of Claude conversations
Percentage of Claude conversations by type of task execution
Source: Handa et al., 2025 | Chart: 2025 AI Index report
Figure 4.2.27
Figure 4.2.28
Distribution of occupational skills exhibited by Claude in conversations
Source: Handa et al., 2025

247
Articial Intelligence
Index Report 2025
Table of Contents Chapter 4 Preview
This section monitors AI investment trends,
leveraging data from Quid, which analyzes
investment data from more than 8 million
companies worldwide, both public and private.
Employing natural language processing, Quid
sifts through vast unstructured datasets—
including news aggregations, blogs, company
records, and patent databases—to detect
patterns and insights. Additionally, Quid is
constantly expanding its database to include
more companies, sometimes resulting in higher
reported investment volumes for specic years.
For the rst time, this year’s investment section
in the AI Index includes data on generative AI
investments.
4.3 Investment
Corporate Investment
Figure 4.3.1 illustrates the trend in global corporate AI investment from
2013 to 2024, including mergers and acquisitions, minority stakes, private
investments, and public oerings.
In 2024, the total investment grew to $252.3 billion, an increase of 25.5%
from 2023. The most signicant upturn occurred in private investment,
which rose by 44.5% compared with the previous year, while mergers and
acquisitions increased by 12.1%. Over the past decade, AI-related investments
have increased nearly thirteenfold.
20.06 37.32
25.72
43.1 58.18
73.79
145.4
113.01
104.34
150.79
88.19
24.68
21.89
36.43
39.83
175.36
121.39
82.26
92.19
14.57 19.04 25.43 33.82
53.72
79.62
103.27
221.87
360.73
253.25
201
252.33
2013 2014 2015 2016 2017 2018 2019 2020 2021 2022 2023 2024
0
50
100
150
200
250
300
350
Merger/acquisition
Minority stake
Private investment
Public oering
Total investment (in billions of US dollars)
Global corporate investment in AI by investment activity, 2013–24
Source: Quid, 2024 | Chart: 2025 AI Index report
Figure 4.3.1
4.3 Investment
Chapter 4: Economy

248
Articial Intelligence
Index Report 2025
Table of Contents Chapter 4 Preview
Startup Activity
This section analyzes private investment trends in AI startups
that have received over $1.5 million in investment since 2013.
Global Trends
Global private AI investment increased 44.5% between 2023
and 2024, marking the rst year-over-year growth since
2021 (Figure 4.3.2). Despite recent uctuations, private AI
investment globally has grown substantially in the last decade.
150.79
2013 2014 2015 2016 2017 2018 2019 2020 2021 2022 2023 2024
0
20
40
60
80
100
120
140
Total investment (in billions of US dollars)
Global private investment in AI, 2013–24
Source: Quid, 2024 | Chart: 2025 AI Index report
Figure 4.3.2
4.3 Investment
Chapter 4: Economy

249
Articial Intelligence
Index Report 2025
Table of Contents Chapter 4 Preview
Funding for generative AI continued to increase sharply
(Figure 4.3.3). In 2024, the sector attracted $33.9 billion,
representing an 18.7% increase from 2023 and over 8.5
times the investment of 2022. Furthermore, generative
AI accounted for more than a fth of all AI-related private
investment in 2024.
33.94
2019 2020 2021 2022 2023 2024
0
5
10
15
20
25
30
35
Total investment (in billions of US dollars)
Global private investment in generative AI, 2019–24
Source: Quid, 2024 | Chart: 2025 AI Index report
Figure 4.3.3
4.3 Investment
Chapter 4: Economy

250
Articial Intelligence
Index Report 2025
Table of Contents Chapter 4 Preview
2,049
2013 2014 2015 2016 2017 2018 2019 2020 2021 2022 2023 2024
0
500
1,000
1,500
2,000
Number of companies
Number of newly funded AI companies in the world, 2013–24
Source: Quid, 2024 | Chart: 2025 AI Index report
214
2019 2020 2021 2022 2023 2024
0
50
100
150
200
Number of companies
Number of newly funded generative AI companies in the world, 2019–24
Source: Quid, 2024 | Chart: 2025 AI Index report
The number of newly funded AI companies in 2024 jumped
to 2,049, an 8.4% increase over the previous year (Figure
4.3.4). In addition, 2024 registered an increase in the number
of newly funded generative AI companies, with 214 new
startups receiving funding, compared to 179 in 2023, and 31
in 2019 (Figure 4.3.5).
Figure 4.3.4
Figure 4.3.5
4.3 Investment
Chapter 4: Economy

251
Articial Intelligence
Index Report 2025
Table of Contents Chapter 4 Preview
Figure 4.3.6 visualizes the average size of AI private
investment events, calculated by dividing the total yearly
AI private investment by the total number of AI private
investment events. From 2023 to 2024, the average increased
signicantly, growing from $31.6 million to $45.4 million.
Figure 4.3.7 reports AI funding events disaggregated by
size. In 2024, AI private investment events increased across
funding size categories exceeding $100 million and decreased
or remained constant in smaller categories. In 2024, there
were 15 AI private investment events that involved funding
sizes greater than $1 billion.
45.43
2013 2014 2015 2016 2017 2018 2019 2020 2021 2022 2023 2024
0
5
10
15
20
25
30
35
40
45
Average investment (in millions of US dollars)
Average size of global AI private investment events, 2013–24
Source: Quid, 2024 | Chart: 2025 AI Index report
Over 1 billion
500 million – 1 billion
100 million – 500 million
50 million – 100 million
Under 50 million
Undisclosed
Total
Funding size
9
9
134
200
2,945
680
3,977
2023
15
20
143
196
2,945
207
3,526
2024
Global AI private investment events by funding size,
Source: Quid, 2024 | Table: 2025 AI Index report
2023 vs. 2024
Figure 4.3.6
Figure 4.3.7
4.3 Investment
Chapter 4: Economy

252
Articial Intelligence
Index Report 2025
Table of Contents Chapter 4 Preview
Regional Comparison by Funding Amount
The United States once again led the world in terms of total
AI private investment. In 2024, the $109.1 billion invested
in the United States was 11.7 times greater than the amount
invested in the next highest country, China ($9.3 billion), and
24.1 times the amount invested in the United Kingdom ($4.5
billion) (Figure 4.3.8). Other notable countries that rounded out
the top 15 in 2024 include Sweden ($4.3 billion), Austria ($1.5
billion), the Netherlands ($1.1 billion), and Italy ($0.9 billion).
0.86
0.93
1.09
1.16
1.33
1.36
1.51
1.77
1.97
2.62
2.89
4.34
4.52
9.29
109.08
0 5 10 15 20 25 30 35 40 45 50 55 60 65 70 75 80 85 90 95 100 105 110 115
Italy
Japan
Netherlands
India
South Korea
Israel
Austria
United Arab Emirates
Germany
France
Canada
Sweden
United Kingdom
China
United States
Total investment (in billions of US dollars)
Global private investment in AI by geographic area, 2024
Source: Quid, 2024 | Chart: 2025 AI Index report
Figure 4.3.8
4.3 Investment
Chapter 4: Economy

253
Articial Intelligence
Index Report 2025
Table of Contents Chapter 4 Preview
3.67
3.90
3.99
5.89
7.27
7.27
8.96
11.10
11.29
13.27
14.96
15.31
28.17
119.32
470.92
0 20 40 60 80 100 120 140 160 180 200 220 240 260 280 300 320 340 360 380 400 420 440 460 480
United Arab Emirates
Switzerland
Australia
Japan
Sweden
Singapore
South Korea
France
India
Germany
Israel
Canada
United Kingdom
China
United States
Total investment (in billions of US dollars)
Global private investment in AI by geographic area, 2013–24 (sum)
Source: Quid, 2024 | Chart: 2025 AI Index report
Figure 4.3.9
When aggregating private AI investments since 2013, the
country rankings remain the same: The United States leads
with $470.9 billion invested, followed by China with $119.3
billion, and the United Kingdom with $28.2 billion (Figure
4.3.9). Other countries that have attracted signicant AI
investment over the past decade include Israel ($15.0 billion),
Singapore ($7.3 billion), and Sweden ($7.3 billion).
4.3 Investment
Chapter 4: Economy

254
Articial Intelligence
Index Report 2025
Table of Contents Chapter 4 Preview
Figure 4.3.10, which looks at AI private investment over
time by geographic area, suggests that the gap in private
investments between the United States and other regions is
widening. While AI private investments have decreased in
China (-1.9%) and increased in Europe (+60%) since 2023, the
United States has seen a signicant increase (+50.7%) during
the same period—and a +78.3% increase since 2022.
2013 2014 2015 2016 2017 2018 2019 2020 2021 2022 2023 2024
0
20
40
60
80
100
Total investment (in billions of US dollars)
9.29, China
19.42, Europe
109.08, United States
Global private investment in AI by geographic area, 2013–24
Source: Quid, 2024 | Chart: 2025 AI Index report
Figure 4.3.10
4.3 Investment
Chapter 4: Economy

255
Articial Intelligence
Index Report 2025
Table of Contents Chapter 4 Preview
2019 2020 2021 2022 2023 2024
0
5
10
15
20
25
30
Total investment (in billions of US dollars)
1.49, Europe
2.11, China
29.04, United States
Global private investment in generative AI by geographic area, 2019–24
Source: Quid, 2024 | Chart: 2025 AI Index report
The disparity in regional AI private investment becomes
particularly pronounced when examining generative AI-
related investments. For instance, in 2023, the United States
outpaced the combined investments of China and Europe in
generative AI by approximately $21.8 billion (Figure 4.3.11). By
2024, this gap widened to $25.4 billion.
Figure 4.3.11
4.3 Investment
Chapter 4: Economy

256
Articial Intelligence
Index Report 2025
Table of Contents Chapter 4 Preview
18
22
23
24
36
39
42
51
52
59
67
74
98
116
1,073
0 100 200 300 400 500 600 700 800 900 1,000 1,100
Spain
Switzerland
Australia
Netherlands
Israel
Singapore
Japan
Canada
South Korea
France
Germany
India
China
United Kingdom
United States
Number of companies
Number of newly funded AI companies by geographic area, 2024
Source: Quid, 2024| Chart: 2025 AI Index report
Regional Comparison by Newly Funded AI Companies
This section examines the number of newly funded AI
companies across dierent geographic regions. Consistent
with trends in private investment, the United States leads all
regions with 1,073 new AI companies, followed by the United
Kingdom with 116, and China with 98 (Figure 4.3.12).
Figure 4.3.12
4.3 Investment
Chapter 4: Economy

257
Articial Intelligence
Index Report 2025
Table of Contents Chapter 4 Preview
A similar trend is evident in the aggregate data since 2013. In the last decade, the number of newly funded AI companies in the
United States is around 4.3 times the amount in China, and 7.9 times the amount in the United Kingdom (Figure 4.3.13).
116
117
154
178
239
270
388
394
434
468
481
492
885
1,605
6,956
0 500 1,000 1,500 2,000 2,500 3,000 3,500 4,000 4,500 5,000 5,500 6,000 6,500 7,000
Netherlands
Spain
Switzerland
Australia
Singapore
South Korea
Japan
Germany
India
France
Canada
Israel
United Kingdom
China
United States
Number of companies
Number of newly funded AI companies by geographic area, 2013–24 (sum)
Source: Quid, 2024 | Chart: 2025 AI Index report
Figure 4.3.13
4.3 Investment
Chapter 4: Economy

258
Articial Intelligence
Index Report 2025
Table of Contents Chapter 4 Preview
Figure 4.3.14 presents data on newly funded AI companies
in specic geographic regions, highlighting a decade-long
pattern in which the United States consistently surpasses
both Europe and China. Since 2022, the United States, along
with Europe, has seen signicant increases in the number of
new AI companies, in contrast to China, which experienced a
second consecutive annual decline.
Figure 4.3.14
2013 2014 2015 2016 2017 2018 2019 2020 2021 2022 2023 2024
0
200
400
600
800
1,000
1,200
Number of companies
109, China
447, Europe
1,143, United States
Number of newly funded AI companies by geographic area, 2013–24
Source: Quid, 2024 | Chart: 2025 AI Index report
4.3 Investment
Chapter 4: Economy

259
Articial Intelligence
Index Report 2025
Table of Contents Chapter 4 Preview
Focus Area Analysis
Quid also disaggregates private AI investment by focus area.
Figure 4.3.15 compares global private AI investment by focus
area in 2024 versus 2023. The focus areas that attracted the
most investment in 2024 were AI infrastructure/research/
governance ($37.3 billion); data management and processing
($16.6 billion); and medical and healthcare ($11 billion). The
prominence of AI infrastructure, research, and governance
reects large investments in companies specically building
AI applications, such as OpenAI, Anthropic, and xAI.
0 2 4 6 8 10 12 14 16 18 20 22 24 26 28 30 32 34 36 38
Creative, music, video content
Content creation/translation
Agritech
IoT
Quantum computing
Ed tech
Retail
AR/VR
Insurtech
Supply chain
Semantic search
Business operations
Marketing, digital ads
Energy, oil, and gas
Drones
Robotics
Cybersecurity, data protection
NLP, customer support
Semiconductors
Manufacturing
Fintech
AV
Medical and health care
Data management, processing
AI infrastructure/research/governance
2024
2023
Total investment (in billions of US dollars)
Global private investment in AI by focus area, 2023 vs. 2024
Source: Quid, 2024 | Chart: 2025 AI Index report
Figure 4.3.15
Figure 4.3.16 presents trends over time in AI focus area investments. As noted earlier, most focus areas saw a boost in investments
in the last year. While still substantial, investment in NLP, customer support peaked in 2021 and has since then declined.
4.3 Investment
Chapter 4: Economy

260
Articial Intelligence
Index Report 2025
Table of Contents Chapter 4 Preview
2018 2020 2022 2024
0
10
20
30
2018 2020 2022 2024
0
10
20
30
2018 2020 2022 2024
0
10
20
30
2018 2020 2022 2024
0
10
20
30
2018 2020 2022 2024
0
10
20
30
2018 2020 2022 2024
0
10
20
30
2018 2020 2022 2024
0
10
20
30
2018 2020 2022 2024
0
10
20
30
2018 2020 2022 2024
0
10
20
30
2018 2020 2022 2024
0
10
20
30
2018 2020 2022 2024
0
10
20
30
2018 2020 2022 2024
0
10
20
30
2018 2020 2022 2024
0
10
20
30
2018 2020 2022 2024
0
10
20
30
2018 2020 2022 2024
0
10
20
30
2018 2020 2022 2024
0
10
20
30
2018 2020 2022 2024
0
10
20
30
2018 2020 2022 2024
0
10
20
30
2018 2020 2022 2024
0
10
20
30
2018 2020 2022 2024
0
10
20
30
2018 2020 2022 2024
0
10
20
30
2018 2020 2022 2024
0
10
20
30
2018 2020 2022 2024
0
10
20
30
2018 2020 2022 2024
0
10
20
30
2018 2020 2022 2024
0
10
20
30
Total investment (in billions of US dollars)
AI infrastructure/research/governance AR/VR AV Agritech
Business operations Content creation/translation Creative, music, video content Cybersecurity, data protection
Data management, processing Drones Ed tech Energy, oil, and gas
Fintech Insurtech IoT Manufacturing
Marketing, digital ads Medical and health care NLP, customer support Quantum computing
Retail Robotics Semantic search Semiconductors
Supply chain
37.27
1.35
9.43
0.81
1.52 0.76 0.75 3.73
16.59
2.58 0.97 2.02
6.88
1.36 0.84
6.58
1.60
10.80
4.18 0.96
1.17 3.29 1.43 5.53
1.40
Global private investment in AI by focus area, 2018–24
Source: Quid, 2024 | Chart: 2025 AI Index report
Figure 4.3.16
4.3 Investment
Chapter 4: Economy

261
Articial Intelligence
Index Report 2025
Table of Contents Chapter 4 Preview
4.4 Corporate Activity
Industry Usage
This section incorporates insights from McKinsey’s publications on the state of
AI alongside data from prior editions. The 2024 McKinsey analysis is based on two
surveys spanning 2,854 respondents across various regions, industries, company sizes,
functional areas, and tenures.
Use of AI Capabilities
Business use of AI increased signicantly after stagnating between 2017 and 2023. The
latest McKinsey report reveals that 78% of surveyed respondents say their organizations
have begun to use AI in at least one business function, marking a signicant increase
from 55% in 2023 (Figure 4.4.1). Use of generative AI, which was covered for the rst
time in last year’s survey, more than doubled year over year, with 71% of respondents
in 2024 saying their organizations regularly use the technology in at least one business
function, compared to 33% in 2023.
This section examines the practical
application of AI by corporations,
highlighting industry usage trends,
how businesses are integrating AI,
the specic AI technologies deemed
most benecial, and the impact of AI
usage on nancial performance.
4.4 Corporate Activity
2017 2018 2019 2020 2021 2022 2023 2024
0%
10%
20%
30%
40%
50%
60%
70%
80%
% of respondents
71%, GenAI
78%, AI
Share of respondents who say their organization uses AI in at least one function, 2017–24
Source: McKinsey & Company Survey, 2024 | Chart: 2025 AI Index report
Figure 4.4.1
Chapter 4: Economy

262
Articial Intelligence
Index Report 2025
Table of Contents Chapter 4 Preview
Figure 4.4.2 shows AI usage by industry and AI function in 2024. The greatest usage was in IT for tech (48%), followed by product
and/or service development for tech (47%) and marketing and sales for tech (47%).
Figure 4.4.28
4.4 Corporate Activity
Chapter 4: Economy
8 “Advanced industries” comprises respondents from sectors such as advanced electronics, aerospace and defense, automotive and assembly, and semiconductors. “Energy and materials”
encompasses respondents from agriculture, chemicals, electric power and natural gas, metals and mining, oil and gas, as well as paper, forest products, and packaging.

263
Articial Intelligence
Index Report 2025
Table of Contents Chapter 4 Preview
Organizations have reported both cost reductions and
revenue increases where they have started using AI, but
most commonly at low levels (Figure 4.4.3). The areas where
respondents most frequently reported that their use of AI
has resulted in cost savings were service operations (49%),
supply chain and inventory management (43%), and software
engineering (41%). For revenue gains, the functions that most
commonly beneted from their use of AI include marketing
and sales (71%), supply chain and inventory management
(63%), and service operations (57%).
28%
9%20%
8%8%21%
8%11%
11%29%
16%28%
11%22%
17%20%
9%15%
34%
34%
37%
23%
43%
49%
37%
41%
25%
Other corporate functions
Software engineering
IT
Service operations
Supply chain and inventory management
Product or service development
Human resources
Risk, legal, and compliance
Marketing and sales
23% 44%
10% 16% 30%
10% 14% 39%
12% 10% 35%
11% 14% 19%
71%
56%
63%
57%
44%
Decrease by <10% Decrease by 10–19% Decrease by ≥20% Increase by >10% Increase by 6–10% Increase by ≤5%
Function
Cost decrease and revenue increase from analytical AI use by function, 2024
Source: McKinsey & Company Survey, 2024 | Chart: 2025 AI Index report
% of respondents
Figure 4.4.3
4.4 Corporate Activity
Chapter 4: Economy

264
Articial Intelligence
Index Report 2025
Table of Contents Chapter 4 Preview
Figure 4.4.4 presents global AI usage by organizations,
segmented by regions. In 2024, surveyed respondents
in every region reported increased use of AI compared
with 2023. One of the most signicant year-over-year
growth rates in AI use was seen in Greater China, where
organizations’ reported use grew by 27 percentage points.
North America remains the leader in use of AI (82%), but
only by a small margin. Europe also experienced a signicant
increase in AI usage rates, growing by 23 percentage points
to 80% since 2023.
78%
72%
80%
82%
75%
77%
55%
58%
57%
61%
48%
49%
0% 10% 20% 30% 40% 50% 60% 70% 80% 90% 100%
Developing markets
(incl. India,
Central/South America,
MENA)
Greater China
(incl. Hong Kong,
Taiwan, Macau)
North America
Europe
Asia-Pacic
All geographies
2024
2023
% of respondents
AI use by organizations in the world, 2023 vs. 2024
Source: McKinsey & Company Survey, 2024 | Chart: 2025 AI Index report
Figure 4.4.4
4.4 Corporate Activity
Chapter 4: Economy

265
Articial Intelligence
Index Report 2025
Table of Contents Chapter 4 Preview
Deployment of AI Capabilities
How are organizations deploying AI? Figure 4.4.5 highlights
the proportion of total surveyed respondents that report
using generative AI for a particular function. It is possible
for respondents to indicate that they deploy AI for multiple
purposes.
The most common application is marketing strategy content
support (27%), followed by knowledge management (19%),
personalization (19%), and design development (14%). Most of
the leading reported use cases are within the marketing and
sales function. A complementary survey of C-suite executives
in developed markets found that only 1% described their
generative AI rollouts as “mature.” Overall, most companies
are still in the early stages of capturing value at scale from AI.
4.4 Corporate Activity
Chapter 4: Economy
12%
11%
14%
11%
13%
19%
27%
11%
13%
19%
0% 5% 10% 15% 20% 25%
Scientic literature and research review
Accelerated early simulation/testing phases (i.e., rening
and accelerating targeted customer research or
interviews via gen AI’s synthesis and writing capabilities)
Sales lead identication and prioritization
Integration of gen AI into the workow of human customer
service representatives (e.g., providing real-time suggestions
for responses during human-to-human phone conversations)
Automation of sales follow-up interactions
Code creation (i.e., using code assistants, leveraging
natural-language-to-code translation, debugging,
development of tests)
Design development
Personalization (e.g., personalized creative
content generation at scale)
Knowledge management
Marketing strategy content support (i.e., drafting,
generating ideas, and presenting relevant
knowledge for creating marketing strategy)
Service operations
R&D/product development
Marketing and sales
Software engineering
Other corporate functions
% of respondents
Most common generative AI use cases by function, 2024
Source: McKinsey & Company Survey, 2024 | Chart: 2025 AI Index report
Figure 4.4.5

266
Articial Intelligence
Index Report 2025
Table of Contents Chapter 4 Preview
Figure 4.4.6 examines the proportion of respondents
that report cost decreases and revenue increases from
their organizations’ use of generative AI in each business
function. Overall, respondents report both cost reductions
and revenue increases across various functions as a result
of using generative AI, most commonly at low levels. The
areas where respondents most frequently reported cost
savings were supply chain and inventory management
(61%), service operations (58%), and both human resources
and strategy and corporate nance (56%). For revenue
gains, the functions most commonly reporting benets
from generative AI include strategy and corporate nance
(70%), supply chain and inventory management (67%), and
marketing and sales (66%).
4.4 Corporate Activity
Chapter 4: Economy
10%11%26%
13%9%29%
10%14%32%
19%7%17%
7%15%39%
7%11%39%
10%12%21%
13%16%23%
15%6%35%
19%8%16%
47%
51%
56%
43%
61%
58%
56%
52%
44%
44%
Knowledge management and other
internal functions
Strategy and corporate nance
Software engineering
IT
Service operations
Supply chain and inventory management
Product or service development
Human resources
Risk, legal, and compliance
Marketing and sales
8% 24% 34%
12% 15% 25%
19% 15% 32%
18% 14% 31%
12% 13% 31%
11% 12% 47%
66%
51%
67%
63%
70%
57%
Decrease by ≤10% Decrease by 11–19% Decrease by ≥20% Increase by >10% Increase by 6–10% Increase by ≤5%
Function
Cost decrease and revenue increase from generative AI use by function, 2024
Source: McKinsey & Company Survey, 2024 | Chart: 2025 AI Index report
% of respondents
Figure 4.4.6

267
Articial Intelligence
Index Report 2025
Table of Contents Chapter 4 Preview
Figure 4.4.7 depicts the variation in generative AI usage
among businesses across dierent regions of the world.
Across all regions, reported use of generative AI in at least one
business function reached 71% in 2024, more than doubling
from 33% in 2023. This amount is just 7 percentage points
lower than the percentage who reported using any form of AI
(78%), which is shown in Figure 4.4.1. The use gap between
AI overall and generative AI has contracted sharply from 22
percentage points in 2023 to 7 percentage points in 2024,
signaling an accelerated usage of generative AI capabilities.
North America (74%), Europe (73%), and Greater China (73%)
lead in organizations’ use of generative AI.
4.4 Corporate Activity
Chapter 4: Economy
71%
67%
73%
74%
73%
68%
33%
30%
31%
40%
31%
33%
0% 10% 20% 30% 40% 50% 60% 70% 80% 90% 100%
Developing markets
(incl. India,
Central/South America,
MENA)
Greater China
(incl. Hong Kong,
Taiwan, and Macau)
North America
Europe
Asia-Pacic
All geographies
2024
2023
% of respondents
Generative AI use by organizations in the world, 2023 vs. 2024
Source: McKinsey & Company Survey, 2024 | Chart: 2025 AI Index report
Figure 4.4.79
9 This gure highlights AI use in at least one business function.

268
Articial Intelligence
Index Report 2025
Table of Contents Chapter 4 Preview
AI’s Labor Impact
Over the last six years, the growing integration of AI into
the economy has sparked intense interest in its productivity
potential. While early adoption showed promise, quantifying
AI’s impact remained challenging until 2023, when the rst
wave of rigorous studies emerged. In 2024, a substantial
body of empirical research established clear patterns of AI’s
workplace eects across multiple domains and contexts. This
section analyzes productivity impact data from ve major
academic studies, which together represent the rst large-
scale empirical investigation of AI’s workplace eects. The
research, encompassing over 200,000 professionals across
multiple industries and contexts, reveals consistent productivity
gains ranging from 10% to 45%, with particularly strong eects
in technical, customer support, and creative tasks. These
studies employed diverse methodologies, including natural
experiments, randomized controlled trials, and large-scale
surveys, to measure AI’s impact across dierent organizational
contexts.
Productivity Trends
One of the most reputable studies on AI’s impact on
productivity, particularly generative AI, was published by
Erik Brynjolfsson, Danielle Li, and Daniel Rock in April 2023.10
Analyzing data from 5,179 customer support agents, the study
examined the staggered introduction of a generative AI-
powered conversational assistant. The researchers found that
AI adoption increased the number of issues resolved per hour
by 14.2% (Figure 4.4.8). Moreover, the study uncovered that
productivity gains emerged quickly after AI was introduced,
and AI-exposed workers maintained higher eciency even
during AI outages.
Other recently released research has conrmed the
Brynjolfsson nding. A Microsoft workplace study established
baseline productivity improvements in common workplace
tasks, with document editing increasing by 10–13% and email
processing time decreasing by 11%. Specialized roles showed
higher gains. For example, security professionals achieved 23%
faster completion times with 7% higher accuracy, and sales
teams demonstrated 39% faster response times with 25%
4.4 Corporate Activity
Chapter 4: Economy
2.97
2.60
Used AI Did not use AI
0.00
0.50
1.00
1.50
2.00
2.50
3.00
Hourly chats per customer support agent
Impact of AI on customer support agents
Source: Brynjolfsson et al., 2023 | Chart: 2024 AI Index report
Impact of AI on scientic innovation
Source: Toner-Rodgers et al., 2025 | Chart: 2025 AI Index report
Figure 4.4.9
Figure 4.4.8
higher accuracy. In scientic research, Aiden Toner-Rodgers’
study of 1,018 scientists found that those who used AI,
compared to those who did not, experienced a 44.1% increase
in materials discovery rates, a 39.4% increase in patent lings,
and a 17.2% increase in product prototypes (Figure 4.4.9).
10 The paper was published as NBER working paper 31161 in 2023 and then in the “Quarterly Journal of Economics” in 2025.

269
Articial Intelligence
Index Report 2025
Table of Contents Chapter 4 Preview
In the software development domain, two major studies
provided complementary evidence of AI’s impact. A eld
experiment with 4,867 developers found that AI assistance
increased task completion by 26.08% on average. This nding
was reinforced by another natural experiment with 187,489
developers; it documented a 12.4% increase in core coding
activities alongside a 24.9% decrease in time spent on project
management tasks.
Equalizing Eect
A consistent pattern across studies is AI’s equalizing eect
on workplace performance (Figure 4.4.10). In software
development contexts, new research has found that junior
developers experienced productivity increases of 21–40%,
while senior developers saw more modest gains of 7–16%.
This pattern was independently conrmed by other studies,
which found coding productivity increases of 14–27% for low-
ability workers compared to 5–10% for high-ability workers.
Moreover, their analysis showed AI increased exploration
of new technologies by 21.8% and generated an average
potential salary increase of $1,683 per developer annually,
suggesting AI tools are not just boosting productivity but
actively enabling skill development. This research supports
earlier 2023 and 2024 studies showing that AI-driven
productivity gains vary based on workers’ initial skill levels.
However, some research suggests that AI’s impact may work
in the opposite direction. A study by Toner-Rodgers found that
while top-performing scientists nearly doubled their output,
the bottom third saw little benet from AI’s introduction. The
study further highlighted that the key factor inuencing AI’s
impact was not prior achievement but the ability to eectively
evaluate AI-generated recommendations. This suggests that
AI tools function as powerful ampliers for those who can
leverage them eectively, regardless of experience level.
Understanding how AI aects dierent workers across
various tasks will be a crucial focus of ongoing research.
4.4 Corporate Activity
Chapter 4: Economy
AI’s productivity equalizing eects
Study Task Low-skill worker productivity gain High-skill worker productivity gain
Brynjolfsson et al., 2023 Customer support 34% Indistinguishable from zero
Dell’Acqua et al., 2023 Consulting 42.96% 16.5%
Cui et al., 2024 Software engineering 21–40% 7–16%
Homan et al., 2024 Software engineering 12–27% 5–10%
Figure 4.4.10

270
Articial Intelligence
Index Report 2025
Table of Contents Chapter 4 Preview
Adoption and Integration
The research reveals that productivity gains are strongly
correlated with comprehensive AI integration and systematic
implementation. A survey conducted by Romanian
researchers of 233 employees found that organizations with
high AI integration showed a 72% probability of signicant
productivity improvements, compared to just 3.4% for those
with minimal integration. Their analysis documented a clear
spectrum of productivity improvements across the entire
study sample, with 46.8% of respondents reporting gains of
0–20%, 26.2% seeing gains of 20–40%, and 18.4% achieving
improvements of 40–60%. A smaller proportion saw even
larger gains, with 7.7% reporting increases of 60–80% and
0.9% achieving improvements of 80–100% (Figure 4.4.11).
Workforce Impact
The introduction of AI tools has led to signicant shifts in both
task allocation and team structures. The Microsoft workplace
study found that AI automation enabled a 45% reduction in
perceived mental demand (measured as 30/100 vs. 55/100
on their cognitive load scale), closed 84.6% of the accuracy
gap for nonnative English speakers, and led to 49% more key
information being included in professional reports. These
improvements were particularly pronounced among “power
users” (users who are intimately familiar with AI, as dened
by using it at least several times a week) with 29% of AI
users in this category saving more than 30 minutes per day.
Research from the Harvard Business School documented
that AI adoption led to reduced collaborative overhead, with
projects requiring 79.3% fewer collaborators (team members)
on average.
These changes are reshaping professional roles in
fundamental ways. Toner-Rodgers’ study observed a
dramatic shift in how scientists spend their time, with idea
generation decreasing from 39% to 16% of work hours while
judgment tasks increased from 23% to 40%. Debates about
AI, like those surrounding past technological advancements,
often center on automation versus augmentation—whether
AI will replace jobs or enhance human work. While concrete
4.4 Corporate Activity
Chapter 4: Economy
46.78%
26.18%
18.45%
7.73%
0.86%
0–20% 20–40% 40–60% 60–80% 80–100%
0%
10%
20%
30%
40%
50%
Productivity gains
% of respondents
Distribution of productivity gains from AI use
Source: Necula et al., 2024 | Chart: 2025 AI Index report
Figure 4.4.11
data on AI-driven workforce changes remains limited,
research is shedding light on how people perceive its impact
on employment.
The Romanian survey data suggests varied expectations for
AI’s impact on workforce size, with 43% of organizations
anticipating decreases, 30% expecting little change, 15%
projecting increases, and 12% remaining uncertain about
long-term implications. A McKinsey survey of executives
found that 31% expect AI to reduce workforce size, while
only 19% foresee an increase (Figure 4.4.12). In spite of claims
about the increase in productivity of software engineers
due to generative AI, the survey shows that their number is
expected to increase, consistent with the Jevons Paradox.
Notably, the share predicting workforce reductions has
declined from last year, suggesting business leaders are
becoming less convinced that AI will shrink organizational
workforces (Figure 4.4.13).

271
Articial Intelligence
Index Report 2025
Table of Contents Chapter 4 Preview
4.4 Corporate Activity
Chapter 4: Economy
8%
15%
10%
10%
8%
8%
8%
7%
7%
6%
5%
9%
19%
17%
17%
15%
14%
13%
10%
10%
9%
7%
14%
24%
18%
18%
16%
14%
11%
11%
10%
10%
9%
38%
38%
33%
29%
26%
25%
25%
21%
20%
19%
15%
8%
18%
17%
17%
16%
15%
13%
11%
7%
7%
6%
6%
15%
11%
10%
8%
8%
7%
5%
5%
4%
4%
5%
10%
10%
10%
9%
8%
8%
6%
4%
12%
15%
15%
14%
13%
12%
11%
11%
10%
9%
9%
0% 20% 40% 60% 80% 100
%
IT
Risk, legal, and
compliance
Strategy and
corporate nance
Product and/or
service development
Software engineering
Human resources
Manufacturing
Supply chain/
i
nventory management
Marketing and sales
Service operations
Overall
Decrease by >20% Decrease by 11–20% Decrease by 3–10% Little or no change
Increase by 3–10% Increase by 11–20% Increase by >20% Don’t know
% of respondents
Expectations about the impact of generative AI on organizations’ workforces in the next 3 years, 2024
S
ource: McKinsey & Company Survey, 2024 | Chart: 2025 AI Index report
Figure 4.4.12

272
Articial Intelligence
Index Report 2025
Table of Contents Chapter 4 Preview
4.4 Corporate Activity
Chapter 4: Economy
8%
5%
10%
31%
14%
10%
8%
14%
3%
4%
8%
30%
25%
10%
8%
12%
0% 10% 20% 30% 40% 50%
Don’t know
Decrease by >20%
Decrease by 11–20%
Decrease by 3–10%
Little or no change
Increase by 3–10%
Increase by 11–20%
Increase by >20%
46%
17%
14%
12%
11%
38%
18%
17%
20%
8%
0% 10% 20% 30% 40% 50%
Don’t know
≤5%
6–10%
11–20%
>20%
2024
2023
% of respondents % of respondents
Change in the number of employees
Share of employees expected to be reskilled
Expectations about the impact of AI on organizations’ workforces in the next 3 years, 2023 vs. 2024
Source: McKinsey & Company Survey, 2023–24 | Chart: 2025 AI Index report
Figure 4.4.13

273
Articial Intelligence
Index Report 2025
Table of Contents Chapter 4 Preview
4.5 Robot Deployments
The deployment of robots equipped
with AI-based software technologies
oers a window into the real-world
application of AI-ready infrastructure.
This section draws on data from the
International Federation of Robotics
(IFR), a nonprot organization
dedicated to advancing the robotics
industry. Annually, the IFR publishes
the World Robotics Reports, which
track global robot installation trends.11
Chapter 4: Economy
4.5 Robot Deployments
Aggregate Trends
The following section includes data on the installation and operation of industrial
robots, which are dened as an “automatically controlled, reprogrammable,
multipurpose manipulator, programmable in three or more axes, which can be either
xed in place or mobile for use in industrial automation applications.”
Figure 4.5.1 reports the total number of industrial robots installed worldwide by year.
In 2023, industrial robot installations decreased slightly, with 541,000 units marking a
2.2% decrease from 2022. This reects the rst year-over-year decrease since 2019.
11 Due to the timing of the IFR report, the most recent data is from 2023. Every year, the IFR revisits data collected for previous years and will occasionally update the data if more accurate
gures become available. Therefore, some of the data reported in this year’s report might dier slightly from data reported in previous years.
541
2012 2013 2014 2015 2016 2017 2018 2019 2020 2021 2022 2023
0
100
200
300
400
500
Number of industrial robots installed (in thousands)
Number of industrial robots installed in the world, 2012–23
Source: International Federation of Robotics (IFR), 2024 | Chart: 2025 AI Index report
Figure 4.5.1

274
Articial Intelligence
Index Report 2025
Table of Contents Chapter 4 Preview
The global operational stock of industrial robots reached 4,282,000 in 2023, up from 3,904,000 in 2022 (Figure 4.5.2). Since
2012, both the installation and utilization of industrial robots have steadily increased.
4.5 Robot Deployments
Chapter 4: Economy
4,282
2012 2013 2014 2015 2016 2017 2018 2019 2020 2021 2022 2023
0
500
1,000
1,500
2,000
2,500
3,000
3,500
4,000
4,500
Number of industrial robots (in thousands)
Operational stock of industrial robots in the world, 2012–23
Source: International Federation of Robotics (IFR), 2024 | Chart: 2025 AI Index report
Figure 4.5.2

275
Articial Intelligence
Index Report 2025
Table of Contents Chapter 4 Preview
Industrial Robots: Traditional vs. Collaborative Robots
There is a distinction between traditional robots, which operate
in place of humans, and collaborative robots, designed to work
alongside them.12 The robotics community is increasingly
enthusiastic about collaborative robots due to their safety,
exibility, scalability, and ability to learn iteratively.
Figure 4.5.3 reports the number of industrial robots installed
in the world by type. In 2017, collaborative robots accounted
for just 2.8% of all new industrial robot installations. By 2023,
the number rose to 10.5%.
4.5 Robot Deployments
Chapter 4: Economy
42 58 57
389 405
366 363
484
495 484
400
424
387 389
526
553 541
2017 2018 2019 2020 2021 2022 2023
0
100
200
300
400
500
Traditional
Collaborative
Number of industrial robots installed (in thousands)
Number of industrial robots installed in the world by type, 2017–23
Source: International Federation of Robotics (IFR), 2024 | Chart: 2025 AI Index report
Figure 4.5.3
12 More detail on how the IFR denes collaborative robots can be found here.

276
Articial Intelligence
Index Report 2025
Table of Contents Chapter 4 Preview
By Geographic Area
Country-level data on robot installations can suggest
which nations prioritize the integration of robots into their
economies. In 2023, China led the world with 276,300
industrial robot installations, six times more than Japan’s
46,100 and 7.3 times more than the United States’ 37,600
(Figure 4.5.4). South Korea and Germany followed with
31,400 and 28,400 installations, respectively.
4.5 Robot Deployments
Chapter 4: Economy
3.60
3.80
4.30
4.40
4.40
5.10
5.80
6.40
8.50
10.40
28.40
31.40
37.60
46.10
276.30
0 30 60 90 120 150 180 210 240 270
Thailand
United Kingdom
Canada
Turkey
Taiwan
Spain
Mexico
France
India
Italy
Germany
South Korea
United States
Japan
China
Number of industrial robots installed (in thousands)
Number of industrial robots installed by geographic area, 2023
Source: International Federation of Robotics (IFR), 2024 | Chart: 2025 AI Index report
Figure 4.5.4

277
Articial Intelligence
Index Report 2025
Table of Contents Chapter 4 Preview
Since surpassing Japan in 2013 as the leading installer of industrial robots, China has signicantly widened the gap with the
nearest country. In 2013, China’s installations accounted for 20.8% of the global total, reaching 51.1% by 2023 (Figure 4.5.5).
4.5 Robot Deployments
Chapter 4: Economy
2011 2012 2013 2014 2015 2016 2017 2018 2019 2020 2021 2022 2023
50
100
150
200
250
300
Number of industrial robots installed (in thousands)
28, Germany
31, South Korea
38, United States
46, Japan
276, China
Number of new industrial robots installed in top 5 countries, 2011–23
Source: International Federation of Robotics (IFR), 2024 | Chart: 2025 AI Index report
Figure 4.5.5

278
Articial Intelligence
Index Report 2025
Table of Contents Chapter 4 Preview
Since 2021, China has installed more industrial robots than the rest of the world combined, but the margin decreased in 2023
compared to 2022 (Figure 4.5.6). Despite this year-over-year decline, the sustained trend underscores China’s dominance in
industrial robot installations.
4.5 Robot Deployments
Chapter 4: Economy
2016 2017 2018 2019 2020 2021 2022 2023
0
50
100
150
200
250
300
Number of industrial robots installed (in thousands)
265, Rest of the world
276, China
Number of industrial robots installed (China vs. rest of the world), 2016–23
Source: International Federation of Robotics (IFR), 2024 | Chart: 2025 AI Index report
Figure 4.5.6

279
Articial Intelligence
Index Report 2025
Table of Contents Chapter 4 Preview
According to the IFR report, seven countries reported an
annual increase in industrial robot installations from 2022 to
2023 (Figure 4.5.7). The countries with the highest growth rates
include India (59%), the United Kingdom (51%), and Canada
(37%). The geographic areas with the steepest declines include
Taiwan (-43%), France (-13%), and Japan and Italy (both -9%).
4.5 Robot Deployments
Chapter 4: Economy
-43%
-13%
-9%
-9%
-5%
-5%
-3%
-1%
7%
9%
15%
31%
37%
51%
59%
−40% −30% −20% −10% 0% 10% 20% 30% 40% 50% 60%
Taiwan
France
Japan
Italy
China
United States
Mexico
South Korea
Germany
Thailand
Turkey
Spain
Canada
United Kingdom
India
Annual growth rate of industrial robots installed
Annual growth rate of industrial robots installed by geographic area, 2022 vs. 2023
Source: International Federation of Robotics (IFR), 2024 | Chart: 2025 AI Index report
Figure 4.5.7

280
Articial Intelligence
Index Report 2025
Table of Contents Chapter 4 Preview
Country-Level Data on Service Robotics
Another important class of robots is service robots, which
the International Organization for Standardization denes as
a robot “that performs useful tasks for humans or equipment
excluding industrial automation applications.”13 Such robots
can, for example, be used in medical settings and for
professional cleaning. In 2023, more service robots were
installed for every application category than in 2022, with the
exception of medical robots (Figure 4.5.8). More specically,
the number of service robots installed in agricultural and
hospitality settings increased 2.5 and 2.2 times, respectively.
4.5 Robot Deployments
Chapter 4: Economy
86
7
9
25
8
113
12
6
54
20
0 10 20 30 40 50 60 70 80 90 100 110
Transportation and logistics
Professional cleaning
Medical and health care
Hospitality
Agriculture
2023
2022
Number of service robots installed (in thousands)
Number of service robots installed in the world by application area, 2022 vs. 2023
Source: International Federation of Robotics (IFR), 2024 | Chart: 2025 AI Index report
Figure 4.5.8
13 A more detailed denition can be accessed here.

282Table of Contents
Overview 282
Chapter Highlights 283
5.1 Notable Medical and Biological
AI Milestones 285
Protein Sequence Optimization 285
Aviary 286
AlphaProteo 287
Human Brain Mapping 287
Virtual AI Lab 288
GluFormer 289
Evolutionary Scale Modeling v3
(ESM3) 289
AlphaFold 3 290
5.2 The Central Dogma 291
Protein Sequence Analysis 291
AI-Driven Protein Sequence Models 291
Public Databases for Protein Science 293
Research and Publication Trends 294
AI-Driven Protein Science
Publications 294
Image and Multimodal AI for
Scientic Discovery 295
5.3 Clinical Care, Imaging 296
Data: Sources, Types, and Needs 296
Advanced Modeling Approaches 298
5.4 Clinical Care, Non-Imaging 300
Clinical Knowledge 300
MedQA 300
Highlight: AI Doctors and
Cost-Eciency Considerations 301
Evaluation of LLMs for Healthcare
Performance 302
Overview 302
Diagnostic Reasoning With LLMs 304
Highlight: LLMs Inuence
Diagnostic Reasoning 304
Management Reasoning and
Patient Care Decisions 304
Highlight: GPT-4 Assistance on
Patient Care Tasks 305
Ambient AI Scribes 306
Deployment, Implementation,
Deimplementation 308
FDA Authorization of AI-Enabled
Medical Devices 308
Successful Use Cases:
Stanford Health Care 308
Screening for Peripheral
Arterial Disease 309
Social Determinants of Health 310
Extracting SDoH From EHR and
Clinical Notes 310
AI Adoption Across Medical Fields
and the Integration of SDoH 311
Synthetic Data 311
Clinical Risk Prediction 311
Drug Discovery 312
Data Generation Platforms 312
Electronic Health Record System 313
Clinical Decision Support 316
5.5 Ethical Considerations 317
Meta Review 317
5.6 AI in Physics, Chemistry,
and Other Scientic Domains 320
Highlight: Notable Model Releases 320
Chapter 5: Science and Medicine
Articial Intelligence
Index Report 2025
ACCESS THE PUBLIC DATA

283
Articial Intelligence
Index Report 2025
Table of Contents Chapter 5 Preview
This chapter explores key trends in AI-driven science and medicine, reecting the
technology’s growing impact in these elds. It begins with notable AI milestones from
2024, followed by an analysis of AI in protein folding, an important area of scientic
advancement. The chapter then examines AI’s role in clinical care, spanning both
imaging and non-imaging applications. This includes a review of clinical knowledge
capabilities in new language models, diagnostic and clinical management capabilities
of AI systems, real-world AI deployments in medicine, synthetic data applications, and
social determinants of health. Finally, the chapter concludes with an exploration of
ethical trends in AI medical research.
This chapter was prepared by RAISE Health (Responsible AI for Safe and Equitable
Health), a collaboration between Stanford Medicine and the Stanford Institute for
Human-Centered Articial Intelligence (HAI). Since its launch in 2023, RAISE Health
has worked to advance responsible AI innovation in biomedical research, education,
and patient care, with a focus on ensuring that these technologies benet everyone.
Fostering collaborative research and knowledge sharing are central to RAISE Health’s
mission. As part of that commitment, RAISE Health partnered with the AI Index Steering
Committee to expand the group’s focus to include key developments in science and
medicine. In 2024, this collaboration produced the inaugural chapter on science and
medicine, highlighting major AI advancements at Stanford and beyond. The 2025
chapter builds on that foundation with contributions from members of the RAISE
Health faculty research council, Stanford School of Medicine faculty, postdoctoral
fellows, and undergraduate students from the schools of Medicine and Engineering.
Overview
CHAPTER 5:
Science and Medicine
Articial Intelligence
Index Report 2025

284
Articial Intelligence
Index Report 2025
Table of Contents Chapter 5 Preview
Chapter Highlights
1. Bigger and better protein sequencing models emerge. In 2024, several large-scale, high-performance protein
sequencing models, including ESM3 and AlphaFold 3, were launched. Over time, these models have grown signicantly in size,
leading to continuous improvements in protein prediction accuracy.
4. AI outperforms doctors on key clinical tasks. A new study found that GPT-4 alone outperformed doctors—both
with and without AI—in diagnosing complex clinical cases. Other recent studies show AI surpassing doctors in cancer detection
and identifying high-mortality-risk patients. However, some early research suggests that AI-doctor collaboration yields the best
results, making it a fruitful area of further research.
2. AI continues to drive rapid advances in scientic discovery. AI’s role in scientic progress continues to expand.
While 2022 and 2023 marked the early stages of AI-driven breakthroughs, 2024 brought even greater advancements, including
Aviary, which trains LLM agents for biological tasks, and FireSat, which signicantly enhances wildre prediction.
3. The clinical knowledge of leading LLMs continues to improve. OpenAI’s recently released o1 set a new state-
of-the-art 96.0% on the MedQA benchmark—a 5.8 percentage point gain over the best score posted in 2023. Since late
2022, performance has improved 28.4 percentage points. MedQA, a key benchmark for assessing clinical knowledge, may be
approaching saturation, signaling the need for more challenging evaluations.
5. The number of FDA-approved, AI-enabled medical devices skyrockets. The FDA authorized its rst AI-enabled
medical device in 1995. By 2015, only six such devices had been approved, but the number spiked to 223 by 2023.
6. Synthetic data shows signicant promise in medicine. Studies released in 2024 suggest that AI-generated
synthetic data can help models better identify social determinants of health, enhance privacy-preserving clinical risk prediction,
and facilitate the discovery of new drug compounds.
CHAPTER 5:
Science and Medicine
Articial Intelligence
Index Report 2025

285
Articial Intelligence
Index Report 2025
Table of Contents Chapter 5 Preview
9. Publicly available protein databases grow in size. Since 2021, the number of entries in major public protein science
databases has grown signicantly, including UniProt (31%), PDB (23%), and AlphaFold (585%). This expansion has important
implications for scientic discovery.
7. Medical AI ethics publications are increasing year over year. The number of publications on ethics in medical AI
quadrupled from 2020 to 2024, rising from 288 in 2020 to 1,031 in 2024.
8. Foundation models come to medicine. In 2024, a wave of large-scale medical foundation models were released,
ranging from general-purpose multimodal models like Med-Gemini to specialized models such as EchoCLIP for echocardiology
and ChexAgent for radiology.
10. AI research wins two Nobel Prizes. In 2024, AI-driven research received top honors, with two Nobel Prizes awarded
for AI-related breakthroughs. Google DeepMind’s Demis Hassabis and John Jumper won the Nobel Prize in Chemistry for their
pioneering work on protein folding with AlphaFold. Meanwhile, John Hopeld and Georey Hinton received the Nobel Prize in
Physics for their foundational contributions to neural networks.
Chapter Highlights (cont’d)
Articial Intelligence
Index Report 2025
CHAPTER 5:
Science and Medicine

286
Articial Intelligence
Index Report 2025
Table of Contents Chapter 5 Preview
This section highlights signicant AI-related medical
and biological breakthroughs in 2024 as chosen by the
RAISE Health AI Index Workgroup and AI Index Steering
Committee.
5.1 Notable Medical and Biological AI Milestones
Protein Sequence Optimization
LLMs optimize protein sequence optimization
LLMs have recently, albeit unintentionally, gained a new
biological capability: optimizing protein sequences.
Traditionally, protein engineering requires extensive lab
studies to rene sequences for improved functionality.
However, a recent study found that LLMs—without ne-
tuning—are becoming remarkably eective at this task.
In other words, this is a hidden strength of existing LLMs,
exemplied in this case by an adapted version of Llama-
3.1-8B-Instruct. Using a directed evolutionary approach,
researchers demonstrated that LLMs can generate protein
sequences that outperform conventional algorithms across
both synthetic and experimental tness landscapes.
Figure 5.1.1 illustrates the researchers’ ndings. The objective
in this case is to maximize the tness value, with higher
scores indicating better performance. The researchers
compared their proposed method’s tness score against that
of the default evolutionary algorithm (EA) approach.1 The
study revealed that this optimization extends beyond single-
objective tasks to include constrained, budget-limited, and
multiobjective scenarios. This compelling nding highlights
the emergent properties of state-of-the-art LLMs, suggesting
that as these general-purpose models continue to improve,
their impact on scientic elds will only grow.
1 Evolutionary algorithms (EA) simulate key aspects of biological evolution within a computer program to tackle complex problems—especially those without precise or fully satisfactory
solutions—by nding approximate answers.
5.1 Notable Medical and Biological AI Milestones
Chapter 5: Science and Medicine
Figure 5.1.1
Single-objective optimization results for
tness optimization
Source: Wang et al., 2024

287
Articial Intelligence
Index Report 2025
Table of Contents Chapter 5 Preview
Aviary
Training LLM agents for biological tasks
As AI systems become increasingly useful, particularly for
scientic use cases, one challenge has been designing
language models that can interact with tools as they reason
through complex tasks. Aviary introduces a structured
framework for training language agents for three particularly
challenging scientic tasks: DNA manipulation (for molecular
cloning), answering research questions (through accessing
scientic papers), and engineering protein stability. Figure
5.1.2 compares the performance of dierent models across
various Aviary environments. It contrasts a baseline Claude 3.5
Sonnet model, which attempts tasks without environmental
access, with models integrated into agent frameworks within
the Aviary environment. Across nearly all tasks, the agentic
models outperform the baseline. This research demonstrates
that (1) although general-purpose LLMs perform well at many
scientic tasks, ne-tuning models alongside domain experts
often helps models yield superior results, and (2) AI-driven
scientic research can be accelerated not only by model size
but also through interaction with external tools, capabilities
now commonly referred to as “agentic AI.”
0.89
0.49
0.59
0.14 0.15
0.80
0.61
0.79
0.73
0.25
0.72
0.83
0.55
0.81
0.72
0.86
0.76
GSM8K hotpotQA SeqQA LitQA2 Protein stability
0.00
0.20
0.40
0.60
0.80
1.00
Claude 3.5 Sonnet Claude 3.5 Sonnet agent Claude 3.5 Sonnet agent pass @16
GPT-4o EI agent Llama 3.1 8B EI agent Llama 3.1 8B EI agent majority vote @32
Task
Pass rate
Performance of LLMs and language agents to solve tasks using Aviary environments
Source: Narayanan et al., 2024 | Chart: 2025 AI Index report
Figure 5.1.2
5.1 Notable Medical and Biological AI Milestones
Chapter 5: Science and Medicine

288
Articial Intelligence
Index Report 2025
Table of Contents Chapter 5 Preview
AlphaProteo
AI for novel, high-anity protein binders
AlphaProteo is Google DeepMind’s model focused on
creating novel, high-anity protein binders that attach to
specic target molecules. Figure 5.1.3 illustrates the predicted
structures of seven target proteins for which AlphaProteo
created successful binders. AlphaProteo has designed the
rst protein binders for many targets, including VEGF-A,
a protein linked to cancer and diabetes. Many of the tool’s
binding strengths are signicantly better than current state-
of-the-art solutions; in fact, the team estimates that some
of their binders are up to 300 times more eective than
anything currently available on the seven target proteins they
tested. For the viral protein BHRF1, 88% of their designed
binders successfully bound when tested in DeepMind’s wet
lab. Based on the tested targets, AlphaProteo binders hold
together roughly 10 times more strongly than those created
using existing state-of-the-art design methods, making it a
true bioengineering breakthrough. The model is being used
for drug development, diagnostics, and biotech applications.
Figure 5.1.3
Figure 5.1.4
Human Brain Mapping
Synaptically reconstructing a small piece of the human brain
A team at Google’s Connectomics project has reconstructed
a one-cubic-millimeter section of the human brain at the
synaptic level—hailed by Wired as “the most detailed map
of brain connections ever made.” The sample, taken from an
epileptic patient’s left anterior temporal lobe during surgery,
was imaged with a multibeam scanning electron microscope.
Over 5,000 ultra-thin slices (30 nanometers each) captured
around 57,000 cells—including neurons, glial cells, and
blood vessels—along with 150 million synapses. Figure 5.1.4
visualizes the results: excitatory neurons on the left, inhibitory
neurons on the right. To process this massive dataset, the team
developed machine learning tools like ood-lling networks
(for neuron reconstruction without manual tracing), SegCLR
(for cell type identication), and TensorStore (for managing
the multidimensional dataset). The dataset is publicly available
via Neuroglancer, a web-based exploration tool; and CAVE,
a Neuroglancer extension for annotation renement. This
project marks a major step in understanding neural circuitry
and could inform future neurological treatments.
AlphaProteo generating successful binders
Source: Google DeepMind, 2024
3D brain map images
Source: Google Research, 2024
5.1 Notable Medical and Biological AI Milestones
Chapter 5: Science and Medicine

289
Articial Intelligence
Index Report 2025
Table of Contents Chapter 5 Preview
Virtual AI Lab
Virtual AI lab supercharges biomedical research
AI’s role in science is shifting from a passive tool to an active
collaborator. A recent Stanford study introduced a virtual AI
laboratory, where multiple AI-powered scientists (technically
LLMs) specialize in dierent disciplines and autonomously
collaborate as agents. In one experiment, human researchers
tasked this AI-driven lab with designing nanobodies—
antibody fragments—capable of binding to SARS-CoV-2,
the virus that causes COVID-19. The lab generated 92
nanobodies, with over 90% successfully binding to the virus
in validation studies. The virtual lab was structured similar to a
computational biology lab, comprising a principal investigator
(PI), a scientic critic AI, and three discipline-specic
scientists specializing in immunology, computational biology,
and machine learning (Figure 5.1.5). The PI model created
these expert scientists and guided their research. Tools like
AlphaFold and Rosetta were used for protein design, but the
real signicance of this study lies not in its specic ndings,
but in demonstrating that an entirely autonomous, LLM-
powered lab can generate meaningful scientic discoveries.
5.1 Notable Medical and Biological AI Milestones
Chapter 5: Science and Medicine
Figure 5.1.5
Workow in AI-based lab
Source: FreeThink, 2025

290
Articial Intelligence
Index Report 2025
Table of Contents Chapter 5 Preview
GluFormer
Continuous glucose monitoring with AI
GluFormer, a foundation model developed by Nvidia Tel Aviv,
the Weizmann Institute, and others, analyzes continuous
glucose monitoring (CGM) data to predict long-term health
outcomes. Trained on over 10 million glucose measurements
from nearly 11,000 individuals—most without diabetes—it
forecasts health trajectories up to four years in advance.
For instance, GluFormer can identify individuals at risk of
developing diabetes or worsening glycemic control long
before symptoms appear. In a 12-year study of 580 adults, it
accurately agged 66% of new-onset diabetes cases and 69%
of cardiovascular-related deaths within their respective top-
risk quartiles. The model’s results have also generalized across
19 external cohorts (n=6,044) in ve countries and diverse
health conditions. GluFormer often outperforms standard
CGM-based metrics like the glucose management indicator
(GMI) (Figure 5.1.6). In the near and long term, models like
GluFormer will shift diabetes care from reactive treatment to
proactive prevention, enabling earlier clinical intervention.
Evolutionary Scale Modeling v3 (ESM3)
Simulating evolutionary processes to generate novel proteins
EvolutionaryScale’s ESM3 is a groundbreaking model
designed to generate novel proteins by simulating evolutionary
processes. The model was trained on 2.78 billion protein
sequences, and hosts 98 billion parameters. Like many
other AI models, it is available in three sizes (small, medium,
and large) and is available both via API and their partners’
platforms. Perhaps ESM3’s most notable achievement is
designing esmGFP, a new articial green uorescent protein
which the company estimates would take nature 500 million
years to develop. This was done through human-led chain-of-
thought prompting. Figure 5.1.7 illustrates the performance
of various ESM3 models in generating proteins that satisfy
atomic coordination prompts. The results show that larger
ESM3 models solve twice as many tasks. ESM3 is also open-
sourced, promoting collaboration in synthetic biology and
protein engineering projects which hope to use code and
data from the project—with applications in drug discovery,
materials science, and environmental engineering.
1.4B 7B 98B
0.00
0.25
0.50
0.75
Base Preference-tuned
Model
Fraction of tasks solved
ESM3 models evaluated on protein generation from
atomic coordination prompts
Source: ESM3, 2024 | Chart: 2025 AI Index report
5.1 Notable Medical and Biological AI Milestones
Chapter 5: Science and Medicine
Figure 5.1.6
Figure 5.1.7
GluFormer versus glucose management indicator
Source: Lutsker et al., 2024

291
Articial Intelligence
Index Report 2025
Table of Contents Chapter 5 Preview
AlphaFold 3
Predicting the structure and interactions of all of life’s
molecules
Google and Isomorphic Lab’s latest in the AlphaFold series,
AlphaFold 3, goes beyond predicting protein structures
to more accurately modeling their interactions with key
biomolecules (DNA, RNA, ligands, antibodies). Figure 5.1.8
compares AlphaFold 3’s accuracy in predicting protein-
ligand interactions against other top docking tools (e.g.,
Vina and Gnina) based on the percentage of predictions
with a root mean square deviation (RMSD) below 2 Å, an
important measure of docking accuracy.2 3 AlphaFold 3 is
competitive with previous state-of-the-art methods and
particularly eective when the binding pocket is predened,
meaning that the docking algorithm is given prior knowledge
about the specic region on the protein where the small
molecule (ligand) is expected to bind. AlphaFold 3 can
accelerate drug development by modeling small molecule-
protein interactions, which is important for disease research.
Moreover, AlphaFold 3’s open-source access empowers
scientists globally.
Figure 5.1.8
58.10
67.20 68.20
77.30
73.10
84.40
59.70
70.10 70.50
79.50 80.50
93.20
Vina Vina + Conf. Ensemble Gnina Gnina + Conf. Ensemble AF3 AF3 Pocket Specied
0
20
40
60
80
100
RMSD < 2 and PB-valid RMSD < 2
Method
% RMSD < 2Å
AlphaFold 3 vs. baselines for protein-ligand docking
Source: ESM3, 2024 | Chart: 2025 AI Index report
5.1 Notable Medical and Biological AI Milestones
Chapter 5: Science and Medicine
2 A docking tool, like Vina, is a computational program used in molecular docking—a process that predicts how small molecules (such as drugs) interact with target proteins. These tools help
scientists model and visualize how a molecule might bind to a protein’s active site, which is crucial in drug discovery.
3 The chart uses two shades of bars to represent dierent accuracy criteria in molecular docking predictions. The lighter bars indicate the percentage of docking results with a root mean
square deviation (RMSD) below 2 Å, meaning the predicted pose is structurally accurate. The darker bars apply a stricter criterion, showing the proportion of predictions that are not only
within 2 Å RMSD but also correctly positioned within the binding pocket (PB-valid). This distinction highlights the dierence between general docking accuracy and more precise, biologically
relevant binding predictions.

292
Articial Intelligence
Index Report 2025
Table of Contents Chapter 5 Preview
AI has transformed numerous scientic
elds, with protein science being one of
the most impacted areas. Understanding
protein sequences is fundamental to
biology, inuencing drug discovery,
synthetic biology, and disease research.
Recent AI advancements have enabled
scientists to analyze and predict protein
functions, structures, and interactions
with unprecedented accuracy. As the
eld evolves, these developments will
aect healthcare, biotechnology, and
regulatory frameworks. This section
highlights key advancements in AI-
driven protein analysis over the past
year, focusing on public databases,
research trends, and emerging policy
considerations.
5.2 The Central Dogma
Protein Sequence Analysis
AI-Driven Protein Sequence Models
The past year has witnessed remarkable progress in AI models applied to protein
sequences. Large-scale machine learning models have improved our ability to
predict protein properties, accelerating research in structural biology and molecular
engineering. As noted above, several notable protein sequencing models, like
AlphaFold, ESM2, and ESM3, have recently been released.
ESM3 integrates multimodal inputs—sequence, structure, and interaction data—
while its larger parameter size improves representativeness and predictive accuracy.
As the ESM family has expanded in scale, protein prediction performance has
improved. Newer models, such as ESM C, released in 2024, have achieved greater
accuracy in predicting protein structures in the Critical Assessment of Structure
Prediction (CASP15) challenge (Figure 5.2.1).
5.2 The Central Dogma
Chapter 5: Science and Medicine
Emergent structure prediction
success, CASP15
Source: EvolutionaryScale, 2024
Figure 5.2.1

293
Articial Intelligence
Index Report 2025
Table of Contents Chapter 5 Preview
Other signicant advancements include ProGen, a generative
AI model that, in demonstrating the ability to design
functional protein sequences, has highlighted the potential of
AI-assisted protein engineering. Similarly, transformer-based
models such as ProtT5 leverage deep learning to predict
protein function and interactions directly from sequence
data, advancing the eld of computational biology. Figure
5.2.2 showcases key protein sequencing models and their
parameter sizes, arranged by release date. As noted earlier,
there is a clear trend toward increasingly larger models trained
on ever-expanding datasets. These AI-driven approaches
have transformed protein science by minimizing reliance on
costly, time-intensive experimental methods, enabling rapid
exploration of protein function and design.
1.20 0.42
6.40
1.20
15.00
98.00
ProGen ProtBert ProGen2 ProtT5 ESM2 ESM3
2020 2022 2023 2024
0
20
40
60
80
100
Model (sorted by release date)
Number of parameters (in billions)
Size of protein sequencing models, 2020–24
Source: RAISE Health, 2025 | Chart: 2025 AI Index report
Figure 5.2.2
5.2 The Central Dogma
Chapter 5: Science and Medicine

294
Articial Intelligence
Index Report 2025
Table of Contents Chapter 5 Preview
Public Databases for Protein Science
The expansion of public databases has been crucial for AI
applications in protein science. Well-curated, large-scale
datasets enable AI models to train on diverse biological
sequences, enhancing their predictive power. Figure
5.2.3 provides information on several key protein science
databases and their release date.
5.2 The Central Dogma
Chapter 5: Science and Medicine
Dataset Release date Description
Protein Data Bank (PDB) 1971 A database of experimentally solved protein structures. When rst released,
it was the rst open-access digital resource in the biological sciences.
Pfam 1995 A comprehensive database of protein families, providing annotations and
multiple sequence alignments generated through hidden Markov models.
STRING 2000 Dataset oering valuable information on protein interactions and
evolutionary relationships.
UniProt 2002 Still the gold standard for protein sequence and function annotation, with
AI-assisted curation improving accuracy.
PDBbind 2004 A subset of the PDB that contains protein biomolecular complexes, including
protein-ligand, protein-protein, and protein-nucleic acid complexes.
AlphaFold Database 2021 An essential resource for structural biology, now integrating AI-driven
models to predict missing experimental data.
Key protein science databases
Source: AI Index, 2025
Figure 5.2.3
The number of entries in various public protein science
databases has also steadily grown over time (Figure 5.2.4).
The increasing availability of AI-generated protein insights
has made these databases indispensable tools for researchers
and industry professionals. However, maintaining data
quality and preventing biases in AI models remain ongoing
challenges.
2019 2020 2021 2022 2023 2024 2025
100
K
1M
10M
100M
UniProt AlphaFold DB PDB
Number of entities (log scale)
Growth of public protein science databases, 2019–25
Source: RAISE Health, 2025 | Chart: 2025 AI Index report
Figure 5.2.4

295
Articial Intelligence
Index Report 2025
Table of Contents Chapter 5 Preview
7.60%
8.40%
3.00%
0.70%
0% 1% 2% 3% 4% 5% 6% 7% 8%
Synthetic protein design
Protein-drug interactions
Protein structure prediction
Function prediction
AI-driven publications in the biological sciences (% of total)
Research area
Proportion of AI-driven protein research in the biological sciences, 2024
Source: RAISE Health, 2025 | Chart: 2025 AI Index report
Figure 5.2.5
5.2 The Central Dogma
Chapter 5: Science and Medicine
Research and Publication Trends
AI-Driven Protein Science Publications
AI applications in protein science have gained signicant
traction in academic research, as evidenced by an increase in
AI-driven studies on PubMed and bioRxiv preprints over the
past year. These studies focus on several key areas. Protein
structure prediction has become more accessible due to
advances in machine learning, providing deeper structural
insights. AI models now infer biochemical functions from raw
sequence data with greater accuracy, enhancing function
prediction. In addition, AI models are being developed
that can predict protein-drug interactions and even create
new drugs from scratch that can target specic proteins.
Both of these tasks are crucial for drug discovery and drug
development. Furthermore, AI-generated proteins with novel
functions are emerging, particularly in enzyme engineering
and therapeutic applications, marking a signicant step
forward in synthetic protein design. Figure 5.2.5 illustrates
the proportion of protein AI-driven research within biological
sciences in 2024. The most researched topic was function
prediction (8.4%), followed by protein structure prediction
(7.6%) and protein-drug interactions (3.0%)

296
Articial Intelligence
Index Report 2025
Table of Contents Chapter 5 Preview
Image and Multimodal AI for Scientic Discovery
Advances in cryo-electron microscopy, high-throughput
uorescence microscopy, and whole-slide imaging allow
scientists to examine and analyze atomic, subcellular
context and tissue-level structures with high precision to
reveal new insights into complex biological processes.
To achieve this, researchers interpret and contextualize
image ndings with existing scientic knowledge to link
observations to biological functions and disease relevance.
Given the rise of high-throughput microscopy, active
research has increasingly focused on the intersection of
vision, vision-language, and, more recently, vision-omics
foundation models. The number of microscopy foundation
models has increased over time across various techniques
(Figure 5.2.6). Light-based models doubled from four
to eight in 2024, and, while no electron or uorescence
models were released in 2023, four models for each
technique emerged in 2024. Overall, foundation models
for microscopy are increasing as more data is collected
and made publicly available.
5.2 The Central Dogma
Chapter 5: Science and Medicine
0
4
0
44
8
2023 2024
0
1
2
3
4
5
6
7
8
Fluorescence Electron Light
Number of foundation models
Number of foundation models per microscopy
techniques, 2023–24
Source: RAISE Health, 2025 | Chart: 2025 AI Index report
Figure 5.2.6

297
Articial Intelligence
Index Report 2025
Table of Contents Chapter 5 Preview
AL
0
AK
0
AZ
0AR
0
CA
22 CO
2
CT
2
DC
0DE
0
FL
0
GA
0
HI
0
ID
0IL
0IN
1
IA
0
KS
0KY
0
LA
0
ME
0
MD
4
MA
15
MI
1
MN
1
MS
0
MO
0
MT
0
NE
0
NV
0
NH
2
NJ
0
NM
0
NY
14
NC
2
ND
0
OH
1
OK
0
OR
0PA
5
RI
0
SC
0
SD
0
TN
0
TX
1
UT
0
VT
1
VA
0
WA
0
WV
0
WI
1
WY
0
Source: Kaushal et al., 2020 | Chart: 2025 AI Index report
US patient cohorts used to train clinical machine learning algorithms
by state, 2015 19
5.3 Clinical Care, Imaging
Data: Sources, Types, and Needs
AI in medical imaging is rapidly evolving, expanding into
new data modalities, and addressing increasingly complex
clinical questions. More than 80% of FDA-cleared machine
learning software targets the analysis of medical images.
Currently, AI is predominantly applied to two-dimensional
(2D) data settings, where conventional image-processing
architectures, such as convolutional neural networks (CNNs)
and transformers, can be eectively utilized. However, despite
a number of successes in this eld, many AI applications in
medical imaging rely on highly limited training datasets.
In histopathology, for example, while staining patient biopsies
for histological analysis is routine, only a small fraction of
these samples is digitized and made publicly available. Even
fewer datasets contain the necessary matched annotations or
omics data required for advanced classication tasks. Publicly
available histopathology cohorts rarely exceed 10,000 patient
samples, with The Cancer Genome Atlas (TCGA) providing
one of the most comprehensive collections—comprising
11,125 patient samples with matched clinical annotations,
genomic sequencing, and protein expression data across 32
cancer types. As a result, histopathology AI models are often
trained on fewer than 1,000 patient samples, particularly
when genomic or proteomic data serve as labels. Limited
training sets increase the risk of data overtting and poor
generalization.
Figure 5.3.1 illustrates the geographic distribution of U.S.
cohorts used to train deep learning algorithms. Most cohorts
originate from California, Massachusetts, and New York,
raising concerns about the limited scope of the datasets used
to train these algorithms.
Figure 5.3.1
5.3 Clinical Care, Imaging
Chapter 5: Science and Medicine

298
Articial Intelligence
Index Report 2025
Table of Contents Chapter 5 Preview
These data limitations are more pronounced for three-
dimensional (3D) medical imaging. While AI has traditionally
focused on 2D modalities such as chest X-rays, histopathology
slides, and fundus photography, recent advancements have
expanded its application to 3D imaging modalities, including
computed tomography (CT), magnetic resonance imaging
(MRI), and 3D histopathology analysis. Three-dimensional
analysis provides richer data, enabling AI models to learn
patterns from volumetric structures and complex surfaces
that may not be apparent in 2D slices. Although promising
approaches have been developed for the use of AI to analyze
3D medical images, similar data limitations and needs
persist. Publicly available 3D datasets remain limited, with
UK Biobank (around 100,000 MRI scans) and TCIA (around
50,000 studies) among the largest. Although 3D samples
are routinely collected in histopathology, 3D imaging is
not standard practice, resulting in an absence of publicly
available 3D histopathology datasets. Standardization
challenges persist due to acquisition variability in pathology.
Dierences in instrument settings, staining techniques, and
institutional practices introduce batch eects, which are
further exacerbated by limited training datasets.
Training accurate AI models requires large datasets: CNNs
have succeeded with around 10,000 labeled images , but
transformers need orders of magnitude more data. MIMIC-
CXR (377,000 images) and CheXpert Plus (around 226,000
frontal-view radiographs with aligned radiology reports and
patient metadata) are important resources but remain smaller
than ImageNet (around 14 million images). Data completeness
and bias issues remain key challenges.
Figure 5.3.2 illustrates the token volume in text and image
datasets used to train various leading medical language and
imaging models, in comparison to various all-purpose text
and image models. GatorTron, a large clinical LLM designed
to extract patient information from unstructured electronic
health records, was trained on 82 billion tokens. In contrast,
Llama 3 was trained on 15 trillion tokens—nearly 182 times
more. On the imaging side, RadImageNet, an open radiologic
deep learning research dataset, contains 16 million image-
equivalent tokens, while DALL-E, an early OpenAI image
generator, was trained on approximately 6 billion—roughly
375 times more.
80B
20T
GatorTron Llama 3
100B
1T
10T
20M
6B
RadImageNet DALL-E
100M
1B
Medical Nonmedical
Number of tokens (log scale)
Number of tokens (log scale)
Training dataset token volumes: medical vs. nonmedical language and imaging models
Source: RAISE Health, 2025 | Chart: 2025 AI Index report
Figure 5.3.2
5.3 Clinical Care, Imaging
Chapter 5: Science and Medicine

299
Articial Intelligence
Index Report 2025
Table of Contents Chapter 5 Preview
Modeling approach Notable releases Advantages Challenges
Diusion models 1. RoentGen (2022)
2. RNA-CDM (2023)
3. XReal (2024)
Generate synthetic medical images for
enhanced training, privacy, and pathol-
ogy-specic augmentation. Outperform
GANs in stability and diversity.
Dataset biases, hallucinated
artifacts, diagnostic uncer-
tainty.
Large vision-language
models (LVLMs)
1. CheXagent (2024)
2. Merlin (2024)
3. Med-Gemini (2024)
4. PathChat (2024)
5. TITAN (2024)
6. PRISM (2025)
7. BiomedParse (2025)
Integrate medical images with text for
improved diagnosis, segmentation,
and report automation. LVLMs extend
multimodal capabilities.
Data scarcity, generalization
to low-resource settings,
computational demands.
2D vision-only foundation
models
1. CTransPath (2022)
2. Virchow (2024)
3. UNI (2024)
4. MedSAM(2024)
Pan-cancer detection, biomarker
prediction, and image segmentation.
Reduce annotation burdens.
Domain generalization,
cross-modal adaptability.
Multiscale/slide-level
models
1. HIPT (2022)
2. MEGT (2023)
3. MG-Trans (2023)
4. HIGT (2023)
5. Prov-GigaPath (2024)
Enhance whole-slide imaging analysis
using hierarchical transformers and
graph-based models for spatial relation-
ships. Improve diagnostic delity and
interpretability.
Scalability, computational
eciency, dataset variability.
Longitudinal imaging is important for modeling disease
progression but remains underrepresented. ADNI (around
2,000 participants over 15-plus years) exemplies such
eorts, but scalable multimodal longitudinal datasets are rare.
Addressing these gaps requires privacy-preserving data-
sharing (e.g., federated learning), synthetic data generation,
and improved annotation strategies.
To train and validate robust medical imaging AI models,
larger, more comprehensive, and multicohort collections of
training data are required. By increasing the availability of
high-quality, labeled training data, models can be expected
to achieve improved performance. Additionally, better
validation practices will bolster condence in these models,
facilitating their transition into clinical practice.
Figure 5.3.3
5.3 Clinical Care, Imaging
Chapter 5: Science and Medicine
Advanced Modeling Approaches
Figure 5.3.3 presents leading clinical imaging modeling approaches, notable releases per approach, and key challenges
associated with each.
Imaging modeling approaches and notable AI models
Source: AI Index, 2025

300
Articial Intelligence
Index Report 2025
Table of Contents Chapter 5 Preview
In recent years, there has been a notable rise in foundation
models being used for medical imaging purposes. Figure 5.3.4
categorizes notable models by medical discipline. In recent
years, the number of medical imaging foundation models has
risen sharply, with a particularly high concentration of newly
launched pathology models.
Figure 5.3.4
5.3 Clinical Care, Imaging
Chapter 5: Science and Medicine
Discipline Notable releases
Echocardiology 1. EchoCLIP (2024)
Oncology 1. MUSK (2025)
Ophthalmology 1. RETFound (2023)
2. VisionFM (2024)
Pathology 1. CTransPath (2022)
2. CHIEF (2024)
3. Prov-GigaPath (2024)
4. PathChat (2024)
5. TITAN (2024)
6. Virchow (2024)
7. UNI (2024)
Radiology 1. RoentGen (2022)
2. CheXagent (2024)
3. Merlin (2024)
4. PRISM (2025)
Medical disciplines and notable AI models
Source: AI Index, 2025

301
Articial Intelligence
Index Report 2025
Table of Contents Chapter 5 Preview
2021 2022 2023 2024
0%
20%
40%
60%
80%
100%
MedQA test accuracy
91.10%, Intensive ne-tuning
96.00%, No ne-tuning
MedQA: test accuracy
Source: RAISE Health, 2025 | Chart: 2025 AI Index report
5.4 Clinical Care, Non-Imaging
Clinical Knowledge
The following section examines the performance of LLMs and
recent AI models on key medical knowledge benchmarks.
MedQA
Evaluating the clinical knowledge of AI models involves
determining the extent of their medical expertise, particularly
knowledge applicable in a clinical setting.
Introduced in 2020, MedQA is a comprehensive dataset
derived from professional medical board exams, featuring
over 60,000 clinical questions designed to challenge
doctors. AI performance on the MedQA benchmark has
advanced signicantly. A team of Microsoft and OpenAI
researchers recently tested o1, which achieved a new state-
of-the-art score of 96.0%—a substantial 5.8 percentage
point improvement over the record set in 2023 (Figure
5.4.1). Since late 2022, performance on the benchmark has
increased by 28.4 percentage points. As with other general
knowledge benchmarks discussed in Chapter 2, MedQA may
be approaching a saturation point, indicating the need for
more challenging evaluations.
Figure 5.4.1
5.4 Clinical Care, Non-Imaging
Chapter 5: Science and Medicine

302
Articial Intelligence
Index Report 2025
Table of Contents Chapter 5 Preview
Some researchers argue that evaluating medical LLMs
requires more comprehensive benchmarks than MedQA,
those that span a broader range of medical domains.
Relying solely on standard medical QA benchmarks like
MedQA—while valuable—may overlook the complexities
of real-world clinical applications. Alternatively, using
multiple benchmarks can oer greater clinical relevance
and a more robust assessment of model performance.
This year, new research from UC Santa Cruz, the University
of Edinburgh, and the National Institutes of Health has taken
a more expansive approach to testing AI medical systems.
The study evaluated ve leading large language models,
including the newly developed o1, which features chain-of-
thought reasoning. The other models assessed were GPT-3.5,
Llama 3-8B, GPT-4, and Meditron-70B—the last of which
is a specialized medical model. These models were tested
on a diverse set of medical benchmarks covering various
tasks, including concept recognition, text summarization,
knowledge-based QA, clinical decision support, and medical
calculations. Figure 5.4.2 presents the average performance
of these ve LLMs across 19 medical datasets. The ndings
indicate that clinical knowledge performance in LLMs is
improving, particularly for newer models like o1 equipped
with real-time reasoning capabilities. However, persistent
challenges remain, including issues with hallucinations and
inconsistent multilingual performance.
Previous research, cited in last year’s AI Index, demonstrated
that prompting techniques like Medprompt can signicantly
enhance LLM performance on medical benchmarks
without additional ne-tuning. OpenAI’s recently released
o1 model incorporates some of these insights by employing
runtime reasoning before generating nal responses.
Researchers found that o1 outperforms the GPT-4 series
with Medprompt, even without specialized prompting
techniques. However, their analysis also highlights the
accuracy-cost trade-o associated with o1. While it
achieves a 5.8 percentage point higher score than GPT-4
Turbo with Medprompt, it is approximately 1.5 times more
GPT-3.5
Meditron-70B
GPT-4
Llama3-8B
o1
2022 2023 2024
0%
20%
40%
60%
80%
100%
Average accuracy
Performance of select LLMs on medical datasets
Source: Xie et al., 2024 | Chart: 2025 AI Index report
Figure 5.4.2
Figure 5.4.3
Highlight:
AI Doctors and Cost-Eciency Considerations
5.4 Clinical Care, Non-Imaging
Chapter 5: Science and Medicine
expensive. Figure 5.4.3 illustrates the cost versus accuracy
trade-o on the MedQA benchmark. This trade-o highlights
a key consideration for medical professionals deploying AI
in clinical settings: the need to balance performance gains
with computational costs.
Enhanced pareto frontier: accuracy vs. cost
Source: Nori et al., 2024

303
Articial Intelligence
Index Report 2025
Table of Contents Chapter 5 Preview
Evaluation of LLMs for Healthcare Performance
Overview
There has been an explosion in interest in the evaluation of language model performance on healthcare tasks. A PubMed search
for “large language model” returned 1,566 papers starting in 2019 with 1,210 published in 2024 alone (Figure 5.4.4).
1,210
353
2
00
1
2019 2020 2021 2022 2023 2024
0
200
400
600
800
1,000
1,200
Number of publications
Number of publications on large language models in PubMed, 2019–24
Source: RAISE Health, 2025 | Chart: 2025 AI Index report
Figure 5.4.4
5.4 Clinical Care, Non-Imaging
Chapter 5: Science and Medicine
304
Articial Intelligence
Index Report 2025
Table of Contents Chapter 5 Preview
A systematic review in early 2024 identied over 500 papers
evaluating the performance of NLP on healthcare tasks
with a heavy emphasis on medical decision-making (Figure
5.4.5). Most of the healthcare studies that evaluated the
performance of NLP systems focused on enhancing medical
knowledge (419) and making diagnoses (178).
Figure 5.4.54
5.4 Clinical Care, Non-Imaging
Chapter 5: Science and Medicine
4 The asterisks represent tasks in NLP and NLU.

305
Articial Intelligence
Index Report 2025
Table of Contents Chapter 5 Preview
A 2024 single-blind, randomized trial tested GPT-4
assistance against conventional resources in tackling
complex clinical vignettes. The study involved 50
U.S.-licensed physicians and evaluated whether AI-
enhanced decision-making could improve diagnostic
accuracy and eciency. The results revealed no
signicant improvement when physicians used GPT-
4 alongside traditional resources. In fact, physicians
with AI assistance performed only slightly better (76%)
than those who relied solely on conventional tools
(74%). However, in a secondary analysis, GPT-4 alone
outperformed both groups, achieving a 92% diagnostic
reasoning score, a 16-percentage-point increase over
physicians working without AI (Figure 5.4.6). Despite
AI’s superior standalone performance, integrating it into
clinical workows proved challenging. There was no clear
advantage in time eciency, as case completion times
remained statistically unchanged across conditions.
While purely autonomous AI outperformed physician-
only eorts, simply giving doctors access to an LLM
did not enhance their performance. This underscores
a phenomenon seen in other AI-human collaborations:
Bridging the gap between excellent model performance
in isolation and eective synergy with clinicians requires
rethinking workows, user training, and interface design.
Highlight:
LLMs Inuence Diagnostic Reasoning
GPT-4 alone Physician + GPT-4 Physician +
conventional
resources only
0
10
20
30
40
50
60
70
80
90
100
Score
LLM performance in clinical diagnosis
Source: Goh et al., 2024 | Chart: 2025 AI Index report
Diagnostic Reasoning With LLMs
Diagnostic errors account for substantial patient harm, and many organizations are exploring AI as a tool to improve the diagnostic
process.
Figure 5.4.6
5.4 Clinical Care, Non-Imaging
Chapter 5: Science and Medicine
Management Reasoning and Patient Care Decisions
Beyond diagnosis, physicians must juggle treatment decisions,
risk-benet trade-os, and patient preferences—collectively
referred to as “management reasoning.” Researchers tested
whether LLMs could improve these complex, context-
dependent skills.

306
Articial Intelligence
Index Report 2025
Table of Contents Chapter 5 Preview
A 2024–25 prospective, randomized, controlled trial
evaluated the impact of GPT-4 assistance on complex
clinical management decisions. The study involved
92 physicians, with half using GPT-4 alongside
standard resources and the other half relying solely on
conventional references. Physicians assisted by GPT-4
outperformed the control group by approximately 6.5
percentage points (Figure 5.4.7). Interestingly, GPT-4
alone performed on par with GPT-4-assisted physicians,
suggesting that in certain well-dened scenarios, near-
autonomous AI-driven management support may be
feasible. However, AI assistance came with a trade-
o, as physicians using GPT-4 spent slightly longer on
each scenario—a delay researchers attributed to deeper
reection and analysis. Generative AI can meaningfully
improve clinical decision-making, but its impact may be
qualitative rather than purely eciency-driven.
Highlight:
GPT-4 Assistance on Patient Care Tasks
GPT-4 alone Physicians + GPT-4 Physicians +
conventional
resources only
0
10
20
30
40
50
60
70
80
90
100
Score
Impact of LLM assistance on clinical management
Source: Goh et al., 2025 | Chart: 2025 AI Index report
Figure 5.4.7
5.4 Clinical Care, Non-Imaging
Chapter 5: Science and Medicine

307
Articial Intelligence
Index Report 2025
Table of Contents Chapter 5 Preview
Ambient AI Scribes
Clinical documentation has long been a source of clinician
burden and burnout. Ambient scribe technology has rapidly
evolved to integrate LLMs into the processing pipeline for
physician-patient recordings. The rst study, published in
NEJM Catalyst, describes the launch of ambient AI scribe
technology at Kaiser Permanente Northern California in late
2023. The technology was eventually adopted by thousands
of clinicians before the end of the pilot (Figure 5.4.8). This
was followed by a second study, published in JAMIA,
that describes the pilot experience at Intermountain
Health. Both studies were based on earlier versions of the
technology that were not fully automated or integrated into
the electronic health record (EHR).
Figure 5.4.8
5.4 Clinical Care, Non-Imaging
Chapter 5: Science and Medicine
Source: Tierney et al., 2024

308
Articial Intelligence
Index Report 2025
Table of Contents Chapter 5 Preview
Researchers at Stanford conducted a two-part study on the
use of ambient AI scribe technology, building on prior work
by testing a fully integrated, automated AI scribe system.
The study demonstrated improvements in both objective
measures, such as documentation time, and subjective
measures of physician experience. Adoption was strong,
with an average uptake of 55% among physicians. The AI
scribe provided notable eciency gains, saving physicians
approximately 30 seconds per note and reducing overall EHR
time by about 20 minutes per day (Figure 5.4.9). Additionally,
physicians reported signicant reductions in burden
and burnout, with average decreases of 35% and 26%,
respectively. These ndings suggest that AI-powered scribe
technology can meaningfully improve physician workow
and well-being, oering both time savings and relief from
administrative strain.
−150
−125
−100
−75
−50
−25
0
25
50
75
−150
−125
−100
−75
−50
−25
0
25
50
75
−150
−125
−100
−75
−50
−25
0
25
50
75
Change in average daily documentation time (minutes)
Change in average daily afterhours time (minutes)
Change in average daily total EHR time (minutes)
Impact of AI Scribe on physician EHR usage
Source: Ma et al., 2024 | Chart: 2025 AI Index report
Figure 5.4.9
5.4 Clinical Care, Non-Imaging
Chapter 5: Science and Medicine
Investment in ambient scribe technology is reported to reach
almost $300 million in 2024. While clinical documentation
has been the starting point for the technology and the
evaluations performed to date, optimists envision ubiquitous
ambient listening technology in both outpatient and inpatient
settings that will eventually support order placement, billing
and coding, and real-time clinical decision support.

309
Articial Intelligence
Index Report 2025
Table of Contents Chapter 5 Preview
1 1 1 1 1 1 5 2 2 3 3 6 6
18
26
64
80
114
129
160
223
0 0 0 0 0 0 0 0
1995
1996
1997
1998
1999
2000
2001
2002
2003
2004
2005
2006
2007
2008
2009
2010
2011
2012
2013
2014
2015
2016
2017
2018
2019
2020
2021
2022
2023
0
50
100
150
200
Number of AI medical devices
Number of AI medical devices approved by the FDA, 1995–2023
Source: FDA, 2024 | Chart: 2025 AI Index report
Figure 5.4.10
Deployment, Implementation, Deimplementation
FDA Authorization of AI-Enabled Medical Devices
The deployment of AI in clinical settings has grown
exponentially over the past decade, highlighted by the
dramatic increase in the number of AI-enabled medical
devices authorized by the U.S. Food and Drug Administration
(FDA).
The FDA authorized its rst AI-enabled medical device in
1995. For the next two decades, annual approvals remained
in the single digits. In 2015 alone, six AI medical devices were
approved. Since then, the number of yearly approvals has
surged, peaking at 223 in 2023 (Figure 5.4.10).
5.4 Clinical Care, Non-Imaging
Chapter 5: Science and Medicine
Successful Use Cases: Stanford Health Care
In practice, transitioning AI models into real-world use
requires a framework that ensures fairness, utility, and
reliability. Stanford Health Care has led the way by evaluating
and implementing AI tools using its FURM (Fair, Useful,
Reliable, Measurable) framework. Among the six AI use
cases assessed, two have been successfully implemented:
(1) screening for peripheral arterial disease (PAD) and (2)
improving documentation and coding for inpatient care. This
section details screening for peripheral arterial disease.

310
Articial Intelligence
Index Report 2025
Table of Contents Chapter 5 Preview
Screening for Peripheral Arterial Disease
Peripheral arterial disease (PAD) is a chronic vascular
condition that often goes undiagnosed in its early stages,
leading to severe complications such as critical limb ischemia
and amputation. To improve early detection and intervention,
Stanford Health Care developed and implemented an AI-
enabled PAD classication model designed to enhance
screening and optimize patient care.
The primary goal of the PAD screening tool is to facilitate
earlier diagnosis in primary care populations, allowing for
medical or surgical intervention before the disease leads to
severe complications. By identifying high-risk patients, the
model also helps optimize resource allocation, ensuring that
those most in need receive immediate follow-up and care.
To integrate seamlessly into clinical workows, the AI tool
was designed to automatically assess PAD risk and ag
high-risk individuals for further evaluation. If the condition is
conrmed, the patient is referred for a vascular consultation.
Figure 5.4.11 illustrates the proposed model and workow
details for integrating PAD screening into clinical workows,
including risk assessment, referrals, and patient follow-up.
Figure 5.4.11
Proposed model and workow for integrating PAD screening into clinical practice
Source: Callahan et al., 2024
5.4 Clinical Care, Non-Imaging
Chapter 5: Science and Medicine
Following a successful pilot phase, the PAD screening tool
advanced to Stage 2 and was fully implemented at Stanford
Health Care. The model is expected to impact approximately
1,400 patients annually. Beyond its clinical benets, the
program has demonstrated nancial sustainability, operating
independently without external funding. By increasing
early PAD detection, reducing the likelihood of severe
complications, and improving patient outcomes, this AI-
driven approach is reshaping the standard of care for PAD
management.

311
Articial Intelligence
Index Report 2025
Table of Contents Chapter 5 Preview
Social Determinants of Health
The integration of LLMs and AI-based clinical decision
support (CDS) systems is transforming medicine, though
adoption varies by specialty. While some embrace LLMs,
others remain cautious. This review explores research and
innovations, emphasizing the role of a strong evidence base.
A key aspect is addressing social determinants of health
(SDoH), such as socioeconomic status and environment. In
2024, AI advancements targeted SDoH, improving patient
care and health equity.
Extracting SDoH From EHR and Clinical Notes
Fine-tuned multilabel classiers (Flan-T5 XL) outperformed
ChatGPT-family models in identifying SDoH in clinical notes
and were less sensitive to demographic descriptors. They also
exhibited lower bias, with reduced discrepancies when race,
ethnicity, or gender was introduced. Figure 5.4.12 illustrates
the performance of various models on SDoH identication
tasks in a radiotherapy test set. Newer, larger models like
Flan-T5-XXL, augmented with synthetic and gold data
(SDoH-labeled sentences), showed superior performance. As
models have scaled and incorporated more data over time,
their ability to identify SDoH has improved.
0.47
0.53
0.36
0.49
0.42
0.60
0.65 0.65 0.68 0.70
BERT-base
with gold and
synthetic data
BERT-base
with gold data
Flan-T5-base
with gold data
Flan-T5-base
with gold and
synthetic data
Flan-T5-large
with gold data
Flan-T5-large
with gold and
synthetic data
Flan-T5-XL
with gold data
Flan-T5-XXL
with gold data
Flan-T5-XL
with gold and
synthetic data
Flan-T5-XXL
with gold and
synthetic data
2018 2020 2022
0.00
0.20
0.40
0.60
0.80
1.00
Macro-F1 score
Model performance on in-domain RT test dataset (any SDoH)
Source: RAISE Health, 2025 | Chart: 2025 AI Index report
Figure 5.4.12
5.4 Clinical Care, Non-Imaging
Chapter 5: Science and Medicine
Extracting SDoH from EHRs helps healthcare providers
address social needs like housing instability or food insecurity.
These ndings highlight LLMs’ potential to enhance SDoH
documentation, resource allocation, and health equity while
emphasizing the need for bias mitigation and robust synthetic
data methods.

312
Articial Intelligence
Index Report 2025
Table of Contents Chapter 5 Preview
AI Adoption Across Medical Fields and the Integration of SDoH
Figure 5.4.13 highlights various medical elds and illustrates how AI integrates social determinants of health in each.
Field Recent research Description of integration
Oncology Istasy et al., 2024 In cancer care, AI-driven tools have been developed to consider SDoH in treatment planning.
By incorporating factors such as a patient’s access to care and support systems, these tools
assist oncologists in creating personalized treatment plans that are both eective and feasible
for patients.
Cardiology Snowdon et al., 2023
Quer et al., 2024
AI models in cardiology have been enhanced to include SDoH, improving the accuracy of risk
assessments for conditions like hypertension and heart failure. This inclusion allows for more
comprehensive patient evaluations and tailored management strategies.
Psychiatry Stade et al., 2024 LLMs have been applied to analyze community-level SDoH data, aiding in the allocation of
mental health resources. By identifying areas with high social risk factors, healthcare systems
can prioritize interventions and support services in communities with the greatest need.
Figure 5.4.13
5.4 Clinical Care, Non-Imaging
Chapter 5: Science and Medicine
Synthetic Data
Synthetic data is revolutionizing healthcare by enhancing
privacy-preserving analytics, clinical modeling, and AI
training. It optimizes workows, simulates rare cases,
and supports AI-driven innovations. However, scalability
concerns, as noted in the rst chapter of this year’s AI Index,
call for cautious adoption.
Clinical Risk Prediction
A recent study validated synthetic data for privacy-preserving
clinical risk prediction. Using ADSGAN, PATEGAN, and
DPGAN, researchers modeled lung cancer risk in ever-
smokers from the UK Biobank.5 The gure below compares
PCA eigenvalues, showing how ADSGAN and PATEGAN
closely match real data distributions, enabling reliable
clustering and feature selection (Figure 5.4.14). These ndings
demonstrate that synthetic datasets can preserve statistical
delity, support exploratory analysis, and develop predictive
models without real and identiable patient data.
Principal component analysis
Source: Qian et al., 2024
5 An ever-smoker is someone who has smoked at least 100 cigarettes in their lifetime.
Figure 5.4.14

313
Articial Intelligence
Index Report 2025
Table of Contents Chapter 5 Preview
Drug Discovery
A recent Nature study introduced a
generative AI approach for in silico
formulation optimization and particle
engineering in drug development. Using an
image generator guided by critical quality
attributes, it creates digital formulations
for analysis without extensive physical
testing. The study validated this method
by predicting the percolation threshold
of microcrystalline cellulose (MCC) in
oral tablets. Figure 5.4.15 compares the
tortuosity calculations of real tablet volumes
(green squares) with AI-synthesized
volumes (red circles).6 Their close alignment
suggests that synthetic data holds promise
for modeling drug properties and improving
AI-driven drug discovery.
Data Generation Platforms
Platforms are necessary to demonstrate,
standardize, and automate the creation
of synthetic data. Recently published
research has demonstrated that large-scale
synthetic data generation and validation
is not only feasible but also capable of
signicantly enhancing AI applications in
medicine with their synthetic tabular neural
generator (STNG) framework. Figure
5.4.16 compares the area-under-the-curve
values for real and synthetic heart disease
datasets to evaluate the eectiveness
of dierent synthetic data generation
methods. In many cases, there is a fairly
close overlap between the real datasets
and the synthetic datasets, showing the
ability of synthetic data to model complex
health conditions closely. Advancements in
synthetic data generation methodologies
can improve data delity while minimizing
privacy risks.
5.4 Clinical Care, Non-Imaging
Chapter 5: Science and Medicine
Figure 5.4.15
Figure 5.4.16
Percolation threshold prediction and validation
based on AI-generated synthetic structures
Source: Hornick et al., 2024
Areas under the curve for evaluating synthetic heart disease datasets
Source: Rashidi et al., 2024
6 Tortuosity is a measure of how convoluted or twisted a path is compared to the shortest possible straight-line distance between two points.

314
Articial Intelligence
Index Report 2025
Table of Contents Chapter 5 Preview
Electronic Health Record System
AI integration in electronic health records (EHRs) can ease
healthcare burdens by streamlining administration, enhancing
clinical decision support, and improving patient care. With
major vendors—Epic, Oracle Health (formerly Cerner),
Meditech, and TruBridge (formerly CPSI)—dominating the
market, their AI tools can be widely adopted within their
networks. As of 2021, EHR adoption had approached 90% for
any system and 80% for certied EHR systems.
A 2023 American Hospital Association IT survey found that
most hospitals using ML or predictive models in their EHRs
relied on a dominant vendor for inpatient care (Figure 5.4.17).
Adoption was highest with Epic, Cerner, and Meditech. While
Epic, Cerner, and CPSI hospitals primarily used vendor-
developed models, Meditech and others more often adopted
third-party or in-house solutions (Figure 5.4.18).
Figure 5.4.17
5.4 Clinical Care, Non-Imaging
Chapter 5: Science and Medicine
710
295
60
4 5 22
450
190 183
8 8
35
160
190 191
144
31
244
Epic Cerner Meditech CPSI/Evident Altera Other
0
100
200
300
400
500
600
700
Machine learning (ML) Other non-ML predictive model Neither/do not know
Vendor
Number of hospitals
Predictive model use across primary inpatient EHR vendor
Source: AHA survey, 2024 | Chart: 2025 AI Index report

315
Articial Intelligence
Index Report 2025
Table of Contents Chapter 5 Preview
AI integration into EHRs could streamline clinical workows
and enhance provider and patient experiences. However, it
remains unclear whether AI-enabled health IT will benet
underserved communities, which often struggle with
technological adoption. Rural areas, for example, face
barriers like limited broadband access, weak healthcare
IT infrastructure, and EHR functionality constraints—key
enablers of AI-driven healthcare. Additionally, it is important
to assess whether AI tools are equitably developed for both
basic and comprehensive EHR systems, as many resource-
limited settings still rely on the former.
95%
84%
30%
75%
8%
41%
53%
46%
71%
42%
46%
68%
52%
33%
81%
33%
54%
23%
5% 4% 2%
17%
0%
9%
0% 1% 1%
8%
0%
7%
Epic Cerner Meditech CPSI/Evident Altera Other
0%
20%
40%
60%
80%
100%
In-house EHR developer A third-party developer Self-developed Public domain Do not know (ML development)
Vendor
% of hospitals
Developer of predictive models across EHR vendor
Source: AHA survey, 2024 | Chart: 2025 AI Index report
Figure 5.4.18
5.4 Clinical Care, Non-Imaging
Chapter 5: Science and Medicine

316
Articial Intelligence
Index Report 2025
Table of Contents Chapter 5 Preview
Clinical Decision Support
AI has transformed how healthcare providers diagnose,
predict, and manage diseases with an increasing focus on
rigorous evaluation of AI-based systems in clinical trials.
The evolution of AI in clinical decision support (CDS)
reects a shift from reactive interventions—e.g., during
the COVID-19 pandemic—to proactive, data-driven clinical
decision-making with clinical trials increasing over the years.
The number of clinical trials that have included mentions of
articial intelligence is steadily rising (Figure 5.4.19).
Figure 5.4.19
5.4 Clinical Care, Non-Imaging
Chapter 5: Science and Medicine
5 9 10
25
69
111
249
349
396
448
537
2014 2015 2016 2017 2018 2019 2020 2021 2022 2023 2024
0
100
200
300
400
500
Number of clinical trials
Number of clinical trials that have included mentions of AI, 2014–24
Source: RAISE Health, 2025 | Chart: 2025 AI Index report

317
Articial Intelligence
Index Report 2025
Table of Contents Chapter 5 Preview
The COVID-19 pandemic accelerated AI adoption in triage,
resource allocation, and outcome prediction, showcasing the
technology’s potential in real-time CDS. Post-pandemic, AI
expanded beyond emergency response to managing chronic
disease, optimizing procedures, and streamlining workows.
Trials like the CERTAIN Study demonstrated how AI-driven
real-time procedural support could improve diagnostic
accuracy in gastrointestinal procedures. By 2023, AI in CDS
extended to medication safety and workow optimization, as
seen in Preventing Medication Dispensing Errors in Pharmacy
Practice, which used AI to detect real-time medication errors.
Globally, AI-driven clinical trials have sharply risen, with China
(105 trials), the U.S. (97), and Italy (42) leading in 2024 (Figure
5.4.20).
5.4 Clinical Care, Non-Imaging
Chapter 5: Science and Medicine
Figure 5.4.20
10 8
27
12 11
25
5
26
63
56
9
14
30
17 20 17
11
22
74 71
15
6
36
19
15
28
16
31
80
71
13 15 16 16 16
24
30
42
97
105
Germany Canada France Taiwan Spain United Kingdom Turkey Italy United States China
0
20
40
60
80
100
2024
2023
2022
2021
Number of clinical trials
Number of clinical trials that have included mentions of AI by select geographic areas, 2021–24
Source: RAISE Health, 2025 | Chart: 2025 AI Index report

318
Articial Intelligence
Index Report 2025
Table of Contents Chapter 5 Preview
288
397
523
674
1,031
2020 2021 2022 2023 2024
0
200
400
600
800
1,000
Number of medical AI ethics publications
Number of medical AI ethics publications, 2020–24
Source: RAISE Health, 2025 | Chart: 2025 AI Index report
The increasing integration of AI in medical research
and clinical care as discussed in previous sections
brings both promises and challenges. AI systems
lean heavily on large amounts of data for training. The
collection, use, and sharing of this data—especially in
high-stakes domains such as healthcare—can raise
various ethical concerns.
5.5 Ethical
Considerations
Meta Review
For this section, the AI Index conducted a meta
review of thousands of medical ethics studies to
glean insights on the state of the eld. The team’s
methodology is highlighted in Figure 5.5.1.
Attention to the ethical issues in medical AI has
increased in each of the past ve years. The number
of publications related to ethics and medical AI
increased fourfold from 2020 to 2024 (Figure 5.5.2).
Figure 5.5.2
5.5 Ethical Considerations
Chapter 5: Science and Medicine
Figure 5.5.1

319
Articial Intelligence
Index Report 2025
Table of Contents Chapter 5 Preview
The focus of AI applications in medical ethics literature has evolved over time. Figure 5.5.3 illustrates the ethical issues discussed
in AI medical papers from 2020 to 2024. In 2024, bias and privacy were the most frequently cited concerns, followed by equity.
In contrast, privacy was a more prominent topic than bias in 2020, but this trend has since shifted.
Bias Privacy Equity Transparency Trust Security Accessibility Stakeholders Fairness Safety
0%
5%
10%
15%
20%
25%
30%
2024 2023 2022 2021 2020
Ethical concern
% of medical AI ethics publications
Top 10 ethical concerns discussed in medical AI ethics publications, 2020–24
Source: RAISE Health, 2025 | Chart: 2025 AI Index report
0 0 0 0 0 0 0 0000000000 0 0 0 0 0 0 0
42
01210 0 0
86
1
5
9
310 0
OpenAI GPT Series
(GPT-3, ChatGPT,
GPT-3.5, GPT-4,
GPT-4-Turbo)
OpenAI Vision
(DALL-E, SORA)
Google
(LaMDA, PaLM,
Gemini)
Meta
(BART, OPT,
LLaMA)
Anthropic
(Claude)
Mistral Cohere xAI
(Grok)
0
10
20
30
40
50
60
70
80
90
2024 2023 2022 2021 2020
AI tool
Number of medical AI ethics publications
AI tools discussed in medical AI ethics publications, 2020–24
Source: RAISE Health, 2025 | Chart: 2025 AI Index report
5.5 Ethical Considerations
Chapter 5: Science and Medicine
In terms of AI tools, much attention has been paid in medical ethics literature to OpenAI’s GPT series (e.g., ChatGPT) (Figure
5.5.4). This reects an expanding interest in large-language models over the past few years.
Figure 5.5.3
Figure 5.5.4

320
Articial Intelligence
Index Report 2025
Table of Contents Chapter 5 Preview
5.5 Ethical Considerations
Chapter 5: Science and Medicine
Figure 5.5.5 and Figure 5.5.6 show the number and total
funding of NIH grants for medical AI ethics projects by scal
year. The number of grants skyrocketed from 25 in 2023 to
337 in 2024 (Figure 5.5.5). Similarly, total funding soared from
$16 million in 2023 to $276 million in 2024—an almost 17-fold
increase in just one year.
2 3 7
25
337
2020 2021 2022 2023 2024
0
50
100
150
200
250
300
350
Fiscal year
Number of NIH grants
Source: RAISE Health, 2025 | Chart: 2025 AI Index report
Number of NIH grants for medical AI ethics by scal
year, 2020–24
2.50 1.70
19.20 16.30
276.00
2020 2021 2022 2023 2024
0
50
100
150
200
250
300
Fiscal year
NIH grant funding (in millions of US dollars)
Source: RAISE Health, 2025 | Chart: 2025 AI Index report
NIH grant funding for medical AI ethics by scal year,
2020–24
Figure 5.5.5 Figure 5.5.6

321
Articial Intelligence
Index Report 2025
Table of Contents Chapter 5 Preview
Highlight:
Notable Model Releases
This year, dozens of foundation models have been developed across various
scientic elds. Some are rened large language models, adapted for
specic domains using relevant publications; others are trained from scratch
with specialized data, such as time series or weather data. These foundation
models are then ne-tuned for targeted scientic tasks or applications.
5.6 AI Foundation Models in Science
5.6 AI Foundation Models in Science
Chapter 5: Science and Medicine
AI has driven signicant progress in other scientic
domains, including physics, chemistry, and geosciences.
The table below highlights some of the most notable
recent launches in these areas, alongside newly released
resources that further track these developments. This
analysis represents an initial eort by the AI Index, which
aims to expand and deepen its coverage of AI-driven
scientic progress across a broader range of disciplines in
the future.
Date Name Domain Signicance Image
Feb 6, 2024 CrystalLLM Materials
science
Researchers ne-tuned LLaMA-2 70B on
text-encoded atomistic data to generate
stable materials, achieving nearly double
the metastability rate of a leading
diusion model (49% vs. 28%) while
maintaining physical plausibility. The
approach enables exible applications
like unconditional generation, structure
inlling, and text-guided design, with
model scale enhancing symmetry
awareness.
Figure 5.6.1
Source: Gruver et al., 2024
Feb 14, 2024 LlaSMol Chemistry To address LLMs’ poor performance on
chemistry tasks, researchers introduce
SMolInstruct, a high-quality dataset with
over 3 million samples across 14 tasks;
and LlaSMol, a set of models ne-tuned
on it. Among them, the Mistral-based
LlaSMol outperforms GPT-4 and Claude
3 Opus by a wide margin, approaching
task-specic model performance
while tuning just 0.58% of parameters,
demonstrating the power of domain-
specic instruction tuning.
Figure 5.6.2
Source: Yu et al., 2024

322
Articial Intelligence
Index Report 2025
Table of Contents Chapter 5 Preview
Apr 23, 2024 ORBIT Earth science Oak Ridge National Lab introduced
ORBIT, a 113B-parameter vision
transformer and the largest AI model
ever built for climate science—1,000
times larger than prior models. Trained
using a novel parallelism technique and
tested on the Frontier supercomputer,
ORBIT achieved up to 1.6 exaFLOPS
of sustained performance. This
breakthrough sets a new bar for AI-
driven Earth system prediction.
Figure 5.6.3
Source: Wang et al., 2024
May 20, 2024 Aurora Earth science Aurora is a large-scale foundation model
trained on over a million hours of Earth
system data, delivering state-of-the-art
forecasts for air quality, ocean waves,
cyclone tracks, and high-resolution
weather. It outperforms traditional
systems while operating at a fraction
of the computational cost, and can be
ne-tuned across domains with minimal
resources—marking a major step toward
accessible, AI-driven Earth system
forecasting.
Figure 5.6.4
Source: Bodnar et al., 2024
Jul 22, 2024 NeuralGCM Weather
forecasting
This study introduces NeuralGCM,
a hybrid model that combines a
dierentiable, physics-based solver
with machine learning components to
simulate both weather and climate. It
matches or exceeds leading ML and
physics-based models in short- and
medium-term forecasts, accurately
tracks climate metrics over decades,
and captures complex phenomena like
tropical cyclones—all while oering
massive computational savings.
Figure 5.6.5
Source: Kochkov et al., 2024
5.6 AI Foundation Models in Science
Chapter 5: Science and Medicine
Highlight:
Notable Model Releases (cont’d)

323
Articial Intelligence
Index Report 2025
Table of Contents Chapter 5 Preview
5.6 AI Foundation Models in Science
Chapter 5: Science and Medicine
Highlight:
Notable Model Releases (cont’d)
Aug 18, 2024 PhysBERT Physics Physics texts are notoriously dicult for
NLP due to their specialized language
and complex concepts. PhysBERT, the
rst physics-specic, text-embedding
model, addresses this by outperforming
general-purpose models on physics-
specic tasks. Trained on 1.2 million arXiv
papers and ne-tuned with supervised
data, it signicantly boosts performance
in information retrieval and subdomain
ne-tuning.
Figure 5.6.6
Source: Hellert et al., 2024
Sep 16, 2024 FireSat Fire
prediction
Google’s FireSat is a satellite-based
wildre detection system that uses
AI to identify res as small as 5x5
meters within 20 minutes of ignition
by analyzing real-time imagery and
environmental data. Developed in
partnership with Earth Fire Alliance
and Muon Space, it not only enhances
disaster response but also advances
global wildre research.
Figure 5.6.7
Source: Google, 2024
Dec 4, 2024 GenCast Weather
prediction
Google DeepMind’s GenCast is an AI-
powered weather model that delivers
highly accurate 15-day forecasts using a
diusion-based approach, outperforming
traditional systems like the ENS on
nearly all metrics. It generates forecasts
in minutes instead of hours and has
broad applications in disaster response,
renewable energy, and agriculture.
Figure 5.6.8
Source: Google, 2024
Dec 9, 2024 AlphaQubit Quantum
computing
In late 2024, Google DeepMind and
Google Quantum AI released AlphaQubit,
an AI-based decoder with state-of-the-art
quantum error detection. Soon after, they
introduced Willow, the rst quantum chip
to achieve exponential error suppression
and correction below the surface code
threshold—a major milestone in the eld.
Willow also completed a benchmark task
in under ve minutes that would take the
fastest supercomputer over 10 septillion
years, longer than the age of the known
universe.
Figure 5.6.9
Source: Google, 2024

Articial Intelligence
Index Report 2025
CHAPTER 6:
Policy and Governance

325Table of Contents
Overview 325
Chapter Highlights 326
6.1 Major Global AI Policy News in 2024 327
6.2 AI and Policymaking 336
Global Legislative Records on AI 336
Overview 336
By Geographic Area 337
Highlight: A Closer Look at
Global AI Legislation 338
US Legislative Records 339
Federal Level 339
State Level 340
Highlight: A Closer Look at
State-Level AI Legislation 342
Highlight: Anti-deepfake
Policymaking 343
Global AI Mentions 345
Overview 345
US Committee Mentions 348
US Regulations 349
Overview 349
By Agency 349
Highlight: A Closer Look at
US Federal Regulations 351
6.3 Public Investment in AI 352
Total AI Public Investments 353
Spending Across Agencies and Sectors 360
Highlight: AI Grant Spending in the US 362
Chapter 6: Policy and Governance
Articial Intelligence
Index Report 2025
ACCESS THE PUBLIC DATA
326
Articial Intelligence
Index Report 2025
Table of Contents Chapter 6 Preview
AI’s advancing capabilities have captured policymakers’ attention, leading to an
increase in AI-related policies worldwide. In recent years, nations and political bodies,
including the United States and the European Union, have introduced signicant
regulations. More recently, many governments have announced major investments in
AI infrastructure. This wave of policymaking reects a growing recognition of the
need to both regulate AI and harness its transformative potential.
This chapter explores global AI governance, starting with a timeline of key AI
policymaking events in 2024. It then examines global and U.S. legislative eorts,
analyzes AI-related mentions in legislative discussions, and reviews how U.S. regulatory
agencies have approached AI. The chapter concludes with an analysis of public
investment in AI in the U.S., with most data sourced independently by the AI Index.
Overview
CHAPTER 6:
Policy and Governance
Articial Intelligence
Index Report 2025

327
Articial Intelligence
Index Report 2025
Table of Contents Chapter 6 Preview
Chapter Highlights
1. U.S. states are leading the way on AI legislation amid slow progress at the federal level. In 2016, only one
state-level AI-related law was passed, increasing to 49 by 2023. In the past year alone, that number more than doubled to 131.
While proposed AI bills at the federal level have also increased, the number passed remains low.
2. Governments across the world invest in AI infrastructure. Canada announced a $2.4 billion AI infrastructure
package, while China launched a $47.5 billion fund to boost semiconductor production. France committed €109 billion to AI
infrastructure, India pledged $1.25 billion, and Saudi Arabia’s Project Transcendence represents a $100 billion AI investment
initiative.
3. Across the world, mentions of AI in legislative proceedings keep rising. Across 75 major countries, AI
mentions in legislative proceedings increased by 21.3% in 2024, rising to 1,889 from 1,557 in 2023. Since 2016, the total number
of AI mentions has grown more than ninefold.
4. AI safety institutes expand and coordinate across the globe. In 2024, countries worldwide launched international
AI safety institutes. The rst emerged in November 2023 in the U.S. and the U.K. following the inaugural AI Safety Summit.
At the AI Seoul Summit in May 2024, additional institutes were pledged in Japan, France, Germany, Italy, Singapore, South
Korea, Australia, Canada, and the European Union.
CHAPTER 6:
Policy and Governance
Articial Intelligence
Index Report 2025
5. The number of U.S. AI-related federal regulations skyrockets. In 2024, 59 AI-related regulations were
introduced—more than double the 25 recorded in 2023. These regulations came from 42 unique agencies, twice the 21
agencies that issued them in 2023.
6. U.S. states expand deepfake regulations. Before 2024, only ve states—California, Michigan, Washington, Texas,
and Minnesota—had enacted laws regulating deepfakes in elections. In 2024, 15 more states, including Oregon, New Mexico,
and New York, introduced similar measures. Additionally, by 2024, 24 states had passed regulations targeting deepfakes.

328
Articial Intelligence
Index Report 2025
Table of Contents Chapter 6 Preview
Singapore plans to invest $1B in AI over 5 years
In his budget speech on February 16, Deputy Prime Minister and
Finance Minister Lawrence Wong announced that the government
will allocate over $1 billion over the next ve years to support AI
computation, talent development, and industry growth.
Abu Dhabi launches $100B AI investment rm
In March 2024, Abu Dhabi established MGX Fund Management
Limited, a state-owned investment rm specializing in AI
technologies, with a target of managing $100 billion in assets. This
initiative aligns with the UAE’s strategic objective to position itself as
a global leader in AI innovation and technology.
Articial Intelligence Act is passed by European Parliament
The landmark EU AI Act, the rst of its kind, was passed by the
European Parliament three months after a provisional agreement on
the bill was reached. The legislation introduces sweeping provisions
around AI systems, including transparency and reporting obligations,
risk-based regulations, and bans on certain applications including
social scoring, human manipulation, and biometric categorization
that uses “sensitive characteristics.” Most of the Act’s provisions will
come into eect in 2026 after a two-year implementation period.
The Act is signicant for its restrictive nature, building on the already
stringent EU privacy regulations. It takes a unique approach to
regulating generative AI, diering from other proposed legislation,
and has been met with resistance from the industry.
This chapter begins with an overview of
some of the most signicant AI-related
policy events in 2024, as selected by the
AI Index Steering Committee.
6.1 Major Global AI Policy News in 2024
6.1 Major Global AI Policy News in 2024
Chapter 6: Policy and Governance
Source: The Straits Times, 2024
Figure 6.1.1
Source: Bloomberg, 2024
Figure 6.1.2
Source: Time, 2023
Figure 6.1.3
Feb. 21, 2024
Mar. 11, 2024
Mar. 13, 2024

329
Articial Intelligence
Index Report 2025
Table of Contents Chapter 6 Preview
India drops plan to require government approval for
launch of new AI models
Less than a month after issuing an advisory requiring tech rms to
obtain government approval before launching new AI models, India
releases revised guidelines for companies’ self-regulation, following
backlash from entrepreneurs and investors. Under the new guidelines,
rms must inform users if their models are undertested or unreliable.
India’s IT Ministry retained its emphasis that AI models should not
undermine electoral integrity or promote bias and discrimination.
India launches IndiaAI Mission with $1.25B investment
In March 2024, India launched the IndiaAI Mission to strengthen its
AI ecosystem. The $1.25 billion initiative aims to build 10,000-plus
GPUs via public-private partnerships, develop a national nonpersonal
data platform, and support homegrown AI models and deep-tech
startups. It also prioritizes ethical AI governance and expanding AI
labs beyond major cities to democratize access.
French government nes Google 250 million euros over
use of copyrighted information
France’s competition watchdog, the Autorité de la Concurrence,
took a harsh stance toward negligent model training when it ned
Google 250 million euros for using French news content to train
Bard, now Gemini, the company’s AI-powered chatbot—without
notifying media companies. The government cited the oense as a
breach of EU intellectual property rules, and claimed it prevented
publishers and press agencies from negotiating fair prices. Google
accepted the settlement and proposed a series of measures to
mitigate scraping issues.
6.1 Major Global AI Policy News in 2024
Chapter 6: Policy and Governance
Source: TechCrunch, 2024
Figure 6.1.4
Source: Nature, 2024
Figure 6.1.5
Source: NBC News, 2024
Figure 6.1.6
Mar. 15, 2024
Mar. 17, 2024
Mar. 20, 2024

330
Articial Intelligence
Index Report 2025
Table of Contents Chapter 6 Preview
U.N. General Assembly adopts resolution promoting
“safe, secure, and trustworthy” AI
Backed by more than 120 member states, the U.N. General assembly
adopted a “historic” U.S.-led resolution (although not ocially
legally binding) on the promotion of “safe, secure, and trustworthy”
articial intelligence systems. The assembly called on stakeholders
to ensure that articial intelligence systems be used in compliance
with human rights laws, recognizing the role these systems may
play in accelerating progress toward reaching the U.N.’s Sustainable
Development Goals. The resolution was supported by more than 120
states, including China, and endorsed without a vote by all 193 U.N.
member states.
Canada pledges CA$2.4B investment to ensure country’s
AI advantage
The Canadian Federal Budget for 2024 featured a CA$2.4 billion
package of measures to “secure Canada’s AI advantage” in the
midst of an intensifying global race for AI development and
adoption. Funding would be directed toward a range of initiatives,
including increasing capabilities and infrastructure for researchers
and developers, boosting AI startups, helping small and medium
businesses increase productivity through AI, supporting workers
impacted by AI, and creating a new Canadian AI Safety Institute.
U.K. AI Safety Institute launches open-source tool for
assessing AI model safety
The agency released a toolset, called Inspect, designed to assess AI
models’ capabilities in a range of areas, including core knowledge,
ability to reason, and autonomous capabilities. The Institute
claimed it was the rst time an AI safety testing platform had been
spearheaded by a government-backed body, and made available for
public use under an open-source license in order to benet industry,
research organizations, and academia.
6.1 Major Global AI Policy News in 2024
Chapter 6: Policy and Governance
Source: UN News, 2024
Figure 6.1.7
Source: Center for International
Governance Innovation, 2024
Figure 6.1.8
Source: TechCrunch, 2024
Figure 6.1.9
Mar. 21, 2024
Apr. 7, 2024
May 11, 2024

331
Articial Intelligence
Index Report 2025
Table of Contents Chapter 6 Preview
U.K. and South Korea cohost AI safety summit in Seoul
At the AI Seoul Summit, attending countries shared the safety
measures they adopted in line with the Bletchley Declaration,
which was signed the year prior at the U.K. AI Safety Summit. The
declaration emphasizes the ethical and responsible development of
AI. Building on the progress made at the U.K. summit, countries have
since launched or announced plans for AI safety institutes. In Seoul,
these nations took another step forward by signing a letter of intent
to establish a collaborative network of institutes, highlighting the
importance of global cooperation in advancing AI safety.
China creates country’s largest-ever state-backed
investment fund to back its semiconductor industry
China launched a fund worth $47.5 billion to boost semiconductor
production. The launch marks the third phase of China’s “Big Fund,”
which has supported the industry’s development since 2014,
including crucial investments into the country’s two largest chip
foundries. The move comes amid rising U.S. export controls on
critical technologies like semiconductors that underpin hardware
components like GPUs used to train AI systems.
European Commission establishes AI Oce
Over three years after the EU AI Act was proposed, the European
Commission unveils its cornerstone. The AI Oce will play a key role
in implementing the Act, enforcing standards for general-purpose
AI models, coordinating the development of codes of practice, and
applying sanctions for oenses under the Act. With over 140 sta
members, the body consists of ve units dedicated to dierent AI-
related goals, including promoting societal good through AI and
pursuing excellence in AI and robotics.
6.1 Major Global AI Policy News in 2024
Chapter 6: Policy and Governance
Source: Center for Strategic and
International Studies, 2024
Figure 6.1.10
Source: Reuters, 2024
Figure 6.1.11
Source: Center for Strategic and
International Studies, 2024
Figure 6.1.12
May 21, 2024
May 27, 2024
May 28, 2024

332
Articial Intelligence
Index Report 2025
Table of Contents Chapter 6 Preview
U.S. NIST unveils framework to help organizations
identify and mitigate GenAI risks
The National Institute of Standards and Technology (NIST) launches
a voluntary framework to help organizations identify unique
risks posed by generative AI and recommends a series of actions
for mitigating those risks. The framework extends the NIST AI
Risk Management Framework released in 2023. Recommended
actions include determining AI risk tolerance and respective risk
management needs, establishing clear responsibilities for managing
AI risks, and involving nondeveloper experts in regular assessment
and updates. The framework followed the release of a NIST
document on adversarial machine learning outlining a taxonomy of
attack types, the eects of such attacks, and mitigation strategies.
U.S. State Department releases AI Risk Management
Prole for Human Rights
The U.S. State Department designed the Risk Management Prole for
Articial Intelligence and Human Rights as a guide for governments,
businesses, and civil society to align AI risk management with
human rights protections. Built on the NIST AI Risk Management
Framework, the Prole outlines four key functions—govern, map,
measure, and manage—to assess and mitigate AI risks, from bias to
misuse for surveillance. By bridging AI governance and human rights,
it provides a globally applicable tool for responsible AI development
and deployment.
U.K. withdraws £1.3B promised for technology and
AI infrastructure
The U.K.’s Labour government canceled £1.3 billion in funding
promised for technology and AI projects, explaining that the
commitments made by the previous government had been
“underfunded.” Announced in 2023, the projects included £500
million for the AI Research Resource, which funds computing power,
and £800 million for the creation of the University of Edinburgh’s
exascale supercomputer.
6.1 Major Global AI Policy News in 2024
Chapter 6: Policy and Governance
Source: FedScoop, 2024
Figure 6.1.13
Source: U.S. Department of State, 2024
Figure 6.1.14
Source: BBC, 2024
Figure 6.1.15
Jun. 26, 2024
Jul. 25, 2024
Aug, 2, 2024

333
Articial Intelligence
Index Report 2025
Table of Contents Chapter 6 Preview
U.S. White House launches task force on AI data center
infrastructure
A White House meeting brought together federal ocials and
technology executives to discuss securing power sources for robust
data center infrastructure critical to AI models. Executives from
OpenAI, Anthropic, Amazon Web Services, Nvidia, and Alphabet
were present. A White House press release emphasized that
advancing AI development in the U.S. is vital for national security
and ensuring AI systems are safe, secure, and trustworthy. The
newly formed AI data center infrastructure task force will identify
opportunities and work with agencies to prioritize the development
of AI data centers.
California governor signs three bills on AI and elections
communications
Ahead of the 2024 San Francisco mayoral election, Governor Gavin
Newsom announced the signing of three bills into law aimed at
combating deepfake election content. AB 2655, AB 2839, and AB
2355 require large online platforms to remove or label digitally
altered election content during specied periods, expand the time
frame for prohibiting the distribution of deceptive AI-generated
election content, and mandate that electoral ads using AI-generated
or altered content include appropriate disclosures, respectively.
United Nations adopts Global Digital Compact to ensure
an inclusive and secure digital future
During the Summit of the Future, U.N. member states adopted the
Global Digital Compact, aiming to establish an inclusive, open,
sustainable, fair, safe, and secure digital future for all. The Compact
emphasizes objectives such as closing digital divides, expanding
benets from the digital economy, fostering a digital space that
respects human rights, advancing equitable data governance, and
enhancing international governance of articial intelligence. Guided
by principles anchored in international law and human rights,
the Compact seeks to harness digital technologies to accelerate
progress toward the Sustainable Development Goals.
6.1 Major Global AI Policy News in 2024
Chapter 6: Policy and Governance
Source: FedScoop, 2024
Figure 6.1.16
Source: The Wall Street Journal, 2024
Figure 6.1.17
Source: United Nations, 2024
Figure 6.1.18
Sep. 13, 2024
Sep. 17, 2024
Sep. 22, 2024

334
Articial Intelligence
Index Report 2025
Table of Contents Chapter 6 Preview
California governor vetoes expansive AI legislation
Governor Gavin Newsom vetoed California’s AI safety bill, which
would have set a national precedent for AI regulation, given the
state’s role as home to many leading AI companies. The bill sought
to mandate safety testing for frontier AI models before their public
release and would have allowed the state attorney general to sue
companies over AI-related harm. Supporters argued it was a nec-
essary step to ensure AI safety and accountability, while critics con-
tended it was overly restrictive and could stie AI development, es-
pecially of the open-weight AI ecosystem. Given California’s status
as the world’s fth-largest economy, the bill’s impact could have
extended beyond state borders, akin to the Brussels eect, shaping
AI governance nationally and internationally. Newsom defended his
veto, arguing the bill imposed excessive standards.
U.S. judge blocks new California AI law over
Kamala Harris deepfake
A federal judge in California issued a temporary injunction on one
of the state’s new AI laws just two weeks after it was signed. In his
ruling, Judge Mendez cited the law’s vague denition of “harmful”
depictions as a potential threat to constitutionally protected speech.
The law had been used to prosecute an X user after he had posted a
deepfake featuring Kamala Harris.
Saudi Arabia announces “Project Transcendence”
In November 2024, Saudi Arabia announced Project Transcendence,
a $100 billion AI initiative aimed at establishing the kingdom as a
global tech hub. Spearheaded by the Public Investment Fund, the
project includes a partnership with Alphabet, Google’s parent
company, involving an investment between $5 billion and $10
billion to develop Arabic-language AI models. This initiative aligns
with Saudi Arabia’s Vision 2030, which focuses on diversifying the
region’s economy beyond oil and becoming a meaningful hub of AI.
6.1 Major Global AI Policy News in 2024
Chapter 6: Policy and Governance
Source: Financial Times, 2024
Figure 6.1.19
Source: Los Angeles Times, 2024
Figure 6.1.20
Source: Telecom Review, 2024
Figure 6.1.21
Sep. 29, 2024
Oct. 2, 2024
Nov. 8, 2024

335
Articial Intelligence
Index Report 2025
Table of Contents Chapter 6 Preview
European Commission AI Oce releases rst draft of
Code of Practice for General-Purpose AI
The European AI Oce issued the rst of four drafts for the General-
Purpose AI Code of Practice. This code was developed by four
working groups of independent experts, focusing on transparency
and copyright, risk identication and assessment, risk mitigation,
and internal governance. Once nalized, the code will complement
the AI Act, allowing AI model providers to demonstrate compliance
until a nalized standard is published.
U.S. launches international AI safety network with
global partners
In November 2024, the U.S. Department of Commerce and the
U.S. Department of State cohosted the inaugural meeting of the
International Network of AI Safety Institutes in San Francisco. This
initiative aims to improve global coordination on safe AI innovation,
focusing on managing synthetic content risks, testing foundation
models, and conducting risk assessments for advanced AI systems.
The United States serves as the inaugural chair, with initial members
including Australia, Canada, the European Union, France, Japan,
Kenya, the Republic of Korea, Singapore, and the United Kingdom.
The network has secured over $11 million in global research funding
commitments to support its eorts.
U.S. increases export controls of semiconductor
manufacturing equipment and software to China
The U.S. Department of Commerce’s Bureau of Industry and Security
further limited China’s ability to produce advanced semiconductors
by announcing new export controls. These measures include
restrictions on 24 types of semiconductor manufacturing
equipment, three types of software tools, and additional limitations.
The secretary of commerce emphasized the importance of these
measures in safeguarding U.S. national security.
6.1 Major Global AI Policy News in 2024
Chapter 6: Policy and Governance
Source: European Union, 2024
Figure 6.1.22
Source: AP, 2024
Figure 6.1.23
Source: CNBC, 2024
Figure 6.1.24
Nov. 14, 2024
Nov. 25, 2024
Dec. 2, 2024

336
Articial Intelligence
Index Report 2025
Table of Contents Chapter 6 Preview
U.N. Security Council debates uses of AI in conicts and
calls for global framework
On Dec. 19, 2024, the United Nations Security Council convened to
address the challenges posed by AI in military contexts. Secretary-
General António Guterres emphasized that AI’s rapid evolution is
outpacing current governance frameworks, potentially undermining
human control over weapons systems. He called for “international
guardrails” to ensure AI’s safe and inclusive use. These discussions
continue amid reports of widespread autonomous drone and robot
use in the ongoing war in Ukraine.
6.1 Major Global AI Policy News in 2024
Chapter 6: Policy and Governance
Source: Berkeley Political Review, 2016
Figure 6.1.25
Dec. 19, 2024

337
Articial Intelligence
Index Report 2025
Table of Contents Chapter 6 Preview
6.2 AI and Policymaking
Global Legislative Records on AI
Overview
The AI Index analyzed legislation containing the term
“articial intelligence” in 114 countries from 2016 to 2024.1
Of these, 39 countries have enacted at least one AI-related
law (Figure 6.2.1).2 In total, the countries have passed 204
AI-related laws. Figure 6.2.2 illustrates the annual count of
AI-related laws enacted since 2016. The total number of
AI-related laws passed rose from 30 in 2023 to 40 in 2024,
making 2024 the second-highest year on record after 2022.
Since 2016, the number of AI-related laws passed has grown
from just one to 40.
0
1–5
6–10
11–15
16–30
No available data
Number of AI-related bills passed into law by country, 2016–24
S
ource: AI Index, 2025 | Chart: 2025 AI Index report
Figure 6.2.1
6.2 AI and Policymaking
Chapter 6: Policy and Governance
1 The analysis may undercount the number of actual laws passed, given that large bills that are proposed can include multiple sections related to AI. For example, the National Defense
Authorization Act is introduced as a single omnibus bill but includes a collection of smaller bills that were originally proposed individually and later consolidated into one single comprehensive bill.
2 The AI Index monitored AI-related laws passed in Hong Kong and Macao, despite these not being ocially recognized countries. Thus, the Index covers a total of 116 geographic areas.
Laws passed by Hong Kong and Macao were counted in the overall tally of AI-related laws. This year, the Index decreased its country sample compared to previous years, due to issues
accessing the legislative databases of certain nations. As a result, there is a dierence between the number of AI-related laws reported this year and those in prior reports.

338
Articial Intelligence
Index Report 2025
Table of Contents Chapter 6 Preview
6.2 AI and Policymaking
Chapter 6: Policy and Governance
2016 2017 2018 2019 2020 2021 2022 2023 2024
0
5
10
15
20
25
30
35
40
45
Number of AI-related bills passed
40
Number of AI-related bills passed into law in 116 select geographic areas, 2016–24
Source: AI Index, 2025 | Chart: 2025 AI Index report
Figure 6.2.2
By Geographic Area
Figure 6.2.3 highlights the number of AI-related laws enacted
in 2024 across the top 15 geographic areas. Russia led with
seven laws, followed by Belgium and Portugal with ve
each. Figure 6.2.4 displays the total number of AI-related
laws passed since 2016, with the United States leading at 27,
followed by Portugal and Russia, each with 20.3
7
5
5
4
2
2
2
2
1
1
1
1
1
1
1
0 1 2 3 4 5 6 7
Germany
France
China
Barbados
Bahamas
Austria
Australia
United Kingdom
South Korea
Latvia
Hong Kong
United States
Portugal
Belgium
Russia
Number of AI-related bills passed
Source: AI Index, 2025 | Chart: 2025 AI Index report
Number of AI-related bills passed into law in select
geographic areas, 2024
27
20
20
18
13
11
10
10
9
7
6
4
4
4
3
0 2 4 6 8 10 12 14 16 18 20 22 24 26 28
Andorra
Japan
Germany
China
Philippines
Austria
France
United Kingdom
Italy
Spain
South Korea
Belgium
Russia
Portugal
United States
Number of AI-related bills passed
Source: AI Index, 2025 | Chart: 2025 AI Index report
Number of AI-related bills passed into law in select
geographic areas, 2016–24 (sum)
Figure 6.2.3 Figure 6.2.4
3 For concision, Figure 6.2.3 and Figure 6.2.4 display data for the top 15 geographic areas by count. Complete country-level totals will be available in the summer 2025 update of the Global AI
Vibrancy Tool. For immediate access, please contact the AI Index team.

339
Articial Intelligence
Index Report 2025
Table of Contents Chapter 6 Preview
Highlight:
A Closer Look at Global AI Legislation
The following subsection delves into some of the AI-related legislation passed into law during 2024. Figure 6.2.5 samples
ve countries’ laws covering a range of AI-related issues.
Country Bill name Description
Austria Federal law amending the
KommAustria Act and the
Telecommunications Act 2021
This act establishes a Service Center for Articial Intelligence
to support, advise, and coordinate AI governance in the media,
telecommunications, and postal sectors. It mandates an AI advisory
board to monitor AI developments, advise the government, and
help shape national AI policy. The Service Center must maintain
an information portal on AI projects, particularly publicly funded
ones. It also provides guidance on AI regulation, cybersecurity, and
compliance. To fund these activities, €700,000 is allocated annually,
with future adjustments based on ination.
Belgium Royal decree establishing an
orientation committee on articial
intelligence
This act creates a federal AI steering committee to advise the
government on AI-related policies and serve as the primary point
of contact for AI governance. The committee, composed of
representatives from ministries and public institutions, meets regularly
to provide recommendations and coordinate AI policy across Belgium.
France LAW No. 2021-1382 of October
25, 2021, relating to the regulation
and protection of access to cultural
works in the digital age4
This law establishes the Regulatory Authority for Audiovisual and
Digital Communication (ARCOM) by merging the Higher Audiovisual
Council (CSA) and the High Authority for the Distribution of Works
and the Protection of Rights on the Internet (HADOPI). It strengthens
measures against online piracy and enhances the regulation of digital
platforms to safeguard access to cultural content in the digital space.
The law also references articial intelligence as a tool ARCOM can
use to monitor and regulate digital platforms, particularly for detecting
copyright infringements and combating online piracy.
Latvia Amendments to the Pre-election
Campaigning Law
This act regulates the use of AI in political advertising, requiring clear
disclosure for AI-generated content in paid campaign materials. It also
bans the use of automated systems with fake or anonymous social
media proles for election campaigns.
Russia On Amendments to the Federal
Law “On Personal Data” and the
Federal Law “On Conducting an
Experiment to Establish Special
Regulations for Creating Necessary
Conditions for the Development
and Implementation of Articial
Intelligence Technologies in the
Constituent Entity of the Russian
Federation – the Federal City of
Moscow,” and on Amendments to
Articles 6 and 10 of the Federal Law
“On Personal Data”
This act establishes a framework for processing and sharing
anonymized personal data to support AI development in government
operations. It regulates AI-driven decision making, sets security
standards for biometric data, and restricts foreign access to sensitive
AI-related datasets.
6.2 AI and Policymaking
Chapter 6: Policy and Governance
Figure 6.2.5
4 Law No. 2024-449, passed in 2024, amends Law No. 2021-1382—originally enacted in 2021 and updated in 2024 to include AI—by broadening its scope to cover articial intelligence and
authorizing ARCOM to utilize AI.

340
Articial Intelligence
Index Report 2025
Table of Contents Chapter 6 Preview
US Legislative Records
Federal Level
Figure 6.2.6 illustrates the total number of passed versus
proposed AI-related bills in the U.S. Congress and
demonstrates a signicant increase in proposed legislation.5 In
the last year, the count of proposed AI-related bills continued
to rise, increasing from 171 in 2023 to 221 in 2024. Since
2022, the number of proposed U.S. federal AI-related bills
has almost tripled. Still, of all AI-related bills being proposed,
relatively few are passed. The signicant increase in U.S.
AI-related legislative activity likely reects policymakers’
response to the increasing public awareness and capabilities
of AI technologies, particularly generative AI.6
2016 2017 2018 2019 2020 2021 2022 2023 2024
0
30
60
90
120
150
180
210
Number of AI-related bills
4, Passed
221, Proposed
Number of congressional AI-related proposed bills and passed laws in the United States, 2016–24
Source: AI Index, 2025 | Chart: 2025 AI Index report
Figure 6.2.6
6.2 AI and Policymaking
Chapter 6: Policy and Governance
5 A bill is passed when it successfully clears both chambers of Congress: the House and the Senate.
6 This section covers only congressional bills. However, U.S. AI policymaking extends beyond Congress to other bodies, including the Executive Branch—such as President Donald Trump’s
Stargate announcement—and rules coming from regulatory agencies like the FTC.

341
Articial Intelligence
Index Report 2025
Table of Contents Chapter 6 Preview
State Level
The AI Index also tracks data on the enactment of AI-
related legislation at the state level. Figure 6.2.7 highlights
the number of AI-related laws enacted by U.S. states in
2024. According to the AI Index tracking methodology,
California leads with 22 laws, followed by Utah with 12 and
Maryland with eight. Figure 6.2.8 displays the total amount
of legislation passed by states from 2016 to 2024. California
again tops the ranking with 42 bills, followed by Maryland
(17), Virginia (17), and Utah (17).
22
12
8
6
5
5
5
4
4
4
4
4
4
4
3
0 2 4 6 8 10 12 14 16 18 20 22
Idaho
Tennessee
Mississippi
Massachusetts
Florida
Colorado
Arizona
Alabama
New York
New Hampshire
Illinois
Virginia
Maryland
Utah
California
Number of AI-related bills passed
Source: AI Index, 2025 | Chart: 2025 AI Index report
Number of AI-related bills passed into law in select
US states, 2024
AL
7
AK
0
AZ
5AR
0
CA
42 CO
7
CT
3
DE
1
FL
9
GA
3
HI
4
ID
4IL
11 IN
4
IA
4
KS
0KY
2
LA
4
ME
1
MD
17
MA
11
MI
7
MN
4
MS
6
MO
0
MT
0
NE
1
NV
2
NH
6
NJ
3
NM
3
NY
8
NC
6
ND
3
OH
2
OK
0
OR
2PA
3
RI
0
SC
1
SD
1
TN
4
TX
5
UT
17
VT
7
VA
17
WA
11
WV
4
WI
2
WY
1
Source: AI Index, 2025 | Chart: 2025 AI Index report
Number of state-level AI-related bills passed into law in the
United States by state, 2016 24 (sum)
Figure 6.2.7
Figure 6.2.8
6.2 AI and Policymaking
Chapter 6: Policy and Governance

342
Articial Intelligence
Index Report 2025
Table of Contents Chapter 6 Preview
Since 2016, the number of state-level AI-related laws has rapidly increased. Only one such bill was passed in 2016, rising to 49
by 2023. In the past year alone, that number more than doubled to 131 (Figure 6.2.9).
2016 2017 2018 2019 2020 2021 2022 2023 2024
0
20
40
60
80
100
120
140
Number of AI-related bills passed
131
Number of AI-related bills passed into law by all US states, 2016–24
Source: AI Index, 2025 | Chart: 2025 AI Index report
Figure 6.2.9
6.2 AI and Policymaking
Chapter 6: Policy and Governance

343
Articial Intelligence
Index Report 2025
Table of Contents Chapter 6 Preview
Highlight:
A Closer Look at State-Level AI Legislation
The following subsection highlights some of the AI-related legislation passed into law at the state level during 2024.
The Index proles legislation from states like California and New York, major hubs for AI companies, alongside states
like Alabama and Colorado, which play a smaller role in the industry. This approach highlights the diverse concerns
shaping AI legislation at the state level (Figure 6.2.10).
State Bill name Description
Alabama Relating to elections; to provide
that distribution of materially
deceptive media is a crime
This bill prohibits the distribution of AI-generated deceptive media
within 90 days of an election if intended to mislead voters or harm a
candidate, with penalties ranging from a misdemeanor to a felony for
repeat oenses. Exceptions apply for media with clear disclaimers,
news reporting, and satire, while violations can result in misdemeanor
or felony charges, and aected parties may seek legal action.
California California AI Transparency Act This act requires large AI providers to oer free AI detection
tools and ensure AI-generated content includes clear, permanent
disclosures. Violations result in a $5,000 ne per instance, with
enforcement by the attorney general or local authorities.
Colorado Consumer Protections for
Articial Intelligence7
This bill establishes consumer protections for interactions with
high-risk AI systems, requiring developers and deployers to prevent
algorithmic discrimination. AI systems must provide transparency,
allow consumers to correct or appeal AI-driven decisions, and
undergo regular impact assessments.
Massachusetts An Act to Provide for the Future
Information Technology Needs of
Massachusetts
This act allocates $1.26 billion to modernize information technology,
cybersecurity, and broadband infrastructure across Massachusetts.
It includes $25 million to integrate AI and machine learning into
state government operations, enhancing automation, eciency, and
cybersecurity.
New York An Act to Amend the General
Business Law, in Relation to
Requiring Disclosure of Certain
Social Media Terms of Service
This act requires social media companies to publicly disclose
their terms of service for each platform they own or operate in a
clear and accessible manner. It also mandates submitting terms of
service reports to the attorney general and imposes penalties for
noncompliance.
6.2 AI and Policymaking
Chapter 6: Policy and Governance
Figure 6.2.10
7 This bill is colloquially known as the “Colorado AI Act.”

344
Articial Intelligence
Index Report 2025
Table of Contents Chapter 6 Preview
6.2 AI and Policymaking
Chapter 6: Policy and Governance
Figure 6.2.11
Highlight:
Anti-deepfake Policymaking
States in the U.S. have been particularly active in passing
legislation to combat deepfakes. A deepfake is AI-
generated synthetic media that manipulates or replaces
a person’s likeness in video, audio, or images, often
creating realistic but deceptive content. Deepfakes
can be used to manipulate election outcomes, as
discussed in Chapter 3 of this year’s AI Index, or to
generate explicit images. The nonprot Public Citizen
maintains a database tracking AI deepfake regulations,
covering both election-related misuse and intimate
image misuse. Figure 6.2.11 illustrates the number of
state-level laws passed in the United States over time,
encompassing anti-deepfake regulations related to
elections and intimate images.8 Figure 6.2.12 highlights
when states enacted laws to regulate AI deepfakes
in elections. Before 2024, ve states—California,
Washington, Texas, Michigan, and Minnesota—had
passed such laws. In 2024, 12 more states, including
Oregon, New Mexico, and New York, introduced similar
regulations.
State-level regulations against intimate deepfakes
are far more widespread than those against election
misuse. A total of 25 states have enacted laws covering
all individuals, while ve states have passed regulations
that apply only to minors (Figure 6.2.13). Wyoming and
Ohio are the only states yet to implement any form of
intimate deepfake regulation.
2019 2020 2021 2022 2023 2024
0
5
10
15
20
25
30
35
Number of state-level laws enacted
20, Elections
36, Intimate imagery
Source: Public Citizen, 2025 | Chart: 2025 AI Index report
Number of state-level laws enacted on AI-generated deepfakes in intimate imagery and elections in the
United States, 2019–24
8 In some cases, the AI Index could not verify the enactment dates of certain state-level AI-related anti-deepfake laws tracked by Public Citizen. Figure 6.2.11 includes only those bills with
conrmed passage dates.

345
Articial Intelligence
Index Report 2025
Table of Contents Chapter 6 Preview
6.2 AI and Policymaking
Chapter 6: Policy and Governance
Figure 6.2.12
Figure 6.2.13
Highlight:
Anti-deepfake Policymaking (cont’d)
AL
AK
AZ AR
CA CO
CT
DE
FL
GA
HI
ID IL INIA
KS KY
LA
ME
MD
MA
MIMN
MS
MO
MT
NE
NV
NH
NJ
NM
NY
NC
ND
OH
OK
OR PA
RI
SC
SD
TN
TX
UT
VT
VA
WA
WV
WI
WY
Source: Public Citizen, 2025 | Chart: 2025 AI Index report
Enacted pre-2024
Enacted in 2024
Legislation pending
No legislation enacted
State-level laws regulating AI-generated deepfakes in elections
in the US by state and status as of 2024
AL
AK
AZ AR
CA CO
CT
DE
FL
GA
HI
ID IL INIA
KS KY
LA
ME
MD
MA
MIMN
MS
MO
MT
NE
NV
NH
NJ
NM
NY
NC
ND
OH
OK
OR PA
RI
SC
SD
TN
TX
UT
VT
VA
WA
WV
WI
WY
Source: Public Citizen, 2025 | Chart: 2025 AI Index report
Enacted (covers everyone)
Enacted (covers minors only)
Legislation pending (covers everyone)
Legislation pending (covers minors only)
No legislation enacted
State-level laws regulating AI-generated deepfakes in intimate imagery
in the US by state and status as of 2024

346
Articial Intelligence
Index Report 2025
Table of Contents Chapter 6 Preview
2016 2017 2018 2019 2020 2021 2022 2023 2024
0
200
400
600
800
1,000
1,200
1,400
1,600
1,800
Number of mentions
1,889
Number of mentions of AI in legislative proceedings in 75 select geographic areas, 2016–24
Source: AI Index, 2025 | Chart: 2025 AI Index report
Figure 6.2.14
Global AI Mentions
Another barometer of legislative interest is the number
of mentions of articial intelligence in governmental and
parliamentary proceedings. The AI Index conducted
an analysis of the minutes or proceedings of legislative
sessions in 73 countries that contain the keyword “articial
intelligence” from 2016 to 2024.9
Overview
Figure 6.2.14 shows the total number of legislative sessions
worldwide that have mentioned AI since 2016. In the past
year, AI mentions rose by 21.3%, increasing from 1,557 in
2023 to 1,889. Since 2016, the total number of AI mentions
has grown more than ninefold.
6.2 AI and Policymaking
Chapter 6: Policy and Governance
9 The full list of analyzed countries is available in the Appendix. The AI Index research team aimed to review governmental and parliamentary proceedings worldwide, but publicly accessible
databases were not available for all countries. This year, the Index slightly adjusted its tracking methodology, resulting in minor dierences from previous totals. More specically, mentions
are counted by session, so multiple mentions of AI in the same legislative session count as one mention. The full methodology is detailed in the Appendix. Additionally, the AI Index tracked
mentions in Macao and Hong Kong. While not ocially countries, their mentions were included in the tally presented in Figure 6.2.14. In total, the Index tracked AI mentions across 75
geographic areas.

347
Articial Intelligence
Index Report 2025
Table of Contents Chapter 6 Preview
0
1–55
56–120
121–250
251–315
No available data
Number of mentions of AI in legislative proceedings by country, 2024
Source: AI Index, 2025 | Chart: 2025 AI Index report
0
1–220
221–440
441–660
661–890
891–1,200
No available data
Number of mentions of AI in legislative proceedings by country, 2016–24 (sum)
Source: AI Index, 2025 | Chart: 2025 AI Index report
Figure 6.2.15
Figure 6.2.16
In 2024, Spain led in AI mentions within its legislative proceedings (314), followed by Ireland (145) and Australia (123) (Figure
6.2.15). Of the 75 geographic areas analyzed, 57 referenced AI in at least one legislative proceeding in 2024.
When legislative mentions are aggregated from 2016 to 2024, a somewhat similar trend emerges (Figure 6.2.16). Spain is rst
with 1,200 mentions, followed by the United Kingdom (710) and Ireland (659).
6.2 AI and Policymaking
Chapter 6: Policy and Governance

348
Articial Intelligence
Index Report 2025
Table of Contents Chapter 6 Preview
United States
Portugal
Russia
Belgium
Spain
ItalySouth Korea United Kingdom
France
Philippines
Hong Kong Japan
AustraliaBrazil Canada
Iceland
India
0 100 200 300 400 500 600 700 800 900 1,000 1,100 1,200
0
5
10
15
20
25
Number of AI mentions
Number of AI-related bills passed into law
Germany
AndorraLatvia
Liechtenstein
China
Barbados
Slovenia
Panama
Mentions of AI in legislative proceedings vs. AI-related bills passed into law in select countries, 2016–24
Source: AI Index, 2025 | Table: 2025 AI Index report
Figure 6.2.17
Drawing on data from select countries, Figure 6.2.17 compares
AI mentions in parliamentary discussions with the number
of AI-related bills passed. In general, greater parliamentary
discussion of AI correlates with more AI legislation—although
some countries, such as Belgium, Portugal, and Russia,
deviate from this trend.
6.2 AI and Policymaking
Chapter 6: Policy and Governance

349
Articial Intelligence
Index Report 2025
Table of Contents Chapter 6 Preview
107th
(2001–02)
108th
(2003–04)
109th
(2005–06)
110th
(2007–08)
111th
(2009–10)
112th
(2011–12)
113th
(2013–14)
114th
(2015–16)
115th
(2017–18)
116th
(2019–20)
117th
(2021–22)
118th
(2023–24)
0
20
40
60
80
100
120
140
Number of mentions
136
Mentions of AI in US committee reports by legislative session, 2001–24
Source: AI Index, 2025 | Chart: 2025 AI Index report
Figure 6.2.18
US Committee Mentions
Mentions of articial intelligence in committee reports by
House and Senate committees serve as another indicator
of legislative interest in AI in the United States. Typically,
these committees focus on legislative and policy issues,
investigations, and internal matters.
Figure 6.2.18 tracks AI mentions in U.S. committee reports
by legislative session from 2001 to 2024. The 118th session
recorded the highest count to date, with 136 mentions—up
83.8% from the 117th session.
6.2 AI and Policymaking
Chapter 6: Policy and Governance

350
Articial Intelligence
Index Report 2025
Table of Contents Chapter 6 Preview
2016 2017 2018 2019 2020 2021 2022 2023 2024
0
10
20
30
40
50
60
Number of AI-related regulations
59
Number of AI-related regulations in the United States, 2016–24
Source: AI Index, 2025 | Chart: 2025 AI Index report
US Regulations
The advent of AI has garnered signicant attention from
regulatory agencies—federal bodies tasked with regulating
sectors of the economy and steering the enforcement of
laws. This section examines AI regulations within the United
States. Unlike legislation, which establishes legal frameworks
within nations, regulations are detailed directives crafted
by executive authorities to enforce legislation. In the
United States, prominent regulatory agencies include
the Environmental Protection Agency (EPA), Food and
Drug Administration (FDA), and Federal Communications
Commission (FCC). Since the specics of legislation often
manifest through regulatory actions, understanding the AI
regulatory landscape is essential to developing a deeper
understanding of AI policymaking.
This section examines AI-related regulations enacted by
American regulatory agencies between 2016 and 2024. It
provides an analysis of the total number of regulations, as
well as their topics, scope, regulatory intent, and originating
agencies. To compile this data, the AI Index performed a
keyword search for “articial intelligence” on the Federal
Register, a comprehensive repository of government
documents from nearly all branches of the American
government, encompassing more than 436 agencies.
Overview
The number of AI-related regulations has risen sharply over
the past six years, with a particularly noticeable increase in
the last year (Figure 6.2.19). In 2024, 59 AI-related regulations
were introduced—more than double the 25 recorded in 2023.
Figure 6.2.19
6.2 AI and Policymaking
Chapter 6: Policy and Governance
By Agency
Figure 6.2.20 looks at the number of AI-related regulations
in the United States that have been released by dierent
American regulatory agencies since 2016.10 In 2024, the
Department of Health and Human Services issued the most
AI-related regulations (14), followed by the Centers for
Medicare and Medicaid Services (7) and the Commerce
Department (7). AI regulations came from a record 42 unique
departments, up from 21 in 2023 and 17 in 2022. This trend
reects a growing interest in AI across a wider range of U.S.
regulators.
10 Regulations can originate from multiple agencies, so the totals in Figure 6.2.20 do not fully align with those in Figure 6.2.19. Figure 6.2.20 refers to departments as agencies, consistent with
the terminology used by the Federal Register, the source of the data.

352
Articial Intelligence
Index Report 2025
Table of Contents Chapter 6 Preview
Highlight:
A Closer Look at US Federal Regulations
The following section highlights some of the AI-related regulations passed as rules and executive orders at the federal
level during 2024 (Figure 6.2.21).
Agency Regulation Description
Executive Oce of
the President
Preventing Access to Americans’
Bulk Sensitive Personal Data
and United States Government–
Related Data by Countries of
Concern
This executive order identies AI use by countries of concern as a
signicant national security threat. It specically warns of foreign
adversaries exploiting bulk sensitive personal and U.S. government–
related data to rene AI algorithms for espionage, cyber
operations, and inuencing campaigns. To counter this risk, the
order implements measures to safeguard sensitive data, including
restrictions or bans on data transactions with these countries and
strengthened network infrastructure security.
Industry and
Security Bureau
Foreign-Produced Direct Product
Rule Additions, and Renements
to Control for Advanced
Computing and Semiconductor
Manufacturing Items
This rule amends the U.S. Export Administration Regulations to
tighten controls on semiconductor manufacturing equipment and
supercomputer exports, particularly to China. It introduces additional
restrictions on semiconductor production, revises existing measures,
and implements “Red Flags” to identify risks of unauthorized exports.
These changes aim to counter China’s eorts to circumvent previous
restrictions and limit its ability to develop advanced computing and
AI systems that could threaten U.S. national security.
Consumer Financial
Protection Bureau
Consumer Financial Protection
Circular 2024–06: Background
Dossiers and Algorithmic Scores
for Hiring, Promotion, and Other
Employment Decisions
This rule mandates that employers cannot base employment
decisions on background dossiers, algorithmic scores, or third-party
reports without complying with the Fair Credit Reporting Act. It
reinforces key obligations, particularly for AI-driven systems, such as
obtaining a worker’s consent before procuring a consumer report. By
doing so, the rule sets clear limits on the use of algorithmic scoring in
hiring and employment decisions.
Federal Election
Commission
Fraudulent Misrepresentation of
Campaign Authority
This interpretive rule oers supplemental guidance on the Federal
Election Campaign Act (FECA) in response to the rise of AI-
generated content. It rearms that FECA is “technology neutral” and
focuses on whether a person or entity engages in election-related
misrepresentation rather than specically addressing AI misuse.
Oce of
Investment Security,
Department of the
Treasury
Provisions Pertaining to U.S.
Investments in Certain National
Security Technologies and
Products in Countries of Concern
This nal rule implements Executive Order 14105, mandating that
U.S. persons notify the Treasury Department of transactions with
entities in countries of concern involved in sensitive technologies
that threaten national security. It also prohibits certain transactions
with these entities. Issued in 2023, the order targets U.S. investments
in high-risk technologies, including AI, semiconductors, and
quantum computing, recognizing them as critical sectors where such
investments could heighten security threats from adversarial nations.
Figure 6.2.21
6.2 AI and Policymaking
Chapter 6: Policy and Governance

353
Articial Intelligence
Index Report 2025
Table of Contents Chapter 6 Preview
6.3 Public Investment in AI11
As AI continues to drive innovation in critical sectors such as
healthcare, transportation, and defense, public funding has
become essential for nations to realize their AI strategies.
Understanding how much governments invest in AI research
and development (R&D) is important for understanding
the broader AI geopolitical landscape, yet tracking these
investments presents signicant challenges. While national
budgets may outline AI-related spending, these allocations
do not always translate directly into expenditures. Moreover,
AI investments are often embedded within broader
scientic or technological initiatives. As a result, pinpointing
AI-specic funding can be dicult.
To address this, the AI Index leveraged natural language
processing (NLP) techniques to analyze public tenders and
contracts and to identify AI-related government spending in
countries across the world.12 Examining tenders provides a
more direct measure of investment trends and oers insight
into how governments allocate resources over time. Because
the AI Index only analyzed countries for which public contract
and tenders data was publicly available, some countries
could not be analyzed.13 This section also presents an analysis
of total AI grant spending in the United States.
The AI Index cautions against making direct country-to-
country comparisons based on the public spending data
presented in this section. While this analysis includes
data on government contracts from a range of countries,
it only covers grant-level spending for the United States.
This asymmetry stems from the complexity and diculty
of collecting comparable grant data from other countries
and regions, such as the European Union and China.
However, as the U.S. case demonstrates, a signicant share
of government spending on AI occurs through grants. In
2023 alone, the AI Index estimates that the U.S. government
awarded approximately $830 million in AI-related public
tenders, compared to $4.5 billion in AI-related grants. Given
the current limitations in cross-national data availability and
consistency, comparative analysis of public AI spending
across countries remains premature. This analysis is
intended as an initial step toward more comprehensive
global coverage. The AI Index is committed to expanding
this work and welcomes collaboration from researchers,
institutions, and governments interested in improving the
scope and quality of this data.
6.3 Public Investment in AI
Chapter 6: Policy and Governance
11 The analysis in this section was led by Lapo Santarlasci.
12 The full methodology behind this analytical approach is detailed in the Appendix. Due to reporting lags that may result in incomplete data for 2024, the most up-to-date analysis is available
for the end of 2023.
13 Some major government AI contract-granting regions, such as the EU (at the aggregate level) and China, were excluded from this analysis due to data limitations. The AI Index is committed
to expanding its scope to include these and other regions in future editions.

354
Articial Intelligence
Index Report 2025
Table of Contents Chapter 6 Preview
Total AI Public Investments
Figure 6.3.1 summarizes key gures on the number of AI-
related contracts and their value at the country level.14 From
2013 to 2023, the United States was the leading nation,
with about $5.2 billion distributed across 2,678 unique AI
contracts (Figure 6.3.1 and Figure 6.3.2). In Europe, the
United Kingdom, Germany, and France stand out with the
highest total contract values awarded, accounting for 56% of
European public investments in AI.
6.3 Public Investment in AI
Chapter 6: Policy and Governance
5,233.10
568.48
278.07
190.10
99.71
83.54
74.40
71.25
55.92
50.02
46.37
44.30
40.71
36.56
29.42
0 500 1,000 1,500 2,000 2,500 3,000 3,500 4,000 4,500 5,000 5,500
Ireland
Hungary
Czech Republic
Italy
Romania
Greece
Poland
Finland
Denmark
Belgium
Spain
France
Germany
United Kingdom
United States
Public spending on AI-related contracts (in millions of US dollars)
Public spending on AI-related contracts in select countries, 2013–23 (sum)
Source: AI Index, 2025 | Chart: 2025 AI Index report
Figure 6.3.1
14 The results and gures presented are subject to missing values ratios of the specic sample of matched tenders: 0.16% for NAICS code, and 26.8% for U.S. dollar values. It is important to
note that the sample does not include Northern Ireland tenders, as their oces do not oer an API service or bulk download option for large-scale data collection.

355
Articial Intelligence
Index Report 2025
Table of Contents Chapter 6 Preview
6.3 Public Investment in AI
Chapter 6: Policy and Governance
3.05
2.81
1.42
1.15
1.07
1.03
1.01
0.92
0.67
0.65
0.63
0.60
0.57
0.56
0.55
0.00 0.50 1.00 1.50 2.00 2.50 3.00
Greece
Latvia
Estonia
Portugal
Norway
Malta
Finland
Austria
Belgium
Italy
Denmark
Luxembourg
Ireland
Turkey
Switzerland
Median value of public AI-related contracts (in millions of US dollars)
Median value of public AI-related contracts in select countries, 2013–23
Source: AI Index, 2025 | Chart: 2025 AI Index report
Figure 6.3.3
2,678
555
409
139
136
121
75
69
49
48
40
38
32
29
28
0 200 400 600 800 1,000 1,200 1,400 1,600 1,800 2,000 2,200 2,400 2,600
Greece
Belgium
Denmark
Italy
Hungary
Romania
Bulgaria
Finland
Czech Republic
Spain
Poland
France
Germany
United Kingdom
United States
Number of AI-related contracts
Number of AI-related contracts in select countries, 2013–23 (sum)
Source: AI Index, 2025 | Chart: 2025 AI Index report
Figure 6.3.2

356
Articial Intelligence
Index Report 2025
Table of Contents Chapter 6 Preview
6.3 Public Investment in AI
Chapter 6: Policy and Governance
Which governments spent the most on AI per capita over the past decade? The United States leads with $1.58 million per 100,000
inhabitants, followed by Finland ($1.3 million) and Denmark ($1.3 million) (Figure 6.3.4).
1.58
1.29
1.27
0.84
0.72
0.60
0.56
0.48
0.47
0.38
0.38
0.38
0.33
0.33
0.32
0.00 0.30 0.60 0.90 1.20 1.50
Austria
Slovenia
Germany
Lithuania
Hungary
Czech Republic
Norway
Greece
Ireland
Luxembourg
Belgium
United Kingdom
Denmark
Finland
United States
Public spending on AI-related contracts per 100,000 inhabitants (in millions of US dollars)
Public spending on AI-related contracts per 100,000 inhabitants in select countries, 2013–23 (sum)
Source: AI Index, 2025 | Chart: 2025 AI Index report
Figure 6.3.4

357
Articial Intelligence
Index Report 2025
Table of Contents Chapter 6 Preview
6.3 Public Investment in AI
Chapter 6: Policy and Governance
Figure 6.3.5 illustrates public investment in AI in 2023. The
U.S. led with $831.0 million, followed by the United Kingdom at
$262.6 million. While Germany, Spain, and the U.K. remained
among Europe’s top investors, countries that historically
ranked lower—such as Romania, Greece, Hungary, and
Poland—broke into the top 10. This shift suggests a more
balanced distribution of AI-related funding across Europe.
830.98
262.59
49.59
49.55
36.89
31.13
26.08
22.98
18.44
16.84
10.48
10.14
8.35
5.78
4.77
0 50 100 150 200 250 300 350 400 450 500 550 600 650 700 750 800 850
Sweden
Czech Republic
Belgium
Austria
Italy
Hungary
France
Poland
Ireland
Romania
Greece
Germany
Spain
United Kingdom
United States
Public spending on AI-related contracts (in millions of US dollars)
Public spending on AI-related contracts in select countries, 2023
Source: AI Index, 2025 | Chart: 2025 AI Index report
Figure 6.3.5

358
Articial Intelligence
Index Report 2025
Table of Contents Chapter 6 Preview
6.3 Public Investment in AI
Chapter 6: Policy and Governance
Figure 6.3.6 illustrates the trends in public AI investment
over time across two signicant regions of AI investment, the
United States and Europe. Both regions have seen substantial
growth in AI-related spending over the past decade. Notably,
Europe’s total AI investment in 2023 was approximately 67
times higher than in 2013, compared to a fteenfold increase
in the United States. Europe experienced particularly sharp
increases in investment, with a 400% year-over-year increase
in 2017, followed by another major spike of 200% year-over-
year in 2019—a year that also saw a peak in the number of
national AI strategies released globally. This sustained upward
trend illustrates how government interest and commitment
to AI is growing in monetary terms.
2013 2014 2015 2016 2017 2018 2019 2020 2021 2022 2023
0
200
400
600
800
1000
Public spending on AI-related contracts (in millions of US dollars)
581.38, Europe
830.98, United States
Public spending on AI-related contracts in the United States and Europe, 2013–23
Source: AI Index, 2025 | Chart: 2025 AI Index report
Figure 6.3.6

359
Articial Intelligence
Index Report 2025
Table of Contents Chapter 6 Preview
Figure 6.3.7 charts the investment gap between Europe and
the U.S. over time. The disparity in AI investment widened
until 2020 but has narrowed over the past three years,
indicating that European nations are closing the gap in total
AI-related public spending.
2013 2014 2015 2016 2017 2018 2019 2020 2021 2022 2023
0
100
200
300
400
500
600
700
800
Public spending on AI-related contracts (in millions of US dollars)
249.60
Dierence in public spending on AI-related contracts between the United States and Europe, 2013–23
Source: AI Index, 2025 | Chart: 2025 AI Index report
Figure 6.3.7
6.3 Public Investment in AI
Chapter 6: Policy and Governance

360
Articial Intelligence
Index Report 2025
Table of Contents Chapter 6 Preview
Figure 6.3.8 documents public investment trends from 2013
to 2023 across the top ve European countries—Belgium,
France, Germany, Spain, and the U.K. The data reveals a
steady increase in investment, marked by periodic peaks.
Germany experienced substantial growth, particularly in
2019, following the launch of its national AI strategy in
November 2018. The U.K. saw sharp increases in AI-related
public investment in both 2021 and 2023. These investments
followed the proposition of a national AI strategy by the AI
Council—an independent expert committee established
in 2019 to advise the government and provide high-level
leadership of the AI ecosystem. Meanwhile, Belgium, France,
and Spain exhibited more modest but consistent growth.
2013 2014 2015 2016 2017 2018 2019 2020 2021 2022 2023
0
50
100
150
200
250
300
Public spending on AI-related contracts (in millions of US dollars)
8.35, Belgium
18.44, France
49.55, Germany
49.59, Spain
262.77, United Kingdom
Public spending on AI-related contracts in top 5 European countries, 2013–23
Source: AI Index, 2025 | Chart: 2025 AI Index report
Figure 6.3.8
6.3 Public Investment in AI
Chapter 6: Policy and Governance

361
Articial Intelligence
Index Report 2025
Table of Contents Chapter 6 Preview
Spending Across Agencies and Sectors
The distribution of public tender investments in AI reects
stark contrasts between the U.S. and Europe, driven by
diering strategic priorities and institutional structures. As
shown in Figure 6.3.9, the U.S. has allocated the majority of AI
contracts since 2013 to the Department of Defense. This fact
is unsurprising given the central role the American defense
sector has played in American technological innovation. In
2023, the Department of Defense (75.0%) was followed by the
Department of Veterans Aairs (6.8%) and the Department of
the Treasury (5.3%).
While the Department of Veterans Aairs may seem like an
outlier, it has made signicant investments in recent years—
in areas that include the use of AI for diagnosis, robotic
prostheses, and mental health.
2013 2014 2015 2016 2017 2018 2019 2020 2021 2022 2023
0%
10%
20%
30%
40%
50%
60%
70%
80%
Public spending on AI-related contracts (% of total)
0.03%, Department of State
0.05%, Department of Education
0.32%, General Services Administration
0.69%, National Aeronautics and Space Administration
0.80%, Department of Transportation
0.97%, Department of Justice
1.57%, Other
2.08%, Department of Commerce
2.30%, Department of Homeland Security
3.98%, Department of Health and Human Services
5.34%, Department of the Treasury
6.83%, Department of Veterans Aairs
75.04%, Department of Defense
Public spending on AI-related contracts (% of total) in the United States by funding agency, 2013–23
Source: AI Index, 2025 | Chart: 2025 AI Index report
Figure 6.3.9
6.3 Public Investment in AI
Chapter 6: Policy and Governance

362
Articial Intelligence
Index Report 2025
Table of Contents Chapter 6 Preview
In Europe, AI investment through public tenders follows
a markedly dierent pattern. Given the lack of aggregated
data comparable to that of the U.S., the AI Index categorized
European funding entities by their central activity. As shown
in Figure 6.3.10, there is a more balanced distribution of
investments in Europe. The top funding areas—general
public services, education, and health—collectively account
for around 84% of total public AI investments in 2023. In the
same year, defense accounted for only 0.84% of all European
AI-related public tenders. This stands in stark contrast to the
U.S., where defense overwhelmingly dominates AI funding.
2013 2014 2015 2016 2017 2018 2019 2020 2021 2022 2023
0%
10%
20%
30%
40%
50%
60%
70%
80%
Public spending on AI-related contracts (% of total)
0.84%, Defense
0.87%, Economic and nancial aairs
1.63%, Local authority
5.35%, Government
7.43%, Health
7.58%, Other
12.26%, Education
64.05%, General public services
Public spending on AI-related contracts (% of total) in Europe by funding agency activity, 2013–23
Source: AI Index, 2025 | Chart: 2025 AI Index report
Figure 6.3.10
6.3 Public Investment in AI
Chapter 6: Policy and Governance

363
Articial Intelligence
Index Report 2025
Table of Contents Chapter 6 Preview
Highlight:
AI Grant Spending in the US
Public grants also represent a key avenue through which
governments allocate resources to AI-related projects
and initiatives. Public institutions can directly invest in
AI-related projects such as enhancing X-ray angiography
interpretation, building AI-driven unmanned aircraft
systems for automated soil monitoring, or developing tools
for interpretable machine learning. Research grants can
be disbursed to organizations like the National Science
Foundation or the Department of Health and Human
Services (which includes NIH) to conduct AI-focused
research. In this section, the AI Index examined data on
grants in the U.S. allocated to AI-specic endeavors.
As in the previous section, the AI Index employed NLP
methodologies to identify AI-related grants.15
Figure 6.3.11 displays aggregate data on AI-related grant
spending in the U.S. from 2013 to 2023. In that period, a
total of roughly $19.7 billion was allocated by the U.S.
government for AI-related grants.
15 The full methodology behind this approach can be found in the Appendix.
Number of grants
Total (in millions $)
Median (in thousands $)
Average (in thousands $)
Total per 100,000 inhabitants (in thousands $)
Grant statistics
18,399
19,748.44
247.53
1,073.34
5,967.69
Value
US AI-related grants, 2013–23
Source: AI Index, 2025 | Table: 2025 AI Index report
4.49
2013 2014 2015 2016 2017 2018 2019 2020 2021 2022 2023
0.00
0.50
1.00
1.50
2.00
2.50
3.00
3.50
4.00
4.50
Public spending on AI-related grants (in billions of US dollars)
Public spending on AI-related grants in the United States, 2013–23
Source: AI Index, 2025 | Chart: 2025 AI Index report
Figure 6.3.11
Figure 6.3.12
Figure 6.3.12 illustrates the steady rise in AI-related grant
funding over time. Between 2013 and 2023, total AI grant
funding in the U.S. grew nearly nineteenfold, from $230
million to $4.5 billion. From 2014 to 2020, investments saw
an average annual growth rate of 40%. This rapid expansion
coincided with major advancements in AI technologies—
such as deep learning, natural language processing, and
computer vision—which likely fueled demand for public-
sector AI applications and drove increased funding for
related projects.
6.3 Public Investment in AI
Chapter 6: Policy and Governance

364
Articial Intelligence
Index Report 2025
Table of Contents Chapter 6 Preview
Highlight:
AI Grant Spending in the US (cont’d)
43.57%
27.91%
16.06%
5.38%
2.62%
1.87%
1.47%
1.12%
0% 5% 10% 15% 20% 25% 30% 35% 40% 45%
National Aeronautics and
Space Administration
Department of Energy
Department of Agriculture
Department of Defense
Department of Commerce
Others
National Science Foundation
Department of Health and
Human Services
Public spending on AI-related grants (% of total)
Funding agency
Public spending on AI-related grants (% of total) by funding agency, 2013–23
Source: AI Index, 2025 | Chart: 2025 AI Index report
Figure 6.3.13
6.3 Public Investment in AI
Chapter 6: Policy and Governance
Figure 6.3.13 illustrates the distribution of AI contract
values by funding agencies in the U.S. from 2013 to 2023.
The greatest share of AI-related grants was allocated to
the Department of Health and Human Services (43.6%),
followed by the National Science Foundation (27.9%) and
the Department of Commerce (5.4%).

Articial Intelligence
Index Report 2025
CHAPTER 7:
Education

366Table of Contents
Overview 366
Chapter Highlights 367
7.1 Background 368
7.2 K–12 CS and AI Education 369
United States 369
Foundational Computer Science 369
Advanced Computer Science 373
Education Standards and Guidance 376
Teacher Perspectives 377
Global 379
Access 379
Guidance 380
7.3 Postsecondary CS and
AI Education 382
Degree Graduates 382
United States 382
Global 388
Guidance 392
7.4 Looking Ahead 393
Chapter 7: Education
Articial Intelligence
Index Report 2025
ACCESS THE PUBLIC DATA

367
Articial Intelligence
Index Report 2025
Table of Contents Chapter 7 Preview
AI has entered the public consciousness through generative AI’s impact on work—
enhancing eciency and automating tasks—but it has also driven innovation in
education and personalized learning. Still, while AI promises benets, it also poses
risks—from hallucinating false outputs to reinforcing biases and diminishing critical
thinking. With the AI education market expected to grow substantially, ethical concerns
about the technology’s misuse—AI tools have already falsely accused marginalized
students of cheating—are mounting, highlighting the need for responsible creation
and deployment.
Addressing these challenges requires both technical literacy and critical engagement
with AI’s societal impact. Expanding AI expertise must begin in K–12 and higher
education in order to ensure that students are prepared to be responsible users and
developers. AI education cannot exist in isolation—it must align with broader computer
science (CS) education eorts. This chapter examines the global state of AI and CS
education, access disparities, and policies shaping AI’s role in learning.
This chapter was a collaboration prepared by the Kapor Foundation, CSTA, PIT-UN
and the AI Index. The Kapor Foundation works at the intersection of racial equity and
technology to build equitable and inclusive computing education pathways, advance
tech policies that mitigate harms and promote equitable opportunity, and deploy
capital to support responsible, ethical, and equitable tech solutions. The CSTA is a
global membership organization that unites, supports, and empowers educators to
enhance the quality, accessibility, and inclusivity of computer science education. The
Public Interest Technology University Network (PIT-UN) fosters collaboration between
universities and colleges to build the PIT eld and nurture a new generation of civic-
minded technologists.
Overview
CHAPTER 7:
Education
Articial Intelligence
Index Report 2025

368
Articial Intelligence
Index Report 2025
Table of Contents Chapter 7 Preview
Chapter Highlights
1. Access to and enrollment in high school CS courses in the U.S. has increased slightly from the previous
school year, but gaps remain. Student participation varies by state, race/ethnicity, school size, geography, income,
gender, and disability.
4. Graduates who earned their master’s degree in AI in the U.S. nearly doubled between 2022 and 2023.
While increased attention on AI will be slower to emerge in the number of bachelor’s and PhD degrees, the surge in master’s
degrees could indicate a future trend for all degree levels.
2. CS teachers in the U.S. want to teach AI but do not feel equipped to do so. Despite 81% of CS teachers
agreeing that using AI and learning about AI should be included in a foundational CS learning experience, less than half of high
school CS teachers felt equipped to teach AI.
3. Two-thirds of countries worldwide oer or plan to oer K–12 CS education. This fraction has doubled since
2019, with African and Latin American countries progressing the most. However, students in African countries have the least
access to CS education due to schools’ lack of electricity.
5. The U.S. continues to be a global leader in producing information, technology, and communications
(ICT) graduates at all levels. Spain, Brazil, and the United Kingdom follow the U.S. as the top producers at various levels,
while Turkey boasts the best gender parity.
CHAPTER 7:
Education
Articial Intelligence
Index Report 2025

369
Articial Intelligence
Index Report 2025
Table of Contents Chapter 7 Preview
7.1 Background
To expand our understanding of the current state of AI
education, it is imperative to dierentiate between AI in
education, AI literacy, and AI education (see Figure 7.1.1).
AI in education is the usage of AI tools in the teaching and
learning process while AI literacy refers to the foundational
understanding of AI—how it works, how to use it, and the
risks of using it. AI education encompasses AI literacy plus
students’ prociency in the technical skills required to build
AI (data analyses undergirding AI technologies, identifying
and mitigating data biases, etc.). For the purposes of this
chapter, the data presented covers AI education.
Figure 7.1.1
7.1 Background
Chapter 7: Education

370
Articial Intelligence
Index Report 2025
Table of Contents Chapter 7 Preview
The world faces signicant challenges
in developing a robust and diverse
workforce when disparities in
infrastructure, access to resources and
courses, and participation in high quality
coursework continue to exacerbate
vast inequities in K–12 students’ ability
to contribute to a technology-enabled
future. While it is dicult to accurately
estimate the extent of the problem due
to the unstandardized nature of data
collection and metrics development,
this section focuses on the earliest
stage in the computing pipeline by
examining the current status of K–12
CS and AI education with existing
global data.
AL
94%
AK
51%
AZ
43% AR
100%
CA
52% CO
59%
CT
84%
DE
61%
DC
53%
FL
38%
GA
78%
HI
72%
ID
46% IL
60% IN
91%
IA
84%
KS
35% KY
76%
LA
39%
ME
63%
MD
100%
MA
83%
MI
54%
MN
36%
MS
85%
MO
58%
MT
31%
NE
52%
NV
95%
NH
95%
NJ
86%
NM
54%
NY
52%
NC
69%
ND
47%
OH
61%
OK
64%
OR
60% PA
75%
RI
83%
SC
92%
SD
51%
TN
61%
TX
56%
UT
81%
VT
72%
VA
68%
WA
50%
WV
78%
WI
52%
WY
74%
Source: Code.org, CSTA, and ECEP Alliance, 2024 | Chart: 2025 AI Index report
Public high schools teaching foundational CS (% of total in state),
2024
Figure 7.2.1
7.2 K–12 CS and AI Education
Chapter 7: Education
7.2 K–12 CS and AI Education1
United States
To begin exploring the prevalence and quality of AI education within the United
States, it is important to start with the CS education landscape in its earliest stages
almost a decade ago. With the launch of President Barack Obama’s “Computer
Science for All” initiative in 2016, billions in investments were provided to ensure that
all K–12 students learn CS to become creators in the digital economy and responsible
citizens of a technology-driven society. The federal funding was dedicated to
enhancing professional learning eorts, improving instructional resources, and
building eective regional partnerships toward expanding CS education access. The
National Science Foundation also led the development and implementation of two
new computing courses (Exploring Computer Science and AP Computer Science
Principles) aimed at engaging a broader group of students in computing. At the same
time, the technology industry and philanthropy invested millions in national eorts to
introduce millions of students across the country to CS.
Foundational Computer Science
In the past decade, educational
advocates have implored policymakers
to adopt legislation to improve access
to CS education. These eorts have
paid o. In the 2017–18 academic year,
35% of U.S. high schools oered CS,
which increased to 60% of U.S. high
schools in 2023–24. However, national
trends can obscure the reality that
prioritization of CS education varies
by state. For example, 100% of high
schools in Arkansas and Maryland oer
CS, compared to only 31% in Montana
(Figure 7.2.1).
1 Since AI has historically been studied under CS, this chapter references CS education data when AI-specic data is unavailable.

371
Articial Intelligence
Index Report 2025
Table of Contents Chapter 7 Preview
43.12%
76.40%
91.18%
Small Medium Large
0%
20%
40%
60%
80%
100%
% of schools
Schools oering foundational CS courses by size,
Source: Code.org, CSTA, and ECEP Alliance, 2024 | Chart: 2025 AI Index report
2024
65.01% 67.00%
60.00%
50.03%
<25% 25–49% 50–75% >75%
0%
20%
40%
60%
80%
100%
% of students on free and reduced lunch
% of schools
Schools oering foundational CS courses by free and
Source: Code.org, CSTA, and ECEP Alliance, 2024 | Chart: 2025 AI Index report
reduced lunch student population, 2024
58.15%
70.13%
56.05%
Urban Suburban Rural
0%
20%
40%
60%
80%
100%
% of schools
Schools oering foundational CS courses by
Source: Code.org, CSTA, and ECEP Alliance, 2024 | Chart: 2025 AI Index report
geographic area, 2024
Signicant gaps remain in equitable access to CS education,
with some student groups left behind. In the 2023–24
academic year, students eligible for free or reduced-price
lunch (FRL); those in small schools; students living in urban
and rural areas; and Native students were less likely to have
access to CS education (Figures 7.2.2, 7.2.3, 7.2.4, and 7.2.5).
Figure 7.2.2 Figure 7.2.3
Figure 7.2.4
7.2 K–12 CS and AI Education
Chapter 7: Education

372
Articial Intelligence
Index Report 2025
Table of Contents Chapter 7 Preview
AL
8%
AK
-
AZ
2% AR
20%
CA
-CO
-
CT
9%
DE
5%
DC
-
FL
2%
GA
7%
HI
4%
ID
2% IL
7% IN
7%
IA
5%
KS
3% KY
11%
LA
3%
ME
-
MD
16%
MA
8%
MI
-
MN
2%
MS
11%
MO
3%
MT
4%
NE
4%
NV
-
NH
-
NJ
9%
NM
3%
NY
5%
NC
5%
ND
5%
OH
-
OK
5%
OR
7% PA
6%
RI
18%
SC
26%
SD
-
TN
6%
TX
6%
UT
13%
VT
4%
VA
5%
WA
5%
WV
4%
WI
4%
WY
9%
Source: Code.org, CSTA, and ECEP Alliance, 2024 | Chart: 2025 AI Index report
Public high school enrollment in CS (% of students), 2024
Data about participation in CS
across 41 states indicates lags in
student engagement with courses.
In the 2020–21 academic year,
only 5.1% of high school students
participated in CS, with a marginal
increase to 6.4% in 2023–24. Similar
to CS access, CS participation
varies highly between states—with
26% of high school students in
South Carolina enrolled in CS but
only 2% enrolled in Florida, Arizona,
and Idaho (Figure 7.2.6).
66.34%
79.74% 80.39% 82.46% 82.98% 83.27%
91.55%
Native American Black Hispanic/Latino White Two+ races Native Hawaiian Asian
0%
20%
40%
60%
80%
100%
% of students
Access to foundational CS courses by race/ethnicity, 2024
Source: Code.org, CSTA, and ECEP Alliance, 2024 | Chart: 2025 AI Index report
Figure 7.2.5
Figure 7.2.6
7.2 K–12 CS and AI Education
Chapter 7: Education

373
Articial Intelligence
Index Report 2025
Table of Contents Chapter 7 Preview
An analysis of CS enrollment by race and ethnicity shows
that eorts to expand access have resulted in near or above
proportional representation for Black, Native American/
Alaskan, and white students at the national level (Figure
7.2.7). However, data gaps—particularly from nine states—
warrant caution in viewing these trends as complete. Girls are
underrepresented relative to their share of the K–12 population.
Additionally, Hispanic and Native Hawaiian/Pacic Islander
students, students with individualized education programs
(IEPs), those eligible for free or reduced-price lunch, and
English language learners remain underrepresented nationally
(Figure 7.2.7 and Figure 7.2.8).
2.60
1.13
0.69
1.00
0.75
0.80
1.00
0 1 2 3
White
Two or more races
Native Hawaiian/Pacic Islander
Native American/Alaskan
Hispanic/Latino/Latina/Latinx
Black/African American
Asian
Ratio of enrollment in CS to national demographics
Public high school enrollment in CS vs. national demographics by race/ethnicity, 2024
Source: Code.org, CSTA, and ECEP Alliance, 2024 | Chart: 2025 AI Index report
Figure 7.2.7
7.2 K–12 CS and AI Education
Chapter 7: Education

374
Articial Intelligence
Index Report 2025
Table of Contents Chapter 7 Preview
Advanced Computer Science
In order to build students’ AI competencies, it is essential
to oer access to advanced coursework in addition to
foundational courses. While AI is not specically covered in
Advanced Placement (AP) CS A, AP CS Principles (AP CS
P) does address some AI content areas. Because AP CS P
was designed to attract a broader class of students, the
potential exists to expose a diverse student population to AI
topics. Yet, despite the growth in raw numbers of students
participating in the AP CS exam (Figure 7.2.9), students
do not participate in proportion to their racial and ethnic
representation in the general student body (Figure 7.2.10
and Figure 7.2.11). Asian students, white boys, and multiracial
students are overrepresented in the population of students
who take AP CS exams, while all other student groups are
underrepresented (Figure 7.2.12).
2 A student with a 504 plan receives accommodations under Section 504 of the Rehabilitation Act of 1973, a U.S. civil rights law that prohibits discrimination against individuals with
disabilities. A student with an IEP (individualized education program) receives special education services under the Individuals with Disabilities Education Act. An IEP is a legally binding
document that outlines a learning plan for a student with a disability designed to meet their unique needs and improve educational outcomes.
7.2 K–12 CS and AI Education
Chapter 7: Education
0.72
0.64
0.65
1.33
0.67
0.00 0.50 1.00 1.50
Students with IEPs
Students with 504 plans
Girls
English language learners
Economically disadvantaged
Ratio of enrollment in CS to national demographics
Public high school enrollment in CS vs. national demographics by subgroup, 2024
Source: Code.org, CSTA, and ECEP Alliance, 2024 | Chart: 2025 AI Index report
Figure 7.2.82

375
Articial Intelligence
Index Report 2025
Table of Contents Chapter 7 Preview
7.2 K–12 CS and AI Education
Chapter 7: Education
19.39 19.83 20.96 19.39 21.14 24.78 29.55
37.33
46.34
54.38
99.87
130.90
158.56
179.19 181.04
201.61
243.18
2007 2008 2009 2010 2011 2012 2013 2014 2015 2016 2017 2018 2019 2020 2021 2022 2023
0
50
100
150
200
250
Number of AP computer science exams taken (in thousands)
Number of AP computer science exams taken, 2007–23
Source: Code.org, CSTA, and ECEP Alliance, 2024 | Chart: 2025 AI Index report
2007 2008 2009 2010 2011 2012 2013 2014 2015 2016 2017 2018 2019 2020 2021 2022 2023
0
10,000
20,000
30,000
40,000
50,000
60,000
70,000
80,000
90,000
Number of AP computer science exams taken
0, Other
321, Native Hawaiian/Pacic Islander
801, Native American/Alaskan
11,238, Two or more races
16,351, Black/African American
43,083, Hispanic/Latino/Latina
69,695, Asian
91,216, White
AP computer science exams taken by race/ethnicity, 2007–23
Source: Code.org, CSTA, and ECEP Alliance, 2024 | Chart: 2025 AI Index report
Figure 7.2.9
Figure 7.2.10

376
Articial Intelligence
Index Report 2025
Table of Contents Chapter 7 Preview
7.2 K–12 CS and AI Education
Chapter 7: Education
2007 2008 2009 2010 2011 2012 2013 2014 2015 2016 2017 2018 2019 2020 2021 2022 2023
0%
10%
20%
30%
40%
50%
60%
AP computer science exams taken (% of total responding students)
0.00%, Other
0.10%, Native Hawaiian/Pacic Islander
0.30%, Native American/Alaskan
4.60%, Two or more races
6.70%, Black/African American
17.70%, Hispanic/Latino/Latina
28.70%, Asian
37.50%, White
AP computer science exams taken (% of total responding students) by race/ethnicity, 2007–23
Source: Code.org, CSTA, and ECEP Alliance, 2024 | Chart: 2025 AI Index report
0 1 2 3 4 5 6 7 8
White
Two or more races
Native Hawaiian/Pacic Islander
Native American/Alaskan
Hispanic/Latino/Latina/Latinx
Black/African American
Asian
Male
Female
Ratio of AP CS exam participation to national demographics
AP computer science exam participation vs. national demographics by race/ethnicity, 2023
Source: Code.org, CSTA, and ECEP Alliance, 2024 | Chart: 2025 AI Index report
Figure 7.2.11
Figure 7.2.12

377
Articial Intelligence
Index Report 2025
Table of Contents Chapter 7 Preview
AL
AK
AZ AR
CA CO
CT
DC DE
FL
GA
HI
ID IL INIA
KS KY
LA
ME
MD
MA
MIMN
MS
MO
MT
NE
NV
NH
NJ
NM
NY
NC
ND
OH
OK
OR PA
RI
SC
SD
TN
TX
UT
VT
VA
WA
WV
WI
WY
Source: CSTA and IACE, 2024 | Chart: 2025 AI Index report
CS standards with significant AI-specific content
CS standards with minimal AI-specific content
CS standards with no AI-specific content
No CS standards
Adoption of AI-specific K 12 computer science standards by US state
Figure 7.2.13
Education Standards and Guidance
Federal guidance issued thus far has focused on AI in
education rather than AI education. The U.S. Department
of Education’s Oce of Educational Technology released a
series of reports about AI in education in 2023 and 2024. One
of the reports focuses on recommendations for educational
technology developers, and two of them are intended for
educators, educational leaders, and policymakers. The most
recent report, from October 2024, oers guidance on the
safe and eective implementation of AI in K–12 schools.
As of January 2025, 26 states have issued guidance on AI in
education. And while there is considerable overlap between
CS and AI education content and what teachers currently
cover in the classroom, K–12 CS standards contain minimal
AI content. The Computer Science Teachers Association
(CSTA) K–12 standards, last published in 2017, contain
only two standards at the advanced high school level that
specically require AI knowledge. However, existing CS
standards support foundational AI knowledge and skills,
covering topics such as perception, data structures, and
algorithms. The U.S. state-adopted K–12 CS standards
averaged 97% coverage of the same subconcepts as the
CSTA standards, indicating strong national coherence in CS
instruction. Among the 44 states that have adopted K–12 CS
standards, 33 have AI-specic standards, which are generally
minimal, aligned to the CSTA standards, and focused on high
school grades (Figure 7.2.13).3 Four of these states recently
adopted more signicant AI-specic standards that span
grades K–12: Colorado (2024), Florida (2024), Ohio (2022),
and Virginia (2024), while Arkansas has dened standards for
a high school AI and machine learning course.
7.2 K–12 CS and AI Education
Chapter 7: Education
3 This project is supported by the National Science Foundation (NSF) under Grant No. 2311746. Any opinions, ndings, and conclusions or recommendations expressed in this material are
those of the author(s) and do not necessarily reect the views of the NSF.

378
Articial Intelligence
Index Report 2025
Table of Contents Chapter 7 Preview
4 This project is supported by the National Science Foundation (NSF) under Grant No. 2118453. Any opinions, ndings, and conclusions or recommendations expressed in this material are
those of the author(s) and do not necessarily reect the views of the NSF. Survey responses may not total 100%, as some questions allowed respondents to select multiple options.
5 The percentages in the gure do not sum to 100% because respondents could select multiple options if they taught more than one grade level.
34%
44%
46%
Elementary school Middle school High school
0%
10%
20%
30%
40%
50%
% of teachers
Percentage of teachers who feel equipped to teach AI
Source: Computer Science Teacher Landscape Survey, 2024 | Chart: 2025 AI Index report
by grade level
84%
65%
82%
90%
51%
56%
89%
88%
75%
86%
93%
61%
73%
94%
92%
72%
85%
96%
74%
87%
96%
Algorithms Articial Intelligence
(AI)
Computing systems
(e.g., hardware/
software)
Computational
thinking
Data and analysis Impacts and ethics
of computing
Programming
0%
20%
40%
60%
80%
100%
Elementary school Middle school High school
Concept
% of teachers
AI concepts taught in CS classrooms by grade level
Source: Computer Science Teacher Landscape Survey, 2024 | Chart: 2025 AI Index report
Teacher Perspectives
To examine the perspectives and practices of CS teachers
as it relates to AI education, the Computer Science Teacher
Landscape Survey collected data from 2,901 pre-K through
12 CS teachers nationally (33% of respondents were
elementary school teachers, 36% taught middle school, and
51% taught high school).4,5
As AI education gains importance for future workforce
readiness, it is important to understand the preparedness of
the current educator workforce. While 81% of CS teachers
believe AI should be included in foundational CS education,
less than half feel equipped to teach it—46% in high school,
44% in middle school, and just 34% in elementary school
(Figure 7.2.14).
When asked to identify the CS-related topics they cover in
class, over two-thirds of middle and high school CS teachers
stated they cover AI specically, despite the lack of explicit
denition in CS standards; fewer elementary teachers (65%)
reported covering AI (Figure 7.2.15). Greater proportions
Figure 7.2.14
Figure 7.2.15
of CS teachers said they include components of AI, such as
algorithms, computing systems, computational thinking, and
programming.
7.2 K–12 CS and AI Education
Chapter 7: Education

379
Articial Intelligence
Index Report 2025
Table of Contents Chapter 7 Preview
When asked to name the greatest benets of using AI in
the classroom, teachers most commonly said improving
their productivity, dierentiating student learning, providing
improved academic support to students, and preparing
students for the future. When asked about the greatest risks,
teachers’ greatest concerns were the misuse of AI (often
related to academic integrity); that AI use could limit student
learning or engagement; overreliance on the technology; that
AI could generate misinformation and replicate biases; and
other ethical concerns, including student privacy.
To equip students to use AI responsibly, the educator
workforce must be upskilled. In a 2024 survey of 364 CS
teachers, 88% identied the need for more resources for AI-
related professional development. When asked to identify
specic resources, CS teachers said they needed to gain
more AI literacy (e.g., how AI works, how to use AI, and the
ethical impacts of AI).
70%
22%
6%
2%
48%
33%
13%
5%
42%
35%
17%
6%
1–2 hours 3–5 hours 6–19 hours 20+ hours
0%
20%
40%
60%
80%
100%
Elementary school Middle school High school
Time
% of teachers
Time spent learning AI in CS classrooms by grade level
Source: Computer Science Teacher Landscape Survey, 2024 | Chart: 2025 AI Index report
Of the 2,245 teachers who did spend class time on AI content, the majority spent fewer than ve hours per course. Elementary
school teachers spent the least amount of time, with 70% spending only one to two hours (Figure 7.2.16).
Figure 7.2.16
7.2 K–12 CS and AI Education
Chapter 7: Education

380
Articial Intelligence
Index Report 2025
Table of Contents Chapter 7 Preview
CS mandatory in primary and secondary
CS mandatory in primary or secondary only
CS as an elective course everywhere
CS in some schools/districts
CS cross curricular
CS planned
No CS
Availability of CS education by country, 2024
S
ource: Raspberry Pi Computing Education Research Centre, 2024 | Chart: 2025 AI Index report
Global
Thus far, very few countries (e.g., Ghana, South Korea,
Netherlands) include AI education in their curricula
explicitly; countries more often ag the importance of AI
education in the national education strategy conversation
without providing a detailed implementation plan. Because
AI education has historically been subsumed under CS
or information and communications technology (ICT)
education, tracking CS and/or ICT education will serve as a
proxy for tracking AI education in this analysis. Similar to the
challenges inherent in tracking CS education in the United
States, caution is called for when interpreting global metrics
because CS and ICT education are sometimes conated
with digital or computer literacy.6
Access
In 2024, approximately two-thirds of the world’s countries
oered or planned to oer CS education (Figure 7.2.17).
CS education is mandatory in primary and/or secondary
schools in 30% of countries, with Europe home to the highest
concentration of these countries. In the past ve years,
all geographic regions have made progress in oering CS
education, with Africa and Latin America registering the largest
increases (Figure 7.2.18). Still, students in African countries are
the least likely to have access to CS education. This is likely
due to infrastructure challenges; in 2023, only 34% of primary
schools in sub-Saharan Africa had access to electricity,
hindering schools’ ability to teach students computer literacy
skills, let alone providing them with CS and AI education.
Figure 7.2.17
7.2 K–12 CS and AI Education
Chapter 7: Education
6 Digital literacy is the “ability to use information and communication technologies to nd, evaluate, create, and communicate information, requiring both cognitive and technical skills,”
whereas computer literacy is the “general use of computers and programs, such as productivity software.”

381
Articial Intelligence
Index Report 2025
Table of Contents Chapter 7 Preview
Globally, the lack of standardized data collection makes it challenging to track progress in AI education. Language barriers and
infrequent updates on implementation further complicate accurate monitoring across countries.
9.40%
24.50%
63.49%
29.54%
49.05% (+39.65 pp)
57.89% (+33.39 pp)
88.88% (+25.39 pp)
70.45% (+40.91 pp)
0% 20% 40% 60% 80% 100%
LAC
Europe
Asia
Africa
2019
2024
% of countries oering CS education
Continent
Change in access to CS education by continent, 2019 vs. 2024
Source: Raspberry Pi Computing Education Research Centre, 2024 | Chart: 2025 AI Index report
Figure 7.2.18
7.2 K–12 CS and AI Education
Chapter 7: Education
Guidance
Countries on a global scale have been quicker to develop
guidance and policies for the use of AI in education as
opposed to developing national standards for teaching AI.
As of November 2024, 10 countries have issued guidance
on AI in education: Australia, Belgium, Canada, Japan, New
Zealand, South Korea, Ukraine, the United Kingdom, the
U.S., and Uruguay. This is not surprising given the decade-
long conversation across countries about developing
guidelines and policy recommendations for AI in education.
As early as 2015, United Nations Educational, Scientic, and
Cultural Organization (UNESCO) member states committed
to harnessing technologies toward ensuring “inclusive and
equitable quality education and promoting lifelong learning
opportunities for all” (See Sustainable Development Goal
4). Since then, UNESCO published the Beijing Consensus on
Articial Intelligence and Education (in 2019) to oer specic
guidance on how to integrate AI technologies to ensure
all people have access to quality education by 2030 (See
Education 2030 Agenda). Within this set of recommendations,
there were four implementation and policy adoption guidelines
that touch upon AI concepts in K–12 education.

382
Articial Intelligence
Index Report 2025
Table of Contents Chapter 7 Preview
Figure 7.2.19
Similar to the AI4K12 initiative, which released a set
of K–12 AI education standards organized around
“Five Big Ideas in AI” (Figure 7.2.19), international
organizations are also developing AI curricular
frameworks for countries to use. Last year, UNESCO
published AI competency frameworks for students
and teachers. The student framework includes four
core competencies: a human-centered mindset,
ethics of AI, AI techniques and applications, and
AI system design. In each competency, students
progress from understanding to applying to creating.
In the European Union, many countries rely on
DigComp 2.2, a framework for developing citizens’
digital competence, along with CS learning objectives
for students. The most recent version has guidance
on recommended knowledge, skills, and attitudes
for interacting with AI, though it does not explicitly
include guidance on teaching citizens to build AI
systems.
7.2 K–12 CS and AI Education
Chapter 7: Education
AI4K12 guidelines organized around 5 Big Ideas in AI
Source: AI4K12, 2024

383
Articial Intelligence
Index Report 2025
Table of Contents Chapter 7 Preview
The role AI will play in the U.S. labor force and the economic future is yet
to be fully understood, but its impact is expected to be substantial. The
technology workforce already contributes signicantly to the U.S. economy,
with 9.6 million working as tech employees across industries. While there
are strong concerns about displaced employment as a result of automation,
projected demands for AI-related roles, such as database management
and data infrastructure solutions, are likely to increase. Therefore, a global
commitment to ensure postsecondary institutions are equipped to train the
future workforce and expand the computing pipeline is essential.
7.3 Postsecondary CS and AI Education
Degree Graduates
United States
Data on U.S. postsecondary CS and AI education trends in
this section comes from the National Center for Education
Statistics (NCES). Notably, the Classication of Instructional
Programs (CIP), a national standard for classifying academic
programs, was developed by NCES under the U.S. Department
of Education. In 2016, AI-specic curricula were designated
under CIP code 11.0102, which covers programs focused
on “symbolic inference, representation, and simulation by
computers and software of human learning and reasoning
processes and capabilities, and the computer modeling
of human motor control and motion. Includes instruction
in computing theory, cybernetics, human factors, natural
language processing, and applicable aspects of engineering,
technology, and specic end-use applications.”
While the number of students earning associate degrees in
CS has largely remained stable over the past decade, several
community colleges are also pioneering AI education,
oering certicate and both associate and bachelor’s degree
programs in AI and related elds (Figure 7.3.2). Notable
examples include Maricopa Community Colleges, Houston
Community College, Miami Dade College, and several
schools in the Bay Area Community College Consortium.
The number of graduates with bachelor’s degrees in
computing has increased 22% over the last 10 years (Figure
7.3.1). In 2023, the top ve producers of CS bachelor’s
graduates were Western Governors University, University of
California–Berkeley, Southern New Hampshire University,
University of Texas at Dallas, and University of Michigan.7
While the increased attention on AI will be slower to show
at the bachelor’s degree level, given its four-year cycle, AI’s
explosive growth has already become visible in master’s
degrees, with a 26% increase in CS graduates between 2022
and 2023, and an overall increase of 83% in the last decade.
7.3 Postsecondary CS and AI Education
Chapter 7: Education
7 Western Governors University and Southern New Hampshire University are primarily online institutions.

384
Articial Intelligence
Index Report 2025
Table of Contents Chapter 7 Preview
23% 22%
32%
24%
77% 78%
68%
76%
Associate Bachelor’s Master’s PhD
0%
20%
40%
60%
80%
100%
Male Female
% of postsecondary graduates
CS postsecondary graduates in the United States by gender, 2023
Source: National Center for Education Statistics’ Integrated Postsecondary Education Data System, 2013–23 | Chart: 2025 AI Index report
2013 2014 2015 2016 2017 2018 2019 2020 2021 2022 2023
0
10,000
20,000
30,000
40,000
50,000
60,000
70,000
80,000
90,000
Number of new CS graduates
2,540, PhD
20,725, Associate
52,107, Master’s
87,435, Bachelor’s
New CS postsecondary graduates in the United States, 2013–23
Source: National Center for Education Statistics’ Integrated Postsecondary Education Data System, 2013–23 | Chart: 2025 AI Index report
Despite the fact that women graduate from college at higher rates than men, degree completion data shows an
underrepresentation of women in CS (Figure 7.3.2).
Figure 7.3.1
Figure 7.3.2
7.3 Postsecondary CS and AI Education
Chapter 7: Education

385
Articial Intelligence
Index Report 2025
Table of Contents Chapter 7 Preview
Black students account for 8% of bachelor’s degrees, 8% of
master’s degrees, and 7% of PhDs in computing (Figure 7.3.3).
Hispanic students account for 13% of bachelor’s degrees,
8% of master’s degrees, and 4% of PhDs in computing. By
contrast, white students account for 46% of bachelor’s
degrees and over half (52%) of PhDs in computing; and
Asian students are overrepresented in the postsecondary
computing space, accounting for 23% of bachelor’s degrees,
28% of master’s degrees, and 17% of PhDs.
12%
12%
10%
8%
12%
8%
10%
7%
27%
20%
18%
13%
13%
8%
10%
4%
4%
4%
4%
4%
3%
3%
3%
3%
6%
13%
9%
23%
8%
28%
12%
17%
47%
44%
56%
46%
57%
40%
58%
52%
4%
6%
3%
5%
6%
12%
6%
15%
0% 20% 40% 60% 80% 100%
CS
All
CS
All
CS
All
CS
All
PhD
Master’s
Bachelor’s
Associate
Native American/Alaskan Black Hispanic NHPI Two or more Asian White Unknown
% of postsecondary graduates
CS vs. all postsecondary graduates in the United States by race/ethnicity (US residents only), 2023
Source: National Center for Education Statistics’ Integrated Postsecondary Education Data System, 2013–23 | Chart: 2025 AI Index report
Figure 7.3.3
7.3 Postsecondary CS and AI Education
Chapter 7: Education
The majority of students in computing-related graduate
programs are from countries outside of the U.S.—a percentage
that has steadily grown over the years. In 2023, nonresidents
accounted for 67% of master’s degree graduates and 60%
of PhD graduates. Between 2022 and 2023, international
CS master’s students increased more than twofold, growing
from 15,811 to 34,850 (IPEDS). Students from India and China
make up the vast majority of this graduate student body (93%
of the 95,130 international master’s students and 60% of the
13,070 international PhD students) (Figure 7.3.4 and Figure
7.3.5).
The number of institutions in the U.S. that oer an AI-specic
bachelor’s degree nearly doubled between 2022 and 2023,
while the number of institutions oering an AI-specic
master’s degree has sharply increased as well (Figure 7.3.6).

386
Articial Intelligence
Index Report 2025
Table of Contents Chapter 7 Preview
3.14
0.06
0.07
0.08
0.09
0.10
0.14
0.14
0.18
0.23
0.23
0.26
0.29
0.48
0.53
0.86
0.88
0.99
1.18
13.19
72.02
0 5 10 15 20 25 30 35 40 45 50 55 60 65 70 75
Other locations
Mexico
France
United Kingdom
Japan
Colombia
Iran
Brazil
Ghana
Canada
Turkey
Saudi Arabia
Vietnam
Pakistan
South Korea
Nigeria
Bangladesh
Nepal
Taiwan
China
India
Number of international CS master’s students (in thousands)
Number of international CS master’s students enrolled in US universities, 2022
Source: National Science Board; National Science Foundation, 2023 | Chart: 2025 AI Index report
1,060
30
40
40
50
50
50
80
130
160
190
190
220
240
250
370
380
660
980
2,760
5,130
0 300 600 900 1,200 1,500 1,800 2,100 2,400 2,700 3,000 3,300 3,600 3,900 4,200 4,500 4,800 5,100
Other locations
Mexico
Italy
Colombia
Egypt
Ghana
Brazil
Sri Lanka
Canada
Turkey
Vietnam
Nigeria
Taiwan
Pakistan
Nepal
Saudi Arabia
South Korea
Iran
Bangladesh
India
China
Number of international CS PhD students
Number of international CS PhD students enrolled in US universities, 2022
Source: National Science Board; National Science Foundation, 2023 | Chart: 2025 AI Index report
Figure 7.3.4
Figure 7.3.5
7.3 Postsecondary CS and AI Education
Chapter 7: Education

387
Articial Intelligence
Index Report 2025
Table of Contents Chapter 7 Preview
2013 2014 2015 2016 2017 2018 2019 2020 2021 2022 2023
0
5
10
15
20
25
30
35
40
45
Number of institutions
19, Bachelor’s
45, Master’s
Number of institutions oering AI bachelor’s and master’s degrees in the US, 2013–23
Source: National Center for Education Statistics’ Integrated Postsecondary Education Data System, 2013–23 | Chart: 2025 AI Index report
Figure 7.3.6
7.3 Postsecondary CS and AI Education
Chapter 7: Education
There was a sharp increase in students graduating with
master’s degrees in AI between 2022 and 2023 (Figure
7.3.7). Carnegie Mellon University, which graduated more
AI majors than any other institution, doubled its number of
graduates; meanwhile, Pennsylvania State University had its
rst graduating class in 2022 (Figure 7.3.8). Until recently,
Carnegie Mellon was one of the only universities to oer
dedicated programs in AI.
2013 2014 2015 2016 2017 2018 2019 2020 2021 2022 2023
0
200
400
600
800
Number of new AI graduates
104, Bachelor’s
935, Master’s
New AI bachelor’s and master’s graduates in the United States, 2013–23
Source: National Center for Education Statistics’ Integrated Postsecondary Education Data System, 2013–23 | Chart: 2025 AI Index report
Figure 7.3.7

388
Articial Intelligence
Index Report 2025
Table of Contents Chapter 7 Preview
7.3 Postsecondary CS and AI Education
Chapter 7: Education
Top postsecondary institutions graduating students in AI in 2023 by degree type8
Source: National Center for Education Statistics’ Integrated Postsecondary Education Data System, 2023
Graduates in AI Bachelor’s Programs
Carnegie Mellon University 32
Full Sail University 19
Concordia University Wisconsin 16
University of Advancing Technology 10
Pennsylvania State University-Main Campus 7
Graduates in AI Master’s Programs
Carnegie Mellon University 178
University of Pennsylvania 98
University of North Texas 76
Northeastern University 55
San Jose State University 52
Graduates in AI PhD Programs
Carnegie Mellon University 28
Capitol Technology University 4
University of Pittsburgh-Pittsburgh Campus 1 Figure 7.3.8
8 This list includes only universities that use the AI-specic CIP code for their programs, rather than general CS. However, many students studying AI worldwide are likely enrolled in broader
CS programs.

389
Articial Intelligence
Index Report 2025
Table of Contents Chapter 7 Preview
1,273
1,889
2,157
2,885
2,946
3,720
6,983
7,249
9,425
10,820
12,852
16,275
16,464
17,764
38,746
0 3,000 6,000 9,000 12,000 15,000 18,000 21,000 24,000 27,000 30,000 33,000 36,000 39,000
Austria
New Zealand
Israel
Sweden
Chile
Mexico
South Korea
Australia
United Kingdom
France
Colombia
Canada
Turkey
Spain
United States
Number of new ICT short-cycle tertiary graduates
New ICT short-cycle tertiary graduates by country, 2022
Source: OECD, 2022 | Chart: 2025 AI Index report
Figure 7.3.9
7.3 Postsecondary CS and AI Education
Chapter 7: Education
Global
No single dataset provides a fully standardized accounting
of AI or CS postsecondary education across all countries.
However, the Organization for Economic Cooperation
and Development has compiled data covering its member
countries and several non-OECD nations.9 The International
Standard Classication of Education is used to compare
education statistics relied on by the OECD to evaluate global
progress. Information and communications technologies, or
ICT, includes such areas of study as “informatics, information
and communication technologies, or CS. These subjects
include a wide range of topics concerned with the new
technologies used for the processing and transmission of
digital information, including computers, computerised
networks (including the Internet), microelectronics,
multimedia, software and programming.”
The U.S. remains a global leader in ICT-related elds,
producing more graduates at each of the associate,
bachelor’s, master’s, and PhD levels than any other country
included in the sample (Figures 7.3.9 to 7.3.12). Notably, the
U.S. graduates more than twice as many associate, master’s,
and PhD students—and nearly twice as many bachelor’s
students—as the next highest country (Figure 7.3.9).
9 While this dataset provides insights across some country lines, it omits a number of countries likely to have large numbers of ICT graduates. The exclusion of India, China, and countries in
Africa highlights the need for global standardized data collection to ensure inclusion of countries that have made signicant investments in computing education and make up a signicant
proportion of the global majority. There is also a signicant lag in collecting and reporting global data on education; as a result, the most recent year for which data is available is 2022.

390
Articial Intelligence
Index Report 2025
Table of Contents Chapter 7 Preview
5,090
6,023
6,256
6,650
10,472
12,817
13,053
13,054
14,584
19,603
20,435
21,365
32,738
61,760
116,401
0 8,000 16,000 24,000 32,000 40,000 48,000 56,000 64,000 72,000 80,000 88,000 96,000 104,000 112,000 120,000
Chile
Turkey
Romania
Spain
France
Poland
Canada
Peru
Australia
South Korea
United Kingdom
Germany
Mexico
Brazil
United States
Number of new ICT bachelor’s graduates
New ICT bachelor’s graduates by country, 2022
Source: OECD, 2022 | Chart: 2025 AI Index report
2,200
2,403
2,452
2,910
2,982
3,214
3,373
3,728
4,044
4,164
9,716
12,500
13,940
21,688
55,706
0 4,000 8,000 12,000 16,000 20,000 24,000 28,000 32,000 36,000 40,000 44,000 48,000 52,000 56,000
Romania
Italy
Netherlands
Korea
Colombia
Spain
Mexico
Ireland
Canada
Poland
Australia
Germany
France
United Kingdom
United States
Number of new ICT master’s graduates
New ICT master’s graduates by country, 2022
Source: OECD, 2022 | Chart: 2025 AI Index report
Figure 7.3.10
Figure 7.3.11
7.3 Postsecondary CS and AI Education
Chapter 7: Education

391
Articial Intelligence
Index Report 2025
Table of Contents Chapter 7 Preview
Gender parity in AI-related elds continues to be a challenge
globally (Figure 7.3.13). On average, women comprise
approximately one-quarter of ICT postsecondary graduates
at the associate, bachelor’s, and PhD levels. Women fare
slightly better at the master’s level, comprising closer to
one-third of graduates. Turkey is among the countries that
fare best with respect to gender parity, with women there
comprising at least half of all graduates at the associate,
bachelor’s, master’s, and PhD levels.
Figure 7.3.12
120
122
140
142
144
194
247
309
374
425
617
733
1,008
1,156
2,759
0 150 300 450 600 750 900 1,050 1,200 1,350 1,500 1,650 1,800 1,950 2,100 2,250 2,400 2,550 2,700 2,850
Netherlands
Sweden
Finland
Switzerland
Mexico
Italy
Spain
Canada
Brazil
Australia
South Korea
France
Germany
United Kingdom
United States
Number of new ICT PhD graduates
New ICT PhD graduates by country, 2022
Source: OECD, 2022 | Chart: 2025 AI Index report
7.3 Postsecondary CS and AI Education
Chapter 7: Education

392
Articial Intelligence
Index Report 2025
Table of Contents Chapter 7 Preview
Figure 7.3.13
24% 23% 33% 34%
SC B M PhD
0%
50%
100%
10% 19% 21% 13%
SC B M PhD
0%
50%
100%
10% 14% 17% NA
SC B M PhD
0%
50%
100%
NA 15% 19% 19%
SC B M PhD
0%
50%
100%
NA
35% 40% 25%
SC B M PhD
0%
50%
100%
29% 22% 31% 24%
SC B M PhD
0%
50%
100%
13% 12% 22%
NA
SC B M PhD
0%
50%
100%
25% 18% 28% 38%
SC B M PhD
0%
50%
100%
31% 21% 18% NA
SC B M PhD
0%
50%
100%
NA
26% 25%
NA
SC B M PhD
0%
50%
100%
NA 16% 19% 18%
SC B M PhD
0%
50%
100%
10% 19% 35%
NA
SC B M PhD
0%
50%
100%
NA
24%
45% 38%
SC B M PhD
0%
50%
100%
NA
25% 30% 21%
SC B M PhD
0%
50%
100%
14% 17% 22% 26%
SC B M PhD
0%
50%
100%
NA
21% 24% 20%
SC B M PhD
0%
50%
100%
NA
30% 42%
22%
SC B M PhD
0%
50%
100%
12% 18% 18% 17%
SC B M PhD
0%
50%
100%
NA
28% 9% NA
SC B M PhD
0%
50%
100%
37% 27% 36% 35%
SC B M PhD
0%
50%
100%
56%
32% 18% 28%
SC B M PhD
0%
50%
100%
17% 17% 25% 28%
SC B M PhD
0%
50%
100%
26% 32% 23% 15%
SC B M PhD
0%
50%
100%
20% 21% 28%
NA
SC B M PhD
0%
50%
100%
NA 16% 34%
NA
SC B M PhD
0%
50%
100%
13% 17%
42% 23%
SC B M PhD
0%
50%
100%
27% 27% 33% 33%
SC B M PhD
0%
50%
100%
13% 15% 29% 14%
SC B M PhD
0%
50%
100%
36% 29% 34% 35%
SC B M PhD
0%
50%
100%
27% 23% 29% 43%
SC B M PhD
0%
50%
100%
NA
31%
NA NA
SC B M PhD
0%
50%
100%
NA
23% 19% 12%
SC B M PhD
0%
50%
100%
6% 20% 37%
11%
SC B M PhD
0%
50%
100%
NA
33% 42% 35%
SC B M PhD
0%
50%
100%
NA 18% 17% 11%
SC B M PhD
0%
50%
100%
13% 21% 23% 15%
SC B M PhD
0%
50%
100%
12% 14% 22% 23%
SC B M PhD
0%
50%
100%
30% 36% 41% 33%
SC B M PhD
0%
50%
100%
NA 11% 17% 19%
SC B M PhD
0%
50%
100%
55% 50% 51% 53%
SC B M PhD
0%
50%
100%
24% 18% 31% 28%
SC B M PhD
0%
50%
100%
24% 24% 35% 26%
SC B M PhD
0%
50%
100%
Short-cycle (SC)
Bachelor’s (B)
Master’s (M)
PhD
Australia Austria Belgium Brazil
Bulgaria Canada Chile Colombia
Costa Rica Croatia Czech Republic Denmark
Estonia Finland France Germany
Greece Hungary Iceland Ireland
Israel Italy South Korea Latvia
Lithuania Luxembourg Mexico Netherlands
New Zealand Norway Peru Poland
Portugal Romania Slovakia Slovenia
Spain Sweden Switzerland Turkey
United Kingdom United States
Percentage of new ICT postsecondary graduates who are female by country, 2022
Source: OECD, 2022 | Chart: 2025 AI Index report
% of female ICT postsecondary graduates
7.3 Postsecondary CS and AI Education
Chapter 7: Education

393
Articial Intelligence
Index Report 2025
Table of Contents Chapter 7 Preview
Guidance
Most existing university policies and guidance around AI
pertain to how students use AI for assignments; guidance on
AI education itself tends to be relegated to the department
level (primarily in computing departments).
AI is being used across campuses by both students and
faculty at high rates: 86% of students use AI in their studies,
and 61% of faculty use AI in their teaching. Yet the guidelines
around usage still lack clarity and standardization across
universities. As of early 2025, 39% of institutions have an AI-
related acceptable use policy, an increase of 16 percentage
points from 2024. Larger universities (10,000-plus students)
are more likely to have a policy than smaller institutions (fewer
than 5,000 students). Although teaching and learning policies
are the most impacted by AI, almost all institutional policies
are aected by technology policies (e.g., purchasing AI tools
using university resources, respecting intellectual property/
copyright laws, using AI to create malware or viruses)—from
cybersecurity and data privacy to online learning and data
and analytics.
In addition to the K–12 guidance UNESCO provided in the 2019
Beijing Consensus on Articial Intelligence and Education, it
oered specic guidance that is relevant for both K–12 and
postsecondary settings with an eye toward achieving the
Education 2030 agenda goals via AI technologies. The 2019
report includes ve implementation and policy guidelines
pertaining to AI education in postsecondary settings.
7.3 Postsecondary CS and AI Education
Chapter 7: Education

394
Articial Intelligence
Index Report 2025
Table of Contents Chapter 7 Preview
7.4 Looking Ahead
The intentional design of an equitable AI educational
ecosystem will be critical for the responsible development
and deployment of future technological innovations. The
current systems in which AI has proliferated have led to
detrimental outcomes, such as mis/disinformation campaigns
to inuence national political outcomes, development of AI-
enabled weapons, and infringement of copyright-protected
intellectual property. The pressing need to prioritize a
better approach to building AI is evident. To do so, it is
necessary to reimagine an educational program where AI
competencies, inclusive of building a lens interrogating
the ethics of AI in addition to technical creation, are seen
as core to preparing students for a technology-powered
future. There are already CS-based infrastructure, policies,
and implementation strategies that oer opportunities to
integrate AI education more seamlessly. As AI innovations
rapidly evolve, transforming education is urgent so that
future creators of these technologies are made aware of
potential harms and have the competencies to mitigate
negative impacts. Academic institutions around the world
must continue to progress (and monitor their progress) on
creating AI pathways, adopt policies to expand access to
relevant courses, and implement strategies to upskill the
educator workforce and engage students to participate and
build competencies equitably.
7.4 Looking Ahead
Chapter 7: Education

396Table of Contents
Overview 396
Chapter Highlights 397
8.1 Public Opinion 399
Global Public Opinion 399
AI Products and Services 399
AI and Jobs 405
AI and Livelihood 407
Highlight: Self-Driving Cars 409
8.2 US Policymaker Opinion 410
Chapter 8: Public Opinion
Articial Intelligence
Index Report 2025
ACCESS THE PUBLIC DATA
397
Articial Intelligence
Index Report 2025
Table of Contents Chapter 8 Preview
As AI continues to permeate broad swaths of society, it is becoming increasingly
important to understand public sentiment around the technology. Insights into how
people perceive AI can help anticipate its societal impact and reveal how adoption
varies across countries and demographic groups. Early data suggests growing public
anxiety about AI, with some regions expressing signicantly more pessimism than
others. As the technology continues to advance, will these trends persist?
This chapter explores public opinion on AI through global, national, demographic, and
ethnic perspectives. It draws on multiple data sources, including longitudinal Ipsos
surveys tracking global AI attitudes, American Automobile Association surveys on self-
driving vehicles, and recent research into local U.S. policymakers’ views on AI.
Overview
CHAPTER 8:
Public Opinion
Articial Intelligence
Index Report 2025

398
Articial Intelligence
Index Report 2025
Table of Contents Chapter 8 Preview
Chapter Highlights
1. The world grows cautiously optimistic about AI products and services. Among the 26 nations surveyed by
Ipsos in both 2022 and 2024, 18 saw an increase in the proportion of people who believe AI products and services oer more
benets than drawbacks. Globally, the share of individuals who see AI products and services as more benecial than harmful has
risen from 52% in 2022 to 55% in 2024.
4. Regional dierences persist regarding AI optimism. First reported in the 2023 AI Index, signicant regional
dierences in AI optimism endure. A large majority of people believe AI-powered products and services oer more benets than
drawbacks in countries like China (83%), Indonesia (80%), and Thailand (77%), while only a minority share this view in Canada
(40%), the United States (39%), and the Netherlands (36%).
2. The expectation and acknowledgment of AI’s impact on daily life is rising. Around the world, two thirds
of people now believe that AI-powered products and services will signicantly impact daily life within the next three to ve
years—an increase of six percentage points since 2022. Every country except Malaysia, Poland, and India saw an increase in this
perception since 2022, with the largest jumps in Canada (17%) and Germany (15%).
3. Skepticism about the ethical conduct of AI companies is growing, while trust in the fairness of AI is
declining. Globally, condence that AI companies protect personal data fell from 50% in 2023 to 47% in 2024. Likewise, fewer
people today believe that AI systems are unbiased and free from discrimination compared to last year.
5. People in the United States remain distrustful of self-driving cars. A recent American Automobile Association
survey found that 61% of people in the U.S. fear self-driving cars, and only 13% trust them. Although the percentage who express
fear has declined from its 2023 peak of 68%, it remains higher than in 2021 (54%).
6. There is broad support for AI regulation among local U.S. policymakers. In 2023, 73.7% of local U.S.
policymakers—spanning township, municipal, and county levels—agreed that AI should be regulated, up signicantly from
55.7% in 2022. Support was stronger among Democrats (79.2%) than Republicans (55.5%), though both registered notable
increases over 2022.
CHAPTER 8:
Public Opinion
Articial Intelligence
Index Report 2025

399
Articial Intelligence
Index Report 2025
Table of Contents Chapter 8 Preview
Chapter Highlights (cont’d)
7. AI optimism registers sharp increase among countries that previously showed the most skepticism.
Globally, optimism about AI products and services has increased, with the sharpest gains in countries that were previously the
most skeptical. In 2022, Great Britain (38%), Germany (37%), the United States (35%), Canada (32%), and France (31%) were
among the least likely to view AI as having more benets than drawbacks. Since then, optimism has grown in these countries by
8%, 10%, 4%, 8%, and 10%, respectively.
10. AI is seen as a time saver and entertainment booster, but doubts remain on its economic impact. Global
perspectives on AI’s impact vary. While 55% believe it will save time, and 51% expect it will oer better entertainment options,
fewer are condent in its health or economic benets. Only 38% think AI will improve health, whilst 36% think AI will improve the
national economy, 31% see a positive impact on the job market, and 37% believe it will enhance their own jobs.
8. Workers expect AI to reshape jobs, but fear of replacement remains lower. Globally, 60% of respondents
agree that AI will change how individuals do their job in the next ve years. However, a smaller subset of respondents, 36%,
believe that AI will replace their jobs in the next ve years.
9. Sharp divides exist among local U.S. policymakers on AI policy priorities. While local U.S. policymakers
broadly support AI regulation, their priorities vary. The strongest backing is for stricter data privacy rules (80.4%), retraining for
the unemployed (76.2%), and AI deployment regulations (72.5%). However, support drops signicantly for a law enforcement
facial recognition ban (34.2%), wage subsidies for wage declines (32.9%), and universal basic income (24.6%).
CHAPTER 8:
Public Opinion
Articial Intelligence
Index Report 2025

400
Articial Intelligence
Index Report 2025
Table of Contents Chapter 8 Preview
8.1 Public Opinion
Global Public Opinion
This section explores global dierences in opinions on AI
through surveys conducted by Ipsos in 2022, 2023, and
2024. These surveys reveal that public perceptions of AI vary
widely across countries and demographic groups.
AI Products and Services
In 2024, Ipsos ran a survey on global attitudes toward AI. The
survey consisted of interviews with 23,685 adults across 32
countries.1
Figure 8.1.1 shows the percentage of respondents who agree
with specic statements. The increase in public awareness of
AI between 2022 and 2024 has remained relatively consistent.
In 2024, 67% of respondents report a good understanding of
what AI is, and 66% anticipate that AI will profoundly change
their daily life in the near future. The proportion of the global
population that perceives AI-powered products and services
as having more benets than drawbacks has increased
modestly, rising from 52% in 2022 to 55% in 2024.
Figure 8.1.1 also highlights respondents’ growing concerns.
In the last year, there has been a three percentage point
decrease in those who trust that companies using AI will
protect their personal data and a two percentage point
decrease in respondents’ trust that AI will not discriminate or
show bias toward any group of people.
1 See Appendix for more details about the survey methodology. The survey was conducted from April to May, 2024.
8.1 Public Opinion
Chapter 8: Public Opinion
Figure 8.1.1
67%
52%
50%
66%
55%
45%
54%
47%
50%
67%
51%
49%
66%
54%
56%
50%
52%
64%
50%
49%
60%
52%
39%
0% 10% 20% 30% 40% 50% 60% 70%
Products and services using articial
intelligence make me nervous
I trust that companies that use
articial intelligence will protect
my personal data
I trust articial intelligence to not
discriminate or show bias toward
any group of people
I trust people not to discriminate or
show bias toward any group of people
Products and services using articial
intelligence have more benets than
drawbacks
Products and services using articial
intelligence will profoundly change
my daily life in the next 3–5 years
Products and services using articial
intelligence have profoundly changed
my daily life in the past 3–5 years
I know which types of products and
services use articial intelligence
I have a good understanding of what
articial intelligence is
2024
2023
2022
% of respondents that “Agree”
Global opinions on products and services using AI (% of total), 2022–24
Source: Ipsos, 2022–24 | Chart: 2025 AI Index report
401
Articial Intelligence
Index Report 2025
Table of Contents Chapter 8 Preview
Perceptions of AI’s benets versus drawbacks vary
considerably by country, according to the Ipsos survey. In
general, respondents in Asia and Latin America believe that AI
will have more benets than drawbacks: 83% of Chinese, 70%
of Mexican, and 62% of Indian respondents view AI products
and services as more benecial than harmful (Figure 8.1.2).
In contrast, in Europe and the Anglosphere, respondents are
more skeptical. For example, 46% of British, 44% of Australian,
40% of Canadian, and 39% of American respondents believe
that AI will have more benets than drawbacks.
AI sentiment appears to be warming, particularly in countries
that were once the most skeptical. Among the 26 nations
surveyed by Ipsos in both 2022 and 2024, 18 saw an increase
in the proportion of people who believe AI products and
services oer more benets than drawbacks. In 2022, France
(31%), Canada (32%), the United States (35%), Germany (37%),
Australia (37%), and Great Britain (38%) ranked among the
least optimistic about AI. By 2024, the percentages in all these
countries had risen.
8.1 Public Opinion
Chapter 8: Public Opinion
Figure 8.1.2
402
Articial Intelligence
Index Report 2025
Table of Contents Chapter 8 Preview
Figure 8.1.3 shows responses to Ipsos’ survey on AI products
and services by country. On average, survey respondents
in China had the highest level of awareness, trust, and
excitement about AI’s use in products and services: 81% of
respondents in China knew what products and services use
AI, 80% reported that those products and services made
them excited, 76% trusted AI to not discriminate or show bias,
and overall 86% believed that products and services using
AI would profoundly change their daily life in the next three
to ve years. Conversely, just 58% of American respondents
thought that AI would profoundly change their life in the
next three to ve years, and 34% reported that products and
services using AI made them excited.
Concerns about the privacy of personal data appear to be
strongest in Japan and Canada, while concerns about AI
discriminating against certain groups was highest in Sweden
and Belgium.
Figure 8.1.3
8.1 Public Opinion
Chapter 8: Public Opinion

403
Articial Intelligence
Index Report 2025
Table of Contents Chapter 8 Preview
Figure 8.1.4 illustrates respondents’ answers to whether they
are excited about AI and whether they are nervous about it.
Notable cross-country trends emerge. As previously noted,
many Anglosphere nations—such as the United Kingdom, the
United States, Canada, Australia, and New Zealand—report
the highest levels of nervousness and the lowest excitement
about AI. In contrast, several Asian countries, including
China, South Korea, and Indonesia, exhibit higher excitement
and lower nervousness levels, with Japan standing as an
exception to this trend.
Global
China
Indonesia
Thailand
Peru
Turkey
Singapore
South Korea
Colombia
Brazil
Spain
Poland
Germany
New Zealand
Ireland
Netherlands
Switzerland
AustraliaUnited States
Belgium
Japan
Canada
Sweden
0% 10% 20% 30% 40% 50% 60% 70% 80% 90% 100%
0%
10%
20%
30%
40%
50%
60%
70%
80%
90%
100%
Excited (% of respondents that “Agree”)
Nervous (% of respondents that “Agree”)
Great Britain
Hungary
Italy
Argentina
France
Malaysia
Mexico
India
South Africa
Chile
Global opinions about products and services using AI by country, 2024
Source: Ipsos, 2024 | Chart: 2025 AI Index report
Figure 8.1.4
8.1 Public Opinion
Chapter 8: Public Opinion
404
Articial Intelligence
Index Report 2025
Table of Contents Chapter 8 Preview
Figure 8.1.5
8.1 Public Opinion
Chapter 8: Public Opinion
A majority of the countries surveyed by Ipsos in 2023 were
surveyed again in 2024, enabling cross-year comparisons.
Figure 8.1.5 highlights the year-over-year change in answers
to particular AI-related questions. Overall, the AI Index
observes slightly rising concerns about the use of AI, with
an average 0.6% decrease in positive responses. This is
largely driven by a 3% decrease in trust that companies that
use AI will protect personal data, and a 2% decrease in trust
that AI will not discriminate or show bias toward any group
of people.2
Brazil and Malaysia saw the sharpest average decline in
awareness, trust, and excitement about AI. In both countries,
that negative trend was led by sharp declines in respondents
who trust AI companies to protect their personal data.
South Africa and Ireland saw the sharpest average increases in
awareness, trust, and excitement about AI. Ireland’s positive
trend appears to be led by positive user experiences, since it
reports the highest increase across countries in respondents
who say their daily lives have been profoundly impacted by
products and services using AI.
2 Average global responses to the question “Products and services using AI make me nervous” are excluded from this average because this is the only question where a positive score would
yield a normatively negative result.
405
Articial Intelligence
Index Report 2025
Table of Contents Chapter 8 Preview
Figure 8.1.6
8.1 Public Opinion
Chapter 8: Public Opinion
Figure 8.1.6 compares responses from the 2022 and 2024
Ipsos surveys, highlighting shifts in sentiment since the
launch of ChatGPT. Globally, the belief that AI-powered
products and services will profoundly change daily life within
the next three to ve years has risen by 6%. Every country
except India, Malaysia, and Poland saw an increase in this
perception since 2022, with the largest jumps in Canada
(17%) and Germany (15%).

406
Articial Intelligence
Index Report 2025
Table of Contents Chapter 8 Preview
21%
11%
39%
25%
8%
8%
22%
33%
10%
23%
0% 20% 40% 60% 80% 100%
AI will replace your current job
in the next 5 years
AI will change how you do your
current job in the next 5 years
Very likely Somewhat likely Don’t know Not very likely Not at all likely
% of respondents
Global opinions on the perceived impact of AI on current jobs, 2024
Source: Ipsos, 2024 | Chart: 2025 AI Index report
Figure 8.1.7
8.1 Public Opinion
Chapter 8: Public Opinion
AI and Jobs
This year’s Ipsos survey included more questions about how
people perceive AI’s impact on their current jobs. Figure
8.1.7 illustrates various global perspectives on the expected
impact of AI on employment. Overall, 60% of respondents
believe AI is likely to change how they do their job in the next
ve years and 36%, or more than one in three, believe that AI
is likely to replace their current job in the next ve years.
Year-over-year comparisons for this question are challenging
because in 2023 the survey did not dierentiate between
“very likely” and “somewhat likely.” Nevertheless, when the
2024 categories are aggregated and compared to the 2023
results, the overall sentiment appears largely unchanged. In
2023, 57% of respondents agreed that AI would change how
jobs are done, while 36% believed AI was likely to replace
their job within ve years.

407
Articial Intelligence
Index Report 2025
Table of Contents Chapter 8 Preview
67%
64%
55%
49%
66%
61%
53%
46%
0% 10% 20% 30% 40% 50% 60% 70%
Baby
boomer
Gen X
Millennial
Gen Z
2024
2023
% of respondents
Global opinions on whether AI will change how current jobs are done in the next ve years (% agreeing with
statement), 2023 vs. 2024
Source: Ipsos, 2024 | Chart: 2025 AI Index report
Figure 8.1.8
8.1 Public Opinion
Chapter 8: Public Opinion
Opinions on whether AI will signicantly impact an
individual’s job vary across demographic groups (Figure
8.1.8). Younger generations, such as Gen Z and millennials,
are more inclined to agree that AI will change how they do
their jobs compared to older generations like Gen X and baby
boomers. Specically, in 2024, 67% of Gen Z compared to
49% of boomers agree with the statement that AI will likely
aect their current jobs.
Across 2023 and 2024, all generations increasingly agree
that AI will change how they do their jobs over the next ve
years. Interestingly, of the 3% who believe AI will change
how they do their jobs, the greatest increase was among both
millennials and baby boomers, perhaps indicating increasing
cross-generational awareness.
408
Articial Intelligence
Index Report 2025
Table of Contents Chapter 8 Preview
Figure 8.1.9
8.1 Public Opinion
Chapter 8: Public Opinion
AI and Livelihood
The Ipsos survey also explored the impact that respondents
believe AI will have on various aspects of their lives, such as
the economy, entertainment, and health.
Figure 8.1.9 shows that 55% of global respondents said
they believe AI will reduce the amount of time it takes them
to get things done, and 51% believe AI will improve their
entertainment options. Opinions on the economy and the job
market were more skeptical. In these sectors, just 36% and
31% of respondents believe AI will have a positive impact.
Figure 8.1.9 also shows signicant range in respondents
who believe AI will improve the economy in their country.
Countries in Asia are the most optimistic about AI’s economic
impact, with 72% of respondents in China saying they expect
AI to improve the economy, followed by 54% in Indonesia.
Conversely, less than 25% of respondents in the Netherlands,
the United States, Belgium, Sweden, and Canada believe that
AI will improve the economy.
Within each country, respondents with an optimistic outlook
on AI’s impact on the economy tended to express optimism in
other areas. For example, countries that expressed the highest
expectation that AI will positively impact their economy also
tended to believe that AI will reduce the amount of time it
takes to get things done and that AI will improve health.
As a global average, 38% of respondents believe AI will
improve health. Mexico reported the highest rates of
optimism, with 56% believing that AI will have a positive
impact on health. Conversely only 19% of respondents in
Japan had positive expectations of AI’s impact on health.

409
Articial Intelligence
Index Report 2025
Table of Contents Chapter 8 Preview
China
Indonesia
Thailand
Singapore
India
Mexico
South Africa
Peru
Malaysia
Brazil Colombia
Argentina
Turkey
Chile
Switzerland
Ireland
Hungary
Japan
Belgium
Sweden
Canada
0% 10% 20% 30% 40% 50% 60% 70% 80% 90% 100%
0%
10%
20%
30%
40%
50%
60%
70%
80%
90%
100%
The job market (% of respondents)
Individual jobs (% of respondents)
United States
New Zealand
Great Britain
Australia
Italy
Netherlands
Germany
Spain
South Korea
France
Poland
Global
Global opinion on the potential of AI to improve the job market vs. individual jobs, 2024
Source: Ipsos, 2024 | Chart: 2025 AI Index report
Global
China
Indonesia
Thailand
Singapore
India
South Africa
Peru
Malaysia
Brazil
Colombia
Argentina
Turkey
South Korea
Poland
Chile
Switzerland
Ireland
Hungary
New Zealand
Japan
Netherlands
Canada
0% 10% 20% 30% 40% 50% 60% 70% 80% 90% 100%
0%
10%
20%
30%
40%
50%
60%
70%
80%
90%
100%
Amount of time to get things done (% of respondents)
Individual jobs (% of respondents)
United States
Great Britain
Australia
Italy
Germany
Spain
France
Sweden
Belgium
Mexico
Global opinion on the potential of AI to improve time to get things done vs. individual jobs, 2024
Source: Ipsos, 2024 | Chart: 2025 AI Index report
Figure 8.1.11
Figure 8.1.10
8.1 Public Opinion
Chapter 8: Public Opinion
Figure 8.1.10 and Figure 8.1.11 provide a correlative analysis of
the preceding data, examining the extent to which responses
to certain questions are interrelated. Notably, there is a strong
correlation between respondents’ agreement that AI will
improve the job market and their belief that it will benet their
own jobs. In some countries, such as Poland, optimism on both
fronts is low, with only 17% and 21% of respondents expressing
agreement, respectively. In contrast, sentiment is much more
positive in China, where 44% believe AI will enhance the job
market, and 62% think it will improve their jobs.
Similarly, countries where respondents believe AI will reduce
the time required to complete tasks are also more likely to
report that AI will improve their individual jobs.

410
Articial Intelligence
Index Report 2025
Table of Contents Chapter 8 Preview
54% 55%
68% 66% 61%
32% 30%
23% 25%
26%
14% 15% 9% 9% 13%
2021 2022 2023 2024 2025
0%
20%
40%
60%
80%
100%
Afraid Unsure Trust
% of respondents
US driver attitude toward self-driving vehicles, 2021–25
Source: AAA, 2025 | Chart: 2025 AI Index report
8.1 Public Opinion
Chapter 8: Public Opinion
Highlight:
Self-Driving Cars
As discussed in Chapter 2: Technical Performance, self-
driving cars have made signicant advancements in both
capability and adoption. With companies like Waymo and
Zoox becoming more prominent, understanding American
attitudes toward self-driving technology is more important
than ever.
The American Automobile Association (AAA) conducts
an annual survey to assess public sentiment toward self-
driving cars. The most recent survey, conducted in January
2025, was designed to be representative of approximately
97% of U.S. households. Figure 8.1.12 presents the results,
revealing that despite the gradual rollout of self-driving
cars on American roads, a majority of Americans (61%)
remain fearful of the technology. Only 13% of respondents
expressed trust in self-driving cars. While fear has declined
slightly from its 2023 peak of 68%, it remains higher than in
2021, when 54% of Americans reported being afraid.
Figure 8.1.12

411
Articial Intelligence
Index Report 2025
Table of Contents Chapter 8 Preview
8.2 US Policymaker Opinion
Understanding public sentiment toward AI requires not
only assessing the views of the general public but also
those of key stakeholders, such as policymakers, who play
a critical role in shaping AI regulation and policy. This year,
an international team of researchers from Uppsala, Oxford,
Harvard, and Syracuse universities released one of the rst
comprehensive studies on the perspectives of local U.S.
policymakers—spanning township, municipal, and county
levels—on AI’s future impact and regulation. Conducted in
two waves, in 2022 and 2023, the study gathered responses
from approximately 1,000 policymakers. Its timing allowed
researchers to compare how policymakers’ views on AI
shifted before and after the launch of ChatGPT.
Figure 8.2.1 illustrates the extent to which local policymakers
agree with the statement: AI should be regulated by the
government. In 2023, 73.7% of local U.S. policymakers
supported this view, a signicant increase from 55.7% in 2022.
The launch of ChatGPT appears to have played a key role in
shifting policymaker sentiment toward regulation. Support
for AI regulation was higher among Democrats (79.2%) than
Republicans (55.5%), though both groups registered a notable
increase after 2022.
8.2 US Policymaker Opinion
Chapter 8: Public Opinion
Figure 8.2.1
64.50%
73.70%
55.70%
79.20%
55.50%
84.40%
74.60%
67.90%
42.70%
19.10%
14.40%
23.60%
15.10%
21.60%
11.60%
18.30%
15.50%
28.00%
16.40%
12.00%
20.70%
5.70%
22.90%
7.10%
16.60%
29.40%
0% 20% 40% 60% 80% 100%
Republicans in 2022
Republicans in 2023
Democrats in 2022
Democrats in 2023
Republicans
Democrats
2022
2023
All
Agree Neither agree nor disagree Disagree
% of respondents
Local US ocials’ support for government regulation of AI by party and year
Source: Hatz et al., 2025 | Chart: 2025 AI Index report

412
Articial Intelligence
Index Report 2025
Table of Contents Chapter 8 Preview
Given that most local policymakers support some form of AI
regulation, which specic policies do they favor? At 80.4%,
the strongest support is for stricter data privacy regulations.
In addition, 76.2% support retraining programs for the
unemployed, and 72.5% support AI deployment regulations
(Figure 8.2.2). In contrast, there is signicantly less backing
for redistributive measures. Just 33.9% support wage
subsidies to oset wage declines and just 24.6% support
universal basic income.
8.2 US Policymaker Opinion
Chapter 8: Public Opinion
Figure 8.2.2
80.40%
76.20%
72.50%
57.70%
54.70%
51.70%
46.40%
45.60%
44.40%
42.90%
42.40%
39.10%
34.20%
33.90%
24.60%
9.50%
14.00%
14.50%
24.50%
20.20%
18.30%
24.60%
22.80%
27.40%
30.50%
22.30%
34.10%
26.00%
27.00%
17.10%
10.10%
9.80%
13.00%
17.80%
25.10%
30.00%
29.00%
31.70%
28.20%
26.60%
35.30%
26.80%
39.80%
39.00%
58.30%
0% 20% 40% 60% 80% 100%
Universal basic income
Wage subsidies for wage declines
Law enforcement facial recognition ban
Immigration reform for AI developers
Robot tax
Higher corporate income taxes
Semiconductor and AI hardware subsidies
Federal regulations on local government AI
Stronger social safety net
Bias audits for hiring and promotion AI
Parole and sentencing AI regulations
Stronger antitrust
AI deployment regulations
Retraining for unemployed
Stricter data privacy regulations
Agree Neither agree nor disagree Disagree
% of respondents
Local US ocials’ views on what AI policies would be benecial for 2025–50
Source: Hatz et al., 2025 | Chart: 2025 AI Index report

413
Articial Intelligence
Index Report 2025
Table of Contents Chapter 8 Preview
When it comes to AI policy, most local legislators do not
believe they will have to take immediate action (Figure
8.2.3). Only 34.3% believe they will need to act within the
next few years, compared to 56.5% who do not. However,
agreement with this statement has increased from 32.2%
in 2022 to 36.6% in 2023. This reects the impact of major
AI developments, such as the launch of ChatGPT, on
policymakers’ perspectives.
8.2 US Policymaker Opinion
Chapter 8: Public Opinion
Figure 8.2.3
34.30%
36.60%
32.20%
35.50%
33.60%
40.50%
31.10%
34.10%
33.00%
9.20%
9.10%
9.20%
8.90%
8.80%
8.10%
9.70%
8.40%
9.10%
56.50%
54.30%
58.60%
55.60%
57.70%
51.40%
59.20%
57.40%
57.90%
0% 20% 40% 60% 80% 100%
Republicans in 2022
Republicans in 2023
Democrats in 2022
Democrats in 2023
Republicans
Democrats
2022
2023
All
Likely Don’t know Unlikely
% of respondents
Local US ocials’ likelihood of making AI policy decisions by party and year
Source: Hatz et al., 2025 | Chart: 2025 AI Index report

414
Articial Intelligence
Index Report 2025
Table of Contents Chapter 8 Preview
Only 29.8% of locally elected ocials feel adequately informed to make AI policy decisions (Figure 8.2.4). While condence in AI-
related policymaking has increased slightly across both parties from 2022 to 2023, it remains relatively low overall.
8.2 US Policymaker Opinion
Chapter 8: Public Opinion
Figure 8.2.4
29.80%
31.30%
28.50%
26.80%
31.50%
29.50%
24.40%
31.80%
31.20%
17.90%
14.90%
20.80%
15.10%
19.80%
11.00%
18.80%
17.60%
22.10%
52.30%
53.80%
50.80%
58.10%
48.70%
59.50%
56.90%
50.70%
46.70%
0% 20% 40% 60% 80% 100%
Republicans in 2022
Republicans in 2023
Democrats in 2022
Democrats in 2023
Republicans
Democrats
2022
2023
All
Agree Neither agree nor disagree Disagree
% of respondents
Local US ocials’ feeling adequately informed to make decisions about AI by party and year
Source: Hatz et al., 2025 | Chart: 2025 AI Index report

416Table of Contents
Articial Intelligence
Index Report 2025
Chapter 1 Research and Development 416
Chapter 2 Technical Performance 420
Chapter 3 Responsible AI 427
Chapter 4 Economy 431
Chapter 5 Science and Medicine 441
Chapter 6 Policy and Governance 451
Chapter 7 Education 454
Chapter 8 Public Opinion 455
Appendix

417
Articial Intelligence
Index Report 2025
Appendix
Table of Contents
Chapter 1: Research and Development
Chapter 1: Research and Development
Appendix
Acknowledgments
The AI Index would like to acknowledge Angelo Salatino for
his contributions to AI publication classication, Ben Cottier
for leading the analysis of machine learning inference costs,
Lapo Santarlasci for leading the analysis of AI patents, and
Andrew Shi for leading the analysis of the environmental
impact of AI models.
AI Publication Analysis
For this analysis, the AI Index used OpenAlex, an open scholarly
database with over 260 million research publications, as its
primary data source. OpenAlex classies papers using its own
knowledge organization system, known as OpenAlex Topics—a
taxonomy of around 4,500 topics combining Scopus codes and
CWTS classication. The system uses a deep learning model
that considers titles, abstracts, journal names, and citation
networks for classication. To identify AI-related topics more
precisely, the AI Index analyzed computer science publications
identied by OpenAlex and rened the classications using the
Computer Science Ontology and the CSO Classier.
The Computer Science Ontology (CSO) is a large-scale,
automatically generated ontology of research areas derived
from 16 million publications using the Klink-2 algorithm. It
features a hierarchical structure with thousands of subtopics,
allowing for precise mapping of specic terms to broader
research elds. Compared to general-purpose scholarly
databases like OpenAlex, Scopus, and Web of Science, CSO
oers a more detailed and ne-grained representation of the
research landscape. As a result, it has been widely used for
scholarly data exploration, analysis, modeling, and expert
identication and recommendation. Version 3.4.1—used in
this analysis—includes approximately 15,000 topics and
166,000 relationships within computer science. Released on
Jan. 17, 2025, this version introduces over 150 new research
topics in articial intelligence, bringing the total to 2,369 AI-
related topics and 12,620 hierarchical relationships within the
AI domain alone.
To analyze research trends, the AI Index used the CSO
Classier—an unsupervised method that automatically
categorizes research papers based on CSO topics. The
classier follows a three-stage pipeline that processes
paper titles and abstracts: A syntactic module detects
direct mentions of CSO topics; a semantic module uses
word embeddings to identify related concepts; and a
postprocessing module merges results, lters out irrelevant
topics, and adds broader categories for a more rened
classication. For this analysis, the AI Index extended the
CSO Classier to focus specically on articial intelligence
and its subtopics. Since its initial release, the classier has
gained signicant and growing interest due to its versatility.
For example, Springer Nature uses it to routinely classify
proceedings books, improving metadata quality. Beyond
academic publishing, it has been successfully applied to
categorize research software, YouTube videos, press releases,
job ads, and IT museum collections.
Accurately categorizing research papers as either conference
proceedings or journal articles is essential for this analysis.
OpenAlex’s metadata elds—type, crossref_type, and
source_type—can sometimes conict. To resolve these
inconsistencies, the AI Index mapped OpenAlex records to
DBLP, a leading bibliographic database for computer science
publications. Known for its high metadata quality, DBLP
continuously adds new publications through a rigorous,
semiautomated curation process and currently indexes 3.6
million conference papers and 3 million journal articles. The
initial matching between OpenAlex and DBLP was performed
using DOIs. For remaining unmatched papers, the AI Index
used a combination of title and publication year. To streamline
this process, the AI Index built a title index to optimize search
and ensure ecient mapping across the datasets.
AI publications are aggregated based on several parameters
to provide a comprehensive analysis. Publications are

418
Articial Intelligence
Index Report 2025
Appendix
Table of Contents
Chapter 1: Research and Development
Appendix
grouped by year, considering the publication date of the
most recent versions. Additionally, the AI Index groups
publications by geographic areas or World Bank regions
using the aliations of authors. This means a single paper can
contribute to multiple counts if coauthored by researchers
from dierent countries, with each country receiving a count.
When authors’ aliations are missing, these publications are
mapped as “Unknown.” Furthermore, sectors are associated
with publications through authors’ aliations when available,
which may lead to a publication being counted for multiple
sectors. Citation counts are included when available; those
without citation data are classied as “Unknown.”
Top 100 Publications Analysis
The AI Index conducted a comprehensive analysis of
inuential AI publications by collecting and analyzing citation
data from multiple sources including OpenAlex, Google
Scholar, and Semantic Scholar. Initially gathering the top 150
most-cited papers per publication year from OpenAlex, the
list was rened to 100 publications through careful review.
The methodology attributes publications to all countries and
regions represented by authors’ aliations, meaning a single
paper can contribute to multiple counts. For instance, a paper
coauthored by researchers from the United States and China
counts once for each country. This approach may result in
overlapping totals in aggregate statistics. Publication years
are based on the most recent versions, whether in journals,
conferences, or repositories like arXiv. To maintain accuracy,
organizational aliations were veried and standardized,
with countries assigned according to headquarters’ locations.
The full list of the top 100 AI publications is available here.
AI Patent Analysis
The AI Index identies AI-related patents using a hybrid
classication approach, combining keyword-based text
analysis with classication-code-based identication.
Patent-level bibliographic data is sourced from PATSTAT
Global, a comprehensive database issued by the European
Patent Oce (EPO). The analysis focuses on granted patents
from 2010 onward, aggregated at the DOCDB family level to
avoid duplicate counting of the same invention.1 Patents are
attributed to countries based on the publication authority of
the earliest recorded grant publication.
Patent abstracts and titles originally published in languages
other than English were translated using the deep-translator
tool, Google Translate engine, and the Meta NLLB-200
machine translation model. Post-translation, patent texts
were processed using natural language processing (NLP)
techniques. These included the removal of stop words
and special characters, part-of-speech (POS) tagging to
retain key grammatical categories, lowercase conversion,
lemmatization, and replacement of numerical measures with
a <NUM> tag.
AI-related patents are identied by searching for relevant terms
in patent titles and abstracts using regular expressions (regex).
An AI-specic keyword dictionary was developed through
a structured multistep process, incorporating keywords
generated by AI models, expanded using established AI
lexicons such as those from Yamashita et al. (2021), and rened
through Word2Vec-based synonym identication. Further
validation was conducted using BERTopic topic modeling and
DeBERTA-based zero-shot classication, with manual checks
applied to reduce false positives.
In addition to keyword-based classication, AI-related patents
were identied using International Patent Classication
(IPC) and Cooperative Patent Classication (CPC) codes.
A curated list of AI-relevant codes was compiled through a
combination of AI model analysis, regex-based searches, and
prior research, including classications from Pairolero et al.
(2023) and WIPO (2024). The nal dataset was constructed
by merging results from both approaches, balancing coverage
and accuracy.
1 Despite this aggregation procedure, duplicates occasionally appear in marginal cases where applications within the same DOCDB family share the same earliest ling date. The AI Index
removes duplicate values with respect to the aggregation variables (e.g., counting by year) when presenting analytics.

419
Articial Intelligence
Index Report 2025
Appendix
Table of Contents
Chapter 1: Research and Development
Appendix
Epoch Notable Models Analysis
The AI forecasting research group Epoch AI maintains a dataset
of landmark AI and ML models, along with accompanying
information about their creators and publications, such as
the list of their authors, number of citations, type of AI task
accomplished, and amount of compute used in training.
The nationalities of the authors of these papers have
important implications for geopolitical AI forecasting. As
various research institutions and technology companies start
producing advanced ML models, the global distribution of
AI development may shift or concentrate in certain places,
which in turn aects the geopolitical landscape because AI is
expected to become a crucial component of economic and
military power in the near future.
To track the distribution of AI research contributions on
landmark publications by country, the Epoch dataset is coded
according to the following methodology:
1. A snapshot of the dataset was taken in March 2025.
This includes papers about landmark models, selected
using the inclusion criteria of importance, relevance,
and uniqueness, as described in the Compute Trends
dataset documentation.
2. The authors are attributed to countries based on their
aliation credited on the paper. For international
organizations, authors are attributed to the country
where the organization is headquartered, unless a
more specic location is indicated.
3. All of the landmark publications are aggregated within
time periods (e.g., monthly or yearly) and the national
contributions compiled to determine the extent of
each country’s contribution to landmark AI research
during each time period.
4. The contributions of dierent countries are compared
over time to identify any trends.
Training Cost Analysis
To create the dataset of cost estimates, the Epoch database
was ltered for models released during the large-scale ML
era2 that were in the top 10 of training compute at the time
of release. This ltered for the largest-scale ML models.
The Transformer model was added to this set of models for
further context.
For the selected ML models, the training time and the type,
quantity, and hardware utilization rate were determined
from the publication, press release, or technical reports, as
applicable. Cloud rental prices for the computing hardware
used by these models were collected from online historical
archives of cloud vendors’ websites.3
Training costs were estimated from the hardware type,
quantity, and time by multiplying the hourly cloud rental rates
(at the time of training)4 by the quantity of hardware hours.
However, some developers purchased hardware rather than
renting cloud compute, and cloud prices vary by vendor
and by rental commitment, so the true costs incurred by the
developers may vary.
Various challenges were encountered while estimating the
training cost of these models. Often, the developers did not
disclose the duration of training or the hardware that was
used. In other cases, cloud compute pricing was not available
for the hardware. The investigation of training cost trends is
more thoroughly detailed in a separate report by Epoch AI.
AI Conference Attendance
The AI Index reached out to the organizers of various AI
conferences in 2024 and asked them to provide information
on total attendance. For conferences that posted their
attendance totals online, the AI Index used those reported
totals and did not reach out to the conference organizers.
2 The selected cuto date was Sept. 1, 2015, in accordance with Compute Trends Across Three Eras of Machine Learning (Epoch, 2022).
3 Historic prices were collected from archived snapshots of Amazon Web Services, Microsoft Azure, and Google Cloud Platform price catalogs viewed through the Internet Archive Wayback
Machine.
4 The chosen rental rate was the most recent published price for the hardware and cloud vendor used by the developer of the model, at a three-year commitment rental rate, after subtracting
the training duration and two months from the publication date. If this price was not available, the most analogous price was used—either the same hardware and vendor at a dierent date, or
the same hardware from a dierent cloud vendor. If a three-year commitment rental rate was unavailable, this was imputed from other rental rates based on the empirical average discount for
the given cloud vendor. If the exact hardware type was not available (e.g., Nvidia A100 SXM4 40GB), a generalization was used (e.g., Nvidia A100).

420
Articial Intelligence
Index Report 2025
Appendix
Table of Contents
Chapter 1: Research and Development
Appendix
GitHub
Identifying AI Projects
In partnership with researchers from Harvard Business
School, Microsoft Research, and Microsoft’s AI for Good
Lab, GitHub identies public AI repositories following the
methodologies of Gonzalez, Zimmerman, and Nagappan
(2020) and Dohmke, Iansiti, and Richards (2023), using topic
labels related to AI/ML and generative AI, respectively, along
with other relevant keywords identied through snowball
sampling, such as “machine learning,” “deep learning,” and
“articial intelligence.” GitHub further augments the dataset
with repositories that have a dependency on the PyTorch,
TensorFlow, OpenAI, Transformers, XGBoost, scikit-learn,
and SciPy libraries for Python.
Mapping AI Projects to Geographic Areas
Public AI projects are mapped to geographic areas using IP
address geolocation to determine the mode location of a
project’s owners each year. Each project owner is assigned
a location based on their IP address when interacting with
GitHub. If a project owner changes locations within a year,
the location for the project would be determined by the mode
location of its owners sampled daily in the year. Additionally,
the last known location of the project owner is carried
forward on a daily basis even if no activities were performed
by the project owner that day. For example, if a project
owner performed activities within the United States and then
became inactive for six days, that project owner would be
considered to be in the United States for that seven-day span.
Environmental Impact Analysis
The AI Index estimated the carbon emissions of training
language and vision models using a calculator proposed by
Lacoste et al. (2019). The analysis focused on the training
stage emissions, excluding embodied hardware production,
idle infrastructure, and deployment emissions. The study
examined four model categories: industry language models,
academic language models, industry vision models, and
academic vision models.
The calculator’s accuracy was veried against published
emission values. Calculator inputs included hardware
type, GPU hours, provider, and compute region. For newer
hardware like the H100 GPU (released in 2022), the A100
SXM4 80GB was used as a substitute in calculations. Provider
selection was based on known partnerships (e.g., Google
models using GCP, OpenAI using Azure), while compute
regions were determined by team locations.
Special consideration was given to models trained on
custom hardware, such as BLOOM’s use of the Jean
Zay supercomputer in France. In these cases, private
infrastructure calculations incorporated carbon eciency
(kg/kWh) and oset percentages.
The study evaluated 50 models in total: 34 industry language
models (2018–24), eight industry vision models (2019–
23), four academic language models (2020–23), and four
academic vision models (2011–22), selecting particularly
inuential models in their respective domains.

421
Articial Intelligence
Index Report 2025
Appendix
Table of Contents
Chapter 2: Technical Performance
Chapter 2: Technical Performance
Appendix
Acknowledgments
The AI Index would like to acknowledge Andrew Shi for
his work generating sample Midjourney and Pika video
generations and Armin Hamrah for his work identifying
signicant AI technical advancements for the timeline.
Benchmarks
In this chapter, the AI Index reports on benchmarks, recognizing
their importance in tracking AI’s technical progress. As a
standard practice, the Index sources benchmark scores from
leaderboards, public repositories such as Papers With Code
and RankedAGI, as well as company papers, blog posts, and
product releases. The Index operates under the assumption
that the scores reported by companies are accurate and
factual. The benchmark scores in this section are current as
of mid-February 2025. However, since the publication of the
AI Index, newer models may have been released that surpass
current state-of-the-art scores.
1. ARC-AGI: Data on ARC-AGI was taken from the ARC-
AGI paper and OpenAI video in February 2025. To learn
more about ARC-AGI, please read the original paper.
2. Arena-Hard-Auto: Data on Arena-Hard-Auto was
taken from the LMSYS leaderboard in February 2025.
To learn more about Arena-Hard-Auto, please read
the original paper.
3. Bench2Drive: Data on Bench2Drive was taken from
the Bench2Drive paper in February 2025. To learn more
about Bench2Drive, please read the original paper.
4. Berkeley Function Calling: Data on Berkeley Function
Calling was taken from the Berkeley Function Calling
leaderboard in February 2025. To learn more about
Berkeley Function Calling, please read the original
work.
5. BigCodeBench: Data on BigCodeBench was taken
from the BigCodeBench leaderboard in February
2025. To learn more about BigCodeBench, please read
the original work.
6. Chatbot Arena: Data on Chatbot Arena was taken
from the Chatbot Arena leaderboard in February
2025. To learn more about Chatbot Arena, please read
the original paper.
7. FrontierMath: Data on FrontierMath was taken from
the FrontierMath paper and OpenAI video in February
2025. To learn more about FrontierMath, please read
the original paper. The visual was supplemented with
benchmark data from OpenAI’s o3 model, sourced
from a YouTube video announcing its launch in
December 2025.
8. GAIA: Data on GAIA was taken from the GAIA
leaderboard in February 2025. To learn more about
GAIA, please read the original paper.
9. GPQA: Data on GPQA was taken from the GPQA
paper and OpenAI video in February 2025. To learn
more about GPQA, please read the original paper.
10. GSM8K: Data on GSM8K was taken from the GSM8K
Papers With Code leaderboard in February 2025. To
learn more about GSM8K, please read the original
paper.
11. HELMET: Data on HELMET (How to Evaluate Long-
Context Models Eectively and Thoroughly) was
taken from the HELMET paper in February 2025. To
learn more about HELMET, please read the original
paper.
12. HLE: Data on Humanity’s Last Exam (HLE) was taken
from the HLE paper in February 2025. To learn more
about HLE, please read the original paper.
13. HumanEval: Data on HumanEval was taken from
the HumanEval Papers With Code leaderboard in
February 2025. To learn more about HumanEval,
please read the original paper.
14. LRS2: Data on Oxford-BBC Lip Reading Sentences
2 (LRS2) was taken from the LRS2 Papers With Code
leaderboard in February 2025. To learn more about
LRS2, please read the original paper.

422
Articial Intelligence
Index Report 2025
Appendix
Table of Contents
Chapter 2: Technical Performance
Appendix
15. MATH: Data on MATH was taken from the MATH
Papers With Code leaderboard in February 2025
and the o3-mini model launch. To learn more about
MATH, please read the original paper.
16. MixEval: Data on MixEval was taken from the MixEval
leaderboard in February 2025. To learn more about
MixEval, please read the original paper.
17. MMLU: Data on MMLU was taken from the MMLU
Papers With Code leaderboard in February 2025.
To learn more about MMLU, please read the original
paper.
18. MMLU-Pro: Data on MMLU-Pro was taken from the
MMLU-Pro leaderboard in February 2025. To learn
more about MMLU-Pro, please read the original
paper.
19. MMMU: Data on MMMU was taken from the MMMU
leaderboard in February 2025. To learn more about
MMMU, please read the original paper.
20. MTEB: Data on Massive Text Embedding Benchmark
(MTEB) was taken from the MTEB leaderboard in
February 2025. To learn more about MTEB, please
read the original paper.
21. MVBench: Data on MVBench was taken from the
MVBench leaderboard in February 2025. To learn
more about MVBench, please read the original paper.
22. PlanBench: Data on PlanBench was taken from the
PlanBench paper in February 2025. To learn more
about PlanBench, please read the original paper.
23. RE-Bench: Data on RE-Bench was taken from the RE-
Bench paper in February 2025. To learn more about
RE-Bench, please read the original paper
24. RLBench: Data on RLBench was taken from the
RLBench Papers With Code leaderboard in February
2025. To learn more about RLBench, please read the
original paper.
25. Ruler: Data on Ruler was taken from the Ruler
repository in February 2025. To learn more about
Ruler, please read the original paper.
26. SWE-bench: Data on SWE-bench was taken from
the SWE-bench leaderboard in February 2025.
To learn more about SWE-bench, please read the
original paper.
27. VAB: Data on VisualAgentBench (VAB) was taken
from the VAB leaderboard in February 2025. To learn
more about VAB, please read the original paper.
28. VCR: Data on VCR was taken from the VCR
leaderboard in February 2025. To learn more about
VCR, please read the original paper.
29. WildBench: Data on WildBench was taken from the
WildBench leaderboard in February 2025. To learn
more about WildBench, please read the original
paper.

423
Articial Intelligence
Index Report 2025
Appendix
Table of Contents
Chapter 2: Technical Performance
Appendix
Works Cited
Akter, S. N., Yu, Z., Muhamed, A., Ou, T., Bäuerle, A., Cabrera, Á. A., Dholakia, K., Xiong, C., & Neubig, G. (2023). An In-Depth
Look at Gemini’s Language Abilities (arXiv:2312.11444). arXiv. https://doi.org/10.48550/arXiv.2312.11444
Bairi, R., Sonwane, A., Kanade, A., C, V. D., Iyer, A., Parthasarathy, S., Rajamani, S., Ashok, B., & Shet, S. (2023). CodePlan:
Repository-Level Coding Using LLMs and Planning (arXiv:2309.12499). arXiv. https://doi.org/10.48550/arXiv.2309.12499
Bauza, M., Chen, J. E., Dalibard, V., Gileadi, N., Hafner, R., Martins, M. F., Moore, J., Pevceviciute, R., Laurens, A., Rao, D., Zambelli,
M., Riedmiller, M., Scholz, J., Bousmalis, K., Nori, F., & Heess, N. (2024). DemoStart: Demonstration-Led Auto-Curriculum Applied
to Sim-to-Real With Multi-ngered Robots (arXiv:2409.06613). arXiv. https://doi.org/10.48550/arXiv.2409.06613
Bommasani, R., Kapoor, S., Klyman, K., Longpre, S., Ramaswami, A., Zhang, D., Schaake, M., Ho, D. E., Narayanan, A., & Liang,
P. (2024). “Considerations for Governing Open Foundation Models.” Science, 386(6718), 151–53. https://doi.org/10.1126/science.
adp1848
Brohan, A., Brown, N., Carbajal, J., Chebotar, Y., Chen, X., Choromanski, K., ... & Zitkovich, B. (2023). RT-2: Vision-Language-
Action Models Transfer Web Knowledge to Robotic Control. (arXiv:2307.15818). arXiv. https://arxiv.org/abs/2307.15818
Budagam, D., Kumar, A., Khoshnoodi, M., KJ, S., Jain, V., & Chadha, A. (2024). Hierarchical Prompting Taxonomy: A Universal
Evaluation Framework for Large Language Models Aligned With Human Cognitive Principles (arXiv:2406.12644; Version 4). arXiv.
https://doi.org/10.48550/arXiv.2406.12644
Cao, Z., Long, M., Wang, J., & Yu, P. S. (2017). HashNet: Deep Learning to Hash by Continuation (arXiv:1702.00758). arXiv.
https://doi.org/10.48550/arXiv.1702.00758
Chen, M., Tworek, J., Jun, H., Yuan, Q., Pinto, H. P. de O., Kaplan, J., Edwards, H., Burda, Y., Joseph, N., Brockman, G., Ray, A.,
Puri, R., Krueger, G., Petrov, M., Khlaaf, H., Sastry, G., Mishkin, P., Chan, B., Gray, S., … Zaremba, W. (2021). Evaluating Large
Language Models Trained on Code (arXiv:2107.03374). arXiv. https://doi.org/10.48550/arXiv.2107.03374
Chiang, W.-L., Zheng, L., Sheng, Y., Angelopoulos, A. N., Li, T., Li, D., Zhang, H., Zhu, B., Jordan, M., Gonzalez, J. E., & Stoica,
I. (2024). Chatbot Arena: An Open Platform for Evaluating LLMs by Human Preference (arXiv:2403.04132). arXiv. https://doi.
org/10.48550/arXiv.2403.04132
Chollet, F., Knoop, M., Kamradt, G., & Landers, B. (2025). ARC Prize 2024: Technical Report (arXiv:2412.04604). arXiv. https://doi.
org/10.48550/arXiv.2412.04604
Chung, J. S., Senior, A., Vinyals, O., & Zisserman, A. (2017). “Lip Reading Sentences in the Wild.” 2017 IEEE Conference on
Computer Vision and Pattern Recognition (CVPR), 3444–53. https://doi.org/10.1109/CVPR.2017.367
Cobbe, K., Kosaraju, V., Bavarian, M., Chen, M., Jun, H., Kaiser, L., Plappert, M., Tworek, J., Hilton, J., Nakano, R., Hesse, C.,
& Schulman, J. (2021). Training Veriers to Solve Math Word Problems (arXiv:2110.14168). arXiv. https://doi.org/10.48550/
arXiv.2110.14168

424
Articial Intelligence
Index Report 2025
Appendix
Table of Contents
Chapter 2: Technical Performance
Appendix
Driess, D., Xia, F., Sajjadi, M. S. M., Lynch, C., Chowdhery, A., Ichter, B., Wahid, A., Tompson, J., Vuong, Q., Yu, T., Huang, W.,
Chebotar, Y., Sermanet, P., Duckworth, D., Levine, S., Vanhoucke, V., Hausman, K., Toussaint, M., Gre, K., … Florence, P. (2023).
PaLM-E: An Embodied Multimodal Language Model (arXiv:2303.03378). arXiv. https://doi.org/10.48550/arXiv.2303.03378
Fang, H., Grotz, M., Pumacay, W., Wang, Y. R., Fox, D., Krishna, R., & Duan, J. (2025). SAM2Act: Integrating Visual Foundation
Model With a Memory Architecture for Robotic Manipulation (arXiv:2501.18564). arXiv. https://doi.org/10.48550/arXiv.2501.18564
Fattorini, L., Maslej, N., Perrault, R., Parli, V., Etchemendy, J., Shoham, Y., & Ligett, K. (2024). The Global AI Vibrancy Tool
(arXiv:2412.04486). arXiv. https://doi.org/10.48550/arXiv.2412.04486
Glazer, E., Erdil, E., Besiroglu, T., Chicharro, D., Chen, E., Gunning, A., Olsson, C. F., Denain, J.-S., Ho, A., Santos, E. de O.,
Järviniemi, O., Barnett, M., Sandler, R., Vrzala, M., Sevilla, J., Ren, Q., Pratt, E., Levine, L., Barkley, G., … Wildon, M. (2024).
FrontierMath: A Benchmark for Evaluating Advanced Mathematical Reasoning in AI (arXiv:2411.04872). arXiv. https://doi.
org/10.48550/arXiv.2411.04872
Hendrycks, D., Burns, C., Basart, S., Zou, A., Mazeika, M., Song, D., & Steinhardt, J. (2021). Measuring Massive Multitask Language
Understanding (arXiv:2009.03300). arXiv. https://doi.org/10.48550/arXiv.2009.03300
Hendrycks, D., Burns, C., Kadavath, S., Arora, A., Basart, S., Tang, E., Song, D., & Steinhardt, J. (2021). Measuring Mathematical
Problem Solving With the MATH Dataset (arXiv:2103.03874). arXiv. https://doi.org/10.48550/arXiv.2103.03874
Hsieh, C.-P., Sun, S., Kriman, S., Acharya, S., Rekesh, D., Jia, F., Zhang, Y., & Ginsburg, B. (2024). RULER: What’s the Real Context
Size of Your Long-Context Language Models? (arXiv:2404.06654). arXiv. https://doi.org/10.48550/arXiv.2404.06654
Huang, Q., Vora, J., Liang, P., & Leskovec, J. (2024). MLAgentBench: Evaluating Language Agents on Machine Learning
Experimentation (arXiv:2310.03302). arXiv. https://doi.org/10.48550/arXiv.2310.03302
Islam, P., Kannappan, A., Kiela, D., Qian, R., Scherrer, N., & Vidgen, B. (2023). FinanceBench: A New Benchmark for Financial
Question Answering (arXiv:2311.11944). arXiv. https://doi.org/10.48550/arXiv.2311.11944
James, S., Ma, Z., Arrojo, D. R., & Davison, A. J. (2019). RLBench: The Robot Learning Benchmark & Learning Environment
(arXiv:1909.12271; Version 1). arXiv. https://doi.org/10.48550/arXiv.1909.12271
Jia, X., Yang, Z., Li, Q., Zhang, Z., & Yan, J. (2024). Bench2Drive: Towards Multi-ability Benchmarking of Closed-Loop End-to-End
Autonomous Driving (arXiv:2406.03877). arXiv. https://doi.org/10.48550/arXiv.2406.03877
Jimenez, C. E., Yang, J., Wettig, A., Yao, S., Pei, K., Press, O., & Narasimhan, K. (2024). SWE-bench: Can Language Models
Resolve Real-World GitHub Issues? (arXiv:2310.06770). arXiv. https://doi.org/10.48550/arXiv.2310.06770
Jones, C. R., & Bergen, B. K. (2024). People Cannot Distinguish GPT-4 From a Human in a Turing Test (arXiv:2405.08007). arXiv.
https://doi.org/10.48550/arXiv.2405.08007

425
Articial Intelligence
Index Report 2025
Appendix
Table of Contents
Chapter 2: Technical Performance
Appendix
Karnchanachari, N., Geromichalos, D., Tan, K. S., Li, N., Eriksen, C., Yaghoubi, S., Mehdipour, N., Bernasconi, G., Fong, W. K.,
Guo, Y., & Caesar, H. (2024). Towards Learning-Based Planning: The nuPlan Benchmark for Real-World Autonomous Driving
(arXiv:2403.04133). arXiv. https://doi.org/10.48550/arXiv.2403.04133
Kusupati, A., Bhatt, G., Rege, A., Wallingford, M., Sinha, A., Ramanujan, V., Howard-Snyder, W., Chen, K., Kakade, S., Jain, P.,
& Farhadi, A. (2024). Matryoshka Representation Learning (arXiv:2205.13147). arXiv. https://doi.org/10.48550/arXiv.2205.13147
Leal, I., Choromanski, K., Jain, D., Dubey, A., Varley, J., Ryoo, M., Lu, Y., Liu, F., Sindhwani, V., Vuong, Q., Sarlos, T., Oslund, K.,
Hausman, K., & Rao, K. (2023). SARA-RT: Scaling Up Robotics Transformers With Self-Adaptive Robust Attention (arXiv:2312.01990).
arXiv. https://doi.org/10.48550/arXiv.2312.01990
Li, K., Wang, Y., He, Y., Li, Y., Wang, Y., Liu, Y., Wang, Z., Xu, J., Chen, G., Luo, P., Wang, L., & Qiao, Y. (2024). MVBench: A
Comprehensive Multi-modal Video Understanding Benchmark (arXiv:2311.17005). arXiv. https://doi.org/10.48550/arXiv.2311.17005
Li, T., Chiang, W.-L., Frick, E., Dunlap, L., Wu, T., Zhu, B., Gonzalez, J. E., & Stoica, I. (2024). From Crowdsourced Data to High-
Quality Benchmarks: Arena-Hard and BenchBuilder Pipeline (arXiv:2406.11939). arXiv. https://doi.org/10.48550/arXiv.2406.11939
Li, X., Mata, C., Park, J., Kahatapitiya, K., Jang, Y. S., Shang, J., Ranasinghe, K., Burgert, R., Cai, M., Lee, Y. J., & Ryoo, M. S. (2025).
LLaRA: Supercharging Robot Learning Data for Vision-Language Policy (arXiv:2406.20095). arXiv. https://doi.org/10.48550/
arXiv.2406.20095
Liu, X., Yu, H., Zhang, H., Xu, Y., Lei, X., Lai, H., Gu, Y., Ding, H., Men, K., Yang, K., Zhang, S., Deng, X., Zeng, A., Du, Z., Zhang, C.,
Shen, S., Zhang, T., Su, Y., Sun, H., … Tang, J. (2023). AgentBench: Evaluating LLMs as Agents (arXiv:2308.03688). arXiv. https://
doi.org/10.48550/arXiv.2308.03688
Liu, X., Zhang, T., Gu, Y., Iong, I. L., Xu, Y., Song, X., Zhang, S., Lai, H., Liu, X., Zhao, H., Sun, J., Yang, X., Yang, Y., Qi, Z., Yao, S., Sun,
X., Cheng, S., Zheng, Q., Yu, H., … Tang, J. (2024). VisualAgentBench: Towards Large Multimodal Models as Visual Foundation
Agents (arXiv:2408.06327). arXiv. https://doi.org/10.48550/arXiv.2408.06327
Mialon, G., Fourrier, C., Swift, C., Wolf, T., LeCun, Y., & Scialom, T. (2023). GAIA: A Benchmark for General AI Assistants
(arXiv:2311.12983). arXiv. https://doi.org/10.48550/arXiv.2311.12983
Mitchell, M. (2024). “The Turing Test and Our Shifting Conceptions of Intelligence.” Science, 385(6710), eadq9356. https://www.
science.org/doi/10.1126/science.adq9356
Muennigho, N., Tazi, N., Magne, L., & Reimers, N. (2023). MTEB: Massive Text Embedding Benchmark (arXiv:2210.07316). arXiv.
https://doi.org/10.48550/arXiv.2210.07316
Ni, J., Xue, F., Yue, X., Deng, Y., Shah, M., Jain, K., Neubig, G., & You, Y. (2024). MixEval: Deriving Wisdom of the Crowd From LLM
Benchmark Mixtures (arXiv:2406.06565). arXiv. https://doi.org/10.48550/arXiv.2406.06565

426
Articial Intelligence
Index Report 2025
Appendix
Table of Contents
Chapter 2: Technical Performance
Appendix
O’Neill, A., Rehman, A., Gupta, A., Maddukuri, A., Gupta, A., Padalkar, A., Lee, A., Pooley, A., Gupta, A., Mandlekar, A., Jain,
A., Tung, A., Bewley, A., Herzog, A., Irpan, A., Khazatsky, A., Rai, A., Gupta, A., … Lin, Z. (2024). Open X-Embodiment: Robotic
Learning Datasets and RT-X Models (arXiv:2310.08864). arXiv. https://doi.org/10.48550/arXiv.2310.08864
Phan, L., Gatti, A., Han, Z., Li, N., Hu, J., Zhang, H., Zhang, C. B. C., Shaaban, M., Ling, J., Shi, S., Choi, M., Agrawal, A.,
Chopra, A., Khoja, A., Kim, R., Ren, R., Hausenloy, J., Zhang, O., Mazeika, M., … Hendrycks, D. (2025). Humanity’s Last Exam
(arXiv:2501.14249). arXiv. https://doi.org/10.48550/arXiv.2501.14249
Rein, D., Hou, B. L., Stickland, A. C., Petty, J., Pang, R. Y., Dirani, J., Michael, J., & Bowman, S. R. (2023). GPQA: A Graduate-Level
Google-Proof Q&A Benchmark (arXiv:2311.12022). arXiv. https://doi.org/10.48550/arXiv.2311.12022
Reuel, A., Hardy, A., Smith, C., Lamparth, M., Hardy, M., & Kochenderfer, M. J. (2024). BetterBench: Assessing AI Benchmarks,
Uncovering Issues, and Establishing Best Practices (arXiv:2411.12990). arXiv. https://doi.org/10.48550/arXiv.2411.12990
Turing, A. M. (2009). Computing Machinery and Intelligence. In Epstein, R., Roberts, G., & Beber, G., eds., Parsing the Turing
Test: Philosophical and Methodological Issues in the Quest for the Thinking Computer (23–65). Springer Netherlands. https://doi.
org/10.1007/978-1-4020-6710-5_3
Valmeekam, K., Stechly, K., & Kambhampati, S. (2024). LLMs Still Can’t Plan; Can LRMs? A Preliminary Evaluation of OpenAI’s o1
on PlanBench (arXiv:2409.13373). arXiv. https://doi.org/10.48550/arXiv.2409.13373
Wijk, H., Lin, T., Becker, J., Jawhar, S., Parikh, N., Broadley, T., Chan, L., Chen, M., Clymer, J., Dhyani, J., Ericheva, E., Garcia, K.,
Goodrich, B., Jurkovic, N., Kinniment, M., Lajko, A., Nix, S., Sato, L., Saunders, W., … Barnes, E. (2024). RE-Bench: Evaluating
Frontier AI R&D Capabilities of Language Model Agents Against Human Experts (arXiv:2411.15114). arXiv. https://doi.org/10.48550/
arXiv.2411.15114
Xia, Z., Li, J., Lin, Z., Wang, X., Wang, Y., & Yang, M.-H. (2024). OpenAD: Open-World Autonomous Driving Benchmark for 3D
Object Detection (arXiv:2411.17761). arXiv. https://doi.org/10.48550/arXiv.2411.17761
Xu, C., Guan, S., Greene, D., & Kechadi, M.-T. (2024). Benchmark Data Contamination of Large Language Models: A Survey
(arXiv:2406.04244). arXiv. https://doi.org/10.48550/arXiv.2406.04244
Yang, X., Sun, K., Xin, H., Sun, Y., Bhalla, N., Chen, X., Choudhary, S., Gui, R. D., Jiang, Z. W., Jiang, Z., Kong, L., Moran, B.,
Wang, J., Xu, Y. E., Yan, A., Yang, C., Yuan, E., Zha, H., Tang, N., … Dong, X. L. (2024). CRAG—Comprehensive RAG Benchmark
(arXiv:2406.04744). arXiv. https://doi.org/10.48550/arXiv.2406.04744
Yen, H., Gao, T., Hou, M., Ding, K., Fleischer, D., Izsak, P., Wasserblat, M., & Chen, D. (2025). HELMET: How to Evaluate Long-
Context Language Models Eectively and Thoroughly (arXiv:2410.02694). arXiv. https://doi.org/10.48550/arXiv.2410.02694
Yue, X., Ni, Y., Zhang, K., Zheng, T., Liu, R., Zhang, G., Stevens, S., Jiang, D., Ren, W., Sun, Y., Wei, C., Yu, B., Yuan, R., Sun, R., Yin,
M., Zheng, B., Yang, Z., Liu, Y., Huang, W., … Chen, W. (2024). MMMU: A Massive Multi-discipline Multimodal Understanding and
Reasoning Benchmark for Expert AGI (arXiv:2311.16502). arXiv. https://doi.org/10.48550/arXiv.2311.16502

427
Articial Intelligence
Index Report 2025
Appendix
Table of Contents
Chapter 2: Technical Performance
Appendix
Zellers, R., Bisk, Y., Farhadi, A., & Choi, Y. (2019). From Recognition to Cognition: Visual Commonsense Reasoning (arXiv:1811.10830).
arXiv. https://doi.org/10.48550/arXiv.1811.10830
Zhang, H., Da, J., Lee, D., Robinson, V., Wu, C., Song, W., Zhao, T., Raja, P., Zhuang, C., Slack, D., Lyu, Q., Hendryx, S., Kaplan,
R., Lunati, M., & Yue, S. (2024). A Careful Examination of Large Language Model Performance on Grade School Arithmetic
(arXiv:2405.00332). arXiv. https://doi.org/10.48550/arXiv.2405.00332

428
Articial Intelligence
Index Report 2025
Appendix
Table of Contents
Chapter 3: Responsible AI
Appendix
Acknowledgments
The AI Index would like to acknowledge Andrew Shi for his
work spearheading the analysis of responsible AI (RAI)–
related conference submissions. The AI Index acknowledges
that the Global State of Responsible AI analysis was
conducted in collaboration with Accenture. It specically
highlights the contributions of Accenture’s Chief Responsible
AI Ocer, Arnab Chakraborty, and the Accenture Research
team, including Patrick Connolly, Jakub Wiatrak, Dikshita
Venkatesh, and Shekhar Tewari, to the data collection and
analysis. The AI Index acknowledges the McKinsey team—
specically, Medha Bankhwal, Emily Capstick, Katherine
Ottenbreit, Brittany Presten, Roger Roberts, and Cayla
Volandes—for their collaboration on the survey of the
responsible AI ecosystem.
Conference Submissions Analysis
For the analysis on responsible AI-related conference
submissions, the AI Index examined the number of
responsible AI–related academic submissions at the following
conferences: AAAI, AIES, FAccT, ICML, ICLR, and NeurIPS.
Specically, the team scraped the conference websites or
repositories of conference submissions for papers containing
relevant keywords indicating they could fall into a particular
responsible AI category. The papers were then manually
veried by a human team to conrm their categorization.
It is possible that a single paper could belong to multiple
responsible AI categories.
The keywords searched include:
Fairness and bias: algorithmic fairness, bias detection, bias
mitigation, discrimination, equity in AI, ethical algorithm
design, fair data practices, fair ML, fairness and bias, group
fairness, individual fairness, justice, nondiscrimination,
representational fairness, unfair, unfairness.
Privacy and data governance: anonymity, condentiality,
data breach, data ethics, data governance, data integrity,
data privacy, data protection, data transparency, dierential
privacy, inference privacy, machine unlearning, privacy by
design, privacy-preserving, secure data storage, trustworthy
data curation.
Security: adversarial attack, adversarial learning, AI incident,
attacks, audits, cybersecurity, ethical hacking, forensic
analysis, fraud detection, red teaming, safety, security,
security ethics, threat detection, vulnerability assessment.
Transparency and explainability: algorithmic transparency,
audit, auditing, causal reasoning, causality, explainability,
explainable AI, explainable models, human-understandable
decisions, interpretability, interpretable models, model
explainability, outcome explanation, transparency, xAI.
Accenture Global State of
Responsible AI Survey
Researchers from Stanford conducted the second iteration of
the Global State of Responsible AI survey in collaboration with
Accenture. Responses from 1,500 organizations, each with
total revenues of at least $500 million, were collected from
20 countries and 19 industries. The survey was conducted in
January–February 2025. The objective of the Global State
of Responsible AI survey was to understand the challenges
of adopting RAI principles and practices and to allow for a
comparison of organizational and operational RAI activities
across 10 dimensions over time.
The survey covers a total of 10 RAI dimensions: reliability;
privacy and data governance; fairness and nondiscrimination;
transparency and explainability; human interaction; societal
and environmental well-being; accountability; leadership/
principles/culture; lawfulness and compliance; and
organizational governance. Details about the methodology
can be found here.
Chapter 3: Responsible AI

429
Articial Intelligence
Index Report 2025
Appendix
Table of Contents
Chapter 3: Responsible AI
Appendix
McKinsey Responsible AI Survey
A recent survey by McKinsey & Company of more than
750 leaders across 38 countries provides insights into the
current state of RAI in enterprises. These leaders represent
various industries, from technology to healthcare, and
include professionals from legal, data/AI, engineering,
risk, and nance roles. Leaders were asked about their
organization’s experience with RAI and assessed using the
McKinsey RAI Maturity Model, a responsible AI framework
that encompasses four dimensions of RAI—strategy, risk
management, data and technology, and operating model—
with 21 subdimensions. RAI maturity was ranked across four
levels, ranging from the development of foundational RAI
practices to having a comprehensive and proactive program
in place.

430
Articial Intelligence
Index Report 2025
Appendix
Table of Contents
Chapter 3: Responsible AI
Appendix
Works Cited
Alanazi, S., & Asif, S. (2024). “Exploring Deepfake Technology: Creation, Consequences and Countermeasures.” Human-
Intelligent Systems Integration, 6(1), 49–60. https://doi.org/10.1007/s42454-024-00054-8
Bai, X., Wang, A., Sucholutsky, I., & Griths, T. L. (2024). Measuring Implicit Bias in Explicitly Unbiased Large Language Models
(arXiv:2402.04105). arXiv. https://doi.org/10.48550/arXiv.2402.04105
Birhane, A., Dehdashtian, S., Prabhu, V. U., & Boddeti, V. (2024). “The Dark Side of Dataset Scaling: Evaluating Racial Classication
in Multimodal Models.” The 2024 ACM Conference on Fairness, Accountability, and Transparency, 1229–44. https://doi.
org/10.1145/3630106.3658968
Bommasani, R., Klyman, K., Kapoor, S., Longpre, S., Xiong, B., Maslej, N., & Liang, P. (2025). The 2024 Foundation Model
Transparency Index (arXiv:2407.12929). arXiv. https://doi.org/10.48550/arXiv.2407.12929
Gabriel, I., Manzini, A., Keeling, G., Hendricks, L. A., Rieser, V., Iqbal, H., Tomašev, N., Ktena, I., Kenton, Z., Rodriguez, M., El-
Sayed, S., Brown, S., Akbulut, C., Trask, A., Hughes, E., Bergman, A. S., Shelby, R., Marchal, N., Grin, C., … Manyika, J. (2024).
The Ethics of Advanced AI Assistants (arXiv:2404.16244). arXiv. https://doi.org/10.48550/arXiv.2404.16244
Germani, F., Spitale, G., & Biller-Andorno, N. (2024). The Dual Nature of AI in Information Dissemination: Ethical Considerations.
Jmir Ai, 3, e53505. https://doi.org/10.2196/53505
Gu, X., Zheng, X., Pang, T., Du, C., Liu, Q., Wang, Y., Jiang, J., & Lin, M. (2024). Agent Smith: A Single Image Can Jailbreak One
Million Multimodal LLM Agents Exponentially Fast (arXiv:2402.08567). arXiv. https://doi.org/10.48550/arXiv.2402.08567
Laer, J., & Rehman, A. (2023). “Deepfakes and Harm to Women.” Journal of Digital Life and Learning, 3(1), Article 1. https://doi.
org/10.51357/jdll.v3i1.218
Li, J., Cheng, X., Zhao, W. X., Nie, J.-Y., & Wen, J.-R. (2023). HaluEval: A Large-Scale Hallucination Evaluation Benchmark for
Large Language Models (arXiv:2305.11747). arXiv. https://doi.org/10.48550/arXiv.2305.11747
Liebowitz, J., ed. (2024). Regulating Hate Speech Created by Generative AI. Auerbach Publications. https://doi.
org/10.1201/9781032654829
Lin, S., Hilton, J., & Evans, O. (2022). TruthfulQA: Measuring How Models Mimic Human Falsehoods (arXiv:2109.07958). arXiv.
https://doi.org/10.48550/arXiv.2109.07958
Longpre, S., Mahari, R., Chen, A., Obeng-Marnu, N., Sileo, D., Brannon, W., Muennigho, N., Khazam, N., Kabbara, J., Perisetla,
K., Wu, X., Shippole, E., Bollacker, K., Wu, T., Villa, L., Pentland, S., & Hooker, S. (2023). The Data Provenance Initiative: A Large
Scale Audit of Dataset Licensing and Attribution in AI (arXiv:2310.16787). arXiv. https://doi.org/10.48550/arXiv.2310.16787
Longpre, S., Mahari, R., Lee, A., Lund, C., Oderinwale, H., Brannon, W., Saxena, N., Obeng-Marnu, N., South, T., Hunter, C., Klyman,
K., Klamm, C., Schoelkopf, H., Singh, N., Cherep, M., Anis, A., Dinh, A., Chitongo, C., Yin, D., … Pentland, S. (2024). Consent in
Crisis: The Rapid Decline of the AI Data Commons (arXiv:2407.14933). arXiv. https://doi.org/10.48550/arXiv.2407.14933

431
Articial Intelligence
Index Report 2025
Appendix
Table of Contents
Chapter 3: Responsible AI
Appendix
Mazeika, M., Phan, L., Yin, X., Zou, A., Wang, Z., Mu, N., Sakhaee, E., Li, N., Basart, S., Li, B., Forsyth, D., & Hendrycks, D. (2024a).
HarmBench: A Standardized Evaluation Framework for Automated Red Teaming and Robust Refusal (arXiv:2402.04249). arXiv.
https://doi.org/10.48550/arXiv.2402.04249
Parrish, A., Chen, A., Nangia, N., Padmakumar, V., Phang, J., Thompson, J., Htut, P. M., & Bowman, S. R. (2022). BBQ: A Hand-
Built Bias Benchmark for Question Answering (arXiv:2110.08193). arXiv. https://doi.org/10.48550/arXiv.2110.08193
Qi, X., Panda, A., Lyu, K., Ma, X., Roy, S., Beirami, A., Mittal, P., & Henderson, P. (2024). Safety Alignment Should Be Made More
Than Just a Few Tokens Deep (arXiv:2406.05946). arXiv. https://doi.org/10.48550/arXiv.2406.05946
Reuel, A., Connolly, P., Meimandi, K. J., Tewari, S., Wiatrak, J., Venkatesh, D., & Kochenderfer, M. (2024). Responsible AI in the
Global Context: Maturity Model and Survey (arXiv:2410.09985). arXiv. https://doi.org/10.48550/arXiv.2410.09985
Röttger, P., Kirk, H. R., Vidgen, B., Attanasio, G., Bianchi, F., & Hovy, D. (2024). XSTest: A Test Suite for Identifying Exaggerated
Safety Behaviours in Large Language Models (arXiv:2308.01263). arXiv. https://doi.org/10.48550/arXiv.2308.01263
Ruan, Y., Dong, H., Wang, A., Pitis, S., Zhou, Y., Ba, J., Dubois, Y., Maddison, C. J., & Hashimoto, T. (2024). Identifying the Risks of
LM Agents with an LM-Emulated Sandbox (arXiv:2309.15817). arXiv. https://doi.org/10.48550/arXiv.2309.15817
Sheshadri, A., Ewart, A., Guo, P., Lynch, A., Wu, C., Hebbar, V., Sleight, H., Stickland, A. C., Perez, E., Hadeld-Menell, D., &
Casper, S. (2024). Latent Adversarial Training Improves Robustness to Persistent Harmful Behaviors in LLMs (arXiv:2407.15549).
arXiv. https://doi.org/10.48550/arXiv.2407.15549
Simchon, A., Edwards, M., & Lewandowsky, S. (2024). The Persuasive Eects of Political Microtargeting in the Age of Generative
Articial Intelligence. PNAS Nexus, 3(2), pgae035. https://doi.org/10.1093/pnasnexus/pgae035
Spivak, R. (2018). “Deepfakes”: The Newest Way to Commit One of the Oldest Crimes. Georgetown Law Technology Review, 3,
339. https://georgetownlawtechreview.org/wp-content/uploads/2019/05/3.1-Spivak-pp-339-400.pdf
Vaccari, C., & Chadwick, A. (2020). Deepfakes and Disinformation: Exploring the Impact of Synthetic Political Video on Deception,
Uncertainty, and Trust in News. Social Media + Society, 6(1), 2056305120903408. https://doi.org/10.1177/2056305120903408
Vidgen, B., Scherrer, N., Kirk, H. R., Qian, R., Kannappan, A., Hale, S. A., & Röttger, P. (2024). SimpleSafetyTests: A Test Suite for
Identifying Critical Safety Risks in Large Language Models (arXiv:2311.08370). arXiv. https://doi.org/10.48550/arXiv.2311.08370
Wei, J., Karina, N., Chung, H. W., Jiao, Y. J., Papay, S., Glaese, A., Schulman, J., & Fedus, W. (2024). Measuring Short-Form
Factuality in Large Language Models (arXiv:2411.04368). arXiv. https://doi.org/10.48550/arXiv.2411.04368
Zeng, Y., Yang, Y., Zhou, A., Tan, J. Z., Tu, Y., Mai, Y., Klyman, K., Pan, M., Jia, R., Song, D., Liang, P., & Li, B. (2024). AIR-Bench 2024:
A Safety Benchmark Based on Risk Categories From Regulations and Policies (arXiv:2407.17436). arXiv. https://doi.org/10.48550/
arXiv.2407.17436

432
Articial Intelligence
Index Report 2025
Appendix
Table of Contents
Chapter 4: Economy
Chapter 4: Economy
Appendix
International Federation of
Robotics (IFR)
Data presented in the Robot Installations section was sourced
from the World Robotics 2024 report.
Lightcast
Prepared by Vishy Kamalapuram and Elena Magrini
Lightcast delivers job market analytics that empower
employers, workers, and educators to make data-driven
decisions. The company’s articial intelligence technology
analyzes hundreds of millions of job postings and real-
life career transitions to provide insight into labor market
patterns. This real-time strategic intelligence oers crucial
insights, such as what jobs are most in demand, the specic
skills employers need, and the career directions that oer
the highest potential for workers. For more information, visit
https://lightcast.io.
Job Postings Data
To support these analyses, Lightcast mined its dataset of
millions of job postings collected since 2010. Lightcast
collects postings from over 51,000 online job sites to
develop a comprehensive, real-time portrait of labor market
demand. It aggregates job postings, removes duplicates,
and extracts data from job postings text. This includes
information on job title, employer, industry, and region,
as well as required experience, education, and skills.
Job postings are useful for understanding trends in the labor
market because they allow for a detailed, real-time look at
the skills employers seek. To assess the representativeness of
job postings data, Lightcast conducts a number of analyses
to compare the distribution of job postings to the distribution
of ocial government and other third-party sources in the
United States. The primary source of government data on U.S.
job postings is the Job Openings and Labor Turnover Survey
(JOLTS) program, conducted by the Bureau of Labor Statistics.
Based on comparisons between JOLTS and Lightcast, the
labor market demand captured by Lightcast data represents
over 99% of the total labor demand. Jobs not posted online
are usually in small businesses (e.g., “Help Wanted” signs in
restaurant windows) and union hiring halls.
Measuring Demand for AI
To measure the demand by employers of AI skills, Lightcast
uses its skills taxonomy of over 33,000 skills.1 These skills are
organized hierarchically in over 400 skills clusters and 32
skills categories. The list of AI skills from Lightcast are shown
below, with associated skills clusters. For the purposes of this
report, all skills below were considered AI skills. A posting was
considered an AI job if it mentioned any of these skills in the
text of the listing.
AI ethics, governance, and regulation: ethical AI, data
sovereignty, AI security, articial intelligence risk.
Articial intelligence: agentic systems, AI/ML inference,
AIOps (articial intelligence for IT operations), AI
personalization, AI testing, applications of articial intelligence,
articial general intelligence, articial intelligence, articial
intelligence development, Articial Intelligence Markup
Language (AIML), articial intelligence systems, automated
data cleaning, Azure Cognitive Services, Baidu, cognitive
automation, cognitive computing, computational intelligence,
Cortana, Data Version Control (DVC), Edge Intelligence,
embedded AI, expert systems, explainable AI (XAI), intelligent
control, intelligent systems, interactive kiosk, IPSoft Amelia,
knowledge distillation, knowledge engineering, knowledge-
based conguration, knowledge-based systems, knowledge
representation, multi-agent systems, neuro-symbolic AI,
1 https://lightcast.io/open-skills

433
Articial Intelligence
Index Report 2025
Appendix
Table of Contents
Open Neural Network Exchange (ONNX), OpenAI Gym,
operationalizing AI, PineCone, Qdrant, reasoning systems,
swarm intelligence, synthetic data generation, Watson
Conversation, Watson Studio, Weka Weaviate.
Autonomous driving: advanced driver-assistance systems,
autonomous cruise control systems, autonomous system,
autonomous vehicles, dynamic routing, guidance navigation
and control systems, light detection and ranging (LiDAR),
object tracking, OpenCV, path analysis, path nding, remote
sensing, scene understanding, unmanned aerial systems
(UAS).
Generative AI: Adobe Sensei, ChatGPT, CrewAI, DALL-E
image generator, generative adversarial networks, generative
AI agents, generative articial intelligence,Google Bard,
image inpainting, image super-resolution, LangGraph,
large language modeling, Microsoft Copilot, multimodal
learning, multimodal models, prompt engineering, retrieval-
augmented generation, Stable Diusion, text summarization,
text to speech (TTS), variational autoencoders (VAEs).
Machine learning: AdaBoost (adaptive boosting), adversarial
machine learning, Apache MADlib, Apache Mahout, Apache
SINGA, Apache Spark, association rule learning, attention
mechanisms, AutoGen, automated machine learning,
autonomic computing, AWS SageMaker, Azure Machine
Learning, bagging techniques, Bayesian belief networks,
Boltzmann Machine, boosting, Chi-Squared Automatic
Interaction Detection (CHAID), Classication and Regression
Tree (CART), cluster analysis, collaborative ltering, concept
drift detection, confusion matrix, cyber-physical systems,
Dask (Software), data classication, Dbscan, decision
models, decision-tree learning, dimensionality reduction,
distributed machine learning, Dlib (C++ library), embedded
intelligence, ensemble methods, evolutionary programming,
expectation maximization algorithm, feature engineering,
feature extraction, feature learning, feature selection,
federated learning, game AI, Gaussian process, genetic
algorithm, Google AutoML, Google Cloud ML Engine,
gradient boosting, gradient boosting machines (GBM), H2O.
ai, hidden Markov model, hyperparameter optimization,
incremental learning, inference engine, k-means clustering,
kernel methods, Kubeow, LIBSVM, loss functions, machine
learning, machine learning algorithms, machine learning
methods, machine learning model monitoring and evaluation,
machine learning model training, Markov chain, matrix
factorization, meta learning, Microsoft Cognitive Toolkit
(CNTK), MLow, MLOps (machine learning operations),
mlpack (C++ library), ModelOps, Naive Bayes Classier,
neural architecture compression, neural architecture search
(NAS), objective function, Oracle Autonomous Database,
Perceptron, Predictionio, predictive modeling, programmatic
media buying, Pydata, PyTorch (machine learning library),
PyTorch Lightning, Random Forest Algorithm, recommender
systems, reinforcement learning, Scikit-Learn (Python
package), semi-uupervised learning, soft computing, sorting
algorithm, supervised learning, support vector machines
(SVM), t-SNE (t-distributed Stochastic Neighbor Embedding),
test datasets, topological data analysis (TDA), Torch (machine
learning), training datasets, transfer learning, transformer
(machine learning model), unsupervised learning, Vowpal
Wabbit, Xgboost, Theano (software).
Natural language processing: AI copywriting, Amazon
Alexa, Amazon Textract, ANTLR, Apache OpenNLP,
BERT (NLP Model), chatbot, computational linguistics,
conversational AI, DeepSpeech, dialog systems, fastText,
fuzzy logic, handwriting recognition, Hugging Face (NLP
framework), Hugging Face Transformers, intelligent agent,
intelligent virtual assistant, Kaldi, language model, latent
Dirichlet allocation, Lexalytics, machine translation, Microsoft
LUIS, natural language generation (NLG), natural language
processing (NLP), natural language programming, natural
language toolkits, natural language understanding (NLU),
natural language user interface, nearest neighbour algorithm,
Nuance Mix, optical character recognition (OCR), screen
reader, semantic analysis, semantic interpretation for speech
recognition, semantic kernel, semantic parsing, semantic
search, sentence transformers, sentiment analysis, Seq2Seq,
Shogun, small language model, speech recognition, speech
recognition software, speech synthesis, statistical language
Chapter 4: Economy
Appendix
434
Articial Intelligence
Index Report 2025
Appendix
Table of Contents
acquisition, summarization methods, text mining, text
retrieval systems, text to speech (TTS), tokenization, Vespa,
voice assistant technology, voice interaction, voice user
interface, word embedding, Word2Vec models.
Neural networks: Apache MXNet, articial neural
networks, autoencoders, Cae (framework), Cae2,
Chainer (Deep Learning Framework), convolutional neural
networks (CNN), Cudnn, deep learning, deep learning
methods, Deeplearning4j, deep reinforcement learning
(DRL), evolutionary acquisition of neural topologies, Fast.
AI, graph neural networks (GNNs), Keras (neural network
library), Long Short-Term Memory (LSTM), neural ordinary
dierential equations, OpenVINO, PaddlePaddle, Pybrain,
recurrent neural network (RNN), reinforcement learning (RL),
residual networks (ResNet), sequence-to-sequence models
(seq2seq), spiking neural networks, TensorFlow.
Robotics: advanced robotics, bot framework, cognitive
robotics, meta-reinforcement learning, motion planning,
Nvidia Jetson, OpenAI Gym environments, reinforcement
learning from human feedback (RLHF), robot framework,
robot operating systems, robotic automation software,
robotic liquid handling systems, robotic programming, robotic
systems, servomotor, SLAM algorithms (Simultaneous
Localization and Mapping).
Visual image recognition: 3D reconstruction, activity
recognition, computer vision, contextual image classication,
Deck.gl, digital image processing, digital twin technology, eye
tracking, face detection, facial recognition, general-purpose
computing on graphics processing units, gesture recognition,
image analysis, image captioning, image matching, image
recognition, image segmentation, image sensor, ImageNet,
instance segmentation, machine vision, MNIST, motion
analysis, object recognition, OmniPage, pose estimation,
RealSense, thermal imaging analysis.
LinkedIn
Prepared by Rosie Hood, Akash Kaura, and Mar Carpanelli
LinkedIn Data
This body of work represents the world seen through LinkedIn
data, drawn from the anonymized and aggregated prole
information of LinkedIn’s more than 1 billion members around
the world. As such, it is inuenced by how members choose
to use the platform, which can vary based on professional,
social, and regional culture, as well as overall site availability
and accessibility. In publishing insights from LinkedIn’s
Economic Graph, LinkedIn aims to provide accurate statistics
while ensuring the privacy of LinkedIn’s members. As a result,
all data shows aggregated information for the corresponding
period following strict data quality thresholds that prevent
disclosing any information about specic individuals.
Country Sample
LinkedIn provides data on Argentina, Australia, Austria,
Belgium, Brazil, Canada, Chile, Costa Rica, Croatia, Cyprus,
Czechia, Denmark, Estonia, Finland, France, Germany,
Greece, Hong Kong SAR, Hungary, Iceland, India, Indonesia,
Ireland, Israel, Italy, Latvia, Lithuania, Luxembourg, Mexico,
Netherlands, New Zealand, Norway, Poland, Portugal,
Romania, Saudi Arabia, Singapore, Slovenia, South Africa,
South Korea, Spain, Sweden, Switzerland, Turkey, United
Arab Emirates, United Kingdom, United States, and Uruguay.
Skills
LinkedIn members self-report their skills on their LinkedIn
proles. Currently, more than 41,000 distinct, standardized
skills are identied by LinkedIn.
LinkedIn categorizes AI skills into two mutually exclusive
groups: “AI Engineering” and “AI Literacy.” Broadly speaking,
AI Engineering skills refer to the technical expertise and
practical competencies required to design, develop,
deploy, and maintain articial intelligence systems, and AI
Literacy skills refer to the knowledge, abilities, and critical
thinking competencies needed to understand, evaluate, and
eectively interact with articial intelligence technologies.
Chapter 4: Economy
Appendix
435
Articial Intelligence
Index Report 2025
Appendix
Table of Contents
As skills are ever evolving, we maintain and refresh these
classications on a periodic basis. For a list of skills included
in this analysis, please see LinkedIn’s AI skills List below.
Industry
LinkedIn’s industry taxonomy is a collection of entities
that share economic activities and contribute to a specic
product or service. An industry represents the products or
services that a company oers or sells. LinkedIn analyzes
the following industries in the context of AI: education;
nancial services; manufacturing; professional services; and
technology, information, and media.
Gender
LinkedIn recognizes that some LinkedIn members identify
beyond the traditional gender constructs of “man” and
“woman.” If not explicitly self-identied, LinkedIn has inferred
the gender of members included in this analysis either by the
pronouns used on their LinkedIn proles or on the basis of
rst names. Members whose gender could not be inferred as
either male or female were excluded from any gender analysis.
Please note that LinkedIn ltered out countries where their
gender attribution algorithm did not have sucient coverage.
AI Jobs or Occupations
LinkedIn member titles are standardized and grouped into
over 16,000 occupations. These are not sector or country
specic. An AI job requires AI skills to perform the job.
Examples of such occupations include (but are not limited to):
machine learning engineer, articial intelligence specialist,
data scientist, and computer vision engineer.
AI Talent
A LinkedIn member is considered AI talent if they have
explicitly added at least two AI skills to their prole and/or
they are or have been employed in an AI job.
METHODOLOGIES
1. Top AI Skills
These are the AI skills most frequently added by LinkedIn
members from 2015 onward.
Interpretation: The most added AI Engineering skills globally
are machine learning, AI, and deep learning.
2. Fastest Growing AI Skills
The year-over-year growth rate for AI skills most frequently
added by all members. Please note that LinkedIn implements
thresholds to skill add volumes in the most recent year, which
are set at the 50th percentile of the most recent year’s AI skill
adds distribution by country.
Interpretation: The fastest growing AI Engineering skills
globally are custom GPTs, AI productivity, and AI agents.
3. AI Talent Concentration
The counts of AI talent are used to calculate talent
concentration metric. In other words, to calculate the country-
level AI talent concentration, LinkedIn uses the counts of AI
talent in a particular country divided by the counts of LinkedIn
members in that country. Note that concentration metrics
may be inuenced by LinkedIn coverage in these countries
and should be utilized with caution.
Interpretation: AI talent with AI Engineering skills represents
0.78% of LinkedIn members in the United States.
4. Relative AI Talent Hiring Rate YoY Ratio
The LinkedIn hiring rate is a measure of hires normalized by
LinkedIn membership. It is computed as the percentage of
LinkedIn members who added a new employer in the same
period the job began, divided by the total number of LinkedIn
members in the corresponding location.
The AI hiring rate is computed using the overall hiring rate
methodology, but it only considers members classied as AI
Chapter 4: Economy
Appendix

436
Articial Intelligence
Index Report 2025
Appendix
Table of Contents
talent. The relative AI talent hiring rate YoY ratio is the year-
over-year change in the AI hiring rate relative to the overall
hiring rate in the same country. LinkedIn shares a 12-month
moving average.
Interpretation: In the United States, the ratio of AI talent hiring
relative to overall hiring has grown 24.7% year over year.
5. Skill Penetration
SKILLS GENOME
For any category (occupation, country, industry, etc.), the
skills genome is an ordered list (a vector) of the 50 skills most
characteristic of that category. These most characteristic
skills are determined using a TF-IDF algorithm, which down-
ranks ubiquitous skills that add little information about that
specic entity (e.g., Microsoft Word) and up-ranks skills
unique to that specic entity (e.g., articial intelligence).
Further details are available at LinkedIn’s skills genome and
the LinkedIn–World Bank Methodology note.
As an example, Table 1 details the skills genome of the
technology, information, and media industry in the United
States in 2024, displaying the top 10 skills ranked by TF-IDF.
Skill name TF-IDF skill rank
Amazon Web Services (AWS) 1
Software as a Service (SaaS) 2
Articial intelligence (AI) 3
Python (programming language) 4
Go-to-market strategy 5
Customer success 6
Large language models (LLM) 7
Salesforce.com 8
SQL 9
Generative AI 10
AI SKILLS PENETRATION
The aim of this indicator is to measure the intensity of AI skills
in a given category using the following methodology:
• LinkedIn computes frequencies for all self-added skills
by LinkedIn members in a given entity (occupation,
industry, etc.) from 2015 onward.
• LinkedIn reweights skill frequencies using a TF-IDF
model to get the top 50 most representative skills in
that entity. These 50 skills compose the “skill genome”
of that entity.
• LinkedIn computes the share of skills that belong to the
AI skill group out of the top skills in the selected entity.
Interpretation: The AI skills penetration rate signals the
prevalence of AI skills across occupations, or the intensity
with which LinkedIn members utilize AI skills in their jobs. For
example, the top 50 skills for the occupation of engineer are
calculated based on the weighted frequency with which they
appear in LinkedIn members’ proles. If four of the skills that
engineers possess belong to the AI skills group, this measure
indicates that the penetration of AI skills is estimated to be
8% among engineers (i.e., 4/50).
RELATIVE AI SKILLS PENETRATION
To allow for skills penetration comparisons across countries,
the skills genomes are calculated, and a relevant benchmark
is selected (e.g., a global average). A ratio is then constructed
between a country and the benchmark’s AI skills penetrations,
controlling for occupations.
Interpretation: If a country has a relative AI skills penetration
of 1.5, that means AI skills are 1.5 times as frequent as in the
benchmark, for an overlapping set of occupations.
GLOBAL COMPARISON
For cross-country comparisons, LinkedIn presents the
relative penetration rate of AI skills, measured as the sum of
the penetration of each AI skill across occupations in a given
country, divided by the average global penetration of AI skills
across the overlapping occupations in a sample of countries.
Chapter 4: Economy
Appendix

437
Articial Intelligence
Index Report 2025
Appendix
Table of Contents
Interpretation: A relative penetration rate of 2 means the
average penetration of AI skills in that country is two times
the global average across the same set of occupations.
GLOBAL COMPARISON: BY INDUSTRY
The relative AI skills penetration by country for a given
industry provides an in-depth sectoral decomposition of AI
skills penetration across industries and countries.
Interpretation: A country’s relative AI skill penetration rate
of 2 in the education sector means the average penetration of
AI skills in that country is two times the global average across
the same set of occupations in that sector.
GLOBAL COMPARISON: BY GENDER
The relative AI skills penetration by gender provides a cross-
country comparison of AI skills penetrations within a gender.
Since the global averages are distinct for each gender, this
metric should only be used to compare country rankings
within each gender, not for cross-gender comparisons within
countries.
Interpretation: A country’s AI skills penetration for women
of 1.5 means that female members in that country are 1.5
times more likely to list AI skills than the average female
member in all countries pooled together across the same set
of occupations that exist in the country-gender combination.
GLOBAL COMPARISON: ACROSS GENDERS
The relative AI skills penetration across genders allows
for cross-gender comparisons within and across countries
globally, since LinkedIn compares a country’s AI skills
penetration by gender to the same global average regardless
of gender.
6. Female Representation in AI
This refers to the share of AI talent occupied by women.
Interpretation: Female representation within AI talent with
AI Engineering skills is 30.5% globally.
7. AI Talent Migration
Data on migration comes from the World Bank Group–
LinkedIn “Digital Data for Development” partnership (see
https://linkedindata.worldbank.org/ and Zhu et al. (2018)).
LinkedIn migration rates are derived from the self-identied
locations of LinkedIn member proles. For example, when a
LinkedIn member updates their location from Paris to London,
this is counted as a migration. Migration data is available from
2019 onward.
LinkedIn data provides insights to countries on AI talent
gained or lost due to migration trends. AI talent migration is
considered for all members with AI skills/holding AI jobs at
time “t” for country A as the country of interest and country
B as the source of inows and destination for outows. Thus,
net AI talent migration between country A and country B is
calculated as:
Net ows are dened as total arrivals minus departures
within a given time period. LinkedIn membership varies
between countries, which can prove challenging when
interpreting absolute movements of members from one
country to another. Migration ows are therefore normalized
with respect to each country. For example, for country A, all
absolute net ows into and out of country A, regardless of
origin and destination countries, are normalized based on the
LinkedIn membership of country A at the end of each year
and multiplied by 10,000. Hence, this metric indicates relative
talent migration from all countries to and from country A.
Please note that minimum thresholds have been applied such
that transitions have a sucient sample size.
Interpretation: The United States had a positive net ow of
AI talent relative to its membership size at 1.07 net ow per
10,000 members.
8. Career Transitions Into AI Jobs
LinkedIn considers the source occupations that feed AI
occupations, analyzing the share of transitions into AI
occupations pooled over a ve-year period. Career transitions
Chapter 4: Economy
Appendix
438
Articial Intelligence
Index Report 2025
Appendix
Table of Contents
are computed by aggregating member-level job transitions
from one occupation to another occupation the member
has not previously held. LinkedIn excludes rst occupations
added by new graduates and intra-occupation transitions.
Interpretation: In the United States, 26.9% of transitions into
AI engineer came from software engineer, followed by 13.3%
from data scientist.
THE LINKEDIN AI SKILLS LIST
AI Engineering
3D reconstruction, AI agents, AI productivity, AI strategy,
algorithm analysis, algorithm development, Amazon Bedrock,
Apache Spark ML, applied machine learning, articial
intelligence (AI), articial neural networks, association
rules, audio synthesis, autoencoders, automated clustering,
automated feature engineering, automated machine learning
(AutoML), automated reasoning, autoregressive models,
Azure AI Studio, Cae, chatbot development, chatbots,
classication, cognitive computing, computational geometry,
computational intelligence, computational linguistics,
concept drift adaptation, conditional generation, conditional
image generation, convolutional neural networks (CNN),
custom GPTs, decision trees, deep convolutional generative
adversarial networks (DCGAN), deep convolutional neural
nNetworks (DCNN), deep learning, deep neural networks
(DNN), evolutionary algorithms, expert systems, facial
recognition, feature extraction, feature selection, fuzzy
logic, generative adversarial imitation learning, generative
adversarial networks (GANs), generative AI, generative
design optimization, generative ow models, generative
modeling, generative neural networks, generative
optimization, generative pre-training, generative query
networks (GQNs), generative replay memory, generative
synthesis, gesture recognition, Google Cloud AutoML, graph
embeddings, graph networks, hyperparameter optimization,
hyperparameter tuning, image generation, image inpainting,
image processing, image synthesis, image-to-image
translation, information extraction, intelligent agents,
k-means clustering, Keras, knowledge discovery, knowledge
representation and reasoning, LangChain, large language
model operations (LLMOps), large language models (LLM),
machine learning, machine learning algorithms, machine
translation, Microsoft Azure Machine Learning, MLOps,
model compression, model interpretation, model training,
music generation,nNatural language generation, natural
language processing (NLP), natural language understanding,
neural network architecture design, neural networks, NLTK,
object recognition, ontologies, OpenAI API, OpenCV, parsing,
pattern recognition, predictive modeling, probabilistic
generative models, probabilistic programming, prompt ow,
PyTorch, question answering, random forest, RapidMiner,
recommender systems, recurrent neural networks (RNN),
reinforcement learning, responsible AI, Scikit-Learn, semantic
technologies, semantic web, sentiment analysis, speech
recognition, Spring AI, statistical inference, style transfer,
StyleGAN, supervised learning, support vector machine
(SVM), synthetic data generation, TensorFlow, text analytics,
text classication, text generation, text mining, text-to-image
generation, Theano, time series forecasting, transformer
models, unsupervised learning, variational autoencoders
(VAEs), video generation, web mining, Weka, WordNet.
AI Literacy
AI Builder, AI prompting, Anthropic Claude, ChatGPT,
DALL-E, generative AI, Generative AI Studio, generative AI
tools, generative art, GitHub Copilot, Google Bard, Google
Gemini, GPT-3, GPT-4, LLaMA, Microsoft Copilot, Microsoft
Copilot Studio, Midjourney, multimodal prompting, prompt
engineering, Stable Diusion.
Acknowledgments
LinkedIn gratefully acknowledges the contributions of Murat
Erer and Carl Shan in developing these methodologies and
metrics, and the feedback from our collaborators at the
OECD.AI, Stanford Institute for Human-Centered AI, World
Bank, and Centro Nacional de Inteligencia Articial (Cenia).
Chapter 4: Economy
Appendix
439
Articial Intelligence
Index Report 2025
Appendix
Table of Contents
Quid
Quid insights prepared by Heather English and Hansen Yang
Quid uses its own in-house LLM and other smart search
features, as well as traditional Boolean query, to search for
focus areas, topics, and keywords within many datasets: social
media, news, forums and blogs, companies, patents, as well as
other custom feeds of data (e.g., survey data). Quid has many
visualization options and data delivery endpoints, including
network graphs based on semantic similarity, in-platform
dashboarding capabilities, and programmatic PostgreSQL
database delivery. Quid applies best-in-class AI and NLP to
reveal hidden patterns in large datasets, enabling users to
make data-driven decisions accurately, quickly, and eciently.
Search, Data Sources, and Scope
Over 8 million global public and private company proles
from multiple data sources are indexed to search across
company descriptions, while ltering and including metadata
ranging from investment information to rmographic
information, such as founding year, headquarter location, and
more. Company information is updated on a weekly basis.
The Quid algorithm reads a large amount of text data from
each document to make links between dierent documents
based on their similar language. This process is repeated at
an immense scale, which produces a network of dierent
clusters identifying distinct topics or focus areas. Trends are
identied based on keywords, phrases, people, companies,
and institutions that Quid identies and other metadata that
is put into the software.
Data
Companies
Organization data is embedded from Capital IQ and
Crunchbase. These companies include every type of
organization (private, public, operating, operating as a
subsidiary, out of business) throughout the world. The
investment data includes private investments, M&A, public
oerings, minority stakes held by PE/ VCs, corporate venture
arms, governments, and institutions both within and outside
the United States. Some data is unavailable—for instance,
when investors’ names or funding amounts are not disclosed.
Quid embeds Capital IQ data as a default and adds in data
from Crunchbase for the data points that are not captured in
Capital IQ. This not only yields comprehensive and accurate
data on all global organizations, but it also captures early-
stage startups and funding events data.
Search Parameters
Boolean query is used to search for focus areas, topics, and
keywords within the archived company database and within
their business descriptions and websites. Quid can lter
out the search results by HQ regions, investment amount,
operating status, organization type (private/ public), and
founding year. Quid then visualizes these companies by
semantic similarity. If there are more than 7,000 companies
from the search result, Quid selects the 7,000 most relevant
companies for visualization based on the language algorithm.
Boolean search: “articial intelligence” or “AI” or “machine
learning” or “deep learning”
Companies
• Global AI and ML companies that have received
investments (private, IPO, M&A) from Jan. 1, 2014, to
Dec. 31, 2024.
• Global AI and ML companies that have received over
$1.5 million for the past 10 years (Jan. 1, 2014, to Dec.
31, 2024).
• Global data was also pulled for a generative AI query
(Boolean search: “generative AI” or “gen AI” OR
“generative articial intelligence”) for companies that
have received over $1.5 million for the past 10 years
(Jan. 1, 2014, to Dec. 31, 2024).
Target Event Denitions
• Private investment: A private placement is a private
sale of newly issued securities (equity or debt) by a
company to a select investor or group of investors. The
stakes that buyers take in private placements are often
minority stakes (under 50%), although it is possible to
take control of a company through a private placement
as well, in which case the private placement would be
a majority stake investment.
Chapter 4: Economy
Appendix

440
Articial Intelligence
Index Report 2025
Appendix
Table of Contents
• Minority investment: These refer to minority stake
acquisitions in Quid, which take place when the buyer
acquires less than 50% of the existing ownership stake
in entities, asset products, and business divisions.
• M&A: This refers to a buyer acquiring more than
50% of the existing ownership stake in entities, asset
products, and business divisions.
McKinsey & Company
Data used in the “Corporate Activity” section was sourced
from two McKinsey global surveys: “The State of AI in Early
2024: Gen AI Adoption Spikes and Starts to Generate Value”
and “The State of AI: How Organizations Are Rewiring to
Capture Value.”
The rst online survey of 2024 was in the eld from Feb. 22
to March 5, and garnered responses from 1,363 participants
representing the full range of regions, industries, company
sizes, functional specialties, and tenures. Among the
respondents, 981 said their organizations had adopted AI in at
least one business function, and 878 said their organizations
were regularly using gen AI in at least one function.
The second online survey of 2024 was in the eld from July 16
to July 31, and garnered responses from 1,491 participants in
101 nations representing the full range of regions, industries,
company sizes, functional specialties, and tenures. Forty-two
percent of respondents said they work for organizations with
more than $500 million in annual revenues.
To adjust for dierences in response rates, the data is weighted
by the contribution of each respondent’s nation to global GDP.
The AI Index also considered data from previous iterations of
the McKinsey survey. These include:
The State of AI in 2023: Generative AI’s Breakout Year
The State of AI in 2022—and a Half Decade in Review
The State of AI in 2021
The State of AI in 2020
AI Proves Its Worth, But Few Scale Impact (2019)
AI Adoption Advances, But Foundational Barriers Remain
(2018)
Chapter 4: Economy
Appendix

441
Articial Intelligence
Index Report 2025
Appendix
Table of Contents
Works Cited
Brynjolfsson, E., Li, D., & Raymond, L. (2025). Generative AI at Work. The Quarterly Journal of Economics, qjae044. https://doi.
org/10.1093/qje/qjae044
Cui, Z. (Kevin), Demirer, M., Jae, S., Musol, L., Peng, S., & Salz, T. (2025). The Eects of Generative AI on High-Skilled Work:
Evidence From Three Field Experiments With Software Developers (SSRN Scholarly Paper 4945566). https://doi.org/10.2139/
ssrn.4945566
Dell’Acqua, F., McFowland, E., Mollick, E. R., Lifshitz-Assaf, H., Kellogg, K., Rajendran, S., Krayer, L., Candelon, F., & Lakhani, K.
R. (2023). Navigating the Jagged Technological Frontier: Field Experimental Evidence of the Eects of AI on Knowledge Worker
Productivity and Quality. SSRN Electronic Journal. https://doi.org/10.2139/ssrn.4573321
Handa, K., Tamkin, A., McCain, M., Huang, S., Durmus, E., Heck, S., Mueller, J., Hong, J., Ritchie, S., Belonax, T., Troy, K. K.,
Amodei, D., Kaplan, J., Clark, J., & Ganguli, D. (2025). Which Economic Tasks Are Performed with AI? Evidence From Millions of
Claude Conversations (arXiv:2503.04761). arXiv. https://doi.org/10.48550/arXiv.2503.04761
Homann, M., Boysel, S., Nagle, F., Peng, S., & Xu, K. (2024). Generative AI and the Nature of Work (No. 11479). CESifo Working
Paper. https://www.econstor.eu/bitstream/10419/308375/1/cesifo1_wp11479.pdf
Jae, S., Shah, N. P., Butler, J., Farach, A., Cambon, A., Hecht, B., Schwarz, M., & Teevan, J. (eEds.). (2024). Generative AI in
Real-World Workplaces: The Second Microsoft Report on AI and Productivity Research. Microsoft. https://www.microsoft.com/
en-us/research/wp-content/uploads/2024/07/Generative-AI-in-Real-World-Workplaces.pdf
Necula, S.-C., Fotache, D., & Rieder, E. (2024). Assessing the Impact of Articial Intelligence Tools on Employee Productivity:
Insights From a Comprehensive Survey Analysis. Electronics, 13(18), Article 18. https://doi.org/10.3390/electronics13183758
Toner-Rodgers, A. (2024). Articial Intelligence, Scientic Discovery, and Product Innovation (arXiv:2412.17866). arXiv. https://doi.
org/10.48550/arXiv.2412.17866
Chapter 4: Economy
Appendix

442
Articial Intelligence
Index Report 2025
Appendix
Table of Contents
Chapter 5: Science and Medicine
Chapter 5: Science and Medicine
Appendix
Acknowledgments
The AI Index would like to acknowledge Armin Hamrah for
his work in surveying the literature on signicant trends in AI-
related science and medicine.
Benchmarks
1. MedQA: Data on MedQA was taken from the MedQA
Papers With Code leaderboard in February 2025. To learn
more about MedQA, please read the original paper.
AI-Driven Protein Science
Publications
The AI Index used Dimensions’ AI document search function
to measure the number of manuscripts published in a year.
The searches were restricted to the 2024 publication year
and the biological sciences category (987,717 publications).
Then a search was conducted for each key term, which had to
be present in both the title and the abstract. This requirement
limited the number of manuscripts returned that might
only have mentioned the key term in passing, rather than
describing research about the key term. Once the number
of manuscripts was identied, the percent of total biological
sciences manuscripts about each key term was calculated.
Image and Multimodal AI for
Scientic Discovery
The AI Index used Semantic Scholar and Google Scholar to
measure the number of manuscripts published from 2023 to
2025. A search was then performed for each key term (e.g.,
“foundation models,” “microscopy,” “electron microscopy,”
“uorescence microscopy,” “light microscopy”) with the
requirement that the terms be present in both the title
and the abstract. Furthermore, the search was rened to
strictly comply with the denition of a foundation model—
specically, a model trained on vast datasets that can be
applied across a wide range of use cases. To this end, any
model alleged to be a foundation model that had been
trained on fewer than 1 million data points or not evaluated on
multiple tasks was discarded.
FDA-Approved AI Medical
Devices
Data on FDA-approved AI medical devices was sourced
from the FDA website, which tracks articial intelligence and
machine learning (AI/ML)–enabled medical devices.
Ethical Considerations
The AI Index used PubMedCentral’s API to query for English-
language indexed articles published between Jan. 1, 2020,
and Dec. 31, 2024, using search terms regarding articial
intelligence, medicine, and ethical issues. In order to obtain
only articles at the intersection of those three topics, the AI
Index further narrowed the articles to those with an abstract
including a keyword related to: (a) articial intelligence, (b)
medicine, and (c) at least one ethical issue. After removing
preprints, retracted articles, and articles that failed to satisfy
the inclusion criteria, 2,916 articles remained. The AI Index
used the frequency of ethical issues mentioned in abstracts
across this pool of articles to conduct its analysis.
API query:
(“articial intelligence”[MeSH] OR “machine learning”[MeSH]
OR “deep learning”[All Fields] OR “AI”[All Fields] OR
“ML”[All Fields] OR “predictive analytics”[All Fields]) AND
((“ethics”[MeSH] OR “ethical implications”[All Fields] OR
“fair*”[All Fields] OR “unfair*”[All Fields] OR “bias”[All Fields]
OR “accountability”[All Fields] OR “transparency”[All Fields]
OR “explainability”[All Fields] OR “privacy”[All Fields] OR
“trustworthy AI”[All Fields]) OR (“bioethics”[MeSH] OR
“ELSI”[All Fields] OR “autonomy”[All Fields] OR “equity”[All
Fields] OR “equitab*”[All Fields] OR “justice”[All Fields] OR
“benecence”[All Fields] OR “non-malecence”[All Fields]
OR “independent review”[All Fields] OR “oversight”[All

443
Articial Intelligence
Index Report 2025
Appendix
Table of Contents
Fields] OR “racis*”[All Fields] OR “prejud*”[All Fields] OR
“inequit*”[All Fields] OR “community engagement”[All
Fields] OR “misuse”[All Fields] OR “dual use”[All Fields]))
AND (“medicine”[MeSH] OR “medical AI”[All Fields]
OR “clinical decision support”[All Fields] OR “health
informatics”[All Fields]) AND (“2020/01/01”[PubDate] :
“2024/12/31”[PubDate])
Date of search: 2/14/2025
Abstract inclusion criteria:
Therefore, includes only articles that discuss medicine,
articial intelligence, and at least one ethical issue within the
abstract (N = 2,916).
• AI keywords: “articial intelligence,” “ AI,” “algorithm,”
“ML,” “machine learning,” “deep learning,” predictive
analytics.
• Medicine keywords: “medicine,” “medical,” “health,”
“healthcare.”
• Ethics keywords: “ethic*,” “fairness,” “bias,”
“accountability,” “transparency,” “explainability,”
“privacy,” “trustworthy AI,” “bioethics,” “ELSI,”
“autonomy,” “equit*,” “justice,” “benecence,” “non-
malecence,” “independent review,” “oversight,”
“racism,” “inequit*,” community engagement, misuse,
dual use.
Chapter 5: Science and Medicine
Appendix

444
Articial Intelligence
Index Report 2025
Appendix
Table of Contents
Works Cited
Abramson, J., Adler, J., Dunger, J., Evans, R., Green, T., Pritzel, A., Ronneberger, O., Willmore, L., Ballard, A. J., Bambrick, J.,
Bodenstein, S. W., Evans, D. A., Hung, C.-C., O’Neill, M., Reiman, D., Tunyasuvunakool, K., Wu, Z., Žemgulytė, A., Arvaniti, E., …
Jumper, J. M. (2024). Accurate Structure Prediction of Biomolecular Interactions With AlphaFold 3. Nature, 630(8016), 493–
500. https://doi.org/10.1038/s41586-024-07487-w
Acharya, R., Abanin, D. A., Aghababaie-Beni, L., Aleiner, I., Andersen, T. I., Ansmann, M., Arute, F., Arya, K., Asfaw, A.,
Astrakhantsev, N., Atalaya, J., Babbush, R., Bacon, D., Ballard, B., Bardin, J. C., Bausch, J., Bengtsson, A., Bilmes, A., Blackwell,
S., … Google Quantum AI and Collaborators. (2025). Quantum Error Correction Below the Surface Code Threshold. Nature,
638(8052), 920–26. https://doi.org/10.1038/s41586-024-08449-y
Blankemeier, L., Cohen, J. P., Kumar, A., Veen, D. V., Gardezi, S. J. S., Paschali, M., Chen, Z., Delbrouck, J.-B., Reis, E., Truyts,
C., Bluethgen, C., Jensen, M. E. K., Ostmeier, S., Varma, M., Valanarasu, J. M. J., Fang, Z., Huo, Z., Nabulsi, Z., Ardila, D., …
Chaudhari, A. S. (2024). Merlin: A Vision Language Foundation Model for 3D Computed Tomography (arXiv:2406.06512). arXiv.
https://doi.org/10.48550/arXiv.2406.06512
Bodnar, C., Bruinsma, W. P., Lucic, A., Stanley, M., Vaughan, A., Brandstetter, J., Garvan, P., Riechert, M., Weyn, J. A., Dong,
H., Gupta, J. K., Thambiratnam, K., Archibald, A. T., Wu, C.-C., Heider, E., Welling, M., Turner, R. E., & Perdikaris, P. (2024). A
Foundation Model for the Earth System (arXiv:2405.13063). arXiv. https://doi.org/10.48550/arXiv.2405.13063
Burley, S. K., Berman, H. M., Kleywegt, G. J., Markley, J. L., Nakamura, H., & Velankar, S. (2017). Protein Data Bank (PDB):
The Single Global Macromolecular Structure Archive. Methods in Molecular Biology (Clifton, N.J.), 1607, 627–41. https://doi.
org/10.1007/978-1-4939-7000-1_26
Callahan, A., McElfresh, D., Banda, J. M., Bunney, G., Char, D., Chen, J., Corbin, C. K., Dash, D., Downing, N. L., Jain, S. S.,
Kotecha, N., Masterson, J., Mello, M. M., Morse, K., Nallan, S., Pandya, A., Revri, A., Sharma, A., Sharp, C., … Shah, N. H. (2024).
Standing on FURM Ground: A Framework for Evaluating Fair, Useful, and Reliable AI Models in Health Care Systems. NEJM
Catalyst, 5(10), CAT.24.0131. https://doi.org/10.1056/CAT.24.0131
Campanella, G., Chen, S., Verma, R., Zeng, J., Stock, A., Croken, M., Veremis, B., Elmas, A., Huang, K., Kwan, R., Houldsworth,
J., Schoenfeld, A. J., & Vanderbilt, C. (2024). A Clinical Benchmark of Public Self-Supervised Pathology Foundation Models
(arXiv:2407.06508). arXiv. https://doi.org/10.48550/arXiv.2407.06508
Carrillo-Perez, F., Pizurica, M., Zheng, Y., Nandi, T. N., Madduri, R., Shen, J., & Gevaert, O. (2023). RNA-to-Image Multi-
cancer Synthesis Using Cascaded Diusion Models. bioRxiv: The Preprint Server for Biology, 2023.01.13.523899. https://doi.
org/10.1101/2023.01.13.523899
Chambon, P., Bluethgen, C., Delbrouck, J.-B., Sluijs, R. V. der, Połacin, M., Chaves, J. M. Z., Abraham, T. M., Purohit, S., Langlotz,
C. P., & Chaudhari, A. (2022). RoentGen: Vision-Language Foundation Model for Chest X-ray Generation (arXiv:2211.12737). arXiv.
https://doi.org/10.48550/arXiv.2211.12737
Chapter 5: Science and Medicine
Appendix

445
Articial Intelligence
Index Report 2025
Appendix
Table of Contents
Chambon, P., Delbrouck, J.-B., Sounack, T., Huang, S.-C., Chen, Z., Varma, M., Truong, S. Q., Chuong, C. T., & Langlotz, C.
P. (2024). CheXpert Plus: Augmenting a Large Chest X-ray Dataset With Text Radiology Reports, Patient Demographics and
Additional Image Formats (arXiv:2405.19538). arXiv. https://doi.org/10.48550/arXiv.2405.19538
Chen, R. J., Chen, C., Li, Y., Chen, T. Y., Trister, A. D., Krishnan, R. G., & Mahmood, F. (2022). Scaling Vision Transformers to Gigapixel
Images via Hierarchical Self-Supervised Learning (arXiv:2206.02647). arXiv. https://doi.org/10.48550/arXiv.2206.02647
Chen, Z., Varma, M., Xu, J., Paschali, M., Veen, D. V., Johnston, A., Youssef, A., Blankemeier, L., Bluethgen, C., Altmayer, S.,
Valanarasu, J. M. J., Muneer, M. S. E., Reis, E. P., Cohen, J. P., Olsen, C., Abraham, T. M., Tsai, E. B., Beaulieu, C. F., Jitsev, J., …
Langlotz, C. P. (2024). A Vision-Language Foundation Model to Enhance Eciency of Chest X-ray Interpretation (arXiv:2401.12208).
arXiv. https://doi.org/10.48550/arXiv.2401.12208
Christensen, M., Vukadinovic, M., Yuan, N., & Ouyang, D. (2024). Vision–Language Foundation Model for Echocardiogram
Interpretation. Nature Medicine, 30(5), 1481–88. https://doi.org/10.1038/s41591-024-02959-y
Clark, K., Vendt, B., Smith, K., Freymann, J., Kirby, J., Koppel, P., Moore, S., Phillips, S., Matt, D., Pringle, M., Tarbox, L., & Prior,
F. (2013). The Cancer Imaging Archive (TCIA): Maintaining and Operating a Public Information Repository. Journal of Digital
Imaging, 26(6), 1045–57. https://doi.org/10.1007/s10278-013-9622-7
Ding, S., Li, J., Wang, J., Ying, S., & Shi, J. (2023). Multi-scale Ecient Graph-Transformer for Whole Slide Image Classication
(arXiv:2305.15773). arXiv. https://doi.org/10.48550/arXiv.2305.15773
Ding, T., Wagner, S. J., Song, A. H., Chen, R. J., Lu, M. Y., Zhang, A., Vaidya, A. J., Jaume, G., Shaban, M., Kim, A., Williamson, D.
F. K., Chen, B., Almagro-Perez, C., Doucet, P., Sahai, S., Chen, C., Komura, D., Kawabe, A., Ishikawa, S., … Mahmood, F. (2024).
Multimodal Whole Slide Foundation Model for Pathology(arXiv:2411.19666). arXiv. https://doi.org/10.48550/arXiv.2411.19666
Goh, E., Gallo, R., Hom, J., Strong, E., Weng, Y., Kerman, H., Cool, J. A., Kanjee, Z., Parsons, A. S., Ahuja, N., Horvitz, E., Yang,
D., Milstein, A., Olson, A. P. J., Rodman, A., & Chen, J. H. (2024). Large Language Model Inuence on Diagnostic Reasoning:
A Randomized Clinical Trial. JAMA Network Open, 7(10), e2440969. https://doi.org/10.1001/jamanetworkopen.2024.40969
Goh, E., Gallo, R. J., Strong, E., Weng, Y., Kerman, H., Freed, J. A., Cool, J. A., Kanjee, Z., Lane, K. P., Parsons, A. S., Ahuja, N.,
Horvitz, E., Yang, D., Milstein, A., Olson, A. P. J., Hom, J., Chen, J. H., & Rodman, A. (2025). GPT-4 Assistance for Improvement
of Physician Performance on Patient Care Tasks: A Randomized Controlled Trial. Nature Medicine, 1–6. https://doi.org/10.1038/
s41591-024-03456-y
Gruver, N., Sriram, A., Madotto, A., Wilson, A. G., Zitnick, C. L., & Ulissi, Z. (2024). Fine-Tuned Language Models Generate Stable
Inorganic Materials as Text (arXiv:2402.04379). arXiv. https://doi.org/10.48550/arXiv.2402.04379
Guevara, M., Chen, S., Thomas, S., Chaunzwa, T. L., Franco, I., Kann, B. H., Moningi, S., Qian, J. M., Goldstein, M., Harper,
S., Aerts, H. J. W. L., Catalano, P. J., Savova, G. K., Mak, R. H., & Bitterman, D. S. (2024). Large Language Models to Identify
Social Determinants of Health in Electronic Health Records. Npj Digital Medicine, 7(1), 1–14. https://doi.org/10.1038/s41746-023-
00970-0
Chapter 5: Science and Medicine
Appendix

446
Articial Intelligence
Index Report 2025
Appendix
Table of Contents
Chapter 5: Science and Medicine
Appendix
Guo, Z., Zhao, W., Wang, S., & Yu, L. (2023). HIGT: Hierarchical Interaction Graph-Transformer for Whole Slide Image Analysis
(arXiv:2309.07400). arXiv. https://doi.org/10.48550/arXiv.2309.07400
Haberle, T., Cleveland, C., Snow, G. L., Barber, C., Stookey, N., Thornock, C., Younger, L., Mullahkhel, B., & Ize-Ludlow, D. (2024).
The Impact of Nuance DAX Ambient Listening AI Documentation: A Cohort Study. Journal of the American Medical Informatics
Association, 31(4), 975–79. https://doi.org/10.1093/jamia/ocae022
Hashmi, A. U. R., Almakky, I., Qazi, M. A., Sanjeev, S., Papineni, V. R., Jagdish, J., & Yaqub, M. (2024). XReal: Realistic Anatomy
and Pathology-Aware X-ray Generation via Controllable Diusion Model (arXiv:2403.09240). arXiv. https://doi.org/10.48550/
arXiv.2403.09240
Hayes, T., Rao, R., Akin, H., Sofroniew, N. J., Oktay, D., Lin, Z., Verkuil, R., Tran, V. Q., Deaton, J., Wiggert, M., Badkundri, R.,
Shafkat, I., Gong, J., Derry, A., Molina, R. S., Thomas, N., Khan, Y. A., Mishra, C., Kim, C., … Rives, A. (2024). Simulating 500
Million Years of Evolution With a Language Model (p. 2024.07.01.600583). bioRxiv. https://doi.org/10.1101/2024.07.01.600583
Hellert, T., Montenegro, J., & Pollastro, A. (2024). PhysBERT: A Text Embedding Model for Physics Scientic Literature
(arXiv:2408.09574). arXiv. https://doi.org/10.48550/arXiv.2408.09574
Hornick, T., Mao, C., Koynov, A., Yawman, P., Thool, P., Salish, K., Giles, M., Nagapudi, K., & Zhang, S. (2024). In Silico Formulation
Optimization and Particle Engineering of Pharmaceutical Products Using a Generative Articial Intelligence Structure Synthesis
Method. Nature Communications, 15(1), 9622. https://doi.org/10.1038/s41467-024-54011-9
Istasy, P., Lee, W. S., Iansavichene, A., Upshur, R., Gyawali, B., Burkell, J., Sadikovic, B., Lazo-Langner, A., & Chin-Yee, B. (2022).
The Impact of Articial Intelligence on Health Equity in Oncology: Scoping Review. Journal of Medical Internet Research, 24(11),
e39748. https://doi.org/10.2196/39748
Jiang, J. X., Qi, K., Bai, G., & Schulman, K. (2023). Pre-pandemic Assessment: A Decade of Progress in Electronic Health Record
Adoption Among U.S. Hospitals. Health Aairs Scholar, 1(5), qxad056. https://doi.org/10.1093/haschl/qxad056
Jin, D., Pan, E., Oufattole, N., Weng, W.-H., Fang, H., & Szolovits, P. (2020). What Disease Does This Patient Have? A Large-
Scale Open Domain Question Answering Dataset From Medical Exams (arXiv:2009.13081). arXiv. https://doi.org/10.48550/
arXiv.2009.13081
Johnson, A. E. W., Pollard, T. J., Berkowitz, S. J., Greenbaum, N. R., Lungren, M. P., Deng, C., Mark, R. G., & Horng, S. (2019).
MIMIC-CXR, a De-identied Publicly Available Database of Chest Radiographs With Free-Text Reports. Scientic Data, 6(1), 317.
https://doi.org/10.1038/s41597-019-0322-0
Kochkov, D., Yuval, J., Langmore, I., Norgaard, P., Smith, J., Mooers, G., Klöwer, M., Lottes, J., Rasp, S., Düben, P., Hateld,
S., Battaglia, P., Sanchez-Gonzalez, A., Willson, M., Brenner, M. P., & Hoyer, S. (2024). Neural General Circulation Models for
Weather and Climate. Nature, 632(8027), 1060–66. https://doi.org/10.1038/s41586-024-07744-y

447
Articial Intelligence
Index Report 2025
Appendix
Table of Contents
Chapter 5: Science and Medicine
Appendix
Kudiabor, H. (2024). Virtual Lab Powered by ‘AI Scientists’ Super-Charges Biomedical Research. Nature, 636(8043), 532–33.
https://doi.org/10.1038/d41586-024-01684-3
Kumar, A., Kriz, A., Havaei, M., & Arbel, T. (2025). PRISM: High-Resolution & Precise Counterfactual Medical Image Generation
Using Language-Guided Stable Diusion (arXiv:2503.00196). arXiv. https://doi.org/10.48550/arXiv.2503.00196
Lu, M. Y., Chen, B., Williamson, D. F. K., Chen, R. J., Zhao, M., Chow, A. K., Ikemura, K., Kim, A., Pouli, D., Patel, A., Soliman, A.,
Chen, C., Ding, T., Wang, J. J., Gerber, G., Liang, I., Le, L. P., Parwani, A. V., Weishaupt, L. L., & Mahmood, F. (2024). A Multimodal
Generative AI Copilot for Human Pathology. Nature, 634(8033), 466–73. https://doi.org/10.1038/s41586-024-07618-3
Lutsker, G., Sapir, G., Shilo, S., Merino, J., Godneva, A., Greeneld, J. R., Samocha-Bonet, D., Dhir, R., Gude, F., Mannor, S.,
Meirom, E., Chechik, G., Rossman, H., & Segal, E. (2025). From Glucose Patterns to Health Outcomes: A Generalizable Foundation
Model for Continuous Glucose Monitor Data Analysis (arXiv:2408.11876). arXiv. https://doi.org/10.48550/arXiv.2408.11876
Ma, J., He, Y., Li, F., Han, L., You, C., & Wang, B. (2024). Segment Anything in Medical Images. Nature Communications, 15(1), 654.
https://doi.org/10.1038/s41467-024-44824-z
Ma, S. P., Liang, A. S., Shah, S. J., Smith, M., Jeong, Y., Devon-Sand, A., Crowell, T., Delahaie, C., Hsia, C., Lin, S., Shanafelt, T.,
Pfeer, M. A., Sharp, C., & Garcia, P. (2025). Ambient Articial Intelligence Scribes: Utilization and Impact on Documentation
Time. Journal of the American Medical Informatics Association, 32(2), 381–85. https://doi.org/10.1093/jamia/ocae304
Madani, A., Krause, B., Greene, E. R., Subramanian, S., Mohr, B. P., Holton, J. M., Olmos, J. L., Xiong, C., Sun, Z. Z., Socher, R.,
Fraser, J. S., & Naik, N. (2023). Large Language Models Generate Functional Protein Sequences Across Diverse Families. Nature
Biotechnology, 41(8), 1099–1106. https://doi.org/10.1038/s41587-022-01618-2
Maier-Hein, L., Eisenmann, M., Reinke, A., Onogur, S., Stankovic, M., Scholz, P., Arbel, T., Bogunovic, H., Bradley, A. P., Carass,
A., Feldmann, C., Frangi, A. F., Full, P. M., van Ginneken, B., Hanbury, A., Honauer, K., Kozubek, M., Landman, B. A., März, K., …
Kopp-Schneider, A. (2018). Why Rankings of Biomedical Image Analysis Competitions Should Be Interpreted With Care. Nature
Communications, 9(1), 5217. https://doi.org/10.1038/s41467-018-07619-7
Mei, X., Liu, Z., Robson, P. M., Marinelli, B., Huang, M., Doshi, A., Jacobi, A., Cao, C., Link, K. E., Yang, T., Wang, Y., Greenspan,
H., Deyer, T., Fayad, Z. A., & Yang, Y. (2022). RadImageNet: An Open Radiologic Deep Learning Research Dataset for Eective
Transfer Learning. Radiology: Articial Intelligence, 4(5), e210315. https://doi.org/10.1148/ryai.210315
Narayanan, S., Braza, J. D., Griths, R.-R., Ponnapati, M., Bou, A., Laurent, J., Kabeli, O., Wellawatte, G., Cox, S., Rodriques, S.
G., & White, A. D. (2024). Aviary: Training Language Agents on Challenging Scientic Tasks (arXiv:2412.21154). arXiv. https://doi.
org/10.48550/arXiv.2412.21154
Nori, H., Lee, Y. T., Zhang, S., Carignan, D., Edgar, R., Fusi, N., King, N., Larson, J., Li, Y., Liu, W., Luo, R., McKinney, S. M., Ness,
R. O., Poon, H., Qin, T., Usuyama, N., White, C., & Horvitz, E. (2023). Can Generalist Foundation Models Outcompete Special-
Purpose Tuning? Case Study in Medicine (arXiv:2311.16452). arXiv. https://doi.org/10.48550/arXiv.2311.16452

448
Articial Intelligence
Index Report 2025
Appendix
Table of Contents
Chapter 5: Science and Medicine
Appendix
Nori, H., Usuyama, N., King, N., McKinney, S. M., Fernandes, X., Zhang, S., & Horvitz, E. (2024). From Medprompt to o1: Exploration
of Run-Time Strategies for Medical Challenge Problems and Beyond (arXiv:2411.03590). arXiv. https://doi.org/10.48550/
arXiv.2411.03590
Pokharel, S., Pratyush, P., Heinzinger, M., Newman, R. H., & Kc, D. B. (2022). Improving Protein Succinylation Sites Prediction
Using Embeddings From Protein Language Model. Scientic Reports, 12(1), 16933. https://doi.org/10.1038/s41598-022-21366-2
Price, I., Sanchez-Gonzalez, A., Alet, F., Andersson, T. R., El-Kadi, A., Masters, D., Ewalds, T., Stott, J., Mohamed, S., Battaglia,
P., Lam, R., & Willson, M. (2025). Probabilistic Weather Forecasting With Machine Learning. Nature, 637(8044), 84–90.
https://doi.org/10.1038/s41586-024-08252-9
Qian, Z., Callender, T., Cebere, B., Janes, S. M., Navani, N., & van der Schaar, M. (2024). Synthetic Data for Privacy-Preserving
Clinical Risk Prediction. Scientic Reports, 14(1), 25676. https://doi.org/10.1038/s41598-024-72894-y
Qiu, J., Wu, J., Wei, H., Shi, P., Zhang, M., Sun, Y., Li, L., Liu, H., Liu, H., Hou, S., Zhao, Y., Shi, X., Xian, J., Qu, X., Zhu, S., Pan, L.,
Chen, X., Zhang, X., Jiang, S., … Yuan, W. (2024). Development and Validation of a Multimodal Multitask Vision Foundation Model
for Generalist Ophthalmic Articial Intelligence. NEJM AI, 1(12), AIoa2300221. https://doi.org/10.1056/AIoa2300221
Quer, G., & Topol, E. J. (2024). The Potential for Large Language Models to Transform Cardiovascular Medicine. The Lancet
Digital Health, 6(10), e767–71. https://doi.org/10.1016/S2589-7500(24)00151-1
Rashidi, H. H., Albahra, S., Rubin, B. P., & Hu, B. (2024). A Novel and Fully Automated Platform for Synthetic Tabular Data
Generation and Validation. Scientic Reports, 14(1), 23312. https://doi.org/10.1038/s41598-024-73608-0
Shah, S. J., Devon-Sand, A., Ma, S. P., Jeong, Y., Crowell, T., Smith, M., Liang, A. S., Delahaie, C., Hsia, C., Shanafelt, T., Pfeer, M.
A., Sharp, C., Lin, S., & Garcia, P. (2025). Ambient Articial Intelligence Scribes: Physician Burnout and Perspectives on Usability
and Documentation Burden. Journal of the American Medical Informatics Association, 32(2), 375–80. https://doi.org/10.1093/
jamia/ocae295
Shapson-Coe, A., Januszewski, M., Berger, D. R., Pope, A., Wu, Y., Blakely, T., Schalek, R. L., Li, P. H., Wang, S., Maitin-Shepard,
J., Karlupia, N., Dorkenwald, S., Sjostedt, E., Leavitt, L., Lee, D., Troidl, J., Collman, F., Bailey, L., Fitzmaurice, A., … Lichtman,
J. W. (2024). A Petavoxel Fragment of Human Cerebral Cortex Reconstructed at Nanoscale Resolution. Science, 384(6696),
eadk4858. https://doi.org/10.1126/science.adk4858
Sheller, M. J., Edwards, B., Reina, G. A., Martin, J., Pati, S., Kotrotsou, A., Milchenko, M., Xu, W., Marcus, D., Colen, R. R., & Bakas,
S. (2020). Federated Learning in Medicine: Facilitating Multi-institutional Collaborations Without Sharing Patient Data. Scientic
Reports, 10(1), 12598. https://doi.org/10.1038/s41598-020-69250-1
Shi, J., Tang, L., Gao, Z., Li, Y., Wang, C., Gong, T., Li, C., & Fu, H. (2023). MG-Trans: Multi-scale Graph Transformer With
Information Bottleneck for Whole Slide Image Classication. IEEE Transactions on Medical Imaging, 42(12), 3871–83.
https://doi.org/10.1109/TMI.2023.3313252

449
Articial Intelligence
Index Report 2025
Appendix
Table of Contents
Chapter 5: Science and Medicine
Appendix
Snel, B., Lehmann, G., Bork, P., & Huynen, M. A. (2000). STRING: A Web-Server to Retrieve and Display the Repeatedly Occurring
Neighbourhood of a Gene. Nucleic Acids Research, 28(18), 3442–44. https://doi.org/10.1093/nar/28.18.3442
Snowdon, J. L., Scheufele, E. L., Pritts, J., Le, P.-T., Mensah, G. A., Zhang, X., & Dankwa-Mullan, I. (2023). Evaluating Social
Determinants of Health Variables in Advanced Analytic and Articial Intelligence Models for Cardiovascular Disease Risk and
Outcomes: A Targeted Review. Ethnicity & Disease, 33(1), 33–43. https://doi.org/10.18865/1704
Stade, E. C., Stirman, S. W., Ungar, L. H., Boland, C. L., Schwartz, H. A., Yaden, D. B., Sedoc, J., DeRubeis, R. J., Willer, R., &
Eichstaedt, J. C. (2024). Large Language Models Could Change the Future of Behavioral Healthcare: A Proposal for Responsible
Development and Evaluation. Npj Mental Health Research, 3(1), 1–12. https://doi.org/10.1038/s44184-024-00056-z
Sudlow, C., Gallacher, J., Allen, N., Beral, V., Burton, P., Danesh, J., Downey, P., Elliott, P., Green, J., Landray, M., Liu, B., Matthews,
P., Ong, G., Pell, J., Silman, A., Young, A., Sprosen, T., Peakman, T., & Collins, R. (2015). UK Biobank: An Open Access Resource
for Identifying the Causes of a Wide Range of Complex Diseases of Middle and Old Age. PLoS Medicine, 12(3), e1001779.
https://doi.org/10.1371/journal.pmed.1001779
Tierney, A. A., Gayre, G., Hoberman, B., Mattern, B., Ballesca, M., Kipnis, P., Liu, V., & Lee, K. (2024). Ambient Articial Intelligence
Scribes to Alleviate the Burden of Clinical Documentation. NEJM Catalyst, 5(3), CAT.23.0404. https://doi.org/10.1056/
CAT.23.0404
Varadi, M., Anyango, S., Deshpande, M., Nair, S., Natassia, C., Yordanova, G., Yuan, D., Stroe, O., Wood, G., Laydon, A., Žídek, A.,
Green, T., Tunyasuvunakool, K., Petersen, S., Jumper, J., Clancy, E., Green, R., Vora, A., Lut, M., … Velankar, S. (2022). AlphaFold
Protein Structure Database: Massively Expanding the Structural Coverage of Protein-Sequence Space With High-Accuracy
Models. Nucleic Acids Research, 50(D1), D439–44. https://doi.org/10.1093/nar/gkab1061
Veitch, D. P., Weiner, M. W., Aisen, P. S., Beckett, L. A., Cairns, N. J., Green, R. C., Harvey, D., Jack, C. R., Jagust, W., Morris, J. C.,
Petersen, R. C., Saykin, A. J., Shaw, L. M., Toga, A. W., Trojanowski, J. Q., & Alzheimer’s Disease Neuroimaging Initiative. (2019).
Understanding Disease Progression and Improving Alzheimer’s Disease Clinical Trials: Recent Highlights From the Alzheimer’s
Disease Neuroimaging Initiative. Alzheimer’s & Dementia: The Journal of the Alzheimer’s Association, 15(1), 106–52. https://doi.
org/10.1016/j.jalz.2018.08.005
Vorontsov, E., Bozkurt, A., Casson, A., Shaikovski, G., Zelechowski, M., Severson, K., Zimmermann, E., Hall, J., Tenenholtz, N.,
Fusi, N., Yang, E., Mathieu, P., van Eck, A., Lee, D., Viret, J., Robert, E., Wang, Y. K., Kunz, J. D., Lee, M. C. H., … Fuchs, T. J.
(2024). A Foundation Model for Clinical-Grade Computational Pathology and Rare Cancers Detection. Nature Medicine, 30(10),
2924–35. https://doi.org/10.1038/s41591-024-03141-0
Wang, R., Fang, X., Lu, Y., & Wang, S. (2004). The PDBbind Database: Collection of Binding Anities for Protein−Ligand Complexes
With Known Three-Dimensional Structures. Journal of Medicinal Chemistry, 47(12), 2977–80. https://doi.org/10.1021/jm030580l
Wang, X., Liu, S., Tsaris, A., Choi, J.-Y., Aji, A., Fan, M., Zhang, W., Yin, J., Ashfaq, M., Lu, D., & Balaprakash, P. (2024). ORBIT: Oak
Ridge Base Foundation Model for Earth System Predictability (arXiv:2404.14712). arXiv. https://doi.org/10.48550/arXiv.2404.14712

450
Articial Intelligence
Index Report 2025
Appendix
Table of Contents
Chapter 5: Science and Medicine
Appendix
Wang, X., Yang, S., Zhang, J., Wang, M., Zhang, J., Yang, W., Huang, J., & Han, X. (2022a). Transformer-Based Unsupervised
Contrastive Learning for Histopathological Image Classication. Medical Image Analysis, 81, 102559. https://doi.org/10.1016/j.
media.2022.102559
Wang, X., Yang, S., Zhang, J., Wang, M., Zhang, J., Yang, W., Huang, J., & Han, X. (2022b). Transformer-Based Unsupervised
Contrastive Learning for Histopathological Image Classication. Medical Image Analysis, 81, 102559. https://doi.org/10.1016/j.
media.2022.102559
Wang, X., Zhao, J., Marostica, E., Yuan, W., Jin, J., Zhang, J., Li, R., Tang, H., Wang, K., Li, Y., Wang, F., Peng, Y., Zhu, J., Zhang, J.,
Jackson, C. R., Zhang, J., Dillon, D., Lin, N. U., Sholl, L., … Yu, K.-H. (2024). A Pathology Foundation Model for Cancer Diagnosis
and Prognosis Prediction. Nature, 634(8035), 970–78. https://doi.org/10.1038/s41586-024-07894-z
Wang, Y., He, J., Du, Y., Chen, X., Li, J. C., Liu, L.-P., Xu, X., & Hassoun, S. (2025). Large Language Model Is Secretly a Protein
Sequence Optimizer (arXiv:2501.09274). arXiv. https://doi.org/10.48550/arXiv.2501.09274
Xiang, J., Wang, X., Zhang, X., Xi, Y., Eweje, F., Chen, Y., Li, Y., Bergstrom, C., Gopaulchan, M., Kim, T., Yu, K.-H., Willens, S.,
Olguin, F. M., Nirschl, J. J., Neal, J., Diehn, M., Yang, S., & Li, R. (2025). A Vision–Language Foundation Model for Precision
Oncology. Nature, 638(8051), 769–78. https://doi.org/10.1038/s41586-024-08378-w
Xie, Y., Wu, J., Tu, H., Yang, S., Zhao, B., Zong, Y., Jin, Q., Xie, C., & Zhou, Y. (2024). A Preliminary Study of o1 in Medicine: Are We
Closer to an AI Doctor? (arXiv:2409.15277). arXiv. https://doi.org/10.48550/arXiv.2409.15277
Xu, H., Usuyama, N., Bagga, J., Zhang, S., Rao, R., Naumann, T., Wong, C., Gero, Z., González, J., Gu, Y., Xu, Y., Wei, M., Wang,
W., Ma, S., Wei, F., Yang, J., Li, C., Gao, J., Rosemon, J., … Poon, H. (2024). A Whole-Slide Foundation Model for Digital Pathology
From Real-World Data. Nature, 630(8015), 181–88. https://doi.org/10.1038/s41586-024-07441-w
Yang, L., Xu, S., Sellergren, A., Kohlberger, T., Zhou, Y., Ktena, I., Kiraly, A., Ahmed, F., Hormozdiari, F., Jaroensri, T., Wang, E.,
Wulczyn, E., Jamil, F., Guidroz, T., Lau, C., Qiao, S., Liu, Y., Goel, A., Park, K., … Golden, D. (2024). Advancing Multimodal Medical
Capabilities of Gemini (arXiv:2405.03162). arXiv. https://doi.org/10.48550/arXiv.2405.03162
Yang, X., Chen, A., PourNejatian, N., Shin, H. C., Smith, K. E., Parisien, C., Compas, C., Martin, C., Flores, M. G., Zhang, Y.,
Magoc, T., Harle, C. A., Lipori, G., Mitchell, D. A., Hogan, W. R., Shenkman, E. A., Bian, J., & Wu, Y. (2022). GatorTron: A Large
Clinical Language Model to Unlock Patient Information from Unstructured Electronic Health Records (arXiv:2203.03540). arXiv.
https://doi.org/10.48550/arXiv.2203.03540
Yu, B., Baker, F. N., Chen, Z., Ning, X., & Sun, H. (2024). LlaSMol: Advancing Large Language Models for Chemistry With a
Large-Scale, Comprehensive, High-Quality Instruction Tuning Dataset (arXiv:2402.09391). arXiv. https://doi.org/10.48550/
arXiv.2402.09391
Zambaldi, V., La, D., Chu, A. E., Patani, H., Danson, A. E., Kwan, T. O. C., Frerix, T., Schneider, R. G., Saxton, D., Thillaisundaram,
A., Wu, Z., Moraes, I., Lange, O., Papa, E., Stanton, G., Martin, V., Singh, S., Wong, L. H., Bates, R., … Wang, J. (2024). De Novo
Design of High-Anity Protein Binders with AlphaProteo (arXiv:2409.08022). arXiv. https://doi.org/10.48550/arXiv.2409.08022

451
Articial Intelligence
Index Report 2025
Appendix
Table of Contents
Chapter 5: Science and Medicine
Appendix
Zhao, T., Gu, Y., Yang, J., Usuyama, N., Lee, H. H., Kiblawi, S., Naumann, T., Gao, J., Crabtree, A., Abel, J., Moung-Wen, C., Piening,
B., Bifulco, C., Wei, M., Poon, H., & Wang, S. (2025). A Foundation Model for Joint Segmentation, Detection and Recognition
of Biomedical Objects Across Nine Modalities. Nature Methods, 22(1), 166–76. https://doi.org/10.1038/s41592-024-02499-w
Zhou, Y., Chia, M. A., Wagner, S. K., Ayhan, M. S., Williamson, D. J., Struyven, R. R., Liu, T., Xu, M., Lozano, M. G., Woodward-
Court, P., Kihara, Y., Altmann, A., Lee, A. Y., Topol, E. J., Denniston, A. K., Alexander, D. C., & Keane, P. A. (2023). A Foundation
Model for Generalizable Disease Detection From Retinal Images. Nature, 622(7981), 156–63. https://doi.org/10.1038/s41586-
023-06555-x

452
Articial Intelligence
Index Report 2025
Appendix
Table of Contents
Chapter 6: Policy and Governance
Acknowledgments
The AI Index would like to acknowledge Julia Betts Lotufo
and Alexandra Rome for their eorts in collecting information
on signicant AI policy events. The AI Index would also like to
acknowledge Lapo Santarlasci for leading the analysis of AI
public spending and U.S. grant-related AI spending.
Global AI Mentions
For mentions of AI in AI-related legislative proceedings
around the world, the AI Index performed searches for the
keyword “articial intelligence,” in respective languages, on
the websites of congresses or parliaments in 75 geographic
areas, usually under sections named “minutes,” “hansard,” etc.
Mentions were counted by session, so multiple mentions of
“articial intelligence” in the same legislative session counted
as one mention. The AI Index team surveyed the following
databases:
Andorra, Armenia, Australia, Azerbaijan, Barbados, Belgium,
Bermuda, Brazil, Canada, Cayman Islands, China,1 Czech
Republic, Denmark, Dominican Republic, Ecuador, El
Salvador, Estonia, Fiji, Finland, France, Germany, Gibraltar,
Greece, Hong Kong, Iceland, India, Ireland, Isle of Man,
Italy, Japan, Kenya, Kosovo, Latvia, Lesotho, Liechtenstein,
Luxembourg, Macao SAR, China, Madagascar, Malaysia,
Maldives, Malta, Mauritius, Mexico, Moldova, Netherlands,
New Zealand, Northern Mariana Islands, Norway, Pakistan,
Panama, Papua New Guinea, Philippines, Poland, Portugal,
Romania, Russia, San Marino, Seychelles, Sierra Leone,
Singapore, Slovenia, South Africa, South Korea, Spain, Sri
Lanka, Sweden, Switzerland, Tanzania, Trinidad and Tobago,
Ukraine, United Kingdom, United States, Uruguay, Zambia,
Zimbabwe
Global Legislation Records on AI
For AI-related bills passed into laws, the AI Index performed
searches for the keyword “articial intelligence,” in respective
languages and in the full text of bills, on the websites of
congresses or parliaments in 116 geographic areas. Note that
only laws passed by state-level legislative bodies and signed into
law (e.g., by presidents or received royal assent) from 2016 to
2024 are included. Laws that were approved but then repealed
are not included in the analysis. For laws where AI-related
provisions were added or amended after initial enactment,
the AI Index uses the year of inclusion rather than the original
passage year, when relevant. Future AI Index reports hope to
include analysis on other types of legal documents, such as
regulations and standards, adopted by state- or supranational-
level legislative bodies, government agencies, etc.
The AI Index team surveyed databases for the following
geographic areas:
Algeria, Andorra, Antigua and Barbuda, Argentina, Armenia,
Australia, Austria, Azerbaijan, The Bahamas, Bahrain,
Bangladesh, Barbados, Belarus, Belgium, Belize, Bermuda,
Bhutan, Bolivia, Brazil, Brunei, Bulgaria, Cameroon, Canada,
Chile, China, Croatia, Cuba, Curacao, Cyprus, Czech
Republic, Denmark, Estonia, Faroe Islands, Fiji, Finland, France,
Germany, Gibraltar, Greece, Greenland, Grenada, Guam,
Guatemala, Guyana, Hong Kong, Hungary, Iceland, India, Iraq,
Ireland, Isle of Man, Israel, Italy, Jamaica, Japan, Kazakhstan,
Kenya, Kiribati, Republic of Korea, Kosovo, Kyrgyz Republic,
Latvia, Liechtenstein, Lithuania, Luxembourg, Macao SAR
China, Malawi, Malaysia, Malta, Mauritius, Mexico, Monaco,
Montenegro, Morocco, Mozambique, Nauru, Netherlands,
New Zealand, Northern Marina Islands, Norway, Panama,
Philippines, Poland, Portugal, Romania, Russia, Samoa,
Saudi Arabia, Serbia, Seychelles, Sierra Leone, Singapore,
Chapter 6: Policy and Governance
Appendix
1 The National People’s Congress is held once per year and does not provide full legislative proceedings. Hence, the counts included in the analysis searched mentions of “articial
intelligence” in the only public document released from the congressional meetings, the Report on the Work of the Government, delivered by the premier.

453
Articial Intelligence
Index Report 2025
Appendix
Table of Contents
Slovak Republic, Slovenia, South Africa, Spain, St. Kitts and
Nevis, Suriname, Sweden, Switzerland, Tajikistan, Tanzania,
Togo, Tongo, Turkey, Tuvalu, Uganda, Ukraine, United Arab
Emirates, United Kingdom, United States, Uruguay, Vietnam,
Yemen, Zambia, Zimbabwe
US State-Level AI Legislation
For AI-related bills passed into law, the AI Index performed
searches for the keyword “articial intelligence” in the full
text of bills on the websites of all 50 U.S. states. Bills are only
counted as passed into law if the keyword appears in the nal
version of the bill, not just the introduced version. Note that
only laws passed from 2015 to 2024 are included. The count
for proposed laws includes both laws that were proposed
that were passed and laws that were proposed that have
not been passed yet, or are now inactive. The AI Index team
surveyed the following databases:
Alabama, Alaska, Arizona, Arkansas, California, Colorado,
Connecticut, Delaware, Florida, Georgia, Hawaii, Idaho,
Illinois, Indiana, Iowa, Kansas, Kentucky, Louisiana, Maine,
Maryland, Massachusetts, Michigan, Minnesota, Mississippi,
Missouri, Montana, Nebraska, Nevada, New Hampshire, New
Jersey, New Mexico, New York, North Carolina, North Dakota,
Ohio, Oklahoma, Oregon, Pennsylvania, Rhode Island, South
Carolina, South Dakota, Tennessee, Texas , Utah, Vermont,
Virginia, Washington, West Virginia, Wisconsin, Wyoming
For a more thorough review, the AI Index also included AI-
related state laws listed on the Multistate AI state legislation
tracker, even if they did not specically reference “articial
intelligence” as a keyword.
US AI Regulation
This section examines AI-related regulations enacted by
U.S. regulatory agencies from 2016 to 2024, analyzing the
total number of regulations and their originating agencies.
To compile this data, the AI Index conducted a keyword
search for “articial intelligence” on the Federal Register, a
comprehensive repository of government documents drawn
from over 436 agencies and nearly every branch of the U.S.
government.
US Committee Mentions
To research trends on the United States’ committee mentions
of AI, the following search was conducted:
Website: Congress.gov
Keyword: articial intelligence
Filters: Committee Reports
Public Investment in AI
The AI Index analyzed government AI spending across
European countries and the United States, focusing on regions
where data is more accessible. It is important to note that
this analysis may not fully represent all countries or regions,
as the availability and quality of data can vary signicantly.
Additionally, while this analysis includes data on government
contracts from various countries, it only covers grant-level
spending for the United States. This discrepancy is the result
of challenges in collecting comparable grant data from other
countries and regions, such as the European Union and China.
Nevertheless, the U.S. case illustrates that a substantial
portion of government spending on AI occurs through grants.
Coverage will expand in future iterations of the AI Index as
more data becomes available, but discrepancies and gaps
in the existing data may aect the comprehensiveness and
accuracy of the ndings.
Data Sources
For European countries, the AI Index collected public tender
data from Tenders Electronic Daily (TED) (Publications Oce
of the European Union, 2024)—the online supplement to
the ocial journal of the EU dedicated to European public
procurement. While contracts are available in various formats,
the most detailed data comes from bulk XML downloads,
which include comprehensive information on tendering
procedures, issuing entities, awarded contractors, lot values,
descriptions, award dates, and common procurement
vocabulary (CPV) codes. TED publication is governed by
EU law thresholds: Tenders above specic monetary values,
deemed of cross-border interest, must be published on
TED. However, some countries also report below-threshold
procurements, leading to variations in coverage across
countries.
Chapter 6: Policy and Governance
Appendix

454
Articial Intelligence
Index Report 2025
Appendix
Table of Contents
For the United Kingdom, data sources include TED, Find a
Tender, Contracts Finder, and Contracts Finder Archive.
Data from Scotland and Wales were accessed via the APIs
of their procurement websites, while Northern Ireland does
not oer this service, necessitating its exclusion from the
analysis and potentially leading to an underestimation of
public investments in AI for the U.K. Due to API limitations
restricting historical data access, the AI Index utilized the
Open Contracting Partnership’s data registry via Kingsher
Collect to obtain comprehensive data for Scotland and Wales.
Data for the United States was sourced from the publicly
accessible USAspending platform, an ocial repository
that facilitates bulk downloads of information related to
contract award notices and grant data. While this dataset
encompasses a longer time frame than the TED dataset, it
is important to note that data quality can vary. Additionally,
a study by the U.S. Government Accountability Oce (GAO,
2023) found that 49 agencies, including 25 in the executive
branch, did not report data to USAspending, accounting for
over $5 billion in net outlays for scal year 2022.
Data Processing
Processing TED data posed signicant challenges due to
inconsistent storage of contract descriptions, which varied
by XML tag names based on release time and procurement
type. Some les contained aggregated descriptions while
others detailed each awarded contract lot. To capture
comprehensive information, the main descriptions of each
competition call were combined with partial descriptions
when available.
The linguistic diversity in data from dierent countries
required translation of all texts into English using the deep-
translator tool and the Google Translator engine. Post-
translation, tender texts were processed using natural
language processing (NLP) techniques. These included
the removal of stop words and special characters, part-of-
speech (POS) tagging to retain key grammatical categories,
lowercase conversion, lemmatization, and replacement of
numerical measures with a <NUM> tag.
For ease of comparison, all monetary amounts were converted
to U.S. dollars and adjusted for price level dierences using
the purchasing power parities (PPP) index.
Classication
Classifying AI-related contracts and grants was achieved
using full-text search with regular expressions. An
AI dictionary was compiled by generating AI-related
expressions and incorporating “core” expressions from the
Yamashita et al. (2021) vocabulary. Additionally, a Word2Vec
model expanded the dictionary with cosine-similar terms
for each baseline expression that were manually reviewed
and included in the nal vocabulary. This process provided
keywords and co-occurrence patterns crucial for identifying
AI content.
The classication followed a multistep approach. Initially,
regular expression (regex) matching identied AI terms
within contract and grant awards. These documents were
then categorized as either “non AI-related” or “AI-related.” To
validate AI-related matches, BERTopic model and pretrained
DeBERTA transformer were employed to assess probability
scores for specic AI-related topics. Awards with relevance
scores below 20% underwent manual review, while those
with higher scores were conrmed as AI-related. To ensure
additional accuracy, all high-value tenders were also manually
reviewed.
Chapter 6: Policy and Governance
Appendix

455
Articial Intelligence
Index Report 2025
Appendix
Table of Contents
Chapter 7: Education
Chapter 7: Education
Appendix
Code.org, CSTA, ECEP Alliance
State-Level Data
Appendix 2 of the State of Computer Science Education
2024 report includes a full description of the methodology
used by Code.org, CSTA, and ECEP Alliance to collect their
data. The sta at Code.org also maintains a database of the
state of American K–12 education and, in this policy primer,
provides a greater amount of detail on the state of American
K–12 education in each state.
AP Computer Science Data
The AP Computer Science data is provided to Code.org as per
an agreement the College Board maintains with Code.org. The
AP Computer Science data comes from the College Board’s
national and state summary reports.
Access to Computer Science Education
Data on access to computer science education was drawn
from Code.org, CSTA, and ECEP Alliance’s State of Computer
Science Education 2024 report.
2024 K-12 Computer Science
Landscape Teacher Landscape
Survey
For more information or access to the dataset, please contact
membership@csteachers.org.
State Standards Comparison
CSTA and the Institute for Advancing Computing Education
(IACE) published a State Standards Comparison report in
December 2024. The dataset of approximately 10,000 state-
adopted K-12 standards is available as a spreadsheet, as well
as a Python notebook that may be useful for data analysis.
Colorado and Virginia’s standards were adopted in late 2024
and are not included in this dataset.
Global K-12 AI Education
The Raspberry Pi Computing Education Research Centre, based
in the Department of Computer Science and Technology at the
University of Cambridge, compiled this dataset, expanding on
research conducted by the Brookings Institution for its 2021
report Building Skills for Life: How to Expand and Improve
Computer Science Education Around the World. We made
one change to their dataset to clarify that CS in the United
States is available in some schools/districts and not available
everywhere as an elective course. For more information about
the methodology, please refer to their report.
IPEDS
The Integrated Postsecondary Education Data System
(IPEDS) combines annual surveys conducted by the U.S.
Department of Education’s National Center for Education
Statistics (NCES). IPEDS gathers information from every
college, university, and technical and vocational institution
that participates in federal student nancial aid programs.
Completion Data
This chapter used data from the Completions survey, which
collects data on the number of students who complete a
postsecondary education program. Graduates in AI-related
elds were identied as those whose rst major was either
Computer and Information Sciences, General (11.01); Computer
Programming (11.02); or Computer Science (11.07), according
to the Classication of Instructional Programs (CIP) codes.
The number of graduates in AI-related elds included in this
year’s report diers from previous years because the AI Index
used multiple CIP codes.
OECD
This chapter used data from the OECD Data Explorer,
specically from the table “Number of enrolled students,
graduates and new entrants by eld of education.” The
methodology for this dataset can be found in Education at a
Glance 2024 Sources, Methodologies and Technical Notes.

456
Articial Intelligence
Index Report 2025
Appendix
Table of Contents
Chapter 8: Public Opinion
Chapter 8: Public Opinion
Appendix
Ipsos
For the sake of brevity, the 2025 AI Index opted not to republish the methodology used by the Ipsos survey featured in the report.
More details about the Ipsos survey’s methodology can be found in the survey itself.


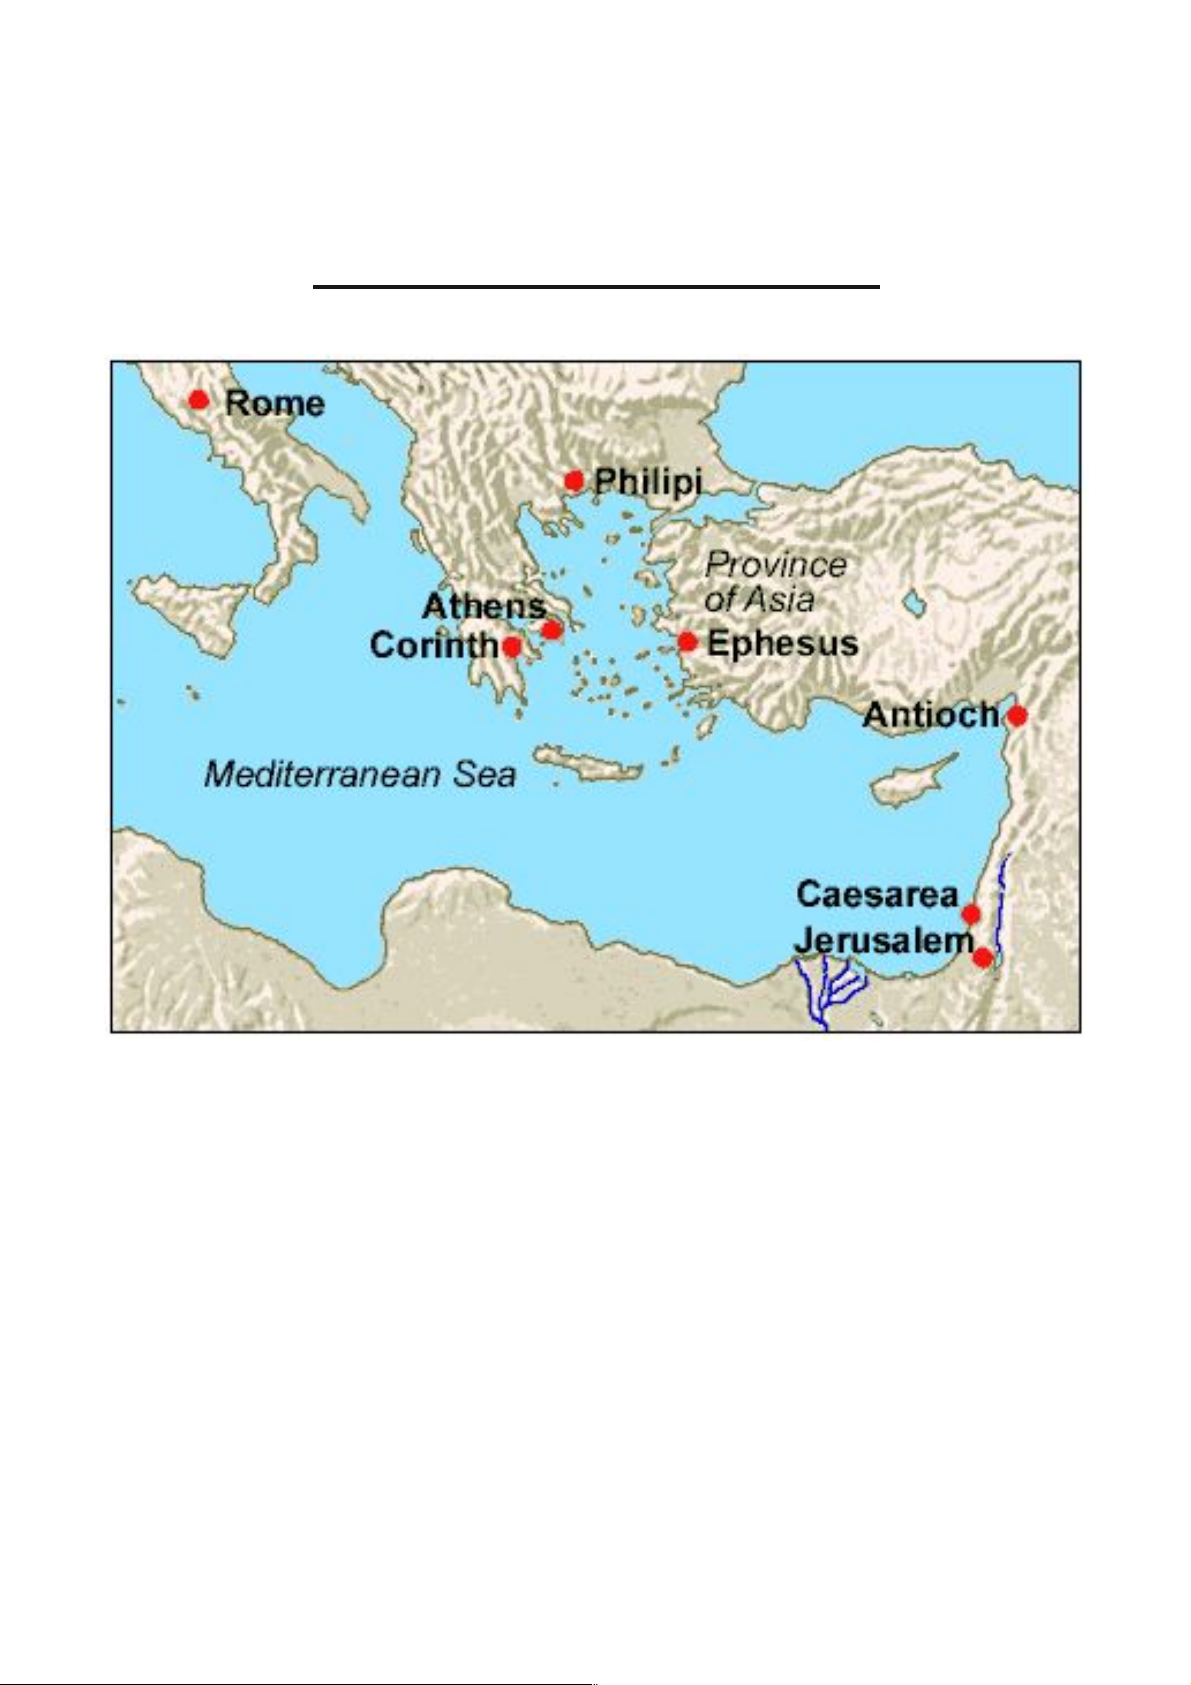

