Building a Bridge to a More Robust and Secure Solar Energy Supply Chain PDF Free Download
1 / 19/19
100%

Building a Bridge to a More Robust
and Secure Solar Energy Supply
Chain
February 2023
Solar Energy Technologies Office
So

Building a Bridge to a More Robust, Secure Solar Energy Supply Chain
ii
Authors
The authors of this report are:
Markus Beck, U.S. Department of Energy (DOE) - Solar Energy Technologies Office (SETO)
Andrew Dawson, DOE - Office of Clean Energy Demonstration (OCED)
Kyle Fricker, DOE – Office of Technology Transitions (OTT)
Daniel Inns, Boston Government Services, LLC, under contract to DOE-SETO
Acknowledgments
The authors would like to acknowledge the valuable guidance and input provided during this
report. The authors are grateful to the following list of contributors. Their feedback, guidance,
and review proved invaluable.
Contributors:
Paul Basore, DOE-SETO
Jake Higdon, Office of the Under Secretary for Science and Innovation (S4)
Becca Jones-Albertus, DOE-SETO
Alejandro Moreno, DOE - Office of Energy Efficiency and Renewable Energy (EERE)
Susanna Murley, DOE-SETO
Garrett Nilsen, DOE-SETO

Building a Bridge to a More Robust, Secure Solar Energy Supply Chain
iii
Executive Summary
To support the transition to a decarbonized power sector by 2035 and a decarbonized economy
by 2050, the U.S. Department of Energy (DOE) Solar Energy Technologies Office (SETO) has
identified potential pathways to a more sustainable, reliable, and resilient supply chain for solar
photovoltaic technologies.
A resilient and reliable supply chain is diversified, both geographically and from a technology
standpoint. It is not excessively concentrated and is financially sound and can adapt to changes in
technology and demand. This report evaluates solar supply chain deficiencies and considers the
composition, scale, and role of public and private entities in enabling a more secure energy
future.
A robust domestic solar manufacturing sector increases supply chain resilience and brings other
direct domestic benefits including job creation, economic development, acquisition and retention
of critical know-how, and simplified shipping and logistics.
SETO has identified three exemplary scenarios that can achieve a more sustainable, reliable, and
resilient supply chain for solar photovoltaic technologies:
1. Majority domestic production across all required supply chain segments for mature solar
technologies (crystalline silicon and cadmium telluride).
2. A blend of domestic sourcing with diversified imports of mature technologies, including
broader international production and collaboration for key supply segments.
3. Transition to new solar conversion technologies based on thin films and tandem
structures.
During the transition from mostly imported solar components today to a larger market in the near
future, the growing domestic manufacturing sector will likely rely on the first two scenarios. The
third, new technology option will have limited impact by 2035—although it has significant
potential to help achieve the 2050 decarbonization goals. Key considerations for each pathway
scenario include: the scale of operations for every supply chain segment, the public and private
sector support that the industry may need over time, and the relevant government policies that
can reduce barriers to success.
A reliable, resilient supply chain is essential to meeting the Administration’s decarbonization
goals. Growth of domestic manufacturing capacity is also a major opportunity to improve
national energy security and provide a growing source of family-sustaining jobs.

Building a Bridge to a More Robust, Secure Solar Energy Supply Chain
iv
About this Report
The U.S. Department of Energy (DOE) Solar Energy Technologies Office (SETO) works to
accelerate the advancement and deployment of solar technology in support of an equitable
transition to a decarbonized energy system by 2050, starting with a decarbonized power sector
by 2035. To identify the most affordable, sustainable, and accessible path to decarbonization,
SETO seeks to understand and mitigate risks and vulnerabilities that may threaten the success of
the energy transition. This report reviews the type and scale of solar supply chain disruption risk,
potential options for a domestic supply chain, and key considerations to enable a resilient and
reliable supply chain.
Table of Contents
Authors ............................................................................................................................................ ii
Acknowledgments........................................................................................................................... ii
Executive Summary ....................................................................................................................... iii
About this Report ........................................................................................................................... iv
Introduction ..................................................................................................................................... 1
Current Status of the U.S. Solar Module Supply Chain ................................................................. 2
Elements of Reliable Solar Module Supply Chains ........................................................................ 4
Geographically Diverse Supply Chains ...................................................................................... 4
Corporate Diversity and Financial Health in Supply Chains ...................................................... 6
Technological Diversity in Supply Chains ................................................................................. 6
Key Elements for Success ............................................................................................................... 7
Sufficient Scale ........................................................................................................................... 7
Diversified Support to Industry .................................................................................................. 8
Expanded, Consistent, and Coordinated Policy Support ............................................................ 9
Supply Chain Scenarios ................................................................................................................ 10
Conclusions ................................................................................................................................... 13
Appendix ....................................................................................................................................... 14

Building a Bridge to a More Robust, Secure Solar Energy Supply Chain
1
Introduction
In September 2021, SETO released the Solar Futures Study,
1
an analysis of the least-cost path to
achieve a decarbonized electrical grid by 2035 and energy system by 2050. The study showed
that these transitions are possible—without increasing energy costs to consumers—by utilizing
known technologies supported by continuing research, development, demonstration, and
commercialization (RDD&C) activities to further reduce their cost and improve performance.
However, this transition would necessitate an enormous increase in rate of deployment required
for key clean energy technologies, notably solar photovoltaics (PV).
Based on this study, the United States needs to deploy an average of 40 gigawatts direct current
(GWdc) of solar generation per year through 2025 and ramp up to 100 GWdc per year by 2030.1
By comparison, the highest domestic annual deployment on record is 24 GWdc in 2021,
2
with
most of the system components manufactured outside the country. The Solar Futures Study did
not perform a detailed supply chain analysis and assumed that hardware availability would not
limit deployment.
In February 2022, DOE’s solar PV supply chain assessment
3
mapped the global crystalline
silicon (c-Si) and cadmium telluride (CdTe) supply chains and identified significant disruption
risk, especially due to the high concentration of companies with close ties to China in the c-Si
supply chain. In addition, domestic production of solar components is far below the current
demand and could not supply the necessary components for increased deployment without
significant new investment. To decarbonize the electric grid by 2035,
4
the United States will
need a secure solar supply chain.
With the recent passage of the Inflation Reduction Act (IRA)
5
and the President’s invocation of
the Defense Production Act
6
for solar manufacturing, there are new policy tools available to
support the growth of manufacturing across the solar supply chain. Tax credits included in IRA
are also expected to increase the rate of deployment.
1
Solar Futures Study, www.energy.gov/eere/solar/solar-futures-study
2
Solar Market Insight Report 2021 Year in Review, www.seia.org/research-resources/solar-market-insight-report-
2021-year-review
3
Solar Photovoltaics: Supply Chain Deep Dive Assessment, www.energy.gov/eere/solar/solar-photovoltaics-supply-
chain-review-report
4
White House Fact Sheet, www.whitehouse.gov/briefing-room/statements-releases/2021/04/22/fact-sheet-president-
biden-sets-2030-greenhouse-gas-pollution-reduction-target-aimed-at-creating-good-paying-union-jobs-and-
securing-u-s-leadership-on-clean-energy-technologies/
5
H.R.5376 - 117th Congress (2021-2022): Inflation Reduction Act of 2022. www.congress.gov/bill/117th-
congress/house-bill/5376
6
www.energy.gov/articles/president-biden-invokes-defense-production-act-accelerate-domestic-manufacturing-
clean

Building a Bridge to a More Robust, Secure Solar Energy Supply Chain
2
This report reviews potential scenarios and associated risks and considerations to bridge the gap
toward a resilient and reliable supply chain for solar module technologies, including activities
that the RDD&C community can pursue to support these goals.
Current Status of the U.S. Solar Module Supply Chain
More than 85% of modules installed in the United States from 2018 through 2020 were
imported.
7
The majority of domestically installed solar modules are c-Si, with most of the supply
chain sourced through China as shown in Figure 1. CdTe solar modules, a thin-film technology
predominantly from a single U.S.-headquartered company, First Solar, represents the remainder
of domestic deployment.
Figure 1: Global PV manufacturing capacity by country, and NREL deployment estimates.
8
Module capacity
values include CdTe and c-Si.
For historical context, the first solid-state solar cells based on c-Si and CdTe were developed in
the United States in the 1950s, and the U.S. together with Japan dominated the early
manufacturing decades (albeit in a market less than 1% the size of today’s). The introduction of
the German renewable energy incentive scheme in 1999, and subsequent PV deployment policies
in other European countries, saw European PV manufacturing increase to over 30% by 2005, as
shown in Figure 2. At the same time, U.S. manufacturing dropped to only 10% and China
implemented incentives for solar energy to grow manufacturing and deployment. By 2015 China
7
U.S. International Trade Commission. Public Report: Crystalline Silicon Photovoltaic Cells, Whether or Not
Partially or Fully Assembled Into Other Products. December 2021. pg. V-36
8
Solar Photovoltaics: Supply Chain Deep Dive Assessment, Fig. 8. USA 2021 deployment data from NREL
Quarterly Solar Industry Update, www.energy.gov/eere/solar/quarterly-solar-industry-update
0
100
200
300
400
500
Polysilicon Ingot Wafer Cell Module 2021 2023 2035
2021 Manufacturing Capacity Annual Global Photovoltaic
Deployment
Capacity (GWdc)
Business
as Usual
USA
China
Other
Global High
Decarbonization
Scenario
USA
China
Other Business
as Usual

Building a Bridge to a More Robust, Secure Solar Energy Supply Chain
3
had overtaken Germany's 40GWdc deployed PV to be the global leader in solar energy
production, and the PV module manufacturing capacity expanded with growing local and
international demand. The capacity build in China in the module sector was supplemented with
upstream supply chain capacity expansions into cells, wafers, and polysilicon to arrive at the
2021 status as shown in Figure 1.
Figure 2: Global PV manufacturing capacity by region, and deployment estimates.
9
Module capacity values
include CdTe and c-Si.
The supply chain for c-Si PV starts with silica (silicon dioxide) that is reduced in an electric arc
furnace to metallurgical grade silicon, the feedstock to refining of high-purity polysilicon.
Polysilicon is melted to grow monocrystalline silicon ingots, which are sliced into thin silicon
wafers. Silicon wafers are processed to make solar cells, which are connected, sandwiched
between glass and glass or polymeric backsheets using a polymeric adhesive, and typically
framed with aluminum to make PV modules. The modules are mounted on racking or tracking
structures and connected to the grid using a power electronics device called an inverter.
9
Photovoltaics report, Fraunhofer ISE. www.ise.fraunhofer.de/en/publications/studies/photovoltaics-report.html
Volume data before 2010: Evolution of solar PV module cost by data source, IEA.
www.iea.org/data-and-statistics/charts/evolution-of-solar-pv-module-cost-by-data-source-1970-2020
0
20
40
60
80
100
120
140
160
180
200
0%
10%
20%
30%
40%
50%
60%
70%
80%
90%
100%
1990 1995 2000 2005 2010 2015 2020
Annual PV module production (GW)
Share of global production
Year
Asia
Europe Rest of World
North America

Building a Bridge to a More Robust, Secure Solar Energy Supply Chain
4
The supply chain for CdTe PV starts with refining cadmium, tellurium, and selenium to high-
purity compounded powders, which are then deposited directly onto a glass sheet. Another piece
of glass and polymeric adhesive and sealant are applied, and a frame might be added to finish the
module, which then can be mounted and connected to the grid in an identical fashion to c-Si
modules.
As evaluated in detail in the PV supply chain review, the domestic c-Si solar manufacturing
sector is composed primarily of established polysilicon production facilities and some c-Si
module assembly plants relying predominantly on imported components. While the current
domestic polysilicon capacity could supply 20 to 30 GWdc of c-Si products, the United States
currently lacks the ingot, wafer, and c-Si cell steps in the silicon PV supply chain. Further, many
polysilicon facilities have been mothballed, producing below capacity, and/or serving other
industries. The United States has about 5 GWdc of c-Si module assembly capacity, yet annual
production output has been below 3 GWdc.
10
As a result, PV deployment in the United States
remains dependent on imported c-Si cells and modules.
Due in part to the nature of thin-film manufacturing processes, the supply chain for CdTe
modules is more complete in the United States, but globally, production is far less than c-Si
modules. The primary producer, First Solar, has production facilities in the United States,
Malaysia, and Vietnam, with plans to expand in both India and the United States.
11
Elements of Reliable Solar Module Supply Chains
Supply chain risks for an industry can come from several issues, including excessive geographic
concentration, trade friction, a small number of companies, lack of technological diversity, and
poor financial health in one or more segments. Of these, geography, corporate diversity, and
technology are key factors in creating a robust solar module supply chain for the United States.
Geographically Diverse Supply Chains
Geographic diversity in the supply chain can mitigate risks from political activities and from
disruptions caused by natural disasters or other events that could impact shipping and logistics.
As shown in Figure 1, the global c-Si PV module supply chain is concentrated in China. The
U.S. market relies on China for polysilicon, ingots, and wafers, but cell manufacturing and
module assembly are typically located in southeast Asia. The majority of these cell and module
suppliers in southeast Asia are Chinese-headquartered companies. This poses significant supply
risk. Trade friction with China related to forced labor and unfair industrial subsidies, production
slowdowns due to COVID-19 restrictions or electricity rationing, increased competition for
10
Solar Photovoltaics: Supply Chain Deep Dive Assessment, Fig. 52. Note these values are increasing significantly
as a result of the incentives in the Inflation Reduction Act.
11
https://investor.firstsolar.com/news/press-release-details/2022/First-Solar-to-Invest-up-to-1.2-Billion-in-Scaling-
Production-of-American-Made-Responsible-Solar-by-4.4-GW/default.aspx

Building a Bridge to a More Robust, Secure Solar Energy Supply Chain
5
shipping capacity, and other factors have impacted U.S. access to PV modules and components
as a result of this concentration of the U.S. PV module supply in China and with Chinese-based
companies.
12
A geographically diverse but predominantly domestic supply chain would bring many benefits.
Domestic manufacturing can be a source of tens of thousands of direct and indirect jobs, while
ensuring adherence to environmental and labor standards and growing critical technology
expertise. Further, if a larger portion of solar module inputs are domestically produced, then the
industry would benefit from shorter shipping times and just-in-time manufacturing, which helps
minimize working capital and adds financial stability in the system. International shipping costs
and associated emissions would also be eliminated.
Another reason to increase domestic production is to mitigate international competition for
modules and ensure U.S. access to them. Over 120 nations have set carbon neutrality targets for
2050.
13
To phase out dependence on Russian natural gas, the European Union recently increased
and accelerated its cumulative PV deployment targets to 400 GWdc by 2025 and 740 GWdc by
2030. The annual global PV c-Si production capacity in 2021 was about 225 GWdc for
polysilicon and 300 GWdc for cells.
14
As the urgency and rate of solar deployment increases,
foreign competition for solar modules and other clean energy technologies will increase. This
could either increase the cost that U.S. customers must pay for modules, or limit U.S. access if
nations such as China or other major producers require domestic product to be used first for
domestic projects or favor non-U.S. markets for other reasons.
The United States has the foundations for a robust PV-grade polysilicon supply chain, with
multiple facilities in different states—Michigan, Tennessee, and Washington—which have
access to reliable and low-cost electricity. Downstream, c-Si module assembly facilities of
moderate size (i.e., up to 2 GWdc) exist now
15
in several states and expansions announced to
date
16
would nearly triple capacity from 5 to over 14 GWdc. More announcements are expected.
17
While the existing domestic capabilities constitute a good base on which to build a full PV
supply chain, the current capacity is far below the market demand. Furthermore, gaps in the
supply chain impede innovation as do large geographic separations. A series of vertically
integrated supply chain clusters in various regions would enable synergies to reduce cost and
drive innovation. First Solar operates facilities that produce close to 3 GWdc of thin-film module
capacity in Ohio. They are expanding their Ohio campus to 6 GWdc and recently announced 3.5
12
June 2022 DOE Solar Market Update. www.energy.gov/eere/solar/quarterly-solar-industry-update
13
National Public Utilities Council, https://www.motive-power.com/npuc-resource/carbon-neutral-goals-by-
country/
14
EU Solar Energy Strategy, https://eur-lex.europa.eu/legal-content/EN/TXT/?uri=COM:2022:221:FIN
15
www.jaxdailyrecord.com/article/jinkosolars-only-u-s-factory-in-growth-mode-in-west-jacksonville
16
www.georgia.org/press-release/solar-energy-giant-qcells-power-470-new-jobs-new-whitfield-county-facility
17
www.pv-magazine-usa.com/2022/08/15/nine-gigawatt-solar-manufacturing-facility-being-scouted-for-qcell-
module-manufacturing/

Building a Bridge to a More Robust, Secure Solar Energy Supply Chain
6
GWdc capacity expansions in Alabama. Coupled with their overseas manufacturing operations,
18
First Solar qualifies as a geographically diverse supplier.
Corporate Diversity and Financial Health in Supply Chains
When a few large companies dominate majority market share in any segment of the supply
chain, it creates risks of overpricing or having a huge gap in the supply chain. In contrast,
multiple entities operating at scale enables the sustainable growth in support industries, supply
chains, and the workforce. Companies in different segments of the supply chain must be
financially sound, so that the entire ecosystem can expand or contract to address shifts in market
dynamics and demand, and adopt next-generation technologies and other process improvements.
In the c-Si supply chain, there are multiple GWdc-scale companies competing vigorously in all
segments. However, while some solar cell and module companies are operating with healthy
profit margins today, some are operating at low or negative margins, and most are relying on
ingot and wafer makers that have historically operated at a loss.
19
While financing within China
is available for these low- and negative-margin businesses, there is some longer-term risk around
their financial stability. Within the United States, the largest single module producer is First
Solar, which is not reliant on the silicon supply chain and historically has had positive profit
margins. However, as First Solar represents over 90% of the global CdTe module supply, there is
corporate concentration which entails supply chain risk.
As discussed in the prior section, the United States has the makings of strong c-Si module
assembly and polysilicon segments with companies independently operating at GW scale. As the
supply chain expands into the ingot, wafer, and cell segments, a similar model would be optimal.
The objective of a robust supply chain must be for multiple companies to establish operations to
mitigate risk and strengthen the supporting network of suppliers and customers.
Technological Diversity in Supply Chains
An industry that is technically diversified can better avoid technology development risks and
roadblocks that could limit the competitiveness of products and solutions in future decades.
Differentiated technologies in the PV module supply chain can stem from different PV materials,
such as c-Si, thin-film CdTe, and potentially emerging technologies like perovskites; while
within the silicon supply chain, it could mean different ingot and wafer types, different wafering
techniques and cell structures or module architectures, and new application areas. Globally,
multiple new technology efforts are being pursued across the ingot, wafer, and cell segments.
The future PV industry could look more technologically diverse than it has over the last decade,
which was dominated by aluminum-alloyed p-type silicon cells. Encouraging this variety is a
18
www.firstsolar.com/About-Us/Locations
19
NREL spring report: www.nrel.gov/docs/fy22osti/82854.pdf

Building a Bridge to a More Robust, Secure Solar Energy Supply Chain
7
good hedge against the possible limits or failure of any single technology and limits the need for
a whole industry to adapt to disruptions.
Thin-film CdTe technology is the most mature material alternative to silicon. The combined
current annual CdTe production capacity is less than 11 GWdc and the total capacity that the
CdTe industry can reach is constrained. The primary limit is tellurium supply, which may cap
annual production capacity to about 20 GWdc.
20
If CdTe capacity could expand to 20 GWdc per
year by 2030, and if it exclusively served the U.S. market, it would be an important market
player but still represent only 20% of the 100 GWdc of yearly deployment the United States
requires to achieve its decarbonization goals. In this decade at least, c-Si technologies will
constitute the majority of U.S. deployment.
Amorphous silicon and CIGS thin-film solar cell technologies had measurable market share in
prior decades, but ultimately failed to compete with the improving cost and performance of c-Si
and CdTe. Similarly, while multicrystalline Si dominated the PV market for about a decade, the
past decade saw a shift to monocrystalline Si. These developments demonstrate the need for
multiple supply chains and technologies to ensure the industry can respond to such changes, even
if single entities or technology types fail.
There are emerging technology alternatives to c-Si and CdTe PV technologies. If one of the
emerging technologies were to enter the market, grow to multi-GW scale, and quickly establish
bankability, it could potentially play a role in diversifying the established supply chain.
However, it takes many years of deployment for markets to deem new technologies bankable.
Given the capital at risk for installing systems at GW scale using new and unproven PV
technologies, it will most likely take close to a decade before any new technology can compete
with today’s proven c-Si and CdTe modules. A new technology like a tandem module concept or
perovskite cell could add diversity to the supply chain in the following decades, and the supply
chain must be able to adapt when these technological changes occur.
Key Elements for Success
Other key elements that reduce risk and improve long-term outcomes for supply chains are:
sufficient scale, continued RDD&C, and expanded and consistent policy support. The solar PV
supply chain deep dive
21
contains a more detailed assessment of policy elements.
Sufficient Scale
Factories in the c-Si and CdTe supply chain segments become more cost competitive as annual
production capacity increases. For ingot, wafer, and cell manufacturing, the threshold of
economic viability today appears to be about 2-5 GWdc annual capacity per factory, with
20
Solar Photovoltaics: Supply Chain Deep Dive Assessment: estimates 20 GWdc annual capacity based on scale of
copper mining
21
Solar Photovoltaics: Supply Chain Deep Dive Assessment, Chapter 3

Building a Bridge to a More Robust, Secure Solar Energy Supply Chain
8
additional competitiveness as scale increases further. For polysilicon production, more than 10
GWdc yearly capacity is required. These factory sizes enable economies of scale with equipment
and component suppliers and allow companies to streamline operations for more complete plant
optimization. Vertical integration across key segments of the PV manufacturing supply chain
further enhances competitiveness. There is enough demand in the United States for multiple
entities operating several large manufacturing plants across all segments.
To ensure robustness and economic viability, overall supply chain scale is also key. Roughly 20
GWdc annual production across all segments of the c-Si supply chain would be needed to enable
multiple entities per supply chain segment to be economically viable. To fully support domestic
market needs when coupled with CdTe production, the sector would then need to grow 2-3 times
by 2030. This would address two critical aspects of scale: facility size and industry competition.
Diversified Support to Industry
Rapid innovation has been central to the solar industry over the past two decades, driving
substantial cost reductions and accelerating deployment. For the United States to reduce the
supply chain risk and achieve its decarbonization goals, strong partnership between public and
private sector funding will continue to be necessary. The needs for partnership span from R&D
for next generation technologies, to manufacturing process and equipment development, to
assistance in facility siting to workforce development. In addition, partnerships between
government and the private sector can facilitate prioritization of diversity, equity, inclusion, and
environmental justice considerations.
SETO’s applied RDD&C funding works to advance new technologies and accelerate their move
to market by strengthening innovative concepts; supporting partnerships with laboratories,
facilities, and experts; and providing resources for technology validation. The office’s funding
programs seek to reduce the barriers to entry for small businesses and enable new technologies to
enter the market and make meaningful impacts. This fosters technical maturation and the
transition of solutions from academic and laboratory R&D programs to industry.
Achieving an initial 30 GWdc per year scale (i.e., 10 GWdc CdTe and the 20 GWdc c-Si needed
for adequate scale) will require a substantial influx of capital to the sector—between $4 billion
and $8 billion (see Appendix). The DOE Loan Programs Office has supported innovative
technologies with $30 billion over the last 10 years and could assist solar manufacturing
companies through debt financing. If appropriated by Congress, Defense Production Act funding
could be another source of capital. Various grants and tax credits in the Infrastructure Investment
and Jobs Act
22
and Inflation Reduction Act may also support facility builds, upgrades, and
operation.
22
Also known as the Bipartisan Infrastructure Law

Building a Bridge to a More Robust, Secure Solar Energy Supply Chain
9
Establishing a sustainable domestic and/or diversified supply chain is a complex, challenging
process, and regular coordination among public and private sector actors will be essential to
effect support of continued innovation across technologies. A portfolio approach will help ensure
immediate robustness and sustained viability.
Expanded, Consistent, and Coordinated Policy Support
Consistent policy support is also critical to manufacturing competitiveness and growth. There are
multiple types of policies that can support domestic solar manufacturing and coordination
between multiple federal, state, and industry actors will be critical.
• Manufacturing Production Support: Tax credits tied to production volumes of
different supply chain segments can directly offset higher costs of manufacturing in the
U.S. until domestic producers reach sustainable scale.
• Capital Expense and Factory Support: Considering that the average selling price of
modules and their components on the market today is very close to the manufacturing
cost
23
, an expected low return on investment in the PV supply chain will dampen private
sector investment.
24
The high initial investment volume combined with time to build and
ramp up production capacity for upstream materials, components, and modules (shown in
the Appendix) makes cost of capital a critical hurdle. Removing this barrier by providing
sufficient and rapidly deployable capital in the form of grants, loans or tax credits would
encourage private-sector investment in domestic manufacturing, as the industry would be
more competitive in a global marketplace.
• Safeguard Tariffs and/or Anti-Dumping/Countervailing Duties: Trade policy can
improve the domestic competitiveness of specific segments of the supply chain by
increasing the cost of competing imports. However, this can create higher costs for
deployment.
• Policies supporting consistent and growing deployment: Policies such as the federal
renewable electricity investment tax credit
25
can increase domestic demand, forming a
strong and growing customer base for the local manufacturing sector. This will support
greater utilization of any newly built supply chain capacity. As deployment increases in
future decades, the supply chain can expand from the established base and take full
advantage of the growing scale: to improve costs, increase geographic and corporate
diversity, and therefore minimize risk for future investment across the supply chain.
23
www.nrel.gov/solar/market-research-analysis/solar-manufacturing-cost.html
24
Solar Photovoltaic (PV) Manufacturing Expansions in the United States, 2017–2019: Motives, Challenges,
Opportunities, and Policy Context www.nrel.gov/docs/fy21osti/74807.pdf
25
Homeowner’s Guide to the Federal Tax Credit for Solar Photovoltaics, www.energy.gov/eere/solar/homeowners-
guide-federal-tax-credit-solar-photovoltaics

Building a Bridge to a More Robust, Secure Solar Energy Supply Chain
10
• Domestic and local content requirements: Tax credits for solar deployment or state or
federal procurements can be contingent on (or increased by) domestic content. This
would generate additional demand for domestic products and act as an incentive for a
local supply chain.
Policy uncertainty has a critical impact on domestic manufacturing. Because of the large capital
expenditures for factories and associated return on investment periods of up to 15 years, the
potential for changes in the specific values, durations, or existence of incentives can alter the
viability of the project. There is also a lag time of 1 to 4 years between manufacturing support
policies and the increased manufacturing capacity due to required time for siting, securing
financing, construction, and commissioning of new facilities.
Supply Chain Scenarios
Reducing the U.S. solar industry’s reliance on a concentrated foreign supply chain and
improving domestic competitiveness would help to manage the risks associated with the current
PV module supply chain. Three supply chain scenarios that could achieve these goals include:
1. Majority domestic with mature technologies. This scenario would focus on domestic
production in all key segments of the module supply chain for both existing commercial
technologies (c-Si and CdTe). It requires sufficiently large capacities at each production
segment—polysilicon, ingots, wafers, cells, solar glass, encapsulants, and module
assembly for c-Si —to make most of the modules needed to meet deployment targets.
The domestic industry would need to produce modules at globally competitive prices to
incentivize domestic consumption and maintain supply chain viability.
26
Establishing a
full c-Si supply chain with several entities across all segments would take 2-3 years as
outlined in the Appendix. Sufficient initial scale for competitiveness of the silicon supply
chain would be approximately 20 GWdc in annual capacity. With the additional
announced and existing CdTe capacity of 10 GWdc, the overall U.S. solar manufacturing
capacity would be 30 GWdc. From this base the supply chain would need to grow rapidly
to match anticipated growth in market demand. Given the lack of domestic
manufacturing expertise in key segments of the c-Si supply chain, the U.S. would initially
depend on technology transfer—predominantly for equipment, process, and operational
execution. Once approximately 20 GWdc capacity exists, the future build-out can leverage
technological improvements (e.g., direct or kerfless wafering, higher equipment
throughput, thinner wafers etc.) to assure sustainable operations.
2. Diverse, international supply chain. In this case, domestic manufacturing is
supplemented by an international supply chain located in friendly countries. The U.S.
would rely on imports from reliable trade partners in some or all supply chain segments
26
Currently it is about 30% more expensive to produce c-Si modules domestically, but the manufacturing
production tax credits that are part of the Inflation Reduction Act provide incentives to offset the price difference.

Building a Bridge to a More Robust, Secure Solar Energy Supply Chain
11
to meet the full domestic demand. This is modeled as half of manufacturing capacity
having domestic sources and half coming from imports. Given that timelines for building
new capacity can be shorter in other countries, this may be faster to realize than building
all capacity in the U.S.
3. Long-term transition to new technologies. This scenario considers the possibility of
novel PV technologies that would augment, diversify, or replace mature technologies,
reducing the need to expand the incumbent supply chains. Besides the ability to compete
on energy conversion efficiency and long-term durability, these new technologies will
need to demonstrate lower production cost and lower capital intensity to outcompete
incumbent technologies for further PV manufacturing capacity expansions. Given the
investment volume, time to de-risk a new technology, and lack of immediate availability,
this scenario has potential for significant impact only after 2030.
Significant resources will need to be deployed to enable the scenarios outlined above—
examples are shown in Figure 2 using domestic cost structures (Appendix). A 100 GWdc per year
wholly domestic supply chain would create more than 100,000 new manufacturing jobs and
would require over $40 billion investment to build out that capacity. Training and educating such
a large workforce would require additional dedicated resources.
Scenario 2 assumes that reliable international partners provide the equivalent of 50% of the U.S.
deployment needs, while 50 GWdc per year are produced domestically. Considering the existing
20 GWdc polysilicon capacity, and Si and CdTe module capacity in place and announced
27
to be
in place by 2025, this is a much smaller domestic expansion than Scenario 1. Consequently, the
number of manufacturing jobs created, and capital resources required, are dramatically reduced.
Scenario 3 requires new technologies, for example perovskites, to be developed and scaled that
have cost structures similar to current GW-scale CdTe,
28
which require lower capital and labor
intensity than c-Si.
29
Given the uncertainty and approximately decade required to demonstrate
bankability this scenario is not relevant to address the 2035 goals.
27
https://investor.firstsolar.com/news/press-release-details/2022/First-Solar-to-Invest-up-to-1.2-Billion-in-Scaling-
Production-of-American-Made-Responsible-Solar-by-4.4-GW/default.aspx
28
$206 M / GW investment announced for CdTe: https://investor.firstsolar.com/news/press-release-
details/2021/First-Solar-Breaks-Ground-on-new-680m-3.3-GW-Ohio-Manufacturing-Facility/default.aspx
29
$175-200 M / GW investment required for large Perovskites factory > 0.5 GW in theory. I.Matthews et. al. (2020)
“Economically sustainable growth of perovskite photovoltaics manufacturing”. Joule, 4(4), pp. 822

Building a Bridge to a More Robust, Secure Solar Energy Supply Chain
12
Figure 3: Manufacturing job creation and investment required for different example PV module supply chains.
Scenario 1: 100 GWdc annual domestic module manufacturing by expanding CdTe and growing a complete c-
Si supply chain.
Scenario 2: Domestic production of 50 GWdc/year c-Si and CdTe, and reliance on imports for remaining
50 GWdc.
Scenario 3: 100 GWdc/year of domestic production using potential low-cost, less labor-intensive new
technologies if they emerge as viable alternatives.
This evaluation has focused primarily on PV module production. However, power electronics
(e.g., inverters, optimizers, rapid shut-down devices), other electronic balance of systems
components (e.g., cabling, sensors, drives, etc.), and structural balance of systems components
(e.g., racking, trackers) must be considered for all scenarios, where they could be leveraged to
improve overall national position within the complete solar manufacturing ecosystem.
Note the scenarios are examples only, and the table in the Appendix shows a range of investment
and time required to put domestic capacity in place. The detailed values depend on various
factors such as equipment availability and cost, degree of automation, geographic location,
greenfield vs. brownfield expansion options using pre-existing facilities, permitting,
material/consumable suppliers, and infrastructure like railways and roads already in place.
These scenarios have differing levels of relevance to 2035 and 2050 targets. Perovskite and
tandem technologies could enable Scenario 3, but even under the most aggressive predictions
they will not be in the market at scale for years.
30
Thus, Scenario 3 is not likely to be the best
option to support the 2035 decarbonization goals but may significantly supplement capacity by
30
The Path to Perovskite Commercialization: A Perspective from the United States Solar Energy Technologies
Office. ACS Energy Lett. 2022, 7, 5, 1728–1734, https://pubs.acs.org/doi/10.1021/acsenergylett.2c00698
0
50
100
150
Scenario 1 Scenario 2 Scenario 3
100GW domestic modules;
Traditional technology
50GW domestic modules;
Remainder imported
100GW domestic modules;
Emerging technology
2030 decarbonization goal 2050 decabonization goal
Manufacturing Jobs (Thousands)
Investment Needed (Billions)

Building a Bridge to a More Robust, Secure Solar Energy Supply Chain
13
2050. Both c-Si and CdTe represent proven, bankable technologies and Table 1 provides a
relative rating of Scenario 1 and 2 versus the status quo (December 2022).
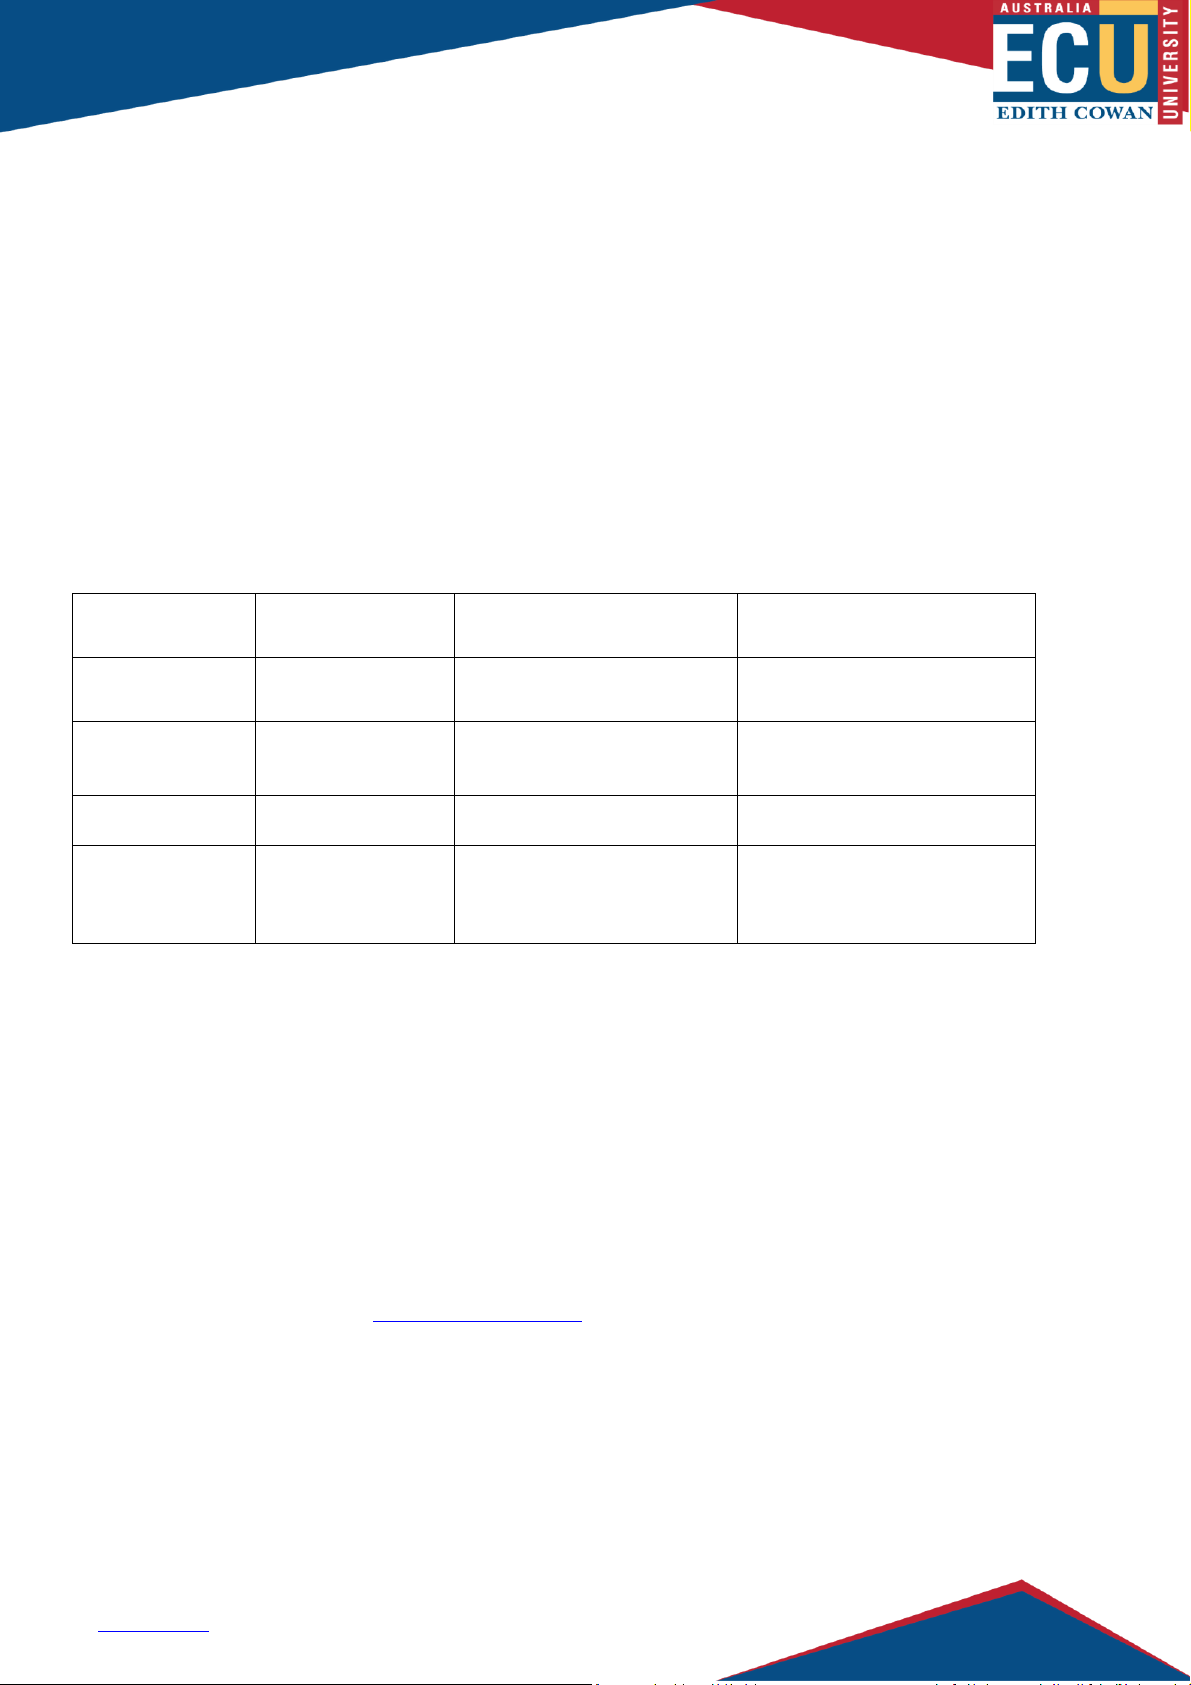
Table 1: Qualitative rating of key aspects associated with the first two scenarios
Time to
Scale
Capital
Expenditure
Job
Creation
Viability
Leveraging
Knowledge
Transfer
Supply
Chain
Diversity
Policy
Uncertainty
Scenario 1
Scenario 2
Status Quo
Conclusions
Solar PV is a key enabling technology and a major commercial opportunity for the electricity
and energy system decarbonization and energy security of the United States. However, reaching
decarbonization goals requires a resilient and reliable supply chain for solar equipment. Today a
major gap exists between required U.S. deployment rates and the manufacturing production
capacity that the United States directly controls or upon which the nation can rely.
To manage this risk, the United States must quickly diversify solar supply chains and improve
our domestic position. To be successful, a domestic sector with a minimum of 30 GWdc annual
production for most if not all components of the supply chain is likely needed within 2-3 years,
with as much as 100 GWdc needed by 2030. The RDD&C community and federal government
will need to take a diversified approach to balance near- and long-term risks as well as providing
agile support tailored to industry sector and technology needs. Well-aligned policies could have a
strong positive impact, but policy uncertainty will delay or prevent the investment in, and growth
of a domestic manufacturing sector. If successful, job growth would be substantial and multiple
domestic industries outside of solar energy technologies would benefit, including semiconductor
manufacturing and downstream industries such as electric vehicles and energy storage, further
improving national security, competitiveness, and employment.
It is critical to act quickly—the 2035 decarbonization goals are aggressive yet achievable and
affordable with today’s proven solar technologies. Expansion takes time and execution will be
risky and imperfect, but failure to act could severely limit the nation’s ability to ensure climate
and energy security.

Building a Bridge to a More Robust, Secure Solar Energy Supply Chain
14
Appendix
Investment volume and time to capacity associated with building each key PV supply chain
segment for present c-Si and CdTe technologies in the United States.
Investment
Required per
Gigawatt
(GW) in
Millions
Time to
Build
Capacity
Annual Plant
Capacity
Investment for
Minimal Viable
Sector in Millions
20 GW c-Si and
10GW CdTe in 1-3
Years
Investment for
Healthy Sector in
Millions
~3X the Minimum
~50 GW Total
Crystalline
Silicon (c-Si)
Polysilicon
$250-300
3-4
years (y)
15,000-40,000
Metric Tons (MT)
$031
$6,250-7,00032
Ingot &
Wafer
$80-100
1-2 y
>2-5 GW/each
$1,200-2,000
$4,000-5,000
Cell
$50-130
1-2 y
>2-5 GW/each
$750-2,600
$2,500-6,500
Module
$50-80
9-15
months
1-20 GW/each
$750-1,600
$2,500-4,000
Total
$2,700-6,20033
$15,250-22,50034
Cadmium
Telluride
(CdTe)
$200-27035
1 y
2-10 GW/each
$900-1,100
Module
Components
Solar
Glass
$25-3536
12-18
months
4-6 GW/each
$375-700
$1,250-1,750
31
70,000-75,000 MT existing capacity (~26-28 GW @ 2.7g/W). Note: Solar Photovoltaics: Supply Chain Deep
Dive Assessment, www.energy.gov/eere/solar/solar-photovoltaics-supply-chain-review-report states 76,500 MT
total across plants sized 1,500-35,000 MT which includes semiconductor grade silicon capacity.
32
additional 5-20 GW
33
All in capital expenditures, not including module components or balance of system (BOS) components.
34
Cumulative all in capital expenditures, not including module components or BOS
35
Lower bound represents brownfield expansions: https://investor.firstsolar.com/news/press-release-
details/2021/First-Solar-Breaks-Ground-on-new-680m-3.3-GW-Ohio-Manufacturing-Facility/default.aspx
Greenfield costs more: https://investor.firstsolar.com/news/press-release-details/2022/First-Solar-to-Invest-up-to-
1.2-Billion-in-Scaling-Production-of-American-Made-Responsible-Solar-by-4.4-GW/default.aspx
36
Estimate from U.S. glass industry, depending on thickness and processing like tempering. Note that supply chain
report quotes $150M / 2 GW

For more information, visit:
energy.gov/eere/solar
DOE/EE-2665 ▪ February 2023