Energy Efficiency in California's Public Power Sector PDF Free Download
1 / 300/300
100%

19
TH
EDITION ‒ 2025
Energy Efficiency
IN CALIFORNIA’S PUBLIC POWER SECTOR

Energy Efficiency in California’s Public Power Sector — 2025
T
ABLE OF
C
ONTENTS
Acknowledgements……………………………………………………………………………………………………………….1
Executive Summary……………………………………………………………………………………………………………….2
Introduction………………………………………………………………………………….…………………………..………….3
Program Results…………………………………………………………………………………………………………………….4
Resources and Tools…………………………………………………………………………………………………………….11
Sources of Funding………………………………………………………………………………………………………….……13
Appendix A – Publicly Owned Utility Narratives…………………………………………………………….…..A–1
Appendix B – Calculation Reference…………………………………………………………………………………..B–1

Energy Efficiency in California’s Public Power Sector — 2025 1
A
CKNOWLEDGMENTS
This report would not be possible without the substantial contributions of the following individuals:
Project Managers: Derek Dolfie, California Municipal Utilities Association (CMUA)
Emily Lemei, Northern California Power Agency (NCPA)
Brandon Czworniak, Southern California Public Power Authority (SCPPA)
Heather Heinbaugh
Alameda Municipal Power
Brian Zimmerman
Anaheim Public Utilities
Paul Reid and Liza Sagun
Azusa Light & Water
Amber Rockwell
City of Banning
Carrie Pahua
City of Biggs
Drew Kidd
Burbank Water & Power
Jessica Sutorus and Adrianne Rogers
City of Colton
Aneta Badalian and Ruzan Soloyan
Glendale Water & Power
Hugo Valdez and Sabrina Barber
Imperial Irrigation District
Terra Sampson
City of Healdsburg
Theresa Phillips
Lassen Municipal Utility District
Astrida Trupovnieks
City of Lodi
Steven Valle
City of Lompoc
Armen Saiyan, Damon Turney, Melanie Kwong, and
Luke Sun
Los Angeles Department of Water & Power
Queta Maldonado, Marisol Vidauri-Sandoval, and
Chelsea Moniz
Merced Irrigation District
Esmeralda Alvarez, Kathleen Fossan, and Samantha
Perea
Modesto Irrigation District
Tanya Dunlap
City of Moreno Valley
Tim Scott
City of Palo Alto Utilities
Gordon Algermissen
Pasadena Water & Power
Vanessa Xie
City of Pittsburg
Emily Compton
Plumas-Sierra Rural Electric Cooperative
Trina Valdez and Deborah Allen
City of Rancho Cucamonga
Sarah Brookins and Kamryn Hutson
City of Redding Electric Utility
Kirsten Rosales
Riverside Public Utilities
Rachel Marmorstein
Roseville Electric
Jamie Arbizo
Sacramento Municipal Utility District
Daniel Young, James Hendry, and Bigit Kundu
San Francisco Public Utilities Commission
James Takehara
City of Shasta Lake
Mary Medeiros McEnroe
Silicon Valley Power
Steve Keates
Truckee Donner Public Utilities District
Monique Hampton, Willie Manuel, Christian Poley,
and Cory Sobotta
Turlock Irrigation District
Jonathan Sun and Anthony Serrano
Vernon Public Utilities
Len Viejo
ASTRUM Utility Services
Miranda Boutelle and Paul Rich
Efficiency Services Group

Energy Efficiency in California’s Public Power Sector — 2025 2
E
XECUTIVE
S
UMMARY
California’s Publicly Owned Utilities (POUs) continue to collaborate to develop cost-effective
Energy Efficiency (EE) programs and report annual results to their customers and the California
Energy Commission (Energy Commission) in a consistent and comprehensive manner. This 19th
edition report presents the latest results from POUs’ wide range of EE programs.
During the Fiscal Year (FY) 2024 reporting cycle, POUs expended over $211 million on EE
programs for their communities, including low-income customers, resulting in over 304
Gigawatt hours (GWh) of net annual energy savings and reducing peak demand by more than
61 Megawatts (MW). Since the enactment of Senate Bill (SB) 1037 (Kehoe, 2005), public power
has spent over $3.113 billion on EE and demand reduction, achieving over 3,588 GWh in net
lifecycle energy savings.
California’s POUs are exploring new methods to reduce energy use and Greenhouse Gas (GHG)
emissions in a cost-effective manner. As indicated in the utility narratives, many POUs have
expanded their electrification and GHG gas reduction efforts, focusing on clean energy
solutions that may demonstrate greater cost-effectiveness than remaining EE opportunities.
Appendix A contains additional information on each POU’s portfolio, including program
descriptions, expenditures, and energy savings. Appendix B presents a comprehensive outline
of the calculations used within the Cost Effectiveness Tool (CET) Reporting Platform (RP)
(CET/RP).

Energy Efficiency in California’s Public Power Sector — 2025 3
I
NTRODUCTION
Pursuant to the Public Utilities Code, each year POUs are required to report the following
information to customers and the Energy Commission :
1
• Investments in EE and demand reduction programs.
• Descriptions of each EE and demand reduction program, program expenditures, cost-
effectiveness of each program, and expected and actual EE savings and demand
reduction results.
• Sources for funding of EE and demand reduction programs.
• Methodologies and input assumptions that are used to determine cost-effectiveness of
programs.
• A comparison of the POUs’ annual EE targets and the POUs’ reported electricity
efficiency savings and demand reductions.
This collaborative report compiles the required data from the individual POUs into a
comprehensive document in compliance with the California Public Utilities Code.
The State’s POUs supply approximately one-quarter of California’s electricity to a broad range
of communities with widely differing climates, customer bases, and economic conditions. This
compilation is presented to foster analyses of broader EE trends and offer policymakers data-
driven considerations regarding the practical impacts of related policies.
The POUs have long supported California’s EE policies and administered programs to provide
financial incentives and rebates to POU customers for investments in a variety of energy-saving
measures. The purpose of this report is to reflect on the successes and challenges of the past
year, while looking ahead to guide discussions on how to achieve further energy savings in the
future.
“
“Energy effi ci ency is the founda tion of deep
decarbonization and is one of the bes t -established and
most-impl emen ted exampl es of a distribu ted, zero -
carbon resource.”
Energy Efficiency I mp act Repo rt
2
1
California Public Utilities Code (Cal. Pub. Util. Code) § 9505.
2
https://energyefficiencyimpact.org/

Energy Efficiency in California’s Public Power Sector — 2025 4
P
ROGRAM
R
ESULTS
This section provides an overview of the EE program results for public power in California
during FY 2024. Most POUs manage and implement EE programs on a fiscal year basis; for POUs
that operate on a calendar year basis, their respective report results for FY 2024 are equal to
that of Calendar Year 2024.
3
In summary, during the 2024 reporting cycle, POUs collectively spent over $211 million on EE
programs, resulting in more than 304 GWh of net annual energy savings, with 3,589 GWh of net
lifecycle energy savings and reduced peak demand by over 61,582 kilowatts (kW).
TABLE 1: Historic Program Results
Fiscal Year
Net Peak
Savings
(kW)
Net Annual
Savings (MWh)
Net Lifecycle
Savings
(MWh)
Total Utility
Expenditures
2006
52,552
169,303
2,249,214
$54,412,728
2007
56,772
254,332
3,062,361
$63,151,647
2008
82,730
401,919
4,473,801
$103,907,266
2009
117,435
644,260
6,749,912
$146,093,107
2010
93,712
522,929
5,586,299
$123,433,250
2011
81,121
459,459
4,604,364
$132,372,795
2012
82,561
439,710
4,638,521
$126,936,631
2013
89,305
521,478
5,722,100
$134,475,230
2014
110,437
568,980
6,414,228
$169,940,735
2015
124,807
644,703
7,836,316
$162,896,993
2016
107,925
771,592
10,253,633
$154,796,668
2017
113,549
861,942
11,991,602
$226,386,251
2018
129,244
638,656
8,267,536
$218,730,235
2019
147,405
646,281
7,312,304
$260,675,319
2020
126,522
475,631
5,221,787
$261,918,171
2021
81,596
254,310
2,850,853
$158,527,378
2022
70,858
361,940
4,265,855
$223,075,217
2023
87,510
355,286
4,114,639
$180,313,119
2024
61,582
304,555
3,588,787
$211,236,782
Total
1,817,623
9,297,266
109,204,122
$3,113,279,522
3
POU fiscal years run from July 1 to June 30, except for the following POUs who operate on a calendar year
basis: Imperial Irrigation District, Merced Irrigation District, Modesto Irrigation District, Plumas-Sierra Rural
Electric Co-op, Sacramento Municipal Utility District, Truckee Donner Public Utility District, and Turlock
Irrigation District.

Energy Efficiency in California’s Public Power Sector — 2025 5
As shown in Table 1, public power has collectively spent over $3.113 billion on EE programs,
resulting in 109,204 GWh in net lifecycle energy savings since 2006 and avoided the
development of 1,817 MW of generation resources to serve peak demand during that time.
Table 1 also shows that Net Annual Savings continue to be below that realized prior to 2020,
indicating that there has been a significant shift in the energy efficiency savings available for
utility programs.
This year’s report has been updated to more accurately account for energy savings from
electrification measures. To calculate the savings for electrification measures with fuel
substitution, positive therm savings are converted to an equivalent kWh and combined with the
negative kWh savings, resulting in a net equivalent kWh savings. Savings for electrification
measures are included in the energy efficiency totals in Tables 1-10.
California’s POUs continue to support the statewide goal of doubling EE by 2030 under the
Energy Commission’s direction. Using the Energy Commission’s methodology to determine
cumulative energy savings, POUs’ cumulative first-year savings from FY 2015 through FY 2024
equals 4,953 GWh, as presented in Table 2 below. The POUs’ energy efficiency results are
influenced by a number of factors, including the lingering effects of the Covid-19 pandemic,
which continues to impact both program delivery and participation rates. Additionally, the
market for easily implemented energy-saving measures is approaching saturation, which is
limiting potential savings from many traditional EE programs. Compounding these challenges
are ongoing budget constraints and limitations in workforce capacity, which further constrain
the scope of EE initiatives.
TABLE 2. California POU Cumulative 1st Year Energy Savings Comparison
Table 3, shown on the next page, provides a comprehensive summary of the EE savings for all
POUs’ respective EE Portfolios in FY 2024. The 16 largest utilities subject to Integrated Resource
Plan (IRP) requirements account for the majority of savings within the public power community.
As in past years, the two largest POUs, Los Angeles Department of Water & Power (LADWP) and
Sacramento Municipal Utility District (SMUD), accounted for 61% of the total POU savings
during the 2024 reporting cycle. Taken as a group, the 16 IRP POUs produced 96% of the total
savings. The remainder of the savings were realized by 25 smaller POUs located throughout
California.
2015 2016 2017 2018 2019 2020 2021 2022 2023
2024
644.7
771.6 861.9 638.7 646.3 475.6 254.3 361.9 355.3 304.6 4,953 5,826
Net 1st Year Savings per Installation Year (GWh)
Cumulative
Savings
CEC Cumulative
Savings Target

Energy Efficiency in California’s Public Power Sector — 2025 6
TABLE 3. EE Program Results by Utility

Energy Efficiency in California’s Public Power Sector — 2025 7
Table 4 breaks down the statewide results by end-use. While lighting programs once again account for the largest share (32%) of the
gross annual EE program savings, total savings from lighting programs continue to trend downwards.
TABLE 4. EE Program Results by End-Use Category

Energy Efficiency in California’s Public Power Sector — 2025 8
Table 5 presents the statewide EE program results by sector. In 2024, the Commercial and Industrial (C&I) sectors account for
approximately half of California POUs’ annual energy savings (50%); the overall percentage of C&I savings has been trending down
over the past three years. In comparison, the proportion of EE savings from residential programs has increased, resulting in 45% of
the gross annual EE program savings.
TABLE 5. EE Program Results by Sector
Table 6, on the next page, presents the statewide EE program results by building type.

Energy Efficiency in California’s Public Power Sector — 2025 9
TABLE 6. EE Program Results by Building Type

Energy Efficiency in California’s Public Power Sector — 2025 10
Table 7 compares the actual savings in 2024 to the POUs’ adopted annual targets for each
utility. In total, the actual energy savings were approximately 35% below the forecasted targets
for 2024. Every four years, POUs are required to identify potentially achievable energy
efficiency savings and establish annual targets for energy efficiency for the next 10-year period.
The targets for 2024 were established in 2021.
TABLE 9. Forecast vs. Actual for Installation Year 2024 3F
4
4F
5
4
To be consistent with EE savings reported in Table 3, Annual targets exclude codes and standards savings.
5
Not all Small, Non-IRP POUs are included in this list because they either did not develop forecasts for 2024, or did
not have any energy savings in 2024.

Energy Efficiency in California’s Public Power Sector — 2025 11
R
ESOURCES AND
T
OOLS
This section provides an overview of the technical resources, analytical tools, methodologies,
and input assumptions used or developed by public power to evaluate its EE program and
develop EE targets, in accordance with the Public Utilities Code.
6
EE Cost-Effectiveness Tool and Repor ting Platform
Energy Platforms, LLC developed a cloud-based EE cost-effectiveness tool and reporting
platform (CET/RP) to improve POUs’ tracking and evaluation of program performance and to
support the development of reports in compliance with state and federal reporting
requirements. This tool was launched in 2019 to calculate the cost-effectiveness of EE and
demand reduction measures and programs and to summarize and report the related program
expenditures and energy savings. The model includes all of the traditional benefit-cost ratio
calculation methodologies used industry-wide to evaluate EE resource programs: Total
Resource Cost (TRC), Program Administrator Cost (PAC), Ratepayer Impact (RIM), and
Participant Cost Test.
Using this tool, POUs can analyze individual efficiency measures or full portfolios to determine
the potential savings and cost-effectiveness before implementation. POUs are able to create
unique programs and measures for their utility – and may choose to share them with other
POUs collaboratively. The model also allows each POU to be able to specify many key inputs,
including, but not limited to, the following:
• retail rates,
• hourly load shapes,
• hourly GHG emissions curves,
• hourly avoided cost, and
• overhead allocations by measure, programs, portfolio, sector, and/or end-use.
The tool allows POUs to manage reference libraries of measures, avoided costs, load shapes,
and GHG emissions, allowing useful tracking and comparative scenario analyses for integrated
planning purposes. The CET/RP has undergone recent updates to fully integrate the statewide
electronic TRM (eTRM) and enable reporting of gas savings and equivalent kWh for fuel
substitution measures. Energy Platforms, LLC continues to update and improve the platform to
enhance reporting functionality.
6
Cal. Pub. Util. Code § 9505(a)(4).

Energy Efficiency in California’s Public Power Sector — 2025 12
Technical Reference Manual
POUs contracted for the development of a POU technical reference manual
7
(TRM) in 2013, and
replaced DEER as the basis for which most POUs calculate the energy savings of their programs.
The POU TRM has since been updated in 2016, 2017, and 2025. Deviations from the TRM for
individual utilities are noted in Appendix A
The TRM provides the methods, formulas, and default assumptions used for estimating energy
savings and peak demand impacts from EE measures and projects in a user-friendly format.
POUs use energy savings estimates to report program accomplishments and measure progress
toward program goals. EE measures are documented and classified as either unit energy
savings measures, semi-custom measures, or custom measures. The TRM includes
nonresidential and residential measures, presenting each measure type in separate sections,
grouped by technology type.
In addition, public power continues its involvement in the California Technical Forum’s (CalTF)
eTRM, an online repository for statewide deemed measures for California.
8
NCPA, SCPPA,
SMUD, and LADWP are members of the CalTF Policy Advisory Committee, which consists of
statewide EE stakeholders who advise on the organization's vision, mission, and guiding
principles, and affirm the annual Work Plan. The eTRM is now integrated into both the POUs’
energy efficiency reporting platform and the POU TRM.
Evaluation, Measurement & Verification
California Public Utilities Code requires each POU to make available to its customers and the
Energy Commission the results of any independent evaluation that measures and verifies the EE
savings and the reduction in energy demand achieved by its EE.
9
The Evaluation, Measurement,
& Verification (EM&V) process relies on the approaches articulated in the National Action Plan
for EE, adopted CPUC protocols, and the innovation and expertise of firms experienced in
program evaluation. EM&V reports help to define the effectiveness of individual programs with
the intent of improving future offerings. Key findings from the EM&V reports confirm high
realization rates for reported energy savings.
10
7
California Municipal Utilities Association Savings Estimation Technical Reference Manual, 3rd. Ed. 2017.
https://www.cmua.org/energy-efficiency-technical-reference-manual.
8
For more information on the CalTF, visit: http://www.caltf.org/.
9
Cal. Pub. Util. Code § 9505(d).
10
See: https://www.cmua.org/emv-reports.

Energy Efficiency in California’s Public Power Sector — 2025 13
S
OURCES OF
F
UNDING
This section provides an overview of the POUs’ sources of funding for its investments in EE and
demand reduction programs, as required by the Public Utilities Code.
11
The POUs collectively
spent $211 million in FY 2024 from a combination of Public Goods Charge (PGC) funds, Cap-
and-Trade (C&T) allowances, and General Fund monies.
Public Goods Charge
The PGC is a “non-bypassable” usage-based charge on local distribution services collected by
POUs in accordance with the Public Utilities Code.
12
The PGC is available to fund investments in
the following:
• Cost-effective demand-side management services to promote EE and energy
conservation,
• New investment in renewable energy resources and technologies,
• Research, development, and demonstration programs for the public interest to advance
science or technology not adequately provided by competitive and regulated markets,
and
• Services provided for low-income electricity customers.
Cap-and-Trade Allowances
The California C&T program allows utilities to use proceeds from the sale of freely allocated
allowances to invest in EE programs to reduce GHG emissions. Expenditures explicitly noted as
acceptable include but are not limited to equipment rebates and building retrofits.
Funds are generated once a quarter as part of CARB’s regular C&T auctions, but the level of
available revenues is expected to increase over time as minimum auction prices have escalation
factors that are applied once a year.
13
General Fund
POUs also support EE improvements and social good in the communities that they serve by
using funds from their general operating reserves through programs such as home
improvement and retrofit projects, appliance recycling and replacement programs,
disconnection assistance programs for DACs, and income-qualified bill assistance discounts
11
Cal. Pub. Util. Code § 9505(a)(3).
12
Id. § 385.
13
California Code of Regulations (CCR), Title 17, § 95801.

Energy Efficiency in California’s Public Power Sector — 2025 A-1
Appendix A – POU Narratives
Appendix A consists of detailed narratives of each POU’s EE programs and general
descriptions of the utilities, presented in alphabetic order.
TABLE 10. Annual EE Program Summary

Energy Efficiency in California’s Public Power Sector — 2025 A-2
ALAMEDA MUNICIPAL POWER
Alameda Municipal Power at a Glance
• Climate Zone: 3
• Customers: 37,895
• Total annual retail sales: 346,026 MWh
• Annual Retail Revenue: $71,536,634
• Annual energy efficiency expenditures for reporting year: $237,691
• Gross annual savings from reporting year portfolio: 163 MWh
Alameda Municipal Power’s Overview
• Due to Alameda’s temperate climate and large residential customer base, the peak
demand for electricity is in the winter (December and January) and early evening.
• Alameda Municipal Power (AMP) has committed to spending its renewable energy
credit (REC) funds to reduce greenhouse gas emissions in its service area.
Residential, 6
Commercial, 119
Low Income, 38
Gross Energy Savings (MWh)
Residential Commercial Industrial Agricultural Other Low Income T&D Electrification

Energy Efficiency in California’s Public Power Sector — 2025 A-3
Major Program and Portfolio Changes
FY 2024 savings included the continuation of a non-residential self-install lighting program, a
residential online rebate portal for heat pump water heaters, electric dryers, smart
thermostats, and a direct-install program for income-qualified residential customers.
Program and Portfolio Highlights
AMP’s non-residential lighting retrofit program provided more than 70 percent of total savings.
This program provides incentives for lighting upgrades that a customer can do themselves or
work with a qualified contractor.
Commercial, Industrial & Agricultural Programs
Non-Residential Self-Install Program: This program offers non-residential customers rebates for
energy efficient LED lighting retrofits. AMP maintains this program as a means of offering
customers a do-it-yourself option for energy efficiency upgrades. This is a common pathway for
chain retailers who are trying to manage incentivized upgrades across various locations.
Residential Programs
• Residential Online Rebates – Customers have been able to participate in residential
energy efficiency rebates using a simple web application since March 2016. In FY 2024
AMP approved 36 EE applications. EE rebates were available for electric clothes dryers,
heat pump water heaters, and smart thermostats.
• Energy Assistance Program (EAP) Plus – In October 2019, AMP launched a residential
direct-install program called EAP Plus, targeting income-qualified residents living in
single and multi-family homes. Eligible customers received no-cost energy-efficiency
upgrades, including LED bulbs, LED fixtures, refrigerators, advanced power strips, low-
flow shower heads, and various weatherization measures. In FY 2024, the program
served 52 customers. The program ended in May 2024.
Complementary Programs
AMP currently offers 18 incentive programs, a time-of-use rate, two technical assistance
programs, and two financial assistance programs for customers focusing on energy efficiency,
building electrification, and clean transportation. Some of these programs are listed below:
• Electric Vehicle (EV) Programs: AMP offers a Time-of-Use rate plan that currently has
984 customers enrolled. AMP offers a $1,500 rebate for the purchase of a used EV with
a purchase price less than $40,000. AMP also offers a $500 rebate for the purchase of a
Level 2 charger, and a rebate of $100-$600 for the purchase of an electric bike.
• Low-Income Programs: AMP continues to provide financial assistance to Alameda's low-
income families through the Energy Assistance through Supportive Efforts (EASE)
program and the Energy Assistance Program (EAP). In FY 2024, customer financial

Energy Efficiency in California’s Public Power Sector — 2025 A-4
assistance programs provided a total of $244,645.24 in electric bill assistance. A
maximum amount of $200 is available per household within a three-year period through
the EASE program. EAP provides a 25 percent monthly discount on electric bills. These
programs are funded through the public purpose component of AMP's energy charges.
AMP also partnered with the Alameda Housing Authority (AHA) to reduce the
administrative burden on customers by implementing auto-enrollment for customers
living in AHA properties.
• Research, Development, and Demonstration: AMP developed a new heat pump heating,
ventilation, and air conditioning (HVAC) rebate for residential and non-residential
customers. Additionally, AMP implemented an energy management device program in
FY 2024.
• AMP expanded electrification and energy efficiency outreach efforts by offering
customers a DIY Energy Audit pilot program and an electrification guide with a cost
estimator tool.
Evaluation, Measurement & Verification Studies
AMP completes an Evaluation, Measurement, and Verification (EM&V) study every other year
with a focus on the two previous years. The most recent EM&V report was completed by ADM
Associates for FY 2021–FY 2022.
Major Differences or Diversions from CA POU TRM for Energy Savings
With a goal of getting the most accurate energy savings, AMP staff used a variety of sources.
For the residential lighting energy savings, AMP used historical AMP customer program data,
buoyed by a high realization rate in the FY 2022 EM&V report. The energy savings figures for
the residential refrigerator/freezer and heat pump water heaters were from the 2017 CMUA
TRM. The electric clothes dryer savings were from an Energy Star report.
Energy savings for non-residential programs were calculated using a hybrid of actual pre- and
post-installation inspections and the POU TRM 2017. Customized lighting projects were
calculated using a combination of the POU TRM 2017 and pre- and post-calculations.

Energy Efficiency in California’s Public Power Sector — 2025 A-5
TABLE AMP-1. Energy Efficiency Program Results by End Use
Summary by End Use
Resource Savings Summary
Cost Test Results
End Use
Gross Peak
Savings (kW)
Gross Annual
Energy Savings
(kWh)
Gross Lifecycle
Energy Savings
(kWh)
Net Peak
Savings (kW)
Net Annual
Energy Savings
(kWh)
Net Lifecycle
Energy Savings
(kWh)
Net Lifecycle GHG
Reductions (Tons)
Total Utility
Cost
PAC
TRC
Utility
($/kWh)
Appliance & Plug Loads
0
13,524
106,644
0
8,181
64,364
23
$33,286
0.27
0.32
0.599
Building Envelope
0
821
16,426
0
230
4,599
2
$39,102
0.04
0.04
12.509
Lighting - Indoor
1
23,521
352,814
1
12,701
190,519
70
$69,147
0.33
0.33
0.485
Low-Income
2
37,866
475,884
1
21,112
259,483
96
$141,535
0.24
0.24
0.703
HVAC - Cooling
0
393
5,895
0
314
4,716
2
$2,073
0.35
0.33
0.588
Lighting - Indoor
30
110,826
1,662,390
24
88,661
1,329,912
611
$70,614
2.50
3.52
0.071
Lighting - Outdoor
0
7,958
95,496
0
6,366
76,397
26
$3,829
2.05
3.31
0.063
Miscellaneous
0
2,573
41,168
0
1,544
24,701
10
$9,993
0.38
0.38
0.551
Service & Domestic Hot Water
1
3,380
33,800
0
1,859
18,590
8
$9,647
0.31
0.32
0.628
Energy Efficiency
30
125,130
1,838,749
24
98,744
1,454,316
657
$96,156
2.00
2.59
0.088
EE, Low Income and Electrification
32
162,996
2,314,633
25
119,857
1,713,799
753
$237,691
0.95
1.07
0.184
C&S and T&D
$0
Utility Total
32
162,996
2,314,633
25
119,857
1,713,799
753
$237,691
0.95
1.07
0.184

Energy Efficiency in California’s Public Power Sector — 2025 A-6
TABLE AMP-2. Energy Efficiency Program Results by Sector
Summary by Sector
Resource Savings Summary
Cost Test Results
Sector
Gross Peak
Savings (kW)
Gross Annual
Energy Savings
(kWh)
Gross Lifecycle
Energy Savings
(kWh)
Net Peak
Savings (kW)
Net Annual
Energy Savings
(kWh)
Net Lifecycle
Energy Savings
(kWh)
Net Lifecycle GHG
Reductions (Tons)
Total Utility
Cost
PAC
TRC
Utility
($/kWh)
Residential
2
37,866
475,884
1
21,112
259,483
96
$141,535
0.24
0.24
0.703
Low-Income
2
37,866
475,884
1
21,112
259,483
96
$141,535
0.24
0.24
0.703
Commercial
30
118,784
1,757,886
24
95,027
1,406,309
637
$74,443
2.48
3.51
0.071
Residential
1
6,346
80,863
0
3,717
48,007
20
$21,714
0.34
0.35
0.586
Energy Efficiency
30
125,130
1,838,749
24
98,744
1,454,316
657
$96,156
2.00
2.59
0.088
EE, Low Income and Electrification
32
162,996
2,314,633
25
119,857
1,713,799
753
$237,691
0.95
1.07
0.184
C&S and T&D
$0
Utility Total
32
162,996
2,314,633
25
119,857
1,713,799
753
$237,691
0.95
1.07
0.184

Energy Efficiency in California’s Public Power Sector — 2025 A-7
TABLE AMP-3. Energy Efficiency Program Results by Building Type
Summary by Building Type
Resource Savings Summary
Cost Test Results
Building Type
Gross Peak
Savings (kW)
Gross Annual
Energy Savings
(kWh)
Gross Lifecycle
Energy Savings
(kWh)
Net Peak
Savings (kW)
Net Annual
Energy Savings
(kWh)
Net Lifecycle
Energy Savings
(kWh)
Net Lifecycle GHG
Reductions (Tons)
Total Utility
Cost
PAC
TRC
Utility
($/kWh)
Residential
2
37,816
475,184
1
21,077
258,993
95
$140,082
0.24
0.25
0.698
Residential - Single-Family
0
50
700
0
35
490
0
$1,453
0.05
0.05
3.886
Low-Income
2
37,866
475,884
1
21,112
259,483
96
$141,535
0.24
0.24
0.703
Any
30
118,784
1,757,886
24
95,027
1,406,309
637
$74,443
2.48
3.51
0.071
Multiple
1
3,380
33,800
0
1,859
18,590
8
$9,647
0.31
0.32
0.628
Residential
0
2,966
47,063
0
1,858
29,417
12
$12,067
0.37
0.37
0.557
Energy Efficiency
30
125,130
1,838,749
24
98,744
1,454,316
657
$96,156
2.00
2.59
0.088
EE, Low Income and Electrification
32
162,996
2,314,633
25
119,857
1,713,799
753
$237,691
0.95
1.07
0.184
C&S and T&D
$0
Utility Total
32
162,996
2,314,633
25
119,857
1,713,799
753
$237,691
0.95
1.07
0.184

Energy Efficiency in California’s Public Power Sector — 2025 A-8
ANAHEIM PUBLIC UTILITIES
Anaheim Public Utilities at a Glance
• Climate Zone: 8
• Customers: 123,726
• Total annual retail sales: 2,114,776 (MWh)
• Annual Retail Revenue: $361,992,000
• Annual energy efficiency expenditures for reporting year: $7,886,642
• Gross annual savings from reporting year portfolio: 6,042 MWh
Anaheim Public Utilities Overview
The City of Anaheim, founded in 1857, is one of the nation’s premier municipalities and among
California’s most populous and visited cities. Anaheim spans over 50 square miles, with more
than 340,000 residents, 123,000 electric utility customers, and 20 million annual visitors.
Anaheim is home to a vibrant business community encompassing diverse sectors, including
large industrial manufacturers and world-renowned tourist attractions such as hotels,
entertainment venues, theme parks, sports franchises, and the largest LEED-certified
convention center on the west coast. While Anaheim is known for its world-renowned
attractions, it is also home to a large population of low-income and disadvantaged
communities. To support these residents, Anaheim Public Utilities (APU) designs energy
Residential,
2,079
Commercial,
2,678
Other, 388
Low Income, 399
Electrification, 497
Gross Energy Savings (MWh)
Residential Commercial Industrial Agricultural Other Low Income T&D Electrification

Energy Efficiency in California’s Public Power Sector — 2025 A-9
efficiency programs tailored to their needs, providing bill assistance, discount programs, and
opportunities to reduce energy costs.
Anaheim owns and operates the only not-for-profit, publicly owned electric utility in Orange
County. APU prioritizes a customer-centric approach, offering incentives and resource programs
to help customers achieve their sustainability, water conservation, and energy efficiency goals.
In alignment with state initiatives for a carbon-free future, APU focuses on simplifying
programs, expanding customer choices, and enhancing outreach and community engagement.
As Anaheim advances towards a cleaner electric grid, APU aims to design new program areas
such as building electrification, enhanced demand response, and new customer incentives that
support the transition to a carbon-free future, while keeping bills affordable.
Program and Portfolio Highlights
Community engagement and outreach remains a central focus of APU. In FY 2024, APU
participated in 87 community outreach events, connecting with more than 18,600 community
members. Through these events, 1,400 applications for bill assistance programs were
distributed, and over 500 sign-ups for the Home Utility Check-Up Program were received. In
addition to traditional marketing channels such as utility webpages, utility bill inserts, social
media, and program flyer distribution, APU facilitated smaller neighborhood events to support
customers with the specific needs of their neighborhood. To further complement community
engagement, APU will unveil a new Sustainability Education Center in the fall of 2025. The
Sustainability Education Center will serve as APU’s flagship educational and workforce
development venue, providing sustainability-themed workshops and events, STEM education,
hands-on energy and water use efficiency exhibits, new technology displays, and career path
exploration opportunities.
APU’s Dusk-to-Dawn Program has significantly improved security and safety within key multi-
family neighborhoods with heightened crime concerns. Through a proactive effort to identify
outdoor lighting improvement opportunities, the program focused on areas where lighting
could play a critical role in deterring crime and promoting community safety. In FY 2024, 77
multi-family properties received no-cost energy-efficient exterior lights, improving visibility and
providing residents with safer, well-lit environments during nighttime hours. Collectively, the
Dusk-to-Dawn Program provided no-cost lighting solutions to 297 residential applications and
149 commercial applications, generating cumulative energy savings of over 590 MWh for this
reporting period. This initiative underscores the city's commitment to enhancing the quality of
life and safety for its communities.
APU's Income-Qualified Weatherization Program achieved notable participation outcomes in FY
2024. The program served 821 residential customers and directly installed 6,800 high-efficiency
measures, resulting in cumulative energy savings of 395 MWh. This initiative provides income-
qualified community members with turnkey access to energy efficiency benefits, contributing
to lower utility costs, home comfort enhancements, and a more sustainable living environment.

Energy Efficiency in California’s Public Power Sector — 2025 A-10
Within the commercial sector, APU’s Small Business Direct Installation Program provided
program participants with 3,655 energy efficiency measures, achieving over 765 MWh of
energy conserved.
The LED Welcome Kit distribution initiative remains a core energy efficiency program. Designed
to provide new electric utility customers with valuable resources, each Welcome Kit contains
four high-efficiency LED lamps, and a detailed brochure that includes city information, contact
details, program information, and available resources. In FY 2024, the program reached 8,502
customers, resulting in over 1,217 MWh conserved. APU’s Commercial Lighting Incentives
Program also achieved notable savings in FY 2024, supporting 20 lighting projects and
generating over 1,411 MWh of energy savings.
The Home Incentives Program achieved 178 MWh in energy savings through rebates issued for
energy-efficient and electrification appliances. By encouraging and incentivizing Anaheim
customers to invest in modern, energy-saving technologies, customers are engaging in
sustainable behaviors that reduce energy demand, all while lowering their utility bills. Looking
ahead, APU remains committed to offering customers an array of program participation options
and incentive choices, while enhancing energy efficiency programs to support customers with
the state’s transition to clean energy and electrification.
In FY 2024, APU held the second annual Sustainable Footprint Contest (formerly Sustainable
Home Survey), an initiative designed to highlight community efficiency efforts and recognize
local sustainability champions. A total of 57 customers shared their sustainability stewardship
stories, with nine participants receiving recognition for their commitment to resource
preservation and active involvement in various energy and water efficiency programs. The
grand prize winner received $5,000 in home efficiency measure upgrades, with the remaining
awardees receiving $3,000 in home efficiency improvements. Participants of the Sustainable
Footprint Contest serve as community ambassadors for sustainability, sharing their experiences
and inspiring others to participate in APU’s home efficiency programs. The initiative highlights
the positive impact individuals can make by embracing sustainable living.
Launched in FY 2023, APU’s Bright Girls Program provides an annual mentorship opportunity to
middle-school girls, encouraging them to explore utilities-related careers. Participants engage in
hands-on STEM activities, facility tours, and interactions with accomplished female
professionals in the industry. The Bright Girls Program aims to encourage and inspire young
girls to envision a future career in the utilities industry. By fostering curiosity and interest in
STEM disciplines, the program contributes to developing the next generation of utility leaders
and supporting a diverse and inclusive workforce.
Initiated as a pilot project in FY 2022, APU collaborated with the Community Services
Department to support the Anaheim Mobile Family Resource Center (MFRC) Program. Through
the MFRC initiative, various city departments and non-profit organizations work collectively to
travel to neighborhoods throughout Anaheim and provide essential services and information to

Energy Efficiency in California’s Public Power Sector — 2025 A-11
disadvantaged residential and multi-family customers, with an on-the-spot utility bill assistance
enrollment service provided by APU. In FY 2024, city departments partnered with non-profit,
education, faith, and other community organizations to support the MFRC Program, resulting in
6,651 significant contacts with residents through 48 neighborhood events held at 34 key
Anaheim neighborhoods. In addition to providing utility support through bill assistance and
program enrollment, the project distributed 1,692 food boxes to families, along with a holiday
toy distribution effort that reached 2,101 children across all 34 Anaheim neighborhoods.
Commercial, Industrial & Agricultural Programs
As part of APU’s ongoing commitment to energy efficiency and demand reduction, the
Commercial and Industrial (C&I) programs have focused on implementing energy efficiency and
electrification measures that promote effective participation throughout the City of Anaheim.
These programs are specifically tailored to assist commercial customers in achieving their
energy-saving initiatives. In FY 2024, the APU C&I programs delivered over 3,715 measures to
business customers, resulting in significant energy savings totaling over 2,784 MWh. These
achievements underscore the impact and effectiveness of energy conservation throughout
Anaheim.
• Comprehensive Energy Assessments: Customized on-site analyses aligned with ASHRAE
standards, offering actionable recommendations for achieving energy efficiency goals.
• Customized Energy Incentives Program: Tailored incentives supporting high-efficiency
technologies such as advanced air conditioning units and energy management systems.
• Heat Pump Incentives Program: Promoting high-efficiency heat pump installations to
optimize electricity consumption.
• Lighting Incentives: Encouraging LED lighting upgrades to improve energy efficiency and
ensure appropriate lighting levels.
• New Construction: Providing design assistance and incentives for projects that exceed
Title 24 energy standards.
• Small Business Energy & Water Direct Install/Assessment Program: Delivering analyses
and upgrades for small businesses, focusing on LED lighting, smart thermostats, and
HVAC/refrigeration tune-ups.
• Air Purifier Rebate: Offering rebates for ENERGY STAR® certified air purifiers.
• Dusk-to-Dawn Lighting: Providing free high-efficiency LED fixtures with photo sensors,
such as wall packs and pole-mounted parking lot lights, to commercial customers.
• Energy & Water Incentives for Multi-family Housing Projects: Financial incentives for
new and rehabilitated multi-family dwellings to promote sustainability.
• Tree Power Program: Distributing complimentary shade trees and offering related
incentives to commercial customers.

Energy Efficiency in California’s Public Power Sector — 2025 A-12
Residential Programs
APU is dedicated to offering customers a range of program options to help them achieve their
energy reduction and water conservation goals. With more than 60 incentive measures and
direct-installation services through its residential rebate and turnkey programs, along with
emerging electrification and demand response initiatives, APU is continuously advancing
innovative resources that promote sustainability and support bill affordability.
• Home Utility Check-Up Program: Complimentary home assessment of electric and water
use, customized audit report with efficiency recommendations, outdoor water
assessment component with irrigation scheduling and controller programming, direct-
installation of LEDs, low-flow shower heads, aerators, toilet leak/dye tab test, and toilet
flapper replacement as needed.
• Dusk-to-Dawn Lighting Program: Residential customers can receive up to two free high-
efficiency LED fixtures with photo sensors. Participants have the option to pick up lights
from the Program contractor’s office in Anaheim or receive lighting fixtures during
Home Utility Check-Up and Weatherization Program services.
• Dusk-to-Dawn Lighting Program Income-Qualified Assistance: In addition to receiving up
to two free outdoor security lights, income-qualified residents may also have the light
installed by one of Anaheim's approved and licensed electrical contractors free of
charge.
• Weatherization Program: Inter-utility partnership with Southern California Gas Company
that assists income-qualified renters and homeowners in making their homes more
water and energy-efficient. The program offers no-cost home repairs and replacement
of inefficient appliances, consisting of ENERGY STAR® certified ceiling fans and room air
conditioners, plug load occupancy sensors in smart power strips, LED lamps, duct sealing
and testing, A/C tune-ups with refrigerant recharge, high-efficient toilets, and additional
electric, water, and gas-saving measures.
• Home Incentives Program: Provides rebates for the purchase and installation of
replacement ENERGY STAR® rated appliances and high-efficiency conservation
measures.
• A/C Tune-Up Program: Provides up to a $100 incentive to residential customers who
have a licensed HVAC contractor perform an A/C tune-up, with an enhanced incentive of
up to $150 for income-qualified customers.
• Refrigerator & Freezer Recycling Program: Provides a $50 incentive to customers who
recycle an old, operational refrigerator or freezer. Appliance collection is available at no
cost to the customer.
• Uninterruptible Power Supply Rebate Program: Provides a $50 incentive for standard
equipment and a $200 incentive for medical device uninterruptible power supply
systems that meet ENERGY STAR® certification requirements.

Energy Efficiency in California’s Public Power Sector — 2025 A-13
• Electric Portable Power Station Rebate Program: Provides a $50 incentive for standard
equipment and a $200 incentive for medical device-associated electric portable power
stations. Incentive eligible for battery-powered electric portable power station devices,
with a minimum 100W AC output.
• Tree Power Program: Provides up to 6 complimentary shade trees, along with an option
for a $20 incentive per shade tree for residential customers.
• MyPower Savings Program: As a demand response program, participating residential
customers earn event participation rewards of $1.00 for every kWh of energy reduced
during event hours (up to $100 in bill credits per FY). Additionally, instant enrollment bill
credits are provided for participants with central A/C units, pool pumps, wall A/C units,
and/or EV chargers.
• LED Distribution Program (Welcome Kits): New residential electric utility customers are
direct-mailed LED Welcome Kits, inclusive of 4 LED lamps and a welcome brochure with
city information and resources.
• Utility Discount Program: Provides a 12% reduction on the electric and/or water
portions of utility bills to seniors, military veterans, or long- term disabled customers at
or below 80% of the Orange County median income.
• Community Solar Discount Program: Income-qualified customers are eligible to receive a
$20 monthly discount on the electric portion of their utility bill for a 12-month period.
• Emergency Assistance Program: Provides up to $350 in utility payment assistance for
income-qualified customers experiencing financial hardship.
Complementary Programs
• School Education Programs: Public and private school students engage in the classroom
and through hands-on outdoor labs to explore environmental issues. Programs were
recently enhanced to incorporate Next Generation Science Standards into curricula that
includes education on renewable resources, water conservation, solar power, EV
adoption and the benefits thereof, in-home student-led energy and water use
assessments, and hands-on field trips to various nature centers and outdoor venues,
with educational activities centered around sustainability and environmental
stewardship. In FY 2024, School Education Programs reached over 7,700 students and
provided 94 outdoor educational experiences across 32 Anaheim schools.
• Water Conservation Student Poster Contest: APU continues to hold an annual “Being
Water Wise Is…” Poster Contest, whereby 1st through 8th grade students are invited to
submit artwork associated with water conservation, giving students the opportunity to
help raise water awareness through the art they create. At the culmination of the
contest, winning artwork is printed on APU branded water bottle labels, and an artist
recognition is held at a City Council meeting. This year hosted the 33rd annual Student
Poster Contest, with 189 artwork entries received.
Energy Efficiency in California’s Public Power Sector — 2025 A-14
• Scholarship Program: Supports high school students in their pursuit of post-secondary
education by offering a monetary award to assist with continued studies in a STEM-
related field. Participants are required to submit an essay detailing their involvement in
their community and schools, as well as the potential positive impact of STEM-related
careers on their communities. In the summer of 2024, scholarship recipients also
participated in a paid internship with APU, in collaboration with Workforce
Development and Hope Builders.
• Anaheim Innovative Mentoring Experience (AIME) Program: Through the 4-session
Program, students learn to collaborate with others from different schools, while
exploring a variety of skill sets, inclusive of resume building, interview skills, teamwork,
and public speaking. Participants learn of utility power/water resources and
sustainability initiatives and are exposed to various utility jobs and career paths.
• Bright Girls Program: Mentorship initiative designed to inspire middle-school girls to
learn about various utilities-related career path opportunities, engage in hands-on STEM
activities, tour utility facilities, and interact with female professionals in the industry.
• Sustainable Footprint Program: Community outreach initiative and customer
sustainability recognition program. This year, nine exemplary customers were
acknowledged for their commitment to resource conservation and active participation
in various energy and water efficiency programs.
• Sustainable Schools Award Program: Each year, Anaheim Public Utilities recognizes K-12
Anaheim schools for making positive environmental impacts on campus and in
curriculums. Through the Sustainable Schools Award Program, schools showcase their
energy- and water-efficiency programs, unique environmental initiatives, and
environmental education programs for students and staff. Two winning schools are
recognized each year and receive the opportunity to select one grand prize, including 30
ENERGY STAR® laptops, digital smart boards, or support for an on-site school
sustainability project. In addition to the Sustainable Schools Award program, APU offers
educators additional resources such as facility tours, extracurricular programs, and
projects to enhance the educational experience for Anaheim students.
• Battery Storage Rebate Program: Incentive of up to $3,000 available for residential
customers who install an energy storage system with a minimum 5 kWh capacity. In FY
2024, a total of 30 battery storage systems were incentivized.
• Private Use EV Charger Rebate Program: Incentive of up to $1,000 for residential and
business customers who install Level 2 plug-in electric vehicle chargers for personal or
business use. A total of 395 Private Use EV Charger Rebates were issued in FY 2024.
• Public Access EV Charger Station Rebate Program: Initiative provides up to $5,000 per
level 2 EV charging station and $10,000 per direct current (DC) fast charging station at
multi-unit dwelling locations or other publicly accessible areas; up to $10,000 per EV
charging station servicing affordable housing or schools and colleges; up to an additional
$5,000 for program participants who choose to install an associated sub-meter; and
Energy Efficiency in California’s Public Power Sector — 2025 A-15
Anaheim Public Utilities rebates the City's plan check fees (up to $1,500/installation)
and pays permit fees (approx. $170/charger) for the EV charger(s). The program
includes an enhanced rebate for chargers located at multi-unit dwellings within low-
income and disadvantaged communities. In FY 2024, APU incentivized 59 public
chargers, 3 plan check fees, and 1 commercial permit fee waiver.
• EV Fleet Charger & Infrastructure Rebate Program: Incentive is open to commercial
customers, schools and colleges, and provides rebates for networked Level 2 or greater
EV chargers and associated EV charger infrastructure upgrades. Maximum of ten EV
chargers per year; Commercial Business Fleet Customers receive up to $5,000 per EV
charger, up to $45,000 per site for associated EV charger infrastructure upgrades and up
to $5,000 for associated sub-meter installation costs. School Customers receive up to
$10,000 per EV charger, up to $95,000 per site for associated EV charger infrastructure
upgrades and up to $5,000 for associated sub-meter installation costs. In FY 2024, APU
incentivized 22 fleet chargers.
• EV Ride Sharing Program: Provides access to EVs for residents who live in multi-family
accommodations located within disadvantaged or low-income communities and who
may not otherwise have access to EVs. The program provides rebates to property
owners and property management companies who host EV ride sharing company
vehicles and make them available for use to their residents. Rebates include up to
$24,000 per year for the lease of two EVs, and up to $36,000 per year to cover the cost
of licensed driver ridership, for up to three years. In FY 2024, two multi-family
properties participated in the program, providing four (4) EVs for residents, which have
been actively used with over 192 bookings.
• Municipal EV Charger Installation Assistance Program: Provides rebates to City of
Anaheim departments who install EV charging stations at their facilities. The rebate
helps offset the costs of chargers and associated infrastructure, playing a crucial role in
expanding EV charging infrastructure citywide. In FY 2024, the program supported the
installation of 29 chargers across various city departments.
• EV Feasibility and Master Planning Studies: APU partners with a consultant to offer no-
cost, no-commitment feasibility and master planning studies to commercial sites, multi-
family dwellings, schools, and municipal facilities. Customers who participate in a
feasibility study receive a high-level report with EV charging installation
recommendations. A master study will include an in-depth report that provides
technical specifications and long-term planning (10-year electrification expansion plan).
In FY 2024, a total of 10 feasibility and master planning studies were successfully
completed.
• EV Ride-and-Drive Events: APU promotes and advocates the use of plug-in vehicles
through events and education. In partnership with Plug In America, three (3) free EV test
drive events were hosted in FY 2024. Attendees were given the opportunity to learn
more about EVs through test driving and interactions with knowledgeable volunteers

Energy Efficiency in California’s Public Power Sector — 2025 A-16
and dealer staff. Events held at Imperial Elementary and Savanna High School were well
attended, with over 218 test drives. Additionally, APU hosted its annual OC Green Expo
in June 2024, which featured an EV test drive experience with over 306 participants,
connecting the community with sustainable resources, organizations, and vendors.
• Residential and Commercial Water Savings Resulting from Equipment Rebates:
Businesses and residents are eligible for rebates by installing or retrofitting with
qualifying water-saving devices through the "SoCal Water$mart" Program in partnership
with the Metropolitan Water District of Southern California. Water savings result from
the application of measures such as Rotating Sprinkler Nozzles, Weather-Based
Irrigation Controllers, Soil Moisture Sensor Systems, Turf Replacement, High-Efficiency
Clothes Washers, Premium High-Efficiency Toilets, Rain Barrels & Cisterns.
• Leak Repair Rebate Program: Offers incentives to customers who demonstrate repair of
water leaks in and around their residences, providing up to $500 for income-qualified
single-family customers and $250 for non-income-qualified residents.
• LED Street Lighting Retrofit Initiative: Anaheim is currently in the process of converting
its city streetlights from HPS to LED lights. In FY 2024, a total of 602 streetlights were
retrofitted with LED lighting, resulting more than 140 MWh of energy conserved.
• Holiday Light Exchange Program: Provides free LED holiday light strands to residents
who turn in old incandescent holiday light strands.
Evaluation, Measurement & Verification Studies
Under SCPPA and CMUA Energy Efficiency Services Resolution No. 2021-105, Anaheim
contributed to the development of tools and services that calculate and report the cost-
effectiveness of energy efficiency and demand response programs.

Energy Efficiency in California’s Public Power Sector — 2025 A-17
TABLE APU-1. Energy Efficiency Program Results by End Use
Summary by End Use
Resource Savings Summary
Cost Test Results
End Use
Gross Peak
Savings (kW)
Gross Annual
Energy Savings
(kWh)
Gross Lifecycle
Energy Savings
(kWh)
Net Peak
Savings (kW)
Net Annual
Energy Savings
(kWh)
Net Lifecycle
Energy Savings
(kWh)
Net Lifecycle GHG
Reductions (Tons)
Total Utility
Cost
PAC
TRC
Utility
($/kWh)
Appliance & Plug Loads
0
2,676
53,520
0
2,676
53,520
15
$2,234
2.33
5.02
0.061
HVAC - Heat Pump
142
491,170
5,421,894
142
491,170
5,421,894
1,698
$174,832
3.59
214.91
0.040
Service & Domestic Hot Water
0
3,600
54,000
0
3,600
54,000
19
$2,549
2.66
5.02
0.063
Electrification
142
497,446
5,529,414
142
497,446
5,529,414
1,732
$179,615
3.56
120.58
0.040
Appliance & Plug Loads
0
28,132
380,120
0
28,132
380,120
107
$23,767
1.62
5.02
0.081
Building Envelope
49
33,972
665,142
49
33,972
665,142
204
$27,000
2.72
5.02
0.059
HVAC - Cooling
72
67,790
632,797
72
67,790
632,797
260
$114,346
1.26
6.35
0.221
Lighting - Indoor
470
2,714,707
35,076,518
470
2,714,707
35,076,518
12,374
$421,316
9.19
15.00
0.015
Lighting - Outdoor
34
807,234
12,681,132
34
807,234
12,681,132
5,536
$4,497,365
0.32
0.32
0.483
Miscellaneous
384
1,204,826
13,669,351
384
1,204,826
13,669,351
4,452
$1,193,745
1.20
1.24
0.112
Water Pumping / Irrigation
0
247,841
2,230,570
0
247,841
2,230,570
829
$475,207
0.60
1.41
0.252
Whole Building
0
41,058
123,174
0
41,058
123,174
45
$177,242
0.08
0.08
1.503
Energy Efficiency
1,009
5,145,560
65,458,805
1,009
5,145,560
65,458,805
23,807
$6,929,990
1.05
1.15
0.137
Appliance & Plug Loads
0
4,550
63,700
0
4,550
63,700
18
$8,282
0.78
5.02
0.170
HVAC - Cooling
33
28,627
175,000
33
28,627
175,000
73
$44,454
1.01
1.01
0.287
Lighting - Indoor
19
166,316
2,494,742
19
166,316
2,494,742
942
$283,781
1.01
1.01
0.152
Miscellaneous
158
199,808
1,998,755
158
199,808
1,998,755
809
$440,520
1.01
1.01
0.267
Low-Income
210
399,301
4,732,197
210
399,301
4,732,197
1,842
$777,037
1.01
1.02
0.209
EE, Low Income and Electrification
1,360
6,042,307
75,720,415
1,360
6,042,307
75,720,415
27,381
$7,886,642
1.11
1.23
0.135
C&S and T&D
$0
Utility Total
1,360
6,042,307
75,720,415
1,360
6,042,307
75,720,415
27,381
$7,886,642
1.11
1.23
0.135

Energy Efficiency in California’s Public Power Sector — 2025 A-18
TABLE APU-2. Energy Efficiency Program Results by Sector
Summary by Sector
Resource Savings Summary
Cost Test Results
Sector
Gross Peak
Savings (kW)
Gross Annual
Energy Savings
(kWh)
Gross Lifecycle
Energy Savings
(kWh)
Net Peak
Savings (kW)
Net Annual
Energy Savings
(kWh)
Net Lifecycle
Energy Savings
(kWh)
Net Lifecycle GHG
Reductions (Tons)
Total Utility
Cost
PAC
TRC
Utility
($/kWh)
Commercial
139
486,414
5,350,554
139
486,414
5,350,554
1,670
$144,213
4.25
0.033
Residential
3
11,032
178,860
3
11,032
178,860
62
$35,403
0.75
5.02
0.272
Electrification
142
497,446
5,529,414
142
497,446
5,529,414
1,732
$179,615
3.56
120.58
0.040
Any
0
247,841
2,230,570
0
247,841
2,230,570
829
$475,207
0.60
1.41
0.252
Commercial
598
2,678,107
31,229,209
598
2,678,107
31,229,209
10,900
$1,087,676
3.08
3.66
0.044
Other
34
140,366
2,807,319
34
140,366
2,807,319
1,311
$4,430,128
0.07
0.07
2.322
Residential
377
2,079,246
29,191,707
377
2,079,246
29,191,707
10,768
$936,979
3.58
4.27
0.043
Energy Efficiency
1,009
5,145,560
65,458,805
1,009
5,145,560
65,458,805
23,807
$6,929,990
1.05
1.15
0.137
Residential
210
399,301
4,732,197
210
399,301
4,732,197
1,842
$777,037
1.01
1.02
0.209
Low-Income
210
399,301
4,732,197
210
399,301
4,732,197
1,842
$777,037
1.01
1.02
0.209
EE, Low Income and Electrification
1,360
6,042,307
75,720,415
1,360
6,042,307
75,720,415
27,381
$7,886,642
1.11
1.23
0.135
C&S and T&D
$0
Utility Total
1,360
6,042,307
75,720,415
1,360
6,042,307
75,720,415
27,381
$7,886,642
1.11
1.23
0.135

Energy Efficiency in California’s Public Power Sector — 2025 A-19
TABLE APU-3. Energy Efficiency Program Results by Building Type
Summary by Building Type
Resource Savings Summary
Cost Test Results
Building Type
Gross Peak
Savings (kW)
Gross Annual
Energy Savings
(kWh)
Gross Lifecycle
Energy Savings
(kWh)
Net Peak
Savings (kW)
Net Annual
Energy Savings
(kWh)
Net Lifecycle
Energy Savings
(kWh)
Net Lifecycle GHG
Reductions (Tons)
Total Utility
Cost
PAC
TRC
Utility
($/kWh)
Other Commercial
139
486,414
5,350,554
139
486,414
5,350,554
1,670
$144,213
4.25
0.033
Residential
3
11,032
178,860
3
11,032
178,860
62
$35,403
0.75
5.02
0.272
Electrification
142
497,446
5,529,414
142
497,446
5,529,414
1,732
$179,615
3.56
120.58
0.040
Any
5
115,806
1,618,134
5
115,806
1,618,134
509
$188,316
0.94
0.99
0.166
Multiple
0
247,841
2,230,570
0
247,841
2,230,570
829
$475,207
0.60
1.41
0.252
Other Commercial
626
2,708,361
32,503,804
626
2,708,361
32,503,804
11,742
$5,330,082
0.66
0.68
0.208
Residential
329
2,046,342
28,562,086
329
2,046,342
28,562,086
10,561
$916,072
3.59
4.24
0.043
Residential - Single-Family
48
27,211
544,211
48
27,211
544,211
167
$20,313
2.95
5.02
0.055
Energy Efficiency
1,009
5,145,560
65,458,805
1,009
5,145,560
65,458,805
23,807
$6,929,990
1.05
1.15
0.137
Residential
180
375,704
4,607,879
180
375,704
4,607,879
1,791
$745,179
1.01
1.02
0.206
Residential - Mobile Home
20
16,394
87,083
20
16,394
87,083
36
$23,816
1.01
1.01
0.302
Residential - Single-Family
10
7,203
37,234
10
7,203
37,234
15
$8,042
1.01
1.01
0.239
Low-Income
210
399,301
4,732,197
210
399,301
4,732,197
1,842
$777,037
1.01
1.02
0.209
EE, Low Income and Electrification
1,360
6,042,307
75,720,415
1,360
6,042,307
75,720,415
27,381
$7,886,642
1.11
1.23
0.135
C&S and T&D
$0
Utility Total
1,360
6,042,307
75,720,415
1,360
6,042,307
75,720,415
27,381
$7,886,642
1.11
1.23
0.135

Energy Efficiency in California’s Public Power Sector — 2025 A-20
AZUSA LIGHT & WATER
Azusa Light & Water at a Glance
• Climate Zone: 9
• Customers: 17,477
• Total annual retail sales: 234,019 MWh
• Annual Retail Revenue: $44,407,427
• Annual energy efficiency expenditures for reporting year: $1,508,029
• Gross annual savings from reporting year portfolio: 2,576 MWh
Azusa Light & Water Overview
Since the inception of its energy efficiency programs, Azusa Light & Water has expended over
$18 Million toward providing energy conservation information to the Azusa community and
rewarding businesses and residents for upgrading inefficient energy-consuming equipment with
more energy-efficient equipment. These efforts have resulted in a consistent annual peak
demand and energy use reduction of approximately one percent.
Residential, 217
Commercial,
1,775
Industrial, 27
Other, 558
Gross Energy Savings (MWh)
Residential Commercial Industrial Agricultural Other Low Income T&D Electrification

Energy Efficiency in California’s Public Power Sector — 2025 A-21
Major Program and Portfolio Changes
Retired the Proctor Engineering HVAC analysis, retrofit, and maintenance program for the
packaged HVAC throughout the City municipal buildings and replaced the program with the
Synergy Energy Efficiency (EE) Audit and Direct Installation (DI) for Residential and Non-
Residential Programs, which will initially focus on the hard to reach manufactured and mobile
home market. Future expansion of the program is planned for low income and disadvantaged
communities.
Program and Portfolio Highlights
The direct install Small Business Audit/Retrofit Program continues to provide the maximum
impact on meeting the needs of the harder-to-reach businesses and small retailers within the
service territory. These hard-to-reach customers have a very tight cash flow and are often
unable to participate in the rebate programs unless there is little to no up-front monetary
outlay. This program allows customers to immediately see the savings and avoid the initial cash
outlay associated with the typical rebate-type programs.
Commercial, Industrial & Agricultural Programs
• Business Partnership Program: Retrofit existing buildings and factories with high-
efficiency lighting, air conditioning, and process equipment.
• Free Energy Audits: Provide suggestions on the most energy-efficient equipment and
more cost-effective methods of operations.
• New Business Retrofit Program: Encourage the use of the most energy-efficient
equipment in the design and construction of new buildings and factories.
• Small Business Audit/Retrofit Program: Provide free utility audit, free LED retrofit, free
packaged A/C tune-ups, the first $1,500 free lighting retrofit, and recommendations for
further energy-saving measures with a corresponding 50% rebate up to a maximum
rebate of $10,000 per customer account.
• “The Proctor Engineering HVAC Tune-Up and Retrofit Program”: Provided free HVAC
tune-ups and HVAC equipment replacement recommendations.
Residential Programs
Home Weatherization and Residential EnergyStar® Appliance Rebate Program: Rebates are
offered for a variety of home weatherization measures and most high-efficiency appliances that
have the EnergyStar® rating, including but not limited to, refrigerators, air conditions, LED
Televisions and computer monitors, dishwashers, clothes washers, pool pumps, ceiling fans,
and various lighting measures.

Energy Efficiency in California’s Public Power Sector — 2025 A-22
Complementary Programs
• The Public Facilities Program is essentially the same as the current commercial and
industrial programs; therefore, they are included in the same category for funding and
savings.
• City Schools "Tinker" Program: Provides an interactive 5th-grade conservation
education program to all 5th-grade classes within the City of Azusa, both private and
public.
• Low-Income Programs: The Azusa Light & Water Low Income Assistance Program is
outlined in Rule No. 18 of Azusa Light & Water’s Rules and Regulations. Interested
customers are required to fill out an application and provide documentation of income.
In general, Azusa Light & Water’s guidelines for qualifying customers follow the low-
income thresholds used by the State.
• Research, Development, and Demonstration: Azusa Light & Water, jointly with the
Southern California Public Power Authority (SCPPA), is an active member of the APPA
DEED Program.
Evaluation, Measurement & Verification Studies
Azusa Light & Water contracted with Lincus Energy to complete a study of the various energy
efficiency programs and associated savings. The Lincus study is available on the CMUA website
and the Azusa Light & Water website.
14
Azusa Light & Water will continue to make EM&V
reports available to the CEC and other parties as they are completed and will continue with its
EM&V programs and practices in the future.
Major Differences or Diversions from CA POU TRM for Energy Savings
For savings, Azusa Light & Water uses a combination of figures from the POU TRM, E3, utility
work papers, and custom savings analysis, along with vendor calculations when applicable.
14
http://www.ci.azusa.ca.us/DocumentCenter/View/26058

Energy Efficiency in California’s Public Power Sector — 2025 A-23
TABLE Azusa-1. Energy Efficiency Program Results by End Use
Summary by End Use
Resource Savings Summary
Cost Test Results
End Use
Gross Peak
Savings (kW)
Gross Annual
Energy Savings
(kWh)
Gross Lifecycle
Energy Savings
(kWh)
Net Peak
Savings (kW)
Net Annual
Energy Savings
(kWh)
Net Lifecycle
Energy Savings
(kWh)
Net Lifecycle GHG
Reductions (Tons)
Total Utility
Cost
PAC
TRC
Utility
($/kWh)
Any
41
146,977
1,794,690
41
146,977
1,794,690
589
$50,915
3.72
10.68
0.036
Building Envelope
607
1,809,968
27,079,861
605
1,808,237
27,027,943
8,555
$1,359,458
2.13
10.40
0.067
Miscellaneous
134
352,240
3,406,568
134
352,240
3,406,568
1,194
$89,169
4.18
10.68
0.033
Water Pumping / Irrigation
30
266,744
800,232
30
266,744
800,232
311
$8,487
10.68
10.68
0.011
Energy Efficiency
812
2,575,929
33,081,351
810
2,574,198
33,029,433
10,649
$1,508,029
2.35
10.45
0.060
EE, Low Income and Electrification
812
2,575,929
33,081,351
810
2,574,198
33,029,433
10,649
$1,508,029
2.35
10.45
0.060
C&S and T&D
$0
Utility Total
812
2,575,929
33,081,351
810
2,574,198
33,029,433
10,649
$1,508,029
2.35
10.45
0.060
Energy Efficiency in California’s Public Power Sector — 2025 A-24
TABLE Azusa-2. Energy Efficiency Program Results by Sector
Summary by Sector
Resource Savings Summary
Cost Test Results
Sector
Gross Peak
Savings (kW)
Gross Annual
Energy Savings
(kWh)
Gross Lifecycle
Energy Savings
(kWh)
Net Peak
Savings (kW)
Net Annual
Energy Savings
(kWh)
Net Lifecycle
Energy Savings
(kWh)
Net Lifecycle GHG
Reductions (Tons)
Total Utility
Cost
PAC
TRC
Utility
($/kWh)
Commercial
567
1,774,572
26,452,536
567
1,774,572
26,452,536
8,358
$1,291,705
2.17
10.68
0.065
Industrial
31
26,743
367,735
31
26,743
367,735
124
$27,548
1.41
10.68
0.098
Other
143
557,812
3,994,544
143
557,812
3,994,544
1,357
$63,172
6.76
10.68
0.019
Residential
70
216,802
2,266,536
69
215,071
2,214,618
810
$125,604
2.16
8.32
0.075
Energy Efficiency
812
2,575,929
33,081,351
810
2,574,198
33,029,433
10,649
$1,508,029
2.35
10.45
0.060
EE, Low Income and Electrification
812
2,575,929
33,081,351
810
2,574,198
33,029,433
10,649
$1,508,029
2.35
10.45
0.060
C&S and T&D
$0
Utility Total
812
2,575,929
33,081,351
810
2,574,198
33,029,433
10,649
$1,508,029
2.35
10.45
0.060

Energy Efficiency in California’s Public Power Sector — 2025 A-25
TABLE Azusa-3. Energy Efficiency Program Results by Building Type
Summary by Building Type
Resource Savings Summary
Cost Test Results
Building Type
Gross Peak
Savings (kW)
Gross Annual
Energy Savings
(kWh)
Gross Lifecycle
Energy Savings
(kWh)
Net Peak
Savings (kW)
Net Annual
Energy Savings
(kWh)
Net Lifecycle
Energy Savings
(kWh)
Net Lifecycle GHG
Reductions (Tons)
Total Utility
Cost
PAC
TRC
Utility
($/kWh)
Any
667
1,953,152
28,125,572
667
1,953,152
28,125,572
8,921
$1,167,203
2.55
10.68
0.055
Other Agricultural
30
266,744
800,232
30
266,744
800,232
311
$8,487
10.68
10.68
0.011
Other Commercial
13
112,488
1,521,276
13
112,488
1,521,276
483
$179,187
0.92
10.68
0.153
Other Industrial
31
26,743
367,735
31
26,743
367,735
124
$27,548
1.41
10.68
0.098
Residential
70
216,802
2,266,536
69
215,071
2,214,618
810
$125,604
2.16
8.32
0.075
Energy Efficiency
812
2,575,929
33,081,351
810
2,574,198
33,029,433
10,649
$1,508,029
2.35
10.45
0.060
EE, Low Income and Electrification
812
2,575,929
33,081,351
810
2,574,198
33,029,433
10,649
$1,508,029
2.35
10.45
0.060
C&S and T&D
$0
Utility Total
812
2,575,929
33,081,351
810
2,574,198
33,029,433
10,649
$1,508,029
2.35
10.45
0.060

Energy Efficiency in California’s Public Power Sector — 2025 A-26
CITY OF BANNING ELECTRIC UTILITY
City of Banning Electric Utility at a Glance
• Climate Zone: 15
• Customers: 13,358
• Total annual retail sales: 145,496 MWh
• Annual Retail Revenue: $28,185,138
• Annual energy efficiency expenditures for reporting year: $232,588
• Gross annual savings from reporting year portfolio: 264 MWh
Banning Overview
During FY 23/24, Banning spent $302,408 in Energy Efficiency programs, which have provided
515,895 kWh of energy savings. It should be noted that the City of Banning is deemed an
economically disadvantaged area. A significant portion of the City’s population is either low-
income or senior citizens living on a fixed income. Due to the economic demographics of
Banning’s population, a significant portion of Public Benefits dollars are utilized to provide low-
income assistance through a monthly utility bill credit.
The master-planned community of Atwell continues to grow. To date, approximately 1,167
homes have been built totaling 3.2 MW of new roof-top solar, and adheres to 2019 Title 24
Construction Standards.
Residential, 264
Gross Energy Savings (MWh)
Residential Commercial Industrial Agricultural Other Low Income T&D Electrification

Energy Efficiency in California’s Public Power Sector — 2025 A-27
Major Program and Portfolio Changes
One of Banning’s new goals for FY 23/24 was to expand energy audits and direct installations of
efficiency measures beyond just our commercial customers. There is such a large population of
low-income as well as seniors who cannot afford our rebate programs. A new program to reach
commercial customers, low-income customers, single-family residences, and manufactured
homes has been gaining traction. In addition to many residential customers being served,
energy efficiency improvements and lighting measures for added safety have taken place within
our downtown corridor. These energy efficiency measures qualified under our Synergy Energy
Audit Measures or “S.E.A.M.” program.
We have many community outreach events planned and executed by our volunteer C.O.R.E.
(community, outreach, relations, and education) Team. Our C.O.R.E. Team actively partners
with other City of Banning departments and local organizations to focus on community
engagement and social equity. We have had several successful community events and continue
evaluating our programs and community-based activities to where we now have a roster of
regularly scheduled programs and community-centric events to be held on an annual basis.
One successful program that spurred from a partnership with our Parks and Recreation
Department is the "Keep Your Kool...At the Pool" program. During the summer of 2024, the City
of Banning Electric Utility sponsored Friday-night "Dive-In Movies" at the local Repplier Aquatic
Center. We had another very successful summer with attendance reaching capacity each week
and had a total of 2013 participants in attendance for the duration of the program. The goal of
this program was to educate attendees about the value of saving electricity from 4:00-10:00pm.
This behavior shaping is used to shave peak load when we no longer have an abundance of
solar energy. Keep Your Kool At the Pool entices residents to leave their homes to cool off in
the community pool rather than stay home and use their air conditioners. To ensure we had the
highest participation possible, we sponsored Dive-In Movies every Friday night in the summer
of 2024. The kWh savings equaled that of three residential customers' usage for an entire
month and helped to decrease the risk of Flex Alerts. This has become one of our C.O.R.E. Team
regularly scheduled summer programs and we look forward to continued success each summer.
Banning Electric Utility was proud to partner with the Arbor Day Foundation for our 4th annual
Energy-Saving Tree Event in the Spring of 2024. Customers accessed the Arbor Day Foundation
website and reserved up to two trees per household in a Banning Electric portal. A day was
scheduled for customers to pick up their reserved trees with planting and care instructions
given to ensure the successful growth of the trees. Some environmental impacts from our 2024
tree event are 287,458 lbs. of carbon sequestered, 592 lbs. of air pollution removed, 568,680
gallons of stormwater filtered, and $62,775 cumulative community benefits over a 20-year

Energy Efficiency in California’s Public Power Sector — 2025 A-28
period. We hope this will continue to be an annual event for years to come, and we already
have a waitlist that was started for the 2025 Energy-Saving Tree event.
In addition to the Energy-Saving Tree Program, we have partnered with our Parks and
Recreation Department as well the Pass Area Rotary Club, The San Gorgonio Boys and Girls
Club, the Banning Senior Center, as well as many other local nonprofit groups to for the past
two years to hold an Arbor Day Community Tree Planting event. Our Parks and Recreation
Department determines a local park or location that needs shade trees due to previous park
vandalism or community blight. We then determine the species, size and placement of trees
needed and come together on a scheduled date to plant the trees. The community
participation doubled last year when over 100 volunteers came together at our local Lions Park.
We planted trees to offer shade to park attendees, offer shade to vehicles parked along the
west-side of the park, as well as helped to develop our community canopy and beautify the
park. These benefits are in addition to the reduction of GHG emissions and reduction of air
pollution storm-drain runoff.
Banning Electric Utility was also instrumental in the development of an expansion for a pallet-
home community for the homeless. Entitled “Opportunity Village,” this small community for
the homeless consisted of portable, energy-efficient, two-person bungalows with heat, air
conditioning, and wall-mounted, fold-up beds, and has been very successful in providing shelter
to those in need who want to turn their lives around. Opportunity Village has had great success
and has become a model for other communities within the State of California who wish to offer
options to the homeless.
Program and Portfolio Highlights
• Renewable Portfolio Standard: In 2024, the City of Banning’s energy portfolio was
55.1% renewable. Steps have been taken to increase our renewable portfolio, which has
helped in making the City of Banning Electric Utility one of the most renewable utilities
in the state. This percentage has slightly declined, but is still an accomplishment we
have worked very diligently to achieve and are very proud of as a small municipal utility.
• Solar Energy: Banning has met its California SB1 requirements by providing $2.4 million
in rebates for the installation of solar photovoltaic systems in its service territory. The
rebates, coupled with Title 24 Construction Standards, have helped install
approximately 6.0 MW of customer-owned solar photovoltaic capacity in the city.
Banning previously met the NEM Cap of 2.3 MW in 2018.
Commercial, Industrial & Agricultural Programs
• Synergy Energy Audit Measures “S.E.A.M.”: Complimentary Energy Audits coupled with
complimentary measures for commercial customers such as efficiency upgrades and
retrofits such as lighting, refrigeration, motors, air conditioning tune-ups, etc.

Energy Efficiency in California’s Public Power Sector — 2025 A-29
• Commercial Programs: Monetary incentives for commercial customers to install more
energy-efficient equipment such as lighting, signage, or refrigeration. Customized rebate
programs have also been adopted when business-specific energy-efficiency measures
are implemented, and kWh and peak demand reduction are demonstrated.
• New Construction: Monetary incentives for new construction projects that exceed
energy efficiency above California’s Title 24 standards.
Residential Programs
• Air Conditioner: Monetary incentives to replace an existing central air conditioning unit
with a new high-efficiency unit.
• Air Conditioner Tune-Ups: Monetary incentives for getting air conditioning units tuned
up.
• EnergyStar® Appliances: Monetary incentives for purchasing products that meet the
Energy Star® criteria.
• EnergyStar® Refrigerator: A monetary incentive for replacing an old inefficient
refrigerator with a new energy-efficient unit.
• Recycling: Rebates offered to remove and recycle operating old and inefficient
refrigerators and freezers.
• Energy Weatherization: Monetary incentives to replace inefficient materials with
products that will improve the energy efficiency of their facility and reduce energy use.
• Shade Tree: Rebates offered to plant shade trees around homes to help reduce the
amount of energy used for air conditioning.
• Smart Thermostat: Rebates are offered for the installation of a programmable, WIFI-
enabled thermostat.
• Summer Savings Program: Rebates created to assist our low-income customers who
cannot afford a new air conditioner to cool off in the summer. These rebates are for box
fans, ceiling fans, and room a/c units to circulate the air and help stay cool during the
hot summer months.
Complementary Programs
• Low-Income Assistance: An electric utility discount for qualified customers. As
mentioned above, the majority of Public Benefits funds are spent to provide low-income
assistance. Currently, we have 955 customers on our Low-Income Assistance with
assistance totaling $372,450 during this FY.
• Medical Discount Program: An electric utility discount for qualified customers. This
program has approximately 516 customers and providing assistance of $154,800 during
this FY.

Energy Efficiency in California’s Public Power Sector — 2025 A-30
Evaluation, Measurement & Verification Studies
The City of Banning Electric Utility has hired third-party firms, such as Lincus, Inc., to perform
EM&V studies in previous years. The City will continue with its EM&V programs and practices.
Major Differences or Diversions from CA POU TRM for Energy Savings
The City of Banning uses CMUA measures. There are no major differences or diversions.

Energy Efficiency in California’s Public Power Sector — 2025 A-31
TABLE Banning-1. Energy Efficiency Program Results by End Use
Summary by End Use
Resource Savings Summary
Cost Test Results
End Use
Gross Peak
Savings (kW)
Gross Annual
Energy Savings
(kWh)
Gross Lifecycle
Energy Savings
(kWh)
Net Peak
Savings (kW)
Net Annual
Energy Savings
(kWh)
Net Lifecycle
Energy Savings
(kWh)
Net Lifecycle GHG
Reductions (Tons)
Total Utility
Cost
PAC
TRC
Utility
($/kWh)
Any
50
143,040
1,430,400
40
114,432
1,144,320
420
$99,639
1.32
1.32
0.105
Appliance & Plug Loads
0
6,487
61,169
0
6,163
58,111
18
$2,182
2.76
1.86
0.046
Building Envelope
32
32,827
655,037
24
18,187
363,316
127
$14,348
4.55
6.13
0.058
HVAC - Cooling
7
19,639
258,134
6
15,411
210,594
82
$57,093
0.83
1.59
0.358
Lighting - Outdoor
2
497
2,485
1
268
1,342
1
$1,713
0.09
0.12
1.391
Miscellaneous
0
61,500
1,230,000
0
49,200
984,000
355
$57,613
1.86
1.86
0.086
Energy Efficiency
92
263,991
3,637,226
72
203,661
2,761,683
1,002
$232,588
1.54
1.77
0.112
EE, Low Income and Electrification
92
263,991
3,637,226
72
203,661
2,761,683
1,002
$232,588
1.54
1.77
0.112
C&S and T&D
$0
Utility Total
92
263,991
3,637,226
72
203,661
2,761,683
1,002
$232,588
1.54
1.77
0.112

Energy Efficiency in California’s Public Power Sector — 2025 A-32
TABLE Banning-2. Energy Efficiency Program Results by Sector
Summary by Sector
Resource Savings Summary
Cost Test Results
Sector
Gross Peak
Savings (kW)
Gross Annual
Energy Savings
(kWh)
Gross Lifecycle
Energy Savings
(kWh)
Net Peak
Savings (kW)
Net Annual
Energy Savings
(kWh)
Net Lifecycle
Energy Savings
(kWh)
Net Lifecycle GHG
Reductions (Tons)
Total Utility
Cost
PAC
TRC
Utility
($/kWh)
Residential
92
263,991
3,637,226
72
203,661
2,761,683
1,002
$232,588
1.54
1.77
0.112
Energy Efficiency
92
263,991
3,637,226
72
203,661
2,761,683
1,002
$232,588
1.54
1.77
0.112
EE, Low Income and Electrification
92
263,991
3,637,226
72
203,661
2,761,683
1,002
$232,588
1.54
1.77
0.112
C&S and T&D
$0
Utility Total
92
263,991
3,637,226
72
203,661
2,761,683
1,002
$232,588
1.54
1.77
0.112
Energy Efficiency in California’s Public Power Sector — 2025 A-33
TABLE Banning-3. Energy Efficiency Program Results by Building Type
Summary by Building Type
Resource Savings Summary
Cost Test Results
Building Type
Gross Peak
Savings (kW)
Gross Annual
Energy Savings
(kWh)
Gross Lifecycle
Energy Savings
(kWh)
Net Peak
Savings (kW)
Net Annual
Energy Savings
(kWh)
Net Lifecycle
Energy Savings
(kWh)
Net Lifecycle GHG
Reductions (Tons)
Total Utility
Cost
PAC
TRC
Utility
($/kWh)
Any
4
66,861
1,259,254
2
53,710
1,008,878
364
$60,653
1.81
1.84
0.088
Multiple
50
144,913
1,447,753
40
114,432
1,144,320
420
$99,920
1.32
1.32
0.106
Residential
38
51,529
921,564
29
34,978
601,376
216
$71,551
1.60
2.74
0.167
Residential - Single-Family
0
688
8,655
0
541
7,110
3
$464
1.99
2.40
0.084
Energy Efficiency
92
263,991
3,637,226
72
203,661
2,761,683
1,002
$232,588
1.54
1.77
0.112
EE, Low Income and Electrification
92
263,991
3,637,226
72
203,661
2,761,683
1,002
$232,588
1.54
1.77
0.112
C&S and T&D
$0
Utility Total
92
263,991
3,637,226
72
203,661
2,761,683
1,002
$232,588
1.54
1.77
0.112

Energy Efficiency in California’s Public Power Sector — 2025 A-34
CITY OF BIGGS
City of Biggs at a Glance
• Climate Zone: 11
• Customers: 694
• Total annual retail sales: 4,997 MWh
• Annual Retail Revenue: $1,000,938
• Annual energy efficiency expenditures for reporting year: $0
• Gross annual savings from reporting year portfolio: 0 MWh
City of Biggs Overview
The City of Biggs is primarily a small residential city with one large industrial customer. A
significant portion of the City's population is either low-income or senior citizens living on fixed
incomes.
Complementary Programs
Low-Income Programs: Biggs works with Community Action Agency of Butte County to provide
Home Energy Assistance Program (HEAP) grants to income-qualified households within our
service territory. Complimentary on-site energy audits are performed by our partner, Efficiency
Services Group, to resolve high usage complaints.
Gross Energy Savings (MWh)
Residential Commercial Industrial Agricultural Other Low Income T&D Electrification
Energy Efficiency in California’s Public Power Sector — 2025 A-35
TABLE Biggs-1. Energy Efficiency Program Results by End Use
Summary by End Use
Resource Savings Summary
Cost Test Results
End Use
Gross Peak
Savings (kW)
Gross Annual
Energy Savings
(kWh)
Gross Lifecycle
Energy Savings
(kWh)
Net Peak
Savings (kW)
Net Annual
Energy Savings
(kWh)
Net Lifecycle
Energy Savings
(kWh)
Net Lifecycle GHG
Reductions (Tons)
Total Utility
Cost
PAC
TRC
Utility
($/kWh)
HVAC - Cooling
0
0
0
0
0
0
0
$0
0.000
Energy Efficiency
0
0
0
0
0
0
0
$0
0.000
EE, Low Income and Electrification
0
0
0
0
0
0
0
$0
0.000
C&S and T&D
$0
Utility Total
0
0
0
0
0
0
0
$0
0.000
Energy Efficiency in California’s Public Power Sector — 2025 A-36
TABLE Biggs-2. Energy Efficiency Program Results by Sector
Summary by Sector
Resource Savings Summary
Cost Test Results
Sector
Gross Peak
Savings (kW)
Gross Annual
Energy Savings
(kWh)
Gross Lifecycle
Energy Savings
(kWh)
Net Peak
Savings (kW)
Net Annual
Energy Savings
(kWh)
Net Lifecycle
Energy Savings
(kWh)
Net Lifecycle GHG
Reductions (Tons)
Total Utility
Cost
PAC
TRC
Utility
($/kWh)
Commercial
0
0
0
0
0
0
0
$0
0.000
Energy Efficiency
0
0
0
0
0
0
0
$0
0.000
EE, Low Income and Electrification
0
0
0
0
0
0
0
$0
0.000
C&S and T&D
$0
Utility Total
0
0
0
0
0
0
0
$0
0.000
Energy Efficiency in California’s Public Power Sector — 2025 A-37
TABLE Biggs-3. Energy Efficiency Program Results by Building Type
Summary by Building Type
Resource Savings Summary
Cost Test Results
Building Type
Gross Peak
Savings (kW)
Gross Annual
Energy Savings
(kWh)
Gross Lifecycle
Energy Savings
(kWh)
Net Peak
Savings (kW)
Net Annual
Energy Savings
(kWh)
Net Lifecycle
Energy Savings
(kWh)
Net Lifecycle GHG
Reductions (Tons)
Total Utility
Cost
PAC
TRC
Utility
($/kWh)
Warehouse - Refrigerated
0
0
0
0
0
0
0
$0
0.000
Energy Efficiency
0
0
0
0
0
0
0
$0
0.000
EE, Low Income and Electrification
0
0
0
0
0
0
0
$0
0.000
C&S and T&D
$0
Utility Total
0
0
0
0
0
0
0
$0
0.000

Energy Efficiency in California’s Public Power Sector — 2025 A-38
BURBANK WATER & POWER
Burbank Water & Power at a Glance
• Climate Zone: 9
• Customers: 53,153
• Total annual retail sales: 942,640 MWh
• Annual Retail Revenue: $173,452,000
• Annual energy efficiency expenditures for reporting year: $1,571,121
• Gross annual savings from reporting year portfolio: 8,425 MWh
Burbank Water & Power Overview
Burbank Water & Power (BWP) provides electric, water, and fiber optic network services to its
customers.
Burbank is home to major entertainment companies such as The Walt Disney Company, Warner
Bros Studios, The Burbank Studios, Nickelodeon, Cartoon Network, ABC Studios, Netflix, and
KCET. There are also numerous small media businesses in the City of Burbank. Burbank also
features unique shopping and dining neighborhoods like Downtown Burbank and Magnolia
Park. The Empire Center, the Burbank Town Center, and one of North America’s largest IKEAs
are also in Burbank.
Residential, 3,755
Commercial, 4,669
Low Income, 1
Gross Energy Savings (MWh)
Residential Commercial Industrial Agricultural Other Low Income T&D Electrification

Energy Efficiency in California’s Public Power Sector — 2025 A-39
The residential community of Burbank consists of about 22,000 single-family homes that range
from post-war bungalows to two-story homes. There are also about 24,000 multi-family
dwellings, and the number of multi-family homes continues increasing with infill and high-
density development. Burbank is in California's Climate Zone 9.
The Integrated Resource Plan (IRP), adopted by the Burbank City Council in November 2023,
directs BWP to reduce GHG emissions by implementing energy efficiency, demand response
programs, beneficial electrification programs, and integrating carbon-free energy.
BWP actively promotes Transportation Electrification by offering educational initiatives and
programs, including the Used Electric Vehicle (EV) Rebate Program, Residential EV Charger
Rebate Program, and Commercial EV Charger Rebate Program. BWP is also committed to
making public charging easy. BWP owns and operates 107 public charging ports in Burbank.
Major Program and Portfolio Changes
During FY 2023-2024, a number of BWP's customer efficiency programs had gaps in services
due to vendors that ceased operations in the region or contracting delays. These programs
include: AC Replace Before it Breaks, Business Bucks, and the low-income Refrigerator
Exchange.
BWP's Business Rebates saw an increase in savings which can be partly attributed to the hiring
of a dedicated Key Accounts Manager who promoted BWP's programs to large and extra-large
business customers.
Program and Portfolio Highlights
BWP manages a comprehensive program portfolio that delivers value to Burbank residents and
businesses. Programs focus on energy efficiency, behavioral-based savings, peak load
reduction, low-income assistance, and clean technologies that mitigate greenhouse gas
emissions. BWP continues to strive for increased participation in existing energy efficiency
programs and launch new programs to increase savings. Programs must have the customer in
mind, as their success is ultimately dependent on the customer's actions.
The Home Improvement Program (HIP) continues to be one of the most popular residential
programs. This program includes energy and water surveys, installation of both energy and
water-saving measures, and home weatherization services, available to all single-family and
multi-family customers in Burbank. The HIP services are provided at no cost to BWP customers,
with all energy-water efficiency measures prioritized based on their cost-effectiveness.
Commercial, Industrial & Agricultural Programs
• Business Rebates: Businesses in Burbank can receive a rebate from the Business Rebates
program by retiring inefficient equipment and installing new energy-efficient

Energy Efficiency in California’s Public Power Sector — 2025 A-40
equipment. BWP offers a menu of deemed incentives and an option for a custom rebate
based on annual energy savings achieved.
• Business Bucks Program: The program offers small and mid-sized businesses an energy
efficiency survey and retrofits.
• LED Street Lighting Project: The program provides incentives for replacing inefficient
high-pressure sodium (HPS) streetlights with energy-efficient LEDs.
Residential Programs
• Home Rewards Rebate Program: BWP provides rebates for purchasing and installing
ENERGY STAR® rated appliances and high-efficiency measures.
• Home Improvement Program: The program offers energy-water surveys, energy-water
measures installation, and home weatherization services to all Burbank single-family
and multi-family customers.
• Energy Saving Trees Program: The program from the Arbor Day Foundation provides a
one-stop shop for residential and commercial customers to learn about the benefits of
shade trees and get complimentary shade trees delivered to their property for planting.
When properly sited, mature shade trees provide shade that helps reduce air
conditioning costs and loads on the grid.
• Student Energy and Water Education Program: The program provides energy and water
education services, materials, and conservation kits to sixth-grade students attending
public schools in Burbank.
• OPower Web Portal: Residential customers can access their electric usage information
through the Opower Web Portal to better understand their energy usage and reduce
their electricity consumption.
• Home Energy Reports: The program provides energy reports to residential customers on
their energy usage and educates them about more energy-efficient usage within a home
through feedback and tips.
• Weekly Energy Updates: The program provides a weekly email report to residential
customers to inform them about their energy usage patterns and trends.
• High Bill Alerts: The program uses AMI data to help customers save energy and money
when they are likely to use more energy than usual.
• AC Replace Before It Breaks Program: This mid-stream incentive program provided
HVAC replacement incentives to residential customers to help them save energy by
ensuring that their air conditioning system is operating at the optimal level. The
program stopped during this FY due to the vendor ceasing operations in the region.
• Low-income Refrigerator Exchange: BWP offered income-qualified and Lifeline-
approved customers a program to replace an old inefficient refrigerator with a new
ENERGY STAR® certified refrigerator at no cost. This program was suspended in late
2023 due to the vendor ending its operations in Southern California.

Energy Efficiency in California’s Public Power Sector — 2025 A-41
Complementary Programs
• Lifeline Program: Offers a reduced electric rate for low-income qualified senior or
disabled customers.
• Life Support Program: Offers low-income qualified customers with life support
equipment an exemption from the utility user tax.
• Project Share Program: Offers income-qualified customers a one-time yearly stipend
towards their utility bills. The program is funded by community donations.
• Charging Station Rebates: Customers who install a Level 1 smart outlet, Level 2 (240V)
EV charger or DC Fast Charger are eligible for a rebate from BWP. Residential customers
can get a reimbursement for up to $1,500 per charging port for their home, and
commercial customers can get a rebate for up to $20,000 per charging port for their
business.
• Used EV Rebates: To support the adoption of EVs, the program offers residential
customers a $1,000 rebate towards a pre-owned EV purchase. It is designed for
customers who prefer pre-owned EVs or have income constraints to acquire a new EV.
Evaluation, Measurement & Verification Studies
BWP is committed to providing cost-effective, ongoing EM&V efforts for its energy efficiency
programs. EM&V costs are covered in the individual program budgets. Conservation staff and
the Key Account Manager review all program applications for completeness and accuracy. To
support EM&V activities, in-person inspections are completed for Business Rebates.
Major Differences or Diversions from CA POU TRM for Energy Savings
The majority of energy savings values used to evaluate BWP's programs are sourced from the
Technical Reference Manual (TRM), developed for California's Publicly Owned Utilities (POUs).
In cases where a particular measure is not listed in the TRM, BWP typically relies on a verified
utility work paper or custom savings analysis, supplemented by vendor calculations to estimate
energy savings.

Energy Efficiency in California’s Public Power Sector — 2025 A-42
TABLE BWP-1. Energy Efficiency Program Results by End Use
Summary by End Use
Resource Savings Summary
Cost Test Results
End Use
Gross Peak
Savings (kW)
Gross Annual
Energy Savings
(kWh)
Gross Lifecycle
Energy Savings
(kWh)
Net Peak
Savings (kW)
Net Annual
Energy Savings
(kWh)
Net Lifecycle
Energy Savings
(kWh)
Net Lifecycle GHG
Reductions (Tons)
Total Utility
Cost
PAC
TRC
Utility
($/kWh)
Any
1,216
4,506,206
67,593,090
1,216
4,506,206
67,593,090
21,482
$828,737
14.73
2.63
0.016
Appliance & Plug Loads
1
37,573
415,481
1
37,573
415,481
145
$20,577
2.61
0.51
0.061
Building Envelope
19
152,824
3,054,977
19
152,824
3,054,977
674
$12,731
15.12
3.55
0.006
HVAC - Cooling
36
74,235
1,476,925
36
74,235
1,476,925
570
$121,095
2.82
0.53
0.125
Lighting - Outdoor
4
18,000
360,000
4
18,000
360,000
165
$4,941
14.20
0.49
0.020
Miscellaneous
245
3,635,265
14,167,640
245
3,635,265
14,167,640
4,493
$556,536
2.32
1.04
0.044
Energy Efficiency
1,522
8,424,103
87,068,113
1,522
8,424,103
87,068,113
27,529
$1,544,618
9.17
2.07
0.023
Appliance & Plug Loads
0
924
4,620
0
924
4,620
2
$2,624
0.28
0.28
0.619
Low-Income
0
924
4,620
0
924
4,620
2
$2,624
0.28
0.28
0.619
EE, Low Income and Electrification
1,522
8,425,027
87,072,733
1,522
8,425,027
87,072,733
27,530
$1,547,241
9.15
2.07
0.023
Codes & Standards
175
648,533
3,242,665
175
648,533
3,242,665
1,151
$23,880
22.34
22.34
0.008
Codes & Standards
175
648,533
3,242,665
175
648,533
3,242,665
1,151
$23,880
22.34
22.34
0.008
C&S and T&D
175
648,533
3,242,665
175
648,533
3,242,665
1,151
$23,880
22.34
22.34
0.008
Utility Total
1,697
9,073,560
90,315,398
1,697
9,073,560
90,315,398
28,682
$1,571,121
9.35
2.14
0.022

Energy Efficiency in California’s Public Power Sector — 2025 A-43
TABLE BWP-2. Energy Efficiency Program Results by Sector
Summary by Sector
Resource Savings Summary
Cost Test Results
Sector
Gross Peak
Savings (kW)
Gross Annual
Energy Savings
(kWh)
Gross Lifecycle
Energy Savings
(kWh)
Net Peak
Savings (kW)
Net Annual
Energy Savings
(kWh)
Net Lifecycle
Energy Savings
(kWh)
Net Lifecycle GHG
Reductions (Tons)
Total Utility
Cost
PAC
TRC
Utility
($/kWh)
Commercial
1,275
4,668,864
69,255,012
1,275
4,668,864
69,255,012
22,070
$955,237
13.13
2.55
0.018
Residential
247
3,755,239
17,813,101
247
3,755,239
17,813,101
5,458
$589,380
2.75
0.85
0.039
Energy Efficiency
1,522
8,424,103
87,068,113
1,522
8,424,103
87,068,113
27,529
$1,544,618
9.17
2.07
0.023
Residential
0
924
4,620
0
924
4,620
2
$2,624
0.28
0.28
0.619
Low-Income
0
924
4,620
0
924
4,620
2
$2,624
0.28
0.28
0.619
EE, Low Income and Electrification
1,522
8,425,027
87,072,733
1,522
8,425,027
87,072,733
27,530
$1,547,241
9.15
2.07
0.023
Other
175
648,533
3,242,665
175
648,533
3,242,665
1,151
$23,880
22.34
22.34
0.008
Codes & Standards
175
648,533
3,242,665
175
648,533
3,242,665
1,151
$23,880
22.34
22.34
0.008
C&S and T&D
175
648,533
3,242,665
175
648,533
3,242,665
1,151
$23,880
22.34
22.34
0.008
Utility Total
1,697
9,073,560
90,315,398
1,697
9,073,560
90,315,398
28,682
$1,571,121
9.35
2.14
0.022

Energy Efficiency in California’s Public Power Sector — 2025 A-44
TABLE BWP-3. Energy Efficiency Program Results by Building Type
Summary by Building Type
Resource Savings Summary
Cost Test Results
Building Type
Gross Peak
Savings (kW)
Gross Annual
Energy Savings
(kWh)
Gross Lifecycle
Energy Savings
(kWh)
Net Peak
Savings (kW)
Net Annual
Energy Savings
(kWh)
Net Lifecycle
Energy Savings
(kWh)
Net Lifecycle GHG
Reductions (Tons)
Total Utility
Cost
PAC
TRC
Utility
($/kWh)
Any
1,275
4,668,864
69,255,012
1,275
4,668,864
69,255,012
22,070
$955,237
13.13
2.55
0.018
Residential
245
3,687,132
16,791,456
245
3,687,132
16,791,456
5,181
$566,411
2.73
0.86
0.040
Residential - Single-Family
2
68,108
1,021,645
2
68,108
1,021,645
277
$22,969
3.22
0.63
0.031
Energy Efficiency
1,522
8,424,103
87,068,113
1,522
8,424,103
87,068,113
27,529
$1,544,618
9.17
2.07
0.023
Residential
0
924
4,620
0
924
4,620
2
$2,624
0.28
0.28
0.619
Low-Income
0
924
4,620
0
924
4,620
2
$2,624
0.28
0.28
0.619
EE, Low Income and Electrification
1,522
8,425,027
87,072,733
1,522
8,425,027
87,072,733
27,530
$1,547,241
9.15
2.07
0.023
Any
175
648,533
3,242,665
175
648,533
3,242,665
1,151
$23,880
22.34
22.34
0.008
Codes & Standards
175
648,533
3,242,665
175
648,533
3,242,665
1,151
$23,880
22.34
22.34
0.008
C&S and T&D
175
648,533
3,242,665
175
648,533
3,242,665
1,151
$23,880
22.34
22.34
0.008
Utility Total
1,697
9,073,560
90,315,398
1,697
9,073,560
90,315,398
28,682
$1,571,121
9.35
2.14
0.022

Energy Efficiency in California’s Public Power Sector — 2025 A-45

Energy Efficiency in California’s Public Power Sector — 2025 A-46
COLTON ELECTRIC UTILITY
Colton Electric Utility at a Glance
• Climate Zone: 10
• Customers: 22,377
• Total annual retail sales: 332,240 MWh
• Annual Retail Revenue: $81,609,216
• Annual energy efficiency expenditures for reporting year: $353,954
• Gross annual savings from reporting year portfolio: 5,217 MWh
Colton Electric Utility Overview
Colton Electric Utility (CEU) was established by Ordinance 119 on October 17th, 1895. For 130
years, CEU has been committed to providing cost-effective, reliable power and EE programs for
the Colton Electric Service territory. CEU proactively pursues new strategies to engage residents
and businesses to participate in EE programs. CEU continues to focus on reducing demand on
the grid through energy efficiency rebates, direct EE installation programs, inter-utility
partnerships with Southern California Gas Company, programs to serve the low-income, and
education and outreach.
Residential, 5,051
Commercial, 166
Gross Energy Savings (MWh)
Residential Commercial Industrial Agricultural Other Low Income T&D Electrification

Energy Efficiency in California’s Public Power Sector — 2025 A-47
Major Program and Portfolio Changes
CEU does not have any major program changes in this reporting year.
The Energy Services team continues to market and provide more online services for a growing
population of computer-literate customers.
Program and Portfolio Highlights
Arbor Day Foundation Energy tree saving program is a community favorite. Every Earth Day in
April, CEU offers residents 200 free shade trees to advance energy savings by shading their
property. The program uses GIS location software that calculates the kWh savings based on the
property location where the resident plants a tree. Once the program is complete the utility
tracks all the energy savings year over year and is provided the shape file for the City's Urban
Forestry Management plan. This program not only helps clean our water supply, reduces soil
erosion and reduces the heat island effect it.
Commercial, Industrial & Agricultural Programs
EE Rebates Non-Residential: Commercial and industrial customers participating in lighting and
equipment upgrades and custom measures were rebated $0.10 per kWh saved on the
projected first year’s savings.
• Municipal Direct Install: This program provided direct installation of energy efficiency
measures throughout City owned facilities.
• Commercial DI: Small business customers with less than 20 kW of demand participated
in an energy audit and direct install of EE measures up to $5,000 per business.
• The Commercial/Industrial Energy Rebate Program provides rebates to
commercial/industrial customers that install new energy efficiency equipment from
lighting upgrades to programs specific to the customer’s business. The amount of the
rebate depends upon the annual energy savings.
• Lighting and Equipment Upgrade Rebates: Commercial and industrial buildings can
benefit from substantial rebates given for improving lighting and equipment by
increasing energy efficiency and lowering consumption. CEU offers $.10 per kWh saved
on the projected first year of savings.
• Commercial Energy Audit: Commercial businesses can participate in CEU commercial
energy audit ASHRAE I or level II. Businesses who participate in this audit can be eligible
for additional direct install opportunities depending on audit recommendations. This is a
program to assist businesses who are concerned with their energy consumption and
want to learn how they can minimize their usage, shift their load, and save on energy
costs.
• Multifamily Energy Efficiency Direct Install Program: apartment complexes throughout
CEU territory can apply to have common area EE upgrades in lighting, thermostats, and
AC tune-ups.

Energy Efficiency in California’s Public Power Sector — 2025 A-48
• Sustainability Partners: Colton Sustainability partners are champions of the
environment, stewards of efficiency, and are committed to the goals of our community.
As a partner, a business demonstrates civic pride, a dedication to sustainability and
actively seek out incentives that benefit both the business and the community at large.
CEU will celebrate the business proactive vision. There are three ways to become a
partner:
1. Energy Efficiency – Equipment upgrades, demand-side management, renewables
2. Water Conservation – Drought tolerant landscaping, installation of water-
efficient devices (such as smart irrigation controllers)
3. Recycling – Participation in the Commercial Recycling Program, innovative
implementation of Commercial/Industrial Recycling & Organics program.
Residential Programs
Energy Efficiency (EE) Upgrade Rebates: CEU offers a variety of rebates on several home energy
efficiency improvements. Currently CEU offers rebates on: Occupancy sensors, energy star
ceiling fans, pool pumps, solar attic fans, whole house fans, room ACs, evaporative coolers,
solar tube lights, energy star clothes washers, energy star dishwasher and energy star
refrigerators, and smart thermostats. Customers who participate in the rebate program will
experience a reduction in their annual energy costs. Additional programs listed below:
• AC Tune-Up Rebate: This program offers a rebate for preventative maintenance on
residential customer AC units up to 5 tons in size. The program requires the customer to
select their own licensed AC contractor that will replace filters, check refrigerant levels
and adjust the AC unit to minimize seasonal air conditioning costs.
• Air Conditioner Upgrade and Replacement Program: This program offers up to $150/ton
rebate to replace an old AC with a SEER2 15.3 or higher AC system. Upgrading AC
systems will significantly lower residential customer’s energy costs.
• Online Energy Audit: Colton Electric Utility’s new online energy assessment tool assists
customers to find ways to save energy and money. The MyEnergyXpert is easy to use
and designed to be completed in just a few minutes. This assessment tool provides an
easy-to-follow improvement plan. Residents will also be connected to rebates available
through the online platform that also links to the web shop.
• Residential Energy Audit: CEU residential customers with energy usage of over 10,000
kWh annually can qualify to participate in a residential energy audit. Participants can be
eligible for additional direct install opportunities depending on audit recommendations.
Customers who previously participated in an energy audit in the past two years with
over 10,000 kWh of usage can participate in up to $500 of direct install measured
recommendations.
• Residential WebShop: CEU residents can now purchase LED light bulbs, smart power
strips, holiday lights and smart thermostats from the comfort of their own home. CEU
provides up to $50.00 per FY to buy down the cost of these items and provides free

Energy Efficiency in California’s Public Power Sector — 2025 A-49
shipping. The customer can order directly from CEU’s website and the items are shipped
directly to the customer’s home.
• Residential Weatherization Rebates: CEU offers residential customers rebates for
installing replacement windows and insulation in their homes. Windows must meet
Energy Star approval with a U-Factor less than 0.35 and SHGC less than 0.30 at a rebate
amount of $4.00 per sq. ft. Insulation may be added to the attic, and/or exterior walls.
Rebates will also be provided for radiant barriers installed within the attic space.
Insulation and radiant barrier must meet the following R-Values:
o Attic Insulation - Minimum R-30 Rebate is $0.40 per sq. ft.
o Radiant Barrier - Minimum R-19 Rebate is $0.30 per sq. ft.
o Exterior Walls - Minimum R-13 Rebate is $0.20 per sq. ft.
• Treebate: CEU residents are offered up to $50.00 a tree to plant an approved tree on
their property that would reduce their energy bill by providing shade to their home.
Residents have a maximum of 5 trees in a lifetime.
Complementary Programs
• Electric Vehicles: CEU continues to grow its EV program. The utility currently has 18
level II public chargers available, an EV incentive rate which adds 250 kWh to residential
2nd Tier of energy, a used EV rebate of $1000 and a low-income rebate of $1500 and an
EV charger rebate of $500 for level II chargers. CEU also installed 7 Level II chargers for
fleet and one 50kW fast charger. CEU continues to work on facilitating the state
incentives to expand fleet electric vehicles with participation in LCFS and developing
rebate programs to incentivize customers to participate.
• Energy Storage: Colton Electric Utility participates in an energy storage working group
through SCPPA. Energy storage is being renewed for future participation. CEU has
purchased 8 Ice Bear thermal energy storage units for installation in 2018 as part of a
trial project.
• Electrification incentives: CEU will continue to explore incentive programs to reduce
GHG emissions through electrification. Heat pump water heaters are being evaluated
for a future incentive.
Evaluation, Measurement & Verification Studies
CEU contracts with Alternative Energy Services Consulting (AESC) annually to complete CEU
programs studies of the residential and commercial program and associated savings. Current
studies are available on CEU’s website.
15
CEU will continue to make EM&V reports available to
the CEC and other parties as they are completed and will continue with its EM&V programs and
practices in the future, budgeting $10,000 per year.
15
www.ci.colton.ca.us/DocumentCenter/View/3225

Energy Efficiency in California’s Public Power Sector — 2025 A-50
Major Differences or Diversions from CA POU TRM for Energy Savings
The sources used to calculate program performance were the TRM and DEER data. The TRM vs.
2.4.4 was utilized for all measures that get updated in all Title 24 code changes.
Energy Efficiency in California’s Public Power Sector — 2025 A-51
TABLE CEU-1. Energy Efficiency Program Results by End Use
Summary by End Use
Resource Savings Summary
Cost Test Results
End Use
Gross Peak
Savings (kW)
Gross Annual
Energy Savings
(kWh)
Gross Lifecycle
Energy Savings
(kWh)
Net Peak
Savings (kW)
Net Annual
Energy Savings
(kWh)
Net Lifecycle
Energy Savings
(kWh)
Net Lifecycle GHG
Reductions (Tons)
Total Utility
Cost
PAC
TRC
Utility
($/kWh)
Appliance & Plug Loads
1
15,824
185,688
0
4,934
67,241
22
$255
29.03
3.12
0.005
Building Envelope
2
13,236
264,724
1
3,706
74,123
17
$76
29.03
0.00
0.002
HVAC - Cooling
536
3,391,484
83,569,050
466
3,375,196
83,405,460
29,746
$319,896
29.03
3.58
0.006
Lighting - Indoor
84
689,306
3,537,447
51
376,580
1,973,815
786
$8,018
29.03
0.62
0.004
Lighting - Outdoor
6,498
89,301
1,339,516
6,498
89,301
1,339,516
625
$5,229
29.03
1.00
0.005
Miscellaneous
11
1,017,730
10,177,305
11
1,017,730
10,177,305
2,575
$20,479
29.03
29.00
0.002
Energy Efficiency
7,132
5,216,883
99,073,731
7,027
4,867,448
97,037,460
33,771
$353,954
29.03
0.60
0.006
EE, Low Income and Electrification
7,132
5,216,883
99,073,731
7,027
4,867,448
97,037,460
33,771
$353,954
29.03
0.60
0.006
C&S and T&D
$0
Utility Total
7,132
5,216,883
99,073,731
7,027
4,867,448
97,037,460
33,771
$353,954
29.03
0.60
0.006

Energy Efficiency in California’s Public Power Sector — 2025 A-52
TABLE CEU-2. Energy Efficiency Program Results by Sector
Summary by Sector
Resource Savings Summary
Cost Test Results
Sector
Gross Peak
Savings (kW)
Gross Annual
Energy Savings
(kWh)
Gross Lifecycle
Energy Savings
(kWh)
Net Peak
Savings (kW)
Net Annual
Energy Savings
(kWh)
Net Lifecycle
Energy Savings
(kWh)
Net Lifecycle GHG
Reductions (Tons)
Total Utility
Cost
PAC
TRC
Utility
($/kWh)
Commercial
6,509
165,551
2,106,083
6,509
165,551
2,106,083
888
$8,486
29.03
1.54
0.005
Residential
623
5,051,331
96,967,647
518
4,701,896
94,931,376
32,883
$345,468
29.03
0.59
0.006
Energy Efficiency
7,132
5,216,883
99,073,731
7,027
4,867,448
97,037,460
33,771
$353,954
29.03
0.60
0.006
EE, Low Income and Electrification
7,132
5,216,883
99,073,731
7,027
4,867,448
97,037,460
33,771
$353,954
29.03
0.60
0.006
C&S and T&D
$0
Utility Total
7,132
5,216,883
99,073,731
7,027
4,867,448
97,037,460
33,771
$353,954
29.03
0.60
0.006
Energy Efficiency in California’s Public Power Sector — 2025 A-53
TABLE CEU-3. Energy Efficiency Program Results by Building Type
Summary by Building Type
Resource Savings Summary
Cost Test Results
Building Type
Gross Peak
Savings (kW)
Gross Annual
Energy Savings
(kWh)
Gross Lifecycle
Energy Savings
(kWh)
Net Peak
Savings (kW)
Net Annual
Energy Savings
(kWh)
Net Lifecycle
Energy Savings
(kWh)
Net Lifecycle GHG
Reductions (Tons)
Total Utility
Cost
PAC
TRC
Utility
($/kWh)
Any
74
681,700
3,419,117
40
368,685
1,851,165
739
$7,553
29.03
0.60
0.004
Lodging - Hotel
10
74,688
746,880
10
74,688
746,880
256
$3,185
29.03
29.03
0.005
Office - Large
0
423
10,571
0
423
10,571
4
$36
29.03
0.20
0.006
Other Commercial
6,498
89,301
1,339,516
6,498
89,301
1,339,516
625
$5,229
29.03
1.00
0.005
Residential
3
16,387
302,222
1
5,031
90,965
21
$118
29.03
0.42
0.002
Residential - Single-Family
547
4,354,384
93,255,425
477
4,329,320
92,998,363
32,125
$337,834
29.03
0.59
0.006
Energy Efficiency
7,132
5,216,883
99,073,731
7,027
4,867,448
97,037,460
33,771
$353,954
29.03
0.60
0.006
EE, Low Income and Electrification
7,132
5,216,883
99,073,731
7,027
4,867,448
97,037,460
33,771
$353,954
29.03
0.60
0.006
C&S and T&D
$0
Utility Total
7,132
5,216,883
99,073,731
7,027
4,867,448
97,037,460
33,771
$353,954
29.03
0.60
0.006

Energy Efficiency in California’s Public Power Sector — 2025 A-54
CORONA DEPARTMENT OF WATER & POWER
Corona Department of Water & Power at a Glance
• Climate Zone: 10
• Customers: 1,839
• Total annual retail sales: 79,760 MWh
• Annual Retail Revenue: $10,790,000
• Annual energy efficiency expenditures for reporting year: $0
• Gross annual savings from reporting year portfolio (MWh): 0
Corona Department of Water & Power Overview
• Customers reside in climate zone 10.
• Established in 2001 with unbundled generation services to existing investor-owned
utility customers and bundled service to customers that continue to build new facilities
located in the designated service territory.
• Peak demand for bundled electric customers was 17.7 MWs (3.8% less than last year).
• Sales for bundled electric customers was 79,760 MWhs (2.6% less than last year).
• Ninety percent of bundled energy sales were to non-residential customers.
• All bundled customers’ facilities meet or exceed the applicable Title 24 requirements.
The recent age of these facilities provides less energy efficiency upgrade opportunities.
Gross Energy Savings (MWh)
Residential Commercial Industrial Agricultural Other Low Income T&D Electrification

Energy Efficiency in California’s Public Power Sector — 2025 A-55
CUD is in the process of revamping its energy efficiency rebate program with plans to
advertise new rebates by late 2024/early 2025.
Major Program and Portfolio Changes
The energy efficiency rebate program is in the process of being revamped, and new rebates will
be available to customers beginning in late 2024. The new program includes rebates for energy
efficient items such as air conditioners, heat pumps, appliances, and smart thermostats.
Program and Portfolio Highlights
• Corona serves municipal facilities that can be interrupted as scheduled.
• No energy efficiency incentive payments were disbursed to customers.
Commercial, Industrial & Agricultural Programs
• HVAC – Commercial – Non-Res Cooling: Financial incentives for the replacement of cost-
effective energy-savings HVAC units that reduce annual energy usage or load
requirements by a specified amount.
• Process – Industrial – Non-Res Process: Financial incentives for the replacement of cost-
effective energy-savings motors, pumps, and equipment that reduce annual energy
usage by a specified amount.
• Other – Industrial – Non-Res Other: Direct funding for projects on the utility-side of the
meter that provide benefits to customers in terms of improved safety, system integrity,
energy efficiency, conservation, or research and development
Residential Programs
• Appliances – Residential – Rebates will be provided to customers who purchase and
install Energy Star® refrigerators, freezers, clothes washers, electric clothes dryers,
dishwashers, induction stoves, and fans.
• HVAC – Residential – Res Cooling: Financial incentives for the replacement of cost-
effective energy-savings HVAC units that reduce annual energy usage or load
requirements by a specified amount.
Complementary Programs
• 21 customers (combined capacity of 537 kW) billed on Corona's net metering tariff
schedule.
• Installed 350 kW of photovoltaic systems.
• Installed eight electric charging vehicle stations.
• Achieved commercial operation for a long-term photovoltaic generating facility power
purchase agreement coupled with an 8 MW battery energy storage system.

Energy Efficiency in California’s Public Power Sector — 2025 A-56
Evaluation, Measurement & Verification Studies
The Energy Efficiency Technical Reference Manual provides energy savings estimates for
Corona's programs.

Energy Efficiency in California’s Public Power Sector — 2025 A-57
TABLE Corona-1. Energy Efficiency Program Results by End Use
Summary by End Use
Resource Savings Summary
Cost Test Results
End Use
Gross Peak
Savings (kW)
Gross Annual
Energy Savings
(kWh)
Gross Lifecycle
Energy Savings
(kWh)
Net Peak
Savings (kW)
Net Annual
Energy Savings
(kWh)
Net Lifecycle
Energy Savings
(kWh)
Net Lifecycle GHG
Reductions (Tons)
Total Utility
Cost
PAC
TRC
Utility
($/kWh)
Appliance & Plug Loads
0
0
0
0
0
0
0
$0
0.000
Building Envelope
0
0
0
0
0
0
0
$0
0.000
HVAC - Cooling
0
0
0
0
0
0
0
$0
0.000
Energy Efficiency
0
0
0
0
0
0
0
$0
0.000
EE, Low Income and Electrification
0
0
0
0
0
0
0
$0
0.000
C&S and T&D
$0
Utility Total
0
0
0
0
0
0
0
$0
0.000
Energy Efficiency in California’s Public Power Sector — 2025 A-58
TABLE Corona-2. Energy Efficiency Program Results by Sector
Summary by Sector
Resource Savings Summary
Cost Test Results
Sector
Gross Peak
Savings (kW)
Gross Annual
Energy Savings
(kWh)
Gross Lifecycle
Energy Savings
(kWh)
Net Peak
Savings (kW)
Net Annual
Energy Savings
(kWh)
Net Lifecycle
Energy Savings
(kWh)
Net Lifecycle GHG
Reductions (Tons)
Total Utility
Cost
PAC
TRC
Utility
($/kWh)
Commercial
0
0
0
0
0
0
0
$0
0.000
Residential
0
0
0
0
0
0
0
$0
0.000
Energy Efficiency
0
0
0
0
0
0
0
$0
0.000
EE, Low Income and Electrification
0
0
0
0
0
0
0
$0
0.000
C&S and T&D
$0
Utility Total
0
0
0
0
0
0
0
$0
0.000
Energy Efficiency in California’s Public Power Sector — 2025 A-59
TABLE Corona-3. Energy Efficiency Program Results by Building Type
Summary by Building Type
Resource Savings Summary
Cost Test Results
Building Type
Gross Peak
Savings (kW)
Gross Annual
Energy Savings
(kWh)
Gross Lifecycle
Energy Savings
(kWh)
Net Peak
Savings (kW)
Net Annual
Energy Savings
(kWh)
Net Lifecycle
Energy Savings
(kWh)
Net Lifecycle GHG
Reductions (Tons)
Total Utility
Cost
PAC
TRC
Utility
($/kWh)
Multiple
0
0
0
0
0
0
0
$0
0.000
Residential
0
0
0
0
0
0
0
$0
0.000
Residential - Multi-Family
0
0
0
0
0
0
0
$0
0.000
Residential - Single-Family
0
0
0
0
0
0
0
$0
0.000
Energy Efficiency
0
0
0
0
0
0
0
$0
0.000
EE, Low Income and Electrification
0
0
0
0
0
0
0
$0
0.000
C&S and T&D
$0
Utility Total
0
0
0
0
0
0
0
$0
0.000

Energy Efficiency in California’s Public Power Sector — 2025 A-60
GLENDALE WATER & POWER
Glendale Water & Power at a Glance
• Climate Zone: 9
• Customers: 90,988
• Total annual retail sales: 974,195 MWh
• Annual Retail Revenue: $241,201,000
• Annual energy efficiency expenditures for reporting year: $5,696,310
• Gross annual savings from reporting year portfolio: 21,002 MWh
Glendale Water & Power Overview
Glendale Water & Power (GWP) is a municipal utility that provides essential electric and water
services to nearly 91,000 electric customers and over 34,000 water customers. Located in
Climate Zone 9, the City of Glendale spans 31 square miles and has a population of 187,000.
GWP is dedicated to helping both residents and businesses reduce their energy and water costs
through a variety of residential and commercial programs focused on promoting conservation
and improving energy-water use efficiency.
In FY 2023-2024, GWP’s energy efficiency programs achieved a total net annual energy savings
of 20,932 MWh and reduced peak demand by 1.2 MW. GWP remains committed to investing in
Residential,
8,707
Commercial,
6,707
T&D, 4,166
Electrification,
1,423
Gross Energy Savings (MWh)
Residential Commercial Industrial Agricultural Other Low Income T&D Electrification

Energy Efficiency in California’s Public Power Sector — 2025 A-61
conservation and energy-water use efficiency programs for residential, commercial, and
industrial customers.
Glendale is also committed to ensuring a clean energy future for its citizens and developing
policies and programs that help achieve a low-carbon future. Through reliable, affordable, and
sustainable clean energy projects, Glendale continues to establish itself as a leader in clean
energy, with a focus on transitioning to a more sustainable future.
Major Program and Portfolio Changes
In FY 2023-2024, all GWP programs were up and running with no significant portfolio changes.
Our Business Energy Upgrade Program, which offers direct installation of energy-saving
measures, achieved substantial savings. Additionally, the Home Energy Reports continued to
provide energy usage insights, resulting in energy savings for program participants. Although
there were no participants in our Business Energy Solutions Program, this can be attributed to
the success and popularity of the Business Energy Upgrade Program.
Program and Portfolio Highlights
GWP’s Business Energy Upgrade Program, Home Energy Reports, and the In-School Energy and
Water Conservation Education Program produced the most energy savings. The Home Energy
Reports program reached the majority of residential customers and provided constant
communication, engagement, and insights. The Business Energy Upgrade Program offered a no
cost energy audit and direct installation of energy efficiency measures for Glendale businesses,
consistently meeting and exceeding the program’s annual goals. The In-School Energy and
Water Conservation Education Program, in collaboration with Glendale Unified School District
and private schools, educated 6th-grade science students about energy and water conservation
through a “hands on” curriculum. The program also provided energy-water conservation
devices for installation in students’ homes.
Commercial, Industrial & Agricultural Programs
Building energy efficiency partnerships with our commercial, industrial, and institutional
customers has always been a priority for Glendale.
• Business Energy Upgrade Program: This seven-year commercial direct-install energy
efficiency program is designed to deliver up to 8.3 MW and 36,500 MWh of energy
savings in commercial buildings by the end of the program term. By the end of FY 2023-
2024, the program had achieved a cumulative total of 18,000 MWh energy savings,
representing about 50% of the 7-year program goal.
Residential Programs
• Home Energy Reports: The program provides print and email energy reports to
residential customers on their energy use. Reports also include action steps for each

Energy Efficiency in California’s Public Power Sector — 2025 A-62
household to help them reduce their electricity consumption. Currently, the program is
integrating the existing two-month billing data and a wealth of external data sources to
educate customers on how they can save energy. The program provides access to the
website where residential customers can review their energy usage in monthly, weekly,
daily or hourly intervals.
• High Bill Alerts: These alerts are designed to analyze AMI data to help customers save
energy and money when they are likely to consume more energy than usual for a billing
period. Before the end of a billing period, High Bill Alerts inform customers that they
are likely to have high energy use, and they provide insights to help customers reduce
their consumption before the billing period ends.
• Weekly Energy Updates: A weekly email report sent to customers to inform them of
their energy usage patterns, trends, and projected energy usage or costs.
• Home Energy Savings Rebates: The program offers incentives to encourage the purchase
of high-efficiency measures and appliances, including rebates for all-electric home
appliances, helping customers electrify their homes and reduce their carbon footprint.
• Tree Power: The program provides up to three no-cost shade trees along with arborist
services to ensure proper planting. When correctly sited and cared for, healthy, mature
shade trees provide cooling shade for homes, helping reduce air conditioning usage.
• Home Energy and Water Saving Upgrade Program: The Home Energy and Water Saving
Upgrade Program provides no-cost home assessments and the installation of energy and
water saving devices, including LED lights, low flow shower heads, faucet aerators, toilet
displacement devices and toilet flappers.
• Energy Efficiency Marketplace: The online Energy Efficiency Marketplace allows
Glendale residents to easily access program eligible energy and water saving products
online, without the need to visit a retail store or complete incentive or rebate
applications.
Complementary Programs
Low-Income Programs - In FY 2023-2024, 58% of the annual Public Benefit Charge (PBC)
expenditure went towards funding the below low-income programs.
• Glendale Care: In FY 2023-2024 the program offered all eligible low-income customers a
discount of $23.50 on their electric bills.
• Helping Hand: This program assists eligible low-income customers facing a temporary
financial emergency by providing $150 towards a bill payment.
• Guardian: This program provides monthly bill discounts to households using doctor-
prescribed electrical medical equipment.
Transportation Electrification - GWP continues to meet the growing demand for electric
vehicles (EV) by investing in EV infrastructure and customer programs.

Energy Efficiency in California’s Public Power Sector — 2025 A-63
• EV Infrastructure: GWP is committed to expanding its public charging network to make
EV charging more accessible and support the growing number of electric vehicles on the
road.
• Residential EV Charging Station Rebate Program: This program offers rebates of up to
$599 for residential customers, who install a new Level 2 EV charging station and an
additional $800 for required electric panel upgrades. Customers enrolled in the Glendale
Care bill assistance program are eligible for higher rebates.
• Commercial EV Charging Station Rebate Program: This program provides rebates to
commercial and multi-family building customers who install EV charging stations at their
properties. The base rebate is the lesser of $50,000 or 50% of the total project cost.
Eligible customers who meet additional criteria may receive up to $75,000 or 75% of the
total project cost.
• Electric Bicycle Rebates: This program provides a rebate of up to $300 to residential
customers who purchase a new electric bicycle. The rebate is higher for customers
enrolled in the Glendale Care bill assistance program.
• Off-Peak EV Charging Rebate Program: The program provides a monthly incentive of $12
to EV drivers who set their vehicles to charge during off-peak hours, helping to reduce
peak load. This program uses AMI data to verify charging times, making the program
available to any electric vehicle and any EV charger. Over 800 customers are currently
enrolled in this program.
• EV Customer Awareness Website: This educational website offers customers with
information on new and used EVs, available incentives, home charging options, EV
dealers, and a map of public charging stations.
Research, Development, and Demonstration:
• Conservation Voltage Reduction (CVR): This program conserves electricity by operating
electric customer voltages in the lower half of the ten percent (10%) voltage band
required by ANSI equipment standards. The CVR program builds on GWP’s investment in
Automated Metering Infrastructure (AMI) by using meter data to reduce power costs by
increasing the efficiency of GWP’s distribution system. During FY 2023-2024, the
program produced energy savings of 4,165 MWh.
Evaluation, Measurement & Verification Studies
GWP plans to initiate Evaluation, Measurement & Verification (EM&V) analysis of energy
efficiency programs in support of AB 2021. For FY 2024-2025, Glendale has budgeted $50,000
to conduct EM&V studies, which will be conducted by a third-party contractor. GWP also plans
to assess all energy efficiency programs in terms of cost-effectiveness, customer participation,
and efficient administration.

Energy Efficiency in California’s Public Power Sector — 2025 A-64
Major Differences or Diversions from CA POU TRM for Energy Savings
The sources of energy savings used to calculate program performance were a combination of
the POU TRM, work papers, and third-party energy efficiency verification.

Energy Efficiency in California’s Public Power Sector — 2025 A-65
TABLE GWP-1. Energy Efficiency Program Results by End Use
Summary by End Use
Resource Savings Summary
Cost Test Results
End Use
Gross Peak
Savings (kW)
Gross Annual
Energy Savings
(kWh)
Gross Lifecycle
Energy Savings
(kWh)
Net Peak
Savings (kW)
Net Annual
Energy Savings
(kWh)
Net Lifecycle
Energy Savings
(kWh)
Net Lifecycle GHG
Reductions (Tons)
Total Utility
Cost
PAC
TRC
Utility
($/kWh)
Appliance & Plug Loads
0
3,233
38,799
0
3,233
38,799
-4
$3,960
-1.31
-0.31
0.129
Miscellaneous
1,391,049
16,692,588
1,391,049
16,692,588
4,627
$611,627
2.84
2.84
0.046
Service & Domestic Hot Water
0
28,738
287,385
0
28,738
287,385
44
$3,193
-0.18
-0.08
0.013
Electrification
0
1,423,021
17,018,771
0
1,423,021
17,018,771
4,667
$618,780
2.79
2.72
0.046
Appliance & Plug Loads
1
69,343
782,459
1
69,343
782,459
270
$38,078
2.13
1.87
0.061
Building Envelope
2
2,940
38,420
2
2,940
38,420
15
$1,224
8.69
49.19
0.042
HVAC - Cooling
51
98,890
1,760,354
51
98,890
1,760,354
603
$98,095
5.28
6.28
0.085
Lighting - Indoor
1,034
7,122,740
84,640,650
1,034
7,122,740
84,640,650
24,210
$4,086,502
2.92
2.92
0.061
Miscellaneous
59
8,119,267
17,524,533
59
8,119,267
17,524,533
6,267
$716,725
2.42
2.42
0.042
Energy Efficiency
1,148
15,413,180
104,746,416
1,148
15,413,180
104,746,416
31,364
$4,940,625
2.89
2.89
0.057
EE, Low Income and Electrification
1,148
16,836,201
121,765,187
1,148
16,836,201
121,765,187
36,031
$5,559,405
2.88
2.87
0.056
Any
0
4,165,670
4,165,670
0
4,165,670
4,165,670
1,752
$136,905
2.86
2.86
0.033
T&D
0
4,165,670
4,165,670
0
4,165,670
4,165,670
1,752
$136,905
2.86
2.86
0.033
C&S and T&D
0
4,165,670
4,165,670
0
4,165,670
4,165,670
1,752
$136,905
2.86
2.86
0.033
Utility Total
1,148
21,001,871
125,930,857
1,148
21,001,871
125,930,857
37,783
$5,696,310
2.88
2.87
0.055

Energy Efficiency in California’s Public Power Sector — 2025 A-66
TABLE GWP-2. Energy Efficiency Program Results by Sector
Summary by Sector
Resource Savings Summary
Cost Test Results
Sector
Gross Peak
Savings (kW)
Gross Annual
Energy Savings
(kWh)
Gross Lifecycle
Energy Savings
(kWh)
Net Peak
Savings (kW)
Net Annual
Energy Savings
(kWh)
Net Lifecycle
Energy Savings
(kWh)
Net Lifecycle GHG
Reductions (Tons)
Total Utility
Cost
PAC
TRC
Utility
($/kWh)
Commercial
1,391,049
16,692,588
1,391,049
16,692,588
4,627
$611,627
2.84
2.84
0.046
Residential
0
31,972
326,183
0
31,972
326,183
40
$7,153
-0.80
-0.24
0.027
Electrification
0
1,423,021
17,018,771
0
1,423,021
17,018,771
4,667
$618,780
2.79
2.72
0.046
Commercial
1,034
6,706,625
80,479,500
1,034
6,706,625
80,479,500
22,638
$4,025,153
2.84
2.84
0.063
Residential
114
8,706,555
24,266,916
114
8,706,555
24,266,916
8,726
$915,472
3.11
3.15
0.041
Energy Efficiency
1,148
15,413,180
104,746,416
1,148
15,413,180
104,746,416
31,364
$4,940,625
2.89
2.89
0.057
EE, Low Income and Electrification
1,148
16,836,201
121,765,187
1,148
16,836,201
121,765,187
36,031
$5,559,405
2.88
2.87
0.056
Any
0
4,165,670
4,165,670
0
4,165,670
4,165,670
1,752
$136,905
2.86
2.86
0.033
T&D
0
4,165,670
4,165,670
0
4,165,670
4,165,670
1,752
$136,905
2.86
2.86
0.033
C&S and T&D
0
4,165,670
4,165,670
0
4,165,670
4,165,670
1,752
$136,905
2.86
2.86
0.033
Utility Total
1,148
21,001,871
125,930,857
1,148
21,001,871
125,930,857
37,783
$5,696,310
2.88
2.87
0.055

Energy Efficiency in California’s Public Power Sector — 2025 A-67
TABLE GWP-3. Energy Efficiency Program Results by Building Type
Summary by Building Type
Resource Savings Summary
Cost Test Results
Building Type
Gross Peak
Savings (kW)
Gross Annual
Energy Savings
(kWh)
Gross Lifecycle
Energy Savings
(kWh)
Net Peak
Savings (kW)
Net Annual
Energy Savings
(kWh)
Net Lifecycle
Energy Savings
(kWh)
Net Lifecycle GHG
Reductions (Tons)
Total Utility
Cost
PAC
TRC
Utility
($/kWh)
Multiple
0
1,423,021
17,018,771
0
1,423,021
17,018,771
4,667
$618,780
2.79
2.72
0.046
Electrification
0
1,423,021
17,018,771
0
1,423,021
17,018,771
4,667
$618,780
2.79
2.72
0.046
Any
0
5,504
55,042
0
5,504
55,042
16
$2,609
1.59
4.73
0.057
Multiple
1,093
7,326,911
86,666,903
1,093
7,326,911
86,666,903
24,860
$4,189,985
2.93
2.92
0.061
Residential
8
8,002,860
16,449,059
8
8,002,860
16,449,059
5,902
$671,919
2.21
2.19
0.042
Residential - Single-Family
47
77,906
1,575,413
47
77,906
1,575,413
586
$76,112
6.62
9.29
0.076
Energy Efficiency
1,148
15,413,180
104,746,416
1,148
15,413,180
104,746,416
31,364
$4,940,625
2.89
2.89
0.057
EE, Low Income and Electrification
1,148
16,836,201
121,765,187
1,148
16,836,201
121,765,187
36,031
$5,559,405
2.88
2.87
0.056
Multiple
0
4,165,670
4,165,670
0
4,165,670
4,165,670
1,752
$136,905
2.86
2.86
0.033
T&D
0
4,165,670
4,165,670
0
4,165,670
4,165,670
1,752
$136,905
2.86
2.86
0.033
C&S and T&D
0
4,165,670
4,165,670
0
4,165,670
4,165,670
1,752
$136,905
2.86
2.86
0.033
Utility Total
1,148
21,001,871
125,930,857
1,148
21,001,871
125,930,857
37,783
$5,696,310
2.88
2.87
0.055
Energy Efficiency in California’s Public Power Sector — 2025 A-68
GRIDLEY MUNICIPAL UTILITY
Gridley Municipal Utility at a Glance
• Climate Zone: 11
• Customers: 3,180
• Total annual retail sales: 33,183 MWh
• Annual Retail Revenue: $7,245,031
• Annual energy efficiency expenditures for reporting year: $43,257
• Gross annual savings from reporting year portfolio: 0.31 MWh
Gridley Municipal Utility Overview
Gridley is a neighborhood community with agricultural roots and a historic downtown. Gridley
is located in Butte County, California, United States, 29 miles south of Chico, California, and 56
miles north of Sacramento, California.
Gridley Municipal Utility (GMU) feels a significant responsibility to its community to invest its
Public Benefits funds in such a way as to impact both energy savings and financial
savings/positive economics in Gridley. GMU offers a comprehensive menu of rebates to all
residential, commercial, and industrial customers. GMU’s customer demographic has
historically resulted in lower customer participation in programs that require capital investment
by the customer.
Residential, .31
Gross Energy Savings (MWh)
Residential Commercial Industrial Agricultural Other Low Income T&D Electrification

Energy Efficiency in California’s Public Power Sector — 2025 A-69
Major Program and Portfolio Changes
There were no major program changes implemented in FY24. GMU has offered a
comprehensive menu of energy efficiency rebate programs for many years. Both customers and
local contractors find value in maintaining a consistent program.
Program and Portfolio Highlights
Program participation was down this year with only two rebates processed.
Commercial, Industrial & Agricultural Programs
GMU manages a comprehensive energy efficiency incentive program for commercial customers
focusing on energy efficiency and peak load reduction. Rebates are available for upgraded
lighting, HVAC, appliances, refrigeration equipment, and electronics, and in cases where an
analysis is performed, rebates can be offered for additional equipment that reduces energy use
and/or demand. On-site energy audits are provided by energy specialists. Energy efficiency
measures are recommended, and additional visits are completed upon request.
• Commercial Lighting Program: GMU offers rebates to business owners who invest in the
installation of energy-efficient lighting upgrades. There is a prevalence of inefficient
lighting throughout the city and most high bay lighting uses high-intensity discharge
fixtures instead of more efficient fluorescent or LED fixtures.
• Commercial HVAC: The City offers rebates to commercial customers for energy-efficient
HVAC upgrades.
• Commercial Refrigeration: Rebates are available to improve the efficiency of commercial
refrigeration systems.
• Commercial Appliances: Rebates are available for energy-efficient cooking equipment
such as ovens, dishwashers, fryers, griddles, etc.
• Commercial Electronics: The City offers rebates for uninterrupted power supplies, plug-
load occupancy sensors, and smart power strips.
• Commercial Custom Program: GMU offers rebates to business owners based on site-
specific consumption. Rebates are tailored to the individual business owner’s needs
based on the audit and the potential energy savings associated with the customer
project.
Residential Programs
Rebates are offered to residential customers for the installation of various energy efficiency
measures, such as lighting, HVAC, appliances, and weatherization. On-site energy audits are
provided by energy specialists. Energy efficiency measures are recommended, and additional
visits are completed upon request.
• Residential Lighting Program: GMU offers rebates to homeowners who install ENERGY
STAR® qualified LED lamps/bulbs, ceiling fans, and LED holiday lights.

Energy Efficiency in California’s Public Power Sector — 2025 A-70
• Residential HVAC Program: GMU offers rebates to homeowners who install high-
performance heat pumps, central air-conditioners, room air-conditioners, or whole
house fans that exceed current state requirements. GMU also offers a rebate for duct
sealing when not required by code.
• Residential Equipment Program: GMU offers rebates to homeowners who purchase new
ENERGY STAR-qualified products, including clothes washers, room air conditioners,
dishwashers, pool pumps, and refrigerators.
• Residential Weatherization Program: GMU offers rebates to homeowners who invest in
weatherizing their homes, including attic and wall insulation, window treatments,
window replacement, or air/duct sealing.
• Residential Water Heater Rebate Program: GMU offers rebates to homeowners who
purchase a new, energy-efficient electric water heater.
Complementary Programs
When applicable, GMU refers customers to the state-funded Community Action Agency HEAP
Program for low-income Butte County residents.
Evaluation, Measurement & Verification Studies
Information on GMU’s EM&V studies is available at https://www.cmua.org/.
Major Differences or Diversions from CA POU TRM for Energy Savings
GMU has relied heavily on the savings listed in the CMUA Technical Resource Manual and eTRM
Unit Energy Savings. Non-residential lighting and custom projects rely on custom savings
calculations.
Energy Efficiency in California’s Public Power Sector — 2025 A-71
TABLE Gridley-1. Energy Efficiency Program Results by End Use
Summary by End Use
Resource Savings Summary
Cost Test Results
End Use
Gross Peak
Savings (kW)
Gross Annual
Energy Savings
(kWh)
Gross Lifecycle
Energy Savings
(kWh)
Net Peak
Savings (kW)
Net Annual
Energy Savings
(kWh)
Net Lifecycle
Energy Savings
(kWh)
Net Lifecycle GHG
Reductions (Tons)
Total Utility
Cost
PAC
TRC
Utility
($/kWh)
Appliance & Plug Loads
0
229
2,516
0
71
780
0
$19,259
0.00
0.00
30.479
HVAC - Cooling
0
77
693
0
28
249
0
$23,998
0.00
0.00
113.976
Energy Efficiency
0
306
3,209
0
99
1,029
0
$43,257
0.00
0.00
51.348
EE, Low Income and Electrification
0
306
3,209
0
99
1,029
0
$43,257
0.00
0.00
51.348
C&S and T&D
$0
Utility Total
0
306
3,209
0
99
1,029
0
$43,257
0.00
0.00
51.348
Energy Efficiency in California’s Public Power Sector — 2025 A-72
TABLE Gridley-2. Energy Efficiency Program Results by Sector
Summary by Sector
Resource Savings Summary
Cost Test Results
Sector
Gross Peak
Savings (kW)
Gross Annual
Energy Savings
(kWh)
Gross Lifecycle
Energy Savings
(kWh)
Net Peak
Savings (kW)
Net Annual
Energy Savings
(kWh)
Net Lifecycle
Energy Savings
(kWh)
Net Lifecycle GHG
Reductions (Tons)
Total Utility
Cost
PAC
TRC
Utility
($/kWh)
Residential
0
306
3,209
0
99
1,029
0
$43,257
0.00
0.00
51.348
Energy Efficiency
0
306
3,209
0
99
1,029
0
$43,257
0.00
0.00
51.348
EE, Low Income and Electrification
0
306
3,209
0
99
1,029
0
$43,257
0.00
0.00
51.348
C&S and T&D
$0
Utility Total
0
306
3,209
0
99
1,029
0
$43,257
0.00
0.00
51.348
Energy Efficiency in California’s Public Power Sector — 2025 A-73
TABLE Gridley-3. Energy Efficiency Program Results by Building Type
Summary by Building Type
Resource Savings Summary
Cost Test Results
Building Type
Gross Peak
Savings (kW)
Gross Annual
Energy Savings
(kWh)
Gross Lifecycle
Energy Savings
(kWh)
Net Peak
Savings (kW)
Net Annual
Energy Savings
(kWh)
Net Lifecycle
Energy Savings
(kWh)
Net Lifecycle GHG
Reductions (Tons)
Total Utility
Cost
PAC
TRC
Utility
($/kWh)
Multiple
0
306
3,209
0
99
1,029
0
$43,257
0.00
0.00
51.348
Energy Efficiency
0
306
3,209
0
99
1,029
0
$43,257
0.00
0.00
51.348
EE, Low Income and Electrification
0
306
3,209
0
99
1,029
0
$43,257
0.00
0.00
51.348
C&S and T&D
$0
Utility Total
0
306
3,209
0
99
1,029
0
$43,257
0.00
0.00
51.348

Energy Efficiency in California’s Public Power Sector — 2025 A-74
CITY OF HEALDSBURG
City of Healdsburg at a Glance
• Climate Zone: 2
• Customers: 6,157
• Total annual retail sales: 82,201 MWh
• Annual Retail Revenue: $16,076,672
• Annual energy efficiency expenditures for reporting year: $229,639
• Gross annual savings from reporting year portfolio: 210 MWh
City of Healdsburg Overview
The City of Healdsburg’s Electric Department manages a comprehensive energy efficiency and
greenhouse gas reduction program for residential and commercial customers by incentivizing
energy conservation as well as peak load reduction. For residential customers, rebates help
drive installations of a variety of energy efficiency and efficient electrification measures.
Residential rebates are offered in the following areas: appliances, heating and cooling, and
weatherization. Commercial rebates are predominately for heat pump projects or site-specific
lighting upgrades. For commercial customers, rebates can also include custom programs when
analysis demonstrates savings. This custom rebate approach allows greater flexibility and
variety of incentives to the end users. These energy rebates and other greenhouse gas
Residential, 27
Commercial, 44
Electrification, 140
Gross Energy Savings (MWh)
Residential Commercial Industrial Agricultural Other Low Income T&D Electrification

Energy Efficiency in California’s Public Power Sector — 2025 A-75
reduction programs are predominately supported by proceeds from the Cap-and-Trade
Program allocations.
Major Program and Portfolio Changes
During 2024, Healdsburg Electric continued implementing a new multi-family program for
appliance replacements in income-qualified multi-family properties. Healdsburg Electric has
also continued the promotion and implementation of existing rebate programs, making minor
modifications as needed to improve the programs. New in 2024, Healdsburg Electric also
updated electric vehicle (EV) programs and launched a Home Energy Load Management
program for managed EV charging and smart thermostat control. Additionally, Healdsburg
Electric is supporting an in-depth energy audit of the Wastewater Reclamation Facility, one of
the highest electricity consumers in the City, to identify energy efficiency opportunities for the
treatment facility.
Program and Portfolio Highlights
The City of Healdsburg continued implementation of the strategies and actions outlined in its
citywide Climate Mobilization Strategy to help reduce greenhouse gas (GHG) emissions in
Healdsburg. One of these programs is the Appliance Replacement Program for income-qualified
multi-family properties, which completed 5 pre-assessment audits to determine equipment
eligibility in the identified properties and collaborated with a local non-profit organization to
receive a grant award for the non-profit group’s support with outreach and on-the-ground
implementation of the program moving forward.
Commercial, Industrial & Agricultural Programs
The City offers the following commercial programs:
• Commercial Lighting Rebates: This program engages local lighting and electrical
contractors to promote and install energy-efficient lighting upgrades through technical
assistance and financial incentives available from the Electric Department. Adjustments
limiting the rebate eligibility will likely be made to this program in 2025 due to new
building codes and health and safety regulations regarding the sale of mercury light
fixtures.
• Commercial HVAC Rebates: The Electric Department offers commercial customers a
variety of HVAC rebates. There are rebate offerings for heat pump HVAC systems and
heat pump water heaters to promote efficient electric space heating and cooling and
water heating.
• Electric Kitchen Equipment: The Electric Department offers rebates for efficient electric
commercial kitchen equipment, based on the California Energy Wise program. A one-
time additional electrification rebate is also available to support switching from natural
gas appliances to efficient electric appliances.

Energy Efficiency in California’s Public Power Sector — 2025 A-76
• Custom EE Programs: The Electric Department will consider custom energy efficiency
programs for site-specific consumption. The Electric Department requires that its
contractor review and endorse all custom programs. This review may result in a small
cost adder to the proposed project, but confirms the estimated savings and allows
greater flexibility for the program. The Electric Department retains the sole right to
approve or deny custom projects. The in-depth energy audit of the Wastewater
Reclamation Facility is expected to result in one or more custom program rebates. The
audit is being supported by Public Benefits Funds to identify innovative and cost-
effective energy efficiency opportunities for the treatment facility, which had
$25,459.56 in consultant and program staff costs in 2024.
Residential Programs
The City offers the following residential programs:
• Residential Heat Pump Rebates: The Electric Department offers rebates for residential
and small business customers who install high performance heat pump HVAC systems
and/or heat pump water heaters. Higher rebate amounts are available for replacing an
existing natural gas appliance with an efficient electric heat pump.
• Weatherization and Building Envelope Rebates: The Electric Department provides
financial incentives for property owners who invest in home weatherization such as
ceiling insulation, wall insulation, and efficient window replacement projects.
• Laundry Rebates: The Electric Department offers incentives for high performance
clothes washers to encourage energy efficiency and water conservation. Clothes dryer
rebates are also offered to further encourage energy efficiency and electric clothes
drying.
• Device Rebates: The Electric Department also provided rebates for variable speed pool
pumps and smart thermostats. The smart thermostat rebate ended in late 2024 with the
launch of the Home Energy Load Management program. However, smart thermostat
rebates are still available for low-income customers who enroll their new thermostat in
the load management program. The pool pump rebate will likely be discontinued in
2025 as well.
• Electric Stove: The Electric Department offers an electric stove/cooktop rebate to
promote electric cooking in place of cooking with natural gas. To inform customers
regarding electric cooktops, specifically induction cooktops, Healdsburg Electric also
offers a free induction cooktop loaner for electric customers interested in cooking with
electricity rather than natural gas. The loaner program includes pans compatible with
induction cooktops.
• Multi-Family Income-Restricted Properties: The Electric Department continued
development and implementation of an appliance replacement program for multi-
family income-restricted properties. The program includes replacing old inefficient
appliances with efficient electric appliances, starting with dishwashers and refrigerators.

Energy Efficiency in California’s Public Power Sector — 2025 A-77
Of the 8 identified properties, 5 have completed a pre-assessment to verify equipment
eligibility. It is the responsibility of the property manager to solicit appliance quotes and
coordinate the installation, which has stalled program progress at the properties given
the property managers’ multiple priorities and day-to-day property management
demands. Healdsburg Electric collaborated with a local non-profit focused on Spanish-
speaking outreach and support to apply for the Community Climate Implementation
Fund grant. The non-profit, Corazon Healdsburg, was selected in early 2025 and will
provide additional on-the-ground support to property managers to assist them in
coordinating the appliance replacements and also support multi-family residents that
may need help swapping their food and belongings during the appliance replacements.
During the program, the non-profit will also promote additional programs in which the
property management or residents could participate.
Complementary Programs
The City offers the following complementary programs:
• Low-Income Programs: The City actively supports a low-income discount for income-
qualified customers. This program was expanded during COVID to include customers
with income at 80% or below area median income. Currently, this discount supports
approximately 565 families, or about 11% of the City’s residential customers. Income-
qualified customers receive 25% off their electric bill through this program. In 2024,
electric bill discounts totaled $100,524.44 with staff administration and overhead costs
of $68,998.36, totaling $169,522.80 for the program. The low-income bill discount is the
primary program supported by Public Benefits Funds.
• Electric Vehicles: The City offers an EV Discount for residents who drive a battery
electric vehicle and switch to the Time of Use rate. This program is no longer accepting
new applications as of late 2024 and will officially end in June 2025. The new Home
Energy Load Management program is replacing the EV Discount Program and provides
better management of peak energy demands caused by EV charging.
• Public EV Charging: Additionally, the City maintains 12 public charging stations with
discounted charging rates located at City Hall. The user fee structure was updated in
2024 to better recover electric costs and discourage charging during evening peak
hours. A 50% discount on the user fees is available for low-income customers.
Healdsburg Electric took ownership of 2 additional charging stations in a new
development area in 2024 and is actively working to expand public charging
opportunities. Healdsburg Electric also offers a commercial level 2 EV charger rebate to
encourage workplace charging and charging during the day when abundant solar is
available.
• Home Energy Load Management: Healdsburg Electric launched its Home Energy Load
Management Program in late 2024 for managed EV charging and smart thermostat

Energy Efficiency in California’s Public Power Sector — 2025 A-78
control. Low-income EV owners that do not have a home charger can also qualify for an
EV charger rebate, if they enroll the charger and EV in the load management program.
• E-bikes: Healdsburg Electric offers an e-bike rebate for residents who purchase an e-bike
to replace driving trips. This program provides various levels of rebates relative to
customer income and purchase location to help offset the cost of purchasing an e-bike.
In 2023 and 2024, Healdsburg Electric also had coupons available for low-income
customers to try the e-bike share program.
• Technical Consulting on all-electric construction: The City implemented a Reach Code in
2019, which was updated in 2022, that required electric space and water heating.
Although the Reach Code is no longer being enforced, the City still offers free technical
consulting through a consultant engineering firm to support builders and contractors
interested in all-electric construction.
• Green Rate: The Electric Department offers a voluntary opt-in 100% renewable
electricity rate for an approximately $0.2 additional charge per kWh. Roughly 8% of the
City’s electricity usage is attributed to customers enrolled in the Green Rate. All
municipal accounts are on the Green Rate and make up the majority of this usage.
• Renewable Energy Programs: The City continues to see PV solar array installations in
both residential and commercial sectors. At the end of 2024, the City had
interconnected a total of 6.87 MWac of solar capacity and 0.79 MW of battery capacity.
This includes the City's 3 MWac floating photovoltaic (FPV) system at the City’s Water
Reclamation Facility. The system provides about 8% of community-wide annual electric
needs. In 2024, the system generated 5,950 MWh directly into the City’s distribution
system and offset roughly .6 MW of the City’s peak coincident demand.
• Water Conservation: The City offers multiple water conservation programs, such as lawn
conversion, low-flow toilets, irrigation controllers, and more. During the multi-year
drought significantly impacting Healdsburg, the City had increased promotion of these
rebates. Customers continued their water conservation in 2024 with an approximately
11% reduction in water consumption, compared to before the drought. Water
conservation can help reduce the amount of electricity needed for treating and
conveying water. Funding for water conservation programs is primarily funded by the
City’s water department and regional conservation grants.
Evaluation, Measurement & Verification Studies
EM&V previously completed by the City is available at www.cmua.org.
Major Differences or Diversions from CA POU TRM for Energy Savings
In 2024, Healdsburg Electric predominately relied on the California eTRM streamlined values for
savings calculations. Fuel substitution calculations provide the negative kWh savings and
positive therm savings, which are converted to claim the total equivalent energy savings in
kWh.
Energy Efficiency in California’s Public Power Sector — 2025 A-79
For measures not included in the eTRM (such as windows, LEDs, and pool pumps), Healdsburg
Electric relied on the 2017 CMUA TRM. For measures without an offering option in the eTRM
(such as electric resistance clothes dryer fuel substitution), Healdsburg Electric relied on actual
equipment model information. Savings for the Commercial Lighting Program are calculated
based on the actual equipment replaced and installed.

Energy Efficiency in California’s Public Power Sector — 2025 A-80
TABLE Healdsburg-1. Energy Efficiency Program Results by End Use
Summary by End Use
Resource Savings Summary
Cost Test Results
End Use
Gross Peak
Savings (kW)
Gross Annual
Energy Savings
(kWh)
Gross Lifecycle
Energy Savings
(kWh)
Net Peak
Savings (kW)
Net Annual
Energy Savings
(kWh)
Net Lifecycle
Energy Savings
(kWh)
Net Lifecycle GHG
Reductions (Tons)
Total Utility
Cost
PAC
TRC
Utility
($/kWh)
Appliance & Plug Loads
0
1,393
24,296
0
1,393
24,296
-3
$4,937
-0.31
-0.16
0.283
HVAC - Heat Pump
0
113,200
1,698,007
0
113,200
1,698,007
220
$104,702
0.63
0.32
0.082
Service & Domestic Hot Water
0
25,085
250,853
0
25,085
250,853
38
$18,096
0.65
0.80
0.087
Electrification
0
139,678
1,973,156
0
139,678
1,973,156
255
$127,735
0.60
0.33
0.085
Appliance & Plug Loads
0
3,721
40,025
0
1,598
16,959
5
$2,122
0.78
0.50
0.153
Building Envelope
2
17,003
340,065
1
7,754
155,083
34
$15,048
0.83
0.35
0.143
HVAC - Cooling
0
3,781
34,327
0
2,004
18,193
5
$2,006
0.88
0.87
0.131
HVAC - Heat Pump
2
7,139
107,079
1
3,579
53,680
17
$12,826
0.47
0.51
0.319
Lighting - Indoor
10
38,971
474,855
9
32,382
392,467
133
$32,315
1.24
1.31
0.104
Energy Efficiency
14
70,615
996,351
11
47,316
636,382
194
$64,318
0.96
0.75
0.132
Appliance & Plug Loads
0
0
0
0
0
0
0
$37,585
0.000
Low-Income
0
0
0
0
0
0
0
$37,585
0.000
EE, Low Income and Electrification
14
210,294
2,969,507
11
186,995
2,609,538
449
$229,639
0.60
0.39
0.116
C&S and T&D
$0
Utility Total
14
210,294
2,969,507
11
186,995
2,609,538
449
$229,639
0.60
0.39
0.116

Energy Efficiency in California’s Public Power Sector — 2025 A-81
TABLE Healdsburg-2. Energy Efficiency Program Results by Sector
Summary by Sector
Resource Savings Summary
Cost Test Results
Sector
Gross Peak
Savings (kW)
Gross Annual
Energy Savings
(kWh)
Gross Lifecycle
Energy Savings
(kWh)
Net Peak
Savings (kW)
Net Annual
Energy Savings
(kWh)
Net Lifecycle
Energy Savings
(kWh)
Net Lifecycle GHG
Reductions (Tons)
Total Utility
Cost
PAC
TRC
Utility
($/kWh)
Commercial
0
13,099
196,478
0
13,099
196,478
40
$12,744
1.06
0.89
0.087
Residential
0
126,580
1,776,677
0
126,580
1,776,677
216
$114,991
0.55
0.29
0.085
Electrification
0
139,678
1,973,156
0
139,678
1,973,156
255
$127,735
0.60
0.33
0.085
Commercial
12
43,632
544,767
10
34,616
425,983
142
$41,797
1.05
1.12
0.124
Residential
2
26,983
451,584
1
12,700
210,399
51
$22,522
0.81
0.42
0.150
Energy Efficiency
14
70,615
996,351
11
47,316
636,382
194
$64,318
0.96
0.75
0.132
Residential
0
0
0
0
0
0
0
$37,585
0.000
Low-Income
0
0
0
0
0
0
0
$37,585
0.000
EE, Low Income and Electrification
14
210,294
2,969,507
11
186,995
2,609,538
449
$229,639
0.60
0.39
0.116
C&S and T&D
$0
Utility Total
14
210,294
2,969,507
11
186,995
2,609,538
449
$229,639
0.60
0.39
0.116

Energy Efficiency in California’s Public Power Sector — 2025 A-82
TABLE Healdsburg-3. Energy Efficiency Program Results by Building Type
Summary by Building Type
Resource Savings Summary
Cost Test Results
Building Type
Gross Peak
Savings (kW)
Gross Annual
Energy Savings
(kWh)
Gross Lifecycle
Energy Savings
(kWh)
Net Peak
Savings (kW)
Net Annual
Energy Savings
(kWh)
Net Lifecycle
Energy Savings
(kWh)
Net Lifecycle GHG
Reductions (Tons)
Total Utility
Cost
PAC
TRC
Utility
($/kWh)
Multiple
0
139,678
1,973,156
0
139,678
1,973,156
255
$127,735
0.60
0.33
0.085
Electrification
0
139,678
1,973,156
0
139,678
1,973,156
255
$127,735
0.60
0.33
0.085
Multiple
3
28,425
474,160
1
12,723
209,299
51
$28,979
0.63
0.52
0.194
Other Commercial
10
36,571
438,855
8
31,086
373,027
126
$30,534
1.24
1.32
0.103
Residential
1
4,271
69,856
1
2,699
45,968
15
$4,118
1.24
0.29
0.125
Residential - Single-Family
0
1,348
13,480
0
809
8,088
2
$687
1.17
0.74
0.103
Energy Efficiency
14
70,615
996,351
11
47,316
636,382
194
$64,318
0.96
0.75
0.132
Residential - Multi-Family
0
0
0
0
0
0
0
$37,585
0.000
Low-Income
0
0
0
0
0
0
0
$37,585
0.000
EE, Low Income and Electrification
14
210,294
2,969,507
11
186,995
2,609,538
449
$229,639
0.60
0.39
0.116
C&S and T&D
$0
Utility Total
14
210,294
2,969,507
11
186,995
2,609,538
449
$229,639
0.60
0.39
0.116

Energy Efficiency in California’s Public Power Sector — 2025 A-83
IMPERIAL IRRIGATION DISTRICT
Imperial Irrigation District at a Glance
• Climate Zone: 15
• Customers: 165,674
• Total annual retail sales: 3,663,158 MWh
• Annual Retail Revenue: $679,792,131
• Annual energy efficiency expenditures for reporting year: $7,878,864
• Gross annual savings from reporting year portfolio: 20,337 MWh
Imperial Irrigation Overview
As the seventh largest utility in California, IID controls more than 1,200 megawatts of energy
derived from a diverse resource portfolio that includes its own generation, and long- and short-
term power purchases. IID’s Energy Department provides electric power to more than 165,000
customers in the Imperial Valley and parts of Riverside and San Diego counties.
As a consumer-owned utility, IID works to efficiently and effectively meet our customers’
demands at the best possible rates, tying our area’s low-cost of living directly with low-cost
utilities. Our diverse resource portfolio provides our customers with some of the lowest cost
rates in southern California, which is critical given unemployment rates within the service
territory are one of the highest in the nation.
Residential, 7,311
Commercial,
12,756
Other, 270
Gross Energy Savings (MWh)
Residential Commercial Industrial Agricultural Other Low Income T&D Electrification

Energy Efficiency in California’s Public Power Sector — 2025 A-84
IID’s energy efficiency programs are a key factor in the utility’s overall goal. These programs
provide a positive impact on utility cost by stabilizing energy consumption and reducing
purchases of expensive peak power. Additionally, customers are provided with an opportunity
to take charge of their energy utilization and by doing so, reducing their electricity consumption
and cost.
Major Program and Portfolio Changes
The program portfolio and rebate levels remained consistent for the most part from the
previous year. The addition of a new Public Green Space program provided major interest as it
funded tree-planting projects for non-residential agencies for cities, counties, special districts,
non-profit organizations, and community organizations.
IID’s refrigerator recycling program was launched in the fall due to the late acquisition of a new
recycling contractor. This resulted in lower program participation and impacted reportable
energy savings. That said, the overall savings impact was more than made up by the heavy
participation in other portfolio programs.
Furthermore, the state of California’s expected doubling of utilities’ energy efficiency savings
over the next few years has proven to be an interesting, yet demanding task. Some of the
challenges at hand are 1) Most cost-effective programs have been in place for years and this
leads us closer to market saturation, and 2) budgets for programs are reduced to fund other
utility projects or matters.
Program and Portfolio Highlights
IID reached 90% of its established kWh savings goal, a feat of which we are proud of. IID strives
to provide an energy efficiency portfolio tailored toward the unique needs of the ratepayers
that generates long-term energy savings while maintaining low-cost, reliable power. The
district’s portfolio offers residential customers with staple programs such as energy
assessments and prescriptive rebates and non-residential customers with a customized
program that allows flexibility necessary to encourage investments in efficient technologies.
The newest rebate for the Energy Rewards program, Gas to Electric HVAC conversion, has also
received consistent activity. The Custom Energy Solutions Program (CESP) experienced major
projects that provided millions in kWh savings. And lastly, the Weatherization program
received such a high volume of interest from customers that even with additional funding
allocated to it than originally planned, it was fully subscribed prior to year’s end.
Commercial, Industrial & Agricultural Programs
Commercial Customer Programs

Energy Efficiency in California’s Public Power Sector — 2025 A-85
• Custom Energy Solutions Program (CESP): This program is designed to promote energy
efficiency by offering financial incentives to commercial customers who install energy-
efficiency equipment. The larger commercial customers that participate generally have
their own energy efficiency specialists they’ve consulted with for their upgrades and
have identified the details of their project prior to applying for the rebate. However, for
all other commercial customers that may not have access to an energy efficiency
specialist, IID offers technical expertise to assist them in identifying the energy efficiency
measures and cost saving opportunities. Measures incentivized include interior and
exterior lighting, process loads and HVAC/refrigeration.
• Weatherization: IID is pleased to announce its Residential Weatherization Program for
2024 where participating IID electric customers receive energy saving services and
equipment that can help reduce heating and cooling costs while boosting their home’s
comfort level. IID customers currently enrolled in the district’s income qualified
Residential Energy Assistance Program (REAP) also receive an additional allotment
towards installed products and services through the weatherization program. The no-
cost services may include: Smart programmable thermostat, Air conditioner tune-up,
High efficiency air conditioning motor, Duct leak sealing, Efficient fan control, Ceiling
fan, Smart power strip, LED lighting, Door shoes, Door thresholds, Door
weatherstripping.
• Energy Rewards Rebate Program: This program offers commercial customers
prescriptive rebates for qualified energy efficient measures. Qualifying measures must
retrofit, replace or upgrade old equipment with new, energy-efficient technologies that
meet and/or exceed the Title 24 standards in effect at the time of installation.
• Public Green Space Program: This program offers funding for public tree-planting
projects for non-residential agencies for cities, counties, special districts, non-profit
organizations, and community organizations.
Residential Programs
Residential Customer Programs:
• Energy Rewards Rebate Program: This program offers residential customers prescriptive
rebates for qualified energy efficient measures. Qualifying residential measures must
retrofit, replace or upgrade old equipment with new, energy-efficient technologies that
meet and/or exceed the Title 24 standards in effect at the time of installation.
• Refrigerator Recycling: This program is designed to encourage customers to recycle their
old refrigerators or freezers rather than using them as a secondary, usually located
either in uninsulated garages or outdoors. Through this program, a customer’s
refrigerator or freezer will be picked-up and recycled, in addition to providing them
receiving a $50 incentive per unit.

Energy Efficiency in California’s Public Power Sector — 2025 A-86
• EV Charger Rebate program (ReCharge): For those who have chosen to go electric, IID
offers rebates of up to $500 to customers who purchase and install a Level 2 (240-volt)
plug-in electric vehicle charger.
Complementary Programs
Low-Income Programs – As a large number of IID’s residential customers participate in its
income-qualified programs, a significant portion of revenue generated through the public
benefits charge is allocated towards these programs. Back in 2019, IID modified its rate
assistance eligibility criteria to allow for greater participation by reducing the age for qualifying
seniors and increasing the maximum income level.
• Residential Energy Assistance Program (REAP) – This program provides customers with a
discounted rate on their electric bill. Qualification is based on the number of residents
per household and the total gross income of all the income sources in the home.
Qualifying customers may receive a 20 percent discount on their monthly bill. Qualifying
seniors 60 or older may apply to receive a 30 percent discount.
• Emergency Energy Assistance Program (EEAP) – This program provides financial
assistance to customers in a financial crisis, facing disconnection for nonpayment.
• Medical Equipment Energy Assistance Program (MEEUAP) – This is an assistance
program that reduces the electric rate for a defined quantity of electricity used to
operate medical equipment by a household that has a full-time resident who requires
specific medically necessary electric equipment to sustain life or prevent deterioration
of a person’s medical condition.
Renewable Energy Programs:
• Net Billing – The Net Billing Program is NEMs successor program and also compensates
net-surplus customers in accordance with the Distributive Self-Generation Service Rate
• E-Green Solar Program – In 2019, IID finalized its e-Green Community Solar Program
that benefits all of IID’s qualified, low-income customers. The program utilizes a 23-
year term power purchase agreement with Citizens Energy Corporation for 30
megawatts of solar energy, of which 10 MW has been allocated specifically for the e-
Green program. The program allows low-income customers to benefit from renewable
clean solar energy without the concern and financial means needed to purchase and
install rooftop solar. IID’s REAP customers will receive an additional discount on their
electric bills under the e-Green program. No enrollment is required and REAP
customers will be automatically enrolled onto the program.
• Green Energy Rate Program – Under the green energy rate, customers can designate
how much renewable energy they wish to be served with. Customers can elect to be
served up 100% of their energy needs with renewables through renewable energy or
renewable energy credits.

Energy Efficiency in California’s Public Power Sector — 2025 A-87
Evaluation, Measurement & Verification Studies
No Evaluation, Measurement & Verification Studies were required this calendar year.
Major Differences or Diversions from CA POU TRM for Energy Savings
IID utilized a combination of savings from the TRM, KEMA 2009 report, utility work papers and
custom savings when applicable. Prescriptive rebate programs such as Energy Rewards and
Refrigerator Recycling used deemed savings values from credited documents for measures such
as HVACs, refrigerators, pool pumps, etc., since the individual efficiency measure’s performance
characteristics and use conditions were well known and consistent. For the CESP program, on
the other hand, custom savings were calculated (for categories such as lighting, refrigeration,
process loads, and HVAC) taking into account the properties of existing equipment,
replacement equipment and future use.

Energy Efficiency in California’s Public Power Sector — 2025 A-88
TABLE IID-1. Energy Efficiency Program Results by End Use
Summary by End Use
Resource Savings Summary
Cost Test Results
End Use
Gross Peak
Savings (kW)
Gross Annual
Energy Savings
(kWh)
Gross Lifecycle
Energy Savings
(kWh)
Net Peak
Savings (kW)
Net Annual
Energy Savings
(kWh)
Net Lifecycle
Energy Savings
(kWh)
Net Lifecycle GHG
Reductions (Tons)
Total Utility
Cost
PAC
TRC
Utility
($/kWh)
Any
0
0
0
0
0
0
0
$69,614
0.000
Appliance & Plug Loads
5
25,872
129,360
4
18,110
90,552
34
$47,803
0.26
0.28
0.581
Building Envelope
30
270,342
10,813,700
30
270,342
10,813,700
1,838
$1,024,761
0.67
1.33
0.256
Commercial Refrigeration
258
1,383,176
27,663,520
219
1,175,700
23,513,992
8,208
$379,979
6.03
21.12
0.025
Lighting - Outdoor
311
9,922,797
198,455,934
258
8,235,921
164,718,425
56,991
$585,421
28.55
35.88
0.005
Miscellaneous
5,306
7,285,463
64,041,428
5,306
7,285,463
64,041,428
26,004
$5,489,267
1.50
2.30
0.116
Process
166
1,449,814
21,747,210
141
1,232,342
18,485,129
6,598
$205,325
10.20
26.92
0.015
Energy Efficiency
6,076
20,337,464
322,851,151
5,958
18,217,878
281,663,225
99,673
$7,802,170
3.85
6.19
0.042
Appliance & Plug Loads
0
0
0
0
0
0
0
$2,703
0.000
Low-Income
0
0
0
0
0
0
0
$2,703
0.000
EE, Low Income and Electrification
6,076
20,337,464
322,851,151
5,958
18,217,878
281,663,225
99,673
$7,804,873
3.85
6.18
0.042
Codes & Standards
0
25,752,000
25,752,000
0
25,752,000
25,752,000
10,253
$73,991
50.25
50.25
0.003
Codes & Standards
0
25,752,000
25,752,000
0
25,752,000
25,752,000
10,253
$73,991
50.25
50.25
0.003
C&S and T&D
0
25,752,000
25,752,000
0
25,752,000
25,752,000
10,253
$73,991
50.25
50.25
0.003
Utility Total
6,076
46,089,464
348,603,151
5,958
43,969,878
307,415,225
109,926
$7,878,864
4.28
6.85
0.037

Energy Efficiency in California’s Public Power Sector — 2025 A-89
TABLE IID-2. Energy Efficiency Program Results by Sector
Summary by Sector
Resource Savings Summary
Cost Test Results
Sector
Gross Peak
Savings (kW)
Gross Annual
Energy Savings
(kWh)
Gross Lifecycle
Energy Savings
(kWh)
Net Peak
Savings (kW)
Net Annual
Energy Savings
(kWh)
Net Lifecycle
Energy Savings
(kWh)
Net Lifecycle GHG
Reductions (Tons)
Total Utility
Cost
PAC
TRC
Utility
($/kWh)
Any
30
270,342
10,813,700
30
270,342
10,813,700
1,838
$1,024,761
0.67
1.33
0.256
Commercial
735
12,755,787
247,866,664
619
10,643,963
206,717,546
71,796
$1,199,437
17.59
32.30
0.009
Other
0
0
0
0
0
0
0
$69,614
0.000
Residential
5,311
7,311,335
64,170,788
5,309
7,303,573
64,131,980
26,038
$5,508,358
1.49
2.28
0.116
Energy Efficiency
6,076
20,337,464
322,851,151
5,958
18,217,878
281,663,225
99,673
$7,802,170
3.85
6.19
0.042
Residential
0
0
0
0
0
0
0
$2,703
0.000
Low-Income
0
0
0
0
0
0
0
$2,703
0.000
EE, Low Income and Electrification
6,076
20,337,464
322,851,151
5,958
18,217,878
281,663,225
99,673
$7,804,873
3.85
6.18
0.042
Residential
0
25,752,000
25,752,000
0
25,752,000
25,752,000
10,253
$73,991
50.25
50.25
0.003
Codes & Standards
0
25,752,000
25,752,000
0
25,752,000
25,752,000
10,253
$73,991
50.25
50.25
0.003
C&S and T&D
0
25,752,000
25,752,000
0
25,752,000
25,752,000
10,253
$73,991
50.25
50.25
0.003
Utility Total
6,076
46,089,464
348,603,151
5,958
43,969,878
307,415,225
109,926
$7,878,864
4.28
6.85
0.037
Energy Efficiency in California’s Public Power Sector — 2025 A-90
TABLE IID-3. Energy Efficiency Program Results by Building Type
Summary by Building Type
Resource Savings Summary
Cost Test Results
Building Type
Gross Peak
Savings (kW)
Gross Annual
Energy Savings
(kWh)
Gross Lifecycle
Energy Savings
(kWh)
Net Peak
Savings (kW)
Net Annual
Energy Savings
(kWh)
Net Lifecycle
Energy Savings
(kWh)
Net Lifecycle GHG
Reductions (Tons)
Total Utility
Cost
PAC
TRC
Utility
($/kWh)
Any
765
13,026,129
258,680,364
648
10,914,305
217,531,246
73,635
$2,293,812
9.50
17.56
0.016
Residential - Single-Family
5,311
7,311,335
64,170,788
5,309
7,303,573
64,131,980
26,038
$5,508,358
1.49
2.28
0.116
Energy Efficiency
6,076
20,337,464
322,851,151
5,958
18,217,878
281,663,225
99,673
$7,802,170
3.85
6.19
0.042
Residential
0
0
0
0
0
0
0
$2,703
0.000
Low-Income
0
0
0
0
0
0
0
$2,703
0.000
EE, Low Income and Electrification
6,076
20,337,464
322,851,151
5,958
18,217,878
281,663,225
99,673
$7,804,873
3.85
6.18
0.042
Any
0
25,752,000
25,752,000
0
25,752,000
25,752,000
10,253
$73,991
50.25
50.25
0.003
Codes & Standards
0
25,752,000
25,752,000
0
25,752,000
25,752,000
10,253
$73,991
50.25
50.25
0.003
C&S and T&D
0
25,752,000
25,752,000
0
25,752,000
25,752,000
10,253
$73,991
50.25
50.25
0.003
Utility Total
6,076
46,089,464
348,603,151
5,958
43,969,878
307,415,225
109,926
$7,878,864
4.28
6.85
0.037
Energy Efficiency in California’s Public Power Sector — 2025 A-91
INDUSTRY PUBLIC UTILITIES
Industry Public Utilities at a Glance
• Climate Zone: 9
• Customers: 135
• Total annual retail sales: 35,800 MWh
• Annual Retail Revenue: $5,200,000
• Annual energy efficiency expenditures for reporting year: $0
• Gross annual savings from reporting year portfolio: 0 MWh
Industry Public Utilities Overview
• Industry Public Utilities (IPU) was established in 2002 to provide electric service to retail
customers that continue to build new facilities located in the designated service
territory.
• The annual budget for energy efficiency programs is $155,000.
• Peak demand was 7.9 MWs (4.5% less than last year).
• Sales were 35,800 MWhs (4.5% less than last year).
• 99.6% of energy sales were to non-residential customers.
• All customers’ facilities meet or exceed the applicable Title 24 requirements. The recent
age of these facilities provides less energy efficiency upgrade opportunities.
Gross Energy Savings (MWh)
Residential Commercial Industrial Agricultural Other Low Income T&D Electrification

Energy Efficiency in California’s Public Power Sector — 2025 A-92
Program and Portfolio Highlights
No energy efficiency rebates were issued in the current year.
The IPU Energy Efficiency Program provides incentives in four program categories: Large
General Service Program; General Service Program; Domestic Service Program; and IPU energy
efficiency measures.
Commercial, Industrial & Agricultural Programs
• Survey – Non-Residential – General Service Customers - Rebates: On-site energy survey,
at no cost to the customer, that analyze customer usage and demand to develop
recommendations designed to improve operating energy efficiency and reduce load
requirements. Rebates are available for the installation of specified energy measures,
up to $1,000 every two years.
• Audits – Large General Service Customers – Non-Res Audits: On-site energy audits, at no
cost to the customer once every two years, that analyze customer usage and demand to
develop recommendations designed to improve energy operating efficiency and reduce
load requirements. Rebates are available for energy efficiency upgrades identified in
these audits. Verification services to ensure appropriate installation of recommended
measures are also provided.
• Lighting – Large General Service Customers – Non-Res Lighting: Provides incentives to
improve energy efficiency for lighting applications, which reduce energy usage by a
specified amount. Rebates are available based on a rate of $0.059/kWh for one year of
energy savings and shall not exceed $50,000 over a two-year budget cycle or 50% of the
lighting material costs.
• Customize Projects – Large General Service Customers – Non-Res Customize Projects:
Financial incentives for the replacement of equipment/technology that conserves
energy and permanently reduces coincident summer/winter peak demand and exceeds
state-mandated codes, federal mandated codes, industry accepted standards or other
baseline performance standards. The rebate is based on a rate of $0.059/kWh for one
year of energy savings and $150/kW for each on-peak kW that has been reduced and
shall not exceed or 50% of the total cost associated with the equipment/material.
• New Construction Projects – Large General Service Customers – Non-Res Construction
Projects: Financial incentives for new equipment components that exceed state-
mandated codes, federal-mandated codes, industry-accepted performance standards,
or other baseline energy performance standards by more than 10%. The rebate is based
upon the lessor of 25% of the cost difference between standard and upgraded new
equipment and/or materials or $50,000 over a two-year budget cycle.
• IPU Energy Efficiency Measures: Payment for eligible projects must be authorized by the
IPU Commission and shall not exceed $10,000 per year.

Energy Efficiency in California’s Public Power Sector — 2025 A-93
Residential Programs
Survey – Residential – Rebates: On-site energy survey, at no cost to the customer, that analyze
customer usage and demand to develop recommendations designed to improve energy
operating efficiency and reduce load requirements. Rebates are available for approved Energy
Star® appliances up to $250 per residence; and program allowance for the installation of
specified energy measures, up to $500 every two years.
Complementary Programs
• Renewable Energy Programs: IPU Solar Installations: Industry Metrolink 1,600 kW
Photovoltaic-1 Solar project.
• Energy Storage: Achieved commercial operation for a long-term photovoltaic
generating facility power purchase agreement coupled with a 4 MW battery energy
storage system.
Evaluation, Measurement & Verification Studies
The Engineering analysis programs are the basis for energy savings and incentive calculations.
The CMUA POU TRM provides energy savings estimates for IPU programs.
Energy Efficiency in California’s Public Power Sector — 2025 A-94
TABLE IPU-1. Energy Efficiency Program Results by End Use
Summary by End Use
Resource Savings Summary
Cost Test Results
End Use
Gross Peak
Savings (kW)
Gross Annual
Energy Savings
(kWh)
Gross Lifecycle
Energy Savings
(kWh)
Net Peak
Savings (kW)
Net Annual
Energy Savings
(kWh)
Net Lifecycle
Energy Savings
(kWh)
Net Lifecycle GHG
Reductions (Tons)
Total Utility
Cost
PAC
TRC
Utility
($/kWh)
Any
0
0
0
0
0
0
0
$0
0.000
Energy Efficiency
0
0
0
0
0
0
0
$0
0.000
EE, Low Income and Electrification
0
0
0
0
0
0
0
$0
0.000
C&S and T&D
$0
Utility Total
0
0
0
0
0
0
0
$0
0.000
Energy Efficiency in California’s Public Power Sector — 2025 A-95
TABLE IPU-2. Energy Efficiency Program Results by Sector
Summary by Sector
Resource Savings Summary
Cost Test Results
Sector
Gross Peak
Savings (kW)
Gross Annual
Energy Savings
(kWh)
Gross Lifecycle
Energy Savings
(kWh)
Net Peak
Savings (kW)
Net Annual
Energy Savings
(kWh)
Net Lifecycle
Energy Savings
(kWh)
Net Lifecycle GHG
Reductions (Tons)
Total Utility
Cost
PAC
TRC
Utility
($/kWh)
Industrial
0
0
0
0
0
0
0
$0
0.000
Energy Efficiency
0
0
0
0
0
0
0
$0
0.000
EE, Low Income and Electrification
0
0
0
0
0
0
0
$0
0.000
C&S and T&D
$0
Utility Total
0
0
0
0
0
0
0
$0
0.000
Energy Efficiency in California’s Public Power Sector — 2025 A-96
TABLE IPU-3. Energy Efficiency Program Results by Building Type
Summary by Building Type
Resource Savings Summary
Cost Test Results
Building Type
Gross Peak
Savings (kW)
Gross Annual
Energy Savings
(kWh)
Gross Lifecycle
Energy Savings
(kWh)
Net Peak
Savings (kW)
Net Annual
Energy Savings
(kWh)
Net Lifecycle
Energy Savings
(kWh)
Net Lifecycle GHG
Reductions (Tons)
Total Utility
Cost
PAC
TRC
Utility
($/kWh)
Any
0
0
0
0
0
0
0
$0
0.000
Energy Efficiency
0
0
0
0
0
0
0
$0
0.000
EE, Low Income and Electrification
0
0
0
0
0
0
0
$0
0.000
C&S and T&D
$0
Utility Total
0
0
0
0
0
0
0
$0
0.000

Energy Efficiency in California’s Public Power Sector — 2025 A-97
LASSEN MUNICIPAL UTILITY DISTRICT
Lassen Municipal Utility District at a Glance
• Climate Zone: 16
• Customers: 10,500
• Total annual retail sales: 145,285 MWh
• Annual Retail Revenue: $28,283,797
• Annual energy efficiency expenditures for reporting year: $151,831
• Gross annual savings from reporting year portfolio: 281 MWh
Lassen Municipal Utility District Overview
Lassen Municipal Utility District (LMUD) remains committed to helping customers manage their
energy use through energy education and a comprehensive offering of energy efficiency
incentives. For residential customers, rebates are offered for the installation of various energy
efficiency measures. For commercial customers, rebates are available for upgraded lighting,
refrigeration equipment, and HVAC equipment, and in cases where an analysis is performed
rebates can be offered for additional equipment that reduces energy use and/or demand. Many
customers are not able to participate in standard rebate programs that require significant
capital investment of their own. To compensate for this, LMUD periodically offers direct
Residential, 119
Commercial, 162
Gross Energy Savings (MWh)
Residential Commercial Industrial Agricultural Other Low Income T&D Electrification

Energy Efficiency in California’s Public Power Sector — 2025 A-98
installation programs at no cost to commercial and residential customers that provide energy
savings and other benefits.
Major Program and Portfolio Changes
LMUD offers a comprehensive menu of energy efficiency rebate programs to our residential,
commercial and agricultural customers. There were no major changes to the program in FY24.
We find that the customers and local contractors value consistency in program offerings.
Program and Portfolio Highlights
LMUD continued the Residential Direct Install Program in FY24. This provided 35% of the gross
annual energy savings for the program. Meanwhile, the Prescriptive Commercial DIY Lighting
Program, which offers fixtures at no cost to customers, delivered 17% of the gross annual
energy savings in FY24. LMUD achieved 134% of the target net annual kWh savings for the last
five years.
Commercial, Industrial & Agricultural Programs
LMUD manages a comprehensive energy efficiency incentive program for commercial,
industrial and agricultural customers:
• Non-Res Lighting Program: LMUD offers rebates to business owners who invest in the
installation of energy efficiency lighting upgrades.
• Non-Res HVAC: LMUD offers rebates to commercial customers for energy efficient HVAC
upgrades.
• Non-Res Refrigeration: Rebates are available to improve the efficiency of commercial
refrigeration systems.
• Non-Res Appliances: Rebates are available for energy efficient cooking equipment such
as ovens, dishwashers, fryers, griddles, etc.
• Non-Res Electronics: LMUD offers rebates for uninterrupted power supplies, plug-load
occupancy sensors and smart power strips.
• Non-Res Custom Program: LMUD offers rebates to business owners based on site-
specific consumption. Rebates are tailored to the individual business owner’s needs
based on the audit and the potential energy savings associated with the customer
project.
• Agricultural Custom Program: LMUD offers rebates to agricultural customers to make
energy efficiency improvements at their sites.
Residential Programs
LMUD manages a comprehensive energy efficiency incentive program for residential
customers:

Energy Efficiency in California’s Public Power Sector — 2025 A-99
• Residential Lighting Program: LMUD offers rebates to homeowners who install ENERGY
STAR-certified LED lamps/bulbs, ceiling fans and LED holiday lights.
• Residential HVAC Program: LMUD offers rebates to homeowners who install high
performance heat pumps, central air-conditioners, whole house fans and ground source
heat pumps that exceed current state requirements.
• Residential Equipment Program: LMUD offers rebates to homeowners who purchase
new ENERGY STAR-certified products, including clothes washers, room air conditioners,
dishwashers, refrigerators, freezers and advanced power strips.
• Residential Water Heater Rebate Program: LMUD offers rebates to customers who
purchase new, energy efficient electric water heaters and heat pump water heaters.
Complementary Programs
• Low-Income Programs: LMUD offers two low-income programs. Winter Energy
Assistance Rate (WEAR) offers rate assistance from November through April. EEAP
provides a one-time assistance payment to help avoid disconnection in the case of a
financial emergency. This program is funded by LMUD’s Public Benefits Program and
administered by the local Salvation Army Office. LMUD also works with Lassen Economic
Development Corporation to identify customers who qualify for state and federal
LIHEAP.
• Renewable Energy Programs: LMUD offers customers a customer generation rate that
pays customers for excess generation. LMUD’s NEM limit of 5% total peak load of
25MW was met in 2018. LMUD no longer offers NEM for solar or other distributed
generation systems. LMUD now offers a Customer Distributed Generation rate of 0.10
per exported kilowatt hour.
• Electric Vehicles: LMUD offers customers rebates on EV charging stations. Publicly
accessible and residential are based on a first-come, first-served basis.
Evaluation, Measurement & Verification Studies
Previous EM&V reports are available on the CMUA’s website: https://www.cmua.org/.
Major Differences or Diversions from CA POU TRM for Energy Savings
LMUD has relied heavily on the savings listed in the CMUA TRM, streamlined eTRM measures,
and savings assumptions from the Bonneville Power Administration. Non-residential lighting,
custom projects and non-deemed refrigeration measures use custom savings calculations.

Energy Efficiency in California’s Public Power Sector — 2025 A-100
TABLE LMUD-1. Energy Efficiency Program Results by End Use
Summary by End Use
Resource Savings Summary
Cost Test Results
End Use
Gross Peak
Savings (kW)
Gross Annual
Energy Savings
(kWh)
Gross Lifecycle
Energy Savings
(kWh)
Net Peak
Savings (kW)
Net Annual
Energy Savings
(kWh)
Net Lifecycle
Energy Savings
(kWh)
Net Lifecycle GHG
Reductions (Tons)
Total Utility
Cost
PAC
TRC
Utility
($/kWh)
Appliance & Plug Loads
3
21,902
231,439
3
17,920
186,195
65
$55,878
0.45
0.43
0.367
Commercial Refrigeration
11
102,107
816,856
7
61,264
490,114
170
$12,646
4.10
4.10
0.030
HVAC - Cooling
1
3,039
28,455
1
1,782
16,806
6
$3,192
0.69
0.65
0.228
HVAC - Heat Pump
2
11,689
175,329
1
7,247
108,704
45
$15,439
1.22
0.81
0.190
Lighting - Indoor
15
88,635
913,289
14
82,183
843,380
311
$37,920
2.83
2.83
0.055
Lighting - Outdoor
2
49,710
589,228
1
40,315
476,850
216
$24,727
2.68
2.68
0.065
Service & Domestic Hot Water
1
3,854
38,542
1
3,604
36,037
15
$2,029
2.69
2.80
0.068
Energy Efficiency
35
280,936
2,793,139
28
214,314
2,158,085
828
$151,831
1.82
1.70
0.086
EE, Low Income and Electrification
35
280,936
2,793,139
28
214,314
2,158,085
828
$151,831
1.82
1.70
0.086
C&S and T&D
$0
Utility Total
35
280,936
2,793,139
28
214,314
2,158,085
828
$151,831
1.82
1.70
0.086
Energy Efficiency in California’s Public Power Sector — 2025 A-101
TABLE LMUD-2. Energy Efficiency Program Results by Sector
Summary by Sector
Resource Savings Summary
Cost Test Results
Sector
Gross Peak
Savings (kW)
Gross Annual
Energy Savings
(kWh)
Gross Lifecycle
Energy Savings
(kWh)
Net Peak
Savings (kW)
Net Annual
Energy Savings
(kWh)
Net Lifecycle
Energy Savings
(kWh)
Net Lifecycle GHG
Reductions (Tons)
Total Utility
Cost
PAC
TRC
Utility
($/kWh)
Commercial
14
161,641
1,531,267
9
108,892
1,061,642
417
$39,011
3.27
3.27
0.045
Residential
21
119,294
1,261,872
19
105,423
1,096,442
411
$112,820
1.32
1.20
0.126
Energy Efficiency
35
280,936
2,793,139
28
214,314
2,158,085
828
$151,831
1.82
1.70
0.086
EE, Low Income and Electrification
35
280,936
2,793,139
28
214,314
2,158,085
828
$151,831
1.82
1.70
0.086
C&S and T&D
$0
Utility Total
35
280,936
2,793,139
28
214,314
2,158,085
828
$151,831
1.82
1.70
0.086
Energy Efficiency in California’s Public Power Sector — 2025 A-102
TABLE LMUD-3. Energy Efficiency Program Results by Building Type
Summary by Building Type
Resource Savings Summary
Cost Test Results
Building Type
Gross Peak
Savings (kW)
Gross Annual
Energy Savings
(kWh)
Gross Lifecycle
Energy Savings
(kWh)
Net Peak
Savings (kW)
Net Annual
Energy Savings
(kWh)
Net Lifecycle
Energy Savings
(kWh)
Net Lifecycle GHG
Reductions (Tons)
Total Utility
Cost
PAC
TRC
Utility
($/kWh)
Any
0
232
2,320
0
139
1,392
0
$1,276
0.15
0.16
1.108
Grocery
12
115,576
978,484
8
72,039
619,416
213
$15,355
4.26
4.26
0.029
Multiple
22
160,355
1,754,628
20
139,473
1,504,583
602
$110,279
1.87
1.71
0.090
Residential
1
2,361
26,920
1
915
10,606
4
$9,021
0.16
0.15
1.065
Residential - Single-Family
0
2,412
30,787
0
1,748
22,087
8
$15,900
0.20
0.21
0.924
Energy Efficiency
35
280,936
2,793,139
28
214,314
2,158,085
828
$151,831
1.82
1.70
0.086
EE, Low Income and Electrification
35
280,936
2,793,139
28
214,314
2,158,085
828
$151,831
1.82
1.70
0.086
C&S and T&D
$0
Utility Total
35
280,936
2,793,139
28
214,314
2,158,085
828
$151,831
1.82
1.70
0.086

Energy Efficiency in California’s Public Power Sector — 2025 A-103
LODI ELECTRIC UTILITY
Lodi Electric Utility at a Glance
• Climate Zone: 12
• Customers: 28,215
• Total annual retail sales: 442,427 MWh
• Annual Retail Revenue: $85,780,477
• Annual energy efficiency expenditures for reporting year: $521,761
• Gross annual savings from reporting year portfolio: 4,043 MWh
Lodi Electric Utility Overview
Lodi Electric Utility (LEU) utilizes the energy efficiency program to engage with residential
customers, bring value to local businesses, and through its commercial energy efficiency
programming, expand the business relationship with key accounts. The energy efficiency
program is designed to benefit all customer segments and offers a wide variety of opportunities
for participation. Residential programs allow households to not only receive rebates by
purchasing energy-efficient appliances, but also encouraging a new way of looking at household
energy use, and how making a few simple changes can make a difference in their carbon
footprint. In 2024, the median household income in Lodi is $85,178. In addition, there are 7
seven percent more households who own their homes than there are renters in the same year.
Residential, 510
Commercial, 365
Industrial, 3,169
Gross Energy Savings (MWh)
Residential Commercial Industrial Agricultural Other Low Income T&D Electrification

Energy Efficiency in California’s Public Power Sector — 2025 A-104
Owners versus renters are 53.47 percent to 46.54 percent. LEU customers, whether owners or
renters, are able to make energy efficient improvements by taking advantage of the many
incentives available for households ranging from appliances to home weatherization, and from
HVAC units to pool pumps. Business accounts, from small commercial to large industrial, can
generate significant operational efficiencies by upgrading lighting, production systems, and
equipment with energy-efficient improvements made affordable through rebates offered by
Lodi Electric.
Major Program and Portfolio Changes
In FY24, LEU continued to offer a comprehensive selection of programs for commercial,
industrial, and residential customers. There were no significant program changes from the
previous program year. Reportable energy savings have decreased from last year due to a
decrease in commercial and industrial projects. In FY 24, Lodi achieved 229% of net annual
energy savings targets.
In FY 24, LEU began its third year of successfully partnering with Tree Lodi, a non-profit
community-based organization, to preserve, protect and enhance Lodi’s urban forest. This all
volunteer organization procures trees from local and regional nurseries, schedules and delivers
trees, determines the most appropriate species for planting, evaluates site conditions for
homeowners and teaches homeowners how to care for trees. Since the inception of this
partnership in FY 21, Tree Lodi has provided homeowners with 2,200 shade trees.
Program and Portfolio Highlights
LEU continued to offer the Residential Direct Install and Snapshot Audit program that it started
in FY 16. This program offers installation of LEDs (Light Emitting Diode), advanced power strips,
thermostatic shower valves, shower heads, and aerators in customer homes at no cost. The
intent is to provide a program for residential customers who do not traditionally participate in
energy efficiency rebate programs. While open to all residential customers, the program
specifically targets multi-family and low-income properties, as they are not likely to benefit
from traditional energy efficiency programs.
The Non-Residential Rebate Program continues to provide a substantial portion of energy
savings achieved, accounting for 92% of annual net savings for FY 24. Through key accounts
management, the utility maintains a proactive and positive relationship with Lodi’s largest
energy consumers. These relationships are essential to the stability of Lodi Electric Utility and
vital to the overall economic development strategy for the City of Lodi.
Commercial, Industrial & Agricultural Programs
LEU manages a comprehensive energy efficiency incentive program for commercial and
industrial customers focusing on energy efficiency and peak load reduction. Rebates are
available for small and large-scale upgraded lighting, HVAC, commercial kitchen appliances,
retail refrigeration equipment, warehouse refrigeration and motorized equipment. In cases

Energy Efficiency in California’s Public Power Sector — 2025 A-105
where an energy efficiency analysis is performed, rebates can be offered for additional
equipment not mentioned above that reduces energy use and/or demand. These on-site
energy efficiency audits, provided by energy efficiency advisors, enable recommendations for
improvements to achieve energy efficiency savings.
LEU offers standard rebates for commercial appliances for Energy Star-rated appliances based
upon industry standards. Other rebates for LED lighting, HVAC improvements, refrigeration,
and motorized equipment are based on energy savings as measured in kilowatt hours
compared to the baseline measurement or old equipment being replaced. These upgrades are
essential to businesses aiming to reduce costs, conserve energy and contribute to
environmental sustainability.
The Keep Your Cool program provides direct install energy savings measures for restaurants,
convenience stores, and any other commercial application requiring refrigeration. Examples
include door closers, anti-sweat heater controls, insulating materials and case lighting.
Over half of all electrical energy consumed in the United States, is used by electric motors.
Businesses investing in improved design, materials, and manufacturing techniques enable
energy-efficient motors to accomplish more work per unit of electricity consumed. LEU offers
rebates on energy-efficient motors based upon number of kilowatt hours saved.
One size does not fit all. LEU encourages businesses to design their own energy efficiency
upgrades and facility improvements to match business energy needs and importantly, budget.
Lodi Electric provides custom-designed rebates based upon energy savings equal to $0.15 cents
per kilowatt hour saved capped at 50 percent of the project’s total cost, and up to a maximum
of $75,000. In addition, LEU offers a zero percent energy financing program that allows
commercial customers to install energy-efficient improvements up to $150,000. The loan
requirements are easy. Customers in good standing are able to install improvements and pay
back the loan over 24 months on their monthly utility bill.
Standard and custom rebate information and applications are available on line at Lodi Electric
Utility.
Residential Programs
Lodi Electric offers energy efficiency incentives or rebates to all residential customers for the
purchase of upgraded lighting, home weatherization, and Energy Star-rated HVAC and other
appliances. While rebates vary by appliance or measure purchased, rebates are evaluated on a
regular basis to conform to the latest industry standard. Examples of appliances and measures
include, but are not limited to LED lamps/bulbs, ceiling fans, holiday lights, and high-
performance HVAC equipment that exceed current state requirements. Household appliances
ranging from clothes washers to dishwashers, and from refrigerators to energy efficient water
heaters account for the majority of rebates. Residential weatherization materials including attic
and wall insulation are also rebated.

Energy Efficiency in California’s Public Power Sector — 2025 A-106
The residential Direct Install Program offered by LEU is a no cost energy efficient measure
installation program to homeowners and renters who without incentives would likely not make
household energy efficient improvements. In many ways, this program begins to unlock the
potential of home energy efficiency for rate payers, and empowers residents to make future
decisions to achieve greater conservation and savings. Lodi Electric deploys home energy
advisors to assess the home and install smart power strips, LED lighting, faucet aerators,
thermostatic shower values, basic pipe insulation and weather-stripping.
Complementary Programs
Payment Assistance for Low-income Households:
• Lodi C.A.R.E. Package Program: Provides payment assistance grants to very low-income
customers in need of assistance paying their electric utility account. In 2022, CARE
Package assistance payments were increased from $110 to $150. Eligible participants
may apply for up to $150 in a six-month period. In FY 24, 271 Lodi Electric Utility
account holders applied for assistance, and received $28,714 in benefits.
• Lodi SHARE Discount Rate: LEU provides a rate discount of 30% for qualifying residential
customers on their electric utility monthly billing statement; $442,200 was budgeted in
FY 24 for this rate discount from the Lodi Public Benefits Program fund.
Sustainability:
• Renewable Energy Programs: LEU offers an Energy Purchase rate tariff for customers
interested in installing solar. In addition, LEU funds a portion of its eligible power supply
costs from the Public Benefits Program fund each year. For FY 24, this totaled a little
over $128,000.
• Electrification: LEU offers rebates for replacing gas ranges and electric resistance
cooktops with new induction Ranges and Cooktops.
• Electric Vehicles: In FY 24, LEU continued to offer rebates for residential and commercial
EV chargers, and rebates for the purchase of new and used zero-emission vehicles
including both standard and income-qualifying rebates. Lodi Electric Utility provides
Level 2 EV public charging at multiple City-owned sites.
Energy Efficiency and Conservation Curriculum:
In FY 24, Lodi Electric Utility implemented another successful energy efficiency education
program within the Lodi middle school educational curriculum designed to teach students
about how to use energy responsibly. Energy education efforts include a science-based energy
efficiency curriculum designed to demonstrate how minor changes in energy use can make a
significant impact on overall energy consumption. Beginning in August 2023 to June 2024,
educational program highlights included lessons delivered through an in-person and online
platform to 538 students across 10 Lodi middle schools. This content was followed with hands-
on activities to enhance learning retention. During the implementation period, teachers,

Energy Efficiency in California’s Public Power Sector — 2025 A-107
students, and parents were given access to the online Web App. During the final lesson,
students completed exercises that required measuring current home energy use and
retrofitting home energy use devices with high-efficiency devices from take-home kits. In FY
23, an educational component was incorporated into the curriculum to educate young students
about the benefits of electric vehicles. This effort continued into the FY 24 program.
Evaluation, Measurement & Verification Studies
Previously completed EM&V reports are available for review at https://www.cmua.org/emv-
reports
The next EM&V studies will be performed after July 1, 2025.
Major Differences or Diversions from CA POU TRM for Energy Savings
LEU relies heavily on the unit energy savings listed in the POU TRM and the eTRM. The
Commercial Lighting and Commercial Custom programs use custom savings calculations based
on actual pre- and post-equipment specifications.
Energy Efficiency in California’s Public Power Sector — 2025 A-108
TABLE LEU-1. Energy Efficiency Program Results by End Use
Summary by End Use
Resource Savings Summary
Cost Test Results
End Use
Gross Peak
Savings (kW)
Gross Annual
Energy Savings
(kWh)
Gross Lifecycle
Energy Savings
(kWh)
Net Peak
Savings (kW)
Net Annual
Energy Savings
(kWh)
Net Lifecycle
Energy Savings
(kWh)
Net Lifecycle GHG
Reductions (Tons)
Total Utility
Cost
PAC
TRC
Utility
($/kWh)
Appliance & Plug Loads
9
76,091
558,342
8
59,189
383,324
135
$134,081
0.32
0.29
0.403
Building Envelope
44
246,447
4,932,533
16
76,155
1,524,099
355
$64,308
1.44
0.64
0.062
HVAC - Cooling
373
2,885,388
43,140,419
358
2,841,511
42,544,470
14,726
$124,633
35.51
26.55
0.004
HVAC - Heat Pump
5
20,251
303,772
3
12,556
188,339
84
$24,403
2.79
2.18
0.173
Lighting - Indoor
56
256,937
2,831,404
53
243,958
2,687,853
1,134
$85,082
3.65
3.93
0.039
Lighting - Outdoor
0
549,878
7,726,211
0
522,384
7,339,900
3,145
$85,095
9.87
117.85
0.015
Service & Domestic Hot Water
2
8,251
82,511
2
7,559
75,585
27
$4,160
2.43
2.20
0.067
Energy Efficiency
488
4,043,243
59,575,191
439
3,763,312
54,743,570
19,606
$521,761
11.10
9.92
0.013
EE, Low Income and Electrification
488
4,043,243
59,575,191
439
3,763,312
54,743,570
19,606
$521,761
11.10
9.92
0.013
C&S and T&D
$0
Utility Total
488
4,043,243
59,575,191
439
3,763,312
54,743,570
19,606
$521,761
11.10
9.92
0.013
Energy Efficiency in California’s Public Power Sector — 2025 A-109
TABLE LEU-2. Energy Efficiency Program Results by Sector
Summary by Sector
Resource Savings Summary
Cost Test Results
Sector
Gross Peak
Savings (kW)
Gross Annual
Energy Savings
(kWh)
Gross Lifecycle
Energy Savings
(kWh)
Net Peak
Savings (kW)
Net Annual
Energy Savings
(kWh)
Net Lifecycle
Energy Savings
(kWh)
Net Lifecycle GHG
Reductions (Tons)
Total Utility
Cost
PAC
TRC
Utility
($/kWh)
Commercial
59
364,729
4,572,086
44
317,192
3,903,972
1,493
$60,703
7.01
6.21
0.020
Industrial
338
3,168,518
47,527,770
338
3,149,632
47,244,477
16,982
$132,174
37.49
63.25
0.004
Residential
90
509,996
7,475,335
57
296,488
3,595,121
1,131
$328,884
1.24
0.94
0.120
Energy Efficiency
488
4,043,243
59,575,191
439
3,763,312
54,743,570
19,606
$521,761
11.10
9.92
0.013
EE, Low Income and Electrification
488
4,043,243
59,575,191
439
3,763,312
54,743,570
19,606
$521,761
11.10
9.92
0.013
C&S and T&D
$0
Utility Total
488
4,043,243
59,575,191
439
3,763,312
54,743,570
19,606
$521,761
11.10
9.92
0.013
Energy Efficiency in California’s Public Power Sector — 2025 A-110
TABLE LEU-3. Energy Efficiency Program Results by Building Type
Summary by Building Type
Resource Savings Summary
Cost Test Results
Building Type
Gross Peak
Savings (kW)
Gross Annual
Energy Savings
(kWh)
Gross Lifecycle
Energy Savings
(kWh)
Net Peak
Savings (kW)
Net Annual
Energy Savings
(kWh)
Net Lifecycle
Energy Savings
(kWh)
Net Lifecycle GHG
Reductions (Tons)
Total Utility
Cost
PAC
TRC
Utility
($/kWh)
Any
32
300,081
3,600,038
30
284,914
3,418,412
1,335
$37,509
10.07
54.84
0.014
Multiple
69
314,307
3,491,811
50
241,132
2,474,832
880
$227,371
1.40
1.08
0.114
Other Industrial
338
3,168,518
47,527,770
338
3,149,632
47,244,477
16,982
$132,174
37.49
63.25
0.004
Residential
45
245,809
4,780,252
18
77,803
1,481,829
361
$85,396
1.32
0.69
0.084
Residential - Single-Family
4
14,528
175,320
4
9,831
124,019
48
$39,311
0.65
0.66
0.411
Energy Efficiency
488
4,043,243
59,575,191
439
3,763,312
54,743,570
19,606
$521,761
11.10
9.92
0.013
EE, Low Income and Electrification
488
4,043,243
59,575,191
439
3,763,312
54,743,570
19,606
$521,761
11.10
9.92
0.013
C&S and T&D
$0
Utility Total
488
4,043,243
59,575,191
439
3,763,312
54,743,570
19,606
$521,761
11.10
9.92
0.013

Energy Efficiency in California’s Public Power Sector — 2025 A-111
LOMPOC ELECTRIC UTILITY
Lompoc Electric Utility at a Glance
• Climate Zone: 5
• Customers: 15,301
• Total annual retail sales: 121,729 MWh
• Annual Retail Revenue: $25,721,326
• Annual energy efficiency expenditures for reporting year: $190,653
• Gross annual savings from reporting year portfolio: 90 MWh
Lompoc Electric Utility Overview
Established in 1923, the City of Lompoc’s Electric Utility (Lompoc) serves electricity to over
15,000 customers in the Central Coast region of California. Lompoc offers a variety of programs
to assist all customer classes by economizing their monthly electricity costs through energy
efficiency and conservation practices. The local climate, customer base and community
demographics largely influence Lompoc’s strategy to offer effective energy-saving programs to
its customers.
In FY 2024, most of Lompoc’s energy savings were achieved through its commercial lighting
retrofit program and lighting retrofit projects completed at City-owned facilities, since there is
little need for air conditioning in Lompoc’s coastal climate and most buildings are heated by
Residential, 27
Commercial, 63
Gross Energy Savings (MWh)
Residential Commercial Industrial Agricultural Other Low Income T&D Electrification

Energy Efficiency in California’s Public Power Sector — 2025 A-112
gas. Residential customers accounted for 90% of Lompoc’s customer base in FY 2024, with an
average residential electricity use of 332 kWh per month. Only 11% of retail customer
connections are commercial and demand customers; however, these customer classes hold the
majority of energy savings opportunities within Lompoc’s electricity service territory.
The demographics of the Lompoc community also have an impact on the participation rate of
energy efficiency programs. The average median household income in Lompoc is $66,947 with
17.2% of the population living in poverty (2023 US Census Quick Facts). Many residential
customers have limited funds or incentive to make energy efficiency improvements to their
homes. During FY 2024, numerous small, local businesses within Lompoc’s service territory
were continuing to recover and resume normal business after the COVID-19 pandemic, leaving
little room for owner-led investment in EE upgrades during this time. To assist its customers,
Lompoc continued to offer generous rebate and income-qualifying programs for customers.
Major Program and Portfolio Changes
In FY 2024, Lompoc continued seeking new and innovative ways to help its customers reduce
energy use while continuing to offer its usual energy efficiency and conservation programs.
Utilizing its AMR-enabled metering system, high energy-using customers were provided
customized energy reduction tips and technical assistance to reduce energy demand and costs.
Lompoc also continued offering its LED Lightbulb Replacement and LED Holiday Light Exchange
programs, which began in FY 2022. Customers of all classes were able to bring their old,
inefficient lightbulbs or holiday light strings into City Hall and replace them with new, efficient
light bulbs or holiday lights. Lompoc offered the new equipment, as well as the disposal of
hazardous and electronic waste, at no cost to utility customers as both programs were funded
with public benefit resources. These programs assisted customers with old, inefficient lighting
equipment to replace it without having to incur an upfront purchase cost and lessened the
increase in electric utility bills during the holiday season.
Program and Portfolio Highlights
Lompoc realized increased savings in its Commercial Lighting Rebate Program from commercial,
industrial, and institutional customers this year and hopes to continue increasing participation
in the program in future years. This program is designed to support commercial, industrial, and
institutional customers to optimize their energy usage by incentivizing the removal and
replacement of old, inefficient light fixtures with more efficient LED fixtures. This program
provided 79% of Lompoc’s annual energy savings in FY 2024.
Commercial, Industrial & Agricultural Programs
Lompoc offers a number of rebate programs for commercial, industrial and agricultural
customers, including rebates for lighting, HVAC, and other energy-efficient equipment
upgrades. These customer classes may also apply for rebates on custom energy-saving projects.

Energy Efficiency in California’s Public Power Sector — 2025 A-113
Lompoc currently classifies industrial and agricultural customers as commercial customers;
therefore, there are no specific programs for these sectors.
Residential Programs
Lompoc offers several rebate opportunities for residential customers such as the Energy Star
Appliance Rebate Program, the LED Lighting Replacement Program, and the Holiday Light
Replacement Program. While each residential rebate program provided a small percentage of
the City’s overall energy savings, these programs provide all customers a chance to participate
in the City’s energy efficiency program. It should be noted that clothes washer rebates
administered through the Energy Star Appliance Rebate Program is partly funded from Public
Benefit charges, sharing program costs with the City of Lompoc’s Water Conservation Fund.
Lompoc provides both water and electricity services to its customers, among other services.
To help encourage low-income residential customer participation in energy efficiency upgrades,
Lompoc continued to offer its Income-Qualified Energy Star Refrigerator Replacement and
Recycle Program in FY 2024. Success of this program can be attributed to an established pre-
approval process for participating customers, as well as City staff working with one small, locally
owned appliance dealer who handles the delivery and installation of new energy-efficient
refrigerators. The appliance dealer also handles refrigerator-recycling processes for
participating customers. This program expedites the process for low-income customers to
participate in the energy efficiency program and assists Lompoc to ensure that old, inefficient
appliances are recycled properly at the City landfill. Residential customers must meet low-
income guidelines established by the Department of Housing and Urban Development (HUD) to
participate. Participating customers also pay a portion of the cost back to the City over a year.
Complementary Programs
In addition to the portfolio programs, Lompoc also offers rate assistance, customer energy use
auditing, and has been closely evaluating the feasibility of offering EV charging services. Lompoc
provides financial assistance towards electricity charges for customers who have a household
income level below the HUD Low Income Limits Calculation for the local area.
The Customer Energy Audit Program continues to be highly successful in meeting customers’
needs. Using Lompoc’s automatic meter reading capabilities, staff is able to view daily and
hourly electric use data. Customers are provided reports of their electric use which can help
them better understand their usage and implement staff suggestions to reduce energy use
without making investments in energy efficiency upgrades. Audits are also offered over-the-
phone and via email to further assist customers who are unable to visit City Hall during business
hours. Customers are also offered a watt meter at no cost to measure the energy use of
appliances and electronics used at home.
Energy Efficiency in California’s Public Power Sector — 2025 A-114
Evaluation, Measurement & Verification Studies
Previously completed EM&V reports are available for review at: https://www.cmua.org/emv-
reports.
Major Differences or Diversions from CA POU TRM for Energy Savings
The City of Lompoc used the CMUA POU TRM and eTRM as the primary sources for calculating
and reporting annual energy efficiency program performance during FY 2024.
Energy Efficiency in California’s Public Power Sector — 2025 A-115
TABLE Lompoc-1. Energy Efficiency Program Results by End Use
Summary by End Use
Resource Savings Summary
Cost Test Results
End Use
Gross Peak
Savings (kW)
Gross Annual
Energy Savings
(kWh)
Gross Lifecycle
Energy Savings
(kWh)
Net Peak
Savings (kW)
Net Annual
Energy Savings
(kWh)
Net Lifecycle
Energy Savings
(kWh)
Net Lifecycle GHG
Reductions (Tons)
Total Utility
Cost
PAC
TRC
Utility
($/kWh)
Appliance & Plug Loads
1
24,052
234,123
1
10,994
100,046
29
$84,570
0.10
0.10
1.030
Commercial Refrigeration
0
5,125
76,875
0
3,587
53,813
19
$8,753
0.63
0.55
0.217
HVAC - Cooling
0
153
1,398
0
83
755
0
$299
0.23
0.21
0.471
HVAC - Heat Pump
0
1,179
17,683
0
731
10,963
4
$5,220
0.29
0.24
0.636
Lighting - Indoor
12
58,740
706,073
10
46,888
563,302
181
$87,480
0.62
0.61
0.196
Miscellaneous
0
1,050
10,500
0
578
5,775
2
$4,330
0.13
0.13
0.907
Energy Efficiency
14
90,298
1,046,652
11
62,860
734,654
235
$190,653
0.37
0.35
0.327
EE, Low Income and Electrification
14
90,298
1,046,652
11
62,860
734,654
235
$190,653
0.37
0.35
0.327
C&S and T&D
$0
Utility Total
14
90,298
1,046,652
11
62,860
734,654
235
$190,653
0.37
0.35
0.327
Energy Efficiency in California’s Public Power Sector — 2025 A-116
TABLE Lompoc-2. Energy Efficiency Program Results by Sector
Summary by Sector
Resource Savings Summary
Cost Test Results
Sector
Gross Peak
Savings (kW)
Gross Annual
Energy Savings
(kWh)
Gross Lifecycle
Energy Savings
(kWh)
Net Peak
Savings (kW)
Net Annual
Energy Savings
(kWh)
Net Lifecycle
Energy Savings
(kWh)
Net Lifecycle GHG
Reductions (Tons)
Total Utility
Cost
PAC
TRC
Utility
($/kWh)
Commercial
12
63,466
776,963
10
50,260
613,883
199
$90,963
0.65
0.64
0.188
Residential
2
26,832
269,689
1
12,600
120,771
37
$99,690
0.11
0.11
1.016
Energy Efficiency
14
90,298
1,046,652
11
62,860
734,654
235
$190,653
0.37
0.35
0.327
EE, Low Income and Electrification
14
90,298
1,046,652
11
62,860
734,654
235
$190,653
0.37
0.35
0.327
C&S and T&D
$0
Utility Total
14
90,298
1,046,652
11
62,860
734,654
235
$190,653
0.37
0.35
0.327
Energy Efficiency in California’s Public Power Sector — 2025 A-117
TABLE Lompoc-3. Energy Efficiency Program Results by Building Type
Summary by Building Type
Resource Savings Summary
Cost Test Results
Building Type
Gross Peak
Savings (kW)
Gross Annual
Energy Savings
(kWh)
Gross Lifecycle
Energy Savings
(kWh)
Net Peak
Savings (kW)
Net Annual
Energy Savings
(kWh)
Net Lifecycle
Energy Savings
(kWh)
Net Lifecycle GHG
Reductions (Tons)
Total Utility
Cost
PAC
TRC
Utility
($/kWh)
Any
13
69,661
811,201
11
54,532
637,197
207
$114,835
0.54
0.54
0.227
Multiple
1
9,129
106,237
0
3,380
40,543
11
$27,651
0.12
0.09
0.862
Residential
0
7,595
85,144
0
2,446
27,771
8
$23,623
0.08
0.08
1.059
Residential - Single-Family
0
3,913
44,070
0
2,502
29,142
9
$24,544
0.13
0.13
1.081
Energy Efficiency
14
90,298
1,046,652
11
62,860
734,654
235
$190,653
0.37
0.35
0.327
EE, Low Income and Electrification
14
90,298
1,046,652
11
62,860
734,654
235
$190,653
0.37
0.35
0.327
C&S and T&D
$0
Utility Total
14
90,298
1,046,652
11
62,860
734,654
235
$190,653
0.37
0.35
0.327

Energy Efficiency in California’s Public Power Sector — 2025 A-118
LOS ANGELES DEPARTMENT OF WATER AND POWER
Los Angeles Department of Water and Power at a Glance
• Climate Zones: 6, 8, 9, 16
• Customers: 1,588,000
• Total annual retail sales: 21,385,000 MWh
• Annual Retail Revenue: $4,825,000,000
• Annual energy efficiency expenditures for reporting year: $125,162,948
• Gross annual savings from reporting year portfolio: 105,791 MWh
Los Angeles Department of Water and Power Overview
The Los Angeles Department of Water and Power (LADWP) was established in 1902 to deliver
water to the City of Los Angeles and distribute electricity in 1916. LADWP is the largest
municipal utility in the nation, providing reliable energy and water services to 4 million
residents and 450,000 businesses (1.6M customer accounts) in four different climate zones:
CZ6, CZ8, CZ9, and CZ16. A peak demand of 5,201 MW was registered on August 29, 2023.
Major Program and Portfolio Changes
During various periods of FY 2023-2024, the RETIRE, ACOPT, REP, EPM, CDI, and LAUSD DI
programs experienced temporary suspensions as part of the normal process of procuring new
Residential, 14,202
Commercial,
73,033
Other, 12,771
Low Income, 25
Electrification,
5,759
Gross Energy Savings (MWh)
Residential Commercial Industrial Agricultural Other Low Income T&D Electrification

Energy Efficiency in California’s Public Power Sector — 2025 A-119
contracts and securing the required approvals to resume operations. These routine procedures
impacted program activity throughout the fiscal year; however, all programs are on track to
resume full operations in FY 2025-2026.
LADWP has expanded its building electrification offerings to serve all customer segments
through a growing portfolio of programs. These initiatives provide tailored solutions to support
the transition from gas to electric technologies, helping customers across residential,
commercial, and industrial sectors reduce carbon emissions and improve energy efficiency.
Program and Portfolio Highlights
Consumer Rebate Program
The Consumer Rebate Program (CRP) introduced a seasonal incentive bonus of $250 for
variable speed pool pump motors to encourage energy-efficient upgrades during peak demand
periods. This limited-time bonus provides additional savings for customers who replace
inefficient pool equipment, helping to reduce energy use while supporting grid reliability.
Efficient Product Marketplace
The suspension of the Efficient Product Marketplace (EPM) spurred a pivot to an in-house order
processing system to restore operations. Although the interim solution was less robust and led
to some service limitations, EPM was able to resume activity and continue supporting a portion
of customers during the transition.
Refrigerator Turn in & Recycle Program
LADWP continued to offer the increased incentive of $60 per refrigerator/freezer recycled.
Commercial, Industrial & Agricultural Programs
City Plants:
The City Plants (CP) Program provides free shade trees for residents and property owners in Los
Angeles to promote tree planting to improve the city's tree canopy, air quality, stormwater
retention, and, importantly, building energy efficiency. This program is operated by the City
Plants team under the city's Board of Public Works and supported by LADWP.
Through this partnership, City Plants can provide free shade trees for residents and property
owners and information on where to plant the trees for maximum energy efficiency benefits.
City Plants currently focuses on delivering trees to residential and commercial customers and
planting trees on residential parkways, commercial parkways, and other city property (Res
Cooling, Res Shell, Commercial Shell).
Energy Efficiency in California’s Public Power Sector — 2025 A-120
Codes and Standards (C&S):
The Codes, Standards & Ordinances Program conducts advocacy activities to improve building,
appliance, and water use efficiency regulations. These activities include monitoring and active
participation in code and standard development, compliance and enforcement support with
our sister agency LA Department of Building and Safety, legislative review, sponsorship of local
ordinances, and participation in policy efforts with other City departments, state agencies and
utilities. The goal of this program is to promote sustainability concerning water and energy use.
The principal audience includes the LA City Department of Building and Safety, LA City Planning,
LA City Department of Public Works, and the LA City Council, which develop and adopt codes
and standards specific to Los Angeles that go beyond state and federal regulation. Other
audiences include state agencies, which conduct periodic rulemakings to update energy
efficiency and water conservation regulations and standards, and industry groups that conduct
research and develop industry-specific standards. (Non-Res Process)
Commercial Direct Install:
The Commercial Direct Install Program is a free direct-install program that targets small,
medium, and large business customers in the LADWP service territory. LADWP partners with
Southern California Gas Company (SoCalGas) on this program to offer a tri-resource efficiency
program aiming to reduce the use of electricity, water, and natural gas. The CDI program is
available to qualifying businesses whose average monthly electrical demand is 250 kilowatts
(kW) or less. (Non-Res Lighting)
Commercial Lighting Incentive Program:
The Commercial Lighting Incentive Program (CLIP) offers customers incentives to install newly
purchased and installed energy-efficient lighting and controls. CLIP currently provides
incentives to customers whose monthly electrical use is greater than 200 kilowatts (kW). CLIP’s
calculated savings approach allows customers to tailor their lighting efficiency upgrades to
meet their lighting needs better, attain greater energy savings, and receive higher incentives.
(Non-Res Lighting)
Custom Performance Program (CPP):
The Custom Performance Program (CPP) provides cash incentives for energy savings achieved
through the implementation and installation of various energy efficiency measures and
equipment that meet or exceed Title 24 or industry standards. Measures may include but are
not limited to equipment controls, industrial process, retrocomissioning, chiller efficiency,
and/or other innovative energy savings strategies.
CPP’s Custom Express fast tracks smaller, less energy-intensive projects with deemed energy
savings projections to help expedite application processing and get customers paid faster, while
CPP’s Custom Calculated conducts an in-depth energy savings analysis to custom calculate
Energy Efficiency in California’s Public Power Sector — 2025 A-121
customers’ individual efficiency projects’ energy savings. By utilizing our customers’ existing
facility conditions as the baseline, CPP’s Custom Calculated maximized our customers’ savings
potential! (Non-Res Cooling, Non-Res Comprehensive, Non-Res Motors, Non-Res Lighting, Non-
Res Refrigeration)
Food Service:
The Food Service Program (FSP) offers incentives to encourage retrofit measures and
technologies to reduce energy consumption in supermarkets, liquor stores, convenience stores,
restaurants, etc. Rebates are offered for ovens, griddles, steam cookers, holding cabinets, glass
and solid door refrigerators/freezers, ice makers, dishwashers and handwrappers. (Non-Res
Refrigeration, Non-Res Cooking)
LADWP Facilities:
The LADWP Facilities Upgrade Program strives to improve energy and water efficiency
throughout LADWP’s facilities with energy efficiency upgrades in HVAC and lighting and water
efficiency upgrades in plumbing fixtures, leak correction and landscaping improvements. It
identifies and assists those LADWP facilities to reduce energy and water usage, which results in
a reduction in energy and water consumption and procurement expense for LADWP that would
otherwise be borne by LADWP customers. (Non-Residential Lighting)
LAUSD Direct Install:
The Los Angeles Unified School District Direct Install Program is designed to improve energy and
water efficiency throughout LAUSD's facilities through upgrades in electric and water systems.
This program provides energy efficiency design assistance, project management experience,
and retrofitting installation, utilizing LADWP’s Power Construction Maintenance (PCM) and
Commercial Direct Install (CDI) program to assist LAUSD facilities reducing energy usage and
corresponding utility expenses. (Non-Res Lighting)
Savings by Design (SBD) / Zero by Design (ZBD):
The Savings By Design (SBD) Program was a California statewide non-residential new
construction program, in which LADWP partnered with Southern California Gas Company
(SoCalGas) to offer a uniform, multi-faceted program designed to consistently serve the needs
of the commercial building community. SBD encouraged energy-efficient building design and
construction practices, promoting the efficient use of energy by offering up-front design
assistance, owner incentives, design team incentives, and energy design resources. On January
1, 2021, SBD transitioned to Zero By Design (ZBD) without the SoCalGas partnership.
Zero By Design (LADWP ZBD) is LADWP’s non-residential new construction incentive program.
Launched on January 1, 2021, LADWP ZBD replaces the California-statewide Savings By Design
program that was held in partnership with Southern California Gas Company. LADWP ZBD
encourages energy-efficient building design and construction practices by promoting the

Energy Efficiency in California’s Public Power Sector — 2025 A-122
efficient use of energy by offering up-front design assistance, owner incentives, design team
incentives, and energy design resources. (Non-Res Comprehensive)
Upstream HVAC:
The nonresidential Upstream Heating, Ventilation, and Air Conditioning (HVAC) Program is a
market transformation-oriented program. This program offers incentives to upstream market
actors who sell qualifying high-efficiency HVAC equipment. The logic that underscores this
program's design is that a small number of upstream market actors can impact thousands of
customers and influence their choice of equipment by increasing the stocking and promotion of
high-efficiency HVAC equipment.
The upstream model cost-effectively leverages this market structure and existing relationships.
The program added additional upstream market actors to expand its coverage of the Los
Angeles market. The upstream program is designed to adapt to market changes. Therefore,
LADWP will continue working with relevant industry players to enhance the program to include
new beyond-code upstream incentives continually. (Commercial Cooling)
Residential Programs
California Advanced Homes:
The California Advanced Home Program (CAHP) is a statewide residential construction incentive
program in which LADWP participated through a partnership with the Southern California Gas
Company. CAHP incentivized builders and designers to create environmentally-friendly,
energy-efficient communities for potential home buyers. CAHP was available to single and
multi-family residential new construction projects and helped builders prepare for future code
changes by encouraging them to build homes that exceed code, ultimately driving new homes
to Zero Net Energy (ZNE). The program partnership ended in December 2019. (Res
Comprehensive)
Consumer Rebate Program (CRP):
The Consumer Rebate Program offers incentives to its residential customers to promote and
advance comprehensive energy efficiency measures, including whole-house solutions, plug load
efficiency, performance standards, and integration opportunities. CRP is designed to offer and
promote specific and comprehensive energy solutions within the residential market sector. (Res
Cooling, Res Shell, Res Refrigeration, Res Pool Pump)
Efficient Product Marketplace:
The Efficient Product Marketplace (EPM) offers customers the opportunity to research, locate,
and purchase energy efficient products online. Residential customers can also apply for rebates
on qualifying ENERGY STAR® products, including refrigerators, room air conditioners, LED
lighting, and televisions. Rebates are also available for Wi-Fi enabled thermostats and advanced
power strips. Customers have the option of purchasing qualified products from a third-party
Energy Efficiency in California’s Public Power Sector — 2025 A-123
retailer and submitting a rebate application, or purchasing select products directly through the
online marketplace and having the rebate applied as an instant discount at the time of
purchase. (Res Cooling, Res Lighting, Res Refrigeration)
Home Energy Improvement Program:
The Home Energy Improvement Program (HEIP) is a comprehensive direct install whole-house
retrofit program that offers residential customers a full suite of free products and services to
improve the home's energy and water efficiency by upgrading/retrofitting the home's envelope
and core systems. While not limited to low-income customers, in FY 2020-2021, HEIP expanded
to serve disadvantaged communities and residential customers by including the multi-family
segment. (Res Shell, Res Lighting)
HVAC Optimization Program:
The AC Optimization Program provides services by certified, professional heating, ventilation,
and air conditioning (HVAC) technicians to analyze cooling systems and provide basic
maintenance to maximize system efficiency. This service is offered to eligible residential and
commercial LADWP customers at no cost. This program also offers a programmable, Wi-Fi
enabled thermostat free of charge to residential customers. (Res Cooling)
Refrigerator Exchange (REP) / Window AC:
The Refrigerator Exchange Program (REP) is a free refrigerator replacement program designed
to target customers that qualify on either LADWP's Low-Income or its Senior Citizen/Disability
Lifeline Rates as well as Multi-Residential or Non-Profit customers. The program was expanded
to include the following entities, multi-family or mobile home communities, civic, community,
faith-based organizations, and educational institutions. This Program leverages a 3rd Party
Contractor, ARCA (Appliance Recycling Centers of America), to administer the program's
delivery and provide new, energy-saving ENERGY STAR® rated refrigerators for this customer
segment to replace qualifying older, inefficient, but operational models. Additionally,
customers can pair the REP with the Window Air Conditioner Recycling Program, which offers a
$25 rebate to residential customers to turn-in their old window air conditioners. Eligible units
must be fully operational and satisfy certain age and size requirements. (Res Refrigeration)
Refrigerator Turn-In & Recycle:
The Refrigerator Turn-in and Recycle Program offers a $60 rebate, along with free pick-up, to
residential customers to turn-in old refrigerators and freezers for recycling. Eligible units must
be fully operational and satisfy certain age and size requirements. LADWP leverages a 3rd Party
Contractor, ARCA (Appliance Recycling Centers of America), to administer the program's
delivery. (Res Refrigeration)

Energy Efficiency in California’s Public Power Sector — 2025 A-124
Residential Lighting Efficiency Program:
The Residential Lighting Efficiency Program (RLEP) provides light-emitting diode (LED) lamps to
customers to reduce their home electrical use. The primary channel for distributing the LED
lamps is by way of Direct-to-Door to residential customers within LADWP's service territory.
Lamps are also distributed at community events and by community-based organizations.
Alternative and additional distribution campaigns continue to be evaluated. (Res Lighting)
Complementary Programs
Low-Income Programs:
Refrigerator Exchange Program, Home Energy Improvement Program and Commercial Direct
Install Program are key programs offered to the community, small business customers, hard to
reach customers, low-income customers, and multi-unit dwellings.
Emerging Technologies Program:
The LADWP Emerging Technologies Program (ETP) is designed to accelerate the introduction of
innovative energy and water-efficient technologies, applications, and analytical tools that are
not yet widely adopted in California. By reducing both the performance uncertainties
associated with new products and institutional barriers, this program's ultimate goal is to
increase the probability that promising energy and water efficiency technologies will be
commercialized and adopted throughout Los Angeles.
As a non-resource program for LADWP and focused on promoting the development and
implementation of new technologies in the LADWP community, ETP provides energy and water
savings that are ultimately captured in LADWP’s resource programs. In this way, ETP plays a
vital role in positioning LADWP as a state and national leader in energy and water efficiency.
Green Power for a Green L.A. Program:
The Green Power for a Green L.A. program gives Los Angeles residents, businesses, and
governmental agencies a stake in preserving and protecting our environment through their
voluntary contribution to support additional renewable energy. Customers who sign up for
Green Power choose to have all, or a portion, of their electricity needs generated from
renewable energy sources.
Program Outreach & Community Partnerships Program
The Program Outreach & Community Partnerships Program (Program) is an advocacy program
that strives to improve customer awareness among LADWP’s “hard-to-reach” customers of
electric efficiency and water conservation programs through community-based activities
organizations. This program offers grants to local non-profit organizations that are awarded
through a competitive selection process to work in one of the fifteen Los Angeles City Council
Districts, or, on an at-large basis, to improve community and customer awareness of LADWP’s

Energy Efficiency in California’s Public Power Sector — 2025 A-125
core energy efficiency and water conservation programs and free services customers can take
to reduce energy and water use. The program has expanded to focus on other topics such as
financial assistance, community solar, water quality, and electric vehicles.
Research, Development, and Demonstration:
LADWP is involved in various internal energy storage studies and projects using various
technologies and use cases, including lithium-ion, flow batteries, compressed air, thermal
energy storage at levels of the power system, including generation, transmission, distribution,
and behind the meter. Some of these studies are in collaboration with EPRI.
Electric Vehicle Charger Rebate Program:
LADWP introduced the Electric Vehicle Charger Rebate Program, “Charge Up L.A.!” to
encourage the installation of convenient electric vehicle (EV) charging stations at residential
and commercial locations to support the purchase and use of EVs. This program benefits the
environment and helps EV users save on fuel costs at the same time. The rebate is offered to
qualifying commercial customers who purchase and install Level 2 (240-volt) chargers at their
business place. Customers who choose to install an optional dedicated time-of-use (TOU) meter
will qualify for the LADWP’s EV discount of 2.5 cents per kilowatt-hour (kWh). This dedicated
service will add additional cost to the installation process but will yield lower electricity costs
for off-peak charging.
Evaluation, Measurement & Verification Studies
The next round of EM&V services are in RFP phase and will go through administrative
processing and review. Thus, this year's reporting figures are purely Ex-Ante or claimed savings.
The total NTE budget for the previous round of EM&V over the 3-year contract period is
$4,895,135, which is equivalent to approximately 1% of the total portfolio budget annually.
This evaluation will review past (retrospective) impact savings from FY15/16 thru 19/20 while
simultaneously reviewing impact savings as it occurs (concurrently), from FY20/21 thru
FY22/23. The process evaluation portion of the scope will only review the concurrent period.
The new round of LADWP EM&V activities started Q3 of 2020 to capture impact evaluation for
retrospective years. Both impact and process evaluation will be evaluated for concurrent years.
Like prior years, the current round of EM&V contract will also have a contract term duration of
3 years, with comparable budgets as proportioned to the portfolio savings.
LADWP has opted to evaluate its programs and activities from a holistic standpoint,
emphasizing the effects of energy efficiency programs. Beyond the core impact and process
evaluation findings, the new EM&V efforts will build upon the preliminary Market
Transformation (MT) evaluation plan reported in prior years. One of the MT evaluation results
will be to quantify the incremental energy savings potential due to market intervention

Energy Efficiency in California’s Public Power Sector — 2025 A-126
introduced by the City of Los Angeles and a plan to track market indicators to re-calibrate early
projections moving forward.
Retrospective (2015-2020) Impact Evaluation Scope results and reports were delivered by June
of 2021. With comprehensive concurrent (2020-2023) final results and report provided by Dec
of 2023.
LADWP will publish all past and future reports on the LADWP Website:
www.ladwp.com/reports
Major Differences or Diversions from CA POU TRM for Energy Savings
Sources of energy savings include custom engineering calculations using building simulation
modeling software such as EnergyPro and eQuest, Openstudio/Energyplus, and simple
engineering calculations in spreadsheet format. LADWP’s Custom Performance Program and
Commercial Lighting incentive Programs apply these methods, respectively. For direct install
and residential programs, deemed savings supported by a combination of the latest Technical
Reference Manual and utility workpapers are used. Examples of programs using this approach
include the Commercial Direct Install, Consumer Rebate Program, the Food Service Program,
Refrigerator Exchange, and Refrigerator Recycling Programs.
LADWP is currently transitioning towards leveraging the eTRM for its deemed savings
references. Moving forward, all new additions and updates will be referring to the eTRM as the
primary source.
For the current FY23-24 SB1037 portfolio submission, all gross savings claims are not EM&V
verified or Ex-Post adjusted. Future EM&V evaluation RFP/Contract is in procurement phase,
thus FY23-25 Ex-Post savings will need to be updated when EM&V contract and retrospectively
review the FY23-24 of the EE portfolio.

Energy Efficiency in California’s Public Power Sector — 2025 A-127
TABLE LADWP-1. Energy Efficiency Program Results by End Use
Summary by End Use
Resource Savings Summary
Cost Test Results
End Use
Gross Peak
Savings (kW)
Gross Annual
Energy Savings
(kWh)
Gross Lifecycle
Energy Savings
(kWh)
Net Peak
Savings (kW)
Net Annual
Energy Savings
(kWh)
Net Lifecycle
Energy Savings
(kWh)
Net Lifecycle GHG
Reductions (Tons)
Total Utility
Cost
PAC
TRC
Utility
($/kWh)
Appliance & Plug Loads
227
415,932
5,594,267
227
415,932
5,594,267
262
$643,305
0.78
0.26
0.162
Building Envelope
11,730
8,977,011
178,032,517
11,730
8,977,011
178,032,517
7,166
$12,463,007
2.37
2.37
0.115
Commercial Refrigeration
612
4,896,606
56,042,604
612
4,896,606
56,042,604
2,211
$4,744,130
0.74
0.58
0.115
Food Service
2
11,501
138,016
2
11,501
138,016
5
$21,291
0.50
0.33
0.208
HVAC - Cooling
4,447
9,468,481
98,099,012
4,447
9,468,481
98,099,012
3,836
$35,434,945
0.25
0.16
0.517
HVAC - Heat Pump
153
279,493
585,439
153
279,493
585,439
26
$752,960
0.11
0.11
1.517
Lighting - Indoor
7,836
51,039,741
608,320,057
7,836
51,039,741
608,320,057
21,557
$51,296,511
0.82
0.78
0.114
Lighting - Outdoor
738
9,289,093
111,279,450
738
9,289,093
111,279,450
5,775
$7,566,952
0.67
0.45
0.092
Miscellaneous
0
0
0
0
0
0
0
$3,484,441
0.000
Service & Domestic Hot Water
22
121,295
1,857,925
22
121,295
1,857,925
60
$1,008,055
0.13
0.13
0.812
Water Pumping / Irrigation
2,186
13,817,019
202,026,805
2,186
13,817,019
202,026,805
6,712
$1,332,130
10.80
10.80
0.010
Whole Building
307
1,690,714
16,907,136
307
1,690,714
16,907,136
678
$1,906,593
0.65
0.71
0.145
Energy Efficiency
28,261
100,006,886
1,278,883,227
28,261
100,006,886
1,278,883,227
48,288
$120,654,321
0.88
0.71
0.132
HVAC - Heat Pump
-1,120
5,688,562
92,609,607
-1,120
5,688,562
92,609,607
23,300
($16,242,938)
0.13
0.16
-0.282
Service & Domestic Hot Water
-4
70,462
704,618
-4
70,462
704,618
178
$28,396
0.21
0.21
0.052
Electrification
-1,124
5,759,024
93,314,225
-1,124
5,759,024
93,314,225
23,479
($16,214,542)
0.13
0.16
-0.279
Appliance & Plug Loads
4
7,398
103,572
4
7,398
103,572
5
$207,427
0.05
0.05
2.846
Building Envelope
9
6,650
181,028
9
6,650
181,028
7
$41,295
0.59
0.59
0.446
HVAC - Cooling
1
736
11,040
1
736
11,040
0
$1,780
1.07
1.07
0.235
HVAC - Heat Pump
-1
3,036
45,540
-1
3,036
45,540
10
$123
-1.26
-1.26
0.004
Lighting - Indoor
1
5,516
88,256
1
5,516
88,256
4
$15,165
0.33
0.33
0.257
Miscellaneous
0
0
0
0
0
0
0
$168,523
0.000
Water Pumping / Irrigation
0
1,686
16,860
0
1,686
16,860
1
$1,640
0.79
0.79
0.125
Low-Income
14
25,022
446,296
14
25,022
446,296
27
$435,954
0.10
0.10
1.577
EE, Low Income and Electrification
27,151
105,790,932
1,372,643,747
27,151
105,790,932
1,372,643,747
71,794
$104,875,733
0.99
0.76
0.108
Any
1,724
1,319,760
16,914,182
1,724
1,319,760
16,914,182
702
$8,842
339.54
339.54
0.001
Appliance & Plug Loads
12,724
30,180,534
452,708,006
12,724
30,180,534
452,708,006
19,041
$109,319
339.54
339.54
0.000
Building Envelope
3,130
6,601,205
99,018,080
3,130
6,601,205
99,018,080
3,165
$32,847
339.54
339.54
0.000
Commercial Refrigeration
569
4,914,202
73,713,028
569
4,914,202
73,713,028
2,721
$12,856
339.54
339.54
0.000
Food Service
2
13,585
203,779
2
13,585
203,779
7
$37
339.54
339.54
0.000
HVAC - Cooling
7,321
27,254,828
408,822,425
7,321
27,254,828
408,822,425
14,004
$98,325
339.54
339.54
0.000
Lighting - Indoor
9,259
61,692,073
925,381,101
9,259
61,692,073
925,381,101
32,076
$182,632
339.54
339.54
0.000
Miscellaneous
142
1,077,133
16,156,993
142
1,077,133
16,156,993
555
$19,666,677
0.05
0.05
1.774

Energy Efficiency in California’s Public Power Sector — 2025 A-128
Process
6
42,027
630,404
6
42,027
630,404
22
$116
339.54
339.54
0.000
Service & Domestic Hot Water
444
3,855,580
57,833,703
444
3,855,580
57,833,703
2,141
$10,048
339.54
339.54
0.000
Whole Building
9,732
52,959,372
794,390,578
9,732
52,959,372
794,390,578
28,770
$165,515
339.54
339.54
0.000
Codes & Standards
45,053
189,910,300
2,845,772,279
45,053
189,910,300
2,845,772,279
103,203
$20,287,215
10.44
10.44
0.010
C&S and T&D
45,053
189,910,300
2,845,772,279
45,053
189,910,300
2,845,772,279
103,203
$20,287,215
10.44
10.44
0.010
Utility Total
72,204
295,701,232
4,218,416,026
72,204
295,701,232
4,218,416,026
174,997
$125,162,948
2.52
2.02
0.043

Energy Efficiency in California’s Public Power Sector — 2025 A-129
TABLE LADWP-2. Energy Efficiency Program Results by Sector
Summary by Sector
Resource Savings Summary
Cost Test Results
Sector
Gross Peak
Savings (kW)
Gross Annual
Energy Savings
(kWh)
Gross Lifecycle
Energy Savings
(kWh)
Net Peak
Savings (kW)
Net Annual
Energy Savings
(kWh)
Net Lifecycle
Energy Savings
(kWh)
Net Lifecycle GHG
Reductions (Tons)
Total Utility
Cost
PAC
TRC
Utility
($/kWh)
Any
1,915
12,771,323
191,569,845
1,915
12,771,323
191,569,845
6,259
$5,543
2,451.11
2,451.11
0.000
Commercial
10,454
73,033,364
865,774,756
10,454
73,033,364
865,774,756
32,882
$72,564,436
0.79
0.58
0.114
Residential
15,892
14,202,199
221,538,626
15,892
14,202,199
221,538,626
9,147
$48,084,342
0.72
0.68
0.338
Energy Efficiency
28,261
100,006,886
1,278,883,227
28,261
100,006,886
1,278,883,227
48,288
$120,654,321
0.88
0.71
0.132
Commercial
31
120,481
887,420
31
120,481
887,420
102
$1,087,714
0.08
0.08
1.666
Residential
-1,155
5,638,542
92,426,805
-1,155
5,638,542
92,426,805
23,377
($17,302,255)
0.13
0.15
-0.301
Electrification
-1,124
5,759,024
93,314,225
-1,124
5,759,024
93,314,225
23,479
($16,214,542)
0.13
0.16
-0.279
Residential
14
25,022
446,296
14
25,022
446,296
27
$435,954
0.10
0.10
1.577
Low-Income
14
25,022
446,296
14
25,022
446,296
27
$435,954
0.10
0.10
1.577
EE, Low Income and Electrification
27,151
105,790,932
1,372,643,747
27,151
105,790,932
1,372,643,747
71,794
$104,875,733
0.99
0.76
0.108
Any
1,724
1,319,760
16,914,182
1,724
1,319,760
16,914,182
702
$8,842
339.54
339.54
0.001
Commercial
21,754
137,798,899
2,066,983,487
21,754
137,798,899
2,066,983,487
70,328
$8,248,380
17.53
17.53
0.006
Industrial
135
989,995
14,849,922
135
989,995
14,849,922
507
$2,791
339.54
339.54
0.000
Residential
21,440
49,801,646
747,024,688
21,440
49,801,646
747,024,688
31,666
$12,027,202
5.25
5.25
0.023
Codes & Standards
45,053
189,910,300
2,845,772,279
45,053
189,910,300
2,845,772,279
103,203
$20,287,215
10.44
10.44
0.010
C&S and T&D
45,053
189,910,300
2,845,772,279
45,053
189,910,300
2,845,772,279
103,203
$20,287,215
10.44
10.44
0.010
Utility Total
72,204
295,701,232
4,218,416,026
72,204
295,701,232
4,218,416,026
174,997
$125,162,948
2.52
2.02
0.043

Energy Efficiency in California’s Public Power Sector — 2025 A-130
TABLE LADWP-3. Energy Efficiency Program Results by Building Type
Summary by Building Type
Resource Savings Summary
Cost Test Results
Building Type
Gross Peak
Savings (kW)
Gross Annual
Energy Savings
(kWh)
Gross Lifecycle
Energy Savings
(kWh)
Net Peak
Savings (kW)
Net Annual
Energy Savings
(kWh)
Net Lifecycle
Energy Savings
(kWh)
Net Lifecycle GHG
Reductions (Tons)
Total Utility
Cost
PAC
TRC
Utility
($/kWh)
Any
11,970
20,466,417
345,471,725
11,970
20,466,417
345,471,725
12,461
$3,742,473
10.45
10.45
0.017
Assembly
103
1,276,028
15,641,725
103
1,276,028
15,641,725
746
$564,472
1.43
0.23
0.049
Education - Community College
52
308,842
3,706,106
52
308,842
3,706,106
150
$447,044
0.55
0.55
0.163
Education - Primary School
1,050
6,158,574
71,242,039
1,050
6,158,574
71,242,039
2,321
$15,271,297
0.34
0.34
0.287
Education - Secondary School
296
1,692,872
19,066,554
296
1,692,872
19,066,554
633
$3,794,315
0.37
0.37
0.265
Education - University
695
3,978,647
48,079,605
695
3,978,647
48,079,605
1,905
$1,720,832
1.90
1.22
0.049
Grocery
46
347,072
4,164,869
46
347,072
4,164,869
158
$229,520
1.18
0.46
0.074
Health/Medical - Hospital
449
3,683,672
47,960,729
449
3,683,672
47,960,729
1,839
$3,044,186
0.96
0.56
0.089
Health/Medical - Nursing Home
395
3,244,870
34,486,362
395
3,244,870
34,486,362
1,334
$1,501,821
1.41
0.53
0.060
Lodging - Hotel
137
883,600
9,692,214
137
883,600
9,692,214
381
$593,656
1.16
1.16
0.081
Lodging - Motel
575
3,679,025
44,110,952
575
3,679,025
44,110,952
1,728
$3,843,238
0.77
0.76
0.118
Manufacturing Light Industrial
47
377,308
4,527,698
47
377,308
4,527,698
174
$150,382
1.88
1.66
0.045
Office - Large
3,183
21,457,166
259,133,118
3,183
21,457,166
259,133,118
9,349
$11,181,746
1.62
0.95
0.059
Office - Small
344
2,537,230
30,802,094
344
2,537,230
30,802,094
1,193
$3,570,357
0.56
0.55
0.157
Other Commercial
1,143
8,253,939
95,436,837
1,143
8,253,939
95,436,837
3,610
$12,210,345
0.52
0.32
0.173
Other Industrial
329
3,534,170
41,959,057
329
3,534,170
41,959,057
2,179
$1,665,620
1.15
0.87
0.054
Residential - Mobile Home
5
4,121
22,573
5
4,121
22,573
1
$52,026
0.08
0.08
2.749
Residential - Multi-Family
1,995
2,637,701
20,967,752
1,995
2,637,701
20,967,752
868
$17,542,522
0.13
0.13
1.087
Residential - Single-Family
3,994
4,873,534
58,374,258
3,994
4,873,534
58,374,258
2,494
$27,276,784
0.28
0.26
0.661
Restaurant - Fast-Food
11
72,485
895,298
11
72,485
895,298
33
$88,272
0.72
0.72
0.135
Restaurant - Sit-Down
279
1,924,420
21,177,520
279
1,924,420
21,177,520
831
$2,032,025
0.72
0.72
0.128
Retail - Large
26
211,361
2,212,062
26
211,361
2,212,062
85
$103,540
1.32
0.50
0.065
Retail - Small
1,102
8,092,704
96,011,393
1,102
8,092,704
96,011,393
3,681
$9,832,621
0.64
0.64
0.139
Storage - Conditioned
2
13,478
168,870
2
13,478
168,870
6
$8,780
1.14
0.16
0.074
Storage - Unconditioned
34
297,651
3,571,816
34
297,651
3,571,816
128
$186,447
1.20
1.03
0.070
Energy Efficiency
28,261
100,006,886
1,278,883,227
28,261
100,006,886
1,278,883,227
48,288
$120,654,321
0.88
0.71
0.132
Assembly
1
29,186
437,786
1
29,186
437,786
78
$223,845
0.08
0.07
0.745
Other Commercial
30
91,296
449,633
30
91,296
449,633
24
$863,869
0.08
0.08
2.450
Residential - Mobile Home
0
401
1,202
0
401
1,202
0
$2,717
0.08
0.08
2.393
Residential - Multi-Family
756
1,769,953
15,752,669
756
1,769,953
15,752,669
2,336
$10,980,153
0.07
0.07
0.960
Residential - Single-Family
-1,912
3,868,189
76,672,933
-1,912
3,868,189
76,672,933
21,040
($28,285,125)
0.10
0.11
-0.613
Electrification
-1,124
5,759,024
93,314,225
-1,124
5,759,024
93,314,225
23,479
($16,214,542)
0.13
0.16
-0.279
Any
1
5,516
88,256
1
5,516
88,256
4
$15,165
0.33
0.33
0.257
Residential
0
0
0
0
0
0
0
$168,523
0.000

Energy Efficiency in California’s Public Power Sector — 2025 A-131
Residential - Multi-Family
2
1,929
44,732
2
1,929
44,732
2
$31,189
0.17
0.17
1.286
Residential - Single-Family
12
17,577
313,308
12
17,577
313,308
21
$221,077
0.14
0.14
1.145
Low-Income
14
25,022
446,296
14
25,022
446,296
27
$435,954
0.10
0.10
1.577
EE, Low Income and Electrification
27,151
105,790,932
1,372,643,747
27,151
105,790,932
1,372,643,747
71,794
$104,875,733
0.99
0.76
0.108
Any
45,053
189,910,300
2,845,772,279
45,053
189,910,300
2,845,772,279
103,203
$623,517
339.54
339.54
0.000
Other Commercial
0
0
0
0
0
0
0
$7,822,514
0.000
Residential
0
0
0
0
0
0
0
$11,841,183
0.000
Codes & Standards
45,053
189,910,300
2,845,772,279
45,053
189,910,300
2,845,772,279
103,203
$20,287,215
10.44
10.44
0.010
C&S and T&D
45,053
189,910,300
2,845,772,279
45,053
189,910,300
2,845,772,279
103,203
$20,287,215
10.44
10.44
0.010
Utility Total
72,204
295,701,232
4,218,416,026
72,204
295,701,232
4,218,416,026
174,997
$125,162,948
2.52
2.02
0.043

Energy Efficiency in California’s Public Power Sector — 2025 A-132
MERCED IRRIGATION DISTRICT
Merced Irrigation District at a Glance
• Climate Zone: 13
• Customers: 13,329
• Total annual retail sales: 517,304 MWh
• Annual Retail Revenue: $101,487,219
• Annual energy efficiency expenditures for reporting year: $345,813
• Gross annual savings from reporting year portfolio: 784 MWh
Merced Overview
For more than 75 years, the Merced Irrigation District (MeID) has been in the business of
generating wholesale electrical power. The District provides electric services to thousands of
customers in Eastern Merced County including the cities of Livingston, Winton, Atwater and
Merced.
A large percentage of MeID’s energy efficiency savings have traditionally come from large
industrial customers. Those customers only make up approximately 15% of the customer base.
MeID differs from other utilities in that almost all of the residential customer base is made up
of relatively new construction.
Residential, 18 Commercial, 11
Industrial, 75
Other, 679
Gross Energy Savings (MWh)
Residential Commercial Industrial Agricultural Other Low Income T&D Electrification

Energy Efficiency in California’s Public Power Sector — 2025 A-133
Major Program and Portfolio Changes
Over the preceding year, our team has made considerable advancements in the augmentation
of both residential and custom rebates. In the area of residential rebates, we have identified
and implemented a variety of measures, ensuring an alignment of incentives with the energy
savings potential inherent in appliances and equipment. This effort involved an adjustment of
incentive values to reflect the impact of energy-efficient choices more accurately. A residential
shade tree program was introduced to our customers in 2024.
Transitioning to custom commercial and industrial rebates, MeID initially instituted a rate of
$0.07 per kWh reduced in 2022, devoid of any incentives for demand reduction. Subsequently,
in 2023, we underwent a substantial transformation in the methodology for calculating
incentives related to energy and demand reduction. The incentives now exhibit a range from
$0.10 per kWh to $500 per KW, contingent upon the end-use framework.
In the current year, we introduced rebates tailored specifically for our commercial and
industrial clienteles. Recognizing that the modification of these programs is merely one facet of
the overall strategy, we are actively engaged in communicating these initiatives to our
customers. Our emphasis extends beyond mere awareness; we are committed to fostering
active participation in our energy savings programs.
Program and Portfolio Highlights
Turning our attention to the highlights of our programs and portfolio, after an extended period
without new additions, MeID has more than doubled the number of residential rebates,
expanding from six to an impressive total of fourteen energy efficiency rebates in 2024. This
year, we built upon those additions by incorporating specific reporting categories to align with
the eTRM.
Concurrently, we have undertaken a comprehensive overhaul of the program's visual identity,
introducing a fresh and user-friendly application format for the first time in over a decade.
These changes emphasize our dedication not only to staying abreast of industry standards but
also to ensuring a more robust and accessible energy efficiency experience for our valued
customers.
Commercial, Industrial & Agricultural Programs
In the domain of commercial, industrial, and agricultural programs, the Customized/Industrial
Retrofit Program allows qualifying customers to seek financial incentives for more specialized
and comprehensive energy-saving measures that fall outside the scope of the Commercial
Lighting Program. Each application for this program is evaluated and approved on an individual
basis. Financial incentives for qualifying customer projects are disbursed based on annual
kilowatt-hour savings within a one-year period or demand savings on completed and approved

Energy Efficiency in California’s Public Power Sector — 2025 A-134
projects—whichever is greater, be it kWh reduced, or kW reduced if a demand component
applies.
Residential Programs
Within the residential programs, in addition to the substantial increase in the number of
rebates, we have offered various measures aligned with the eTRM for our residential
customers. Furthermore, we are planning the inclusion of additional incentives specifically
tailored for our low-income customers and tailoring specific rebates for electrification.
Complementary Programs
Complementing these initiatives, Merced Irrigation District's Residential Energy Assistance
Program (CARE) has been providing discounts on energy bills for income-qualifying low-income
families since the year 2000. The Medical Baseline Program, an integral part of this assistance
framework, offers additional 500 kilowatt-hours to a customer's base energy quantity on their
monthly bill, if they have a qualifying medical condition. These programs stand as pillars of our
commitment to the well-being and energy affordability of our diverse customer base.
To improve accessibility, we have redesigned program materials, expanded language options,
and partnered with community-based organizations to bring applications directly to places like
local doctor’s offices. These efforts have played a significant role in increasing participation,
helping more eligible customers connect with available assistance and reinforcing our
commitment to energy affordability.
Evaluation, Measurement & Verification Studies
Merced Irrigation District partnered with Modesto and Turlock into one evaluation effort for
EM&V that was conducted by Anchor Blue. The three Irrigation Districts of Modesto, Turlock,
and Merced (MTM) are all located in California’s Central Valley near one another.
Energy Efficiency in California’s Public Power Sector — 2025 A-135
TABLE MeID-1. Energy Efficiency Program Results by End Use
Summary by End Use
Resource Savings Summary
Cost Test Results
End Use
Gross Peak
Savings (kW)
Gross Annual
Energy Savings
(kWh)
Gross Lifecycle
Energy Savings
(kWh)
Net Peak
Savings (kW)
Net Annual
Energy Savings
(kWh)
Net Lifecycle
Energy Savings
(kWh)
Net Lifecycle GHG
Reductions (Tons)
Total Utility
Cost
PAC
TRC
Utility
($/kWh)
Any
61
754,399
11,316,438
37
421,874
6,328,113
2,277
$323,740
2.28
2.82
0.068
Appliance & Plug Loads
2
15,912
181,171
1
8,435
92,254
34
$13,701
0.82
1.34
0.184
HVAC - Cooling
1
1,909
45,824
0
1,312
34,558
13
$3,418
2.20
2.67
0.169
HVAC - Heat Pump
0
76
1,137
0
47
705
0
$353
0.49
1.02
0.670
Lighting - Outdoor
0
11,398
170,970
0
6,269
94,034
43
$4,600
2.41
2.79
0.065
Energy Efficiency
63
783,693
11,715,540
39
437,937
6,549,664
2,367
$345,813
2.22
2.77
0.071
EE, Low Income and Electrification
63
783,693
11,715,540
39
437,937
6,549,664
2,367
$345,813
2.22
2.77
0.071
C&S and T&D
$0
Utility Total
63
783,693
11,715,540
39
437,937
6,549,664
2,367
$345,813
2.22
2.77
0.071
Energy Efficiency in California’s Public Power Sector — 2025 A-136
TABLE MeID-2. Energy Efficiency Program Results by Sector
Summary by Sector
Resource Savings Summary
Cost Test Results
Sector
Gross Peak
Savings (kW)
Gross Annual
Energy Savings
(kWh)
Gross Lifecycle
Energy Savings
(kWh)
Net Peak
Savings (kW)
Net Annual
Energy Savings
(kWh)
Net Lifecycle
Energy Savings
(kWh)
Net Lifecycle GHG
Reductions (Tons)
Total Utility
Cost
PAC
TRC
Utility
($/kWh)
Any
57
678,857
10,182,831
35
380,374
5,705,594
2,065
$296,489
2.26
2.82
0.069
Commercial
0
11,398
170,970
0
6,269
94,034
43
$4,600
2.41
2.79
0.065
Industrial
4
75,473
1,132,095
2
41,510
622,652
212
$26,961
2.49
2.84
0.058
Residential
2
17,965
229,644
1
9,785
127,384
47
$17,763
1.07
1.67
0.187
Energy Efficiency
63
783,693
11,715,540
39
437,937
6,549,664
2,367
$345,813
2.22
2.77
0.071
EE, Low Income and Electrification
63
783,693
11,715,540
39
437,937
6,549,664
2,367
$345,813
2.22
2.77
0.071
C&S and T&D
$0
Utility Total
63
783,693
11,715,540
39
437,937
6,549,664
2,367
$345,813
2.22
2.77
0.071
Energy Efficiency in California’s Public Power Sector — 2025 A-137
TABLE MeID-3. Energy Efficiency Program Results by Building Type
Summary by Building Type
Resource Savings Summary
Cost Test Results
Building Type
Gross Peak
Savings (kW)
Gross Annual
Energy Savings
(kWh)
Gross Lifecycle
Energy Savings
(kWh)
Net Peak
Savings (kW)
Net Annual
Energy Savings
(kWh)
Net Lifecycle
Energy Savings
(kWh)
Net Lifecycle GHG
Reductions (Tons)
Total Utility
Cost
PAC
TRC
Utility
($/kWh)
Any
59
751,919
11,278,179
37
422,458
6,332,287
2,296
$324,604
2.26
2.82
0.069
Multiple
0
2,798
38,279
0
1,195
16,401
10
$2,860
1.41
1.87
0.228
Residential - Single-Family
2
10,260
118,341
1
3,990
46,569
14
$9,580
0.46
0.78
0.259
Retail - Large
2
18,716
280,740
1
10,294
154,407
48
$8,768
2.66
2.93
0.076
Energy Efficiency
63
783,693
11,715,540
39
437,937
6,549,664
2,367
$345,813
2.22
2.77
0.071
EE, Low Income and Electrification
63
783,693
11,715,540
39
437,937
6,549,664
2,367
$345,813
2.22
2.77
0.071
C&S and T&D
$0
Utility Total
63
783,693
11,715,540
39
437,937
6,549,664
2,367
$345,813
2.22
2.77
0.071

Energy Efficiency in California’s Public Power Sector — 2025 A-138
MODESTO IRRIGATION DISTRICT
Modesto Irrigation District at a Glance
• Climate Zone: 12
• Customers: 133,517
• Total annual retail sales: 2,669,292 MWh
• Annual Retail Revenue: $464,879,622
• Annual energy efficiency expenditures for reporting year: $1,428,309
• Gross annual savings from reporting year portfolio: 3,183 MWh
Modesto Irrigation District Overview
The Modesto Irrigation District (MID) was formed in 1887 to provide irrigation water within a
service area of over 100,000 acres. MID began providing electric service in 1923 within an
original service area of 160 square miles, which was expanded by 7.5 square miles in 2001.
Since 1996, MID has also provided non-exclusive electric service in an adjacent 400 square mile
area. In 1994, MID began providing treated domestic water to the City of Modesto on a
wholesale basis.
MID’s 2024 annual retail electric sales by customer class are: 37.6% residential, 26.7%
commercial, 30.3% industrial, 4.4% agricultural and pumping, 0.4% other. Load growth in 2024
was 2.7% (based on Total System Input GWH).
Residential, 440
Commercial, 2,038
Industrial, 614
Low Income, 90
Gross Energy Savings (MWh)
Residential Commercial Industrial Agricultural Other Low Income T&D Electrification

Energy Efficiency in California’s Public Power Sector — 2025 A-139
MID has robust energy efficiency program offerings, but savings can fluctuate year to year
independent of changes to the programs or to the economic outlook. A key contributor is multi-
year construction cycles for energy efficiency projects of large industrial customers. Typically,
when lower energy savings are reported in the current year, we anticipate a surge in the
following year as projects complete.
Major Program and Portfolio Changes
MID did not have any changes for 2024.
Program and Portfolio Highlights
MID continued to promote low to moderate income energy efficiency programs by providing
staff presentations on energy efficiency to non-profit agencies and low-income advocacy
groups in our area in 2024. Social media promotions have improved customer awareness of
MID programs.
Commercial, Industrial & Agricultural Programs
Programs offered are Business, Business Custom and Business New Construction. See MID
website (www.mid.org) for program details.
Residential Programs
MID offers a variety of residential rebates. See MID website (www.mid.org) for program details.
Complementary Programs
• Energy Audits – MID energy specialists provide free virtual and on-site energy audits
that include usage analysis, identification, and recommendation of energy conservation
measures to reduce load and improve energy efficiency.
• CARES Program – Income qualifying households will receive a 60 percent reduction on
their fixed monthly charge and a 23.1 percent discount on the first 850 kilowatt-hours
each billing cycle. The MID CARES discount is also applicable to group residences where
low-income persons are accommodated without a rental charge by a non-profit agency.
• Medical Life Support Rate – Customers who need electricity for life-sustaining devices or
who have a condition that requires special heating or air conditioning may qualify for 50
percent off the first 500 kilowatt-hours used during each residential billing cycle.
• Weatherization – Our Weatherization program provides energy efficient measures to
income qualified households to help reduce their energy consumption. Energy savings
from the weatherization program are included in the results for the SB1037 report.
However, MID continues to facilitate new partnerships with other organizations and
agencies to increase its outreach and provide additional weatherization services to low-
income customers.

Energy Efficiency in California’s Public Power Sector — 2025 A-140
• Good Neighbor Program – Each month, many MID customers seek emergency
assistance to help pay their electric bills. With MID's Good Neighbor Program, customers
can donate money to a designated fund for MID customers that seek assistance. MID
works with the Salvation Army to ensure that 100% of the donations go only to those
MID customers who are experiencing hardships.
Evaluation, Measurement & Verification Studies
MID continued its ongoing efforts to obtain independent, third-party review of its EE programs,
which is employed as part of the review and approval process for selected projects as well as
after the fact for the overall portfolio.
Anchor Blue Consulting conducted M&V on the 2023 EE portfolio. Review of the 2024 portfolio
will be done in 2025.
MID’s 2024 budget for EM&V work was $65,845 and completed studies can be found at:
https://www.cmua.org/emv-reports.

Energy Efficiency in California’s Public Power Sector — 2025 A-141
TABLE MID-1. Energy Efficiency Program Results by End Use
Summary by End Use
Resource Savings Summary
Cost Test Results
End Use
Gross Peak
Savings (kW)
Gross Annual
Energy Savings
(kWh)
Gross Lifecycle
Energy Savings
(kWh)
Net Peak
Savings (kW)
Net Annual
Energy Savings
(kWh)
Net Lifecycle
Energy Savings
(kWh)
Net Lifecycle GHG
Reductions (Tons)
Total Utility
Cost
PAC
TRC
Utility
($/kWh)
Any
70
352,212
5,281,754
35
176,106
2,640,877
890
$129,455
3.01
1.30
0.066
Appliance & Plug Loads
1
87,868
884,313
1
54,198
546,874
163
$35,816
1.82
0.95
0.080
Building Envelope
61
47,774
851,701
37
27,014
487,353
221
$65,066
2.56
0.92
0.195
Commercial Refrigeration
116
221,711
1,550,711
58
110,856
775,356
280
$90,676
1.48
0.96
0.135
HVAC - Cooling
60
305,682
3,864,892
36
175,395
2,247,775
907
$193,204
2.09
1.31
0.112
HVAC - Heat Pump
5
10,925
163,534
3
5,462
81,767
29
$4,895
2.93
1.99
0.080
Lighting - Indoor
122
1,850,269
27,746,083
67
1,017,648
15,260,346
5,132
$641,206
3.19
1.73
0.057
Lighting - Outdoor
4
212,059
3,179,763
2
116,632
1,748,870
622
$73,107
3.17
1.61
0.056
Service & Domestic Hot Water
1
4,665
46,652
1
4,665
46,652
16
$3,096
2.13
1.40
0.081
Energy Efficiency
440
3,093,165
43,569,402
240
1,687,977
23,835,868
8,260
$1,236,520
2.80
1.48
0.069
Appliance & Plug Loads
2
18,240
273,365
2
18,240
273,365
96
$56,362
0.71
0.76
0.277
Building Envelope
4
3,054
29,901
4
3,054
29,901
14
$27,246
0.35
0.66
1.110
HVAC - Cooling
2
13,292
67,395
2
13,292
67,395
33
$23,090
0.64
0.63
0.383
Lighting - Indoor
5
52,119
820,471
5
52,119
820,471
301
$76,632
1.66
1.67
0.128
Miscellaneous
0
585
3,928
0
585
3,928
1
$6,671
0.07
0.04
2.013
Service & Domestic Hot Water
1
2,770
27,679
1
2,770
27,679
10
$1,787
2.26
2.16
0.079
Low-Income
14
90,061
1,222,739
14
90,061
1,222,739
456
$191,789
1.02
1.08
0.210
EE, Low Income and Electrification
454
3,183,226
44,792,141
253
1,778,038
25,058,607
8,716
$1,428,309
2.56
1.45
0.076
C&S and T&D
$0
Utility Total
454
3,183,226
44,792,141
253
1,778,038
25,058,607
8,716
$1,428,309
2.56
1.45
0.076

Energy Efficiency in California’s Public Power Sector — 2025 A-142
TABLE MID-2. Energy Efficiency Program Results by Sector
Summary by Sector
Resource Savings Summary
Cost Test Results
Sector
Gross Peak
Savings (kW)
Gross Annual
Energy Savings
(kWh)
Gross Lifecycle
Energy Savings
(kWh)
Net Peak
Savings (kW)
Net Annual
Energy Savings
(kWh)
Net Lifecycle
Energy Savings
(kWh)
Net Lifecycle GHG
Reductions (Tons)
Total Utility
Cost
PAC
TRC
Utility
($/kWh)
Commercial
163
2,038,378
30,545,092
86
1,102,676
16,524,509
5,564
$709,293
3.15
1.55
0.058
Industrial
155
614,304
7,437,290
79
326,782
4,012,974
1,395
$230,739
2.53
1.76
0.075
Residential
123
440,482
5,587,020
75
258,520
3,298,385
1,301
$296,487
2.17
1.14
0.118
Energy Efficiency
440
3,093,165
43,569,402
240
1,687,977
23,835,868
8,260
$1,236,520
2.80
1.48
0.069
Residential
14
90,061
1,222,739
14
90,061
1,222,739
456
$191,789
1.02
1.08
0.210
Low-Income
14
90,061
1,222,739
14
90,061
1,222,739
456
$191,789
1.02
1.08
0.210
EE, Low Income and Electrification
454
3,183,226
44,792,141
253
1,778,038
25,058,607
8,716
$1,428,309
2.56
1.45
0.076
C&S and T&D
$0
Utility Total
454
3,183,226
44,792,141
253
1,778,038
25,058,607
8,716
$1,428,309
2.56
1.45
0.076

Energy Efficiency in California’s Public Power Sector — 2025 A-143
TABLE MID-3. Energy Efficiency Program Results by Building Type
Summary by Building Type
Resource Savings Summary
Cost Test Results
Building Type
Gross Peak
Savings (kW)
Gross Annual
Energy Savings
(kWh)
Gross Lifecycle
Energy Savings
(kWh)
Net Peak
Savings (kW)
Net Annual
Energy Savings
(kWh)
Net Lifecycle
Energy Savings
(kWh)
Net Lifecycle GHG
Reductions (Tons)
Total Utility
Cost
PAC
TRC
Utility
($/kWh)
Any
242
2,289,545
32,537,094
127
1,247,889
17,814,839
6,041
$805,683
3.00
1.64
0.060
Manufacturing Light Industrial
70
352,212
5,281,754
35
176,106
2,640,877
890
$129,455
3.01
1.30
0.066
Multiple
5
127,347
1,222,379
3
67,166
642,955
151
$23,227
1.73
1.39
0.044
Residential
61
189,721
2,811,583
37
115,997
1,712,249
798
$180,736
2.14
1.23
0.142
Residential - Mobile Home
0
251
5,001
0
251
5,001
2
$511
2.89
4.13
0.151
Residential - Multi-Family
0
134
4,027
0
134
4,027
1
$415
2.50
0.46
0.184
Residential - Single-Family
61
133,954
1,707,563
37
80,434
1,015,920
378
$96,494
2.35
1.02
0.126
Energy Efficiency
440
3,093,165
43,569,402
240
1,687,977
23,835,868
8,260
$1,236,520
2.80
1.48
0.069
Multiple
0
105
1,052
0
105
1,052
0
$423
0.31
0.41
0.505
Residential
13
86,618
1,190,698
13
86,618
1,190,698
444
$188,941
1.01
1.07
0.213
Residential - Mobile Home
0
7
149
0
7
149
0
$223
0.19
0.90
2.208
Residential - Multi-Family
0
1,230
12,291
0
1,230
12,291
4
$782
2.29
2.20
0.078
Residential - Single-Family
0
2,100
18,549
0
2,100
18,549
7
$1,420
1.85
1.88
0.092
Low-Income
14
90,061
1,222,739
14
90,061
1,222,739
456
$191,789
1.02
1.08
0.210
EE, Low Income and Electrification
454
3,183,226
44,792,141
253
1,778,038
25,058,607
8,716
$1,428,309
2.56
1.45
0.076
C&S and T&D
$0
Utility Total
454
3,183,226
44,792,141
253
1,778,038
25,058,607
8,716
$1,428,309
2.56
1.45
0.076

Energy Efficiency in California’s Public Power Sector — 2025 A-144
MORENO VALLEY UTILITY
Moreno Valley Utility at a Glance
• Climate Zone: 10
• Customers: 8,943
• Total annual retail sales: 225,498 MWh
• Annual Retail Revenue: $68,709,106
• Annual energy efficiency expenditures for reporting year: $841,735
• Gross annual savings from reporting year portfolio: 463 MWh
Moreno Valley Utility Overview
Moreno Valley Utility (MVU), municipally owned, was founded in 2001 and has been providing
services to customers since 2004. MVU has experienced notable load growth, reaching a peak
of just over 225,000 MWs. MVU saw a decline in EE projects during the pandemic years from its
largest customers, but is now showing a promising increase. Our energy savings goals are
primarily driven by the energy audit and direct install programs from our residential customers,
which have enabled us to pursue energy efficiency measures across our service territory.
Residential, 206
Other, 256
Gross Energy Savings (MWh)
Residential Commercial Industrial Agricultural Other Low Income T&D Electrification

Energy Efficiency in California’s Public Power Sector — 2025 A-145
Major Program and Portfolio Changes
MVU has increased its EE programs annual funding and overall customer participation for the
residential energy audits and direct install program to ensure that all statutory requirements
are met. The whole house fan and the smart programmable thermostat has increased
participation greatly.
Program and Portfolio Highlights
MVU's residential direct installation program has demonstrated to be successful in achieving
our energy savings goals during this review period. With increased funding, we have expanded
our offerings of energy-efficient items. There has been a lot interest in lighting retrofits and
solar projects from our commercial customers.
Commercial, Industrial & Agricultural Programs
• Lighting Retrofits – rebates are available to commercial customers for LED lighting
retrofits, other energy efficient lighting replacements, and for LED or photo-luminescent
exit signs.
• Commercial EE Program – this Direct Install program provides small to medium-sized
customers with an onsite energy audit and energy saving measures at no cost to the
customer.
• Commercial HVAC Retrofits – customers that install new high SEER HVAC units or
replace older inefficient units can participate in this rebate program. The installation of
new chillers that exceed Title 24 requirements or load-shifting Thermal Energy Storage
(TES) systems may also qualify for rebates.
• Motor Replacements – commercial customers that install premium efficiency motors
are eligible for rebates under this program. Motors covered under this program must be
new, three1phase induction motors (1hp to 200hp in size) and operate for at least 2,000
hours per year.
• New Construction and Major Tenant Renovation – this program offers incentives for
projects exceeding Title 24 by at least ten percent. Eligible customers are responsible for
providing documentation of energy savings using energy modeling software and all
calculations must be signed by a licensed mechanical engineer.
• Outreach Programs – the utility works closely with the City's Economic Development
department to provide the largest commercial customers with detailed energy usage
information to help efficiently manage their energy consumption and evaluate potential
EE projects.
Residential Programs
• Residential Energy Audit & Direct Install – this program targets very high energy use
customers and participants in our Low-Income Program. The program provides eligible
residential customers with a full in-home energy audit and specific recommendations

Energy Efficiency in California’s Public Power Sector — 2025 A-146
for their home plus a fixed set of EE upgrades, including the Nest thermostat, at no cost
to the customer.
• EnergyStar® Appliance Rebates – customers who purchase EnergyStar® Qualified
appliances can apply for a fixed rebate amount under this program.
• Weatherization – rebates are available for energy efficient windows, doors, attic
insulation, and high SEER AC and heat pumps.
• Building Electrification - MVU offers rebates for electric heat pump water heaters for
those customers who want to remove their natural gas appliances.
Complementary Programs
• Low-Income Programs: MVU’s Energy Bill Assistance Program provides income qualified
residents with a 23% or 35% discount on monthly energy charges; this year’s
expenditure was approximately $245K.
• Research Design & Development (RD&D): Small scale projects have been initiated by our
interns in hopes of promoting efficient renewable energy. The Solar Canopy Project
construction began in 2024 in the hopes of educating customers on the MVU's
renewable energy. This project includes a modified canopy that utilizes solar panels and
batteries to create and store energy from the sun, then power three daily loads found in
most households. Items, like fans, refrigerators, and lights.
• Electric Vehicles (EVs): MVU launched two new programs aimed at the encouragement
of adopting EVs and related infrastructure in the community. Both programs offer
rebates for commercial and residential participation. The residential EV program offers
a monthly bill credit. These incentives help reduce the upfront costs of purchasing and
installation, thus making it more accessible to adopt an eco-friendlier lifestyle.
• Energy Storage: MVU has seen a significant increase in battery storage devices with
residential solar installations. As the electric rate for new solar installation is on Time-
of-Use (TOU) rate, we expected that battery storage installation will increase.
Evaluation, Measurement & Verification Studies
Engineering analysis programs such as Department of Energy -2 (DOE-2) are the basis for
calculated energy savings and incentive calculations. MVU requires both pre-inspections and
post inspections for all projects that result in a commercial rebate of over $5,000.
Sources of Energy Savings -MVU relied primarily on the values from the POU TRM and eTRM,
but also used reported energy savings from trusted engineering contractors to calculate
program performance.
Commercial Codes & Standards – this reporting year MVU will not record its share of the energy
savings that are attributable to the State’s Building Codes and Appliance Standards (Title-24) to
the Energy Commission.
Energy Efficiency in California’s Public Power Sector — 2025 A-147
TABLE MVU-1. Energy Efficiency Program Results by End Use
Summary by End Use
Resource Savings Summary
Cost Test Results
End Use
Gross Peak
Savings (kW)
Gross Annual
Energy Savings
(kWh)
Gross Lifecycle
Energy Savings
(kWh)
Net Peak
Savings (kW)
Net Annual
Energy Savings
(kWh)
Net Lifecycle
Energy Savings
(kWh)
Net Lifecycle GHG
Reductions (Tons)
Total Utility
Cost
PAC
TRC
Utility
($/kWh)
Any
2
16,467
247,720
2
15,651
235,477
85
$30,609
0.86
0.86
0.174
Appliance & Plug Loads
1
3,614
44,238
0
2,084
26,161
9
$1,747
1.93
1.78
0.085
HVAC - Cooling
84
389,042
3,298,005
50
233,480
1,949,734
774
$795,381
0.59
0.59
0.483
Lighting - Indoor
7
53,750
762,500
7
53,750
762,500
278
$13,998
6.13
6.13
0.024
Energy Efficiency
94
462,872
4,352,463
60
304,966
2,973,872
1,146
$841,735
0.69
0.69
0.348
EE, Low Income and Electrification
94
462,872
4,352,463
60
304,966
2,973,872
1,146
$841,735
0.69
0.69
0.348
C&S and T&D
$0
Utility Total
94
462,872
4,352,463
60
304,966
2,973,872
1,146
$841,735
0.69
0.69
0.348
Energy Efficiency in California’s Public Power Sector — 2025 A-148
TABLE MVU-2. Energy Efficiency Program Results by Sector
Summary by Sector
Resource Savings Summary
Cost Test Results
Sector
Gross Peak
Savings (kW)
Gross Annual
Energy Savings
(kWh)
Gross Lifecycle
Energy Savings
(kWh)
Net Peak
Savings (kW)
Net Annual
Energy Savings
(kWh)
Net Lifecycle
Energy Savings
(kWh)
Net Lifecycle GHG
Reductions (Tons)
Total Utility
Cost
PAC
TRC
Utility
($/kWh)
Any
54
256,390
2,646,950
31
147,608
1,555,054
603
$669,365
0.49
0.49
0.528
Residential
40
206,482
1,705,513
30
157,357
1,418,819
543
$172,371
1.47
1.47
0.149
Energy Efficiency
94
462,872
4,352,463
60
304,966
2,973,872
1,146
$841,735
0.69
0.69
0.348
EE, Low Income and Electrification
94
462,872
4,352,463
60
304,966
2,973,872
1,146
$841,735
0.69
0.69
0.348
C&S and T&D
$0
Utility Total
94
462,872
4,352,463
60
304,966
2,973,872
1,146
$841,735
0.69
0.69
0.348
Energy Efficiency in California’s Public Power Sector — 2025 A-149
TABLE MVU-3. Energy Efficiency Program Results by Building Type
Summary by Building Type
Resource Savings Summary
Cost Test Results
Building Type
Gross Peak
Savings (kW)
Gross Annual
Energy Savings
(kWh)
Gross Lifecycle
Energy Savings
(kWh)
Net Peak
Savings (kW)
Net Annual
Energy Savings
(kWh)
Net Lifecycle
Energy Savings
(kWh)
Net Lifecycle GHG
Reductions (Tons)
Total Utility
Cost
PAC
TRC
Utility
($/kWh)
Any
0
232
2,320
0
139
1,392
1
$147
1.26
2.12
0.128
Residential
87
429,532
4,011,864
55
278,654
2,705,723
1,040
$807,075
0.63
0.63
0.367
Residential - Single-Family
7
33,108
338,279
5
26,172
266,757
106
$34,513
2.11
2.12
0.157
Energy Efficiency
94
462,872
4,352,463
60
304,966
2,973,872
1,146
$841,735
0.69
0.69
0.348
EE, Low Income and Electrification
94
462,872
4,352,463
60
304,966
2,973,872
1,146
$841,735
0.69
0.69
0.348
C&S and T&D
$0
Utility Total
94
462,872
4,352,463
60
304,966
2,973,872
1,146
$841,735
0.69
0.69
0.348

Energy Efficiency in California’s Public Power Sector — 2025 A-150
CITY OF PALO ALTO UTILITIES
City of Palo Alto Utilities at a Glance
• Climate Zone: 4
• Customers: 30,063
• Total annual retail sales: 865,782 MWh
• Annual Retail Revenue: $175,155,897
• Annual energy efficiency expenditures for reporting year: $1,559,361
• Gross annual savings from reporting year portfolio: 2,563 MWh
Palo Alto Overview
The City of Palo Alto Utilities (CPAU) has implemented a variety of EE programs since the 1970s.
In 1998, in response to California’s landmark energy legislation (AB 1890), CPAU established the
Electric Public Benefits (PB) Program and increased the Electric PB program budget to 2.85
percent of projected annual revenue to fund EE programs. CPAU’s electric efficiency program
budget can be supplemented with supply funds to meet state requirements that publicly
owned electric utilities, in procuring energy, first acquire all available EE and demand reduction
resources that are cost effective, reliable and feasible.
CPAU is committed to supporting environmental sustainability through promoting efficiency
programs, promoting distributed renewable generation, and influencing consumer demand
Residential, 45
Commercial, 846
Industrial, 568
Low Income, 48
Electrification,
1,055
Gross Energy Savings (MWh)
Residential Commercial Industrial Agricultural Other Low Income T&D Electrification

Energy Efficiency in California’s Public Power Sector — 2025 A-151
through incentives and education. In March 2013, Palo Alto City Council approved a Carbon
Neutral Electric Resource Plan, committing CPAU to a carbon-neutral electric portfolio
beginning in 2013. Since July 2017, CPAU has also maintained a carbon neutral natural gas
portfolio by purchasing carbon offsets; this serves as a bridge strategy to meeting the City’s
greenhouse gas reduction goal. Palo Alto is committed to reducing fossil fuel use and helping
residents and businesses pursue electrification opportunities in the building and transportation
sectors.
In May 2021, Palo Alto City Council approved a set of annual electric energy efficiency (EE) goals
for 2022-2031. The EE goal for FY 2024 is set at 0.55% of forecast electric load, increasing to
0.8% in FY 2031. The gradual ramp-up of these goals reflect staff’s anticipation that EE savings
levels will take time to recover following the economic downturn. These EE goals are based on
the results of an EE potential model that considers planned program offerings, expenditures,
market saturation of energy efficient technologies, load forecast, and a planned conservation
voltage reduction program following the city-wide deployment of Advanced Metering
Infrastructure (AMI). To meet the state’s legislative requirements, new annual electric EE goals
for 2026-2035 will be adopted in 2025.
For FY 2024, CPAU fell short of its electricity savings targets, achieving 0.16% versus its goal of
0.55%. Various factors contributed to below-target achievements. CPAU relies heavily on
commercial efficiency projects for the majority of the electric efficiency savings achieved in Palo
Alto each year. The rate and size of large commercial EE project completion increased from FY
2023 but was still low compared to pre-pandemic highs. The next couple years will be key in
determining whether the FY 2024 increase is indicative of a trend or if electric efficiency savings
are likely to continue falling short of annual targets. Additionally, as CPAU continues to focus on
developing and promoting electrification programs, this report now reflects the positive impact
these efficient electrification measures have on energy use. The FY 2024 report is the second
year that CPAU has included efficiency savings from electrification projects by converting
avoided therms to kWh equivalent and subtracting the new kWh usage of the electric
appliance.
Major Program and Portfolio Changes
In FY 2024, CPAU continued efforts on building-electrification activities and supporting
installation of EV charging equipment while ramping up the Advanced Heat Pump Water Heater
Pilot Program to make it easy and affordable for residential customers to electrify their water
heating equipment. The Business Energy Advisor (BEA) program launched near the end of FY
2022, but FY 2024 was the first year with completed projects with energy efficiency savings to
report. The Home Efficiency Genie program is still ongoing but did not have any efficiency
savings to report in FY 2024. The PV Partners Program has also been removed from this report
as the last rooftop solar rebates from the program were paid out in 2023.

Energy Efficiency in California’s Public Power Sector — 2025 A-152
Program and Portfolio Highlights
The highlight of CPAU’s FY 2024 portfolio is the Advanced Heat Pump Water Heater Pilot
Program that launched in early 2023. The program ramped up dramatically in FY 2024, installing
over 300 water heaters and saving an equivalent of over 1,000 MWh. The Commercial and
Industrial EE Program also had an impressive jump in reported savings compared to FY 2023,
from 179 MWh to over 1,200 MWh.
Commercial, Industrial & Agricultural Programs
• Business Customer Rebates (BCR): Incentives are offered to commercial customers for
investments in efficiency, lighting, motors, HVAC and custom projects that target gas,
peak demand and energy reductions. In FY 2024, the BCR program resulted in annual
electric savings of 44,779 kWh.
• Commercial and Industrial EE Program (CIEEP): This program provides Key Account
customers with access to an engineering consulting firm to evaluate and implement EE
projects. In FY 2024, the CIEEP program delivered annual electric savings of 1,217,641
kWh.
• Business Energy Advisor (BEA) program: This program dispatches trained energy
professionals to evaluate energy equipment such as lighting, heating, ventilation, and
AC (HVAC) systems, hot water systems, refrigeration and more at small to medium
business customers. Their customized assessments pinpoint exactly where businesses
can benefit from efficiency by identifying cost-effective upgrades to electric, gas and
water use equipment . Energy Advisors review assessment reports with customers and
explain where they can reduce energy or water use. In FY 2024, the BEA program
resulted in annual electric savings of 74,579 kWh.
Residential Programs
• MultiFamily Plus: This program provides no-cost, direct installation of EE measures to
multifamily residences with four or more units including hospices, care centers, and
rehab facilities. These properties are typically very difficult to engage in and unlikely to
implement EE measures on their own. In FY 2024, the MultiFamily Plus program vendor
was undergoing staff turnover in addition to the general difficulty engaging the
multifamily sector, leading to the program delivering low annual electric savings of 48
kWh.
• Home Efficiency Genie: The Home Efficiency Genie was launched in June 2015 to
provide residents with professional advice and information to improve their home’s
efficiency and comfort, lower their energy and water usage, and more recently, offer
guidance on home electrification options. In addition to in-home efficiency assessments
of energy equipment and the building envelope (attic, windows, walls), the program
also offers a Home Electrification Readiness Assessment (HERA) to plan for
electrification upgrades; both the efficiency assessment and HERA are offered in a

Energy Efficiency in California’s Public Power Sector — 2025 A-153
virtual option. The Home Efficiency Genie program did not yield any reportable electric
efficiency savings in FY 2024.
• Residential Energy Assistance Program (REAP): This program provides weatherization
and equipment replacement services to low-income residents and those with certain
medical conditions, at no cost to the residents. This program has an equal focus on
efficiency and comfort. As a program serving income and medically qualified residents,
it is not meant to be cost-effective, and neither costs nor savings are included in CPAU’s
calculation of EE portfolio cost effectiveness. In FY 2024, REAP resulted in annual electric
savings of 23,252 kWh.
• Advanced Heat Pump Water Heater (HPWH) Pilot Program: This program offers an end-
to-end advisory and installation service to homeowners to replace their gas water
heater with an efficient electric heat pump water heater; this includes a prescreened
contractor, zero-interest financing, attractive pricing with CPAU subsidies, and more. In
addition to the full-service option, customers can also choose their own contractor for
their project and apply for a rebate after the HPWH is installed. In FY 2024, the HPWH
program installed 316 new water heaters and produced annual energy savings
equivalent to 1,033,415 kWh.
Complementary Programs
• C&S: Green Building Ordinance: Since 2008, as part of the Green Building Ordinance the
City of Palo Alto has enforced energy reach codes that are more stringent than the
state’s Title 24 building energy standards. The energy reach code requirements apply to
both new residential and commercial buildings. In FY 2024, 24,052 kWh of savings were
attributable to the city’s Green Building Ordinance.
• Community Resource Education Programs: CPAU offers free EE advice and energy
education programs to the community. Activities include residential energy workshops
on topics such as the SunShares solar group-buy program and tabling at neighborhood
association events, local fairs and various special events throughout the city.
• Low-Income Program: Rate Assistance Program (RAP): CPAU offers a 25% discount on
gas and/or electricity charges for residents with qualifying financial or medical needs. All
households receiving Supplemental Security Income, Temporary Assistance to Needy
Families or Food Stamps automatically qualify for this rate discount which began in FY
1993.
• Public School Program: CPAU provides an annual grant of up to $50,000 to the Palo Alto
Unified School District (17 schools with 12,000 students total) to support teacher
training programs and the development of curriculums and education projects
promoting renewable energy and energy and water efficiency. CPAU participates in
quarterly sustainable schools committee meetings and gives educational presentations
to classes on EE, renewable energy, and safety.

Energy Efficiency in California’s Public Power Sector — 2025 A-154
• SunShares Solar Discount Program: Palo Alto has participated in this regional solar
group-buy program since 2015. This program is administered by a non-profit agency and
offer discounted prices for residential solar PV and battery storage systems from a few
pre-qualified contractors.
Evaluation, Measurement & Verification Studies
In FY 2024, CPAU did not undertake evaluation, measurement, and verification by any third
parties for any of its programs.
Major Differences or Diversions from CA POU TRM for Energy Savings
The energy savings data used for most of CPAU’s programs were taken from the 2017 CMUA
POU TRM or the eTRM. All savings data claimed by CPAU was vetted by staff and relies on
conservative assumptions.

Energy Efficiency in California’s Public Power Sector — 2025 A-155
TABLE CPAU-1. Energy Efficiency Program Results by End Use
Summary by End Use
Resource Savings Summary
Cost Test Results
End Use
Gross Peak
Savings (kW)
Gross Annual
Energy Savings
(kWh)
Gross Lifecycle
Energy Savings
(kWh)
Net Peak
Savings (kW)
Net Annual
Energy Savings
(kWh)
Net Lifecycle
Energy Savings
(kWh)
Net Lifecycle GHG
Reductions (Tons)
Total Utility
Cost
PAC
TRC
Utility
($/kWh)
Appliance & Plug Loads
0
355
3,550
0
302
3,017
1
$531
0.53
0.09
0.211
BROs
10
172,387
861,934
8
146,529
732,644
189
$202,476
0.20
0.49
0.300
Building Envelope
0
2,466
49,330
0
2,097
41,930
8
$4,761
0.19
0.19
0.164
Codes & Standards
3
43,667
873,346
3
37,117
742,344
205
$2,674
15.58
15.58
0.005
HVAC - Cooling
70
395,400
7,908,000
60
336,090
6,721,800
1,919
$224,769
2.43
0.48
0.048
HVAC - Heat Pump
3
26,418
528,360
3
22,455
449,106
148
$57,147
0.61
0.21
0.184
Lighting - Indoor
97
818,629
8,186,290
82
695,835
6,958,347
2,273
$208,502
3.08
1.55
0.036
Miscellaneous
0
0
0
0
0
0
0
$1,100
0.000
Energy Efficiency
183
1,459,323
18,410,810
156
1,240,424
15,649,188
4,744
$701,960
1.86
0.73
0.058
HVAC - Heat Pump
4
21,993
439,862
3
18,694
373,883
109
$37,118
0.76
0.16
0.143
Service & Domestic Hot Water
72
1,033,415
12,400,978
61
878,403
10,540,831
3,742
$713,823
1.39
0.51
0.084
Electrification
76
1,055,408
12,840,840
65
897,097
10,914,714
3,851
$750,941
1.36
0.48
0.086
Appliance & Plug Loads
1
7,208
72,082
1
6,127
61,270
17
$13,895
0.41
0.41
0.272
Building Envelope
0
20,057
401,132
0
17,048
340,962
70
$28,767
0.28
0.28
0.122
HVAC - Heating
0
20
400
0
17
340
0
$285
0.11
0.11
1.212
Lighting - Indoor
2
15,039
150,390
2
12,783
127,831
45
$36,151
0.34
0.34
0.339
Miscellaneous
0
157
1,566
0
133
1,331
0
$19,230
0.00
0.00
17.299
Water Pumping / Irrigation
0
6,014
80,688
0
5,112
68,585
14
$8,131
0.20
0.20
0.154
Low-Income
4
48,494
706,258
3
41,220
600,319
147
$106,460
0.26
0.26
0.237
EE, Low Income and Electrification
263
2,563,225
31,957,908
223
2,178,741
27,164,222
8,741
$1,559,361
1.51
0.59
0.074
C&S and T&D
$0
Utility Total
263
2,563,225
31,957,908
223
2,178,741
27,164,222
8,741
$1,559,361
1.51
0.59
0.074

Energy Efficiency in California’s Public Power Sector — 2025 A-156
TABLE CPAU-2. Energy Efficiency Program Results by Sector
Summary by Sector
Resource Savings Summary
Cost Test Results
Sector
Gross Peak
Savings (kW)
Gross Annual
Energy Savings
(kWh)
Gross Lifecycle
Energy Savings
(kWh)
Net Peak
Savings (kW)
Net Annual
Energy Savings
(kWh)
Net Lifecycle
Energy Savings
(kWh)
Net Lifecycle GHG
Reductions (Tons)
Total Utility
Cost
PAC
TRC
Utility
($/kWh)
Commercial
100
846,372
8,737,608
85
719,417
7,426,967
2,428
$266,379
2.55
1.17
0.043
Industrial
80
567,787
8,769,934
68
482,619
7,454,444
2,108
$427,245
1.37
0.48
0.080
Residential
3
45,163
903,267
3
38,389
767,777
208
$8,335
4.94
4.94
0.016
Energy Efficiency
183
1,459,323
18,410,810
156
1,240,424
15,649,188
4,744
$701,960
1.86
0.73
0.058
Commercial
4
21,993
439,862
3
18,694
373,883
109
$37,118
0.76
0.16
0.143
Residential
72
1,033,415
12,400,978
61
878,403
10,540,831
3,742
$713,823
1.39
0.51
0.084
Electrification
76
1,055,408
12,840,840
65
897,097
10,914,714
3,851
$750,941
1.36
0.48
0.086
Residential
4
48,494
706,258
3
41,220
600,319
147
$106,460
0.26
0.26
0.237
Low-Income
4
48,494
706,258
3
41,220
600,319
147
$106,460
0.26
0.26
0.237
EE, Low Income and Electrification
263
2,563,225
31,957,908
223
2,178,741
27,164,222
8,741
$1,559,361
1.51
0.59
0.074
C&S and T&D
$0
Utility Total
263
2,563,225
31,957,908
223
2,178,741
27,164,222
8,741
$1,559,361
1.51
0.59
0.074

Energy Efficiency in California’s Public Power Sector — 2025 A-157
TABLE CPAU-3. Energy Efficiency Program Results by Building Type
Summary by Building Type
Resource Savings Summary
Cost Test Results
Building Type
Gross Peak
Savings (kW)
Gross Annual
Energy Savings
(kWh)
Gross Lifecycle
Energy Savings
(kWh)
Net Peak
Savings (kW)
Net Annual
Energy Savings
(kWh)
Net Lifecycle
Energy Savings
(kWh)
Net Lifecycle GHG
Reductions (Tons)
Total Utility
Cost
PAC
TRC
Utility
($/kWh)
Assembly
7
52,225
522,250
6
44,391
443,913
143
$38,165
1.07
0.74
0.103
Education - University
10
172,387
861,934
8
146,529
732,644
189
$202,476
0.20
0.49
0.300
Health/Medical - Hospital
158
1,143,437
15,388,370
134
971,921
13,080,115
4,000
$382,111
2.96
0.77
0.038
Lodging - Hotel
3
26,418
528,360
3
22,455
449,106
148
$57,147
0.61
0.21
0.184
Office - Small
2
18,722
187,220
2
15,914
159,137
50
$13,526
1.08
1.01
0.102
Other Commercial
0
970
19,408
0
825
16,497
5
$199
6.95
6.95
0.017
Residential
3
42,697
853,937
3
36,292
725,847
200
$2,474
16.28
16.28
0.005
Residential - Multi-Family
0
2,466
49,330
0
2,097
41,930
8
$5,861
0.16
0.16
0.202
Energy Efficiency
183
1,459,323
18,410,810
156
1,240,424
15,649,188
4,744
$701,960
1.86
0.73
0.058
Office - Small
4
21,993
439,862
3
18,694
373,883
109
$37,118
0.76
0.16
0.143
Residential - Single-Family
72
1,033,415
12,400,978
61
878,403
10,540,831
3,742
$713,823
1.39
0.51
0.084
Electrification
76
1,055,408
12,840,840
65
897,097
10,914,714
3,851
$750,941
1.36
0.48
0.086
Residential - Single-Family
4
48,494
706,258
3
41,220
600,319
147
$106,460
0.26
0.26
0.237
Low-Income
4
48,494
706,258
3
41,220
600,319
147
$106,460
0.26
0.26
0.237
EE, Low Income and Electrification
263
2,563,225
31,957,908
223
2,178,741
27,164,222
8,741
$1,559,361
1.51
0.59
0.074
C&S and T&D
$0
Utility Total
263
2,563,225
31,957,908
223
2,178,741
27,164,222
8,741
$1,559,361
1.51
0.59
0.074

Energy Efficiency in California’s Public Power Sector — 2025 A-158
PASADENA WATER & POWER
Pasadena Water & Power at a Glance
• Climate Zone: 9
• Customers: 67,343
• Total annual retail sales: 1,007,444 MWh
• Annual Retail Revenue: $311,988,000
• Annual energy efficiency expenditures for reporting year: $2,682,512
• Gross annual savings from reporting year portfolio: 12,140 MWh
Pasadena Water & Power Overview
The City of Pasadena, located in climate zone (CZ) 9, is home to the iconic Rose Bowl, world-
class institutions like the California Institute of Technology and a variety of small businesses,
many of which of are restaurants. At the same time, Pasadena has a vibrant residential
community, with a diverse mix of single-family homes that ranges from craftsman homes to
bungalows and two-story tract homes. In the recent years, there has been an increase in new
multifamily properties; a sector that will continue to see growth with infill and higher-density
development.
Residential, 8,462
Commercial, 3,676
Low Income, 2T&D, 1
Gross Energy Savings (MWh)
Residential Commercial Industrial Agricultural Other Low Income T&D Electrification

Energy Efficiency in California’s Public Power Sector — 2025 A-159
Pasadena Water and Power’s (PWP) energy efficiency portfolio has been designed to align with
the utility’s goals of providing sustainable, affordable and reliable service to all of its residential
and commercial customers. At the same time, PWP is also trying to overcome industry wide
challenges like negative load growth while consistently meeting aggressive energy efficiency
and demand reduction goals set forth by its City Council since 2007.
The energy efficiency and demand reduction goals starting in FY22 called for 11,720 MWh of
annual energy savings (about 1.2 % of retail sales/year). PWP’s long standing energy efficiency
programs, combined with new building codes and standards, independent efficiency
improvements and customer investments in clean/local distributed generation have resulted in
a steady decline in retail energy sales since FY2008, and are expected to maintain a consistently
flat energy load projections in the near future.
In FY24, energy efficiency programs expenditures totaled $2.09 million, which is roughly 0.67%
of retail revenue. PWP funds procurement of all energy efficiency programs through its Public
Benefits Charge (“PBC”) revenues, with current PBC revenue rate at $0.00685 per kWh.
As a whole, energy-efficiency programs and other related expenses represented approximately
64% of Pasadena’s PBC expenditures in FY24. The transportation and building electrification
incentives represented 15%, and income-qualified rate assistance accounted for 21%.
Major Program and Portfolio Changes
PWP has continued to develop and implement various conservation and sustainability programs
for all of its customers, while meeting annual energy efficiency goals adopted by the City
Council and supporting GHG emissions reduction goals outlined in the City's Climate Action
Plan.
Program and Portfolio Highlights
Energy savings for FY24 are broken down into five separate categories. Commercial energy
efficiency programs contributed 3,156 MWh, Residential energy efficiency programs
contributed 8,038 MWh, Codes & Standards ("C&S") contributed 1,185 MWh, Water-Energy
transfer (embedded energy savings from water conservation efforts) contributed 533 MWh and
Transmission and Distribution ("T&D") upgrades contributed roughly 0.9 MWh. In total, PWP's
energy efficiency programs produced 12,912 MWh of energy savings for FY24.
Commercial, Industrial & Agricultural Programs
PWP’s commercial offerings fall into two distinct categories: rebates and direct-install
programs.

Energy Efficiency in California’s Public Power Sector — 2025 A-160
1. The Customized Incentive and Business Rebate programs provides incentives to any
commercial electric customer to help offset the upfront costs of efficiency upgrades and capital
improvement projects that generates above code energy savings.
2. The no-cost Water and Energy direct install program (WeDIP) serves small businesses and
includes a free evaluation to go with a customized report. Efficiency measures offered through
the WeDIP include LED Lighting, refrigeration upgrades, aerators, efficient kitchen equipment
and low-flow toilet replacements.
Residential Programs
PWP has seven residential offerings that fall into three distinct categories: rebates, direct-
install, and behavioral programs.
1. The Home Energy Rebate program provides rebates on the purchase of Energy Star certified
appliances, qualifying variable speed pool pumps, efficient air conditioning/heat pump
equipment and various building shell improvements that include wall and ceiling insulation.
2. The ESAP is a partnership with the SoCalGas that provides no cost direct install services to
income qualified customers. As part of the program, eligible residential customers will receive
various efficiency upgrades to help improve the comfort of their home while lowering
energy/water consumption. Measures include attic insulation, AC Tune-up, LED light bulbs,
smart power strips, smart thermostats, smart irrigation controllers, low-flow toilets and much
more.
3. The Home Improvement program provides no cost direct install services to all residential
electric customers. As part of the program, eligible residential customers will receive various
efficiency upgrades to help improve the comfort and efficiency of their home. Measures include
attic insulation, duct sealing, AC Tune-up, smart thermostats, smart irrigation controllers and
much more.
4. The Home Energy Report is a residential behavioral program that is mailed to approximately
40,000 customers on a quarterly basis, helping residents better understand their energy
consumption and how it compares with similar households in the vicinity. The report also has
customizable sections that help promote other PWP efficiency programs that may be of
interest.
5. The Public Benefits fund also help share the cost of the utility’s education programs for
school-aged children. In particular, this involves educational field trips for students of the
Pasadena Unified School District ("PUSD"), scholarship for high school seniors, the Living wise
green curriculum, and the Solar Cup through the Metropolitan Water District. On average, the
utility is able to reach about 5,000 students each year. In particular, the green curriculum is
available to all 2nd grade PUSD students and emphasizes ways to incorporate sustainability as
part of their daily lifestyles.

Energy Efficiency in California’s Public Power Sector — 2025 A-161
Complementary Programs
1. Income Qualified Rate Assistance Programs: PWP has offered electric rate assistance
programs to eligible low-income customers for several decades. The Electric Utility Assistance
Program (“EUAP”) became effective in 2006 and provides monthly assistance to customers
between the ages of 18-61 that meets the established income guidelines. The CARES and CARES
Plus program provides additional assistance for low-income seniors (ages 62 and up), plus
customers with a permanent disability that meets the established income guidelines. Project
APPLE (“Assisting Pasadena People with Limited Emergencies”) provides a one-time utility bill
payment assistance program that provides eligible income qualified customers who are at risk
of power shut off, up to $200 per year. Project APPLE is primarily funded by PBC revenues, plus
donations from PWP customers as well. In addition, PWP also offers added services to eligible
low-income customers which includes bonus rebates on qualifying efficiency products offered
through the Home Energy Rebates program, no-cost direct installation of energy and water
efficiency services, and much more.
2. PWP also offers a Green Power Program, where customers can opt to pay a premium on
their electricity bill for clean, renewable power. This program is open to both residential and
commercial customers.
3. Research, Development, and Demonstration ("RD&D"): While there were no RD&D projects
in FY24, PWP continues to seek out a variety of new opportunities that aligns with current
utility objectives.
4. Transportation Electrification: PWP continues to encourage the private sector to build
additional charging sites for public and private fleet use through a robust incentive program
offering rebates of up to $75,000 per commercial electric account. Commercial customers that
install charging infrastructure are eligible to receive $3,000 per unit, which doubles to $6,000 if
the chargers are in DAC locations. Incentives are also in place to encourage Pasadena residents
to buy or lease an EV and EV charger to enable charging at home. In particular, PWP residential
electric customers can receive up to $1,500 for a used EV and up to $600 for a new Wi-Fi
enabled L2 EV charger.
Evaluation, Measurement & Verification Studies
PWP used EM&V efforts for various energy efficiency programs to justify program design,
expenditures and verify results:
1. Residential Rebate Program: Utility staff requested and verified proof of install
documentation on residential energy-efficient equipment purchases and installations that were
selected for inspection.

Energy Efficiency in California’s Public Power Sector — 2025 A-162
2. Residential Direct Install Program: Program implementer performed quality assurance
inspections on a percentage of sub-contract direct installations.
3. Commercial Rebate Programs: For custom projects, utility staff or third-party engineering
consultants conducted inspections on all installations. For non-custom projects participating in
the deemed rebate program, utility staff conduct a percentage of inspections after installations
are complete.
Major Differences or Diversions from CA POU TRM for Energy Savings
PWP relies on the latest version of the CMUA POU TRM or California eTRM data, supplemented
by best available technical information from independent engineering analysis or approved CA
utility work papers when e-TRM measures are not available. For commercial programs, as
discussed above, PWP may rely on independent engineering analysis conducted by PWP’s third-
party engineering consultant and/or an online rebate estimator with industry accepted models
and simulations. Customized commercial efficiency offerings like the “CIP” provide commercial
electric customers with the ability to participate with any proven technology that can produce
above code energy savings, provided it meets the existing program requirements at the time.

Energy Efficiency in California’s Public Power Sector — 2025 A-163
TABLE PWP-1. Energy Efficiency Program Results by End Use
Summary by End Use
Resource Savings Summary
Cost Test Results
End Use
Gross Peak
Savings (kW)
Gross Annual
Energy Savings
(kWh)
Gross Lifecycle
Energy Savings
(kWh)
Net Peak
Savings (kW)
Net Annual
Energy Savings
(kWh)
Net Lifecycle
Energy Savings
(kWh)
Net Lifecycle GHG
Reductions (Tons)
Total Utility
Cost
PAC
TRC
Utility
($/kWh)
Any
39
162,650
1,301,200
39
162,650
1,301,200
486
$1,048,116
0.21
1.56
0.950
Appliance & Plug Loads
4
16,704
171,830
2
9,440
93,080
32
$17,034
0.89
0.91
0.230
BROs
1,881
7,782,020
7,782,020
1,881
7,782,020
7,782,020
3,176
$399,885
2.68
2.68
0.051
Building Envelope
291
324,603
6,484,821
82
91,278
1,823,153
675
$25,789
25.15
24.88
0.022
Commercial Refrigeration
4
38,221
382,210
4
38,221
382,210
136
$5,607
8.20
24.43
0.018
HVAC - Cooling
20
47,012
264,375
13
40,870
219,202
79
$243,297
0.21
3.51
1.256
HVAC - Heat Pump
114
697,239
10,458,588
114
696,800
10,451,996
3,234
$133,296
10.15
13.73
0.018
Lighting - Indoor
276
2,376,893
18,755,098
276
2,376,893
18,755,098
6,149
$697,672
3.21
24.25
0.044
Miscellaneous
85
692,326
2,364,949
85
692,326
2,364,949
863
$70,852
4.23
8.56
0.036
Whole Building
0
0
0
0
0
0
0
$22,000
0.000
Energy Efficiency
2,715
12,137,668
47,965,091
2,498
11,890,498
43,172,908
14,830
$2,663,548
2.23
7.00
0.074
Any
0
1,620
17,826
0
1,620
17,826
7
$3,490
0.86
2.30
0.247
Low-Income
0
1,620
17,826
0
1,620
17,826
7
$3,490
0.86
2.30
0.247
Appliance & Plug Loads
0
0
0
0
0
0
0
$6,680
0.000
Service & Domestic Hot Water
0
0
0
0
0
0
0
$5,000
0.000
Electrification
0
0
0
0
0
0
0
$11,680
0.000
EE, Low Income and Electrification
2,715
12,139,289
47,982,916
2,498
11,892,119
43,190,734
14,836
$2,678,718
2.22
6.90
0.074
Codes & Standards
147
1,185,822
1,185,822
147
1,185,822
1,185,822
445
$3,714
32.06
32.06
0.003
Codes & Standards
147
1,185,822
1,185,822
147
1,185,822
1,185,822
445
$3,714
32.06
32.06
0.003
Transmission & Distribution
0
919
25,732
0
919
25,732
9
$81
32.06
32.06
0.006
T&D
0
919
25,732
0
919
25,732
9
$81
32.06
32.06
0.006
C&S and T&D
147
1,186,741
1,211,554
147
1,186,741
1,211,554
454
$3,795
32.06
32.06
0.003
Utility Total
2,862
13,326,030
49,194,470
2,646
13,078,860
44,402,288
15,290
$2,682,512
2.26
7.01
0.072

Energy Efficiency in California’s Public Power Sector — 2025 A-164
TABLE PWP-2. Energy Efficiency Program Results by Sector
Summary by Sector
Resource Savings Summary
Cost Test Results
Sector
Gross Peak
Savings (kW)
Gross Annual
Energy Savings
(kWh)
Gross Lifecycle
Energy Savings
(kWh)
Net Peak
Savings (kW)
Net Annual
Energy Savings
(kWh)
Net Lifecycle
Energy Savings
(kWh)
Net Lifecycle GHG
Reductions (Tons)
Total Utility
Cost
PAC
TRC
Utility
($/kWh)
Commercial
460
3,675,684
30,244,009
460
3,675,684
30,244,009
9,750
$1,086,874
3.41
17.08
0.044
Residential
2,254
8,461,984
17,721,082
2,038
8,214,814
12,928,899
5,080
$1,576,674
1.43
3.55
0.135
Energy Efficiency
2,715
12,137,668
47,965,091
2,498
11,890,498
43,172,908
14,830
$2,663,548
2.23
7.00
0.074
Residential
0
1,620
17,826
0
1,620
17,826
7
$3,490
0.86
2.30
0.247
Low-Income
0
1,620
17,826
0
1,620
17,826
7
$3,490
0.86
2.30
0.247
Residential
0
0
0
0
0
0
0
$11,680
0.000
Electrification
0
0
0
0
0
0
0
$11,680
0.000
EE, Low Income and Electrification
2,715
12,139,289
47,982,916
2,498
11,892,119
43,190,734
14,836
$2,678,718
2.22
6.90
0.074
Commercial
147
1,185,822
1,185,822
147
1,185,822
1,185,822
445
$3,714
32.06
32.06
0.003
Codes & Standards
147
1,185,822
1,185,822
147
1,185,822
1,185,822
445
$3,714
32.06
32.06
0.003
Commercial
0
919
25,732
0
919
25,732
9
$81
32.06
32.06
0.006
T&D
0
919
25,732
0
919
25,732
9
$81
32.06
32.06
0.006
C&S and T&D
147
1,186,741
1,211,554
147
1,186,741
1,211,554
454
$3,795
32.06
32.06
0.003
Utility Total
2,862
13,326,030
49,194,470
2,646
13,078,860
44,402,288
15,290
$2,682,512
2.26
7.01
0.072

Energy Efficiency in California’s Public Power Sector — 2025 A-165
TABLE PWP-3. Energy Efficiency Program Results by Building Type
Summary by Building Type
Resource Savings Summary
Cost Test Results
Building Type
Gross Peak
Savings (kW)
Gross Annual
Energy Savings
(kWh)
Gross Lifecycle
Energy Savings
(kWh)
Net Peak
Savings (kW)
Net Annual
Energy Savings
(kWh)
Net Lifecycle
Energy Savings
(kWh)
Net Lifecycle GHG
Reductions (Tons)
Total Utility
Cost
PAC
TRC
Utility
($/kWh)
Any
461
3,679,318
30,261,768
461
3,678,228
30,256,441
9,755
$1,065,768
3.48
18.98
0.043
Multiple
0
0
0
0
0
0
0
$22,000
0.000
Residential
2,250
8,447,027
17,566,716
2,035
8,206,516
12,847,235
5,050
$1,561,088
1.43
3.61
0.135
Residential - Single-Family
3
11,323
136,607
2
5,755
69,232
25
$14,692
0.88
0.87
0.275
Energy Efficiency
2,715
12,137,668
47,965,091
2,498
11,890,498
43,172,908
14,830
$2,663,548
2.23
7.00
0.074
Residential
0
1,620
17,826
0
1,620
17,826
7
$3,490
0.86
2.30
0.247
Low-Income
0
1,620
17,826
0
1,620
17,826
7
$3,490
0.86
2.30
0.247
Residential
0
0
0
0
0
0
0
$11,680
0.000
Electrification
0
0
0
0
0
0
0
$11,680
0.000
EE, Low Income and Electrification
2,715
12,139,289
47,982,916
2,498
11,892,119
43,190,734
14,836
$2,678,718
2.22
6.90
0.074
Any
147
1,185,822
1,185,822
147
1,185,822
1,185,822
445
$3,714
32.06
32.06
0.003
Codes & Standards
147
1,185,822
1,185,822
147
1,185,822
1,185,822
445
$3,714
32.06
32.06
0.003
Any
0
919
25,732
0
919
25,732
9
$81
32.06
32.06
0.006
T&D
0
919
25,732
0
919
25,732
9
$81
32.06
32.06
0.006
C&S and T&D
147
1,186,741
1,211,554
147
1,186,741
1,211,554
454
$3,795
32.06
32.06
0.003
Utility Total
2,862
13,326,030
49,194,470
2,646
13,078,860
44,402,288
15,290
$2,682,512
2.26
7.01
0.072

Energy Efficiency in California’s Public Power Sector — 2025 A-166
PLUMAS-SIERRA RURAL ELECTRIC COOPERATIVE
Plumas-Sierra Rural Electric Cooperative at a Glance
• Climate Zone: 16
• Customers: 8,263
• Total annual retail sales: 144,301 MWh
• Annual Retail Revenue: $32,144,923
• Annual energy efficiency expenditures for reporting year: $134,512
• Gross annual savings from reporting year portfolio: 106 MWh
Plumas-Sierra Rural Electric Cooperative Overview
Plumas-Sierra Rural Electric Cooperative (PSREC) is a member-owned, not-for-profit utility
located in the eastern Sierras of Northern California. PSREC provides electricity to more than
8,100 rural residents in portions of Plumas, Sierra and Lassen counties in California and part of
Washoe County, Nevada.
Plumas-Sierra’s service territory encompasses more than 1,700 square miles with more than
1,300 miles of transmission and distribution power line. PSREC serves just six members per mile
of line, compared to the average of 34 customers per mile of line for investor-owned utilities.
Residential, 93
Agricultural, 13
Gross Energy Savings (MWh)
Residential Commercial Industrial Agricultural Other Low Income T&D Electrification

Energy Efficiency in California’s Public Power Sector — 2025 A-167
The goal of PSREC’s energy efficiency programs is to help members understand and control
their energy use.
Major Program and Portfolio Changes
There were no major changes to the PSREC programs or portfolios in 2024.
Program and Portfolio Highlights
The majority of the energy savings for the CY24 program were provided by the residential
sector.
Commercial, Industrial & Agricultural Programs
PSREC provides free energy audits to businesses to assist with energy conservation and
troubleshooting high energy consumption. This program has been successful in assisting
business owners in making decisions in efficiency upgrades and conservation.
PSREC offers rebates for commercial and industrial members who perform efficiency upgrades
including lighting and other custom measures.
To encourage the installation of energy efficient equipment in agricultural irrigation systems
PSREC offers rebates for pump tests and efficiency improvements.
Residential Programs
• Geothermal Heating/Cooling Loans: 0% interest ground source heat pump loop loans
available for installation of ground-source heat pumps.
• HVAC Rebates: PSREC provides members with rebate options to encourage installation
of energy-efficient electric heat pumps and ground-source heat pumps in new
construction and existing homes and small businesses. Upgrading to an energy-efficient
heating and cooling system will contribute to increased comfort in homes while helping
to reduce overall energy use.
• ENERGY STAR® Rebates: Rebates available for the purchase of an ENERGY STAR®
refrigerator, dishwasher or clothes washer.
• Appliance Recycling: Rebates offered for recycling a non-essential freezer or
refrigerator.
• ENERGY STAR® Lighting Rebates: Offers rebates for the purchase and installation of LED
lamps.
• LED Holiday Light Rebate: Provides an incentive to replace incandescent holiday light
strands with qualified new ENERGY STAR LED holiday light strands.
• Water Heater Sales and Rebates: Discounted sales of, and rebates for the purchase of
high-efficiency electric water heaters, including heat pump water heaters.
• Weatherization Rebates: PSREC offers members rebates for upgrading windows and
insulation in their homes. By retrofitting a home to above-code R-Values, and upgrading

Energy Efficiency in California’s Public Power Sector — 2025 A-168
windows to double-pane high-performance windows, members not only realize the
added comfort, but also gain increased home values. PSREC encourages members to
invest in weatherization measures prior to, or in addition to, investing in a new heating
source for energy conservation.
• Annual Member Meeting Efficiency Giveaways: PSREC provides members who attend
the annual meeting with efficiency items such as LED lights, low-flow showerheads,
faucet aerators, etc.
• Efficiency Education: PSREC provides energy efficiency and conservation information, as
well as kilowatt meters, to interested members to help them reduce their bill,
understand their energy consumption and make their home more efficient. This
program has successfully addressed high bill concerns by empowering members to use
information such as our ‘Do-It-Yourself Energy Audit’ to learn more about their home
and how they use energy.
• Efficiency Education - Energy Audits: PSREC provides free comprehensive energy audits
to assist members with energy conservation and troubleshooting high energy
consumption in their home. This program has been successful in educating members
about efficiency and conservation and assisting in reduction of energy use, especially in
low-income homes.
Complementary Programs
• Low Income Winter Rate Assistance Program: Income-qualified members can apply for a
discounted rate during the heating season. In conjunction, a home energy audit is
offered, and efficiency information is provided to assist members with energy
conservation.
• Net Metering Program: PSREC offers net metering for members who install renewable
energy generation systems.
• Community Shared Solar: PSREC offers solar energy shares to our members who
currently cannot install solar on their homes or businesses due to cost, location or
ownership status.
• Lending Library and Resource Center: Provides energy efficiency and renewable energy
resources to members through a book lending library and resource center in our office
lobby.
• Electric Vehicle Rebate: PSREC offers a $500 rebate for the purchase of an electric
vehicle.
• Research, Development, and Demonstration: PSREC is researching electric vehicle
charging infrastructure and other program options to encourage the adoption of electric
vehicles in its service area.

Energy Efficiency in California’s Public Power Sector — 2025 A-169
Evaluation, Measurement & Verification Studies
PSREC performs a yearly internal review to evaluate program effectiveness and improvement
areas. PSREC has committed to seek third-party evaluation of its programs every five years,
dependent upon budget.
Major Differences or Diversions from CA POU TRM for Energy Savings
PSREC uses the CMUA POU TRM, eTRM, and the Bonneville Power Administration as the
primary sources for the majority of reported energy savings. Savings for the commercial lighting
program are custom calculations based on the specific equipment replaced.
Energy Efficiency in California’s Public Power Sector — 2025 A-170
TABLE PSREC-1. Energy Efficiency Program Results by End Use
Summary by End Use
Resource Savings Summary
Cost Test Results
End Use
Gross Peak
Savings (kW)
Gross Annual
Energy Savings
(kWh)
Gross Lifecycle
Energy Savings
(kWh)
Net Peak
Savings (kW)
Net Annual
Energy Savings
(kWh)
Net Lifecycle
Energy Savings
(kWh)
Net Lifecycle GHG
Reductions (Tons)
Total Utility
Cost
PAC
TRC
Utility
($/kWh)
Appliance & Plug Loads
1
7,508
64,361
1
4,017
30,728
11
$22,184
0.19
0.14
0.855
Building Envelope
2
5,469
104,855
1
3,380
66,336
17
$4,567
0.96
0.24
0.101
HVAC - Cooling
0
1,370
12,444
0
737
6,695
2
$1,030
0.69
0.22
0.183
HVAC - Heat Pump
24
77,313
1,159,694
15
46,876
703,145
272
$91,793
1.12
0.31
0.174
Lighting - Indoor
0
262
3,860
0
141
2,084
1
$753
0.38
0.32
0.482
Service & Domestic Hot Water
0
1,060
10,600
0
583
5,830
2
$3,733
0.22
0.21
0.774
Water Pumping / Irrigation
1
12,600
126,000
0
5,040
50,400
17
$10,452
0.51
0.31
0.251
Energy Efficiency
28
105,582
1,481,814
17
60,775
865,218
323
$134,512
0.88
0.29
0.207
EE, Low Income and Electrification
28
105,582
1,481,814
17
60,775
865,218
323
$134,512
0.88
0.29
0.207
C&S and T&D
$0
Utility Total
28
105,582
1,481,814
17
60,775
865,218
323
$134,512
0.88
0.29
0.207
Energy Efficiency in California’s Public Power Sector — 2025 A-171
TABLE PSREC-2. Energy Efficiency Program Results by Sector
Summary by Sector
Resource Savings Summary
Cost Test Results
Sector
Gross Peak
Savings (kW)
Gross Annual
Energy Savings
(kWh)
Gross Lifecycle
Energy Savings
(kWh)
Net Peak
Savings (kW)
Net Annual
Energy Savings
(kWh)
Net Lifecycle
Energy Savings
(kWh)
Net Lifecycle GHG
Reductions (Tons)
Total Utility
Cost
PAC
TRC
Utility
($/kWh)
Agricultural
1
12,600
126,000
0
5,040
50,400
17
$10,452
0.51
0.31
0.251
Residential
27
92,982
1,355,814
17
55,735
814,818
306
$124,060
0.91
0.29
0.204
Energy Efficiency
28
105,582
1,481,814
17
60,775
865,218
323
$134,512
0.88
0.29
0.207
EE, Low Income and Electrification
28
105,582
1,481,814
17
60,775
865,218
323
$134,512
0.88
0.29
0.207
C&S and T&D
$0
Utility Total
28
105,582
1,481,814
17
60,775
865,218
323
$134,512
0.88
0.29
0.207
Energy Efficiency in California’s Public Power Sector — 2025 A-172
TABLE PSREC-3. Energy Efficiency Program Results by Building Type
Summary by Building Type
Resource Savings Summary
Cost Test Results
Building Type
Gross Peak
Savings (kW)
Gross Annual
Energy Savings
(kWh)
Gross Lifecycle
Energy Savings
(kWh)
Net Peak
Savings (kW)
Net Annual
Energy Savings
(kWh)
Net Lifecycle
Energy Savings
(kWh)
Net Lifecycle GHG
Reductions (Tons)
Total Utility
Cost
PAC
TRC
Utility
($/kWh)
Any
1
16,024
142,783
1
7,436
62,143
22
$18,534
0.38
0.28
0.353
Multiple
6
31,630
461,763
4
18,311
268,347
105
$43,710
0.94
0.62
0.217
Residential
1
4,590
79,461
1
3,170
57,494
17
$10,206
0.49
0.20
0.255
Residential - Single-Family
19
53,338
797,808
11
31,858
477,235
180
$62,062
1.06
0.22
0.174
Energy Efficiency
28
105,582
1,481,814
17
60,775
865,218
323
$134,512
0.88
0.29
0.207
EE, Low Income and Electrification
28
105,582
1,481,814
17
60,775
865,218
323
$134,512
0.88
0.29
0.207
C&S and T&D
$0
Utility Total
28
105,582
1,481,814
17
60,775
865,218
323
$134,512
0.88
0.29
0.207
Energy Efficiency in California’s Public Power Sector — 2025 A-173
PORT OF OAKLAND
Port of Oakland at a Glance
• Climate Zone: 3
• Customers: 131
• Total annual retail sales: 94,989 MWh
• Annual Retail Revenue: $18,253,778
• Annual energy efficiency expenditures for reporting year: $14,547
• Gross annual savings from reporting year portfolio (MWh): 0
Port of Oakland Overview
The Port of Oakland (the Port) oversees the Oakland seaport, Oakland International Airport,
and 20 miles of waterfront. Together with its business partners, the Port supports more than
84,000 jobs in the region and nearly 827,000 jobs nationwide. The Port exemplifies a unique
combination of public/private endeavors. It encompasses a world-class container port, a
thriving airport, an array of retail and commercial buildings, and acres of recreational and open
space. The Port has approximately 167 commercial electric customers.
Gross Energy Savings (MWh)
Residential Commercial Industrial Agricultural Other Low Income T&D Electrification

Energy Efficiency in California’s Public Power Sector — 2025 A-174
Major Program and Portfolio Changes
Although no customers completed projects in FY24, the Port offered incentives for energy
efficiency projects.
Program and Portfolio Highlights
There were no programmatic highlights in FY24.
Commercial, Industrial & Agricultural Programs
• Energy Audits: The Port provides Energy Audits that focus on five major energy-saving
retrofit/improvement projects that will result in load reduction and more efficient use
of energy.
• Energy Saving Measures Exceeding Title 24 Standards: The Port will provide a rebate for
any new facility constructed within the Port by its electricity customers that exceed the
Title 24 standards in energy saving measures. Eligible facilities must reduce energy
usage by a minimum of 10% compared to the standard Title 24 facility.
• Energy Saving Equipment Retrofits/Improvements Rebates: The Port has implemented a
program that provides rebates and solid technical support for the installation of new
energy-efficiency equipment/improvements by our commercial customers.
• Lighting Retrofit: A program providing rebates for the installation of energy-efficiency
lighting upgrades.
Residential Programs
The Port does not have any residential customers.
Complementary Programs
The Port recognizes the unique opportunities available in renewable energy, energy storage,
and electric vehicles due to our customer base. We are working with customers to identify
needs and assess the potential for renewable energy, storage, EV adoption, and EV charging
infrastructure programs and investments.
Evaluation, Measurement & Verification Studies
Go to https://www.cmua.org/emv-reports for more information on EM&V studies.
Major Differences or Diversions from CA POU TRM for Energy Savings
Reported savings are custom calculations based on actual equipment replaced and installed.
Energy Efficiency in California’s Public Power Sector — 2025 A-175
TABLE Port-1. Energy Efficiency Program Results by End Use
Summary by End Use
Resource Savings Summary
Cost Test Results
End Use
Gross Peak
Savings (kW)
Gross Annual
Energy Savings
(kWh)
Gross Lifecycle
Energy Savings
(kWh)
Net Peak
Savings (kW)
Net Annual
Energy Savings
(kWh)
Net Lifecycle
Energy Savings
(kWh)
Net Lifecycle GHG
Reductions (Tons)
Total Utility
Cost
PAC
TRC
Utility
($/kWh)
Lighting - Indoor
0
0
0
0
0
0
0
$14,547
0.000
Energy Efficiency
0
0
0
0
0
0
0
$14,547
0.000
EE, Low Income and Electrification
0
0
0
0
0
0
0
$14,547
0.000
C&S and T&D
$0
Utility Total
0
0
0
0
0
0
0
$14,547
0.000
Energy Efficiency in California’s Public Power Sector — 2025 A-176
TABLE Port-2. Energy Efficiency Program Results by Sector
Summary by Sector
Resource Savings Summary
Cost Test Results
Sector
Gross Peak
Savings (kW)
Gross Annual
Energy Savings
(kWh)
Gross Lifecycle
Energy Savings
(kWh)
Net Peak
Savings (kW)
Net Annual
Energy Savings
(kWh)
Net Lifecycle
Energy Savings
(kWh)
Net Lifecycle GHG
Reductions (Tons)
Total Utility
Cost
PAC
TRC
Utility
($/kWh)
Commercial
0
0
0
0
0
0
0
$14,547
0.000
Energy Efficiency
0
0
0
0
0
0
0
$14,547
0.000
EE, Low Income and Electrification
0
0
0
0
0
0
0
$14,547
0.000
C&S and T&D
$0
Utility Total
0
0
0
0
0
0
0
$14,547
0.000
Energy Efficiency in California’s Public Power Sector — 2025 A-177
TABLE Port-3. Energy Efficiency Program Results by Building Type
Summary by Building Type
Resource Savings Summary
Cost Test Results
Building Type
Gross Peak
Savings (kW)
Gross Annual
Energy Savings
(kWh)
Gross Lifecycle
Energy Savings
(kWh)
Net Peak
Savings (kW)
Net Annual
Energy Savings
(kWh)
Net Lifecycle
Energy Savings
(kWh)
Net Lifecycle GHG
Reductions (Tons)
Total Utility
Cost
PAC
TRC
Utility
($/kWh)
Multiple
0
0
0
0
0
0
0
$14,547
0.000
Energy Efficiency
0
0
0
0
0
0
0
$14,547
0.000
EE, Low Income and Electrification
0
0
0
0
0
0
0
$14,547
0.000
C&S and T&D
$0
Utility Total
0
0
0
0
0
0
0
$14,547
0.000

Energy Efficiency in California’s Public Power Sector — 2025 A-178
RANCHO CUCAMONGA MUNICIPAL UTILITY
Rancho Cucamonga Municipal Utility at a Glance
• Climate Zone: 10
• Customers: 3,433
• Total annual retail sales: 111,590 MWh
• Annual Retail Revenue: $20,723,377
• Annual energy efficiency expenditures for reporting year: $44,649
• Gross annual savings from reporting year portfolio: 328 MWh
Rancho Cucamonga Overview
The Rancho Cucamonga Municipal Utility (RCMU) began providing electric services in 2004 to
primarily commercial customers. Since then, RCMU has grown and expanded to residential and
industrial customers and new developments. Interest and participation in EE programs
continue to have low demand due to existing customer base and new growth coming from new
construction that meets or exceeds Title 24 requirements.
Major Program and Portfolio Changes
There were no major program changes implemented in FY 2024.
Residential, 0.01
Commercial, 328
Gross Energy Savings (MWh)
Residential Commercial Industrial Agricultural Other Low Income T&D Electrification

Energy Efficiency in California’s Public Power Sector — 2025 A-179
Program and Portfolio Highlights
In previous years, the greatest participation in EE programs has been attained by the
commercial EE rebate program. Replacing inefficient lamp fixtures with LEDs continues to be
the trend for EE rebates. Programs and EE practices are promoted online and free energy
audits are continuing to be offered to educate customers on energy savings and potential
upgrades on existing equipment.
Commercial, Industrial & Agricultural Programs
• EE Program: Non-Res Lighting, Non-Res Refrigeration: RCMU has adopted an “Express
Solution” model for EE rebates. Customers receive a rebate for estimated kilowatt hour
savings for the first year in the following categories: Lighting, Interior LED, Exterior LED,
Delamping, HVAC, Motors and Refrigeration.
• Direct Savings Program: Non-Res Lighting: To encourage and assist small and medium
sized businesses to reduce their energy usage, RCMU will pay and install up to $1,500 of
recommended retrofit items that are determined from the complimentary energy audit.
Any cost above the $1,500 limit is paid by the customer.
Residential Programs
During this reporting period, the RCMU residential customer base expanded from primarily
leasing multi-family tenants to include single family owned residences. With the growth
coming from new developments that meet or exceed Title 24, there is a continued challenge to
find interest in EE improvements among the residential customers. The homes are built with
LED lighting fixtures, energy efficient appliances, and may include solar PV systems. The newly
established residential rebate program has low demand as anticipated. Staff will continue to
explore innovative ways to tailor the programs to increase participation.
Complementary Programs
Complementary Programs
• Energy Audits: RCMU offers free, customized energy audits including lighting, HVAC and
equipment assessment and a review of energy usage. Specific cost-effective
recommendations to improve EE and reduce energy use are provided.
• Low Income: The program is intended to assist customers with their bills and is funded
by RCMU Public Benefit Fund. The household size and gross income requirements is
based off the San Bernardino County Income Limits and Documentation System. RCMU
also offers acceptance into the low-income program based on LIHEAP acceptance.
• Medical Support Assistance Program: The program will assist eligible residential
customers where a full-time resident of the household regularly requires the use of
essential medical support equipment. An application with supporting documentation
from the patient's doctor is required to receive the credit each month.
Energy Efficiency in California’s Public Power Sector — 2025 A-180
TABLE RCMU-1. Energy Efficiency Program Results by End Use
Summary by End Use
Resource Savings Summary
Cost Test Results
End Use
Gross Peak
Savings (kW)
Gross Annual
Energy Savings
(kWh)
Gross Lifecycle
Energy Savings
(kWh)
Net Peak
Savings (kW)
Net Annual
Energy Savings
(kWh)
Net Lifecycle
Energy Savings
(kWh)
Net Lifecycle GHG
Reductions (Tons)
Total Utility
Cost
PAC
TRC
Utility
($/kWh)
Appliance & Plug Loads
0
10
101
0
0
0
0
$100
0.000
HVAC - Cooling
0
1,509
15,090
0
1,509
15,090
5
$1,238
0.67
1.27
0.192
Lighting - Outdoor
140
326,506
3,265,060
140
326,506
3,265,060
1,498
$42,102
9.15
12.09
0.016
Energy Efficiency
140
328,025
3,280,251
140
328,015
3,280,150
1,503
$43,440
8.67
11.62
0.017
EE, Low Income and Electrification
140
328,025
3,280,251
140
328,015
3,280,150
1,503
$43,440
8.67
11.62
0.017
C&S and T&D
$0
Utility Total
140
328,025
3,280,251
140
328,015
3,280,150
1,503
$43,440
8.67
11.62
0.017
Energy Efficiency in California’s Public Power Sector — 2025 A-181
TABLE RCMU-2. Energy Efficiency Program Results by Sector
Summary by Sector
Resource Savings Summary
Cost Test Results
Sector
Gross Peak
Savings (kW)
Gross Annual
Energy Savings
(kWh)
Gross Lifecycle
Energy Savings
(kWh)
Net Peak
Savings (kW)
Net Annual
Energy Savings
(kWh)
Net Lifecycle
Energy Savings
(kWh)
Net Lifecycle GHG
Reductions (Tons)
Total Utility
Cost
PAC
TRC
Utility
($/kWh)
Commercial
140
328,015
3,280,150
140
328,015
3,280,150
1,503
$43,340
8.70
11.69
0.017
Residential
0
10
101
0
0
0
0
$100
0.000
Energy Efficiency
140
328,025
3,280,251
140
328,015
3,280,150
1,503
$43,440
8.67
11.62
0.017
EE, Low Income and Electrification
140
328,025
3,280,251
140
328,015
3,280,150
1,503
$43,440
8.67
11.62
0.017
C&S and T&D
$0
Utility Total
140
328,025
3,280,251
140
328,015
3,280,150
1,503
$43,440
8.67
11.62
0.017
Energy Efficiency in California’s Public Power Sector — 2025 A-182
TABLE RCMU-3. Energy Efficiency Program Results by Building Type
Summary by Building Type
Resource Savings Summary
Cost Test Results
Building Type
Gross Peak
Savings (kW)
Gross Annual
Energy Savings
(kWh)
Gross Lifecycle
Energy Savings
(kWh)
Net Peak
Savings (kW)
Net Annual
Energy Savings
(kWh)
Net Lifecycle
Energy Savings
(kWh)
Net Lifecycle GHG
Reductions (Tons)
Total Utility
Cost
PAC
TRC
Utility
($/kWh)
Any
140
328,015
3,280,150
140
328,015
3,280,150
1,503
$43,340
8.70
11.69
0.017
Residential - Multi-Family
0
10
101
0
0
0
0
$100
0.000
Energy Efficiency
140
328,025
3,280,251
140
328,015
3,280,150
1,503
$43,440
8.67
11.62
0.017
EE, Low Income and Electrification
140
328,025
3,280,251
140
328,015
3,280,150
1,503
$43,440
8.67
11.62
0.017
C&S and T&D
$0
Utility Total
140
328,025
3,280,251
140
328,015
3,280,150
1,503
$43,440
8.67
11.62
0.017

Energy Efficiency in California’s Public Power Sector — 2025 A-183
REDDING ELECTRIC UTILITY
Redding Electric Utility at a Glance
• Climate Zone: 11
• Customers: 44,343
• Total annual retail sales: 736,112 MWh
• Annual Retail Revenue: $129,391,300
• Annual energy efficiency expenditures for reporting year: $284,876
• Gross annual savings from reporting year portfolio: 88 MWh
Redding Electric Utility Overview
Total sales for FY 2024 were 736,612 MWh – a 3.39% decrease compared to FY 2023. Redding
attributes the decrease in retail sales to rising cost of living expenses from inflation, lower work
from home levels, and a slower rate of new construction. Redding continuously develops
electric sales forecasts, especially as the utility expects to see sustained increases in sales
attributed to economic growth and increased building and transportation electrification.
Commercial, 55
Electrification, 33
Gross Energy Savings (MWh)
Residential Commercial Industrial Agricultural Other Low Income T&D Electrification

Energy Efficiency in California’s Public Power Sector — 2025 A-184
Due to Redding’s hot summer climate and high residential load, REU’s peak demand typically
occurs in the summer between 4:00-5:00 p.m. and is more than double the peak demand
during non-cooling months.
In previous reporting years, Redding committed much of our Cap-and-Trade (C&T) auction
proceeds to efforts that reduce greenhouse gas emissions, support energy efficiency and
electrification upgrades to income-eligible customers, and achieve reliable energy savings.
Redding does not expect to receive additional funding from C&T auction proceeds for customer
programs and is actively ramping down greenhouse gas-funded programs over the next few
years. There are no plans for new programs utilizing C&T auction proceeds.
Major Program and Portfolio Changes
REU continuously evaluates and makes changes to the public benefits programs to maximize
the benefits to the community and maintain compliance with State and Federal Regulations.
In September 2021, Redding’s City Council approved Redding’s Demand-Side Management
Integrated Resource Plan (DSM-IRP) report. The DSM-IRP concluded that energy efficiency
measures were not cost-effective for ratepayers due to Redding’s low avoided costs and the
impact of lost revenue for providing programs that inherently reduce load (i.e. energy
efficiency). In contrast, electrification programs are cost-effective for all ratepayers (not just
participants), provide a positive revenue source to help sustain Public Benefits funding, and are
a cost-effective way to save carbon. As a result, Redding City Council approved terminating all
energy efficiency rebate programs paid through Public Benefits, replacing them with a new
suite of building electrification programs beginning in FY2023. The approved DSM-IRP report is
available on the City of Redding’s website.
16
Redding implemented several electrification programs effective July 1st, 2022, including:
• Residential Electrification Rebates
o Heat Pump Water Heaters
o Heat Pump Clothes Dryers
• Commercial Electrification Rebates
o Heat Pump Water Heaters
• New Construction Residential Rebates
o Heat Pump Space and Water Heating Package
With the LED Streetlight Replacement Project ending in FY 2023, the Redding Energy Efficiency
Economic Recovery Plan (EEE-RP), which provides EE upgrades to City facilities, is the final
remaining EE savings program. This program is funded by C&T auction proceeds, and there are
no plans to extend the program once all funding is exhausted.
16
http://reddingcityca.iqm2.com/Citizens/Detail_LegiFile.aspx?Frame=&MeetingID=3604&Medi
aPosition=&ID=7641&CssClass

Energy Efficiency in California’s Public Power Sector — 2025 A-185
Program and Portfolio Highlights
Redding’s City Energy Efficiency Economic Response Program accounted for 63% of annual
energy savings, or 0.055 million kWh (net). This was a decrease of 81% or -0.236 kWh from
FY23 as most large-scale projects are now complete.
Redding utilizes the kWh equivalent (e-kWh) for therms saved when evaluating the total energy
savings. On the residential side, the Residential Electrification Rebates Program accounted for
32% of total annual energy savings for the year, or 0.028 million e-kWh. While participation is
still low, it has begun to increase. Furthermore, switching to a new administrative system to
manage the applications has significantly reduced administrative costs. Redding continues to
conduct marketing and outreach efforts to increase participation in the new electrification
programs.
During the reporting year, Redding developed the Residential Electrification Assistance Program
(REAP) to provide electrification upgrades at no-cost to income-qualified customers. The
program was implemented in July 2024. Therefore, energy savings from REAP will be reported
starting in FY 2025.
Commercial, Industrial & Agricultural Programs
Water Heaters – Deemed rebates for converting from fossil-fueled water heaters to heat pump
technology.
City Facilities Energy Efficiency – Funding from C&T auction proceeds provide updates to City of
Redding facilities, including lighting retrofits and upgrades to energy-efficient equipment.
Retrofit lighting projects are calculated using a custom calculator to determine savings based on
existing equipment, retrofit equipment, and hours of operation.
Residential Programs
Water Heater Electrification – Deemed rebates for converting from fossil-fueled water heaters
to heat pump technology.
Clothes Dryer Electrification – Deemed rebates for converting from fossil-fueled clothes dryers
to heat pump technology.
Single-Family New Construction Electrification – Deemed rebates for installing heat pump space
and water heating equipment (in lieu of fossil-fuel appliances) and Wi-Fi capable thermostats in
new construction single-family homes.
Complementary Programs
Low-Income Programs – Low-income assistance spending (through the CARES Program and
Residential Energy Discount) continues to be the second-largest area of our Public Benefits

Energy Efficiency in California’s Public Power Sector — 2025 A-186
Program expenditures. During FY 2024, rate discounts represented about $1.91 million, and
assistance programs represented about $0.05 million paid with public benefits funds. Low-
income programs have been most beneficial to a significant portion of our customer base that
has limited situational and/or financial means to participate in other energy efficiency
programs.
Electric Vehicle (EV) and Charging Infrastructure – Redding offers Transportation Electrification
(TE) vouchers towards the purchase or lease of electric vehicles or electric bikes (E-Bikes) for
low-income residential ratepayers, and DC fast chargers for commercial ratepayers through
Low Carbon Fuel Standard (LCFS) funding.
Residential Education – Redding offers a variety of in-home services through the Residential
Energy Advisor program. This includes guiding customers through the rebate programs while
educating them with energy-saving tips and discussing the benefits of electrification.
Commercial Education – Redding offers a variety of in-business services through the
Commercial Energy Advisor program. This includes guiding customers through the rebate
programs while educating them with energy-saving tips and discussing the benefits of
electrification.
Evaluation, Measurement & Verification Studies
The results of Redding EM&V reports are available on CMUA's website:
https://www.cmua.org/emv-reports.
In addition to these activities, rebate processing includes technical reviews on 100% of the
rebate applications submitted to ensure that projects align with program requirements.
Furthermore, REU performs pre- and post-field inspections on large projects that account for
the majority of savings.
Major Differences or Diversions from CA POU TRM for Energy Savings
For the vast amount of its energy efficiency programs, REU uses the eTRM standard measures
as constructed within the Energy Services Platform’s (ESP) reporting tool. For REU’s unique
programs (City Energy Efficiency Economic Response Plan), REU used the custom measure
feature in ESP to represent the energy and demand impacts of those programs. REU utilizes a
custom calculation for lighting retrofit projects in the City Energy Efficiency programs.
Energy Efficiency in California’s Public Power Sector — 2025 A-187
TABLE REU-1. Energy Efficiency Program Results by End Use
Summary by End Use
Resource Savings Summary
Cost Test Results
End Use
Gross Peak
Savings (kW)
Gross Annual
Energy Savings
(kWh)
Gross Lifecycle
Energy Savings
(kWh)
Net Peak
Savings (kW)
Net Annual
Energy Savings
(kWh)
Net Lifecycle
Energy Savings
(kWh)
Net Lifecycle GHG
Reductions (Tons)
Total Utility
Cost
PAC
TRC
Utility
($/kWh)
Lighting - Indoor
8
55,383
830,745
8
55,383
830,745
279
$155,790
0.44
0.80
0.215
Energy Efficiency
8
55,383
830,745
8
55,383
830,745
279
$155,790
0.44
0.80
0.215
HVAC - Heat Pump
1
2,676
40,139
1
2,542
38,132
10
$28,526
0.11
0.09
0.856
Service & Domestic Hot Water
-0
29,904
299,040
-0
29,791
297,910
42
$100,560
0.22
0.21
0.368
Electrification
0
32,580
339,179
0
32,333
336,043
52
$129,086
0.19
0.18
0.421
EE, Low Income and Electrification
8
87,963
1,169,924
8
87,716
1,166,788
332
$284,876
0.33
0.42
0.276
C&S and T&D
$0
Utility Total
8
87,963
1,169,924
8
87,716
1,166,788
332
$284,876
0.33
0.42
0.276

Energy Efficiency in California’s Public Power Sector — 2025 A-188
TABLE REU-2. Energy Efficiency Program Results by Sector
Summary by Sector
Resource Savings Summary
Cost Test Results
Sector
Gross Peak
Savings (kW)
Gross Annual
Energy Savings
(kWh)
Gross Lifecycle
Energy Savings
(kWh)
Net Peak
Savings (kW)
Net Annual
Energy Savings
(kWh)
Net Lifecycle
Energy Savings
(kWh)
Net Lifecycle GHG
Reductions (Tons)
Total Utility
Cost
PAC
TRC
Utility
($/kWh)
Commercial
8
55,383
830,745
8
55,383
830,745
279
$155,790
0.44
0.80
0.215
Energy Efficiency
8
55,383
830,745
8
55,383
830,745
279
$155,790
0.44
0.80
0.215
Residential
0
32,580
339,179
0
32,333
336,043
52
$129,086
0.19
0.18
0.421
Electrification
0
32,580
339,179
0
32,333
336,043
52
$129,086
0.19
0.18
0.421
EE, Low Income and Electrification
8
87,963
1,169,924
8
87,716
1,166,788
332
$284,876
0.33
0.42
0.276
C&S and T&D
$0
Utility Total
8
87,963
1,169,924
8
87,716
1,166,788
332
$284,876
0.33
0.42
0.276
Energy Efficiency in California’s Public Power Sector — 2025 A-189
TABLE REU-3. Energy Efficiency Program Results by Building Type
Summary by Building Type
Resource Savings Summary
Cost Test Results
Building Type
Gross Peak
Savings (kW)
Gross Annual
Energy Savings
(kWh)
Gross Lifecycle
Energy Savings
(kWh)
Net Peak
Savings (kW)
Net Annual
Energy Savings
(kWh)
Net Lifecycle
Energy Savings
(kWh)
Net Lifecycle GHG
Reductions (Tons)
Total Utility
Cost
PAC
TRC
Utility
($/kWh)
Other Commercial
8
55,383
830,745
8
55,383
830,745
279
$155,790
0.44
0.80
0.215
Energy Efficiency
8
55,383
830,745
8
55,383
830,745
279
$155,790
0.44
0.80
0.215
Multiple
0
32,580
339,179
0
32,333
336,043
52
$129,086
0.19
0.18
0.421
Electrification
0
32,580
339,179
0
32,333
336,043
52
$129,086
0.19
0.18
0.421
EE, Low Income and Electrification
8
87,963
1,169,924
8
87,716
1,166,788
332
$284,876
0.33
0.42
0.276
C&S and T&D
$0
Utility Total
8
87,963
1,169,924
8
87,716
1,166,788
332
$284,876
0.33
0.42
0.276

Energy Efficiency in California’s Public Power Sector — 2025 A-190
RIVERSIDE PUBLIC UTILITIES
Riverside Public Utilities at a Glance
• Climate Zone: 10
• Customers: 113,082
• Total annual retail sales: 2,064,551 MWh
• Annual Retail Revenue: $352,501,989
• Annual energy efficiency expenditures for reporting year: $7,144,896
• Gross annual savings from reporting year portfolio: 12,696 MWh
Riverside Overview
Riverside Public Utilities (RPU) has been providing efficient, reliable water and electric services
throughout the city since 1895. RPU is committed to providing the highest quality services at
the lowest possible rates to benefit customers and the community.
RPU continues to help customers manage their energy use through a comprehensive range of
education, rebates and incentives. In FY 2024, RPU reached 57% of its kWh savings goal of 1%
of retail sales as adopted by the Board of Public Utilities in 2021.
Residential, 3,862
Commercial, 8,399
Low Income, 435
Gross Energy Savings (MWh)
Residential Commercial Industrial Agricultural Other Low Income T&D Electrification

Energy Efficiency in California’s Public Power Sector — 2025 A-191
Major Program and Portfolio Changes
RPU continues to enhance and expand its energy efficiency program portfolio for the benefit of
its customers and the community. Staff regularly review the program portfolio and make
changes to the rebates and incentives as needed. Since 2020, RPU has developed new and
enhanced programs for both commercial and residential customers. This has led to an increase
in program participation and resulted in increased energy savings being realized.
Throughout FY 2024, RPU enhanced the program offer via the Tree Power Program,
Commercial Outdoor Lighting program, and the Small Business Direct install programs.
Beginning FY 2024, RPU implemented some enhancements to the existing Energy Savings
Assistance Program (ESAP) with Southern California Gas Co., expanding the program to include
refrigerator replacement and whole house fans at no cost to qualifying customers.
Program and Portfolio Highlights
RPU has focused considerable attention on further developing commercial programs.
Commercial customers represent almost 12% of the customer base, but account for
approximately 65% of the City’s load. In FY 2024 RPU entered a second year of the Medium and
Large Business Outdoor Lighting Program, Small Business Direct Installation Program, and Small
Business Refrigerator Load Program.
Commercial, Industrial & Agricultural Programs
• Air Conditioning Incentives – Rebates for replacement of energy inefficient AC units.
• Business Outdoor Lighting Program – Program provides direct installation for medium
and large business with outdoor lighting conversion to efficient LED.
• Key Account Energy Efficiency Program (KEEP) – Program targeting RPU’s largest Time of
Use Customers and includes the top 300 RPU customers in terms of consumption. KEEP
is intended to provide Key Account customers with a comprehensive energy efficiency
plan including a priority list of recommended energy efficiency measures along with an
estimated return on investment and applicable utility incentives.
• LEED New Construction – Rebate for LEED certification for new buildings and major
renovations.
• Lighting Incentive – Rebates for kWh savings on installation of more energy efficient
lighting and controls.
• Performance Based Incentive – Rebates for customers who can demonstrate a kWh
savings based on custom energy-efficiency measures.

Energy Efficiency in California’s Public Power Sector — 2025 A-192
• Refrigerator Load Program - Program offers the direct installation of energy efficiency
measures such as air curtains, cooler gaskets, automatic door closures, LED case lighting
retrofits and high-efficiency motor upgrades.
• Small Business Direct Install Program (SBDI) - Program provides small and medium-sized
businesses with energy audits, and direct installation of energy efficiency measures such
as lighting upgrades and controls, HVAC tune-ups, exit and open/closed signs, advanced
power strips and weatherization.
• Weatherization – Rebates for installation of insulation, window film and cool roofs.
Residential Programs
• Air Conditioning Incentives – Rebates for replacing Central Air Conditioners with a SEER
rating of 15 above and HVAC tune-up.
• Appliance Recycling – Free recycling service for old inefficient refrigerators and freezers.
• Energy Savings Assistance Program (ESAP) – Direct installation program targeting low-
income customers, offered in partnership and cooperation with SCGC. Measures include
lighting efficiency upgrades, HVAC tune-ups, smart power strips, and refrigerator
recycling (low-income assistance, Res Lighting, Res Cooling, Res Refrigeration).
• Energy Star Appliances – Rebates for purchase of Energy Star-rated refrigerators,
dishwashers, clothes washers, room air conditioners, ceiling fans, and televisions.
• Heat Pumps – New rebate to residential electric customers when they purchase and
install new energy-efficient heat pumps.
• Pool Saver – Rebates for purchase and installation of high efficiency, variable speed, or
multi-flow pool pump motors.
• Tree Power – Rebates for purchasing and planting of up to five qualifying shade trees
per year and one free qualifying shade tree coupon printed on the March back of the
bill.
• Weatherization – Rebates for installing attic insulation or wall insulation, standard
rebates for duct replacement, duct testing/sealing, window film, solar and standard attic
fans, whole house fans, and cool roofs.
Complementary Programs
• SHARE – This low-income assistance program credits $250 toward the electric deposit or
as an emergency payment on delinquent balances and/ or assists with a $16 monthly bill
payment and beginning January 1st, 2024, the monthly credit was increased to $20 to
offset the rate increase for qualified low-income applicants annually
• Energy Savings Assistance Program (ESAP) - In partnership with SoCal Gas, ESAP is
designed to help lower monthly bills to income-qualified renters and homeowners,
making homes more energy efficient through professional no-cost energy-saving home
improvements by RPU's authorized contractor Synergy. Participation of ESAP for FY
2024 was 367 with 4,874 different EE measures installed.

Energy Efficiency in California’s Public Power Sector — 2025 A-193
• Pool Pump Timer Credit Load Shift Program – This program offers a bill credit of $5 per
month for customers who agree to install and program their residential pool pump
timer so that the pump operates only during off-peak hours.
Evaluation, Measurement & Verification Studies
RPU is committed to providing cost-effective, ongoing evaluation, measurement, and
verification (EM&V) efforts for its energy efficiency programs. EM&V costs are covered in the
individual program budgets.
In addition to periodic program audits, RPU consistently performs the following in support of
EM&V activities:
• An onsite inspection rate of a selection of randomly selected residential program
participants, performed by RPU staff and contractors.
• A pre-and post-inspection of 100% of large commercial rebate participants, including a
review of historical energy usage, energy-saving calculations, and post-measure bill
analysis.
• Audits and installations performed by third-party contractors for RPU direct installation
programs have high inspection rates that are performed by both the contractor and RPU
staff.
• Refrigerator recycling program administered by A&G Recycling Angels assures full
inspection when the contractor picks up old appliances.

Energy Efficiency in California’s Public Power Sector — 2025 A-194
TABLE RPU-1. Energy Efficiency Program Results by End Use
Summary by End Use
Resource Savings Summary
Cost Test Results
End Use
Gross Peak
Savings (kW)
Gross Annual
Energy Savings
(kWh)
Gross Lifecycle
Energy Savings
(kWh)
Net Peak
Savings (kW)
Net Annual
Energy Savings
(kWh)
Net Lifecycle
Energy Savings
(kWh)
Net Lifecycle GHG
Reductions (Tons)
Total Utility
Cost
PAC
TRC
Utility
($/kWh)
Any
0
2,070,068
20,700,684
0
2,070,068
20,700,684
6,916
$335,406
7.03
9.56
0.020
Appliance & Plug Loads
241
874,538
5,224,956
229
829,256
4,948,015
1,818
$248,920
2.44
8.24
0.057
Building Envelope
175
192,465
3,557,903
159
175,207
3,231,945
1,229
$148,957
4.58
8.81
0.066
Commercial Refrigeration
0
116,984
1,359,252
0
116,984
1,359,252
485
$159,873
0.94
9.56
0.148
HVAC - Cooling
2,311
4,306,156
95,791,775
1,942
3,330,556
71,801,263
26,292
$2,198,098
5.91
8.42
0.047
Lighting - Indoor
2
415,233
4,177,098
2
415,233
4,177,098
1,395
$89,599
5.30
9.56
0.026
Lighting - Outdoor
0
1,372,825
13,728,250
0
1,372,825
13,728,250
6,432
$1,029,220
1.51
9.56
0.091
Miscellaneous
2
2,354,229
22,439,137
2
2,354,007
22,438,249
7,634
$2,319,499
1.09
9.55
0.125
Service & Domestic Hot Water
0
5,956
60,628
0
5,658
57,597
20
$2,067
2.85
8.56
0.044
Whole Building
0
552,494
8,287,410
0
552,494
8,287,410
2,936
$163,096
5.68
9.56
0.026
Energy Efficiency
2,732
12,260,949
175,327,094
2,334
11,222,289
150,729,763
55,156
$6,694,735
3.32
8.80
0.060
Appliance & Plug Loads
12,288
122,880
12,288
122,880
44
$24,591
0.67
9.56
0.242
Building Envelope
0
62,355
1,247,100
0
62,355
1,247,100
472
$146,321
1.96
9.56
0.173
HVAC - Cooling
0
186,806
2,493,777
0
186,806
2,493,777
949
$209,927
2.14
9.56
0.110
Lighting - Indoor
0
173,153
2,597,295
0
173,153
2,597,295
981
$69,322
4.22
9.56
0.036
Low-Income
0
434,602
6,461,052
0
434,602
6,461,052
2,446
$450,161
2.32
9.56
0.094
EE, Low Income and Electrification
2,732
12,695,551
181,788,146
2,334
11,656,891
157,190,815
57,602
$7,144,896
3.26
8.83
0.062
C&S and T&D
$0
Utility Total
2,732
12,695,551
181,788,146
2,334
11,656,891
157,190,815
57,602
$7,144,896
3.26
8.83
0.062

Energy Efficiency in California’s Public Power Sector — 2025 A-195
TABLE RPU-2. Energy Efficiency Program Results by Sector
Summary by Sector
Resource Savings Summary
Cost Test Results
Sector
Gross Peak
Savings (kW)
Gross Annual
Energy Savings
(kWh)
Gross Lifecycle
Energy Savings
(kWh)
Net Peak
Savings (kW)
Net Annual
Energy Savings
(kWh)
Net Lifecycle
Energy Savings
(kWh)
Net Lifecycle GHG
Reductions (Tons)
Total Utility
Cost
PAC
TRC
Utility
($/kWh)
Commercial
1,393
8,398,770
93,711,419
1,246
8,200,225
90,603,173
32,042
$4,086,481
2.49
9.29
0.056
Residential
1,338
3,862,179
81,615,675
1,088
3,022,064
60,126,589
23,114
$2,608,254
4.63
8.43
0.068
Energy Efficiency
2,732
12,260,949
175,327,094
2,334
11,222,289
150,729,763
55,156
$6,694,735
3.32
8.80
0.060
Residential
0
434,602
6,461,052
0
434,602
6,461,052
2,446
$450,161
2.32
9.56
0.094
Low-Income
0
434,602
6,461,052
0
434,602
6,461,052
2,446
$450,161
2.32
9.56
0.094
EE, Low Income and Electrification
2,732
12,695,551
181,788,146
2,334
11,656,891
157,190,815
57,602
$7,144,896
3.26
8.83
0.062
C&S and T&D
$0
Utility Total
2,732
12,695,551
181,788,146
2,334
11,656,891
157,190,815
57,602
$7,144,896
3.26
8.83
0.062
Energy Efficiency in California’s Public Power Sector — 2025 A-196
TABLE RPU-3. Energy Efficiency Program Results by Building Type
Summary by Building Type
Resource Savings Summary
Cost Test Results
Building Type
Gross Peak
Savings (kW)
Gross Annual
Energy Savings
(kWh)
Gross Lifecycle
Energy Savings
(kWh)
Net Peak
Savings (kW)
Net Annual
Energy Savings
(kWh)
Net Lifecycle
Energy Savings
(kWh)
Net Lifecycle GHG
Reductions (Tons)
Total Utility
Cost
PAC
TRC
Utility
($/kWh)
Any
1,393
6,573,878
76,705,467
1,246
6,375,333
73,597,222
26,262
$2,655,990
3.11
9.23
0.045
Other Commercial
0
1,883,609
17,769,261
0
1,883,609
17,769,261
6,058
$1,802,219
1.11
9.56
0.122
Residential
1,338
3,803,463
80,852,366
1,088
2,963,348
59,363,280
22,837
$2,236,525
5.36
8.42
0.060
Energy Efficiency
2,732
12,260,949
175,327,094
2,334
11,222,289
150,729,763
55,156
$6,694,735
3.32
8.80
0.060
Residential
0
434,602
6,461,052
0
434,602
6,461,052
2,446
$450,161
2.32
9.56
0.094
Low-Income
0
434,602
6,461,052
0
434,602
6,461,052
2,446
$450,161
2.32
9.56
0.094
EE, Low Income and Electrification
2,732
12,695,551
181,788,146
2,334
11,656,891
157,190,815
57,602
$7,144,896
3.26
8.83
0.062
C&S and T&D
$0
Utility Total
2,732
12,695,551
181,788,146
2,334
11,656,891
157,190,815
57,602
$7,144,896
3.26
8.83
0.062

Energy Efficiency in California’s Public Power Sector — 2025 A-197
ROSEVILLE ELECTRIC UTILITY
Roseville Electric Utility at a Glance
• Climate Zone: 11
• Customers: 69,178
• Total annual retail sales: 1,162,275 MWh
• Annual Retail Revenue: $189,988,393
• Annual energy efficiency expenditures for reporting year: $3,324,682
• Gross annual savings from reporting year portfolio: 16,365 MWh
Roseville Electric Utility Overview
The City of Roseville is a summer peaking utility located in climate zone 11 and forecast zone 4.
Summers are hot and include several days over 100 degrees. Winters are mild with daily highs
often in the 50s and 60s, and overnight lows only occasionally dropping into the 30s, but rarely
below 32 degrees.
Roseville is the largest and fastest growing city in Placer County, and significantly influences the
economy as the retail destination and healthcare hub for the Sacramento region.
Residential, 13,401
Commercial, 1,012
Electrification,
1,952
Gross Energy Savings (MWh)
Residential Commercial Industrial Agricultural Other Low Income T&D Electrification
Energy Efficiency in California’s Public Power Sector — 2025 A-198
Municipal owned Roseville Electric Utility offers affordable electric rates and reliable power to
61,882 residential accounts and 7,305 commercial accounts.
In FY 2024 Roseville issued new construction permits for 1,259 single family homes, 337
multifamily units and 30 commercial buildings. While issued permits for multifamily new
construction were less than half of last year’s, there is an anticipation of substantially increased
multifamily new construction permits in the coming years due incentives in fee deferrals for
affordable housing projects as well as SB 937 fee deferrals.
Development of industrial land has increased and vacancy rates are at a historic low of 1.6
percent. Commercial development has also increased primarily related to the construction of
restaurants, retail space, and other personal service uses. Office space vacancy is up from the
previous year at 13.5%.
The median household income in Roseville has risen to $111,466. Over 96% percent of Roseville
residents over age 25 have a high school diploma, and 47% of residents over 25 have obtained a
Bachelor’s degree or higher.
Roseville aims to provide a broad portfolio of programs for both residential and commercial
customers to allow for high engagement in energy efficiency installations and behavior
throughout the customer base. Roseville makes concerted efforts to rebate products that will
mitigate high energy usage during the summer months, which is when our customers are most
likely to experience higher bills.
Roseville’s customer base has embraced new technology such as smart thermostats, heat pump
HVACs, Heat Pump Water Heaters, and Electric Vehicles. Interest in rooftop solar remains high
amongst our customers.
In FY 2024, Roseville’s rebate offerings were successful in garnering the participation necessary
to exceed its gross energy efficiency targets. Although these targets were met this year,
Roseville has seen a decline in participation and energy savings gained from many of its long-
standing energy efficiency offerings. In recent years Roseville has been particularly successful in
promoting all-electric homes for new construction. FY24 reporting will not reflect the full
continued investment in this area because of the delays seen in construction. The majority of
projects set to complete in the FY24 year were delayed and thus we will be presenting those
investments and energy savings next reporting cycle in FY25. This, as well as reduced
participation in commercial rebate programs, are the main factors accounting for a decrease in
energy savings and spending between this reporting cycle and our last.
In addition to energy efficiency goals, Roseville has maintained a focus of assisting low income
customers through rate assistance. Rate Assistance participants receive a $15 credit on their
monthly base charge. In addition, Roseville’s Low Income Rate Discount was increased from
15% to a 20% discount in June 2024. This increased assistance for low income customers was
enacted to mitigate the impact of our most recent rate adjustment as well as general economic

Energy Efficiency in California’s Public Power Sector — 2025 A-199
inflation and cost of living increases. Income eligibility has been maintained at the level of
200% of the Federal Poverty Level. Roseville Electric Utility also offers a specialized rate for
those who qualify for Medical Rate Assistance. In addition to the $15 credit towards the
monthly base charge, Medical Rate participants receive a 50% discount on their first 500 kWh
and a 20% discount on all other kWh usage. Although Roseville implemented a temporary 8%
energy cost surcharge between February 2023 and December 2024, Roseville has been able to
cover the cost of this surcharge for all customers enrolled in rate assistance. In addition to
increasing rate assistance benefits, Roseville has made concerted efforts to increase rate
assistance enrollment by increasing general outreach, streamlining application processes,
increasing time limits before reapplication is required, and creating less burdensome routes for
providing proof of income. Roseville now allows qualification through providing evidence of
concurrent enrollment in either CalFresh, SNAP, TANF, CAPI, or Section 8 housing. Roseville’s
enhanced focus on assisting Low Income and Medical Rate customers through rate assistance
has resulted in a 38% increase in rate assistance expenditures compared to FY2022 levels and
this is expected to continue to rise in the coming years.
Major Program and Portfolio Changes
In FY23 Roseville made historic investment reservations for all-electric new construction homes
that were scheduled to be paid out in FY24. The level of interest and pace of reservations in this
program far exceeded expectation. Although the majority of these expenditures ended up
being delayed to FY25, Roseville’s FY24 incentive levels included strategies to invest in all-
electric homes by shifting funding away from other measures for a set period of time. Due to
this, as well as other market factors, at mid-year Roseville experimented with reduced
incentives and incentive caps on select programs where current market information pointed
towards lower incentives being sufficient. In some cases, these reduced incentives did not
significantly affect participation; however, in other programs, incentive changes did result in
reduced participation. For many of the programs with reduced participation, it is not clear how
much the incentive drops were responsible verses the decline being part of a trend already
underway of a multi-year reduction in participation due to the incentivized products already
having reached significant market saturation. Increased interest rates in the commercial lending
market may have also contributed to this decline.
Roseville’s incentive strategy for the next reporting cycle of FY25 will include returning some
offerings to their previous incentive levels.
Focus on Electrification – Success in Residential – Commercial Market Remains Uninterested:
While electrification offerings continued to be prominent within our residential sector, our
transition to promoting only electrification in the commercial sector was not nearly as
successful. In FY24 Roseville was only able to capture one, although large, commercial
electrification project. Interest in commercial electrification is low as customers are seeing that
the additional inspections that these projects trigger, as well as the overall project costs and

Energy Efficiency in California’s Public Power Sector — 2025 A-200
expected appliance performance, does not yet match the typical project budget constraints or
specific needs for commercial buildings.
In order to capture any significant commercial HVAC related energy savings opportunities in the
coming years, Roseville believes it must allow technology offerings outside of exclusively
electrification.
Changes in Electrification Reporting:
In previous years, Roseville reported electrification savings in terms of kWh exclusively, taking
the gas savings in therms, converting these to their kWh equivalent and then subtracting the
kWh of the added electric load to get the total net kWh savings reported for a measure. This
was done knowing that these energy savings should be displayed as a kWh to count towards
Roseville’s energy savings targets. For this reporting cycle, publicly owned utilities worked on an
enhancement within the ESP reporting tool allowing us to report the negative kWh for added
electric load, saving in terms of gas therms, while also displaying net savings in terms of
equivalent kWh. Cost effectiveness metrics and bill savings are now able to use the information
from both gas and electric rates, and gas and electric avoided costs.
Reduction in Commercial Lighting:
Beginning in FY23, stricter permitting requirements were enacted for commercial lighting
projects. This seems to have continued to dampen commercial interest in participating in these
rebate projects. Additionally, Roseville is evaluating if the decline in participation is also due to
having reached a higher saturation in commercial buildings that have already transitioned to
LEDs. While commercial LED retrofits were still the most significant contributor to energy
savings gained in our commercial sector, for the broader portfolio the reduced opportunities in
investment have meant that commercial lighting represented only 6% of Roseville total gross
annual energy Savings in FY24.
Overall Commercial Participation Reduction:
Decline in commercial rebate program participation was not limited to just Roseville’s lighting
offering in FY24. In general, Roseville has seen the financial climate, including higher interest
rates, reducing the appetite for commercial customers to make large investments in energy
efficiency. Additionally, Roseville’s Commercial Custom program has been a cornerstone of the
commercial offerings in past years, but did not gain any participation in FY24. Additionally,
several reserved projects were canceled due to a major participant’s company acquisition and
rebuild.
Program and Portfolio Highlights
Home Energy Reports – Highest Performer and Most Cost Effective:
Residential Home Energy Reports continue to be the largest contributor to Roseville’s annual
kWh savings having captured more annual kWh savings than all other rebate programs

Energy Efficiency in California’s Public Power Sector — 2025 A-201
combined, at 12.5 GWh and 77% of Roseville’s total portfolio. Not only has this program
continued to achieve the highest savings, but it has also remained as the most cost effective
program in Roseville’s portfolio. While the program is still the most influential in the portfolio
by far, the height of the savings may not be consistently obtainable in years to come. FY24’s
energy savings showed a 10% drop from the previous year and savings have continued to
decline after the end of the FY.
Tune Ups and Smart Thermostats Produce High Residential Engagement:
Our HVAC Tune Up and Smart Thermostat offerings continue to drive the most engagement
with our residential customers in terms of rebate offerings. In FY 2024 we were able to rebate
1,133 HVAC tune ups and 720 Smart Thermostats. While this participation is significant, it does
represent a decline from the previous year, most significantly in the case of smart thermostats
which declined by 23%.
Progress in Residential Retrofit Electrification:
Residential Electrification continued to show high participation in FY24 and contributed to
almost 2 GWh in energy savings. Participation in Residential Heat Pump HVAC retrofits
increased by 27%, despite incentive offerings that were lower than the previous year. Heat
Pump Water Heater Transitions were just 4% behind last year, with most of the participation
being concentrated during times that stackable incentives were available through both TECH
Clean California and Roseville. After TECH Clean’s Water Heater Program ended, participation in
Roseville’s program sharply dropped, as significant incentives are required for a project that can
be about two to ten times the cost of a traditional gas water heater replacement. The number
of folks participating in induction cooktops grew 24% from FY23, and while there is minimal
interest in Heat Pump Dryers, participation grew significantly in FY24. To support electrification,
Roseville has continued to offer incentives on panel replacements. In FY24, participation in this
offering was half of what it was the previous year, despite overall increases in electrification. It
is possible that this decline is due to increased contractor education where methods for
avoiding panel replacement projects are becoming more widely understood.
Commercial, Industrial & Agricultural Programs
Commercial LED and Other Lighting: Offers business customers a wide variety of energy
efficient LED interior and exterior LED lighting retrofits and control options for updating their
facilities.
Commercial HVAC: Includes package and split system retrofits, smart thermostats and HVAC
tune ups. Offerings also included incentives for all electric systems.

Energy Efficiency in California’s Public Power Sector — 2025 A-202
Commercial Custom: Customer driven rebate option targets projects that reduce peak loads
and energy consumption and offers unlimited energy efficiency technology opportunities for
the large and key account customers.
Residential Programs
Low-Income Rate Assistance: Roseville Electric assisted approximately 2,044 customers in rate
reduction for their utility bills in FY24. Additionally, Roseville works with local agencies and
supports the local LIHEAP program.
Residential Electrification: Rebate program offering incentives for fuel substitution including
transitions to Heat Pump HVACs, Heat Pump Water Heaters, Heat Pump Dryers and Induction
Cooktops. Incentives for Smart Thermostats are offered in conjunction with the HVAC
replacement and incentives for Panel Replacements are offered in order to make electrification
accessible.
Residential Electric to Electric Appliances: Rebate offerings for customers with traditional
electric HVACs/Furnaces, Water Heaters, Dryers, and Cooktops to switch to the energy efficient
heat pump version and efficient induction technology for cooktops.
Residential Whole House Fan: Program offering a rebate to customers installing a permanently
fixed 2000 cfm (or greater) whole house fan.
Residential Windows (Discontinued): Program for retrofit Windows must be Energy Star rated
with a U-value of .30 and an SHGC of .25 or less and bear the National Fenestration Rating
Council label. One residual project was completed in FY24.
Residential Home Energy Reports: Industry-recognized, contractor-managed energy efficiency
behavior program providing education, feedback and tips to residential customers.
Residential HVAC: Provides rebates performing annual HVAC tune-ups and installing smart
thermostats. While Traditional High Efficiency HVAC replacement offerings are no longer
available through this program, FY24 produced one residual non electrification HVAC
replacement.
Residential Shade Tree: Rebate program designed to incentivize and educate customers to
plant drought-tolerant shade trees to keep their home cool. A local urban forester recommends
trees. Energy efficiency savings for the trees was obtained from an EM&V performed in 2010.
Residential Pool Pump: Rebate program designed to incentivize customers to upgrade from a
single speed to a variable speed pool pump.
Residential New Construction: An all-electric home program for single family, multifamily and
accessory dwelling units offering incentives to builders. This program was designed to be
consistent with new construction programs from neighboring utilities. Offerings included All
Electric homes including Induction Cooktop Technology and All Electric Homes without

Energy Efficiency in California’s Public Power Sector — 2025 A-203
Induction Cooktops provided. Savings estimates are obtained from HERS energy reports and
reviewed by the third-party administrator. This program has been fully reserved through 2026.
Complementary Programs
Electric Vehicle Program:
Roseville Electric participates in California Air Resource Board’s (CARB) Low Carbon Fuel
Standard (LCFS) Program. Proceeds from the sale of LCFS credits go to fund electric vehicle
incentive programs. As the value of LCFS credits declined during 2024, this left our
transportation electrification programs with more limited funding compared to previous years.
In FY2024, Roseville’s residential LCFS program provided incentives for low income customers
to install a Level 2 charger. In the FY25 year residential offerings were added for ebikes,
including an increased incentive level for low income customers.
In addition to residential rebates, LCFS funding provided robust offerings for commercial
customers. By the beginning of FY24, all commercial funding was reserved but payouts upon
project completion occurred throughout the year. The commercial program included incentives
towards infrastructure upgrades, free EV site assessments upon request, incentives towards
electric vehicles, as well as Level 2 charging for workplaces and fleets. Additionally, incentives
towards DC fast charging were available for commercial nonprofit customers. Roseville
allocated a large portion of the LCFS funding this past FY to the public school system in the form
of incentives for electric school buses and charging infrastructure. Roseville has maintained a
focus on increasing equity enrollment in LCFS related projects.
Additionally, funding was used to promote electric vehicle adoption through outreach and
education.
In FY 2023, an update to the independent assessment of the potential impact of electric
vehicles to the City of Roseville Electric grid was completed for Roseville Electric Utility. This
report provided recommendations for a strategic approach to address the electrification of the
transportation industry. Roseville staff are using this report and other industry research to
identify opportunities for improvements and expansion of our existing EV program.
Community Solar:
Roseville introduced a 986 kW community solar project, Roseville Solective, to residential
households in March 2019. A portion of the program was set aside for low-income customers.
The project is funded by the participants and the energy contributes to the Utility’s RPS
requirements. The objective is to explore options for customers who rent or otherwise choose
not to install solar on their own homes.
Energy Efficiency in California’s Public Power Sector — 2025 A-204
Utility Exploration Center reimagined:
For nearly 16 years, the Roseville Utility Exploration Center (UEC) has been a learning haven for
thousands of community members eager to learn about the world of utility systems. Whether
navigating through a colossal trash pile or cranking a hand generator to understand electric
demands, thousands of visitors have cherished unique experiences. After two years of planning
and construction, the UEC has undergone a complete overhaul and is now fully reimagined for
the next decade and more. The 3,000-square-foot museum has been redefined with mind-
blowing exhibits and unparalleled exploration opportunities.
Prepare for a fusion of high-tech and low-tech elements within the refreshed exhibit hall.
Highlights include encounters with a real garbage truck, engaging in hands-on waste sorting
activities aligned with Placer County's recycling practices, delving into the fascinating realm of
wastewater-cleaning microbes, and uncovering innovative approaches to delivering electricity
to homes with minimal environmental impact.
Over 1,000 visitors helped us reopen the Utility Exploration Center on April 6th to celebrate all
the hard work that went into this refresh. 16,000+ visitors continued to pour in April, May and
June, 78% increase compared to the previous year. This investment in our community will help
ensure that the UEC stays at the leading edge of utility education and community engagement.
The Utility Exploration Center developed targeted education and outreach programs for all age
ranges and hosts regionally attended special events.
Age Specific Programming Includes:
• STEM Story Time for Preschoolers (1,066 attendees) – Offering stories and activities that
highlight the work done by Electric employees and ways for residents to partner in
conservation.
• Kindergarten and 1st grade field trips exploring energy efficiency (1,018 students and
300 adults chaperones)
• League of Explorers for 7-11 year olds, including electric themed monthly take home kits
and in-person science experiments. (477 3rd-5th grade students)
• 4th Grade class visits, and traveling trunks including information on renewable energy
and conducting energy audits. (50 teachers and 1,354 students)
• 8th Grade energy efficiency school and home investigation program and community
energy efficiency video contest. (782 students)
• Electric Field day for High schoolers exploring how the Electric Utility operates and the
career paths available to pursue (75 students)
• High school students toured the Roseville energy park including operations of a natural
gas power plant to explore real world applications of the concepts they learn in school.
(167 students)

Energy Efficiency in California’s Public Power Sector — 2025 A-205
• Adult learners participated in hands on workshops covering topics such as solar, electric
vehicles, whole home electrification and shade tree care. (182 attendees)
Community Events include:
• Big Truck Summer – Residents watch demonstrations and get to meet Roseville Electric
lineworkers who highlight the amazing work they do every day to make sure energy
flows throughout the City. (900 attendees)
• Earth Night – Families join our utilities to enjoy an evening celebrating our sustainability
initiatives throughout the City and learning how they can work with us to conserve our
resources for the future. (830 attendees)
In partnership with our Utility Exploration Center, Roseville also offered education workshops
for adults both in person and online with topics such as solar, HVAC replacements, Water
Heater replacements, electric vehicles and whole home electrification.
Evaluation, Measurement & Verification Studies
Because Roseville’s energy efficiency programs have had EM&Vs conducted within the last few
years, and because our programs have not changed in design, we opted to not EM&V any
programs during FY 2024. We plan to EM&V our electrification programs in the near future.
Selection of the programs to review is prioritized by the dollars spent and savings claimed for
the program or when a provisional or custom measure is introduced to our customers.
The budget for pre- and post-EM&V is determined by the program selected for review, and can
vary from $20,000 up to $150,000. The budget depends on the extent of field measurement or
customer surveys required to evaluate the program within the guidelines established by the
California Energy Commission.
All third-party EM&V and M&V reports are published on CMUA’s website under resources in
the document library.
Recent Reports include:
• EM&V- Residential Home Energy Reports (2019)
• EM&V-Commercial Exterior Lighting (2017)
• EM&V- Residential HVAC, Pool Pump, Whole House Fan and Sunscreen (2016)
• M&V- Smart Thermostats (2018)
• M&V- HVAC Tune Ups (2018)
Major Differences or Diversions from CA POU TRM for Energy Savings
Roseville Electric's avoided costs are entered into the ESP reporting model and are calculated
based on energy prices, transmission losses and distribution losses. All modeling is performed
using these costs.
Energy Efficiency in California’s Public Power Sector — 2025 A-206
Roseville Electric relies on the savings documented in the POU TRM. If not available, the
measure is entered to the ESP reporting model as a custom measure. When a custom program
is entered, the source of energy savings is documented as coming from an industry approved
method (Energy Reports), a published industry white paper or published EM&V. HERS reports
are provided by Builders for new construction programs and reviewed by a third party
consultant. Some measures utilize calculation for watts reduction with calculations for kW and
kWh performed with standard industry hours of use data. Savings calculations for residential
electrification were produced by a custom study completed for Roseville Electric by Energeia in
2020. Savings for commercial electrification was provided by a custom calculator developed by
DNV specifically for Roseville Electric Utility, but utilizing eTRM data.

Energy Efficiency in California’s Public Power Sector — 2025 A-207
TABLE Roseville-1. Energy Efficiency Program Results by End Use
Summary by End Use
Resource Savings Summary
Cost Test Results
End Use
Gross Peak
Savings (kW)
Gross Annual
Energy Savings
(kWh)
Gross Lifecycle
Energy Savings
(kWh)
Net Peak
Savings (kW)
Net Annual
Energy Savings
(kWh)
Net Lifecycle
Energy Savings
(kWh)
Net Lifecycle GHG
Reductions (Tons)
Total Utility
Cost
PAC
TRC
Utility
($/kWh)
Appliance & Plug Loads
0
4,618
65,923
0
3,918
55,421
5
$15,287
0.25
0.13
0.357
HVAC - Heat Pump
1
1,595,094
23,926,408
1
1,541,315
23,119,729
3,983
$1,420,730
1.13
0.69
0.081
Service & Domestic Hot Water
0
352,637
5,289,548
0
352,637
5,289,548
757
$307,832
1.25
0.87
0.076
Electrification
1
1,952,349
29,281,879
1
1,897,870
28,464,698
4,745
$1,743,848
1.14
0.71
0.080
Appliance & Plug Loads
28
59,652
601,640
27
36,710
372,084
109
$32,069
0.83
0.33
0.103
BROs
0
12,509,997
12,509,997
0
8,256,598
8,256,598
3,348
$589,443
1.00
1.00
0.071
Building Envelope
1
157,707
3,154,136
1
79,241
1,584,827
743
$112,753
1.14
1.38
0.102
HVAC - Cooling
10
742,113
4,955,653
9
679,270
4,559,572
2,054
$394,446
1.11
0.95
0.103
HVAC - Heat Pump
1
7,125
106,875
1
5,700
85,500
38
$14,394
0.50
0.11
0.221
Lighting - Indoor
133
488,306
5,371,366
120
439,475
4,834,229
1,635
$216,507
1.59
1.48
0.055
Lighting - Outdoor
146
445,113
4,896,243
131
400,602
4,406,619
2,030
$218,945
1.44
1.55
0.061
Service & Domestic Hot Water
0
2,350
35,250
0
1,880
28,200
13
$2,278
1.04
0.55
0.106
Energy Efficiency
320
14,412,363
31,631,160
289
9,899,476
24,127,629
9,969
$1,580,834
1.17
1.07
0.075
EE, Low Income and Electrification
321
16,364,712
60,913,039
290
11,797,347
52,592,327
14,714
$3,324,682
1.15
0.85
0.078
C&S and T&D
$0
Utility Total
321
16,364,712
60,913,039
290
11,797,347
52,592,327
14,714
$3,324,682
1.15
0.85
0.078

Energy Efficiency in California’s Public Power Sector — 2025 A-208
TABLE Roseville-2. Energy Efficiency Program Results by Sector
Summary by Sector
Resource Savings Summary
Cost Test Results
Sector
Gross Peak
Savings (kW)
Gross Annual
Energy Savings
(kWh)
Gross Lifecycle
Energy Savings
(kWh)
Net Peak
Savings (kW)
Net Annual
Energy Savings
(kWh)
Net Lifecycle
Energy Savings
(kWh)
Net Lifecycle GHG
Reductions (Tons)
Total Utility
Cost
PAC
TRC
Utility
($/kWh)
Commercial
1
29,216
438,239
1
29,216
438,239
78
$25,934
1.19
0.65
0.078
Residential
0
1,923,133
28,843,640
0
1,868,654
28,026,459
4,666
$1,717,914
1.14
0.72
0.080
Electrification
1
1,952,349
29,281,879
1
1,897,870
28,464,698
4,745
$1,743,848
1.14
0.71
0.080
Commercial
284
1,011,843
11,214,369
256
909,608
10,077,164
3,920
$497,289
1.45
1.46
0.060
Residential
36
13,400,520
20,416,791
33
8,989,869
14,050,465
6,049
$1,083,545
1.04
0.91
0.084
Energy Efficiency
320
14,412,363
31,631,160
289
9,899,476
24,127,629
9,969
$1,580,834
1.17
1.07
0.075
EE, Low Income and Electrification
321
16,364,712
60,913,039
290
11,797,347
52,592,327
14,714
$3,324,682
1.15
0.85
0.078
C&S and T&D
$0
Utility Total
321
16,364,712
60,913,039
290
11,797,347
52,592,327
14,714
$3,324,682
1.15
0.85
0.078

Energy Efficiency in California’s Public Power Sector — 2025 A-209
TABLE Roseville-3. Energy Efficiency Program Results by Building Type
Summary by Building Type
Resource Savings Summary
Cost Test Results
Building Type
Gross Peak
Savings (kW)
Gross Annual
Energy Savings
(kWh)
Gross Lifecycle
Energy Savings
(kWh)
Net Peak
Savings (kW)
Net Annual
Energy Savings
(kWh)
Net Lifecycle
Energy Savings
(kWh)
Net Lifecycle GHG
Reductions (Tons)
Total Utility
Cost
PAC
TRC
Utility
($/kWh)
Multiple
0
1,118
13,415
0
1,118
13,415
-0
$2,218
0.40
0.10
0.205
Other Commercial
1
29,216
438,239
1
29,216
438,239
78
$25,934
1.19
0.65
0.078
Residential - Single-Family
0
1,922,015
28,830,225
0
1,867,536
28,013,043
4,667
$1,715,696
1.14
0.72
0.080
Electrification
1
1,952,349
29,281,879
1
1,897,870
28,464,698
4,745
$1,743,848
1.14
0.71
0.080
Office - Small
2
3,024
45,360
1
2,570
38,556
12
$3,698
0.71
0.95
0.126
Other Commercial
283
1,008,819
11,169,009
254
907,037
10,038,608
3,908
$493,591
1.46
1.47
0.060
Residential
30
12,894,166
18,359,429
29
8,552,427
12,387,706
5,288
$917,717
1.05
1.02
0.080
Residential - Single-Family
5
506,355
2,057,362
4
437,442
1,662,759
762
$165,828
1.02
0.56
0.109
Energy Efficiency
320
14,412,363
31,631,160
289
9,899,476
24,127,629
9,969
$1,580,834
1.17
1.07
0.075
EE, Low Income and Electrification
321
16,364,712
60,913,039
290
11,797,347
52,592,327
14,714
$3,324,682
1.15
0.85
0.078
C&S and T&D
$0
Utility Total
321
16,364,712
60,913,039
290
11,797,347
52,592,327
14,714
$3,324,682
1.15
0.85
0.078

Energy Efficiency in California’s Public Power Sector — 2025 A-210
SACRAMENTO MUNICIPAL UTILITY DISTRICT
Sacramento Municipal Utility District at a Glance
• Climate Zone: 12
• Customers: 674,510
• Total annual retail sales: 10,721,201 MWh
• Annual Retail Revenue: $1,781,725,537
• Annual energy efficiency expenditures for reporting year: $55,561,769
• Gross annual savings from reporting year portfolio: 98,114 MWh
Notes on Methodology: Electrification is based on equivalent reported electrification savings in terms of
kWh exclusively, taking the gas savings in therms, converting these to their kWh equivalent and then
subtracting the kWh of the added electric load to get the total net kWh savings reported for a measure.
These calculations were completed using internal SMUD systems, outside of the ESP platform. Low
Income captures both energy efficiency and electrification measures.
Sacramento Municipal Utility District Overview
Sacramento Municipal Utility District (SMUD) is planning program changes to respond to the
following industry trends, utility direction and changing customer expectations:
• In July of 2020, the SMUD Board declared a climate emergency and set a goal of
delivering carbon neutral electricity by 2030.
Residential, 38,887
Commercial,
20,057
Low Income, 5,152
Electrification,
34,017
Gross Energy Savings (MWh)
Residential Commercial Industrial Agricultural Other Low Income T&D Electrification

Energy Efficiency in California’s Public Power Sector — 2025 A-211
• Diversity, Equity, Inclusion, and Belonging (DEIB) is a stated goal in SMUD culture. Many
of our programs have included Equity components to help insure Inclusion. In addition,
SMUD Board of Directors issued funding for a Community Impact Plan program offerings
to ensure equitable access to decarbonization offerings.
• Energy efficiency, building electrification, transportation electrification, solar and
storage will continue to converge toward complete energy solutions, customized to
meet the needs of the customer and the utility.
Major Program and Portfolio Changes
SMUD continued long-term reduction in the overall energy efficiency budget, with an ensuing
reduction in the energy and peak savings achieved in prior years. This was both a planned
reduction as SMUD’s focus shifted towards its 2030 Zero Carbon plan goals and a decrease in
commercial program activity resulting from economic conditions. Major program changes
include the following:
• Growing and scaling up residential and commercial load flexibility portfolio of programs,
including My Energy Optimizer™ (MEO) Partner (residential smart thermostats), MEO
Partner+ (residential battery storage), Peak Conserve™ (residential air conditioner
switch), and PowerDirect (commercial autoDR program).
• The Advanced Homes program conducted delivery coordination with the statewide
California TECH program, which provided incentives for heat pump water and space
heating conversions.
Program and Portfolio Highlights
On July 17, 2020, the SMUD Board of Directors adopted a climate emergency declaration. The
SMUD Board of Directors adopted a climate emergency declaration that commits to working
toward an ambitious goal of delivering carbon neutral electricity by 2030. The declaration
recognizes the immediate risks to our community and demands bold action to achieve results.
As SMUD charts the process to decarbonize our electricity supply, we recognize there is a need
to help our customers decarbonize their lives also through energy efficiency, building
electrification and transportation electrification. Building and transportation electrification will
both place strain on the distribution grid and force a larger carbon free electricity supply.
Managing the load and grid in 2030 will encourage SMUD to operate the supply and grid
differently.
Due to these expected changes, SMUD is changing many of their existing programs and
developing new programs to prepare SMUD and our customers to this new future. As we move
forward, this will encourage more bundling of programs and care to develop programs that aid
us to a carbon free future.

Energy Efficiency in California’s Public Power Sector — 2025 A-212
For 2024, SMUD spent $50.8 million for residential and commercial energy-efficiency programs,
compared to a budget of $38.9 million. All expenditures are public-goods funded. These
programs delivered 11 megawatts (MW) of peak-load reduction and 98.1 million kilowatt-hours
(GWh) of annual energy savings.
Commercial, Industrial & Agricultural Programs
Commercial, Industrial & Agricultural Programs
Expenditures for commercial/industrial energy efficiency retrofit and electrification programs
for existing buildings and facilities, and for all-electric commercial and residential new
construction, were $8.2 million, with delivery of 25.8 GWh in annual energy savings.
• Customized Energy Efficiency Incentives: Promotes the installation of energy-efficient
equipment, controls, and processes at commercial and industrial customer facilities.
Provides incentives to contractors and/or customers to promote the installation of
energy efficient lighting, HVAC, motors, and refrigeration equipment and controls. The
program also provides incentives for retro-commissioning, process improvements, and
data center storage projects that result in energy savings.
• Express Energy Solutions: Provides prescriptive incentives to participating qualified
contractors for high-efficiency equipment across a variety of end-uses: lighting, HVAC,
refrigeration, and food-service equipment. Incentives are targeted to the
contractor/supplier in an effort to stimulate the market for energy-efficient equipment
and services and are designed to cover a significant portion of the incremental cost of
the equipment.
• Complete Energy Solutions: Third party administrator performs comprehensive energy
audits of small and medium-sized businesses. Customer receives a customized report
detailing recommended energy improvements, estimated savings, estimated cost and
payback. Third party administrator then assists customer in hiring a contractor to
complete the project.
• Integrated Design Solutions: Provides incentives to builders and their design teams to
design new commercial and industrial buildings energy efficient than required by Title
24 (or typical new construction in the case of Title 24-exempt buildings and processes).
• Multifamily Retrofit: Provides incentives to apartment owners and managers to
complete energy retrofits
• Smart Homes: Provides incentives to builders and their design teams to design efficient
all electrics homes and apartments
Residential Programs
Expenditures for residential energy-efficiency and electrification programs for existing homes
were $21.0 million and achieved 67.0 GWh in annual energy savings.

Energy Efficiency in California’s Public Power Sector — 2025 A-213
• Advanced Home Solutions: Provides rebates for qualifying (Energy Star, Consortium for
Energy Efficiency, and/or other high-efficiency levels) efficiency improvements, which
include mini split heat pump, heat pump space heaters and heat pump water heaters.
• Home Energy Reports: Emailed energy reports to support more energy efficient usage
within a home
• Appliance Efficiency Program: Included in this program are induction cooking rebates,
Refrigerator/Freezer Recycling, SHIFT, and the Retail Partnership Program.
o Induction Cooking Rebates provides incentives for both electric replacement and
gas conversions
o Retail Partnership Program is an upstream program that works with big box
retailers to pay retailer incentives for all the energy efficiency items they sell in
their stores.
o SHIFT is an upstream program that works with big box retailers to pay retailer
incentives to shift adoption away from high volume non-Energy Star models
Complementary Programs
Low Income Programs
SMUD has expanded offerings for income qualified customers in 2024. While continuing to
offer no-cost direct installations of electrification and energy efficiency measures to our
residential low-income customers, this year commercial installations were added. Based upon
SMUD’s commitment to leave no community behind as part of our Community Impact Plan,
SMUD has introduced low-cost direct installations for small and medium-sized businesses as
well as multifamily properties serving underserved communities.
Expenditures for low-income electrification and energy efficiency programs for existing homes
and businesses were $11.4M and achieved 5.2 GWh in annual energy savings.
Information/Education Programs
SMUD provides residential and commercial educational events, classes and seminars through
its Energy & Technology center. These activities provide information on a wide range of
distributed energy resources, including energy efficiency, building electrification, electric
transportation, solar, and battery storage.
Demand-Reduction Programs
• Peak Corps and Peak Conserve (Residential Air Conditioner Load Management): Peak
Corp is a legacy program in which radio-controlled cycling devices were installed on
customers’ central air conditioners to send a radio signal to switch, or cycle off, their air
conditioners to reduce peak load on the electric system. In the late 1990’s the program
was transitioned into maintenance mode with no new installations. In 2010 the program
was modified for emergency use only and all service and maintenance related work was
Energy Efficiency in California’s Public Power Sector — 2025 A-214
discontinued. Operators have the ability to activate the entire ACLM cycling program
within a 3-minute time span, but the program has not been activated since 2000. In
2023, Peak Conserve was launched as a successor program with new two-way switches
utilizing SMUD’s mesh communication network.
• Power Direct (Commercial Automated Demand Response): Launched in 2013, this
program enhances customer facilities’ energy performance by seamlessly integrating
automated response capabilities into participants’ energy management, lighting, and
HVAC systems; it automatically reduces electricity consumption on Conservation Days in
times of high demand.
• My Energy Optimizer Partner (Residential smart thermostats): Continuing from 2022,
this program utilizes smart thermostat devices for economic load curtailment events. A
portion of customers were also enrolled into the Critical Peak Pricing (CPP) Rate.
• My Energy Optimizer Partner Plus (Residential battery storage): The program launched
in 2023 and offers incentives and performance payments for event-based battery
utilization.
Other Complimentary Programs
• Shade Trees: Provides free shade trees to SMUD customers. Implemented through the
community-based non-profit Sacramento Tree Foundation (STF). STF foresters review
tree selection and site locations with customers, who plant the trees.
• Electric Vehicles: In 2024, SMUD’s Drive Electric program continued to promote
adoption of plug-in electric vehicles through special PEV rate offerings, participation in
educational events, and educational offerings through our website SMUD.org/PEV.
SMUD incentivized EV chargers for commercial customers and provided rebates for EV
chargers for residential customers. SMUD also completed direct installation of chargers
for income eligible customers.
• Renewable Energy Programs: SMUD has continued to work closely with our community
to develop new programs for our customers including an Affordable Housing Virtual
Solar option. This new program, coupled with the Solar and Storage rate, has joined our
voluntary green pricing programs including SolarShares, which supports expansion of
distributed solar, and commercial and residential REC purchase programs.
• Codes & Standards: SMUD continues to pursue the development and implementation of
codes and standards (e.g. T24, T20, etc.) as the most cost-effective source of Energy
Savings. SMUD participates in several working groups, drives code compliance through
programs, assists with workforce training, conducts research, and develops data
management systems to improve tracking and reporting. SMUD is claiming 51 net GWh
energy savings associated with the Statewide Codes and Standards Team for 2024.
• Research, Development, and Demonstration: SMUD has a centralized research and
development program that conducts public good research across the electricity
enterprises from the supply side to demand side. Research is conducted in eight

Energy Efficiency in California’s Public Power Sector — 2025 A-215
research areas which include renewable energy, electric transportation, climate change,
distributed generation, energy efficiency, demand response, storage and smart grid.
These programs seek to track emerging technologies, demonstrate promising
technologies and prepare SMUD and SMUD customers for adoption of these emerging
technologies.
Evaluation, Measurement & Verification Studies
Evaluation studies are managed through SMUD’s Finance & Strategy division’s Enterprise & Risk
business unit. Studies are selected based on its importance to SMUD’s Enterprise Strategy
pillars, which covers a wide range of initiatives, including Environmental Leadership activities.
For 2024, evaluation studies completed included:
• My Energy Optimizer Partner Thermostat Year 2
• My Energy Optimizer Partner+ Battery Peak Conserve Summer 1
• Advanced Commercial Solutions (Integrated Design Solutions and Customized Efficiency)
• Advanced Homes Solutions HVAC
In 2025, the following evaluation studies will be completed:
• Peak Conserve Summer 2
• My Energy Optimizer Partner Thermostat Year 3
• Residential Equity Building Decarbonization
• PrePay Proof of Concept
• Transportation Electrification Portfolio Evaluability
• Home Energy Reports & Rate Coach
• PowerDirect
Major Differences or Diversions from CA POU TRM for Energy Savings
In order to determine energy savings, programs may rely on several sources: the California
Technical Reference Manual, Energy Modeling Software, or specific studies conducted by
utilities or recognized working groups. The goal is to use the most current studies/workpapers
which best represent CZ12 and SMUD customers.

Energy Efficiency in California’s Public Power Sector — 2025 A-216
TABLE SMUD-1. Energy Efficiency Program Results by End Use
Summary by End Use
Resource Savings Summary
Cost Test Results
End Use
Gross Peak
Savings (kW)
Gross Annual
Energy Savings
(kWh)
Gross Lifecycle
Energy Savings
(kWh)
Net Peak
Savings (kW)
Net Annual
Energy Savings
(kWh)
Net Lifecycle
Energy Savings
(kWh)
Net Lifecycle GHG
Reductions (Tons)
Total Utility
Cost
PAC
TRC
Utility
($/kWh)
Appliance & Plug Loads
48,300
483,000
48,300
483,000
45
$543,966
0.02
0.02
1.457
HVAC - Heat Pump
24,942,862
326,179,438
24,648,783
321,768,250
24,192
$20,826,845
0.43
0.15
0.091
Miscellaneous
0
0
0
0
0
$663,500
0.000
Service & Domestic Hot Water
5,045,630
65,663,472
5,041,216
65,610,504
4,625
$4,938,040
0.21
0.28
0.106
Whole Building
17
3,980,567
79,609,560
17
3,980,513
79,608,750
3,691
$5,055,585
0.22
0.14
0.106
Electrification
17
34,017,359
471,935,470
17
33,718,812
467,470,504
32,552
$32,027,937
0.34
0.15
0.099
Appliance & Plug Loads
5,623
5,553,658
72,989,471
3,578
3,795,746
49,983,356
3,511
$1,891,593
0.44
0.09
0.054
Codes & Standards
0
51,000
765,000
0
40,800
612,000
38
$251,649
0.04
0.04
0.608
Commercial Refrigeration
52,784
791,760
42,227
633,408
39
$19,406
0.48
1.43
0.045
Food Service
0
2,468
26,910
0
1,974
21,528
2
$1,044
0.37
0.20
0.065
HVAC - Cooling
911
1,901,010
22,228,305
621
1,423,635
17,065,568
1,345
$365,324
1.04
0.45
0.030
HVAC - Heating
15,270,882
229,063,230
9,162,529
137,437,938
8,347
$1,920,185
0.17
0.01
0.021
Lighting - Indoor
182
11,396,205
79,773,435
145
9,116,964
63,818,748
8,355
$1,366,552
0.99
0.76
0.025
Service & Domestic Hot Water
202,538
3,038,070
121,523
1,822,842
111
$254,205
0.11
0.01
0.206
Whole Building
369
24,513,898
145,916,770
264
17,704,324
110,310,668
9,608
$4,396,379
0.51
0.47
0.054
Energy Efficiency
7,086
58,944,443
554,592,951
4,609
41,409,722
381,706,055
31,357
$10,466,336
0.50
0.11
0.038
Appliance & Plug Loads
4,464
44,640
4,464
44,640
4
$21,242
0.04
0.23
0.616
Food Service
6,975
69,750
5,580
55,800
5
$33,377
0.03
0.15
0.774
HVAC - Cooling
3,583
550,975
7,078,915
3,583
519,827
6,611,701
508
$1,544,541
0.13
2.74
0.326
HVAC - Heat Pump
172
1,661,691
20,819,331
172
1,603,028
20,203,992
1,567
$7,934,479
0.07
0.20
0.546
Lighting - Indoor
636,112
4,452,784
508,890
3,562,227
467
$139,328
0.55
1.73
0.047
Service & Domestic Hot Water
2,270,807
27,627,371
1,879,603
22,932,923
1,724
$3,390,968
0.11
0.22
0.203
Whole Building
20,901
313,515
16,721
250,812
16
$3,561
1.19
1.06
0.021
Low-Income
3,755
5,151,925
60,406,306
3,755
4,538,113
53,662,095
4,291
$13,067,495
0.09
0.26
0.333
EE, Low Income and Electrification
10,857
98,113,727
1,086,934,727
8,380
79,666,647
902,838,655
68,200
$55,561,769
0.31
0.14
0.087
C&S and T&D
$0
Utility Total
10,857
98,113,727
1,086,934,727
8,380
79,666,647
902,838,655
68,200
$55,561,769
0.31
0.14
0.087

Energy Efficiency in California’s Public Power Sector — 2025 A-217
TABLE SMUD-2. Energy Efficiency Program Results by Sector
Summary by Sector
Resource Savings Summary
Cost Test Results
Sector
Gross Peak
Savings (kW)
Gross Annual
Energy Savings
(kWh)
Gross Lifecycle
Energy Savings
(kWh)
Net Peak
Savings (kW)
Net Annual
Energy Savings
(kWh)
Net Lifecycle
Energy Savings
(kWh)
Net Lifecycle GHG
Reductions (Tons)
Total Utility
Cost
PAC
TRC
Utility
($/kWh)
Commercial
17
1,492,822
22,326,120
17
1,194,275
17,861,154
1,128
$4,377,040
0.11
0.09
0.362
Residential
32,524,537
449,609,350
32,524,537
449,609,350
31,425
$27,650,897
0.38
0.15
0.089
Electrification
17
34,017,359
471,935,470
17
33,718,812
467,470,504
32,552
$32,027,937
0.34
0.15
0.099
Commercial
555
20,057,409
209,681,385
413
15,845,223
164,734,540
14,530
$4,687,886
0.64
0.56
0.038
Residential
6,531
38,887,034
344,911,566
4,196
25,564,500
216,971,515
16,827
$5,778,451
0.38
0.05
0.037
Energy Efficiency
7,086
58,944,443
554,592,951
4,609
41,409,722
381,706,055
31,357
$10,466,336
0.50
0.11
0.038
Commercial
827,538
7,289,299
662,030
5,831,439
608
$508,585
0.23
0.74
0.112
Residential
3,755
4,324,387
53,117,007
3,755
3,876,083
47,830,656
3,683
$12,558,910
0.09
0.24
0.362
Low-Income
3,755
5,151,925
60,406,306
3,755
4,538,113
53,662,095
4,291
$13,067,495
0.09
0.26
0.333
EE, Low Income and Electrification
10,857
98,113,727
1,086,934,727
8,380
79,666,647
902,838,655
68,200
$55,561,769
0.31
0.14
0.087
C&S and T&D
$0
Utility Total
10,857
98,113,727
1,086,934,727
8,380
79,666,647
902,838,655
68,200
$55,561,769
0.31
0.14
0.087

Energy Efficiency in California’s Public Power Sector — 2025 A-218
TABLE SMUD-3. Energy Efficiency Program Results by Building Type
Summary by Building Type
Resource Savings Summary
Cost Test Results
Building Type
Gross Peak
Savings (kW)
Gross Annual
Energy Savings
(kWh)
Gross Lifecycle
Energy Savings
(kWh)
Net Peak
Savings (kW)
Net Annual
Energy Savings
(kWh)
Net Lifecycle
Energy Savings
(kWh)
Net Lifecycle GHG
Reductions (Tons)
Total Utility
Cost
PAC
TRC
Utility
($/kWh)
Assembly
82,242
1,233,630
65,794
986,904
61
$230,342
0.11
0.06
0.345
Education - Community College
1,344,800
20,172,000
1,075,840
16,137,600
1,017
$2,175,250
0.20
0.20
0.199
Education - Primary School
0
0
0
0
0
$57,750
0.000
Education - Secondary School
5
84
1,260
5
84
1,260
0
$367,237
0.00
0.00
430.609
Manufacturing Light Industrial
1
15
1
12
0
$146,252
0.00
0.00
18,006.373
Office - Large
5,910
88,650
4,728
70,920
4
$290,399
0.01
0.02
6.050
Office - Small
55,737
769,845
44,590
615,879
41
$569,104
0.02
0.04
1.328
Other Agricultural
12
1
15
12
1
15
0
$4,251
0.00
0.00
418.713
Residential - Multi-Family
1,719,976
31,004,320
1,719,976
31,004,320
1,600
$2,442,515
0.19
0.17
0.128
Residential - Single-Family
30,804,561
418,605,030
30,804,561
418,605,030
29,825
$25,208,382
0.40
0.15
0.086
Restaurant - Fast-Food
0
0
0
0
0
$225,159
0.000
Retail - Large
4,047
60,705
3,238
48,564
3
$311,297
0.00
0.02
9.470
Electrification
17
34,017,359
471,935,470
17
33,718,812
467,470,504
32,552
$32,027,937
0.34
0.15
0.099
Any
0
51,000
765,000
0
40,800
612,000
38
$251,649
0.04
0.04
0.608
Assembly
710,346
5,108,022
560,649
3,972,005
514
$61,232
1.35
1.45
0.018
Education - Primary School
89
711,585
4,981,095
71
569,268
3,984,876
515
$136,549
0.56
0.08
0.041
Education - Secondary School
1,080,609
12,885,855
937,659
11,406,262
851
$349,329
0.54
0.49
0.043
Education - University
41,006
287,042
32,805
229,634
30
$5,221
0.83
1.44
0.027
Grocery
73,150
512,050
58,520
409,640
54
$1,830
4.59
0.99
0.005
Health/Medical - Hospital
0
118,425
832,543
0
94,740
666,034
87
$28,880
0.47
1.32
0.052
Health/Medical - Nursing Home
114,560
801,920
91,648
641,536
84
$29,455
0.44
1.21
0.055
Lodging - Hotel
811,734
12,176,010
649,387
9,740,808
596
$156,274
1.03
2.33
0.024
Lodging - Motel
0
0
0
0
0
$36,624
0.000
Manufacturing Biotech
56
2,540,616
32,680,256
20
1,194,596
13,575,752
1,096
$528,182
0.44
0.45
0.054
Manufacturing Light Industrial
184
2,681,309
39,108,435
176
2,568,283
37,635,292
2,356
$1,358,722
0.46
0.41
0.053
Office - Large
94
2,539,979
22,390,143
35
1,923,445
16,284,041
1,770
$353,229
0.93
1.28
0.028
Office - Small
88
2,943,350
38,006,834
76
2,610,585
34,244,041
2,404
$1,013,003
0.59
0.55
0.042
Other Agricultural
0
0
0
0
0
$34,000
0.000
Other Commercial
8
2,831,092
19,893,644
6
2,265,919
15,930,590
2,077
$328,154
1.02
1.57
0.025
Residential
17,060,900
34,121,800
11,942,630
23,885,260
4,320
$1,288,970
0.64
0.64
0.056
Residential - Single-Family
6,531
21,775,134
310,024,766
4,196
13,581,070
192,474,255
12,469
$4,237,832
0.32
0.03
0.032
Restaurant - Sit-Down
129,064
903,448
103,251
722,758
95
$47,303
0.33
0.61
0.078
Retail - Large
15
2,634,502
18,441,514
12
2,107,602
14,753,211
1,932
$203,278
1.58
2.22
0.016
Retail - Small
21
96,082
672,574
17
76,866
538,059
70
$4,791
2.45
4.09
0.011

Energy Efficiency in California’s Public Power Sector — 2025 A-219
Storage - Unconditioned
0
0
0
0
0
$11,830
0.000
Energy Efficiency
7,086
58,944,443
554,592,951
4,609
41,409,722
381,706,055
31,357
$10,466,336
0.50
0.11
0.038
Assembly
375,194
2,791,262
300,155
2,233,010
275
$246,476
0.19
0.60
0.134
Health/Medical - Hospital
8,100
121,500
6,480
97,200
6
$47,271
0.06
0.15
0.719
Office - Large
209,993
1,963,447
167,994
1,570,758
154
$116,042
0.26
1.03
0.097
Other Commercial
0
0
0
0
0
$4,500
0.000
Residential - Multi-Family
2,241,521
26,431,755
1,793,217
21,145,404
1,650
$2,850,658
0.12
0.17
0.183
Residential - Single-Family
3,755
2,082,866
26,685,252
3,755
2,082,866
26,685,252
2,033
$9,708,252
0.08
0.31
0.508
Restaurant - Sit-Down
106,666
1,462,235
85,333
1,169,788
78
$66,602
0.27
1.05
0.082
Retail - Large
127,585
950,855
102,068
760,684
94
$27,693
0.58
1.79
0.044
Low-Income
3,755
5,151,925
60,406,306
3,755
4,538,113
53,662,095
4,291
$13,067,495
0.09
0.26
0.333
EE, Low Income and Electrification
10,857
98,113,727
1,086,934,727
8,380
79,666,647
902,838,655
68,200
$55,561,769
0.31
0.14
0.087
C&S and T&D
$0
Utility Total
10,857
98,113,727
1,086,934,727
8,380
79,666,647
902,838,655
68,200
$55,561,769
0.31
0.14
0.087

Energy Efficiency in California’s Public Power Sector — 2025 A-220
SAN FRANCISCO PUBLIC UTILITIES DISTRICT
San Francisco Public Utilities District at a Glance
• Climate Zone: 3
• Customers: 7,003
• Total annual retail sales: 940,181 MWh
• Annual Retail Revenue: $166,558,139
• Annual energy efficiency expenditures for reporting year: $404,304
• Gross annual savings from reporting year portfolio: 1,478 MWh
San Francisco Public Utilities Commission Overview
The San Francisco Public Utilities Commission (SFPUC)’s Hetch Hetchy Power manages a
portfolio of electric generation, which includes the Hetch Hetchy Water and Power System,
which generates an average of 1.4 million MWh of clean hydroelectric power each year, 28
municipal solar photovoltaic installations (8.0 MW), and a biogas cogeneration facility (2 MW).
Hetch Hetchy Power has made a commitment to energy efficiency as its highest priority
resource.
Commercial, 1,478
Gross Energy Savings (MWh)
Residential Commercial Industrial Agricultural Other Low Income T&D Electrification

Energy Efficiency in California’s Public Power Sector — 2025 A-221
Historically, Hetch Hetchy Power's energy efficiency programs have mainly targeted its
municipal customers, and most of its programs have been provided at no charge to these civic
agencies. Hetch Hetchy Power also now offers programs for its growing residential and
commercial customer sectors.
Major Program and Portfolio Changes
This year’s energy savings are primarily derived from direct install lighting projects at Hamilton
Recreation Center, Richmond Recreation Center, Multi-Service Center South, San Francisco
Police Department (SFPD) Tenderloin Station and SFPD Stables. There were also
retrocommissioning and controls projects at the Veterans Building and Multi-Service Center
South.
Program and Portfolio Highlights
Energy efficiency has been an essential component of Hetch Hetchy Power's resource portfolio
for more than a decade. In the current reporting period, FY 2023-24, completed energy
efficiency projects and programs are estimated to save 491 MWh (net savings) of electricity per
year, at a utility cost of $304,000. Hetch Hetchy Power's energy efficiency projects and
programs also achieve significant natural gas savings each year, which are accounted for
separately from this report.
Program highlights for FY 2023-24 include:
• High bay gym lighting retrofit at Hamilton Recreation Center
• High bay gym lighting and exterior lighting retrofit at Richmond Recreation Center
• Interior lighting retrofit at Multi-Service Center South
• Interior lighting retrofit at SFPD Stables
• Interior lighting retrofit at SFPD Tenderloin Station
• Retrocommissioning at the War Memorial Veterans Building
• Controls retrofit at Multi-Service Center South
Commercial, Industrial & Agricultural Programs
Hetch Hetchy Power's energy efficiency programs are generally tailored to each customer
(almost all of which are other City departments), because most of these customers are large
and have varied property characteristics. These programs include:
• General Fund Program: This program provides complete retrofit services and
customized incentives to targeted municipal customers. The program focuses on City
agencies that are funded primarily through local tax receipts, fees, and federal/state-
funded programs. These customers are considered hard-to-reach (due to limited access
to capital and engineering, as well as insufficient price signals).
• Civic Center Sustainability District: Through a partnership with the Clinton Global
Initiative, this program demonstrates green, renewable and energy efficient

Energy Efficiency in California’s Public Power Sector — 2025 A-222
technologies as a national model for sustainability in historic districts. For energy
efficiency projects, the program provides free energy audits, design, construction
management, construction services, and full funding to buildings in the City’s Civic
Center historic district.
• Energy Benchmarking Program: San Francisco requires owners of non-residential
buildings over 10,000 square feet to annually benchmark and disclose the energy
performance of their buildings. In FY 2023-24, Power Enterprise released its twelfth
annual report benchmarking the energy performance of San Francisco’s municipal
buildings.
• Upgrade for Savings: Hetch Hetchy Power offers customized cash incentives and
technical support to help customers make significant upgrades to energy-efficient
equipment, systems, and operational practices.
• Blueprint for Savings: This new construction energy efficiency program offers design
assistance and cash payments to building owners and design teams planning to
construct highly energy efficient buildings 50,000 square feet or larger.
Residential Programs
Hetch Hetchy Power primarily serves municipal loads. Hetch Hetchy Power provides
distribution service to the former military installations at Treasure Island and Hunters Point,
both of which are in the process of being redeveloped to residential/commercial uses.
Additional energy efficiency activities for this new residential use are limited as these new units
are being built to the latest code and energy efficiency standards. In addition, Hetch Hetchy
Power serves a limited number of affordable housing sites. New programs are under
development to serve these customers.
Complementary Programs
Hetch Hetchy Power offers several related programs, among them:
Renewable Energy Programs:
• Municipal Renewable Program: Under this program, Hetch Hetchy Power directly
installs, maintains, and operates solar PV systems on municipal buildings throughout the
City and County of San Francisco; and
• GoSolarSF: This program provides incentive payments to San Francisco residents and
businesses installing rooftop solar projects. The program includes a component for low-
income residents, which complements a statewide program administered by Grid
Alternatives, a nonprofit organization.

Energy Efficiency in California’s Public Power Sector — 2025 A-223
Electrification Programs:
• All Electric Multifamily Program: This program provides free electrification planning
services, including a building electrification-focused audit and roadmap, for eligible
affordable housing developments.
• EV Charge SF: This program provides incentive payments and technical support for
qualified municipal, commercial, and multifamily customers installing electric vehicle
charging beyond code minimums.
• Electrify My Ride: This program provides point-of-sale rebates for income-qualified
customers to purchase electric bicycles.
Evaluation, Measurement & Verification Studies
Historically, most of the energy efficiency retrofit projects funded by Hetch Hetchy Power have
included an individual M&V study following the International Performance Measurement and
Verification Protocol (IPMVP). These projects have included an M&V plan with a sampling plan,
a logging plan, an approach to data recovery and analysis, and a written report.
Major Differences or Diversions from CA POU TRM for Energy Savings
Hetch Hetchy Power's mostly direct-install energy efficiency portfolio allows it to report energy
savings based on site-specific engineering studies with detailed ex ante savings estimates.
These studies base savings on on-site collected data for hours of operation, nameplate data for
replaced equipment, and detailed site-specific costs. As such, Hetch Hetchy Power assumes an
"existing conditions" baseline for energy savings calculations, and accordingly, Hetch Hetchy
Power does not separately claim savings from code advocacy.
Energy Efficiency in California’s Public Power Sector — 2025 A-224
TABLE SFPUC-1. Energy Efficiency Program Results by End Use
Summary by End Use
Resource Savings Summary
Cost Test Results
End Use
Gross Peak
Savings (kW)
Gross Annual
Energy Savings
(kWh)
Gross Lifecycle
Energy Savings
(kWh)
Net Peak
Savings (kW)
Net Annual
Energy Savings
(kWh)
Net Lifecycle
Energy Savings
(kWh)
Net Lifecycle GHG
Reductions (Tons)
Total Utility
Cost
PAC
TRC
Utility
($/kWh)
HVAC - Heating
4
1,124,947
16,874,212
4
1,124,947
16,874,212
3,884
$194,648
3.16
10.52
0.015
Lighting - Indoor
36
259,900
3,898,500
36
259,900
3,898,500
1,301
$193,443
2.03
10.52
0.066
Miscellaneous
0
93,473
1,402,100
0
93,473
1,402,100
295
$16,213
2.58
10.52
0.015
Energy Efficiency
40
1,478,321
22,174,812
40
1,478,321
22,174,812
5,480
$404,304
2.60
10.52
0.024
EE, Low Income and Electrification
40
1,478,321
22,174,812
40
1,478,321
22,174,812
5,480
$404,304
2.60
10.52
0.024
C&S and T&D
$0
Utility Total
40
1,478,321
22,174,812
40
1,478,321
22,174,812
5,480
$404,304
2.60
10.52
0.024
Energy Efficiency in California’s Public Power Sector — 2025 A-225
TABLE SFPUC-2. Energy Efficiency Program Results by Sector
Summary by Sector
Resource Savings Summary
Cost Test Results
Sector
Gross Peak
Savings (kW)
Gross Annual
Energy Savings
(kWh)
Gross Lifecycle
Energy Savings
(kWh)
Net Peak
Savings (kW)
Net Annual
Energy Savings
(kWh)
Net Lifecycle
Energy Savings
(kWh)
Net Lifecycle GHG
Reductions (Tons)
Total Utility
Cost
PAC
TRC
Utility
($/kWh)
Commercial
40
1,478,321
22,174,812
40
1,478,321
22,174,812
5,480
$404,304
2.60
10.52
0.024
Energy Efficiency
40
1,478,321
22,174,812
40
1,478,321
22,174,812
5,480
$404,304
2.60
10.52
0.024
EE, Low Income and Electrification
40
1,478,321
22,174,812
40
1,478,321
22,174,812
5,480
$404,304
2.60
10.52
0.024
C&S and T&D
$0
Utility Total
40
1,478,321
22,174,812
40
1,478,321
22,174,812
5,480
$404,304
2.60
10.52
0.024
Energy Efficiency in California’s Public Power Sector — 2025 A-226
TABLE SFPUC-3. Energy Efficiency Program Results by Building Type
Summary by Building Type
Resource Savings Summary
Cost Test Results
Building Type
Gross Peak
Savings (kW)
Gross Annual
Energy Savings
(kWh)
Gross Lifecycle
Energy Savings
(kWh)
Net Peak
Savings (kW)
Net Annual
Energy Savings
(kWh)
Net Lifecycle
Energy Savings
(kWh)
Net Lifecycle GHG
Reductions (Tons)
Total Utility
Cost
PAC
TRC
Utility
($/kWh)
Other Commercial
40
1,478,321
22,174,812
40
1,478,321
22,174,812
5,480
$404,304
2.60
10.52
0.024
Energy Efficiency
40
1,478,321
22,174,812
40
1,478,321
22,174,812
5,480
$404,304
2.60
10.52
0.024
EE, Low Income and Electrification
40
1,478,321
22,174,812
40
1,478,321
22,174,812
5,480
$404,304
2.60
10.52
0.024
C&S and T&D
$0
Utility Total
40
1,478,321
22,174,812
40
1,478,321
22,174,812
5,480
$404,304
2.60
10.52
0.024

Energy Efficiency in California’s Public Power Sector — 2025 A-227
CITY OF SHASTA LAKE
City of Shasta Lake at a Glance
• Climate Zone: 11
• Customers: 4,597
• Total annual retail sales: 198,620 MWh
• Annual Retail Revenue: $33,073,350
• Annual energy efficiency expenditures for reporting year: $120,994
• Gross annual savings from reporting year portfolio: 115 MWh
Shasta Lake Overview
The City of Shasta Lake (CSL) is located in Shasta County north of Redding. CSL invests its Public
Benefit funds to promote positive community impacts by promoting electricity-saving
measures. CSL utilizes a comprehensive set of traditional rebate programs available to all
customers under retrofit projects.
Major Program and Portfolio Changes
Reportable savings tend to fluctuate dramatically from year to year. In the last five years, CSL
has achieved 71% of net kWh savings targets.
Residential, 93
Commercial, 21 Other, 1
Gross Energy Savings (MWh)
Residential Commercial Industrial Agricultural Other Low Income T&D Electrification

Energy Efficiency in California’s Public Power Sector — 2025 A-228
Program and Portfolio Highlights
The Residential Direct Install Program provided 42% of the gross annual savings in FY24. The
program provides instant kWh savings by installing lighting and water savings measures at no
cost to the customer.
Commercial, Industrial & Agricultural Programs
CSL manages a comprehensive energy efficiency incentive program for commercial customers
focusing on energy efficiency and peak load reduction. Rebates are available for upgraded
lighting, HVAC, appliances, refrigeration equipment, electronics, and, in cases where an analysis
is performed, rebates can be offered for additional equipment that reduces energy use and/or
demand. On-site energy audits are provided by CSL energy specialists. Energy efficiency
measures are recommended, and additional visits are completed upon request.
• Commercial/Industrial Lighting Program: CSL offers rebates to business owners who
invest in the installation of energy efficiency lighting upgrades. There is a prevalence of
inefficient lighting throughout the City and most high bay lighting uses high intensity
discharge fixtures instead of more efficiency fluorescent or LED fixtures.
• Commercial HVAC: The City offers rebates to commercial customers for energy efficient
HVAC upgrades.
• Commercial Refrigeration: Rebates are available to improve the efficiency of commercial
refrigeration systems.
• Commercial Appliances: Rebates are available for energy efficient cooking equipment
such as ovens, dishwashers, fryers, griddles, etc.
• Commercial Electronics: The City offers rebates for uninterrupted power supplies, plug-
load occupancy sensors and smart power strips.
• Commercial/Industrial Custom Program: CSL offers rebates to business owners based on
site-specific consumption. Rebates are tailored to the individual business owner’s needs
based on the audit and the potential energy savings associated with the customer
project.
Residential Programs
CSL manages a comprehensive energy efficiency incentive program for residential customers.
Rebates are offered for the installation of various energy efficiency measures, such as lighting,
HVAC, appliances and weatherization. On-site energy audits are provided by CSL energy
specialists. Energy efficiency measures are recommended, and additional visits are completed
upon request.
• Residential Lighting Program: CSL offers rebates to homeowners who install ENERGY
STAR® qualified LED lamps/bulbs, ceiling fans and LED holiday lights.
• Residential HVAC Program: CSL offers rebates to homeowners who install high
performance heat pumps, central air-conditioners, room air-conditioners, or whole

Energy Efficiency in California’s Public Power Sector — 2025 A-229
house fans that exceed current state requirements. CSL also offers a rebate for duct
sealing when not required by code.
• Residential Equipment Program: CSL offers rebates to homeowners who purchase new
ENERGY STAR qualified products, including clothes washers, room air conditioners,
dishwashers, pool pumps, and refrigerators.
• Residential Weatherization Program: CSL offers rebates to homeowners who invest in
weatherizing their homes, including attic and wall insulation, window
treatments/replacement, air/duct sealing and radiant barriers.
• Residential Heat Pump Water Heater Rebate Program: CSL offers rebates to
homeowners who purchase a new, energy efficient heat pump water heater.
Complementary Programs
• Low-Income Programs: Lifeline monthly rate discount program and one-time bill
assistance known as SHARE
• Renewable Energy Programs: Focus on customized solar projects that benefit the City
• Research, Development, and Demonstration: Focuses on LED lighting in various
applications, community solar charging station(s) and latest HVAC applications in City
owned facilities
• Electric Vehicles: Support of local business in conversion of combustion engine vehicles
to electric vehicles
• Water Conservation: Rebates offered for clothes washers with any domestic hot water
source, toilets, and automatic irrigation controllers.
Evaluation, Measurement & Verification Studies
EM&V reports for CSL are posted on the CMUA website.
Major Differences or Diversions from CA POU TRM for Energy Savings
CSL has relied heavily on the energy savings listed in the POU TRM, the eTRM, and the
Bonneville Power Administration. Non-residential lighting, custom projects and non-deemed
measures utilize custom savings calculations.

Energy Efficiency in California’s Public Power Sector — 2025 A-230
TABLE CSL-1. Energy Efficiency Program Results by End Use
Summary by End Use
Resource Savings Summary
Cost Test Results
End Use
Gross Peak
Savings (kW)
Gross Annual
Energy Savings
(kWh)
Gross Lifecycle
Energy Savings
(kWh)
Net Peak
Savings (kW)
Net Annual
Energy Savings
(kWh)
Net Lifecycle
Energy Savings
(kWh)
Net Lifecycle GHG
Reductions (Tons)
Total Utility
Cost
PAC
TRC
Utility
($/kWh)
Any
0
895
8,951
0
716
7,161
3
$2,661
0.31
0.31
0.449
Appliance & Plug Loads
1
6,459
47,141
1
4,926
30,948
11
$20,739
0.17
0.16
0.767
Building Envelope
8
42,146
842,917
3
12,335
246,708
57
$15,165
0.95
0.84
0.090
HVAC - Cooling
2
3,948
58,265
1
3,038
45,004
18
$18,028
0.58
0.63
0.534
HVAC - Heat Pump
3
9,142
137,134
2
5,668
85,023
36
$31,987
0.73
0.68
0.503
Lighting - Indoor
3
26,449
266,771
3
24,940
250,628
90
$13,138
2.17
2.14
0.063
Lighting - Outdoor
2
24,160
283,834
1
19,386
227,804
102
$8,535
3.05
2.44
0.047
Service & Domestic Hot Water
0
2,138
21,383
0
1,487
14,874
5
$10,743
0.14
0.13
0.873
Energy Efficiency
19
115,337
1,666,397
11
72,496
908,151
323
$120,994
0.90
0.84
0.173
EE, Low Income and Electrification
19
115,337
1,666,397
11
72,496
908,151
323
$120,994
0.90
0.84
0.173
C&S and T&D
$0
Utility Total
19
115,337
1,666,397
11
72,496
908,151
323
$120,994
0.90
0.84
0.173
Energy Efficiency in California’s Public Power Sector — 2025 A-231
TABLE CSL-2. Energy Efficiency Program Results by Sector
Summary by Sector
Resource Savings Summary
Cost Test Results
Sector
Gross Peak
Savings (kW)
Gross Annual
Energy Savings
(kWh)
Gross Lifecycle
Energy Savings
(kWh)
Net Peak
Savings (kW)
Net Annual
Energy Savings
(kWh)
Net Lifecycle
Energy Savings
(kWh)
Net Lifecycle GHG
Reductions (Tons)
Total Utility
Cost
PAC
TRC
Utility
($/kWh)
Any
0
895
8,951
0
716
7,161
3
$2,661
0.31
0.31
0.449
Commercial
0
21,415
256,977
0
17,132
205,581
95
$5,933
3.97
3.13
0.036
Residential
19
93,028
1,400,468
11
54,648
695,408
225
$112,401
0.75
0.71
0.212
Energy Efficiency
19
115,337
1,666,397
11
72,496
908,151
323
$120,994
0.90
0.84
0.173
EE, Low Income and Electrification
19
115,337
1,666,397
11
72,496
908,151
323
$120,994
0.90
0.84
0.173
C&S and T&D
$0
Utility Total
19
115,337
1,666,397
11
72,496
908,151
323
$120,994
0.90
0.84
0.173
Energy Efficiency in California’s Public Power Sector — 2025 A-232
TABLE CSL-3. Energy Efficiency Program Results by Building Type
Summary by Building Type
Resource Savings Summary
Cost Test Results
Building Type
Gross Peak
Savings (kW)
Gross Annual
Energy Savings
(kWh)
Gross Lifecycle
Energy Savings
(kWh)
Net Peak
Savings (kW)
Net Annual
Energy Savings
(kWh)
Net Lifecycle
Energy Savings
(kWh)
Net Lifecycle GHG
Reductions (Tons)
Total Utility
Cost
PAC
TRC
Utility
($/kWh)
Any
2
606
3,610
1
334
2,019
1
$1,891
0.13
0.11
1.057
Multiple
8
46,279
496,624
6
39,238
404,896
150
$70,275
0.85
0.79
0.214
Residential
8
45,144
874,535
3
14,600
274,171
70
$35,028
0.63
0.66
0.184
Residential - Single-Family
1
1,894
34,651
1
1,192
21,483
6
$7,868
0.36
0.28
0.524
Retail - Large
0
21,415
256,977
0
17,132
205,581
95
$5,933
3.97
3.13
0.036
Energy Efficiency
19
115,337
1,666,397
11
72,496
908,151
323
$120,994
0.90
0.84
0.173
EE, Low Income and Electrification
19
115,337
1,666,397
11
72,496
908,151
323
$120,994
0.90
0.84
0.173
C&S and T&D
$0
Utility Total
19
115,337
1,666,397
11
72,496
908,151
323
$120,994
0.90
0.84
0.173

Energy Efficiency in California’s Public Power Sector — 2025 A-233
SILICON VALLEY POWER
Silicon Valley Power at a Glance
• Climate Zone: 4
• Customers: 60,685
• Total annual retail sales: 4,479,607 MWh
• Annual Retail Revenue: $620,605,445
• Annual energy efficiency expenditures for reporting year: $3,976,841
• Gross annual savings from reporting year portfolio: 15,945 MWh
Silicon Valley Power Overview
Silicon Valley Power (SVP) is unique in its mix of customers. While 85% of the customers are
residential, 94% of the utility retail sales are to commercial, industrial and municipal customers.
Over 75% of our electric load is attributable to our largest “Key Customers" and more than half
comes from data centers. Historically, it is those customers, including the large data centers,
who implement a few large projects that make up the majority of our annual energy savings
each year. Our unique customer mix and mild climate results in very little energy savings from
the residential sector as compared to the business sector. This is partly because we do not have
a high residential air conditioning load, which often makes up a large percentage of residential
energy portfolio savings in other climate zones.
Residential, 18
Commercial,
15,853
Low Income, 25 Electrification, 49
Gross Energy Savings (MWh)
Residential Commercial Industrial Agricultural Other Low Income T&D Electrification

Energy Efficiency in California’s Public Power Sector — 2025 A-234
Major Program and Portfolio Changes
In FY 2023-2024, Silicon Valley Power made the following changes to its program portfolio:
• Residential Building Electrification Rebates – In February 2024, Silicon Valley Power
launched residential building electrification rebates for the replacement of gas water
heaters, stovetops and clothes dryers with efficient electric heat pump water heaters,
induction cooktops and electric clothes dryers. Tiered incentives are provided to pay
higher incentives based on income eligibility for income-qualified customers.
• Silicon Valley Power added the following complimentary programs to its portfolio in FY
2023-2024 which are described in more detail in the complimentary programs section of
this report: add-on incentives for electric panel upgrades when installing a residential
building electrification measure, circuit pauser/splitter rebates, commercial and
nonprofit solar rebate programs, a trade school scholarship for income-qualified
customers and a residential battery storage rebate.
• Silicon Valley Power resumed its after-school energy education program with the Santa
Clara Unified School District as part of its overall energy efficiency education and
outreach program. This effort is targeted at fourth grade students and teaches them
about energy conservation and efficiency, as well as renewable resources. It includes
hands on components, such as conducting a simple home energy audit and building a
solar powered model car.
Program and Portfolio Highlights
In FY 2023-2024, Silicon Valley Power customers completed a total of 7 large custom incentive
projects under the Customer Directed Rebate and Date Center Rebate programs. These projects
contributed approximately 13 million kWh in gross energy savings to the program's overall goal.
The Customer Directed Rebate and Data Center Rebate programs were developed years ago in
recognition of the unique customer base served by Silicon Valley Power. The programs provide
opportunities for energy-efficiency projects that may not otherwise fit into the utility's standard
rebate and customer assistance offerings. Any energy efficiency project that decreases energy
consumption at a facility in Santa Clara and is not already covered under one of our other
rebate programs may qualify. Customers must provide a measurement and verification plan
that is approved by Silicon Valley Power before work can begin. Pre- and post-inspection and
validation of energy savings is required. Under the data center program, performance
payments are made annually to ensure savings are achieved, as data centers do not always
build out as planned and occupancy can vary. The performance incentive component has been
well-received by Silicon Valley Power's customers, as the rebate is paid to the facility's
operating budget annually after the initial capital project is closed. This was a benefit to the
customer that utility staff did not anticipate and the performance incentive is now used for

Energy Efficiency in California’s Public Power Sector — 2025 A-235
building controls and any custom project where energy savings have a high level of uncertainty.
Lighting retrofits are the second largest contributor to Silicon Valley Power’s energy efficiency
goals with nearly 2.7 million kWh in energy savings.
Commercial, Industrial & Agricultural Programs
• Business Rebates: Encourages businesses to install energy efficient lighting, air
conditioners, motion sensors, programmable thermostats, food service equipment, etc.
The programs are occasionally changed to match statewide programs.
• Emerging Technologies Grant: The program provides grants to encourage businesses to
develop new energy-related technologies. The incentive is paid in two installments.
The first payment of 50% of the incentive will be paid upon completion of the project
and the second payment of 50% will be paid upon verification of energy savings. This is
intended to encourage customers to implement innovative energy efficiency projects
and minimize some of the risks involved if the savings do not materialize as expected,
which has been one of the barriers to program adoption. SVP reviews emerging
technologies and reaches out to customers to inform them about the program and
appropriate emerging technologies for their business.
• Commercial New Construction Rebate: This program provides a rebate to customers
who exceed Title 24 by 10% for the measure being incentivized, in line with our other
prescriptive rebates for retrofit projects. A tiered Design Team Incentive is provided up
to $50,000.
• Business Energy Audits: Provides free energy efficiency audits to business customers.
Energy & Resource Solutions administers this and other business PBC programs.
• Enhanced Ventilation Controls Rebate: This program provides an incentive per ton for
adding enhanced ventilation controls to HVAC rooftop packaged units 15 tons or
smaller.
• Small Business Efficiency Services Program: This program is targeted at small business
customers, and provides assistance in identifying energy efficiency projects, selecting
and managing contractors, and help with filling out rebate application paperwork. The
program also provides a 35% incentive for lighting and HVAC rebates, provided that
customers to install the lighting measures within 6 months of program enrollment and
HVAC measures within 12 months of enrollment in order to receive the additional
incentive.
• Controls Program: This program is available for projects where at least 80% of the
savings come from the control strategies. Incentives are paid on a performance basis
with 6 payments made over 5 years. The first payment is made upon project completion
and each additional annual payment will be subject to commissioning of the controls
system and validation of persistent energy savings.

Energy Efficiency in California’s Public Power Sector — 2025 A-236
• Public Facilities’ Energy Efficiency Program: SVP provides technical assistance and
financial incentives for the expansion, remodel, and new construction of City of Santa
Clara buildings.
• Data Center Efficiency Program: This program targets data centers with IT server load
greater than 350 kW or cooling load greater than 100 tons. The incentive is paid as a
performance incentive, where the customer will receive five annual payments based on
actual measured energy savings, with the first payment made three months after
project completion.
• Customer Directed Rebate: This program provides incentives based on actual energy
saved for energy efficiency measures that do not fall into SVP’s standard business
rebate programs.
• Energy Efficiency Grant Program for Nonprofit Organizations: Organizations registered
as a 501c3 are eligible for a grant up to $25,000 to fund energy efficiency upgrades in
their facilities. The grant requires a 20% matching funds contribution through cash,
other grant funding, donations, or some other documented means.
• Commercial Electrification Rebates: Silicon Valley Power offers commercial
electrification rebates including a custom rebate for conversion to heat recovery
chillers, a custom rebate for heat pump pool heaters, a rebate for heat pump air
conditioners, bonus incentives for electrification of food service equipment and a rebate
for installation of heat pump water heaters. The heat pump air conditioner rebate
program also offers an incentive to help cover the cost of infrastructure improvements
needed to accommodate the new equipment.
Residential Programs
• Residential Pool Pump Rebate: This program provides a rebate to residential customers
installing a new variable speed pool pump with a qualifying controller.
• ENERGY STAR Residential Heat Pump Electric Water Heater Rebate: SVP offers a rebate
for the purchase of an ENERGY STAR-qualified electric heat pump water heater. The
rebate is tiered to provide higher incentives based on income eligibility for income-
qualified customers.
• Residential Energy Efficiency Education and Energy Conservation Hot Line: The program
encourages residents to become more energy efficient and reduce their energy bills.
SVP staffs an information booth at City events, providing education on energy efficiency
and solar electric generation systems to residents. Staff also answers an energy
conservation hotline to assist customers in reducing their electric usage through energy
conservation tips, assistance in analyzing energy usage, and suggestions for energy
efficiency and building electrification retrofits.
• SVP Marketplace: Online marketplace where customers can purchase energy efficient
products. The marketplace includes instant rebates on equipment such as ENERGY STAR
room air cleaners and electric yard care equipment. Manufacturer rebates are also

Energy Efficiency in California’s Public Power Sector — 2025 A-237
provided for a variety of products including smart thermostats and various types of LED
light bulbs.
• Heat Pump Water Heater Electrification Program – Silicon Valley Power provides funding
for a regional midstream heat pump water heater electrification program through
BayREN where enrolled contractors receive a $1000 incentive for installing an electric
heat pump water heater in place of a natural gas water heater.
• Residential Building Electrification Rebates – In February 2024, Silicon Valley Power
launched residential building electrification rebates for the replacement of gas water
heaters, stovetops and clothes dryers with efficient electric heat pump heaters,
induction cooktops and electric clothes dryers. Tiered incentives are provided to pay
higher incentives based on income eligibility for income-qualified customers.
Complementary Programs
• Financial Rate Assistance Program (FRAP) – This program provides a discount ranging
from 25-40% discount on the electric portion of utility bills for income-qualified
residential customers, up to the first 800 kWh of use per month. Discounts are tiered
based on income levels.
• Low Income EV Charging Station Grant for Multifamily properties – Under its low-
income programs, SVP offers a grant of up to $1,000 per charging station for multifamily
properties where a specified percentage of customers residing at the property qualify
for SVP’s low income programs. This is in addition to the rebate program the utility
offers to all multifamily complexes in Santa Clara.
• Income-Qualified Solar Grant Program – Silicon Valley Power offers a grant up to
$10,500 to install solar photovoltaic (PV) systems on the homes of low-income residents
that will offset nearly 100% of their annual energy consumption.
• Electric Vehicle Charging Infrastructure Rebate - This program provides a rebate up to
$550 per residential electric vehicle charger installed at residences receiving electricity
from Silicon Valley Power. Multifamily housing can receive a rebate up to $3,000 per
Level 2 charger installed, and schools and non-profit organizations can receive up to
$5,000 per Level 2 charging station installed.
• Income-Qualified Pre-Owned Electric Vehicle Rebate – this program provides a $1500
rebate to income qualified customers for the purchase of an all-electric pre-owned
vehicle or $1000 rebate for the purchase of a pre-owned plug-in hybrid electric vehicle
(PHEV). Customers who meet LIHEAP income eligibility requirements receive an
additional $1000 rebate and vehicles with an MPGe of 117 or greater are eligible for an
additional $1,000 rebate.
• Electric Bicycle Rebate – This program provides a rebate of 10% of the purchase price of
an electric bicycle, up to $300. Income-qualified customers can receive a bonus
incentive of $200.
Energy Efficiency in California’s Public Power Sector — 2025 A-238
• Smart Electric Panel Rebates – Silicon Valley Power provides a rebate of $2,000 for
residential customers who upgrade their electric panel to a smart panel and install an EV
charger or a home electrification measure. A bonus incentive of $1,000 is available to
income qualified customers. Customers meeting LIHEAP income guidelines receive an
additional $1000 for a total of $4000.
• Multifamily Boiler Electrification Pilot Program – This program provides up to $100,000
in funding for the conversion of a natural gas boiler to an electric boiler at multifamily
complexes with at least 25 dwelling units. The program covers up to 100% of the
incremental cost of replacing the gas boiler with an efficient boiler.
• Educational Outreach in Schools - Silicon Valley Power contracts with Tinker Teach to
provide online energy efficiency education modules for 4th and 10th grade classrooms
located within the city of Santa Clara. Tinker Teach works with teachers at the schools to
provide the modules, training materials and the opportunity to earn mini grants for
classroom supplies. Students can compete for points and earn prizes based on
completion of the modules. Content is tailored to showcase examples relevant to the
local electric utility.
• Induction Cooking Demonstration Classes – Silicon Valley Power retrofitted the Santa
Clara Unified School District’s Adult Education Cooking Classroom with six induction
cooktops and new cookware. The utility sponsors monthly cooking classes for Santa
Clara residents to cook on induction cooktops and provides educational materials about
the benefits of induction cooktops. Classes are fully funded by Silicon Valley Power and
the School District charges a small fee to ensure those who enroll show up for the class.
• Commercial Solar Rebate Program - Silicon Valley Power offers a solar photovoltaic (PV)
rebate to commercial customers who install a qualifying PV system between 200kW and
1 MW, not to exceed 80% of the facility’s annual electric usage. The program is intended
to help offset the utility’s peak demand, especially during the summer months. Rebates
will be paid as either an up-front rebate or as a performance-based incentive over two
years.
• Nonprofit Solar Grant - Qualifying nonprofit organizations can receive a grant for
installing a solar photovoltaic (PV) system at their facility. The grant may cover a
significant portion of the system cost, with additional funds allocated for qualifying
building repairs or infrastructure to make the site PV-ready.
• Trade School Scholarships - Silicon Valley Power provides scholarships up to $5,000 for
eligible customers interested in furthering their career in an area supporting the energy
industry. This program supports Santa Clara residents to help learn the skills to earn a
livable wage while pursuing high demand careers in the energy industry.
• Student Grants for Energy Efficiency and Renewable Energy Projects - Silicon Valley
Power offers grants up to $5,000 for high school students to create projects or
awareness campaigns that will educate the Santa Clara community about energy
efficiency and/or renewable energy.

Energy Efficiency in California’s Public Power Sector — 2025 A-239
• Community Outreach Grants for Energy Efficiency and Building Electrification Education
- Silicon Valley Power offers grants up to $10,000 for not-for-profit community-based
organizations to identify and provide outreach to underserved Santa Clara residential
and small business customers, with an emphasis on diversity, equity and inclusion.
Examples include but are not limited to educational videos, online resources, printed
outreach materials, webinars or workshops.
Evaluation, Measurement & Verification Studies
Silicon Valley Power regularly conducts EM&V studies of its rebate programs. The most current
study is planned to kick off in March 2025 and will be available in the fall. All past EM&V studies
conducted on behalf of Silicon Valley Power can be found on the California Municipal Utilities
Association website: https://www.cmua.org/emv-reports.
Major Differences or Diversions from CA POU TRM for Energy Savings
Silicon Valley Power uses the California eTRM for the majority of its energy savings. Where no
savings value exists, Silicon Valley Power uses actual savings verified through metering or an
approved measurement and verification plan. In the case of lighting projects, Silicon Valley
Power uses a lighting calculator that utilizes actual operating hours. A copy of the calculator can
be found at siliconvalleypower.com/businesses/rebates.

Energy Efficiency in California’s Public Power Sector — 2025 A-240
TABLE SVP-1. Energy Efficiency Program Results by End Use
Summary by End Use
Resource Savings Summary
Cost Test Results
End Use
Gross Peak
Savings (kW)
Gross Annual
Energy Savings
(kWh)
Gross Lifecycle
Energy Savings
(kWh)
Net Peak
Savings (kW)
Net Annual
Energy Savings
(kWh)
Net Lifecycle
Energy Savings
(kWh)
Net Lifecycle GHG
Reductions (Tons)
Total Utility
Cost
PAC
TRC
Utility
($/kWh)
Appliance & Plug Loads
1
18,475
69,224
1
16,369
59,955
12
$1,116,779
0.01
0.01
21.097
Commercial Refrigeration
1
4,249
56,928
0
3,117
40,964
9
$19,388
0.28
0.26
0.611
HVAC - Cooling
1,285
12,932,122
193,981,830
1,092
10,992,304
164,884,555
34,878
$1,675,294
13.25
3.48
0.014
HVAC - Heat Pump
0
9,855
118,260
0
4,928
59,130
12
$54,250
0.13
0.12
1.155
Lighting - Indoor
300
2,702,622
13,513,110
195
1,762,401
8,812,004
1,804
$1,152,633
0.92
0.45
0.143
Process
23
204,392
3,065,880
20
173,733
2,605,998
550
$52,546
6.71
2.18
0.027
Energy Efficiency
1,610
15,871,715
210,805,231
1,309
12,952,851
176,462,607
37,265
$4,070,890
5.81
2.34
0.030
Service & Domestic Hot Water
0
48,776
487,756
0
48,776
487,756
96
($804,475)
0.01
0.01
-1.995
Electrification
0
48,776
487,756
0
48,776
487,756
96
($804,475)
0.01
0.01
-1.995
Appliance & Plug Loads
0
24,788
41,502
0
24,788
41,502
8
$710,427
0.01
0.01
17.420
Low-Income
0
24,788
41,502
0
24,788
41,502
8
$710,427
0.01
0.01
17.420
EE, Low Income and Electrification
1,610
15,945,278
211,334,490
1,309
13,026,415
176,991,865
37,369
$3,976,841
5.94
2.36
0.030
C&S and T&D
$0
Utility Total
1,610
15,945,278
211,334,490
1,309
13,026,415
176,991,865
37,369
$3,976,841
5.94
2.36
0.030

Energy Efficiency in California’s Public Power Sector — 2025 A-241
TABLE SVP-2. Energy Efficiency Program Results by Sector
Summary by Sector
Resource Savings Summary
Cost Test Results
Sector
Gross Peak
Savings (kW)
Gross Annual
Energy Savings
(kWh)
Gross Lifecycle
Energy Savings
(kWh)
Net Peak
Savings (kW)
Net Annual
Energy Savings
(kWh)
Net Lifecycle
Energy Savings
(kWh)
Net Lifecycle GHG
Reductions (Tons)
Total Utility
Cost
PAC
TRC
Utility
($/kWh)
Commercial
1,608
15,853,240
210,736,008
1,308
12,936,482
176,402,652
37,253
$2,954,111
8.00
2.63
0.022
Residential
1
18,475
69,224
1
16,369
59,955
12
$1,116,779
0.01
0.01
21.097
Energy Efficiency
1,610
15,871,715
210,805,231
1,309
12,952,851
176,462,607
37,265
$4,070,890
5.81
2.34
0.030
Residential
0
48,776
487,756
0
48,776
487,756
96
($804,475)
0.01
0.01
-1.995
Electrification
0
48,776
487,756
0
48,776
487,756
96
($804,475)
0.01
0.01
-1.995
Residential
0
24,788
41,502
0
24,788
41,502
8
$710,427
0.01
0.01
17.420
Low-Income
0
24,788
41,502
0
24,788
41,502
8
$710,427
0.01
0.01
17.420
EE, Low Income and Electrification
1,610
15,945,278
211,334,490
1,309
13,026,415
176,991,865
37,369
$3,976,841
5.94
2.36
0.030
C&S and T&D
$0
Utility Total
1,610
15,945,278
211,334,490
1,309
13,026,415
176,991,865
37,369
$3,976,841
5.94
2.36
0.030
Energy Efficiency in California’s Public Power Sector — 2025 A-242
TABLE SVP-3. Energy Efficiency Program Results by Building Type
Summary by Building Type
Resource Savings Summary
Cost Test Results
Building Type
Gross Peak
Savings (kW)
Gross Annual
Energy Savings
(kWh)
Gross Lifecycle
Energy Savings
(kWh)
Net Peak
Savings (kW)
Net Annual
Energy Savings
(kWh)
Net Lifecycle
Energy Savings
(kWh)
Net Lifecycle GHG
Reductions (Tons)
Total Utility
Cost
PAC
TRC
Utility
($/kWh)
Any
1,610
15,858,396
210,782,932
1,309
12,940,865
176,442,537
37,261
$3,727,593
6.34
2.42
0.028
Residential - Single-Family
0
13,319
22,300
0
11,987
20,070
4
$343,298
0.01
0.01
17.407
Energy Efficiency
1,610
15,871,715
210,805,231
1,309
12,952,851
176,462,607
37,265
$4,070,890
5.81
2.34
0.030
Multiple
0
48,776
487,756
0
48,776
487,756
96
($804,475)
0.01
0.01
-1.995
Electrification
0
48,776
487,756
0
48,776
487,756
96
($804,475)
0.01
0.01
-1.995
Residential - Single-Family
0
24,788
41,502
0
24,788
41,502
8
$710,427
0.01
0.01
17.420
Low-Income
0
24,788
41,502
0
24,788
41,502
8
$710,427
0.01
0.01
17.420
EE, Low Income and Electrification
1,610
15,945,278
211,334,490
1,309
13,026,415
176,991,865
37,369
$3,976,841
5.94
2.36
0.030
C&S and T&D
$0
Utility Total
1,610
15,945,278
211,334,490
1,309
13,026,415
176,991,865
37,369
$3,976,841
5.94
2.36
0.030

Energy Efficiency in California’s Public Power Sector — 2025 A-243
TRUCKEE DONNER PUBLIC UTILITY DISTRICT
Truckee Donner Public Utility District at a Glance
• Climate Zone: 16
• Customers: 14,676
• Total annual retail sales: 166,385 MWh
• Annual Retail Revenue: $33,149,400
• Annual energy efficiency expenditures for reporting year: $659,750
• Gross annual savings from reporting year portfolio: 163 MWh
Truckee Donner Public Utility District Overview
Truckee Donner Public Utility District (TDPUD) serves electricity and water to the greater
Truckee area comprised of approximately 44 square miles in eastern Nevada County and
approximately 1.5 square miles in adjacent Placer County. TDPUD is governed by a locally
elected Board of Directors consisting of 5 members with staggered 4-year terms and operates
on a calendar year budget. TDPUD is a transmission-dependent utility within NV Energy’s
control area and secures electric resources primarily through the Utah Associated Municipal
Power System (UAMPS). TDPUD has been successful in transitioning towards renewable energy
sources (well in excess of our Renewable Portfolio Standard requirements), keeping rates
stable, and investing in accessible, cost-effective, energy efficiency programs.
Residential, 163
Commercial, 0
Gross Energy Savings (MWh)
Residential Commercial Industrial Agricultural Other Low Income T&D Electrification

Energy Efficiency in California’s Public Power Sector — 2025 A-244
Major Program and Portfolio Changes
This year TDPUD has continued to maintain its programs as they start to mature. No significant
changes were made in 2024.
Program and Portfolio Highlights
TDPUD’s Residential Energy Survey’s has historically been very popular program with
customers. In the fourth quarter of 2023 TDPUD expanded its virtual energy audit services to all
customers. PY 2024 marks the first complete year for which this program was available to
customers. The District continued to offer complimentary energy audits to commercial
customers on an ad hoc basis (upon request).
The District has seen increased uptake on heat-pumps and heat-pump water heaters, as well as
for induction cooktops in 2024. Uptake on traditional energy efficiency measures have seen a
slight plateau, though interest in TDPUD's programs are consistent with local economic
conditions and customer satisfaction is high.
Commercial, Industrial & Agricultural Programs
Commercial Custom Rebate (Non-Res Process): Provides incentives to commercial electric
customers for replacing inefficient plant equipment with high efficiency equipment. Customers
receive a rebate proportional to the projected first year energy savings. No activity occurred for
this program in 2024.
Commercial Energy Survey: The District provides ad hoc energy surveys to commercial
customers upon request, and subject to staff resources. These energy surveys provide
customers analysis of their energy use patterns and an on-site review of their facilities and
equipment. The complimentary survey delivers a set of no-capitol, low-capital, and high-capitol
recommendations for business owners to follow-up on.
Commercial Efficient Upgrades: The District began working on a commercial menu program
(equivalent in implementation to our Residential Energy Upgrades). The program will officially
launch in 2025, though a couple of rebates were funneled through in 2024 as a pilot.
Residential Programs
Residential Appliance Rebate (Appliance): Provides increasing incentives to customers to
purchase more energy efficient appliances as identified by Energy Star. Due to the saturation of
Energy Star appliance purchases this program now only provides rebates for induction cook-
tops and energy star air purifiers.
Heat Pump Water Heater (Res Electric Water Heater): Provides a $750 rebate for electric water
heaters with a UEF > 2.85, and $1,000 for gas to electric conversions.

Energy Efficiency in California’s Public Power Sector — 2025 A-245
Residential Building Efficiency Rebates (Res Shell): Provides an incentive of up to $200 each for
building envelope and/or duct air leakage tests and up to $500 (50% of project cost) each for
building envelope or duct leakage mitigation.
Thermally Efficient Windows Rebate (Res Shell): Provides an incentive of $3.50 per square foot
of window to replace qualifying single-pane windows. Primary heating source must be a
permanent electric space heating system.
Water-Efficient Toilet Rebate (Non-Res Process): Encourages customers to replace high-water
use toilets with low water use toilets (1.28 and 1.6 GPF) by providing increasing incentives for
more efficient toilets. Rebates range from $25 to $100.
EV Charger Rebates: This rebate pays up to $950 for any (new) EV smart charger installed at a
customer's home with proof of an EV registered at the address. Lower rebates available if the
EV charger is not “smart” but is Energy Star listed.
Heat Pumps (Space Heating): Heat-pumps replace existing gas furnaces or older (inefficient)
heat pumps as the main source of heat for the customer. Rebates are tiered based on the
efficiency of the unit(s) being installed and scale with the size of the system (in Tons). Rebates
span from $250 per Ton for an 8.5 HSPF system replacing a pre-existing heat pump to $800 per
Ton for a 10 HSPF unit replacing a gas furnace.
Complementary Programs
Residential Energy Survey – RES (Res comprehensive): Provides free residential energy surveys
and free energy and water-saving measures energy efficient LED bulbs, low-flow shower heads,
faucet aerators, weather stripping, and pipe insulation at the time of survey. Customers are
also informed about TDPUD conservation programs and good energy efficiency habits that they
may benefit from and provided with associated literature.
Commercial Energy Survey: The District provides ad hoc energy surveys to commercial
customers upon request, and subject to staff resources. These energy surveys provide
customers analysis of their energy use patterns and an on-site review of their facilities and
equipment. The complimentary survey delivers a set of no-capitol, low-capital, and high-capitol
recommendations for business owners to follow-up on.
Payment Assistance Program Income-Qualified (Res Comprehensive): Provides an annual bill
credit and a free residential energy survey to income qualified customers. Customers are
qualified by an intermediary agency and are eligible for a one-time credit equal to two-times
their highest energy charge in the past 12-months upon completion of the required Residential
Energy Survey (RES). The requirement of the RES has been suspended during the COVID-19
crisis and all participants will be offered the RES when re-instated.
Patricia S. Sutton Conservation Garden (Not Evaluated): Promotes water-efficient landscaping
by demonstrating, at the TDPUD’s headquarters, native and drought tolerant plants,

Energy Efficiency in California’s Public Power Sector — 2025 A-246
hardscaping/mulching techniques, and efficient irrigation. Plant lists, design, and materials used
in the project are all available via a web-based resource at www.tdpud.org.
School Conservation Education (Res Comprehensive): Promotes energy and water conservation
through an innovative series of programs designed to both educate students and deliver, for
free, energy and water savings measures.
Renewable Energy Generation: The District helps buy down the cost of additional renewable
generation components within its energy portfolio. This increases our renewables within our
RPS while maintaining low rates for our customers.
Evaluation, Measurement & Verification Studies
TDPUD is currently securing an EM&V contractor for a post hoc evaluation of PY 2024. Results
will be reported via TDPUD's website once available.
Major Differences or Diversions from CA POU TRM for Energy Savings
Energy savings were predominately derived from the CA eTRM and in some cases were pulled
from the CMUA POU TRM or from the Pacific Northwest Regional Technical Forum (RTF). One
notable exception is found in the embedded energy value applied to our water-energy nexus
measures. The embedded energy content for water-energy nexus measures was derived by our
EM&V consultant in 2014 using actual water pumping data provided by the District.
Energy Efficiency in California’s Public Power Sector — 2025 A-247
TABLE TDPUD-1. Energy Efficiency Program Results by End Use
Summary by End Use
Resource Savings Summary
Cost Test Results
End Use
Gross Peak
Savings (kW)
Gross Annual
Energy Savings
(kWh)
Gross Lifecycle
Energy Savings
(kWh)
Net Peak
Savings (kW)
Net Annual
Energy Savings
(kWh)
Net Lifecycle
Energy Savings
(kWh)
Net Lifecycle GHG
Reductions (Tons)
Total Utility
Cost
PAC
TRC
Utility
($/kWh)
Appliance & Plug Loads
0
1,229
13,148
0
676
7,232
3
$13,233
0.06
0.07
2.247
Building Envelope
0
15,791
406,797
0
4,422
113,903
24
$25,180
0.11
0.11
0.366
HVAC - Heat Pump
10
84,994
1,274,907
5
46,747
701,199
250
$25,136
3.08
1.90
0.048
Miscellaneous
1
13,088
21,214
1
9,226
16,133
6
$396,146
24.72
24.40
28.699
Process
0
61
666
0
33
366
0
$109,019
0.00
0.00
367.590
Service & Domestic Hot Water
5
48,116
481,155
3
26,464
264,635
95
$5,416
5.55
4.90
0.025
Whole Building
0
47
47
0
47
47
0
$85,620
0.00
0.00
1,806.325
Energy Efficiency
17
163,326
2,197,935
10
87,614
1,103,515
378
$659,750
15.01
15.11
0.793
EE, Low Income and Electrification
17
163,326
2,197,935
10
87,614
1,103,515
378
$659,750
15.01
15.11
0.793
C&S and T&D
$0
Utility Total
17
163,326
2,197,935
10
87,614
1,103,515
378
$659,750
15.01
15.11
0.793
Energy Efficiency in California’s Public Power Sector — 2025 A-248
TABLE TDPUD-2. Energy Efficiency Program Results by Sector
Summary by Sector
Resource Savings Summary
Cost Test Results
Sector
Gross Peak
Savings (kW)
Gross Annual
Energy Savings
(kWh)
Gross Lifecycle
Energy Savings
(kWh)
Net Peak
Savings (kW)
Net Annual
Energy Savings
(kWh)
Net Lifecycle
Energy Savings
(kWh)
Net Lifecycle GHG
Reductions (Tons)
Total Utility
Cost
PAC
TRC
Utility
($/kWh)
Commercial
0
61
666
0
33
366
0
$106,559
0.00
0.00
359.296
Residential
17
163,265
2,197,269
10
87,581
1,103,149
378
$553,190
17.91
18.01
0.665
Energy Efficiency
17
163,326
2,197,935
10
87,614
1,103,515
378
$659,750
15.01
15.11
0.793
EE, Low Income and Electrification
17
163,326
2,197,935
10
87,614
1,103,515
378
$659,750
15.01
15.11
0.793
C&S and T&D
$0
Utility Total
17
163,326
2,197,935
10
87,614
1,103,515
378
$659,750
15.01
15.11
0.793
Energy Efficiency in California’s Public Power Sector — 2025 A-249
TABLE TDPUD-3. Energy Efficiency Program Results by Building Type
Summary by Building Type
Resource Savings Summary
Cost Test Results
Building Type
Gross Peak
Savings (kW)
Gross Annual
Energy Savings
(kWh)
Gross Lifecycle
Energy Savings
(kWh)
Net Peak
Savings (kW)
Net Annual
Energy Savings
(kWh)
Net Lifecycle
Energy Savings
(kWh)
Net Lifecycle GHG
Reductions (Tons)
Total Utility
Cost
PAC
TRC
Utility
($/kWh)
Residential
17
163,265
2,197,269
10
87,581
1,103,149
378
$553,190
17.91
18.01
0.665
Retail - Small
0
61
666
0
33
366
0
$106,559
0.00
0.00
359.296
Energy Efficiency
17
163,326
2,197,935
10
87,614
1,103,515
378
$659,750
15.01
15.11
0.793
EE, Low Income and Electrification
17
163,326
2,197,935
10
87,614
1,103,515
378
$659,750
15.01
15.11
0.793
C&S and T&D
$0
Utility Total
17
163,326
2,197,935
10
87,614
1,103,515
378
$659,750
15.01
15.11
0.793

Energy Efficiency in California’s Public Power Sector — 2025 A-250
TURLOCK IRRIGATION DISTRICT
Turlock Irrigation District at a Glance
• Climate Zone: 12
• Customers: 95,780
• Total annual retail sales: 2,258,282 MWh
• Annual Retail Revenue: $321,738,686
• Annual energy efficiency expenditures for reporting year: $1,340,341
• Gross annual savings from reporting year portfolio: 2,292 MWh
Turlock Irrigation District Overview
Turlock Irrigation District (TID) continues to help customers achieve energy savings through the
implementation and promotion of a variety of energy efficiency programs for all rate classes.
Many programs provide rebate opportunities to encourage customers to conserve energy. A
significant portion of the energy efficiency measures adopted by our customers were
implemented by industrial and commercial segments. TID provides a variety of options for
businesses that are looking to make changes in their existing systems by making upgrades or
retrofitting their existing facility. Rebates are available that address areas such as lighting,
compressed air systems, refrigeration systems, motors, gaskets, chillers and many other
systems components.
Residential, 499
Commercial, 66
Industrial, 1,345
Agricultural, 79
Other, 137
Low Income, 166
Gross Energy Savings (MWh)
Residential Commercial Industrial Agricultural Other Low Income T&D Electrification

Energy Efficiency in California’s Public Power Sector — 2025 A-251
Major Program and Portfolio Changes
We also had our Electric Vehicle & Charging rebate programs, which has seen a large increase in
rebates since we started these programs in 2019. These programs were funded through the
Low Carbon Fuel Standard (LCSF) program which promotes GHG reductions through
transportation electrification. TID had offered residential and non-residential customers
rebates when they purchased a plug-in electric vehicle or installed an EV charger. TID has
expended $1,251,008.61 and issued 2,342 rebates for residential customers, 94 for non-
residential through 2024. TID has also installed 10 TID-owned EV Level 2 Chargers for public
use.
Program and Portfolio Highlights
TID’s Custom rebate accounted for 90% of the total program savings in 2024. This was driven by
lighting projects completed by our non-residential customers. TID is continuing this lighting
program through the end of 2025, at which time it will be retired and no longer available.
Commercial, Industrial & Agricultural Programs
• Commercial LED rebate programs: TID offers our non-residential customers a lighting
rebate that is paid based on first year kWh savings.
• Commercial and Industrial HVAC: TID offers a prescriptive rebate for heating and cooling
measures that, as a summer peaking utility, can greatly benefit our customers.
Residential Programs
TID offers many rebates for Heating & Cooling, Appliances and General Improvements. In 2024,
TID adopted the Residential HVAC Tuneup rebate program year around, offering customers a
rebate incentive when they had a tuneup performed on their heating & cooling systems. During
this time, we saw more than 200 customers take advantage of this rebate. We marketed both
to our customers and local HVAC contractors to promote the new program, which has made
this program successful.
Multifamily Direct Install Program: TID has contracted to provide weatherization services for
residents who live in multifamily complexes. The program enables customers to reduce their
energy bills by implementing feasible measures to make their homes more energy efficient.
Complementary Programs
• TID CARES Program: An energy assistance program for qualified customers to receive a
discount on their monthly energy bills. The CARES program reduces the monthly
customer charge of $17 to $6, a savings of $11, and provides a 15% discount on the first
800 kWh energy charges.

Energy Efficiency in California’s Public Power Sector — 2025 A-252
• Medical Rate Assistance: The District provides a 50% discount on the first 500-kWh
energy charges for customers who use additional energy due to life-support equipment
or a medical condition.
• Weatherization: TID has contracted with organizations within our community to
provide weatherization services for families who meet the income qualification
guidelines. The program enables families to reduce their energy bills by making their
homes more energy efficient.
Evaluation, Measurement & Verification Studies
Our 2023 EM&V is available at: https://www.cmua.org/emv-reports
Major Differences or Diversions from CA POU TRM for Energy Savings
TID continues to calculate the savings for each individual project. In order to capture actual
savings for our lighting rebates, paid by first year kWh savings, we administer a pre-inspection
for each project to establish a baseline usage. We also administer a post-inspection to confirm
the number of fixtures that were upgraded, installed and de-lamped. In doing this we are able
to confirm actual savings as precisely as possible.

Energy Efficiency in California’s Public Power Sector — 2025 A-253
TABLE TID-1. Energy Efficiency Program Results by End Use
Summary by End Use
Resource Savings Summary
Cost Test Results
End Use
Gross Peak
Savings (kW)
Gross Annual
Energy Savings
(kWh)
Gross Lifecycle
Energy Savings
(kWh)
Net Peak
Savings (kW)
Net Annual
Energy Savings
(kWh)
Net Lifecycle
Energy Savings
(kWh)
Net Lifecycle GHG
Reductions (Tons)
Total Utility
Cost
PAC
TRC
Utility
($/kWh)
Any
0
867
13,006
0
737
11,055
4
$2,505
0.52
0.47
0.303
Appliance & Plug Loads
87
11,408
159,712
74
9,697
135,755
48
$28,244
0.57
0.44
0.273
Building Envelope
47
91,929
1,011,221
31
63,301
696,313
243
$142,930
0.86
0.95
0.253
HVAC - Cooling
9
16,725
131,504
7
13,871
110,052
47
$43,514
0.67
0.38
0.464
Lighting - Indoor
2
39,326
589,888
2
29,966
449,483
163
$34,199
1.53
1.29
0.102
Miscellaneous
0
154
1,386
0
131
1,178
0
$689
0.18
0.18
0.693
Service & Domestic Hot Water
1
5,529
55,289
1
4,658
46,583
17
$2,915
1.50
2.29
0.076
Low-Income
146
165,938
1,962,005
115
122,361
1,450,419
522
$254,995
0.89
0.79
0.223
Appliance & Plug Loads
0
62,644
671,254
0
33,749
361,431
119
$31,456
1.26
0.44
0.107
Building Envelope
3
3,913
47,196
1
1,313
17,573
6
$4,779
0.43
0.23
0.361
Commercial Refrigeration
0
57,414
861,218
0
34,449
516,731
143
$30,389
2.41
1.89
0.079
HVAC - Cooling
283
590,562
8,745,473
167
350,238
5,299,740
1,846
$467,581
2.03
1.14
0.121
Lighting - Indoor
19
1,163,250
17,415,061
10
638,903
9,565,353
3,105
$444,564
2.20
1.04
0.062
Lighting - Outdoor
3
137,116
2,056,746
2
75,414
1,131,210
520
$57,446
2.28
1.45
0.068
Process
0
6,669
66,688
0
4,001
40,013
14
$3,253
1.33
0.31
0.098
Service & Domestic Hot Water
0
11,524
115,243
0
6,757
67,566
25
$5,065
1.34
0.71
0.091
Water Pumping / Irrigation
0
78,620
1,179,300
0
31,448
471,720
165
$26,496
1.96
0.34
0.075
Whole Building
16
14,550
290,996
13
12,367
247,347
78
$14,316
1.66
1.66
0.085
Energy Efficiency
324
2,126,262
31,449,174
193
1,188,640
17,718,683
6,022
$1,085,345
2.08
1.03
0.082
EE, Low Income and Electrification
470
2,292,200
33,411,179
308
1,311,000
19,169,103
6,545
$1,340,341
1.85
1.00
0.094
C&S and T&D
$0
Utility Total
470
2,292,200
33,411,179
308
1,311,000
19,169,103
6,545
$1,340,341
1.85
1.00
0.094

Energy Efficiency in California’s Public Power Sector — 2025 A-254
TABLE TID-2. Energy Efficiency Program Results by Sector
Summary by Sector
Resource Savings Summary
Cost Test Results
Sector
Gross Peak
Savings (kW)
Gross Annual
Energy Savings
(kWh)
Gross Lifecycle
Energy Savings
(kWh)
Net Peak
Savings (kW)
Net Annual
Energy Savings
(kWh)
Net Lifecycle
Energy Savings
(kWh)
Net Lifecycle GHG
Reductions (Tons)
Total Utility
Cost
PAC
TRC
Utility
($/kWh)
Residential
146
165,938
1,962,005
115
122,361
1,450,419
522
$254,995
0.89
0.79
0.223
Low-Income
146
165,938
1,962,005
115
122,361
1,450,419
522
$254,995
0.89
0.79
0.223
Agricultural
0
78,620
1,179,300
0
31,448
471,720
165
$26,496
1.96
0.34
0.075
Any
3
137,116
2,056,746
2
75,414
1,131,210
520
$57,446
2.28
1.45
0.068
Commercial
10
66,025
990,369
5
34,054
510,808
176
$26,081
2.06
0.95
0.068
Industrial
155
1,345,069
20,142,687
92
753,724
11,285,861
3,498
$551,780
2.26
0.93
0.065
Residential
156
499,432
7,080,071
94
293,999
4,319,084
1,663
$423,543
1.82
1.43
0.134
Energy Efficiency
324
2,126,262
31,449,174
193
1,188,640
17,718,683
6,022
$1,085,345
2.08
1.03
0.082
EE, Low Income and Electrification
470
2,292,200
33,411,179
308
1,311,000
19,169,103
6,545
$1,340,341
1.85
1.00
0.094
C&S and T&D
$0
Utility Total
470
2,292,200
33,411,179
308
1,311,000
19,169,103
6,545
$1,340,341
1.85
1.00
0.094

Energy Efficiency in California’s Public Power Sector — 2025 A-255
TABLE TID-3. Energy Efficiency Program Results by Building Type
Summary by Building Type
Resource Savings Summary
Cost Test Results
Building Type
Gross Peak
Savings (kW)
Gross Annual
Energy Savings
(kWh)
Gross Lifecycle
Energy Savings
(kWh)
Net Peak
Savings (kW)
Net Annual
Energy Savings
(kWh)
Net Lifecycle
Energy Savings
(kWh)
Net Lifecycle GHG
Reductions (Tons)
Total Utility
Cost
PAC
TRC
Utility
($/kWh)
Residential
109
85,674
1,037,841
93
72,823
882,165
299
$131,990
0.89
0.71
0.191
Residential - Mobile Home
8
32,976
399,752
5
19,785
239,851
88
$40,476
1.02
1.02
0.215
Residential - Multi-Family
28
41,770
469,387
17
25,062
281,632
118
$79,143
0.80
0.80
0.349
Residential - Single-Family
1
5,518
55,025
1
4,690
46,771
17
$3,386
1.30
1.84
0.088
Low-Income
146
165,938
1,962,005
115
122,361
1,450,419
522
$254,995
0.89
0.79
0.223
Assembly
2
8,467
127,005
1
4,657
69,853
24
$3,762
2.06
0.72
0.072
Grocery
0
51,232
768,488
0
30,740
461,093
124
$27,970
2.41
1.91
0.081
Other Agricultural
0
85,289
1,245,988
0
35,449
511,733
179
$29,750
1.89
0.34
0.077
Other Industrial
3
137,116
2,056,746
2
75,414
1,131,210
520
$57,446
2.28
1.45
0.068
Residential
82
377,911
5,867,681
49
222,584
3,562,631
1,404
$355,410
1.90
1.69
0.139
Residential - Single-Family
74
121,521
1,212,391
45
71,415
756,453
259
$68,133
1.43
0.68
0.115
Restaurant - Fast-Food
9
57,558
863,364
4
29,397
440,955
152
$22,319
2.07
1.00
0.068
Storage - Conditioned
150
549,497
8,242,454
90
306,906
4,603,584
1,443
$219,648
2.25
0.75
0.064
Storage - Unconditioned
3
565,834
8,487,517
2
311,209
4,668,134
1,511
$211,300
2.18
1.43
0.060
Warehouse - Refrigerated
2
171,836
2,577,541
1
100,869
1,513,038
406
$89,609
2.47
0.70
0.079
Energy Efficiency
324
2,126,262
31,449,174
193
1,188,640
17,718,683
6,022
$1,085,345
2.08
1.03
0.082
EE, Low Income and Electrification
470
2,292,200
33,411,179
308
1,311,000
19,169,103
6,545
$1,340,341
1.85
1.00
0.094
C&S and T&D
$0
Utility Total
470
2,292,200
33,411,179
308
1,311,000
19,169,103
6,545
$1,340,341
1.85
1.00
0.094

Energy Efficiency in California’s Public Power Sector — 2025 A-256
CITY OF UKIAH
City of Ukiah at a Glance
• Climate Zone: 2
• Customers: 7,899
• Total annual retail sales: 105,784 MWh
• Annual Retail Revenue: $30,112,700
• Annual energy efficiency expenditures for reporting year: $114,707
• Gross annual savings from reporting year portfolio: 107 MWh
Ukiah Overview
The City of Ukiah (Ukiah) is located in Mendocino County on Highway 101 approximately 100
miles north of San Francisco. The City is committed to helping customers manage energy use
through energy education and a comprehensive menu of energy efficiency incentives. The City
also provides funding to assist income-qualified customers.
Major Program and Portfolio Changes
There were no major program changes in FY24. Ukiah started a Low-Income Direct Install
Program in FY23 and a Commercial Lighting Do It Yourself program will begin in FY25. Ukiah
also began incentivizing induction cooktops and ranges in FY24. Additionally, in FY24, Ukiah
Residential, 84
Commercial, 23
Electrification, 0.21
Gross Energy Savings (MWh)
Residential Commercial Industrial Agricultural Other Low Income T&D Electrification

Energy Efficiency in California’s Public Power Sector — 2025 A-257
offered a rebate for replacing gas-powered outdoor yard equipment with fully electric
equipment.
Program and Portfolio Highlights
The Residential Direct Install Program delivered the greatest percentage of savings in FY24,
accounting for 61% of the total savings. Ukiah achieved 51% of the target energy savings for the
past five reporting years.
Commercial, Industrial & Agricultural Programs
Ukiah provides comprehensive energy efficiency incentive program offerings for commercial
and industrial customers focusing on energy efficiency and peak load reduction. Rebates are
available for upgraded lighting, HVAC, appliances, refrigeration equipment, and electronics, and
in cases where an analysis is performed rebates can be offered for additional equipment that
reduces energy use and demand. Energy specialists provide on-site energy audits. Energy
efficiency measures are recommended, and additional visits are completed upon request.
• Non-Res Lighting: Ukiah offers rebates to business owners who invest in the installation
of energy-efficient lighting upgrades. There is a prevalence of inefficient lighting
throughout the city instead of more efficient fluorescent or LED fixtures.
• Non-Res HVAC: Ukiah offers rebates to commercial customers for energy-efficient HVAC
upgrades.
• Non-Res Refrigeration: Rebates are available to improve the efficiency of commercial
refrigeration systems.
• Non-Res Appliances: Rebates are available for energy-efficient cooking equipment such
as ovens, dishwashers, fryers, griddles, etc.
• Non-Res Electronics: The City offers rebates for uninterrupted power supplies, plug-load
occupancy sensors, and smart power strips.
• Non-Res Custom: The City offers rebates to business owners based on site-specific
consumption. Rebates are tailored to the individual business owner’s needs based on
the audit and the potential energy savings associated with the customer project.
Residential Programs
Ukiah provides comprehensive energy efficiency incentive program offerings for residential
customers. Rebates are offered for the installation of various energy efficiency measures, such
as lighting, HVAC, appliances, and weatherization. Energy specialists provide on-site energy
audits. Energy efficiency measures are recommended, and additional visits are completed upon
request.
• Residential Lighting: Ukiah offers rebates to homeowners who install ENERGY STAR®
qualified LED lamps/bulbs, ceiling fans, and LED holiday lights.

Energy Efficiency in California’s Public Power Sector — 2025 A-258
• Residential HVAC: Ukiah offers rebates to homeowners who install high-performance
heat pumps and air-conditioners that exceed current state requirements. Ukiah also
offers a rebate for duct sealing when not required by code.
• Residential Equipment: Ukiah offers rebates to homeowners who purchase new ENERGY
STAR-certified products, including clothes washers, induction cooktops and ranges,
dishwashers, pool pumps, refrigerators, and advanced power strips. Rebates are also
available for refrigerator and freezer recycling.
• Residential Weatherization: Ukiah offers rebates to homeowners who invest in
weatherizing their homes, including attic and wall insulation, window
treatments/replacement, solar attic fans, and air sealing.
• Residential Water Heater Rebate: Ukiah offers rebates to homeowners who purchase a
new, energy-efficient electric water heater.
Complementary Programs
• Low-Income Programs: Ukiah offers a low-income bill assistance program to eligible
customers.
• Renewable Energy Program: Ukiah offers net metering agreements to customers
wishing to install Solar PV.
• Electric Yard Equipment rebates were offered in FY24 for replacing gas powered items
with fully electric equipment.
• Electric Vehicles: In addition to the 8 Tesla Fast Charging stations, the Electric Utility has
installed four Level II chargers in the downtown area and is reviewing additional
locations throughout the city. Ukiah has also received approval to offer a rebate for
installation of a Level 2 EV charger in customer homes and up to $4,000 for public or
workplace Level 2 chargers.
Evaluation, Measurement & Verification Studies
EM&V information for the City can be found at www.cmua.org.
Major Differences or Diversions from CA POU TRM for Energy Savings
Ukiah has relied heavily on the unit energy savings listed in CMUA’s POU TRM, the eTRM, and
the Bonneville Power Administration. The Commercial Lighting and Commercial Custom
programs use custom savings calculations.

Energy Efficiency in California’s Public Power Sector — 2025 A-259
TABLE Ukiah-1. Energy Efficiency Program Results by End Use
Summary by End Use
Resource Savings Summary
Cost Test Results
End Use
Gross Peak
Savings (kW)
Gross Annual
Energy Savings
(kWh)
Gross Lifecycle
Energy Savings
(kWh)
Net Peak
Savings (kW)
Net Annual
Energy Savings
(kWh)
Net Lifecycle
Energy Savings
(kWh)
Net Lifecycle GHG
Reductions (Tons)
Total Utility
Cost
PAC
TRC
Utility
($/kWh)
Any
0
212
3,392
0
212
3,392
1
$3,709
0.15
0.09
1.490
Electrification
0
212
3,392
0
212
3,392
1
$3,709
0.15
0.09
1.490
Appliance & Plug Loads
2
18,413
104,784
2
16,561
89,145
35
$32,905
0.54
0.51
0.409
Building Envelope
0
4,442
88,840
0
1,417
28,346
8
$5,264
0.58
0.68
0.273
HVAC - Cooling
28
5,312
78,225
17
3,925
58,023
24
$17,519
0.83
0.79
0.405
HVAC - Heat Pump
1
7,942
119,135
1
4,924
73,864
32
$16,685
1.00
0.81
0.302
Lighting - Indoor
9
44,319
460,787
8
40,784
421,914
155
$22,204
3.10
3.10
0.064
Lighting - Outdoor
3
18,346
209,371
2
15,123
172,556
76
$14,310
1.54
0.58
0.103
Service & Domestic Hot Water
2
7,811
78,111
1
2,393
23,928
9
$2,110
2.03
2.04
0.107
Energy Efficiency
45
106,586
1,139,254
30
85,127
867,775
340
$110,999
1.33
1.05
0.158
EE, Low Income and Electrification
45
106,798
1,142,646
30
85,339
871,167
341
$114,707
1.29
1.00
0.163
C&S and T&D
$0
Utility Total
45
106,798
1,142,646
30
85,339
871,167
341
$114,707
1.29
1.00
0.163
Energy Efficiency in California’s Public Power Sector — 2025 A-260
TABLE Ukiah-2. Energy Efficiency Program Results by Sector
Summary by Sector
Resource Savings Summary
Cost Test Results
Sector
Gross Peak
Savings (kW)
Gross Annual
Energy Savings
(kWh)
Gross Lifecycle
Energy Savings
(kWh)
Net Peak
Savings (kW)
Net Annual
Energy Savings
(kWh)
Net Lifecycle
Energy Savings
(kWh)
Net Lifecycle GHG
Reductions (Tons)
Total Utility
Cost
PAC
TRC
Utility
($/kWh)
Any
0
212
3,392
0
212
3,392
1
$3,709
0.15
0.09
1.490
Electrification
0
212
3,392
0
212
3,392
1
$3,709
0.15
0.09
1.490
Commercial
3
22,907
274,885
2
18,326
219,908
89
$6,621
3.94
0.86
0.038
Residential
42
83,679
864,369
28
66,802
647,867
251
$104,378
1.16
1.10
0.198
Energy Efficiency
45
106,586
1,139,254
30
85,127
867,775
340
$110,999
1.33
1.05
0.158
EE, Low Income and Electrification
45
106,798
1,142,646
30
85,339
871,167
341
$114,707
1.29
1.00
0.163
C&S and T&D
$0
Utility Total
45
106,798
1,142,646
30
85,339
871,167
341
$114,707
1.29
1.00
0.163
Energy Efficiency in California’s Public Power Sector — 2025 A-261
TABLE Ukiah-3. Energy Efficiency Program Results by Building Type
Summary by Building Type
Resource Savings Summary
Cost Test Results
Building Type
Gross Peak
Savings (kW)
Gross Annual
Energy Savings
(kWh)
Gross Lifecycle
Energy Savings
(kWh)
Net Peak
Savings (kW)
Net Annual
Energy Savings
(kWh)
Net Lifecycle
Energy Savings
(kWh)
Net Lifecycle GHG
Reductions (Tons)
Total Utility
Cost
PAC
TRC
Utility
($/kWh)
Any
0
212
3,392
0
212
3,392
1
$3,709
0.15
0.09
1.490
Electrification
0
212
3,392
0
212
3,392
1
$3,709
0.15
0.09
1.490
Any
2
865
4,905
1
523
2,965
1
$9,989
0.04
0.04
3.760
Multiple
43
82,039
803,397
29
68,224
647,684
246
$69,968
1.61
1.45
0.131
Residential
0
8,811
149,538
0
4,487
71,758
27
$21,060
0.70
0.73
0.403
Residential - Single-Family
0
760
12,084
0
604
9,905
4
$5,718
0.33
0.37
0.799
Retail - Large
0
14,111
169,330
0
11,289
135,464
62
$4,263
4.12
0.62
0.040
Energy Efficiency
45
106,586
1,139,254
30
85,127
867,775
340
$110,999
1.33
1.05
0.158
EE, Low Income and Electrification
45
106,798
1,142,646
30
85,339
871,167
341
$114,707
1.29
1.00
0.163
C&S and T&D
$0
Utility Total
45
106,798
1,142,646
30
85,339
871,167
341
$114,707
1.29
1.00
0.163
Energy Efficiency in California’s Public Power Sector — 2025 A-262
VERNON PUBLIC UTILITIES
Vernon Public Utilities at a Glance
• Climate Zone: 8
• Customers: 1,761
• Total annual retail sales: 1,031,891 MWh
• Annual Retail Revenue: $169,046,104
• Annual energy efficiency expenditures for reporting year: $113,887
• Gross annual savings from reporting year portfolio: 999 MWh
Vernon Overview
The City of Vernon, located in climate zone 8, is 5.2 square miles and located southeast of
Downtown Los Angeles. Founded in 1905, Vernon currently houses more than 1,800 businesses
that employ approximately 50,000 people, serving as a vital economic engine in the region.
Vernon is home to various businesses that specialize in food and agriculture, apparel, steel,
plastics, logistics, information technology and home furnishings.
Vernon Public Utilities (VPU) is an essential resource for the City’s ever-growing and evolving
business community. As such, the current and future energy efficiency portfolio of VPU is
designed to align with the utility's goal of serving its predominantly commercial and industrial
customer base with reliable and cost competitive utility rates.
Commercial, 999
Gross Energy Savings (MWh)
Residential Commercial Industrial Agricultural Other Low Income T&D Electrification

Energy Efficiency in California’s Public Power Sector — 2025 A-263
Major Program and Portfolio Changes
For FY24, VPU launched its Commercial Energy Rebate Program (CERP), which provided
customers with deemed incentives on various measures that include LED Lighting, HVAC, Heat
Pumps and restaurant equipment. In addition, the utility continues to educate its business
community on the importance of efficiency through its no-cost energy audit services. Over the
years, businesses have successfully leveraged VPU's complimentary energy audit services to
identify various efficiency opportunities, ranging from operational adjustments that involve
refrigeration controls to large scale LED lighting retrofits. VPU remains a key partner in the
energy efficiency journey as customers continue to identify options to lower operating costs.
With a customer base that is comprised mainly of large commercial and industrial customers,
one of the ongoing challenges faced by VPU is the limited types of efficiency measures and
projects can be implemented by the customer each year. Any complex energy efficiency project
implemented by a business requires proper financial planning, corporate approval for the
allocation of funds, and proactive budgeting for capital improvements. Depending on the
business needs at a given time, implementation of energy efficiency projects may or may not be
a priority.
Program and Portfolio Highlights
For FY24 portfolio highlights, VPU customers that are in the cold storage and food processing
sectors explored refrigeration control upgrades, plus evaporator motor and air compressor
replacements to achieve energy savings.
To help support these complex energy efficiency projects, VPU worked with a third-party
engineering consultant to conduct evaluation, measurement and verification studies to confirm
the validity of the savings generated.
LED Lighting retrofits also contributed to a portion of energy savings through VPU's custom
incentive program. Customers with 24/7 operations and large warehouses can see significant
savings by upgrading from non-LED to LED lighting technology. The utility's longstanding
Custom Incentive Program continues to lead the way in providing incentives for any commercial
electric customer that implements efficiency upgrades that produces above code savings.
Commercial, Industrial & Agricultural Programs
VPU's Commercial and Industrial programs are comprised of the following:
1. Custom Incentive Program (CIP): The CIP provides incentives for the implementation of
energy efficient technologies and equipment, such as LED lighting, variable speed drives, air
compressors, motors, refrigeration controls, and air conditioning upgrades.
2. Energy Audit Program: As part of this program, VPU provides no-cost on-site energy audits
for commercial and industrial businesses. The comprehensive energy audit includes a detailed

Energy Efficiency in California’s Public Power Sector — 2025 A-264
billing analysis of energy usage and costs, identification of energy efficiency measures,
recommended actions and referral to VPU's incentive programs.
3. Customer Directed Program (CDP): The CDP provides incentives for custom projects that
demonstrate energy savings. Customers are required to contribute a portion of the total project
cost and are only eligible if the proposed energy efficiency project does not qualify for any of
the other programs.
4. Commercial Energy Rebate Program (CERP): The CERP is a deemed energy efficiency offering
that provides rebates to businesses that install eligible measures to include LED Lighting, HVAC,
Heat Pumps and restaurant equipment.
5. Commercial EV Charger Incentive Program (CEVSE): VPU commercial electric customers are
eligible to receive a rebate (per port), for the installation of qualifying Level 2 EV Chargers and
Level 3 Direct Current (DC) Fast Chargers.
6. Commercial Electric Forklift Incentive Program (CEF): VPU commercial electric customers are
eligible to receive a rebate towards the lease or purchase of a qualifying electric forklift.
Residential Programs
VPU's Residential programs are comprised of the following:
1. Residential Electric Vehicle (EV) Rebate Program: VPU's residential electric customers are
eligible to receive incentives for the purchase or lease of a qualifying, new or used EV.
2. Residential Electric Vehicle (EV) Charger Rebate Program: VPU's residential electric
customers are eligible to receive incentives for the installation of a qualifying, smart Level 2 EV
Charger.
Complementary Programs
VPU's complementary programs and services are comprised of the following:
1. Energy Education and Outreach Services: VPU hosts meetings on a regular basis to provide
businesses with an update of the utility's latest offerings, which encompasses energy efficiency
programs. In addition, VPU also has a dedicated newsletter, and bill inserts that goes out to
utility customers to increase overall awareness on various initiatives that are spearheaded by
different city departments.
2. Time-of-Use (TOU) Rate Plans: VPU customers that meet the electrical demand threshold are
eligible to enroll in TOU rate plans that help businesses manage energy costs by taking
advantage of lower rates during off-peak periods and avoided higher on-peak rates when
energy resources are in demand.

Energy Efficiency in California’s Public Power Sector — 2025 A-265
Evaluation, Measurement & Verification Studies
For FY24, an EM&V study was conducted for a large wholesale food distributor that offers
fresh, frozen and packaged products to bakery and food service clients. The company operates
a cold storage facility that had to upgrade a significant amount of evaporator fan motors and
condenser fan motors. The motor control systems also contributed to additional energy savings
by toggling motor operating speeds based on compressor operation. VPU plans to continue to
leverage third party engineering consultants to conduct EM&V studies for complex energy
efficiency projects implemented by its large commercial and industrial customer base.
Major Differences or Diversions from CA POU TRM for Energy Savings
Due to Vernon's unique customer base that is comprised of almost all industrial and large
commercial customers, VPU relies on customized energy savings calculations that are derived
from an independent, third-party engineering analysis. The engineering analysis may reference
CA investor-owned utility work papers or other reputable industry sources where appropriate.
VPU may also utilize the eTRM for energy savings on certain deemed measures when the
opportunity arises.
Energy Efficiency in California’s Public Power Sector — 2025 A-266
TABLE VPU-1. Energy Efficiency Program Results by End Use
Summary by End Use
Resource Savings Summary
Cost Test Results
End Use
Gross Peak
Savings (kW)
Gross Annual
Energy Savings
(kWh)
Gross Lifecycle
Energy Savings
(kWh)
Net Peak
Savings (kW)
Net Annual
Energy Savings
(kWh)
Net Lifecycle
Energy Savings
(kWh)
Net Lifecycle GHG
Reductions (Tons)
Total Utility
Cost
PAC
TRC
Utility
($/kWh)
Appliance & Plug Loads
26
666,348
6,419,969
26
666,348
6,419,969
2,215
$73,408
9.35
2.11
0.014
Commercial Refrigeration
30
297,476
4,353,120
30
297,476
4,353,120
1,476
$36,761
11.50
2.73
0.012
HVAC - Heat Pump
2
3,302
48,320
2
3,302
48,320
16
$408
11.50
0.36
0.012
Lighting - Indoor
12
32,183
221,385
12
32,183
221,385
71
$3,310
7.93
0.72
0.017
Energy Efficiency
69
999,309
11,042,794
69
999,309
11,042,794
3,778
$113,887
10.01
2.15
0.013
EE, Low Income and Electrification
69
999,309
11,042,794
69
999,309
11,042,794
3,778
$113,887
10.01
2.15
0.013
C&S and T&D
$0
Utility Total
69
999,309
11,042,794
69
999,309
11,042,794
3,778
$113,887
10.01
2.15
0.013
Energy Efficiency in California’s Public Power Sector — 2025 A-267
TABLE VPU-2. Energy Efficiency Program Results by Sector
Summary by Sector
Resource Savings Summary
Cost Test Results
Sector
Gross Peak
Savings (kW)
Gross Annual
Energy Savings
(kWh)
Gross Lifecycle
Energy Savings
(kWh)
Net Peak
Savings (kW)
Net Annual
Energy Savings
(kWh)
Net Lifecycle
Energy Savings
(kWh)
Net Lifecycle GHG
Reductions (Tons)
Total Utility
Cost
PAC
TRC
Utility
($/kWh)
Commercial
69
999,309
11,042,794
69
999,309
11,042,794
3,778
$113,887
10.01
2.15
0.013
Energy Efficiency
69
999,309
11,042,794
69
999,309
11,042,794
3,778
$113,887
10.01
2.15
0.013
EE, Low Income and Electrification
69
999,309
11,042,794
69
999,309
11,042,794
3,778
$113,887
10.01
2.15
0.013
C&S and T&D
$0
Utility Total
69
999,309
11,042,794
69
999,309
11,042,794
3,778
$113,887
10.01
2.15
0.013
Energy Efficiency in California’s Public Power Sector — 2025 A-268
TABLE VPU-3. Energy Efficiency Program Results by Building Type
Summary by Building Type
Resource Savings Summary
Cost Test Results
Building Type
Gross Peak
Savings (kW)
Gross Annual
Energy Savings
(kWh)
Gross Lifecycle
Energy Savings
(kWh)
Net Peak
Savings (kW)
Net Annual
Energy Savings
(kWh)
Net Lifecycle
Energy Savings
(kWh)
Net Lifecycle GHG
Reductions (Tons)
Total Utility
Cost
PAC
TRC
Utility
($/kWh)
Multiple
26
666,348
6,419,969
26
666,348
6,419,969
2,215
$73,408
9.35
2.11
0.014
Other Commercial
12
32,183
221,385
12
32,183
221,385
71
$3,310
7.93
0.72
0.017
Warehouse - Refrigerated
31
300,778
4,401,440
31
300,778
4,401,440
1,492
$37,169
11.50
2.54
0.012
Energy Efficiency
69
999,309
11,042,794
69
999,309
11,042,794
3,778
$113,887
10.01
2.15
0.013
EE, Low Income and Electrification
69
999,309
11,042,794
69
999,309
11,042,794
3,778
$113,887
10.01
2.15
0.013
C&S and T&D
$0
Utility Total
69
999,309
11,042,794
69
999,309
11,042,794
3,778
$113,887
10.01
2.15
0.013
Energy Efficiency in California’s Public Power Sector — 2025 A-269
VICTORVILLE MUNICIPAL UTILITIES SERVICES
Victorville Municipal Utilities Services at a Glance
• Climate Zone: 14
• Customers: 91
• Total annual retail sales: 102,900 MWh
• Annual Retail Revenue: $20,007,000
• Annual energy efficiency expenditures for reporting year: $0
• Gross annual savings from reporting year portfolio: 0 MWh
Victorville Municipal Utilities Services Overview
• Victorville Municipal Utilities Services (VMUS) only serve non-residential customers.
• The annual budget for energy efficiency programs is $200,000.
• Peak demand was 21.1 MWs (0.5% less than last year).
• Sales were 102,900 MWhs (4.8% less than last year).
• The system load factor was 68.5%.
• Customers are served through 12 kV underground facilities with larger gauge ASCR
conductors to improve system reliability and reduce system losses.
Gross Energy Savings (MWh)
Residential Commercial Industrial Agricultural Other Low Income T&D Electrification

Energy Efficiency in California’s Public Power Sector — 2025 A-270
Program and Portfolio Highlights
• Time-of-use meters and customers’ access to their daily usage on the web portal
provide the data to assess the cost of their energy usage and demand requirements.
• Cost-effective, reliable, and feasible energy efficiency improvements are a priority in the
Victorville's integrated resource plan.
• Victorville serves municipal facilities that can be interrupted as scheduled.
Commercial, Industrial & Agricultural Programs
• Audits – Industrial – Non-Res Audits: On-site energy assessment and recommendations
designed to potentially improve energy operating efficiency and reduce load
requirements.
• Lighting – Industrial – Non-Res Lighting: Financial incentives to improve energy
efficiency for lighting applications, based on rate of $0.15/kWh for one year of energy
savings and $150/kW for each kW that has been reduced. The EE Program payment
shall not exceed 50% of the lighting material cost (including installation) or $50,000 per
FY, whichever is lower.
• New Construction Projects – Industrial – Non-Res Construction Projects: Financial
incentives for new equipment components that exceed state-mandated codes, federal-
mandated codes, industry-accepted performance standards, or other baseline energy
performance standards by more than 10%. Financial incentive payment is based on a
rate of $0.15/kWh for each kWh that has been reduced, $150/kW for each kW that has
been reduced, and $2/therm for each therm that has been reduced (whole building
approach) for one year of energy savings between the baseline energy performance
standards and the proposed energy performance standards for a whole building
approach. Financial incentive payment shall not exceed 50% of the cost difference
between standard and upgraded equipment and/or materials, or $100,000, whichever is
lower.
• Custom Energy Efficiency Incentives: Financial incentives payment for the replacement
of energy efficient equipment/technology that conserves energy and permanently
reduces coincident summer/winter on-peak load and exceeds state-mandated codes,
federal-mandated codes, industry accepted performance standards or other baseline
energy performance standards. Financial incentive payment is based on a rate of
$0.15/kWh or $2/therm for one year of energy savings and $150/kW for each kW that
has been reduced and shall not exceed 50% of the total cost associated with the
equipment/materials (including installation) or $50,000 per FY, whichever is lower.
• City Facilities: City owned facilities that are served by VMUS are qualified to participate
in any of the energy efficiency programs herein. Qualifying city facilities served by VMUS
could take advantage of our direct install program or custom incentives. The level of
incentives or direct install budget will be determined by VMUS on a case-by-case basis.

Energy Efficiency in California’s Public Power Sector — 2025 A-271
• Utility-Side Projects/Activities: Direct funding for projects/activities on the utility side of
the meter that promote a benefit to VMUS customers in terms of improved safety,
system integrity, energy efficiency, conservation, or Research and Development (R&D).
Projects must be authorized by the City Council as part of the annual operating budget
or through a subsequent request in a public meeting.
Residential Programs
Victorville only serves non-residential customers.
Complementary Programs
Achieved commercial operation for a long-term photovoltaic generating facility power purchase
agreement coupled with an 8 MW battery energy storage system.
Evaluation, Measurement & Verification Studies
Engineering analysis programs are the basis for energy savings and incentive calculations.
Victorville relies upon the Technical Reference Manual for energy savings estimates.
Energy Efficiency in California’s Public Power Sector — 2025 A-272
TABLE VMUS-1. Energy Efficiency Program Results by End Use
Summary by End Use
Resource Savings Summary
Cost Test Results
End Use
Gross Peak
Savings (kW)
Gross Annual
Energy Savings
(kWh)
Gross Lifecycle
Energy Savings
(kWh)
Net Peak
Savings (kW)
Net Annual
Energy Savings
(kWh)
Net Lifecycle
Energy Savings
(kWh)
Net Lifecycle GHG
Reductions (Tons)
Total Utility
Cost
PAC
TRC
Utility
($/kWh)
Lighting - Indoor
0
0
0
0
0
0
0
$0
0.000
Energy Efficiency
0
0
0
0
0
0
0
$0
0.000
EE, Low Income and Electrification
0
0
0
0
0
0
0
$0
0.000
C&S and T&D
$0
Utility Total
0
0
0
0
0
0
0
$0
0.000
Energy Efficiency in California’s Public Power Sector — 2025 A-273
TABLE VMUS-2. Energy Efficiency Program Results by Sector
Summary by Sector
Resource Savings Summary
Cost Test Results
Sector
Gross Peak
Savings (kW)
Gross Annual
Energy Savings
(kWh)
Gross Lifecycle
Energy Savings
(kWh)
Net Peak
Savings (kW)
Net Annual
Energy Savings
(kWh)
Net Lifecycle
Energy Savings
(kWh)
Net Lifecycle GHG
Reductions (Tons)
Total Utility
Cost
PAC
TRC
Utility
($/kWh)
Industrial
0
0
0
0
0
0
0
$0
0.000
Energy Efficiency
0
0
0
0
0
0
0
$0
0.000
EE, Low Income and Electrification
0
0
0
0
0
0
0
$0
0.000
C&S and T&D
$0
Utility Total
0
0
0
0
0
0
0
$0
0.000
Energy Efficiency in California’s Public Power Sector — 2025 A-274
Energy Efficiency in California’s Public Power Sector — 2025 A-275
TABLE VMUS-3. Energy Efficiency Program Results by Building Type
Summary by Building Type
Resource Savings Summary
Cost Test Results
Building Type
Gross Peak
Savings (kW)
Gross Annual
Energy Savings
(kWh)
Gross Lifecycle
Energy Savings
(kWh)
Net Peak
Savings (kW)
Net Annual
Energy Savings
(kWh)
Net Lifecycle
Energy Savings
(kWh)
Net Lifecycle GHG
Reductions (Tons)
Total Utility
Cost
PAC
TRC
Utility
($/kWh)
Manufacturing Light Industrial
0
0
0
0
0
0
0
$0
0.000
Energy Efficiency
0
0
0
0
0
0
0
$0
0.000
EE, Low Income and Electrification
0
0
0
0
0
0
0
$0
0.000
C&S and T&D
$0
Utility Total
0
0
0
0
0
0
0
$0
0.000

Energy Efficiency in California’s Public Power Sector — 2025 B-1
Appendix B
Lori Bovitz
Last Updated: 9-18-2023
Version: 2.0
ESPLabs™
Calculation Reference

Energy Efficiency in California’s Public Power Sector — 2025 B-2
Cost Benefit Calculations
The Cost/Benefit calculations in ESP are based on the Cost/Benefit tests described in the California
Standard Practice Manual. ESP calculates all the tests described in that manual. The following describes
the process used to calculate these and the other results in ESP.
Load Shape Assignment
The default Load Shape for a Measure is determined using a process that involves multiple fields in the
Measure:
• Current version of the Load Shape
• Load Shape is either local to the organization or “Shared”
• The following attributes of the Load Shape match the same attribute of the Measure:
o Climate Zone, or “All”
o Building Type, or “All”
o End Use
o Sector, or “All”
• If an IOU is defined for the Load Shape, then the IOU for the Load Shape must match the IOU for
the organization
o If no IOU is defined for the Load Shape, the Load Shape is available to all Measures
If more than one Load Shape matches the above criteria, ESP uses the following additional process to
determine the Load Shape for the Measure:
• ESP gives precedence to the following:
o Load Shapes local to your organization (as opposed to shared Load Shapes)
o Specific Building Type over “All”
o Specific Sector over “Non-Residential” or “All”
o Specific Climate Zone over “All”
Dual Baseline Savings, Cost, and Measure Life
The calculations for Gross Savings, Cost, and Measure Life in ESP depend on the selection of Measure
Application Type and Delivery Type in the Applied Measure Editor.

Energy Efficiency in California’s Public Power Sector — 2025 B-3
Each Measure contains the following fields used to calculate the Baseline values:
Note: Non-
zero Values for
both Code
Baseline and
Existing Baseline
are required for
the Measure to
support Dual
Baseline
calculations.

Energy Efficiency in California’s Public Power Sector — 2025 B-4
ESP calculates the actual 1st and 2nd Baseline values used in the calculations from these fields. The
derivation of 1st and 2nd Baseline values depends on the Delivery Type and Measure Application Type
selected in the Applied Measure.
Each Delivery Type selected in the Applied Measure belongs to either Group 1 or Group 2:
ESP Name
eTRM Name
Group
Upstream Prescriptive Rebate
PreRebUp
Group 1
Downstream Prescriptive Rebate
PreRebDown
Group 1
Non-upstream
NonUpStrm
Group 1
Building Design Incentive
BldgDesInc
Group 1
Custom Incentive
CustIncent
Group 1
Downstream Custom Incentive
CustIncentDown
Group 1
On-line Audit
OnLineAudit
Group 1
On-site Audit
OnSiteAudit
Group 1
Prescriptive Rebate
PreReb
Group 1
Any
Any
Group 1
Direct Install
DirInstall
Group 2
Direct Install Prescriptive Rebate
PreRebDI
Group 2
Based on the following Delivery Type “Group” and the selected Measure Application Type, the following
describes the first and second baseline savings, cost, and years for single and dual baseline.
Delivery
Type
Measure
Application
Type
1st
Baseline
2nd
Baseline
1st
Baseline
Costs
2nd
Baseline
Costs
1st
Baseline
Years
2nd
Baseline
Years
Group 1
Early retirement
Existing
Code
MC
MC – BC
RUL
EUL – RUL
Replace on
Burnout
Code
n/a
MC – BC
n/a
EUL
n/a
New
Construction
Code
n/a
MC – BC
n/a
EUL
n/a
Retro-
Commissioning
Existing
n/a
MC
n/a
EUL
n/a
Retrofit
Existing
Code
MC
MC – BC
RUL
EUL – RUL
Retrofit Add-on
Existing
n/a
MC
n/a
EUL
n/a
Group 2
Early retirement
Existing
Code
MC
MC – BC
RUL
EUL – RUL
Replace on
Burnout
Existing
n/a
MC
n/a
EUL
n/a
New
Construction
Existing
n/a
MC
n/a
EUL
n/a
Retro-
Commissioning
Existing
n/a
MC
n/a
EUL
n/a
Retrofit
Existing
Code
MC
MC – BC
RUL
EUL – RUL
Retrofit Add-on
Existing
n/a
MC
n/a
EUL
n/a
MC = Measure Costs
BC = Base Costs

Energy Efficiency in California’s Public Power Sector — 2025 B-5
RUL = Remaining Useful Life (years)
EUL = Estimated Useful Life (years)
If the Measure is dual Baseline, the cost/benefit calculation engine uses the first Baseline savings and
costs for the first years of the Measure life, and the second Baseline savings and costs for the remaining
years.
Total Cost Column
The Total Cost Column for Programs is a total of the Incremental Costs for each Applied Measure in the
Program. The Increment Costs are calculated based on the Baseline Costs for the Applied Measure as
described in the table above. This cost is a per unit cost and is not multiplied by the Number of Units.
Gross Savings, Adjusted Gross Savings, and Net Savings
ESP calculates 1st and 2nd Baseline Gross Savings values based on the Measure Application Type and
Delivery Type (see table above).
Fields are available for the Measure for Gross Savings Installation Adjustment (GSIA) and Net to Gross
Percentage in the Measure Editor.
GSIA is a factor typically used to account for the following impacts:
• In-Service Rate – number of actual units installed
• Realization Rate – differences between actual and Measure savings based on impact evaluation
studies
Adjusted Gross Savings
The value for Adjusted Gross Savings is determined by the following formula:

Energy Efficiency in California’s Public Power Sector — 2025 B-6
Adjusted Gross Savings = Gross Savings * GSIA
The cost/benefit calculations use Adjusted Gross Savings to derive participant avoided costs.
Net Savings
The value for Net Savings is determined by the following formula:
Net Savings = Adjusted Gross Savings * Net to Gross Percentage
The cost/benefit calculations use Net Savings to derive utility avoided costs.
Annual Data Calculations
Cost/benefit calculations for full calendar years and are in U.S. dollars. For each hour of each year for
the lifetime of the measure, ESP calculations the savings benefit using the following formulas.
Adjusted Gross Savings Benefit
1. Multiply annual Adjusted Gross Savings (unit = kWh, kW, etc.) by the Load Shape value which
results in the Adjusted Gross savings for the hour.
Annual Savings (unit) * 8760 Fraction (unit) = Hourly Savings (unit)
2. Multiply the hourly Adjusted Gross Savings by the hourly Retail Rate to get the Adjusted Gross
hourly benefit.
Hourly Savings (unit) * Retail Rate ($/unit) = Hourly Benefits ($)
3. Add up the Adjusted Gross hourly benefits for a year to get annual Adjusted Gross Benefit ($).
Net Savings Benefit
1. Multiply the annual Net savings by the Load Shape hourly value, which results in the Net savings
for that hour.
Annual Savings (unit) * 8760 Fraction (unit) = Hourly Savings (unit)
2. Multiply the hourly Net savings by the hourly Avoided Cost rate to get the Net hourly benefit ($).
Hourly Savings(unit) * Avoided Cost Rate($/unit) = Hourly Benefit ($)

Energy Efficiency in California’s Public Power Sector — 2025 B-7
ESP treats each type of savings this way; Adjusted Gross Savings, Net Savings, Gas Savings, and Water
Savings to get annual dollar benefit values.
Cost values in ESP are already annual dollar values and thus do not require 8760 hourly data or a rate for
conversion.
In ESP, Retail Rate and Avoided Cost Rates in ESP are multi-year hourly values. As a result, each year of
the calculation uses different hourly values throughout the measure lifetime.
In ESP, each Load Shape resource contains one year of hourly data. As a result, each year of the
calculation uses the same values for each year in the Measure lifetime.
Cost Allocation
ESP allocates Portfolio and Program costs down to the Applied Measure level according to the following
rules. This allows the grouping of Applied Measures and their associated cost/benefit values in different
ways for analysis.
• Allocates Portfolio overhead costs to each Applied Measure in the Portfolio in proportion to the
Net Savings of the measure.
• Allocates Program overhead costs to each Applied Measure in the Program in proportion to the
Net Savings of each measure.
• Allocates Sector overhead costs to each Applied Measure according to the Measure Sector
setting, in proportion to the Net Savings of each measure.
Applied Measures have an option setting that prevents the allocation of any overhead costs to that
Applied Measure.

Energy Efficiency in California’s Public Power Sector — 2025 B-8
Cost Benefit calculations will not run if it cannot allocate a cost to any Applied Measures. For example, if
you enter a cost in the Sector Overhead Residential field, but there are no Residential Measures to
allocate the overhead costs, the cost benefit calculation will not run. This also applies to Portfolio
Overhead and Program Overhead costs.
Costs are applied to Low Income Applied Measures just like any other Applied Measure even though
they are presented separately from the main Portfolio in the results.
Low-Income
Low income Applied Measures results are separate from the main Portfolio results. So are Transmission
& Distribution, Codes & Standards, and Electrification Applied Measures.
Use the “Measure Type Override” option in the Applied Measure to set the Applied Measure as low
income, even if its underlying Measure is not of type Low Income. This option also allows you to
override the Measure Type with any of the other Measure Type options.

Energy Efficiency in California’s Public Power Sector — 2025 B-9
Cost Benefit Calculations
ESP supports the following cost/benefit tests:
• Participant Test
• Ratepayer Impact Measure Test (RIM)
• Total Resource Cost Test (TRC)
• Modified Resource Cost Test (MTRC)
• Societal Test
• Program Administrator Cost Test (PA)
ESP calculates the cost/benefit tests using elements that correspond to the specific costs and benefits in
each of the tests. Each Element has an Element Type that describes it in the context of the California
Standard Practice Manual.
Element Type
TRC
MTRC
PAC
RIM
PCT
SCT
BR_BillReductionsGross
Benefit
EmissionsCostSavingsNet
Benefit
FR_FreeRiderCost
Cost
Cost
INC_IncentivesPaidByUtilityGross
Cost
Cost
INC_IncentivesReceivedByCustomerGross
Benefit
PC_ParticipantCostsGross
Cost
PCN_ParticipantCostsNet
Cost
Cost
Cost
PRC_ProgramAdministratorCosts
Cost
Cost
Cost
Cost
Cost
RL_RevenueLossNet
Cost
Note:
Participant Test
and Ratepayer
Impact Measure
Test are only run
if a Retail Rate is
selected for the
Applied
Measure.

Energy Efficiency in California’s Public Power Sector — 2025 B-10
Element Type
TRC
MTRC
PAC
RIM
PCT
SCT
UAC_UtilityAvoidedCostsNet
Benefit
Benefit
Benefit
Benefit
Benefit
Net Present Value Calculations
Formulas in the California Standard Practice Manual use a divisor of (1+d)t-1, which equals 1 in the first
year. In other words, the application of the discount rate should not happen in the first year. This is the
implementation of the calculation in ESP.
Important Note: Many spreadsheet cost benefit calculations, including the original CMUA CET, use the
Excel NPV function to calculate net present values. The NPV function in Microsoft Excel assumes that
payments occur at the end of the term, which means the application of the discount rate is to first year
costs and benefits. This approach is technically incorrect.


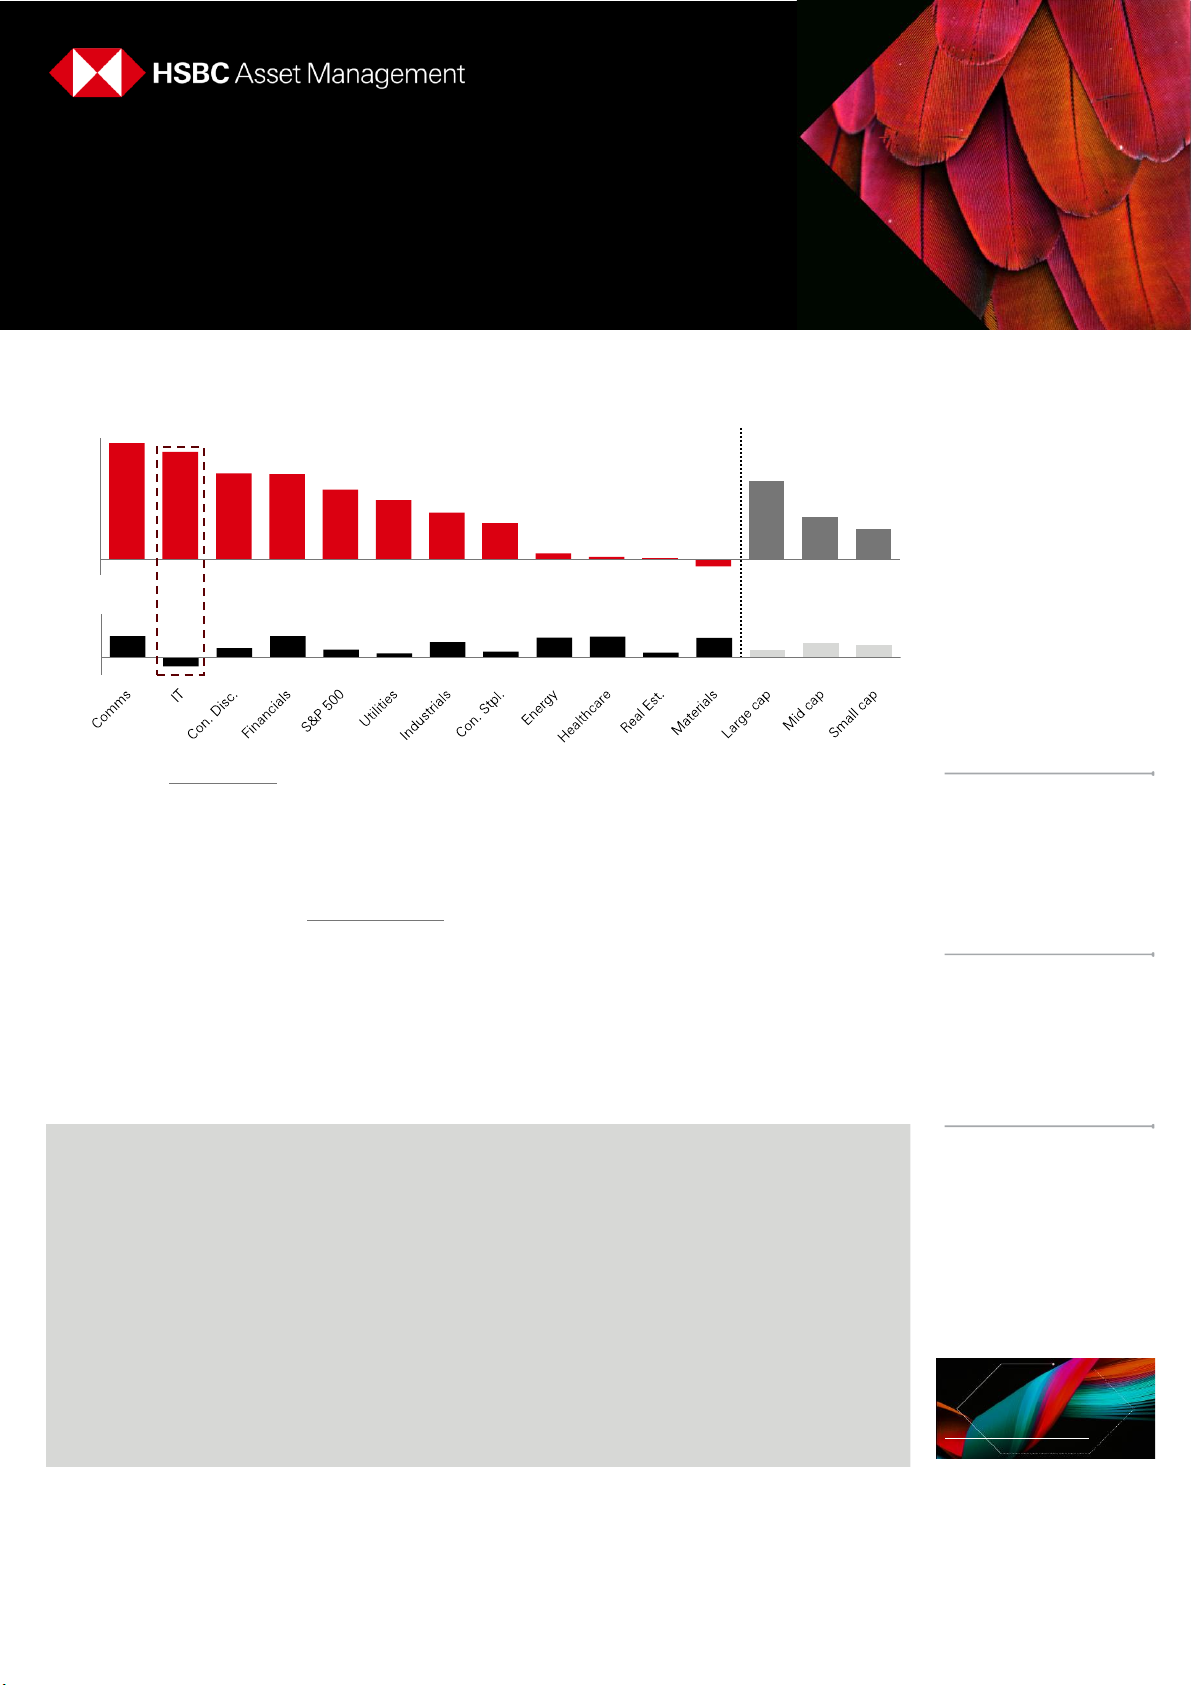


![Advertising Agency Business Plan [YEAR]](https://s3.us-east-1.amazonaws.com/outstation.idea/pdf-mt/2042029753928499200/pdf/4371161a-bea3-4a82-b57a-06b40da2aba5/imgs/page1.png)