Financial Business Decisions & Break Even Analysis PDF Free Download
1 / 27/27
100%

Financial Business Decisions &
Break Even Analysis

Introduction
•Financial Business Decisions
–A Decision to invest organization's financial
resources in the most efficient manner
–Before investing in the project organization needs
to judge every possible alternative
–The organization can perform financial analysis by
using various tools

Introduction
Tools to Analyze
Business
Decisions
The Break Even
Analysis
The Cost-
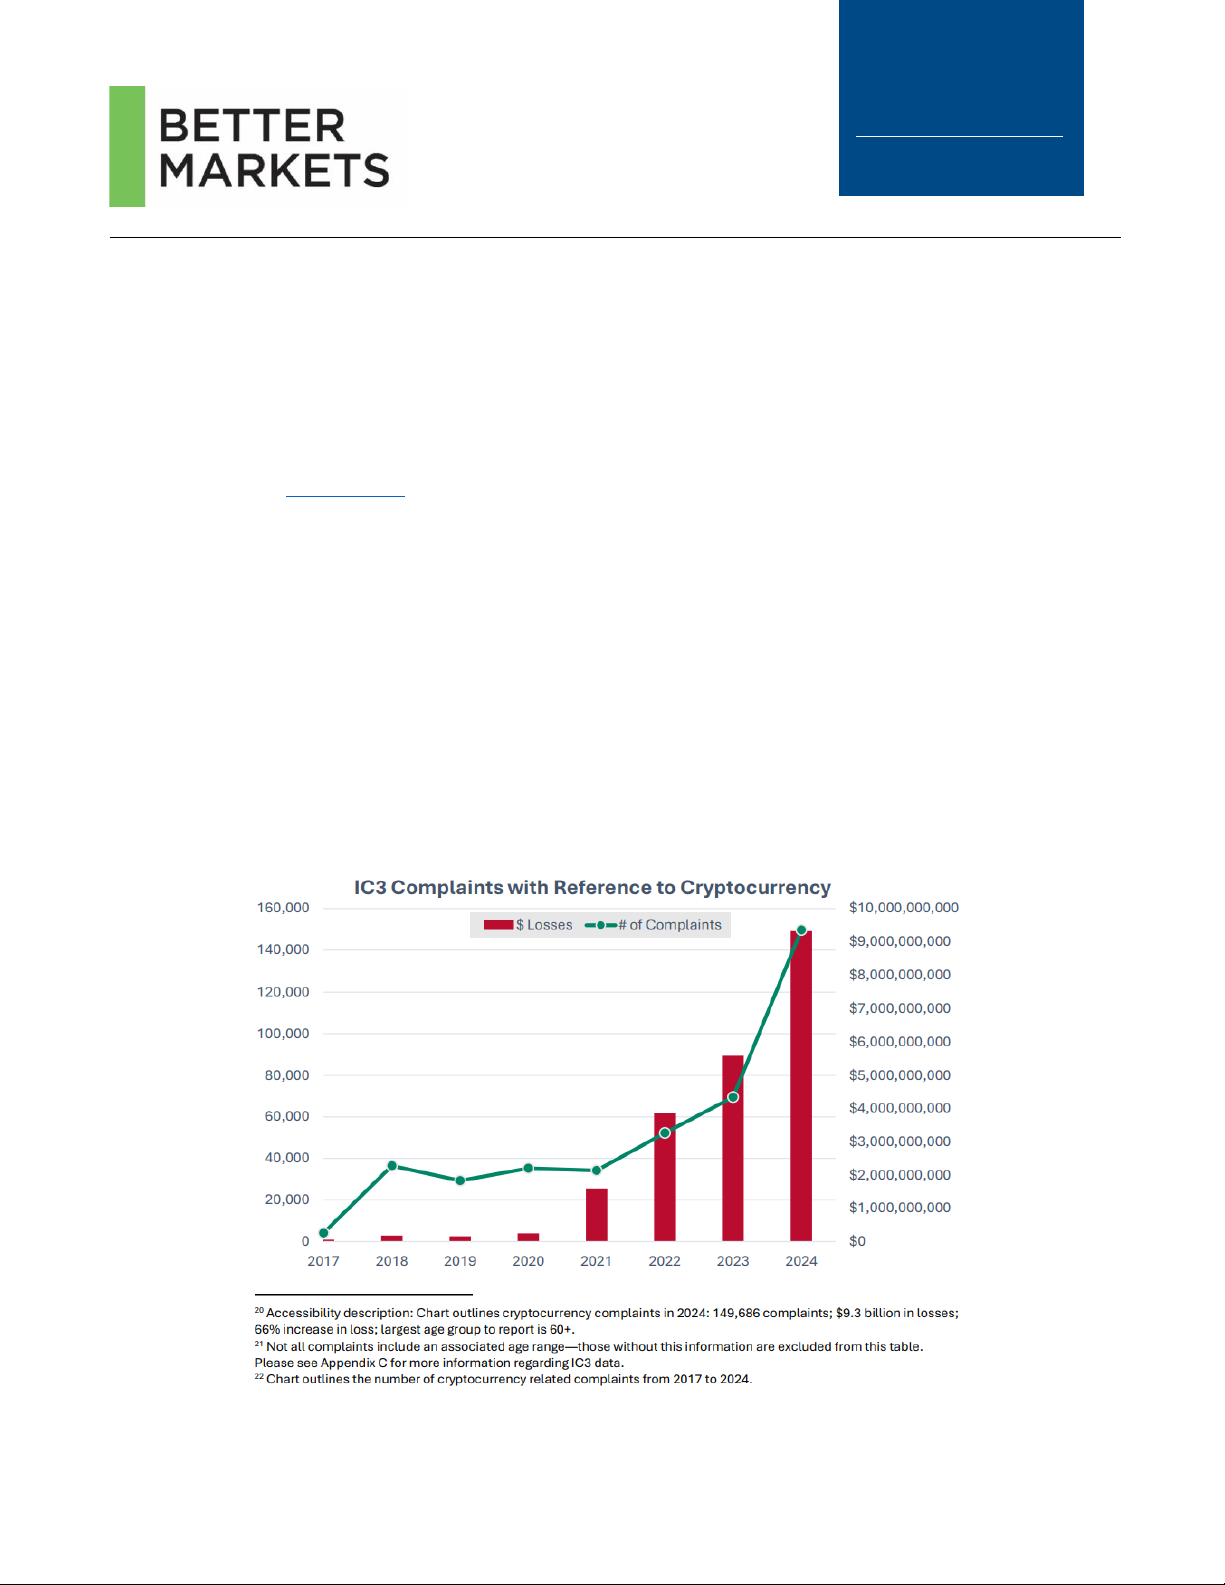
Volume-Profit
Analysis
Margin of Safety

Break Even Analysis
•It is a technique to judge whether the given level
of production would be profitable or not
•It is conducted by finding Break Even Point of an
organization
•BREAK EVEN POINT
–No Profit No Loss point
–If the revenue goes beyond this point then the
organization earns profit
–And If the revenue goes below the BEP than the
organization incurs loss
–Total Revenue = Total Cost=Break Even Point

Break Even Point
•Assumptions of Break-Even Analysis:
–The total costs can be classified into fixed and variable costs.
–The price of the product is assumed to be constant
–The volume of sales and volume of production are equal
–The fixed costs remain constant over the volume under consideration
•How to Calculate BEP?
Profit = Sales –Cost
Profit = Sales –(Fixed Cost + Variable Cost)
Profit = Sales - Fixed Cost - Variable Cost
Sales = Net Profit + Fixed Cost + Variable Cost
SP(S) = P + FC + VC(S)
At the BEP profit=0
SP(S) = 0 + FC + VC(S)
FC = S(SP-VC)
S= FC / SP-VC
Where S = No. of unit sold at the BEP
SP = Selling Price per unit
P = Net Profit
FC = Fixed Cost
VC = Variable Cost

Break Even Point
BEP (In Units) = Fixed Cost
Selling Price per unit –Variable Cost per unit
OR
BEP (In Units) = Fixed Cost
Contribution per unit
BEP ( In Rs.) = Break Even Units * Selling Price per unit
Break Even Point
•Example A has just opened her own pen manufacturing shop and is
looking at her projected costs for the end of the first quarter, trying to
determine what her break-even point is. Let's say her fixed costs for this
first quarter, is $20,000, and her variable costs have been calculated to
be $1.50 per unit. She plans on charging approximately $2.00 per
product. How many units will she have to sell to break even?
BEP in Units = Fixed Costs / (Price of Product - Variable Costs Per Unit)
BEP in Units = $20,000 / ($2.00 - $1.50)
BEP in Units = $20,000 / ($0.50)
BEP in Units = 40,000 units
So, in other words, A company needs to sell 40,000 products during that first
quarter to break even.
Now let's try to figure out the break-even point in dollars.
Break-Even Point in $ = Sales Price Per Unit x Break-Even Point in Units
Break-Even Point in $ = $2.00 x 40,000
Break-Even Point in $ = $80,000
So A company has to sale $80,000 to break even
Example
•A table fan manufacturing organization has
the capacity to produce 5000 fans p.a. The
marginal cost of each fan is Rs. 2000 and each
fan is sold for Rs.2500, while the fixed cost are
Rs. 1,20,000 p.a. Calculate the BEP for output
and sales

Example
•XYZ Restaurant, which sells only pepperoni pizza, the expenses per pizza
are:
How many pizzas does XYZ Restaurant need to sell at $10 each to cover all
those fixed monthly expenses?
Ans : XYZ must sell 1,272 pizzas
Fixed Cost Variable Cost
General Labor
1500 Rs
Flour
0.5
Rent
3000 Rs
Yeast
0.05
Insurance
200 Rs
Water
0.01
Advertising
500
Rs
Cheese
3.00
Utilities
450 Rs
Pepperoni
2.00
Cost-Volume-Profit Analysis
•Cost = Cost incurred to manufacture the goods
•Volume=Volume of goods and services produced
•Profit=Profit earned by selling goods and services
•CVP analysis is concerned with how profit is affected by changes in
cost and selling price
•Profit/Volume ratio (P/V Ratio) represents the CVP analysis
•PV ratio is the ratio of contribution to sales
•The higher the P/V ratio that means a company is incurring huge
profit
CVP Analysis
•CVP analysis has following assumptions
–Sales price per unit is constant
–Variable costs per unit are constant
–Total fixed costs are constant
–Everything produced is sold

CVP Analysis
P/V Ratio (%) = Contribution * 100
Sales
OR
P/V Ratio (%) = 1- (Variable Cost/Sales) * 100
OR
P/V Ratio = Sales –Variable Cost
Ex :
Sales 10000
-VC 2000
Contribution 8000
-FC 3000
EBIT 5000
P/V Ratio (%) = Contribution * 100 = 8000 * 100 = 80%
Sales 10000
OR
P/V Ratio (%) = 1- (Variable Cost/Sales) * 100 = 1-(2000/10000)*100 = (1-(0.2))*100 = 80%
That means contribution in sales is 80% and the ratio of variable cost in sales is 20%

Margin of Safety
•It is a difference between actual sales volume
and sales volume at BEP
•At BEP the MOS is Zero.
•If the actual sales > BEP sales = Profit
•If the actual sales < BEP sales = Loss
•MOS = Total Sales –Break Even sales
•A Company has supplied following information
–Unit Sold = 20000
–Total Sales = Rs. 60000
–Total variable cost= 50% of Sales
–Total Fixed Cost = Rs.18000
–Calculate
•Contribution per unit
•P/V Ratio
•BEP
•Volume of sales to earn a profit Rs.25000

Sales = 60000 ( Per Unit SP = 3)
-VC = 30000
Contribution 30000
-FC =18000
EBIT = 12000
1. Contribution per unit = Selling Price per unit –Variable cost per unit
= 3 –1.5 = 1.5 per unit
2. PV Ratio = Contribution per unit = 1.5 * 100 = 50%
Selling price per unit 3
3. BEP in units = FC/(SP per unit-VC per unit)
= 18000/(3-1.5) = 12000 units
BEP in Rs. = 12000 * 3 = 36000
OR
BEP in Rs. = FC/PV Ratio
4. Profit = (Sales * PV Ratio) –Fixed Cost
25000 = (Sales * 0.5)-18000
25000 + 18000 = Sales
0.5
Sales Amt = 86000/3 = 28667 units
Example
•From the following information calculate
–PV Ratio
–BEP
–MOS
Sales = 100000
Fixed Cost = 30000
Profit = 20000

•A table fan manufacturing organization has the capacity to produce 500 fans p.a.
The marginal cost of each fan is Rs. 200 and each fan is sold for Rs.250, while the
fixed cost are Rs. 12000 p.a.
1. Calculate the BEP for output and sales.
2. Calculate P/V ratio
3. What would be the profit if the production of output is 90%
1. BEP in Units = FC/SP per unit
-VC per unit OR
BEP In Units = FC / Contribution per Unit
= 12000/ 50
= 240 units
1. BEP in Rs.
= BEP units * Selling Price per Unit
= 240 * 250
= 60000 Rs
OR
BEP = Total Fixed Cost/PV Ratio
= 12000/20%
= 60000 Rs.
OR
BEP = [FC/{1-(VC per unit/SP per unit)}]
OR
BEP = (FC* SP per unit)/Contribution per Unit
OR
BEP = (FC * Total Sales) / Total Contribution
2. P/V Ratio
= Contribution/Sales
= 50/250
= 20%
3. What would be the profit if the production of output is 90%
Capacity = 500 fans
90% capacity = 450 fans
Since Fixed cost are fully recovered at BEP, the entire contribution beyond the BEP would be profit. So, profit
on 450 units is
Profit = (450
–240) * 50 = 10500 Rs.

Example : From the following data calculate
1. P/V Ratio
2. Profit when sales is 2,00,000
3. Fixed Expense = 40000 Rs.
4. BEP = 100000 Rs
1. PV Ratio
BEP = FC/PV Ratio *100
So,
PV Ratio = FC/BEP * 100
= 40000/100000
= 40%
2. Profit when sales is 2,00,000
PV Ratio is the contribution ratio of sales
Which is 40%
Sales = 200000 (given)
-
VC = 120000
Contribution = 80000 (PV Ratio over sales)
-
FC = 40000 (given)
-
Profit 40000
Profit = (Sales * PV Ratio)
-FC
= (200000 * 40%) –40000
= 40000 Rs.
•Pepsi Company produces a single article. Following cost data is given
about its product:‐
•Selling price per unit Rs.40
•Marginal cost per unit Rs.24
•Fixed cost per annum Rs.16000
Calculate:
(a)P/V ratio
(b) break even sales
(c) sales to earn a profit of Rs. 2,000
(d) Profit at sales of Rs.60,000
(e) New break even sales, if price is reduced by 10%.
•Answers
(a)P/V ratio = 40%
(b) break even sales = 40000
(c) sales to earn a profit of Rs. 2,000 =1125 units
(d) Profit at sales of Rs.60,000 =8000
(e) New break even sales, if price is reduced by 10%. = 48000
•Calculate
–BEP expressed in amount of sales in Rs
–How many units must be sold to earn net income
of 20% of sales
–Selling Price = Rs.200 per unit
–Variable cost = Rs. 120 per unit
–Fixed cost = Rs. 24,00,000

•BEP = FC/SP per unit-VC per unit
= 2400000/80 = 30,000 units
BEP in Rs. = 30000*200 = 60,00,000
•Let the unit sold = X
Sales = 200X
-VC =120X
Contribution = 80 X
-FC =2400000
Profit = 40X
Total sales = Cost + Profit
200X = 120X + 24,00,000 +40X
200X –160X = 24,00,000
40X= 24,00,000
X=60,000
•Pepsi Company produces a single article. Following cost
data is given about its product:‐
•Selling price per unit Rs.40
•Marginal cost per unit Rs.24
•Fixed cost per annum Rs.16000
Calculate:
(a)P/V ratio
(b) break even sales
(c) sales to earn a profit of Rs. 2,000
(d) Profit at sales of Rs.60,000
(e) New break even sales, if price is reduced by 10%.
•Calculate break-even point from the following
data:
•Fixed Cost = Rs 2,50,000
•Variable Cost = Rs 15 per unit
•Selling Price = Rs 25 per unit
•Production level in units 12,000, 15,000,
20,000, 25,000, 30,000, and 40,000.

•Explanation of the graph:
X –axis = No. of Units
Y –axis = Dollars
The straight line in red color represents the total annual
fixed expenses of $15,000.
The blue line represents the total expenses. Notice that
the line has a positive or upward slop that indicates the
effect of increasing variable expenses with the increase
in production.
The green line with positive or upward slop indicates
that every unit sold increases the total sales revenue.
The total revenue line and the total expenses line cross
each other. The point at which they cross each other is
the break-even point.
Notice that the total expenses line is above the total
revenue line before the point of intersection and below
after the point of intersection. It tells us that the
business suffers a loss before the point of intersection
and makes a profit after this point.