House of Dim Sum PDF Free Download
1 / 2/2
100%

House of Dim Sum is located in San Francisco’s iconic Chinatown and
specializes in dim sum. Before working with SF Environment and ReThink
Disposable, Ying Huang, the owner, spent thousands of dollars each week
on disposable foodware to serve dine-in customers. After a visit from SF
Environment’s outreach team, she learned that the ReThink Disposable program
provides funds to switch from disposables to reusables for on-site dining.
Huang joined the program — resulting in the elimination of unnecessary landll
waste and produced tremendous cost savings, which further supports House of
Dim Sum as a cultural point of signicance and source of nourishment for San
Franciscans and Chinatown visitors.
BUSINESS PROFILE
BEFORE and AFTER: House of Dim Sum switched to reusable foodware.
THE BOTTOM LINE
• $429 upfront investment in reusable foodware
• $33,561 in total annual net cost savings
• 2.2 million disposable items reduced per year
• 7.2 tons of annual waste reduction (equivalent to
the weight of a San Francisco cable car)
Changes to serviceware for less waste and more savings:
Napkins automatically
included with all orders Napkins only
upon request
Open stack of napkins Dispenser
Disposable hot cups Stainless steel double-walled cups
Individually wrapped creamer Carafe for bulk creamer
Plastic forks
and spoons Stainless steel utensils and
teaspoons for stirrers
3 sizes of plastic clamshells,
paper boats, and deli containers Durable baskets and
reusable plates
“I encourage other businesses
to work with ReThink Disposable
and the City for the cost
savings and to eliminate
disposable items.”
— Ying Huang, Owner
CASE STUDY:
House of Dim Sum
Name:
House of Dim Sum
Location:
San Francisco, CA
On-site dining: 84
Take-out: 50%
Warewashing:
3-sink system
Employees: 8

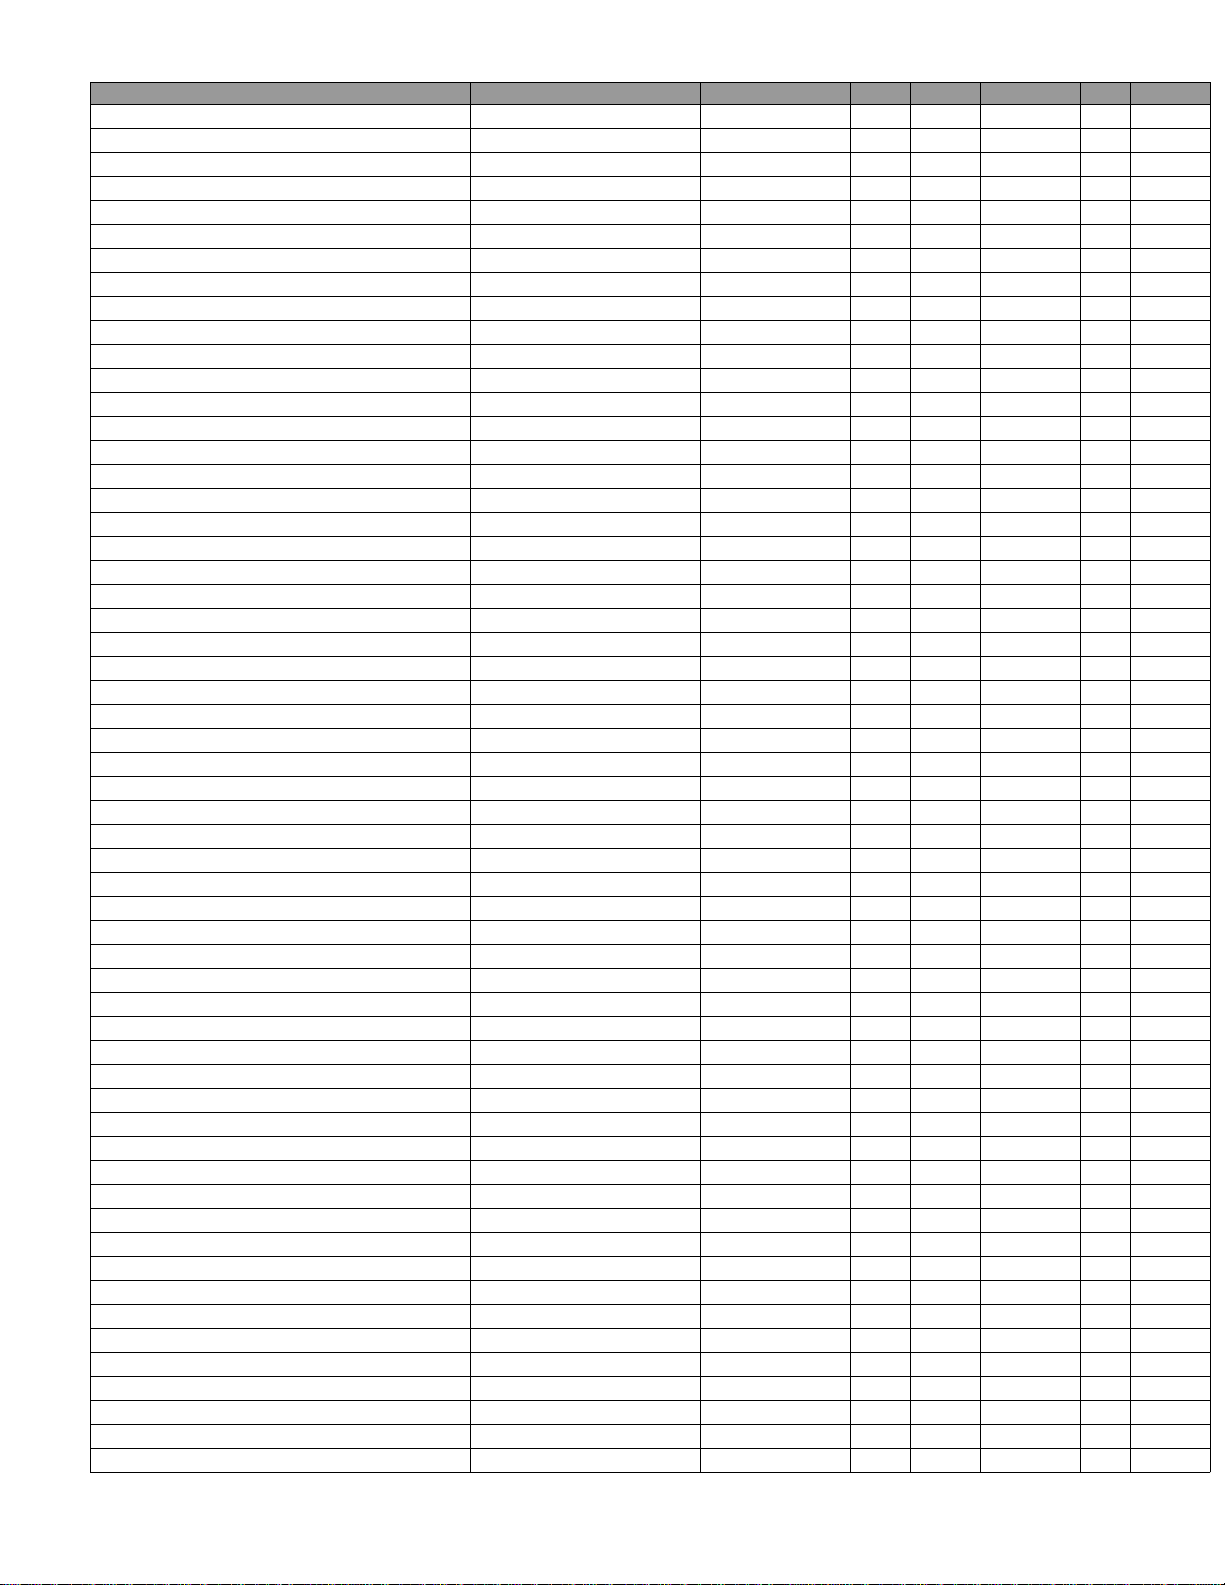
PACKAGING IMPACTS COST IMPACTS
Disposable Product
Replaced or
Minimized
Recommendation
Implemented
Percent
Disposable
Reduction
(%)
Annual Quantity
of Disposable
Product
Reduced
Annual
Waste
Reduction
(lbs.)
Payback
Period
(months)
Annual NET*
Cost Savings After
Payback Period
($)
1-ply paper napkins Napkin dispenser and only
available upon request 97.1 2,024,881 8,100 0.1 $9,675
Plastic fork Stainless steel fork 25.0 17,381 108 1.4 $170
Plastic spoon Stainless steel spoon 100.0 24,333 151 1.3 $238
8" clear clamshell
container Plates 46.7 17,033 2,121 0.2 $4,344
6” clear clamshell Plates 28.9 19,771 614 0.4 $2,056
5” clear clamshell Basket 82.5 22,943 891 0.0 $2,626
16 oz plastic deli
container w/lid Reusable bowl 90.0 52,560 2,190 0.1 $6,787
12 oz brown
hot cup Stainless steel cup 100.0 27,375 329 0.0 $7,665
TOTALS: 2,206,277
pieces
14,502 lbs.
(7.2 tons)
1.7 weeks
(average) $33,561
© 2023 Copyright by Clean Water Action and Clean Water Fund. All rights reserved.
Tel. (415) 369-9160
ReThinkDisposable@cleanwater.org
www.rethinkdisposable.org
This case study was made possible through a partnership with the
San Francisco Environment Department and their outreach team.
ReThink Disposable is a program of Clean Water Action and Clean Water Fund
conducted in partnership with local organizations, businesses, and government
agencies. Generous support is provided by a changing list of public and private
funders. To learn more about the program, its partners, and funders, visit:
www.rethinkdisposable.org.
RESULTS
*Net Cost Savings considers upfront and ongoing costs tied to
the purchase and care of reusable items, capital improvements
needed to carry out ReThink Disposable’s recommendations,
and discontinued disposable foodware purchases.