HSBC Holdings Plc (HSBA:LN) PDF Free Download
1 / 8/8
100%

HSBC Holdings Plc (HSBA:LN)
Financials/Banks Price: 895.40 Report Date: February 19, 2025
Business Description and Key Statistics
Price, Moving Averages & Volume
Website:
ICB Industry:
ICB Subsector:
Address:
Employees:
Current YTY % Chg
Revenue LFY (M)
EPS Diluted LFY
Market Value (M)
Shares Outstanding LFY (000)
Book Value Per Share
EBITDA Margin %
Net Margin %
Long-Term Debt / Capital %
Dividends and Yield TTM
Payout Ratio TTM %
60-Day Average Volume (000)
52-Week High & Low
Price / 52-Week High & Low
HSBC Holdings plc (HSBC) is a banking and financial services company.
Its segments include Wealth and Personal Banking (WPB), Commercial
Banking (CMB) and Global Banking and Markets (GBM). WPB provides
products and services that include current accounts, credit cards, personal
loans and mortgages, as well as savings, investments, insurance and
wealth management. CMB provides businesses with banking services,
including trade and receivables finance, global payments solutions, multi-
currency accounts, commercial cards, overdrafts, working capital finance,
insurance, term loans and syndicated, leveraged, acquisition and project
finance. GBM offer a range of banking services to support its clients?
needs, including banking and financing solutions, global transaction
banking services, fund administration, global custody and direct custody
and clearing, and corporate trust and loan agency. Its businesses serve
customers worldwide through a network that covers 60 countries and
territories.
Financials
Banks
https://www.hsbc.com/
8 Canada Square
LONDON E14 5HQ
GBR
211,304
1.24
160,697
17,946,951
10.31
29.1
40.7
0.59 - 5.37%
36.5
22,980
8.98 - 5.76
1.00 - 1.56
0.1
24.4
559.7 559.7
604.0 604.0
648.3 648.3
692.6 692.6
736.9 736.9
781.3 781.3
825.6 825.6
869.9 869.9
914.2 914.2
Q1' 24 Q2 Q3 Q4 Q1' 25
Volume (000)
0 0
37,915 37,915
75,829 75,829
113,744 113,744
151,659 151,659
Q1' 24 Q2 Q3 Q4 Q1' 25
Mean (28027.25)
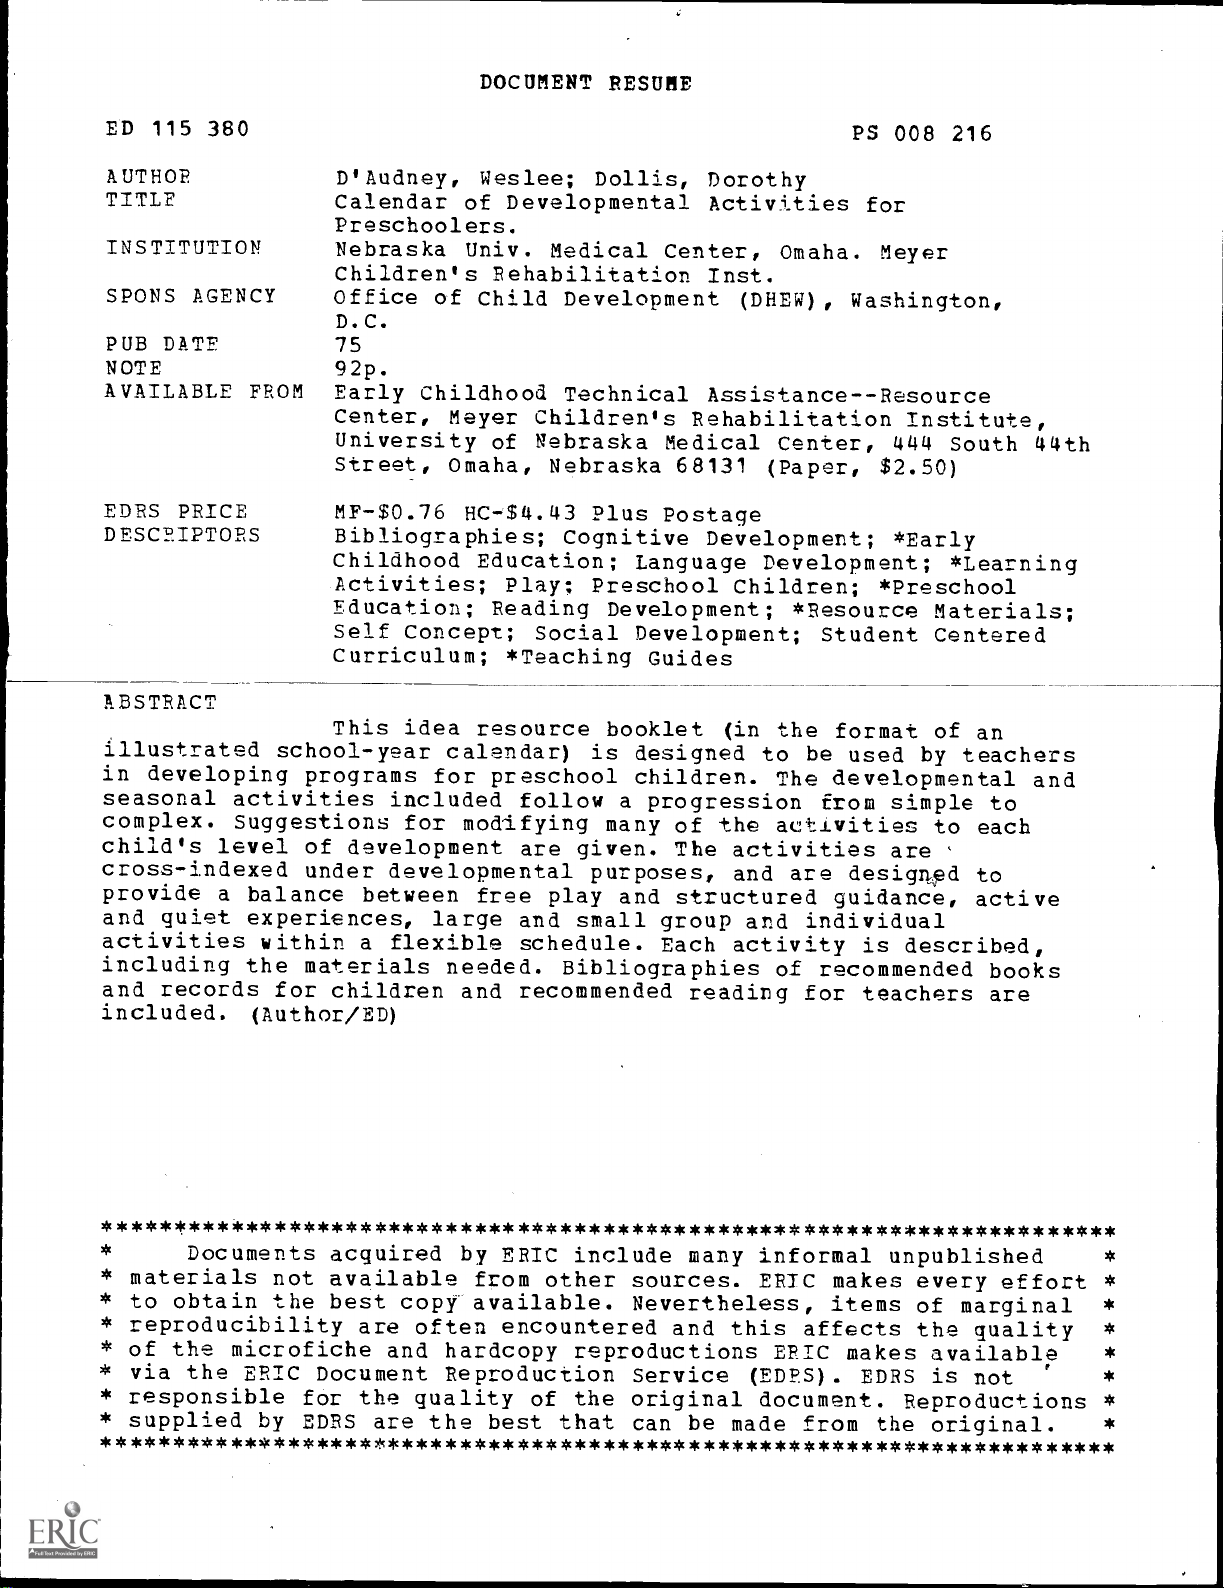
Price Price (50-Day Simple Moving Average) Price (200-Day Simple Moving Average)
HSBC Holdings Plc is
currently trading at 895.40
which is 10,940.7% above its
50 day moving average price
of 8.11 and 12,423.1% above
its 200 day moving average
price of 7.15.
HSBA:LN is currently
9,869.9% above its 52-week
high price of 8.98 and is
15,450.5% above its 52-week
low price of 5.76. Over the
past 52-weeks, HSBA:LN is up
51.8% while on a calendar
year-to-date basis it is up
14.0%.
The Relative Strength Index
(RSI) indicator for HSBA:LN is
currently 73.69. An RSI value
of 70 and above is considered
overbought and 30 and below
oversold.
Copyright © 2025 FTSE Russell www.ftserussell.com1

HSBC Holdings Plc (HSBA:LN)
Financials/Banks Price: 895.40 Report Date: February 19, 2025
Price Performance, Technical Indicators & Risk Metrics
5-Year Price Performance vs. FTSE 350
Difference
Price Performance % Change vs FTSE 350
1-Day %
1-Week %
4-Week %
52-Week %
Quarter-to-Date %
Year-to-Date %
Last Month %
Last Quarter %
Last Calendar Year %
Technical Indicators
50-Day Average Price
Price / 50-Day Average
200-Day Average Price
Price / 200-Day Average
RSI - Relative Strength Index
Risk Metrics
Price Volatility
Sharpe Ratio
Sortino Ratio
-0.30
1.55
8.80
51.81
14.02
14.02
7.69
17.35
23.57
-0.18
1.75
8.38
39.74
13.74
7.16
9.15
16.06
19.69
8.11
1.10
7.15
1.25
73.69
0.26
0.12
0.21
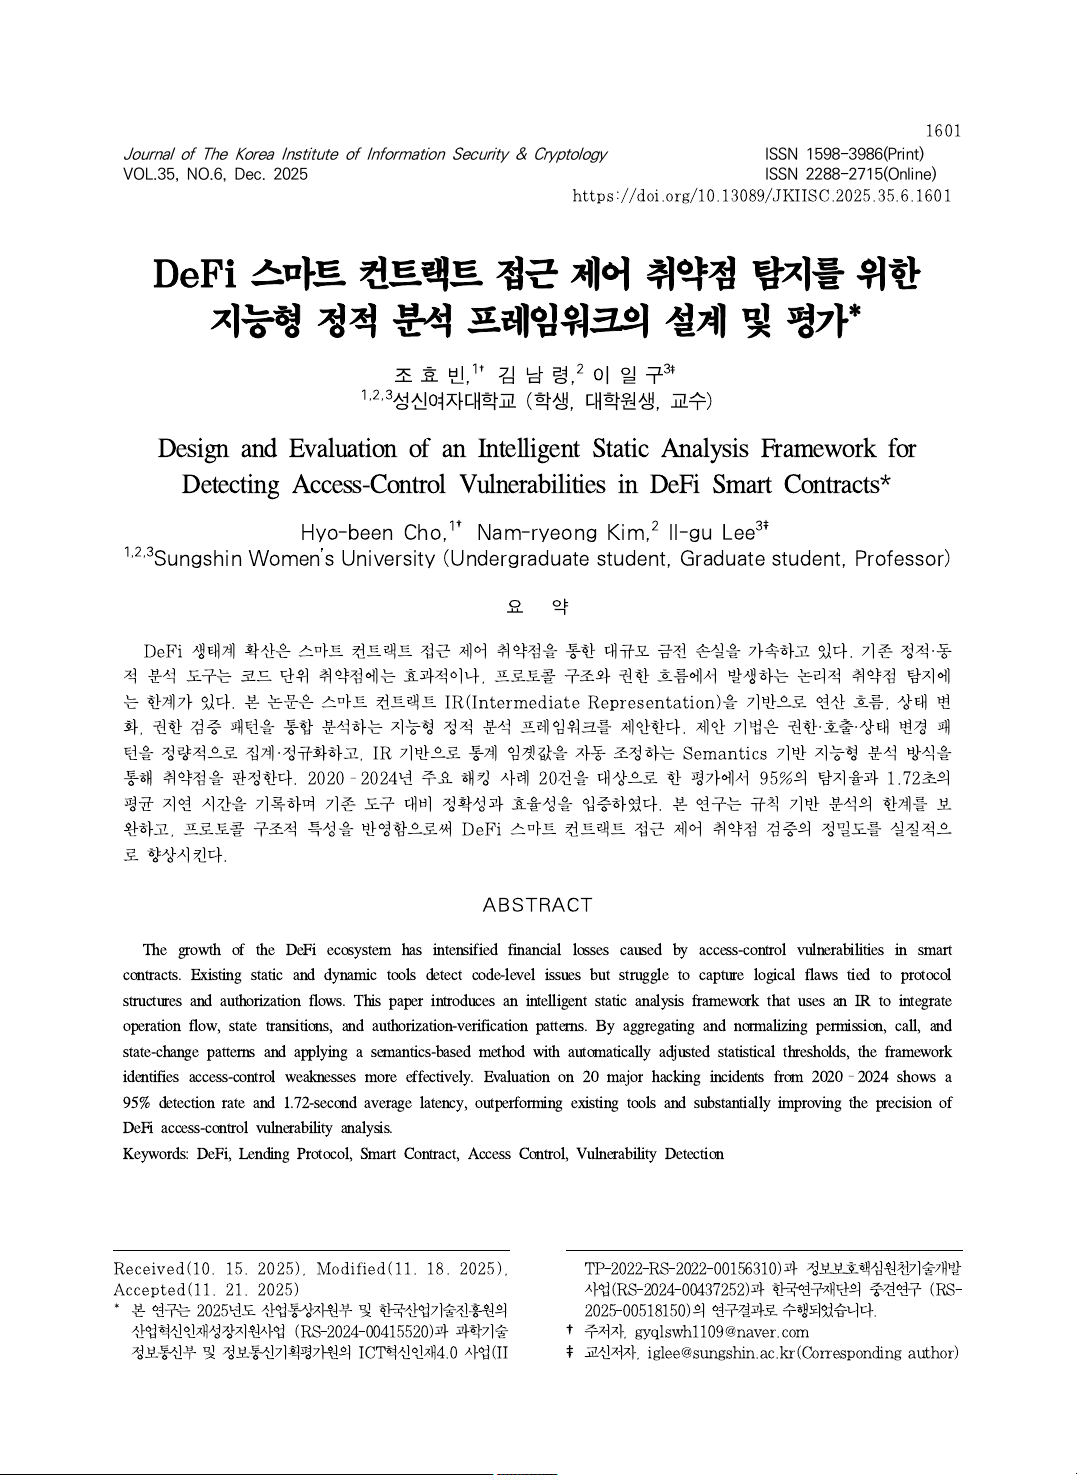
HSBC Holdings Plc Current: 1.59 CAGR: 9.8%
FTSE 350 Index Current: 1.14 CAGR: 2.7%
0.4 0.4
0.5 0.5
0.6 0.6
0.7 0.7
0.8 0.8
0.9 0.9
1.0 1.0
1.1 1.1
1.2 1.2
1.3 1.3
1.4 1.4
1.5 1.5
1.6 1.6
2020 2021 2022 2023 2024 2025
HSBA:LN
^NMX:LN
Over the past five years,
HSBC Holdings Plc's stock
price is up 59.3% which is
45.1% above the FTSE 350
Index performance of 14.1%
over the same period. HSBC
Holdings Plc's cumulative
annualized growth rate
(CAGR) over the five year
period has been 9.8% while
that of the FTSE 350 Index
has been 2.7%.
Over the past year, HSBC
Holdings Plc's stock price
performance of 51.8% has
outperformed that of the FTSE
350 Index by 39.7%. On a
year-to-date basis, HSBC
Holdings Plc's stock price
performance of 14.0% has
outperformed the FTSE 350
Index by 7.2%.
Over the past week, HSBC
Holdings Plc's stock price
performance of 1.6% has
outperformed that of the FTSE
350 Index by 1.8%.
Copyright © 2025 FTSE Russell www.ftserussell.com2

HSBC Holdings Plc (HSBA:LN)
Financials/Banks Price: 895.40 Report Date: February 19, 2025
Growth and Profitability Metrics
Historical Growth 3-Year 5-Year 10-Year
Revenues %
Revenues Per Share %
EBITDA %
EPS Diluted %
Free Cash Flow %
Cash from Operations %
Book Value %
Profitability 5-Year 10-Year
Current Average Average
Gross Margin %
EBITDA Margin %
Pre-Tax Margin %
Net Margin %
Return on Equity %
Return on Capital %
Return on Assets %
5.8
9.4
21.9
-12.3
-14.5
1.8
1.8
3.3
17.6
20.5
17.0
2.6
4.4
4.9
6.7
999.9
999.9
0.4
38.5
29.1
12.9
7.8
0.8
25.8
21.1
8.7
5.5
0.6
24.6
19.6
7.6
4.7
0.5
Current: 1.24 Median: 0.74 High: 1.24 Low: 0.19 CAGR: 59.8%
EPS Diluted
0.14 0.14
0.58 0.58
1.01 1.01
1.45 1.45
2020 2021 2022 2023 2024
0.19
0.62 0.74
1.14 1.24
Current: 29.05 Median: 22.53 High: 31.26 Low: 7.16 CAGR: 19.6%
Net Profit Margin %
6.0 6.0
14.8 14.8
23.6 23.6
32.5 32.5
2020 2021 2022 2023 2024
Mean (21.10)
Current: 12.90 Median: 8.50 High: 14.00 Low: 2.70 CAGR: 22.1%
Return on Equity %
2.1 2.1
6.3 6.3
10.4 10.4
14.6 14.6
2020 2021 2022 2023 2024
Mean (8.72)
HSBC Holdings Plc's
cumulative annualized EPS
growth rate over the charted
period is 59.8%. This
compares to cumulatative
annualized growth of 21.9%
over the past 3 years.
HSBC Holdings Plc's net profit
margin of 29.1% is 8.0%
above the period's mean net
margin of 21.1%. During the
charted period, the observed
net profit margin high and low
were 31.3% and 7.2%
respectively.
HSBC Holdings Plc's return on
equity of 12.9% is 4.2% above
the period's mean return on
equity of 8.7%. During the
charted period, the observed
ROE high and low were 14.0%
and 2.7% respectively.
Copyright © 2025 FTSE Russell www.ftserussell.com3

HSBC Holdings Plc (HSBA:LN)
Financials/Banks Price: 895.40 Report Date: February 19, 2025
Valuation Metrics
5-Year 10-Year
Current Median Median
Price / EPS TTM
Price / Sales
Price / Operating Cash Flow
Price / Book Value
5-Year 10-Year
Current Median Median
Earnings Yield %
Free Cash Flow Yield %
Dividend Yield %
Enterprise Value / EBITDA
6.8
2.0
6.3
0.9
6.7
1.4
5.6
0.6
8.3
1.5
6.5
0.6
14.71
18.54
5.37
15.04
31.71
4.38
12.11
13.08
7.00
Current: 6.80 Median: 6.65 High: 17.23 Low: 4.31 CAGR: -6.7%
Price / EPS TTM
3.7 3.7
8.4 8.4
13.1 13.1
17.9 17.9
2020 2021 2022 2023 2024
Median (6.65)
Current: 1.98 Median: 1.43 High: 1.98 Low: 0.80 CAGR: 6.3%
Price / Sales
0.74 0.74
1.17 1.17
1.61 1.61
2.04 2.04
2020 2021 2022 2023 2024
Median (1.43)
Current: 0.87 Median: 0.55 High: 0.87 Low: 0.31 CAGR: 7.0%
Price / Book Value
0.3 0.3
0.5 0.5
0.7 0.7
0.9 0.9
2020 2021 2022 2023 2024
Median (0.55)
Current: 18.54 Median: 31.71 High: 100.00 Low: 2.13 CAGR: 9.8%
Free Cash Flow Yield %
-2.8 -2.8
33.1 33.1
69.0 69.0
104.9 104.9
2020 2021 2022 2023 2024
Median (31.71)
HSBC Holdings Plc is trading
at 6.80 times its EPS
generated during the latest
fiscal year. This multiple is
above the historically observed
median of 6.65, while high and
low observations have been
17.23 and 4.31.
HSBC Holdings Plc is trading
at a Price to Sales ratio of 1.98
based on sales generated
during the latest fiscal year.
This ratio is above the
historically observed median
ratio of 1.43, while high and
low observations have been
1.98 and 0.80.
HSBC Holdings Plc is trading
at a Price to Book ratio of 0.87
based on book value at the
latest fiscal year end. This
ratio is above the historically
observed median of 0.55,
while high and low
observations have been 0.87
and 0.31.
HSBC Holdings Plc has a Free
Cash Flow Yield of 18.54%
based on free cash flow
generated during the latest
fiscal year. This value is below
the historically observed
median yield of 31.71%, while
high and low observations
have been 100.00 and 2.13.
Copyright © 2025 FTSE Russell www.ftserussell.com4

HSBC Holdings Plc (HSBA:LN)
Financials/Banks Price: 895.40 Report Date: February 19, 2025
Dividends Data
Dividend Growth and Yield
Dividends Per Share TTM Payout Ratio TTM % Dividend Yield TTM %0.59 36.52% 5.37%
Rate Ex Date Record Date Payment Date Currency Note
0.360 06-03-2025 07-03-2025 25-04-2025 USD
0.078 07-11-2024 08-11-2024 19-12-2024 GBP
0.076 15-08-2024 16-08-2024 27-09-2024 GBP
0.079 09-05-2024 10-05-2024 21-06-2024 GBP
0.248 07-03-2024 08-03-2024 25-04-2024 GBP
0.080 09-11-2023 10-11-2023 21-12-2023 GBP
0.080 10-08-2023 11-08-2023 21-09-2023 GBP
0.079 11-05-2023 12-05-2023 23-06-2023 GBP
0.185 02-03-2023 03-03-2023 27-04-2023 GBP
0.079 18-08-2022 19-08-2022 29-09-2022 GBP
0.138 10-03-2022 11-03-2022 28-04-2022 GBP
0.051 19-08-2021 20-08-2021 30-09-2021 GBP
Current: 0.48 Median: 0.22 High: 0.49 Low: 0.00 CAGR: 27.6%
Dividends Per Share TTM
-0.02 -0.02
0.07 0.07
0.16 0.16
0.24 0.24
0.33 0.33
0.42 0.42
0.51 0.51
2020 2021 2022 2023 2024
Current: 5.37 Median: 4.38 High: 9.59 Low: 0.00 CAGR: -7.5%
Dividend Yield TTM %
-0.48 -0.48
1.28 1.28
3.04 3.04
4.80 4.80
6.55 6.55
8.31 8.31
10.07 10.07
2020 2021 2022 2023 2024
Median (4.38)
HSBC Holdings Plc's trailing
12-month dividend per share
is 0.48 and its dividend has
grown at a cumulative
annualized rate of 27.6% over
the charted period. This
compares to dividend growth
of 21.70% over the past year
and cumulative annualized
growth of 46.30% over the
past 3 years.
HSBC Holdings Plc's current
dividend yield is 5.37% based
on trailing 12 month
dividends. The current yield is
above the historically observed
median of 4.38% and, over the
charted time period, the
observed high yield has been
9.59% and the observed low
yield has been 0.00%.
Copyright © 2025 FTSE Russell www.ftserussell.com5

HSBC Holdings Plc (HSBA:LN)
Financials/Banks Price: 895.40 Report Date: February 19, 2025
ICB Subsector Peer Comparisons
Price Change Year to Date % Price Change Last Calendar Year %
Price / EPS TTM Price / Book Value
EPS 5-Year Growth Rate % Revenue 5-Year Growth Rate %
0.0
0.0
13.1
13.1
26.2
26.2
39.4
39.4
52.5
52.5
NatWest Group PLC
Barclays PLC
Lloyds Banking Group Plc
Peer Group Average
Bank of Ireland Group plc
Banco Santander SA (Spain)
JSC Halyk Bank
Banco Bilbao Vizcaya Argentaria SA…
HSBC Holdings Plc
Axis Bank Ltd
50.3
42.6
20.4
20.0
16.3
12.9
12.1
11.0
7.8
6.2
-26.8
-26.8
-8.2
-8.2
10.4
10.4
29.0
29.0
47.6
47.6
Banco Bilbao Vizcaya Argentaria SA…
JSC Halyk Bank
Banco Santander SA (Spain)
HSBC Holdings Plc
Axis Bank Ltd
Peer Group Average
Lloyds Banking Group Plc
Barclays PLC
Bank of Ireland Group plc
NatWest Group PLC
44.2
36.6
32.4
23.2
16.0
14.6
5.1
-3.0
-6.2
-17.3
0.0
0.0
2.2
2.2
4.4
4.4
6.6
6.6
8.8
8.8
Barclays PLC
Lloyds Banking Group Plc
NatWest Group PLC
Bank of Ireland Group plc
Banco Bilbao Vizcaya Argentaria SA…
HSBC Holdings Plc
Banco Santander SA (Spain)
Peer Group Average
Turkiye Is Bankasi AS
Axis Bank Ltd
JSC Halyk Bank
OTP Bank Plc (Hungary)
8.4
8.1
6.9
6.5
6.1
5.8
4.9
4.5
1.2
0.8
0.3
0.0
0.0
0.0
0.3
0.3
0.5
0.5
0.8
0.8
1.0
1.0
Banco Bilbao Vizcaya Argentaria SA…
Bank of Ireland Group plc
Lloyds Banking Group Plc
NatWest Group PLC
HSBC Holdings Plc
Banco Santander SA (Spain)
Peer Group Average
Barclays PLC
Turkiye Is Bankasi AS
Axis Bank Ltd
JSC Halyk Bank
OTP Bank Plc (Hungary)
1.0
0.8
0.8
0.7
0.7
0.6
0.5
0.5
0.3
0.1
0.1
0.0
0.0
0.0
17.0
17.0
34.0
34.0
51.0
51.0
68.0
68.0
Turkiye Is Bankasi AS
Axis Bank Ltd
Bank of Ireland Group plc
JSC Halyk Bank
Peer Group Average
OTP Bank Plc (Hungary)
Banco Bilbao Vizcaya Argentaria SA…
NatWest Group PLC
Banco Santander SA (Spain)
HSBC Holdings Plc
Barclays PLC
Lloyds Banking Group Plc
65.0
31.9
27.7
22.6
21.3
21.3
15.9
14.1
11.7
10.9
7.7
5.6
0.0
0.0
12.9
12.9
25.8
25.8
38.7
38.7
51.5
51.5
Turkiye Is Bankasi AS
OTP Bank Plc (Hungary)
JSC Halyk Bank
Axis Bank Ltd
Peer Group Average
Bank of Ireland Group plc
Banco Bilbao Vizcaya Argentaria SA…
HSBC Holdings Plc
Barclays PLC
Banco Santander SA (Spain)
Lloyds Banking Group Plc
NatWest Group PLC
49.1
19.5
18.4
15.9
12.1
6.7
6.2
5.6
4.3
3.9
2.7
0.4
Copyright © 2025 FTSE Russell www.ftserussell.com6

HSBC Holdings Plc (HSBA:LN)
Financials/Banks Price: 895.40 Report Date: February 19, 2025
Abbreviations:
CAGR
EBIT
EBITDA
LFY
M
LON
Definitions:
Market Value
Revenue
Revenue Per Share
Normalized EPS LFY
60-Day Average Volume (000)
Price 52-Week High
Price 52-Week Low
Price / 52-Week High
Price / 52-Week Low
50-Day Average Price
200-Day Average Price
Price / 50-Day Average Price
Price / 200-Day Average Price
Relative Strength Index
Price Volatility
Sharpe Ratio
Sortino Ratio
Dividends Per Share TTM
Payout Ratio
Dividend Yield TTM %
EBITDA
Free Cash Flow
Book Value Per Share
Gross Margin %
EBITDA Margin %
Pre-Tax Margin %
Net Profit Margin %
Return on Equity %
Return on Capital %
Return on Assets %
Price / EPS TTM
Price / Sales
Price / Book Value
Free Cash Flow Yield %
Enterprise Value
Enterprise Value / Sales
Enterprise Value / EBITDA
Enterprise Value / EBIT
Enterprise Value / Free Cash Flow
Russell 1000 Index
- Cumulative annual growth rate.
- Earnings before interest and taxes.
- Earnings before interest, taxes, depreciation & amortization.
- Last fiscal year
- Million
- London Stock Exchange
- Weekly Price times latest Shares Outstanding times any applicable ADR factor.
- Sum of the last four quarters of Revenues.
- Sum of the last four quarters of Total Revenue divided by Weighted Average Shares Outstanding.
- EPS excluding non-recurring, non-operating items, fiscal year aligned TTM value.
- The average of the last 60 daily volume values in thousands of shares.
- The high closing price from the last 52 weeks of daily closing prices.
- The low closing price from the last 52 weeks of daily closing prices.
- Latest price divided by the high price from the past 52 weeks of daily closing prices.
- Latest price divided by the low price from the past 52 weeks of daily closing prices.
- Mean of last 50 daily closing prices.
- Mean of last 200 daily closing prices.
- Latest closing price divided by mean of last 50 daily closing prices, as a percentage.
- Latest closing price divided by mean of last 200 daily closing prices, as a percentage.
- Relative Strength Index or RSI measures the magnitude of gains over a given time period against the magnitude of losses
over that period. The equation is RSI = 100 - 100 / (1 + RS) where RS = (total gains / n) / (total losses / n) and n = number of RSI periods. In this item, 14
days is used and one year of daily prices are considered. A value of 30 or below may imply oversold and 70 or above may imply overbought.
- The standard deviation of the last 20 days of daily closing prices.
- The 5 year average of the excess monthly return over the risk - free rate(1 - month T - bill) over the 5 year standard deviation of the same
series. - The same calculation as the Sharpe Ratio but with positive excess returns set to zero for the standard deviation denominator, so only
negative volatility weighs in.- Sum of the last four quarters of Dividends Per Share.
- Dividends Per Share TTM divided by Normalized EPS TTM.
- Sum of the last four quarter of Dividends Per Share divided by Weekly Price.
- Sum of the last four quarters of EBITDA (Operating Income + Depreciation & Amortization).
- Sum of the last four quarters Net Cash from Operations minus Capital Expenditures (Purchase of Property, Plant & Equipment), from
the Cash Flow Statement.
- Total Common Equity last quarter divided by Shares Outstanding last quarter.
- Sum of the last four quarters Gross Profit divided by the sum of the last four quarters Revenues.
- Sum of the last four quarters EBITDA divided by the sum of the last four quarters Revenues.
- Sum of the last four quarters of Earnings Before Taxes divided by sum of the last four quarters Revenues.
- Sum of the last four quarters of Normalized EPS divided by sum of the last four quarters Revenues Per Share.
- Sum of the last four quarters of Normalized EPS divided by the average of the last four quarters Book Value.
- Sum of the last four quarters of Normalized EPS divided by the average of the last four quarters Total Capital Per Share.
- Sum of the last four quarters of Normalized EPS divided by the average of the last four quarters Total Assets Per Share.
- Weekly Price divided by the sum of the last four quarters of Normalized EPS (capped at 99.9).
- Weekly Price divided by Revenues Per Share TTM.
- Weekly Price divided by Book Value Per Share last quarter. Book Value Per Share is Total Common Equity last quarter divided by
Shares Outstanding last quarter (capped at 49.9).
- Free Cash Flow Per Share TTM divided by Weekly Price.
- Market Value plus Total Debt last year plus Preferred Equity last year minus Cash & Cash Equivalents last year.
- Enterprise Value divided by the sum of the last four quarters of Revenue.
- Enterprise Value divided by EBITDA TTM.
- Enterprise Value divided by trailing four quarters of Operating Income.
- Enterprise Value divided by the sum of the last four quarters of Free Cash Flow.
- The largest 1,000 stocks by market cap, the index comprehensively covers the US large cap universe.
EPS 5-Year Growth Rate % is capped at 999.9%.
Revenue 5-Year Growth Rate % is capped at 999.9%.
Copyright © 2025 FTSE Russell www.ftserussell.com7
HSBC Holdings Plc (HSBA:LN)
Financials/Banks Price: 895.40 Report Date: February 19, 2025
Disclaimer:
© 2025 London Stock Exchange Group plc and its applicable group undertakings (the “LSE Group”). The LSE Group
includes (1) FTSE International Limited (“FTSE”), (2) Frank Russell Company (“Russell”), (3) FTSE Global Debt Capital
Markets Inc. and FTSE Global Debt Capital Markets Limited (together, “FTSE Canada”), (4) MTSNext Limited (“MTSNext”),
(5) Mergent, Inc. (“Mergent”), (6) FTSE Fixed Income LLC (“FTSE FI”) and (7) The Yield Book Inc (“YB”). All rights reserved.
FTSE Russell® is a trading name of FTSE, Russell, FTSE Canada, MTSNext, Mergent, FTSE FI, YB. “FTSE®”, “Russell®”,
“FTSE Russell®”, “MTS®”, “FTSE4Good®”, “ICB®”, “Mergent®”, “The Yield Book®” and all other trademarks and service
marks used herein (whether registered or unregistered) are trademarks and/or service marks owned or licensed by the
applicable member of the LSE Group or their respective licensors and are owned, or used under licence, by FTSE, Russell,
MTSNext, FTSE Canada, Mergent, FTSE FI, YB. FTSE International Limited is authorised and regulated by the Financial
Conduct Authority as a benchmark administrator.
All information is provided for information purposes only. All information and data contained in this publication is obtained by
the LSE Group, from sources believed by it to be accurate and reliable. Because of the possibility of human and mechanical
error as well as other factors, however, such information and data is provided "as is" without warranty of any kind. No
member of the LSE Group nor their respective directors, officers, employees, partners or licensors make any claim,
prediction, warranty or representation whatsoever, expressly or impliedly, either as to the accuracy, timeliness,
completeness, merchantability of any information or of results to be obtained from the use of FTSE Russell indexes or data
or the fitness or suitability of the FTSE Russell indexes or data for any particular purpose to which they might be put. Any
representation of historical data accessible through FTSE Russell indexes or data is provided for information purposes only
and is not a reliable indicator of future performance.
No responsibility or liability can be accepted by any member of the LSE Group nor their respective directors, officers,
employees, partners or licensors for (a) any loss or damage in whole or in part caused by, resulting from, or relating to any
error (negligent or otherwise) or other circumstance involved in procuring, collecting, compiling, interpreting, analysing,
editing, transcribing, transmitting, communicating or delivering any such information or data or from use of this document or
links to this document or (b) any direct, indirect, special, consequential or incidental damages whatsoever, even if any
member of the LSE Group is advised in advance of the possibility of such damages, resulting from the use of, or inability to
use, such information.
No member of the LSE Group nor their respective directors, officers, employees, partners or licensors provide investment
advice and nothing contained in this document or accessible through FTSE Russell indexes or data, including statistical
data and industry reports, should be taken as constituting financial or investment advice or a financial promotion.
No part of this information may be reproduced, stored in a retrieval system or transmitted in any form or by any means,
electronic, mechanical, photocopying, recording or otherwise, without prior written permission of the applicable member of
the LSE Group. Use and distribution of the LSE Group data requires a licence from FTSE, Russell, FTSE Canada,
MTSNext, Mergent, FTSE FI, YB, and/or their respective licensors.
Copyright © 2025 FTSE Russell www.ftserussell.com8