Job Creation and Local Economic Development 2024: The Geography of Generative AI PDF Free Download
1 / 192/192
100%

Job Creation andLocal
Economic Development 2024
THE GEOGRAPHY OFGENERATIVE AI
Job Creation andLocal Economic Development 2024 THE GEOGRAPHY OFGENERATIVE AI


Job Creation and Local
Economic Development
2024
THE GEOGRAPHY OF GENERATIVE AI

This document, as well as any data and map included herein, are without prejudice to the status of or sovereignty over
any territory, to the delimitation of international frontiers and boundaries and to the name of any territory, city or area.
The statistical data for Israel are supplied by and under the responsibility of the relevant Israeli authorities. The use of
such data by the OECD is without prejudice to the status of the Golan Heights, East Jerusalem and Israeli settlements in
the West Bank under the terms of international law.
Note by the Republic of Türkiye
The information in this document with reference to “Cyprus” relates to the southern part of the Island. There is no single
authority representing both Turkish and Greek Cypriot people on the Island. Türkiye recognises the Turkish Republic of
Northern Cyprus (TRNC). Until a lasting and equitable solution is found within the context of the United Nations, Türkiye
shall preserve its position concerning the “Cyprus issue”.
Note by all the European Union Member States of the OECD and the European Union
The Republic of Cyprus is recognised by all members of the United Nations with the exception of Türkiye. The
information in this document relates to the area under the effective control of the Government of the Republic of Cyprus.
Please cite this publication as:
OECD (2024), Job Creation and Local Economic Development 2024: The Geography of Generative AI, OECD Publishing, Paris,
https://doi.org/10.1787/83325127-en.
ISBN 978-92-64-56441-1 (print)
ISBN 978-92-64-62866-3 (PDF)
ISBN 978-92-64-34365-8 (HTML)
Job Creation and Local Economic Development
ISSN 2617-4960 (print)
ISSN 2617-4979 (online)
Photo credits: Cover © Irina_Strelnikova/Getty Images Plus.
Corrigenda to OECD publications may be found at: https://www.oecd.org/en/publications/support/corrigenda.html.
© OECD 2024
Attribution 4.0 International (CC BY 4.0)
This work is made available under the Creative Commons Attribution 4.0 International licence. By using this work, you accept to be bound by the terms of this licence
(https://creativecommons.org/licenses/by/4.0/).
Attribution – you must cite the work.
Translations – you must cite the original work, identify changes to the original and add the following text: In the event of any discrepancy between the original work and the
translation, only the text of original work should be considered valid.
Adaptations – you must cite the original work and add the following text: This is an adaptation of an original work by the OECD. The opinions expressed and arguments employed in
this adaptation should not be reported as representing the official views of the OECD or of its Member countries.
Third-party material – the licence does not apply to third-party material in the work. If using such material, you are responsible for obtaining permission from the third party and for
any claims of infringement.
You must not use the OECD logo, visual identity or cover image without express permission or suggest the OECD endorses your use of the work.
Any dispute arising under this licence shall be settled by arbitration in accordance with the Permanent Court of Arbitration (PCA) Arbitration Rules 2012. The seat of arbitration shall
be Paris (France). The number of arbitrators shall be one.

3
JOB CREATION AND LOCAL ECONOMIC DEVELOPMENT 2024 © OECD 2024
Preface
Over the last five years, OECD countries have shown remarkable labour market dynamism, with
employment rates at or near record-highs. In parallel, gender gaps in labour market participation have
narrowed in regions across the OECD.
Strong labour demand has resulted in labour shortages in the most vibrant regions, while other regions
continue to have untapped workforce potential. Similar disparities exist regarding labour productivity, with
many regions with low employment rates also exhibiting lower levels of productivity.
This edition of Job Creation and Local Economic Development provides new evidence on how the advent
of Generative AI can contribute to closing these regional gaps, while continuing to boost economic growth
in the most dynamic regions. Generative AI, in addition to automation and other digital breakthroughs,
offers significant potential to boost productivity, particularly in urban areas where a third of workers expect
to be able to complete many of their tasks twice as quickly. Generative AI can also help to address growing
labour shortages, especially in regions with an ageing population or that are experiencing population
decline.
Sound policies are needed for all regions to unlock the full potential of generative AI, particularly rural
regions that have further potential to boost jobs, productivity and incomes. Targeted programmes should
focus on addressing place-specific obstacles, whether they relate to a region’s attractiveness to workers
and capital, the quality of regional education and training systems, or regulatory frameworks. Adequate
investment in digital infrastructure, not least to address existing, and often significant, urban-rural divides
in access to high-speed internet, will also be needed.
Through novel estimates for 35 OECD countries that show the degree of exposure of regional labour
markets to Generative AI, this edition of Job Creation and Local Economic Development highlights the full
potential and impact of Generative AI, as well as opportunities to ensure that all regions are able to benefit.
In doing so, the report aims to provide policy makers at all levels of government, business and civil society
with insights into the transformative potential of Generative AI for jobs, and recommendations to leverage
AI to drive economic growth, enhance productivity, and create more resilient and inclusive labour markets.

4
JOB CREATION AND LOCAL ECONOMIC DEVELOPMENT 2024 © OECD 2024
Foreword
Despite the recovery from COVID-19, regional and local economies in OECD countries continue to
undergo significant transformations. An ageing workforce, sluggish productivity growth, persistent regional
disparities, pervasive labour shortages across even more regions, and the rapid advancement of new
technologies will require comprehensive transitions for both individuals and communities. These shifts
underscore the need for adaptive strategies that support workforce resilience and help regions remain
competitive and resilient.
Employment, education and training systems are not keeping pace with the changing demands for new
skills. Technological advancements like artificial intelligence as well as structural shifts such as the
decarbonisation of economies imply greater need for new tools to facilitate job transitions and investments
in upskilling and reskilling initiatives. Just as people will need to adapt to these changing requirements to
find jobs where they live, places must also seize emerging opportunities for local economic development
and job creation.
The rapid rise of new AI technologies could offer a strategic tool to OECD regions to address critical
economic and labour market challenges, including labour shortages or labour productivity growth.
Providing access to AI tools and training can help regions to access untapped talent and raise productivity.
However, this requires the right enabling conditions, such as investments and deployment of AI in firms
and preparing larger segments of the workforce with the skills to use AI tools effectively to complement
their work.
This 6th edition of Job Creation and Local Economic Development closely examines the current health and
recent evolution of regional labour markets in the OECD. It documents the uneven rise of labour shortages
that hold back local economies, especially in jobs that are critical for the green and digital transition. Against
this context, the report offers novel insights into the geography of the labour market impact of Generative
AI. It explores which jobs and which types of places are already exposed to Generative AI, meaning that
AI could be a complement to boost productivity in a job or potentially render some jobs no longer
necessary. The report discusses the potential implications of increased adoption of Generative AI for urban
and rural communities and workers and zooms in on place-based actions as well as policies to seize the
opportunities that these technologies could yield to boost productivity growth and address labour shortages
in ageing societies.
This publication contributes to the work of the Co-operative Action Programme on Local Economic and
Employment Development (LEED), created in 1982 to provide practical solutions about how to build vibrant
communities with more and better jobs for all. It was approved by the Local Economic and Employment
Development Directing Committee via written procedure on 13 November 2024
[CFE/LEED(2024)14/REV1].
5
JOB CREATION AND LOCAL ECONOMIC DEVELOPMENT 2024 © OECD 2024
Acknowledgements
This publication was produced by the OECD Centre for Entrepreneurship, SMEs, Regions and Cities
(CFE), led by Lamia Kamal-Chaoui, Director, as part of the programme of work of the Local Employment
and Economic Development (LEED) Programme.
This publication was co-ordinated and managed by Lukas Kleine-Rueschkamp, under the supervision of
Karen Maguire, Head of Division and Nadim Ahmad (Deputy Director, CFE). Lead authors for individual
chapters were Antonela Miho (Chapter 1), Laurenz Baertsch and Antonela Miho (Chapter 2), and Agustin
Basauri (Chapter 3). Patricia Peñalosa and Ana Krstanovic made effective contributions to the different
chapters. Tahsin Mehdi (Statistics Canada) kindly provided data on Canada.
This report benefited from valuable comments and inputs from Wessel Vermeulen, Carlo Menon, Cem
Ozguzel, Amal Chevreau, Lea Samek, Stijn Broecke, Marguerita Lane, Glenda Quintini, and Luis Aranda.
The OECD would like to thank the delegates to the OECD LEED Directing Committee, including
contributions from the report steering group, for their valuable input. Eloisa Cozar Navarrete and Katrina
Baker prepared the manuscript for publication.

6
JOB CREATION AND LOCAL ECONOMIC DEVELOPMENT 2024 © OECD 2024
Table of contents
Preface 3
Foreword 4
Acknowledgements 5
Executive summary 11
1 The state of regional labour markets 14
In Brief 15
Introduction 16
Regional disparities persist, highlighting the absence of regional convergence despite a strong
recovery from the COVID-19 shock 17
Most regions face persistently low productivity growth, with little progress in closing regional
gaps in labour productivity 29
Building resilient regional labour markets: the role of workers and firms 36
Conclusion 51
References 53
Notes 58
Annex 1.A. Additional background on policy 60
Annex 1.B. Additional results 62
2 Labour shortages across regional labour markets 70
In Brief 71
Introduction 72
Disparities in labour market tightness across regions remain large despite widespread increases
in recent years 74
The extent of labour shortages depends on the characteristics of the regional economy 78
High-skilled occupations mainly drive regional labour shortages 81
High-productivity and contact-intensive industries experience the strongest labour shortages 87
Demographic change will put additional pressure on labour market tightness 90
Potential policy levers to alleviate labour shortages 96
Policy recommendations to alleviate labour shortages 108
References 110
Notes 117

7
JOB CREATION AND LOCAL ECONOMIC DEVELOPMENT 2024 © OECD 2024
3 Beyond automation: Decoding the impact of Generative AI on regional labour
markets 118
In Brief 119
Technological progress and AI: The future of local labour markets 120
Understanding the foundations: AI, automation, and labour market dynamics 122
Narrow-purpose technologies and automation: The consequences for local labour markets 126
The implications of Generative AI for regional labour markets 136
The role of AI in driving regional productivity and addressing labour market challenges 160
Navigating the future: public policy for jobs in the AI era 167
177
References 179
Notes 186
Annex 3.A. Data coverage and measurements 188
FIGURES
Figure 1.1. Employment rates are high, and regional differences exist across OECD countries 18
Figure 1.2. As employment rates reach a record high, there has been minimal regional convergence over the
last decade 19
Figure 1.3. Employment rates are higher in capital-city regions, non-ageing regions, regions with a high share
of green jobs and jobs in tradeable service sectors 20
Figure 1.4. Participation rates remain 10% higher in the top versus the bottom quintile of regions within a
country, a difference of almost 9% of the national median 21
Figure 1.5. Regional employment recovery is uneven in half of OECD countries 22
Figure 1.6. Metro and non-metro regions recovered congruently, despite greater COVID-19 incidence in the
former 23
Figure 1.7. Regional employment recovered more widely than participation rates 24
Figure 1.8. Age inequalities, but not gender, exacerbated over the last decade 27
Figure 1.9. Regions with large increases in the age inclusion gap saw NEET rates fall, and there is little link
with changes to youth enrolment rates 28
Figure 1.10. Capital-city regions contribute most to the age gap in participation rates while the gender gap is
highest in non-capital-city regions 29
Figure 1.11. Within OECD countries, the leading region's productivity is, on average, double that of the least
productive region 31
Figure 1.12. Most regions experienced only modest productivity growth over the past decade 32
Figure 1.13. Within OECD countries, annual productivity growth kept in step for both the most and least
productive regions 33
Figure 1.14. Productivity in the top quintile of regions remains over 50% higher than in the bottom quintile of
regions 34
Figure 1.15. Capital-city regions and regions with a higher share of green jobs or specialised in tradeable
services lead productivity levels 35
Figure 1.16. Over the past ten years, labour productivity growth accompanied gains in participation but not
employment 36
Figure 1.17. High-skilled jobs represent the highest share across OECD regions 38
Figure 1.18. High-skilled jobs are replacing middle-skilled job 39
Figure 1.19. On average, more than 9 percentage points (a third of the OECD regional median) separate the
region with the highest and lowest share of mismatched jobs within OECD countries 40
Figure 1.20. Over the past ten years, the share of mismatch fell in capital-city regions, ageing regions and
regions with a high relative share of green jobs 41
Figure 1.21. Regions specialise in a type of skill mismatch: those with more over-skilled workers tend to have
fewer under-skilled workers 42
Figure 1.22. Within-country complementarity in the type of mismatch exists for half of OECD regions 43
Figure 1.23. There is considerable within-country range of over 5 percentage points between the region with
the highest rate of self-employed vs. the lowest for almost half of OECD countries 44
Figure 1.24. Increase in post-pandemic within-country disparities between the regions with the highest and
least share of the self-employed 45
8
JOB CREATION AND LOCAL ECONOMIC DEVELOPMENT 2024 © OECD 2024
Figure 1.25. Take-up of self-employment is greatest in regions facing higher unemployment rates, although
the difference is narrowing 46
Figure 1.26. Employment is moderately diversified in a few sectors across OECD regions 48
Figure 1.27. A majority of workers are employed by up to three sectors across OECD regions 49
Figure 1.28. Large disparities in the instance of mass layoffs across regions 51
Figure 2.1. Labour markets are tight in many countries, despite some signs of easing post-2020 73
Figure 2.2. Labour markets are tight across OECD regions, with large dispersion in over half of countries 75
Figure 2.3. Employment and unemployment-based measures lead to similar tightness results 76
Figure 2.4. Labour markets have become tighter across all regions 77
Figure 2.5. Job switches do not explain increasing labour market tightness 78
Figure 2.6. Labour shortages are higher in regions that are more urban, have high employment rates, and rely
more on tradable services 79
Figure 2.7. Labour market tightness is up to four times higher-than-average for the most affected occupations 83
Figure 2.8. ICT jobs experience particularly severe shortages across OECD regions 85
Figure 2.9. Green jobs are tighter than the average job in the vast majority of OECD regions 86
Figure 2.10. Shortages in green and ICT jobs tend to co-occur in OECD regions 86
Figure 2.11. Industries differ substantially in terms of labour market tightness 88
Figure 2.12. Regions that are more reliant on high-growth industries experience stronger shortages 89
Figure 2.13. ICT and utilities are the tightest industries in more than half of all European regions 90
Figure 2.14. Over 40% of OECD regions experienced a decline in the working age population over the past
decade 91
Figure 2.15. Demographic pressure will tighten labour markets, especially in older regions 93
Figure 2.16. Ageing populations will affect almost all OECD countries, albeit to varying degrees 95
Figure 2.17. Most OECD regions will experience increases in tightness due to demographic change 96
Figure 3.1. Automation technologies involve a large set of technologies with varied degrees of generality 123
Figure 3.2. Key high-level dimensions of the OECD Framework for the Classification of AI Systems 124
Figure 3.3. The share of jobs at high risk of automation can range from under 1% to 29% across OECD
regions 128
Figure 3.4. The manufacturing sector leads in jobs at risk of automation by a significant margin 129
Figure 3.5. Although it is too early to assess the full impacts of automation in the labour market, there is
currently little evidence of job destruction in regions more exposed to automation 131
Figure 3.6. Most regions have seen employment growth and a large share of those that did not experienced a
drop in employment at high risk of automation 132
Figure 3.7. Overall job destruction across regions can be attributed to automation in only a handful of cases 133
Figure 3.8. Regions with a higher share of employment at risk of automation saw a small but significant boost
in productivity 134
Figure 3.9. A quarter of workers are now exposed to Generative AI 138
Figure 3.10. Labour market exposure to Generative AI could range from 16% to 77% across regions 139
Figure 3.11. Labour demand has not yet reacted to Generative AI exposure 141
Figure 3.12. Exposure to Generative AI varies greatly across industries 142
Figure 3.13. Occupations with higher complementarity tend to require more education and/or training 143
Figure 3.14. Most job families contain occupations that can use Generative AI as a complement to their work 144
Figure 3.15. Labour markets in urban areas are significantly more exposed to Generative AI than non-urban
areas. 145
Figure 3.16. Cities are significantly more exposed than rural areas 146
Figure 3.17. Cities are, and will be, significantly more exposed to Generative AI 147
Figure 3.18. Regions with a low risk of automation are now highly exposed to Generative AI, and vice-versa 148
Figure 3.19. Highly educated workers are significantly more exposed to Generative AI, and this gap will only
increase 149
Figure 3.20. The overall trend in exposure across levels of education holds for all regions individually 150
Figure 3.21. Women are slightly more exposed to Gen-AI, a different trend from prior forms of automation 151
Figure 3.22. Men are consistently more exposed to narrow-purpose technologies across regions, while women
are most exposed to Generative AI in most regions 152
Figure 3.23. The gender gap in exposure to Generative AI reflects higher shares of women in exposed sectors 153
Figure 3.24. Software jobs are significantly more exposed while the cultural, creative and health occupations
are closer to the labour market average 155
Figure 3.25. Most cultural and creative occupations are more exposed than the average occupation, up to
more than double 159
Figure 3.26. Almost half of health occupations are more exposed than the average occupation 160
Figure 3.27. Opportunities and challenges of adopting AI in public employment services 174
9
JOB CREATION AND LOCAL ECONOMIC DEVELOPMENT 2024 © OECD 2024
Annex Figure 1.B.1. Employment did not increase faster over the past ten years depending on demographics
or employment structure 62
Annex Figure 1.B.2. COVID-19 exacerbated regional inequalities along age, but not gender 63
Annex Figure 1.B.3. Half of countries show significant regional dispersion in youth inactivity rates 63
Annex Figure 1.B.4. Within-country differences between regions with the highest and lowest NEET rates are
growing 64
Annex Figure 1.B.5. Neither demographic nor economic structure is correlated with higher productivity growth 64
Annex Figure 1.B.6. Mismatch is lower in capital-city regions 65
Annex Figure 1.B.7. Record-low unemployment rates, with convergence continuing past Covid-19 recovery 65
Annex Figure 1.B.8. Across OECD regions, about 16% of workers are engaged in part-time work, with little
regional dispersion in most countries 66
Annex Figure 1.B.9. Stark gender divides in the take-up of part-time work 67
Annex Figure 1.B.10. Little regional dispersion in the incidence of temporary employment, apart from in some
Latin American countries 68
Annex Figure 1.B.11. There is little within-country variation in temporary and part-time employment, reflecting
that take-up is driven by structural national policies 69
TABLES
Table 3.1. Example of occupations by their exposure to Generative AI 137
Annex Table 3.A.1. Summary of exposure rubric 188
Annex Table 3.A.2. Employment by occupation data sources 188
BOXES
Box 1.1.From crisis to recovery: Employment support policies during COVID-19 25
Box 1.2. Navigating the productivity puzzle: Factors, trends, and challenges facing OECD regions 30
Box 1.3. Defining sectoral diversification 47
Box 2.1. How well do different measures of labour market tightness align? 76
Box 2.2. Shortages vs. dynamism: disentangling drivers of labour market tightness 78
Box 2.3. Labour market tightness as a proxy for labour shortages 80
Box 2.4. How representative are online job postings data? 81
Box 2.5. How does labour market tightness affect wages? 84
Box 2.6. Lower labour force participation and employment rates among older workers intensify labour
shortages 92
Box 2.7. Calculating demographic pressure on labour market tightness 93
Box 2.8. AI to the rescue: how automation alleviates local labour shortages in manufacturing and agriculture 97
Box 99
Box 2.10. Answering the needs of business and the local community: The case of vocational schools in
Närpes, Finland 100
Box 101
Box 2.12. PES increasingly use labour market intelligence tools to facilitate job matching 102
Box 2.13. France adapts its large-scale national skills agenda to regional needs 104
Box 2.14 Skills for Success: Modernising VET and adult learning towards the twin transition 105
Box 2.15. Building teleworking potential: Ireland, Trento, and The Netherlands Case Studies 107
Box 3.1. Automation involves an ever-growing set of technologies 122
Box 3.2. Measuring jobs impacted by narrow-purpose automation technologies 127
Box 3.3. Digital upskilling in Australia, Romania, Korea, and Japan 134
Box 3.4. Measuring exposure to Generative AI at the occupation level using O*NET data and expert surveys 136
Box 3.5. Alternative measures of AI exposure in labour markets 139
Box 3.6. The impact of Generative AI on job creation and destruction remains uncertain 140
Box 3.7. How complementary is Generative AI to different occupations? 142
Box 3.8. Use of AI in cultural and creative sectors 154
10
JOB CREATION AND LOCAL ECONOMIC DEVELOPMENT 2024 © OECD 2024
Box 3.9. Using AI to deal with labour shortages in the health sector 156
Box 3.10. Use of AI in the programming industry 158
Box 3.11. Future Skills Centre: Improving AI skills and attitudes across Canada 162
Box 3.12. Regional AI and automation strategies for economic revitalisation 163
Box 3.13. Using AI to alleviate labour shortages in industries with tight labour markets 165
Box 3.14. Experimental evidence on the impact of Generative AI in the workplace 168
Box 3.15. AI for task management in the workplace 169
Box 3.16. Initiatives to support AI adoption in SMEs 171
Box 3.17. Measuring SME digitalisation: 2024 OECD D4SME Survey 172
Box 3.18. Guidelines for AI adoption in public employment services (PES) 173
Box 3.19. Examples of AI applications in public employment services (PES) 175
Annex Box 1.A.1. Examples: policies for inclusive labour market participation 60
Annex Box 3.A.1. Measuring the degree of urbanisation 189
11
JOB CREATION AND LOCAL ECONOMIC DEVELOPMENT 2024 © OECD 2024
Executive summary
While most regions have benefitted from an employment boom, this has not
translated into narrowing regional gaps
Employment rates across OECD regions are at record highs but large disparities remain. In 2023,
roughly 3 out of 5 (59%) of OECD regions had employment rates over 70%. Within countries, employment
is particularly high in metropolitan regions with a high share of employment in tradeable sectors as well as
om the COVID-19 pandemic, the
recovery was faster and larger in metro regions. Overall, significant disparities persist, with little
convergence between top- and bottom-performing regions in critical measures such as employment,
labour force participation, and labour productivity. On average, regional employment rates differ by up to
10.5 percentage points in OECD countries.
During this employment boom, gender inequalities in regional labour markets have narrowed but
age disparities have widened in most regions, to the detriment of younger workers. The gender gap
between men and women in labour force participation has fallen in over four out of five (83%) of OECD
regions, with two-thirds of OECD regions recording a fall of more than 1.5 percentage points. In contrast,
disparities by age group increased in the majority of regions. The gap in labour force participation between
youth (15- to 24-year-olds) and prime-age working population (25- to 64-year-olds) increased in three out
of five (almost 60%) of regions, growing significantly by over 1.5 percentage points in half of OECD regions.
Young people are struggling more to integrate into the labour market, particularly in metropolitan regions.
A troubling slowdown in labour productivity growth and stark differences among regions persist.
Labour productivity growth has remained sluggish over the past decade, with half of OECD regions
recording growth of less than 0.8% per year. While the least productive regions grew faster than the most
productive ones over the last 10 years, it was not sufficient to result in significant regional convergence.
As of 2022, the 20% most productive regions still recorded 50% higher labour productivity levels than the
20% least productive regions in the same country. Overall, labour productivity remains considerably higher
in capital regions (one-third higher) and regions specialised in tradable sectors (one-fifth higher) than in
the rest of a country.
A diversified skills base aligned with labour market needs boosts resilience; however, OECD
regions have recorded a noticeable increase in skills polarisation and struggle with large skills
mismatches. On average, the share of middle-skilled jobs fell in four out of five OECD regions over the
last decade, in many cases being replaced by high-skilled jobs, but also in some cases low-skilled jobs.
Skills mismatches (workers that are either under or overqualified for their jobs) persist and vary widely
across regions, with one-third of countries exhibiting regional differences in skills mismatch of more than
10 percentage points between the regions with the highest and lowest skills mismatches.
12
JOB CREATION AND LOCAL ECONOMIC DEVELOPMENT 2024 © OECD 2024
Most OECD regions are struggling with labour shortages
Labour and skills shortages have become one of the most pressing policy concerns in most OECD
regions, not only dynamic urban labour markets. Driven by a combination of both cyclical and structural
vacancies at different skill levels. The consequences for both firms and local economies can be significant,
holding back firm operations and investments, inhibiting local economic growth, and creating obstacles for
seizing new economic opportunities offered by technology or meeting environmental objectives.
Regional labour shortages have risen substantially since 2019 and increasingly affect regions with
previously low levels of labour shortages. Labour market tightness (defined as vacancies per employed
person) increased significantly (e.g. 50% in Germany, 80% in the U.S.) compared to pre-COVID times
(2019-2022). While the severity of labour shortages differs between countries, regional disparities are also
significant. Within countries, the tightest regional labour markets report on average five times more
vacancies per employed person than the least tight regions. Labour shortages are particularly acute in
regions focused on tradable services or high-growth industries.
Many regions face significant labour shortages in jobs crucial for the green and digital transitions.
In almost all OECD regions (95%), labour shortages in Information and communication technologies (ICT)
are higher than for other jobs, with on average twice as high labour market tightness. Labour shortages
are also more pronounced for green jobs in nine out of ten (90%) regions. In European regions, labour
shortages are on average more than 40% higher for green-task jobs than for other jobs. The scarcity of
the twin transition but could also
indicate significant skills mismatches, resulting from structural labour market transformation that has not
yet been accompanied by the necessary change in education and training systems adapted to regional
workforce needs.
Widespread population ageing risks exacerbating labour shortages, especially in the regions with
the oldest age structure. More than four in ten OECD regions experienced a shrinking working-age
population over the past decade. If current population trends continued, average regional labour market
shortages could increase by almost 9% within the next 20 years, and by nearly 16% in the oldest 20% of
OECD regions (rising from one vacancy for every 21 working-age persons to one vacancy for every 18
working-age persons). Policies designed to mitigate labour shortages need to reflect place-specific
challenges, such as ageing, retaining and attracting (young) talent to remote regions and facilitating job
transitions, taking account of the geographic distribution of jobs.
Generative AI will transform many jobs, but its impact will be greatest in regions
that have been least exposed to past waves of automation
Generative AI could have a much wider labour market impact than previous technologies that drove
automation of tasks, affecting a broader group of people and places. Across the OECD, around a
quarter of workers are exposed to Generative AI, meaning 20% (or more) of their job tasks could be done
at least 50% faster with the help of Generative AI. Exposure to AI will continue to grow, as new software
is developed or integrated with Generative AI technologies, with the share of workers who could be highly
exposed (50% of their tasks could be done at least 50% faster with Generative AI) possibly ranging from
16% to more than 70% across OECD regions. In contrast to previous automation technologies, Generative
AI excels in doing cognitive, non-routine tasks, shifting regional labour market exposure, with regions
concentrating industries such as education, ICT, or finance becoming most exposed to Generative AI.
Regions previously considered to be at comparatively low risk of automation are the most exposed
to Generative AI. Technology-led automation, including through other forms of AI, particularly affected
non-metropolitan and manufacturing regions. In contrast, Generative AI has the potential to alter a
13
JOB CREATION AND LOCAL ECONOMIC DEVELOPMENT 2024 © OECD 2024
significantly higher share of jobs in metropolitan regions. Exposure to Generative AI is greater for high-
skilled workers and women, while previous technology-led automation mainly affected low-skilled workers
and men.
While the exact effects of Generative AI on the geography of job creation and displacement remain
to be seen, evidence from automation trends show overall net job creation. The share of jobs at high
risk of automation, including through forms of AI that predated Generative AI, ranges from around 1% to
29% in OECD regions. However, on average, higher regional risks of automation did not lead to overall
reductions in employment over the past decade. Instead, an increase of 10% in the share of jobs at high
risk of automation is related to an increase of 5.6% in labour productivity over five years. Yet, in some
regions, automation appears to have contributed directly to a loss of overall employment. Moreover, even
though new job creation outweighed job losses in most regions, newly created jobs might not have
benefitted those workers who lost their jobs due to automation.
New AI technologies could offer a strategic tool for OECD regions to address critical economic and
labour market challenges, including labour shortages, and help boost sluggish labour productivity
growth. Fostering the adoption of AI technologies could yield a much-needed catalyst for productivity in
regional economies. Providing access to AI tools and training can help regions to access untapped talent
in low-skilled workers or workers with disabilities for whom many jobs were previously out of reach. In
addition, AI technologies can be leveraged to directly supplement workers where feasible, helping to ease
labour shortages and the effects of an ageing workforce.
National place-based policies and local actions could foster resilience of regional
economies and help seize the benefits of Generative AI
National labour market policies could draw lessons from the uneven recovery from COVID-19 and
recent trends in regional labour market performance. By reflecting on the diverse impact and recovery
from the pandemic, policy makers could take into consideration the different degrees of resilience to labour
market shocks across regions and identify challenges and appropriate policy responses in light of ongoing
transformations such as the green-digital twin transition.
In trying to alleviate labour shortages, policy makers need to address their exact, underlying
causes, which are often place specific. In some regions, labour shortages might primarily be driven by
a lack of available workers, a problem that could be exacerbated by ageing and a shrinking workforce.
However, in other contexts, skills mismatches and gaps could be the main driver of labour shortages.
Furthermore, some regions struggle with a lack of attractiveness to both attract and retain a skilled
workforce. Finally, some regions might rely on employment in jobs that have become less attractive to
workers due to lower job quality or work conditions, subsequently creating labour shortages. As such, the
right mix of policy responses will need to consider the place-specific factors behind labour shortages.
To seize the opportunities of new technologies and respond to its labour market risks, policy
makers could assess regional labour market exposure to different forms of AI. Working with the
private sector could foster a better understanding of the job and skills changes that result from the spread
of new forms of AI in different regions. This would provide the foundation for more effective up- and re-
skilling programmes that are aligned with local labour market needs as well as tailored support for
displaced workers. Public-private sector collaboration could help boost the adoption of AI tools, which could
raise regional labour productivity, mitigate labour shortages, or offer a new tool to alleviate ageing in
regions with significant population decline. Regional policy makers could also consider new opportunities
that AI tools could bring such as promoting efficiency gains and enhancing the quality of regional public
services or facilitating the labour market inclusion of people with disabilities. Collaboration with social
partners to monitor job quality and worker rights should accompany these efforts.

14
JOB CREATION AND LOCAL ECONOMIC DEVELOPMENT 2024 © OECD 2024
This chapter examines the current state of regional labour markets in the
OECD, as well as recent and long-term trends in standard indicators such as
employment, inclusion and productivity. It also assesses their resilience to
the green, digital and demographic transitions. While most regions have
recovered since the COVID-19 crisis, regional convergence in employment
and participation rates is limited. Despite record-high employment rates in
many regions, the inclusion of certain groups in the labour market remains
an issue. Labour productivity growth remains modest, and disparities
between the most and least productive regions persist. Skill mismatches and
non-traditional work are prevalent, and a lack of sectoral diversification may
hamper the ability of regions to adapt. Mass layoffs pose additional
challenges, especially given their prevalence and severity in some regions.
1 The state of regional labour markets

15
JOB CREATION AND LOCAL ECONOMIC DEVELOPMENT 2024 © OECD 2024
In Brief
The landscape of regional labour markets in the OECD over the past decade
reveals a mixed picture of recovery and persistent disparities and challenges in
productivity and skills.
Healthy regional labour markets promote economic growth, social inclusion, and overall well-being. This
chapter examines their evolution in OECD regions over the past decade and in the aftermath of the
COVID-19 pandemic, reporting on recent employment trends, productivity growth, skill polarisation and
mismatch, non-traditional work, and sectoral diversification. The analysis sheds light on the diversity of
regional experiences and their differing abilities to withstand future shocks and transitions. This diversity
highlights the need for differentiated actions given the specific labour market challenges of different
types of regions.
• Employment rates across OECD regions are at record highs, but significant regional
disparities are widespread in some places. In 26 OECD countries, employment rates are
above 70% in at least three-fourths of regions. In particular, employment is higher in capital-city
regions, regions with a high share of employment in green jobs and tradable sectors, and regions
with younger working-age profiles. Almost seven in ten regions recovered both employment and
participation rates relative to pre-COVID levels, although the recovery was more widespread for
employment rates and in metro regions.
• There is little convergence between top- and bottom-performing regions within countries
in employment and participation rates or productivity. On average in OECD countries, ten
percentage points separate the region with the highest and lowest employment. Participation
and employment rates remain about 10 to 13% higher, respectively, in the top versus the bottom
quintile of regions in a country.
• Many regions still struggle with the labour market inclusion of different groups. Age
disparities in regional labour markets widened over the past decade, and gender inequalities
narrowed, despite fears that COVID--
between youth (15-24 year-olds) and the prime-age working population (25-64 year-olds) grew
in almost three in five (58%) regions, and the gender inclusion gap fell in five in six (83%) regions
over the past ten years, with 20 countries seeing a rise in the age gap and 31 countries seeing
a fall in the gender gap in at least 70% of their regions. Capital-city regions exhibit the greatest
age disparities in labour force participation rates, while gender disparities are most prominent in
non-capital-city regions, by about seven and four percentage points, respectively.
• Labour productivity growth remained sluggish over the past decade, with half of OECD
regions recording growth rates of less than 0.8% per year. Within-country gaps between the
most- and least-productive regions remain large, despite marginally higher productivity growth
in lagging regions. In 2022, in two-thirds of OECD countries, productivity in the most productive
region is at least 50% higher than in the least productive region. The quintile of regions with the
highest initial productivity, within a country, still has 50% higher productivity than the quintile of
regions with the lowest initial productivity. Capital-city regions and regions with a higher share
of green jobs or jobs specialised in tradable services record significantly higher labour
productivity than the national average.

16
JOB CREATION AND LOCAL ECONOMIC DEVELOPMENT 2024 © OECD 2024
• A diversified skills base enhances the quality and resilience of regional labour markets,
yet many regions face rising skills polarisation and high skills mismatches. The share of
middle-skilled jobs fell in four-fifths of OECD regions, and the share of low-skilled jobs grew in
three-fourths of regions where the share of middle-skilled jobs fell. The falling middle may reflect
changing labour market demands, but it has not resulted in a
skills and those needed by their jobs. Skill mismatches remain an issue for most OECD regions,
with significant within-country differences of over ten percentage points in over one-third of
countries. Mismatches fell over the past ten years in capital-city regions and in regions with a
higher share of green jobs.
Introduction
The past decade has been marked by profound shifts for global economies. These shifts are driven
by rapid technological change, the necessity of environmental sustainability, demographic pressures, and
heightened geopolitical instability, all against the backdrop of recovery from the shock of the COVID-19
epidemic. Issues such as labour shortages, sluggish productivity and skill mismatches are increasingly
relevant in the context of ongoing transformations such as the green and digital transition, specifically the
rise of artificial intelligence (AI). In many places too, the pressures of demographic change, with shrinking
working-age populations, are further complicating the situation.
Regional labour markets, given their size, specific characteristics, and degree of specialisation,
face distinct challenges in adapting to these megatrends. To keep pace, transitions that build upon a
may be necessary to not only navigate these challenges but to actively
transform these challenges into opportunities. This chapter provides an overview of these recent trends in
regional labour markets.
Employment rates stand at a record high across OECD countries, even as the regional picture is
more uneven. The average employment rate (share of the working-age population in employment) in the
OECD reached over 70% in Q2 2024, surpassing this figure in almost two-thirds of OECD countries. These
historic employment gains create benefits across demographic groups (OECD, 2024[1]). Most national
labour market indicators, such as employment, unemployment, and participation rates, have recovered in
most countries following the shock of the COVID-19 pandemic. For example, by Q2 2023, unemployment
and inactivity rates were, on average, half a percentage point and one percentage point, respectively,
below pre-pandemic levels in OECD countries (OECD, 2023[2]). However, this pattern has not been true
for all regions, contributing to persistent or growing regional inequalities in some countries. Employment
rates fully recovered or exceeded their pre-pandemic levels by Q2 2022 in less than half of OECD regions
across 33 countries (OECD, 2023[3]).The chapter will address the current situation and report on recovery
into 2023.
Labour shortages remain a prevalent and persistent issue in this high-employment context. As
industries evolve and new technologies emerge, the demand for specific skills can sometimes outpace
their supply, making it difficult for firms to fill needed positions. It may also be that available jobs are not
attractive enough in terms of pay, working conditions, location, or a combination of these. Even if 2023
saw real wage growth, wage gains remain below pre-pandemic levels (OECD, 2024[4]). This issue is further
exacerbated by demographic change, as ageing populations combined with declining birth rates contribute
to shrinking working-age populations. Regional labour market tightness increased by around 50% since
2019, affecting regions with high and low prior levels of shortages similarly. At the same time, the average
difference between the relatively tightest and least tight regions is almost twice the national average,
indicating substantial regional variation in the extent of labour shortages (see Chapter 2).
17
JOB CREATION AND LOCAL ECONOMIC DEVELOPMENT 2024 © OECD 2024
Labour productivity is an important driver for reducing income inequality, yet regional differences
remain large: levels in the most productive region are almost twice as high as the least productive region,
on average within OECD countries (OECD, 2023[3]). The trend of stagnating labour productivity adds to
the challenge of widening regional inequalities in GDP per capita in more than half of OECD countries with
available data. This is especially a challenge where large differences in productivity levels exist even where
there were declines in GDP per capita inequality (OECD, 2023[3]).
Active innovation and the diffusion of new technologies, for example, artificial intelligence, across
regions, coupled with targeted investments in infrastructure such as digital technologies may be
avenues for boosting productivity (OECD, 2023[3]). Yet, whether artificial intelligence will support or
replace workers depends on the "task-based" nature of jobs and the ability of AI to perform those tasks
more efficiently (Nedelkoska and Quintini, 2018[5]). The issue is addressed in Chapter 3 through new
estimates on occupational exposure to AI, such as large-language models. The regional-level analysis
presents within-country disparities in AI exposure, affecting a broader group of people and places. It
discusses the potential double-edged sword of the integration of AI in the workforce: whether it is
productivity-boosting or leads to job displacement.
Overall, the rapid pace of technological change and the shift towards greener economies creates
a growing need for new skills and competencies and regions have different capacities to adapt. For
example, while 18% of workers in the OECD have jobs with a significant share of green tasks that promote
- considerable range across
regions, from 7% to more than 35%, and are especially concentrated in capital-city regions (OECD,
2023[6]).
In light of these trends, this chapter examines the current state of regional labour markets and their
resilience to major transitions. The first section explores regional labour market dynamics over the past
decade, touching upon the recovery from the COVID-19 crisis, and regional convergence. It considers
recent developments and implications for employment, labour productivity and inclusion. The second
section delves into different indicators linked to the ability of regional labour markets to adapt and benefit
from the full potential of both workers and firms. For example, it investigates recent trends in the take-up
of non-traditional work, skills polarisation and skills mismatch, as well as the sectoral concentration of
employment and the incidence of mass layoffs.
Regional disparities persist, highlighting the absence of regional convergence
despite a strong recovery from the COVID-19 shock
Across OECD regions, employment rates have reached record highs (Figure 1.1). In 26 OECD
countries, employment rates are above 70% in at least three in four regions, and in 20 countries, in all
regions. In almost three in five regions (59%), employment stands at over 70% of the labour force and over
80% in almost one in ten regions (8%). Employment is particularly high in Iceland, Switzerland, and the
Netherlands, which all boast at least two regions in the top ten of employment rates across OECD regions.
Four out of the top ten regions are in the Netherlands, which can likely be attributed to the high take-up of
part-time work. On the other hand, the employment rate is lagging and below 60% in at least one-third of
their regions for seven OECD countries. This is also the case in about one in seven (14%) OECD regions.
This is a particular challenge for Türkiye and Italy, which have six (out of 26) and three (out of 21) regions,
respectively, in the bottom ten of employment rates across OECD regions. The lowest employment rate is
in Chocó (Colombia), likely due to its geographical isolation and lack of infrastructure. This is similar to the
challenges faced by the Italian regions, which are all located in the south. While in Türkiye, low female
labour market participation rates, which range from 24% to 49%, limit employment rates.

18
JOB CREATION AND LOCAL ECONOMIC DEVELOPMENT 2024 © OECD 2024
Within-country regional differences are widespread. In 16 out of the 35 countries with more than one
region, the difference between the top and bottom regions in employment rates is over ten percentage
points. In Colombia, the difference exceeds 34 percentage points; in Italy, it is almost 30 percentage points
and in Türkiye and Israel, almost 22 percentage points, highlighting particularly large disparities in these
countries. Portugal has the smallest dispersion, among countries with at least five regions, at about two
percentage points. This is followed by Denmark and Norway, where the difference is about 3 and 3.6
percentage points, respectively. As many regions experience all-time high employment, the focus is
shifting towards widespread labour shortages (see Chapter 2).
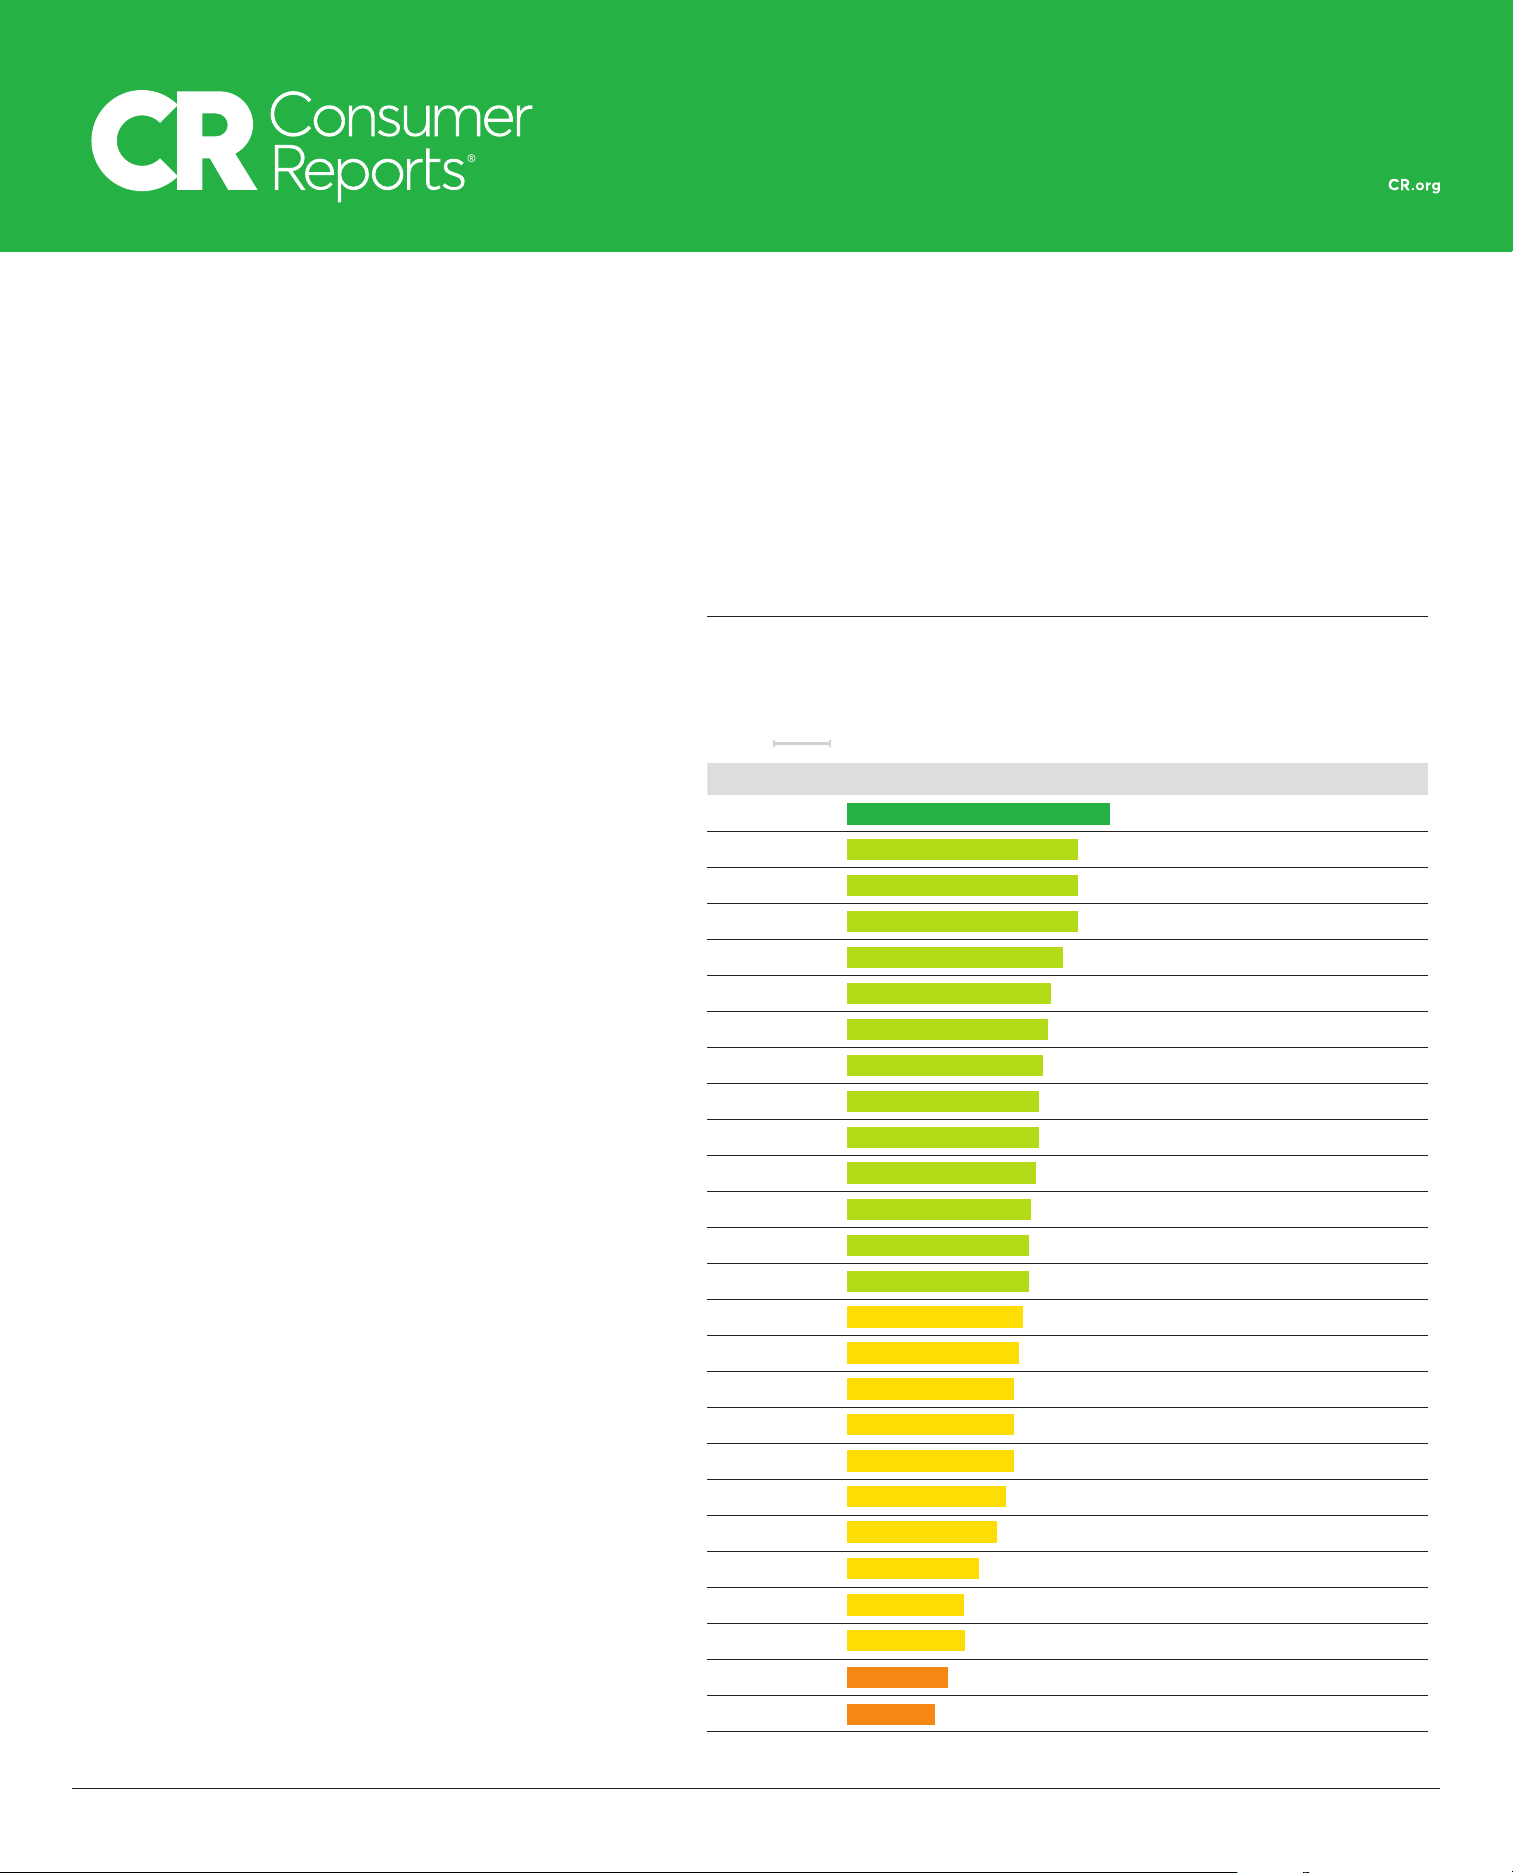
Figure 1.1. Employment rates are high, and regional differences exist across OECD countries
Note: The figure shows the regional dispersion (highest, lowest and median value) in the employment rate for 15-64 year-olds in 2023. For
Colombia, the data refers to 2022 due to data availability. The sample is all TL-2 regions in countries (including the OECD accession countries
of Bulgaria, Croatia and Romania) with available data. The employment rate is defined as the number of working-age employed persons out of
the working-age population, where the working-age is defined as 15-64 year-olds.
Source: OECD calculations based on the OECD Regional databases.
Over the past decade, there has been minimal progress towards regional convergence in
employment rates. In 2023, employment rates in the top quintile of regions in a country were more than
4% above the national median versus almost 6% in 2013 (Figure 1.2). In contrast, employment in the
bottom quintile of regions is almost 7% below the national median, versus almost 8% in 2013. Thus, there
have been small decreases in within-country disparities over the past ten years. In 2013, the top quintile
of regions had employment rates almost 16% higher than the bottom quintile, with the gap falling to 13%
by 2023. Overall, the within-country difference in employment rates between top and bottom regions fell
by about 2.5% of the national average over the past ten years.
Vienna Salzburg
Tasmania Canberra Region
Wallonia Flemish Region
North West South West
Newfoundland Labrador Quebec
Ticino Central
Los Lagos Aysén
Chocó Narińo
Brunca Central
Moravia-Silesia Prague
Bremen Bavaria
South Copenhagen Region
Estonia Estonia
W. Macedonia Peloponnese
Andalusia Madrid
East and North Ĺland
Hauts-de-France Pays de la Loire
Pannonian Croatia City of Zagreb
North Budapest
Southern Eastern and Midland
Jerusalem Tel Aviv
Reykjavik Region Other Regions
Campania Bolzano-Bozen
Kansai Hokuriku
Gyeongnam Jeju
Centre and West Vilnius
Luxembourg Luxembourg
Latvia Latvia
Chiapas Baja California S.
Limburg N. Brabant
Agder and Sřr-Řstlandet Western Norway
Northland Wellington
Podkarpacia Warsaw Region
North Algarve
South East Bucharest - Ilfov
East Middle Stockholm
East West
East Bratislava
S.E. Anatolia E. Thrace
Wales S.E. England
Mississippi South Dakota
Romania
Croatia
Bulgaria
Iceland
Netherlands
Switzerland
Japan
New Zealand
Sweden
Australia
Norway
Germany
Estonia
Denmark
Canada
Austria
Czechia
United Kingdom
Lithuania
Hungary
Finland
Ireland
Portugal
United States
Slovak Republic
Slovenia
Poland
Latvia
Luxembourg
France
Korea
Italy
Israel
Spain
Mexico
Chile
Belgium
Greece
Colombia
Costa Rica
Türkiye
40 50 60 70 80 90
Employment rate (%)
aaa
Minimum Regional median Maximum

19
JOB CREATION AND LOCAL ECONOMIC DEVELOPMENT 2024 © OECD 2024
Figure 1.2. As employment rates reach a record high, there has been minimal regional convergence
over the last decade
Evolution of the employment rate relative to the national median, 2013 to 2023
Note: The figure shows the evolution of the employment rate for the working-age population (15-64 year-olds), relative to the national median
(which corresponds to 100 on the top graph), for the top and bottom 20% of regions which account for at least 20% of the population in a country.
The sample is all TL-2 regions in OECD countries with at least five regions and with data available over the entire period. The employment rate
is defined as the number of working-age employed persons out of the working-age population, where the working-age is defined as 15-64 year-
olds.
Source: OECD calculations based on the OECD Regional databases.
Regions with younger age profiles (non-ageing regions), capital-city regions and regions where
employment is specialised in green jobs or tradeable sectors lead employment rates (Figure 1.3).
The strongest predictor of high employment rates is the absence of an increase in the old-age dependency
ratio: within-country employment levels are close to 4.5 percentage points higher, on average, in those
regions than regions where the old-age dependency ratio rose. This is followed by the regional employment
structure. In regions with an above-country-median employment share in green jobs or in tradeable goods
or services, the employment rate is about 2.5 percentage points higher, on average, than in regions with
a below-median share of green jobs or specialised in non-tradeable sectors. Finally, capital-city regions
have employment rates that are two percentage points higher than non-capital-city regions. These regional
differences in employment rates exist regardless of national characteristics or population size and account
for country-level shocks. In contrast, none of these regional characteristics is correlated with within-country
employment growth over the past ten years (Annex Figure 1.B.1). Regional characteristics in the same
country, such as demographics, location or industry structure, are thus important for understanding current
employment rates.
Difference(Top 20% - Bottom 20%)
2013 2014 2015 2016 2017 2018 2019 2020 2021 2022 2023
2013 2014 2015 2016 2017 2018 2019 2020 2021 2022 2023
95
100
105
110
115
11.0
11.5
12.0
12.5
13.0
13.5
Relative employment rate
Top 20% Bottom 20% Ratio(Top 20% to Bottom 20%)

20
JOB CREATION AND LOCAL ECONOMIC DEVELOPMENT 2024 © OECD 2024
Figure 1.3. Employment rates are higher in capital-city regions, non-ageing regions, regions with a
high share of green jobs and jobs in tradeable service sectors
Within-country correlation of the employment rate to selected characteristics, 2023 or latest available year
Note: ***p-value<0.01, **p-value<0.05, *p-value<0.1. The graph shows the coefficient and 90% confidence intervals of separate multivariate
regressions of the employment rate in 2023 (for Colombia, the latest available year is 2022) on a dummy for capital-city regions, ageing regions
(defined as those that experienced an increase in the elder-dependency rate over the past five years), for an above national median employment
share in green jobs in 2021, in tradeable services (ISIC broad sectors G to N), tradeable goods (ISIC sectors B, D, E) or neither tradeable goods
nor services. The coefficient (`within-country correlation') presents the within-county percentage point difference in employment rates based on
the characteristic on the x-axis. Each regression also controls for the log of population in 2023 or latest available year and country fixed effects.
The level of observation is the TL-2 region. The sample of countries includes all OECD countries. Robust standard errors are clustered at the
country level. The employment rate is defined as the number of working-age employed persons out of the working-age population, where the
working-age is defined as 15-64 year-olds.
Source: OECD elaboration based on the OECD Regional databases.
Despite concerns that COVID-19 would exacerbate regional inequalities through substantial and
sustained workforce dropout in more affected regions, within-country differences in participation
rates have been stable (Figure 1.4). Participation rates refer to the share of people employed or looking
for work out of the working-age population. A fall in participation rates implies that people are dropping out
of the workforce into economic inactivity, i.e. they are no longer employed or looking for work. There was
a particular risk of this during the COVID-19 crisis due to its specific nature, characterised by lockdowns,
challenges to specific industries, risks to older workers, and an increased burden of home care. Thus, it is
notable that the ratio of participation rates in the top compared to the bottom quintile of regions in a country
is at its lowest level over the past ten years: about 9.9%, which is a modest decrease from 11% in 2013.
This is despite the small (0.6 percentage points) increase in the ratio during 2020. Overall, in 2023, the top
quintile of regions had participation rates 3.5% higher than the national median, while the bottom quintile
of regions trails the national median by 5.5%.
**
**
** **
***
-7.5
-5.0
-2.5
0.0
2.5
5.0
Capital-city regions Ageing regions Sh(green jobs) Tradeable services Tradeable goods Non tradeables
Within-country correlation

21
JOB CREATION AND LOCAL ECONOMIC DEVELOPMENT 2024 © OECD 2024
Figure 1.4. Participation rates remain 10% higher in the top versus the bottom quintile of regions
within a country, a difference of almost 9% of the national median
Evolution of the participation rate relative to the national median, 2013 to 2023
Note: The figure shows the evolution of the participation rate for the working-age population (15-64 year-olds), relative to the national median
(which corresponds to 100 on the top graph), for the top and bottom 20% of regions which account for at least 20% of the population in a country.
The sample is all TL-2 regions in OECD countries with at least five regions and with data available over the entire period. The participation rate
is defined as the number of working-age employed persons or persons looking for work out of the working-age population, where the working-
age is defined as 15-64 year-olds.
Source: OECD calculations based on the OECD Regional databases.
Employment and participation rebounded strongly after the COVID-19 shock
By 2023, half of OECD countries (19 out of 38 countries) saw all regions recover their employment
levels to at least pre-pandemic levels (Figure 1.5). In ten countries, employment rates surpassed pre-
pandemic levels by more than 1.5 percentage points in all regions, while in eight OECD countries,
employment recovery is limited, and no region rebounded by more than 1.5 percentage points. In only one
country (Latvia), all regions have yet to recover to their pre-crisis employment rate; in all other countries,
regional employment recovery is uneven with some regions recovering while others lag. Overall, more than
three-fourths (76%) of OECD regions recovered their pre-pandemic employment rates, with almost half
(49%) of regions recovering by at least 1.5 percentage points, and almost one in ten (8%) regions by over
5 percentage points. In contrast, for one in ten OECD regions, employment rates are still more than 1.5
percentage points below pre-crisis levels, and for a little over one in a hundred (1.2%) OECD regions, rates
lag by more than 5 percentage points. While the vast majority of OECD regions showed strong employment
recovery after the COVID-19 shock, some still face challenges in regaining their pre-pandemic employment
levels.
Difference(Top 20% - Bottom 20%)
2013 2014 2015 2016 2017 2018 2019 2020 2021 2022 2023
2013 2014 2015 2016 2017 2018 2019 2020 2021 2022 2023
95
100
105
110
9.00
9.25
9.50
9.75
10.00
Relative participation rate
Top 20% Bottom 20% Ratio(Top 20% to Bottom 20%)

22
JOB CREATION AND LOCAL ECONOMIC DEVELOPMENT 2024 © OECD 2024
Figure 1.5. Regional employment recovery is uneven in half of OECD countries
Note: The figure shows the regional difference between the employment rate in 2019 and the employment rate in 2023, except for Colombia
where the latest available year is 2022. The sample is all TL-2 regions (including the OECD accession countries of Bulgaria, Croatia and
Romania) with available data. The employment rate is defined as the number of working-age employed persons out of the working-age
population, where the working-age is defined as 15-64 year-olds.
Source: OECD calculations based on the OECD Regional databases.
Employment rates returned to pre-crisis levels for metropolitan regions in 12 countries and for non-
metropolitan regions in 11 countries, out of the 18 countries with available data (Figure 1.6). Yet,
employment in metropolitan regions rebounded by 0.3 percentage points more than in non-metropolitan
regions on average, ranging from -3.2 percentage points in Lithuania (since non-metropolitan regions
recovered the quickest) to over 5 percentage points in Ireland. Furthermore, although the average
employment change is similar across metropolitan and non-metropolitan regions (about 1.1 and
0.9 percentage points, respectively), non-metropolitan regions showed much greater volatility with greater
employment gains and employment declines than metropolitan regions. Thus, despite the increased
severity of the COVID-19 epidemic in cities and metropolitan areas, metropolitan regions proved to be
more resilient and stable in responding to the pandemic-related labour market shock.

23
JOB CREATION AND LOCAL ECONOMIC DEVELOPMENT 2024 © OECD 2024
Figure 1.6. Metro and non-metro regions recovered congruently, despite greater COVID-19
incidence in the former
Median employment rate change, 2019 to 2023 or latest available year
Note: The figure shows the change in the employment rate from 2019 to 2023 (or the latest available year after 2020), in metropolitan regions
and non-metropolitan regions, defined at the TL-3 level, for each country. For Germany, the latest available year refers to 2021, and for Czechia,
Slovenia, Spain, Sweden, Switzerland, and the United Kingdom, to 2022. The employment rate is defined as the number of working-age
employed persons out of the working-age population, where the working-age is defined as 15-64 year-olds.
Source: OECD calculations based on the OECD Regional databases.
Most regions recovered strongly from the COVID-19 pandemic both in employment and labour
market participation. Compared to pre-COVID levels, almost seven in ten (69%) OECD regions reached
at least pre-crisis levels in both dimensions, with over one-third (36%) of regions displaying improvements
in both rates by over 1.5 percentage points (Figure 1.7). Yet, regional disparities exist. More than one-third
of OECD countries have regions that recovered in only one dimension. And in one in nine (11%) OECD
regions, both participation and employment rates are at least 1.5 percentage points below their pre-Covid
values. The average employment change since the pandemic across all OECD regions is 1.5 percentage
points, while for participation rates, the change is 1.1 percentage points.
In general, regional employment rates recovered more widely than participation rates. This suggests
that employment rates, if viewed in isolation, may paint a slightly more positive picture since they obscure
the presence of economic inactivity, i.e. the working-age population that is neither employed nor looking
for work. Particularly, in almost half (45%) of OECD regions, employment rates recovered by more than
participation rates; and in one in twelve (9%) regions, only employment rates recovered, more than double
the regions where only participation rates recovered. Among regions that have yet to recover, the average
gap (the extent to which the current rate is below the pre-crisis value) is similar: about 1.6 percentage
points for both participation and employment rates. The policy response of countries to COVID-19,
particularly through employment support programmes, was without precedent, matching the novel nature
of the shock (OECD, 2022[7]). Yet, given that labour market participation rates lagged employment rate
recovery, additional efforts may be required to bring back workers who left the labour market during
COVID-19.
-2
0
2
4
Korea
Ireland
New Zealand
Australia
Hungary
Lithuania
Italy
Slovak Republic
Austria
Switzerland
Spain
United Kingdom
Slovenia
Sweden
Germany
Czechia
Norway
Latvia
Employment rate change (pp)
Metro regions Non metro regions

24
JOB CREATION AND LOCAL ECONOMIC DEVELOPMENT 2024 © OECD 2024
Figure 1.7. Regional employment recovered more widely than participation rates
Note: The figure shows the share of regions in each country which belong to each of the five categories comparing the change in employment
and participation rates from 2019 to 2023, except for Colombia where the latest available year is 2022. `Faster for employment' means that the
employment and participation rate are at or above their 2019 rate, but employment recovered by more. `Faster for participation' means that both
the employment and participation rates are at or above their 2019 rate, but participation recovered by more. `Only employment' means that the
employment rate is at or above the 2019 rate, but not the participation rate. `Only participation' means that the participation rate is at or above
the 2019 rate, but not the employment rate. `Neither' means that both the employment and participation rates are below their 2019 rate. The
sample is all TL-2 regions in all OECD countries (including the OECD accession countries of Bulgaria, Croatia and Romania) with available
data. The employment rate is defined as the number of working-age employed persons out of the working-age population, where the working-
age is defined as 15-64 year-olds. The participation rate is defined as the number of working-age employed persons or persons looking for work
out of the working-age population, where the working-age is defined as 15-64 year-olds.
Source: OECD calculations based on the OECD Regional databases.
Government action likely played a key role in the post-pandemic recovery patterns of employment and
participation, but no particular scheme stands out for explaining regional recovery. These policies included
job retention schemes such as short-term work (STW) schemes, wage subsidies, and cash transfers (see
Box 1.1 for an overview). Furthermore, government action, particularly furlough schemes, likely avoided
large negative shocks to employment (Calligaris et al., 2023[8]). Yet, some workers who are more
represented in certain regions, for example, the self-employed, were often not eligible to benefit from these
schemes in many countries. Differences in accounting techniques, particularly whether furloughed workers
were counted as unemployed, as in North America, or employed, as in Europe, also obscure the ability to
comment on their efficiency. It is also important to note that regions may have been exposed to other
shocks in the same period, which are not considered here. For example, the energy crisis triggered by
degrees, depending on their reliance on Russian gas supplies (OECD, 2022[9]; OECD, 2022[10]). Thus
0
25
50
75
100
Iceland
Ireland
Korea
Luxembourg
France
Australia
Italy
Spain
Poland
Norway
Greece
New Zealand
Türkiye
Canada
Slovenia
United States
Denmark
Portugal
Belgium
Costa Rica
Switzerland
Colombia
Germany
Slovak Republic
Finland
Israel
Netherlands
Hungary
Sweden
Austria
Estonia
Czechia
Lithuania
Chile
Latvia
Croatia
Bulgaria
Romania
Share of regions (%)
Recovery type
Faster for employment Faster for participation Only employment Only participation Neither

25
JOB CREATION AND LOCAL ECONOMIC DEVELOPMENT 2024 © OECD 2024
Regions experienced narrowing gender inequalities and widening age inequalities over
the past ten years
The labour market experience of workers during the past decade has varied depending on their
demographics, with distinct challenges and responses shaping their paths (OECD, 2022[7]). The
recovery from the recent pandemic is especially pertinent in this regard. For example, older workers, given
the health risks during the COVID-19 crisis, may have chosen to permanently exit the labour force, such
as taking early retirement. For the cohort of young workers who entered the labour market during the crisis,
the shock could have had a lasting impact on their labour market integration and career progression. Lastly,
lockdown restrictions put further pressure on child and home care activities, the brunt of which tends to fall
on women, bringing down their participation rates (Djankov et al., 2021[13]; OECD, 2021[14]; Alon et al.,
Box 1.1.From crisis to recovery: Employment support policies during COVID-19
In response to the unprecedented shock of the global pandemic in 2020, countries implemented
or expanded employment support policies to sustain economies and workers. These policies
include the use of job retention schemes in the form of short-term work (STW), wage subsidies, and
cash transfers to mitigate the economic impact of the shock. Both existing and temporary policies were
expanded during the pandemic to allow for increased access, coverage, and generosity (OECD,
2020[11]). These policies aimed to mitigate the effects of the crisis, prevent mass layoffs, maintain
attachment to the workforce, and support a quick recovery after public health restrictions were lifted.
Most OECD countries had pre-existing job retention schemes (JRS), while others implemented
temporary policies. Examples include job retention schemes such as STW and expanded benefits,
while others introduced temporary wage subsidies and direct cash transfers to cover independent
workers. The STW schemes are temporary partial or full suspensions of work contracts that directly
subsidise hours not worked. Wage subsidy schemes do not necessarily reduce the working hours of
workers but rather subsidise hours worked and can also supplement the earnings of workers on reduced
hours. Most also provided cash transfers to help workers not covered by traditional job retention
schemes (OECD, 2020[11]).
STW schemes existed in most OECD countries and were expanded during the crisis, with some
regional differences in take-up rates. This was the case in Belgium, France, Germany, the United
Kingdom and the United States. Otherwise, other OECD countries, such as Australia, Canada and
Colombia, used temporary wage subsidies instead of STW schemes to maintain employer-employee
relationships.
Countries also rolled out innovative cash transfers to aid workers, adapting these support
measures dependent on earnings, or offering cash transfers at a flat rate or value to the entire
eligible population. These countries include Austria, Canada, Italy, Japan, Korea, the United States
and the United Kingdom.
Across the OECD, JRS supported over 50 million jobs, ten times as many as during the global
financial crisis of 2008-10 (OECD, 2020[12]). However, there are significant regional disparities within
countries in the participation rates in these programmes. These are likely the result of local economic
structures as well as geographically targeted containment measures. Unfortunately, the lack of
comprehensive data on the regional take-up of these schemes prevents any analysis of whether
regional take-up explains why some regions performed better during the crisis. It is also important to
note that while most EU countries had pre-existing JRS, many other OECD countries such as Australia,
Canada, and the United Kingdom, had to quickly implement a temporary JRS, often in the form of wage
subsidies.

26
JOB CREATION AND LOCAL ECONOMIC DEVELOPMENT 2024 © OECD 2024
2020[15]). The aggregate picture of the post-crisis recovery of labour force participation masks the diversity
of these experiences. Consequently, analysis of differences in labour market outcomes by gender and age
warrants specific attention.
The past decade in OECD regions witnessed a narrowing of gender inequalities in many labour
markets. In five out of six (83%) OECD regions, the gender gap in participation rates, which reflects the
difference between male and female labour market participation rates, fell from 2013 to 2023 (Figure 1.8).
In more than two-thirds (67%) of regions, the gap fell by more than 1.5 percentage points. In 31 countries,
gender gaps fell in at least 70% of their regions. And, in 18 OECD countries, the gender inclusion gap fell
in all regions. While no OECD countries saw the gender participation gap increase in all regions, some
countries (Chile, Colombia, Costa Rica, Greece, Mexico, New Zealand, Türkiye and the United States)
show significant regional disparities in the change in the gender gap of over ten percentage points. For
example, in Türkiye and New Zealand, over 21 and 17 percentage points separate the region with the
greatest reduction in the gender gap (Western Black Sea Middle and East in Türkiye and Gisborne Region
in New Zealand) and the greatest increase (Eastern Anatolia - West in Türkiye and Tasman-Nelson-
Marlborough in New Zealand). On average, the gender inclusion gap fell by 2.7 percentage points across
OECD regions.
Over the same period, age disparities increased by 0.9 percentage points, on average, across
OECD regions. The age inclusion gap, or the difference between participation rates of the prime-age (25-
64 year-olds) working population and youth (15-24 year-olds), grew in almost three in five (59%) of regions,
growing significantly by over 1.5 percentage points in more than half (53%) of regions (Figure 1.8). In 23
OECD countries, age gaps grew in at least 70% of their regions. All regions in 13 OECD countries saw
increases in the age inclusion gap. In four countries, all regions decreased their age inclusion gap. Of the
remaining countries where the change in the age inclusion gap did not change in the same direction for all
regions, in Chile, France, Mexico, New Zealand, Slovak Republic, and the United States, the difference
between the region with the greatest increase and the region with the greatest reduction is over twenty
percentage points. It is important to caveat these findings as the labour force participation rates of youth
are not adjusted to account for the general trend of young people deciding to remain longer in higher
education.

27
JOB CREATION AND LOCAL ECONOMIC DEVELOPMENT 2024 © OECD 2024
Figure 1.8. Age inequalities, but not gender, exacerbated over the last decade
Share of regions given change in the gap in the participation rate by age and gender, 2013 to 2023 or latest
available year
Note: The figure shows the share of regions in each country which belong to each of the four categories representing the difference between
the age gap between the prime-age working population (25-64 year-olds) and youth (15-24 year-olds) (top panel) and gender gap between male
and women (bottom panel) in the participation rate in 2013 and the gap in the participation rate in 2023. For Colombia (except for Chocó where
the data refers to 2010 to 2020), Korea and the United Kingdom (except for North where the data refers to 2011 to 2021); for Mexico (except for
Nayarit where the data refers to 2009 to 2019) the last year is 2020. The sample includes all TL-2 regions in countries with available data,
including the OECD accession countries of Bulgaria, Croatia and Romania. The participation rate is defined as the number of working-age
employed persons or persons looking for work out of the working-age population in the same subgroup, where the working-age is defined as
15-64 year-olds.
Source: OECD calculations based on the OECD Regional databases.
Rising age disparities cannot solely be attributed to rising educational enrolment rates; they are
also not associated with increases in the NEET rates (Figure 1.9). While a positive correlation between
rising youth enrolment rates and increases in the age gap in participation rates exists across regions, the
association is small (0.02) and weak (not statistically different from zero). Thus, widening age disparities
cannot be entirely attributed to a general trend of staying longer in education. At the same time, the share
of youth not in employment or education (NEET) fell over the past ten years in almost nine in ten (88%)
OECD regions with available data, even as age disparities widened.1 Furthermore, a time-series analysis
of the evolution of the age and gender gap in employment and participation rates suggests that age
disparities grew during the pandemic, while men and women were similarly affected (Annex Figure 1.B.2).2
These pieces of evidence suggest that, despite the rise in the age gap in participation rates, there is likely
a limited risk of further labour market scarring, whereby youth who graduate during a recession or shock
suffer long-term negative effects on their earnings and career opportunities over time (Tomlinson and
Tholen, 2023[16]; Schwandt and von Wachter, 2019[17]). Yet, it is important to continue to monitor the
situation. These evolving patterns underscore the need for targeted policies to address age inequalities
where they persist while supporting the gains achieved in gender balance (for selected examples, see
Annex Box 1.A.1. in Annex 1.A).
Gender gap (Male - Female)
Age gap (25 to 64 year-olds - 15 to 24 year-olds)
Iceland
Costa Rica
New Zealand
Colombia
Denmark
Mexico
Norway
Austria
United States
France
Germany
Italy
Türkiye
Sweden
Greece
Portugal
Poland
Hungary
Canada
Netherlands
Latvia
Slovenia
Belgium
Korea
Czechia
Switzerland
Spain
Australia
Chile
Estonia
Finland
Ireland
Israel
Japan
Lithuania
Luxembourg
Slovak Republic
United Kingdom
Romania
Bulgaria
Croatia
0
25
50
75
100
0
25
50
75
100
Change in gap from 2013 to 2023
Increase >= 1.5 pp Increase < 1.5 pp Decrease < 1.5 pp Decrease >= 1.5 pp

28
JOB CREATION AND LOCAL ECONOMIC DEVELOPMENT 2024 © OECD 2024
Figure 1.9. Regions with large increases in the age inclusion gap saw NEET rates fall, and there is
little link with changes to youth enrolment rates
Correlation between the ten-year change in the NEET rate (left) or the youth enrolment rate (right) and the age
inclusion gap, 2013 to 2023 or closest available years
Note: The figure shows the ten-year change in the difference in the participation rate for the prime-age working population (25-64 year-olds) and
youth (15-24 year-olds) on the y-axis, and the ten-year change in the youth not in employment, education or training rate (18-24 year-olds) on
the x-axis on the left graph and the ten-year change in the educational enrolment rate for youth (20-29 year-olds) on the x-axis on the right
graph, over the years 2013 to 2023, or the closest available years for OECD TL-2 regions with available data. For the age inclusion gap, the last
available year is 2022 for regions in Colombia (except for Chocó where the data refers to 2010 to 2020), Korea, and the United Kingdom (except
for North where the data refers to 2011 to 2021); for Mexico (except for Nayarit where the data refers to 2009 to 2019) the last year is 2020. For
youth enrolment rates, the ten-year period is 2012 to 2022 for Colombia, Latvia, New Zealand, and the United States; the initial year is 2014 for
Estonia and Poland, and 2016 for Chile and Korea; for Austria, Australia, Belgium, Czechia, Denmark, Germany, Greece, Spain, Finland, France,
Hungary, Italy, the Netherlands, Norway, Poland, Portugal, Sweden, Slovak Republic, Switzerland, Türkiye, and the United Kingdom, the last
available year is 2022. For NEET rates, the ten-year period refers to 2011 to 2021 for Sweden, to 2012 to 2022 for Australia, Belgium, Israel,
Japan, Mexico, Slovak Republic, Spain, Switzerland, the United Kingdom and the United States. The dotted line represents the correlation line,
and the grey-shaded area represents the 95% confidence intervals between the two measures. The estimate of the correlation is listed on the
top right of each graph with standard error in paratheses. Each dot represents a TL-2 region. Outliers, defined as regions with values in the top
or bottom 8% of the distribution, are not included. The participation rate is defined as the number of working-age employed persons or persons
looking for work out of the working-age population in the same subgroup, where the working-age is defined as 15-64 year-olds. The NEET rate
is defined as the share of youth not in employment, education or training) out of the youth working-age population (15- 24 year-olds). The
educational enrolment rate is the share of individuals aged 15-29 year-olds enrolled in all types of schools and education institutions, including
public, private and all other institutions that provide organised educational programmes according to the ISCED 2011 classification, regardless
of education level, out of all individuals aged 15-29 year-olds.
Source: OECD calculations based on the OECD Regional databases.
Age disparities in labour force participation rates are highest for capital-city regions, while gender
disparities are most prominent in non-capital-city regions (Figure 1.10). In 2023, capital-city regions
had a gender inclusion gap that was almost four percentage points below that of non-capital-city regions.
In contrast, the age gap in participation rates was almost seven percentage points higher in capital-city

29
JOB CREATION AND LOCAL ECONOMIC DEVELOPMENT 2024 © OECD 2024
regions. Both types of regions exhibit the same general trend over the past years in the evolution of the
age and gender gap in participation rates: the age gap is increasing over the decade while the gender gap
is decreasing. Yet, in both cases, disparities between capital and non-capital-city regions are widening.
From 2013 to 2023, they increased marginally by 0.3 percentage points for the gender inclusion gap and
by 2.8 percentage points for the age inclusion gap. Universities, and thus, a higher share of students, tend
to be located in capital-city regions, which likely explains a part of the increase, as previously discussed.
Figure 1.10. Capital-city regions contribute most to the age gap in participation rates while the
gender gap is highest in non-capital-city regions
Note: The figure shows the evolution of the difference in the participation rate for youth (aged 15 to 24) and the prime-age population (top panel)
and the gender difference for males and females (bottom panel) for the working-age population (15-64 year-olds) for capital-city regions vs non-
capital-city regions. The sample is all TL-2 regions in OECD countries with data available over the entire time period. The participation rate is
defined as the number of working-age employed persons or persons looking for work out of the working-age population in the same subgroup,
where the working-age is defined as 15-64 year-olds.
Source: OECD calculations based on the OECD Regional databases.
Most regions face persistently low productivity growth, with little progress in
closing regional gaps in labour productivity
Labour productivity, defined as output per worker, is often cited as a primary driver of growth, well-
being, and competitiveness in the global economy (see Box 1.2). It plays a role in enabling higher
wages, improved living standards, and increased investments in public services and infrastructure. As
economies globally face the challenges of technological adaptation and demographic shifts, understanding
the dynamics of their productivity allows regions to adapt to these challenges. Factors such as
technological innovation, human capital, regulatory environments, and infrastructure development play
significant roles in shaping productivity trends. However, recent years have witnessed a troubling
slowdown in productivity growth across various advanced economies, accompanied by a disconnect
between productivity gains and real wage increases. This scenario underscores the need for insightful
policy interventions that can revive productivity while aiming for benefits that extend to workers and
enhance the economic well-being of regions.
Gender gap (Male - Female)
Age gap (25 to 64 year-olds - 15 to 24 year-olds)
2013 2014 2015 2016 2017 2018 2019 2020 2021 2022 2023
2013 2014 2015 2016 2017 2018 2019 2020 2021 2022 2023
32
34
36
38
40
9
11
13
15
Difference in participation rate (%)
Capitol-city regions Non-capital-city regions

30
JOB CREATION AND LOCAL ECONOMIC DEVELOPMENT 2024 © OECD 2024
Box 1.2. Navigating the productivity puzzle: Factors, trends, and challenges facing OECD
regions
Labour productivity, measured here as the output per worker, is a fundamental indicator of
economic efficiency and a key driver of economic growth and well-being.3 Higher labour
productivity allows for increased wages and living standards since it implies more value is generated
per worker or hour worked. This, in turn, can support higher income levels and greater investments in
public services and infrastructure (Abiad, Furceri and Topalova, 2015[18]). On a global scale, productivity
y to
innovate and adapt to technological advancements (OECD, 2018[19]; Schwab and Zahidi, 2020[20]).
Consequently, a focus on labour productivity growth is vital for driving local economic development and
improving the quality of life in OECD regions.
Productivity growth is driven by a confluence of factors, including technological advancements,
human capital development, regulatory environments and infrastructure improvements
(Syverson, 2011[21]). Technological innovation, particularly in the digital and manufacturing sectors, has
been identified as a key enhancer of productivity by enabling more efficient production processes and
fostering new business models (OECD, 2024[22]; OECD, 2023[23]). For example, there is early micro-
evidence that artificial intelligence, such as large language models, may be productivity-enhancing,
although long-run aggregate effects are not yet evident (Filippucci et al., 2024[24]). Its impact on workers
and occupations is also not yet clear (see Chapter 3). Human capital also plays a role: better-educated
workforces adapt more swiftly to new technologies and processes, thereby increasing output (OECD,
2019[25]). In addition, regulatory frameworks that encourage competition and facilitate fair market
conditions can significantly boost productivity by promoting efficiency among businesses (Nicoletti and
Scarpetta, 2003[26]; Rubens, 2023[27]). Lastly, investments in infrastructure not only improve efficiency
but also connect markets more effectively, enhancing productivity at both national and regional levels
(OECD, 2023[3]).
Despite its central role in driving economic growth and well-being, productivity growth slowed
down significantly in recent years, turning negative in the European Union, the United States and
the OECD in 2022 (OECD, 2024[28]). Several potential, and likely inter-linked, explanations lie behind
this productivity slowdown rooted in macroeconomic, societal and technological shifts. For example,
one theory relates to the slowdown in technological progress given the increasing difficulty of generating
new ideas and fewer groundbreaking innovations (such as electricity and the internal combustion
engine) versus advances in software and information technology (Bloom et al., 2020[29]; Gordon,
2017[30]). Structural factors, such as ageing populations, the slowdown in trade and lower growth of
allocative efficiency, also play a role (Goldin et al., 2024[31]; Maestas, Mullen and Powell, 2023[32];
Daniele, Honiden and Lembcke, 2019[33]). Skills mismatches and inadequate investment in education
and training, depressing the contribution of human capital, may have also hindered productivity
improvements across various industries (World Bank Group, 2021[34]). Finally, difficulties in measuring
labour productivity may also be a factor, albeit a small one that cannot fully explain the widespread
phenomenon (Ahmad, Ribarsky and Reinsdorf, 2017[35]).
An important caveat is the documented trend of the decoupling of productivity and real wage
growth, which casts doubt on the ability of productivity gains to translate into improvements in
well-being. A study across 24 OECD countries found that productivity increases decoupled from gains
in real wages over the period 1995 to 2015, given declines in total-economy labour shares and a partial
measure of wage inequality (the ratio of median wages to average wages) (Schwellnus, Kappeler and
Pionnier, 2017[36]). Increase in knowledge-based capital, technological change, and the rise of global

31
JOB CREATION AND LOCAL ECONOMIC DEVELOPMENT 2024 © OECD 2024
Within-country productivity differences are widespread, driven by a few top-performing regions.
The most productive region is twice as productive as the least productive, on average (Figure 1.11). Labour
productivity in the most productive region is more than three times higher than in the least productive
regions in 3 out of 33 (9%) OECD countries and twice as high in 20 out of 33 (60%) OECD countries with
available data. This is mainly driven by a few regions that lead productivity within a country. In 30 out of 33
OECD countries, the median relative productivity level is below the national average, which is normalised
to one. Overall, almost two-thirds (62%) of OECD regions have productivity levels below the national
average.
Figure 1.11. Within OECD countries, the leading region's productivity is, on average, double that of
the least productive region
Note: The figure shows the regional dispersion (highest, and lowest value) for labour productivity, relative to the regional median in the country
for 2022 or the latest available year. The vertical line represents the national average, normalised to one. The data refers to 2021 for New
Zealand, Norway, Switzerland and the United Kingdom; to 2020 for Australia and Alaska (United States); and to 2018 for Nunavut, N.W.
Territories, and Yukon regions in Canada. The sample is all TL-2 regions in countries (including the OECD accession countries of Bulgaria,
Croatia and Romania) with available data, excluding Ireland.
Source: OECD calculations based on the OECD Regional databases.
Burgenland Vorarlberg
Tasmania Western Australia
Wallonia Brussels Region
South Central South West
Prince Edward I. N.W. Territories
Espace Mittelland Northwestern
Ńuble Antofagasta
Narińo Meta
Northwest Prague
Mecklenburg-Vorpommern Hamburg
N. Jutland Copenhagen Region
Estonia Estonia
E. Macedonia, Thrace Attica
Extremadura Basque Country
Ĺland Helsinki-Uusimaa
Corsica Île-de-France
Pannonian Croatia City of Zagreb
S. Transdanubia Pest
Calabria Lombardy
Jeju Chungcheong
Centre and West Vilnius
Luxembourg Luxembourg
Latvia Latvia
Chiapas Campeche
Drenthe N. Holland
Innlandet Jan Mayen and Svalbard
Northland Auckland
Lublin Warsaw Region
North Lisbon Metropolitan
North East Bucharest - Ilfov
Smĺland with I. Stockholm
East West
Central Bratislava
N.E. Anatolia E. Istanbul
Wales Greater London
Mississippi D. of Columbia
Romania
Croatia
Bulgaria
Italy
Estonia
Lithuania
Luxembourg
Latvia
Slovenia
Finland
Germany
Spain
New Zealand
Switzerland
Türkiye
Austria
Colombia
Belgium
Netherlands
Korea
France
Sweden
United States
Hungary
Portugal
Denmark
United Kingdom
Greece
Poland
Australia
Mexico
Chile
Czechia
Norway
Canada
Slovak Republic
1 2
Relative labour productivity
aaa
Minimum Regional median Maximum
value chains and income inequality are all cited as potential drivers of this phenomenon (Autor and
Salomons, 2018[37]; Berlingieri, Blanchenay and Criscuolo, 2017[38]). Policies that call for higher
minimum wages, unionisation, employer protection laws and reduced wage inequality may contribute
to a positive link between productivity and wages over time, as well as to encourage upskilling of
workers to reduce capital-labour substitution (Berlingieri, Blanchenay and Criscuolo, 2017[38]; OECD,
2018[39]). Many of these factors are likely to depend on regional characteristics; for example, gains from
knowledge-based capital are likely to accrue in metropolitan regions.

32
JOB CREATION AND LOCAL ECONOMIC DEVELOPMENT 2024 © OECD 2024
In half of OECD regions, labour productivity growth over the past decade was below 0.8% per year
(Figure 1.12). Labour productivity growth, nonetheless, varies widely across OECD regions, ranging from
a decrease of about 5% in Greece’s Western Macedonia region to increases of almost 6% in Chile’s Los
Lagos region and almost 5% in several regions in Turkey (Southern Aegean; Western Black Sea – West;
and Northeastern Anatolia - East). Within-country differences are also significant among OECD countries.
The median regional dispersion, i.e. the difference between the top and bottom region, in annual
productivity growth over the past ten years is about 1.4 percentage points. The highest dispersions were
observed in Chile (8 percentage points), and Greece (6 percentage points). The lowest dispersions were
observed in Belgium (0.5 percentage points) and Sweden (0.8 percentage points). In more than half of
the countries with available data and with more than three regions, regional dispersion is above two
percentage points.
Figure 1.12. Most regions experienced only modest productivity growth over the past decade
Note: The map shows the initial labour productivity in 2012 and the annual rate of labour productivity growth over the past ten years, from 2012
to 2022 or the closest available years. The initial year refers to 2013 for Chile. The last year refers to 2021 for New Zealand, Norway, Switzerland
and the United Kingdom; to 2020 for Australia and Alaska (United States); and to 2018 for Nunavut, N.W. Territories, and Yukon regions in
Canada. Initial productivity levels are shown through the size of the circles and the change in labour productivity is shown through the colour
scale. Labour productivity is measured as GDP (in USD 2015 PPP) per worker, using regional deflators. The sample is all TL-2 regions (including
the OECD accession countries of Bulgaria, Croatia and Romania) with available data, excluding Ireland.
Source: OECD calculations based on the OECD Regional databases.
Annual labour productivity growth, within countries, evolved similarly over the past decade (2012
to 2022) for regions with higher and lower levels of productivity, even if the least productive regions
grew marginally faster (Figure 1.13). Between 2012 and 2022, productivity growth in the least productive
regions grew faster than the least productive in all but two years. For most of the decade, the least
productive regions grew, on average, at an annual rate of about 0.9%. During this time, the most productive
regions experienced slightly more sluggish growth of 0.6%, on average, or even negative growth, as in the
years 2012 and 2020. Indeed, in 2020 in the aftermath of the onset of the COVID-19 pandemic, both
groups of regions experienced negative annual productivity growth, with the most productive regions

33
JOB CREATION AND LOCAL ECONOMIC DEVELOPMENT 2024 © OECD 2024
seeing a downtick of almost 1.3 percentage points more than the least productive regions. Productivity
growth in the most and least productive regions grew sharply and converged in 2021, with a less than
0.5 percentage point difference in annual growth rates. This may be due to the shifting composition of
employment during the crisis, where smaller firms and lower-skilled workers dropped out of the labour
market, mechanically raising the average (Kapsos, 2021[40]). In the most recent year, 2022, the most
productive regions overtook the least productive regions in terms of growth. The gap in labour productivity
growth reached 0.7 percentage points, mostly due to a decline in labour productivity growth in the least
productive regions of almost 2.8 percentage points. This shift may represent a temporary fluctuation as
the economy stabilised from the COVID-19 shock and distortions caused by furloughed workers are no
longer as prevalent, or it may represent a longer-term trend that should be monitored.
Figure 1.13. Within OECD countries, annual productivity growth kept in step for both the most and
least productive regions
Annual labour productivity growth given initial productivity level, 2012 to 2022
Note: The figure shows the evolution of the annual growth rate of labour productivity for the top and bottom 20% of regions within a country from
2012 to 2022 based on initial productivity levels in 2012 which account for at least 20% of the population. The sample is all regions in countries
with at least five regions and with data available over the entire time period, excluding Ireland.
Source: OECD calculations based on the OECD Regional databases.
Productivity gains among the least productive regions were not enough to significantly narrow the
gap between the top and bottom-performing regions. By 2022, productivity levels are almost 53%
higher in regions in the top quintile of productivity than regions in the bottom quintile, compared to almost
56% in 2012, a decrease of less than two percentage points (Figure 1.14). Thus, although the least
productive regions have marginally higher annual productivity growth, these gains do not show up in terms
of relative productivity gains. The most productive regions have productivity levels almost 30% above the
national median, on average, while the least productive regions have productivity levels that are almost
13% below the national median in 2022. This represents a difference of 41% of the national median, on
average. The gap in productivity levels between the best- and worst-performing regions within a country
highlights persistent regional inequalities within the OECD. While some regions are thriving with high
productivity levels, others are struggling significantly, which could exacerbate socio-economic disparities.
Difference(Top 20% - Bottom 20%)
2012 2013 2014 2015 2016 2017 2018 2019 2020 2021 2022
2012 2013 2014 2015 2016 2017 2018 2019 2020 2021 2022
-2
-1
0
1
2
3
-1.0
-0.5
0.0
0.5
Labour productivity annual growth (%)
Initial level in 2012:
20% most productive regions Regional median 20% least productive regions

34
JOB CREATION AND LOCAL ECONOMIC DEVELOPMENT 2024 © OECD 2024
Figure 1.14. Productivity in the top quintile of regions remains over 50% higher than in the bottom
quintile of regions
Evolution of the labour productivity relative to the national median, 2012 to 2022
Note: The figure shows the evolution of labour productivity, relative to the national median (which corresponds to 100 on the top graph), for the
top and bottom 20% of regions which account for at least 20% of the population in a country. The sample is all TL-2 regions in OECD countries
with at least five regions and with data available over the entire period, excluding Ireland.
Source: OECD calculations based on the OECD Regional databases.
Productivity levels are higher in capital-city regions and regions with a higher share of green jobs or
specialising in tradeable services (Figure 1.15). Regions that contain the capital city have higher
productivity, far above non-capital-city regions, by over 1.7 standard deviations from the national mean.
The industrial composition of employment also plays a role. In regions with an above-median share of
green jobs or where employment is specialised in tradeable sectors, labour productivity is higher by almost
0.8 standard deviations from the national mean. In contrast, none of these characteristics are correlated
with higher labour productivity growth (Annex Figure 1.B.5).
Difference(Top 20% - Bottom 20%)
2012 2013 2014 2015 2016 2017 2018 2019 2020 2021 2022
2012 2013 2014 2015 2016 2017 2018 2019 2020 2021 2022
100
120
140
42
43
Relative labour productivity
Top 20% Bottom 20% Ratio(Top 20% to Bottom 20%)

35
JOB CREATION AND LOCAL ECONOMIC DEVELOPMENT 2024 © OECD 2024
Figure 1.15. Capital-city regions and regions with a higher share of green jobs or specialised in
tradeable services lead productivity levels
Within-country standardised correlation of labour productivity to selected characteristics, 2022 or latest available
year
Note: ***p-value<0.01, **p-value<0.05, *p-value<0.1. The graph shows the coefficient and 90% confidence intervals of separate multivariate
regressions of labour productivity, standardised within each country, in the latest available year on a dummy for capital-city regions (large regions
that include the capital city), regions with an above national median employment share in green jobs in 2021, in tradeable services (ISIC broad
sectors G to N), tradeable goods (ISIC sectors B, D, E) or neither tradeable goods nor services. The coefficient represents the change in
productivity, measured in standard deviations from the national mean, for regions with the specified characteristic on the x-axis. Each regression
also controls for the log of population in the latest available year, a dummy for the latest available year, and country fixed effects. The level of
observation is the TL-2 region. The sample of countries includes all OECD countries with available data, excluding Ireland. The data refers to
2021 for New Zealand, Norway, Switzerland and the United Kingdom; to 2020 for Australia and Alaska (United States); and to 2018 for Nunavut,
N.W. Territories, and Yukon regions in Canada. Robust standard errors are clustered at the country level.
Source: OECD elaboration based on the OECD Region and Cities databases.
Productivity growth over the past decade complemented gains in labour market participation but
not employment across OECD regions (Figure 1.16). There is a positive correlation between labour
productivity growth and the change in labour force participation rates. For employment, this correlation is
null. Indeed, productivity gains can lead to job losses, for example, in the case of labour-saving
technological change. Furthermore, job losses can mechanically raise labour productivity if output does
not fall at the same rate as the number of workers. Nonetheless, productivity gains did go hand-in-hand
with gains in participation rates: over four-fifths (83%) of regions where participation rates increased also
exhibited overall productivity growth at the same time. Furthermore, about two-thirds (64%) of OECD
regions are situated in the upper right quadrant of both graphs, indicating positive labour productivity gains
with increases in both employment and participation rates over the past ten years. Additionally, almost
three-fourths (74%) of regions experienced positive labour productivity growth, with an increase in either
employment or participation, but not both. Yet, in almost one in twelve (8%) regions, productivity gains did
not accompany either employment or participation gains.

36
JOB CREATION AND LOCAL ECONOMIC DEVELOPMENT 2024 © OECD 2024
Figure 1.16. Over the past ten years, labour productivity growth accompanied gains in participation
but not employment
Correlation between labour productivity growth and employment (left) or participation growth (right), 2012 to 2022 or
the closest available years
Note: The figure shows the ten-year change in the employment rate (left) or the participation rate (right) on the x-axis, and the ten-year compound
growth rate in labour productivity on the y-axis using the years 2012 to 2022, or the closest available years, for OECD regions with available
data. For labour productivity, the first year refers to 2013 for Chile and the last year refers to 2021 for New Zealand, Norway, Switzerland and
the United Kingdom; to 2020 for Australia and Alaska (United States); and to 2018 for Nunavut, N.W. Territories, and Yukon regions in Canada.
The dotted line represents the correlation, and the grey shaded area represents the 95% confidence intervals between the two measures. Each
dot represents a TL-2 region. Outliers are not shown. The employment rate is defined as the number of working-age employed persons out of
the working-age population, where the working-age is defined as 15-64 year-olds. The participation rate is defined as the number of working-
age employed persons or persons looking for work out of the working-age population, where the working-age is defined as 15-64 year-olds.
Source: OECD calculations based on the OECD Regional databases.
Building resilient regional labour markets: the role of workers and firms
Regional resilience involves the ability of a local economy to weather and recover from shocks
through adaptative changes in economic structures and social arrangements (Martin and Sunley,
2014[41]). These shocks include economic recession, natural disasters, and structural changes accelerated
by megatrends such as the green, digital and demographic transitions. Policies that support a dynamic
business environment, diversified sectoral base and local skills development are key to regional labour
market quality, while at the same time, to building resilience in the face of external shocks. For example,
targeted economic support measures, like maintaining employer-employee relationships and short-term
business support schemes, can aid recovery without compromising efficiency but must be balanced to
promote flexible labour markets. Active labour market policies, such as job-seeker support and skills
development programmes, enhance regional resilience by improving employability and cushioning against
unemployment during economic crises (Vermeulen, 2022[42]). Lastly, supporting vulnerable groups through

37
JOB CREATION AND LOCAL ECONOMIC DEVELOPMENT 2024 © OECD 2024
in-work benefits, partial unemployment aid, and skills subsidies helps to build more equitable resilience.
This section considers several indicators covering skill levels and mismatch, the take-up of non-traditional
work on the worker side, and sectoral diversification and the case of mass layoffs on the firm side, to
comment on the resilience of regional labour markets.
High-skilled jobs dominate regional employment, as the share of middle-skilled jobs
shrinks
A diversified skills base in the regional labour force can help to enhance the quality and resilience
of regional labour markets. Skills diversity not only supports adaptability to changing economic
conditions but also fosters innovation and productivity growth (Aghion and Howitt, 2008[43]; Acemoglu and
Autor, 2011[44]). Effective skills development programmes, including vocational training and lifelong
learning initiatives, play a pivotal role in equipping workers with the necessary competencies to thrive in
evolving industries (European Commission, 2020[45]; Winthrop, Mcgivney and Fellow, 2016[46]). This is in
addition to investments in high-quality education and training, which can enhance workforce flexibility and
reduce vulnerability to economic shocks, thereby bolstering regional resilience (Heckman and Kautz,
2012[47]; World Bank Group, 2019[48]). Lastly, policies that promote skills matching, such as job placement
services and apprenticeship programmes, facilitate smoother transitions for workers and contribute to
overall labour market efficiency (European Commission, 2020[49]; Autor, 2014[50]; OECD, 2018[51]). By
prioritising a diverse skills agenda, regions can better withstand disruptions and position themselves for
sustained economic growth in an increasingly competitive global landscape.
Occupations that require a high level of skills account for the largest proportion of jobs in OECD
regions. In more than half (55%) of OECD regions, most workers are employed in high-skilled jobs,
followed by three in eleven (27%) regions where most workers are in medium-skilled jobs (Figure 1.17).
This highlights a trend towards more advanced, professional, and technical occupations in the overall
distribution of jobs within OECD regions. Yet, this distribution varies significantly across countries, and in
some cases within countries, likely reflecting differences in education systems, labour market policies, and
economic structures. Within-country differences tend to be driven by the capital-city region, where high-
skilled jobs dominate. This is the case in Colombia, Greece, Korea, Mexico, and Portugal, where only the
capital-city region has the high-skilled as the most common occupational skill level. In 5 out of 28 OECD
countries with available data, there is at least one region where each of the skill levels dominates, reflecting
significant within-country differences in the skill levels demanded by the labour market.

38
JOB CREATION AND LOCAL ECONOMIC DEVELOPMENT 2024 © OECD 2024
Figure 1.17. High-skilled jobs represent the highest share across OECD regions
Note: The figure shows the most common job skill level and its share for OECD regions in 2023 or latest available year. For European Union
countries, the data refers to 2022 and for Korea, to 2021. Job skill is defined using ISCO occupational categories. Low-skilled corresponds to
jobs in sales and services and un-skilled occupations (ISCO 5 and 9), medium-skilled workers hold jobs as clerks, craft workers, plant and
machine operators and assemblers (ISCO 4, 7 and 8), and high-skilled workers are those who have jobs in managerial, professional, technical
and associated professional occupations (ISCO 1, 2 and 3). The definition of skill is based on the educational level thought to be required of an
occupation and does not consider skills not related to educational level. The sample is all TL-2 regions with available data.
Source: OECD calculations based on national labour force surveys for the European Union (including the OECD accession countries of Bulgaria,
Croatia and Romania), Canada, Chile, Colombia, Costa Rica, Korea, Mexico, the United States and the United Kingdom.
Over the past decade, the share of middle-skilled jobs contracted in OECD regions, as the share of
high-skilled jobs increased. In four in five (80%) OECD regions with available data, the share of middle-
skilled jobs fell over 2013 to 2023, falling significantly by over five percentage points in almost two in eleven
(22%) regions (Figure 1.18). To a large extent, increasing demand for high-skilled jobs compensated for
the falling share of middle-skilled jobs. The share of high-skilled jobs grew in three-fourths (75%) of regions
where the share of middle-skilled jobs fell. In contrast, in a majority (63%) of OECD regions, the share of
low-skilled jobs changed by less than three percentage points. In one in eleven (11%) regions, the share
of low-skilled jobs grew by over three percentage points and in tandem with the share of high-skilled jobs.
While in more than half (53%) of regions, low-skilled and middle-skilled jobs fell together, as high-skilled
jobs grew. Similar to the skill distribution across countries, this trend indicates a shift towards more
managerial, professional, technical, and associated professional occupations at the cost of a decline in
clerks, craft workers, plant and machine operators and assemblers. This may reflect a shifting skills
demand, driven by changes in technology, automation, and the global economic landscape. In contrast,
there is a consistent demand for low-skilled jobs in sales, services and unskilled occupations, despite these
advancements in technology and economic shifts.

39
JOB CREATION AND LOCAL ECONOMIC DEVELOPMENT 2024 © OECD 2024
Figure 1.18. High-skilled jobs are replacing middle-skilled job
Correlation between the ten-year change in the regional skill distribution, 2013 to 2023 or closest available years
Note: The figure shows the ten-year change in the share of high-skilled jobs on the x-axis and the ten-year change in the share of medium-
skilled jobs on the y-axis. The colour of the point refers to the ten-year change in the share of low-skilled jobs. The ten-year period is 2013 to
2023, or closest available years. The time period refers to 2013 to 2022 for European Union countries, to 2015 to 2023 for the United Kingdom;
and 2013 to 2021 for Korea. The dotted line represents the correlation line, and the grey shaded area represents the 95% confidence intervals
between the two measures. The estimate of the correlation is listed on the top right of each graph with standard error in paratheses. Each dot
represents a TL-2 region. Outliers, defined as regions with values in the top or bottom 5% of the distribution, are not included. Job skill is defined
using ISCO occupational categories. Low-skilled corresponds to jobs in sales and services and un-skilled occupations (ISCO 5 and 9), medium-
skilled workers hold jobs as clerks, craft workers, plant and machine operators and assemblers (ISCO 4, 7 and 8), and high-skilled workers are
those who have jobs in managerial, professional, technical and associated professional occupations (ISCO 1, 2 and 3). The definition of skill is
based on the educational level thought to be required of an occupation and does not consider skills not related to educational level. The sample
is all TL-2 regions in OECD countries with available data.
Source: OECD calculations based on national labour force surveys for the European Union, Canada, Chile, Colombia, Costa Rica, Korea,
Mexico, the United States and the United Kingdom.
Regional disparities in over- and under-skilling highlight challenges in labour market
alignment
Skills mismatches, defined as discrepancies between the skills of workers and those demanded
by employers, pose challenges for aligning labour market needs with available talent.4 These
mismatches can result in underemploymentwhere individuals work in jobs that do not fully utilise their
skills, in in workers underqualified for the jobs they are employed in, or in job vacancies that remain
unfilled due to a lack of qualified candidates. This friction can influence the economic performance of
regions, weighing on growth and the capacity to respond to market changes effectively. As regions strive
to enhance their economic resilience, understanding and addressing skill mismatches becomes
increasingly important.

40
JOB CREATION AND LOCAL ECONOMIC DEVELOPMENT 2024 © OECD 2024
Skill mismatches are prevalent across OECD regions with almost one in three employed individuals
working in jobs that do not match their skill level, regardless of whether they are over- or under-
qualified (Figure 1.19). Countries such as Czechia, Lithuania, and Slovakia exhibit relatively low regional
median skill mismatches, around 16.5% to 23%. Conversely, the top four OECD countries experiencing
the greatest degree of mismatch, are Korea (41.8%), Costa Rica (41.1%), Colombia (40.5%), and the
United Kingdom (40%). Low mismatch suggests effective alignment in most regions, given equally low
regional dispersion of around 7.5 to 9 percentage points difference between the region with the highest
and lowest mismatch. Conversely, 10 out of the 33 OECD countries with available data indicate large
regional dispersion with a difference of over ten percentage points. The largest dispersions are present in
high mismatch countries, such as Korea, Mexico and Colombia, where the difference is over 30 percentage
points, 20 percentage points and over 15 percentage points, respectively. The difference between the
region with the highest and lowest mismatch is also large in the United States (21 percentage points),
despite having a lower-than-average regional mismatch.
Figure 1.19. On average, more than 9 percentage points (a third of the OECD regional median)
separate the region with the highest and lowest share of mismatched jobs within OECD countries
Note: The figure shows the regional dispersion (highest, lowest and median value) in the share of workers in mismatched jobs in 2023 or the
latest available year. For European Union countries, the data refers to 2022, and for Korea, to 2021. Skill mismatch is calculated following the
methodology of the Skills for Jobs Indicators of the OECD's Directorate for Employment, Labour and Social Affairs, whereby a worker is in a
mismatched job when their educational skill level does not match the most common skill level of workers in that occupational group in that
country. The sample is all TL-2 regions with available data.
Source: OECD calculations based on national labour force surveys for the European Union (including the OECD accession countries of Bulgaria,
Croatia and Romania), Canada, Chile, Colombia, Costa Rica, Korea, Mexico, the United States and the United Kingdom.
Capital-city regions, ageing regions and regions with a higher share of green jobs saw the share
of mismatched workers fall over the past ten years (Figure 1.20). Ageing regions, or regions where the
old-age dependency ratio increased over the past five years, are correlated with a 3.2 percentage point
Carinthia-Styria Burgenland-Lower Austria-Vienna
Brussels Region Wallonia
South West North East
Quebec Saskatchewan
Zurich Ticino
Antofagasta Maule
Bogotá District La Guajira
Central Brunca
Moravia-Silesia Prague
Saxony Bremen
Copenhagen Region South
Estonia Estonia
Attica S. Aegean
Madrid Cantabria
West Ĺland
Auvergne-Rhône-Alpes Corsica
City of Zagreb Adriatic Croatia
W. Transdanubia North
Eastern and Midland Northern and Western
Iceland Iceland
Apulia Friuli-Venezia Giulia
Seoul Region Jeju
Vilnius Centre and West
Luxembourg Luxembourg
Latvia Latvia
Chiapas Sinaloa
Netherlands Netherlands
Oslo and Viken North
Lesser Poland Warmian-Masuria
North Algarve
West South East
Upper Norrland Smĺland with I.
East West
Central Bratislava
Greater London E. Midlands
D. of Columbia Nevada
Romania
Croatia
Bulgaria
Korea
Costa Rica
Colombia
United Kingdom
Iceland
Italy
Spain
Netherlands
Austria
Mexico
Norway
Switzerland
Greece
Portugal
Germany
Denmark
Ireland
Canada
France
United States
Sweden
Chile
Estonia
Belgium
Finland
Latvia
Slovenia
Luxembourg
Hungary
Poland
Slovak Republic
Lithuania
Czechia
20 40 60
Share of skill mismatch (%)
aaa
Minimum Regional median Maximum

41
JOB CREATION AND LOCAL ECONOMIC DEVELOPMENT 2024 © OECD 2024
decrease in the share of mismatch. This is likely driven by both the exit of older workers with less education
and an overall demand shift toward a more educated labour force. Job mismatch also fell by 1.4 percentage
points in capital-city regions, and marginally by 0.2 percentage points in regions with a higher share of
green jobs, compared to regions in the same country. The share of mismatched workers is lower in capital-
city regions, compared to other regions in the same country (Annex Figure 1.B.6). In contrast, other
demographic (such as an ageing population), or economic (such as the sectoral employment composition)
characteristic is not correlated with within-country differences in the share of mismatch.
Figure 1.20. Over the past ten years, the share of mismatch fell in capital-city regions, ageing
regions and regions with a high relative share of green jobs
Within-country correlation of the ten-year change in the share of mismatch (pp) to selected characteristics, 2023 or
latest available year
Note: ***p-value<0.01, **p-value<0.05, *p-value<0.1. The graph shows the coefficient and 90% confidence intervals of separate multivariate
regressions of the ten-year change in the share of job mismatch from 2013 to 2023 (or closest available years) on a dummy for capital-city
regions, ageing regions (defined as those that experienced an increase in the elder-dependency rate over the past five years), for an above
national median employment share in green jobs in 2021, in tradeable services (ISIC broad sectors G to N), tradeable goods (ISIC sectors B,
D, E) or neither tradeable goods nor services. The coefficient (`within-country correlation') presents the within-county percentage point difference
in the share of mismatch based on the characteristic on the x-axis. Skill mismatch is calculated following the methodology of the Skills for Jobs
Indicators of the OECD's Directorate for Employment, Labour and Social Affairs, whereby a worker is in a mismatched job when their educational
skill level does not match the most common educational skill level of workers in that occupational group in that country. Each regression also
controls for the log of population in 2023 or latest available year and country fixed effects. For European Union countries, the data refers to 2013
to 2022, for Korea, to 2013 to 2021, and for the United Kingdom, to 2015 to 2023. The level of observation is the TL-2 region. The sample of
countries includes all OECD countries. Robust standard errors are clustered at the country level.
Source: OECD elaboration based on the OECD Regional databases.
Regions with a higher prevalence of over-skilled workers generally exhibit lower levels of under-
skilling (Figure 1.21). The mean difference between the share of underqualified and overqualified workers
is around nine percentage points across OECD regions. The top five regions with the greatest difference
are all in Canada, with over 30% of over-skilled workers and 1.5% to 2.3% of under-skilled workers. In
contrast, the regions with the smallest differences between the share of over-skilled and under-skilled
workers are in three different countries (Italy, Poland, Spain and the United States), with a difference of
under 0.3 percentage points. Regions with a high share of either over- or under-skilled workers may be
experiencing a high- or low-skill equilibrium, whereby the skills demand of jobs adapts to match the skills
*** *** **
-4
-2
0
Capital-city regions Ageing regions Sh(green jobs) Tradeable services Tradeable goods Non tradeables
Within-country correlation

42
JOB CREATION AND LOCAL ECONOMIC DEVELOPMENT 2024 © OECD 2024
supply of the population. This can be a particular issue in a low-skill equilibrium when employers adopt a
price-based competition strategy that relies on low-skilled and standardised production (OECD, 2014[52]).
Jeju region (Korea) stands out with a high share of both under- and over-skilled workers at over 30% each,
likely due to its economy specialised in agriculture, fishing and tourism, which differs from the rest of Korea,
which is more industrialised. As such, workers in the same occupation in Jeju likely require different skills
than their counterparts in the rest of Korea. The regional economic structure, industrial composition and
educational system are likely to all contribute to this distinct distribution of skill mismatches.
Figure 1.21. Regions specialise in a type of skill mismatch: those with more over-skilled workers
tend to have fewer under-skilled workers
Note: The figure shows the share of over- and under-skilled workers for each OECD TL-2 region in 2023 or the latest available year. For
European Union countries, the data refers to 2022, and for Korea, to 2021. Skill mismatch is calculated following the methodology of the Skills
for Jobs Indicators of the OECD's Directorate for Employment, Labour and Social Affairs, whereby a worker is in a mismatched job when their
educational skill level does not match the most common educational skill level of workers in that occupational group in that country. `Over-skilled'
means that the worker has an educational skill level above the most common educational skill level of their occupation. `Under-skilled' means
that the worker has an educational skill level below the most common educational skill level of their occupation.
Source: OECD calculations based on national labour force surveys for the OECD countries in the European Union, Canada, Chile, Colombia,
Costa Rica, Korea, Mexico, the United States and the United Kingdom.
Spatial variation in the incidence of over- and under-skill across regions highlights distinct
patterns in how educational qualifications align with labour market demands. There exist
opportunities in some countries to leverage complementarities between types of skill mismatch. For
example, Illinois (United States) has 18% of under-skilled workers, while its neighbouring regions, such as
Indiana and Wisconsin, have 16% of over-skilled workers (Figure 1.22). Overall, for half of OECD regions
with available data, there exists a region in the same country with a complementary type of mismatch. In
contrast, in 10 out of the 33 OECD countries with available data, all regions display the same type of
mismatch, whether it is over-skilling or under-skilling. In these countries, skill mismatch is likely driven by
national trends. Vocational education and training systems (VET) can be leveraged to bridge skill gaps by
providing skills training in alignment with industry needs. At the same time, these systems should be flexible
with recognised credentials, to respond to evolving skills needs and labour market transitions such as in
Germany, Austria and Switzerland (OECD, 2023[53]).
40 20 020
Share of skill mismatch (%)
Region
Over-skilled Under-skilled

43
JOB CREATION AND LOCAL ECONOMIC DEVELOPMENT 2024 © OECD 2024
Figure 1.22. Within-country complementarity in the type of mismatch exists for half of OECD
regions
Note: -
-For European Union countries, the data refers to 2022, and for Korea, to 2021. Skill
mismatch is calculated following the methodology of the Skills for Jobs Indicators of the OECD's Directorate for Employment, Labour and Social
Affairs, whereby a worker is in a mismatched job when their educational skill level does not match the most common skill level of workers in that
occupational group in that country. The sample is all TL-2 regions with available data.
Source: OECD calculations based on national labour force surveys for the European Union (including the OECD accession countries of Bulgaria,
Croatia and Romania), Canada, Chile, Colombia, Costa Rica, Korea, Mexico, the United States and the United Kingdom.
Across regions, self-employment is higher where more traditional jobs are lacking
Non-traditional forms of employment, such as self-employment, as well as part-time and temporary
work, play an important role in today's labour markets, reflecting broader shifts in work
arrangements across OECD countries. Self-employment, defined by individuals owning and operating
their businesses, provides independence and can encourage labour market engagement among those
desiring more control over their work, exploring entrepreneurial ventures, or adapting to unique personal
circumstances. Part-time employment, characterised by fewer working hours per week than full-time jobs,
provides flexibility and can facilitate increased labour market participation among students, caregivers, and
older adults. Similarly, temporary work, including fixed-term contracts and seasonal employment, offers
both employers and employees greater adaptability in response to fluctuating economic conditions and
personal circumstances. Take-up of the latter two forms of non-traditional forms of work is mainly driven
by structural national policies, implying few regional dimensions. See Annex Figure 1.B.8 to Annex
Figure 1.B.11 in Annex 1.B for more information about the regional take-up of part-time and temporary
work.
Non-traditional work arrangements also present challenges, such as lower job security, reduced
career progression opportunities, and often limited access to benefits compared to permanent,
full-time roles (OECD, 2018[54]; OECD, 2019[55]). In particular, self-employment can raise specific

44
JOB CREATION AND LOCAL ECONOMIC DEVELOPMENT 2024 © OECD 2024
challenges, such as income instability, difficulty in accessing credit and financing, and the burden of
managing administrative tasks and regulatory compliance (OECD, 2019[55]; OECD/European Union,
2017[56]). Rather than a deliberate choice for greater work autonomy, workers may engage in self-employed
work due to a lack of other options. In addition, it tends to be under-represented among women, youth, the
elderly, immigrants, and the unemployed (OECD/European Commission, 2023[57]).5 Consequently,
understanding the dynamics in the take-up of non-traditional employment allows for the development of
comprehensive policies that promote equitable work conditions and protection for all workers, regardless
of their employment status.
Median within-country regional dispersion in self-employment rates stands at over 6 percentage
points (Figure 1.23). Yet, this difference between the regions with the most and least self-employed
ranges from about 0.5 percentage points in Austria to over 21 percentage points in Greece. Countries with
a high overall share of self-employed tend to also have high regional dispersion. For example, in Greece,
Italy and Poland, the median share of self-employed across all regions is over 18%, with regional
dispersion at over eight percentage points. France is an exception, as the overall share of self-employed
resembles the OECD average, yet it has high regional dispersion at over 17 percentage points. In contrast,
regional self-employment rates are limited in Austria, Norway and Denmark, where the difference between
the region with the highest and lowest share of the self-employed is under two percentage points. Regions,
where the tourism and agriculture sectors dominate, such as in Peloponnese (Greece), Podlaskie (Poland),
Corsica (France), and Molise (Italy), tend to have the highest self-employment rates.
Figure 1.23. There is considerable within-country range of over 5 percentage points between the
region with the highest rate of self-employed vs. the lowest for almost half of OECD countries
Note: The figure shows the regional dispersion (highest, lowest and median value) in the share of self-employed among all working-age
employed persons in 2022. The working-age population is defined as 15-64 year olds. The sample is all TL-2 regions with available data.
Source: OECD calculations based on national labour force surveys for the European Union (including the OECD accession countries of Bulgaria,
Croatia and Romania).
U. Austria-Salzburg-Tyrol-Vorarlberg Burgenland-L. Austria-Vienna
Wallonia Brussels Region
North Central South Central
Lake Geneva Ticino
Moravia-Silesia Prague
Bremen Berlin
Central Jutland Zealand
Estonia Estonia
Attica Peloponnese
Madrid Galicia
Ĺland East and North
Hauts-de-France Corsica
Northern Croatia Adriatic Croatia
N. Great Plain Budapest
Eastern and Midland Northern and Western
Iceland Iceland
Friuli-Venezia Giulia Molise
Vilnius Centre and West
Luxembourg Luxembourg
Latvia Latvia
Netherlands Netherlands
Western Norway Innlandet
Silesia Podlaskie
Lisbon Metropolitan Algarve
Bucharest - Ilfov North East
Upper Norrland Smĺland with I.
East West
West Central
Romania
Croatia
Bulgaria
Greece
Italy
Poland
Spain
Netherlands
Belgium
Slovak Republic
Czechia
Portugal
Switzerland
Ireland
France
Finland
Iceland
Slovenia
Lithuania
Hungary
Austria
Estonia
Latvia
Sweden
Luxembourg
Germany
Denmark
Norway
010 20 30 40
Share of self-employed (%)
aaa
Minimum Regional median Maximum

45
JOB CREATION AND LOCAL ECONOMIC DEVELOPMENT 2024 © OECD 2024
Regional disparities in the rates of self-employment between regions with the highest and lowest
rates increased by three percentage points following the COVID-19 shock (Figure 1.24). In 2013, high
self-employment regions had rates of self-employment almost 47% higher than regions with low-self-
employment, in the same country. By 2022, this ratio rose to almost 50% higher. The difference between
the top and bottom quintile of regions, based on self-employment rates, increased from about 33% of the
national median to almost 35%. The increase is mostly driven by falling self-employment rates in regions
in the bottom quintile of self-employment, relative to the national median.
Figure 1.24. Increase in post-pandemic within-country disparities between the regions with the
highest and least share of the self-employed
Evolution of the self-employment rate relative to the national median, 2013 to 2022
Note: The figure shows the evolution of the share of self-employed among the employed in the working age population (15-64 year-olds), relative
to the national median (which corresponds to 100 on the top graph), for the top and bottom 20% of regions which account for at least 20% of
the population. The sample is all TL-2 regions in OECD countries with at least five regions and with data available over the entire period.
Source: OECD calculations based on national labour force surveys for the OECD countries in the European Union.
Self-employment is marginally most prevalent in regions facing higher unemployment rates
(Figure 1.25). In regions with unemployment rates below the national median, about 17% of workers are
self-employed at the start of the period. For regions facing unemployment rates above the national median,
the self-employed represented almost 18% of workers. The difference in the share of self-employed
between higher and lower unemployment regions, in the same country, remained relatively stable at about
0.5 percentage points, up until 2020. In 2021, the trend briefly reversed so that regions with unemployment
rates below the national median had marginally higher rates of self-employment. By 2022, the difference
in the share of self-employed for regions above and below the national median narrowed to about
0.1 percentage points. This may be linked to overall falling unemployment rates, especially in high-
unemployment regions (Annex Figure 1.B.7). High unemployment rates suggest that jobs are scarce so
more traditional types of work are difficult to find. Thus, rather than solely representing a voluntary shift to
a more autonomous working environment, self-employment take-up is also likely a recourse from a difficult
labour market situation.
Difference(Top 20% - Bottom 20%)
2013 2014 2015 2016 2017 2018 2019 2020 2021 2022
2013 2014 2015 2016 2017 2018 2019 2020 2021 2022
80
100
120
140
33.0
33.5
34.0
34.5
Relative share of self-employed
Top 20% Bottom 20% Ratio(Top 20% to Bottom 20%)

46
JOB CREATION AND LOCAL ECONOMIC DEVELOPMENT 2024 © OECD 2024
Figure 1.25. Take-up of self-employment is greatest in regions facing higher unemployment rates,
although the difference is narrowing
Evolution of the self-employment rate given initial unemployment rate, 2013 to 2022
Note: The figure shows the evolution of the share of self-employed among the employed in the working-age population for the regions above
and below the national-specific median of unemployment rates in 2013. The unemployment rate is defined as the share of persons looking for
work as a percentage of the labour force (employed or looking for work) in the working-age population (15-64 year-olds). The sample is all
regions in OECD countries with data available over the entire time period.
Source: OECD calculations based on national labour force surveys for the OECD countries in the European Union.
Sectoral diversity and mass layoffs: The role of firms in regional resilience
The adap
withstand economic shocks and capitalise on new opportunities for innovation, job creation and
productivity gains. As regions navigate the challenges posed by globalisation, technological
advancements, and changing market demands, the strength and diversity of local businesses and sectors
become instrumental in promoting sustainable development and long-term economic stability. Therefore,
a deep understanding of the firm and sectoral structure of regions is essential for policymakers to design
informed and effective strategies that enhance regional resilience.
The composition of sectoral employment represents an important feature of regional economies
with implications for economic diversity and resilience. Regions dominated by a limited number of
industries often face increased vulnerability to economic fluctuations and external shocks, such as
technological changes or global market shifts, even if regions concentrated in trade-exposed sectors tend
to be relatively more resistant (OECD, 2018[19]). Conversely, regions with a diversified employment base
tend to exhibit greater economic stability and adaptability (Audretsch and Feldman, 1996[58]; Giannakis,
Bruggeman and Mamuneas, 2024[59]; Delgado, Porter and Stern, 2014[60]). This sectoral diversification
also influences labour market dynamics, affecting everything from wage levels to employment
opportunities and workforce skills development (Autor, Katz and Kearney, 2008[61]; Boeri et al., 2019[62];
Greenstone, Hornbeck and Moretti, 2010[63]). It is important to understand these dynamics to mitigate the
risk associated with economic specialisation.
In over two-thirds of OECD regions, the sectoral composition of employment shows moderately-
low or low diversification (Figure 1.26). Diversification is measured using the Herfindahl-Hirschman
Index (HHI) (See Box 1.3 for details). This is driven mainly by a high share of regions with moderately-low
Difference (Above - Below country median)
2013 2014 2015 2016 2017 2018 2019 2020 2021 2022
2013 2014 2015 2016 2017 2018 2019 2020 2021 2022
16.0
16.5
17.0
17.5
18.0
-0.3
0.0
0.3
0.6
Share of self-employed (%)
Initial unemployment rate in 2013:
Above country median Below country median

47
JOB CREATION AND LOCAL ECONOMIC DEVELOPMENT 2024 © OECD 2024
diversified labour markets: only 13% of OECD regions with available data (57 out of 419 regions) display
a low sectoral diversification of employment (mean HHI index of 2 822), while in ten regions, sectoral
employment diversification is especially low (over 3 000). While the region with the highest index score
(and lowest diversification) is Nunavut in Canada (likely due to its remoteness and low population density),
other top regions include three regions in Czechia, two in Mexico and Türkiye, and one in Romania and
Greece. Then, 142 out of 419 regions (34%) are in moderately-high diversified labour markets. In contrast,
no regions fall into the category of high diversification, likely due to the low total number of available
sectors. The five regions with the highest diversification are Luxembourg, Central (Costa Rica), Prague
(Czechia), Warsaw (Poland), and Tel Aviv (Israel) (HHI ranging from 1 615 to 1
Box 1.3. Defining sectoral diversification
The Herfindahl-Hirschman Index (HHI) is a standard measure of market concentration, usually used
to consider firm power in a certain product market, sector or economy (Antitrust Division, 2024[64]).
new hires, or employment within a market (OECD, 2022[7]). To consider sectoral diversification, this
chapter takes the share of workers employed in each sector in a subnational region.
The measure is thus defined as the sum of the squared percentage shares of each sector in the
economy. In this way, the index accounts for the relative size distribution of firms in the regional
economy. Given data availability, sectors are classified into ten broad categories: "Agriculture, Forestry
& Fishing", "Industry", "Manufacturing", "Construction", "Trade, Repair, Transport, Accommodation",
"Information and communication", "Financial and insurance activities", "Real estate activities",
"Professional, scientific and technical activities; administrative and support service activities", "Public
admin., Defence, Edu., Health, Social", and "Arts, Entertainment, Recreation". It ranges from 1 000
when a labour market is occupied by an equal share of employment in each of the ten sectors, and a
maximum of 10 000 if all employment is concentrated in one sector.
Given the high level of aggregation of the sectors considered, the measure presented in this
chapter should not be taken to be an indicator of the concentration of a regional labour market.
Instead, the purpose is to give a sense of the sectoral diversity of the distribution of employment and to
comment on sub-regional differences.
Conventionally, a market is considered concentrated (or less diverse) if it has an HHI of 2 500
or above, a threshold usually considered conservative (Nocke and Whinston, 2022[65]; Affeldt et al.,
2021[66]). A moderately concentrated (or moderately less diverse) market is between 1 500 and 2 500,
which can be further broken down into moderately-low (HHI of 1 500 to 2 000), moderately-high (HHI
of 2 000 to 2 500) and a low concentrated market is an HHI below 1 500 (US Department of Justice
and Federal Trade Commission, 2010[67]).
Recent work found pervasive labour market concentration in OECD countries using harmonised
data on job postings: 16% of business-sector workers in 15 OECD countries are in national labour
markets that are at least moderately concentrated and 10% in highly concentrated markets. Exploiting
harmonised linked employer-employee databases, it also finds evidence of monopsony power, i.e. firm
discretion in setting wages and working conditions in contrast to competitive markets where firms must
concentrated labour markets experience a wage penalty of at least 5% compared to a worker in a
median-concentrated market. Job quality is also affected, as evident in the increased use of flexible and
temporary contracts, as well as higher skill requirements (OECD, 2022[7]). Reintroducing competition

48
JOB CREATION AND LOCAL ECONOMIC DEVELOPMENT 2024 © OECD 2024
Figure 1.26. Employment is moderately diversified in a few sectors across OECD regions
Note: The map shows the regional distribution of the degree of diversification of employment in 2023 or the last available year. The data refers
to 2022 for Belgium, Colombia, Czechia, Denmark, Estonia, France, Hungary, Luxembourg, Malta, Mexico, Slovenia and Spain; to 2021 for
Austria, Bulgaria, Croatia, Finland, Germany, Greece, Ireland, Italy, Japan, Latvia, Lithuania, the Netherlands, Poland, Portugal, Romania,
Slovak Republic, Sweden, Switzerland, and the United Kingdom; to 2020 for the United States; and to 2014 for Iceland. The colour represents
the value of the employment diversification index, measured through the Herfindahl-Hirschman Index, which is the sum of the squared shares
of employment of ten broad industries: "Agriculture, Forestry & Fishing", "Industry", "Manufacturing", "Construction", "Trade, Repair, Transport,
Accommodation", "Information and communication", "Financial and insurance activities", "Real estate activities", "Professional, scientific and
technical activities; administrative and support service activities", "Public admin., Defence, Edu., Health, Social", and "Arts, Entertainment,
Recreation". High diversification is values below 1 500, moderate-high diversification is values between 1 500 and 2 000, moderate-low
diversification is values between 2 000 and 2 500, and values above 2 500 represent a low degree of diversification. The thresholds are adapted
from the definition of concentration by the U.S. Department of Justice and Federal Trade Commission (US Department of Justice and Federal
Trade Commission, 2010[67]). The sample is all TL-2 regions (including the OECD accession countries of Bulgaria, Croatia and Romania) with
available data.
Source: OECD calculations based on the OECD Regional databases.
into labour markets requires policies that increase the relative bargaining power of workers and promote
fair wage-setting mechanisms in the face of power imbalances, towards the goal of improved labour
market efficiency.

49
JOB CREATION AND LOCAL ECONOMIC DEVELOPMENT 2024 © OECD 2024
Industry is the dominant sector (i.e. the sector with the highest employment share) in the least
diversified labour markets, leading in 24 regions. “Trade, Repair, Transport and Accommodation”,
“Public services” and “Agriculture” are the dominant sector in 12, 13, and 8 regions, respectively. Industry
is the most common sector due to the complementary between the “Industry” sector and
the “Manufacturing” sector. In almost 92% (22 out of 24) of regions with low diversification driven by the
“Industry” sector, “Manufacturing” represents the second highest sectoral share of employment. The
findings highlight interdependencies between these sectors which drive economic specialisation of the
region, but also potentially limiting the scope for further diversification.
Figure 1.27. A majority of workers are employed by up to three sectors across OECD regions
Note: The figure shows the share of regions in each country that belong to each category which represents the number of sectors that
cumulatively represent a majority (50% or higher) of employment in that region for the year 2023 or the latest available year. The data refers to
2022 for Belgium, Colombia, Czechia, Denmark, Estonia, France, Hungary, Luxembourg, Malta, Mexico, Slovenia and Spain; to 2021 for Austria,
Bulgaria, Croatia, Finland, Germany, Greece, Ireland, Italy, Japan, Latvia, Lithuania, the Netherlands, Poland, Portugal, Romania, Slovak
Republic, Sweden, Switzerland, and the United Kingdom; to 2020 for the United States; and to 2014 for Iceland. The sectors considered are ten
broad groups based on NACE-REV2 categories: "Agriculture, Forestry & Fishing", "Industry", "Manufacturing", "Construction", "Trade, Repair,
Transport, Accommodation", "Information and communication", "Financial and insurance activities", "Real estate activities", "Professional,
scientific and technical activities; administrative and support service activities", "Public admin., Defence, Edu., Health, Social", and "Arts,
Entertainment, Recreation". The sample is all TL-2 regions (including the OECD accession countries of Bulgaria, Croatia and Romania) with
available data.
Source: OECD calculations based on the OECD Regional databases.
Two sectors or fewer are responsible for employing at least half of all workers in the region in
almost two-thirds of OECD regions with available data (Figure 1.27). In three OECD regions, one
industry accounts for more than half of employment, indicating a high level of specialisation in that sector.
In contrast, a majority of employment is spread across three sectors in all regions of Estonia, Latvia,
Lithuania, Luxembourg, and Switzerland. This is the case for only two sectors in all regions of Australia,
Denmark, Iceland, Japan, the United Kingdom and the United States. Thus, in many OECD regions, few
industries account for the majority of employment, highlighting the limited degree of economic
diversification across OECD regions.
0
25
50
75
100
Estonia
Latvia
Lithuania
Luxembourg
Switzerland
Poland
Portugal
New Zealand
Slovak Republic
Korea
Italy
Germany
Costa Rica
Hungary
Slovenia
Finland
Belgium
Ireland
Spain
Chile
Türkiye
Colombia
Austria
Israel
Netherlands
France
Czechia
Mexico
Sweden
Canada
Australia
Denmark
Iceland
Japan
Norway
United Kingdom
United States
Greece
Bulgaria
Croatia
Romania
Share of regions (%)
Number of sectors comprising a majority of employment: 1 2 3

50
JOB CREATION AND LOCAL ECONOMIC DEVELOPMENT 2024 © OECD 2024
Industry-specific downturns can contribute to mass layoffs, which can destabilise regional
economies given the relative size of the shock. Mass layoffs are defined as the separation of a
significant number of employees from a single establishment over a short period. These events often occur
for many reasons, for example, in response to economic downturns, industry restructuring, or technological
advancements (Silva et al., 2019[68]; Chhinzer, 2023[69]). The occurrence of mass layoffs can significantly
disrupt regional labour markets, leading to sudden increases in unemployment, persistent wage losses,
reductions in consumer spending, and broader economic downturns within affected regions (Vermeulen
and Braakmann, 2023[70]; Foote, Grosz and Stevens, 2018[71]; Cederlöf, 2021[72]; Flaaen, Shapiro and
Sorkin, 2017[73]; Arquié and Grjebine, 2024[74]). For example, job losses are recorded not only in the directly
affected establishments but also in nearby businesses and regions, indicating sizeable spillover effects on
regional economies (Gathmann, Helm and Schönberg, 2018[75]). Thus, while the direct consequences are
often severe, leading to substantial job losses, the indirect effects can also profoundly alter the economic
stability of the affected regions. This is particularly true for regional labour markets as these events affect
a larger proportion of workers than at the national level.
Mass layoffs are prevalent among OECD regions although there is considerable range in their
occurrence over the past decade. Figure 1.28 presents the spatial variation in the instance of mass
layoffs over the past ten years in European regions.6 In almost one-tenth (9%) of OECD regions in the
European Union with available data, no mass layoffs are reported, while in the same proportion of regions,
over 50 mass layoff events occurred. Five regions experienced one hundred or more of these events, with
the most mass layoffs occurring in North Rhine-Westphalia (Germany) with over 130 events. Despite this,
the majority of regions with available data experienced a modest number of mass layoffs in the past ten
years: two in five (41%) regions had less than 10 mass layoff events, and almost three in five (60%), had
less than 15 mass layoffs. There is a noted spatial dimension to the occurrence of mass layoff events
linked to the bias in the data towards medium and large firms, especially in the manufacturing sector. Mass
layoffs are notably most prevalent in current or historical industrial and manufacturing hubs, such as central
Germany, northern United Kingdom, eastern France, and others. Lastly, apart from a brief increase during
the COVID-19 pandemic, the frequency of mass layoffs has remained relatively constant over the past
decade.

51
JOB CREATION AND LOCAL ECONOMIC DEVELOPMENT 2024 © OECD 2024
Figure 1.28. Large disparities in the instance of mass layoffs across regions
Note: The map presents the number of mass layoffs that occurred in the region over the past 10 years. A mass layoff is defined as the announced
destruction of (1) at least 100 jobs or (2) affects at least 10% of the workforce at sites (i.e. workplaces) employing more than 250 people. This
means that the lower bound of job loss for a mass layoff event is at least 25 workers. The information on mass layoffs comes from a database
of large restructuring events reported in the principal national media and company websites, collected by Eurofound. Importantly, this database
is not representative of mass layoff events as the size requirement leads to a bias towards medium and large firms, especially in the
manufacturing sector. The sample is TL-2 regions in OECD countries with available data.
Source: OECD calculations based on the European Restructuring Monitor (Eurofound, 2024[76]).
Conclusion
This chapter provides an analysis of the current state and evolution as well as the resilience of
regional labour markets in the aftermath of major shocks, reflecting on the recovery process and
the capacity of regions to handle significant transitions. It assesses recovery from the COVID-19
pandemic, implications for employment and productivity, and explores various indicators that highlight the
adaptability of regional labour markets to leverage the full potential of both workers and firms.
While employment rates across OECD regions have reached record highs, the decade-long view
reveals persistent regional disparities in employment and participation rates. However, the recovery
has come at the cost of labour market exclusion for specific groups, such as young workers, who have
experienced widening age disparities. This trend will likely aggravate the current context of tight labour
markets where firms report difficulty in recruitment. Chapter 2 examines the issue of labour market
shortages by zooming in on the places, sectors and occupations facing greater difficulties in finding
workers. Identifying these trends allows for the design of well-informed policy to address the bottleneck
caused by labour market shortages and its impact on employment and local development.
52
JOB CREATION AND LOCAL ECONOMIC DEVELOPMENT 2024 © OECD 2024
Labour productivity growth has been lagging in many OECD regions, with little progress in closing
the gap between the top and bottom performers. Notably, in half of OECD regions, labour productivity
growth over the past decade was below 0.8% per year, indicating that gains in labour market outcomes
have not necessarily been accompanied by proportional productivity increases. Population ageing
contributes to declines in per capita income and limits productivity growth, but it may also incentivise the
adoption of labour-enhancing or labour-saving technologies like AI, depending on its efficiency in job-
specific tasks (Nedelkoska and Quintini, 2018[5]; André, Gal and Schief, 2024[77]). Chapter 3, through new
estimates on occupational exposure to AI, discusses the double-edged sword of the integration of AI in the
workforce. In order for AI to support rather than undermine productivity growth, policymakers may want to
consider the pace and nature of AI adoption, the ability of workers to adapt, and the need for transitional
support policies.
A flexible and diversified skills base in the regional labour force contributes to the increased quality
and resilience of regional labour markets. However, skill mismatches are prevalent across OECD
regions, and non-traditional forms of employment, such as self-employment, play an important role in
today's labour markets. Furthermore, in over two-thirds of OECD regions, labour markets exhibit
moderately low or low employment diversification. Amid accelerating green, digital, and demographic
transitions, policy measures that contribute to building resilience through labour markets that encourage
flexibility and integrate regional labour market demands to establish realistic career pathways across
different regions are needed.
In conclusion, the diversity of regional experiences across OECD countries highlights both
achievements and ongoing challenges. Valuable lessons can be drawn from these experiences,
including the importance of enhancing the quality and diversity of the regional labour force, effectively
managing sectoral employment diversification and potential vulnerabilities like mass layoffs, leveraging
technological advancements, such as artificial intelligence, to address lagging productivity growth, and
prioritising skills and job development. In light of past trends and in anticipation of future challenges, it is
essential to adopt proactive place-based strategies that foster more inclusive and resilient labour markets
in the future.

53
JOB CREATION AND LOCAL ECONOMIC DEVELOPMENT 2024 © OECD 2024
References
Abiad, A., D. Furceri and P. Topalova (2015), The Macroeconomic Effects of Public Investment:
Evidence from Advanced Economies.
[18]
Acemoglu, D. and D.
Handbook of Labor Economics, Elsevier, https://doi.org/10.1016/s0169-
7218(11)02410-5.
[44]
Affeldt, P. et al. (2021), Market Concentration in Europe: Evidence from Antitrust Markets,
http://www.RePEc.org.
[66]
Aghion, P. and P. Howitt (2008), The Economics of Growth, The MIT Press.
[43]
Ahmad, N., J. Ribarsky and M.
economy explain the post-, OECD Statistics
Working Papers, No. 2017/9, OECD Publishing, Paris, https://doi.org/10.1787/a8e751b7-en.
[35]
Alon, T. et al. (2020), The Impact of COVID-19 on Gender Equality.
[15]
André, C., P. Gal and M.
society: , OECD Economics Department Working
Papers, No. 1807, OECD Publishing, Paris, https://doi.org/10.1787/605b0787-en.
[77]
Antitrust Division, U. (2024), Herfindahl-Hirschman Index, https://www.justice.gov/atr/herfindahl-
hirschman-index (accessed on 4 July 2024).
[64]
Arquié, A. and T. Grjebine (2024), Are Mass Layoffs Individually Costly But Socially Beneficial?*,
http://www.cepii.fr.
[74]
Audretsch, D. and M.
Source: The American Economic Review, Vol. 86/3, pp. 630-640.
[58]
Autor,
Science, Vol. 344/6186, pp. 843-851, https://doi.org/10.1126/science.1251868.
[50]
Autor, D., L. Katz and M.
Review of Economics and Statistics, Vol. 90/2, pp. 300-323,
https://doi.org/10.1162/rest.90.2.300.
[61]
Autor, D. and A. Salomons (2018), Is Automation Labor-Displacing? Productivity Growth,
Employment, and the Labor Share, National Bureau of Economic Research, Cambridge, MA,
https://doi.org/10.3386/w24871.
[37]
Berlingieri, G., P. Blanchenay and C. , OECD
Science, Technology and Industry Policy Papers, No. 39, OECD Publishing, Paris,
https://doi.org/10.1787/953f3853-en.
[38]
Bloom, N. et American Economic Review,
Vol. 110/4, pp. 1104-1144, https://doi.org/10.1257/aer.20180338.
[29]

54
JOB CREATION AND LOCAL ECONOMIC DEVELOPMENT 2024 © OECD 2024
Boeri, T. et al. (2019), Wage Equalization and Regional Misallocation: Evidence from Italian and
German Provinces, National Bureau of Economic Research, Cambridge, MA,
https://doi.org/10.3386/w25612.
[62]
Calligaris, S. et -19: The role of job
retenti, OECD Economics Department Working Papers, No. 1788, OECD
Publishing, Paris, https://doi.org/10.1787/33388537-en.
[8]
Cederlöf,
SSRN Electronic Journal, https://doi.org/10.2139/ssrn.3905994.
[72]
Chhinzer, level job decline or
growth impacts firmlevel layoff implementation, Human Resource Management Journal,
https://doi.org/10.1111/1748-8583.12543.
[69]
Daniele, F., T. Honiden and A.
regions: , OECD
Regional Development Working Papers, No. 2019/08, OECD Publishing, Paris,
https://doi.org/10.1787/9dcb3116-en.
[33]
Delgado, M., M. Porter and S.
Research Policy, Vol. 43/10, pp. 1785-1799,
https://doi.org/10.1016/j.respol.2014.05.007.
[60]
Djankov, S. et al. (2021), The evolving gender gap in labor force participation during COVID-19,
Peterson Institute for International Economics.
[13]
Employment and Social Development Canada (2024), Supporting Mothers with $10-a-day child
care, Government of Canada.
[80]
Eurofound (2024), European Restructuring Monitor (ERM).
[76]
European Commission (2020), Skills Agenda for Europe: Working together for Europe’s recovery
and resilience.
[45]
European Commission (2020), The reinforced Youth Guarantee.
[78]
future Education, training and life-https://doi.org/10.2767/811982.
[49]
European Commission (2019), WISE – Giving women in Donegal, Ireland, the skills and
confidence to return to the labour market.
[82]
Filippucci, F. et
growth: , OECD Artificial Intelligence
Papers, No. 15, OECD Publishing, Paris, https://doi.org/10.1787/8d900037-en.
[24]
Flaaen, A., M. Shapiro and I. Sorkin (2017), Reconsidering the Consequences of Worker
Displacements: Firm versus Worker Perspective, National Bureau of Economic Research,
Cambridge, MA, https://doi.org/10.3386/w24077.
[73]
Foote, A., M. Grosz and A.
ILR Review, Vol. 72/1, pp. 101-126,
https://doi.org/10.1177/0019793917753095.
[71]

55
JOB CREATION AND LOCAL ECONOMIC DEVELOPMENT 2024 © OECD 2024
Gathmann, C., I. Helm and U. Journal of
the European Economic Association, Vol. 18/1, pp. 427-468,
https://doi.org/10.1093/jeea/jvy045.
[75]
Giannakis, E., A. Bruggeman and T. al economic resilience,
Papers in Regional Science,
Vol. 103/2, p. 100010, https://doi.org/10.1016/j.pirs.2024.100010.
[59]
Goldin, I. et Journal of Economic Literature,
Vol. 62/1, pp. 196-268, https://doi.org/10.1257/jel.20221543.
[31]
Gordon, R. (2017), The Rise and Fall of American Growth, Princeton University Press,
https://doi.org/10.2307/j.ctvc77bwm.
[30]
Greenstone, M., R. Hornbeck and E.
Journal of Political Economy,
Vol. 118/3, pp. 536-598, https://doi.org/10.1086/653714.
[63]
Heckman, J. and T. Labour Economics, Vol. 19/4,
pp. 451-464, https://doi.org/10.1016/j.labeco.2012.05.014.
[47]
Kapsos, S. (2021), Why would labour productivity surge during a pandemic?, International
Labour Organisation.
[40]
Landivar, L. et -19 Is Exacerbating Gender
Socius: Sociological Research for a Dynamic World, Vol. 6,
p. 237802312094799, https://doi.org/10.1177/2378023120947997.
[87]
Maestas, N., K. Mullen and D.
American Economic Journal: Macroeconomics,
Vol. 15/2, pp. 306-332, https://doi.org/10.1257/mac.20190196.
[32]
Martin, R. and P.
Journal of Economic Geography, Vol. 15/1, pp. 1-42,
https://doi.org/10.1093/jeg/lbu015.
[41]
Nedelkoska, L. and G. , OECD Social,
Employment and Migration Working Papers, No. 202, OECD Publishing, Paris,
https://doi.org/10.1787/2e2f4eea-en.
[5]
Nicoletti, G. and S. Scarpetta (2003), Regulation, Productivity and Growth: OECD Evidence, The
World Bank, https://doi.org/10.1596/1813-9450-2944.
[26]
Nocke, V. and M.
American Economic Review, Vol. 112/6, pp. 1915-1948,
https://doi.org/10.1257/aer.20201038.
[65]
OECD (2024), Mobilising the Elderly for Economic and Community Development: The Leaf
Business in Kamikatsu, Japan.
[83]
OECD (2024), OECD Compendium of Productivity Indicators 2024, OECD Publishing, Paris,
https://doi.org/10.1787/b96cd88a-en.
[28]

56
JOB CREATION AND LOCAL ECONOMIC DEVELOPMENT 2024 © OECD 2024
OECD (2024), OECD Digital Economy Outlook 2024 (Volume 1): Embracing the Technology
Frontier, OECD Publishing, Paris, https://doi.org/10.1787/a1689dc5-en.
[22]
OECD (2024), OECD employment and labour force participation rates stable at record highs in
the second quarter of 2024.
[1]
OECD (2024), OECD Employment Outlook 2024: The Net-Zero Transition and the Labour
Market, OECD Publishing, Paris, https://doi.org/10.1787/ac8b3538-en.
[4]
OECD (2024), Part-time employment rate (indicator), https://doi.org/10.1787/f2ad596c-en
(accessed on 26 July 2024).
[86]
OECD (2023), Building Future-Ready Vocational Education and Training Systems, OECD
Reviews of Vocational Education and Training, OECD Publishing, Paris,
https://doi.org/10.1787/28551a79-en.
[53]
OECD (2023), Economic Policy Reforms 2023: Going for Growth, OECD Publishing, Paris,
https://doi.org/10.1787/9953de23-en.
[23]
OECD (2023), Job Creation and Local Economic Development 2023: Bridging the Great Green
Divide, OECD Publishing, Paris, https://doi.org/10.1787/21db61c1-en.
[6]
OECD (2023), OECD Employment Outlook 2023: Artificial Intelligence and the Labour Market,
OECD Publishing, Paris, https://doi.org/10.1787/08785bba-en.
[2]
OECD (2023), OECD Regional Outlook 2023: The Longstanding Geography of Inequalities,
OECD Publishing, Paris, https://doi.org/10.1787/92cd40a0-en.
[3]
OECD (2023), Retraining Jobseekers, OECD Publishing.
[79]
-proofing adult learning systems in cities and regions: A policy manual for
, OECD Local Economic and Employment Development (LEED) Papers,
No. 2022/03, OECD Publishing, Paris, https://doi.org/10.1787/11fa26cc-en.
[81]
ropean manufacturing to gas supply conditions?: A regional
, OECD Policy Responses on the Impacts of the War in Ukraine, OECD Publishing,
Paris, https://doi.org/10.1787/01278ba3-en.
[9]
OECD (2022), OECD Employment Outlook 2022: Building Back More Inclusive Labour Markets,
OECD Publishing, Paris, https://doi.org/10.1787/1bb305a6-en.
[7]
, OECD
Local Economic and Employment Development (LEED) Papers, No. 2022/08, OECD
Publishing, Paris, https://doi.org/10.1787/b7dae4e9-en.
[10]
-
, OECD Policy Responses to Coronavirus (COVID-19), OECD Publishing, Paris,
https://doi.org/10.1787/3555d164-en.
[14]
OECD (2021), OECD Employment Outlook 2021: Navigating the COVID-19 Crisis and
Recovery, OECD Publishing, Paris, https://doi.org/10.1787/5a700c4b-en.
[88]
Strengthening the Governance of
Skills Systems: Lessons from Six OECD Countries, OECD Publishing, Paris,
https://doi.org/10.1787/cd2b486a-en.
[84]

57
JOB CREATION AND LOCAL ECONOMIC DEVELOPMENT 2024 © OECD 2024
OECD (2020), Job retention schemes during the COVID-19 lockdown and beyond, OECD
Publishing, https://doi.org/10.1787/0853ba1d-en.
[12]
OECD (2020), OECD Employment Outlook 2020: Worker Security and the COVID-19 Crisis,
OECD Publishing, Paris, https://doi.org/10.1787/1686c758-en.
[11]
OECD (2019), Education at a Glance 2019: OECD Indicators, OECD Publishing, Paris,
https://doi.org/10.1787/f8d7880d-en.
[25]
OECD (2019), OECD Employment Outlook 2019: The Future of Work, OECD Publishing, Paris,
https://doi.org/10.1787/9ee00155-en.
[55]
productivity: what implications for public
OECD Publishing, Paris, https://doi.org/10.1787/eco_outlook-v2018-2-3-en.
[39]
OECD (2018), Productivity and Jobs in a Globalised World: (How) Can All Regions Benefit?,
OECD Regional Development Studies, OECD Publishing, Paris,
https://doi.org/10.1787/9789264293137-en.
[19]
OECD (2018), Seven Questions about Apprenticeships: Answers from International Experience,
OECD Reviews of Vocational Education and Training, OECD Publishing, Paris,
https://doi.org/10.1787/9789264306486-en.
[51]
OECD (2018), The Future of Social Protection: What Works for Non-standard Workers?, OECD
Publishing, Paris, https://doi.org/10.1787/9789264306943-en.
[54]
OECD (2014), Job Creation and Local Economic Development, OECD Publishing, Paris,
https://doi.org/10.1787/9789264215009-en.
[52]
OECD/European Commission (2023), The Missing Entrepreneurs 2023: Policies for Inclusive
Entrepreneurship and Self-Employment, OECD Publishing, Paris,
https://doi.org/10.1787/230efc78-en.
[57]
OECD/European Union (2017), The Missing Entrepreneurs 2017: Policies for Inclusive
Entrepreneurship, OECD Publishing, Paris, https://doi.org/10.1787/9789264283602-en.
[56]
Rubens, American Economic
Review, Vol. 113/9, pp. 2382-2410, https://doi.org/10.1257/aer.20210383.
[27]
Schwab, K. and S. Zahidi (2020), The Global Competitiveness Report Special Edition 2020,
World Economic Forum.
[20]
Schwandt, H. and T. -Term Effects of
Entering the Labor Market in a Recession in Large Cross-Journal of
Labor Economics, Vol. 37/S1, pp. S161-S198, https://doi.org/10.1086/701046.
[17]
Schwellnus, C., A. Kappeler and P.
productivity: Macro-, OECD Economics Department Working Papers, No. 1373,
OECD Publishing, Paris, https://doi.org/10.1787/d4764493-en.
[36]
Silva, F. et -, OECD
Science, Technology and Industry Policy Papers, No. 72, OECD Publishing, Paris,
https://doi.org/10.1787/90b572f3-en.
[68]

58
JOB CREATION AND LOCAL ECONOMIC DEVELOPMENT 2024 © OECD 2024
Syverson, Journal of Economic Literature, Vol. 49/2,
pp. 326-365, https://doi.org/10.1257/jel.49.2.326.
[21]
Tomlinson, M. and G.
Labour and Industry,
Vol. 33/3, pp. 308-325, https://doi.org/10.1080/10301763.2023.2251216.
[16]
UNESCO (2023), Republic of Korea: Lifelong Education Act 2009.
[85]
US Department of Justice and Federal Trade Commission (2010), Horizontal Merger Guidelines.
[67]
Vermeulen, W. and N. -offs affect ,
OECD Local Economic and Employment Development (LEED) Papers, No. 2023/01, OECD
Publishing, Paris, https://doi.org/10.1787/99d48aeb-en.
[70]
Vermeulen, , OECD Local Economic and
Employment Development (LEED) Papers, No. 2022/09, OECD Publishing, Paris,
https://doi.org/10.1787/872d431b-en.
[42]
Winthrop, R., E. Mcgivney and S. Fellow (2016), Skills for a Changing World: Advancing Quality
Learning for Vibrant Societies.
[46]
World Bank Group (2021), World Development Report 2021: Data for Better Lives, World Bank,
Washington D.C.
[34]
World Bank Group (2019), World Development Report 2019: The Changing Nature of Work,
World Bank, Washington D.C.
[48]
Notes
1 For more data on NEET rates, see Annex Figure 1.B.3 and Annex Figure 1.B.4.
2 This is despite the worries that the gendered impact of lockdowns, as described above, contributed to an
-
market participation at the onset of the crisis (Landivar et al., 2020[87]).
3 Labour productivity can also be defined as output (real gross domestic product (GDP)) per hour worked.
This would account for the overall trend of falling working hours across OECD countries, although there
are some exceptions, for example, in Turkey, Mexico and Colombia. Over the past two decades, the
average annual hours worked per worker decreased, due to changes in work patterns, increased part-time
work and shifts towards service industries (OECD, 2021[88]). Nonetheless, the same general pattern of
sluggish labour productivity growth is observed also with this definition (OECD, 2024[28]).
4 Measuring skill mismatches poses several challenges as it requires quantifying both the skills of workers
and the demands of their jobs, neither of which are observable. Thus, to quantify skill mismatch, this
their level of education, using the ISCED classification. The
skill demands of the job are calculated as the most common skill level of workers in that occupation-

59
JOB CREATION AND LOCAL ECONOMIC DEVELOPMENT 2024 © OECD 2024
country-year. Skill mismatch is thus present when the skill level of an individual worker does not match the
skill level of their occupation. Over-(under-
educational level and occupation of workers, both of which are readily available in most labour force
surveys. Furthermore, by defining the occupational skill level relative to the country and year, the approach
takes into account cross-country differences and changing skill demands of an occupation.
5 Note that it is not possible to look at the demographics of self-employment take-up, i.e. the share of
women, male, youth, elderly, immigrants, natives, etc. engaged in self-employment due to issues of small
sample sizes in labour force surveys. The Chapter focuses only on overall rates of self-employment among
the employed.
6 The information on mass layoffs comes from a database on large restructuring events reported in the
principal national media and company websites, collected by Eurofound. It provides information on the
instance of mass layoffs, defined as the announced destruction of at least 100 jobs or that affects at least
10% of the workforce at sites employing more than 250 people. Importantly, this database is not
representative of mass layoff events as the size requirement leads to a bias towards medium and large
firms, especially in the manufacturing sector. Nonetheless, it is a useful resource to get an overall idea of
their instance across OECD regions.

60
JOB CREATION AND LOCAL ECONOMIC DEVELOPMENT 2024 © OECD 2024
Annex 1.A. Additional background on policy
Annex Box 1.A.1. Examples: policies for inclusive labour market participation
Youth
• The EU Youth Guarantee was reinforced by member states in 2020 by committing that people
under 30 receive quality employment, continued education, or a traineeship within four months
of becoming unemployed or leaving education (European Commission, 2020[78]). Since its
establishment in 2013, the European Union improved and expanded employment services for
youth such as continued education, traineeship or connecting them with employment
opportunities, resulting in a record-low drop in youth unemployment of 14.9% in 2020 and 1.7
million fewer youth in neither employment, education or training (NEETs) (European
Commission, 2020[78]). The reinforced programme has a broader target group of 15-to 29-year-
olds at risk of unemployment or unable to enter the labour market and offers individualised
approaches; providing youth with the appropriate guidance and helping them find courses or
boot camps for upskilling (European Commission, 2020[78]).
• The Municipality of Rotterdam, in the Netherlands gave training vouchers to residents facing
economic and labour market challenges due to the pandemic. The vouchers paid for courses
and training in professional areas in high demand, to adjust to the changes produced by the
pandemic. The programme was successful in improving the labour market and continued
beyond the pandemic as an active and integral part of the youth labour market activation. The
municipality will expand the programme to over 20 000 vouchers by 2024 (OECD, 2023[79]).
Women
• Canada promoted a CAD 10-a-day child care framework, which was implemented through
bilateral agreements with provinces and territories. The objective is to get more women into the
labour force. Since this investment in the federal budget of 2021 and the culmination of the
regional agreement negotiation, labour force participation among working age mothers with
young children is at a record high of 79.7% (Employment and Social Development Canada,
2024[80]). The government is now making more progress by increasing inclusive access to child
care, with funding focused on underserved communities (Employment and Social Development
Canada, 2024[80]).
• Donegal, in Ireland implemented the Project
(WISE), which provides services to support women entering and re-entering the labour market.
Over 70% of women in WISE have found a job and sustained employment in the long-term
(OECD, 2022[81]). WISE worked by assigning participants to a personal advisor who supports
training in writing CVs, improving interview skills, and understanding employment contracts. In
addition, it matched women with local employer opportunities and assisted with access to public
funding for training and childcare (European Commission, 2019[82]).
Elderly
• In Kamikatsu, Japan, more than half of the 1 415 population is 65 and older. The waning
agriculture industry resulted in economic decline and depopulation. In response, the public-
private Irodori Corporation brought together local farmers and the town government to sell

61
JOB CREATION AND LOCAL ECONOMIC DEVELOPMENT 2024 © OECD 2024
tsumamono, a leaf used in Japanese gastronomy. Almost 200 farmers are aged 70 on average,
90% being women (OECD, 2024[83]). The programme impacted well-being as the region has
the lowest per capita costs of medical care in the prefecture, despite having a large proportion
of older individuals (OECD, 2024[83]).
• Suwon, in South Korea, established nearly 600 lifelong learning centres to help residents
improve career prospects and participate in adult learning (OECD, 2020[84]). The initiative aims
to support disadvantaged groups, such as the elderly, by increasing access to learning spaces.
The city also offers subsidies for citizen-developed learning programmes, involves NGOs in
running lifelong learning initiatives, and supports the certification of lifelong learning teachers
(OECD, 2020[84]). This certification requires mandatory training and has been introduced by the
Government of Korea, for people who want to become lifelong learning teachers (UNESCO,
2023[85]). This bottom-up approach to adult learning helps the elderly to actively engage in
society, offering opportunities to continue learning and contributing (OECD, 2020[84]).

62
JOB CREATION AND LOCAL ECONOMIC DEVELOPMENT 2024 © OECD 2024
Annex 1.B. Additional results
Annex Figure 1.B.1. Employment did not increase faster over the past ten years depending on
demographics or employment structure
Within-country correlation of ten-year employment change (pp) to selected characteristics, 2013 to 2023 or closest
available years
Note: ***p-value<0.01, **p-value<0.05, *p-value<0.1. The graph shows the coefficient and 90% confidence intervals of separate multivariate
regressions of the ten-year change in employment rates (2013 to 2023) on a dummy for capital-city regions, ageing regions (defined as those
that experienced an increase in the elder-dependency rate over the past five years), for an above national median employment share in green
jobs in 2021, in tradeable services (ISIC broad sectors G to N), tradeable goods (ISIC sectors B, D, E) or neither tradeable goods nor services.
Each regression also controls for the log of population in 2023, or latest available year, and country fixed effects. The level of observation is the
TL-2 regions. The sample of countries includes all OECD countries. Robust standard errors are clustered at the country level.
Source: OECD elaboration based on the OECD Region and Cities databases.
-2
-1
0
1
2
3
Capital-city regions Ageing regions Sh(green jobs) Tradeable services Tradeable goods Non tradeables
Within-country correlation

63
JOB CREATION AND LOCAL ECONOMIC DEVELOPMENT 2024 © OECD 2024
Annex Figure 1.B.2. COVID-19 exacerbated regional inequalities along age, but not gender
Average participation rate of OECD regions by gender and age and their differences, 2013 to 2023
Note: The figure shows the mean participation rate for OECD regions in the years 2013 to 2023, by demographic group. The mean participation
rate for men and women is presented in the first panel, for workers aged 15 to 24 and workers aged 25 to 64 in the second panel, and the
difference in the participation rate between men and women and older and younger workers in the bottom panel.
Source: OECD calculations based on the OECD Regional databases.
Annex Figure 1.B.3. Half of countries show significant regional dispersion in youth inactivity rates
Note: The figure shows the regional dispersion (highest, lowest and median value) in the NEET rate (not in employment, education or training)
for the youth working-age population (15-24 year-olds) in 2023 or latest available year. The last year refers to 2022 for Australia, Belgium,
Colombia, Israel, Japan, Mexico, Slovak Republic (except for Bratislava where the data refers to 2017), Spain, Switzerland, the United Kingdom
and the United States; to 2021 for Sweden; to 2019 for Bulgaria, Croatia, Denmark, France, Luxembourg, Malta, the Netherlands (except for
Zealand where the data refers to 2016), and Romania; to 2017 for Chile; and to 2016 for Norway. The sample is all TL-2 regions in countries
with available data, including the OECD accession countries of Bulgaria, Croatia and Romania.
Source: OECD calculations based on the OECD Regional databases.
Difference
Age
Gender
2013 2014 2015 2016 2017 2018 2019 2020 2021 2022 2023
65
70
75
80
50
60
70
80
15
20
25
30
Participation rate (%)
Male Female Y25T64
Y15T24 Diff: Male - Female Diff: Y25T64 - Y15T24
Salzburg Vienna
Canberra Region Queensland--N. Territory
Flemish Region Brussels Region
South West North West
Quebec Nunavut
Central Lake Geneva
Santiago Metrop. Coquimbo
Bogotá District Chocó
Central North Huetar
Central Jutland South
Crete Ionian I.
Navarra Andalusia
Brittany Hauts-de-France
Adriatic Croatia Adriatic Croatia
Budapest North
Northern and Western Eastern and Midland
Tel Aviv North
Marche Campania
Hokuriku Hokkaido--Chugoku
Luxembourg Luxembourg
Latvia Latvia
Mexico City Chiapas
Utrecht Limburg
Trřndelag Innlandet
Centro Algarve
North East Center
Upper Norrland South--N. Middle
West East
West East
Istanbul S.E. Anatolia Middle
S.W. England N.E. England
North Dakota Alaska
Romania
Croatia
Bulgaria
Türkiye
Colombia
Costa Rica
Greece
Israel
Chile
Mexico
Portugal
Canada
France
United Kingdom
Italy
Belgium
Spain
United States
Hungary
Australia
Slovak Republic
Latvia
Denmark
Ireland
Norway
Slovenia
Austria
Switzerland
Luxembourg
Sweden
Netherlands
Japan
020 40
Youth not in employment, education or training (NEET) rate (%)
aaa
Minimum Regional median Maximum

64
JOB CREATION AND LOCAL ECONOMIC DEVELOPMENT 2024 © OECD 2024
Annex Figure 1.B.4. Within-country differences between regions with the highest and lowest NEET
rates are growing
Evolution of the NEET rate relative to the national median, 2013 to 2023
Note: The figure shows the evolution of the NEET rate (not in employment, education or training) for the youth working-age population (15-24
year-olds), relative to the national median (which corresponds to 100 on the top graph), for the top and bottom 20% of regions which account
for at least 20% of the population in a country. The sample is all TL-2 regions in OECD countries with at least five regions and with data available
over the entire period
Source: OECD calculations based on the OECD Regional databases.
Annex Figure 1.B.5. Neither demographic nor economic structure is correlated with higher
productivity growth
Within-country correlation of ten-year annual labour productivity growth (pp) to selected characteristics, 2012 to
2022 or closest available years
Note: ***p-value<0.01, **p-value<0.05, *p-value<0.1. The graph shows the coefficient and 90% confidence intervals of separate multivariate
regressions of annual labour productivity growth in the latest available year on a dummy for capital-city regions (large regions that include the
capital city), regions with an above national median employment share in green jobs in 2021, in tradeable services (ISIC broad sectors G to N),
tradeable goods (ISIC sectors B, D, E) or neither tradeable goods nor services. The coefficient (`within-country correlation') presents the within-
country percentage point difference in productivity growth rates based on the characteristic on the x-axis. Each regression also controls for the
log of population in the latest available year, a dummy for the latest available year, and country fixed effects. The level of observation is the TL-
2 region. The sample of countries includes all OECD countries with available data, excluding Ireland. Robust standard errors are clustered at
the country level.
Source: OECD elaboration based on the OECD Region and Cities databases.
Difference(Top 20% - Bottom 20%)
2013 2014 2015 2016 2017 2018 2019 2020 2021 2022 2023
2013 2014 2015 2016 2017 2018 2019 2020 2021 2022 2023
100
150
200
55
60
65
70
Relative youth not in employment, education or training (NEET) rate (%)
Top 20% Bottom 20% Ratio(Top 20% to Bottom 20%)
-0.4
-0.2
0.0
0.2
0.4
Capital-city regions Sh(green jobs) Tradeable services Tradeable goods Non tradeables
Within-country correlation

65
JOB CREATION AND LOCAL ECONOMIC DEVELOPMENT 2024 © OECD 2024
Annex Figure 1.B.6. Mismatch is lower in capital-city regions
Within-country correlation of the share of mismatch to selected characteristics, 2023 or latest available year
Note: ***p-value<0.01, **p-value<0.05, *p-value<0.1. The graph shows the coefficient and 90% confidence intervals of separate multivariate
regressions of the share of job mismatch in 2023 (or latest available year) on a dummy for capital-city regions, ageing regions (defined as those
that experienced an increase in the elder-dependency rate over the past five years), for an above national median employment share in green
jobs in 2021, in tradeable services (ISIC broad sectors G to N), tradeable goods (ISIC sectors B, D, E) or neither tradeable goods nor services.
The coefficient (`within-country correlation') presents the within-county percentage point difference in the share of mismatch based on the
characteristic on the x-axis. Skill mismatch is calculated following the methodology of the Skills for Jobs Indicators of the OECD's Directorate
for Employment, Labour and Social Affairs, whereby a worker is in a mismatched job when their educational skill level does not match the most
common educational skill level of workers in that occupational group in that country. Each regression also controls for the log of population in
2023 or latest available year and country fixed effects. For European Union countries, the data refers to 2022, and for Korea, to 2021. The level
of observation is the TL-2 region. The sample of countries includes all OECD countries. Robust standard errors are clustered at the country
level.
Source: OECD elaboration based on the OECD Regional databases.
Annex Figure 1.B.7. Record-low unemployment rates, with convergence continuing past Covid-19
recovery
Note: The figure shows the evolution of the unemployment rate for the working-age population (15-64 year-olds) for the top and bottom 20% of
regions in a country, which account for at least 20% of the population. The sample is all TL-2 regions in OECD countries with at least five regions
and with data available over the entire period.
Source: OECD calculations based on the OECD Regional databases.
*
-5.0
-2.5
0.0
2.5
Capital-city regions Ageing regions Sh(green jobs) Tradeable services Tradeable goods Non tradeables
Within-country correlation
Difference(Top 20% - Bottom 20%)
2013 2014 2015 2016 2017 2018 2019 2020 2021 2022 2023
2013 2014 2015 2016 2017 2018 2019 2020 2021 2022 2023
4
6
8
10
3.0
3.5
4.0
4.5
Unemployment rate (%)
Top 20% Regional median Bottom 20%

66
JOB CREATION AND LOCAL ECONOMIC DEVELOPMENT 2024 © OECD 2024
Annex Figure 1.B.8. Across OECD regions, about 16% of workers are engaged in part-time work,
with little regional dispersion in most countries
Note: The figure shows the regional dispersion (highest, lowest and median value) in the part-time employment rate for employed individuals,
15-64 year-olds in 2023 or the latest available year. The data refers to 2022 for Finland and Iceland; and to 2021 for Romania. When the region
name is double-hyphenated, it signifies two regions with the same value. The sample is all TL-2 regions (including the OECD accession countries
of Bulgaria, Croatia and Romania) with available data.
Source: OECD calculations based on the OECD Regional databases.
On average across OECD regions, take-up of part-time work is higher than the OECD average,
representing around 16% of employment versus 14.7% for the OECD as a whole (Annex Figure 1.B.8)
(OECD, 2024[86]). Within-country variance is low. The mean difference between the region with the largest
vs. lowest take-up of part-time work stands at around 4 percentage points. The exceptions are Türkiye and
Australia, where this difference is around 17 and 12 percentage points, respectively. However, there is
large variance in the take-up of part-time work across OECD countries and regions. The regional median
region of the share of employment in part-time contracts varies widely from under 2% in Bulgaria, with the
lowest regional share in North East and South Central at around 1% of employment, to over 42% in the
Netherlands, with close to one in two workers engaged in part-time work in Groningen.
Yet, this aggregate picture conceals that women are almost 15 percentage points more likely to be
employed in part-time contracts than men across OECD countries (Annex Figure 1.B.9). The gender
difference in part-time work ranges from -0.55 percentage points in Romania to over 42 percentage points
in the Netherlands and Switzerland, largely driven by high overall take-up of part-time work among women
at over 60% in both countries. The ratio of women to men employed in part-time work is above two in all
but six out of the thirty-one OECD countries with available data, reaching over 4 women for each man in
Germany, Italy and Austria.
Burgenland Vienna
N. Territory Tasmania
Brussels Region Flemish Region
South West North West--South East
New Brunswick British Columbia
Ticino Espace Mittelland
Northwest Prague
Saxony-Anhalt Bremen
Zealand Central Jutland
Estonia Estonia
Ionian I. Thessaly
La Rioja Basque Country
Helsinki-Uusimaa West
Île-de-France Auvergne-Rhône-Alpes
Northern Croatia Adriatic Croatia
C. Transdanubia S. Great Plain
Eastern and Midland Southern
Other Regions Reykjavik Region
Piedmont--Basilicata Bolzano-Bozen
Vilnius Centre and West
Luxembourg Luxembourg
Latvia Latvia
Flevoland Groningen
Oslo and Viken Agder and Sřr-Řstlandet
Podlaskie Lublin
Alentejo Lisbon Metropolitan
Bucharest - Ilfov North East
Stockholm West
East West
Central Bratislava--West
S.E. Anatolia Middle N.E. Anatolia E.
Romania
Croatia
Bulgaria
Netherlands
Switzerland
Austria
Germany
Australia
Denmark
Norway
Iceland
Belgium
Ireland
Sweden
Luxembourg
Italy
Finland
France
Canada
Estonia
Spain
Türkiye
Slovenia
Greece
Portugal
Czechia
Latvia
Lithuania
Poland
Hungary
Slovak Republic
010 20 30 40 50
Share of part-time employment (%)
aaa
Minimum Regional median Maximum

67
JOB CREATION AND LOCAL ECONOMIC DEVELOPMENT 2024 © OECD 2024
Annex Figure 1.B.9. Stark gender divides in the take-up of part-time work
Note: The figure shows the gender distribution and difference in the regional median for each country for part-time employment rate for employed
individuals, 15-64 year-olds in 2023 or the latest available year. The data refers to 2022 for Finland and Iceland; and to 2021 for Romania. The
sample is all TL-2 regions (including the OECD accession countries of Bulgaria, Croatia and Romania) with available data.
Source: OECD calculations based on the OECD Regional databases.
The instance of temporary employment is slightly below part-time employment across OECD
regions: about 12% of employed individuals are employed through fixed-term contracts (Annex
Figure 1.B.10). Regional dispersion is also limited: the mean country difference between minimum and
maximum regions in a country stands at about 4.5 percentage points, once the three countries with the
greatest difference are excluded: Colombia (38.8 percentage points), Greece (21.2 percentage points) and
Chile (18.2 percentage points). La Guajira in Colombia leads in the use of temporary work contracts, with
over half of its workforce employed through these fixed-term arrangements. Following significantly behind
is Aysén in Chile, where the share of employment in fixed-term contracts stands at about 37%over 20
percentage points lower than La Guajira. In contrast, the lowest use of temporary contracts, less than 1%,
is in the Central region of Costa Rica. In Estonia, Costa Rica, Australia, Slovak Republic, and Hungary,
the take-up of temporary work is particularly low: less than 5% of workers are employed by these contracts.
-10
0
10
20
30
40
50
60
70
Australia
Austria
Belgium
Canada
Czechia
Denmark
Estonia
Finland
France
Germany
Greece
Hungary
Iceland
Ireland
Italy
Latvia
Lithuania
Luxembourg
Netherlands
Norway
Poland
Portugal
Slovak Republic
Slovenia
Spain
Sweden
Switzerland
Türkiye
Bulgaria
Croatia
Romania
Part-time work rate (%)
Female Male Diff: Female - Male

68
JOB CREATION AND LOCAL ECONOMIC DEVELOPMENT 2024 © OECD 2024
Annex Figure 1.B.10. Little regional dispersion in the incidence of temporary employment, apart
from in some Latin American countries
Note: The figure shows the regional dispersion (highest, lowest and median value) in the share of employment on fixed-term contracts (15-64
year-olds) in 2023 or the latest available year. The data refers to 2022 for Australia, Belgium, Colombia, Costa Rica, Czechia, Estonia, Germany,
Japan, Poland, Slovenia, Spain, Sweden, Switzerland, and the United Kingdom. The sample is all TL-2 regions with available data.
Source: OECD calculations based on the OECD Regional databases.
Regions with a high degree of take-up in part-time work do not necessarily also have more workers
employed in short-term contracts, pointing to substitutability between part-time and short-term
work. Annex Figure 1.B.11 plots the regional share of workers in part-time work contracts versus the
regional share of workers in temporary employment. The correlation of these two variables, accounting for
country-specificities, reveals a lack of relationship between the two. Furthermore, there are clear clusters
of regions in the same country, which indicates that structural national policies likely shape employment
practices in the take-up of different types of non-traditional work.
Lower Austria Tyrol
Queensland Canberra Region
Flemish Region Brussels Region
Manitoba Newfoundland Labrador
Central Lake Geneva
Santiago Metrop. Aysén
Bolívar La Guajira
Central Huetar Caribbean
Central Bohemia Moravia-Silesia
Brandenburg Bremen
Estonia Estonia
Central Greece S. Aegean
Madrid Extremadura
Budapest North
Jerusalem Central
Lombardy Calabria
Hokuriku Kansai
Oslo and Viken Innlandet
Greater Poland Lodzkie
North Algarve
West Upper Norrland
East West
Bratislava West
E. of England Wales
Colombia
Chile
Japan
Spain
Portugal
Italy
Greece
Sweden
Poland
Germany
Slovenia
Switzerland
Canada
Belgium
Austria
Norway
Israel
Czechia
United Kingdom
Hungary
Slovak Republic
Australia
Costa Rica
Estonia
020 40 60
Share of employment in fixed-term contracts (%)
aaa
Minimum Regional median Maximum

69
JOB CREATION AND LOCAL ECONOMIC DEVELOPMENT 2024 © OECD 2024
Annex Figure 1.B.11. There is little within-country variation in temporary and part-time
employment, reflecting that take-up is driven by structural national policies
Note: The figure shows the share of employment in fixed-term contracts on the x-axis and the share of employment in part-time work on the y-
axis in the year 2023 or latest available year for OECD regions with available data. For part-time work, the data refers to 2022 for Finland and
Iceland; and to 2021 for Romania. For the temporary work rate, the data refers to 2022 for Australia, Belgium, Colombia, Costa Rica, Czechia,
Estonia, Germany, Japan, Poland, Slovenia, Spain, Sweden, Switzerland, and the United Kingdom. The dotted line represents the correlation
line, and the grey shaded area is 95% confidence intervals between the two measures. Each dot represents a region.
Source: OECD calculations based on the OECD Regional databases.

70
JOB CREATION AND LOCAL ECONOMIC DEVELOPMENT 2024 © OECD 2024
Many OECD regions struggle with significant labour shortages that hold back
economic growth. This chapter presents new data and analysis on labour
market tightness across OECD regions. It examines some of the drivers of
labour shortages and explores which sectors and jobs face the greatest
labour shortages in different regions. It also considers the shortages for
green and Information and communication technologies (ICT) jobs, which
could hold back progress in the twin transition for many regions. Finally, this
chapter analyses how and where current population trends of demographic
change could intensify regional labour shortages.
2 Labour shortages across regional
labour markets

71
JOB CREATION AND LOCAL ECONOMIC DEVELOPMENT 2024 © OECD 2024
In Brief
Driven by record-high employment rates, population ageing, new skills
requirements, and changing worker preferences, most OECD regions are
struggling with labour and skills shortages.
Labour markets across OECD regions have more than bounced back from the COVID-19 pandemic.
Employment levels are record high in many countries. There are also increasing demands for new types
-
now face increasing difficulties in finding and hiring the right workers to fill vacancies. The resulting
labour and skills shortages are a potential drag on firm operations, productivity, and economic growth,
as well as producing flow-on consequences for the supply of critical public services.
• Regional labour shortages have risen substantially since 2019 and increasingly also
affect regions with previously low levels of labour shortages. Regional labour market
tightness, defined as vacancies per employed person, has increased substantially since 2019.
Data from the United States and Germany show that regional labour market tightness has
increased by 50% and 80%, respectively, between 2019 and 2022, affecting all types of regions.
• The severity of rising labour shortages differs a lot across regions. In the United States,
for example, tightness grew by 29% and 105% in the 10% of regions with the lowest and
the highest increases on average. While the growth in labour shortages seems to have slowed
in most OECD regions since 2021, shortages remain at a high level relative to pre-COVID-19
levels (e.g. 50% higher in the United States), highlighting that the drivers of labour shortages go
beyond the temporary post-COVID-19 recovery.
• Regional disparities in labour shortages are significant across the OECD. Within countries,
the tightest regional labour market reports on average five times higher labour market tightness
than the least tight region. Regions with a large population and high employment rates (relative
to the national average) experience 14% and 26% higher shortages relative to low-population
and low-employment places, respectively. Labour shortages are also more acute in regions that
rely more on tradable services or that have benefitted from the presence of high-growth
industries.
• In 95% of regions, labour shortages in ICT are higher than for other jobs, with on average
over twice as high labour market tightness. Similarly, labour shortages are more pronounced
for green jobs in 89% of regions. On average, labour shortages are between 40% (European
regions) and 15% (Australian regions) higher for green than non-green jobs. Greater shortages
in green and digital jobs partly reflect the transformation of regional economies in the twin
transition but could also indicate skills mismatches, as education and training systems have not
yet fully adapted to new labour market demand. Furthermore, regions with a 10% higher green
jobs tightness also show an 18% higher ICT job tightness, suggesting that the digital and green
transitions impact many places simultaneously.
• Population ageing risks exacerbating labour shortages to varying degrees across
regions. If current population trends continue, regional labour shortages could increase by
almost 9% by 2042, and almost twice as much (16%) in the oldest 20% of OECD regions.
Consequently, tightness is projected to increase from one vacancy for every 21 working age
persons to one vacancy for every 18 working age persons in the oldest 20% of regions.

72
JOB CREATION AND LOCAL ECONOMIC DEVELOPMENT 2024 © OECD 2024
Introduction
Labour shortages are a major challenge for firms and for economic development more broadly
across the OECD. More than half (54%) of all SMEs in the European Union report difficulties in finding
employees with the right skills the most commonly nominated among a range of business problems
(European Commission, 2023[1]). Although difficult to quantify, this lack of adequately skilled employees
represents a drag on firm operations, negatively impacting innovation, productivity and economic growth.
While labour shortages have somewhat attenuated since the post-COVID recovery (OECD, 2024[2]), a
substantial skills mismatch persists in the labour market (Chapter 1). Tensions are particularly significant
in occupations that are crucial for the green and digital transitions, representing bottlenecks on the path to
achieving net-zero emission goals. Regions will need to revisit policies and tools they have at their disposal,
including their skills training systems, support for the economically inactive, (im)migration policies, and
labour market intelligence to address these labour and skills shortages.
While labour shortages have eased after the marked increase due to COVID-19, national labour
markets remain tight (Figure 2.1). By the end of 2022, there were about 0.6 vacancies per unemployed
person on average for OECD countries with available data, down from its peak of 0.65 in 2021 but still
significantly above the pre-crisis average of 0.4. The United States stands out with the greatest labour
market tightness of about 1.8 vacancies per unemployed person, down from almost two vacancies per
unemployed person at its peak. Still, labour market tightness is 55% higher than before the COVID-19
crisis, indicating that labour shortages persist. The latest increase in labour market tightness is especially
pronounced in some countries. In Australia, for example, vacancies per unemployed persons tripled
compared to pre-crisis levels. For Luxembourg and Norway, that figure doubled.
• Policies designed to mitigate labour shortages need to reflect place-specific challenges,
which include retaining and attracting (young) talent to remote regions and facilitating
job transitions, taking into account the geographic distribution of jobs. Labour market
intelligence tools can inform the design of such place-based policies, which requires more
detailed employment data, for example at the geographic and occupational level.

73
JOB CREATION AND LOCAL ECONOMIC DEVELOPMENT 2024 © OECD 2024
Figure 2.1. Labour markets are tight in many countries, despite some signs of easing post-2020
Number of vacancies per unemployed person. National definitions, seasonally adjusted.
Note: This figure is taken from (OECD, 2023[3]). OECD is an unweighted average of the countries shown above. In Panel A, the definition of
vacancies is not harmonised across countries. See figure 1.7 in (OECD, 2023[3]) for details.
https://doi.org/10.1787/190bb5bc-en (accessed on 23 June 2023) for Australia, Austria, Germany, Hungary, Portugal, the United Kingdom, Job
vacancy statistics by NACE Rev.2 activity for Finland, Luxembourg, Latvia, Lithuania, the Netherlands, Norway, Poland, the Slovak Republic,
Slovenia and Swede
à Pôle emploi (Dares, France), Posti vacanti (Italian National Institute of Statistics), Job Openings and Labor Turnover Survey (U.S. Bureau of
Labor Statistics, retrieved from FRED); Online job posting on Indeed.
Labour shortages are widespread, and the main drivers are a combination of cyclical and structural
factors, with the latter being the larger driver in European countries. Cyclical factors reflect the reprise
of economic activity after downturns to which the supply of workers does not adjust quickly enough.
Structural factors arise from longstanding mismatches in terms of skills and preferences (e.g. working
conditions) between jobseekers and employers. The decline in the working-age population and an
insufficient supply of workers with highly specialist skills, such as STEM, are important contributing factors.
Furthermore, the ongoing green and digital transitions are placing additional pressure on shortages
(European Labour Authority, 2022[4]). This is in line with evidence that firms with higher skill requirements
and fast-growing innovative firms are more likely to experience labour shortages (Groiss and Sondermann,
2023[5]).
While labour shortages were mostly limited to high-skilled occupations over the past decades,
previous research found that they affect both high-skilled and lower-skilled, contact-intensive
occupations since the COVID-19 pandemic (Causa et al., 2022[6]). This is due in part to workers shifting
away from jobs with poor working conditions, such as low-paying and contact-intensive ones (Zwysen,
2023[7]). However, country-specific factors exist, as this shift is observed in the US and the UK but not in
Germany (OECD, 2024[2]). Another reason for shortages spreading to different types of occupations is the
relatively small pool of unemployed persons seeking employment (due to high employment rates) during
the post-COVID recovery. A strong labour market is likely to further aggravate shortages by encouraging
workers to quit their jobs as a tight labour market facilitates the job search (OECD, 2024[2]). Additionally,
labour hoarding, which occurs when companies retain workers without fully utilising their capacity,
contributed to the resilience of the European labour market despite weak economic growth throughout
2022 and 2023 (Gayer et al., 2024[8]). Yet, it can also aggravate labour shortages, by preventing workers
from moving to recruiting firms (Doornik, Igan and Kharroubi, 2023[9]).
74
JOB CREATION AND LOCAL ECONOMIC DEVELOPMENT 2024 © OECD 2024
This chapter aims to fill the knowledge gap on labour market tightness in regional labour markets,
as well as at the occupational and industry level. Country-level estimates mask regional differences
and effective policy measures depend on a local labour market perspective. Therefore, this chapter zooms
in on OECD regions and analyses the geography of labour market tightness. Additionally, it presents new
estimates on labour market tightness for different sectors and occupations, which helps to shed light on
which regional economies are driving labour shortages and therefore most in need of policy support. The
possible additional impact of ageing populations on labour shortages is also explored. The chapter
concludes with a discussion of potential policy levers to alleviate labour shortages, such as the increased
use of technology, increasing participation of hard-to-reach groups, labour market intelligence tools, skills
training, and (im)migration policies.
labour market tightness and, consequently, their interpretation. Measures of labour market tightness
implicitly assume that vacancies can only be filled by jobseekers within the same geographic unit, making
the geographic level of analysis an important methodological choice. Ideally, the geographic level would
coincide with functional labour markets, within which workers commute between their place of residence
and their workplace (i.e., no mobility between regions). However, due to data limitations, this chapter uses
the first administrative tier of subnational governance (i.e., TL2, corresponding to states in the United
States), whenever subnational employment data are available. While TL2 regions are relatively large such
that, in many cases, workers stay within the same TL2 region, labour markets can span multiple TL2
regions and multiple labour markets may exist in one TL2 region, resulting in an inaccurate picture of labour
market tightness. This caveat, particularly relevant for TL2 regions with high inter-region mobility, needs to
be kept in mind when interpreting regional tightness estimates. More detailed geographic employment data
would mitigate this shortcoming by enabling the analysis at the level of functional labour markets.
countries due to data limitations in online job postings data (Box 2.3 and Box 2.4). Online job
postings provide detailed and timely data on labour demand. However, there exist differences across
countries in terms of their overall coverage, as well as the representation of specific industries, occupations
and regions (Box 2.4). Therefore, this chapter presents tightness measures relative to the country average
for aggregate regional estimates, and relative to the regional average for occupational (or industry)
breakdowns.
Disparities in labour market tightness across regions remain large despite
widespread increases in recent years
In the vast majority of OECD countries, regions face substantially different degrees of labour
shortages. Based on the relative labour market tightness indicator (see Box 2.3 for methodology), the
tightest region is on average more than five times tighter than the least tight region within a country
(Figure 2.2). The country with the greatest regional dispersion is Italy, where the greatest relative tightness
observed in the Bolzano-Bozen Province is over four times the national average and the region with the
lowest tightness is less than one-seventh of the national average. Norway also displays high dispersion:
Western Norway (the tightest region) shows tightness of almost four times the national average, while the
lowest tightness is evident in Oslo and Viken at 0.07 times the national average. These regions with high
relative tightness potentially reflect low unemployment rates as in Bolzano-Bozen Province (2.3% in 2022)
or the concentrated nature of each regional economy: offshore oil in Western Norway and tourism in the
Ionian Islands. The lowest regional dispersion is found in Finland.

75
JOB CREATION AND LOCAL ECONOMIC DEVELOPMENT 2024 © OECD 2024
Figure 2.2. Labour markets are tight across OECD regions, with large dispersion in over half of
countries
Regional labour market tightness relative to national average, 2022.
Note: Relative labour market tightness at the regional level is the number of vacancies over unemployment for a given region, divided by the
national labour market tightness average. The horizontal axis shows the average relative labour market tightness across regions. Regions with
a population below 10 000 are dropped. The sample includes all OECD countries with available data, including the OECD accession countries
of Bulgaria, Croatia and Romania.
Source: OECD elaboration based on OECD regional database for unemployment data, and Lightcast data for vacancies.
Labour shortages are often concentrated in specific communities that drive a high labour market
tightness in OECD countries. In 10 out of 26 countries, the median of regional relative labour market
tightness is below the national average, which is normalised to one. In these countries, most regions
display low tightness and so, there are few regions with high labour market tightness within the country. In
addition, capital regions do not stand out in terms of tightness: they are the tightest region only in five out
of the 26 countries with data. This may partly be because in some countries urban regions are, surprisingly,
underrepresented in online job vacancy data (Box 2.4).
To estimate labour market tightness at a detailed occupational and industry level, the remainder of
this chapter measures tightness as the ratio of online job vacancies to employment, rather than
unemployment. The reason for this is that most countries do not provide information on the unemployed
on-level tightness estimates using
the standard tightness measure. Nevertheless, Box 2.1 shows that both labour market tightness measures,
namely the one using the standard unemployment--based
definition, align well across regions.
Burgenland-L. Austria-Vienna U. Austria-Salzburg-Tyrol-Vorarlberg
South Australia N. Territory
Brussels Region Flemish Region
North West South West
Ticino Central
Northwest Prague
Hesse Hamburg
Zealand Central Jutland
W. Macedonia Ionian I.
Andalusia Basque Country
South West
Île-de-France Corsica
Pannonian Croatia Adriatic Croatia
N. Great Plain Budapest
Southern Eastern and Midland
Sicily Bolzano-Bozen
Centre and West Vilnius
Oslo and Viken Western Norway
Lublin Lesser Poland
Algarve Alentejo
S.W. Oltenia Bucharest - Ilfov
South Upper Norrland
East West
East Bratislava
N.E. England S.W. England
West Virginia D. of Columbia
Less tight More tight
Romania
Croatia
Bulgaria
Spain
Slovak Republic
Lithuania
Austria
Hungary
Switzerland
France
Sweden
Finland
Slovenia
Czechia
United States
Germany
United Kingdom
Portugal
Australia
Italy
Denmark
Greece
Poland
Ireland
Belgium
Norway
050 100 150 200 250 300 350 400 450 500
aaa
Minimum Regional median Maximum

76
JOB CREATION AND LOCAL ECONOMIC DEVELOPMENT 2024 © OECD 2024
Box 2.1. How well do different measures of labour market tightness align?
Standard measures of labour market tightness divide vacancies by unemployment. To provide tightness
estimates at the occupational level, this chapter uses employment instead of unemployment, as
for most countries. This box
assesses the degree of alignment between the two measures, one based on unemployment and the other
on employment.
Figure 2.3. Employment and unemployment-based measures lead to similar tightness results
Regional tightness relative to the national level (=100) using employment (horizontal axis) and unemployment
(vertical axis) in the denominator, 2022.
Note: labour market tightness on the horizontal axis is computed by dividing online vacancies by employment at the regional level, while the
vertical axis reports tightness based on a measure that uses unemployment in the denominator. The 45°-line indicates where both measures
produce identical results.
Source: Own elaboration based on Lightcast, OECD regional unemployment statistics, and labour force surveys: EU-LFS, UK-LFS, Bureau of
Labour Statistics (USA), and Australian Bureau of Statistics.
Both the unemployment-based (vertical axis) and the employment-based (horizontal axis) relative
tightness measures provide similar results (Figure 2.3). In most cases regional tightness, relative to
the national average, falls close to the 45°-line, on which both measures are identical. The similarity of the
two measures is confirmed by a h-
based tightness measure is also an appropriate proxy for labour shortages.
Regional labour markets have witnessed a notable increase in tightness since 2019, a trend
especially exacerbated by the COVID-19 crisis. Figure 2.4 presents an illustrative example using
regions in the United States, where Lightcast data is best comparable since 2019, but similar trends are
observed across OECD countries (OECD, 2023[3]). Between 2019 and 2022, regional labour market
tightness in the United States increased by over 50%. The increase is especially pronounced during the
COVID-19 crisis. Between 2020 and 2021, the regional median increased by an additional thirty
percentage points, relative to 2019, in contrast to the approximately 10 percentage point increases
observed in the preceding and subsequent years.
45°-line45°-line45°-line45°-line45°-line45°-line45°-line45°-line45°-line45°-line45°-line45°-line45°-line45°-line45°-line45°-line45°-line45°-line45°-line45°-line45°-line45°-line45°-line45°-line45°-line45°-line45°-line45°-line45°-line45°-line45°-line45°-line45°-line45°-line45°-line45°-line45°-line45°-line45°-line45°-line45°-line45°-line45°-line45°-line45°-line45°-line45°-line45°-line45°-line45°-line45°-line45°-line45°-line45°-line45°-line45°-line45°-line45°-line45°-line45°-line45°-line45°-line45°-line45°-line45°-line45°-line45°-line45°-line45°-line45°-line45°-line45°-line45°-line45°-line45°-line45°-line45°-line45°-line45°-line45°-line45°-line45°-line45°-line45°-line45°-line45°-line45°-line45°-line45°-line45°-line45°-line45°-line45°-line45°-line45°-line45°-line45°-line45°-line45°-line45°-line45°-line45°-line45°-line45°-line45°-line45°-line45°-line45°-line45°-line45°-line45°-line45°-line45°-line45°-line45°-line45°-line45°-line45°-line45°-line45°-line45°-line45°-line45°-line45°-line45°-line45°-line45°-line45°-line45°-line45°-line45°-line45°-line45°-line45°-line45°-line45°-line45°-line45°-line45°-line45°-line45°-line45°-line45°-line45°-line45°-line45°-line45°-line45°-line45°-line45°-line45°-line45°-line45°-line45°-line45°-line45°-line45°-line45°-line45°-line45°-line45°-line45°-line45°-line45°-line45°-line45°-line45°-line45°-line45°-line45°-line45°-line45°-line45°-line45°-line45°-line45°-line45°-line45°-line45°-line45°-line45°-line45°-line45°-line45°-line45°-line45°-line45°-line45°-line45°-line45°-line45°-line45°-line45°-line45°-line45°-line45°-line45°-line45°-line45°-line45°-line45°-line45°-line45°-line45°-line45°-line45°-line45°-line45°-line45°-line45°-line45°-line45°-line45°-line45°-line45°-line45°-line45°-line45°-line45°-line45°-line45°-line45°-line45°-line45°-line45°-line45°-line45°-line45°-line45°-line45°-line45°-line45°-line45°-line45°-line45°-line45°-line45°-line45°-line45°-line45°-line45°-line45°-line45°-line45°-line45°-line45°-line45°-line
Correlation = 0.79Correlation = 0.79Correlation = 0.79Correlation = 0.79Correlation = 0.79Correlation = 0.79Correlation = 0.79Correlation = 0.79Correlation = 0.79Correlation = 0.79Correlation = 0.79Correlation = 0.79Correlation = 0.79Correlation = 0.79Correlation = 0.79Correlation = 0.79Correlation = 0.79Correlation = 0.79Correlation = 0.79Correlation = 0.79Correlation = 0.79Correlation = 0.79Correlation = 0.79Correlation = 0.79Correlation = 0.79Correlation = 0.79Correlation = 0.79Correlation = 0.79Correlation = 0.79Correlation = 0.79Correlation = 0.79Correlation = 0.79Correlation = 0.79Correlation = 0.79Correlation = 0.79Correlation = 0.79Correlation = 0.79Correlation = 0.79Correlation = 0.79Correlation = 0.79Correlation = 0.79Correlation = 0.79Correlation = 0.79Correlation = 0.79Correlation = 0.79Correlation = 0.79Correlation = 0.79Correlation = 0.79Correlation = 0.79Correlation = 0.79Correlation = 0.79Correlation = 0.79Correlation = 0.79Correlation = 0.79Correlation = 0.79Correlation = 0.79Correlation = 0.79Correlation = 0.79Correlation = 0.79Correlation = 0.79Correlation = 0.79Correlation = 0.79Correlation = 0.79Correlation = 0.79Correlation = 0.79Correlation = 0.79Correlation = 0.79Correlation = 0.79Correlation = 0.79Correlation = 0.79Correlation = 0.79Correlation = 0.79Correlation = 0.79Correlation = 0.79Correlation = 0.79Correlation = 0.79Correlation = 0.79Correlation = 0.79Correlation = 0.79Correlation = 0.79Correlation = 0.79Correlation = 0.79Correlation = 0.79Correlation = 0.79Correlation = 0.79Correlation = 0.79Correlation = 0.79Correlation = 0.79Correlation = 0.79Correlation = 0.79Correlation = 0.79Correlation = 0.79Correlation = 0.79Correlation = 0.79Correlation = 0.79Correlation = 0.79Correlation = 0.79Correlation = 0.79Correlation = 0.79Correlation = 0.79Correlation = 0.79Correlation = 0.79Correlation = 0.79Correlation = 0.79Correlation = 0.79Correlation = 0.79Correlation = 0.79Correlation = 0.79Correlation = 0.79Correlation = 0.79Correlation = 0.79Correlation = 0.79Correlation = 0.79Correlation = 0.79Correlation = 0.79Correlation = 0.79Correlation = 0.79Correlation = 0.79Correlation = 0.79Correlation = 0.79Correlation = 0.79Correlation = 0.79Correlation = 0.79Correlation = 0.79Correlation = 0.79Correlation = 0.79Correlation = 0.79Correlation = 0.79Correlation = 0.79Correlation = 0.79Correlation = 0.79Correlation = 0.79Correlation = 0.79Correlation = 0.79Correlation = 0.79Correlation = 0.79Correlation = 0.79Correlation = 0.79Correlation = 0.79Correlation = 0.79Correlation = 0.79Correlation = 0.79Correlation = 0.79Correlation = 0.79Correlation = 0.79Correlation = 0.79Correlation = 0.79Correlation = 0.79Correlation = 0.79Correlation = 0.79Correlation = 0.79Correlation = 0.79Correlation = 0.79Correlation = 0.79Correlation = 0.79Correlation = 0.79Correlation = 0.79Correlation = 0.79Correlation = 0.79Correlation = 0.79Correlation = 0.79Correlation = 0.79Correlation = 0.79Correlation = 0.79Correlation = 0.79Correlation = 0.79Correlation = 0.79Correlation = 0.79Correlation = 0.79Correlation = 0.79Correlation = 0.79Correlation = 0.79Correlation = 0.79Correlation = 0.79Correlation = 0.79Correlation = 0.79Correlation = 0.79Correlation = 0.79Correlation = 0.79Correlation = 0.79Correlation = 0.79Correlation = 0.79Correlation = 0.79Correlation = 0.79Correlation = 0.79Correlation = 0.79Correlation = 0.79Correlation = 0.79Correlation = 0.79Correlation = 0.79Correlation = 0.79Correlation = 0.79Correlation = 0.79Correlation = 0.79Correlation = 0.79Correlation = 0.79Correlation = 0.79Correlation = 0.79Correlation = 0.79Correlation = 0.79Correlation = 0.79Correlation = 0.79Correlation = 0.79Correlation = 0.79Correlation = 0.79Correlation = 0.79Correlation = 0.79Correlation = 0.79Correlation = 0.79Correlation = 0.79Correlation = 0.79Correlation = 0.79Correlation = 0.79Correlation = 0.79Correlation = 0.79Correlation = 0.79Correlation = 0.79Correlation = 0.79Correlation = 0.79Correlation = 0.79Correlation = 0.79Correlation = 0.79Correlation = 0.79Correlation = 0.79Correlation = 0.79Correlation = 0.79Correlation = 0.79Correlation = 0.79Correlation = 0.79Correlation = 0.79Correlation = 0.79Correlation = 0.79Correlation = 0.79Correlation = 0.79Correlation = 0.79Correlation = 0.79Correlation = 0.79Correlation = 0.79Correlation = 0.79Correlation = 0.79Correlation = 0.79Correlation = 0.79Correlation = 0.79Correlation = 0.79Correlation = 0.79Correlation = 0.79Correlation = 0.79
0
100
200
300
400
0 100 200 300 400
Rel. tightness (employment-based)
Rel. tightness (unemployment-based)

77
JOB CREATION AND LOCAL ECONOMIC DEVELOPMENT 2024 © OECD 2024
While regions still face widespread labour shortages, the growth of labour market tightness is
showing signs of slowing down after the initial effect of the COVID-19 pandemic. Both regions with
the most and the least severe shortages show a slower increase in labour market tightness since 2021.
However, by the end of 2022, tightness was still increasing at a relatively high rate across all regions,
standing at more than 10 percentage points.
Figure 2.4. Labour markets have become tighter — across all regions
Evolution of relative labour market tightness in US regions indexed to 2019 (= 100), 2019 to 2022.
Note: Illustration based on the United States. Absolute tightness is indexed to the year 2019 (=100). The figure shows the evolution of absolute
labour market tightness for US regions in the top 20%, bottom 20% and the regional median of absolute tightness. The group of regions in the
top and bottom 20% each account for at least 20% of the employed population in the region.
Source: Own elaboration based on Lightcast vacancies and Bureau of Labour Statistics (USA).
100
120
140
2019 2020 2021 2022
Labour market tightness
20% tightest regions Median 20% least tight regions

78
JOB CREATION AND LOCAL ECONOMIC DEVELOPMENT 2024 © OECD 2024
Box 2.2. Shortages vs. dynamism: disentangling drivers of labour market tightness
Rising labour market tightness cannot be explained through increasingly dynamic labour markets.
If workers are entering and leaving their jobs at a more frequent rate, it is a sign of a vibrant labour market,
since workers can quickly transition to new jobs. Figure 2.5 plots the rate at which workers start new jobs
and leave their jobs in European regions. Based on this evidence, labour markets have not become more
dynamic: besides the dip in new hires and rise in separations in 2020, the trend is flat. This contrasts with
labour market tightness, which increased sharply in 2021 and continues to increase into 2022 (Figure 2.4).
Therefore, the measure of labour market tightness presented in this chapter is more likely to capture actual
labour shortages than dynamic labour markets, and the two terms are used interchangeably throughout
this note.
Figure 2.5. Job switches do not explain increasing labour market tightness
New hires and job separation rates over all employed persons, 2017 to 2022.
Note: Illustration based on European countries. New hires rate is defined as the number of people who stated they started a new job in that year
over the employed population. The turnover rate is defined as the number of people who stated they left their job that year over the employed
population. The figure shows the evolution of the new hires (left) and turnover rate (right) for regions in the top 20%, bottom 20% and the regional
median of absolute tightness. The group of regions in the top and bottom 20% each account for at least 20% of the employed population in the
region.
Source: OECD elaboration based on EU-LFS, including the OECD accession countries of Bulgaria, Croatia and Romania.
The extent of labour shortages depends on the characteristics of the regional
economy
This section examines to what extent
labour market conditions and economic structure. To do this, it analyses the relation between labour market
tightness (relative to the national level) and regional characteristics in linear regression models
(Figure 2.6).
20% most dynamic regions Regional median 20% least dynamic regions
0.00
0.05
0.10
0.15
0.20
0.25
0.30
2017 2018 2019 2020 2021 2022
New hires rate
0.00
0.02
0.04
0.06
0.08
0.10
2017 2018 2019 2020 2021 2022
Left work rate

79
JOB CREATION AND LOCAL ECONOMIC DEVELOPMENT 2024 © OECD 2024
Tightness differs by regional demographic and employment characteristics
More populous and urban regions face more intense labour shortages. The 50% of regions with the
highest population in a country (i.e. those above the population median) have 14% higher tightness levels
than those below the median (Figure 2.6). Similarly, regions with above-median population density and
projected labour force growth have on average 26% and 15% higher tightness levels, respectively,
compared to those below the median. Labour demand is likely strongest in more urban areas, to which the
labour force adapts by relocating to such high labour demand areas.
Regions with high employment rates face more severe labour shortages. Labour market tightness is
on average 19% higher in regions with employment rates above the national median, relative to those with
below-median employment rates. This aligns with the interpretation of high employment rates being a
driver of labour shortages, as the pool of job seekers is relatively small. Additionally, labour shortages are
20% lower in regions with above-median employment growth over the past five years, potentially because
employment growth is more likely to be observed in regions with relatively low employment rates and low
levels of tightness. The negative association between employment growth and tightness is also intuitive
as firms in regions with a growing labour market are able to fill vacancies and therefore experience lower
labour shortages. An important caveat is that the association between labour market tightness and
employment rate growth is partially mechanical since a higher number of filled positions decreases labour
Figure 2.6. Labour shortages are higher in regions that are more urban, have high employment
rates, and rely more on tradable services
Average difference in labour market tightness (relative to the national level) between regions with high levels (i.e.
above median) and low levels (i.e. below median) of the characteristics reported on the horizontal axis.
Note: ***p-value<0.01, **p-value<0.05, *p-value<0.1. Each bar corresponds to the coefficient of a univariate, regional-level regression of labour
market tightness (relative to the national average) on the respective characteristic on the horizontal axis. In each regression, the covariate takes
the form of a binary variable indicating that a region is above the country-specific median value of the respective characteristic (e.g. population).
Thus, the vertical axis reports the mean difference in labour market tightness between regions above the country-specific average (e.g. in
population) relative to those below the country--age
population, population density, its projected labour force change over the future 10 years, the level and the 5-year change in its employment to
working-age population rate, the employment share in tradeable services (ISIC broad sectors G to N) and tradeable goods (ISIC sectors B, D,
E). Standard errors are clustered at the country level. The regressions include all regions in countries with at least two subnational regions with
available data, namely Australia, Belgium, Switzerland, Czechia, Germany, Denmark, Greece, Spain, Finland, France, Hungary, Ireland, Italy,
Lithuania, Norway, Poland, Portugal, Sweden, Slovenia, Slovakia, the United Kingdom and the United States.
Source: OECD elaboration based on Lightcast, the OECD Region and Cities databases and labour force surveys: EU-LFS, UK-LFS, Bureau of
Labour Statistics (USA), and Australian Bureau of Statistics.
*
***
** **
**
**
Demographics Labour market Economic structure
-20%
0%
20%
40%
Population
Population density
Labour force change
Employment rate
Employment rate change
Tradeable services
Tradeable goods

80
JOB CREATION AND LOCAL ECONOMIC DEVELOPMENT 2024 © OECD 2024
The regional economic structure also matters for the extent of shortages
Regions that are more specialised in tradeable services experience higher labour shortages.
Regions with an above-median employment share in tradeable services industries (i.e. ISIC broad groups
G to N) experience 21% higher tightness levels compared to those below median.1 A likely explanation is
that some tradeable services industries have seen particularly high and growing demand, for example ICT
as a central industry to the twin transition or accommodation and food service activities in the post-COVID
recovery. Additionally, it is important to note that office-based jobs many of which are part of tradeable
services industries are overrepresented in online vacancy data in many countries (Box 2.4), which might
overstate the statistical relation between labour market tightness and tradeable services to some degree.
Regions with a high share of employment in tradeable goods industries do not show tighter labour markets
than those with low employment shares in these industries.
Box 2.3. Labour market tightness as a proxy for labour shortages
Labour market shortages occur when firms are not able to fill open positions. As firms cannot
hire the desired employees, labour shortages may impede economic growth and productivity, both for
economic health, labour market shortages are difficult to measure since standard labour market
statistics do not typically track job vacancies (and whether these are filled) in a consistent manner
across time and countries. Throughout this note, labour market tightness is used as a proxy for labour
shortages.
Methodology
Labour market tightness is calculated as the number of job vacancies over the number of
employed persons in a given region and year. The measure is calculated for different occupations
and industries in a given region as:
The number of job vacancies comes from online job postings collected by Lightcast while
employment data are derived from labour force surveys and national statistics (see notes). This
indicator differs from other approaches in that it divides the number of job vacancies by employment
(rather than unemployment) (OECD, 2023[3]). However, using employment in the denominator allows
for a more accurate disaggregation by occupation and industry, as employed individuals can be
attributed to a specific occupation and industry. This results in more detailed information on which
sectors or occupations experience greater labour market shortages. Figure 2.3 shows that the standard
unemployment-based and the employment-based measure used in this chapter align well across
regions.
This chapter presents labour market tightness over time (i.e. 2019-2022), for subnational regions
(mostly TL2), as well as by occupation and industry. Since the data quality of online job postings
(i.e. how accurately it tracks all job openings in an economy) varies by country and over time, this note
reports relative measures of tightness. Specifically, the results report occupation- and industry-level
s, while regional estimates (i.e. for all
occupations and industries) are presented relative to the national tightness level. Thus, this approach
rather than in absolute terms. Similarly, occupation- and industry-level tightness estimates can only be

81
JOB CREATION AND LOCAL ECONOMIC DEVELOPMENT 2024 © OECD 2024
High-skilled occupations mainly drive regional labour shortages
Within regions, labour market tightness varies to a large degree by occupation. The tightest ten
occupations in Europe and the United States have between two and almost five times more job openings
per employed person in that occupation than the average job in that region (Figure 2.7). Furthermore, the
tightest occupation in Europe (Sales Marketing and Development Managers) is among the five tightest
occupations in 42% of regions, highlighting that many regions face shortages in that occupation. The same
is true for 42% of regions when it comes to software and applications developers and analysts, and 35%
of regions in the case of transport and storage labourers.
compared across regions in relation to their regional tightness average. Additionally, the evolution over
time is only reported for the United States (Figure 2.4), as its data is the most reliable across time.
However, some challenges arise when proxying labour shortages with labour market tightness.
First, the labour market tightness measure does not account for whether a vacancy is filled.
Theoretically, both actual labour shortages and a dynamic labour market (with many vacancies that are
filled) could lead to high labour market tightness index. Second, the regional, occupational, and sectoral
representativeness of online job postings data varies by country (Box 2.4). This chapter mitigates these
shortcomings by restricting the results to where the data are reliable and by reporting results in relative
terms.
Notes: Job vacancies are provided by Lightcast; employment data come from EU-LFS, UK-LFS, Bureau of Labour Statistics (USA), and
Australian Bureau of Statistics.
Box 2.4. How representative are online job postings data?
Vacancy data from online job postings (OJPs) provide timely and detailed information. However,
they also come with differences in terms of representativeness across countries, regions within
countries, occupations and industries. This box provides a brief overview of the representativeness
of OJP data from Lightcast (LC) in countries included in this chapter. Existing work in this area compares
LC data to official data from national statistical offices and labour agencies, which come with their own
limitations (e.g. if firms report vacancies voluntarily). Thus, these comparisons provide a measure of
similarity between available sources, rather than an absolute measure of representativeness.
For Anglophone countries, namely the United States, the United Kingdom, and Australia, LC
data match official statistics relatively well when considering the distribution of vacancies (e.g.
the share of vacancies in a specific region, occupation or industry) (Tsvetkova et al., 2024[10]). Since
the total number of vacancies in LC data is consistently below the one in national statistics, this chapter
refrains from reporting absolute levels of tightness (i.e. the number of OJPs per filled position).
Nevertheless, differences in the distribution of vacancies do exist. Overrepresentation is highest for the
education and health sectors, whose share is between 12 and 15 percentage points higher in LC than
in official statistics. Evidence of occupational representation is limited to Canada, where management
and professional occupations are overrepresented and lower skilled occupations are underrepresented.
Importantly, these sectoral and occupational patterns remain relatively stable between 2015 and 2022.
The regional representation is in general high for Anglophone countries, showing differences of one
percentage point at most between LC data and official records with very few exceptions.

82
JOB CREATION AND LOCAL ECONOMIC DEVELOPMENT 2024 © OECD 2024
High-skilled occupations are in demand across OECD regions
Labour shortages in OECD regions affect high-skilled occupations more than low- and medium-
skilled occupations. In two-thirds of European regions and all regions in the United States, high-skilled
jobs, namely managers and professionals (i.e. defined at the 1-digit level of the European occupational
classification ISCO), are the tightest occupational group. Their average tightness is 25% and 41% higher
than the average job in the labour market in Europe and the United States, respectively. Low-skilled jobs,
for example, service and sales workers, are the second tightest skilled group, with 2% and 32% lower-
than-average tightness levels in Europe and the United States, followed by medium-skilled jobs (22% and
34% lower-than-average tightness). These findings contrast evidence on increased labour shortages
among low-and medium-skilled occupations, which may partly be explained by office jobs, many of which
are high-skilled, being overrepresented in the underlying online job postings data (Box 2.4).
However, occupations of all skills groups and in a variety of industries count among the tightest
occupations. In Europe, both high-skilled occupations (e.g. Software and Applications Developers and
Analysts) and lower-skilled occupations (e.g. manufacturing, transport, and storage labourers) are among
the tightest occupations on average across regions. In the United States, the tightest occupations include
mostly high-skilled occupations (e.g. management occupations or computer occupations), with few
exceptions (e.g. physical therapist assistants). Additionally, jobs in a wide range of industries show high
labour market tightness in the United States, namely the ICT, wholesale, arts and healthcare industries,
and in Europe, namely the ICT, manufacturing and logistics industries.
The representativeness of LC data varies strongly across European countries (Vermeulen and
Gutierrez Amaros, 2024[11]). In 2020, the ratio of OJPs to those reported in official statistics ranged from
6.8 in Ireland to 0.4 in Czechia. Between 2019 and 2022, the coverage of OJPs increased substantially
such that in 2022 the number of OJPs exceeds the ones from official statistics in all countries except
Luxembourg. Consequently, this chapter does not report time trends for European countries.
Subnational regions are not equally represented in most countries, with the exception of Sweden and
the Netherlands. Surprisingly, urban areas are not always overrepresented, as capital regions are
underrepresented in Belgium, Hungary and Romania. Regarding industries, manufacturing, utilities,
ICT, and finance and insurance activities are in general overrepresented. Furthermore, professional
and administrative occupations tend to be overrepresented, potentially because office-based job
vacancies are more likely to be posted online. It is important to take these results into account when
Source: (Vermeulen and Gutierrez Amaros, 2024[11]); (Tsvetkova et al., 2024[10])

83
JOB CREATION AND LOCAL ECONOMIC DEVELOPMENT 2024 © OECD 2024
Figure 2.7. Labour market tightness is up to four times higher-than-average for the most affected
occupations
Labour market tightness by occupation relative to the regional average (=100) for the ten tightest occupations, 2022.
Note: Relative labour market tightness by occupation is calculated at the regional level as the number of vacancies over employment for a given
occupation and region, divided by the regional labour market tightness average. The horizontal axis shows the average relative labour market
tightness across regions (weighted by employment) in the US and the EU. The figure shows the ten tightest occupations in the US and the EU.
Occupations are classified according "minor" occupational SOC codes (4 digit) in the US and 3-digit ISCO codes in the EU.
Source: Own elaboration (see Box 2.3); Lightcast; EU-LFS, UK-LFS, Bureau of Labour Statistics (USA), and Australian Bureau of Statistics.
Missing green and digital talent hold back many OECD regions
Tightness estimates at the occupational level allow for aggregations by relevant occupational
groups, such as green and ICT jobs, and can provide valuable evidence for policies to target
shortages effectively. This chapter uses the task-based definition of green jobs established in previous
LEED work, according to which occupations with at least 10% green tasks are classified as green (OECD,
2023[12]). In this definition, tasks that contribute to environmental objectives, such as preserving the
environment and reducing greenhouse gas emissions, are considered green. For ICT jobs, this chapter
e defined as "workers who have the ability to
develop, operate and maintain ICT systems, and for whom ICT constitute the main part of their job"
(Eurostat, 2024[13]). Since Eurostat defines ICT specialists at the 4-digit ISCO level, this classification is
further converted to the 3-digit level based on employment shares and adapted to other occupational
taxonomies (e.g. SOC) used in this chapter.
Jobs that are crucial for the digital transition experience high labour shortages in almost all OECD
regions. ICT jobs show 156% more vacancies per filled position than the regional labour market on
average. Although ICT are tighter than the average job in 97% of OECD regions with available data large
regional disparities exist within countries (Figure 2.8). On average, ICT jobs show more than twice (126%)
Marketing, promotions, public relations, and
sales managers
Management occupations (other)
Computer occupations
Drafters, engineering and
mapping technicians
Mathematical science occupations
0 100 200 300 400
Relative tightness
United States
Sales, marketing and development managers
Software and applications
developers and analysts
Sales workers (other)
Manufacturing labourers
Transport and storage
labourers
0 100 200 300 400 500
Relative tightness
Europe

84
JOB CREATION AND LOCAL ECONOMIC DEVELOPMENT 2024 © OECD 2024
more vacancies per filled position in the region with the highest compared to the one with the lowest ICT
shortages.2 This difference can reach up to 700% (Thessaly region in Greece). On average across
countries, ICT jobs are tightest in Greece, Portugal and Poland, which have around 4 times more vacancies
per filled position in ICT jobs compared to the average job. Nordic European countries, namely Finland,
Sweden and Denmark, experience the lowest ICT shortages as ICT jobs are approximately as tight as the
regional labour market on average. Apart from job-specific skills, other factors, such as generally higher
educational requirements among digital (and green) jobs compared to the average job, likely contribute to
these tightness differences.
For green jobs, this gap in relative tightness is smaller than for ICT jobs, but still substantial.
Similarly to ICT jobs, green jobs show more vacancies per filled position than the average job in more than
nine out of ten OECD regions (91%) (Figure 2.9). With 37% more vacancies per filled position than the
average job, the magnitude of this tightness difference for green jobs is substantial, but smaller than for
ICT jobs (156%). Regions vary in their tightness of green jobs, as green jobs are 44% tighter in the region
with the most relative to those with the least severe green jobs shortages. Yet these regional disparities
are smaller than in the case of ICT jobs. Greece experiences the strongest green jobs shortages both at
the national level, where green jobs are 95% tighter, and at the regional level, with green jobs in Eastern
Macedonia showing more than twice as many vacancies than the average job. The three countries with
the lowest green jobs shortages on average are Norway, Sweden and Finland, where green jobs are about
as tight as the average job. These Nordic countries also experience relatively little variation across regions,
with the exception of Norway where green jobs are almost 57% less tight than the average job in
Trøndelag.
Box 2.5. How does labour market tightness affect wages?
Theoretically, occupations and industries that experience labour shortages should see an
increase in their real wages. The reason for this is that firms need to improve job conditions (including
but not restricted to wages) to attract the relatively few job candidates. Past and current economic
projections have repeatedly highlighted that this mechanism could lead to additional upward pressure
on wages, potentially exacerbating a wage-price spiral, in the current context of high inflation (OECD,
2024[14]).
In practice, despite widespread labour shortages, real wages have declined across the OECD
by 2.2% on average between Q4 2019 and the end of 2022 as nominal wages have not kept pace
with inflation in recent years. Although nominal wages grew by 14.3% over the same period, high
inflation rates overshadowed the (likely) labour shortages-induced upward pressure on real wages.
Real wages performed better (i.e. fell by less) in low- than in medium- or high-paying industries, as a
result of stronger nominal wage growth in lower-wage industries (OECD, 2023[3]). This aligns with
evidence that labour shortages have increased strongly in lower-paid and lower-quality occupations
over this period (Zwysen, 2023[7]).
As inflation fades, labour shortages could lead to higher real wages in affected occupations and
industries. Supporting this hypothesis, tentative evidence suggests that industries that faced higher
increases in labour market tightness also experienced higher nominal wage growth (OECD, 2023[3]).
More specifically, industries that experienced a 1% increase in tightness saw their nominal wages rise
by 0.03%. Indeed, evidence from 2023 shows that real wage growth has turned positive in most OECD
countries (29 out of 35), standing at 3.5% across the OECD on average (OECD, 2024[2]). However,
more detailed regional analysis is not feasible due to the lack of regional and occupational wage data,
which represents a major limitation to offer valuable policy options to address the issue of stagnating
wages across OECD regions.

85
JOB CREATION AND LOCAL ECONOMIC DEVELOPMENT 2024 © OECD 2024
Regions with more severe labour shortages for green jobs also experience higher ICT job tightness
(and vice versa), highlighting that the digital and green transitions are intertwined. Regions with a
10% higher green jobs tightness level also have a 18% higher tightness of ICT jobs on average (relative
to the average regional tightness) (Figure 2.10). This positive relationship likely stems from the fact that
the green and the digital transitions and their associated job profiles complement each other, as both
the innovation and the implementation of green technologies often require an adequate ICT infrastructure
and a digitally-
industrial processes more energy-efficient, including in the most emissions-intensive industries, such as
cement, steel and chemical industries (European Commission, 2022[15]). However, the positive association
between tightness of green and digital jobs at the regional level can partly also arise from some
occupations being classified as both green and digital.
Figure 2.8. ICT jobs experience particularly severe shortages across OECD regions
Labour market tightness of ICT jobs relative to the regional average (= 100), 2022.
Note: The relative labour market tightness of ICT jobs is based on the relative tightness estimates by occupation, which are aggregated at the
3
level (4 digits) than the available employment data (mostly 3 digits), the classification is aggregated to the 3-digit level assuming equal
employment shares among the 4-digit occupations. The vertical axis shows the average relative labour market tightness of ICT jobs relative to
t. Hence, a value above 1 indicates higher-than-average tightness of ICT jobs in that region.
Source: Own elaboration (see Box 2.3); Lightcast; EU-LFS, UK-LFS, Bureau of Labour Statistics (USA), and Australian Bureau of Statistics;
(Eurostat, 2024[13]).
Shortages of workers with green and digital skills are an obstacle to firm investments and inhibit
local economic growth (OECD, 2023[12]). In Europe, for example, more than 80% of firms report skills
shortages, especially for green and digital skills, which limits the implementation of climate change projects
and progress on the green transition (EIB, 2023[16]). This reflects the high demand for workers with green
and digital skills as economies adjust to the twin transition and could be a result of a skills mismatch as
labour markets undergo a process of structural transformation that is not yet complemented through
adaptations in education and training systems.
Thessaly
Centro
Swietokrzyskie
Southern Transdanubia
Andalusia
Saxony
East Slovakia
Basilicata
Vermont
Lake Geneva Region
Southern Austria
Northern and Western
Western Norway
Central and Western Lithuania
Southeast
South Australia
Bourgogne-Franche-Comté
Brussels Capital Region
Northern Ireland
Southern Denmark
West Sweden
Ĺland
South East
Adriatic Croatia
Regional
tightness mean
100
500
1000
1500
Greece
Portugal
Poland
Hungary
Spain
Germany
Slovakia
Italy
OECD
United States
Switzerland
Austria
Ireland
Norway
Lithuania
Czechia
Australia
France
Belgium
United Kingdom
Denmark
Sweden
Finland
Romania
Croatia
National average Regional values

86
JOB CREATION AND LOCAL ECONOMIC DEVELOPMENT 2024 © OECD 2024
Figure 2.9. Green jobs are tighter than the average job in the vast majority of OECD regions
Labour market tightness of green jobs relative to the regional average (= 100), 2022.
Note: The relative labour market tightness of green jobs is based on the relative tightness estimates by occupation, which are aggregated at the
regional level using the green jobs classification established in (OECD, 2023[12]). The vertical axis shows the average relative labour market
-than-average tightness
of green jobs in that region.
Source: Own elaboration (see Box 2.3); Lightcast; EU-LFS, UK-LFS, Bureau of Labour Statistics (USA), and Australian Bureau of Statistics; (OECD, 2023[12]).
Figure 2.10. Shortages in green and ICT jobs tend to co-occur in OECD regions
Labour market tightness of green jobs (horizontal axis) and ICT jobs (vertical axis) relative to the regional average
(=100), 2022.
Note: The figure shows the labour market tightness of green jobs (horizontal axis) and ICT jobs (vertical axis) relative to the regional average in
2022 for all OECD regions with available (subnational) data. The dashed line represents the regression line of a linear model with a 95%
confidence interval.
Source: Own elaboration (see Box 2.3); Lightcast; EU-LFS, UK-LFS, Bureau of Labour Statistics (USA), and Australian Bureau of Statistics;
(OECD, 2023[12]); (Eurostat, 2024[13]).
Eastern Macedonia
Southern Great Plain
Sicily
Eastern and Midland
Alentejo
Bremen
Castile-La Mancha
Northwest
Walloon Region
Mazowiecki region
South Dakota
Eastern Austria
Ticino
Hauts-de-France
Yorkshire and The Humber
East Slovakia
Southern Denmark
Western Australia
Central and Western Lithuania
Western Finland
East Middle Sweden
Trřndelag
West
Adriatic Croatia
Regional tightness
mean
0
100
200
300
400
500
600
Greece
Hungary
Italy
Ireland
Portugal
Germany
Spain
Czechia
Belgium
Poland
United States
Austria
OECD
Switzerland
France
United Kingdom
Slovakia
Denmark
Australia
Lithuania
Finland
Sweden
Norway
Romania
Croatia
National average Regional values

87
JOB CREATION AND LOCAL ECONOMIC DEVELOPMENT 2024 © OECD 2024
High-productivity and contact-intensive industries experience the strongest
labour shortages
Industries differ substantially in terms of labour market tightness, yet the magnitude depends on
the geographic area. While jobs in the tightest industry are 2.7 times tighter than the regional average in
Australia (mining), the tightest industry in the United Kingdom (real estate activities) stands at 1.8 times
the average regional tightness level (Figure 2.11).
High-productivity industries, such as ICT and finance and insurance, tend to be among the tightest
industries. Mirroring the ongoing digital transition in many regions, the ICT industry ranks among the five
tightest industries in three out of four geographical areas analysed (Figure 2.11). Jobs in the ICT industry
display between 1.2 times (Australia) and two times (European regions) more vacancies per filled position
than the average job in a region. Moreover, ICT is the tightest industry in 33% of European regions and in
24% of US regions. This aligns with ICT specialist occupations showing particularly high levels of tightness
(Figure 2.8). Furthermore, financial and insurance activities and utilities are particularly tight in the United
States and Europe. In fact, the finance and insurance industry is the tightest industry in the United States,
with 2.5 times more vacancies per filled position than the regional average (1.6 times in the European
Union).
Contact-intensive industries, namely health care, and accommodation and food services also show
strong signs of labour shortages. In line with reports of widespread shortages of health care workers
a lack of 15 million health workers in 2022 worldwide (Boniol et al., 2022[17]) the health care industry
ranks among the five tightest industries in the United States, the United Kingdom and Australia, with values
ranging from 1.4 to 1.6 times the average regional tightness level. Similarly, accommodation and food
services are among the five tightest industries in the United Kingdom and Australia (both 1.3 times the
regional average), and Europe (1.1 times tighter), reflecting the post-COVID-19 surge in labour shortages
in contact-intensive industries (Causa et al., 2022[6]).

88
JOB CREATION AND LOCAL ECONOMIC DEVELOPMENT 2024 © OECD 2024
Figure 2.11. Industries differ substantially in terms of labour market tightness
Labour market tightness of the five tightest broad industries relative to the regional average (=100), 2022.
Note: Relative labour market tightness by industry is calculated at the regional level as the number of vacancies over employment for a given
industry and region, divided by the regional labour market tightness average. The horizontal axis shows the average relative labour market
tightness across regions (weighted by employment) in the United States, the United Kingdom, Europe and Australia. Occupations are classified
according to broad industries (i.e., the highest level) of the respective industry classification, namely NAICS the US, NACE in the EU, UK SIC
in the UK and, ANZSIC in Australia.
Source: Own elaboration (see Box 2.3); Lightcast; EU-LFS, UK-LFS, Bureau of Labour Statistics (USA), and Australian Bureau of Statistics.
Labour shortages are larger in regions that rely more on high-growth industries (defined at the
national level), highlighting the regional economic structure as a driver of shortages. Regions with
a one percentage point higher employment share in high-growth industries show a 2% higher tightness
level (relative to the country mean) on average (Figure 2.12). For this analysis, high-growth industries are
defined as the three (1-digit) industries with the largest employment growth between 2019 and 2022 at the
country level. As demand for workers in high-growth industries is high in many parts of the country,
companies in regions with a higher reliance on these industries are likely to face more difficulties in finding
adequately skilled employees given increased labour force needs and increased competition from other
companies within the region and other regions.
finance and insurance
health care and social
assistance
real estate and rental and
leasing
utilities
information
0 100 200 300
United States
real estate activities
human health and social
work activities
accommodation and food
service activities
manufacturing
education
0 100 200 300
United Kingdom
information and communication
electricity, gas, steam and
air conditioning supply
financial and insurance
activities
accommodation and food services
manufacturing
0 100 200 300
Relative tightness
Europe
mining
health care and social
assistance
accommodation and
food services
information media and telecom.
education and training
0 100 200 300
Relative tightness
Australia

89
JOB CREATION AND LOCAL ECONOMIC DEVELOPMENT 2024 © OECD 2024
Figure 2.12. Regions that are more reliant on high-growth industries experience stronger shortages
Regional tightness relative to the national level (vertical axis) and the share of employment in high-growth industries,
defined at the national level (horizontal axis), 2022.
Note: The figure shows regional tightness relative to the national level on the vertical axis and the share of employment in high-growth industries
on the horizontal axis. High-growth industries are defined as the three (1-digit) industries with the largest employment growth between 2019 and
2022 at the country-level. For example, the most common high-growth indu
Source: OECD elaboration based on Lightcast, the OECD Region and Cities databases and labour force surveys: EU-LFS, UK-LFS, Bureau of
Labour Statistics (USA), and Australian Bureau of Statistics.
The interpretation of tightness estimates for nascent, often high-growth industries requires some
caution. By definition, such newly emerging industries are initially characterised by a low number of
workers, leading to high levels of tightness compared to other industries (provided that sufficiently many
vacancies exist already). Conventional tightness measures can be misleading in this context, since
nascent industries recruit from other industries, particularly those that employ workers with a similar skill
set. While this caveat is important to keep in mind, it is mitigated in this chapter as the latter examines
tightness for approximately 15 broad industry groups per country, within which emerging industries make
up a relatively small share.
(Figure 2.13). In some countries, most regions experience the strongest shortages in finance and
insurance (e.g. France, Sweden, and the Czech Republic), while in others, most
markets are ICT (e.g. Spain, Portugal, Switzerland, and Poland) or utilities (e.g. Germany). Italy presents
a mixed picture, as regions vary in terms of their tightest industry (utilities, ICT, and manufacturing).

90
JOB CREATION AND LOCAL ECONOMIC DEVELOPMENT 2024 © OECD 2024
Figure 2.13. ICT and utilities are the tightest industries in more than half of all European regions
Tightest industry in each region, 2022.
Source: Own elaboration (see Box 2.3); Lightcast; EU-LFS, UK-LFS, Bureau of Labour Statistics (USA), and Australian Bureau of Statistics.
Demographic change will put additional pressure on labour market tightness
More than four in ten OECD regions saw their potential labour force shrink over the past decade
(Figure 2.14). This proportion increased from almost 30% in 2008 to over 40% in 2022 (OECD, 2020[18]).
In almost 10% of regions the working age population (15- to 64-year-olds) shrank by more than 10%, in
many cases as a result of both ageing and outmigration. On average, OECD regions experienced modest
growth in their potential labour force of about 3%. Notably, more than a quarter of regions grew their
potential labour force by more than 10%. Thus, the varied trends in the evolution of the working age
population across regions suggests the need for tailored support for those regions facing a significant
contraction, especially as it potentially aggravates labour market tightness.

91
JOB CREATION AND LOCAL ECONOMIC DEVELOPMENT 2024 © OECD 2024
Figure 2.14. Over 40% of OECD regions experienced a decline in the working age population over
the past decade
Note: The figure shows the share of regions in each country which belong to each of the four categories representing the percentage change in
the working age population in 2012 and the working age population in 2022. The sample of countries includes the OECD accession countries
of Bulgaria, Croatia and Romania.
Source: OECD calculations based on OECD Regional Labour Database.
By 2042, the median local labour market tightness across OECD regions is projected to increase
by almost 9%, solely due to the decrease in the working age population in ageing regions
(Figure 2.15). Most OECD countries are ageing resulting in shrinking working age populations (OECD,
2022[19]; OECD, 2023[20]). These ageing populations will further exacerbate local labour market tightness,
especially in the places that face the greatest demographic change. Using information on regional
population structures, this chapter calculates the projected percent change in labour market tightness that
can be directly attributed to regional demographic shifts. Information on the methodology behind the
calculation is detailed in Box 2.7.
0
25
50
75
100
Costa Rica
Iceland
Ireland
Israel
Luxembourg
Mexico
Australia
New Zealand
Colombia
Türkiye
Chile
Switzerland
Canada
Sweden
Belgium
Norway
United States
Netherlands
Slovak Republic
Austria
Denmark
Finland
Germany
United Kingdom
Korea
France
Spain
Poland
Hungary
Italy
Lithuania
Slovenia
Portugal
Czechia
Japan
Greece
Estonia
Latvia
Romania
Bulgaria
Croatia
Share of regions
Working age population change, 2012 to 2022
Increase >= 5% Increase < 5% Decrease < 5% Decrease >= 5%

92
JOB CREATION AND LOCAL ECONOMIC DEVELOPMENT 2024 © OECD 2024
Box 2.6. Lower labour force participation and employment rates among older workers intensify
labour shortages
A pandemic-induced increase in labour market attrition (i.e. labour force exits) among older
workers intensifies demographic pressure and contributes to shortages in the US labour market.
-70) likelihood of retiring during the first year of the COVID-19 pandemic rose
by 6.7 percentage points (43%). This effect was particularly strong for older workers without a college
degree and those in contact-intensive jobs (Davis et al., 2023[21]), suggesting that health concerns
played a role in these retirement decisions. Furthermore, labour force participation rates among workers
aged 55-74 have not recovered to pre-pandemic levels and remained below 40% at the end of 2022
(Botelho and Weißler, 2022[22]). At this point it remains unclear to what extent older workers who left
the labour force (mainly to retire) during COVID-19 in the United States will return to the labour market
in the long run.
In contrast, the European Union only experienced a temporary drop in labour force participation
rates of older workers during the COVID-19 pandemic. In Euro area countries, labour force
participation quickly returned to its pre-COVID growth path, which is largely in line with ageing
population trends, after the pandemic. As a result, in 2022 more (41.5%) workers aged 55-67 than
before the pandemic (40%) were working or actively looking for employment (Botelho and Weißler,
2022[22]). However, employment rates show a different pattern: about the same share (95%) of older
workers in the labour force (aged 60-64) in the European Union are employed in 2022 compared to
2018, while employment rates increased for all other age groups over the same period. This stagnation
suggests that older workers in the European Union face difficulties in finding employment even if they
are willing to participate in the labour market. These difficulties may include negative perceptions of
older workers by employers and a lack of skills in an increasingly digital job market (see below).
In the regions with the oldest population structure, demographic change will increase labour
market tightness by 2042 almost twice as much as in the OECD median region. The difference
between older regions, defined as those currently in the top 20% of regions with the highest old-age
dependency ratio (i.e. the ratio of the population aged 65 and over to the working age population), and the
OECD regional median will be increasing over time. In contrast, for younger regions in the bottom 20% of
the regional distribution of old-age dependency ratios, labour market tightness will only marginally
decrease by about 2% by 2027 and remain relatively stable up to 2042. Even in regions where the working-
age population is expected to grow, the easing of labour market tightness is limited, especially compared
to the impact of ageing populations.

93
JOB CREATION AND LOCAL ECONOMIC DEVELOPMENT 2024 © OECD 2024
Figure 2.15. Demographic pressure will tighten labour markets, especially in older regions
Projected labour market tightness given net working age population change, 2022 to 2042.
Note: The figure shows the projected increase in labour market tightness over the years 2022 to 2042, where 2022 is indexed to 100. The figure
shows the evolution of absolute tightness for regions in the top 20%, bottom 20% and the regional median of the old-age dependency ratio. The
group of regions in the top and bottom 20% each account for at least 20% of the population in the region.
Source: OECD elaboration based on Lightcast, the OECD Region and Cities databases and labour force surveys: EU-LFS (including the OECD
accession countries of Bulgaria, Croatia and Romania), UK-LFS, Bureau of Labour Statistics (USA), and Australian Bureau of Statistics.
95
100
105
110
115
120
2022 2027 2032 2037 2042
Change in absolute tightness
(index = 2022)
20% oldest regions Region median 20% least old regions
Box 2.7. Calculating demographic pressure on labour market tightness
“Back-of-the-envelope” exercise
Regions are ageing across the OECD (OECD, 2022[19]; OECD, 2023[20]). This demographic change is
likely to have diverse implications for local economies and local labour markets in particular. In the case
of labour market tightness, shifts in the population structure are especially pertinent since the degree
of tightness is directly related to the available supply of potential workers, i.e. the working age
population.
To gain insight into the expected impact of population change within regions on the intensity of labour
market tightness, this note uses a simple exercise. In short, the exercise seeks to answer the question:
By how much would labour market tightness increase given the projected net change in the
working age population?
Methodology
The first step calculates the projected working age population for five-year periods from 2022 to 2042
(i.e. up to 20 years from the last available year, 2022). The projected working age population takes into
account the hypothetical net change in the working age population, defined as 15- to 64-year-olds,
given current demographic age structures. For example, in the year 2027, the projected working age
population is calculated as the working age population in 2022 minus those individuals expected to
retire by 2027 (i.e. those aged 60 and over in 2022), plus those individuals expected to join the working

94
JOB CREATION AND LOCAL ECONOMIC DEVELOPMENT 2024 © OECD 2024
age population by 2027 (i.e. those aged 10 and over in 2022). The projection for 2042 assumes that
births in the next five years will be the same as the currently youngest 0- to 5-year-old cohort.
Information on the demographic structure of regions is taken from the OECD Regions and Cities
databases (OECD, 2024[23]).
Next, the projected working age population is used to calculate an alternative measure of labour market
tightness. The main measure of labour market tightness defines tightness as the number of vacancies
over the number of employed persons (see Box 2.3). For the purpose of this exercise, labour market
tightness is instead defined as the number of vacancies over the working age population (15- to
64-years-old).
This change in methodology avoids additional assumptions on employment rates and their evolution
across demographic groups. For example, using the projected number of employed persons would
either require knowing the employment rate of young people and of older workers over the next twenty
years, or assuming that the rate is constant over this period and for each group. Both of these scenarios
seem unlikely, as employment rates differ greatly across age groups and over time.
Furthermore, as the interest of this exercise is to calculate the projected percent change in tightness
given a demographic change, the most important aspect is the comparability of the measure to 2022,
the last year with available data. By redefining the measure, comparability is maintained with minimal
confounding assumptions. Additional assumptions, which are important to keep in mind, are that the
regional fertility in the next five years is the same as the past five years, that no fatalities occur over the
next two decades, and that net migration in the region is constant.
Lastly, to calculate the percent change in labour market tightness given the projected working age
population, each five-year period is indexed to 2022, the last available year. In this way, the exercise
describes the change in labour market tightness attributed only to the predicted change in the
working age population.
This implies that the exercise does not take into account how the change in the population structure
could affect the number of vacancies. Vacancies are taken as the value in 2022, which is kept constant.
It could be that a fall in the labour force affects the number of vacancies. This correlation could be either
positive or negative: vacancies could rise due to increased demand for labour-intensive care work, or
they could fall since older populations tend to demand less goods and services. The net effect of these
two dynamics could also be country or region-specific and so, different from the average net correlation.
The exercise keeps vacancies constant in order to clearly attribute the change in tightness solely due
to the change in the labour force.
Notes: Job vacancies are provided by Lightcast; population data comes from the OECD Regions and Cities database (OECD, 2024[23]).

95
JOB CREATION AND LOCAL ECONOMIC DEVELOPMENT 2024 © OECD 2024
Figure 2.16. Ageing populations will affect almost all OECD countries, albeit to varying degrees
Average projected change in labour market tightness given net working age population change by country, indexed
to 2022.
Note: The figure shows the mean of the projected increase in labour market tightness for 2032 and 2042, relative to 2022 (indexed to 0), for
OECD countries with available data.
Source: OECD elaboration based on Lightcast, the OECD Region and Cities databases and labour force surveys: EU-LFS (including the OECD
accession countries of Bulgaria, Croatia and Romania), UK-LFS, Bureau of Labour Statistics (USA), and Australian Bureau of Statistics.
Most OECD countries will be affected by demographic pressure on labour market tightness. By
2042, in 25 out of the 26 countries for which data is available, the national mean of regional labour market
tightness is expected to increase due to demographic pressure (Figure 2.16). Yet, the degree of this
increase varies greatly across countries. The highest increase is projected to be in Italy, where labour
market tightness is projected to increase by almost 30%, followed by Portugal (24.2%), Spain (22.9%),
and Greece (21.7%). In contrast, Ireland is the only country where demographic change will decrease
labour market tightness in 2042, but the degree is negligible (-0.9%).
Over the next 10 and 20 years, demographic change is projected to lead to increased labour market
tightness in a majority of OECD regions. Labour market tightness will increase by over 5% in 38% of
OECD regions by 2032, and 72% of OECD regions by 2042 (Figure 2.17). Asturias (Spain), Sardinia (Italy),
and Liguria (Italy) are the most affected regions, where labour market tightness in 2042 will be more than
40% higher relative to 2022.
Some regions will experience a notable easing of labour market tightness due solely to
demographic change. For example, in Utah (United States), labour market tightness is projected to
decrease by nearly 14% by 2042, followed by North Dakota (United States) and the Northern Territory
(Australia) with a projected decrease of almost 7% in each. This finding contrasts with the aggregate results
at the OECD and country levels, which found minimal projected decreases in labour market tightness.
Thus, it highlights the diversity of regional demographic structures and challenges.
-5%
0%
5%
10%
15%
20%
25%
30%
Austria
Australia
Belgium
Switzerland
Czechia
Germany
Denmark
Greece
Spain
Finland
France
Hungary
Ireland
Italy
Lithuania
Norway
Poland
Portugal
Sweden
Slovenia
Slovak Republic
United Kingdom
United States
Bulgaria
Croatia
Romania
Change in absolute tightness
(index = 2022)
2032 2042

96
JOB CREATION AND LOCAL ECONOMIC DEVELOPMENT 2024 © OECD 2024
Figure 2.17. Most OECD regions will experience increases in tightness due to demographic change
Projected change in labour market tightness given net working age population change for 2032 (top) and 2042
(bottom), indexed to 2022.
Note: The figure shows the share of regions where the projected change in absolute labour market tightness is over 5%, under 5%, under -5%
and over -5%, for OECD countries with available data. The projected change is shown for 2032 (top) and 2042 (bottom), relative to 2022.
Source: OECD elaboration based on Lightcast, the OECD Region and Cities databases and labour force surveys: EU- LFS (including the OECD
accession countries of Bulgaria, Croatia and Romania), UK-LFS, Bureau of Labour Statistics (USA), and Australian Bureau of Statistics.
Potential policy levers to alleviate labour shortages
Local and national governments can turn to multiple policy levers to mitigate local labour
shortages. This section gives an overview of the key policy areas, namely labour-saving technologies,
supporting the economically inactive, labour market intelligence tools, up- and reskilling, and (im)migration.
For each of these policy areas, this section provides tangible policy examples that contribute to alleviating
labour shortages in OECD regions.
Leveraging labour-saving technologies
In the context of addressing labour shortages, technology presents an opportunity to increase
productivity, enhance job quality, and attract workers to jobs previously considered less desirable
while also recognising the need to mitigate the potential risks of technological change. From Plato
expressed (Frank et al., 2019[24]; Keynes, 1930[25]). While historical fears of a worker-less future have failed
to manifest, evidence does show adverse effects of technological change on some workers. For example,
workers who lose their jobs in mass layoffs including in sectors subject to significant automation
often never recover their previous wage, and some workers and places may be left behind, even as there
Increase >= 5% Increase < 5% Decrease < -5% Decrease >= -5%
0
25
50
75
100
Germany
Italy
Greece
Portugal
Switzerland
Spain
Lithuania
Slovenia
Denmark
Poland
Hungary
Slovak Republic
Finland
Norway
United States
Czechia
France
United Kingdom
Belgium
Sweden
Australia
Ireland
Croatia
Bulgaria
Romania
0
25
50
75
100
Switzerland
Czechia
Germany
Greece
Spain
Finland
Hungary
Italy
Lithuania
Portugal
Slovenia
Poland
Norway
Denmark
France
Belgium
United Kingdom
Slovak Republic
Sweden
United States
Australia
Ireland
Bulgaria
Croatia
Romania
Share of regions (%)

97
JOB CREATION AND LOCAL ECONOMIC DEVELOPMENT 2024 © OECD 2024
is net job growth (Vermeulen and Braakmann, 2023[26]; Autor and Dorn, 2013[27]; Acemoglu and Restrepo,
2019[28]). With regard to artificial intelligence, for example, Generative AI such as Chat-GPT, its impact on
work is difficult to measure. So far, the evidence suggests that the impact of AI on jobs is limited to large
firms experimenting with the technology. Where firms have adopted these technologies, they are reluctant
to fire workers as a first step, opting instead to adjust hiring practices (OECD, 2023[3]; Acemoglu et al.,
2022[29]). In the future, the potential effects remain to be seen but are likely to differ from these early effects,
as the technology will progress and expose a much larger and different pool of workers to its impact
(Eloundou et al., 2024[30]).
The use of AI can help alleviate pressures in industries from healthcare to manufacturing that are
suffering from labour shortages (see Chapter 3). In the healthcare sector, AI technologies focused on
streamlining hospital operations, diagnostic assistance, and nursing practices can free up time for patient
care. In regions experiencing labour shortages in manufacturing, robotic automation can reduce operating
costs significantly, ensure a more optimised production, help avoid injuries and human error, and increase
the quality of output and reduce product defects. Regions with a strong presence of agriculture could also
benefit from AI through precision farming technologies, automated irrigation and pest control, enhancing
crop yields and reducing the need for some types of human skills. Box 2.8 gives examples of industries in
which AI are already used to mitigate labour shortages.
Box 2.8. AI to the rescue: how automation alleviates local labour shortages in manufacturing
and agriculture
Significant labour shortages are evident in both manufacturing and agriculture in countries such as the
United States, jeopardising economic stability, growth and productivity. However, AI can offer a number
of solutions to alleviate labour shortages. For example, robotic automation can enhance efficiency by
handling repetitive tasks in manufacturing, while precision farming and drones can help to maintain crop
yields in agriculture and thereby profitability. Consequently, funding for research and development of
AI and automation in these industries can help address the challenges posed by persistent labour
shortages.
Manufacturing
In manufacturing, AI and robotic automation can enable continuous production, with safer and more
efficient operations, help with heavy material handling and repetitive movements, and facilitate quality
checks (Forbes, 2022[31]; World Economic Forum, 2024[32]). Tool Gauge, an aerospace component
manufacturing company based in Tacoma, Washington, turned to automation to address its labour
shortage when the company needed to hire around 100 new employees who were not available in the
local labour market (International Society of Automation, 2020[33]). As a solution, Tool Gauge instigated
the use of collaborative robots (cobots) to operate repetitive and high-labour applications in its metal
and plastic parts areas. The use of cobots reduced labour needs by 75%, as it only requires one
operator to work with the cobot to produce four hundred units per day (International Society of
Automation, 2020[33]).
Agriculture
crop yields (BBC, 2024[34]). AI can be one way to mitigate these issues. A recent estimate puts the
economic value of AI to US agriculture through labour and input cost savings, and increased crop
yields at USD 100 billion (McKinsey, 2024[35]). Indeed, some estimates show an increase in AI
adoption among US agricultural businesses from 54% in 2018 to 87% in 2022 (RELX, 2021[36]). To

98
JOB CREATION AND LOCAL ECONOMIC DEVELOPMENT 2024 © OECD 2024
By reducing the need to do repetitive tasks, the use of automation and AI allows workers undertake
more valued work, addressing one of the main drivers of the post-COVID-19 rise in labour
shortages: low-paid and low-quality jobs. Studies report that some of the largest recent increase in
labour shortages is observed in industries with difficult work environments (such as Food and Services,
Manufacturing, and Retail Trade), noting that a rise in quit rates accompanies the rise in labour shortages
(Duval et al., 2022[39]; Pizzinelli and Shibata, 2023[40]; Causa et al., 2022[6]; Zwysen, 2023[7]). At the same
time, in firms that are early adopters of the technology, workers report a positive impact on job quality
(OECD, 2023[3]). However, this is likely to be limited to jobs that do not require constant face-to-face human
interactions, excluding some service sector jobs in hospitality, catering, and retail sales, for example.
Where job responsibilities permit, improving job quality through AI could alleviate a contributing factor to
labour market shortages, although special attention must be given to support workers whose jobs are
potentially displaced.
Bringing the economically inactive (back) to the labour market
Local economies can also harness untapped potential in their population by removing barriers to
work for specific groups with low labour force participation. This section focuses on mothers, youths
and elderly people, discussing the reasons for their often-low economic activity as well as policies that
facilitate their return to the labour market.
Women, and in particular mothers, are less likely to work than men of similar age, which is
highlighted by a 15 percentage points lower employment rate among 15-65 year old women (62%)
than among men (77%) in 2022. One reason for this is that mothers often engage more in child care than
fathers, impeding them from taking up paid work. Regional governments can facilitate the return to work
for mothers, by improving the accessibility, affordability, and quality of their early childcare systems
(European Commission, 2023[41]). A study of the 1990s reforms in Spain that led to an expansion of
subsidised childcare for 3-year-olds finds an increase in maternal employment of 9.6% (Nollenberger and
Rodríguez-Planas, 2015[42]). The impact of region-based policy is further evidenced in recent years, as the
-10-a-
with all provinces and territories, with adaptations between them (Box 2.9). This policy was developed with
the aim to bring more women into the labour force. Since its implementation, the labour force participation
among working age mothers with young children has reached a record high of 79.7%. The government is
now making further progress by increasing inclusive access to child care, with funding focused on
underserved communities (Employment and Social Development Canada, 2024[43]).
future labour shortages in the industry. The project is aimed at automising operations, for example
through the use of robot tractors and water management systems that can be operated via
smartphones, thereby reducing the demand for on-farm workers. Additionally, AI-based analysis of
remotely sensed data and weather data taken by drones and satellites improves the accuracy and
efficiency of many aspects of farming, including disease control, water management, and crop
on-farm workers (Ryan, 2023[37]) (Japanese Ministry of Agriculture, 2023[38]).

99
JOB CREATION AND LOCAL ECONOMIC DEVELOPMENT 2024 © OECD 2024
Box 2.9. Unlocking women’s labour force participation: The case of the CAD 10 a day child care
programme
In 2021, the Government of Canada announced CAD 30 billion investments towards affordable
The federal
government negotiated Canada-wide Early Learning and Child Care (ELCC) Agreements with each
province and territory to address their specific needs. These investments also include funding for
Indigenous early learning and childcare through partnerships tables.
• Nunavut, a territory with the smallest population in the country, was the first jurisdiction to
reduce fees to a flat rate of CAD 10-a-day under the federal programme, which resulted in an
82% reduction in parent fees in Iqaluit, on average, the largest fee reduction of any city in
Canada in 2023. Families in Nunavut are now saving up to CAD 14 300 per year, per child.
• In Fall 2024, Newfoundland and Labrador started a new non-standard hours of care trial to
provide family child care services funding for up to 13 hours of extended daytime child care or
up to 13 hours of overnight child care.
• In Manitoba, the Ready-to-Move (RTM) Child Care project offers a collaborative approach to
construct a large number of child care facilities servicing infant and pre-school spaces within
the province under expedited timelines and in areas with a demonstrated child care need. Under
this initiative, RTM construction costs will be fully funded under the Canada-Manitoba Canada-
wide ELCC Agreement in exchange for land, servicing and free rent for the child care operator.
• Ontario, one of the most populous and urbanised provinces, has enrolled 92% of licensed child
care providers in the Canada-wide ELCC program for children aged 0-5 as of June 2024. The
province has implemented a phased approach to reducing parent fees in licensed child care. In
2022, Ontario introduced a fee reduction of up to 25% retroactively by April, reaching a 50%
reduction by the end of the year. Moving forward, Ontario plans to introduce a parent fee cap of
CAD 22 per day for eligible children starting January 1, 2025, with the goal of achieving an
average of CAD 10 per day by 2026.
Preliminary results suggest that these investments in ELCC and jurisdictional adaptations have
likely increased female labour force participation.
Statistics Canada Labour Force Survey continues to show positive trends, including a 79.7% labour
force participation rate among mothers aged 25-54 with young children in 2023, up from 75.9% in 2019.
Source: (Employment and Social Development Canada, 2022[44]) (Government of Newfoundland and Labrador, 2024[45]) (Government of
Manitoba, 2023[46]) (Government of Ontario, 2022[47]) (Employment and Social Development Canada, 2024[43]) (Statistics Canada, 2024[48])
For young economically inactive persons, support programmes can facilitate their labour market
participation. Across OECD countries, 12.6% of young people (15-29 years) were neither in employment,
education, nor training (NEET) in 2022. To reduce the NEET rate, governments in OECD countries run
various programmes that equips youths with job experience and new skills. For example, the Seoul
Metropolitan Government (SMG) in South Korea, under its City of Global Professionals framework, has
made use of several mechanisms to enhance youth employment. These mechanisms include free training
on software development with the aim to reduce job mismatches, and an internship camp to provide on-
the-job experience. In this way, the SMG facilitates the entry of unemployed youths into SMEs, as it actively
connects them with employers, provides professional work experience, and skills training (Seoul
Metropolitan Government, 2024[49]). Additionally, Mexico implemented the programme Youths Building the
Future which provides financial support for apprenticeships, training, and social security for young people

100
JOB CREATION AND LOCAL ECONOMIC DEVELOPMENT 2024 © OECD 2024
(aged 18-29). The programme has to date benefited almost 3 million youths who are on average 2.7 times
more likely to find employment than those who did not participate (Secretaria del Trabajo y Prevision
Social, 2024[50]) (Comision Nacional de los Salarios Minimos and Secretaria del Trabajo y Prevision Social,
2023[51]).
Decentralising the higher education system by opening new higher education institutions (HEIs) in
non-metropolitan regions can have the potential to increase place attractiveness in particular
for young workers and firms. Many youths and young workers in OECD countries migrate from remote
to metropolitan regions, in which educational (and professional) opportunities are often concentrated
(OECD, forthcoming[52]). To counter the out-migration of young people from remote regions, which
economic development, some OECD countries decentralize the education system by strategically placing
new Higher Education Institutions (HEIs) away from metropolitan areas. By opening new HEIs in less
developed regions, governments apart from attracting students also aim at attracting innovative
companies which can recruit directly among the new HEI
turn create new job opportunities for workers in these regions.
To enable HEIs in remote regions to create economic opportunities for workers and firms, their
educational programme needs to reflect the local skills demand. Innovation spillovers between
universities and firms can foster employment and wage growth at the local level (Hausman, 2022[53]). Yet,
bringing these positive dynamics to remote regions, for example by strategically opening new HEIs,
remains challenging. Openings of new HEIs in Italy from 1985 - 2000 and Switzerland between 1997 and
(Cowan and
Zinovyeva, 2013[54]) (Pfister et al., 2021[55]). In Switzerland, especially small and medium-sized enterprises
in regions outside major innovation hubs benefitted. However, a similar policy in Germany in the 1980s
and 1990s shows that newly opened HEIs may mostly benefit already dynamic labour markets (Berlingieri,
Gathmann and Quinckhardt, 2022[56]). For HEIs to contribute to sustained economic development in
adapted the needs of local businesses as Närpes, a small locality in Finland, shows (Box 2.10).
Box 2.10. Answering the needs of business and the local community: The case of vocational
schools in Närpes, Finland
Närpes, a small locality in Western Finland, provides and adapts vocational education that suits
the needs of the local economy, which has been part of the success of its regional
attractiveness. This is achieved as the region closely collaborates with the main businesses, resulting
in a curriculum that includes logistics, metalwork, constructions, and home care, reflecting the needs of
the locality. The educational curriculum is repeatedly adjusted, as evidenced in a recent pilot initiated
with the purpose of satisfying the high demand of welders from the Närpes Trä & Metall (NTM) company.
This pilot study was the result of close collaboration between the school, Närpes municipality and
government which provided funding and the Regional Centre for Economic Development, Transport
and the Environment (ELY-Centre) which developed the pilot. The pilot offered a specialization in
wielding techniques and was designed for 30 people which were filled immediately.
Despite its rather remote location, Närpes has had a positive population inflow over the last
decade, and a 10% higher employment rate in comparison to the national average, partly
attributed to its vocational school approach that answers the needs of business, good
immigration policies, and an efficient healthcare system. The number of people in adult education
has been growing, and most students find a job in the region upon graduating. The customized

101
JOB CREATION AND LOCAL ECONOMIC DEVELOPMENT 2024 © OECD 2024
Older workers also show low labour force participation rates due to the challenges they face in the
labour market. This is evidenced by the fact that, in 2022, only 67.4% of people aged 55-64 participated
in the labour force, compared to 86.4% of adults aged 25-54. Some older workers may struggle to keep
up with technological advancements, such as the ongoing digitalisation of many job tasks, as they are less
likely than younger workers to participate in job-related training. Additionally, employers often perceive
-based pay progression, which is a common human
resources practice (EBRD, 2020[58]) These factors make older workers particularly vulnerable to lay-offs in
work force restructuring (ILO and IFC, 2021[59]), after which they struggle to be reemployed. Japan
addresses some of these issues through its Act on Employment Security of Elderly Persons (AESEP)
(Box 2.11).
Box 2.11. Japan’s Act on Stabilization of Employment of Elderly Persons
Act on Employment Security of Elderly Persons (AESEP)
promotes employment security of older individuals. AESEP prohibits employers from imposing
mandatory retirement under 60 and requires them to take measures that aim at providing job
opportunities for elderly persons up to 70, including continuous employment. Continuous employment
involves allowing workers to retire at the standard retirement age but then rehiring them or extending
their employment under new terms, including adjusted wages. Unlike raising or abolishing the
mandatory retirement age, which continues employment under the same conditions, continuous
employment typically involves a formal retirement followed by re-contracting workers. Wages may
decrease under the new contract depending on the job duties after the re-contracting
Data from 2023 show that 3.9% of firms with 21 or more employees have abolished the mandatory
retirement age, 26.9% have raised the mandatory retirement age, and 69.2% introduced a continuous
employment system as measures to secure employment for elderly persons up to 65. As efforts to
secure job opportunities for elderly persons up to 70, 3.9% abolished the mandatory retirement age,
2.3% have raised the mandatory retirement age, and 23.5% introduced a continuous employment
system. The Ministry of Health, Labour and Welfare also introduced a wage subsidy of up to YEN 500
000 (roughly USD 3 200 in 2024) to employers who improve their employment management systems
for older workers and up to YEN 300 000 (roughly USD 2 000 in 2024) for raising the retirement age
to 65.
Source: (Kajitani, 2023[60]; Ministry of Health, Labour and Welfare of Japan, 2023[61])
The barriers to work for older people also include age-based discrimination (e.g. in the hiring
process), leading to difficulties finding and applying for jobs. To combat age-based discrimination in
for interviews and help overcome the age bias in hiring (OECD, 2019[62]). In an alternative approach, the
Government of Canada promotes awareness initiatives to promote labour force participation of older
individuals by informing employers, unions, and general society about the advantages of recruiting and
retaining older workers. The federal government funded various awareness projects in provinces,
predominantly in Quebec and Prince Edward Island, while other provinces such as Alberta, Nova Scotia,
education system is part of the reason that attracts new workers internally and internationally, as well
as retaining local workers by offering ways to switch into other professions.
Source: (Michael Kull, 2019[57])

102
JOB CREATION AND LOCAL ECONOMIC DEVELOPMENT 2024 © OECD 2024
and British Columbia have implemented their own awareness action plans (Employment and Social
Development Canada, 2018[63]).
Using effective labour market intelligence tools
Labour market intelligence tools can help identify labour shortages and facilitate better matching
between local vacant positions and available workers, including among the unemployed.
Knowledge about current and future trends in the labour market is crucial to anticipate which occupations
and indus
model provides information about labour market trends for occupations and industries. By 2035, it
estimates that France will need to fill roughly 880 000 positions for science and engineering professionals,
consisting of 305 000 new positions and 575 000 workers who will need to be replaced (Cedefop, 2023[64]).
Novel approaches produce timely estimates on regional occupation and skills demand, going
beyond more aggregate information based on employer surveys that usually come with a larger
time lag. While many statistical offices provide estimates of job vacancy rates and the extent of labour
shortages at a rather aggregate level, for example at the industry-level or by firm size, and sometimes for
an entire country, advances in data availability (e.g. from online job postings) and text analysis (i.e. natural
language processing) have given rise to more fine-grained insights. NESTA
innovation agency for social good, provide demand estimates for roughly 100 occupations and their
required skills in 228 UK Travel-to-Work Areas using online job vacancy data. Similarly, Skills Future
Singapore, a government agency, created a Jobs Skills Dashboard with which users can see the most
common hiring companies and industries for a given job title and skill (SkillsFuture Singapore, 2023[65]).
Using online vacancy data, Skills Future Singapore also identifies priority skills for specific industries, such
as the green, digital and care economies (SkillsFuture Singapore, 2024[66]). The Austrian PES launched a
large language model-based AI tool, called Jobinformat (Job Informant), that provides jobseekers with
information on job profiles and related training paths (box 1.20 in chapter 3). Box 2.12 gives additional
examples of innovative approaches used by PESs in OECD countries.
Box 2.12. PES increasingly use labour market intelligence tools to facilitate job matching
New types of labour market data, such as job vacancies, along with advances in statistical and
artificial intelligence (AI) methods, allow PES in many OECD countries to better support job
seekers and employers. More precisely, through the use of novel data sources and AI, PES can
support a larger number of clients in a more personalised manner and with more up-to-date insights.
As of 2024, half of OECD PES augment their services with some form of AI technologies. Yet,
the use cases and tools substantially differ between PES. Matching systems that recommend suitable
job opportunities to job seekers, which are currently used by 20% of OECD PES, are the most common
application. These systems are increasingly competency-based through the use of occupation and skills
taxonomies. Other use cases include the provision of information (e.g. on available services, measures
and benefits), jobseeker profiling tools to better understand their needs (both 17% of PES), and tools
to guide career management and job-search strategies of jobseekers (15% of PES). In recent years,
PES also started supporting employers in creating vacancy postings (20% of PES), for example by
drafting vacancy descriptions and correctly classifying occupations using AI technologies.
The PES in Flanders, Belgium (VDAB), uses the Jobbereik (Job Reach) tool which provides
competencies and transferable skills. Based on data from job vacancies and deep learning, this tool
supports job mobility and transitions. VDAB currently also develops a new functionality which identifies

103
JOB CREATION AND LOCAL ECONOMIC DEVELOPMENT 2024 © OECD 2024
In combination with job-level information on skills requirements, AI and traditional statistical tools
can also steer job seekers towards future career paths that match their skill set. Using online job
vacancy and regional employment data from Italy, the United Kingdom and the United States, (Basauri,
Kleine-Rueschkamp and Vermeulen, 2025 (forthcoming)[68]) identify feasible career transitions based on a
sufficiently high skills overlap between the old and the new job, and the regional availability of the new job
as most workers look for jobs within their region. This framework can guide career transitions from polluting
to neutral and green jobs. The analysis also shows that workers in polluting jobs share between 57% and
86% of skills (depending on the country) with the five closest neutral jobs, on average.
Updating the skills provision to reflect local needs
Labour shortages are also the result of a gap between the skills required by employers and those
available in the workforce, particularly in the context of growing demand for certain skills arising
from megatrends like the green and digital transitions. Vocational education and training (VET) and
adult education can mitigate labour and skills shortages by equipping the workforce with sought-after skills.
Vocational education and training (VET) can provide students with necessary technical skills and
practical experience at the start of their career. VET offers the potential to prepare students for technical
professions, many of which experience shortages, while also facilitating the school-to-work transitions and
offering a pathway to higher education (OECD, 2023[69]; European Commission, 2023[1]). For example,
90% of VET students in Germany pursue studies in the dual system in which trainees split their time
between studying at a vocational school and working at a company, which usually takes around three
years to complete (OECD, 2022[70]). This dual system provides trainees with practical experience and
broadens their employment opportunities (OECD, 2022[70]).
Governments are increasing the attractiveness of VET education, to reduce the shortage of skilled
workers. For example, Germany anticipates a shortage of 240 000 skilled workers in 2026, yet the VET
system experiences high dropout rates of apprentices (26.7% in 2019) and a significant decline in VET
training contract numbers (Affairs, 2022[71]; Cedefop, 2023[72]). In 2022, the German government
introduced the Excellence for VET initiative that addresses these issues through financial support for high-
performing trainees, improved vocational guidance (including digital formats), a push for international
education of trainees, and overall greater promotion of VET programmes (Affairs, 2022[71]). In 2024, Austria
introduced more advanced vocational training cycle (i.e. at the fifth out of eight levels of the European
Additionally, Competentiecheck (Competency check) allows jobseekers to assess whether their skills
are up-to-
competencies. This tool is also designed to provide training and job suggestions for the user.
France Travail, the French PES, uses two versions of an AI-powered tool to help job counsellors
and job seekers navigate available active labour market policies (ALMP) if a job seeker is
unlikely to find a job quickly. Since 2017, job counsellors can use the Mon Assistant Personnel (MAP
My Personal Assistant) tool to obtain individual-specific recommendations for ALMP support and job
learning, machine learning and an expert model), assists job counsellors and allows them to spend time
on other important tasks rather than replacing them. Similarly, jobseekers can access their version of
for services and measures including suitable training opportunities and available workshops (e.g. to
improve their CV and/or interview skills).
Source: (Brioscú et al., 2024[67])

104
JOB CREATION AND LOCAL ECONOMIC DEVELOPMENT 2024 © OECD 2024
Qualifications Framework) to offer further specialization for skilled workers, namely those who have already
completed initial vocational training or have sufficient job experience (Austrian Ministry of Labour and
Economy, 2024[73]). Educational and industry experts as well as social partners are currently designing the
new degrees such that they target the needs of the economy, including green and digital skills.
Governments should adapt their skills and training systems to reflect shortages of skilled workers
at the regional level. For example, Australia has acknowledged VET as key to tackling regional and rural
skills shortages, particularly for nurses, teachers, and engineers (Australian Ministry of Employment and
Workforce Relations, 2023[74]). Since 2018 the French national government establishes regional
Agreements for Investments in Skills), to improve the regional offer of training programmes. The
programmes are designed to equip two million low-skilled jobseekers and youths distant from the labour
market with the skills for regional shortage occupations until 2022 (Box 2.13).
Box 2.13. France adapts its large-scale national skills agenda to regional needs
The French government supports low-skilled youths and the long-term unemployed through the
This policy promotes the
skills development of these target groups by financing both already existing and new training programmes
To provide training (and other support services) to the 2 million planned participants between 2018 - 2022,
PIC received 15 billion Euros in funding (French Ministry of Labour, 2018[75]).
Regional agreements, the Pactes Régionaux d'Investissements dans les Compétences (PRIC),
receive half of the funding and ensure that the training programmes address the regions' needs.
Regions and the national government define the content and the financing of the educational offer in the
PRICs. To do so, regional actors determine the priorities of the training programmes, both in terms of content
and target group, based on available labour market data on employment, (anticipated) recruitment
occupations (France Stratégie, 2018[76]). Regions, which commit to spending at least the same amount as
before the introduction of the PIC in 2017, and the national government share the costs of the training
programmes (French Ministry of Labour, 2018[75]). Regions and the national government currently negotiate
new PRICs for the period 2024-2027.
The PRICs improve the training offer at the regional level via increased capacity of training
programmes and additional measures, such as lowering financial barriers. The Occitanie region
planned to train 20 000 additional youths and job seekers, elevating the number of trained job seekers to
80 000. Additionally, the regional agreement includes remote learning options, the on-the-job training,
information activities in rural urban priority areas, and a labour market observatory to better understand the
costs, financing
877 million EUR and 569 million EUR, respectively (Occitanie Region, 2024[77]). To lower financial barriers,
the majority of regions has put into place financial aid for commuters and child care. The Bretagne,
Normandie, and Pays de la Loire regions have also raised the pay of apprentices (Dares, 2024[78]).
A scientific committee evaluates the training programmes on a regular basis. In their third report,
the committee finds that, relative to 2017, regions that signed a PRIC showed a 48% (+0.73 billion EUR)
increase in training-related expenditure per year on average, and a 44% (+169 000) increase in the
number of participants in 2021. However, regions differ in the effectiveness of their regional agreements
as some regions struggle with a lack of information among potential trainees, competition with other

105
JOB CREATION AND LOCAL ECONOMIC DEVELOPMENT 2024 © OECD 2024
training programmes, training providers selecting among interested individuals, and a lack of
attractiveness of additional training in the context of a tight labour market (Dares, 2022[79]).
Note: An interactive map shows examples of PRIC initiatives around France: https://travail-emploi.gouv.fr/carte-decouvrir-les-initiatives-en-
region-du-plan-dinvestissement-dans-les-competences (accessed on 14 October 2024).
Similarly, the curricula of VET programmes need to be updated to reflect emerging skills demands
for green and digital jobs, thereby mitigating current and future shortages. As part of the European
Green New Deal, many European countries are introducing programmes that aim at redesigning their VET
systems such that they teach the skills required for digital and green jobs (Cedefop, 2024[80]). For example,
Estonia started updating its VET curricula based on labour market monitoring and future skills forecasts
(Cedefop and Refernet, 2023[81]). Furthermore, Austria has adapted the educational content of more than
eighty apprenticeship programmes to the needs of the green and digital transitions in collaboration with
companies and social partners. To this end, it also created new apprenticeship programmes, such as
Climate--
in 2024 (Austrian Ministry of Labour and Economy, 2024[82]). Box 2.14 gives further examples of initiatives
that redesign VET systems to tackle skills shortages.
Box 2.14 Skills for Success: Modernising VET and adult learning towards the twin transition
Regions are redesigning their VET and adult learning systems to equip their workforce with
skills required for the digital and green transitions. This box presents selected educational
programmes, including both public and private initiatives, from OECD regions that equip workers with
the technical skills for green jobs, for example in the renewable energy sector.
The Technical Skills for Harmonised Offshore Renewable Energy project (T-Shore) addresses the
skill shortages in the offshore wind industry by building and strengthening regional partnerships
between VET schools, industry partners and governmental organisations across five countries
spread in northern Europe. Through the six Centres of Vocational Excellence (CoVEs), T-Shore aims to
provide skills and competencies in five countries, through partnerships with 13 partners. This effort also aims
to support regional development by anticipating sector specific skill needs and addressing challenges such
as worker mobility, aging workforces, and the need for reskilling. In Denmark, T-Shore helps with the demand
to retrain workers form industries such as oil and gas towards offshore wind sector. In the Netherlands T-
Shore aimed to address the severe labour market shortages in technical labour, however two CoVEs were
established to better reflect the differences between the focus and development of the North and South
Netherlands. The North emphasizes supported SME in participating in the offshore wind supply chains, with
partners like Noorderpoort and TCNN. In contrast, the South, where the Winddock CoVE was already
established in 2018, focuses on innovation in wind turbine maintenance.
In France, regions are launching specialized training centres through public-private partnerships
focused on green transition roles, such as the new Douvrin Battery Training Centre in the electric
vehicle (EV) sector. The Douvrin Battery Training Centre is a public-private initiative between the region,
the Union of Metallurgies Industries (UIMM) Hauts-de-France and Stellantis, an automotive company. The
Training aims to prepare and retrain active workers and job seekers for EV roles in a 400 hours training
programme. The region plans to train 6 600 workers compared to a projected 20 000 jobs in the EV sector
over the next decade -- to support EV gigafactories and enhance their international competitiveness.
In the Navarra region in Spain, the regional government, in collaboration with the Confederation of
Entrepreneurs and the Navarre Industry Association, set up the Training Centre for Renewable
Energies and Energy Efficiency skills, CENIFER. The aim is to address skills shortages in the region by

106
JOB CREATION AND LOCAL ECONOMIC DEVELOPMENT 2024 © OECD 2024
For experienced workers, governments can foster life-long learning to give workers the opportunity
to adapt to ongoing trends in the labour market. An example of this is RES-SKILL, a European initiative
that seeks to equip current and former coal mining industry workers with the skills needed in renewable
energy jobs, such as solar photovoltaic installers or wind turbine technicians (RES-SKILL, 2024[89]). The
at creating accessible learning
opportunities for adults. The strategy emphasises community-based learning by encouraging local
organisations to offer tailored educational programmes to address community needs. It promotes
partnerships between government, educational institutions, and businesses to develop and deliver relevant
training programmes. This includes addressing digital literacy to ensure all adults can participate in the
digital economy and adapt to technological change (Scottish Government, 2022[90]).
Managing migration to ease labour shortages
Migration policies, through both international immigration and promotion of internal migration, can
serve as a tool for mitigating labour shortages, with OECD countries such as Canada, Australia,
and Germany implementing reforms to facilitate this. Many factors, including the declining working age
population across most OECD countries, increase the shortage of high and low-skilled workers, and third-
country immigration offers an opportunity to increase the number of adequately skilled workers (Kate
Hooper, 2021[91]; Katrin Sommerfeld, 2023[92]). To do this, countries need to look at broadening existing
policies, such as easier visa application processes, better recognition of foreign credentials, and by offering
a clear path to residency or citizenship (Kate Hooper, 2021[91]; Katrin Sommerfeld, 2023[92]).These can be
adapted to the needs of regions that struggle the most with labour shortages.
Some OECD countries implemented regional immigration programs to address labour shortages.
The Canadian Atlantic Immigration Program facilitates the hiring process of skilled immigrants for
(Government of
Canada, 2022[93]; Government of Canada, 2024[94]). This program started as a pilot in 2017 and has since
filled more than 9 800 vacancies in key sectors experiencing shortages including in health care,
manufacturing, accommodations and food services. Over 90% of applicants still live in the region after a
year (Government of Canada, 2022[93]). Following the success of this pilot, Canada has announced new
s that differs in length usually between 420 and 700 hours spread in
an academic year, and some specialization courses include a training module in work centres. It offers a
wide range of courses for professions such as technicians in power plants, water management, thermal and
fluid installations, solar thermal energy. The trainings range from offerings to the unemployed, to specialized
classes offered in the evening to accommodate schedules of those employed.
In the United States, the Workforce Innovation and Opportunity Act (WIOA) Adult Program
supports low-income and low-skilled workers transitioning into high-quality, in-demand jobs
through reskilling and upskilling since 2014.
composed of representatives of local businesses, labour, community-based organizations and higher
education submits a four-year plan that outlines its strategy for service delivery in its workforce
development system. The WIOA funds occupational training and support services, such as employment
search assistance, and child care assistance while in training (US Department of Labor, 2024[83]). In
2022, WIOA supported almost 300 000 participants, of which 130 000 also received training services,
throughout the United States. 72% of participants were in unsubsidised employment one year after exit
from the programme, with a median salary of 8 272 USD among those employed (US Employment and
Training Administration, 2024[84]).
Notes: State-level success indicators for the Workforce Innovation and Opportunity Act can be accessed under
https://www.dol.gov/agencies/eta/Performance/results (15 October 2024).
Sources: (T-Shore, 2024[85]) (Region Hauts-de-France, 2023[86]) (OECD, 2023[12]) (Educacion Navarra, 2024[87]) (CENIFER, 2024[88]) (OECD, 2023[12]).

107
JOB CREATION AND LOCAL ECONOMIC DEVELOPMENT 2024 © OECD 2024
immigration pilots to support rural and Francophone minority communities (Government of Canada,
2022[95]). Australia has implemented a similar regional immigration framework through the Designated Area
Migration Agreements (DAMAs) that allow regional employers to sponsor overseas workers (Australian
Department of Home Affairs, 2024[96]). These agreements are tailored to the specific economic and labour
needs of each region, providing a strategic solution to local shortages by attracting skilled migrants to
underpopulated areas. Similar immigration policies could be implemented in other OECD countries to
tackle labour shortages.
Various OECD countries have introduced direct incentives for internal migration in the form of tax
incentives, housing subsidies, and overall regional development. Such policies can contribute to
mitigating labour shortages in communities facing declining populations by bringing back workers. An
example of such policies is Japan, which projects that by 2040 the population in almost half of its
municipalities will decline by 50% or more. To address this, the government implemented its Regional
Revitalisation Policy. The policy is aimed at managing population decline in affected regions and at
alleviating the concentration of population in the Tokyo area by providing subsidies and incentives to
encourage migration from urban to rural areas (Government of Japan, 2019[97]). This includes support for
business relocations, housing subsidies, and grants for individuals and families moving to less populated
areas (up to YEN 1 million per child) (Government of Japan, 2019[97]). Portugal implemented the Interior
Employment Plus - Supported Mobility for a Sustainable Interior" in 2020, which aims to stimulate the
competitiveness of regions (Government of Portugal, 2020[98]). Through this policy, workers and
teleworkers who move to the interior have access to direct financial support of up to EUR 4 827 including
an additional 20% for each member of the household, and moving costs (Government of Portugal, 2020[98]).
Better systems for the recognition of foreign credentials can mitigate labour shortages through
labour market integration of third-country immigrants. The foreign credential recognition process (or
lack thereof) can be a major roadblock for labour market integration. In Canada, 25.8% of immigrants with
a degree completed outside of Canada were overqualified for their job according to 2021 Census data,
meaning that over a quarter of all immigrants would have the skills to work in more highly skilled
professions (Statistics Canada, 2022[99]). In 2012, Germany introduced the Federal Recognition Act which
facilitated non-EU credential recognition. This reform raised employment in regulated occupations, such
as nurses, by 18.6% among non-EU immigrants. Furthermore, these immigrants did not have lower skills
or receive lower wages than the native-born (Anger, Bessetto and Sandner, 2022[100])
Box 2.15. Building teleworking potential: Ireland, Trento, and The Netherlands Case Studies
Teleworking Strategy in the Autonomous Province of Trento, Italy
Trento implemented a teleworking strategy in 2021 with the goal to lower commuting demands and
expand the talent pool by attracting skilled professionals through teleworking opportunities. To achieve
this, multiple policies have been put in place, including the creation of teleworking spaces in villages by
repurposing buildings and redesigning telecentres. Employers are encouraged to offer flexible work
arrangements through hybrid work to allow less frequent commuting and family-friendly arrangements.
To promote, encourage and share learnings and best teleworking practices, a community of human
resources practitioners has been created.
Ireland’s Rural Development Plan 2021-2025
This plan has been introduced as a post-COVID-19 rural recovery initiative and aims to build the
teleworking potential of rural Ireland. This includes optimising internet infrastructure, supporting rural
employment and careers, improving public services, revitalising towns, and reaching a climate neutral
community. Teleworking is emphasised as it reduces transport emissions, supports local businesses,
and offers opportunities for youth employment in their communities. The plan includes investing in

108
JOB CREATION AND LOCAL ECONOMIC DEVELOPMENT 2024 © OECD 2024
teleworking infrastructure to help people remain living in their communities. The plan looks to achieve
this to by building 400 teleworking facilities, as well as moving 20% of the public sector to remote work
and progressively increasing that percentage. Finally, the plan also explores incentives for relocation
to rural towns by providing funding to local authorities to build a strategy to attract talent.
The Netherland’s Flexible Working Act
Adopted in 2016, this legislation encourages flexible working arrangements. Consistently, several cities
have undertaken their own initiatives aimed at promoting flexible working arrangements, such as
Amsterdam which established the Smart Work Centres as shared office spaces where employees can
work closer to their homes. Other cities such as Leeuwarden and Rotterdam developed initiatives for
flexible work with the objective of decreasing traffic congestion and air pollution. Nation-wide, the act
includes the right to request flexible working hours (allowing for reasoned refusal of the request), and
protections against discrimination. The Flexible Working Act applies to all employees and employers
regardless of the size or type of organisation.
Source: (OECD, 2023[101])
The rise of teleworking offers a parallel to traditional migration policies, delivering similar
economic benefits without the physical relocation of workers. Teleworking has become a common
practice among OECD countries and has the potential to alleviate regional labour shortages by allowing
firms to tap into a broader range of talent (OECD, 2023[101]). This approach can complement traditional
migration strategies, providing a flexible and cost-effective solution to address the growing demand for
skilled workers. However, it is important to note the teleworking potential can vary across regions and
industries, as it is more common in services than in industrial production. Teleworking potential can be
improved by upgrading internet infrastructure, promoting digital skills, fostering automation and
establishing regional or sectoral teleworking agreements (OECD, 2023[101]). Additionally, attracting
teleworkers working for employers elsewhere may not directly address local labour shortages, but can
yield benefits such as increased tax revenue, higher consumption, and expanded professional networks
(OECD, 2023[101]).
Policy recommendations to alleviate labour shortages
In conclusion, governments have various policy options to mitigate regional labour shortages. The following
place-based recommendations aim at easing labour shortages through AI-induced productivity gains,
worker re- and upskilling, talent attraction, support to the economically inactive and the use of labour
market intelligence tools.
• Identify opportunities where AI can drive productivity growth in regions: By building local AI
capabilities, regions can modernise traditional industries, attract new investments, and harness
emerging technologies for sustainable development. This approach can be particularly valuable for
regions facing labour shortages, for example driven by demographic pressure.
• Improve the uptake of AI tools across businesses to reap potential productivity gains:
Businesses may need additional resources to fully utilise AI tools, such as targeted training
programmes, guidance on implementing AI technologies, and workforce retraining. Special
attention should be given to SMEs, which often lag behind in technology adoption, by providing the
support they need to remain competitive in an AI-driven economy.
• Revise regional skill provisions to address workforce needs: Addressing changing skill needs
requires updating the skills provision system to better align with current demands. This includes
109
JOB CREATION AND LOCAL ECONOMIC DEVELOPMENT 2024 © OECD 2024
revising vocational education programmes, expanding access to adult education, and introducing
targeted programmes for critical roles in emerging industries.
• Provide tailored reskilling and employment support for displaced workers: Technological
advancements, such as AI and automation, lead to shifts in the labour market and may cause
worker displacement. Targeted support for these workers, including retraining programs and re-
employment assistance, can help mitigate long-term economic losses and prevent vulnerable
groups and regions from being left behind amid technological changes.
• Expand training opportunities in non-metropolitan areas: Establishing training opportunities in
remote regions can enhance regional attractiveness and help retain young people. By tailoring
these programmes to local skill demands, non-metropolitan areas can provide local businesses
with a skilled workforce and stimulate economic growth.
• Promote regional talent attraction to address labour shortages: Regions can focus on creating
more opportunities to attract skilled workers, such as simplifying administrative processes,
recognising relevant qualifications, and providing clear long-term career pathways. Incentives like
tax benefits, and housing subsidies can also help draw workers to regions with rising labour
demand.
• Increase the participation of hard-to-get groups to alleviate labour shortages: Local
economies can tap into untapped potential by removing barriers to employment for groups with
traditionally low labour force participation, including women (especially mothers), young people,
and older workers. Flexible work arrangements, accessible childcare, targeted training, and
incentives for hiring, can support these groups, fostering inclusivity.
• Increase the use of labour market intelligence tools: Advanced intelligence tools provide timely,
granular data on regional occupations and skills demand, and can help policymakers understand
future needs, as well as the underlying causes of shortages, informing the design of place-based
policies. In PES, AI tools can improve job matching, connecting job seekers and employers more
effectively, and help anticipate labour shortages.
• Foster collaboration with local stakeholders to strengthen policy intelligence: Engaging local
stakeholders, such as employers, educational institutions, and community organisations, provides
valuable, real-time insights that can enhance the effectiveness of workforce policies. Such
collaboration promotes better-informed, widely accepted, and adaptable policies that respond to
regional economic conditions.

110
JOB CREATION AND LOCAL ECONOMIC DEVELOPMENT 2024 © OECD 2024
References
Acemoglu, D. et
Journal of Labor Economics, Vol. 40/S1, pp. S293-S340, https://doi.org/10.1086/718327.
[29]
Acemoglu, D. and P.
Journal of Economic Perspectives, Vol. 33/2, pp. 3-30,
https://doi.org/10.1257/jep.33.2.3.
[28]
Affairs, G. (2022), The Federal Government’s killed labour strategy,
https://www.bmas.de/SharedDocs/Downloads/EN/PDF-Publikationen/skilled-labour-strategy-
pdf.pdf?__blob=publicationFile&v=2.
[71]
Anger, S., J. Bessetto and M.
Occupational Recognition and ImmiInstitute for
Employment and Research, https://doi.org/10.48720/IAB.DP.2211.
[100]
(accessed 22 October 2024), https://immi.homeaffairs.gov.au/visas/employing-and-
sponsoring-someone/sponsoring-workers/nominating-a-position/labour-
agreements/designated-area-migration-agreements.
[96]
Australian Ministry of Employment and Workforce Relations (2023), VET key to tackling regional
skills shortages, https://ministers.dewr.gov.au/oconnor/vet-key-tackling-regional-skills-
shortages (accessed on 22 October 2024).
[74]
Press release (acccessed 22 October 2024),
https://www.bmaw.gv.at/Presse/AktuellePressemeldungen/Verbesserungen-bei-dualer-
Ausbildung.html#:~:text=12.,viele%20M%C3%B6glichkeiten%20und%20Chancen%20blicken
.
[82]
neue
https://www.bmaw.gv.at/European-Year-of-Skills/Newsletter/3-Newsletter-Fachkraefte/2-
Fachkraefte-gesucht/HBB.html.
[73]
Autor, D. and D. -Skill Service Jobs and the Polarization of the
American Economic Review, Vol. 103/5, pp. 1553-1597,
https://doi.org/10.1257/aer.103.5.1553.
[27]
Basauri, A., L. Kleine-Rueschkamp and W. Vermeulen (2025 (forthcoming)), Occupation
proximity: the role of geography and skills in career transitions.
[68]
BBC (2024), US farms are making an urgent push into AI. It could help feed the world,
https://www.bbc.com/worklife/article/20240325-artificial-intelligence-ai-us-agriculture-farming.
[34]
Berlingieri, F., C. Gathmann and M.
SSRN Electronic Journal, https://doi.org/10.2139/ssrn.4168907.
[56]
Boniol, M. et
BMJ Global Health, Vol. 7/6,
https://doi.org/10.1136/bmjgh-2022-009316.
[17]

111
JOB CREATION AND LOCAL ECONOMIC DEVELOPMENT 2024 © OECD 2024
Botelho, V. and M. -19 and retirement decisions of older workers in the
ECB Economic Bulletin, (accessed 22 October 2024),
https://www.ecb.europa.eu/press/economic-
bulletin/focus/2022/html/ecb.ebbox202206_02~67d6677c0e.en.html.
[22]
Brioscú, A. et
OECD Artificial Intelligence Papers 19,
https://doi.org/10.1787/5dc3eb8e-en.
[67]
Causa, O. et -COVID-19 , OECD Economics
Department Working Papers, No. 1721, OECD Publishing, Paris,
https://doi.org/10.1787/e60c2d1c-en.
[6]
https://www.cedefop.europa.eu/en/tools/timeline-vet-policies-europe.
[80]
addres
https://www.cedefop.europa.eu/en/news/germany-excellence-vet-brings-together-new-and-
proven-initiatives-address-skill-shortages.
[72]
Cedefop (2023), Skills Forecast, https://www.cedefop.europa.eu/en/tools/skills-
forecast?t=welcome.
[64]
Cedefop and Refernet (2023), Supporting skills-based approaches, green and digital transitions
in VET, Timeline of VET policies in Europe., https://www.cedefop.europa.eu/en/tools/timeline-
vet-policies-europe.
[81]
CENIFER (2024), Cursos, https://www.cenifer.com/ (accessed on 30 September 2024).
[88]
Comision Nacional de los Salarios Minimos and Secretaria del Trabajo y Prevision Social (2023),
El Efecto del Programa ’’Jovenes Construyendo el Futuro’’,
https://www.gob.mx/cms/uploads/attachment/file/857719/El_efecto_del_programa_JCF_usan
do_datos_de_la_ENIGH_2022.pdf.
[51]
Cowan, R. and N. Research Policy,
Vol. 42/3, https://doi.org/10.1016/j.respol.2012.10.001.
[54]
October 2024), https://dares.travail-
emploi.gouv.fr/sites/default/files/47ec22e2628a32c78402ea15776aa584/Dares_synth%C3%
A8se_%C3%89valuation-d%C3%A9ploiement_PIC_regions%20.pdf.
[78]
https://dares.travail-
emploi.gouv.fr/sites/default/files/616f7a757ed28ba50327277f520ffe2e/Troisi%C3%A8me%20
Rapport%20CS-%20PIC.pdf.
[79]
Davis, O. et -19 affect the labor force participation of older workers in
Journal of Pension Economics and Finance, Vol. 22/4,
https://doi.org/10.1017/S1474747223000045.
[21]

112
JOB CREATION AND LOCAL ECONOMIC DEVELOPMENT 2024 © OECD 2024
Doornik, B., D. Igan and E.
BIS Quarterly Review, https://ideas.repec.org/a/bis/bisqtr/2312f.html.
[9]
Duval, R. et Staff Discussion
Notes, Vol. 2022/001, https://doi.org/10.5089/9798400204340.006.
[39]
OCtober 2024), https://www.ebrd.com/documents/corporate-strategy/report-economic-
inclusion-for-older-workers.pdf.
[58]
Educacion Navarra (2024), Cursos de Especialización,
https://www.educacion.navarra.es/web/dpto/cursos-especializacion (accessed on
30 September 2024).
[87]
EIB (2023), EIB Investment Report 2022/2023 - Resilience and renewal in Europe,
https://doi.org/10.2867/307689.
[16]
Eloundou, T. et Science,
Vol. 384/6702, https://www.science.org/doi/10.1126/science.adj0998.
[30]
-a-day child
https://www.canada.ca/en/employment-
social-development/news/2024/05/supporting-mothers-with-10-a-day-child-care.html.
[43]
Employment and Social Development Canada (2022), $10-a-day child care becoming a reality
for families in Nunavut in December 2022, https://www.canada.ca/en/employment-social-
development/news/2022/11/10-a-day-child-care-becoming-a-reality-for-families-in-nunavut-in-
december-2022.html.
[44]
https://www.canada.ca/en/employment-
social-development/corporate/seniors-forum-federal-provincial-territorial/labour-force-
participation.html.
[63]
European Commission (2023), Employment and Social Developments in Europe: Addressing
Labour Shortages and Skills Gaps in the EU, https://doi.org/10.2767/089698.
[41]
European Commi
https://ec.europa.eu/commission/presscorner/detail/en/ip_23_5732.
[1]
European Commission (2022), 5 digital solutions for a greener Europe, https://joint-research-
centre.ec.europa.eu/jrc-news-and-updates/5-digital-solutions-greener-europe-2022-07-05_en
(accessed on 22 October 2024).
[15]
European Labour Authority (2022), Report on labour shortages and surpluses,
https://doi.org/10.2883/67288.
[4]
Eurostat (2024), ICT specialists in employment,
https://ec.europa.eu/eurostat/cache/metadata/en/isoc_skslf_esms.htm (accessed on
22 October 2024).
[13]

113
JOB CREATION AND LOCAL ECONOMIC DEVELOPMENT 2024 © OECD 2024
Forbes (2022), The Labor Shortage Is Killing American Manufacturing. Here’s How AI Can Bring
It Back To Life, https://www.forbes.com/sites/glenngow/2022/08/28/the-labor-shortage-is-
killing-american-manufacturing-heres-how-ai-can-bring-it-back-to-life/.
[31]
France Stratégie (2018), Élaboration des Pactes régionaux d’investissement dans les
compétences : sources et usages des données,
https://www.strategie.gouv.fr/sites/strategie.gouv.fr/files/atoms/files/fs-2018-vademecum-
19juillet-final_web.pdf (accessed on 22 October 2024).
[76]
Frank, M. et al. (2019),
Proceedings of the National Academy of Sciences, Vol. 116/14, pp. 6531-6539,
https://doi.org/10.1073/pnas.1900949116.
[24]
French Ministry of Labour (2018), Pactes régionaux d’investissement dans les compétences,
https://travail-emploi.gouv.fr/les-pactes-regionaux-dinvestissement-dans-les-competences
(accessed on 22 October 2024).
[75]
Gayer, C. et al. (2024), Vulnerabilities of the labour market: A new survey-based measure of
labour hoarding in the EU, https://cepr.org/voxeu/columns/vulnerabilities-labour-market-new-
survey-based-measure-labour-hoarding-eu (accessed on 16 July 2024).
[8]
Government of Canada (2024), Atlantic Immigration Program,
https://www.canada.ca/en/immigration-refugees-citizenship/services/immigrate-
canada/atlantic-immigration.html (accessed on 22 October 2024).
[94]
Government of Canada (2022), Launching the Atlantic Immigration Program to drive economic
growth and attract skilled workers, Government of Canada,
https://www.canada.ca/en/immigration-refugees-citizenship/news/2022/03/launching-the-
atlantic-immigration-program-to-drive-economic-growth-and-attract-skilled-workers.html
(accessed on 22 October 2024).
[93]
Government of Canada (2022), Rural and Northern Immigration Pilot,
https://www.canada.ca/en/immigration-refugees-citizenship/services/immigrate-canada/rural-
northern-immigration-pilot.html (accessed on 22 October 2024).
[95]
Government of Japan (2019), Regional Revitalization Paves the Way for the Future of Japan,
https://www.gov-online.go.jp/eng/publicity/book/hlj/html/201905/201905_01_en.html
(accessed on 22 October 2024).
[97]
Government of Manitoba (2023), Ready-to-Move (RTM) Child Care Project,
https://www.gov.mb.ca/education/childcare/resources/rtm.html.
[46]
Government of Newfoundland and Labrador (2024), Governments of Newfoundland and
Labrador and Canada Announce Early Learning and Child Care Action Plan, More than
10,000 Spaces Now Operating at $10-a-day or Less in the Province,
https://www.gov.nl.ca/releases/2024/education/0809n02/#:~:text=The%20ministers%20also%
20announced%20the%20province%E2%80%99s%20new%20Non-
Standard,up%20to%2013%20hours%20of%20overnight%20child%20care.
[45]
Government of Ontario (2022), Canada-Ontario early years and child care agreement,
https://www.ontario.ca/page/canada-ontario-early-years-and-child-care-agreement.
[47]

114
JOB CREATION AND LOCAL ECONOMIC DEVELOPMENT 2024 © OECD 2024
Press release (accessed on 22 October 2024),
https://www.portugal.gov.pt/pt/gc22/comunicacao/comunicado?i=candidaturas-a-medida-
emprego-interior-mais-disponiveis.
[98]
Groiss, M. and D.
SSRN Electronic Journal, https://doi.org/10.2139/ssrn.4623034.
[5]
Hausman, Review of Economics
and Statistics, Vol. 104/4, https://doi.org/10.1162/rest_a_01027.
[53]
ILO and IFC (2021), Managing Transitions and Retrenchments Guidelines,
https://www.ilo.org/media/385161/download (accessed on 22 October 2024).
[59]
International Society of Automation (2020), Collaborative robots save production costs,
https://www.isa.org/intech-home/2020/may-june/features/collaborative-robots-save-
production-costs.
[33]
Japanese Ministry of Agriculture, F. (2023), Development of Smart Agriculture,
https://www.maff.go.jp/e/policies/tech_res/smaagri/attach/pdf/Promotion_of_Smart_Agricultur
e.pdf (accessed on 22 October 2024).
[38]
Kajitani,
Japan Labor Issues, Vol. 7/42,
https://www.jil.go.jp/english/jli/documents/2023/042-02.pdf.
[60]
Kate Hooper (2021), Labor Shortages during the Pandemic and Beyond: What Role Can
Immigration Policy Play?, Migration Policy Institute,
https://www.migrationpolicy.org/news/labor-shortages-pandemic-immigration-policy-role
(accessed on 22 October 2024).
[91]
Katrin Sommerfeld (2023), Tailoring Migration Policies to Address Labour Shortages, ZEW
Policy Brief, https://ftp.zew.de/pub/zew-docs/policybrief/en/pb05-23.pdf.
[92]
Keynes, Revisiting Keynes,
https://doi.org/10.7551/mitpress/9780262162494.003.0002.
[25]
McKinsey (2024), From bytes to bushels: How gen AI can shape the future of agriculture,
https://www.mckinsey.com/industries/agriculture/our-insights/from-bytes-to-bushels-how-gen-
ai-can-shape-the-future-of-agriculture (accessed on 22 October 2024).
[35]
Michael Kull (2019), NÄRPES IN FINLAND: Where “Green Growth” contributes to attractive and
inclusive development, for and with the people, Nordregio, https://nordregioprojects.org/wp-
content/uploads/2020/03/Narpes.pdf.
[57]
Ministry of Health, Labour and Welfare of Japan (2023), Age of the 100-Year Life-Current State
of Employment Measures for the Elderly,
https://www.mhlw.go.jp/content/10500000/001086776.pdf (accessed on 22 October 2024).
[61]
Nollenberger, N. and N. Rodríguez--time universal childcare in a context of
low maternal employment: Quasi-experimentLabour Economics,
Vol. 36, pp. 124-136, https://doi.org/10.1016/j.labeco.2015.02.008.
[42]

115
JOB CREATION AND LOCAL ECONOMIC DEVELOPMENT 2024 © OECD 2024
Occitanie Region (2024), Pacte régional d’investissement dans les compétences entre l’État et la
Région Occitanie, https://www.laregion.fr/Pacte-regional-d-investissement-dans-les-
competences-entre-
l#:~:text=En%20r%C3%A9gion%20Occitanie%2C%20le%20Pacte,plus%20de%2080%2000
0%20personnes. (accessed on 22 October 2024).
[77]
OECD (2024), OECD Economic Outlook, Interim Report February 2024: Strengthening the
Foundations for Growth, OECD Publishing, Paris, https://doi.org/10.1787/0fd73462-en.
[14]
OECD (2024), OECD Employment Outlook 2024: The Net-Zero Transition and the Labour
Market, https://doi.org/10.1787/ac8b3538-en.
[2]
OECD (2024), OECD Regions and Cities databases, http://oe.cd/geostats (accessed on
26 February 2024).
[23]
OECD (2023), Education at a Glance 2023: OECD Indicators, OECD Publishing, Paris,
https://doi.org/10.1787/e13bef63-en.
[69]
OECD (2023), Employment Outlook 2023: Artificial Intelligence and the Labour Market, OECD
Publishing, Paris, https://doi.org/10.1787/08785bba-en.
[3]
OECD (2023), Job Creation and Local Economic Development 2023: Bridging the Great Green
Divide, OECD Publishing, Paris, https://doi.org/10.1787/21db61c1-en.
[12]
OECD (2023), OECD Regional Outlook 2023: The Longstanding Geography of Inequalities,
OECD Publishing, Paris, https://doi.org/10.1787/92cd40a0-en.
[20]
OECD (2023), -
, OECD Local Economic and Employment Development (LEED) Papers,
No. 2023/18, OECD Publishing, Paris, https://doi.org/10.1787/ea8dc114-en.
[101]
OECD (2022), OECD Regions and Cities at a Glance 2022, OECD Publishing, Paris,
https://doi.org/10.1787/14108660-en.
[19]
OECD (2022), The Landscape of Providers of Vocational Education and Training, OECD
Reviews of Vocational Education and Training, OECD Publishing, Paris,
https://doi.org/10.1787/a3641ff3-en.
[70]
OECD (2020), Job Creation and Local Economic Development 2020: Rebuilding Better, OECD
Publishing, Paris, https://doi.org/10.1787/b02b2f39-en.
[18]
OECD (2019), Working Better with Age, Ageing and Employment Policies, OECD Publishing,
Paris, https://doi.org/10.1787/c4d4f66a-en.
[62]
OECD (forthcoming), Regions and Cities at a Glance 2024.
[52]
Pfister, C. et Research
Policy, Vol. 50/4, https://doi.org/10.1016/j.respol.2021.104197.
[55]
Pizzinelli, C. and I. -19 induced labor market mismatch? Evidence
Labour Economics, Vol. 81,
https://doi.org/10.1016/j.labeco.2023.102329.
[40]

116
JOB CREATION AND LOCAL ECONOMIC DEVELOPMENT 2024 © OECD 2024
Region Hauts-de-France (2023), Douvrin : la Région inaugure un centre de formation aux
métiers de la batterie, https://www.hautsdefrance.fr/battery-training-center/ (accessed on
30 September 2024).
[86]
RELX (2021), RELX Emerging Tech Executive Report, https://stories.relx.com/relx-emerging-
tech-2021/index.html.
[36]
RES-SKILL (2024), RES-SKILL project, https://res-skill.eu/index.php/uber-res-skill/ (accessed on
26 February 2024).
[89]
Ryan, M. (2023), Labour and skills shortages in the agro-food sector, OECD Publishing, Paris,
https://doi.org/10.1787/ed758aab-en.
[37]
Scottish Government (2022), Adult learning strategy 2022 to 2027,
https://www.gov.scot/binaries/content/documents/govscot/publications/strategy-
plan/2022/05/adult-learning-strategy-scotland-2022-27/documents/adult-learning-strategy-
scotland-2022-2027/adult-learning-strategy-scotland-2022-2027/govscot%3Adocument/adult-
le (accessed on 22 October 2024).
[90]
Secretaria del Trabajo y Prevision Social (2024), Jovenes Construyendo el Futuro,
https://jovenesconstruyendoelfuturo.stps.gob.mx/ (accessed on 22 October 2024).
[50]
Seoul Metropolitan Government (2024), A Global City of Professionals,
https://english.seoul.go.kr/policy/economy/a-global-city-of-professionals/ (accessed on
22 October 2024).
[49]
SkillsFuture Singapore (2024), Skills demand for the future economy 2023/24,
https://www.skillsfuture.gov.sg/docs/default-source/skills-report-2023/sdfe-2023.pdf.
[66]
SkillsFuture Singapore (2023), Jobs-Skills Dashboard,
https://public.tableau.com/app/profile/skillsfuturesg/viz/JobsSkillsTalentInsight-
SDFE_17001475553270/Overview (accessed on 22 October 2024).
[65]
Statistics Canada (2024), Labour Force Survey,
https://www23.statcan.gc.ca/imdb/p2SV.pl?Function=getSurvey&SDDS=3701 (accessed on
22 October 2024).
[48]
Statistics Canada (2022), Canada leads the G7 for the most educated workforce, thanks to
immigrants, young adults and a strong college sector, but is experiencing significant losses in
apprenticeship certificate holders in key trades, https://www150.statcan.gc.ca/n1/daily-
quotidien/221130/dq221130a-eng.htm (accessed on 22 October 2024).
[99]
T-Shore (2024), 2022-2024 Impact Report, https://t-shore.eu/wp-content/uploads/2024/09/T-
shore_WP6_D6.2_Impact-Report-2024.pdf (accessed on 30 September 2024).
[85]
Tsvetkova, A. et
English speaking countries? Benchmarking Lightcast data against statistical sources across
, OECD LEED Papers, OECD, Paris,
https://doi.org/10.1787/c17cae09-en.
[10]
US Department of Labor (2024), Workforce Innovation and Opportunity Act,
https://www.dol.gov/agencies/eta/wioa (accessed on 22 October 2024).
[83]

117
JOB CREATION AND LOCAL ECONOMIC DEVELOPMENT 2024 © OECD 2024
US Employment and Training Administration (2024), WIOA Performance Report,
https://www.dol.gov/sites/dolgov/files/ETA/Performance/pdfs/PY2022/PY%202022%20WIOA
%20National%20Performance%20Summary.pdf (accessed on 22 October 2024).
[84]
Vermeulen, W. and N. -offs affect reg,
OECD Local Economic and Employment Development (LEED) Papers, No. 2023/01, OECD
Publishing, Paris, https://doi.org/10.1787/99d48aeb-en.
[26]
Vermeulen, W. and F. national
sources in European countries? Benchmarking Lightcast data against statistical and labour
, OECD LEED Papers, OECD, Paris,
https://doi.org/10.1787/e1026d81-en.
[11]
World Economic Forum (2024), 6 ways to unleash the power of AI in manufacturing,
https://www.weforum.org/agenda/2024/01/how-we-can-unleash-the-power-of-ai-in-
manufacturing/.
[32]
Zwysen, W. (2023), Labour shortages-turning away from bad jobs Policy recommendations,
https://www.etui.org/sites/default/files/2023-04/Labour%20shortages-
turning%20away%20from%20bad%20jobs_2023.pdf (accessed on 22 October 2024).
[7]
Notes
1 Tradeable services consist of the ISIC 1-digit industries wholesale and retail trade; repair of motor
vehicles and motorcycles (G); Transportation and storage (H); Accommodation and food service activities
(I); Information and communication (J); Financial and insurance activities (K); Real estate activities (L);
Professional, scientific and technical activities (M); Administrative and support service activities (N).
2 Regions with the highest and lowest ICT jobs shortages are, respectively, the top and bottom ICT jobs
following paragraph.
3
https://ec.europa.eu/eurostat/cache/metadata/en/isoc_skslf_esms.htm#:~:text=216)%2C%20Eurostat%2
0defines%20ICT%20specialists,main%20part%20of%20their%20job%22. (as of 4 July 2024).

118
JOB CREATION AND LOCAL ECONOMIC DEVELOPMENT 2024 © OECD 2024
Automation technologies can augment labour productivity but can also serve
as a substitute for people by automating functions entirely. In the past, the
geography of this impact has been stronger in semi-urban and rural areas.
Generative AI, an emerging form of AI, may represent a new leap in
technology and is impacting higher-skilled jobs located in urban areas. While
the full extent of its impact is still uncertain, the effects on jobs or skills will
likely be context- and place-specific. This chapter explores both the observed
and anticipated impacts of AI technologies as they mature and achieve
widespread adoption. It provides novel regional estimates to contrast
previous forms of automation technologies with Generative AI and the
geography of those impacts. Furthermore, it analyses which sectors and
types of jobs might be most transformed, zooming in on specific occupations.
Finally, it discusses possible actions going forward that could help regions
seize new opportunities and manage the challenges AI poses.
3 Beyond automation: Decoding the
impact of Generative AI on regional
labour markets

119
JOB CREATION AND LOCAL ECONOMIC DEVELOPMENT 2024 © OECD 2024
In Brief
Generative AI has the potential to affect a wide range of high-skilled workers in
OECD regions, including many who have historically been less affected by
technology.
AI has the potential to transform local labour markets by boosting productivity, creating or destroying
jobs, and changing the very nature of some jobs, including job quality. This chapter examines exposure
to automation technologies across regional labour markets in OECD regions, exploring the potential
effects on job creation and productivity, as well as their distribution across different regions, industries,
and workers.
• Generative AI will likely have a much wider labour market impact than other recent digital
technologies, affecting a broader group of people and places. Digital technologies that
predate Generative AI had a narrower focus, being designed to excel in one or few specific
tasks. Generative AI, on the other hand, excels at many tasks. Around a quarter of workers are
exposed to Generative AI, meaning 20% (or more) of their job tasks could be done in half the
time with the help of Generative AI, but this figure ranges from 13% to 48% across regions.
• As Generative AI tools find greater adoption and integration with existing software,
exposure to Generative AI could exceed 90% of workers in some regions. As new software
is developed or integrated with Generative AI technologies, over 70% of OECD workers could
be exposed, with almost 40% being highly exposed (meaning at least 50% of their job tasks
could be done in half the time with the help of Generative AI). Metropolitan regions, such as
Greater London (United Kingdom), Prague (Czechia) or Zurich (Switzerland), are expected to
be significantly more exposed than less urban regions. Within countries, the most affected
regions are around 60% more exposed than the least affected regions. Furthermore, in some
countries such as Colombia, the top region is expected to be three times more exposed than the
least affected region. These strong regional disparities can be explained in large part by
differences in industrial composition, as regions with a focus on services, such as education,
healthcare, Information and communication technology (ICT), and finance, are most exposed to
Generative AI.
• Regions previously considered to be at comparatively low risk of automation are the most
exposed to Generative AI. While previous automation technologies, including other forms of
AI, affected mostly non-metropolitan and manufacturing regions, Generative AI has the potential
to alter a significantly higher share of jobs in metropolitan regions and cities. On average, 32%
of workers in urban areas are exposed to Generative AI, compared to 21% in non-urban regions.
Furthermore, this gap can exceed 17 percentage points in some countries such as Colombia,
Greece, and Romania. A similar reversal becomes evident when analysing worker exposure by
gender and education level. Exposure to Generative AI is greater for high-skilled workers and
women, while previous technologies mainly affected low-skilled workers and men.
• While the exact effects of Generative AI on the geography of job creation and
displacement remain to be seen, little evidence exists on technology-led automation
leading to mass job destruction. Instead, empirical results link automation technologies in
regional labour markets with regional productivity growth. A small but significant number of
regions across the OECD have experienced automation-led job displacement in the last decade.

120
JOB CREATION AND LOCAL ECONOMIC DEVELOPMENT 2024 © OECD 2024
In these regions, job displacement was outpaced by the creation of new jobs.
Nevertheless, there is no assurance that these new jobs went to the workers that lost their jobs
and could instead have been taken up by, for example, new workers entering the labour force.
There is no reason to believe that the full effects of automation technology adoption have been
realised, which means regional labour markets may still see further impact.
• AI technologies could offer OECD regions a strategic tool to address critical economic
and labour market challenges, including labour shortages, stagnant labour productivity
growth, or workforce inclusivity. AI technologies can be leveraged to supplement workers,
helping to ease labour shortages and the effects of an ageing workforce. The same technologies
that threaten some jobs can help regions access untapped talent in low-skilled workers or
workers with disabilities for whom many jobs were previously out of reach. If used to augment
ur productivity growth.
However, training and upskilling will be required, with 61% of European workers believing that
they will need new knowledge and skills to cope with the impact of AI tools on their work.
• Although Generative AI holds potential to improve labour productivity and job
satisfaction, it also poses risks for workers. On the one hand, Generative AI can allow
workers to perform tasks quicker and with greater accuracy, automating routine tasks and
freeing up time for more meaningful work. On the other hand, practices such as algorithmic
management raise questions about impact on job quality, along with concerns about privacy
and potential biases in AI systems. Collaboration with social partners and establishing clear,
transparent guideline
• To harness the benefits of Generative AI and address its potential risks, regions should
adopt data-driven, place-specific solutions that foster workforce adaptation. This includes
identifying opportunities for AI-driven growth, updating skills provision systems, and developing
comprehensive skills inventories to address mismatches and prepare workers for new demands.
Supporting SMEs in AI adoption, fostering collaboration with local stakeholders, and providing
tailored support for displaced workers are also key to sustainable and equitable regional
development amid technological changes.
Technological progress and AI: The future of local labour markets
Technological progress has been an important driver of economic development. In many cases,
such progress has had direct labour market consequences, with implications for firms, workers,
and the skills required in many jobs. Generative Artificial Intelligence (Generative AI)1 is one of the latest
waves of innovation in Artificial Intelligence (AI) and has captured the attention of people around the world.
Progress in AI, with its easy access, practical use and showcased applications, has become highly tangible
for a much larger proportion of the population. Yet, the current state of Generative AI might only be the
start, with companies around the world working on further applications. While the adoption of Generative
AI might provide tangible benefits for its users, the exact impact on workers, firms, and different
communities are yet to fully materialise. One major concern is the potential for job displacement through
task automation.
The discussion around the effects of automation encompasses both positive and negative aspects,
including job losses, greater productivity, and overall economic growth. In broad terms, the concept
of automation can be understood as the application of technology to achieve outcomes with minimal human
input (Box 3.1). In assessing its impact, on the one hand, there is automation anxiety (Akst, 2013[1]) which
121
JOB CREATION AND LOCAL ECONOMIC DEVELOPMENT 2024 © OECD 2024
is the real concern that technology will lead to the loss of jobs. On the other hand, automation can lead to
productivity gains, thus possibly translating into higher incomes for workers.
In the past, new technologies have impacted regions and groups of people differently, and this
uneven development is expected to continue. As new technologies spread throughout the economy,
they often become concentrated in specific geographical areas, influenced by factors such as
infrastructure, culture, natural resources, institutions, industrial composition, and workforce skill
composition, among other regional characteristics.
One of the main motivations for adopting AI and automation technologies is to increase
productivity while reducing labour costs. Firms using AI tend to be, on average, more productive than
other firms (Calvino and Fontanelli, 2023[2]). For instance, studies show that robot adoption in Spanish
firms can result in productivity gains of 2025% within four years, a reduction of the labour cost share by
57 percentage points, and net job creation of 10% (Koch, Manuylov and Smolka, 2021[3]). One
explanation for these findings is that automated firms become more productive and competitive, which
allows them to lower product prices, gain market share, and ultimately increase labour demand (Banco de
España, 2023[4]; Aghion et al., 2022[5])
However, productivity gains do not solely materialise through the adoption of new technology.
Instead, these gains often come from a combination of factors, including how well the technology works
alongside other digital technologies, its workers skills), and overall economic
policy. Firms with better access to key technical, managerial, and organisational skills have benefitted
more from digital technologies than other firms. These varied impacts are relevant to other topics in this
report, as technologies can address labour shortages, introduce new challenges related to digitalisation,
drive the need for upskilling among workers, and influence overall employment levels, among others.
(OECD, 2019[6]).
The actual impact of new technologies on regional labour markets and workers will likely be more
nuanced than scenarios of mass job losses or significant productivity gains. Furthermore, labour
market impacts may not be evenly distributed, may interact with each other, and potentially be felt
disproportionately by specific groups of workers. For example, automation can lead to job polarisation and
wage inequality (Acemoglu and Loebbing, 2022[7]), job losses concentrated within some sectors of the
economy and particularly among workers with lower education (Georgieff and Milanez, 2021[8]), or reduce
the quality of jobs even if the quantity is not affected (Autor, 2015[9]).
As technologies evolve, they often transform job roles and thus local labour markets, rendering
some jobs unrecognisable from their previous iterations or giving rise to entirely new occupations.
Bank tellers serve as a pertinent illustration of this phenomenon. As automated teller machines (ATMs)
were introduced in the 1970s, their widespread adoption accelerated notably throughout the 1990s and
2000s. Nevertheless, human bank tellers as an occupation did not disappear (although their share in the
US economy did decline). While the number of bank tellers per bank decreased, the number of banks
increased in parallel due to lower operating costs (Bessen, 2015[10]). This allowed banks to expand their
urban branches by 43% and focus on customer needs that machines could not address, particularly small
business clients who may have previously been overlooked. Overall, the tasks carried out by bank tellers
expanded to encompass soft skills more akin to those of salespersons.
Although the labour market impacts of technology and automation are a main topic of concern,
knowledge regarding the effects of Generative AI remains limited. Given this recent wave of
technology, research on the subject is sparse, with most existing studies predominantly focusing on a
single country. Furthermore, empirical work has so far mainly neglected subnational differences, resulting
in a gap in our understanding of variations across regional labour markets. This chapter presents new
evidence on the geographic distribution of exposure to Generative AI, addressing a significant data gap
and examining how the labour market impacts of this latest advancement differ from previous technologies.

122
JOB CREATION AND LOCAL ECONOMIC DEVELOPMENT 2024 © OECD 2024
The following sections explore and discuss the impact of modern digital technologies, at least
some of which can be categorised as AI, on local labour markets and workers. These technologies
can be grouped based on both the scope of tasks they perform and the ease of accessibility to the user.
First, an overview of the different technologies involved in automation and AI is provided. Next, a set of
empirical estimates on risk of automation and exposure to Generative AI in OECD regions is presented
and discussed. The last section addresses policy-relevant issues aimed at helping regions harness the
benefits of new technologies, mitigate associated risks, and leverage AI to both tackle labour market
challenges and enhance the work of the public administration, including public employment services (PES).
Understanding the foundations: AI, automation, and labour market dynamics
AI developments over the last decades: Narrow-purpose technologies
AI encompasses various technologies some of which have been around for decades and has
seen remarkable advancements in the 2010s. In fact, AI development dates back to the early days of
computers, with foundational work such as the 1943 perceptron model (McCulloch and Pitts, 1943[11])
leading to today's neural network models a - centrepiece of modern AI technology. AI progress in the latter
half of the 20th century and in the early 21st century has been marked by periods of advancement but also
setbacks (Anyoha, 2017[12]). Over the last 15 years, this sector has boomed with deep learning, for
example, being named one of 10 breakthrough technologies in 2013.2 These technical advancements
have powered the gears behind major new technologies such as image recognition (with applications
ranging from medical imaging to crop monitoring), text and speech recognition, or language translation
among others.
Box 3.1. Automation involves an ever-growing set of technologies
Automation can be understood as the application of technology to achieve outcomes with minimal
human input. Automation technologies encompass then a large set of technologies, including digital
technologies which include both conventional and AI powered software, which may or may not be
Generative AI and mechanical systems, among others (Figure 3.1).
The use of technology most commonly leads to the automation of specific work tasks and only
rarely leads to the automation of entire jobs (Bonney et al., 2024[13]). A given job can be understood
as a set of diverse tasks carried out by the worker. While technology adoption has led to the disappearance
or creation of jobs, it typically replaces specific tasks within a job rather than eliminating the entire job. In
other words, automation technologies can potentially displace tasks, not jobs. Nevertheless, technology-
led task automation may still lead to job losses (typically productivity enhancing) as, with the use of
technology, one worker can do the work that previously required several workers, which may prompt
employers to scale down their labour force.
It is useful to classify automation-related technologies based on their format, scope of application,
and accessibility. Figure 3.1 illustrates a non-exhaustive classification of technologies associated to task
automation, along with examples. Mechanical technologies refer to physical technologies that provide
engineering solutions for human tasks, with robotics and various manufacturing technologies being
prominent examples. Digital technologies involve the use of computers and range from simple software,
such as email clients and text editors, to conversational AI platforms such as ChatGPT. Although
technology groups are visualised as separate, these are often used together as, for example, delivery
robots might use image recognition software to navigate their environment. However, the technology

123
JOB CREATION AND LOCAL ECONOMIC DEVELOPMENT 2024 © OECD 2024
groupings presented serve as an intuitive and broad illustrative classification, though they are not
exhaustive.
Figure 3.1. Automation technologies involve a large set of technologies with varied degrees of
generality
Examples of digital and mechanical technologies
Note: Although categories are illustrated as separate, some technologies might fit into more than one group depending on their specific
application.
Source: OECD elaboration.
AI technologies can in turn be classified based on the context of their development, their inputs
and outputs, the specific underlying model or the economic context they are deployed in. The
OECD Framework for the Classification of AI systems (OECD, 2022[14]) provides a structure to
characterise the application of an AI system deployed in a specific project and context (Figure 3.2). The
framework allows for a systematic characterisation of AI systems across various dimensions. In this
context, it is both relevant and practical to classify Generative AI technologies as distinct from earlier AI
technologies. This distinction arises, at least in part, from the varying degrees of generality among AI
technologies.

124
JOB CREATION AND LOCAL ECONOMIC DEVELOPMENT 2024 © OECD 2024
Figure 3.2. Key high-level dimensions of the OECD Framework for the Classification of AI Systems
Characteristics per classification dimension and key actor(s) involved
Note: Actors are illustrative, non-exhaustive and notably relevant to accountability.
Source: (OECD, 2022[14]).
The degree of generality of an AI system refers to its ability to perform several tasks including
ones for which it was not initially trained. While there is no single indicator of generality, several criteria
in this framework can indicate generality when combined (OECD, 2022[14]) such as the (1) scale of the AI
system, (2) its model development/maintenance and (3) its ability to combine tasks and actions into multi-
task, composite systems.
Generative AI significantly differs from previous AI systems in at least these three criteria,
indicating a higher degree of generality. First, the training datasets behind Generative AI models are
larger than most if not all previous AI models and are only getting larger (Epoch, 2024[15]). Second, these
models can be universal, customisable or tailored depending on the needs and budget of its user, and in
practice the most popular platforms have universal models which are free to use and widely available.
Third, by themselves or when integrated with other technologies, Generative AI systems can combine
many tasks, at least as many as previous technologies.

125
JOB CREATION AND LOCAL ECONOMIC DEVELOPMENT 2024 © OECD 2024
Technology, either AI or non-AI, designed to solve specific problems or address specific work
tasks can be grouped in the category of narrow-purpose technologies (Box 3.1). Such models and
technologies have in common, at their core, their ability to perform strongly in one or few specific tasks.
Therefore, their scope is limited, as one technology is unable to generalise its knowledge to different,
unrelated tasks outside of its designed purpose. For example, an algorithm might recognise tumours in
medical images better and faster than a qualified doctor, but it may not be able to recognise other
symptoms, describe what a tumour is or suggest a treatment. Moreover, narrow-purpose technologies
have not been accessible to a wide range of users, at least in part because they were not originally
designed for a broad audience.
The impact of AI in the labour market is expected to shift as new frontier technologies are adopted.
The labour market impacts of narrow-purpose technologies tend to align with the specific and limited scope
of the technology, affecting mostly low-skilled workers within certain primary or resource-based industries.
Nevertheless, recent advancements in AI have broadened the capabilities of digital technologies into a
growing set of cognitive non-routine tasks which is not limited to the initial intended use of the technology.
Therefore, the labour market impacts of these new technologies should be felt by a broader group of
potentially different workers.
Recent waves: Towards a more general use AI
Recent developments have supported the broadening use of AI technologies, leading to the
emergence of Generative Artificial Intelligence (Generative AI). During the last three to five years, the
technology industry has seen a shift away from narrow-purpose technologies to more broadly applicable
AI technologies (Filippucci et al., 2024[16]). Generative AI, one of the latest advancements, is designed to
create human-like outputs usually text, images, or video based on existing data. In practice, it can
assist with a wide range of applications, from content creation to problem solving. Furthermore, this
technology has been integrated into platforms that are easily accessible to a wide, non-technical audience
through intuitive, natural language interfaces, often in the form of chat-based systems.
The broader scope and easy accessibility of Generative AI technologies suggest they will have a
more widespread impact on the labour market compared to previous waves of AI. Although
Generative AI is trained to excel in a single task content generation it does so effectively across many
diverse contexts, themes, and formats (including not only text but also speech, images, and video), giving
it a more general purpose than previous AI technologies. In addition, its use can extend beyond the original
intentions of its creators, significantly broadening the range of tasks at which it excels. Consequently, many
industries and occupations may find utility in its capabilities.
Although early studies identified low-skilled workers as the most exposed to narrow-purpose
technologies, recent research suggests frontier AI may increasingly impact high-skilled workers
as well (Nedelkoska and Quintini, 2018[17]; Autor, Levy and Murnane, 2003[18]). As AI technologies mature,
For the purpose of this chapter, it is useful then to separate Generative AI technologies from
previous AI technologies. Following the OECD Framework for the Classification of AI systems,
Generative AI can be considered as a separate group of AI systems that, given its more general purpose,
is expected to have a different labour market impact relative to previous technologies. In addition, these
Generative AI systems are more accessible than previous waves of AI. For practical purposes, this chapter
classifies automation technologies that predate Generative AI as narrow-purpose technologies (left side
of Figure 3.1), as under this framework, their development and use characterise them as less general
purpose than Generative AI (bottom right of Figure 3.1).
Source: (OECD, 2022[14]).
126
JOB CREATION AND LOCAL ECONOMIC DEVELOPMENT 2024 © OECD 2024
it becomes possible for them to automate increasingly cognitive and non-routine tasks, such as analysing
text, drafting documents, or searching for information. Therefore, the impact of this new wave of technology
is expected to be concentrated in jobs associated with knowledge work in high and upper-middle income
countries (Gmyrek, Berg and Bescond, 2023[19]). At the occupation level, recent research indicates that AI
technologies are directed at high-skilled tasks (Webb, 2019[20]), correlate with higher wages (Felten, Raj
and Seamans, 2023[21]) and increasingly impact women and highly educated workers (Pizzinelli, 2023[22]).
Generative AI technologies could contribute to the displacement of some jobs while others could
instead be augmented, but in most cases the overall impact remains unclear. Job augmentation
refers to technology enhancing or supporting human workers, therefore complementing human work. High-
skilled workers with higher incomes are on average more exposed to AI, but they also exhibit high potential
for complementarity (Pizzinelli, 2023[22]). Occupations that require a high level of cognitive engagement
and advanced skills are better positioned to benefit from increased productivity while minimising the risk
of job losses. Recent analysis that classifies occupations based on the potential for augmentation or
displacement finds that more occupations could be augmented rather than automated by Generative AI.
However, a significant share of occupations3 remain where both the potential for displacement and
augmentation exist (Gmyrek, Berg and Bescond, 2023[19]).4 While AI is unlikely to fully replace many jobs,
highly exposed jobs share certain characteristics such as belonging to occupations that can be done
remotely (Hering, 2023[23]).
Within economies and local labour markets, AI technologies may contribute to increased income
inequality and job polarisation. The benefits of new technologies not only tend to accrue to high-skilled
labour and owners of capital (in the form of higher capital incomes and returns), but may also lead to wage
stagnation in some workers, therefore increasing inequality (Moll, Rachel and Restrepo, 2022[24]; Manning,
2024[25]). Advanced economies may also face increased job polarisation in the face of AI adoption more
so than emerging economies as their employment structure is better positioned to benefit from growth
opportunities but also makes them more vulnerable to job displacements (Pizzinelli, 2023[22]). On the other
hand, research indicates that there is no relationship, or even a negative one, between AI and overall
inequality, although there is an indication that higher occupational exposure to AI may be associated with
lower wage inequality within occupations (Georgieff, 2024[26]; Webb, 2019[20]) possibly because AI
technology may act as a skill leveller (Box 3.14). The following sections explore this idea further and
substantiate it with quantitative estimates.
Narrow-purpose technologies and automation: The consequences for local
labour markets
Even before the emergence of Generative AI, the impact of automation technologies differed across
local labour markets. While the adoption of technology can bring tangible benefits, it can also lead to job
losses. This impact depends on the nature of the tasks performed by workers, resulting in varying benefits and
risks across different regions and economic groups, and can be quantified by examining the skills and abilities
required for each occupation and the composition of local labour markets (Box 3.2). This measure of risk of
automation serves as a useful metric to examine the effects of narrow-purpose technologies. As the underlying
survey considers all available technology in late 2021, this measure considers all advanced automation and AI
technologies up to that point (Lassébie and Quintini, 2022[27]).5 The metric is then used to measure the share
of employment at high risk of automation, with Figure 3.3 illustrating the results for OECD regions.
While slightly more than a tenth (12%) of the workforce is at high risk of automation, those risks
differ widely across regions. On average, regions in Latin America, Eastern Europe, Asia, and the United
States tend to have a higher share of jobs at high risk of automation, especially compared to regions in
Central, Southern, and Western Europe, Oceania, and Canada. The share of jobs at high risk of automation

127
JOB CREATION AND LOCAL ECONOMIC DEVELOPMENT 2024 © OECD 2024
ranges from under 1% (Greater London, United Kingdom) to almost 29% (La Guajira, Colombia),
highlighting the great diversity in automation risks across regions in the OECD (Figure 3.3).
Box 3.2. Measuring jobs impacted by narrow-purpose automation technologies
The O*NET database
The O*NET programme is a US-based effort to, among other things, collect and classify information on
occupations, skills, abilities, knowledge, and work tasks. It is made up of several relational datasets
which are updated on a regular basis and describe over 1 000 occupationsa. Skill and ability
requirements of occupations are measured in terms of importance and level. The former indicates
whether the particular skill or ability is important to perform the job, while the latter indicates the level of
mastery or proficiency in that skill or ability needed for the job. This information can be combined with
other datasets and surveys to explore different dimensions of work as well as labour market impacts of
other phenomena such as the green transition (OECD, 2023[28]; Vona, Marin and Consoli, 2019[29];
OECD, 2024[30]), or remote work (OECD, 2020[31]; Dingel and Neiman, 2020[32]), among others.
Automation of skills and abilities
To examine the relationship technologies have had with local labour markets, a measure of risk of
automation is developed. Drawing from expert surveys and detailed information on skills and abilities
(O*NET), several metrics are developed to measure the extent to which occupations are automatable.
(Lassébie and Quintini, 2022[27]). These metrics explore the risk of automation of occupations given
available technologies, where the available technologies include all technologies which existed at the
end of 2021 when the surveys were conducted. One measure considers that occupations are at high
risk of automation if over 25% of its skills and abilities are highly automatable with available
technologies. This measure serves as both an expansion and an update of the measure of risk of
automation presented in the 2018 Job Creation and Local Economic Development report (OECD,
2018[33]).
The group of experts was comprised mostly of AI experts who were asked to rate the degree of
automatability of skills and abilities in general, but they were not asked to distinguish between the
specific technologies that might be driving automation. Therefore, even if the most recent advances
have occurred in the field of AI, their ratings reflect the capabilities of older and newer automation
technologies.b Furthermore, experts recognised that it would be best to focus on the capabilities of
current technologies, since predictions regarding the distant future made in the past proved to be far
from reality.
Measuring the automation potential of narrow-purpose technologies
The resulting dataset considers all technologies available in December 2021 and is therefore a practical
metric to examine the impact of narrow-purpose technologies on labour markets. As experts were
instructed to consider all available technologies at the time, this measure serves as a baseline estimate
for that specific point in time. For the purpose of this chapter, the share of occupations at high risk of
automation serves as proxy for labour market exposure to narrow-purpose technologies.
Note: a See full taxonomy in https://www.onetcenter.org/taxonomy.html. b The responses were averaged without removing outliers. Those
skills and abilities that had a mean value larger than 3.5 were considered to be highly automatable.
Source: (Lassébie and Quintini, 2022[27])

128
JOB CREATION AND LOCAL ECONOMIC DEVELOPMENT 2024 © OECD 2024
Figure 3.3. The share of jobs at high risk of automation can range from under 1% to 29% across
OECD regions
Share of employment at high risk of automation in OECD regions, latest available year
Note: Estimates for TL-2 regions where available except for Slovenia which is TL-3. Last available year is 2024 for Canada and Korea, 2023 for
Australia, Colombia, Costa Rica, Mexico, New Zealand, the United Kingdom, and the United States, 2022 for all others.
Source: OECD calculations based on (Lassébie and Quintini, 2022[27]), labour force survey and employment by occupations tables. See Annex
3.A for more details.
The share of employment at high risk of automation also varies significantly within countries. On
average, the share of workers at high risk of automation in the most affected regions is almost four times
larger than in the least affected regions within the same country (Figure 3.3). The largest subnational
differences can be found in Czechia, where the top region is 9 times more exposed than the bottom region.
Furthermore, such regional differences are also considerable in Spain and the United States where the
top region is between 7 and 8 times more exposed than the bottom region.6 Even though the very low risk
of automation in the District of Columbia (DC) affects the degree of dispersion in the United States, regional
differences remain large (2.3 times) if DC is excluded.
In most countries, capital regions have a significantly lower share of workers at high risk of
automation. In 22 out of 28 countries with data for multiple regions, the capital region has the lowest share
of jobs at high risk of automation in the country. Australia, Canada, Colombia, Mexico, Portugal, and Spain
are notable exceptions. However, even in those countries, capital regions or regions with very large
metropolitan areas have a relatively low exposure to automation (e.g., New South Wales in Australia, which
contains the city of Sydney). A subsequent section discusses in more detail how the impact of technology
is distributed among urban and rural regions.
Regional dispersion is primarily driven by the significant variation across industries, with the
manufacturing sector being the most affected over the last decade. Over 33% of employment in the
manufacturing sector is (and has been) at high risk of automation, which is 5 times more than mining and

129
JOB CREATION AND LOCAL ECONOMIC DEVELOPMENT 2024 © OECD 2024
quarrying, the next most exposed industry, and around 9 times more than the following four most exposed
industries (Figure 3.4). Furthermore, 8 out of the 18 industries analysed have under 1% of employment at
high risk of automation and only three industries (manufacturing, wholesale and retail, trade, and
construction) account for almost 90% of employment at high risk. This shows the high specificity of most
of these technologies, affecting only a small portion of the economy.
Figure 3.4. The manufacturing sector leads in jobs at risk of automation by a significant margin
Share of employment at high risk of automation by industry EU, Iceland, Norway, and Switzerland, 2022
Note: In addition to Iceland, Norway, Switzerland, and the United Kingdom this data includes the following EU countries: Austria, Belgium,
Croatia, Czechia, Denmark, Estonia, Finland, France, Germany, Greece, Hungary, Ireland, Italy, Latvia, Lithuania, Luxembourg, Netherlands,
Poland, Portugal, Romania, Slovak Republic, Spain, and Sweden. Numbers represent total employment, as measured by LFS surveys.
Source: OECD calculations based on (Lassébie and Quintini, 2022[27]) and EU-LFS. See Annex 3.A for more details.
The impact of technological progress on automation: Job losses, productivity gains, or
job creation
A common concern among policy makers is that automation technologies will lead to the
displacement of workers and the destruction of jobs. However, recent evidence points to more
nuanced implications. Based on economic theory, task automation could lead to both job destruction and
job creation, while stimulating productivity growth. It could result in falling employment, as employees are
replaced by frontier technologies and displaced from the labour market, or in an increase in employment
as labour demand is boosted by more productive workers (Acemoglu and Restrepo, 2019[34]). In addition,
completely new jobs might be created by new technologies, as, for example, new machines need a
specialised workforce to fix and maintain them. Furthermore, productivity gains from these technologies
can lead to income growth, which may stimulate expansion in unrelated sectors, such as the leisure
industries.
130
JOB CREATION AND LOCAL ECONOMIC DEVELOPMENT 2024 © OECD 2024
Empirical evidence on the labour market effects of automation has been mixed and suggests that
both negative and positive consequences are unequally distributed. Recent analysis shows that
automation of job-tasks is concentrated within routine tasks mainly held by low-skilled workers (Acemoglu
and Restrepo, 2021[35]; Schwabe and Castellacci, 2020[36]). Between 50% and 70% of all changes in the
wage structure in the United States (between 1980 and 2016) appear to be directly linked to automation-
related changes in tasks. For instance, young men with no high school degree have experienced a
15% decline in real wages during this period, largely due to their heavy concentration in various routine
occupations in manufacturing, mining, retail, and wholesale industries (Acemoglu and Restrepo, 2021[35]).
Evidence from European countries suggests that between 2011 and 2019, employment has increased,
overall, in occupations more exposed to AI-enabled automation, which also tend to have younger and more
skilled workers. However, the results vary largely across countries (Albanesi et al., 2023[37]).
In the United States, a slowdown of wage and employment growth has been linked to an
acceleration in the adoption of automation technologies. While the creation of new jobs due to
technological advancement has been significant, it has been outpaced by the substitution of workers by
new technologies (Acemoglu and Restrepo, 2022[38]). However, empirical work on this topic is so far limited
and existing results may not translate outside of the United States (Acemoglu, Manera and Restrepo,
2020[39]) as taxation in the United States is much lower for capital than labour (especially capital involved
in automation, such as equipment and software).
So far, there is little evidence of a significant fall in overall employment in local labour markets with
a higher share of jobs at high risk of automation. On average, regions with a higher risk of automation
have neither recorded significant job losses nor experienced slower job creation than other regions
(Figure 3.5).7 However, this regional analysis may overlook more subtle impacts, such as the reduction in
work hours rather than the complete loss of jobs. For instance, exposure to AI has been linked to a decline
in average working hours in occupations with low levels of computer usage (Georgieff and Hyee, 2021[40]).
Moreover, significant employment changes may still be observed in the future as technologies may still be
adopted in lagging regions or industries.

131
JOB CREATION AND LOCAL ECONOMIC DEVELOPMENT 2024 © OECD 2024
Figure 3.5. Although it is too early to assess the full impacts of automation in the labour market,
there is currently little evidence of job destruction in regions more exposed to automation
Annualised increase in employment and share of employment at high risk of automation (20112019) in selected
OECD regions
Note: Selected countries based on data availability at the regional level. Base year is 2012 for the regions of Bremen (DEU), Mecklenburg-
Vorpommern (DEU), Saarland (DEU) and Ireland, 2013 for the regions Warsaw (POL), Mazowiecki (POL), Hungary, Korea, Lithuania, and
Mexico, 2014 for the regions Corsica (FRA), Guadeloupe (FRA), Martinique (FRA), French Guiana (FRA) and La Réunion (FRA) and 2011 for
all others. Size of bubbles represent labour market size (employment).
Source: OECD calculations based on (Lassébie and Quintini, 2022[27]), (OECD, 2024[41]), labour force surveys, employment by occupations
table. See Annex 3.A for more details.
Nevertheless, this does not necessarily imply that jobs were not destroyed. Instead, evidence
suggests that in many regions job losses were offset by job creation in other sectors of the
economy. In fact, in most OECD regions (70%) which exhibited a drop in employment at high risk of
automation, more than enough jobs were created to make up for this (top-left quadrant in Figure 3.6). On
the other hand, in 70% of the regions where employment increased between 2011 and 2019, part of this
growth can be attributed to occupations considered at high risk (top-right quadrant of Figure 3.6),
highlighting the possible role of technology in facilitating labour expansion. However, this expansion of
labour into high-risk jobs may prove to be a double-edged sword, as a potential future wave of job
displacement may impact an even larger share of workers in these regions.

132
JOB CREATION AND LOCAL ECONOMIC DEVELOPMENT 2024 © OECD 2024
Figure 3.6. Most regions have seen employment growth and a large share of those that did not
experienced a drop in employment at high risk of automation
Regions by change in total employment (%) and change in high-risk employment (%), 2011-19
Note: Selected regions based on data reliability. 2011 or nearest available year. Regions marked with employment growth had growth in overall
employment. Regions marked with employment had a decrease in overall employment. Regions marked with displacement had a reduction of
total jobs at high risk of automation. Regions marked with creation had an increase in of total jobs at high risk of automation.
Source: OECD calculations based on (Lassébie and Quintini, 2022[27]), (OECD, 2024[41]) ,labour force surveys, employment by occupations
table. See Annex 3.A for more details.
Overall job destruction across OECD regions can be attributed to automation in only a handful of
cases. Figure 3.7 illustrates how the percentage change in employment is distributed among high-risk and
non-high-risk occupations for regions that had overall negative employment growth. In only 11 out of the
42 (26%) regions that experienced a fall in overall employment between 2011 and 2019 was the decrease
higher in occupations at high risk of automation. Furthermore, only six (14%) recorded employment losses
exclusively for occupations at high risk of automation (bottom regions in Figure 3.7). For the latter group
of regions, the fall in employment could be attributed, at least in part, to the job destruction of high-risk
employment. In other regions, various economic factors may have been more influential than automation;
however, automation-related job displacement could still occur in occupations deemed lower risk, albeit to
a lesser extent.

133
JOB CREATION AND LOCAL ECONOMIC DEVELOPMENT 2024 © OECD 2024
Figure 3.7. Overall job destruction across regions can be attributed to automation in only a handful
of cases
Share of job change by occupation type in regions with overall job destruction, 2011-19
Note: Selected regions which had less employment in 2019 compared to the 2011 (or nearest year available). Value in both bars sum up to -
100%, which is represent 100% of the negative change in employment. Background colours relate to quadrant colours in Figure 3.6.
Source: OECD calculations based on (Lassébie and Quintini, 2022[27]), (OECD, 2024[41]), labour force surveys, employment by occupations
table. See Annex 3.A for more details.
Even though new job creation outweighed job losses in most regions, newly created jobs might
not have benefitted those workers who lost their jobs. In fact, regions that experienced job losses due
to automation may have seen these workers enter long term unemployment or leave the labour force,
potentially through early retiring, with new jobs taken up by workers either transitioning from other jobs or
recently entering the workforce. Labour market policies that target affected workers could facilitate their
reintegration into the workplace by, for example, providing them with the skills needed in their local labour
market and which enable them to take advantage of new AI technologies (Box 3.3).
Across the OECD, regions with a higher share of employment at risk of automation saw a small but
significant increase in productivity. The annualised increase in productivity8 from 2011 to 2019 tended
to be significantly higher in those regions where industrial activities were at higher risk of automation
(Figure 3.8). This positive impact on productivity holds even when one considers heterogeneity across
countries as, when including country fixed effects, an increase of 10% in the share of jobs at risk of
automation is related to an increase of 1.1% in annual productivity, which amounts to a 5.6% increase over
five years. The limited magnitude of this effect may be explained by the fact that some technologies were
still under development during the 2010s and even when available may not have been instantly adopted9.
Therefore, some regions may still stand to benefit from the untapped potential of technology.

134
JOB CREATION AND LOCAL ECONOMIC DEVELOPMENT 2024 © OECD 2024
Figure 3.8. Regions with a higher share of employment at risk of automation saw a small but
significant boost in productivity
Annualised increase in productivity and share of employment at high risk of automation (2011 2019) in selected
OECD regions
Note: Selected countries based on data availability at the regional level. Base year is 2012 for the regions of Bremen (DEU), Mecklenburg-
Vorpommern (DEU), and Saarland (DEU), 2013 for Hungary, Lithuania, and Mexico, 2014 for the regions of Corsica (FRA), Guadeloupe (FRA),
Martinique (FRA), French Guiana (FRA) and La Réunion (FRA) and 2011 for all others. Size of bubbles represent labour market size
(employment).
Source: OECD calculations based on (Lassébie and Quintini, 2022[27]), (OECD, 2024[41]), labour force surveys, and employment by occupation
Tables. See Annex 3.A for more details.
Box 3.3. Digital upskilling in Australia, Romania, Korea, and Japan
Upskilling in Australia
The five-year National Skills Agreement in Australia seeks deliver high-quality and responsive Vocational
Education and Training (VET) to support the development of a skilled workforce for current and future
needs. The government will work with states and territories to deliver on shared national priorities which
includes building The government also collaborates with
industry leaders to provide apprenticeships and traineeships that combine formal education with on-the-
job training. This approach aims to help learners acquire practical skills that are immediately applicable
in the workplace.
Romania’s initiatives to address digital skill gaps
Through the National Employment Strategy (NES) 2021-2027 and the Education and Employment
Programme (EEP) 2021-2027, the Ministry of Labour and Social Solidarity (MLSS) in Romania

135
JOB CREATION AND LOCAL ECONOMIC DEVELOPMENT 2024 © OECD 2024
implements measures to enhance digital skills in the labour force. These include revising vocational
training regulations, providing digital skills training for job seekers, and establishing funding mechanisms
for employee professional development. Digital skills training, for instance, will be provided starting in
2024 for unemployed individuals through county employment agencies.
opean Certificate of Digital
Competences (EDSC), alongside countries such as Finland, Spain, Austria, and France. The EDSC aims
to promote digital skills, increase recognition of these skills, and support citizens in understanding and
improving their digital competence levels. This initiative is part of the European effort to address the digital
skills gap and achieve the goal of 80% of adults having basic digital skills by 2030.
South Korea’s AI National Strategy
significant investments in education and training to prepare
the workforce for an AI-driven economy. The strategy supports the establishment of AI education centres
at universities and research institutions, offering specialised programs in AI and machine learning. The
South Korean government also provides subsidies for workers and students to enrol in AI courses and
certifications. Additionally, the strategy includes initiatives to foster industry-academia collaboration, so
that the training programmes align with the needs of the market.
Korea facilitates use of the acquired data by establishing an AI hub to provide companies and researchers
with AI training data and cloud-based high-performance computing (an essential tool to process large
amounts of data efficiently). The ecosystem will include big data platforms to produce and manage data,
especially for sectors such as finance and healthcare. Korea also provides AI vouchers to SMEs and
start-ups that need AI-powered products or services. Using the vouchers, the beneficiary companies can
purchase necessary AI solutions from AI-solution suppliers.
Japan’s strategic support to the private sector for adopting AI
Japan, through the Ministry of Economy, Trade, and Industry (METI), launched the J-Startup programme
in 2018 to foster innovation and help Japanese startups succeed. This public-private programme identifies
and supports top startups and provides them with resources and opportunities to innovate in various
sectors, including healthcare, with a strong focus on new technologies and AI. This initiative, beyond
empowering the ecosystem in Japan, looks to foster better partnerships between the private and public
sectors. J-Startup describes the support offered by the private sector to the government as working
together to do experimental studies with robots, products, and infrastructure networks. The support by
the government includes applying supportive frameworks for startups such as subsidies and simplifying
procedures.
Regions in Japan have their own J-Startup programmes, aimed at supporting regional growth and
development. For example, J-Startup Kansai identifies promising startup companies that will serve as a
role model for the region and supports their growth within the region (J-Startup Kansai, 2024[42]). Similarly,
Central Japan implemented J-Startup Central to give robust regional support for their development
(Central Japan Startup Ecosystem, 2024[43]).
Source: (Australian Department of Employment and Workplace Relations, 2023[44]), (Ministry of Science and ICT of Korea, 2021[45]), (Song,
2022[46]) (J-Startup Kansai, 2024[42]) (Central Japan Startup Ecosystem, 2024[43]).

136
JOB CREATION AND LOCAL ECONOMIC DEVELOPMENT 2024 © OECD 2024
The implications of Generative AI for regional labour markets
The rise of large language models (LLMs) might have an impact on a much larger share of workers
than previous digital technologies. LLMs such as Generative Pre-trained Transformers (GPTs) have
characteristics of a general-purpose technology (Eloundou et al., 2023[47]) and can generate high-quality
text, images and other content based on large amounts of training data. While technology in the past
focused on specific parts of the production of goods and services, Generative AI in the form of LLMs can
intervene in manifold ways.
This section provides novel estimates on the exposure of different workers and local labour
markets to Generative AI. It expands the work done by (Eloundou et al., 2023[47]), which examines how
the tasks of individual jobs can be done significantly faster via the use of LLMs and associated user
interfaces (Box 3.4). It constructs four related estimates that examine occupational exposure at two levels
of intensity (exposed and highly exposed) and two points in time (now and in the near future).10 Table 3.1
provides example occupations and their respective exposure to Generative AI. Overall, the analysis covers
regional labour markets in 36 OECD countries (further details on country coverage and data can be found
in Annex 3.A).
Box 3.4. Measuring exposure to Generative AI at the occupation level using O*NET data and
expert surveys
Eloundou et al. (2023[47]) measure the potential implications of Generative AI, specifically frontier
LLMs such as General Pre-rket. They classify jobs
according to their task content. This methodology is based on the idea that jobs can be decomposed into
distinct tasks, which can then be analysed in detail (Box 3.2). Conclusions for jobs are then inferred from the
tasks that make up these jobs.
The authors along with AI experts classify tasks based on how much faster they could be completed
by a human using an LLM or an LLM-powered system. This optimisation is conditional on the fact that
the quality of output is not compromised. If the time required for a human to perform a task can be reduced
by at least 50% with the use of an LLM, then this task is classified as exposed. For example, online
-
optimised with the use of Generative AI models.
Although LLMs are advanced in their capabilities, their use in everyday work may remain limited due
to poor software integration or restricted access to relevant data. For example, LLMs are commonly
used to write or de-bug software code, but writing prompts and copying code can be done faster if the LLM
is embedded directly in a devel
is the case with GitHub Copilot (Box 3.10). In addition, some Generative AI platforms have restrictions that
could be relaxed if necessary. For example, prompts given to early LLM powered chatbots were limited to 2
000 words, but this limit has since expanded. In addition, some LLM platforms cannot access the internet to
retrieve up-to-date facts, which is not necessarily a limitation. In fact, some LLM-powered systems could be
more useful for certain occupations if they were trained on internal company data, thereby also enhancing
safety by reducing exposure to misinformation from the internet. Some tasks could theoretically be optimised
with the use of LLMs, but the technology is either unnecessarily restricted or has not yet been converted into
tools easily adoptable by users. As a result, some tasks are not yet exposed but are likely to become exposed
in the (near) future.

137
JOB CREATION AND LOCAL ECONOMIC DEVELOPMENT 2024 © OECD 2024
Table 3.1. Example of occupations by their exposure to Generative AI
Occupations
affected
Not exposed
(No tasks)
Exposed
(20% of tasks)
Highly exposed
(50% of tasks)
Now
˗ Home Health Aides
˗ Sound Engineering
Technicians
˗ Materials Scientists
˗ Sales Engineers
Financial Examiners
˗ Programmers
˗ Interpreters and
Translators
Now or near
future
˗ Cleaners of Vehicles and
Equipment
˗ Slaughterers and Meat
Packers
˗ Camera Operators
˗ Opticians
˗ Insurance
Underwriters
˗ Database Architects
Note: Selected occupations.
Source: (Eloundou et al., 2023[47]).
Most occupations exhibit some degree of exposure to Generative AI, though the extent of this
exposure varies significantly across different fields. Higher paying occupations tend to be more
exposed to Generative AI, while occupations heavily reliant on science and critical thinking skills are less
exposed on average. Similarly, jobs that require more education and/or training tend to, on average, be
more exposed to Generative AI (Eloundou et al., 2023[47]).
To address this, the authors create multiple measures of exposure for occupations. Two of them are
the most relevant: exposure now and exposure now or in the near future. As implied, the second measure
is an expanded version of the first. Exposure now is defined as the share of tasks within an occupation that
can be completed in half the time by using LLMs in their current form, i.e., Chat-GPT 3.5 or similar. Exposure
now or in the near future is defined as the share of tasks within an occupation that can be completed in half
the time by using with LLMs in their current form (the same as the first scenario) plus those tasks where it is
easy to imagine additional software that could be developed on top of the LLMs that would reduce the time
taken to complete the task by half. It is important to note that this last definition does not presume major
advances in technology, but it merely expects software tools to catch up to integrate frontier LLMs and
specialise in certain applications.a Neither of these measures necessarily imply that highly exposed
occupations will face displacement. It could also be the case that those occupations can be done more
efficiently with the use of Generative AI tools.
This report expands on the work of Eloundou et al. (2023[47]) and applies a modified methodology
for OECD regions. Occupations are considered to be exposed if these measures the share of tasks
that can be done with a set of technologies exceed 20%. Furthermore, occupations are considered
to be highly exposed if these measures exceed 50%. These thresholds were chosen to reflect two
particular dimensions of labour market exposure. In short, a threshold of 20% measures those
occupations that have a low but significant exposure while a threshold of 50% measures those
occupations where most of the job can be optimised by the use of Generative AI. Table 3.1 summarises
the four resulting measures and provides examples.
Note: a Annex 3.A contains more details on these measures.
Source: (Eloundou et al., 2023[47]).

138
JOB CREATION AND LOCAL ECONOMIC DEVELOPMENT 2024 © OECD 2024
A quarter of workers are currently exposed to Generative AI, but this share is expected
to grow
Across the OECD, around 26% of workers are exposed to Generative AI, but only 1% are considered
to be highly exposed. Nevertheless, as Generative AI technologies are integrated into the workplace, up
to 70% of workers could be exposed to Generative AI in the near future, with 39% of these considered to
be highly exposed. Table 3.1 provides examples of occupations within each category. The extent to which
these estimates materialise in regions depends on the actual uptake by workers and firms, which in turn
hinges on both investment and training.
Figure 3.9. A quarter of workers are now exposed to Generative AI
Share of employment exposed to Gen-AI now, latest available year
Note: Estimates for TL-2 regions except for Slovenia which is TL-3. Last available year: 2024 for Canada and Korea, 2023 for Australia,
Colombia, Costa Rica, Mexico, New Zealand, the United Kingdom, and the United States, 2022 for all others.
Source: OECD calculations based on (Eloundou et al., 2023[47]) , labour force survey and employment by occupations tables. See Annex 3.A
for more details.
The exposure of jobs to Generative AI across OECD regions varies significantly. The share of
workers highly exposed to Generative AI in the near future is expected to range from 16% in Guerrero
(Mexico) to 77% in Greater London (United Kingdom) (Figure 3.10). The within-country dispersion for this
measure averages around 14 percentage points, indicating that the top region in a country is, on average,
1.6 times more exposed to Generative AI compared to the bottom region. In Colombia, the country with
the highest regional dispersion, the top region (Bogotá Capital District) is over 3 times as exposed as the
bottom region (La Guajira). Capital regions tend to account for the high share in the within-country
dispersion, pointing to an urban-rural divide in this dimension.

139
JOB CREATION AND LOCAL ECONOMIC DEVELOPMENT 2024 © OECD 2024
Figure 3.10. Labour market exposure to Generative AI could range from 16% to 77% across regions
Share of employment highly exposed to Gen-AI now or in the near future, latest available year
Note: Estimates for TL-2 regions except for Slovenia which is TL-3. Last available year: 2024 for Canada and Korea, 2023 for Australia,
Colombia, Costa Rica, Mexico, New Zealand, the United Kingdom, and the United States, 2022 for all others.
Source: OECD calculations based on (Eloundou et al., 2023[47]), labour force survey and employment by occupations tables. See Annex 3.A for
more details.
Box 3.5. Alternative measures of AI exposure in labour markets
Exposure to AI and automation technologies can be viewed through more than one lens. The
results presented in this section examine labour market exposure to Generative AI when this is
embedded in an accessible platform. At least three different datasets have been developed to examine
this issue through other vantage points and present complementary results.
AI Occupational Exposure (AIOE)
This dataset individually links 10 AI application to 51 skills and abilities (O*NET). It does this by
surveying online gig workers and combines their responses into an occupation level indicator which
describes the extent to which a given occupation is exposed to each AI application, as well as AI in
general. The main indicator is the Artificial Intelligence Occupational Exposure (AIOE) and has been
used to examine the geographical and industrial distribution of AI exposure (Felten, Raj and Seamans,
2021[48]), the AI exposure of labour markets across developed and developing economies (Pizzinelli,
Burgenland Vienna
New South WalesTasmania
BrusselsFlemish Region
OntarioSaskatchewan
ZurichEastern Switzerland
BogotáLa Guajira
CentralNorth Huetar
PragueCentral Moravia
BerlinThuringia
Copenhagen regionNorthern Jutland
AtticaCentral Greece
MadridCastile-La Mancha
Helsinki-UusimaaEastern and Northern Finland
Île-de-FranceBourgogne-Franche-Comté
Pannonian Croatia City of Zagreb
BudapestNorthern Hungary
Northern and Western Eastern and Midland
Basilicata Lazio
Seoul Capital AreaJeolla Region
Vilnius RegionCentral and Western Lithuania
Guerrero Nuevo Leon
Innlandet Oslo and Viken
WellingtonSouthland
Swietokrzyskie Warsaw
Metropolitan area of LisbonAzores
South East (ROU) Bucharest - Ilfov
StockholmNorth Middle Sweden
Littoral–Inner Carniola Central Slovenia
Bratislava RegionWest Slovakia
Greater LondonNorthern Ireland
District of ColumbiaWyoming
Mexico
Colombia
Costa Rica
Romania
Korea
United States
Spain
Croatia
Hungary
Czechia
Slovak Republic
Slovenia
Greece
Italy
Australia
Portugal
Poland
Latvia
Estonia
Finland
Lithuania
Iceland
Denmark
France
Austria
Norway
Belgium
Germany
Ireland
New Zealand
Sweden
Switzerland
Canada
Netherlands
United Kingdom
Luxembourg
010 20 30 40 50 60 70 80 90 100
Share of employment highly exposed to Gen. AI - now or near future (%)
Min. region Country average Max. region

140
JOB CREATION AND LOCAL ECONOMIC DEVELOPMENT 2024 © OECD 2024
2023[22]) and a detailed analysis of labour market exposure in Canada (Mehdi and Morissette, 2024[49]),
among others. National level estimates of the share of exposed workers ranges from around 25% (India)
to 65% (United States), with 57% of employment considered exposed in Canada.
A global analysis of potential task exposure to Generative AI
This dataset evaluates ISCO occupations, including their description and task content, in regards to
their potential exposure to Generative AI (Specifically GPTs). The study used ChatGPT-4 to score
individual occupations and creates national and global estimates on the share of jobs exposed (Gmyrek,
Berg and Bescond, 2023[19]). In addition, the study evaluates which occupations have augmentation
potential (they are likely to be complemented by Generative AI) and which have automation potential
(they are likely to be displaced by Generative AI). Results show that 15.3% of jobs across the globe are
considered exposed, with 13% having augmentation potential and 2.3% having automation potential.
Nevertheless, this figure can reach 18.5% in high income countries, with 13.4% and 5.1% of jobs having
augmentation and automation potential respectively.
Source: (Felten, Raj and Seamans, 2021[48]; Gmyrek, Berg and Bescond, 2023[19]).
It may be too early to determine the full impact of Generative AI on local labour market composition.
While certain labour markets are highly exposed to AI, this has not yet resulted in significant changes. It
may take some time before we observe shifts in employment figures in response to the impact of
Generative AI. An analysis of online job postings in the United States (Box 3.6) indicates no structural
changes in hiring practices since Generative tools were launched. While these results may not fully
represent the OECD, it is anticipated that the United States will act as an early indicator for the rest of the
OECD, given its likelihood to be among the first to respond to the impact of Generative AI.
Box 3.6. The impact of Generative AI on job creation and destruction remains uncertain
So far, labour demand has not reacted to exposure to Generative AI, as evidenced in the United
States. The share of job postings of occupations expected to be exposed to Generative AI has not
changed significantly in the last three years. Around 82% of US online jobs postings in 2023 are
considered to be exposed to Generative AI either now or in the near future, of which 59% are highly
exposed (). This share of employment was also around 82% in 202111, before Chat-GPT 3 was released
to the public. Although there has been no observable change, it might still be too early as at least part
of the impact of Generative AI may have not materialised yet. In other words, although the correlation
is non-existent right now, stronger effects may be observed in the future.
Nevertheless, labour markets may change as they integrate Generative AI tools. These exposure
estimates do not imply job displacement, but they should correlate with productivity as they measure
the tasks that can be done faster with the help of Generative AI. Therefore, Generative AI may lead to
both job destruction and creation. Nevertheless, employers may decide to postpone both hiring and
layoffs until the practical uses of new technologies yield results.

141
JOB CREATION AND LOCAL ECONOMIC DEVELOPMENT 2024 © OECD 2024
Figure 3.11. Labour demand has not yet reacted to Generative AI exposure
Share of online job postings by exposure to Generative AI, United States
Source: (Eloundou et al., 2023[47]) and Lightcast data on online job postings.
Most sectors of the economy can benefit from Generative AI
Industrial composition is the main driver of differences in exposure to Generative AI across local
labour markets. Across sectors in the EU, only 5% of workers in agriculture are considered exposed to
Generative AI compared to 71% of workers in the information and communications industry (Figure 3.12).
Among the latter, a small share of workers (5%) is considered to be highly exposed right now (i.e., half of
their tasks could be significantly accelerated through the use of Generative AI), but this figure might reach
almost 90% in the future. The share of highly exposed workers in the financial and insurance industry in
the future could be even higher at almost 97%.
Almost half of all sectors could see the majority of their workers highly exposed to Generative AI.
In eight out of the eighteen sectors analysed in the European Union, over 50% of employment could be
highly exposed in the near future. In four industries, real estate activities, information and communication,
professional and scientific activities, and financial and insurance services, the share of exposed workers
could exceed 80%.
0
25
50
75
100
2021 Q1 2021 Q3 2022 Q1 2022 Q3 2023 Q1 2023 Q3
Share of employment (%)
Highly exposed now or in the near future Exposed now or in the near future Not exposed

142
JOB CREATION AND LOCAL ECONOMIC DEVELOPMENT 2024 © OECD 2024
Figure 3.12. Exposure to Generative AI varies greatly across industries
Labour market exposure to Gen-AI by industry for EU countries, 2022
Source: OECD calculations based on (Eloundou et al., 2023[47]), EU-LFS and employment by occupations tables. See Annex 3.A for more
details.
Only a few sectors, such as construction, accommodation, and agriculture appear to not face
significant changes due to Generative AI. In those three sectors, less than a quarter of workers could
be highly exposed to AI in the future. The common factor across these sectors is the more limited use of
Information technology (IT) than elsewhere. In fact, the agriculture sector is expected to have only 7% of
its workers highly exposed to Generative AI.
Generative AI exposure is expected to intensify, with industries that currently have a high share of
exposed workers being those with a high share of highly exposed workers in the near future as
well. It is reasonable to conclude that occupations that make use of Generative AI now will continue to do
so in the future. Furthermore, as this technology evolves it is expected that its future use cases will align
with its current use cases, therefore deepening exposure levels within the same occupations. Industry level
estimates (Figure 3.12) support this conclusion as the most and least exposed industries, in terms of
exposure to Generative AI, are expected to remain relatively unchanged.
Box 3.7. How complementary is Generative AI to different occupations?
Measuring complementarity with AI technologies across occupations
It is unclear whether these measures of exposure to Generative AI correspond to the
replacement or complementarity of workers tasks. Some occupations involve some aspects that
are necessarily human, such as physical presence, responsibility, or face-to-face communication. This
methodology (Pizzinelli, 2023[22]) leverages O*NET data on work context and job zones to propose a

143
JOB CREATION AND LOCAL ECONOMIC DEVELOPMENT 2024 © OECD 2024
framework that conceives complementarity as driven by a set of factors social, legal, technical that
are independent of exposure itself.
Workers significantly exposed to Generative AI are expected to be impacted differently
depending on the extent to which this technology complements or substitutes their work. This
methodology attempts to shed some light on this issue by grouping workers into three categories:
(1) high exposure-high complementarity, (2) high exposure-low complementarity and (3) low exposure
(Figure 3.13).
Figure 3.13. Occupations with higher complementarity tend to require more education and/or
training
Exposure to Generative AI now or in the near future and potential complementarity to AI
Source: (Pizzinelli, 2023[22]; Mehdi and Morissette, 2024[49])
Contrasting exposure to Generative AI and potential complementarity
The relative positioning of occupations in terms of their exposure to Generative AI and potential
complementarity provides insights into the likelihood of job displacement and opportunities for
productivity enhancement. Occupations on the right-hand side of Figure 3.13 are relatively more
exposed while occupations on the top-half present relatively higher levels of complementarity.
Occupations on the top right are better positioned to be complemented by Generative AI while
occupations on the bottom-right are better posed to be displaced. Nevertheless, as this is a relative
measure it is not perfect and can only shed light on the potential for productivity or displacement relative
to other occupations. Therefore, it can still not be determined which occupations will be displaced or
have their productivity enhanced.
Oral and Maxillofacial Surgeons
Prosthodontists
Sports Medicine PhysiciansAthletic Trainers
Cashiers Models Telemarketers
Telephone Operators
Insurance Claims and Policy Processing Clerks
Sewing Machine Operators
Cutters and Trimmers, Hand
High exposure
High complementarity
High exposure
Low complementarity
Low
exposure
0.4
0.5
0.6
0.7
0.8
025 50 75 100
Exposure to Generative AI - now or near future (% of tasks)
Potential complementarity
Little or no preparation needed Some preparation needed Medium preparation needed
Considerable preparation needed Extensive preparation needed

144
JOB CREATION AND LOCAL ECONOMIC DEVELOPMENT 2024 © OECD 2024
On average, occupations that require more education tend to have higher levels of
complementarity with AI technologies. On the other hand, the opposite is true for occupations that
only require little or some preparationa. The level of preparation refers to a composite measure which
combines the levels of education, experience, and training necessary to perform the occupation
(O*NET[50]).
Figure 3.14. Most job families contain occupations that can use Generative AI as a complement
to their work
Exposure to Generative AI now or in the near future and potential complementarity to AI by job family
Note: Y-axis categories corresponds to job family as defined by O*NET (O*NET, 2024[51]).
Source: (Pizzinelli, 2023[22]; Mehdi and Morissette, 2024[49]).
In most job families, more than half of their relatively highly exposed occupations are complemented
by AI technologies. Nevertheless, there are 5 job families that contain mostly occupations that are relatively
highly exposed with low levels of complementarity, illustrated at the bottom of Figure 3.14. For example,
over 70% of occupations in Management and Educational Instruction and Library have relatively high levels
of exposure with low complementarity which indicates they are more susceptible to job displacement. At the
opposite end, Healthcare Support; Farming, Fishing, and Forestry; and Building and Grounds Cleaning and
Maintenance present low levels of exposure.
Note: aNote that the complementarity measure considers job zones as a measure of complementarity as occupations with longer periods
of required professional development would have a greater ability to integrate AI knowledge into their training programs and thus equip
future workers with complementary skills. Therefore, some of this dispersion across skills is a mechanical result given the way the
complementary measure is constructed. Nevertheless, job zones make up only a small part of the complementarity measure with work
contexts making up largest part.
Source: (Pizzinelli, 2023[22]; Mehdi and Morissette, 2024[49]).
Educational Instruction and Library
Management
Architecture and Engineering
Life, Physical, and Social Science
Community and Social Service
Healthcare Practitioners and Technical
Sales and Related
Protective Service
Business and Financial Operations
Arts, Design, Entertainment, Sports, and Media
Legal
Personal Care and Service
Transportation and Material Moving
Computer and Mathematical
Food Preparation and Serving Related
Construction and Extraction
Installation, Maintenance, and Repair
Office and Administrative Support
Production
Building and Grounds Cleaning and Maintenance
Farming, Fishing, and Forestry
Healthcare Support
010 20 30 40 50 60 70 80 90 100
Share of occupations (%)
Low exposure High exposure
Low complementarity High exposure
High complementarity

145
JOB CREATION AND LOCAL ECONOMIC DEVELOPMENT 2024 © OECD 2024
Metropolitan workers experience higher exposure to Generative AI than non-
metropolitan workers
The concentration of industries within or outside cities drives disparities in Generative AI exposure
between urban and non-urban labour markets. Certain industries, such as financial services or
technology development, often concentrate around metropolitan areas while non-metropolitan or rural
areas tend to rely on industries with a different production structure, such as agriculture or manufacturing.
Similarly, workers are also spatially concentrated, with highly skilled workers often being more present in
clusters in or around a few metropolitan areas.
Workers in urban and metropolitan areas are significantly more exposed to Generative AI than
workers in the rest of the country, by every measure (Figure 3.15). The exact gap varies by country
but, on average, labour markets in urban areas are over twice as exposed than non-urban labour markets.
This average is primarily driven by Colombia where urban regions are 2.6 times more exposed than non-
urban regions. Nevertheless, if we Colombia is not included, urban regions are 74% times more exposed
than their non-urban counterparts, on average.
Figure 3.15. Labour markets in urban areas are significantly more exposed to Generative AI than
non-urban areas.
Share of workers highly exposed to Gen-AI now or in the near future by area type 2023
Note: The definition of urban and rural may differ across countries so estimates are not directly comparable. Country selection is based on data
availability. The -metropolitan
areas are groups of US counties and are defined and named accordingly the US-BLS.
Source: OECD calculations based on (Eloundou et al., 2023[47]), metropolitan level Occupational Employment and Wage Statistics (OEWS) and
labour force survey data (LFS). See Annex 3.A for more details.
10.8
38.8
20.4
38.1
17.1
34.1
43.1
32
Colombia
Costa Rica
Mexico
United States
Rural Urban Rural Urban Rural Urban Non
metropolitan Metropolitan
0
10
20
30
40
Share of employment highly exposed to Gen. AI - now or near future (%)

146
JOB CREATION AND LOCAL ECONOMIC DEVELOPMENT 2024 © OECD 2024
In European Union countries, workers in cities are significantly more exposed than elsewhere.
Examining the exposure of workers to Generative AI by the degree of urbanisation (DEGURBA12), shows
that cities are significantly more exposed than rural areas (Figure 3.16). Across the European Union, over
36% of jobs in cities are exposed to Generative AI. In contrast, in rural areas, only 21% of jobs are
considered exposed to Generative AI. In some countries, such as Poland, Hungary or Greece, the share
of employment exposed to Generative AI is at least twice as high in cities compared to rural areas.
Figure 3.16. Cities are significantly more exposed than rural areas
Ratio of share of employment exposed to Generative AI in EU countries - 2022
Note: The degree of urbanisation (DEGURBA) is a classification that indicates the character of an area. It classifies the territory of a country on
an urban-rural continuum.
Source: OECD calculations based on (Eloundou et al., 2023[47]) and EU-LFS. See Annex 3.A for more details.
The gap between rural areas and cities in exposure to Generative AI is expected to vary
significantly by country. In the near future, the rural-urban gap in exposure could vary from just under
8% in Belgium to close to 35% in Romania (Figure 3.17). Luxembourg is the only country where rural areas
are more exposed than towns and/or semi-dense areas. In addition, Luxembourg is expected to have the
most exposed urban population in the European Union with 84% of employment in cities expected to be
exposed to Generative AI in the near future.
Aside from a few outliers, cities across EU countries are expected to have a similar average
exposure to Generative AI. Setting aside Luxembourg and Spain, which have the most and least exposed
cities respectively, the share of exposed workers in EU cities is expected to differ by up to 11 percentage
points, ranging from 53.1% in Romania to 64.2% in Sweden. However, the difference between exposure
(now or in the near future) in rural areas differs by 31 percentage points across countries in the
European Union, with the Netherlands having the most exposed and Romania the least exposed rural
areas (Figure 3.17).
1.5
1.2
2.4
1.9
1.7
1.5
2
1.5
1.4
2.5
2.5
2.2
1.5
1.6
1.8
1.8
1.5
1.4
2
2.3
1.7
3.8
2.2
1.6
1.7
1.4
Belgium
Germany
Netherlands
Switzerland
Estonia
Austria
Ireland
Luxembourg
France
Spain
Italy
Denmark
Portugal
Sweden
Latvia
Lithuania
Czechia
Finland
Norway
Slovak Republic
Iceland
Poland
Croatia
Hungary
Greece
Romania
0.0 0.5 1.0 1.5 2.0 2.5 3.0 3.5
Ratio of share of employment exposed to Gen. AI (cities / rural areas)

147
JOB CREATION AND LOCAL ECONOMIC DEVELOPMENT 2024 © OECD 2024
Figure 3.17. Cities are, and will be, significantly more exposed to Generative AI
Share of workers highly exposed to Gen-AI now or in the near future by the degree of urbanisation in EU countries,-
2022
Note: The degree of urbanisation (DEGURBA) is a classification that indicates the character of an area. It classifies the territory of a country on
an urban-rural continuum.
Source: OECD calculations based on (Eloundou et al., 2023[47]) and EU-LFS. See Annex 3.A for more details.
Shifting landscapes: The impact of AI on people and places
The latest wave of AI technologies represents a departure from the development of narrow-purpose
digital technologies towards more general-purposed solutions. This section explores how labour
market impacts differ between narrow-purpose technologies and Generative AI technologies, examining
in detail which economic groups are most exposed and how relative exposures are distributed across
el of
education and gender. Furthermore, a massive shift is observed in the distribution of this impact across
OECD regions.
OECD regions previously only mildly at risk of automation are now significantly exposed to
Generative AI and vice versa. There is a clear negative correlation between the expected share of highly
automation (Figure 3.18). This trend is statistically significant despite the presence of a few regions that
display low values in both estimates, such as Andalusia (Spain), Central Greece, and Sicily (Italy), among
others.
Spain
Romania
Belgium
Estonia
Italy
Iceland
Portugal
Latvia
France
Greece
Denmark
Germany
Austria
Czechia
Finland
Croatia
Lithuania
Poland
Ireland
Hungary
Netherlands
Slovak Republic
Norway
Switzerland
Sweden
Luxembourg
20 30 40 50 60 70 80
Share of employment highly exposed to Gen. AI - now or near future (%)
Rural areas Towns and semi-dense areas Cities

148
JOB CREATION AND LOCAL ECONOMIC DEVELOPMENT 2024 © OECD 2024
Figure 3.18. Regions with a low risk of automation are now highly exposed to Generative AI, and
vice-versa
Share of employment highly exposed to Gen-AI now or in the near future and at high risk of automation, latest
available year
Note: Horizontal and vertical lines represent unweighted regional averages. Size of bubble represents labour market size (employment).
Source: OECD calculations based on (Eloundou et al., 2023[47]), (Lassébie and Quintini, 2022[27]), labour force survey and employment by
occupations tables. See Annex 3.A for more details. Estimates for TL-2 regions except for Slovenia which is TL-3. Last available year is 2024
for Canada and Korea, 2023 for Australia, Colombia, Costa Rica, Mexico, New Zealand, the United Kingdom, and the United States, 2022 for
all others.
Workers with a higher level of education, who were previously at lower risk of automation, are now
significantly more exposed to Generative AI than their less educated peers. Generative AI is causing
a large shift in the impact of technology on local labour markets, as previous waves of innovation not
only involving digital technologies but also other technologies had a stronger impact on less educated
workers who were more exposed (Figure 3.19). Less educated workers tended to be between 60% and
70% more at risk of automation than their highly educated counterparts. Workers with higher levels of
education are now more than twice as exposed relative to less educated workers, and this gap is expected
to be maintained as both groups of workers become more exposed to Generative AI over time. The
expected gap in the exposure to Generative AI between workers with high and low levels of education can
be attributed to the large overlap between Generative AI and the tasks carried out by highly educated
workers. This technology is not only useful for a larger set of tasks but it also is increasingly helpful with
both cognitive and non-routine tasks, which are significantly more common among highly skilled workers.

149
JOB CREATION AND LOCAL ECONOMIC DEVELOPMENT 2024 © OECD 2024
Figure 3.19. Highly educated workers are significantly more exposed to Generative AI, and this gap
will only increase
Average exposure to Gen-AI and risk of automation by level of education, last available year
Note: Level of education according to ISCED 2011 (UNESCO, 2012[52]). Low corresponds to first digits 0-2, medium corresponds to first digits
3-4, high corresponds to first digits 5-8. Figure represents the weighted average across all OECD countries for which there is data. The estimates
are weighted averages based on employment by level of education.
Source: OECD calculations based on (Eloundou et al., 2023[47]), (Lassébie and Quintini, 2022[27]), labour force survey and employment by
occupations tables. See Annex 3.A for more details.
The large differences in exposure and risk of automation across levels of education is consistent
across all regions (Figure 3.20). High-skilled workers are expected to be more exposed to Generative AI
than the rest of the workforce in all regions. In just over 10% of regions, mostly non-urban regions in Latin
America and Romania, high-skilled workers are expected to be at least twice as exposed to Generative AI
as the average non-high skilled workers. As shown in Figure 3.20, the relative gap is much lower regarding
narrow-purpose technologies as, across regions, the risk of automation for high-skilled workers ranges
from 50% to 90% of the risk faced by low- and medium-skilled workers.
9.8
16.3
14.2
19.2
61.9
8.5
29.4
12.9
41.9
Narrow purpose
technologies
Gen-AI
Low Medium High Low Medium High
0
5
10
15
20
25
30
35
40
45
50
55
60
65
0
5
10
15
Level of education
Average risk/exposure (%)
Automation Gen. AI now Gen. AI now or near future

150
JOB CREATION AND LOCAL ECONOMIC DEVELOPMENT 2024 © OECD 2024
Figure 3.20. The overall trend in exposure across levels of education holds for all regions
individually
Relative gap in exposure estimates between highly educated workers and low- and medium-educated workers
across regions, last available year
Note: Figure represents the un-weighted regional average for all OECD for which there is reliable data. Relative gap represents the average
exposure of highly educated workers relative to the average exposure of medium low educated workers. Level of education according to ISCED
2011 (UNESCO, 2012[52]). Low corresponds to first digits 0-2, medium corresponds to first digits 3-4, high corresponds to first digits 5-8.
Source: OECD calculations based on (Eloundou et al., 2023[47]), (Lassébie and Quintini, 2022[27]), labour force survey and employment by
occupations tables. See Annex 3.A for more details.
Women are somewhat more exposed to Generative AI than their male counterparts, which is again
a reversal of previous trends. On average, the share of tasks done by women that can be sped up by
the use of LLMs is currently 4 percentage points higher than that of men, and this gap is expected to slightly
increase to over 6 percentage points in the near future (Figure 3.21).

151
JOB CREATION AND LOCAL ECONOMIC DEVELOPMENT 2024 © OECD 2024
Figure 3.21. Women are slightly more exposed to Gen-AI, a different trend from prior forms of
automation
Average exposure to Gen-AI and risk of automation by sex, last available year
Note: Figure represent the weighted average across all OECD countries for which there is reliable data. The estimates are weighted averages
based on employment by gender.
Source: OECD calculations based on (Eloundou et al., 2023[47]), (Lassébie and Quintini, 2022[27]), labour force survey and employment by
occupations tables. See Annex 3.A for more details.
The disparity in exposure between men and women is generally consistent across regions except
for a few regions where men are significantly more exposed to Generative AI than women
(Figure 3.22). Men tend to take on jobs that are at higher risk of automation in all regions studied. On the
other hand, women tend to perform jobs that are expected to be more exposed to Generative AI in most
but not all regions. Notable exceptions to this are La Guajira (Colombia), Oslo and Viken (Norway), Zurich
(Switzerland), Yorkshire and The Humber (United Kingdom), Greater London (United Kingdom) and South
East England (United Kingdom). In addition to differences in occupational uptake, these regional disparities
also reflect variations in sectoral composition across regions.
14
11.6
12.8
45.3
16.7
50.7
Narrow purpose
technologies
Gen-AI
Men Women Men Women
0
5
10
15
20
25
30
35
40
45
50
0
5
10
Average Average risk/exposure (%)
Automation Gen. AI now Gen. AI now or near future

152
JOB CREATION AND LOCAL ECONOMIC DEVELOPMENT 2024 © OECD 2024
Figure 3.22. Men are consistently more exposed to narrow-purpose technologies across regions,
while women are most exposed to Generative AI in most regions
Relative gap in exposure estimates between men and women across regions, last available year
Note: Figure represents the un-weighted regional average for all OECD for which there is reliable data. Relative gap represents the average
exposure of women relative to the average exposure of men.
Source: OECD calculations based on (Eloundou et al., 2023[47]), (Lassébie and Quintini, 2022[27]), labour force survey and employment by
occupations tables. See Annex 3.A for more details.
Examining the gender composition of industries sheds some light on the determinants of gender
differences in Generative AI exposure. This further highlights the ripple effects of varying industrial
compositions on the exposure of different economic groups. The share of men and women in each industry
(as opposed to the share of employment in an industry that are men or women) varies greatly across
industries (Figure 3.23). For example, in the real estate sector, approximately 2% of men and 3% women
are exposed. This similar share is understandable, as the industry is relatively small in terms of
employment, and its gender composition is balanced. On the other hand, manufacturing and construction
(less exposed) concentrate a significantly higher share of men while health (more exposed) concentrates
a significantly higher share of women.
Education, human health and social work are the primary industries driving high exposure to
Generative AI for women. These industries account for over 30% of female employment but only for
around 9% of male employment. In addition, these industries are expected to have a relatively high level
of exposure to Generative AI. Education, which concentrates close to 12% of female employment, is
expected to have an exposure to Generative AI that is 4 percentage points larger than average (44.4%),
while human health and social work is close to the mean. Nevertheless, the occupations that make up
these industries are quite broad as, for example, human health and social work includes both office jobs
(often clerical) and physical jobs such as doctors or physicians. This simple analysis does not reflect
potential gender differences within these industries that might further explain the gender gap in Generative
AI exposure.

153
JOB CREATION AND LOCAL ECONOMIC DEVELOPMENT 2024 © OECD 2024
Conversely, industries with mainly male workers are less exposed to Generative AI. Construction
and manufacturing, which together account for nearly 32% of male employment, have a below-average
exposure to Generative AI, with construction approximately 18 percentage points and manufacturing 9
percentage points below the average. Furthermore, the gender gap in these industries is substantial as
they account for only 12% of female employment. Other industries with a higher exposure to Generative
AI employ a significant share of both men and women, but the distribution of employment between genders
in these industries is more balanced, therefore contributing less to the gender gap in Generative AI
exposure (Figure 3.23).
Figure 3.23. The gender gap in exposure to Generative AI reflects higher shares of women in
exposed sectors
Share of employed men and women in each industry for EU countries, 2022
Notes: Highlighted sectors are the industries where the employment gap between men and women is most relevant, this is further discussed in
the text.
Source: OECD calculations based on (Eloundou et al., 2023[47]), labour force survey and employment by occupations tables. See Annex 3.A for
more details.
Zooming in on specific occupations
The latest wave of AI will not affect all groups of occupations to the same extent. While most
occupations are, or will be, affected in some way or another by the latest wave of AI, some occupations
may face more considerable change. The rest of this section zooms in on possible implications for jobs
and workers in cultural and creative occupations (OECD, 2022[53]), healthcare13, and software-related
occupations14.
At least some cultural and creative occupations are extensively using Generative AI, which has
already sparked tensions in the industry. Generative AI tools can help creative workers come up with
ideas, write scripts and text, and generate audiovisual content, among others. This has raised concerns

154
JOB CREATION AND LOCAL ECONOMIC DEVELOPMENT 2024 © OECD 2024
about copyright, as the way Generative AI models handle copyrighted content remains unclear, and
existing legal frameworks often fall short in addressing these issues. Workers in the industry have
expressed concerns over the use of this technology, with some escalating their grievances to the point of
strike action (Box 3.8).
Box 3.8. Use of AI in cultural and creative sectors
Cultural and creative sectors (CCS) is a term used to describe a range of activity which has its
basis in creativity and can typically be exploited through intellectual property rights. Broadly,
CCS includes the following sectors: advertising, architecture, book, newspaper and magazine
publishing, dance, design, fashion, film and television, libraries and archives, museums, art galleries
and heritage sites, music, radio, theatre, video games, and visual arts. Each of these subsectors require
different skills and have different dynamics and business models. Many jobs in CCS are non-cultural
and creative jobs (e.g., an accountant working for a film company) and therefore these sectors are
exposed to AI risks associated with many occupations beyond just cultural and creative ones. There
are several examples of the impact of AI in these sectors.
Film and television
AI has had a significant impact on the film and television industry in multiple areas. Machine
learning has been used in the visual effects industry (VFX) for over a decade in tasks such as
Rotoscoping (tracing the outline of an element of an image to move or replace it), motion tracking for
computer generated images (CGI), and picture or colour adjustments. Recently, AI use in VFX includes
extensive moving picture generation and digital asset manipulation, as well as helping to generate code
for some of the underlying programming of VFX engines.
Generative AI also has applications in idea generation, script writing and editing. While there is
yet to be a blockbuster hit with a screenplay written by AI, Generative AI is being used to help generate
ideas, edit, and even provide first drafts of scripts. Concerns over the implication of Generative AI for
the writing industry in the United States contributed to the Writers Guild of America strike action in 2023.
This large-scale industrial dispute was primarily due to differences in contract terms for writers working
on live broadcast vs streaming content. However, the issue of Generative AI was also raised as a
significant concern during the action. Resolution of the strike included agreements on new regulations
for the use of Generative AI in script writing.
Music
AI has been used in music production for a number of years, but advances in generative AI
models could lead to greater use of AI-generated vocals, instrumentals, and lyrics. Free AI music
generators are already on the market, allowing people to create new musical pieces with ease. Similar
to concerns with the use of LLMs in the publishing industry, this type of Generative AI raises significant
issues in relation to copyright and the ownership of AI-generated music. Machine learning models are
also playing an increasing role in shaping musical tastes, with major streaming platforms such as Spotify
using machine learning algorithms to recommend music to listeners. In addition, AI is being used in less
obvious ways in the music industry by, for example, helping rights management companies to identify
use of copyrighted material in film, television, and the internet to establish royalty payments and protect
copyrights.
Source: (OECD, 2023[54]).

155
JOB CREATION AND LOCAL ECONOMIC DEVELOPMENT 2024 © OECD 2024
Similarly, software related occupations are also extensively using Generative AI and qualitative
evidence suggest they have benefited from increased productivity and job satisfaction. These
occupations, which include programmers, database architects and software developers, for example,
already have multiple tools at their disposal which help them write and correct code, organise and clean
data, and produce digital designs, among others (Box 3.10).
The health sector faces significant labour shortages in certain regions and occupations (Box 3.9).
Although this sector has a lower labour market exposure to Generative AI (Figure 3.24) than average, this
technology could still help address labour shortages as there is a relevant share of occupations that are
highly exposed and therefore offer scope for Generative AI adoption (Figure 3.26). Health professionals in
charge of records, such as medical record specialist, are the most exposed within this group. In regard to
doctors, physicians, dietitians, and general physicians count among the most exposed. On the opposite
end of exposure are medical professionals whose jobs are not limited to diagnosis and who conduct
physical procedures, such as surgical assistants, dental hygienists, and paramedics.
In addition, applications of AI in the health sector are diverse, including development of
pharmaceuticals, diagnostics, and behavioural interventions through chatbots. For example, Japan
has been at the forefront of AI innovation and strives to actively integrate AI into its healthcare system to
enhance efficiency and address challenges, such as labour shortages (Cabinet Secretariat, 2024[55];
Ministry of Health, 2023[56]). The Japan Agency for Medical Research and Development (AMED) is working
to support the development of medical devices that utilize AI (AMED, 2024[57]). These efforts aim to improve
patient outcomes, streamline hospital operations, and mitigate the effects of an ageing population and
workforce shortages (Box 3.9).
Figure 3.24. Software jobs are significantly more exposed while the cultural, creative and health
occupations are closer to the labour market average
Average exposure to Gen-AI now or in the near future by occupation type
Note: Figure represents the weighted average across all OECD for which there is data, see Annex 3.A for more details. Top and bottom lines
indicate the 95% confidence interval. Source: (Eloundou et al., 2023[47])
47 43
87
45
Creative Health Programming All occupations
0
10
20
30
40
50
60
70
80
90
Average exposure to Gen. AI now or in the near future (%)

156
JOB CREATION AND LOCAL ECONOMIC DEVELOPMENT 2024 © OECD 2024
Box 3.9. Using AI to deal with labour shortages in the health sector
Nursing care industry in Japan
. The number of people requiring
nursing care is increasing due to the declining birthrate and ageing population. According to estimates
done by the Ministry of Health, Labor and Welfare, 570 000 new nursing care workers will be needed
by 2040. Under these circumstances, providing high-quality nursing care services efficiently to those
requiring care by actively utilizing digital technology has become an important issue in Japan.
AI has attracted a great deal of attention to solve these issues in the nursing care and welfare
industry. There are solutions already available, including DRIVEBOSS, which helps to plan
transportation routes and schedules to take facility users to and from nursing care facilities. AI Sakura-
san, a voice conversation customer service system, is also attracting attention as a solution to labour
shortages. AI Sakura-san takes over the work of in-house help desks, call centres, and inbound
customer service. Given the prevalence of night shifts in the nursing care and welfare industry, there
are high hopes for the system to be able to communicate with the elderly on behalf of staff.
AI innovation for the health sector in Japan
Japan's J-Startup program (Box 3.3) links the public and private sector to foster AI in various
industries. Startups are selected among a pool of over 10 000 projects, with examples in the healthcare
sector including:
• Aillis: Uses AI for real-time diagnostic assistance and aims to alleviate the shortage of
specialists by providing an emergency medical coordination system to share medical
information remotely. This includes remote support through live video streaming, surgery
support, and linking doctors to depopulated and remote areas to provide medical support.
• Ubie: Optimises the patient experience by streamlining in-hospital operations through AI online
interviews and matches patients with the relevant medical institution. This shortens not only the
process of patient uptake but also their stay in the hospital. It is currently used by over 1700
hospitals and clinics.
• AIM: Specialises in AI-driven endoscopic diagnostic support for GI cancers, improving early
detection and treatment planning. There is a shortage of endoscopists in Japan and the world,
and 20% of cancers are overlooked due to limitations of human observation.
AI to address shortages of medical professionals in the United Kingdom
The UK is experiencing a significant shortage of medical professionals and is turning to AI to
help address this challenge. By 2036, England is expected to face a shortfall of 260 000 to 360 000
doctors, nurses, and other health professionals, despite increasing recruitment of foreign-trained staff.
Administrative demands and documentation requirements are further compounding this problem,
decreasing the time available for patient care, and leading to greater workloads and burnout.
The National Health Service (NHS) in the UK has convened an expert group to explore ways in
which AI can support healthcare by automating routine tasks and augmenting the abilities of
clinical professionals. Technologies under consideration include speech recognition and natural
language processing (NLP) for clinical documentation, which could help free up time for medical
professionals to focus on patient care, as well as automated image interpretation, robotics for
interventions and rehabilitation, and predictive analytics using AI.

157
JOB CREATION AND LOCAL ECONOMIC DEVELOPMENT 2024 © OECD 2024
Planning and commissioning of local services will differ across regions. This approach aims to
enable each region to tailor technologies to their unique needs and challenges, addressing regional
priorities, and supporting the best use of available workforce and talent.
COVID-19 vaccines in El Chaco, Argentina
Argentina took a different approach on AI and healthcare, aiming to use behavioural nudges
through a Whatsapp chatbot to increase vaccination rates. In 2022, in a randomised controlled trial
(RCT), the country launched a WhatsApp chatbot, integrated with a booking system, aimed at
increasing vaccination rates in the province with the lowest COVID-19 vaccination rates, El Chaco. The
Ministry of Health of El Chaco collaborated with the private sector through a social impact company to
increase vaccination rates by helping people to schedule their appointments and sending reminders.
higher than that of the control group. Following the success of the RCT, the province of Tucuman
launched a chatbot in 2024 with the aim to increase routine vaccinations such as influenza and
COVID-19 boosters.
Sources: (AISmiley, 2024[58]), (Brown et al., 2024[59]), (Aillis, 2024[60]), (J-Startup, 2024[61]), (Ubie, 2024[62]), (AI Medical Services
Corporation, 2024[63]), (NHS England, 2024[64]), (NHS, 2023[65]).
The use of AI in healthcare presents significant ethical and privacy concerns. One of the main risks
involves the handling of large volumes of personal health data, raising concerns about how this information
is collected, stored, and used, and whether it could lead to breaches of patient confidentiality (Khan et al.,
2023[66]). AI algorithms also risk perpetuating biases if they are trained on biased data, potentially resulting
in unequal treatment for certain patient groups. Additionally, concerns about accountability arise when AI
makes errors in diagnosis or treatment, as assigning responsibility can become challenging in such cases
(Nicholson Price II, 2019[67]). Setting standards to protect patient data, maintaining confidentiality, and
avoiding exacerbation of inequalities are key ethical considerations that need to be tackled as the use of
AI solutions in the healthcare sector become more common. Changes in medical education may also be
required to prepare healthcare professionals for evolving roles and responsibilities.
Generative AI could lead to a greater transformation of cultural, creative and software occupations
than other types of occupations. On average, the potential of Generative AI to support or take over
specific work tasks are expected to lead to a 2 percentage points higher share of exposure in cultural and
creative occupations than for all occupations on average. In software occupations, the already existing
integration of AI tools and the progress in development of new tools that facilitate programming by creating
or optimising software code, such as GitHub Co-pilot (Box 3.10), results in even greater exposure to
Generative AI, which could reach up to 87% of workers (42 percentage points above the average).

158
JOB CREATION AND LOCAL ECONOMIC DEVELOPMENT 2024 © OECD 2024
Box 3.10. Use of AI in the programming industry
GitHub Copilot is an AI-powered coding assistant developed by GitHub in collaboration with
OpenAI. It leverages machine learning models to assist developers by providing code suggestions and
autocompletions directly within their integrated development environment. Copilot can help generate
whole lines or blocks of code, making it easier and faster to write software, reducing repetitive tasks,
and enhancing productivity.
The tool has a significant positive impact in the production of software developers. A study
rate of completing tasks and did so 55% faster than developers who did not use the tool. Letting GitHub
Copilot shoulder the routine and repetitive work of development reduced the cognitive load of
developers and allowed for better productivity. This tool is being used by 90% of the Fortune 100
companies and by more than 100 million developers.
Between 6075% developers reported feeling more fulfilled in their job, less frustrated when
coding, and able to focus on more satisfying work when using the tool. It also helped with
conserving mental energy, as developers reported that GitHub Copilot helped them stay in the flow
(73%) and preserve mental effort during repetitive tasks (87%). That is associated with developer
happiness, since previous research shows that certain types of work are mentally draining, and that
context switches and
Source: (Kalliamvakou, 2022[68]).
Some cultural and creative occupations are expected to be up to 90% exposed now or in the near
future, unlike many others that are much less exposed. The more cultural occupations such as
dancers, choreographers, glassmakers, or potters, mainly consist of tasks that are least likely to be
significantly accelerated through the use of Generative AI (Figure 3.25). These occupations generally
require more physical skill or presence, meaning they generally involve a greater share of low-exposure
tasks. Conversely, occupations such as journalists, translators, or graphic designers, involve more
computer-related tasks and do not have a substantial physical aspect, so these occupations are expected
to be highly exposed. Moreover, other types of Generative AI technologies beyond LLMs (such as image
and sound generation technologies) are already beginning to make an impact in cultural occupations that
may have been thought to be low risk for example, generative image technology can create and manipulate
so-, replicating a. Similarly, in music, generative
sound technology can automate the generation and production of music.

159
JOB CREATION AND LOCAL ECONOMIC DEVELOPMENT 2024 © OECD 2024
Figure 3.25. Most cultural and creative occupations are more exposed than the average
occupation, up to more than double
Average exposure now or in the near future, cultural and creative occupations
Note: Cultural and creative occupations are defined in ISCO at the 4-digit level according to the Eurostat definition used by the OECD.
Source: (Eloundou et al., 2023[47]), (OECD, 2022[53]).

160
JOB CREATION AND LOCAL ECONOMIC DEVELOPMENT 2024 © OECD 2024
Figure 3.26. Almost half of health occupations are more exposed than the average occupation
Average exposure now or in the near future, health occupations
Note: Selected health occupations.
Source: (Eloundou et al., 2023[47]).
The role of AI in driving regional productivity and addressing labour market
challenges
AI holds potential to improve productivity and support regional growth
AI, particularly new general-purpose models which can work autonomously, hold potential to
address stagnating productivity gains and enhance innovation across OECD economies (see
Chapter 1). This can be particularly relevant in tackling the demographic challenges of an ageing society.
As the working-age population shrinks, AI can help maintain productivity by enabling fewer workers to
achieve a higher output, thereby sustaining economic growth despite demographic decline. Micro-
econometric studies find that the productivity gains from non-generative AI on firms are comparable to
those from previous digital technologies (up to 10%). However, performance benefits from using
Generative AI in tasks such as writing, programming, or handling customer services requests can range
from 10% to 56% (Filippucci et al., 2024[16]). These gains are especially impactful for workers with less
experience.
As AI adoption is still low, the long-term, and broad economic impact of this technology remains
uncertain. In the US, less than 5% of firms report using Generative AI, making it difficult to observe
macroeconomic gains at present (Filippucci et al., 2024[69]). Although the user-friendly nature of new AI
tools may accelerate their adoption, realising their full potential still requires substantial complementary
investments in data, skills, and software. Estimated aggregate gains suggest AI could contribute between
0.25 and 0.6 percentage points to annual total factor productivity (TFP) growth over the next ten years,

161
JOB CREATION AND LOCAL ECONOMIC DEVELOPMENT 2024 © OECD 2024
boosting annual labour productivity by 0.4 to 0.9 percentage points. However, these estimates carry
significant uncertainty (OECD, 2024[70]).
AI research and development, as well as adoption, is uneven across places, potentially deepening
existing societal divides. AI activities could bring significant benefits to cities and regions, with the sector
projected to grow from USD 184 million in 2024 to USD 826 billion by 2030 (Statista, 2024[71]). Some
places, however, are better positioned to benefit from the opportunities in AI than others. In Europe,
Germany, France, and Spain have traditionally been the strongest AI economic players (Righi et al.,
2022[72]). In the US, AI firms are highly concentrated in the San Francisco Bay Area, with other important
hubs across the country such as New York, Boston and Seattle, where large companies are already driving
early adoption (Muro and Liu, 2021[73]). Factors such as regional skills, leading research institutions, and
a strong innovation ecosystem, have proven to be some of the main aspects driving AI research,
development, commercialisation, and adoption in these places.
There are concerns about market competition, as AI development and adoption is concentrated in
a few dominant players. Adoption trends indicate a divide: larger firms and those in ICT sectors are
integrating AI faster, while smaller and older firms are lagging behind (Calvino and Fontanelli, 2023[2]). This
raises concerns about potential market distortions, particularly if early adopters gain substantial market
power, making it challenging for other firms to compete. It remains uncertain whether the productivity gains
achieved by early adopters will diffuse to other firms, potentially deepening existing economic divides
(Filippucci et al., 2024[16]). Furthermore, the success of AI adoption often relies on complementary assets,
including ICT skills and training, firm-level digital capabilities, robust digital infrastructure, access to quality
data and computer power, as well as general workforce skills (Calvino and Fontanelli, 2023[2]). Not all
regions or firms have equal access to these resources, which may exacerbate existing disparities and
leave some regions struggling to keep pace. Additionally, the demand for AI talent is more widespread
across sectors, which could provide evidence of the general-purpose nature of AI technologies.
The widespread use of AI also raises concerns about its impact on employment. While AI
technologies have the potential to boost productivity, augment human abilities, and create new job
opportunities, they also bring the risk of displacing workers. Generative AI, for instance, poses risks even
for jobs traditionally viewed as secure from automation. However, recent evidence indicates that instead
of reducing their reliance on human labour, companies across various sectors are responding to AI
adoption by restructuring internally, reallocating workers to tasks where humans have a comparative
advantage rather than displacing them (Filippucci et al., 2024[16]).
Effective public policy can maximise the benefits of AI technologies for workers and communities,
while also addressing its potential negative effects. A key concern is promoting widespread AI
adoption while preventing excessive market concentration. This means reducing barriers to adoption,
supporting smaller firms, and ensuring fair competition without stifling innovation. Human complementarity
with AI is also important, implying that AI should augment, rather than replace, human work. To achieve
this, policies can encourage retraining and labour reallocation, helping workers transition into new roles
and adapt to the use of AI technologies (Box 3.11). Preparing for rapid adaptation is equally important. AI-
driven transformations are unpredictable, and responsive policy measures that adjust to these shifts can
help technological progress benefit workers, communities, and industries, rather than contributing to
inequality or causing disruption (OECD, 2024[70]). Furthermore, public policy can foster acceptance and
trust by developing mechanisms to keep AI technologies in line with strict ethical standards, thereby
improving transparency and accountability.

162
JOB CREATION AND LOCAL ECONOMIC DEVELOPMENT 2024 © OECD 2024
Box 3.11. Future Skills Centre: Improving AI skills and attitudes across Canada
The Future Skills Centre is promoting various initiatives to enhance professional development
and equip workers with the skills to work with AI. The Future Skills Centre is a national organisation
dedicated to preparing workers across Canada for the changing demands in the workforce by investing
in skills development initiatives. Three examples of projects related to AI issues are:
• Accelerating the appropriate adoption of Artificial Intelligence in healthcare: This pan-
Canadian project completed in 2024 aimed to overcome reluctance
to adopt AI by offering tailored education and training. The project developed interventions such
as certificate programmes and mentorships to equip healthcare professionals with the skills and
confidence to integrate AI into their practice. As a result, the project saw improved attitudes
toward AI adoption, enhanced patient care, more efficient workflows, and increased confidence
in AI systems.
• From data to decision: AI training and professional certification: This pan-Canadian
project addresses the growing demand for AI skills by offering a short-duration, online training
programme developed by IVADO and Université de Montréal. The project aims to train 1 000
mid-career professionals and leaders across Canada on how to integrate AI into their
organisations and make better use of the data they generate. The initiative includes self-
assessment tools to identify skill gaps, a training path with up to seven courses, and professional
certification for successful participants.
• Facing the challenge of digital transformation in the insurance sector: Women at work:
This project in the Quebec region addresses the impact of digital transformation on female
workers in the insurance sector, where AI and automation threatens low-skill positions typically
held by women. Led by a consortium at Laval University, the project assesses the skills
development needs of female insurance workers and creates training pathways to reskill and
support them in transitioning to future-facing roles, helping them remain competitive in the
changing labour market.
Source: (Chan and McDonough, 2024[74]), (Future Skills Centre, 2024[75]), (Future Skills Centre, 2024[76]).
Evidence suggests that policy attention could also benefit from considering the shifting geography
and socio-economic effects of Generative AI compared to previous technological advancements.
increasingly falls on urban labour markets, which could
drive growth in cities but also risks widening disparities between urban and rural regions (Figure 3.18).
Moreover, Generative AI is likely to impact a different set of workers compared to previous technologies.
This changing landscape suggests the need for adaptive policies for a different and emerging group of
workers and regions.
Regions with a high proportion of jobs at risk of automation could benefit from monitoring job
displacement trends to facilitate timely responses. Tracking employment in specific sectors and
occupations can help regions identify local needs and react with appropriate place-based policies. This
approach allows for the timely development of reskilling programmes, support for affected workers, and
strategies to foster new employment opportunities. A proactive policy response can help mitigate potential
negative effects, while enabling regions to harness the benefits of new technologies.
Assessing the existing skills base in regions with high labour market exposure to Generative AI
could help develop targeted programmes to strengthen AI-related competencies. Conducting a
comprehensive inventory of available skills could help policy makers and businesses identify gaps and
opportunities, enabling them to better prepare the workforce to adapt to the evolving skill demands.

163
JOB CREATION AND LOCAL ECONOMIC DEVELOPMENT 2024 © OECD 2024
By implementing tailored training and upskilling initiatives, these regions can mitigate potential disruptions,
but also capitalise on the transformative potential of Generative AI. These efforts can include training
programmes, grants, tax incentives and establishing innovation networks, among others.
By fostering AI local capabilities, regions can modernise traditional industries, attract investments,
and leverage emerging technologies for sustainable growth. This is not only relevant for regions that
are heavily impacted by automation, but also for those dealing with demographic challenges, low job
creation, outmigration, and outdated industrial bases. For these regions, adopting AI strategies presents a
dual opportunity: revitalising their economies while mitigating the potential adverse effects of automation
(Box 3.12). Effective AI integration, paired with policies to support skills development and job transitions,
can lead to more resilient regional economies and balanced growth across various sectors.
Box 3.12. Regional AI and automation strategies for economic revitalisation
La Rioja, Spain
La Rioja is a
small region in Northern Spain with a strong industrial and agriculture sector. This industrial composition
manufacturing, and in fact the region has the highest share of jobs at risk of automation within Spain (
Figure 3.3
drop in employment in these jobs (Figure 3.7).
The region is advancing initiatives to promote research and business development focused on
the application of AI and big data. This includes initiatives like the Parque Científico Tecnológico de
La Rioja, an initiative for which the first stone has already been set in the form of the Tech FabLab
which aims to promote technological business initiatives based on AI and other disruptive technologies
(Gobierno de La Rioja, 2024[77]). This aligns the regions path with the stated national goal of having at
least 25% of companies use AI and big data in five years.
Piedmont, Italy
Piedmont is one of the most industrialised regions in the OECD, with around a fifth of its jobs
in the industrial sector. The automotive industry has been historically a big part of this sector but has
driven a 17% decline in industrial jobs between 2004 to 2018 (OECD, 2021[78]). A large part of this drop
in employment can be attributed to automation-led job displacement (Figure 3.7) and most likely
happened in waves, as this region has and above average number of mass layoff events in the last 10
years (Figure 1.27). Within the automation sector, the main actor is Fiat, an Italian automaker that has
scaled down production in the region since it became part of Stellantis, a multinational automotive
manufacturing company.
The region is aiming to shift its development strategy towards one of innovation by providing
support for existing businesses and start-ups. These incentives take the form of grants, direct
financing and financing guarantees, vouchers, and tax benefits, among others. Although the new
development strategy is still ongoing, Piedmont has managed to leverage its existing industry and talent
to establish itself as an R&D hub which concentrates over
(EY, 2022[79]).
Georgia, United States
The state of Georgia has a high percentage of jobs at risk of automation (13.5%) compared to
the OECD average (8.8%) (OECD, 2024[80]). Manufacturing is the second-largest contributor to
Georgia's GDP, primarily in machinery, electrical equipment, and fabricated metals (IBISWorld,

164
JOB CREATION AND LOCAL ECONOMIC DEVELOPMENT 2024 © OECD 2024
2024[81]). However, Georgia's manufacturing industries face challenges that stem from a combination
of global competition, reliance on traditional manufacturing, and a need for modernisation.
The Georgia AI Manufacturing (GA-AIM) coalition, supported by the U.S. Department of
a grant of USD 65 million through
the American Rescue Plan Regional Challenge (Georgia AIM, 2024[82]). The initiative focuses on
accelerating AI technology integration in key sectors like semiconductors, batteries, electrification, food
production, aerospace, and defence. It aims to build regional resilience, catalyse local industries, and
create quality jobs, while fostering economic growth, and serving as a national example for how to
accelerate automation in manufacturing. The coalition will also establish an AI Manufacturing Pilot
Facility at Georgia Tech and seeks to expand job training for underserved communities so that
automation benefits workers rather than replace them (EDA, 2022[83]).
Source: (Gobierno de La Rioja, 2024[77]), (fDi Intelligence, 2023[84]), (OECD, 2021[78]), (Regione Piemonte, 2024[85]), (EY, 2022[79]), (EDA,
2022[83]), (Georgia AIM, 2024[82]).
AI can be a tool to alleviate current labour market challenges
With over 30% of OECD regions losing population and over 90% ageing,15 a major challenge for
policy makers is addressing workforce needs with a shrinking working-age population (OECD,
2024[86]). At the same time, labour shortages are pervasive across OECD regions (see Chapter 2) and
may widen given current demographic trends.
AI and related technologies can be leveraged to address current region-specific labour market
challenges and provide support to marginalised workers. Regions experiencing workforce shortages
may benefit from increased use of AI either through upskilling workers with AI tools or by directly
implementing AI technologies to fill positions left vacant due to demographic decline or other factors.
This is particularly true for regions with a concentration of industries facing challenges in workforce
availability (Box 3.13). In such cases, capital investment in AI becomes a viable alternative, with its
applications broadening thanks to technological advancements. In addition, low- and medium-skilled
workers can also benefit as AI may be used as a tool to close skill gaps.
These technologies can also help mitigate labour shortages by offering career guidance for critical
occupations and enhancing labour market matching across regions. Labour markets shortages often
arise in seemingly unattractive careers, but career guidance can help address misconceptions and attract
talent. In the education sector, for example, Generative AI can be leveraged through chatbots aimed at
answering questions and addressing doubts of high school students who are interested in becoming
teachers (Box 3.13). There are already examples of AI technologies being used to better match skilled
workers with open positions, enhancing regional mobility and, in turn, improving labour market efficiency.

165
JOB CREATION AND LOCAL ECONOMIC DEVELOPMENT 2024 © OECD 2024
Box 3.13. Using AI to alleviate labour shortages in industries with tight labour markets
Manufacturing
In the United States, the manufacturing sector has critical labour shortages. It is estimated that
even if every skilled worker in the US was employed, there would still be 35% more unfilled job openings
in the durable goods manufacturing sector than skilled workers capable of filling them (Gow, 2022[87]).
Technology presents itself as a solution, as AI with the support of robotic automation can save at
least 75% of the labour costs of using humans alone, enable 24-hour continuous production, and help
avoid injuries. In fact, the use of technology in tight labour markets helps maximise the productivity
gains from any potential automation of work (OECD, 2023[88]).
Generative AI provides novel, more advanced solutions for this sector. Additive manufacturing,
such as 3D printing, requires highly skilled designers and engineers to draw on years of experience
tion. AI now empowers a rapid, generative
approach to developing complex and highly optimised design solutions that can be produced quickly
through 3D printing. Machine vision and product optimisation are also technologies that can help. For
example, the use of cameras and AI that recognise the shape, orientation, and condition of assembly
line products under various lighting conditions eliminate the need for human eyes and hands in the
questions and answers process.
Education
The education sector is critical to a regions development, but filling essential positions can be
challenging, leading to some of the most relevant examples of labour shortages. In the United
States, for example, there were an estimated 55 000 vacant teaching positions at the start of the school
year in 2023, 51% more than in 2022, and 270 000 teachers were working without meeting state
qualifications. Chile is another example of a country facing a significant teacher shortage, with an
estimated deficit of 26 000 qualified teachers for 2025, representing 19% of the required workforce.
Regions far from the capital can have a much larger shortage, reaching 40% of the required workforce
in regions such as Atacama, Magallanes, and the Chilean Antarctica. This deficit is caused by a low
level of attractiveness of the profession and a high desertion rate as 19% of new teachers leave after
their first year.
AI tools have emerged to produce learning materials, attract and retain talent, and provide
mentoring and support for new teachers. Bookbaker, for example, is a Generative AI tool that allows
teachers to create custom learning materials personalised for their students, and aligned with their
curricula, therefore freeing up time and resources from already heavy teaching workloads. In Chile, the
non-profit organisation Elige Educar has been pioneering the use of AI with two initiatives: Quiero Ser
Profe and Somos Profes, Somos Educadores. The former uses chatbots alongside human tutors to
provide personalised information and support to students interested in pursuing a teaching career,
helping them make informed decisions. The latter employs AI tools to provide mentoring and support
to new teachers and early childhood educators during their initial years in the profession.
And other sectors
The practical solutions offered by AI extend to several more sectors, from professional services
to agriculture and life sciences. For example, in the legal sector, Latham & Watkins deployed a model
that scans documents and produces accurate legal briefs. This tool can reduce contract review time by
60% (Virtasant, 2024[89]). In agriculture, AI-powered drones facilitate precision farming, while other
technologies are being used to automate irrigation, pest control, and enhance crop yields. In addition,
smart farms have emerged in San Francisco, where agricultural activities are conducted in highly

166
JOB CREATION AND LOCAL ECONOMIC DEVELOPMENT 2024 © OECD 2024
controlled environments monitored and managed by digital systems. In life sciences, AI-powered tools
designed to assist in patient diagnosis are expected to improve accuracy and free up medical
professionals to spend more time on patient care, while AI technologies for drug development are
expected to speed up the research process.
Source: (Gow, 2022[87]), (Elige Educar, 2020[90]), (Elige Educar, 2020[90]), (Post, 2024[91]).
The integration of AI in the workplace holds the potential to address skill gaps among workers.
Workers with lower skill levels typically face more difficulties in the workplace, such as limited job
opportunities, lower wages, and reduced job security. AI-powered tools can be used to enhance workers
capabilities, thereby levelling the playing field and providing access to better job opportunities. For
example, AI-powered tools can assist workers in performing complex tasks that would otherwise be beyond
their skillsets, such as coding, and data analysis.
AI can improve the participation in the workforce of people with disabilities who remain
significantly underrepresented in the labour market. As of 2019, people with disabilities in OECD
countries were 2.3 times more likely to be unemployed compared to their non-disabled counterparts, with
27 percentage points lower employment rate (OECD, 2023[92]). Equipping workplaces with AI tools and
teaching workers with disabilities the skills to use them could increase the labour force, closing employment
gaps and promoting greater inclusion.
AI-powered tools, such as automated vehicles, can enhance mobility, and improve accessibility in
work environments. To harness these benefits, there is a need for pro-active government policies that
promote inclusive AI development, and sustainable funding for AI research and accessibility solutions.
Mobilising AI-solutions for workforce participation for people with disabilities could be particularly relevant
in regions with poor communications or limited accessibility, as well as regions struggling with labour
shortages. One example is the (goMARTI) project in
Grand Rapids, Minnesota, United States. This project offers a free self-driving shuttle service designed to
help residents, particularly those with mobility challenges, access different locations under rural and winter
conditions (goMARTI, 2024[93]).
Policies aimed at closing the AI skills gap could facilitate a more equitable access to technological
advancements, benefiting workers of all skill levels. Demand for advanced AI skills - those needed to
develop AI systems - such as natural language processing (NLP) or machine learning (ML) is growing
rapidly, but they only account for around 1% of jobs postings (Borgonovi et al., 2023[94]). The main policy
challenge lies in boosting AI skills which are useful for a larger segment of the population. Recent research
shows that 61% of European workers agree that it is fairly or very likely that they will need new knowledge
and skills to cope with the impact of AI tools on their work in the next five years, but 44% think it is unlikely
that their organisation will provide the training (Cedefop, 2024[95]).
Reliable internet access is essential for workers to fully leverage AI tools, but limited or slow
connectivity remains a challenge in certain OECD regions. On average, 84% of households have
internet access across the OECD, but this figure can be as low as 50% in some OECD regions.
Furthermore, cities experience 13% faster internet on average than the rest of the country (OECD,
forthcoming[96]). Consequently, the internet is faster and more accessible in urban areas, which are also
the regions with higher levels of exposure to Generative AI. This fact deepens the regional divide in
Generative AI exposure as the fewer workers exposed may, in practice, experience even lower levels of
adoption due to barriers posed by slow or limited internet access in their region. This underscores the
importance of ensuring that, alongside training programmes and software tools, physical infrastructure also
receives policy attention.
167
JOB CREATION AND LOCAL ECONOMIC DEVELOPMENT 2024 © OECD 2024
Navigating the future: public policy for jobs in the AI era
Impact of AI within the workplace
New roles are emerging to develop and deploy AI solutions, increasing the demand for AI-related
skills. In the US, for instance, firms providing AI solutions have increased by 4 percentage points between
2010 and 2017, going from less than 1% to more than 5% of all technology firms (Muro and Liu, 2021[73]).
Examples of roles that fine-tune AI tools include data annotators, who label and organise data such as
images, text, or audio enabling AI models to learn and make accurate predictions; AI operations
specialists, who oversee the performance and integration of AI systems in real-world settings; and AI
trainers, who improve AI models by providing feedback and adjusting algorithms to enhance performance.
Machine learning and natural language processing are some of the most sought-after skills in AI-related
job vacancies. Despite the rapid growth of AI, however, less than 1% of all job postings are AI-related
(Borgonovi et al., 2023[94]).
AI is also creating new roles to work alongside emerging technologies. Many of these new roles are
focused on monitoring, maintaining, and improving the systems that integrate AI into existing operations.
For instance, in the mining industry, robotic automation has led to new roles managing machines through
digital twins, which are virtual replicas of equipment. These digital twins optimise mining operations and
improve worker safety by allowing remote monitoring and control, reducing exposure to hazardous
conditions, and increasing operational efficiency through predictive maintenance (Saes, 2024[97]). This
example highlights how AI and automation can render some traditional jobs obsolete (e.g., conventional
mining) while simultaneously creating new opportunities to work alongside AI technologies.
The labour market impact of AI extends beyond job displacement, job creation, and productivity,
as recent evidence suggests that the most significant impact of AI is concentrated on tasks rather
than jobs. Instead of fully displacing jobs, most European workers declare that AI has an impact on their
job tasks. In fact, 30% of European workers who use AI technologies and tools to do their job experienced
a reduction or disappearance of some tasks, while 41% reported new tasks in their jobs. In addition, for
68% of workers, the main effect of AI technologies, so far, has been to enable them to do their job tasks
faster (Cedefop, 2024[95])16. This suggests that jobs will not only be created or destroyed but also
transformed in their execution and processes. Therefore, issues are expected to arise within the workplace
as new skills become essential (or obsolete), knowledge of AI systems becomes necessary, and the use
of technology to monitor workers increases.
People are likely to experience AI's impacts within their existing roles, emphasising a growing need
for widespread digital skills. recognise
how these tools can augment their capabilities at work and develop specialised skills to create a symbiotic
relationship with AI-technologies (Zirar, Ali and Islam, 2023[98]). Digital skills, such as IT literacy or basic
knowledge of machine learning models, will be important to work and interact with AI. These skills help
workers comprehend how AI solutions operate, and understand AI system's capabilities, limitations, and
underlying logic. Other high-level cognitive skills will also be important to understand how AI can fit within
and to make informed decisions based on AI-generated outputs (OECD, 2023[88]).
To adapt to AI systems and implement them in their job, workers may need upskilling and reskilling, which
could in turn increase trust in AI adoption. Furthermore, in an OECD survey, workers indicated that AI has
increased the importance of human and interpersonal skills, such as creativity and communication, more
than of AI specialised skills (Lane, Williams and Broecke, 2023[99]).
As AI is incorporated into everyday work life, workers may benefit from increased productivity and
reduced time spent on tedious tasks, potentially leading to higher job satisfaction. Software
programmers who have integrated an AI tool in their everyday work, for instance, are able to finish more
tasks, more quickly, and reported feeling more fulfilled in their job (Box 3.14). In addition, a recent survey

168
JOB CREATION AND LOCAL ECONOMIC DEVELOPMENT 2024 © OECD 2024
of the manufacturing and finance sector indicated that nearly two-thirds (63%) of workers reported AI had
improved their enjoyment at work (OECD, 2023[88]). Experimental evidence in the consulting industry
shows that real-world tasks can be done better and faster with the use of Generative AI tools.
Research also shows that AI can act as a skill-leveller, boosting the performance of low-skilled workers
with a smaller effect on high-skilled workers (Box 3.14). Regions that struggle to attract high-skilled workers
may therefore benefit from AI as it could enable low- and middle-skilled workers to fill positions that were
previously beyond their reach. These examples highlight the importance of AI as a tool to augment
productivity rather than replace jobs.
Box 3.14. Experimental evidence on the impact of Generative AI in the workplace
al. (2023[100]) experimentally tested the performance implications
of AI on realistic, complex, and knowledge-intensive tasks. Consultants from the Boston Consulting
Group (BCG) were evaluated on their ability to carry out creative, analytical, writing, marketing, and
persuasiveness tasks. A
was multidisciplinary, involving multiple types of experiments and hundreds of interviews.
Participants were split into groups and asked to carry out several fictional tasks common to the
consulting profession. The test group was allowed to use Chat-GPT 4, a widely utilised Generative
AI platform, while the control group was not. All participants underwent a pre-test without any
Generative AI technology to establish a baseline for measuring their improvement.
AI had a significant positive impact on all measures. Consultants using AI finished 12.2% more
tasks on average, completed tasks 25.1% more quickly, and produced 40% higher quality results than
those without AI. The quality of the output was rated by both human and AI graders. Introducing
participants to the AI tools and giving them an overview of how they work had no significant effect.
Results suggests that AI is a skill leveller as poor performers were heavily boosted by AI while
top performers were moderately boosted. The consultants who scored the worst when initially
assessed experienced the largest jump in their performance, 43%, when they were able to use AI. Top
consultants also received a boost, but a significantly smaller one.
In contrast, when faced with a particularly hard task, participants who did not have access to
Generative AI came out on top. The authors constructed a specific task that was designed to be
unsolvable by the Generative AI tool, or at least not correctly. Participants not using AI were successful
84% of the time while the treated group was successful only between 60% and 70% of the time. This
result suggests that too much AI can potentially be harmful as users are over-confident of the platfor
ability and fail to check its output. Similar research in a different work environment arrived at a similar
conclusion [101]).
Source: al., 2023[100]), [101]).
On the other hand, the adoption of AI in some work processes can have negative effects on both
job satisfaction and the quality of produced work. For instance, modern practices such as algorithmic
management can lead to heightened stress and overall job dissatisfaction (Box 3.15). In addition, although
the automation of routine tasks can free up time for more engaging work, it can also have negative effects
as it can, if implemented poorly, increase work intensity, and reduce a workers agency. The impact of
technology on job satisfaction heavily depends on workers' ability to participate in its design and
implementation (Gmyrek, Berg and Bescond, 2023[19]). Finally, using Generative AI can result in a lower
quality of outputs if it is applied to tasks or activities that it is ill-suited to address (Box 3.14).

169
JOB CREATION AND LOCAL ECONOMIC DEVELOPMENT 2024 © OECD 2024
Organisational change management will play an important role in determining how AI technologies
are embraced in the workplace. While AI has the potential to enhance productivity, improve decision-
making, and increase job satisfaction, these benefits may remain unrealised without a proper approach to
AI implementation. An OECD survey of employers and workers in the manufacturing and finance sectors
showed that, although both employers and workers have generally positive attitudes about the use of AI,
concerns over job loss, stability and potential pressures on wages also prevail (Lane, Williams and
Broecke, 2023[99]). Early involvement of employees in the adoption process can help them understand the
technology's value and potential benefits, reducing resistance to change (Lane, Williams and Broecke,
2023[99]; Hechler, Oberhofer and Schaeck, 2020[102]). Training is also relevant to help employees adapt to
new tasks, (Lane, Williams and
Broecke, 2023[99]). Companies such as IBM strive to improve technology skills and usage among
employees by mandating 40 hours of annual learning. The training includes courses on AI, allowing
employees to test IBM's in-house AI tools, which has increased both technology adoption and trust in AI
systems within the company.
Box 3.15. AI for task management in the workplace
The effects of algorithmic management on job satisfaction and working conditions emphasises
the importance of worker agency and participation in technological adoption. Algorithmic
management, which uses data-driven algorithms to manage work tasks and evaluate performance,
often reduces worker autonomy and feedback opportunities, while increasing surveillance. This can
lead to heightened stress and job dissatisfaction, particularly in environments where workers have little
control over their tasks and limited interaction with management (Baiocco et al., 2022[103]).
Amazon warehouse workers in the United Kingdom, for instance, have expressed feeling pressured
to work at the fast pace set by automated systems to meet performance targets (GPAI, 2024[104]).
Amazon employs a system in their warehouses called Associate Development and Performance Tracker
(ADAPT) to monitor performance and provide feedback across a range of dimensions including productivity,
quality, safety, and behaviour. The ADAPT system is able to track how many tasks each worker completes,
such as how quickly items are packed or processed, and uses this data to assess performance. In some
cases, it can generate automatic warnings if workers fail to meet set targets.
Algorithmic management systems for task assignment and monitoring are also common in call
centres and in the gig economy (McKensey & Company, 2021[105]). In call centres, AI systems are used
to monitor call quality, response times, and employee interactions. In the gig economy, platforms such as
Uber and DoorDash rely on AI to track worker performance and manage job allocation. These systems use
predictive analytics to match workers with tasks, monitor productivity, and assess customer ratings. While
AI's role in managing both customer interactions and gig workers can improve operational efficiency, it also
raises concerns about the balance between worker autonomy and automated oversight.
However, technology can also have positive effects on job satisfaction. A recent report shows that
when workers are actively involved in the design and implementation of new technologies, the outcomes
can be more positive (Gmyrek, Berg and Bescond, 2023[19]). Countries with strong frameworks for
workplace consultation and decentralised decision-making, such as those in the Nordic region and
Germany, demonstrate higher worker acceptance and better job satisfaction. Thus, the key to
maintaining job quality in the face of technological advancements lies in robust worker participation and
dialogue, which can help integrate technology in ways that enhance, rather than detract from, job
satisfaction.

170
JOB CREATION AND LOCAL ECONOMIC DEVELOPMENT 2024 © OECD 2024
AI's integration into the workplace raises important questions regarding workers' rights. Algorithmic
management, where algorithms determine work assignments and evaluate performance, can result in
heightened surveillance and work intensity as AI tracks worker behaviours, productivity, and movements
in real-time (Box 3.15). This can lead to increased work pressure, stress, and risks to both mental and
physical health (OECD, 2024[107]). This type of management can also reduce feedback and complicate
collective bargaining, as it is challenging for workers to organise around a management system they cannot
directly see or interact with (CLJE LAB, 2024[108]). Furthermore, algorithmic decision-making in hiring,
promotions, or terminations is opaque and can lead to biases, potentially discriminating against certain
groups. Extensive data collection without appropriate regulations may also compromise workers' privacy
by exposing personal information to misuse or unauthorised access.
Putting transparency and responsibility at the core of AI use and giving workers a voice through
. Following OECD AI
Principles, having trustworthy AI means that AI development and use are safe and respectful of
fundamental rights such as privacy, fairness, and labour rights. Additionally, employment-related decisions
made by AI should be transparent and understandable by humans (OECD, 2023[109]). It is important for
employers, workers, and job seekers to be informed about AI usage and for accountability mechanisms to
be clear in case issues arise. Collaboration with social partners can also be critical in shaping how AI is
integrated into the workplace and to protect workers' rights (Kinder et al., 2024[110]). Robust policy
measures and ethical guidelines are required to maintain fair treatment, protect worker data, and provide
retraining opportunities to mitigate the risks of displacement. The US Department of Labor (2024[111]), for
instance, has published a set of AI Principles and Best Practices for integrating AI responsibly,
emphasising worker engagement and training to prevent displacement and facilitate equitable benefits. In
the EU, the AI Act (European Parliament, 2024[112]) addresses risks related to safety, health, and
fundamental rights, with specific provisions for high-risk applications in the workplace. Although many
OECD countries are developing similar initiatives, most AI-specific measures remain non-binding and
depend largely on organis-regulate (OECD, 2023[109]).
Opportunities and challenges of AI adoption for SMEs
Small and medium size enterprises (SMEs) can leverage digital tools, such a Generative AI, to
optimise their operations, but support for technology adoption is limited. Recent evidence suggests
that SMEs tend to view the opportunities of Generative AI as higher than the risks. These enterprises face
challenges in adopting digital technologies including higher cost, a lack of skills, or cybersecurity risks.
Initiatives that support AI adoption for SMEs can help improve their operations, allow them to fully realise
the potential of these technologies, and minimise risks, enabling SMEs to innovate without falling behind
in the rapidly evolving digital landscape (examples in Box 3.16).
Platform cooperatives have emerged as alternatives to conventional platforms to help tackle
challenges such as job quality, employer status and asymmetry in bargaining power. Unlike
traditional platforms, platform cooperatives are owned and democratically managed by their workers
that use websites and mobile apps to sell goods and/or services (OECD, 2023[106]), In the context of AI,
workers in platform cooperatives could actively participate in decisions about how algorithmic systems
are designed and implemented, such as determining the criteria for task allocation. By involving workers
in these decisions, platform cooperatives offer a model that could mitigate the risks of low job quality
often associated with traditional platform work, where workers have limited agency.
Source: (Gmyrek, Berg and Bescond, 2023[19]), (Baiocco et al., 2022[103]), (GPAI, 2024[104]), (McKensey & Company, 2021[105]), (OECD,
2023[106]).

171
JOB CREATION AND LOCAL ECONOMIC DEVELOPMENT 2024 © OECD 2024
Box 3.16. Initiatives to support AI adoption in SMEs
SMEs-Digital (Mittlestand-Digital), Germany
The SMEs-Digital initiative is designed to help small and medium-sized enterprises (SMEs),
crafts, and start-ups in Germany to navigate the complexities of digital transformation. With 163
local and thematic centres across Germany, its primary goal is to provide these businesses with free
orientation and resources to understand and leverage the opportunities presented by digitalisation while
addressing the associated challenges.
To achieve this, the initiative offers a comprehensive range of support services specifically
tailored to the needs of SMEs. Activities within SMEs-Digital include workshops and training sessions
on various technologies, such as AI, which are designed for different levels of expertise. Additionally,
SMEs can benefit from personalised consultations with experts, who provide tailored advice on how to
implement digital solutions. The initiative also facilitates networking and collaboration opportunities,
along with the chance to participate in demonstration projects, allowing SMEs to better understand how
digital technologies can be integrated into their processes.
Starting in 2024, the initiative will place a heightened focus on AI and AI readiness. This shift
aims to enhance the availability and preparation of high-quality data, which is crucial for the effective
implementation of AI applications in SMEs. By fostering a deeper understanding of AI and its potential
applications, SMEs-Digital seeks to equip businesses with the tools and knowledge necessary to
integrate AI into their operations.
SCALE-AI, Canada
SCALE-AI is a Canadian innovation supercluster programme focused on accelerating the
adoption and commercialisation of AI across supply chains. Supported by the Canadian
government and managed from its headquarters in Montreal, the programme is a public-private
partnership bringing together businesses, research institutions, and universities. The main goal of
collaboration among SMEs and large companies.
SCALE-AI provides a variety of tailored services and funding opportunities to help SMEs adopt
AI technologies and improve their operational processes. Activities include hands-on workshops,
training sessions, and access to mentorship programmes that guide SMEs through the process of
implementing AI solutions. The programme also helps SMEs connect with AI experts and larger
organisations and offers funding for AI-based research and development projects, helping companies
experiment with AI applications in real-world scenarios. This includes support for data analytics,
machine learning, and automation projects, all aimed at improving logistics, optimising inventory
management, and enhancing decision-making processes. By providing resources and expertise,
SCALE-AI strives to help smaller companies harness the power of AI so they can remain competitive
in a rapidly evolving digital economy.
Source: (Federal Ministry for Economic Affairs and Climate Action, 2024[113]), (SCALE AI, 2024[114]).

172
JOB CREATION AND LOCAL ECONOMIC DEVELOPMENT 2024 © OECD 2024
In contrast to earlier technological advancements that required significant infrastructure,
Generative AI is more easily accessible. Businesses, including SMEs, can use generative AI through
cloud-based software and applications, making it available at a low cost. These benefits, combined with
the fact that anyone can use it with minimal knowledge through simple queries, make this application of AI
very more accessible for businesses regardless of the limitations related to their size (OECD, 2024[115]).
Nearly 1 in 5 SMEs surveyed in the 2024 OECD D4SME Survey reported experimenting with
generative AI less than a year after LLMs became available to the public in late 2022 (OECD,
2024[115]). This is in stark contrast with other applications of AI, which appear to be considerably less
widespread among surveyed SMEs. For example, only 6% of SMEs reported they created or acquired
tailored machine learning algorithms (produced by either internal or external experts) to be applied in their
business functions (OECD, 2024[115]). However, it must be highlighted that many SMEs still lack a proper
understanding of AI possible applications or uses in the tools they are already using. Policy should aim to
provide tailored support for SMEs in adopting digital technologies, addressing their specific needs, as many
SMEs report a lack of awareness of available assistance that meets their requirements (Box 3.17).
Box 3.17. Measuring SME digitalisation: 2024 OECD D4SME Survey
The widening gap across enterprises
se their operations, but recent data suggest that they
have not kept pace with large enterprises. Digital tools can help streamline operations, operate
flexibly, and diversify revenue streams, which can help withstand external shocks. Recent data,
however, shows that large enterprises continue to outpace SMEs in the adoption of software
technologies, despite progress in SMEs digitalisation.
The adoption of digital technologies by SMEs depends largely on its ability to increase sales,
drive efficiency, and boost resilience. A recent surveya shows that the primary objective of SMEs
when adopting digital tools is increasing domestic sales (47%) and expanding their customer base
(41%). Automation, which can significantly enhance operational efficiency, is an objective for 40% of
business. This objective is more important in the professional services sector (48%), and among more
digitally mature business (48%). Reducing operational costs is also an objective, especially for those
businesses that operate exclusively online.
However, SMEs face significant bottlenecks in adopting digital tools.
bottlenecks to digitalisation, such as costs, skills shortages, and lack of time for training. Digital security
practices are also a main concern as 1 in 3 business across surveyed European countries were aware
of having been the target of cyber-attacks.
Generative AI has been rapidly embraced by SMEs, which generally view this technological
advancement positively. Over half of the respondents (57%) reported a view that opportunities
associated with Generative AI features surpassed the risks. Additionally, managers are more optimistic
about generative AI than employees, with 62% believing the benefits of the technology outweigh the
risks, compared to 48% of employees.
Despite this positive view of generative AI, many SMEs still lack a comprehensive understanding
of its potential uses or how to embed it in the tools they already use. Overall, only 26% of
respondent SMEs acknowledged their use of AI but, as the survey was distributed to SMEs active on
large digital platforms, by design, all respondents in the sample were at minimum using it passively
(through the machine learning algorithms embedded in platforms they were using). Overall, only about
5% of respondents recognised they were using AI passively in this sense, highlighting the need for
continued support and understanding of AI among SMEs.

173
JOB CREATION AND LOCAL ECONOMIC DEVELOPMENT 2024 © OECD 2024
Support for SMEs in the adoption of digital tools remains limited.
are aware of government support for the adoption of digital tools. Furthermore, respondents who were
aware of support cited concerns about the suitability of programmes for their digital needs, red tape in
accessing the programmes and capacity challenges to sustain digital improvements after the
completion of the support programme.
Note: a The D4SME Survey gathered responses from 1 005 SMEs from Japan (561), Korea (249), Europe-4 [113, combining France (44),
Germany (15), Italy (33), and Spain (21)], and the United States (82). The sample was drawn from a distinct set of digital platforms and so
cannot be considered as being representative of the entire universe of SMEs in those countries or indeed the OECD.
Source: (OECD, 2024[115]).
AI in the public administration
AI also holds potential to improve productivity and optimise processes in the public administration.
By leveraging AI, governments can automate routine tasks, streamline workflows, and enhance decision-
making capabilities, thereby freeing up public servants to focus on more complex, citizen-centric activities.
AI-driven tools, such as chatbots, predictive analytics, and automated document processing, can contribute
to more efficient public service delivery, reduce bureaucratic bottlenecks, and ultimately improve
transparency and responsiveness in government operations.
One-in-two OECD public employment services (PES) have already implemented AI solutions in
2024 (Brioscú et al., 2024[116]). Specifically, PES have used AI to understand the needs on jobs seekers
and target support, improve their labour market matching and employment services and optimise their own
back-office processes and knowledge generation. However, PES should be careful in managing the risks
linked to AI, such as privacy concerns, and potential biases, while also supporting PES staff in developing
the skills to effectively use AI tools (Box 3.18).
Box 3.18. Guidelines for AI adoption in public employment services (PES)
The adoption of AI presents significant opportunities for PES, but it will also require proactive
measures to address and minimise the associated risks. A new dawn for public
employment services(2024[116]) explores the impact of widespread AI adoption in PES. Some of the
recommendations in the paper include:
• Making accountability, transparency and explainability central in PES AI use. Ensuring
that those who design, deploy and operate AI systems are accountable for their proper
functioning, creating well-design structures that foster transparency and explainability in AI
outcomes, ultimately enhancing trust.
• Implementing AI models that strive for data privacy and quality. PES handle sensitive
administrative data and must remain vigilant about their data privacy obligations. They should
also verify that the data fed into AI systems is accurate and appropriate for the intended use.
• Mitigating the risk of bias within AI systems. PES undertake sensitive work that can have
implications for the lives of citizens. Ensuring that biases and discrimination are minimised,
while prioritising fairness and equality, should be a key focus for PES.
• Developing skills among PES staff to work alongside AI and address resistance.
Employees may resist AI due to fears of job security or discomfort with new practices. Proactive
steps should be taken to close the skills gap and build trust in AI tools, facilitating greater
adoption among staff and minimising potential concerns.

174
JOB CREATION AND LOCAL ECONOMIC DEVELOPMENT 2024 © OECD 2024
• Conducting continuous monitoring and evaluation of AI systems. Positive results during
development do not guarantee success of the tool post-implementation, making ongoing quality
checks necessary to avoid unintended impacts.
Figure 3.27. Opportunities and challenges of adopting AI in public employment services
Source: (Brioscú et al., 2024[116]).
Tools to match job seekers to employers and tools to design vacancy postings are among the most
common uses of AI in PES, with over 20% of PES across the OECD implementing at least one of
these (Brioscú et al., 2024[116]). AI-powered job matching solutions have been implemented in counties
such a
postings is another common use of AI in PES. Both the PES of France and Flanders, Belgium use tools
that analyses CVs and job ads to identify implicit skills not listed and provide suggestions that can refine
job descriptions and candidate profiles (Broecke, 2023[117]). Other common uses include profiling tools that
with information (usually in the
form of chatbots), and tools to help with career management and job search orientation (Box 3.19).
PES can harness AI to better tailor their services to the specific needs of regional labour markets.
The services can then be scaled more efficiently while maintaining a strong focus on regional priorities,
addressing the unique economic and employment challenges that vary between regions. Examples of this
already exist, where counsellors work with AI tools to provide nuanced, region-specific solutions, or AI-
powered chatbots that can boost the quality and accessibility of services (Box 3.19).

175
JOB CREATION AND LOCAL ECONOMIC DEVELOPMENT 2024 © OECD 2024
Box 3.19. Examples of AI applications in public employment services (PES)
AI for jobseeker profiling in the Basque employment service
The Basque Country is an Autonomous Community in northern Spain known for its strong
manufacturing base and increasingly educated workforce. The region benefits from a robust
Vocational Education and Training (VET) system and a variety of active labour market programmes
tailoring training and labour market incentives to job demand. Low job quality and the demand for skills,
however, are contributing to overqualification in the region (OECD, 2020[118]).
PES established in 2011, has a range of responsibilities that include managing active labour market
programmes and Renta Garantia de
Ingresos (RGI).
Recently, Lanbide has developed an AI tool to aid in their profiling process, which improves the
management of active employment policies, and supports . A profiling
process involves classifying or defining jobseekers according to their employability, functioning as a
diagnostics tool that identifies the risk levels of individuals regarding their chances of re-entering
employment. Lanbide developed a methodology that leverages big data and automates the analytical
component of jobseeker profiling.
The main objective of this tool is to classify job seekers to better know them and address four
key issues in running the PES. The tool is meant to provide a (1) more personalised and (2) reactive
service that helped PES professionals (3) better match job seekers to vacancies and (4) address
chronic long-term unemployment.
Machine learning is utilised to profile jobseekers based on their employability, with the resulting
analysis presented to counsellors through a comprehensive dashboard. Counsellors can
leverage this tool during interviews with jobseekers to guide them towards the most suitable
opportunities in the labour market. The methodology can be applied in other organisations and can be
tailored to the local needs by, for example, training it on region-specific datasets, as it has been in the
Basque region. The tool is currently in an experimental phase, with plans to integrate additional
variables, ESCO skills, and macroeconomic trends into the analysis to further enhance the profiling
model.
AI-powered career information chatbot in the Austrian employment services
In Austria, the labour market is changing due to technological advances, evolving job roles, and
a growing emphasis on digital skills. The Austrian Public Employment Service (AMS) is addressing
these challenges through multiple initiatives aimed at facilitating career guidance and continuous
education for both new entrants to the workforce, and those looking to reskill or upskill to access new
roles.
The AMS Career Information Assistant (Berufsinfomat) is a Generative AI-powered chatbot to
assist with career-related inquiries. This chatbot, based on OpenAI technology, provides accessible
information about careers, education, and training opportunities. The tool is freely accessible and allows
users to ask career-related questions through an interactive chat interface serving a broad audience,
including young people, parents, teachers, job seekers, career changers, and those returning to work.
It is also used by AMS advisors to help them research career-related questions.
The chatbot offers information on a variety of career-related subjects. These include (1)
descriptions of over 2 500 professions, including typical tasks, required skills, and qualifications, (2)
suggestions for courses, seminars, and other education pathways such as apprenticeships, schools,

176
JOB CREATION AND LOCAL ECONOMIC DEVELOPMENT 2024 © OECD 2024
and universities, and (3) information on starting salaries, apprentice wages, and wages according to
collective agreements.
The interactive chat format provides real-time, personalised responses. The chatbot is designed
to be barrier-free, meaning users do not need to register or provide personal data,
anonymity. It can direct users to local AMS offices for more specialised and in-person support.
Supporting 90 languages, the Career Information Assistant facilitates accessibility to a broad audience,
making the tool easy to use for individuals from different backgrounds and needs.
Source: (OECD, 2020[118]), (Lanbide Basque Employment Service, 2024[119]), (Public Employment Service Austria, 2024[120]).
The use of AI can transform the work of public servants in various ways beyond optimising PES.
One common application has been using AI for information processing and speeding up writing
tasks. The Danish Environmental Protection Agency (EPA) and the Ministry of Digital Government and
Gender Equality, in collaboration with the company cBrain, developed an AI-powered solution that assists
with drafting briefing notes, speeches, translations, and summaries, which is being used, for instance, in
the Copenhagen and Aarhus city governments. The tool works as a virtual assistant for public servants,
using an on-premises LLM to ensure data security, and which is trained with thousands of government
documents (cBrain, 2024[121]). Public servants and caseworkers can also use the assistant to ask questions
and receive information on specific procedures, thereby improving productivity.
AI can be used for document processing and to sped up time-consuming bureaucratic tasks in
public administration. The Danish EPA, for instance, is using an AI tool to accelerate environmental and
building permitting processes. The tool is trained on local and national environmental and building permit
documents, enabling it to handle case processing and filing, and improving the overall quality of decisions.
This automation significantly reduces the workload for public servants and citizens by streamlining
application self-service. The tool is currently to assist project developers, generate draft reports, and
support civil servants who review and finalise decisions (Knudsen and Søndergaard-Gudmandsen,
2023[122]). cBrain is also piloting an AI chatbot in California, United States, specifically trained in
environmental regulations, which can be used during the development of construction projects. A user
might, for example, ask the chatbot, "What should I consider to improve the safety of birds in the
development of my wind farm?", and the chatbot provides relevant information on applicable regulations
and other pertinent resources Beyond permitting, this type of AI application has vast potential, as public
administrations frequently manage complex and time-consuming bureaucratic tasks that could be
automated with AI (Georgieff, 2024[26]).
Public administrations can leverage AI technologies to improve cybersecurity and address
evolving security threats. In terms of system security, AI can accelerate the detection and mitigation of
cyber threats, improving response times and safeguarding sensitive data, including user identities and key
government datasets. These AI-driven systems can automatically identify vulnerabilities and neutralise
cyber risks, offering greater protection against breaches. Additionally, AI is being used to track
misinformation, monitor potential radicalisation, and detect other security dangers. For example, the AI
tools developed by the company Cybara are being used in regional and local governments to track risks
on social media, helping to combat misinformation, and identify early signs of foreign influence and
coordinated disinformation campaigns. The company often collaborates with government intelligence units
and police forces, and has worked on cases such as local elections, and to combat disinformation related
to vaccines (Cyabra, 2024[123]).
The application of AI in public administration has great potential to improve productivity, but raises
concerns similar to those seen with PES and that might impact their adoption (Box 3.18). One of
the main challenges is the need for extensive training for personnel to effectively use AI systems, which
often require new technical skills. There are also concerns about potential biases embedded in AI
177
JOB CREATION AND LOCAL ECONOMIC DEVELOPMENT 2024 © OECD 2024
algorithms, which could perpetuate inequality or lead to unfair outcomes. Additionally, attitudes toward
change play a significant role, as both employees and citizens may be resistant to the implementation of
new ecision-making
processes, fearing a lack of transparency or loss of human oversight. Striving for transparency, deploying
AI ethically, and with careful consideration of its social impact will be central in maintaining public trust.
Policy recommendations
markets
In conclusion, by tailoring strategies to regional needs, policies can support economic growth, workforce
development, and fair integration of AI technologies in the workplace. The following place-based
recommendations aim to help local labour markets harness the benefits of Generative AI, while addressing
potential risks and promoting equitable use.
1. Identify opportunities where AI can drive regional growth: By building local AI capabilities,
regions can modernise traditional industries, attract new investments, and harness emerging
technologies for sustainable development. This approach can be particularly valuable for regions
facing demographic pressures, low job creation, or outdated industrial structures, and to close
urban-rural divides.
2. Assess regional labour market exposure to different forms of AI: Monitoring the varied effects
of AI and automation allows for targeted interventions that address specific needs in different
regions. Tracking high-risk occupations can further enable regions to anticipate job displacement
trends, address skill mismatches, and implement place-based policies to foster resilience and
workforce adaptation.
3. Use data to develop comprehensive regional skills inventories: Developing a skills inventory
skills and areas for development. In regions with high exposure to Generative AI, this inventory can
be particularly helpful in guiding efforts to adapt the workforce, address potential skill shortages,
and capitalise on the opportunities AI offers.
4. Foster collaboration with local stakeholders to strengthen policy intelligence: Engaging local
stakeholders, such as employers, educational institutions, and community organisations, provides
valuable, real-time insights that can enhance the effectiveness of workforce policies. Such
collaboration promotes better-informed, and adaptable policies, and can be particularly important
for the integration of Generative AI, as it can improve its uptake, foster trust among stakeholders,
and tailor policies to regional economic conditions.
5. Build awareness of AI's benefits for workers and employers: Emphasising how AI can enhance
productivity by automating routine tasks and freeing up time for more meaningful work can help
workers and firms see its value. Engaging employees early in discussions about implementing AI
in the workplace, along with providing training, can build further acceptance and make adoption
smoother.
6. Improve the uptake of AI tools across businesses, with a special focus on SMEs: Businesses
may need additional resources to take full advantage of AI tools, such as targeted training
programmes, guidance on implementing AI technologies, and workforce retraining. Special
attention should be given to SMEs, which often lag behind in technology adoption, by providing the
support they need to remain competitive in an AI-driven economy.
7. Leverage AI in the public administration, including public employment services (PES): Using
AI in the public administration can automate routine tasks, enhance accuracy, and improve service
178
JOB CREATION AND LOCAL ECONOMIC DEVELOPMENT 2024 © OECD 2024
delivery through tools like multilingual chatbots and AI-powered document processing. In PES, AI
tools can improve job matching, connecting job seekers and employers more effectively.
8. Establish frameworks to control AI risks: AI presents risks, including privacy concerns, biases,
increased pressures on workers, and potential job displacement. Addressing these issues requires
clear guidelines and ethical standards to enhance transparency and accountability, and safeguard
implementation.
9. Provide tailored support for displaced workers: Technological advancements, such as AI and
automation, lead to shifts in the labour market and may cause worker displacement. Targeted
support for these workers, including retraining programs and re-employment assistance, can help
mitigate long-term economic losses and prevent vulnerable groups and regions from being left
behind amid technological changes.
10. Revise regional skill provisions to address workforce needs: Addressing changing skill needs,
such as those driven by the adoption of Generative AI in the workplace, requires updating the skills
provision system to better align with current demands. This includes revising vocational education
programmes, expanding access to adult education, and introducing targeted programmes for
critical roles in emerging industries.

179
JOB CREATION AND LOCAL ECONOMIC DEVELOPMENT 2024 © OECD 2024
References
Acemoglu, D. and J. SSRN Electronic Journal,
https://doi.org/10.2139/ssrn.4238255.
[7]
Acemoglu, D., A. Manera and P.
Brookings Papers on Economic Activity, Vol. 2020/1, https://doi.org/10.1353/ECA.2020.0003.
[39]
Acemoglu, D. and P. -based approach to inequaIFS Deaton
Review of Inequality, https://ifs.org.uk/inequality/a-task-based-approach-to-inequality.
[38]
Acemoglu, D. and P.
SSRN Electronic Journal, https://doi.org/10.2139/ssrn.3866352.
[35]
Acemoglu, D. and P. Restrepo (2019), Automation and new tasks: How technology displaces
and reinstates labor, https://doi.org/10.1257/jep.33.2.3.
[34]
Aghion, P. et
Working Papers hal-03943312, HAL,
https://ideas.repec.org/p/hal/wpaper/hal-03943312.html.
[5]
AI Medical Services Corporation (2024), About AIM, https://en.ai-ms.com/.
[63]
Aillis (2024), About Aillis, https://www.aillis.jp/.
[60]
AISmiley (2024), Utilizing AI in nursing care and welfare! Case studies and future prospects
introduced from the perspective of resolving labor shortages,
https://aismiley.co.jp/ai_news/examples-of-utilization-of-ai-in-the-field-of-long-term-care-and-
welfare/.
[58]
Akst, D. (2013), What can we learn from past anxiety over automation? by Daniel Akst —
Summer 2013: Where Have All The Jobs Gone? | The Wilson Quarterly, Wilson Quarterly,
https://www.wilsonquarterly.com/quarterly/summer-2014-where-have-all-the-jobs-
gone/theres-much-learn-from-past-anxiety-over-automation.
[1]
Albanesi, S. et Banco de España.
Documentos de Trabajo 2322,
https://www.bde.es/f/webbe/SES/Secciones/Publicaciones/PublicacionesSeriadas/Document
osTrabajo/23/Files/dt2322e.pdf.
[37]
AMED (2024), Research project for medical-engineering collaboration and implementation of
artificial intelligence, https://www.amed.go.jp/en/program/list/14/05/014.html (accessed on
15 November 2024).
[57]
Anyoha, - Can MachinHarvard
University.
[12]
Australian Department of Employment and Workplace Relations (2023), Australian Digital
Capability Framework: Version 1.0.
[44]
Autor, D. (2015), Why are there still so many jobs? the history and future of workplace
automation, https://doi.org/10.1257/jep.29.3.3.
[9]

180
JOB CREATION AND LOCAL ECONOMIC DEVELOPMENT 2024 © OECD 2024
Autor, D., F. Levy and R.
Quarterly Journal of Economics, Vol. 118/4,
https://doi.org/10.1162/003355303322552801.
[18]
Baiocco, S. et c Management of work and its implications in different
, JRC Working Papers Series on Labour, Education and Technology.
[103]
Banco de España (2023), El mercado de trabjo español: situación actual, tendencias
estructurales y políticas de empleo,
https://www.bde.es/f/webbe/SES/Secciones/Publicaciones/PublicacionesAnuales/InformesAn
uales/23/Fich/InfAnual_2023_Cap3.pdf.
[4]
Bessen, J. (2015), Toil and technology: Innovative technology is displacing workers to new jobs
rather than replacing them entirely.
[10]
Böckerman, PLOS ONE,
Vol. 15/11, p. e0242929, https://doi.org/10.1371/journal.pone.0242929.
[36]
Bonney, K. et Economics
Letters, Vol. 244, p. 111971, https://doi.org/10.1016/j.econlet.2024.111971.
[13]
Borgonovi, F. et ,
OECD Artificial Intelligence Papers, No. 2, OECD Publishing, Paris,
https://doi.org/10.1787/7c691b9a-en.
[94]
Brioscú, A. et
OECD Artificial Intelligence Papers,
https://doi.org/10.1787/5dc3eb8e-en.
[116]
Broecke, S. (2023), Artificial intelligence and labour market matching, OECD Publishing, Paris,
https://doi.org/10.1787/2b440821-en.
[117]
Brown, D. et
Nature Human Behaviour,
https://doi.org/10.1038/s41562-024-01985-7.
[59]
Cabinet Secretariat (2024), Digital Administrative and Financial Reform.
[55]
Calvino, F. and L. Firm
, OECD Science, Technology and
Industry Working Papers, No. 2023/02, OECD Publishing, Paris,
https://doi.org/10.1787/0fb79bb9-en.
[2]
https://cbrain.com/f2-ai-assistant.
[121]
https://www.cedefop.europa.eu/en/press-releases/ai-skills-workplace-cedefop-asked-workers.
[95]
Central Japan Startup Ecosystem (2024), About the Central Japan Startup Ecosystem,
https://central-startup.jp/en/.
[43]
Chan, G. and L.
Future Skills Centre, https://fsc-
ccf.ca/projects/ai-health-care/.
[74]

181
JOB CREATION AND LOCAL ECONOMIC DEVELOPMENT 2024 © OECD 2024
Center for Labor and a Just
Economy at Harvard Law School, https://clje.law.harvard.edu/app/uploads/2024/01/Worker-
Power-and-the-Voice-in-the-AI-Response-Report.pdf.
[108]
https://cyabra.com/solutions/public-sector/.
[123]
Working paper June.
[101]
F. et
Evidence of thSSRN
Electronic Journal, https://doi.org/10.2139/ssrn.4573321.
[100]
Dingel, J. and B. Journal of Public
Economics, Vol. 189, https://doi.org/10.1016/j.jpubeco.2020.104235.
[32]
Integration of Artificial Intelligence Technologies in Industry in Georgia Through American
US Economic Development Administration,
https://www.eda.gov/news/press-release/2022/09/02/us-department-commerce-invests-
approximately-65-million-accelerate.
[83]
Elige Educar (2020), Análisis y proyección de la dotación docente en contextos rurales,
https://eligeeducar.cl/investigaciones-realizadas/analisis-y-proyeccion-de-la-dotacion-
docente-en-contextos-rurales/.
[90]
Eloundou, T. et al. (2023), GPTs are GPTs: An Early Look at the Labor Market Impact Potential
of Large Language Models, https://arxiv.org/abs/2303.10130.
[47]
Epoch (2024), Training computation (petaFLOP) dataset, Parameter, Compute and Data Trends
in Machine Learning, https://ourworldindata.org/grapher/training-computation-vs-dataset-size-
in-notable-ai-systems-by-researcher-affiliation (accessed on 18 October 2024).
[15]
and of th
https://eur-lex.europa.eu/eli/reg/2024/1689/oj.
[112]
Eurostat (2018), Methodological manual on territorial typologies,
https://data.europa.eu/doi/10.2785/930137.
[124]
EY (2022), EY Venture Capital Barometer Italia.
[79]
-ups to future-
https://www.fdiintelligence.com/content/feature/piedmonts-hopes-for-startups-to-futureproof-
its-economy-82993 (accessed on 30 September 2024).
[84]
-
https://www.mittelstand-digital.de/MD/Redaktion/DE/Publikationen/mittelstand-digital-
flyer.html.
[113]
Felten, E., M. Raj and R.
SSRN Electronic Journal,
https://doi.org/10.2139/ssrn.4375268.
[21]

182
JOB CREATION AND LOCAL ECONOMIC DEVELOPMENT 2024 © OECD 2024
Felten, E., M. Raj and R. and geographic exposure to
Strategic Management Journal,
Vol. 42/12, https://doi.org/10.1002/smj.3286.
[48]
Filippucci, F. et erils of AI for
VoxEU Column: Productivity and Innovation,
https://cepr.org/voxeu/columns/should-ai-stay-or-should-ai-go-promises-and-perils-ai-
productivity-and-growth.
[69]
Filippucci, F. et Artificial Intelligence on productivity, distribution and
growth: , OECD Artificial Intelligence
Papers, No. 15, OECD Publishing, Paris, https://doi.org/10.1787/8d900037-en.
[16]
Future Skills Centre
https://fsc-ccf.ca/projects/facing-the-challenge-of-digital-
transformation-in-the-insurance-sector-women-at-work/.
[76]
https://fsc-ccf.ca/projects/from-data-to-decision-ai-training-and-professional-certification/.
[75]
https://georgiaaim.org/projects/.
[82]
Georgieff, , OECD Artificial Intelligence
Papers, OECD, https://doi.org/10.1787/bf98a45c-en.
[26]
Georgieff, A. and R. Hyee (2021), Artificial intelligence and employment: New cross-country
evidence, OECD Social, Employment and Migration Working Papers,
https://doi.org/10.1787/c2c1d276-en.
[40]
Georgieff, A. and A. OECD
Social, Employment and Migration Working Papers 255, https://doi.org/10.1787/10bc97f4-en.
[8]
Gmyrek, P., J. Berg and D.
SSRN Electronic Journal,
https://doi.org/10.2139/ssrn.4584219.
[19]
https://www.larioja.org/innovacion/es/noticias/noticia-innovacion/belinda-leon-destaca-
importancia-implementacion-tecnologias (accessed on 30 September 2024).
[77]
https://www.gomarti.com/about.
[93]
Gow, G. (2022), The Labor Shortage Is Killing American Manufacturing. Here’s How AI Can
Bring It Back To Life..
[87]
https://gpai.ai/projects/future-of-work/fairwork-amazon-report-2024.pdf.
[104]
Hechler, E., M. Oberhofer and T. Schaeck (2020), AI and Change Management, Apress,
Berkeley, CA, https://doi.org/10.1007/978-1-4842-6206-1_10.
[102]
Hering, A. (2023), Indeed’s AI at Work Report: How GenAI Will Impact Jobs and the Skills
Needed to Perform Them, INDEED.
[23]

183
JOB CREATION AND LOCAL ECONOMIC DEVELOPMENT 2024 © OECD 2024
- Shttps://www.ibisworld.com/united-
states/economic-profiles/georgia/.
[81]
J-Startup (2024), J-Startup summary, https://www.j-startup.go.jp/en/about/.
[61]
J-Startup Kansai (2024), Creating a Role Model from the Kansai Region, https://next-
innovation.go.jp/j-startup-kansai/english/.
[42]
Kalliamvakou,
The GitHub Blog, Sep.
[68]
Khan, B. et
Biomedical Materials & Devices, Vol. 1/2, pp. 731-738,
https://doi.org/10.1007/s44174-023-00063-2.
[66]
Kinder, M. et Blookings,
https://www.brookings.edu/articles/generative-ai-the-american-worker-and-the-future-of-
work/.
[110]
Knudsen, C. and F. Søndergaard-
AcBrain, https://cbrain.com/ai-for-government.
[122]
Koch, M., I. Manuylov and M. The Economic Journal,
Vol. 131/638, pp. 2553-2584, https://doi.org/10.1093/ej/ueab009.
[3]
Lanbide Basque Employment Service (2024), AI-Machine Learning Serving People and
Employment – Profiling Jobseekers.
[119]
Lane, M., M. Williams and S. ings
, OECD Social, Employment and
Migration Working Papers, No. 288, OECD Publishing, Paris,
https://doi.org/10.1787/ea0a0fe1-en.
[99]
Lassébie, J. and G. utomation technologies
OECD Social, Employment and
Migration Working Papers 282, https://doi.org/10.1787/646aad77-en.
[27]
Lopez Cobo, M. (ed.) (2022), AI Watch Index 2021, Publications Office of the European Union,
https://doi.org/10.2760/921564.
[72]
Manning, S. (2024), AI’s impact on income inequality in the US Interpreting recent evidence and
looking to the future.
[25]
McCulloch, W. and W.
The Bulletin of Mathematical Biophysics, Vol. 5/4, https://doi.org/10.1007/BF02478259.
[11]
-demand revolution in customer-
https://www.mckinsey.com/capabilities/operations/our-insights/an-on-demand-revolution-in-
customer-experience-operations.
[105]
Mehdi, T. and R.
OccupaAnalytical Studies Branch Research Paper Series -
Statistics Canada, https://doi.org/10.25318/11f0019m2024005-eng.
[49]

184
JOB CREATION AND LOCAL ECONOMIC DEVELOPMENT 2024 © OECD 2024
Ministry of Health, L. (2023), 17th Healthcare AI Development Acceleration Consortium
Roadmap.
[56]
Ministry of Science and ICT of Korea (2021), Strategy to realize trustworthy artificial intelligence.
[45]
MIT Technology Review (2013), 10 Breakthrough Technologies,
https://www.technologyreview.com/10-breakthrough-technologies/2013/.
[125]
Moll, B., L. Rachel and P.
Econometrica, Vol. 90/6, https://doi.org/10.3982/ecta19417.
[24]
Muro, M. and S. e artifical intelligence
Metropolitan Policy Program at Brookings, https://www.brookings.edu/wp-
content/uploads/2021/08/AI-report_Full.pdf.
[73]
Nedelkoska, L. and G. , OECD Social,
Employment and Migration Working Papers, https://doi.org/10.1787/2e2f4eea-en.
[17]
NHS: Health Education England, https://topol.hee.nhs.uk/.
[65]
https://www.england.nhs.uk/long-
read/nhs-long-term-workforce-plan-2/.
[64]
Nicholson Price II, W. (2019), Risks and remedies for artificial intelligence in health care,
Brookings, https://www.brookings.edu/articles/risks-and-remedies-for-artificial-intelligence-in-
health-care/.
[67]
O*NET (2024), National Center for O*NET Development. Browse by Job Family. O*NET OnLine,
https://www.onetonline.org/find/family (accessed on 10 October 2024).
[51]
O*NET (2024), National Center for O*NET Development. Browse by Job Zone. O*NET OnLine,
https://www.onetonline.org/find/zone (accessed on 21 October 2024).
[50]
c productivity gains from Artificial
Working Party No. 1 on Macro-Economic and Structural Policy Analysis,
https://one.oecd.org/official-document/ECO/CPE/WP1(2024)14/en.
[70]
OECD (2024), OECD Database on Regions, cities and local, http://oe.cd/geostats.
[86]
OECD (2024), OECD Employment Outlook 2024: The Net-Zero Transition and the Labour
Market, OECD Publishing, Paris, https://doi.org/10.1787/ac8b3538-en.
[30]
OECD (2024), OECD Regions and Cities databases, http://oe.cd/geostats.
[41]
OECD SME and Entrepreneurship Papers 62, https://doi.org/10.1787/eb4ec9ac-en.
[115]
https://one.oecd.org/document/C/MIN(2024)20/FINAL/en/pdf.
[107]
https://www.oecd.org/en/data/dashboards/twin-transition-tracker-assessing-regional-
resilience.html.
[80]

185
JOB CREATION AND LOCAL ECONOMIC DEVELOPMENT 2024 © OECD 2024
OECD (2023), Job Creation and Local Economic Development 2023: Bridging the Great Green
Divide, OECD Publishing, Paris, https://doi.org/10.1787/21db61c1-en.
[28]
OECD (2023), OECD Employment Outlook 2023: Artificial Intelligence and the Labour Market,
https://doi.org/10.1787/19991266.
[88]
OECD (2023), OECD Employment Outlook 2023: Artificial Intelligence and the Labour Market,
OECD Publishing, Paris, https://doi.org/10.1787/08785bba-en.
[109]
OECD (2023), Platform cooperatives and employment: An alternative for platform work, OECD
Publishing, https://doi.org/10.1787/3eab339f-en.
[106]
OECD (2023), Summer Academy on Cultural and Creative Industries and Local Development
6th Edition - Disrupting tradition: How digital technology is changing the cultural and creative
processes.
[54]
OECD (2023), Using AI to support people with disability in the labour market: Opportunities and
challenges, OECD, https://doi.org/10.1787/008b32b7-en.
[92]
OECD (2022), OECD Framework for the Classification of AI systems, OECD Digital Economy
Papers, https://doi.org/10.1787/cb6d9eca-en.
[14]
OECD (2022), The Culture Fix: Creative People, Places and Industries, Local Economic and
Employment Development (LEED), OECD Publishing, Paris,
https://doi.org/10.1787/991bb520-en.
[53]
OECD (2021), Regional Innovation in Piedmont, Italy: From Innovation Environment to
Innovation Ecosystem, OECD Regional Development Studies, OECD Publishing, Paris,
https://doi.org/10.1787/7df50d82-en.
[78]
OECD (2020), OECD Digital Economy Outlook 2020, OECD Publishing, Paris,
https://doi.org/10.1787/bb167041-en.
[31]
OECD (2020), Preparing the Basque Country, Spain for the Future of Work, OECD Reviews on
Local Job Creation, OECD Publishing, Paris, https://doi.org/10.1787/86616269-en.
[118]
Paris, https://doi.org/10.1787/5713bd7d-en.
[6]
OECD (2018), Job Creation and Local Economic Development 2018: Preparing for the Future of
Work, OECD Publishing, Paris, https://doi.org/10.1787/9789264305342-en.
[33]
OECD (forthcoming), OECD Regions and Cities at a Glance 2024, OECD.
[96]
Pizzinelli, C. -country Differences and Distributional
IMF Working Papers, Vol. 2023/216,
https://doi.org/10.5089/9798400254802.001.
[22]
Post, R. (2024), How Can AI Help Solve Teacher Shortages?, https://www.aaspa.org/news/how-
can-ai-help-solve-teacher-shortages (accessed on 30 September 2024).
[91]
https://www.ams.at/arbeitsuchende/aus-und-
weiterbildung/berufsinformationen/berufsinformation/berufsinfomat.
[120]

186
JOB CREATION AND LOCAL ECONOMIC DEVELOPMENT 2024 © OECD 2024
Regione Piemonte (2024), Agevolazioni per le imprese,
https://www.regione.piemonte.it/web/temi/sviluppo/agevolazioni-per-imprese (accessed on
30 September 2024).
[85]
Saes, Forbes,
https://www.forbes.com/councils/forbesbusinesscouncil/2024/02/21/digital-twins-for-mining-
industries-a-transformative-technology/.
[97]
https://www.scaleai.ca/projects/.
[114]
Song, The AI Wonk,
https://oecd.ai/en/wonk/korea-ai-transition.
[46]
https://www.statista.com/forecasts/1474143/global-ai-market-size.
[71]
-being: Principles And
https://www.dol.gov/sites/dolgov/files/general/ai/AI-Principles-Best-Practices.pdf.
[111]
Ubie (2024), About Ubie, https://ubie.life/about_ubie.
[62]
UNESCO (2012), International Standard Classification of education ISCED 2011,
https://isced.uis.unesco.org/.
[52]
Virtasant (2024), Stress, Burnout, and Labor Shortages: How AI in the Workplace is Making
Core Business Problems a Thing of the Past, https://www.virtasant.com/ai-today/ai-in-the-
workplace.
[89]
Vona, F., G. Marin and D. Consoli (2019), Measures, drivers and effects of green employment:
Evidence from US local labor markets, 2006-2014, https://doi.org/10.1093/jeg/lby038.
[29]
Webb, SSRN Electronic
Journal, https://doi.org/10.2139/ssrn.3482150.
[20]
Zirar, A., S. Ali and N.
coexistence: EmergiTechnovation, Vol. 124, p. 102747,
https://doi.org/10.1016/j.technovation.2023.102747.
[98]
Notes
1 Generative AI refers to artificial intelligence that can create new content by learning patterns from
existing data. Current uses of Generative AI include content creation (including text and images), code
generation, and personalised recommendations, with technologies such as ChatGPT, DALL-E, and
GitHub Copilot being some recognised examples of Generative AI platforms.
2 MIT Technology Review (2013[125]).
https://www.technologyreview.com/10-breakthrough-technologies/2013/ accessed on 18/07/2024.
187
JOB CREATION AND LOCAL ECONOMIC DEVELOPMENT 2024 © OECD 2024
3 8.6% of global employment
(281 million workers) falls within this category.
4Note that this study uses the Generative AI platform GPT-4 to judge Generative AI itself, which might
lead to bias. Nevertheless, the direction and magnitude of any potential bias is unclear.
5 This includes mechanical technologies, and non-generative AI. This may include some early forms of
LLMs but only to a limited extent as the most prominent Generative AI platforms were released after this
date. For the purpose of this chapter, Generative AI encompasses models and platforms released in or
after 2022.
6 Note that regional dispersion is impacted by the size and number of regions, as countries with a higher
number of smaller regions tend to have more regional dispersion. This explains, at least in part, the small
variance in, for example, Australia and Canada.
7Once country-specific factors are considered, the correlation is insignificant. Qualitatively similar results
are found by (Georgieff and Milanez, 2021[8]).
8 Labour productivity is measured as gross value added per employment at place of work by main
economic activity (OECD, 2024[41]).
9 Additionally, some productivity gains may not have manifested as increased sales or income, but rather
as consumer surplus, which would not be reflected in this particular measure of productivity.
10 Exposure to generative AI does not make a job more or less likely to be displaced, it simply means
that generative AI is a useful tool for enhancing efficiency in that occupation.
11 This trend is described for the exposure now or in the near future, but it holds for exposure now as
well.
12 See Annex 3.A for more details.
13 Healthcare occupations include general and specialist doctors, dentists, medical and dental
practitioners, assistants and technicians, chiropractors, physical therapists and assistants, medical and
health service managers, podiatrists, nurses, midwives, acupuncturists, veterinarians, opticians, genetic
counsellors, pharmacists and complementary medicine associates. Exact occupations depend on
occupation classification.
14 Software-related occupations includes developers, programmers, computer technicians, ICT support,
web and digital designers, computer operators, network and computer systems administrators, computer
scientists and specialists, system and security analysts, database managers and designers, data entry
keyers, statisticians, and data scientists. Exact occupations depend on occupation classification.
15 An ageing region is one where the elderly dependency ratio has increased in the last 10 years (to
2022 or 2023 depending on last year available). Similarly, a region is losing population if it has less
population than it did 10 years ago. This analysis is done at the TL-3 level where possible, and if not, it is
done at the TL2 level.
16 The survey was conducted between February and May 2024 in 11 EU countries. The sample size was
around 500 adult workers in each country, with a total of 5 342 interviews.

188
JOB CREATION AND LOCAL ECONOMIC DEVELOPMENT 2024 © OECD 2024
Annex 3.A. Data coverage and measurements
Measuring exposure to Generative AI
The two measures of exposure to Generative AI are used in this report: exposure now and exposure now
or in the near future. The former is defined as the share of tasks within an occupation that can be completed
in half the time with the use of LLMs in their current form i.e., Chat-GPT 3.5 or similar. In particular, this
measure includes those tasks classified under E1 (Annex Table 3.A.1). The latter is defined as the share
of tasks within an occupation that can be completed in half the time with LLMs in their current form or it is
easy to imagine additional software that could be developed on top of the LLM that would reduce the time
it takes to complete the task by half. In particular, this measure includes those tasks classified under E1
and E2.
Annex Table 3.A.1. Summary of exposure rubric
Exposure category
Description
E0 (No exposure)
• Using the described LLM results in no or minimal reduction in the time required to complete the activity or
task while maintaining equivalent quality or
• Using the described LLM results in a decrease in the quality of the activity/task output.
E1
• Using the described LLM via ChatGPT or the OpenAI playground can decrease the time required to
complete the Detailed Work Activity (DWA) or task by at least half (50%).
E2
• Access to the described LLM alone would not reduce the time required to complete the activity/task by at
least half, but
• Additional software could be developed on top of the LLM that could reduce the time it takes to complete
the specific activity/task with quality by at least half. Among these systems, we count access to image
generation systems.
Note: Tasks performed with the use of Generative AI should be of equivalent quality, this is, a third party would not notice or care about LLM
assistance.
Source: (Eloundou et al., 2023[47])
Details on data sources and coverage
Annex Table 3.A.2. Employment by occupation data sources
Country
Type of data
Dataset
Source
Variables
available
AUS
Table
Table EQ08
Australian Bureau of
Statistics (ABS)
Sex
AUT, BEL, CHE, CZE, DEU,
DNK, ESP, EST, FIN, FRA, GRC,
HRV, HUN, IRL, ISL, ITA, LTU,
LUX, LVA, NLD, NOR, POL,
PRT, ROU, SVK, SWE
Survey
EU-LFS
Eurostat
Sex, Level of
education
CAN
Survey
Labour Force Survey
StatCan
Sex, Level of
education
COL
Survey
Gran Encuesta Integrada de
Hogares (GEIH)
Departamento
Administrativo Nacional
de estadística (DANE)
Sex, Level of
education
CRI
Survey
Encuesta Continua de Empleo
Instituto Nacional de
Sex, Level of

189
JOB CREATION AND LOCAL ECONOMIC DEVELOPMENT 2024 © OECD 2024
Estadística y Censos
(INEC)
education
KOR
Survey
Korean Labor & Income Panel
Study (KLIPS)
Center for Labor Statistics
Research, Korea Labor
Institute
Sex, Level of
education
MEX
Survey
Mexican National Survey of
Occupation and Employment
(ENOE)
National Institute of
Statistics and Geography
(INEGI)
Sex, Level of
education
NZL
Survey
Household Labour Force Survey
(HLFS)
Stats NZ Tatauranga
Aotearoa (Stats NZ)
Sex, Level of
education
SVN
Table
Statistical Register of Employment
(SRDAP)
Republic of Slovenia
Statistical Office (SURS)
Sex
USA
Table
Occupational Employment and
Wage Statistics (OEWS)
U.S. Bureau of Labor
Statistics (US-BLS)
-
Source: OECD elaboration
Annex Box 3.A.1. Measuring the degree of urbanisation
The degree of urbanisation (DEGURBA) is a classification that indicates the character of an area by
classifying the territory of a country on an urban-rural continuum. The classification uses local
administrative units (LAUs or communes) and classifies these as cities, towns and suburbs, or rural
areas based on a combination of geographical contiguity and population density. The basis for the
classification is the data for 1 km² population grid cells. The categories are described as follows:
• Cities: densely populated areas where at least 50% of the population lives in one or more urban
centres.
• Towns and suburbs: intermediate density areas where less than 50% of the population lives
in an urban centre and at least 50% of the population lives in an urban cluster.
• Rural areas: thinly populated areas where more than 50% of the population lives in rural grid
cells.
Source: (Eurostat, 2018[124])

Job Creation andLocal Economic Development
2024
THE GEOGRAPHY OFGENERATIVE AI
Regions across theOECD face arange oflabour market challenges andare undergoing asignificant
transformation. An ageing workforce, low labour productivity growth, persistent regional disparities,
pervasive labour shortages, andnew technologies will require both people andplaces toundergo transitions.
Thisreport, Job Creation andLocal Economic Development 2024: The Geography ofGenerative AI, examines
thehealth ofregional andlocal labour markets, including through new estimates onregional labour shortages
andtheirdrivers. New tools andtechnologies, such as Generative AI, could help policymakers address
thesechallenges andseize new opportunities forjob creation andlocal economic growth. This report provides
novel evidence ofthegeography oftheimpact ofGenerative AI onjobs across theOECD. It examines
which places within countries andtypes ofworkers are most exposed toGenerative AI andcontrasts this
withthelabour market impact ofpast waves oftechnologies that drove automation. Finally, it discusses local
andplace‑based actions andpolicies forseizing thebenefits ofGenerative AI, such as boosting productivity,
mitigating labour shortages anddemographic change, as well as formitigating risks ofjob displacement.
9HSTCQE*fgeebb+
PRINT ISBN 978-92-64-56441-1
PDF ISBN 978-92-64-62866-3
/(('
GOOD JOBS, GREAT PLACES
Job Creation andLocal Economic Development 2024 THE GEOGRAPHY OFGENERATIVE AI