SMARTAGRI BAROMETER NEWSLETTER Edition 1 - 2025/2026 PDF Free Download
1 / 40/40
100%

NEWSLETTERNEWSLETTER
Edition 1 - 2025/2026Edition 1 - 2025/2026
MEET DAWN MEET DAWN
NOEMDOE: DAWN NOEMDOE: DAWN
OF THE BEESOF THE BEES
1010
WC HOSTS 2025 MCAP WC HOSTS 2025 MCAP
ANNUAL CONVENINGANNUAL CONVENING
1212
IMPACT OF CLIMATE IMPACT OF CLIMATE
CHANGE AND WEEDS CHANGE AND WEEDS
ON AGRI PRODUCTIONON AGRI PRODUCTION
1818
2ND GHG INVENTORY 2ND GHG INVENTORY
FOR THE WCFOR THE WC
2121
NEW AND NEW AND
EXPANDED CARBON EXPANDED CARBON
HEROES PLATFORM HEROES PLATFORM
2929

02 SMARTAGRI BAROMETERSMARTAGRI BAROMETER
CONTENTSCONTENTS
NEWS SNIPPETS AND MEDIA LINKSNEWS SNIPPETS AND MEDIA LINKS
NEWS FROM OUR PROVINCENEWS FROM OUR PROVINCE
SMARTAGRI IMPLEMENTATIONSMARTAGRI IMPLEMENTATION
04
11
22
INTERNATIONAL NEWS
NATIONAL NEWS
25
27
SHOWCASING RESEARCH & YOUNG SCIENTISSHOWCASING RESEARCH & YOUNG SCIENTISTSTS
NEWS FROM OUR PARTNERSNEWS FROM OUR PARTNERS
30
34
UPCOMING CONFERENCESUPCOMING CONFERENCES
37

EDITOR’S NOTEEDITOR’S NOTE
SMARTAGRI BAROMETER 1 - 2025/2026SMARTAGRI BAROMETER 1 - 2025/2026
It is wonderfully inspiring to see how
young researchers, farmers and program
managers are making their mark in
the joint effort to nd solutions to the
climate crisis facing agriculture. In this
edition, we introduce our readers to
four dedicated and talented youth
who are on this journey in one way
or another: Mpho Mence is the new
manager of the GreenCape Agri-Sector
Desk; Dawn Noemdoe is thriving as a
new beekeeper in addition to her work
as a communicator; and both Teneille
Nel and Douw Bodenstein recently
graduated with PhD in Soil Science,
working on soil carbon uptake potential.
We are proud and delighted to
report that the annual convening of
the Mediterranean Climate Action
Partnership (MCAP), hosted in
Stellenbosch in early May by the Western
Cape Departments of Agriculture and
Environmental Affairs & Development
Planning, was an unqualied success.
Dr Trautmann and Goosain Isaacs
provide feedback on the event and
the township tour. In the next edition of
the Barometer we will take our readers
on the Living Labs tour (virtually!)
which showcased some of the climate
adaptation approaches and projects
that are building resilience in the Western
Cape’s Boland region.
Our partners on the SmartAgri journey
have also been busy! Hortgro is building
a valuable online portal and rolling
out its Footprint Webinar Series, while
BlueNorth Sustainability launched the
new and expanded Carbon Heroes
platform, and GreenCape has again
published its annual assessment of the
current market opportunities in the green
agricultural value chain.
Enjoy the read, and please feel free to
send your feedback and ideas, and to
disseminate to other interested parties.
For those who have not read about the
SmartAgri plan, or seen our previous
editions of the SmartAgri Barometer,
please visit www.greenagri.org.za and
click on SmartAgri.
Prof Stephanie Midgley
Editor
03SMARTAGRI BAROMETERSMARTAGRI BAROMETER

NEWS SNIPPETS & NEWS SNIPPETS &
MEDIA LINKSMEDIA LINKS

05SMARTAGRI BAROMETERSMARTAGRI BAROMETER 05SMARTAGRI BAROMETERSMARTAGRI BAROMETER
We warmly welcome Ms Mpho Mence to
the ‘SmartAgri family’! Ms Mence has taken
over the reins from Ms Sibusisiwe Maseko
as the head of the Agri Sector Desk at
GreenCape, a partnership with the Western
Cape Department of Agriculture.
Since 2021, Ms Maseko made a signicant
contribution to the work of the Desk, and
it was a pleasure to work with her. We
thank her and wish her well in her future
endeavours.
Mpho Mence is an Agricultural Economist
with a Master’s in Sustainable Agriculture,
currently serving as an Analyst in
the Sustainable Agriculture team at
GreenCape. She has built her career at the
intersection of agriculture, sustainability,
and innovation—driving strategic projects
in regenerative agriculture and agtech.
With hands-on experience supporting
SMMEs and engaging across government,
academia, and industry, she works to unlock
inclusive green economy opportunities in
South Africa. Her work focuses on market
intelligence, value chain assessment, and
catalyzing investment in climate-resilient
agriculture.
NEW FACE OF THE GREEN-NEW FACE OF THE GREEN-
CAPE-DOA AGRI SECTOR DESKCAPE-DOA AGRI SECTOR DESK
The SmartAgri team at the WCDoA looks
forward to working closely with Ms Mence
on green and climate smart technologies
and investments for the Province.
Ms Mence can be contacted at: mpho@
green-cape.co.za
Remember to use the GreenAgri portal for
your green-agri and agtech information
needs: https://www.greenagri.org.za/
GreenAgri is an information-sharing portal
for all farmers, researchers, private and
non-governmental agencies interested in
smart agricultural practices - supporting
green farming practices, balancing
farming and conservation needs, resource
efciency and waste minimisation in the
Western Cape.

06 SMARTAGRI BAROMETERSMARTAGRI BAROMETER
The deciduous fruit community now has a wealth of
information on climate change risks and responses
available at the press of a button. Hortgro has been
building up its online resource base – please take a
look at https://www.hortgro.co.za/climate-change-
adaptation/.
Online app: Guide to climate change and pome/stone
fruit production in South Africa: https://climatechange.
hortgro.science/
Climate Change Response Strategy for the Deciduous
Fruit Industry of South Africa: https://www.hortgro.
co.za/news/small-acts-big-impacts/
Further links to various research projects, initiatives and
articles on climate change are available.
Hortgro is also rolling out its Hortgro Footprint Webinar
series. “Our free Hortgro Footprint Webinar series
covers essential and relevant sustainability topics
for the deciduous fruit industry, such as sustainable
agricultural practices for soil health and green nancing
opportunities.
This year, we will also incorporate topics on sustainable
packaging, carbon calculations/how to become a
carbon hero and water efciency in packhouses.”
For more information on the webinars and to register,
please visit https://events.hortgro.co.za/webinars/.
Or contact Ms Nitasha Baijnath-Pillay, Resource
Management & Sustainability Manager: nitasha@
hortgro.co.za.
HORTGRO BUILDS ITS CLIMATE HORTGRO BUILDS ITS CLIMATE
CHANGE PORTALCHANGE PORTAL

05SMARTAGRI BAROMETERSMARTAGRI BAROMETER 07SMARTAGRI BAROMETERSMARTAGRI BAROMETER
COLLABORATIVE ACTION TO ADDRESS COLLABORATIVE ACTION TO ADDRESS
WATER SCARCITYWATER SCARCITY
The Boland Groot Winterhoek Strategic Water
Source Areas (SWSA) Collective has published a
6-page factsheet on working together for water
security.
The Collective is a “platform of platforms”,
uniting strong actors in the Western Cape. It
focuses on the Berg and Breede rivers in the
Boland, and the Olifants and Doring rivers in the
Groot Winterhoek. The initiative is supported by
WWF-SA.
The factsheet covers threats and opportunities,
the importance of a healthy environment, facts
on the Groot Winterhoek SWSA and the Boland
SWSA, the role and work of the Collective,
membership, a case study of the 24 Rivers sub-
catchment, and the importance of investment
in ecological infrastructure, including the
removal of invasive alien plants.
To download the full factsheet click here:
https://www.wwf.org.za/?53066/boland-groot-
winterhoek-SWSA-collective


A GUIDE TO APPROPRIATE A GUIDE TO APPROPRIATE
LOCAL PLANT SELECTION LOCAL PLANT SELECTION
THROUGH CAPE FARM MAPPERTHROUGH CAPE FARM MAPPER
A new video has been released by Johann van
Biljon, well-known ecosystem restoration expert and
founder of Green Intaba (https://www.greenintaba.
co.za/). Access the video here: https://youtu.be/
YMggKzmIrhk?si=U8grDt6UBcAT1WiH. In this video,
he explores how to harness the power of Cape Farm
Mapper—an initiative of the Department of Agriculture
of the Western Cape Government—to identify and
compile lists of native plants specic to restoration sites.
Learn step-by-step how to use Cape Farm Mapper to:
• Discover native plant species in your area
• Gather reliable data from community observations
• Generate targeted plant lists for planting and
restoration planning
• Ensure your projects support local biodiversity and
ecosystem health
• Whether you’re working on a small-scale
revegetation or a large habitat restoration, sourcing
local plants is crucial for success. Using CFM makes
this process accessible, accurate, and community-
driven.
• Join us as we demonstrate practical tips to streamline
your plant sourcing process and contribute to more
sustainable, resilient ecosystems.
To access Cape Farm Mapper go to: https://gis.elsen-
burg.com/apps/cfm/
09SMARTAGRI BAROMETERSMARTAGRI BAROMETER

10 SMARTAGRI BAROMETERSMARTAGRI BAROMETER
Dawn Noemdoe of Wellington is on a journey as
beekeeper, agricultural journalist and blogger,
and advocate for women in agriculture. In 2024-
2025 she was a beneciary of the small-scale
farmers / agro-processing programme of the Cape
Winelands District Municipality.
Dawn established her business, HoneyatDawn, as a
leap into the unknown. It has since become one of
the most rewarding experiences of her life.
Her CGTN Africa documentary, “Faces of Africa –
Dawn of the Bees”, captures not only her growth
as a beekeeper and business owner, but also her
deep commitment to environmental sustainability.
“Her work is bringing fresh energy to South Africa’s
beekeeping community. Determined to create
new opportunities in towns affected by poverty,
Dawn is focused on ethical beekeeping, producing
premium honey and natural bee products, while
also educating locals, especially the youth on the
crucial role bees play in our ecosystem. Dawn’s
work aims to empower others & provide an
alternative source of income.”
MEET DAWN NOEMDOE: MEET DAWN NOEMDOE:
DAWN OF THE BEESDAWN OF THE BEES
Click this link to watch the video on Youtube:
https://youtu.be/9164ko248mg
Dawn Noemdoe email address:
dawnlisa1@gmail.com
buzz@honeyatdawn.co.za
Dawn Noemdoe - Instagram:
(@dawnnoemdoe)
Instagram photos and videos instagram.com
HoneyatDawn Pty Ltd - Instagram:
(@honeyatdawnsa)
Dawn Noemdo - linkedin.com

09SMARTAGRI BAROMETERSMARTAGRI BAROMETER
SMARTAGRI SMARTAGRI
IMPLEMENTATIONIMPLEMENTATION

12 SMARTAGRI BAROMETERSMARTAGRI BAROMETER
WESTERN CAPE HOSTS THE 2025 WESTERN CAPE HOSTS THE 2025
MEDITERRANEAN CLIMATE MEDITERRANEAN CLIMATE
ACTION PARTNERSHIP (MCAP) ACTION PARTNERSHIP (MCAP)
ANNUAL CONVENINGANNUAL CONVENING
By Dr Ilse Trautmann (WCDoA) and Goosain Isaacs (DEA&DP)
medclimate.org
westerncape.gov.za
medclimate.org westerncape.gov.za
medclimate.org westerncape.gov.za
CALIFORNIA
VICTORIA
RABAT-SALÉ-KÉNITRA
CENTRAL GREECE
AREAS WITH
MEDITERRANEAN
CLIMATE
CATALONIA
OCCITANIE
EMILIA-ROMAGNA
TANGER-TÉTOUAN-AL HOCEIMA
MAROC ORIENTAL
NEW SOUTH
WALES
BIOBIO
SANTIAGO
BAJA SUR
40°N
40°S
WESTERN CAPE SOUTH AUSTRALIA

As mentioned in the SmartAgri Barometer Edition
3 (2024/2025), the Western Cape Government,
represented by the Department of Agriculture and
Department of Environmental Affairs & Development
Planning, proudly hosted the 2025 Mediterranean
Climate Action Partnership (MCAP) Annual Convening
from 6–9 May 2025. This highlighted the province’s
growing reputation as a focal point for climate action,
innovation and partnership in climate change response
measures.
The MCAP Convening brought together 11 of the 16
founding Mediterranean subnational governments from
across ve continents to accelerate regional responses
to climate risks in three focus areas, being drought,
wildre and extreme heat. These climate driven impacts
continue to threaten ecosystems, communities and
livelihoods in these regions. The recent event was the
second MCAP convening since its ofcial launch at
COP28, Dubai, in 2023, with the rst convening being
held in Barcelona in 2023.
The 2025 Convening also set the tone for delivering on
MCAP’s ambitious three-year action agenda, structured
around objectives aimed at:
1. Elevating Mediterranean Regions Through a Unied
Global Voice
2. Positioning MCAP as a Global Model for Scalable
Climate Solutions
3. Amplifying the Leadership of MCAP Regions
4. Mobilizing Resources to Sustain and Scale Action;
and
5. Leveraging Crisis as a Catalyst for Action and Policy
Change
These goals are supported by dedicated workstreams
focusing on MCAP’s three thematic Working Groups
that focus on drought, wildre, and extreme heat.
In welcoming MCAP delegates to the province, Premier
Alan Winde indicated that “…the Western Cape and
its Mediterranean partners are proving that subnational
governments are not merely backstops to national
action — they are leaders on the frontlines. Their local
knowledge, community relationships, and legislative
powers uniquely position them to pilot innovation,
champion bold policies, and build resilience from the
ground up.”
This year’s annual convening served as a key event
in transforming regional momentum into measurable
milestones. It provided a platform to set shared
objectives, prioritise strategic actions, exchange best
practices and expand regional partnerships to access
critical climate data and research. The gathering was
also a key moment for the MCAP Leadership Council to
review and approve priority actions for the coming year
and engage in vital governance discussions.
The Local Organising Committee left no stone unturned
to compile a 4-day programme to showcase not only
the Western Cape as preferred tourism destination,
but also as a climate change champion and partner
of choice. After the ofcial opening at Leeuwenhof,
a township tour followed where delegates were
introduced to township life as well as some projects
designed to mitigate the effect of climate change on
these livelihoods. And in true South African spirit, the day
was concluded with a rooibos tea and ‘Old Vine’ wine
tasting.
On the second day, a guided tour showcased climate
change response measures through visits to a series of
‘Living Lab’ sites across the Cape Winelands where they
witnessed real-world examples of climate resilience
and innovation. The next edition of the Barometer will
feature a more detailed account of this tour.
A highlight of the week was the presentation of results
from the Mini-Sprint Project Acceleration effort, which
focused on identifying tangible, fast-tracked initiatives
that can be executed by member regions in the
months ahead. Funding for projects to be implemented
collectively by the partner regions in the respective
work streams are from philanthropic organisations and
a process of project calls and adjudication was put
in place. The rst round of calls was concluded at the
recent event in Stellenbosch.
The Western Cape emerged as a key contributor and
partner amongst the three selected MCAP mini-sprint
project proposals listed below.
1. 1. Designing a Wildre Risk Information Service Designing a Wildre Risk Information Service
and Spatial Planning for Wildre Prevention and and Spatial Planning for Wildre Prevention and
Biodiversity ConservationBiodiversity Conservation - with Catalonia, California,
New South Wales and Western Cape
2. 2. Regional Heat Island Monitoring and Prediction Regional Heat Island Monitoring and Prediction
Tool DevelopmentTool Development - with Santiago, California and
Western Cape
3. 3. Coastal Wetlands Resilience: Protecting Biodiversity Coastal Wetlands Resilience: Protecting Biodiversity
& Sustainable Water Management& Sustainable Water Management - with Catalonia,
Central Greece and Western Cape
The annual convening facilitated progress in the
design of these cross-regional projects, emphasizing
the urgency of implementation and the ambition to
showcase outcomes at the United Nations Framework
Convention on Climate Change’s ‘COP 30’ in Brazil
later this year. Through the Western Cape Government’s
strong partnerships with local academic institutions,
public entities and the private sector, international
delegates were able to engage directly with community
members, conservation agencies, and farmers—gaining
rst-hand insights into how the province is piloting and
implementing climate change adaptation measures in
response to shared Mediterranean climate challenges.
The 2025 MCAP Convening afrmed that tackling
Mediterranean climate risks requires more than policy
– it demands partnership, agility, and global-local
collaboration. As a proud host of this vibrant and fast-
moving alliance, the Western Cape will continue to
contribute meaningfully to shaping a future where
Mediterranean communities across the globe can
thrive despite climate adversity.
MCAP Co-Chair Mr Wade Crowfoot, Secretary of the
California Natural Resources Agency, stated at the
opening event “We all face similar threats driven by
climate change - drought, wildres, extreme heat and

`ooding. We know we will do a better job protecting
our people if we work together across continents. This
week is all about learning about what is working in the
Western Cape and sharing with each other how we are
making investments, deploying resources to protect our
regions from these climate change impacts. We are
ultimately stronger together.”
MCAP Co-Chair Ms Sonsoles Letang, Director General
for Climate Change and Environmental Quality for the
Government of Catalonia, said, “It is very important for
us to share all the tools and strategies that each region
utilises to ght climate change. To have a common tool
among all MCAP regions makes us stronger.”’
And at the end of the convening Secretary Crowfoot
commented: “An eye-opening week in South Africa!
So grateful we formed the Mediterranean Climate
Action Partnership (MCAP) to help protect our people
from climate change threats and build a healthy and
prosperous future. No time to waste so we can’t reinvent
the wheel in each place. We’re stronger together!”
This event was a roaring success and the delegates
were stunned by the climate change work WCG and
our partners are doing. The Mediterranean Climate
Action Partnership (MCAP), a regional approach to
building climate change resilience is one to follow – we
expect great outcomes from this partnership and will
keep our readers posted.
To view the MCAP website, please click here.
For more information, contact Dr Ilse Trautmann at 021-
8085012 or ilse.trautmann@westerncape.gov.za
The rest of the programme of the convening was focused on the work and vision of MCAP and its
members.
Premier Alan Winde welcoming delegates at Leeuwenhof, Cape Town
Ofcial residence of Premier

15SMARTAGRI BAROMETERSMARTAGRI BAROMETER
MCAP CONVENING MEETING MCAP CONVENING MEETING
PARTICIPANTS GETTING A FEEL FOR PARTICIPANTS GETTING A FEEL FOR
TOWNSHIP LIVINGTOWNSHIP LIVING
Mr Goosain Isaacs
The technical township tour on Tuesday 6th May 2025
was an unforgettable cultural experience as delegates
explored the heart of Cape Town’s oldest township
Langa, established in 1927.
The journey began with a guided walking tour of Langa,
offering a closer look at everyday life in the township.
Delegates strolled through its streets, met friendly locals,
and heard stories that bring to life the struggles and
triumphs of the people who call Langa home. From
informal settlements to vibrant community hubs, the
experience was both eye-opening and inspiring.
This followed with a visit to the Guga S’thebe Arts and
Cultural Centre, located in a stunning building decorated
with colourful mosaics and traditional African designs.
Guga S’thebe is the cultural heartbeat of Langa where
delegates witnessed and experienced drumming,
explored exhibitions of local art and engaged with
artisans at the on-site marketplace.
Delegates purchased handmade crafts and souvenirs
supporting the local economy while taking a piece of
Langa’s spirit home with them.
The local organising team was commended by
participants for sharing with delegates the juxtaposition
of Cape Town suburban af`uence with vulnerable
township living.

Prof Johann Strauss
A CHALLENGING 2024 FOR A CHALLENGING 2024 FOR
CONSERVATION AGRICULTURECONSERVATION AGRICULTURE
The 2024 season was a rollercoaster The 2024 season was a rollercoaster
ride, marked by ride, marked by several highs and several highs and
lows. Conditions varied throughout lows. Conditions varied throughout
the province, having a profound the province, having a profound
impact on yield, quality, fertilisation impact on yield, quality, fertilisation
and weed control. and weed control.
With record canola yields in the With record canola yields in the
southern Cape and southern Cape and dismal canola dismal canola
crops in the Swartland, our producers crops in the Swartland, our producers
faced signicant challenges. The very faced signicant challenges. The very
wet conditions in June contributed to wet conditions in June contributed to
excellent yields in the southern Cape, excellent yields in the southern Cape,
as the planting season starts earlier as the planting season starts earlier
there than in the Swartland, allowing there than in the Swartland, allowing
the crops to be more advanced and the crops to be more advanced and
cope with the conditions. cope with the conditions.
The wheat crop struggled with The wheat crop struggled with
grading in both production areas. grading in both production areas.
The soils were too wet to control The soils were too wet to control
weeds and apply topdressing at weeds and apply topdressing at
the appropriate times, resulting in the appropriate times, resulting in
signicant weed competition and a signicant weed competition and a
subsequent decline in wheat yield.subsequent decline in wheat yield.
Although the southern Cape Although the southern Cape
struggled with good struggled with good grading, grading,
wheat yields were above average, wheat yields were above average,
whereas those in the Swartland whereas those in the Swartland
were down by 20%. Accompanied were down by 20%. Accompanied
by low commodity prices for wheat, by low commodity prices for wheat,
the impact on the Swartland was the impact on the Swartland was
profound. Since most of the harvest profound. Since most of the harvest
was either of low B3 grading or was either of low B3 grading or
utility grade, farmers’ incomes were utility grade, farmers’ incomes were
severely affected.severely affected.
Although the season was in turmoil, Although the season was in turmoil,
the the conservation agriculture trials conservation agriculture trials
yielded some positive results. The yielded some positive results. The
building of the soil structure through building of the soil structure through
the basic principles resulted in better the basic principles resulted in better
handling of wet conditions, through handling of wet conditions, through
improved intake and distribution of improved intake and distribution of
excess water, allowing us to access excess water, allowing us to access
the soil earlier than was the case the soil earlier than was the case
in soils where CA principles are not in soils where CA principles are not
followed. followed.
With the wet conditions, fertilisation With the wet conditions, fertilisation
was a was a nightmare, and some of the nightmare, and some of the
crop-only systems required more crop-only systems required more
applications than usual. applications than usual.
Even though that was the case, the Even though that was the case, the
medic pasture systems did not medic pasture systems did not
receive more funding than we had receive more funding than we had
applied for in previous years. These applied for in previous years. These
systems still outperformed those with systems still outperformed those with
higher application rates and also higher application rates and also
resulted in higher-quality grading. resulted in higher-quality grading.
The challenges of the 2024 season The challenges of the 2024 season
were still evident were still evident in the early part of in the early part of
2025; more producers were burning 2025; more producers were burning
residue to cope with the increased residue to cope with the increased
weed pressure resulting from the weed pressure resulting from the
poor weed control in 2024. poor weed control in 2024.
Many also felt the need to loosen the Many also felt the need to loosen the
soil that they believed was soil that they believed was
compacted by the heavy rains, or compacted by the heavy rains, or
to repair wheel ruts. Although these to repair wheel ruts. Although these
efforts are not part of a conservation efforts are not part of a conservation
agriculture approach, sometimes agriculture approach, sometimes
we must be `exible enough to we must be `exible enough to
take strategic actions. The actions, take strategic actions. The actions,
however, should be rather a one-time however, should be rather a one-time
action than a continued practice. action than a continued practice.
For more information on For more information on
Conservation Agriculture, Conservation Agriculture, contact contact
Prof Johann Strauss at Prof Johann Strauss at Johann.Johann.
strauss@westerncape.gov.zastrauss@westerncape.gov.za
16 SMARTAGRI BAROMETERSMARTAGRI BAROMETER

RENEWABLE ENERGY DEVELOPMENT RENEWABLE ENERGY DEVELOPMENT
AND AGRICULTURE IN THE WESTERN AND AGRICULTURE IN THE WESTERN
CAPECAPE
INTRODUCTIONINTRODUCTION
The Western Cape of South Africa is
rapidly emerging as a leader in renewable
energy, driven by favorable environmental
conditions, strategic government initiatives,
and increasing private sector investment.
Amid ongoing energy insecurity and the
growing threat of climate change, the
province has embraced wind and solar
energy as central pillars of its sustainable
development strategy. This transition not only
addresses pressing energy needs but also
presents both opportunities and challenges
for the region’s agricultural sector.
A RENEWABLE ENERGY HUBA RENEWABLE ENERGY HUB
With strong coastal winds and high solar
irradiance, the Western Cape is ideally suited
for renewable energy development. The
province has become a focal point for large-
scale wind and solar projects, many of which
are supported by the national Renewable
Energy Independent Power Producer
Procurement Programme (REIPPPP).
Launched in 2011, this initiative has attracted
billions in private investment and facilitated
the construction of numerous renewable
energy facilities.
According to a factsheet by the Western
Cape Government and Wesgro, the province
manufactures approximately 70% of South
Africa’s locally produced renewable ener-
gy components, including photovoltaic (PV)
panels and wind turbine parts. The provincial
government estimates that the renewable
energy market could reach a value of R468
billion by 2030.
MAJOR WIND AND SOLAR FACILITIESMAJOR WIND AND SOLAR FACILITIES
Several signicant wind and solar energy
facilities are either operational or under
development in the Western Cape. The
Department of Forestry, Fisheries and the
Environment (DFFE) provides an ofcial map
of Renewable Energy Environmental Impact
Assessment (EIA) applications through its SA_
REEA MapServer platform (DFFE, 2024).
Dr Michael Wallace
Figure 1. Wind and solar energy applications by farm portion—operational and
planned as of the third quarter 2024 data release (DFFE, 2024).
17SMARTAGRI BAROMETERSMARTAGRI BAROMETER

Although currently of`ine, the MapServer offers valuable
insights into existing and planned renewable energy
installations. The most recently available data from the
platform is illustrated in Figure 1. Updated releases should
be imminently available. While most of these sites are
located on natural veld, the expansion of renewable
energy infrastructure into cultivated agricultural areas is
drawing increased attention.
NOTABLE OPERATIONAL OR PLANNED FACILITIES IN THE NOTABLE OPERATIONAL OR PLANNED FACILITIES IN THE
PROVINCE INCLUDE:PROVINCE INCLUDE:
Gouda Wind Farm (near Tulbagh): 138 MW, supplying
electricity to over 200,000 households.
Roggeveld Wind Power Station (near Matjiesfontein):
147 MW.
Perdekraal East Wind Farm (Ceres Karoo): 110 MW.
Sere Wind Farm (near Vredendal): 100 MW.
Klipheuwel/Dassiesklip Wind Energy Facility (near
Caledon): 27 MW.
Aurora-Rietvlei Solar PV Plant (Aurora): 9.65 MW.
Paleisheuwel Solar Facility (near Clanwilliam): 75 MW.
Excelsior Wind Farm (outside Swellendam): 33 MW.
Umoya Wind Farm (near Hopeeld): 67 MW.
Figure 2. Wind energy sites southwest of Swellendam showing typical commodity production.
Planned Overberg Wind Farm (near Swellendam):
Expected capacity of 380 MW, poised to become
South Africa’s largest privately developed single wind
farm, with signicant conservation considerations due
to its proximity to sensitive habitats.
City of Cape Town PV Plant (Atlantis): A 7 MW city-
owned facility, scheduled for completion by year-end.
According to GreenCape’s 2025 Renewable Energy
Market Intelligence Report, the Western Cape
currently hosts 465 MW of large-scale PV and 958
MW of wind power, with nearly equivalent capacity
in the development pipeline for the next six years
(GreenCape, 2025).
IMPACT ON AGRICULTUREIMPACT ON AGRICULTURE
The integration of renewable energy with agriculture
in the Western Cape has yielded promising outcomes.
Rather than displacing agricultural activity, many wind,
and even some solar projects are designed to coexist
with farming operations.
Wind turbines occupy a relatively small footprint—
typically around 2% of the land they are sited on—
allowing continued agricultural use for grazing or crop
cultivation.
In areas such as Caledon and Swellendam, annual
crop production continues around the turbines, with
farmers beneting from lease payments and improved
infrastructure. Figure 2 illustrates wind farm sites near
Swellendam alongside commodity production data
from 2022/23.
18 SMARTAGRI BAROMETERSMARTAGRI BAROMETER

The Excelsior Wind Farm, for instance, operates on
agricultural land and employs a 'shut-down on demand'
system to protect endangered bird species such as the
Black Harrier and Cape Vulture. This involves real-time
monitoring and rapid turbine shutdowns when birds
are detected nearby, minimizing ecological disruption
(Overberg Renosterveld Trust, 2024). Similar measures
are anticipated for the upcoming Overberg Wind
Energy Facility.
Solar farms, while more land-intensive, are increasingly
being adapted for dual land use. Recent research has
shown that certain crops—such as leafy greens and
berries—can thrive under solar panels, which provide
shade and reduce water evaporation (Randle-Boggis
et al., 2025).
CHALLENGES AND CONSIDERATIONSCHALLENGES AND CONSIDERATIONS
Despite the benets, integrating renewable energy into
agricultural landscapes presents several challenges:
Land Use Con`icts:Land Use Con`icts: The diversion of prime agricultural
land for energy production can raise concerns about
long-term food security. The availability of open spatial
data such as the Flyover iterations and the DFFE SA_
REEA MapServer platform facilitate spatial monitoring of
trends that may begin to impact on agriculture.
Ecological SensitivityEcological Sensitivity: Projects like the Excelsior and
Overberg wind farms underscore the importance of
environmental impact assessment and subsequent
careful planning to avoid adverse impacts on
endangered species and sensitive ecosystems.
Grid Connectivity:Grid Connectivity: Remote energy facilities often face
delays in connecting to the national grid, limiting their
full potential.
CONCLUSIONCONCLUSION
The Western Cape’s renewable energy expansion
re`ects a strong commitment to sustainability,
innovation, and economic resilience. By leveraging its
natural resources and aligning energy development
with agricultural practices, the province is creating
a model for integrated rural development. As South
Africa advances its energy transition, the Western Cape
stands as a compelling example of how clean energy
and agriculture can coexist.
REFERENCESREFERENCES
• DFFE, 2024. Map of Renewable Energy Environmental
Impact Assessment (EIA) Applications. Department of
Forestry, Fisheries and the Environment, Pretoria.
• GreenCape, 2025. Renewable Energy Market Intelligence
Report. Cape Town, p. 54.
• Randle-Boggis, R.J., Barron-Gafford, G.A., Kimaro, A.A.,
Lamanna, C., Macharia, C., Maro, J., Mbele, A., Hartley,
S.E., 2025. Harvesting the Sun Twice: Energy, Food and
Water Benets from Agrivoltaics in East Africa. Renewable
and Sustainable Energy Reviews, 208, 115066.
• Overberg Renosterveld Trust, 2024. Web site. https://
overbergrenosterveld.org.za/black-harrier-
collisions-with-wind-turbines/. Accessed 30/05/2025.
For further information please contact Dr Michael
Wallace: mike.wallace@westerncape.gov.za
Wind turbine - Caledon by Piet Lombard
Wind turbine - Gouda by Dr Mike Wallace
19SMARTAGRI BAROMETERSMARTAGRI BAROMETER

DR MIKE FERREIRADR MIKE FERREIRA
NATURE-BASED SOLUTIONS NATURE-BASED SOLUTIONS
TO THE IMPACTS OF CLIMATE TO THE IMPACTS OF CLIMATE
CHANGE AND WEEDS ON CHANGE AND WEEDS ON
AGRICULTURAL PRODUCTIONAGRICULTURAL PRODUCTION
The demand for agricultural products and the drive
for greater prots require an increase in agricultural
production from the same unit area. This necessitates
an improvement in efciency that can be resolved by
an intensication of production processes. Currently, this
intensication relies heavily on the use of agrochemicals
for crop protection and fertilisation, but many of
these products are being phased out either due to
pest or weed resistance or new laws and regulations.
This requires alternative approaches to ensure crop
protection and to counteract pests, diseases and
weeds. Compounding matters are the less manageable
effects of climate change.
ADVERSE SECONDARY EFFECTS OF PRODUCTION ADVERSE SECONDARY EFFECTS OF PRODUCTION
INTENSIFICATIONINTENSIFICATION
Recent studies indicate that the intensication of
agricultural production has contributed to an increased
spread of weedy and alien plant species, underlining
the interconnected nature of agricultural practices
and biological invasions. Also, alien plants and weed
species are spreading in regions worldwide as one of
the consequences of the global expansion of trade
and transport, which facilitates their spread and
establishment in new environments.
This is especially the case in highly human-dominated
agricultural landscapes, which have undergone
massive changes in land use structure and intensity
over the last three-quarters of a century. The constant
disturbances over large swaths of land have enabled
the spread of weeds beyond routes of transport. This
trend is contributing to the emergence of biological
invasions as a primary cause of biodiversity loss across
the globe with substantial and growing impacts on
human well-being and the global economy.
However, in agroecosystems, biological diversity
contributes to several ecosystem services coupled with
denite positive in`uences on crop yield. These include
crop pollination and biological pest control by insect
predators. In addition, benecial microbes are involved
in numerous processes in the rhizosphere of crops. These
belowground organisms’ shapes soil formation, creates
labile plant nutrient pools, facilitates colonisation
by vascular plants, and in`uences development of
complex communities of different life forms.
Also, studies have shown that soil microbial community
composition can signicantly impact plant health and
resistance against attacks by pests, diseases and the
competitive effects of weeds.
In addition, production intensication is compounded
by climate change that drives a range of shifts of species
and biomes, as organisms track suitable climates
and habitats. Recent reports indicate that globally,
climate change threaten the long-term sustainability of
agricultural production systems in various ways. Findings
also show that some agricultural crops exhibit reduced
biomass, below and aboveground, that is evident in
reduced yields under warmer conditions. Pre-emptively
addressing this constraint requires a wider farmland
concept that will improve the sustainability of intensive
production systems.
WEED INVASIONS AND CLIMATE CHANGEWEED INVASIONS AND CLIMATE CHANGE
Weeds can pose signicant threats to agricultural
productivity, biodiversity and ecosystem functioning.
Data suggest that increased temperatures bolster
weed competitiveness, but that the impacts of warming
vary depending on the weed species in question.
Additionally, competition from weeds generally
increased under higher temperatures, raising concerns
about global warming and associated impacts on crop
production and related management challenges.
Recent data imply that under warmer conditions,
weeds will gain a competitive edge over many crop
plants, as invasive species often demonstrate superior
tness and adaptability, enabling them to thrive in
changing agroecosystems. This is especially true for C4
plants which are known to be more tolerant of warming
conditions. Plants with the C4 photosynthesis mechanism
facilitate greater water use and nutrient use efciency
compared to C3 plants and this factor further enhances
its invasive potential.
As climate change progresses, warming conditions
may exacerbate weed pressures, threatening
crop production and food security. Effective weed
management strategies and adaptive agricultural
practices will be essential to mitigate these impacts and
sustain agricultural productivity.
20 SMARTAGRI BAROMETERSMARTAGRI BAROMETER

NATURE-BASED SOLUTIONS IN THE AGRICULTURAL NATURE-BASED SOLUTIONS IN THE AGRICULTURAL
LANDSCAPE TO CLIMATE CHANGELANDSCAPE TO CLIMATE CHANGE
Recent ndings provide insights into a possible nature-
based solution to both ecological and socio-ecological
impacts of climate change. Ecosystems across the
globe are vulnerable to the effects of climate change,
as are the communities of people that depend on them.
For ecosystems to provide services to people, they must
themselves be able to resist, recover and/or adapt to
change. In an undisturbed environment of ecological
equilibrium, diversity allows for sustained productivity
through extremes of res, `oods and droughts, pests,
diseases and weed invasions via the buffering effects
of multiple species, which differ independently in their
responses to similar environmental conditions.
The concept of nature-based principles includes
habitat conservation and the introduction of ecological
high density semi-natural habitats that will enable the
dispersion of complementary life forms to the surrounding
areas to benet agricultural production. Clearly, the
presence of native species with a comparatively
intricate and balanced variety of plants in a sheltered
environment in the agricultural landscape, are essential
for the settlement of many life forms, particularly in the
face of intensive production and climate change. This
is supported by data that show ecosystems provide
effective adaptation and contribute to the mitigation
of climate change impacts. Conservation of farmland
biodiversity that focus on supporting semi-natural
habitats and the diversity of species traits present in the
communi¬ties of these habitats, will also provide an
insurance against future changes by hosting organisms
and genes that may become of fundamental
importance to guarantee ecosystem processes vital to
production stability and food safety under changing
environmental conditions. Implementation of these
practices will ensure sustainable food production in the
face of climate change, whilst simultaneously meeting
yield demands and human consumption.
Enhancing the assortment of life forms in agricultural
surroundings through plants, not only sets up safe havens
in the landscape, but also improves the dispersion of
complementary life forms to farmlands. Consequently,
semi-natural habitats will ensure that ecosystem services
vital to agricultural yields persist during `uctuating
climatic and environmental conditions. The connectivity,
density and structural diversity of semi-natural habitats
are positive factors that are strongly associated with the
provision of ecosystem services.
Lastly, the variety of species traits and genes found in
diverse habitats has ensured its survival and guaranteed
the continuation of ecosystem processes over millennia
under changing environmental conditions and
unquestionably will do likewise during future alterations
in climatic conditions.
For further information please contact Dr Mike Ferreira:
Email: Mike.Ferreira@westerncape.gov.za
Effective suppression of Paterson’s curse (Echium plantagineum) with
a biomass mulch of wood chips implies that it can be applied for
controlling this weed and its seed bank in elds margins, roadsides and
along fences in the agricultural landscape.
Effective suppression of intra-row weeds in rooibos plantations with a
biomass mulch of wood chips reduces the area subjected to herbicide
applications, improves the soil micro-climate and the crops’ vegetative
growth.
A cultivated hedge row (white mustard and vetch) that encloses the crop
serves as a safe haven for insects predators that prey on pests of wheat, thereby
reducing the amount of agrochemicals applied in the agricultural landscape. 21SMARTAGRI BAROMETERSMARTAGRI BAROMETER

14 SMARTAGRI BAROMETERSMARTAGRI BAROMETER
NEWS FROM OUR NEWS FROM OUR
PROVINCEPROVINCE

23SMARTAGRI BAROMETERSMARTAGRI BAROMETER
THE 2THE 2NDND GHG INVENTORY FOR THE GHG INVENTORY FOR THE
WESTERN CAPE (2009 – 2022)WESTERN CAPE (2009 – 2022)
Ms Lize Jennings-Boom
The 2nd iteration of the Western Cape Greenhouse Gas
(GHG) Emissions Inventory was completed in March
2025. The analysis is undertaken every 2-3 years by
the Climate Change Directorate in the Western Cape
Department of Environmental Affairs and Development
Planning (DEA&DP). It covers the following sectors:
• Energy, which includes electricity, liquid fuels for
transport, coal for industrial purpose (outside of
power station use) and gas for other purposes
• Industrial Process and Product Use (IPPU) which
are GHG emissions resulting from various industrial
activities that product emissions not directly the
result of energy consumed during the process as
well as the use of man-made GHGs in products.
These include refrigerants, aerosols, solvents and
lubricants.
• Waste related emissions, include landlling,
wastewater treatment works and incinerations
of waste. Organic waste is one of the biggest
contributors of GHG emissions from this sector.
• Agriculture, Forestry and Other Land Use (AFOLU)
includes land use change, forestry agricultural
activities including livestock management, manure
management, fertilizers, enteric fermentation,
burning biomass, cropland and grassland soil
carbon. This sector sees relatively slow change over
the short-term and due to the technical expertise
needed to update the data, which is outside the
scope of the inhouse team, this sector has not been
updated in the 2nd iteration.
The Western Cape has been collecting GHG emissions
data in the energy sector for almost 15 years, where
more recently they have expanded work toward
collecting information for the other sectors. The image
(Figure 1) shows the emissions per sector for 2018 (the
date of the rst iteration of the GHG inventory) with
updates for 2020, 2021 and 2022. The reason for the
multiple year update was linked to trying to understand
the impacts that the COVID-19 lockdown in 2020 as well
as ongoing loadshedding had on the emissions picture.
Figure 1. Estimated emissions per sector for 2018 (the date of the rst iteration of the Western Cape GHG inventory)
with updates for 2020, 2021 and 2022.

The energy sector has remained the dominant
contributor over the years. The decrease in 2020 can
be primarily attributed to the impact of the COVID-19
lockdown, and the decreases in 2022 from 2021 gures
can be partially linked to the 250+ days of loadshedding
experienced in 2022. The continued shift towards
renewables, efciencies and other mitigation measures
is also contributing to emissions reductions.
Although the GHG inventory formally reports emissions
from 2018 onward, it draws on energy data collected
by DEA&DP since 2009, allowing for a broader historical
perspective. Figure 2 illustrates trends and shifts in energy-
related emissions between 2009 and 2022. Notably,
increased adoption of energy efciency measures
and small-scale renewable energy systems across the
residential, commercial, and industrial sectors have
contributed to gradual emission reductions over time.
Additionally, improvements in the quality and accuracy
of coal-related data have in`uenced the variability
observed in the coal emission gures.
Figure 1. Trends and shifts in energy-related GHG emissions between 2009 and 2022.
While this GHG Inventory provides a high-level overview
of the GHG emissions in a number of sectors and sub-
sectors, it is not able to provide facility-level information
or data down to a very disaggregated level. Due to
challenges with access and quality of data, a number
of assumptions also need to be made to ll in data gaps.
Work is now underway to nalise the updated GHG
emissions reports for each sector, supported by the
development of a consolidated summary report and
district-level reports focused on energy and waste-
related emissions.
These outputs will not only enhance the understanding
of emission trends across the Western Cape, but also
support evidence-based planning and targeted
climate action at both provincial and local levels.
The continued collaboration of sector departments
and partners remains key to ensuring the credibility,
relevance, and impact of these reporting efforts.
For more information, please contact Ms Lize Jennings-
Boom at DEA&DP: lize.jennings@westerncape.gov.za
24 SMARTAGRI BAROMETERSMARTAGRI BAROMETER

16 SMARTAGRI BAROMETERSMARTAGRI BAROMETER
NATIONALNATIONAL
NEWSNEWS

Guide to extreme heat planning in South Africa for the human health sector
The Power of Togetherness
NATIONAL HEAT HEALTH ACTION GUIDELINESNATIONAL HEAT HEALTH ACTION GUIDELINES
South Africa’s National Department of Health
published the National Heat Health Action
Guidelines in 2021. These will assist Provincial
Departments of Health, District Health Services
and Municipalities to reduce the burden of
disease from heat exposure.
Human health is impacted by climate change
driven increases in extreme heat (maximum
temperature >35°C) in multiple ways,
sometimes causing increases in mortality and
morbidity: cardiac and respiratory problems;
dehydration, heat cramps, heat exhaustion
and heat stroke which manifests as damage
to the brain, kidneys and other organs;
exacerbation of chronic medical conditions
including HIV/Aids and diabetes; mental
health problems including anxiety, irritability,
interpersonal violence and gender-based
violence; outbreak of food- and water-borne
infections; and malaria- and other vector-
borne infections.
Some population groups have higher
exposures to heat, such as people who work
outdoors (e.g. on farms) or in hot indoor areas
(e.g. poorly ventilated packhouses). Workers
in outdoor settings such as agriculture and
construction, commonly experience sunburn,
sleeplessness, irritability and exhaustion.
Heat Health Action Plans are a package of
practical, feasible, and low-cost interventions
at the individual and community level that can
assist people to adapt to high temperatures.
The agricultural sector can contribute by
building greater awareness around heat
extremes and effective responses during
such events. It is especially important to
train foremen and managers on prevention
(e.g. responding to heat-health warning
systems based on weather forecasts) and the
recognition of heat stress symptoms in agri-
workers.
Click here to access the South Africa
National Heat Health Action Guidelines
report: https://www.health.gov.za/wp-
content/uploads/2022/06/National-Heat-
Health-Action-Guidelines.pdf

18 SMARTAGRI BAROMETERSMARTAGRI BAROMETER
INTERNATIONALINTERNATIONAL
NEWSNEWS

1. 1. CLIMATE-RELATED STUDIES BY WORLD ECONOMIC CLIMATE-RELATED STUDIES BY WORLD ECONOMIC
FORUMFORUM
The following three publications by the World Economic
Forum make for very interesting reading for anyone
interested in the future.
1. The Global Risks Report 2025 20th edition – Insight
Report
“The Global Risks Report 2025 presents the ndings of the
Global Risks Perception Survey 2024-2025 (GRPS), which
captures insights from over 900 experts worldwide. The
report analyses global risks through three timeframes to
support decisionmakers in balancing current crises and
longer-term priorities: current or immediate-term (in 2025),
short- to medium-term (to 2027), and long term (to 2035).
The report considers not only the survey ndings and
the range of implications, but also provides six in-depth
analyses of selected risk themes.”
LINK: https://reports.weforum.org/docs/WEF_Global_
Risks_Report_2025.pdf
2. FUTURE OF JOBS REPORT 2025 – INSIGHT REPORT2. FUTURE OF JOBS REPORT 2025 – INSIGHT REPORT
“Technological change, geoeconomic fragmentation, “Technological change, geoeconomic fragmentation,
economic uncertainty, demographic shifts and the economic uncertainty, demographic shifts and the
green transition – individually and in combination – green transition – individually and in combination –
are among the major drivers expected to shape and are among the major drivers expected to shape and
transform the global labour market by 2030. The Future of transform the global labour market by 2030. The Future of
Jobs Report 2025 brings together the perspective of over Jobs Report 2025 brings together the perspective of over
1,000 leading global employers … to examine how these 1,000 leading global employers … to examine how these
macrotrends impact jobs and skills, and the workforce macrotrends impact jobs and skills, and the workforce
transformation strategies employers plan to embark on in transformation strategies employers plan to embark on in
response, across the 2025 to 2030 timeframe.”response, across the 2025 to 2030 timeframe.”
“Climate-change mitigation is the third-most “Climate-change mitigation is the third-most
transformative trend overall transformative trend overall – and the top trend related to – and the top trend related to
the green transition – the green transition – while climate change adaptation while climate change adaptation
ranks sixthranks sixth with 47% and 41% of employers, respectively, with 47% and 41% of employers, respectively,
expecting these trends to transform their business in the expecting these trends to transform their business in the
next ve years. This is next ve years. This is driving demand for rolesdriving demand for roles such as such as
renewable energy engineers, environmental engineers renewable energy engineers, environmental engineers
and electric and autonomous vehicle specialists, all and electric and autonomous vehicle specialists, all
among the 15 fastest-growing jobs. among the 15 fastest-growing jobs.
Climate trends are also expected to drive an increased Climate trends are also expected to drive an increased
focus on environmental stewardship, which has entered focus on environmental stewardship, which has entered
the Future of Jobs Report’s list of top 10 fastest growing the Future of Jobs Report’s list of top 10 fastest growing
skills for the rst time.”skills for the rst time.”
LINK: LINK: https://reports.weforum.org/docs/WEF_Future_of_https://reports.weforum.org/docs/WEF_Future_of_
Jobs_Report_2025.pdfJobs_Report_2025.pdf
28 SMARTAGRI BAROMETERSMARTAGRI BAROMETER

3. FUTURE-PROOFING THE LONGEVITY ECONOMY: 3. FUTURE-PROOFING THE LONGEVITY ECONOMY:
INNOVATIONS AND KEY TRENDS. WHITE PAPER (2025) INNOVATIONS AND KEY TRENDS. WHITE PAPER (2025)
“More than one in four people worldwide now reside in a “More than one in four people worldwide now reside in a
country where the population has already peaked in size, country where the population has already peaked in size,
signalling a profound shift in labour markets and economic signalling a profound shift in labour markets and economic
systems. Meanwhile, global life expectancy has increased systems. Meanwhile, global life expectancy has increased
signicantly over the past century; however, this progress signicantly over the past century; however, this progress
masks stark disparities – life expectancy can exceed 80 masks stark disparities – life expectancy can exceed 80
years in high-income countries yet remain below 60 in some years in high-income countries yet remain below 60 in some
low-income nations. As birth rates decline, some of the low-income nations. As birth rates decline, some of the
world’s most advanced economies would need to at least world’s most advanced economies would need to at least
double their productivity growth rates to sustain historical double their productivity growth rates to sustain historical
improvements in living standards. improvements in living standards.
These demographic shifts intersect with two other These demographic shifts intersect with two other
dening transitions of our time: the rapid acceleration of dening transitions of our time: the rapid acceleration of
technological advances and articial intelligence, as well technological advances and articial intelligence, as well
as the as the escalating impact of climate change and extreme escalating impact of climate change and extreme
heatheat. Taken together, these forces create both an urgent . Taken together, these forces create both an urgent
challenge and an unprecedented opportunity to rethink challenge and an unprecedented opportunity to rethink
nancial resilience and economic participation across all life nancial resilience and economic participation across all life
stages. stages. Governments, businesses and civil society must act Governments, businesses and civil society must act
now to build systems that enable people of all generations now to build systems that enable people of all generations
to thrive.”to thrive.”
LINK: LINK: https://reports.weforum.org/docs/WEF_Future_https://reports.weforum.org/docs/WEF_Future_
Proong_the_Longevity_Economy_2025.pdfProong_the_Longevity_Economy_2025.pdf
Feature on extreme heat, climate change and the longevity Feature on extreme heat, climate change and the longevity
economy:economy:
“Climate change is reshaping economies, communities
and public health systems worldwide, presenting signicant
challenges and considerations for the longevity economy.
As extreme weather events become more frequent and
environmental changes disrupt nancial security, career
stability and public health, individuals and institutions must
navigate new uncertainties that affect their long-term well-
being.
A longevity economy that accounts for climate risks will
require a deeper understanding of how these disruptions
affect nancial resilience, workforce participation and
intergenerational stability.”
29SMARTAGRI BAROMETERSMARTAGRI BAROMETER

NEWS FROM OUR NEWS FROM OUR
PARTNERSPARTNERS

NEW AND EXPANDED CARBON HEROES NEW AND EXPANDED CARBON HEROES
PLATFORM LAUNCHES TO CELEBRATE PLATFORM LAUNCHES TO CELEBRATE
CREDIBLE SUSTAINABILITY PROGRESS IN CREDIBLE SUSTAINABILITY PROGRESS IN
AGRICULTUREAGRICULTURE
Ms Anél Blignaut
On 15 May 2025, Blue North Sustainability ofcially
launched the enhanced Carbon Heroes platformCarbon Heroes platform—a
digital recognition system designed to spotlight genuine
and measurable sustainability progress across food
and agricultural sectors. The launch event was held
at the atmospheric Die Boekklub venue just outside
Stellenbosch, bringing together a diverse group of
industry stakeholders for an evening of connection,
conversation, and celebration. Among the attendees
were distinguished guests Dr Ilse Trautmann and Prof
Stephanie Midgley from the Western Cape Department
of Agriculture, along with representatives from
Woolworths, Hortgro, WWF-South Africa, and leading
farms and agribusinesses.
Since 2011, Blue North has worked closely with businesses
at every level of the agricultural supply chain—from farm
to retailer—supporting their efforts to meet increasingly
demanding sustainability goals. Over the years, it
became clear that while numerous environmental
and social standards and audits are essential to ensure
compliance, they often fall short of capturing the full
depth and commitment to sustainability demonstrated
by many businesses. These processes sometimes feel
more like obligatory procedures than opportunities
to showcase meaningful work happening across the
supply chain.
Throughout this journey, Blue North witnessed countless
inspiring sustainability initiatives and success stories
that often went unrecognised. The challenge was
clear: how to highlight these positive contributions in
a credible, transparent, and impactful way—without
adding yet another rigid standard that might increase
compliance burdens? In response, Carbon Heroes
was launched in 2021 as a pioneering pilot initiative
focused on celebrating fruit and wine growers who
used the Confronting Climate Change (CCC) carbon
footprinting tool.
This pilot proved highly successful, generating positive
sentiment and encouraging deeper engagement with
sustainability practices by shining a light on genuine
carbon management efforts. Building on this strong
foundation, Blue North saw the opportunity to broaden
Carbon Heroes beyond carbon alone, evolving it into
a comprehensive, inclusive platform that recognises a
wider spectrum of sustainability efforts. The updated
Carbon Heroes platform now embraces six key areas:
Foundational Compliance, Commitment, Carbon,
Water, Biodiversity, and Transparency—re`ecting the
interconnected realities of sustainability challenges and
progress within the agricultural sector.
Carbon Heroes operates as a recognition framework
designed to make sustainability efforts visible and to
reward authentic progress with integrity. Participating
businesses—from primary producers to exporters and
other value chain actors—are invited to measure their
sustainability performance using trusted tools such
as SHERPA and CCC, set meaningful targets, and
demonstrate ongoing improvement.
Recognition is awarded at Bronze, Silver, and Gold levels
across the six pillars, with each organisation receiving
a public prole and a unique QR code to showcase
their achievements.David Farrell, CEO of Blue North
Sustainability, emphasised the platform’s role in shifting
the sustainability narrative. “There is so much great work
happening on farms and within businesses that often
goes unnoticed — Carbon Heroes seeks to change
that by celebrating credible, bottom-up progress,” he
said. “Our aim is to foster greater transparency and trust
across agricultural value chains by encouraging self-
disclosure and publicly sharing progress.”
The launch party featured an interactive exploration
area where guests could browse the new Carbon
Heroes platform rsthand. Attendees shared enthusiastic
feedback on its user-friendly design and clear purpose.
“Credibility is key,” Farrell noted. “We’ve developed a
robust methodology and a strict set of rules to ensure
the integrity of the recognition process.”
The enhanced Carbon Heroes platform is now live and
accessible at http://www.carbonheroes.co.za, offering
practical guidance for businesses eager to apply,
earn recognition, and learn from others committed
to sustainability. For further details, contact Blue North
Sustainability at support@bluenorth.co.za.
31SMARTAGRI BAROMETERSMARTAGRI BAROMETER

David Farrell (Blue North) and Dr Ilse Trautmann (WCDoA)Ms Louise Brodie (Lucentlands) and Prof Stephanie Midgley (WCDoA)
Top left to right: David Farrell (Blue North), Chantelle Smit (Blue North), Malissa Murphy (Blue North), Nitasha Baijnath-Pillay (Hortgro), Keenan
Naicker (Blue North), Anél Blignaut (Blue North), Tania Coetsee (Blue North), Amber Paulse (Blue North). Front left to right: Alexis Oosthuizen (Blue
North), Joné Carter (Blue North), Solène Reed (Blue North), Dr Ilse Trautmann (WCDoA), Prof Stephanie Midgley (WCDoA), Wilmie Cronjé (Blue
North), Eddie Vienings (Blue North)

GREENCAPE PUBLISHES GREENCAPE PUBLISHES
2025 SUSTAINABLE 2025 SUSTAINABLE
AGRICULTURE MARKET AGRICULTURE MARKET
INTELLIGENCE REPORT INTELLIGENCE REPORT
(MIR)(MIR)
The 2025 Sustainable Agriculture Market Intelligence Report
(MIR) is compiled for investors and suppliers to the
sustainable agriculture sector in the Western Cape. It
highlights smart farming and undercover farming as areas
that offer opportunities for investors, agricultural and green
technology manufacturers, service providers, distributors
and others in the value chain.
This report provides updates on smart farming, and has a
particular focus on precision-spraying using drones. It also
provides an update on undercover farming, last featured
in the 2021 Sustainable Agriculture MIR, as this market is
particularly active due to strong market drivers.
Please click here to download the 2025 MIR Report for
Sustainable Agriculture: https://greencape.co.za/
wp-content/uploads/2025/04/WEB-2025-Sustainable-
Agriculture-MIR.pdf
33SMARTAGRI BAROMETERSMARTAGRI BAROMETER

SHOWCASING SHOWCASING
RESEARCH AND RESEARCH AND
YOUNG SCIENTISTSYOUNG SCIENTISTS

35SMARTAGRI BAROMETERSMARTAGRI BAROMETER
DR TENEILLE NELDR TENEILLE NEL
Doctor of Philosophy in the Department of Doctor of Philosophy in the Department of
Soil Science in the Faculty of AgriSciences at Soil Science in the Faculty of AgriSciences at
Stellenbosch University, 2024Stellenbosch University, 2024
TITLE: TERMITE-AFFECTED SOILS IN THE WESTERN TITLE: TERMITE-AFFECTED SOILS IN THE WESTERN
CAPE – A TOOLKIT FOR THE ASSESSMENT OF CAPE – A TOOLKIT FOR THE ASSESSMENT OF
OXALOTROPHY AND CARBON STORAGE OXALOTROPHY AND CARBON STORAGE
POTENTIALPOTENTIAL
Supervisor: Prof Catherine E. ClarkeSupervisor: Prof Catherine E. Clarke
Co-supervisor: Dr Michele L. FrancisCo-supervisor: Dr Michele L. Francis Dr Teneille Nel at her graduation in December 2024
THESIS ABSTRACTTHESIS ABSTRACT
Soil carbon (C) sequestration is a nature-based strategy to
reduce atmospheric CO2 levels. Soil inorganic carbon (SIC)
represents a store of durable C in (semi-)arid soils. Earthen
mounds (heuweltjies) occupied by Microhodotermes
viator termites are ubiquitous in the Greater Cape Floristic
Region of South Africa and may be active sites for the
biogenic formation of calcium carbonate (CaCO3) via the
oxalate-carbonate pathway (OCP).
However, a lack of techniques to monitor the OCP has
hindered its investigation. The impact of land use change
on C storage capacity of heuweltjies demands research
efforts to inform land-use decisions. No studies have
conrmed whether OCP is active in heuweltjie soils or
assessed the quantity and distribution of soil organic C
(SOC) and SIC in heuweltjies of mesic climatic regions.
The aims of this study were to develop an analytical toolkit to
identify and monitor the OCP and apply these techniques
to evaluate biotic and abiotic drivers of C dynamics in
termite-affected soils. This toolkit included novel methods
of quantifying oxalate concentrations in environmental
samples by mid-infrared (MIR) spectroscopy and monitoring
soil pore gas composition in incubation experiments. Soils,
vegetation and termite frass (excrement) from semi-arid
and mesic regions (Koringberg and Stellenbosch) and from
cultivated and uncultivated heuweltjies were compared
to evaluate climatic controls as well as the impact of land-
use change on C dynamics in the mounds.
The heuweltjie in Stellenbosch contributed to 51% of
landscape SOC stocks (predominantly in the topsoil)
and subsoil alkalinization suggested that bicarbonates
may be produced in these heuweltjies and leached
to aquifers for long-term C storage. In Koringberg,
heuweltjie subsoils were enriched in SOC and SIC
relative to off-mound soils. The SOC enrichment factor
of uncultivated heuweltjie topsoils relative to off-mound
soils was up to 5.6 times greater than that of cultivated
mounds due to higher organic C content of frass derived
from renosterveld vegetation compared to crops. The
deeper, cultivated mound (up to 140 cm depth) stored
more C than the shallower mounds in undisturbed soil
(mean maximum depth of 85 cm) and contributed 53%
toward total landscape C stocks. MIR spectroscopic
models accurately quantied CaOx in compound clay
mineral mixtures, frass samples and vegetation extracts
(normalized root mean squared error of prediction ≤ 0.07).
Higher soluble oxalate content in vegetation from drier
climatic zones may re`ect drought stress-induced oxalate
synthesis in plant tissues of these regions. CaOx in frass
samples may have degraded more rapidly in soils with
greater moisture content. Increases in pH, calcite saturation
index and apparent respiratory quotient values provided
evidence of oxalotrophy in heuweltjie soils treated with
CaOx or frass. Soils treated with frass sequestered more
C (18.5% increase) than CaOx treatments, which may be
attributed to CO2-xation. Decreased apparent respiratory
quotient (ARQ) values in frass treatments (ca. 0.5 units
lower than the control) suggested preferential metabolism
of lignin. This study provides an analytical toolkit that
enables more comprehensive assessment of C dynamics
in oxalate-rich ecosystems to inform land use decisions
based on evaluation of climate-regulating ecosystem
services.
PUBLISHED FIRST-AUTHOR ARTICLES FROM THE THESIS:PUBLISHED FIRST-AUTHOR ARTICLES FROM THE THESIS:
• Nel, T. et al. 2025. Impacts of land use change on
carbon storage in termite mounds of South Africa.
Catena. https://doi.org/10.1016/j.catena.2025.109141
• Nel, T. et al. 2025. Oxalate content of vegetation and
termite frass in western South Africa. Ecosphere. https://
doi.org/10.1002/ecs2.70265
• Nel, T. et al. 2025. Carbon dynamics in termite mounds:
The effect of land use on microbial oxalotrophy.
Catena. https://doi.org/10.1016/j.catena.2025.108947
• Nel, T. et al. 2024. Efcient quantication of soluble
and insoluble oxalates in clay mineral mixtures.
Communications in Soil Science and Plant Analysis.
https://doi.org/10.1080/00103624.2024.2336574

37 SMARTAGRI BAROMETERSMARTAGRI BAROMETER
DR DOUW BODENSTEINDR DOUW BODENSTEIN
Doctor of Philosophy in the Department of Doctor of Philosophy in the Department of
Soil Science in the Faculty of AgriSciences at Soil Science in the Faculty of AgriSciences at
Stellenbosch University, 2025.Stellenbosch University, 2025.
TITLE: EVALUATION OF SELECTED GLOBAL AND TITLE: EVALUATION OF SELECTED GLOBAL AND
REGIONAL SOIL MAPS FOR SOIL CARBON REGIONAL SOIL MAPS FOR SOIL CARBON
CONTENT MODELLING OF AREAS OF SOUTH CONTENT MODELLING OF AREAS OF SOUTH
AFRICAAFRICA
Supervisor: Prof Catherine E. ClarkeSupervisor: Prof Catherine E. Clarke
Co-supervisors: Dr Stephan van der Westhuizen Co-supervisors: Dr Stephan van der Westhuizen
and Dr Andrew Watsonand Dr Andrew Watson Dr Douw Bodenstein
THESIS ABSTRACTTHESIS ABSTRACT
Southern Africa faces climate variability, compromised
food and water security, as well as the loss of ecosystem
functions due to high greenhouse gas levels, like carbon
dioxide. Environmental models, such as hydrological
models, Earth Systems Models and Land Surface Models,
as well as carbon turnover models, are often used to
investigate the systems in which these problems occur.
Soil maps serve an important purpose for many of these
environmental models by providing spatially distributed
information about soil types and properties.
The most intensively researched soil property of these
maps is soil organic carbon (SOC). Soil organic carbon
is an important component in soil systems, which impact
local ecosystems and global carbon circulation systems.
Global and regional soil maps like the Harmonized
World Soil Database v1.2 (HWSD), SOTER (Soil and Terrain
Digital Database) maps, and SoilGrids are often used in
environmental models. Numerous soil maps therefore
exist for the use in environmental models. However, few
modelling studies critically evaluate the soil map used
and likely depend on the implied accuracies of the
maps.
This study assessed the accuracy of global and regional
soil maps for a portion of southern Africa by comparing
the mapped soil properties to those from two soil prole
databases. The investigated soil maps were the HWSD,
AfSoilGrids250m , and SOTER for southern Africa, while the
prole databases were the African Soil Prole Database
(AfSIS) and the South African Soil Prole Database. The
analyses revealed that, for most cases, the modelled
and observed data correlated poorly but that the
AfSoilGrids250m map was the most representative of
eld conditions.
This research study further developed a 3D Random Forest
machine learning model to predict SOC concentrations
at six standard depths for South Africa. A similar modelling
approach to SoilGrids2.0 was implemented, in which
depth was used as a covariate, thereby allowing for
the prediction of soil properties in three dimensions. The
SOC maps obtained from the model were compared to
SoilGrids2.0 as well as with data from the South African
Soil Prole Database.
The results showed that the new SOC maps for South
Africa were able to predict carbon concentrations
in texturally contrasting soils more accurately than
SoilGrids2.0. The nal component of this research used
the existing global soil maps (HWSD and SoilGrids2.0),
together with the newly developed SOC map of South
Africa, to estimate the carbon sequestration potential of
a semi-arid, Mediterranean rainfall region in South Africa.
The results showed that the RothC-26.3 carbon turnover
model could be calibrated for the study region and that
the model could be used to predict carbon sequestration
potential. The results further indicated that the choice of
soil basemap is important, as the basemap impact the
predicted rate of carbon sequestration.
PUBLISHED FIRST-AUTHOR ARTICLE FROM THE THESIS:PUBLISHED FIRST-AUTHOR ARTICLE FROM THE THESIS:
• Bodenstein, D., Clarke, C., Watson, A., Miller, J., van
der Westhuizen, S., Rozanov, A., 2022. Evaluation of
global and continental scale soil maps for southern
Africa using selected soil properties. Catena (Amst)
216. https://doi.org/10.1016/j.catena.2022.106381

05SMARTAGRI BAROMETERSMARTAGRI BAROMETER 05SMARTAGRI BAROMETERSMARTAGRI BAROMETER
UPCOMING UPCOMING
CONFERENCESCONFERENCES

11
GARDEN ROUTE ENVIRONMENTAL GARDEN ROUTE ENVIRONMENTAL
FORUM (GREF): CLIMATE CHANGE AND FORUM (GREF): CLIMATE CHANGE AND
ENVIRONMENTAL MANAGEMENT INDABAENVIRONMENTAL MANAGEMENT INDABA
June 27, 2025
Main Auditorium, Nelson Mandela University
Theme: A global re-look at Climate Change and
securing sustainable funding mechanisms for resilient
landscapes in the Southern Cape
To register contact Louise Mare: louisamare@gmail.
com
22
ADAPTATION FUTURES 2025 (AF2025)ADAPTATION FUTURES 2025 (AF2025)
13-16 October 2025
Te Pae Christchurch Convention Centre
{tautahi Christchurch
NEW ZEALAND
Hybrid (in-person and virtual)
Adaptation Futures Conference 2025
AF2025 is a unique opportunity to share new ideas, AF2025 is a unique opportunity to share new ideas,
network with 1500 people from around the world network with 1500 people from around the world
and online and inspire action to accelerate climate and online and inspire action to accelerate climate
adaptation!adaptation!
AF2025 will recognise the vital role of Indigenous
and local knowledges and insights from Oceania.
AF2025 aims to support Global South, Indigenous
and youth leadership at this global event.AF2025 will
offer innovative, inclusive and interactive discussion
formats, face to face and online. Alongside welcoming
traditional papers/panels and posters to ignite action
and share new insights we encourage ‘co-creation’
sessions including workshops/talanoa-wānanga
opportunities for rich discussion, feedback and new
knowledge creation. AF2025 will intentionally stimulate
inclusive, disruptive and challenging conversations to
accelerate adaptation.
38 SMARTAGRI BAROMETERSMARTAGRI BAROMETER

33
Technical Field Days presented by the Western Cape Technical Field Days presented by the Western Cape
Department of Agriculture in partnership with farmers Department of Agriculture in partnership with farmers
and industry bodiesand industry bodies
Registration details for these events will be made
available later in the year. Please SAVE-THE-DATES!
• Conservation Agriculture Western Cape (CAWC)
Jack Human Week: 6-7 August 2025, Percheron
Hall, Elsenburg, and Tygerhoek Research Farm,
Riviersonderend.
Book tickets here: https://www.quicket.co.za/
events/300102-blwk-se-jack-human-bewaringslan
dbouweek/?ref=invite&?utm_source=invite&utm_
medium=email&utm_campaign=invite_system#/
• SSK Winter Cereal Information Day: 27
August 2025, Uitkyk, Riversdale
• SKOG Information Day: 28 August 2025,
Langgewens Research Farm
• Outeniqua Information Day: 17 September 2025,
Outeniqua Research Farm
• Hopeeld Information Day: 19 September 2025,
Waterboerskraal, Hopeeld
44
Western Cape Agricultural Research Forum (WCARF)Western Cape Agricultural Research Forum (WCARF)
18 September 2025
Elsenburg
For more information contact Dr Ilse Trautmann:
ilse.trautmann@westerncape.gov.za
55
30TH UNITED NATIONS CLIMATE CHANGE CONFERENCE 30TH UNITED NATIONS CLIMATE CHANGE CONFERENCE
2025 (UNFCCC COP30)2025 (UNFCCC COP30)
10-21 November 202510-21 November 2025
Belém, BrasilBelém, Brasil
https://cop30.br/enhttps://cop30.br/en
39SMARTAGRI BAROMETERSMARTAGRI BAROMETER

02 SMARTAGRI BAROMETERSMARTAGRI BAROMETER
BECOME PART OF
THE SMARTAGRI
DRIVE
Interested persons who would like to get more
information on SmartAgri and its related actions,
are invited to contact Prof Stephanie Midgley:
stephanie.midgley@westerncape.gov.za. Please
subscribe to the SmartAgri Barometer if you would
like to be updated on a regular basis.
Lee-Ann BellLee-Ann Bell
Information Developer
lee-ann.bell@westerncape.
gov.za
SMARTAGRI SMARTAGRI NewsletterNewsletter
stephanie.midgley@westerncape.gov.za Web: www.elsenburg.com
www.greenagri.org.za
Prof Stephanie MidgleyProf Stephanie Midgley
Specialist Scientist: Climate
Change
stephanie.midgley@
westerncape.gov.za
Images: Images: Johann Strauss, Piet Lombard, Johann Strauss, Piet Lombard,
Mike Wallace, Mike Ferreira, Blue North Mike Wallace, Mike Ferreira, Blue North
Sustainability, Dawn Noemdoe, Teneille Sustainability, Dawn Noemdoe, Teneille
Nel, Douw Bodenstein, Lee-Ann BellNel, Douw Bodenstein, Lee-Ann Bell
Newsletter compiled by:


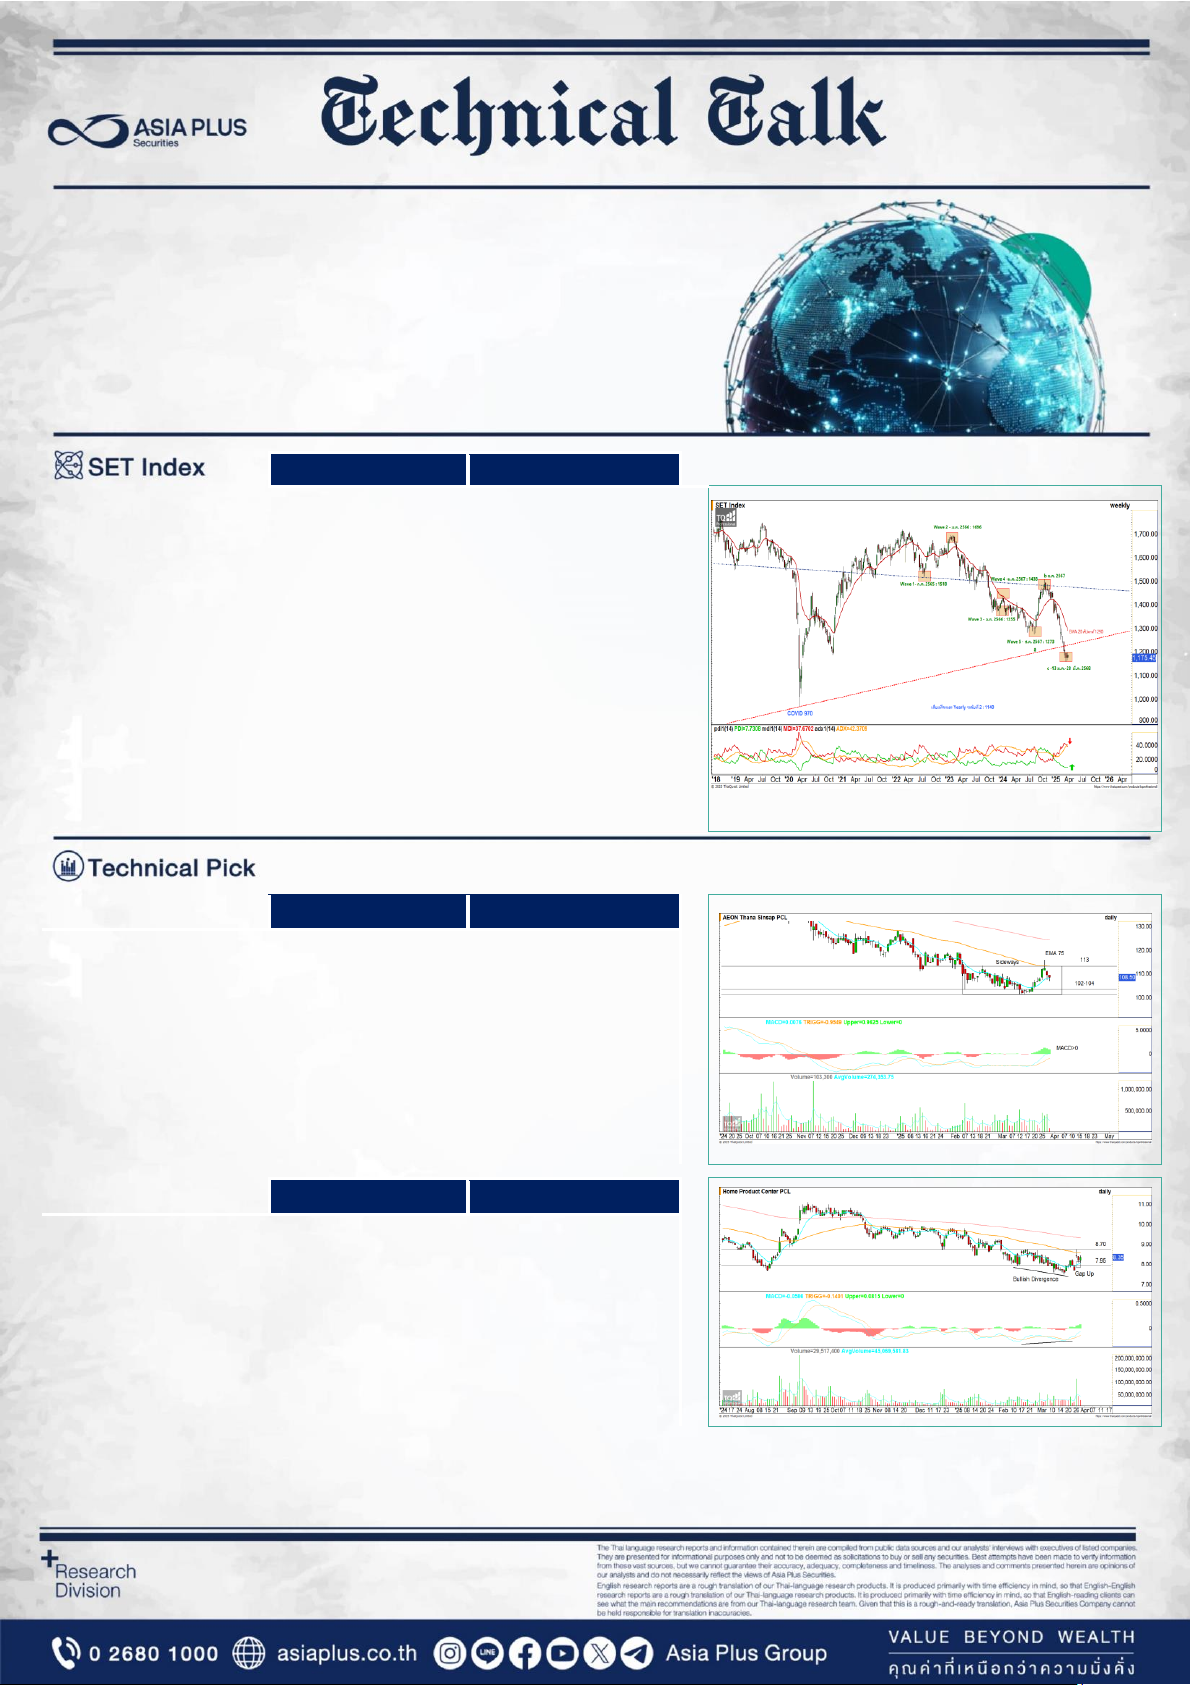
![TRAIL 1: THE ANCESTORS ERA [GENESIS]](https://s3.us-east-1.amazonaws.com/outstation.idea/pdf-mt/2042542606083424256/pdf/1fbc2a8a-6154-411e-b03f-2d2455cbc19a/imgs/page1.png)