2025 Multifamily Investment Report PDF Free Download
1 / 39/39
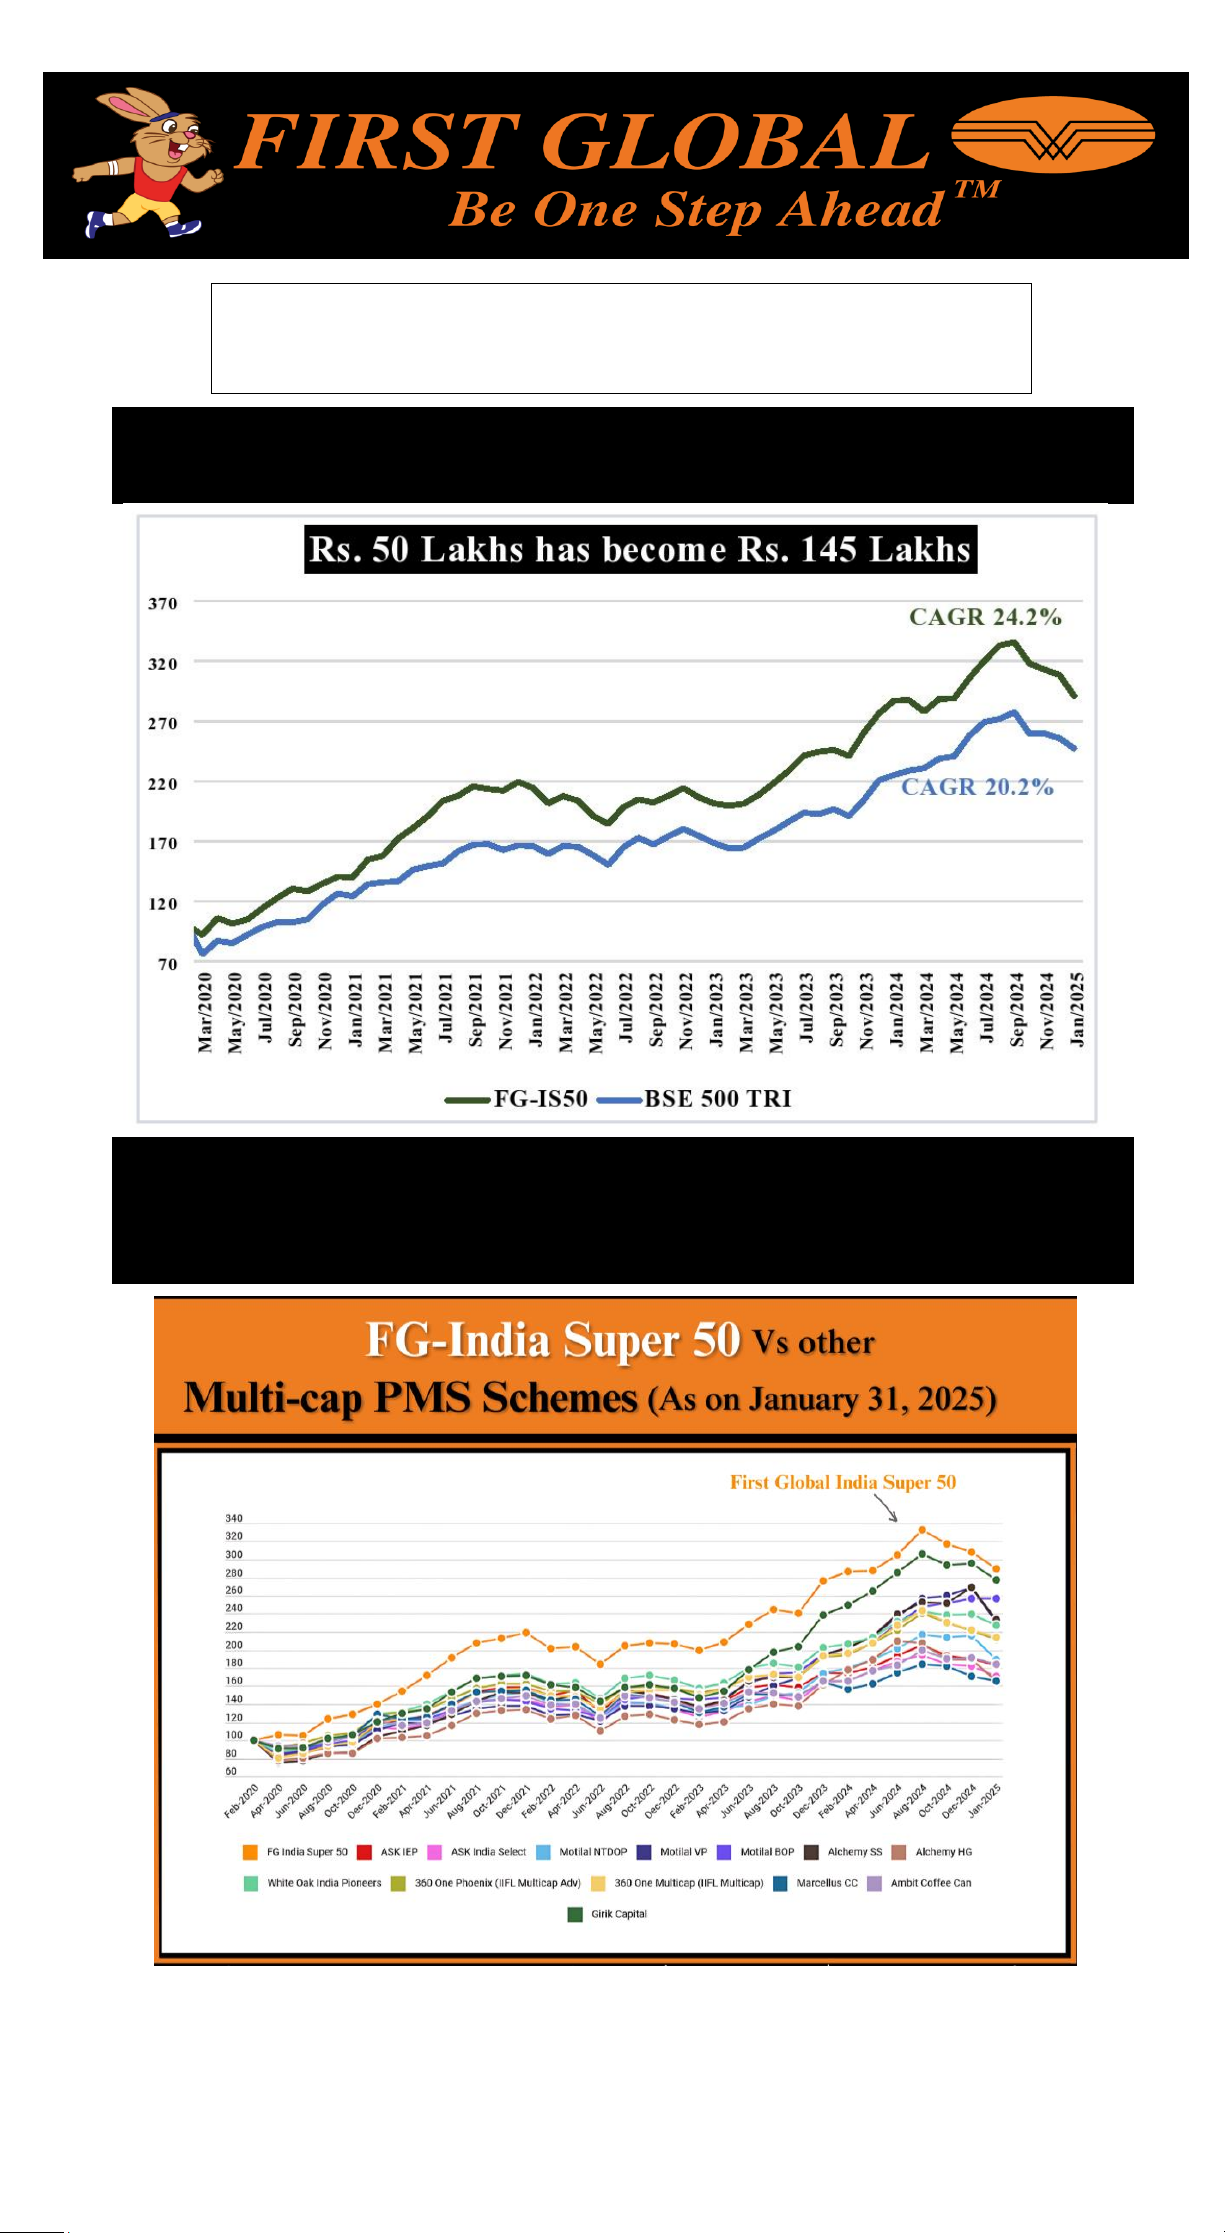
100%

www.investnext.comwww.investnext.com March 2025
2025 Multifamily
Investment Report

www.investnext.com
1/38 March 2025
Executive Summary
Market Overview & 2024 Retrospective
2
4
10
17
25
34
Capital Markets & Investment Landscape
Geographic Market Analysis
Investment Strategies & Opportunities
Take Your Multifamily Investment Strategy
Further with InvestNext
table of contents
Table of Contents

www.investnext.com
2/38 March 2025
The Multifamily Market in 2025: What's Next for Fund Managers
Heading into 2025, the multifamily market is showing signs of stabilizing
after a challenging year. While 2024 brought record supply levels and
interest rate pressures, strong renter demand has kept the sector
resilient – and it remains the top choice for commercial real estate
investors. For fund managers navigating this transition, both challenges
and opportunities are emerging
The numbers tell an encouraging story for 2025. Vacancy rates are
expected to improve to 4.9% by year-end, with rents growing at 2.6%
annually according to CBRE's latest projections. This recovery comes at
a critical time, as new construction starts are set to drop significantly –
down 74% from their 2021 peak by mid-2025. This pullback in new
supply should help properties that have been dealing with local market
competition
The market's strength hasn't gone unnoticed by major players. Recent
deals highlight continued confidence in multifamily: KKR invested $2.1
billion to acquire 5,200 units, while Blackstone purchased Apartment
Income REIT for $10 billion. These moves make sense when you look at
the housing market – it now costs about 25% more monthly to own a
home than rent one, the biggest gap we've seen in 15 years. This spread
continues to drive rental demand across markets.
executive summary
Executive Summary
Looking at the year ahead, we see several important trends shaping the
market. Debt funds are becoming more active as traditional lenders
adjust their approach.
Deal volume should reach $370-380 billion as capital that's been sitting
on the sidelines starts moving again when interest rates stabilize.

www.investnext.com
3/38 March 2025
Meanwhile, strong operations and smart technology adoption are
becoming key differentiators – it's not just about buying right, but
managing assets effectively
The landscape also presents evolving risk considerations that
multifamily investors cannot ignore, including:
Rising operating expense
Tightening compliance requirement
Capital structure challenge
In this report, we break down these trends and what they mean for fund
managers. We'll look at market conditions, capital availability, regional
opportunities, and strategies that can help position your firm for
success as the market enters this next chapter.
The landscape is shifting, but for managers who understand these
changes and leverage the right technology platforms, 2025 offers some
compelling opportunities.
executive summary
Executive Summary
KEVIN HERAS
Co-Founder & CEO

Market Overview &
2024 Retrospective
1

www.investnext.com
5/38 March 2025
The multifamily sector closed out 2024 with stronger fundamentals than
many expected, driven by robust economic growth and persistent
barriers to homeownership. The U.S. economy grew at 2.7% - exceeding
most projections and providing a solid foundation for rental demand.
Strong employment numbers and durable consumer spending helped
offset the impacts of higher interest rates and historic supply levels.
While inflation pressures moderated in 2024, the cost of home ownership
continued to lock many potential buyers into the rental market.
This dynamic was evident in the housing market, where median home
prices reached $415,000 in 2024. With strict lending requirements, only
27% of U.S. households qualified for a standard Freddie Mac loan. The
average spread between median home payments and average rents
grew to $1,200 - creating a ceiling on resident turnover and supporting
stable occupancy across most markets.
market overview & 2024 retrospective
Market Performance: Looking Back at 2024
Economic Context and Market Drivers
Housing Market Impact
Mortgages Shift Course, Pricing Still Elevated
2020
$210 2.0%
$265 3.5%
$320 5.0%
$375 6.5%
$430
8
.0%
Median Sales Price
-
Existing Home
Median Sale Price
(
000s
)
Median Sale Price
(
000s
)
Mortgage
R
ate
30
-Y
ear Mortgage
2021 2022 2023 2024

www.investnext.com
6/38 March 2025
market overview & 2024 retrospective
2024 marked a peak in new multifamily deliveries, with 520,000 units
coming online across the country. What surprised many observers was
the market's ability to absorb this new supply. The year recorded the
second-highest absorption numbers on record, demonstrating the
depth of rental demand despite economic headwinds.
Supply and Absorption Dynamics
Looking forward, we're seeing clear signs of a shifting supply landscape.
Permit activity dropped 24% year-over-year in the first eight months of
2024, with some markets seeing even sharper declines.
For example
Austin: -60.5
Miami: -77.8
Houston: -61.0%
Construction Pipeline Changes
Supply and Demand Come Into Alignment
05
-225 2.0%
03.5%
225 5.0%
450 6.5%
675 8.0%
Class A
Vacancy Rate
Class B Class C
07 09 11 13 15 17 19 21 23 25

www.investnext.com
7/38 March 2025
The multifamily market in 2024 told very different stories depending on
location. This regional diversity created both challenges and
opportunities for investors navigating market selection.
Sun Belt metros continued their pattern of strong population growth and
in-migration, though the impact of new supply was impossible to ignore.
Markets like Dallas-Fort Worth (36,100 new units) and Phoenix (29,000
new units) led the nation in deliveries. Despite this wave of new
inventory, these markets showed remarkable resilience
Average rents remained below the national mean of $1,830 in two-
thirds of Sun Belt market
Strong job growth helped absorb new supply, particularly in markets
like Dallas, which led the nation in hirin
Population growth and household formation continued to provide a
cushion for absorption
market overview & 2024 retrospective
Regional Performance Variations
Sun Belt Markets

www.investnext.com
8/38 March 2025
Primary markets demonstrated different strengths in 2024, with high
barriers to entry playing a key role in their performance
Limited new supply helped maintain pricing powe
Strong rental retention rates offset slower population growt
Premium rents proved sustainable due to high-income renter
demographic
Markets like New York City (21,000 units) and Washington, D.C.
(16,600 units) saw more measured supply growth
market overview & 2024 retrospective
Coastal/Primary Markets
Midwest markets presented a more moderate picture throughout 2024
More modest household formation compared to coastal and Sun Belt
region
Lower barriers to homeownership impacted renter retentio
Conservative development activity helped maintain market balanc
Competitive yields attracted value-focused investors
Midwest Market Performance
Coastal/Primary Markets Midwest Markets

www.investnext.com
9/38 March 2025
The operating environment in 2024 revealed clear differences between
property classes and locations, creating opportunities for targeted
investment strategies.
The market maintained significant rent differentials between property
classes:
Class B to Class C spread: $320 per month These spreads helped
maintain renter retention in Class B and C properties while providing
upgrade opportunities for value-add investors.
Class A to Class B spread: $510 per month
market overview & 2024 retrospective
Rent Growth and Operating Performance
Class Performance Spreads
Urban markets showed signs of stabilization after several challenging
years:
Urban rent growth began to normalize as return-to-office trends
stabilized
Suburban vacancy rates held near long-term averages
50,000+ units absorbed in urban areas
U
r
b
an
v
s
.
S
ubu
r
b
an
T
rends
Class C
ut
s
R
e
gi
s
t
er
i
n
g
Compara
b
le
D
emand
Class
A
V
acanc
y
R
a
t
e
Class
B
Class C
2020
1.0%
2.5%
4.0%
5.5%
7.0%
2021 2022 2023 2024

Capital Markets &
Investment Landscape
2

www.investnext.com
11/38 March 2025
The Burns + CRE Daily Fear and Greed Index tells an encouraging story
for multifamily investors. With a score of 62 on their expansion
sentiment scale, multifamily ranks among the strongest performing
commercial property types, significantly outpacing office (43) and even
just slightly behind industrial (63).
This positive sentiment isn't just abstract—it represents a weighted
analysis from hundreds of active investors signaling their intentions to
increase market exposure in the coming months.
Such confidence metrics typically precede actual capital deployment,
suggesting the groundwork for increased transaction activity is being
laid even as the market works through short-term challenges.
The capital markets story in 2024 was one of gradual improvement and
strategic adaptation. While challenges persisted, investors and lenders
showed increasing confidence as the year progressed, setting up an
intriguing landscape for 2025
Capital Markets & Investment Landscape
Investment Activity and Sentiment
The Fear and Greed Index measures investor sentiment across 4 commercial real estate sectors.
Burns + CRE Fear & Greed Index Current CRE Investment Strategy Index
Access to CRE Capital Index (4Q24 vs. 3Q24)
Expected CRE Investment Strategy Index: Next 6 Months
Fear
H
arder to
access capital
Decreasing my
exposure
Will decrease
my exposure
Sources
:
J
ohn Burns Research and Consulting, LLC
;
CRE Daily (Data
:
N
ov-24,
P
ub
:
Dec-24)
Easier to access
capital
Increasing my
exposure
Will increase my
exposure
Typical
H
olding/not changing
my exposure
Will hold/not change
my exposure
Balanced Greed
O
n a diffusion index, a value above 55 indicates expansion, while a value below 45 implies contraction.
0 0
00
10 10
1010
20 20
2020
30 30
3030
40 40
4040
50 50
5050
60 60
6060
7
0
7
0
7
0
7
0
80 80
8080
9
0
9
0
9
0
9
0
100 100
100100
56 56
5668
56 55
55
6
9
43 45
45
50
62 61
61
80
63 65
65
7
4
O
verall
O
verall
O
verall
O
verall
Multifamily Multifamily
MultifamilyMultifamily
Industrial Industrial
IndustrialIndustrial
Retail Retail
RetailRetail
O
ffice
O
ffice
O
ffice
O
ffice
FGI

www.investnext.com
12/38 March 2025
The market is still working through some pricing adjustments
Multifamily values declined 7% year-over-yea
Looking ahead, experts project a modest 2% decline in the first half
of 202
This "price discovery" phase has actually helped bring buyers and
sellers closer to agreement on valu
While multifamily values declined 7% year-over-year, the forward-
looking projection is considerably more moderate. Investors expect just
a 2% decline in the first half of 2025, signaling we may be approaching
the bottom of the price adjustment cycle.
For mid-sized investors, this institutional activity has important
implications. While these headline-grabbing deals might seem removed
from day-to-day operations, they signal broader market confidence and
help establish valuable pricing benchmarks for assets across the market
spectrum
Capital Markets & Investment Landscape
Asset Values and Pricing

www.investnext.com
13/38 March 2025
This represents a significant shift from previous quarters' expectations
and suggests that pricing discovery is advancing.
The sentiment from market participants, as one Texas-based investor
noted, points to 2025 as "a good year to acquire multifamily with lower
cost and higher transaction volumes"—a particularly notable outlook
given the continued capital constraints in the broader market
Capital Markets & Investment Landscape
Investors believe that Office and Multifamily asset values will fall further in 2025.
Multifamily
Retail
Industrial
Office
Sources: John Burns Research and Consulting, LLC; CRE Daily (Data: Nov-24, Pub: Dec-24)
Expected Change in Values by Asset Class (Next 6 Months)
1Q24
1Q24
1Q24
1Q24
2Q24
2Q24
2Q24
2Q24
3Q24
3Q24
3Q24
3Q24
4Q24
4Q24
4Q24
4Q24
-2%
-2%
-2%
-2%
-2%
2% 1%
-2%
0%
0%
0%
0%
2%
2%
2%
2%
3%
3% 3%
3%
-1%
1%1%
-9%
-4%
-9%
-4%
0%
4%
4%
4%
4%
-4%
-4%
-4%
-4%
-6%
-6%
-6%
-6%
-8%
-8%
-8%
-8%
-10%
-10%
-10%
-10%

www.investnext.com
14/38 March 2025
The debt markets showed signs of stabilization in 2024, though access
to capital remained selective. This selectivity has actually created
opportunities for well-positioned operators who can demonstrate strong
fundamentals and clear business plans.
Average multifamily loan interest rates: 6.29
Loan-to-value ratios trending between 55-65
Traditional banks maintaining conservative lending standard
The key to navigating this environment has been preparation and
relationships. Successful borrowers in 2024 typically came to the table
with more detailed financial packages, stronger proof of operational
excellence, and clear strategies for managing both upside and downside
scenarios.
Debt funds and alternative lenders stepped up to fill gaps in the market,
particularly for
Bridge loans for value-add opportunitie
Short-term financing need
Structured solutions for complex deals
Capital Markets & Investment Landscape
Lending Environment
Traditional Financing
Alternative Capital Sources
This evolution in the lending landscape represents both a challenge and
an opportunity. While traditional financing may be harder to secure, the
variety of capital sources has actually increased, giving experienced
operators more tools to structure deals creatively.

www.investnext.com
15/38 March 2025
One of the biggest stories heading into 2025 is the approaching wave of
debt maturities. About $1.5 trillion in commercial real estate debt comes
due by the end of 2025, with a significant portion in multifamily. The
data on approaching debt maturities
30% of investors plan to refinance at market rate
26% remain undecided on their strateg
Many loans originated in 2018-2021 face refinancing rates 200-300
basis points higher than their original term
This maturity wave isn't just a challenge - it's potentially a significant
opportunity for well-capitalized investors. As some owners face difficult
refinancing decisions, buyers with dry powder and operational expertise
are likely to find increasingly attractive acquisition opportunities
throughout 2025.
Capital Markets & Investment Landscape
The Debt Maturity Challenge

www.investnext.com
16/38 March 2025
The data shows a mixed picture for construction inputs.
reports that national material
costs in the U.S. decreased by 0.5% over the past quarter but increased
0.3% over the past 12 months. However, labor costs continue to rise,
with the national average increasing 0.9% over the past quarter and 3.7%
year-over-year.
CoreLogic's
February 2025 Construction Cost Update
These trends vary significantly by region and material type. Lumber
costs have decreased 6.0% year-over-year, providing some relief, while
other materials like steel deck have seen increases of 10.7% during the
same period.
Trade policy uncertainty is creating additional challenges.
found that potential tariff policies could
significantly impact construction costs, particularly for materials like
lumber, cement, and steel that rely heavily on imports. According to
industry economists, net inputs to multifamily construction—excluding
capital investment, labor, and imports—are already up 35% from five
years ago and more than 50% from a decade ago.
Urban Land
Institute's economist survey
Capital Markets & Investment Landscape
Material and Labor Cost Trends
Tariff and Supply Chain Considerations
Construction costs and trade policy uncertainty are creating additional
complexities for multifamily developers in 2025. According to
, builder confidence
has fallen sharply amid concerns about tariffs and elevated housing
costs, with uncertainty on trade policy creating significant headwinds
for new developments
February
data from the National Association of Home Builders
Construction Costs and Tari Impacts
F
or multifamily developers, these cost pressures are creating additional
hurdles in an already challenging environment of high interest rates and
tight lending standards.
P
ro
j
ects in pre-development are requiring value
engineering and creative approaches to maintain financial feasibility.

Geographic
Market Analysis
3

www.investnext.com
18/38 March 2025
The Sun Belt story in 2024 demonstrated both the region's enduring
appeal and its near-term challenges. Dallas-Fort Worth emerged as a
prime example of this dynamic, leading the nation in both job creation
and new supply with 36,100 units delivered. This level of new inventory
might seem concerning at first glance, but the market's fundamentals
tell a more nuanced story
"Despite new supply pressures, Sun Belt markets maintain remarkable
absorption strength," notes Marcus & Millichap's research, pointing to
Dallas's nation-leading hiring rates and robust household formation. This
employment growth provides crucial support for the market's expanding
inventory
Other key Sun Belt markets showed similar patterns
Phoenix: 29,000 new units delivered, with population growth helping
offset supply pressur
Austin: 24,300 units added, experiencing temporary rent adjustments
(-5.5% year-over-year
Atlanta: 17,000 units, benefiting from diverse employment growth
Geographic Market Analysis
Sun Belt Markets: Supply and Demand at an
Inection Point

www.investnext.com
19/38 March 2025
In contrast to the Sun Belt's explosive growth, Northeast and Midwest
markets demonstrated different strengths in 2024. According to the
Fear and Greed Index, these regions benefited from
More modest supply pipeline
Strong rental retention rate
Sustained pricing power in established submarket
Particularly notable was the performance of urban cores in these
regions. The data shows over 50,000 units absorbed in urban areas
during 2024, marking a significant shift from pandemic-era trends. This
urban revival is especially evident in markets like Boston, where sub-2%
inventory growth has supported stronger rent growth, pushing average
effective rents above $3,100
Geographic Market Analysis
Northeast and Midwest: Stability Amid Limited
Supply
Current CRE Investment Strategy Index (4Q24)
Decreasing Exposure Increasing Exposure
Sources: John Burns Research and Consulting, LLC; CRE Daily (Data: Nov-24, Pub: Dec-24)
Measures the share of commercial real estate investors increasing, descreasing, or holding their
investment exposure to commercial real estate sectors during the most recent quarter.
0
10
20
30
40
50
60
70
80
90
100
Multifamily Industrial Retail Office
1Q24
2Q24
3Q24
4Q24
1Q24
2Q24
3Q24
4Q24
1Q24
2Q24
3Q24
4Q24
1Q24
2Q24
3Q24
4Q24
54 55 55
44
53
43
55
46
55
45
57 61 59 57 57
65

www.investnext.com
20/38 March 2025
Coastal gateway markets demonstrated surprising resilience in 2024,
leveraging their high barriers to entry and strong employment
fundamentals. New York City, delivering 21,000 units, exemplified how
these markets are balancing growth with constraint
Washington, D.C.'s performance (16,600 new units) showcased another
key advantage of gateway markets: diverse employment drivers. As
Marcus & Millichap's research indicates, markets with varied economic
bases proved more resilient to sector-specific disruptions, maintaining
more stable occupancy rates throughout the year
Price and Performance Metric
Looking at gateway market performance
Limited new supply kept competitive pressures in chec
Higher barriers to homeownership supported strong retentio
Premium rents remained sustainable despite economic headwinds
Geographic Market Analysis
Coastal Gateway Markets Return to Prominence

www.investnext.com
21/38 March 2025
Several markets emerged as strong performers in 2024, combining
elements of both gateway and Sun Belt success stories. Data from
Marcus & Millichap highlights particularly strong performances in
Orlando: The market led the nation in household formation while
maintaining elevated rent growth projections. Unlike some of its Sun Belt
peers, Orlando's supply additions remained better aligned with
absorption
Las Vegas: Significant household formation combined with renewed
employment growth created a compelling investment case. The market
demonstrated strong migration patterns while avoiding the oversupply
concerns seen in other high-growth regions
Houston: The market's story centered on affordability and opportunity,
recording the second-largest labor force expansion forecast among
major metros. Net in-migration and competitive living costs continued
driving demand across property classes.
Geographic Market Analysis
Emerging Markets: The Next Wave

www.investnext.com
22/38 March 2025
The regional variations we've observed create distinct investment
approaches for different market types
Geographic Market Analysis
Market-Specic Investment Implications
High-Growth Market
In markets like Phoenix and Austin, investors are finding opportunities in
Properties approaching stabilization in supply-heavy submarket
Value-add opportunities where operational improvements can offset
market pressure
Assets positioned to benefit from strong employment corridors
Stable Secondary Market
Markets showing more measured growth patterns offer
Higher initial yields compared to primary market
More stable occupancy trend
Conservative development pipelines supporting rent growt
The data suggests successful strategies will vary significantly by market
type. As Caliber's research notes, metros like Miami demonstrate how
land constraints and strong job growth can support performance even in
competitive environments. Meanwhile, secondary markets often offer
compelling yield premiums that compensate for slower growth
trajectories

www.investnext.com
23/38 March 2025
Geographic Market Analysis
Regional Market Opportunities Summary
Market
Atlanta
Austin
Boston
Dallas-Fort
Worth
Houston
Las Vegas
Moderating
(17,000 units)
Heavy
(24,300 units)
Limited (<2%
inventory
growth)
Heavy (36,100
units)
Moderating
(15,800 units)
Moderate
Stabilizing
Elevated
Low
Stabilizing
Stabilizing
Improving
Moderate
(2-3%)
Recovering
(-5.5% to
positive in
2025)
Strong
(
$
3,100
+
avg.
rents)
Improving
Moderate
Above
average
V
alue
-
add plays
in stabilizing
submar
k
ets
C
ore ac
q
uisitions
at ad
j
usted pricing
Y
ield
-f
ocused core
investments
V
alue
-
add in
employment
corridors
A
ff
ordability
-
f
ocused
investments
Employment
-
driven growth
plays
S
u
pp
l
y
P
i
p
eline Va
c
an
cy
T
ren
dR
ent
G
ro
w
th
O
utlook
I
n
v
est
m
ent
Opp
ortunit
y

www.investnext.com
24/38 March 2025
Geographic Market Analysis
Regional Market Opportunities Summary
Market
New York
City
Orlando
Phoenix
Washington,
D.C.
Moderate
(21,000 units)
Moderate
Heavy
(29,000 units)
Moderate
(16,600 units)
Low
Improving
Elevated
Stabilizing
Stable
Above
average
Recovering
Moderate
Premium core
assets
Strong household
formation plays
Strategic core
acquisitions
Employment
-
centered
investments
Supp
ly
Pi
p
eline
V
a
c
an
c
y
T
rend
R
ent
G
rowth
O
u
tlook
I
n
v
est
m
ent
O
pp
ort
u
nity
Mia
m
iLimited
(
permits down
77
.8
%)
Low Strong Supply
-
constrained core/
value
-
add

Investment Strategies &
Opportunities
4

www.investnext.com
26/38 March 2025
As we head deeper into 2025, the multifamily investment landscape
presents both challenges and opportunities. Success increasingly
depends not just on what you buy, but how you execute - from deal
structure to daily operations
Looking at the broader investment landscape, the overall commercial
real estate market sentiment registers at 56 on the Fear and Greed scale
—just into expansion territory. This composite score is derived from
three critical components: current investment strategy, expected
investment strategy, and access to capital.
Investment Strategies & Opportunities
Operational Excellence in a Complex Market
We are pleased to share the 4Q24 Burns + CRE Daily Fear and Greed Index.
Overview of the Fear and Greed Index (FGI)Overview of the Fear and Greed Index (FGI) Fear and Greed Index Rating
56
The Fear and Greed Index measures investor sentiment across
the US commercial real estate industry. As a composite diffusion
index, ratings above 55 indicate industry
ratings below 45 indicate industry . Ratings
between 45 and 55 indicate a more balanced market.
expansion (greed);
contraction (fear)
The Fear and Greed Index is calculated as a weighted average
of 3 sub-indices:
Increasing/holding/decreasing exposure
in the current
q
uarter vs. the prior
q
uarter
The Fear and Greed Index is at out of
1
00, indicating an commercial
real estate market.
56
expanding
E
xpect ot increase/hold/decrease exposure
over the
next 6 months.
E
asier/similar/harder to access capital
in the
current quarter
vs. the prior
q
uarter.
Current Invest
m
ent
S
trategy Index
out of
100
Expe
c
ted Invest
m
ent
S
trategy Index
Acc
ess to Capital Index
Sources:
J
ohn
B
urns Research and
C
onsulting, LL
C;
C
R
E
D
aily
(D
ata:
N
ov-24,
P
ub:
D
ec-24
)
C
onducted
J
ointly by
J
ohn
B
urns Research
and consulting and
C
R
E
D
aily, the 4
Q
24
index reflects findings 64
7
commercial real
estate investors across four main sectors:
Multifamily, Industrial, Retail
and
Office.
FGI

www.investnext.com
27/38 March 2025
"The introduction of technology reshaped our approach," notes Mike
Williams, VP of Investor Relations at Open Door Capital. "What started
as a way to handle basic operations turned into a competitive
advantage, helping us scale from $50 million to $400 million in capital
under management in just four years.
This operational focus becomes especially critical when looking at the
numbers
Operating expenses are growing faster than historic average
Insurance costs continue rising sharply in many market
Labor costs remain a significant pressure poin
Utility and maintenance expenses require closer management
The market's evolution is changing how investors approach both value-
add and core strategies. Value-add deals, which dominated the last
cycle, now require more careful consideration. According to Marcus &
Millichap's research, successful value-add plays in 2025 are more
focused on operational improvements than major capital projects
For core assets, the story is different. Markets with strong fundamentals
but temporary supply pressure (like Phoenix and Austin) are creating
opportunities to acquire high-quality, newer vintage properties at
attractive bases. The key is understanding which markets are truly
oversupplied versus those experiencing short-term absorption
challenges
Investment Strategies & Opportunities
Value-Add vs Core Strategies Creates A Shiing
Dynamic

www.investnext.com
28/38 March 2025
Well researched market selection has never been more crucial. The data
from our research sources points to several key considerations
Markets showing the strongest opportunities share common
characteristics
Strong job growth (Dallas led the nation in hiring
Solid household formation rate
Population growth supporting absorptio
Supply/demand balance trending positive
Investment Strategies & Opportunities
Asset Selection and Market Positioning
But it's not just about picking markets - it's about understanding specific
submarkets and asset positions within them. The Fear and Greed Index
research shows that properties positioned near major employment
centers are maintaining stronger occupancy rates and seeing better rent
growth, even in more challenging markets.
Expected CRE Investment Strategy Index: Next 6 Months (4Q24)
Will likely decrease
exposure Will likely increase
expocure
Sources: John Burns Research and Consulting, LLC; CRE Daily (Data: Nov-24, Pub: Dec-24)
Measures the share of commercial real estate investors that expect to increase, decrease, or hold their investment
exposure to commercial real estate sectors over the next 6 months.
0
10
20
30
40
50
60
70
80
90
100
Multifamily Industrial Retail
O
ffice
1
Q
24
2
Q
24
3
Q
24
4
Q
24
1
Q
24
2
Q
24
3
Q
24
4
Q
24
1
Q
24
2
Q
24
3
Q
24
4
Q
24
1
Q
24
2
Q
24
3
Q
24
4
Q
24
72 74
68
52
69
45
67
53
69
50
75 80
70 71 70 74

www.investnext.com
29/38 March 2025
Today's multifamily market demands a more sophisticated approach to
risk management. Successful operators are developing comprehensive
strategies across three critical dimensions: capital structure, operational
excellence, and regulatory compliance. Each of these areas represents
an opportunity to build resilience and competitive advantage in a
challenging environment.
With average multifamily loan interest rates at 6.29% and LTV ratios
trending between 55-65% according to our research, operators are
being forced to take a more sophisticated approach to their capital
stack. The approaching wave of debt maturities—with $1.5 trillion in
commercial real estate debt coming due through 2025—makes these
considerations all the more critical
These capital structure fundamentals create a foundation for stability,
but they're just the beginning of comprehensive risk management
Investment Strategies & Opportunities
Risk Mitigation in Practice
Capital Structur
The foundation of effective risk mitigation starts with a robust capital
strategy. Based on the data from Burns + CRE Daily Fear and Greed
Index and our market research, we're seeing operators adapt their
approach in several important ways
Maintaining higher liquidity levels for operating reserves to buffer
against market disruptio
Building relationships with multiple capital sources across
traditional lenders and alternative provider
Creating flexibility in financing structures to navigate the changing
interest rate environment

www.investnext.com
30/38 March 2025
In addition to capital structure, operational excellence has emerged as a
key differentiator for multifamily operators. As Multifamily Dive research
indicates, operating expenses are growing faster than historic averages,
and both insurance and labor costs continue to present significant
challenges. This makes operational risk management increasingly
important
Technology adoption for streamlining operations and reducing
administrative overhea
Systematic approaches to property management that create
consistency across portfolio
Efficient investor communication systems that build transparency
and trus
This operational focus isn't just about administrative convenience—it's
about creating systems that can adapt to market challenges while
maintaining performance. When investor communications, financial
reporting, and property management are connected through integrated
platforms, operators gain both efficiency and resilience.
"At DeRosa Group, we realized the pressing need to streamline our
operations to foster better investor relations and enhance efficiency,"
shares Vincent Celeste of DeRosa Group, who grew from a single duplex
to a diverse portfolio spanning multiple property types. "The decision
to integrate InvestNext was a game-changer. The platform's features,
especially the automated payments and visually appealing investor
dashboard, have been instrumental in streamlining our operations.
Investment Strategies & Opportunities
Operational Risk Management

www.investnext.com
31/38 March 2025
The third dimension of effective risk management involves navigating an
increasingly complex regulatory landscape. With FinCEN's new reporting
requirements taking effect in December 2025 and closer scrutiny on real
estate transactions, compliance is evolving from a back-office function
into a strategic consideration
"Fraud is on the rise and real estate is not immune to these bad actors,"
explains InvestNext Co-Founder and Chief Product Officer Matthew
Attou. "More than $4.6 billion was lost in 2023 to fraudulent
investments; more than any other category according to the FTC. KYC
verification is another major milestone on the path to setting the
standard for what a safer and compliant investing experience looks
like."
At InvestNext, we've watched this transformation across the industry.
Firms that previously viewed compliance as just paperwork are now
using it to build credibility with their investors. The shift is happening in
several key areas
Investor verification has become more thorough, with identity
checks and database screening built into modern investment
platform
Ownership reporting requirements continue expanding, especially
for entities controlling U.S. real estat
Documentation practices are getting more rigorous, with five-year
record retention becoming standard
Investment Strategies & Opportunities
Compliance Risk Management

www.investnext.com
32/38 March 2025
These changes create practical challenges for day-to-day operations,
but they also present opportunities. As our Co-founder and CEO Kevin
Heras notes: "Sponsors are using KYC/AML proactively: this approach
adds a crucial layer of confidence, ensuring audit-readiness and
verification of all capital partners and investors in a given investment,
significantly minimizing the risk of exposure to bad actors.
The reality is that investors—especially those with institutional
experience—are coming to expect these verification standards. Modern
verification systems get the job done without creating friction, with
approval rates above 90% for U.S.-based investors on the first attempt.
This means operators can maintain high standards without slowing
down their capital raise
"A key component of our strategy is empowering clients with the
infrastructure needed to navigate a constantly tightening regulatory
landscape," Heras adds. "KYC/AML inherently fosters investor trust:
investors are already familiar with KYC/AML, especially those involved in
public markets or other regulated securities.
When these three dimensions — capital structure, operational
excellence, and compliance — work together, they create a
comprehensive approach to risk management that addresses the core
challenges identified in our research. This integrated strategy doesn't
just protect against downside scenarios but positions operators to thrive
in a market that increasingly rewards institutional-grade practices and
systems
Investment Strategies & Opportunities

www.investnext.com
33/38 March 2025
As we look toward the latter half of 2025 and beyond, several clear
opportunities are emerging
Markets with strong fundamentals but temporary supply pressure
may present attractive buying opportunities, with values down 7%
year-over-year but strong long-term demand driver
Secondary markets in the Northeast and Midwest are showing
stability and often offering better initial yields than their Sun Belt
counterpart
The approaching debt maturity wave ($1.5T through 2025) suggests
timing opportunities, particularly in markets with high concentrations
of 2018-2021 vintage loan
Success in this environment requires a balanced approach - combining
smart market selection with operational excellence and risk
management. The winners in 2025 will likely be those who can execute
across all these dimensions while maintaining the flexibility to adapt as
market conditions evolve
Investment Strategies & Opportunities
Looking Ahead: Strategic Opportunities

Take Your Multifamily
Investment Strategy
Further with InvestNext
5

www.investnext.com
35/38 March 2025
The evolving multifamily landscape demands more than just smart
acquisitions - it requires sophisticated operating systems, seamless
investor management, and institutional-grade compliance. InvestNext
offers a comprehensive platform designed to help multifamily operators
execute across every dimension of their business, from investor
relations to fund administration.
investnext
Take Your Multifamily Investment Strategy
Further with InvestNext

www.investnext.com
36/38 March 2025
Fund managers and operators need robust, adaptable tools to navigate
today's complex market environment. InvestNext's end-to-end platform
helps you:
investnext
Transform Your Investment Operations
Execute with Precisio
Automate complex waterfall distributions and investor payment
Streamline tax document management and K-1 distributio
Maintain institutional-grade compliance and reporting standard
Handle multiple fund structures within a single platform

www.investnext.com
37/38 March 2025
investnext
Build Stronger Investor Relationship
Deliver a modern, branded investor portal experienc
Provide real-time access to investment performanc
Share documents and updates securel
Enable seamless investor communication
Build Stronger Investor Relationship
Deliver a modern, branded investor portal experienc
Provide real-time access to investment performanc
Share documents and updates securel
Enable seamless investor communication
Scale Your Operations Efficientl
Reduce administrative overhead through automatio
Centralize document management and investor dat
Integrate fund administration services seamlessl
Support growth without adding overhead

www.investnext.com
38/38 March 2025
investnext
Real Results from Real Operators
By centralizing your investment operations on InvestNext, you can focus
on what matters most: finding deals, building relationships, and growing
your portfolio. The result is more efficient operations, enhanced investor
satisfaction, and a stronger competitive position in today's demanding
market
Schedule a demo to discover how InvestNext can help you
scale your operations while providing enhanced transparency
to build investor trust and confidence.
Victor Pasaran
Pasago Investment Management
“InvestNext wasn't just a tool for me. It was a game-changer in how I
managed my portfolio, allowing me to see the bigger picture, analyze
data, and diversify investments across various markets, thanks to its
versatility.”
Patrick Keltner
Griffin Partners
“The transition has left a positive mark on our operations, elevating
our professionalism, reducing payment errors, and enhancing risk
controls.”
Mike Williams, VP Investor Relations
O
pen
D
oor
C
apital
“The introduction of InvestNext reshaped our approach. It came at a
critical juncture, providing the scalability we needed to surpass our
expectations of
$50
million in
C
apital
U
nder
M
anagement, reaching
$400
million in
C
apital
U
nder
M
anagement within just four years.”