A Very Brief Introduction to Candlestick Patterns PDF Free Download
1 / 14
/14
100%

Table of Contents
Introduction .................................................................................................................... 2
1 Basic theoretical concepts ....................................................................................... 3
1.1 Candlestick construction .................................................................................................................................. 3
1.2 Short and long lines ........................................................................................................................................... 4
1.3 Basic candles ....................................................................................................................................................... 6
1.3.1 Candles with different open and close prices ..................................................................................................... 6
1.3.2 Marubozu candles ................................................................................................................................................... 7
1.3.3 Spinning tops ........................................................................................................................................................... 7
1.3.4 Doji candles .............................................................................................................................................................. 7
1.4 Candlestick charts: CandleScanner color theme ........................................................................................... 7
1.5 Price trend and price averages ......................................................................................................................... 9
1.6 Candlestick patterns ........................................................................................................................................ 10
1.6.1 Basic candles .......................................................................................................................................................... 10
1.6.2 One-line patterns ................................................................................................................................................... 11
1.6.3 Two-line patterns .................................................................................................................................................. 11
1.6.4 Three-line patterns ................................................................................................................................................ 12
1.6.5 Four-line patterns .................................................................................................................................................. 12
1.6.6 Five-line patterns ................................................................................................................................................... 13

A VERY BRIEF INTRODUCTION TO CANDLESTICK PATTERNS 2
Introduction
Please note that this text sometimes refers to CandleScanner software. However, the
knowledge described here is universal and may be used by anyone, no matter if
CandleScanner is used or not.
Japanese candle patterns are well known and routinely implemented in displaying price behaviour. However, when
apparent emerging patterns are analysed and discussed, it is frequently the case that the conclusions are imprecise, and,
indeed, often result in contradictory interpretations of what the patterns are actually saying. Hence, to accurately
implement a tool scanning charts for candle patterns is not a straightforward undertaking.
Candle patterns are very interesting for traders due to their simplicity, elegance and natural interpretation of market
sentiment. No matter how markets evolve, ‘patterns’ will appear on the charts. Essentially, the core premise, and
assumption, underlying the application of technical analysis is that such patterns are repetitive and detectable. Technical
analysis is widely employed in various financial markets, informing traders about the non-fundamental determinants of
price, in other words, "market sentiment."
However, observing an apparent repeating pattern on a chart can result in completely different trading outcomes.
Experienced traders know that the efficiency of an investment decision depends not only on the analytical tool(s)
employed, but also on other factors, such as risk and position management. In this regard, CandleScanner™ software
can be implemented as an objective tool aiding the trader in taking positions, based on the systematic evaluation of price
behaviour.
Trying to identify patterns manually, or visually, by merely scanning the charts can be problematic. It can be also be
dangerous, as there may be a tendency to see patterns, where there are none, in random data. For example, the very
successful trader, William Eckhardt, in the Jack Schwager book “The New Market Wizards”, says that we as human beings
don’t look at data neutrally. That is, when the human eye scans a chart it doesn’t give all the data points equal weight.
Instead, there is a tendency to focus on certain 'outstanding' cases, and to form opinions on the basis of these special
cases. That’s why when Eckhardt has an insight based on a chart pattern, he tries to reduce it to an algorithm that can be
tested on a computer. In order to investigate whether or not the insight has any value, it should be explicitly formulated,
tested and evaluated. In this regard, an objective assessment has a lower chance of being biased, which is crucial when
making trading decisions.
Finally, recalling Warren Buffet's (alleged) reflection on the markets: “I'd be a bum in the street with a tin cup if the markets were
efficient.”
For a very detailed description of each pattern, including its performance, please visit our
website at: https://www.candlescanner.com/patterns-dictionary/.

A VERY BRIEF INTRODUCTION TO CANDLESTICK PATTERNS 3
1 Basic theoretical concepts
In the context of candlestick analysis, the identification of candle patterns may be important, but that in-it-self is not a
sufficient condition for profitable trading. Many texts on candlesticks will most often graphically show that the pattern
had correctly signalled the subsequent price action and leave it at that. This can give the erroneous impression that to
find the pattern on the chart is all the trader needs to do in order to make a profit. However, by merely looking at the
resulting price profile ignores important considerations such as position management and risk management. A full
assessment of the profitable success or otherwise of candle patterns requires back testing the results, based on candle
signals and taking account of money and risk management..
1.1 Candlestick construction
The construction of the single candlestick, also known as the candle line, is based on the basic data in a single time
interval and consists of the following (OHLC) components:
opening price (Open)
maximum price (High)
minimum price (Low)
closing price (Close)
The time interval can be of any length spanning minutes, hours, days, weeks, months or years. However, if we are
focused on candle patterns, most traders are interested in candles made from intervals not longer than one day.
It is common to find OHLC representing the order for displaying the prices (open, high, low, close).
Figure 1.1. Candlestick construction.

A VERY BRIEF INTRODUCTION TO CANDLESTICK PATTERNS 4
The single candlestick is composed of three elements: upper shadow (jap. uwakage), lower shadow (jap. shitakage) and body (jap.
jittai). The candlestick body is determined by the opening and closing prices, represented by a rectangle. The color of the
rectangle differs, depending on whether the opening price is higher or lower than the closing price.
If the closing price is higher, which means that over the time interval we had an increase in price, the candle is referred
to as a white candle. If the price decreased over given time interval, that is, the closing price is below the opening price, the
candle is referred to as black candle.
Traditionally, the Japanese used black and red. However, nowadays it is more common to use black and white or, if the
candlestick is filled with color, is deemed to be decreasing candlestick (closing price below the opening price).
Alternatively, if the candlestick is unfilled this indicates growth (closing price above opening price). Sometimes, filled red
candles are used to denote a bearish candle (closing price below the opening price) and a filled green candle denotes a
bullish candle (closing price above opening price).
Figure 1.1 shows the elements which make-up a candle and how it is drawn, depending on the relationship between the
opening and closing prices.
1.2 Short and long lines
Candles differ in length, which is shown in the division of the candle. The criterion for this division is fluid and depends
on the current situation on the chart. The so-called short line is the one where the market volatility is very low (small price
range). Similarly, the long line will be the one of high volatility (high price range). The short/long line can be displayed in
CandleScanner software with different colors so that they can readily be recognized. By default, the orange color is used
for the short line and a green color for the long line.
Knowing whether a candle is a short or long line is important to recognize correctly, and distinguish, between the many
candle patterns. However, to know the details how exactly CandleScanner recognizes whether we have a short or long
line is not necessary, especially for the less experienced users.
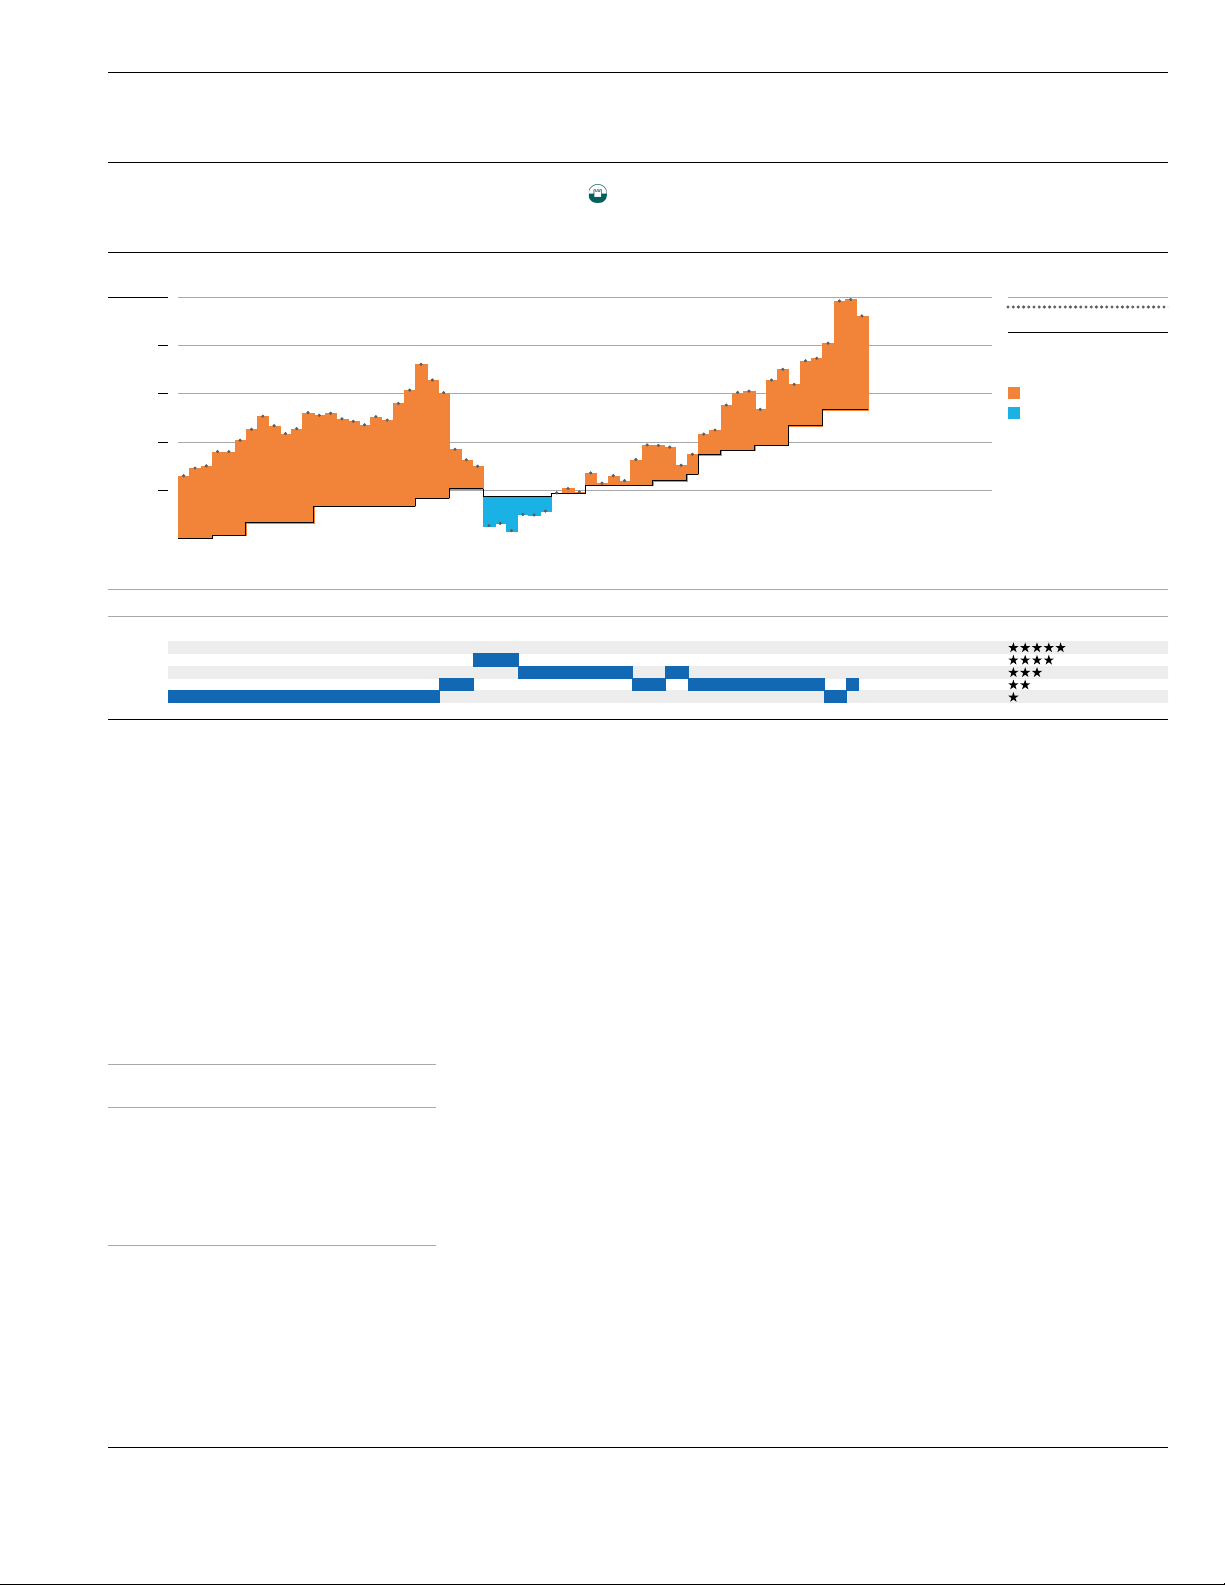
Figure 1.2. Pfizer Inc. long lines (green) and short lines (orange). Candle length depends on the current volatility of the last 25 sessions,
which means that the green candlesticks may have very different span (and still be seen as long lines). Other colors used on the chart
are explained in subsequent sections. Please note that such a color theme is implemented in CandleScanner, but the user can also

A VERY BRIEF INTRODUCTION TO CANDLESTICK PATTERNS 5
switch to a simple traditional two-color scheme with black and white candles (or other). Using more colors helps, for example, to
accept or reject certain candle pattern as valid/invalid.
It is assumed in CandleScanner that the decisions as to whether we are dealing with a long or a short line, we take the
whole candle into account (the body with the shadows).
A common analyst’s mistake is to look at the historical chart and determine the height and dynamics of the candle, not
only on the basis of the historical prices but also on future candles. However, while the candlestick is being formed, we
do not know the future yet. Therefore, we should not use the information about the future volatility of the market.
Figure 1.2 shows that the green candles, representing a long line, have very different spans. For example, the September
long lines are significantly shorter than those as at the end of October. But, in both cases, we deal with long lines
although in different market conditions.
Long/short line is also known as a long/short day. The term "day" (short or long) refers to a single
line of candle and derives from the period, where the charts were created on the basis of daily
quotations. In the case of charts constructed on the basis of intraday prices, (for example 5
minutes, hourly or others), such a term can be confusing. For this reason, in CandleScanner the
term long/short line is used to avoid any misunderstanding.
Moreover, in Greg Morris’s book titled "Candlestick Charting Explained", such phrases as long
days and short days are referring only to the height of the candle body. This is a surprising
approach, because that would mean that the candle with a small body and with very long
shadows would be considered as constituting a short day, indicating low volatility during the
day. Therefore, it might be considered that this was some simplification on the part of Morris. To
repeat, CandleScanner takes into account the whole candle height, i.e. the body and the
shadows if they exist.
Figure 1.3. Determination of the short and the long line, depending on the average price range. The green line shows 70% of price
volatility for the last 25 bars. We can notice that when the candle height exceeds the green line it is marked as green, meaning that we

A VERY BRIEF INTRODUCTION TO CANDLESTICK PATTERNS 6
are dealing with a long line. All candles whose height is below the green line are marked in yellow – these are short lines. The red and
dark blue candles are described in section 1.3.
By default CandleScanner adopts the following rule determining whether the candle is a long or a short line: it sets the
current range of volatility as an exponential average distance between the highest and lowest prices of individual candles
for the last 25 candles. A candle which spans more than 70 percent of this volatility value is regarded as a long line.
Candles below this threshold are regarded as short lines.
Figure 2.4 illustrates the process of determining the short and a long line. Red lines designate the average range of
volatility for the last 25 candles. The green line in the middle indicates 70 percent of the range between red lines. Each
candle located below this threshold is classified as a short line and marked with the orange color. Dark blue and red
candles will be discussed later.
The parameter value of 70 percent was arbitrarily chosen. Normally, this depends on personal preference, and
CandleScanner allows the user to change this to meet specific requirements. Nevertheless, it is good to remember that
the more we increase this parameter, the more short lines we will have, and vice versa when we lower the value, there
will be more long lines. This also has an impact on the number of identified candle patterns found by CandleScanner.
Despite the discretion, we should remember that the optimal range is somewhere between 65 and 80 percent of the span.
Please follow this link https://www.youtube.com/watch?v=3jKZuMM9hlk to watch the video
explaining the short/long line notion.
1.3 Basic candles
Given the requirement for information on four prices, OHLC, in order to construct a candle, the resulting candle shapes
can take on a variety of forms. The body may be very long or very short, and similarly for shadows. However, either the
body or the shadows may sometimes not appear at all. This multitude of combinations allows a grouping the candles
based on their appearance, enabling them to be interpreted. All the individual candles are called basic candles. Most of
them are not patterns as such, but they can often play an important role in the assessment of the current situation of the
market and its possible further development. Basic candles are components of more complex patterns which can contain
two, three or even more basic candles.
The detailed construction of basic candles (and candle patterns) is described on our website:
http://www.candlescanner.com/candlestick-patterns/basic-candles/.
1.3.1 Candles with different open and close prices
Candles with different opening and closing prices having two shadows (upper and lower) and, with a longer body than
the shadows, are denoted as follows:
Short White Candle (short line)
White Candle (long line)
Long White Candle (long line)
Short Black Candle (short line)
Black Candle (long line)
Long Black Candle (long line)

A VERY BRIEF INTRODUCTION TO CANDLESTICK PATTERNS 7
1.3.2 Marubozu candles
Candles with different opening and closing prices, but not having at least one shadow, are called marubozu (jap. shaved
head). In the case when a single shadow exists, the candlestick body must be longer than the shadow. Marubozu candles
occur both for the short and long line.
Marubozu candles can be one of the following:
White Marubozu
Opening White Marubozu
Closing White Marubozu
Black Marubozu
Opening Black Marubozu
Closing Black Marubozu
1.3.3 Spinning tops
Candlesticks with different opening and closing prices and having at least one shadow, where at least one shadow has to
be longer than the body, are called spinning tops. The following types of spinning tops are possible:
White Spinning Top (short and long line if none of the shadows are three times longer than the body)
Black Spinning Top (short and long line if none of the shadows are three times longer than the body)
High Wave – a kind of spinning top occurring on a long line (if one of the shadows is at least three times longer
than the body).
In CandleScanner spinning tops are marked by default in dark blue color.
1.3.4 Doji candles
Candles, in which there is no body because the opening price is equal to the closing price are called doji candles (jap. fool,
clumsy, slip of the tongue).
Note that CandleScanner can also classify a candle as a doji when the opening and closing prices differ by a very small
amount (in theory, a doji should not have a body, but the difference may be negligible and then on the chart is hardly
visible). Doji may occur with or without shadows. There are the following types of doji candles:
Four-Price Doji (short line)
Long-Legged Doji (long line)
Dragonfly Doji (long line)
Gravestone Doji (long line)
Doji (short or long line)
In CandleScanner, the doji candles are marked in red color by default when using the CandleScanner color theme. All of
these basic candles can be part of candlestick patterns, and, therefore, it is important to know if we are dealing with a
doji candle or a spinning top. It is easy to mix them up when a spinning top has a very small body, which looks on the
chart as if the open and close prices are equal.
1.4 Candlestick charts: CandleScanner color theme
Almost all of the western literature devoted to candlesticks has simplified the analysis by limiting the candle colors to
dark (black) and light (white) body. According to Seiki Shimizu, the colors of candles were originally much more
complex, which he demonstrated in the example of a doji candle, in which there is only a shadow line and a line marking
the opening price equal to the closing price.

A VERY BRIEF INTRODUCTION TO CANDLESTICK PATTERNS 8
Figure 1.4. Alcoa Inc. candlestick chart using CandleScanner Color Theme. Due to using colors it is very easy to see long/short lines
(green and yellow candlesticks respectively), spinning tops (blue candlesticks) and doji candles (red candlesticks).
With high price volatility over short time intervals, when the price jumps, for example, by some 30 percent, some
candles can look as insignificant points on the chart. The use of color immediately explains and shows the nature of the
candle. In CandleScanner users can display colors of their choice in the candlestick charts using the CandleScanner Color
Theme. The following colors can be displayed:
green – long lines
orange (dark yellow) – short lines
blue – all kinds of spinning tops
red – all types of doji candles
Figure 1.4 shows a candlesticks chart using the CandleScanner Color Theme. This theme is optional, and can be switched
off if you prefer a simple candlesticks chart using just two colors. Notice that it makes to use the CandleScanner Color
Theme if you want to quickly spot the difference between short/long lines and spinning tops/doji candles. For example,
some doji candles are marked in blue color rather than red as was previously mentioned. This is because in fact such
candles are indeed spinning tops and not doji candles, but their bodies are so small that on the chart they look as if the
open and close prices are the same. Hence, most people just looking on the chart would say that they see a doji candle,
although in fact it is a spinning top.
Again, the distinction as to which exact candle we have on the chart is crucial in correctly recognizing the candle pattern.
CandleScanner enables the user to adjust the settings of the searching algorithms to meet specific requirements. For
example, the CandleScanner algorithm searching for doji candles can be adjusted to accept small deviations from the
strict doji definition which says that such candles do not have a body (open and close prices are equal). This can be
helpful while dealing with larger candles. We can then define in CandleScanner to accept as doji candles such cases
where body length is up to 3% of the whole candle length. Similarly, CandleScanner allows defining the threshold for
long/short lines.

A VERY BRIEF INTRODUCTION TO CANDLESTICK PATTERNS 9
1.5 Price trend and price averages
Probably one of the easiest ways to determine trend is the use of moving averages. Moving average is simply an average
of prices (for example close prices) for a certain number of candles. The shorter the period (fewer candlesticks) to
calculate an average the more likely is to be dominated by noise, rather than reflect an underlying trend.
In CandleScanner, there are three basic types of averages: simple, weighted and exponential. The first is the arithmetic
average, where each price has the same impact (i.e. equal weight) on the trend value. The other two measures take
account the element of time where, essentially, the more distant candle prices have less impact on the calculated trend
value and the more recent prices have a greater impact. Consequently, the weighted and exponential averages respond
faster to recent price changes than does the simple average.
It is generally the case that the trend is downward if the prices (candlesticks) are below the calculated average line and
the trend is upward if they are above it.
Trend is very important in terms of the candle patterns. Every candle pattern is anticipating either a continuation of the
current trend or its reversal. There are, essentially, the following types of candle patterns in terms of the price trend:
bullish reversal patterns – reversing downtrend into an uptrend
bullish continuation patterns – continuation of uptrend
bearish reversal patterns – reversing uptrend into downtrend
bearish continuation patterns – continuation of downtrend
In CandleScanner the user can set the following parameters related to price trend:
the period (number of candles) of the moving average used as a trend indicator
the type of average used as a trend indicator
how long the required trend needs to last in order to consider established candle pattern as valid
All the above parameters have an impact on the number of candle patterns found by CandleScanner.
Figure 1.5
.
A so-called Bearish Engulfing candle pattern is forecasting a reversal of an uptrend into a downtrend. The first Bearish
Engulfing pattern is not recognized as a valid pattern because the trend requirement was not met (candles were not above the moving
average line). In this particular case, CandleScanner required that an uptrend needs to last at least three candles (days) prior to the
occurrence of the candle pattern.

A VERY BRIEF INTRODUCTION TO CANDLESTICK PATTERNS 10
As an example, Figure 1.5 shows how the classification of patterns works according to the trend on the chart. We have
three examples of the candle patterns typical for a bear market. To be considered a bearish reversal signal, there should
be an existing uptrend to reverse. However, only in the second and third case, with a simple moving average of 10
candles clearly indicating the uptrend, we consider a bearish reversal pattern as valid. In the first case, despite the fact
that bearish reversal candle pattern occurred, ultimately it is not recognized as a valid one – the uptrend lasted only for
one candle (one day in this case) which is not enough.
1.6 Candlestick patterns
The following list of authors and their books had the biggest influence on this textbook:
Seiki Shimizu (The Japanese Chart of Charts)
Steve Nison (Japanese Candlestick Charting Techniques)
Thomas Bulkowski (Encyclopedia of Candlestick Charts)
Greg Morris (Candlestick Charting Explained: Timeless Techniques for Trading Stock and Futures)
The team responsible for developing CandleScanner software has spent a considerable amount of time (spanning several
years) on the analysis, on comparisons and on tests between what different authors had to say on the subject of
candlesticks and candlestick patterns. It so happens, that even between well-known authors and their publications, there
are differences, and even contradictions, on how to apply and interpret candlestick patterns. CandleScanner attempts to
remain true to the spirit of the original Japanese formulation(s). Notwithstanding, rather than take and implement a rigid
approach, the software also provides the opportunity for users to control various parameters.
Below you will find a full list of patterns.
For a very detailed description of each pattern, including its performance, please visit our
website at: https://www.candlescanner.com/patterns-dictionary/.
1.6.1 Basic candles
Watch the video describing basic candles: https://www.candlescanner.com/candlestick-patterns/basic-candles/
Black Candle
Gravestone Doji
Short Black Candle
Black Marubozu
High Wave
Short White Candle
Black Spinning Top
Long Black Candle
White Candle
Closing Black Marubozu
Long White Candle
White Marubozu
Closing White Marubozu
Long-Legged Doji
White Spinning Top
Dragonfly Doji
Opening Black Marubozu
Doji
Four-Price Doji
Opening White Marubozu

A VERY BRIEF INTRODUCTION TO CANDLESTICK PATTERNS 11
1.6.2 One-line patterns
1.6.3 Two-line patterns

A VERY BRIEF INTRODUCTION TO CANDLESTICK PATTERNS 12
1.6.4 Three-line patterns
1.6.5 Four-line patterns
Concealing Baby Swallow
Bearish Three-Line Strike
Bullish Three-Line Strike

A VERY BRIEF INTRODUCTION TO CANDLESTICK PATTERNS 13
1.6.6 Five-line patterns