Comerica Incorporated Second Quarter 2024 Financial Review PDF Free Download
1 / 23/23
100%

Comerica Incorporated
Second Quarter 2024 Financial Review
July 19, 2024
This presentation, and other Comerica written and oral communications, include statements that are not historical facts but rather are forward-looking statements
as defined in the Private Securities Litigation Reform Act of 1995. Words such as “achieve, anticipate, aspire, assume, believe, can, commit, confident, continue,
could, designed, enhances, estimate, expect, feel, forecast, forward, future, goal, grow, guidance, guide, initiative, intend, look forward, maintain, may, might,
mission, model, objective, opportunity, outcome, on track, outlook, plan, position, potential, project, propose, remain, risk, seek, should, signs, strategy, strive,
target, trajectory, trend, until, well-positioned, will, would” or similar expressions, as they relate to Comerica, or to economic, market or other environmental
conditions or its management, are intended to identify forward-looking statements. These forward-looking statements are predicated on the beliefs and
assumptions of Comerica's management based on information known to Comerica's management as of the date of this presentation and do not purport to speak
as of any other date. Forward-looking statements may include descriptions of plans and objectives of Comerica's management for future or past operations,
products or services, and forecasts of Comerica's revenue, earnings or other measures of economic performance, including statements of profitability, business
segments and subsidiaries as well as estimates of credit trends and global stability. Such statements reflect the view of Comerica's management as of this date
with respect to future events and are subject to risks and uncertainties. Should one or more of these risks materialize or should underlying beliefs or assumptions
prove incorrect, Comerica's actual results could differ materially from those discussed. Factors that could cause or contribute to such differences include credit
risks (changes in customer behavior; unfavorable developments concerning credit quality; and declines or other changes in the businesses or industries of
Comerica's customers); market risks (changes in monetary and fiscal policies; fluctuations in interest rates and their impact on deposit pricing; and transitions away
from the Bloomberg Short-Term Bank Yield Index towards new interest rate benchmarks); liquidity risks (Comerica's ability to maintain adequate sources of funding
and liquidity; reductions in Comerica's credit rating; and the interdependence of financial service companies and their soundness); technology risks (cybersecurity
risks and heightened legislative and regulatory focus on cybersecurity and data privacy); operational risks (operational, systems or infrastructure failures; reliance
on other companies to provide certain key components of business infrastructure; the impact of legal and regulatory proceedings or determinations; losses due to
fraud; and controls and procedures failures); compliance risks (changes in regulation or oversight, or changes in Comerica’s status with respect to existing
regulations or oversight; the effects of stringent capital requirements; and the impacts of future legislative, administrative or judicial changes to tax regulations);
strategic risks (damage to Comerica's reputation; Comerica's ability to utilize technology to efficiently and effectively develop, market and deliver new products and
services; competitive product and pricing pressures among financial institutions within Comerica's markets; the implementation of Comerica's strategies and
business initiatives; management's ability to maintain and expand customer relationships; management's ability to retain key officers and employees; and any
future strategic acquisitions or divestitures); and other general risks (changes in general economic, political or industry conditions; negative effects from inflation;
the effectiveness of methods of reducing risk exposures; the effects of catastrophic events, including pandemics; physical or transition risks related to climate
change; changes in accounting standards; the critical nature of Comerica's accounting policies, processes and management estimates; the volatility of Comerica’s
stock price; and that an investment in Comerica’s equity securities is not insured or guaranteed by the FDIC). Comerica cautions that the foregoing list of factors is
not all-inclusive. For discussion of factors that may cause actual results to differ from expectations, please refer to our filings with the Securities and Exchange
Commission. In particular, please refer to “Item 1A. Risk Factors” beginning on page 14 of Comerica's Annual Report on Form 10-K for the year ended December
31, 2023. Forward-looking statements speak only as of the date they are made. Comerica does not undertake to update forward-looking statements to reflect facts,
circumstances, assumptions or events that occur after the date the forward-looking statements are made. For any forward-looking statements made in this
presentation or in any documents, Comerica claims the protection of the safe harbor for forward-looking statements contained in the Private Securities Litigation
Reform Act of 1995.
Safe Harbor Statement
2
©2024, Comerica Inc. All rights reserved.

2Q24 Review
3
©2024, Comerica Inc. All rights reserved.
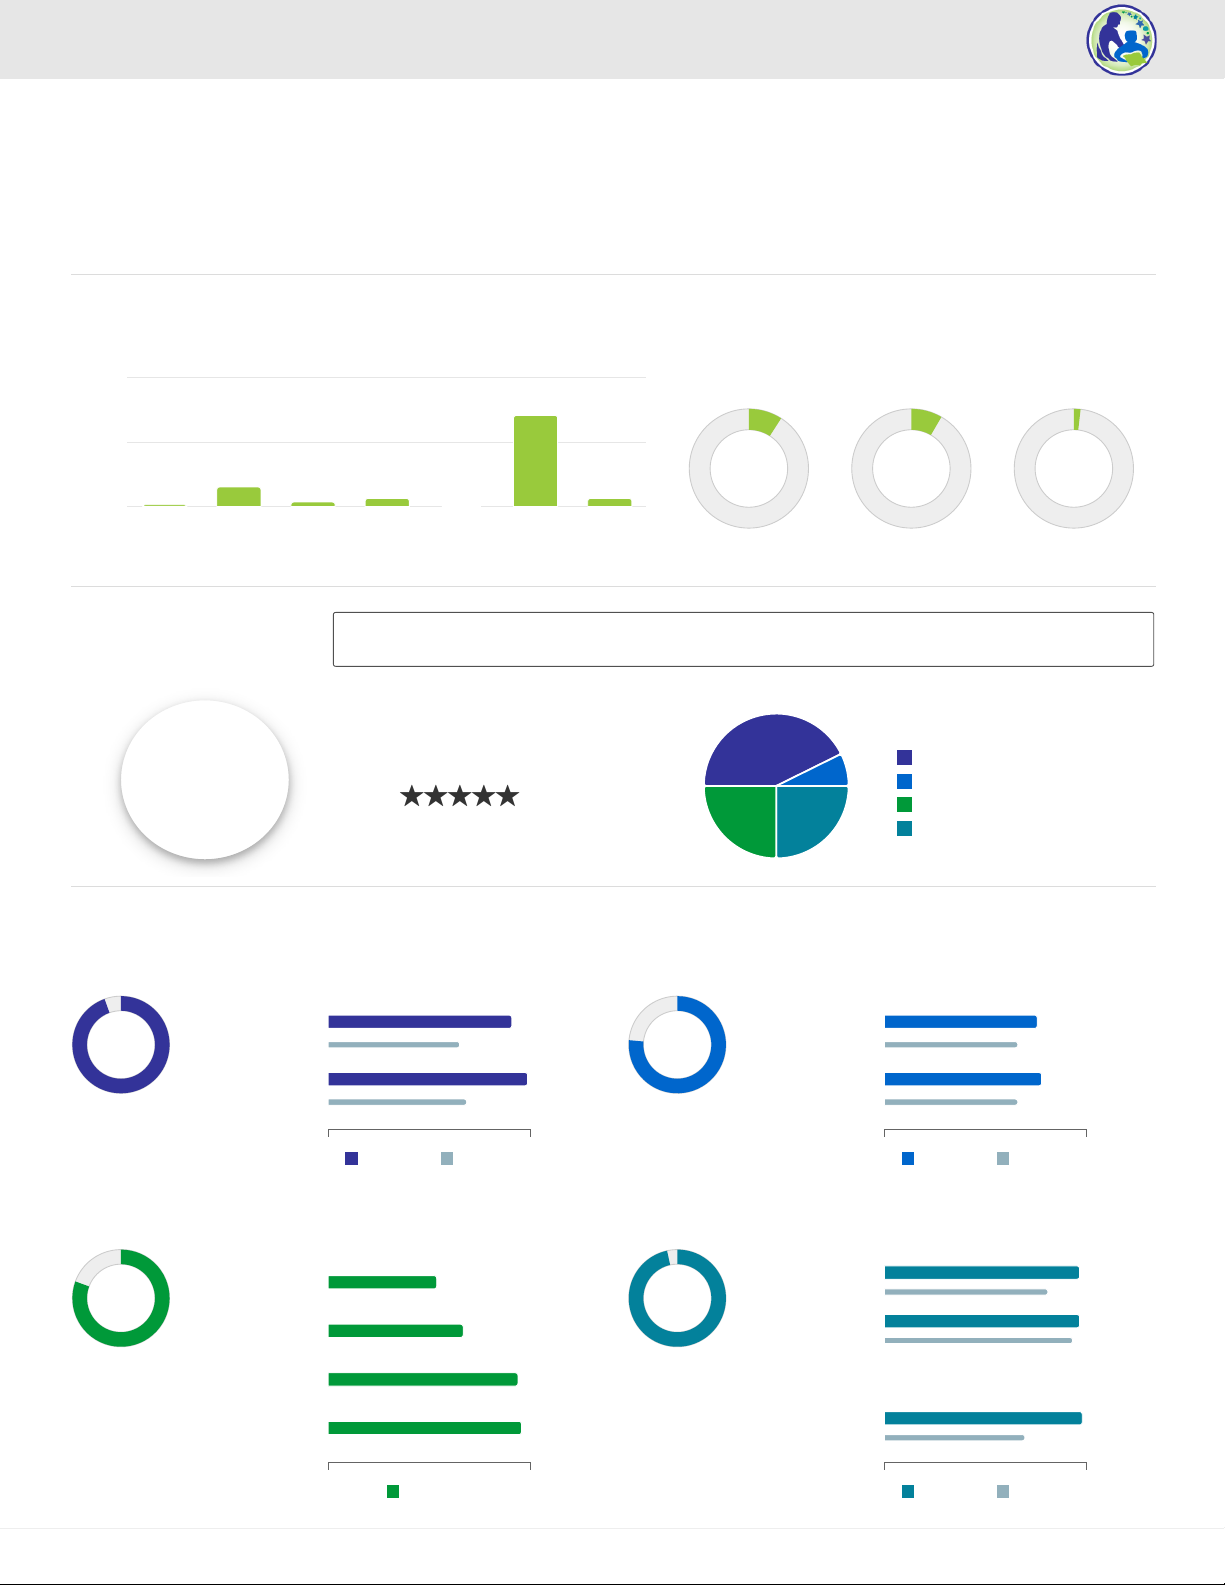
Successful execution of strategic priorities positions for responsible growth
Period-end loans
($ in billions)
Published 16th annual Corporate Responsibility
Report
Recognized as one of the “Best Companies to
Work For”, “Best in Financial Services”, &
“Best Companies in the South” by U.S. News
Recognized as one of the 2024 Top 50
Companies by Fair360, formerly DiversityInc
Recognized as one of the 50 most community-
minded companies for 9th consecutive year by
Points of Light
Earned Texas Bankers Foundation
Cornerstone Award for Comerica BusinessHQ
Achieved $3.0B in Green Lending in 2Q; aligned
with commitment to sustainability
NIM
Noninterest expenses
($ in millions)
Net Charge-Offs
(% of total loans)
EPS
Noninterest income
($ in millions)
($
in
bil
lio
ns)
$50.8 $51.9
1Q24 2Q24
(
)
0.10%
0.09%
1Q24 2Q24
2.80%
2.86%
1Q24 2Q24
($
)
$603
$555
1Q24 2Q24
($
in
mil
lio
ns)
$236 $291
1Q24 2Q24
$0.98
$1.49
1Q24 2Q24
2Q24 Results
Favorable customer trends, prudent credit discipline & reduced impact from notable items drove
improved profitability compared to 1Q24
1Includes gains/(losses) related to deferred comp asset returns of $4MM 2Q23, $6MM 1Q24, $0.5MM 2Q24 in noninterest income & $4MM 2Q23, $6MM 1Q24, $2MM 2Q24 in noninterest expense Ɣ 2Diluted earnings per common share Ɣ 3Refer to
reconciliation of non-GAAP financial measures in appendix Ɣ 4Noninterest expenses as a percentage of the sum of net interest income and noninterest income excluding net gains (losses) from securities, a derivative contract tied to the conversion rate of
Visa Class B shares and changes in the value of shares obtained through monetization of warrants Ɣ 52Q24 estimated Ɣ 6Reflects a $14MM benefit as a result of changes in the combined state income tax rate applicable to deferred tax assets & liabilities
offset by discrete items from vested stock awards of $3MM in 1Q24
(millions, except per share data) 2Q24 1Q24 2Q23
Change From
1Q24 2Q23
Average loans $51,071 $51,372 $55,368 $(301) $(4,297)
Average deposits 63,055 65,310 64,332 (2,255) (1,277)
Net interest income 533 548 621 (15) (88)
Provision for credit losses -- 14 33 (14) (33)
Noninterest income1291 236 303 55 (12)
Noninterest expenses1555 603 535 (48) 20
Provision for income tax 63 29 83 34 (20)
Net income 206 138 273 68 (67)
Earnings per share2$1.49 $0.98 $2.01 $0.51 $(0.52)
Adjusted Earnings per share2,3 1.53 1.29 2.05 $0.24 $(0.52)
Efficiency Ratio467.77% 76.91% 57.70%
CET1511.55% 11.48% 10.31%
Key Performance Drivers
2Q24 compared to 1Q24
• Average loans declined 0.6% due to muted 1Q demand;
balances increased throughout 2Q
• ~69% of decline in average deposits due to deliberate 1Q
reduction in brokered time deposits
• Net interest income impacted by lower Fed deposits from 1Q
liquidity normalization & lower average loans; NIM increased
• Modest net charge-offs of 9 bps; reserve ratio declined to
1.38% reflecting expected, manageable credit trends
• Noninterest income benefited from favorable customer trends &
absence of negative 1Q BSBY cessation impact
• Noninterest expenses declined with lower salaries & benefits &
FDIC expense, largely from the 1Q special assessment
• Taxes impacted by higher pre-tax income & lack of 1Q
favorable discrete items6
• Conservative approach to capital; maintained CET1 above our
10% strategic target
4
©2024, Comerica Inc. All rights reserved.

55.4 54.0 52.8 51.4 51.1 50.8 51.9
6.18 6.34 6.38 6.33 6.32
2Q23 3Q23 4Q23 1Q24 2Q24 1Q24 2Q24
Loans
Prioritizing responsible growth drove an inflection in balances throughout the quarter
2Q24 compared to 1Q24 Ɣ 1See Quarterly Average Loans slide for more details Ɣ 2See Commercial Real Estate slide for more details
Loans
($ in billions)
Average loans decreased $0.3B1, or 0.6%
- $291MM Equity Fund Services
- $126MM Wealth Management
+ $145MM Commercial Real Estate2
Period-end loans increased $1.0B, or 2.0%
+ Included growth in most business lines with largest increases in National Dealer
Services, Equity Fund Services & Environmental Services
Pipeline remained strong throughout 2Q24
5
©2024, Comerica Inc. All rights reserved.
Loan Yields %
Average Balances Period-end
Loan Commitments Declined from 2023
Strategic Rationalization Efforts
(period-end: $ in billions)
57.0 55.5 53.7 50.9 50.0
47% 47% 48% 49% 50%
2Q23 3Q23 4Q23 1Q24 2Q24
Utilization
64.3 65.9 66.0 65.3 63.1 63.6 62.5
2.37
2.90 3.12 3.28 3.23
2Q23 3Q23 4Q23 1Q24 2Q24 1Q24 2Q24
Deposits
Successful strategy drove higher customer-related interest-bearing balances & improved pricing;
retained favorable NIB mix
2Q24 compared to 1Q24 Ɣ 1Interest costs on interest-bearing deposits
Deposit Rate1 %
Average Balances
($ in billions)
Average deposits decreased $2.3B, or 3.5%
- $1.6B Brokered Time Deposits
- $682MM General Middle Market
- $220MM Corporate Banking
+ $206MM Retail Bank
• Average interest-bearing decrease of $1.2B primarily due to $1.6B
decline in brokered time deposits; Average noninterest-bearing
decline of $1.1B
• Cumulative interest-bearing deposit beta of 61%
• 2Q24 average NIB at 40% of total deposits, impacted by success
in growing interest-bearing deposits & cyclical pressure on NIB
balances
6
©2024, Comerica Inc. All rights reserved.
Period-end Balances
($ in billions)
41% 39%
Noninterest-bearing (NIB)
Interest-bearing (IB)

Securities Portfolio
Expect future maturities to enhance earnings power
6/30/24 Ɣ Totals shown in graph above may not foot due to rounding Ɣ 1Outlook for legacy portfolio as of 7/19/24 assuming 6/30/24 forward curve Ɣ 2Amortized cost reflects securities at par net of repayments and remaining unaccreted discount
or premium Ɣ 3Estimated as of 6/30/24
Period-end 2Q24 portfolio decreased $0.6B
• $323MM MBS payments & $250MM Treasury maturities
• Average 2Q24 portfolio decreased $578MM
• 3Q24: Estimated repayments ~$330MM MBS1
• Duration of 5.5 years3
• Extends to 6.0 years under +200bps instantaneous rate increase3
• Net securities-related AOCI unrealized loss modestly increased to
$2.3B (after tax); expect unrealized loss to decline ~20% by 4Q251
Consistent Portfolio Strategy
• Utilize natural portfolio attrition as liquidity source
• Pledge portfolio as collateral to access wholesale funding as needed
• 100% of portfolio is available-for-sale
• No current intention to sell or restructure
• Modest treasury reinvestments planned in FY24 to maintain collateral
requirements
• Expect non-treasury reinvestment potentially to resume ~year-end
2024
©2024, Comerica Bank. All rights reserved. 7
Repayments created liquidity
(period-end; $ in billions)
12.4
18.3 17.4 16.3 16.9 16.2 15.7 15.2 14.8 13.1
0.1
2.7 2.9 3.6 2.7 2.9 3.0 2.8 2.7
2.4
12.3
21.0 20.4 20.0 19.5 19.2 18.6 18.0 17.5
15.5
4Q19 1Q23 2Q23 3Q23 4Q23 1Q24 2Q24 3Q24 4Q24 4Q25
Valuation Adjustment
Fair Value (Reported on Balance Sheet)
Amortized Cost
Without Reinvestment1
2
621 601 584 548 533
2.93 2.84 2.91 2.80 2.86
2Q23 3Q23 4Q23 1Q24 2Q24
Net Interest Income
Lower Fed deposits & average loans offset reduced wholesale funding & improved interest-bearing
deposit cost; NIM increased
2Q24 compared to 1Q24 Ɣ 1See BSBY Cessation Impacts slide for more details
Net Interest Income
($ in millions)
$548MM 1Q24 2.80%
-5MM
- 7MM
+ 2MM
Loans
Lower balances
Portfolio dynamics
- 0.01
- 0.02
+ 0.01
-1MM Securities Portfolio + 0.00
-42MM Fed Deposits -0.10
+12MM
+ 16MM
- 4MM
Deposits
Interest-bearing balances & mix
Rates
+0.07
+0.09
- 0.02
+21MM
+ 27MM
- 3MM
- 3MM
Wholesale Funding
FHLB advances
Medium & long-term debt
Rates, incl. swaps
+0.10
+ 0.14
- 0.02
- 0.02
$533MM 2Q24 2.86%
8
©2024, Comerica Inc. All rights reserved.
Net impact due to rates: ($7MM) on Net Interest Income & (4bps) on the NIM
BSBY Cessation: ($3MM) negative impact to Net Interest Income1
Net Interest Margin %

Interest Rate Sensitivity
Well positioned to protect income as rates decline
6/30/24 Ɣ 1Received fix/pay floating swaps; maturities extend through 3Q30; Table reflects the ultimate swaps average notional balances & weighted average yields post CME LIBOR transition for terms of current & forward starting swaps currently
under contract & assumes no future termination Ɣ 2See BSBY Cessation Impacts slide for more details Ɣ 3For methodology see Company’s Form 10-K, as filed with the SEC. Estimates are based on simulation modeling analysis from our base case
which utilizes June 2024 average balances 9
©2024, Comerica Inc. All rights reserved.
Swaps as of 6/30/241
($ in billions; average; weighted average yield)
• No new swaps added in 2Q24; $250MM forward starting swap went into effect
4/1/24
• Net unrealized swap losses in AOCI relatively flat with $3MM decline to $815MM at
6/30/24 (after-tax)
• BSBY cessation & swap re-designation does not impact above table2
Estimated 12-Month Net Interest Income Impact Relative to Baseline
100 bps gradual decrease $28MM
100 bps gradual decrease & 60% incremental beta $47MM
100 bps gradual increase -$43MM
100 bps gradual increase & 60% incremental beta -$71MM
Sensitivity Analysis as of 6/30/24
Rates UP Rates DOWN
Loan Balances Modest increase Modest decrease
Deposit Balances Moderate decrease Moderate increase
Deposit Beta ~48% per incremental change
Securities Portfolio Partial reinvestment of cash flows
Hedging (Swaps) No additions modeled
6/30/24 Model Assumptions3
100 bps (50 bps avg) gradual, non-parallel rise
22.4 23.6 23.0
20.1
15.0 9.8
4.6
0.8
2.38% 2.50% 2.57% 2.68% 2.72% 2.85% 2.95% 2.97%
FY23 FY24 FY25 FY26 FY27 FY28 FY29 FY30
186
154
178
217 226
0.33 0.29 0.34 0.43 0.44
(0.10)
0.10
0.30
0.50
0.70
0.90
1.10
1.30
1.50
2Q23 3Q23 4Q23 1Q24 2Q24
NPA/Loans %
Credit Quality
Decline in criticized loans, reserve & net charge-offs; migration remains manageable
2Q24 compared to 1Q24 Ɣ 1Criticized loans are consistent with regulatory defined Special Mention, Substandard, & Doubtful categories Ɣ 2A portion of the TLS portfolio is also considered Leveraged & also reflected in the Leveraged data
Nonperforming Assets
Well Below Historical Averages
($ in millions)
Reduction in Criticized Loans1
($ in millions)
728 736 728 728 717
1.31 1.38 1.40 1.43 1.38
-
1.00
2.00
3.00
4.00
5.00
6.00
2Q23 3Q23 4Q23 1Q24 2Q24
ACL/Loans %
Decline in Allowance for Credit Losses
($ in millions)
($ in millions)
2,048 2,290 2,405 2,688 2,430
3.7 4.3 4.6 5.3 4.7
-
2.00
4.00
6.00
8.00
10.00
12.00
2Q23 3Q23 4Q23 1Q24 2Q24
Criticized/Loans %
10
©2024, Comerica Inc. All rights reserved.
Lower Net Charge-Offs (Recoveries)
($ in millions)
Portfolios with Incremental Monitoring
Business Line or
Portfolio
6/30
Loans
% of Total
Loans
%
Criticized Key Drivers
Commercial Real
Estate Business Line $10.3B 19.9% 4.3% Elevated rates impacting valuations & interest
reserves
Leveraged $2.9B 5.6% 9.1% Elevated rates impacting debt service
coverage
Automotive
Production $0.9B 1.6% 9.7% Material / freight inflation & elevated rates
pressuring customer profitability
Senior Housing $0.8B 1.5% 41.4% Under pressure from interest rates, inflation &
occupancy
TLS2$0.7B 1.4% 23.7% Elevated rates, lower valuations & slow
fundraising activity driving higher relative risk
($ in millions)
(2)
6
20 14 11
-0.01 0.05
0.15 0.10 0.09
(0.20)
(0.15)
(0.10)
(0.05)
-
0.05
0.10
0.15
0.20
0.25
0.30
2Q23 3Q23 4Q23 1Q24 2Q24
NCO/Loans %

Noninterest Income
Growth in most customer-related income categories
2Q24 compared to 1Q24 Ɣ 1Includes Risk management hedging income related to price alignment (PA) received for Comerica’s centrally cleared risk management positions $6MM 2Q23, $17MM 3Q23, $18MM 4Q23, $13MM 1Q24, $17MM 2Q24;
Includes Credit Valuation Adjustment (CVA) $1MM 2Q23, ($2MM) 3Q23, ($0.2MM) 4Q23, $0.4MM 1Q24, ($0.1MM) 2Q24; Includes gains/(losses) related to deferred comp asset returns of $4MM 2Q23, ($3MM) 3Q23, $8MM 4Q23, $6MM 1Q24, $0.5MM
2Q24 Ɣ 2See Comerica’s prior disclosures regarding BSBY cessation impact, beginning on January 8, 2024, for more details.
Noninterest Income1
($ in millions)
303 295
198
236
291
2Q23 3Q23 4Q23 1Q24 2Q24
Increased $55MM
+ $42MM risk management income benefit2
+ $39MM BSBY cessation impact
+ $3MM risk management income (PA)
+ $7MM capital markets income
+ $7MM fiduciary income
+ $4MM brokerage fees
- $5MM deferred compensation asset returns (offset in
noninterest expenses)
11
©2024, Comerica Inc. All rights reserved.
535 555
718
603 555
57.7 61.9
91.9
76.9
67.7
2Q23 3Q23 4Q23 1Q24 2Q24
Efficiency Ratio %
Noninterest Expenses1
($ in millions)
Noninterest Expenses
Committed to driving efficiency
2Q24 compared to 1Q24 Ɣ 1Includes modernization & expense recalibration initiatives $7MM 2Q23, ($14MM) 3Q23, $21MM 4Q23; FY23 $31MM; $1MM 1Q24, $2MM 2Q24; Includes gains/(losses) related to deferred comp plan of $4MM 2Q23,
($3MM) 3Q23, $8MM 4Q23, $6MM 1Q24, $2MM 2Q24; Variance may not foot due to rounding
Decreased $48MM
- $25MM salaries & benefits
- $19MM stock-based compensation
- $5MM payroll taxes
- $5MM deferred compensation (offset in other noninterest
income)
- $3MM 401-K expense
+ $4MM severance costs
+ $3MM annual merit increases
+ $2MM staff insurance
- $17MM FDIC insurance (primarily driven by special assessment)
- $12MM other noninterest expense
- $9MM consulting
- $4MM operational losses
- $3MM lower asset impairment costs
+ $4MM advertising
12
©2024, Comerica Inc. All rights reserved.
Notable Items in 2Q results
•FDIC: $3MM expense related to estimated net increase in special FDIC
assessment in addition to $16MM special assessment in 1Q24
• $2MM expense related to modernization & expense recalibration
initiatives

(2.8) (2.0) (2.2) (2.3)
(1.3)
(0.6) (0.8) (0.8)
(0.5)
(0.4) (0.4) (0.4)
3Q23 4Q23 1Q24 2Q24
Securities Swaps Pension
6.36% 6.49%
1Q24 2Q24
Capital Management
Maintained capital position above target CET1 of ~10%1
6/30/24 Ɣ 1Outlook as of 7/19/24 Ɣ 22Q24 estimated Ɣ 3Considers AOCI for securities & pension & related RWA benefit utilizing 6/30/24 risk weighting. Does not assume other potential Basel III Endgame impacts (such as market risk, operational risk &
changes to standard counter-party risk). Ɣ 4Refer to reconciliation of non-GAAP financial measures in appendix Ɣ 5Represents the impact of $3.5B in AOCI on common equity and $2.4B in corresponding impacts to total assets
11.48% 11.55%
7.0%
1Q24 2Q24
CET12Tier 12
12.01% 12.08%
8.5%
1Q24 2Q24
Regulatory Minimum + Capital Conservation Buffer (CCB)
13
©2024, Comerica Inc. All rights reserved.
5.7 5.8
1Q24 2Q24
Common Equity
($ in billions; period-end)
Tangible Common
Equity Ratio4
7.12% 7.24%
1Q24 2Q24
Common Equity Ratio
Accumulated Other Comprehensive
Income
($ in billions)
Scenarios
Est. AOCI
Increase /
(Decrease)
Rate shock
+ 100 bps
Static
balances ($1.2B)
Rates shock
- 100 bps
Static
balances $1.2B
Estimated Change in AOCI Derived
Simulated Sensitivity Analysis for
Securities & Swap Portfolios
2Q24: AOCI impact5 of (402 bps) AOCI impact5 of (407 bps) AOCI impact of ($3.5)
Basel III Endgame Capital Considerations
We are not subject to these proposed rules
with ~$80B in assets as of 6/30/24.
If subject to proposed Basel III Endgame
capital requirements relating to AOCI opt-out
changes, our estimated CET1 would exceed
regulatory minimums & conservation buffer
as of 6/30/243.
7.99%
Estimated CET1 with AOCI opt-out
8.08%
Expect unrealized loss to decline 27% by 4Q25
14©2024, Comerica Inc. All rights reserved.
Direct Express
Program update: Preliminary notification of non-selection
•Summary: Comerica Bank is the exclusive issuer of the Direct
Express debit card for approximately 4.5 million federal benefit
recipients as of June 30, 2024.
•Driving Financial Inclusion: Helping the U.S. Department of
the Treasury, Bureau of the Fiscal Service (U.S. Treasury)
provide recipients ready, safe access to their government
benefits was the founding mission of the Direct Express
Program. The prepaid card program is intended to deliver
benefits more cost effectively and securely and to be an on-
ramp to financial inclusion for millions of unbanked Americans,
providing recipients the tools they need to participate fully in the
economy.
•Renewal History: In 2008, 2014 and again in 2020, Comerica
Bank was selected by the U.S. Treasury as the Financial Agent
for their Direct Express Debit MasterCard Program. Comerica
Bank’s contract with the U.S. Treasury expires in early 2025.
•Strong Customer Satisfaction: Since inception of the program,
Comerica has achieved a 90% (or better) cardholder satisfaction
rating.
•Prioritizing Security: Since 2013, the U.S. Treasury has
required all federal benefit recipients (with a few grandfathered
exceptions) to receive their monthly benefits electronically,
either by direct deposit or through the Direct Express debit card.
With 100% of cardholders using EMV chip and PIN, it can be
considered one of the most secure prepaid cards in the industry.
Program Overview Financial Metrics Program Status
•Balances: ~$3.3B in 2Q24 average deposit balances
(large fluctuations throughout the quarter due to timing
cause ending balances to vary).
•Intra-month Patterns: Comerica Bank receives most of
the deposit balances on the 1st and 3rd days of each
month (subject to change based on weekends or
holidays).
•Peaks & Troughs: In June 2024, highest balance was
$4.8B & lowest balance was $2.8B.
•Income Statement:
• $137MM FY23 & $29MM 2Q24 noninterest
income (card fees)
• $138MM FY23 & $29MM 2Q24 direct expenses
primarily in outside processing fees, but also
includes professional fees, operational losses,
staff expenses & other fees
•Re-Bid: We received a preliminary notification that Comerica
Bank has not been selected to continue serving as the
Financial Agent to support the program following contract
expiration.
•Transition Plan: If the preliminary non-selection of Comerica
Bank remains the final disposition, we expect the formal
transition plan for managing accounts & deposits to be
agreed upon once contract negotiations are finalized with the
new provider. We do not currently expect this transition to
impact 2024 deposits, noninterest income or noninterest
expenses.
•Next Steps: We intend to continue to support our customers
through the transition & prioritize efforts to drive deposits.
4.8 Stars1
1Apple App Store as of 7/11/24

Deposit
Initiatives:
Prioritizing targeted efforts to
drive balances aligned with
core relationship strategy
©2024, Comerica Inc. All rights reserved.
Small Business Investment
Treasury Management & Payments
Leveraging Card Capabilities
Enhanced On-Line Deposit Capabilities
Targeted Focus on Deposit-Rich Customers
FY24 vs FY23
Average loans -4% full year average, impacted by 2023 rationalization efforts & muted 1H24 loan demand;
+2% point to point (Dec ‘23 to Dec ’24) driven by broad-based growth in the second half of 2024
Average deposits -3% full year average; project relatively flat average brokered time deposits (FY23 avg to FY24 avg)
-2% point to point (Dec ’23 to Dec ‘24), assumes brokered deposits relatively consistent point to point
Net interest income1-14%, cyclical noninterest-bearing deposit pressures, lower average loans & modest increase in deposit betas
Credit quality Continued credit normalization, expect NCOs to approach the lower end of the 20 to 40 bps range
Noninterest income +1 to +2%, driven by notable items, assumes deferred comp2 & CVA do not repeat after 2Q24;
-1%, adjusting for BSBY & Ameriprise transition
Noninterest expenses -2 to -3%, driven by notable items, assumes deferred comp2 does not repeat & lower pension ($19MM year over year benefit);
+4% adjusting for FDIC special assessment, Ameriprise transition, expense re-calibration & modernization
Tax FY tax rate ~24%, excluding discrete items
Capital Expect to maintain capital well above our CET1 target of 10% through year-end 2024
Management Outlook
Assumes no change in current economic environment
©2024, Comerica Inc. All rights reserved. 16
3Q24 vs. 2Q24
Average loans
+1%, broad-based momentum
Average deposits
+1%, higher brokered time
deposits more than offsetting
NIB pressures
Net interest income1
-2 to –3%, or -1% excluding
BSBY impact; reflects NIB
pressures & modest
increase in deposit betas
Noninterest income3
-3 to -4% driven largely by
lower non-customer income
Noninterest expense4
+3 to +4% on both reported &
adjusted basis; reinvestment
of savings into headcount
6/30/24 Ɣ Outlook as of 7/19/24 & guidance compares to reported 2023 values unless otherwise indicated. Ɣ 1Utilizing 6/30/24 forward curve Ɣ 2Deferred comp FY23 $13MM Ɣ 3Assumes 2Q24 deferred comp of $0.5MM does not repeat
Ɣ 4Assumes 2Q24 deferred comp of $2MM does not repeat

©2024, Comerica Inc. All rights reserved.
Positioned for the Future
Strong foundation & strategy create opportunity for enhanced returns over time
•Proven credit results
9Outperformance through cycles
9Top quartile 1Q24 charge-off performance
amongst peers1 & strong 2Q results
9Metrics below historical averages
•Solid capital position
911.55% CET1, well above target
9Adjusting for AOCI opt out, 2Q24 CET1
exceeded regulatory minimums & buffers
•Abundant liquidity
9Normalized cash position
9Reduced wholesale funding significantly
9Preserved substantial capacity
•Attractive deposit franchise
9Peer leading NIB mix1
9Compelling Treasury Management cross-
sell
Leveraging strong foundation
•Targeted market, MSA focused
strategy
9In 14 of the 15 largest2 & 8 of the 10 fastest
growing markets3
9Investments in TX & the southeast align
with market growth trends
•Diversified business
9Leading bank for business with strong retail
& wealth management capabilities
9Selective business mix with specialized
verticals where we demonstrate
differentiated value proposition
9Enhances opportunity for consistent &
strong returns
•Tenured colleagues
9Experienced colleagues deliver value-add,
industry expertise
9Business leaders average >24 yrs, RMs 11
yrs, GMs 19 yrs4
9Reinforces consistency for our customers &
high level of customer service
Executing on differentiated strategy
•Favorable earnings trajectory
9Structural projected benefit to NII
beginning in 2H24 from maturing swaps &
repayment of securities5
•Select strategic investments
9Focus on noninterest income to drive
capital efficient revenue (Payments,
Capital Markets & Wealth Management)
9Targeted market expansion to enhance
growth
9Granular Small Business deposit strategy
9Continued focus on enhanced risk
framework
•Balance sheet expansion
9Focus on responsible, balanced growth
9Projected broad based 2H increase in
loans & deposits5
Driving responsible growth
Ɣ 1Source for peer data: S&P Global Market Intelligence & company press releases Ɣ 2U.S. Census Bureau; by population 2023. Includes all locations with employees & offices Ɣ 32023 vs 2022 by number of people Ɣ 4As of 7/19/24
Ɣ 5Outlook as of 7/19/24 17
APPENDIX

What Our Customers Say…
“Working with Comerica has consistently been a
fantastic experience for our small business.”
– Small Business Customer
“Comerica has created a lot of flexibility in our
operating model so that we could make decisions
to further our growth.”
– TLS Customer
“Comerica actually put a plan together to help
us…They saw what we wanted to do.”
– Commercial Bank Customer
©2024, Comerica Inc. All rights reserved.
The Right Balance
Positioned to effectively meet the unique needs of our target customers
Experienced & tenured
team delivering
consistency to our
relationships across
markets & businesses
Tailored solutions &
customized product offerings
to meet our customers needs
Localized
advice for our
customers
Industry expertise adding
unique value to customers
across core businesses
& specialized verticals
Comprehensive suite of products
& services including credit capacity,
treasury management, & capital
market solutions
Community engagement
recognizing we all play a role in
advancing the markets &
communities we serve
Large Bank Capabilities
Small Bank Service
19
Commercial Bank
86% 10% 4%
Commercial Bank Wealth Management Retail Bank
49% 6% 39% 6%
Commercial Bank Wealth Management Retail Bank Other
©2024, Comerica Inc. All rights reserved.
Diversified Businesses
Unique & complementary model
Loans1Deposits1
1See Quarterly Average Loans & Quarterly Average Deposits slides for more details, respectively
20
Wealth Management
Deliver a first-class
commercial solution as
a “Leading Bank for
Business” including a
robust digital suite
Grow Middle Market,
Business Banking &
Specialty Businesses
in which we have
expertise
Generate capital-
efficient fee income
Focus on organic &
other strategic growth
opportunities
Deliver a high level of
service to customers
across all touchpoints
Provide important
funding source for the
Corporation in terms of
size, granularity &
deposit diversification
Retail Bank
Cohesive relationship strategy across our divisions unlocks the value of our franchise

Primary Markets Other Markets Office Locations
Diversified Geographic Footprint
Texas
• Established: 1988
• #2 largest state GDP
• Business friendly environment
• Dallas-Fort Worth, Houston, Austin, San Antonio
California
• Established: 1991
• #1 largest state GDP
• Deep industry expertise
• L.A., San Diego, San Jose, San Francisco
Michigan
• Established: 1849
• #14 largest state GDP
• Large retail deposit base
• Detroit, Ann Arbor, Grand Rapids, Lansing
Offices Across U.S.
Southeast
•Strong population growth & manufacturing base
•3 commercial offices in Raleigh, Winston-Salem
& Charlotte
•New offices in SC & GA
•Serving customers in FL, GA, NC, TN, SC & VA
Mountain West
•Fast growing economy, attractive climate
•1 office in Denver
•Serving customers in AZ & CO
International Presence
•Our North America platform enables us to fulfill
the U.S., Mexican & Canadian dollar-based
needs of our customers
21
©2024, Comerica Inc. All rights reserved.
Large, higher growth urban markets Highly integrated, cost-effective platform
Predominance of middle market companies
& wealth management opportunities
36% 26% 14% 24%
MI CA TX Other Markets
3
22% 36% 25% 17%
MI CA TX Other Markets
Loans1Deposits1
1See Quarterly Average Loans & Quarterly Average Deposits slides for more details, respectively
22
©2024, Comerica Inc. All rights reserved.
BSBY Cessation Impacts
Actual Projected1
4Q23 1Q24 2Q24 3Q24 4Q24 FY24 FY25 FY26 FY27 FY28 Total
Net Interest
Income
Impact
$2.8MM $2.7MM ($3.1MM) ($9.0MM) $16.2MM $6.9MM $83.5MM $26.5MM $8.4MM $1.9MM $130.1MM
Gain /
(Loss) in
Other
Noninterest
Income
($91.3MM) ($38.8MM) - - - ($38.8MM) ----($130.1MM)
Pre-Tax
Income
Impact
($88.5MM) ($36.0MM) ($3.1MM) ($9.0MM) $16.2MM ($31.9MM) $83.5MM $26.5MM $8.4MM $1.9MM $0.0MM
•Accounting Impact: Temporary loss of hedge accounting due to pending cessation of BSBY caused the recognition of unrealized losses in 4Q23 &
1Q24 & impacts net interest income. AOCI losses recognized in earnings over 12 months but accreted back to income over original life of swap.
•Financial Impact:
• No economic impact as these losses are re-couped over time; ~90% of impact expected to accrete back by YE2026
• Pre-tax gains or losses related to this accounting treatment impact CET1, but not Tangible Common Equity
• Normal pay / receive cash flows remain uninterrupted
1Projected non-cash net impact of amortization & accretion; included in Outlook unless otherwise indicated in an adjustment.
Majority of losses expected to accrete back in 2025 & 2026

23©2024, Comerica Inc. All rights reserved.
Net Interest Income
Expected Securities Repayments & Maturities2
($ in millions)
564 590
460 490 551
473
1.64% 1.50% 1.32% 1.36% 1.26% 1.32%
3Q24 4Q24 1Q25 2Q25 3Q25 4Q25
Contractual Swap Notionals as of 6/30/241
($ in billions; average; weighted average yield)
Swap & securities attrition expected to create tailwind into 2025
Project 12 bps point to point higher yield & $1.1B
lower notional from 2Q24 to 4Q25; lessens
pressure on NII
Deployment of liquidity from repayment of lower
yielding securities expected to benefit NII, only
partially offset by reinvestment
6/30/24 Ɣ 1Received fix/pay floating swaps; maturities extend through 3Q30; Table assumes no future terminations Ɣ 2Outlook as of 7/19/24
23.5 23.6 23.4 23.3
22.9
22.4
2.51% 2.54% 2.55% 2.55% 2.57% 2.61%
3Q24 4Q24 1Q25 2Q25 3Q25 4Q25
©2024, Comerica Inc. All rights reserved.
Liquidity
Abundant liquidity & funding capacity enhances flexibility
6/30/24 Ɣ 1Securities at the FHLB are incremental to Unencumbered Securities at Market Value Ɣ 2Total Liquidity Capacity amounts may not foot due to rounding
24
• Repaid $3.5B of wholesale funding (average):
• $1.9B in maturing FHLB advances
• $1.6B in brokered time deposits
• Scheduled FHLB Maturities of $1B annually from 2025-2028
Source (6/30/24)
$ in billions
Amount or
Total Capacity
Remaining
Capacity
Cash 3.9 3.9
FHLB (securities1 & loan collateral) 17.2 12.0
Unencumbered Securities at Market Value 8.2 8.2
Discount Window (loan collateral) 17.4 17.4
Total Liquidity Capacity2$41.4 billion
Total Liquidity Capacity
(ex. Discount Window)2
$24.0 billion
Low Unsecured Debt Obligations
(Debt Maturities, $ in millions)
83%
86%
50%
60%
70%
80%
90%
100%
110%
120%
130%
2008
2009
2010
2011
2012
2013
2014
2015
2016
2017
2018
2019
2020
2021
2022
2023
1Q24
2Q24
0
%
Loan to Deposit Ratio Below Historical Average
(period-end)
500 350 400 550
1,000
500
2024 2025 2026 2027 2028 2029 2030 2033

= Total Fixed Rate (55%)
Business Line 2Q24 1Q24 2Q23
Middle Market
General $11.6 $11.5 $12.9
Energy 1.4 1.4 1.5
National Dealer Services 5.7 5.7 5.8
Entertainment 1.1 1.1 1.1
Tech. & Life Sciences 0.7 0.7 0.9
Equity Fund Services 1.7 2.0 3.4
Environmental Services 2.5 2.4 2.4
Total Middle Market $24.7 $24.8 $28.1
Corporate Banking
US Banking 4.0 4.1 4.5
International 1.5 1.5 1.7
Commercial Real Estate 10.3 10.2 8.9
Mortgage Banker Finance -- 0.1 1.5
Business Banking 3.2 3.1 3.1
Commercial Bank $43.7 $43.9 $47.9
Retail Bank $2.3 $2.3 $2.2
Wealth Management $5.0 $5.2 $5.3
TOTAL $51.1 $51.4 $55.4
Quarterly Average Loans
$ in billions Ɣ Totals shown above may not foot due to rounding. Certain prior quarter amounts have been reclassified to conform to the current quarter presentation. Ɣ 1Other Markets includes FL, AZ, International Finance Division & businesses that have
a significant presence outside of the three primary geographic markets Ɣ 2Fixed rate loans include $23.4B receive fixed/pay floating (30-day) SOFR, BSBY & Prime interest rate swaps; Forward dated hedges are excluded Ɣ 3Includes ~3.4% of Daily SOFR
By Market 2Q24 1Q24 2Q23
Michigan $11.5 $11.7 $12.6
California 18.2 18.4 18.8
Texas 12.8 12.6 12.3
Other Markets18.6 8.8 11.8
TOTAL $51.1 $51.4 $55.4
©2024, Comerica Inc. All rights reserved. 25
(55%)
Fixed Rate
10%
Synthetically
fixed from
swaps
45%
-Day Rate
36%
90-Day+ Rate
6%
Prime-based
3%
2
Loan Portfolio
(2Q24 Period-end)
3
$51.9B
Quarterly Average Deposits
$ in billions Ɣ Totals shown above may not foot due to rounding. Certain prior quarter amounts have been reclassified to conform to the current quarter presentation. Ɣ 1Finance/Other includes items not directly associated with the geographic markets or
the three major business segments Ɣ 2Other Markets includes FL, AZ, International Finance Division & businesses that have a significant presence outside of the three primary geographic markets
Business Line 2Q24 1Q24 2Q23
Middle Market
General $16.7 $17.4 $16.1
Energy 0.3 0.3 0.5
National Dealer Services 0.9 0.9 1.0
Entertainment 0.4 0.4 0.3
Tech. & Life Sciences 2.9 3.1 3.4
Equity Fund Services 0.8 0.8 1.0
Environmental Services 0.3 0.4 0.3
Total Middle Market $22.3 $23.2 $22.6
Corporate Banking
US Banking 2.0 2.1 1.4
International 1.9 2.0 1.8
Commercial Real Estate 1.5 1.4 1.4
Mortgage Banker Finance -- 0.1 0.4
Business Banking 3.5 3.5 3.4
Commercial Bank $30.9 $32.0 $30.8
Retail Bank $24.6 $24.4 $24.0
Wealth Management $4.0 $3.9 $3.9
Finance / Other1$3.3 $4.8 $5.4
TOTAL $63.1 $65.3 $64.3
By Market 2Q24 1Q24 2Q23
Michigan $22.5 $23.2 $21.9
California 16.4 16.3 16.0
Texas 9.2 9.4 9.4
Other Markets211.6 11.6 11.6
Finance / Other13.3 4.8 5.4
TOTAL $63.1 $65.3 $64.3
©2024, Comerica Inc. All rights reserved. 26
Commercial
Noninterest-
bearing
28%
Commercial
Interest-
bearing
31%
Retail
Interest-
bearing
29%
Retail
Noninterest-
bearing
12%
Strong Deposit Mix: 40% Noninterest-bearing
(2Q24 Average)
Total
$63.1B

2Q24 compared to 1Q24 Ɣ 1Represents uninsured deposits using total deposits at the consolidated level for Comerica Inc. & subsidiaries, which is consistent with the presentation on the consolidated balance sheet, & excludes uninsured deposits
eliminated in consolidation Ɣ 26/30/24 is estimated Ɣ 3As of 6/30/24 Ɣ 4Includes consumer & small business
©2024, Comerica Inc. All rights reserved.
Attractive Deposit Profile
Targeted focus on relationship deposits
Better Risk Characteristics Compared to 2022
• Less concentrated in more vulnerable businesses
• Lower price sensitivity
• Lower percent of uninsured & excess deposits
• Retained strong mix of 40% average noninterest-bearing
Stronger Profile than Pre-Pandemic
($ in billions) YE 2019 YE 2022 6/30/2024
Loan-to-Deposit Ratio 88% 75% 83%
Total Deposits
(Period-end) $57.3 $71.4 $62.5
% Uninsured Deposits
Per Call Report
Adjusted for Affiliate Deposits1
60%
54%
64%
57%
47%2
41%2
Stable & Tenured Core Deposit Base3
Diversified Across
Markets & Businesses
• Highest concentrations in Retail Consumer (30%), Middle
Market Lending (13%) & Small Business Banking (9%),
inherently diversified business lines
• Geographically dispersed
Holistic, Connected
Relationships
• ~91% of Commercial Bank noninterest-bearing deposits utilize
Treasury Management services; ~91% have ECA
• Average Middle Market relationship has >7 Treasury
Management products
• ~89% Retail customers have checking account4
Tenured • Average Middle Market relationship >15 years
• Average Retail relationship ~16 years4
Active Operating
Accounts
• Average Middle Market relationship deposit balances of
~$4MM (includes ~$2MM in noninterest-bearing)
• Average Retail customer checking account balance of ~$28K4
t1Q24
1
R t i d d it i t t l d it t th lid
d
t
Commercial
Bank
49%
Retail Bank
39%
Wealth
Management
6%
Other 6%
Diversified Deposit Base
(2Q24 average)
27
Shared National Credit (SNC) Relationships
Credit quality of our SNC relationships better than portfolio average
• SNC loans increased $346MM compared to
1Q24
• SNC relationships included in business line
balances; we do not have a dedicated SNC line
of business
• Approximately 700 borrowers
• Comerica is agent for 29% of loans
• Strategy: Pursue full relationships with ancillary
business
• Adhere to same credit underwriting standards as
rest of loan book
• Only ~3% of SNCs were criticized
• ~14% of SNCs were leveraged
Period-end Loans
($ in billions)
Commercial
Real Estate
$1.0
9%
Corporate
Banking
$2.7
23%
Equity Fund
Services
$0.7
6%
Tech. & Life Sciences
$0.2
1%
General Middle
Market
$2.7
23%
National Dealer
Services
$1.3
11%
Energy
$1.3
11%
Entertainment
$0.7
6%
Environmental
Services
$1.2
10%
= Total Middle Market (68%)
Total
$11.9B
28©2024, Comerica Inc. All rights reserved.
6/30/24 Ɣ SNCs are facilities greater than $100 million shared by three or more federally supervised financial institutions which are reviewed by regulatory authorities at the agent bank level

Year-over-Year growth of our Refer-a-
Friend program, supporting customer
and deposit growth
205%2
Investing for Growth with 3 Key Initiatives
Elevating Small Business
Strategic investment in sales coverage, marketing &
essential technology to enable growth.
Enabling Performance
Reimagined roles, expectations and behaviors drive
consistency in customer engagement & experience.
Modernizing for Growth
Harness digital investments to transform experience,
drive growth & expand into new markets.
107 6$1.4B1
Dollars in Small Business
Lending commitments in
communities across the
Comerica footprint
Small Business Bankers,
serving communities within
the Comerica Bank footprint
6x2
Year-over-Year increase of
customer Financial Wellness
$VVHVVPHQWV
©2024, Comerica Inc. All rights reserved. 29
The Retail Bank: More than a Leading Bank for Business
Banking Personal & Small Business customers in growth markets across the US
6/30/24 Ɣ 12023 Annual Community Support Ɣ 212/31/23 compared to 12/31/22
Aspirational Target for Small Business:
Top 10 market share in all major markets; currently 3rd in Michigan
Aspirational Target for Personal Banking:
)LQDQFLDO:HOOQHVVIRUHYHU\FXVWRPHUGULYLQJSULPDF\
Scored Loans & LOCs, 2
Maximize Treasury Bundles,
Zelle, Comerica SizeUp Small
Businesses
People New Products Community Support
39%
%DQN¶V7RWDO'HSRVLWV
at 6/30/24
6PDOO%XVLQHVV&XVWRPHUV
~$28K
Avg. Customer Deposits
82%
Personal Customers
~380 Banking Centers
28 Districts
5 Regions
Alternative Channels:
•Contact Center
•ATM / ITM
•Online & Mobile
©2024, Comerica Inc. All rights reserved.
Wealth Management
Leading the way to your business and personal success
Performance
43%:
:
Comerica Advisor Solutions YOY
43%:
:
omerica
Adv
Co
sales growth 1/1/2024
v
iso
r
vi
4
4
–
so
r
s
–
–
Solutions
Y
sor
so
–
–
6/30/2024
41%:
:
YOY sales
es
s
growth in Private Wealth
41%:
:
OY
sa
le
YO
es
s
rowth in Priva
t
r
g
Investment Management & Trust
st
st
1
11%:
:
YOY revenue growth in Private
11%:
:
OY revenue growth
YO
Wealth Specialty Fiduciary
y
y
1
7%:
%
:
YOY balance growth in average
7%
%
:
O
O
Y
Loans
s
s
1
Comerica Financial Advisors
$14B:
:
Successfully converted assets to
$14B:
:
uccessfully
converted
assets
to
Su
the Ameriprise platform offering our clients
the Ameri
pri
se
pla
tform offeri
ng
our clients
the
Ameripr
premium technology, products, services,
premium
technology
,
products
,
services
,
financial planning, & research capabilities as
financial
pl
ann
ing
, &
research
ca
pab
ilitie
s
of November 2023 (date of conversion)
$27B:
:
Comerica
a
Financial Advisors
rs
s
assets
$2
7B:
:
omeri
ca
Co
a
as of June 2024
90%:
:
Advisor retention rate leading up to
90%:
:
Advisor
retentio
& through conversion
$5MM:
:
Since initiating our new recruiting
$5MM:
:
Since
initiating
our
new
recruiti
model at the end of Q1 2024, we have
model
at
the
end
of
Q1
2024
,
we
have
signed offers & onboarded advisors with
signed
offers
&
onboarded
advisors
with
>$5MM in trailing annual revenue. Our
>$5MM
in
trailing
annual
revenue
.
Our
pipelines are at a historical high point.
Expansion
124:
4:
:
New Relationships added to Private
12
4
4:
:
ew
Re
lat
Ne
N
Wealth in 2024
W
•
n
2024
Wea
n
alth
i
We
Average client balances: $
$
3.6
6
MM
•
Average client balances:
Average client revenue: $
:
$
3
$
$
$
31
M
3.
.6
.
M
3
1
1
31
31
K
$3B:
:
Successfully recruited a Wealth team
$3
B:
:
uccessfully
recruited
a
Wealth
tea
Su
with $3B in total relationship balances in
with $3B in
with
$3B
i
Q3’2023
40%:
:
Penetration rate into our Middle
40
%:
:
enetration
rate
into
our
Middle
Pe
Market channel, broadening our reach &
Market channel, broadening our reach &
Mar
ket
ch
a
overall Bank client wallet share; up 6%
overal
l
YOY
l
ral
l
Y
Y
1
YO
Let us Raise Your Expectations of Wealth Management
Get started with concierge-style services & first-class privileges you deserve
1 Full year 2023 versus full year 2022 30

Total CMA Office Exposure
•Not primary strategy: Total CMA office loans of $746MM, or <1.5% of total loans;
outstandings within CRE LOB of $452MM, or <1% of total CMA loans
•Selective geography: Urban in-fill & suburban strategy
•Majority recourse: Strong sponsors critical to underwriting
•Monitoring credit: Criticized loans totaling ~$132MM (or ~18% of total office portfolio)
Multifamily
48%
Industrial / Storage
34% Retail
5%
Office
5% Single
Family
1%
Other
3%
Land Carry
2%
Multi use
2%
Commercial Real Estate Business Line
Growth driven by multifamily & industrial projects; excellent credit quality
6/30/24 Ɣ 1Excludes CRE business line loans not secured by real estate Ɣ 2Criticized loans are consistent with regulatory defined Special Mention, Substandard, & Doubtful categories
Primarily Lower Risk Multifamily & Industrial1
(2Q24 period-end)
Total
$9.7B
Strong Credit Profile Driven by:
• Long history of working with well-established, proven developers; >90% of new commitments from
existing customers
• Experienced relationship team; average tenure:
• CRE line of business leadership: ~27 years
• Relationship managers: ~19 years
• CRE credit approval team: ~25 years
• Significant up-front equity required (typically averaging 35-40%, often from institutional investors)
• ~70% has recourse
• Majority of commitments are construction
• Primary strategy is financing development of Class A, urban infill multi-family & warehouse
distribution in major sun belt metros (32% CA, 27% TX, 12% Southeast, 11% Southwest)
• Modest credit migration driven by elevated rate environment, but remained very manageable
• >50% of the portfolio maturing by the end of 2025
•4
th consecutive quarter of lower commitments
©2024, Comerica Inc. All rights reserved. 31
Excellent Credit Quality in Commercial Real Estate Business
No significant net charge-offs since 2014
($ in millions)
2Q23 3Q23 4Q23 1Q24 2Q24
NAL 0.9 0.0 18 18 18
Criticized2246 458 481 443 448
% Criticized 2.7% 4.8% 4.8% 4.3% 4.3%
NCO (Recoveries) (0.13) (0.70) (0.38) (0.01) (0.26)
32©2024, Comerica Inc. All rights reserved.
Total Office Portfolio
Not a primary strategy
Geographic Diversification
By State
$ millions 6/30/24
California $301.1
Texas 22 8 .4
Michigan 61.4
Washington 39.7
Arizona 34.4
Nevada 11.9
Georgia 4.7
Illinois 4.4
Florida 1.5
Subtotal 687.5
Other158.7
Total Loans $746.2
Key Office Portfolio Metrics
$ millions 6/30/24 3/31/24
Total Loans $746.2 $821.7
Avg Loan Outstanding $5.0 $5.7
Net Charge Offs 0.5% 0%
Delinquencies22% 0%
Non-Performing Loans 3% 3%
Criticized Loans 18% 19%
6/30/24 Ɣ 1Other includes 3 loans to funds secured by multiple properties Ɣ 2Loans 30 days or more past due

33©2024, Comerica Inc. All rights reserved.
Multi-family Portfolio
Geographic Diversification
By State
$ millions 6/30/24
California $1,649.2
Texas 1, 3 97. 5
Florida 372.6
Arizona 240.7
Washington 226.8
North Carolina 194.8
Michigan 148.9
Oregon 147.8
Colorado 146.4
Subtotal 4,524.7
Other1456.6
Total Loans $4,981.3
Key Multi-family Portfolio Metrics
$ millions 6/30/24 3/31/24
Total Loans $4,981.3 $4,834.2
Avg Loan Outstanding $16.7 $16.2
Net Charge Offs 0% 0%
Delinquencies20% 0%
Non-Performing Loans 0% 0%
Criticized Loans 5% 4%
6/30/24 Ɣ 1Other includes various other states Ɣ 2Loans 30 days or more past due
46%
28%
10%
7% 9%
California
LA County
Bay Area
Orange County
Sacramento
County
Other
44%
32%
15%
9%
Texas
DFW
Austin
Houston
San Antonio
Energy
Primarily E&P exposure
6/30/24 Ɣ 1Includes Services of 2Q23 $21MM; 3Q23 $27MM; 4Q23 $11MM; 1Q24 $10MM; 2Q24 $8MM
Period-end Loans
($ in millions)
1,168 1,127 1,070 1,048 1,109
312 310 312 310 300
1,480 1,437 1,382 1,358 1,409
2Q23 3Q23 4Q23 1Q24 2Q24
Midstream Exploration & Production1
©2024, Comerica Inc. All rights reserved. 34
• Exposure $3.4B / 40% utilization
• Hedged 50% or more of production
• At least one year: 72% of customers
• At least two years: 44% of customers
• Focus on larger, sophisticated E&P and Midstream companies
• E&P:
• 58% Oil-focused
• 23% Natural Gas focused
• 19% Oil/Gas balanced
• Excellent credit quality
• <1% Criticized loans
• $(9.4MM) Net recoveries

Toyota/Lexus
12%
Honda/Acura
11%
Ford
6% GM
7%Jaguar/Land Rover
6%
Stellantis
9%
Mercedes
7%
Nissan/ Infiniti
3%
Other European
13%
Other Asian
8%
Other
18%
National Dealer Services
75+ years of floor plan lending
6/30/24 Ɣ 1Other includes obligations where a primary franchise is indeterminable (rental car and leasing companies, heavy truck, recreational vehicles, and non-floor plan loans)
Franchise Distribution
(Based on period-end loan outstandings)
• Top tier strategy
• National in scope
• Focus on “Mega Dealer” (five or more dealerships in group)
• Strong credit quality; Robust monitoring of company inventory &
performance
• Floor Plan remained below historical averages
2.8 1.9 2.2 2.0 1.2 0.6 0.6 0.6 0.8 1.0 1.2 1.4 1.7 1.7 2.1 2.0 2.2
6.2
5.3 5.5 5.3
4.4 3.8 3.9 4.1 4.5 4.8 5.1 5.4 5.8 5.8 6.0 5.7 5.7
2Q20
3Q20
4Q20
1Q21
2Q21
3Q21
4Q21
1Q22
2Q22
3Q22
4Q22
1Q23
2Q23
3Q23
4Q23
1Q24
2Q24
Floor Plan
Average Loans
($ in billions)
Total
$6.1B
1
©2024, Comerica Inc. All rights reserved. 35
3,408 3,281 3,312 3,070 2,933
0
500
1,000
1,500
2,000
2,500
3,000
3,500
4,000
2Q23 3Q23 4Q23 1Q24 2Q24
909 832 791 713 724
2
Q
23 3
Q
23 4
Q
23 1
Q
24 2
Q
24
Technology & Life Sciences
~30 years of deep expertise & strong relationships with top-tier investors
6/30/24
Average Loans
($ in millions)
• Manage concentration to numerous verticals to ensure widely
diversified portfolio
• Closely monitor cash balances & maintain robust backroom
operation
•10 offices throughout US & Canada
Strong Loan to Deposit Ratio Relative to
Other Business Lines
($ in millions)
Growth
58%
Early Stage
13%
Late Stage
29%
Customer Segment Overview
(approximate; 2Q24 period-end loans)
Total
$747MM
©2024, Comerica Inc. All rights reserved. 36

Equity Fund Services
Strong relationships with top-tier Private Equity firms
6/30/24
• Customized solutions for Private Equity & Venture Capital firms
• Credit Facilities (Funds, General Partners, Management
Companies)
• Treasury Management
• Capital Markets, including Syndication
• Customers in the US & Canada
• Well-diversified across funds with various industry strategies
• Drives connectivity with other teams
• Middle Market
• Commercial Real Estate
• Environmental Services
•Energy
•TLS
• Private Banking
• Strong credit profile
• No charge-offs
• No criticized loans
Average Balances
©2024, Comerica Inc. All rights reserved. 37
3,378
2,815
2,453
1,981
1,690 1,631
1,997
2Q23 3Q23 4Q23 1Q24 2Q24 1Q24 2Q24
Period-end Balances
Loans
($ in millions)
Environmental Services Department
Experienced team; specialized industry, committed to growth
6/30/24
• 15+ year experienced team with 20+ year management tenure
• Dedicated relationship managers advise & guide customers on
profitably growing their business by providing banking solutions
• Focus on middle market-sized companies with full banking
relationships
• Historically strong credit quality
Waste Management & Recycling (~75% of loan portfolio)
• Insight & expertise with:
• Transfer stations, disposal & recycling facilities
• Commercial & residential waste collection
• Financing for M&A and growth capital
Renewable Energy Solutions (~25% of loan portfolio)
• Formed group in 2022; active in the landfill-gas-to-energy &
biomass industries for more than a decade
• Expanded focus to also include solar, wind, anaerobic
digestion, & battery energy standalone storage
2,418 2,383 2,365 2,376 2,452
2Q23 3Q23 4Q23 1Q24 2Q24
Average Loans
($ in millions)
©2024, Comerica Inc. All rights reserved. 38

©2024, Comerica Inc. All rights reserved.
Comerica’s Core Values
Trust OwnAct
To raise expectations of what a bank can be for our colleagues, customers & communities
39
40©2024, Comerica Inc. All rights reserved.
Descriptions of Notable Items
Subject Description
Impact of BSBY cessation announcement
• On November 15, 2023, Bloomberg Index Services Limited (“BISL”) officially announced the
future permanent cessation of Bloomberg Short-Term Bank Yield Index (“BSBY”) on November
15, 2024.
• This announcement resulted in a temporary loss of hedge accounting for a portion of cash flow
hedges, driving recognition of unrealized losses related to applicable swaps previously in AOCI
in 4Q23 & 1Q24 & an impact to net interest income expected quarterly from 4Q23 through
2028.
FDIC special assessment • CMA recorded expense related to the FDIC’s Deposit Insurance Fund (DIF) special
assessment in 4Q23, 1Q24 & 2Q24.
Modernization & expense recalibration initiatives
• Actions taken to transform the retail banking delivery model, align corporate facilities, optimize
technology platforms, enhance earnings power & create capacity for strategic & risk
management investments resulted in severance charges.

41©2024, Comerica Inc. All rights reserved.
Details for Outlook
Financial Metric Full Year 2023 + / - Adjustments Identified on Outlook Slide
Noninterest Income • +$91MM BSBY cessation loss
• -$23MM full-year salaries & commissions for Ameriprise partnership prior to presentation impact
Noninterest Expense
• -$109MM special one-time FDIC assessment
• -$25MM expense recalibration initiative related charges
• -$23MM full-year salaries & commissions for Ameriprise partnership prior to presentation impact
Financial Metric Second Quarter 2024 + / - Adjustments Identified on Outlook Slide
Noninterest Expense • -$3MM special FDIC assessment
• -$2MM expense recalibration & modernization initiative related charges
Net Interest Income • $3MM BSBY accretion
Reconciliations
©2024, Comerica Inc. All rights reserved. 42
(period-end, millions, except per share data) 2Q24 1Q24 4Q23 3Q23 2Q23
Tangible Common Equity
Total shareholders’ equity $6,161 $6,050 $6,406 $4,972 $5,595
Less fixed-rate non-cumulative perpetual preferred stock $394 $394 $394 $394 $394
Common shareholders’ equity $5,767 $5,656 $6,012 $4,578 $5,201
Less goodwill $635 $635 $635 $635 $635
Less other intangible assets $7 $8 $8 $8 $8
Tangible common equity $5,125 $5,013 $5,369 $3,935 $4,558
Total assets $79,597 $79,444 $85,834 $85,706 $90,761
Less goodwill $635 $635 $635 $635 $635
Less other intangible assets $7 $8 $8 $8 $8
Tangible assets $78,955 $78,801 $85,191 $85,063 $90,118
Common equity ratio 7.24% 7.12% 7.00% 5.34% 5.73%
Tangible common equity ratio 6.49% 6.36% 6.30% 4.62% 5.06%
Tangible Common Equity
Tangible common equity is used by Comerica to measure the quality of capital and the return relative to balance sheet risk. The tangible common equity ratio removes
the effect of intangible assets from capital and total assets.
Comerica believes non-GAAP measures are meaningful because they reflect adjustments commonly made by management, investors, regulators and analysts to evaluate the adequacy of common equity and our performance trends.

©2024, Comerica Inc. All rights reserved.
Uninsured Deposits
Comerica believes that the presentation of uninsured deposits adjusted for the impact of affiliate deposits provides enhanced clarity of uninsured deposits at risk. Total
uninsured deposits as calculated per regulatory guidance and reported on schedule RC-O of Comerica Bank’s Call Report include affiliate deposits, which by definition
have a different risk profile than other uninsured deposits. The amounts presented below remove affiliate deposits from the total uninsured deposits number.
Reconciliations Continued
Comerica believes non-GAAP measures are meaningful because they reflect adjustments commonly made by management, investors, regulators and analysts to evaluate the adequacy of common equity and our performance trends. Ɣ 1Diluted earnings
per common share
(period-end; millions) 2Q24 1Q24 4Q23 2Q23
(A) Total uninsured deposits, as calculated per regulatory guidelines $29,509 $30,481 $31,485 $31,627
(B) Affiliate deposits $3,882 $3,966 $4,064 $4,412
(A-B) Total uninsured deposits, excluding affiliate $25,627 $26,515 $27,421 $27,215
43
Adjusted Earnings Per Share1
Comerica believes that the presentation of adjusted earnings per share provides a greater understanding of ongoing operations and financial results by removing the
impact of notable items. Notable items are meaningful because they provide greater detail of how certain events or initiatives affect Comerica’s results for a more
informed understanding of those results.
(per share) 2Q24 1Q24 2Q23
Earnings per common share 1.49 0.98 2.01
Net BSBY cessation hedging losses 0.01 0.21 --
FDIC special assessment 0.02 0.09 --
Modernization & expense recalibration initiatives 0.01 0.01 0.04
Adjusted earnings per common share 1.53 1.29 2.05
Holding Company Debt Rating
As of 7/11/24 Ɣ Source: S&P Global Market Intelligence; Debt Ratings are not a recommendation to buy, sell, or hold securities
Senior Unsecured/Long-Term Issuer Rating Moody’s S&P Fitch
Cullen Frost A3 A- -
M&T Bank Baa1 BBB+ A
BOK Financial Baa1 BBB+ A
Fifth Third Baa1 BBB+ A-
Huntington Baa1 BBB+ A-
Regions Financial Baa1 BBB+ A-
Citizens Financial Group Baa1 BBB+ BBB+
Comerica Baa1 BBB A-
KeyCorp Baa2 BBB BBB+
Webster Financial Baa2 BBB -
First Horizon National Corp Baa3 - BBB
Western Alliance Ba1 - BBB-
Synovus Financial - BBB- BBB
©2024, Comerica Inc. All rights reserved. 44

Bank Debt Rating
As of 7/11/24 Ɣ Source: S&P Global Market Intelligence; Debt Ratings are not a recommendation to buy, sell, or hold securities
Senior Unsecured/Long-Term Issuer Rating Moody’s S&P Fitch
Cullen Frost A3 A -
Fifth Third A3 A- A-
Huntington A3 A- A-
M&T Bank Baa1 A- A
BOK Financial Baa1 A- A
Regions Financial Baa1 A- A-
Citizens Financial Group Baa1 A- BBB+
Comerica Baa1 BBB+ A-
KeyCorp Baa1 BBB+ BBB+
Webster Bank Baa2 BBB+ -
Western Alliance Baa2 - BBB-
Zions Bancorporation Baa2 BBB+ BBB+
First Horizon National Corp Baa3 - BBB
Synovus Financial Baa3 BBB BBB
©2024, Comerica Inc. All rights reserved. 45
Thank You
T
h
k
Y
©2024, Comerica Inc. All rights reserved.