COMPARING THE COST OF OWNING THE MOST POPULAR VEHICLES IN THE UNITED STATES: 2025 UPDATE PDF Free Download
1 / 13/13
100%

Atlas Public Policy has shown in analyses for vehicles sold in 2022 and 2023, the most popular gas-
oline models often cost more to own than a comparable electric vehicle (EV) over a typical seven-
year ownership period. Since then, the market has strengthened for EVs with sales topping 1.4 mil-
lion in 2024, while the number of light-duty EV models nearly doubled in ve years. As the technol-
ogy has improved, battery costs have fallen resulting in longer driving ranges at lower cost, and new
federal tax-credit rules shuled which models qualify for clean vehicle incentives.
Using our same methodology, we compare the best-selling gasoline vehicles of 2024 with their
closest electric counterparts. We calculated all expenses incurred by a household to own the vehi-
cle, including purchase price (minus any federal or manufacturer incentives), resale value after
seven years, fuel or electricity costs, maintenance and repairs, insurance, as well as taxes and
fees.
1
Our ndings show that in all but one case, EVs today deliver savings to owners compared to a
similar gasoline vehicle over a seven-year period—a common length of time a driver keeps a
newly purchased vehicle. The savings can be signicant, from more than $2,000 for a compact
sedan to more than $8,000 for a mid-size SUV.
Transportation is generally the second largest expenditure for Americans after housing, and over 90
percent of American households have at least one car. In this fact sheet, we show that many EVs
available now are more aordable to drive than the most popular gasoline vehicles of today.
1
Each conventional vehicle selected was the most popular new vehicle of its type registered in the United States in 2024,
according to Experian. This was based on vehicle make, model, series, and trim as defined by Experian. Comparable
electric vehicles were chosen based on similar features, size, and utility.
This fact sheet was supported by the Natural Resources Defense Council. The
conclusions contained herein are Atlas’s alone.
COMPARING THE COST OF OWNING
THE MOST POPULAR VEHICLES IN
THE UNITED STATES: 2025 UPDATE
Comparison between ve of the most popular gasoline powered
models in the country and an electric vehicle equivalent for purchase
By Dan Wilkins & Nick Nigro
June 2025

Comparing the Total Cost of Ownership of the Most Popular Vehicles in the United States
2
The economic benets of new EVs for households is expected to grow over time as technology
costs continue to decline, more models become available, and the used EV market continues to
grow. The repeal of the tax credit would raise the upfront cost of EVs in the near-term. Even if the tax
credit is repealed, however, the Equinox EV and Model Y still cost less to own than their gasoline
counterparts.
Table 1: Vehicle Comparison Results
Vehicle
Type
Internal Combustion Engine
Electric Vehicle
Net
Savings
with an EV
Vehicle
(Upfront Price)
7-Year
TCO
Vehicle
(Upfront Price)
7-Year
TCO
Compact
Sedan
2025 Toyota Corolla
($22,235)
$43,031
2025 Nissan Leaf
FWD
($28,140)
$40,933
$2,098
Sedan
2025 Toyota
Camry LE
($28,700)
$45,214
2025 Hyundai Ioniq
6 RWD
($37,850)
$41,874
$3,340
Compact
SUV
2025 Chevrolet
Equinox FWD
($28,600)
$48,086
2025 Chevrolet
Equinox EV FWD
($33,600)
$38,603
$9,483
Mid-Size
SUV
2025 Jeep Grand
Cherokee Limited 4x2
($42,905)
$54,780
2024 Tesla Model Y
Long Range RWD*
($44,990)
$46,636
$8,144
Pickup
Truck
2025 Ford F-150 XLT
($56,215)
$59,342
2024 Ford F-150
Lightning*
($62,995)
$61,800
-$2,458
Vehicles are model year 2025, except those with an asterisk (*), which are model year 2024. A $7,500 federal
tax credit was applied to the Equinox EV, Model Y, and F-150 Lightning; the Nissan Leaf was eligible for a
$3,750 tax credit. The 2025 Hyundai Ioniq 6 was ineligible for a federal tax credit at the time of the analysis,
but the manufacturer offered a point-of-sale incentive of $7,500.

Comparing the Total Cost of Ownership of the Most Popular Vehicles in the United States
3
The subsequent pages of this fact sheet show, for each vehicle comparison, the breakdown of the
total cost of ownership by category, including:
• Taxes and Fees: Estimated for recurring taxes and fees for owning a vehicle. We do not as-
sume these are different between a conventional vehicle and an EV.
• Insurance: Estimated cost to insure a vehicle. We apply AAA’s 2024 Your Driving Costs av-
erages based on vehicle type and whether it is a conventional vehicle or an EV.
• Fuel: Cost to fuel a gasoline vehicle or to recharge an EV. EVs are assumed to charge at
home much of the time and in public occasionally.
• Maintenance & Repairs: Average cost per mile for standard maintenance and repairs.
Costs are expected to be lower for an EV compared to a gasoline vehicle though they are
expected to increase after the fifth year of ownership for both vehicles.
• Vehicle Price minus Resale Value (less tax credits and incentives): Amount the owner
would effectively pay to use the vehicle for a seven-year period if they sold it at the end of
that period. This is calculated by subtracting the expected resale value of the vehicle and
any purchase tax credits from the original sticker price.
See Assumptions for quantitative inputs and explanations of these categories.

Comparing the Total Cost of Ownership of the Most Popular Vehicles in the United States
4
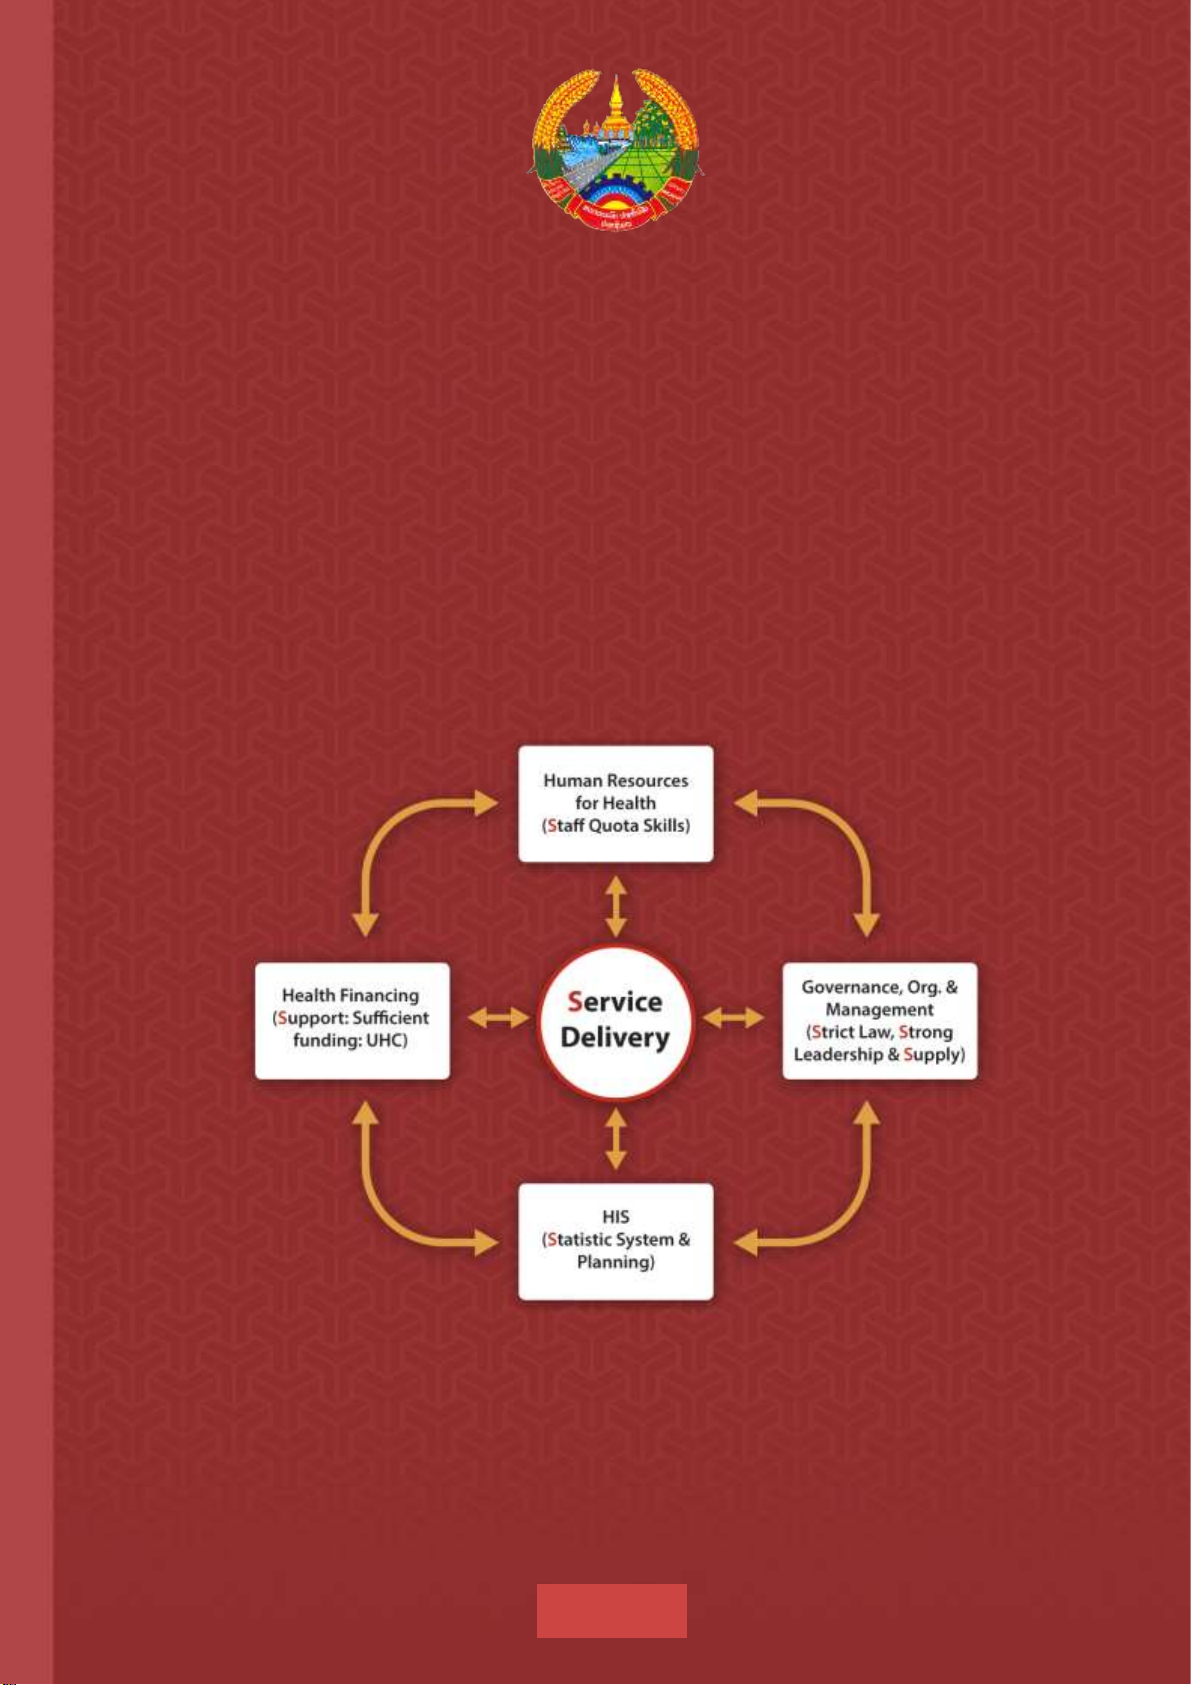
Compact Sedan: The EV is slightly cheaper.
Owning the Leaf costs nearly ve percent less than the very popular Toyota
Corolla LE over seven years on a TCO basis. The Leaf has 43 percent or more
savings on fuel and 39 percent savings on maintenance. That works out to
around $300 in savings each year for the Leaf compared to the Corolla.
Nissan Leaf Toyota Corolla LE
Taxes + Fees
Insurance
Fuel
Maintenance &
Repairs
Vehicle Price minus
Resale Value (less
tax credits and
incentives)
Upfront Price: $28,140
TCO: $40,933
Upfront Price: $22,235
TCO: $43,031

Comparing the Total Cost of Ownership of the Most Popular Vehicles in the United States
5
Sedan: The EV is slightly cheaper.
Owning the Ioniq 6 costs nearly eight percent less than the Toyota Camry over seven
years on a TCO basis. The Ioniq 6 has 56 percent lower cost for fuel and 39 percent
lower cost for maintenance. That works out to around $480 in savings each year for
the Ioniq 6 compared to the Camry.
Hyundai Ioniq 6 Toyota Camry Hybrid LE
Taxes + Fees
Insurance
Fuel
Maintenance &
Repairs
Vehicle Price minus
Resale Value (less
tax credits and
incentives)
Upfront Price: $37,850
TCO: $41,874
Upfront Price: $28,700
TCO: $45,214

Comparing the Total Cost of Ownership of the Most Popular Vehicles in the United States
6
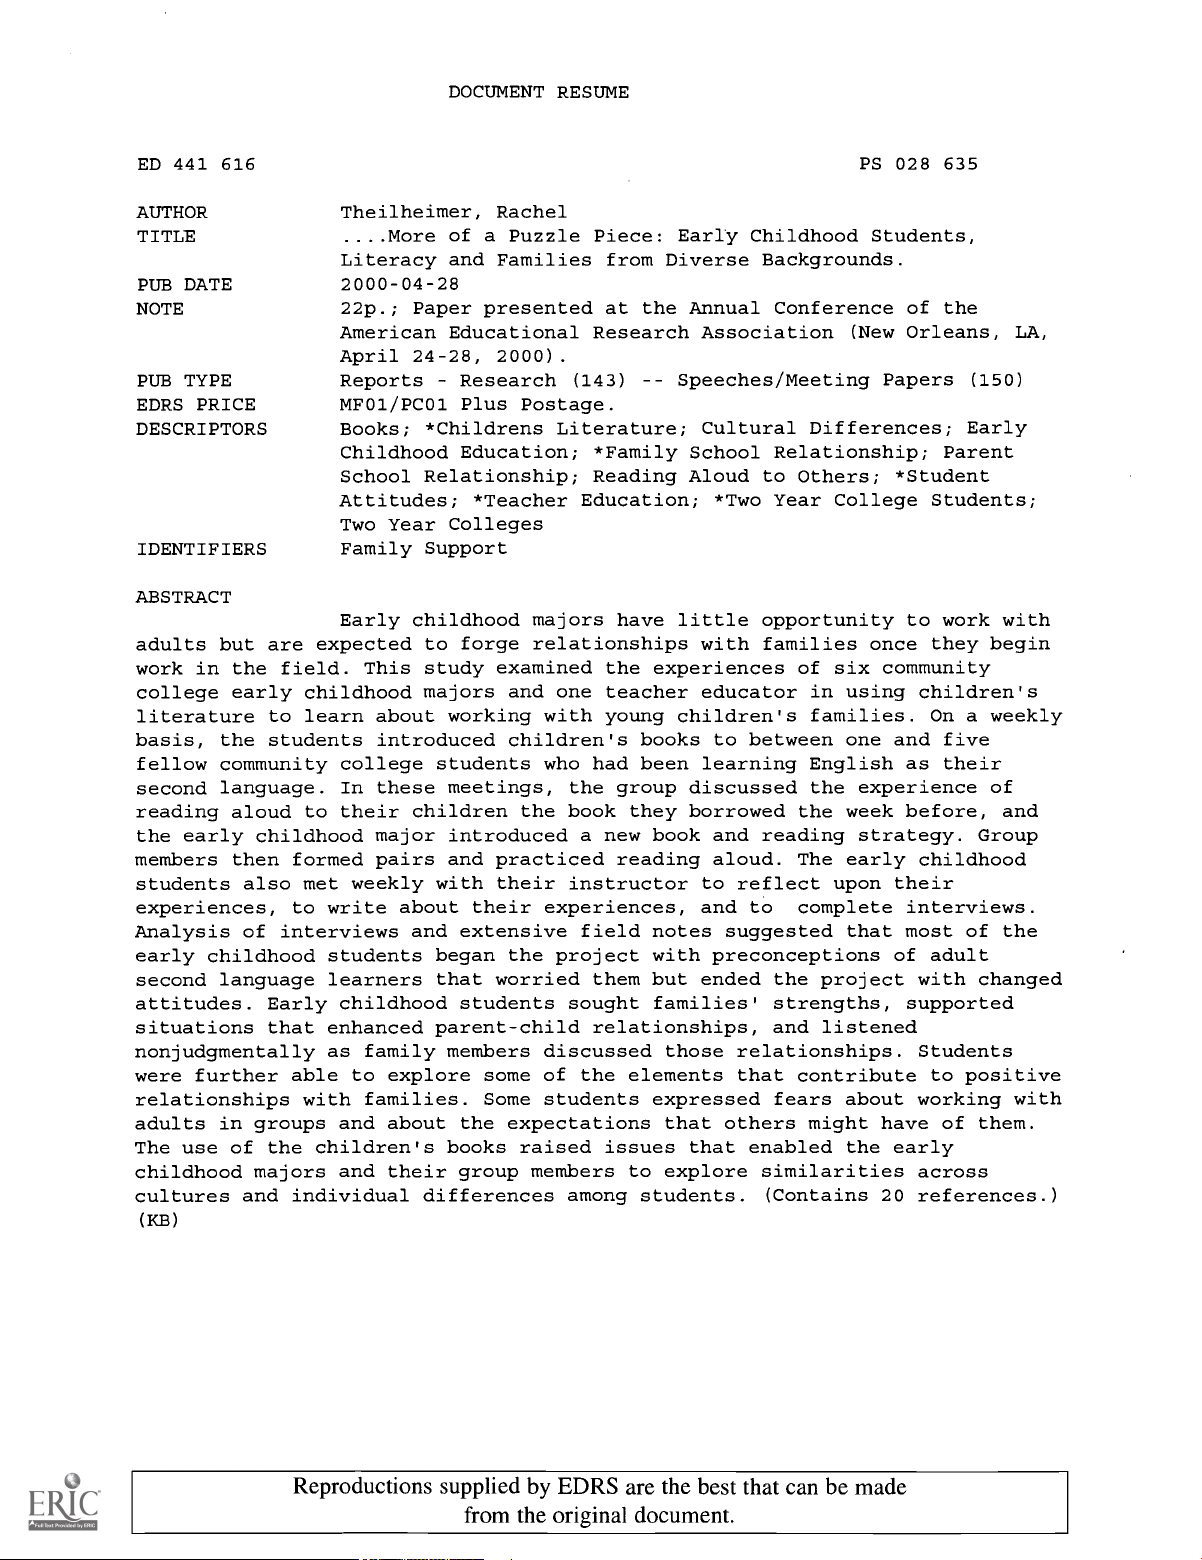
Compact SUV: The EV is much cheaper.
Owning the EV version of the Chevrolet Equinox costs nearly 20 percent less than
the gas version of the Equinox over seven years on a TCO basis. The Equinox EV has
56 percent savings on fuel and 39 percent savings on maintenance. That works out
to around $1,350 in savings each year for the Equinox EV compared to the gasoline
Equinox.
Chevrolet Equinox EV Chevrolet Equinox ICE
Taxes + Fees
Insurance
Fuel
Maintenance &
Repairs
Vehicle Price minus
Resale Value (less
tax credits and
incentives)
Upfront Price: $33,600
TCO: $38,603
Upfront Price: $28,600
TCO: $48,086

Comparing the Total Cost of Ownership of the Most Popular Vehicles in the United States
7
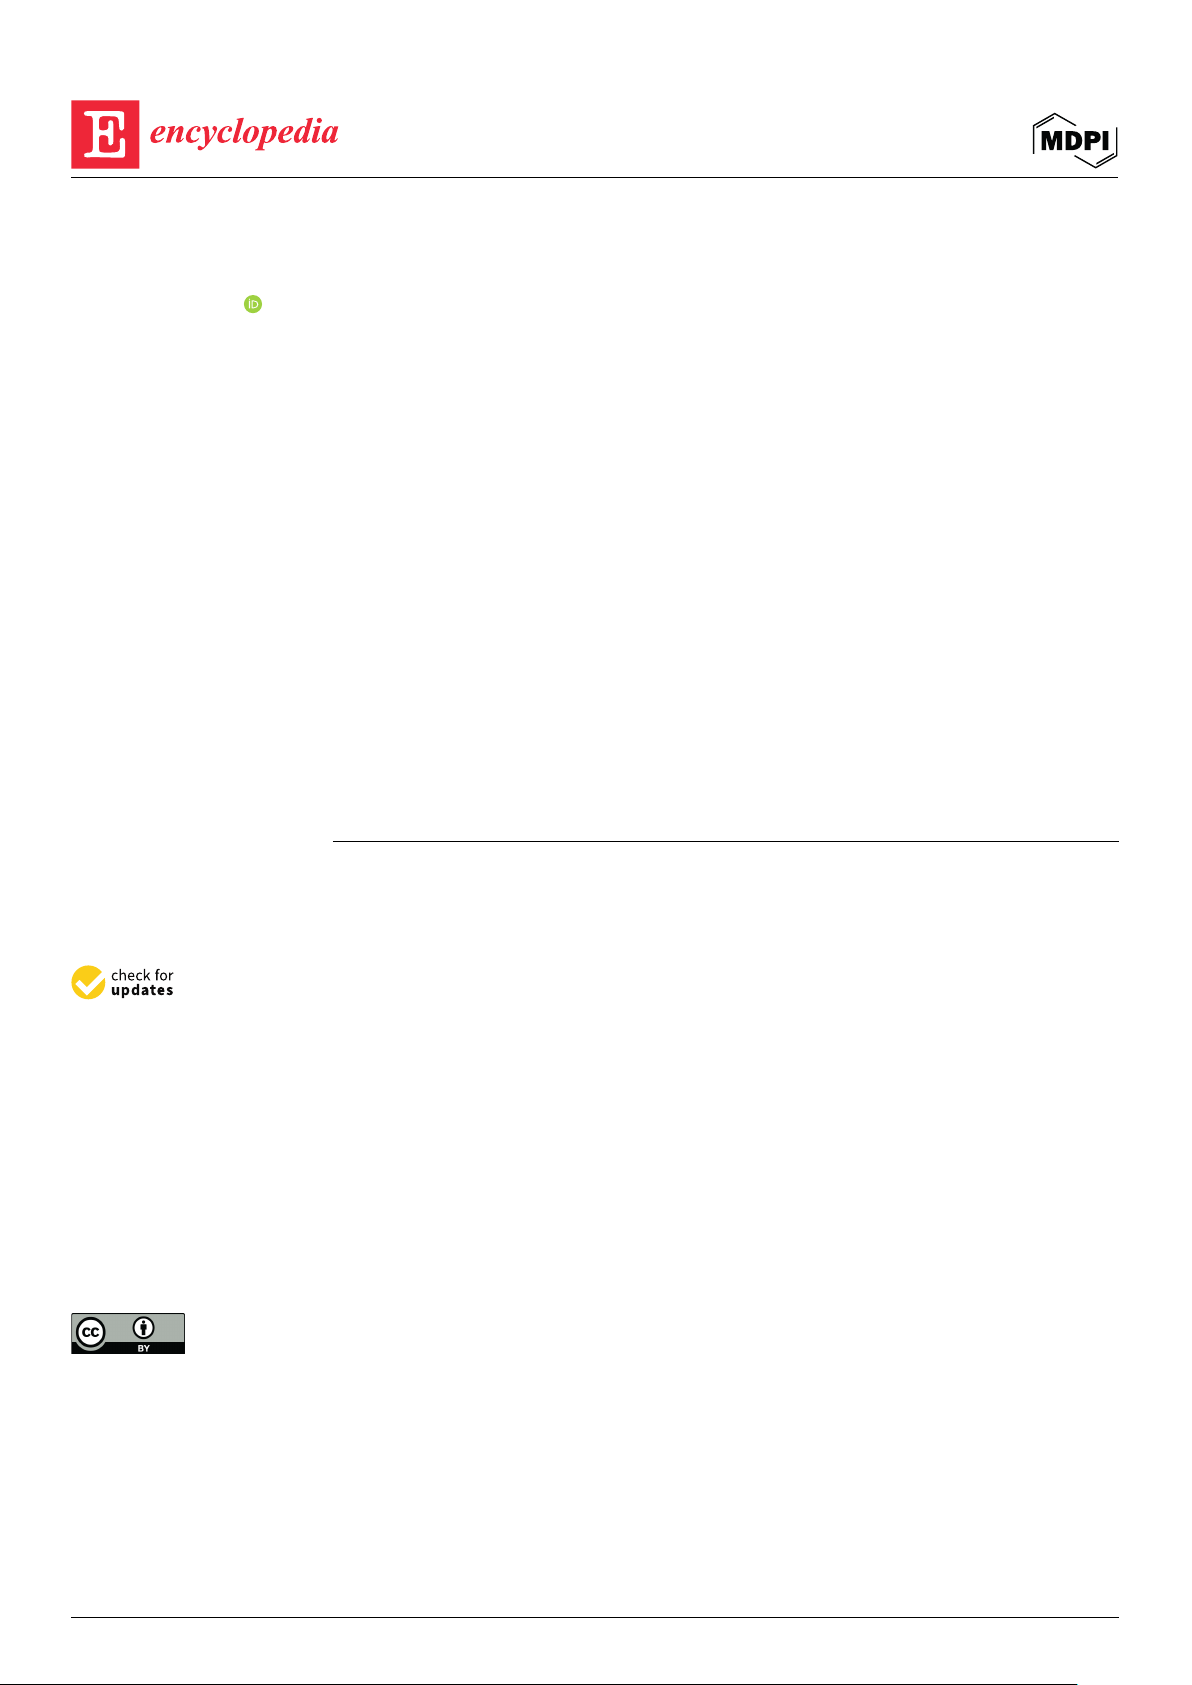
Box 1. Near-Term Uncertainty from Changes in Federal Policy
The savings the Equinox EV gives drivers would drop sharply if policies under consideration in Con-
gress are enacted. These policies, the termination of the $7,500 federal clean-vehicle credit and a new
$250 annual EV registration fee, would increase the Equinox EV’s total cost to own by about 20 per-
cent. The savings over seven years that a driver would see from switching to an EV would shrink from
more than $9,000 to under $200.
The impacts of auto tariffs are less certain. Our analysis suggests a 25 percent Section 232 tariff could
add over $1,700 to the price of an Equinox EV and over $3,100 to the gasoline Equinox. Tariff burdens
vary widely by model and even among model variations, and no one can yet say how much of these
costs manufacturers would absorb or how long any tariff hikes would stay in place.
Chevrolet Equinox EV Chevrolet Equinox EV Chevrolet Equinox ICE
Vehicle Price minus Resale Value Maintenance & Repairs Fuel Insurance Taxes + Fees
TCO increase of 20%
(Total TCO: $47,888)
(less tax credits and incentives)
(No Credit and Annual EV Fee)

Comparing the Total Cost of Ownership of the Most Popular Vehicles in the United States
8
Mid-Size SUV: The EV is much cheaper.
Owning the Model Y costs nearly 15 percent less than the Jeep Grand Cherokee L
over seven years on a TCO basis. Fuel for the Model Y costs nearly 68 percent less,
and maintenance costs 39 percent less. That works out to around $1,160 in savings
each year for the Model Y compared to the Grand Cherokee.
Tesla Model Y Long Range Jeep Grand Cherokee L
Taxes + Fees
Insurance
Fuel
Maintenance &
Repairs
Vehicle Price minus
Resale Value (less
tax credits and
incentives)
Upfront Price: $44,990
TCO: $46,636
Upfront Price: $42,905
TCO: $54,780

Comparing the Total Cost of Ownership of the Most Popular Vehicles in the United States
9
Pickup: The EV is slightly more expensive.
The cost of owning the F-150 Lightning is slightly more expensive compared to its
gasoline counterpart, costing nearly four percent more, or around $350 more each
year to own the F-150 Lightning compared with the gasoline F-150. The Lightning has
a much lower cost on key metrics however, including a 51 percent savings on fuel
and 39 percent savings on maintenance.
Taxes + Fees
Insurance
Fuel
Maintenance &
Repairs
Vehicle Price minus
Resale Value (less tax
credits and
incentives)
Ford F150 Lightning XLT
Upfront Price: $62,995
TCO: $61,800
Ford F150 XLT
Upfront Price: $56,215
TCO: $59,342

Comparing the Total Cost of Ownership of the Most Popular Vehicles in the United States
10
Assumptions
This analysis was carried out with the Fleet Procurement Analysis Tool using the default inputs to
version 1.34, in addition to the following exceptions:
• Each conventional vehicle selected was the most popular new vehicle of its type registered
in the United States in 2024, according to Experian. Comparable electric vehicles were cho-
sen based on similar features, size, and utility.
• Current vehicle prices were selected using the base manufacturer’s suggested retail price
(MSRP), as well as fuel economy in miles per gallon and miles per gallon-equivalent (MPGe)
from fueleconomy.gov, except for the Ford F-150 Lightning’s MSRP which was sourced from
Ford.com.
• Financial incentives were determined via the Federal Tax Credit tracker on the fuelecon-
omy.gov website. The existing $7,500 federal tax credit for qualified electric vehicles was
used for all EVs except the Nissan Leaf, which qualifies for half of the credit for purchases
made from January 1, 2024 through December 31, 2024.
• Maintenance & Repairs were estimated using per-mile cost factors from an Argonne Na-
tional Lab report. For the first five years, the tool applies $0.061/mi for EVs and $0.101/mi
for gasoline vehicles; in years six and up those costs rise to $0.079/mi and $0.131/mi, re-
spectively, to reflect additional wear and tear.
• Depreciation (residual value) was calculated with a statistical model based on vehicle age,
mileage, and all-electric range. The model was calibrated using data from more than 1,000
used-vehicle listings from cars.com and data from fueleconomy.gov. After year five, the
model uses a constant percentage decline until a $300 scrap value floor is reached.
• Insurance costs were from AAA’s Your Driving Costs 2024 study, using full-coverage aver-
ages for each vehicle category. The sedan, compact SUV, mid-size SUV, and pickup match
the AAA category; the compact sedan vehicle type used the Medium Sedan figure.
• Home charging was assumed to be 88 percent, which was derived from the average daily
charging demand from a National Renewable Energy Laboratory report.
• Public charging costs were assumed to be the average nationwide Electrify America charg-
ing prices.
• Residential electricity prices and gasoline prices and were based on the average national
retail price for 2024 from U.S. Energy Information Administration.
• Expected years of use for each vehicle were assumed to be seven years.
• Vehicles were estimated to travel an average of 11,106 miles driven per year according to
the Federal Highway Administration.
• No charging equipment costs were factored into the calculation.
• No climate costs or benefits were factored into the analysis.

Comparing the Total Cost of Ownership of the Most Popular Vehicles in the United States
11
Cost Per Mile Results
The gures in this fact sheet show the cost per mile of each vehicle by several categories consider-
ing energy and other ination. The table below provides the underlying data for each gure.
Vehicle Name
Category
Cost ($/mile)
2025 Toyota Corolla LE
Vehicle Price minus Resale Value
(less tax credits and incentives)
$0.171
Fuel
$0.100
Maintenance & Repairs
$0.117
Insurance
$0.151
Taxes & Fees
$0.014
2025 Nissan Leaf
Vehicle Price minus Resale Value
(less tax credits and incentives)
$0.189
Fuel
$0.057
Maintenance & Repairs
$0.071
Insurance
$0.196
Taxes & Fees
$0.014
2025 Toyota Camry HEV FF
LE
Vehicle Price minus Resale Value
(less tax credits and incentives)
$0.191
Fuel
$0.108
Maintenance & Repairs
$0.117
Insurance
$0.151
Taxes & Fees
$0.014
2025 Hyundai Ioniq 6
Standard Range
Vehicle Price minus Resale Value
(less tax credits and incentives)
$0.211
Fuel
$0.047
Maintenance & Repairs
$0.071
Insurance
$0.196
Taxes & Fees
$0.014

Comparing the Total Cost of Ownership of the Most Popular Vehicles in the United States
12
Vehicle Name
Category
Cost ($/mile)
2025 Chevrolet Equinox
FWD
Vehicle Price minus Resale Value
(less tax credits and incentives)
$0.191
Fuel
$0.132
Maintenance & Repairs
$0.117
Insurance
$0.165
Taxes & Fees
$0.014
2025 Chevrolet Equinox EV
FWD
Vehicle Price minus Resale Value
(less tax credits and incentives)
$0.168
Fuel
$0.058
Maintenance & Repairs
$0.071
Insurance
$0.186
Taxes & Fees
$0.014
2025 Jeep Grand Cherokee L
2WD
Vehicle Price minus Resale Value
(less tax credits and incentives)
$0.235
Fuel
$0.164
Maintenance & Repairs
$0.117
Insurance
$0.175
Taxes & Fees
$0.014
2024 Tesla Model Y Long
Range RWD
Vehicle Price minus Resale Value
(less tax credits and incentives)
$0.258
Fuel
$0.053
Maintenance & Repairs
$0.071
Insurance
$0.205
Taxes & Fees
$0.014
2025 Ford F-150 XLT
Vehicle Price minus Resale Value
(less tax credits and incentives)
$0.275
Fuel
$0.189
Maintenance & Repairs
$0.117

Comparing the Total Cost of Ownership of the Most Popular Vehicles in the United States
13
Vehicle Name
Category
Cost ($/mile)
Insurance
$0.169
Taxes & Fees
$0.014
2024 Ford F-150 Lightning
Vehicle Price minus Resale Value
(less tax credits and incentives)
$0.416
Fuel
$0.092
Maintenance & Repairs
$0.071
Insurance
$0.203
Taxes & Fees
$0.014