Dietary Behavioural Preferences of Spanish and German Adults and Their Translation to the Dietary Recommendations of a Personalised Nutrition App in the Framework of the Stance4Health Project PDF Free Download
1 / 16/16
100%

Academic Editors: Kalliopi Karatzi,
Sabina Lachowicz-Wi´sniewska and
Agata Kotowska
Received: 18 February 2025
Revised: 26 February 2025
Accepted: 4 March 2025
Published: 6 March 2025
Citation: Hinojosa-Nogueira, D.;
Navajas-Porras, B.; Pastoriza, S.;
Delgado-Osorio, A.; Toledano-
Marín, Á.; Rohn, S.; Rufián-Henares,
J.Á.; Quesada-Granados, J.J. Dietary
Behavioural Preferences of
Spanish and German Adults and
Their Translation to the Dietary
Recommendations of a Personalised
Nutrition App in the Framework of
the Stance4Health Project. Nutrients
2025,17, 912. https://doi.org/
10.3390/nu17050912
Copyright: © 2025 by the authors.
Licensee MDPI, Basel, Switzerland.
This article is an open access article
distributed under the terms and
conditions of the Creative Commons
Attribution (CC BY) license
(https://creativecommons.org/
licenses/by/4.0/).
Article
Dietary Behavioural Preferences of Spanish and German Adults
and Their Translation to the Dietary Recommendations of a
Personalised Nutrition App in the Framework of the
Stance4Health Project
Daniel Hinojosa-Nogueira 1, Beatriz Navajas-Porras 1, Silvia Pastoriza 1, Adriana Delgado-Osorio 1,
Ángela Toledano-Marín
1
, Sascha Rohn
2
, José Ángel Rufián-Henares
1,
* and José Javier Quesada-Granados
1
1
Department of Nutrition and Food Sciences, Institute of Nutrition and Food Technology, Biomedical Research
Centre, Universidad de Granada, 18071 Granada, Spain; dhinojosa@ugr.es (D.H.-N.);
beatriznavajas@ugr.es (B.N.-P.); spdelacueva@ugr.es (S.P.); adrianadelgado@ugr.es (A.D.-O.);
antolemarin@correo.ugr.es (Á.T.-M.); quesadag@ugr.es (J.J.Q.-G.)
2
Department of Food Chemistry and Analysis, Institute of Food Technology and Food Chemistry, Technische
Universität Berlin, 13355 Berlin, Germany; rohn@tu-berlin.de
*Correspondence: jarufian@ugr.es
Abstract: Background/Objectives: The influence of individual differences in the selection
of food portions can have a deep effect on recommendations for personalised nutrition. In
addition to typical aspects such us energy density and nutrient composition, portion size
is important for dietary recommendations. This study examined the dietary behaviours
and portion size selection of 224 subjects in Spain and Germany to use such information
to improve dietary adherence to a personalised nutrition app. Methods: An online ques-
tionnaire administered to adults in Spain and Germany collected sociodemographic data
and dietary habits. The measurement of portion sizes was derived from a classification
ranging from XXS to XL across 22 food groups, with assistance from a photographic atlas.
Results: Significant differences across dimensions were found. Dietary habits showed
that omnivores were the majority in both countries, with significant differences in the
consumption of bread, desserts, and beverages. The Mediterranean diet was significantly
followed by the Spanish group, reflecting cultural differences. Body mass index (BMI) was
slightly higher among Germans, although both populations fell within the normal ranges.
Portion size comparisons revealed statistically significant differences in the consumption
of various food items between the two countries. Spaniards consumed higher amounts of
rice, meat, and legumes, while Germans consumed larger portions of stews, lasagne, and
pizza. These variations highlight differing dietary habits influenced by cultural preferences
and dietary guidelines. Conclusions: The findings support the development of novel
personalised nutrition apps that consider user preferences and enhance dietary adherence,
thereby contributing to improved dietary recommendations and health outcomes.
Keywords: food choice; portion size assessment; meal intake behaviour; personalised nutrition
1. Introduction
Dietary choices are influenced by a variety of factors, including personal preferences,
lifestyle, environment, socioeconomic status, and religious, or philosophical beliefs. These
factors influence people’s dietary behaviours [
1
]. Understanding dietary habits through
the identification of factors influencing food selection and the dietary status of individual
Nutrients 2025,17, 912 https://doi.org/10.3390/nu17050912

Nutrients 2025,17, 912 2 of 16
behaviour is therefore vital [
2
]. However, maintaining an adequate nutritional status
can be complicated. Dietary recommendations are often based on guidelines for large
groups of healthy people. Consequently, these recommendations are very general and
frequently ignore that different individuals have a wide range of responses to different
dietary patterns [
3
,
4
]. The heterogeneous nutritional responses of individuals increase
the need for the development of precision or personalised nutrition (PN). In recent years,
advances in nutrition and food sciences have aided in the analysis and comprehension of
the specific needs and dietary behaviours of each individual [5,6].
PN has great potential, particularly when combined with the power and accessibility
of new technologies [
7
]. New dietary evaluation tools are being developed and validated
using web-based tools [
8
]. Some examples are ASA-24 [
9
], or INTAKE24, which introduces
additional features such as home measurements or pictures of food rations [
8
]. Mobile
applications (apps) have been instrumental in facilitating the accurate estimation of the
nutritional value of consumed foods, dietary habits, and food intake, thereby contributing
to the enhancement of public health [
6
]. Currently, it is estimated that there are around
10,000 apps available for nutrition and diet [
10
]. Speak4Diet is an example of how a mobile
application can use technology to empower people to improve their diet by integrating
this technology into their daily lives [
11
]. Apps offer greater versatility and faster feed-
back, making them a more cost-effective option for improving healthy eating habits [
12
].
Therefore, apps enable rapid data analysis, which could help improve access to quality
nutritional data [13].
In recent years, a proliferation of food and drink options has been observed, precipitat-
ing substantial shifts in consumption patterns, encompassing both quality and quantity [
2
].
As a result, making appropriate food choices is also linked to portion size control [
14
]. Food
portion size is traditionally measured in terms of weight or volume. Although weight can
be determined accurately using a scale, it is time-consuming and requires a high level of
motivation from consumers [
15
]. More convenient would be a fast visualisation method.
Several different visual methods are commonly used to estimate food consumption, such as
the use of household measurements, where common objects are used to relate their size to
the portions consumed [
16
]. Identical artificial figures of food have also been used [
17
]. The
use of 3D-printing technology has made it more cost-effective for estimating the portion
size using 3D-models [
2
]. Another tool for estimating food portion sizes is the use of
standardised photos of food portions. This is a cost-effective and portable method that is
widely considered a useful tool for estimating food portion sizes. These photos are grouped
into a digital photographic food atlas [
2
,
16
,
17
]. Currently, thanks to new technologies, food
portion estimations are continuously improving. For instance, image recognition combined
with bioinformatics techniques can provide accurate estimations [
6
,
18
]. Other examples
could include infrared technology or thermal cameras, which are rapidly evolving [18].
Furthermore, a multitude of additional factors have the capacity to influence dietary
decisions in relation to the consumption of particular food items, the size of portions
consumed, and also to affect other dietary habits [
1
]. Nevertheless, the issue of portion sizes
remains a significant challenge in estimating and formulating dietary recommendations.
In the context of PN, the development of apps to monitor, control, and manage diets has
emerged as a significant advancement. However, to ensure the effective implementation of
these apps, it is crucial to obtain and use precise estimations of portion sizes.
Based on this evidence, the aim of the present study was to investigate the dietary be-
haviour of adults from two of the countries (Germany and Spain) involved in the European
research project Stance4Health [
19
]. The results of this study would help to understand and
develop more specific tools to help with portion size recommendations and other dietary

Nutrients 2025,17, 912 3 of 16
aspects, in order to improve the accuracy and suitability of the i-Diet app [
20
], which is the
main focus of the aforementioned project.
2. Materials and Methods
2.1. Study Participants
This work is part of the Stance4Health project (https://stance4health.com/, accessed
on 19 January 2025). The participants were recruited from Spain and Germany, where
nutritional interventions were planned to be carried out as part of the overall project goal.
No inclusion or exclusion criteria were applied, and the participants solely comprised
adults from the general population, aged 18–82 years. The determination of sample size
was based on a correlation-based power analysis expecting an effect size of
ρ
= 0.35, with
an
α
error probability of 0.05 and a desired statistical power (1
−β
) of 0.95. With a
target population of 200 participants per country, as established in the European S4H
project, the finite population correction was applied [
21
], resulting in a need to recruit
approximately
66 people
per country. This strategy was developed to optimise the balance
between logistical feasibility and the desired accuracy in detecting changes in consumption
habits in the Spanish and German populations, serving as a foundation for the subsequent
personalised nutrition study. The recruitment process involved an online questionnaire,
which was distributed through social media and via the networks of the researchers in
charge per country. The study was approved by the Ethics Committee of the University of
Granada (protocol code 1080/CEIH/2020) and all subjects voluntarily participated in the
study. The data were processed as specified in Regulation (EU) 2016/679 “General Data
Protection Regulation (GDPR)”, and the Declaration of Helsinki on research ethics was
followed. To ensure participant anonymity, the collected data were anonymised.
2.2. Dietary Behaviours and Questionnaire Construction
The developed questionnaire included personal characteristics such as age, weight,
height, and socioeconomic information. Body Mass Index (BMI) was calculated using the
formula (kg/m
2
). In addition, the questionnaire asked about dietary behaviours such as
eating alone or eating bread with meals or drinking and the type of drinks consumed,
among other relevant information. To determine whether the dietary patterns were similar
between both populations, the 13-questions questionnaire on adherence to the Mediter-
ranean diet (AMD) was also used, which was a modified version that does not consider
alcoholic beverages [
22
]. Good AMD was defined as a score of 8 points or more [
22
]. The
questionnaire was developed and provided online through Google Forms.
The creation of the questions regarding portion size was conducted through the integra-
tion of diverse tools, including food frequency questionnaires, food consumption patterns
in Spain and Germany, data from the photographic food atlas, and culinary techniques and
portion sizes detailed in recipes [
16
,
23
–
31
]. The standard food sizes were defined according to
the methodology established in some photographic food atlases [
15
,
32
]. In order to standard-
ise portion sizes, six different images were used. The food photographs were obtained from a
previously validated photographic food atlas [17,33–35].
Food portions were presented from left to right in the order of size, from small to large,
or in the order of weight, from light to heavy. The sizes were assigned ranging from XXS,
XS, S, M, L, and XL, obtaining a more understandable methodology for the subjects [
36
].
Food selection was generalised for the choice of food photos to estimate equivalent food.
The study summarised and classified the consumption size images of different food groups
and dishes in diverse conditions and with various tableware into 22 categories based on
food type and size (Table 1). For instance, a salad with green leaves was used as an example,

Nutrients 2025,17, 912 4 of 16
which can be applied to different types of salads. This allows users to select a portion size
for each category according to their preferences.
Table 1. Food categories and the range of portion sizes.
Type of Food
Portion Range XXS XS S M L XL
Rices (g) 39 85 131 224 316 362
Beverages (mL) 100 200 300 400 500 600
Raw vegetables (g) 32 49 67 101 136 153
Meat (g) 56 108 168 246 308 400
Breakfast cereals (g) 16 23 31 45 60 67
Salad (g) 88 150 213 338 463 525
Nuts (g) 15 49 82 116 183 250
Stew dish (g) 93 158 222 352 481 546
Bread (g) 22 34 48 63 94 126
Lasagne (g) 135 187 238 341 444 496
Legumes dish (g) 80 140 200 320 440 500
Fruit salad (g) 39 64 89 139 189 214
Cooked vegetables (g) 26 56 85 145 204 234
Fruit portion (g) 53 83 166 266 376 532
Pasta (g) 55 108 161 266 372 425
Potatoes (g) 61 97 131 204 275 311
Fish (g) 43 58 82 245 345 560
Pizza (g) 42 84 168 335 502 670
Cheese (g) 13 25 36 60 83 95
Sliced fruit (g) 28 56 83 139 194 222
Soup dish (mL) 33 89 145 257 369 425
Cakes (g) 67 83 98 129 160 176
2.3. Data Statistical Analysis
The collected data comprised both quantitative and qualitative variables. Data were
presented as percentages or as means and standard deviations. To explore these categorical
variables, specific statistical analyses were used. Tests of association, such as the Chi-square
test, were used to assess the relationship between variables. In specific cases, categorical
variables were coded, such as part of the MANOVA analysis, which was used to examine
differences in multivariate proportions to determine if there were significant differences
between groups. For quantitative variables, the Kolmogorov–Smirnov test was used to
analyse the data, followed by Spearman correlations to assess the associations between the
different variables. The statistical differences between the groups were evaluated according
to the Mann–Whitney U and Kruskal–Wallis test. The SPSS 26.0 statistical software was
used to analyse the data. The level of significance was set at p< 0.05. Graphics were
generated using the Python 3.7 module. The calculation of statistical power was carried
out using G*Power software (version 3.1.9.7).
3. Results
3.1. Characteristics of the Subjects and Dietary Habits
The study comprised a total of 224 participants, with ages ranging from 18 to 80 years
in Spain and from 20 to 82 years in Germany (Table 2). The average age was 35.4 years.
Of the participants, 38% were Spanish and 62% were from Germany. The study included
77 men
and 147 women, 97.3% of whom were European (Spanish or German national-
ity) and the remaining nationalities residing in Spain or Germany. Of the participants,

Nutrients 2025,17, 912 5 of 16
18% reported
allergies or food intolerances. The most common allergies were towards
dairy products and nuts. Some allergies to fruit peel and plant lipid transfer proteins (LTP),
or intolerances to additives were also identified among the participants.
Table 2. Characteristics of the surveyed populations.
Feature Spain Germany Total
Population 84 140 224
Age (years) Average ±SD 26.3 ±10.2 40.8 ±14.9 35.4 ±15.1
Gender Male 31 46 77
Female 53 94 147
Origin Asian 0 1 1
European 80 138 218
Latin 4 1 5
Allergies and
Intolerances
No 64 116 180
Nuts 0 8 8
Dairy 5 9 14
Others 15 3 18
Education
Primary 4 3 7
Secondary 10 25 35
Higher 70 112 182
Employment
Unemployed 1 1 2
Employed 18 90 108
working part-time 8 18 26
Studying 55 26 81
Retired 2 5 7
Marital status
Married 6 54 60
Divorced 0 6 6
Other 4 36 40
Single 74 44 118
Share home
With friends 25 16 41
With family 43 41 84
With partner 8 55 63
Other 1 0 1
Alone 7 28 35
Housing Rented 36 75 111
Owned 34 60 94
Other 14 5 19
Living in Urban areas 66 102 168
Rural areas 18 38 56
Eating habits Vegetarians 0 23 23
Omnivores 98 103 201
Dietary behaviour Eat in company 61 100 161
Alone 23 40 63
Use spices Sometimes 14 3 17
Never 5 1 6
Always 65 136 201
Dishes during meals Other 5 6 11
Single dish 61 128 189
First and second dish 18 6 24

Nutrients 2025,17, 912 6 of 16
Table 2. Cont.
Feature Spain Germany Total
Eat dessert
Sometimes 18 63 81
Never 20 66 86
Always 46 11 57
Bread consumption Sometimes 24 43 67
Never 28 71 99
Always 32 26 58
Drink during meal
Water 69 75 144
Sparkling water 1 41 42
Beer/Wine 4 3 7
Never 6 6 12
Other 0 5 5
Soft drink 4 2 6
Juices 0 8 8
AMD Average ±SD 9.63 ±1.72 6.09 ±1.99 7.42 ±2.56
Physical activity
Intense (>5 times/week)
13 17 30
Light (walking) 26 48 74
Moderate
(3 times/week) 39 57 96
Very intense (2 h/day) 4 1 5
Very light 2 17 19
BMI (kg/m2)Average ±SD 23.07 ±3.92 24.23 ±4.43 23.79 ±4.27
A total of 81.3% of surveyed participants completed higher education and
15.6% declared
having only secondary education. For the rest, primary education studies were declared.
Of those surveyed, 59.8% were employed, with 11.6% working part-time. A total of
36% of
the participants were studying, while only 3.6% and 0.9% were retired or unemployed,
respectively. The survey results show that 52.7% of the participants were single. Addi-
tionally, 37.5% of the participants lived with their family, 28.1% with their partner, and
15.6% lived alone, while 18.3% declared that they lived with friends. In terms of housing,
49.5% of the participants lived in rented accommodation while 42% owned their own home.
Furthermore, 74.9% of the participants reported living in urban areas, while the remaining
participants reported living in rural areas. In total, 10% of the total population were vegan
or vegetarian (all from Germany).
Regarding dietary behaviour, 72% of the participants ate in company. In general,
89.7% used spices, which was significantly higher in the Spanish cohort. Furthermore,
84.4% of the participants preferred a single dish. Significant differences were observed
between countries, with only 28% of participants in Spain choosing other options, such
as a menu with several dishes, compared to 9% in Germany. In total, 62% of participants
eat desserts daily or regularly. In addition, 44% of participants did not consume bread
during meals, while close to 95% consumed some kind of drink during meals. When
examining data by country, it is interesting to note that in Spain, 81% of participants drank
water and only 19% drank other beverages. In Germany, this percentage changes, with
54% drinking
water, 29% drinking sparkling water, and the rest reporting other drinks.
Related to lifestyle, 76% reported engaging in light or moderate physical activity. On
average, the participants had a height of 171 cm and a weight of 70.7 kg, with a mean BMI
of 23.8
±
4.3 (kg/m
2
). Statistically significant differences were found between BMI in men
(24.8 kg/m
2
) and women (23.3 kg/m
2
) (p-value: 0.008). The mean score for adherence to the
Mediterranean diet (AMD) was 7.4
±
2.5, indicating generally low adherence (especially

Nutrients 2025,17, 912 7 of 16
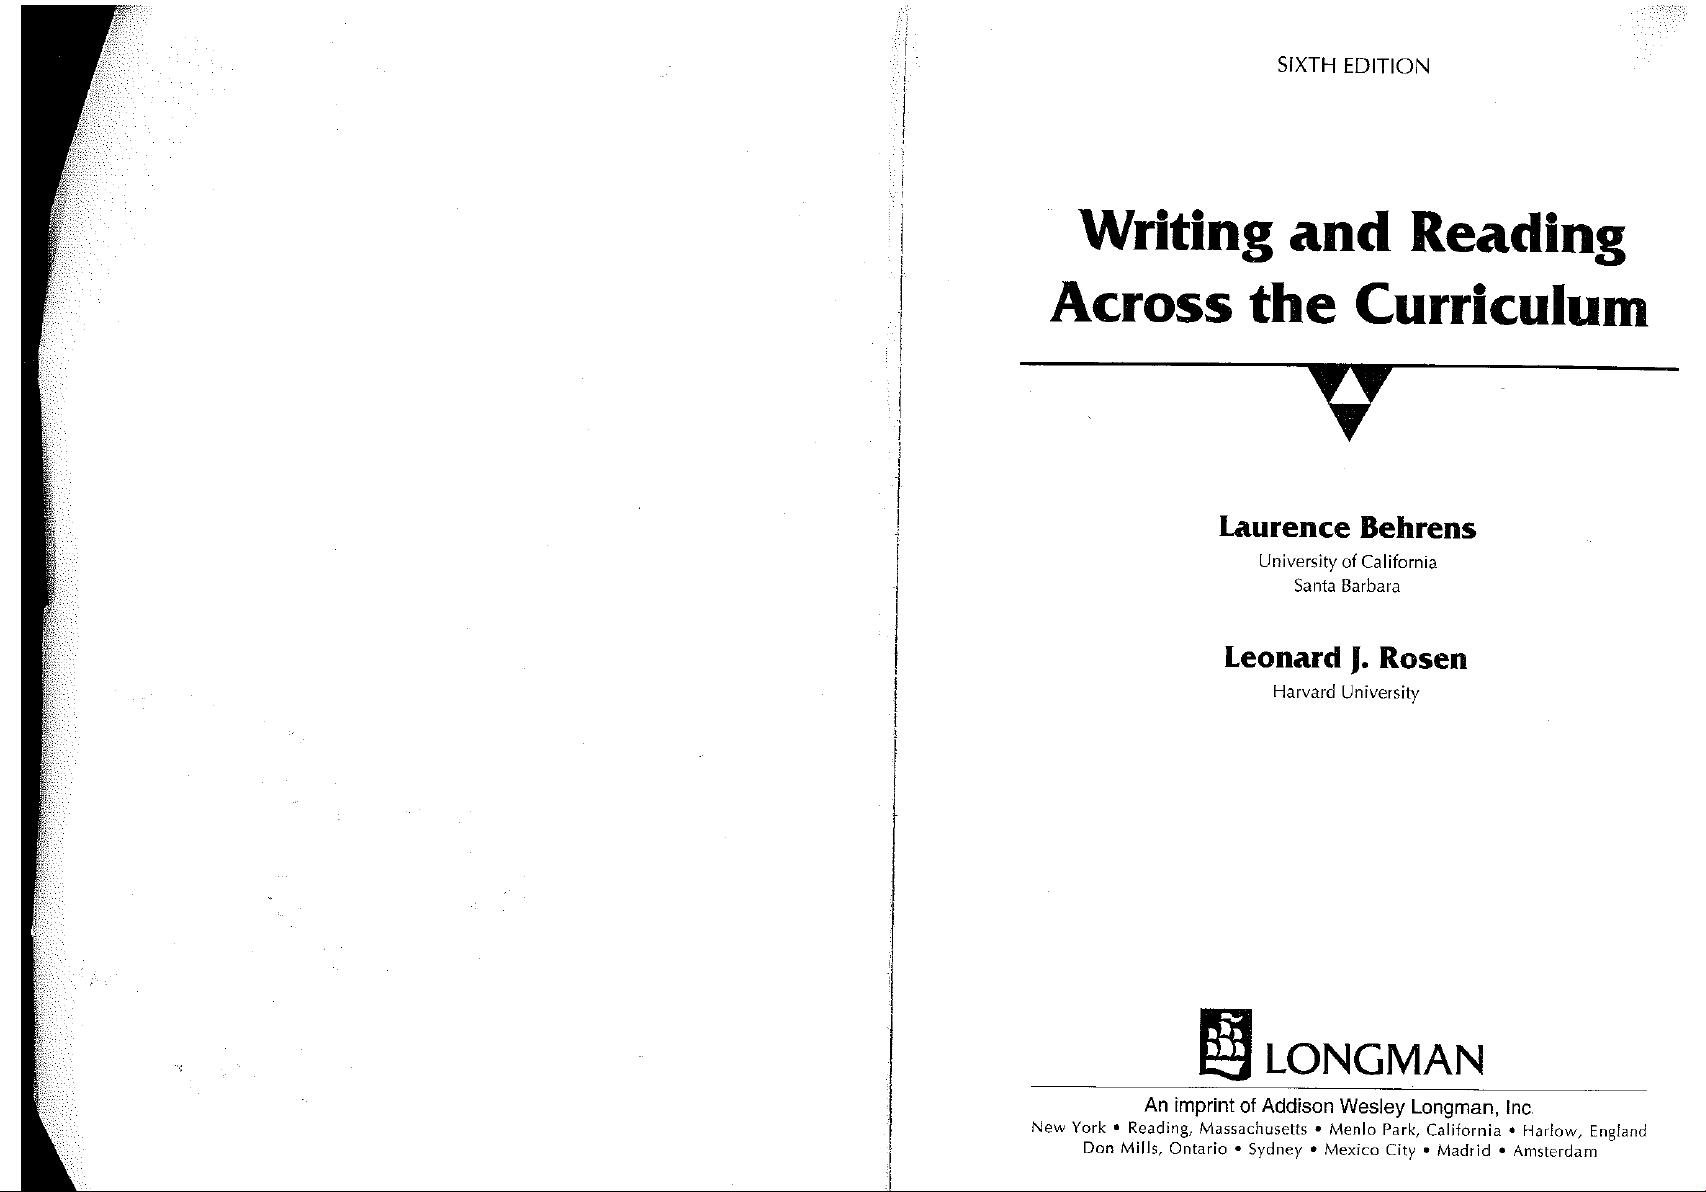
among German respondents). Statistically significant differences were found between
the AMD of the Spanish and German populations (Figure 1) (p-value: 0.001). Significant
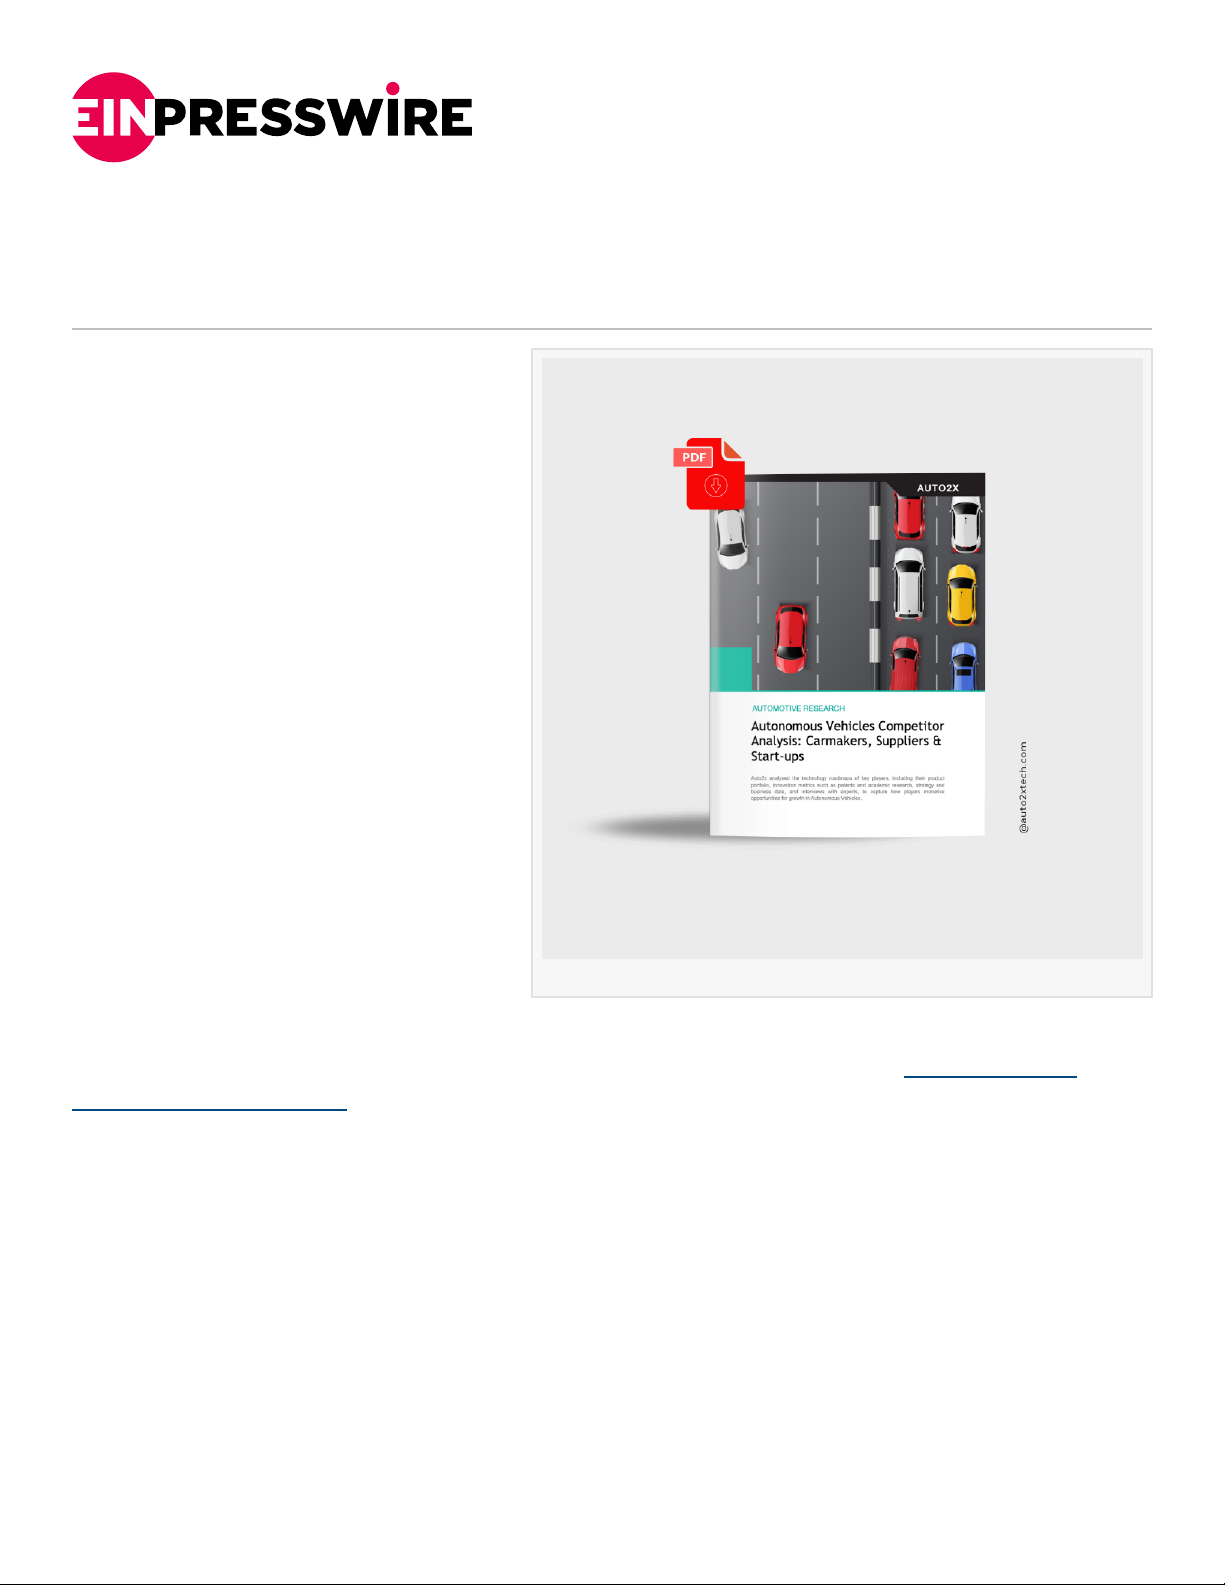
correlations between BMI, age, and AMD were found (Figure 2), suggesting that young
people in particular had higher AMD and lower BMI.
Nutrients 2025, 17, x FOR PEER REVIEW 7 of 16
German respondents). Statistically significant differences were found between the AMD
of the Spanish and German populations (Figure 1) (p-value: 0.001). Significant correlations
between BMI, age, and AMD were found (Figure 2), suggesting that young people in par-
ticular had higher AMD and lower BMI.
Figure 1. Adherence to the Mediterranean diet (AMD) by country. A score of 8 or higher indicates
high AMD. Differences between Spanish and German samples. ** Significant at the p < 0.05 level.
Figure 2. Heat map showing significant Spearman correlations between BMI, age, and adherence to
the Mediterranean diet (AMD). ** Correlation significant at p < 0.05 level.
Figure 1. Adherence to the Mediterranean diet (AMD) by country. A score of 8 or higher indicates
high AMD. Differences between Spanish and German samples. ** Significant at the p< 0.05 level.
Nutrients 2025, 17, x FOR PEER REVIEW 7 of 16
German respondents). Statistically significant differences were found between the AMD
of the Spanish and German populations (Figure 1) (p-value: 0.001). Significant correlations
between BMI, age, and AMD were found (Figure 2), suggesting that young people in par-
ticular had higher AMD and lower BMI.
Figure 1. Adherence to the Mediterranean diet (AMD) by country. A score of 8 or higher indicates
high AMD. Differences between Spanish and German samples. ** Significant at the p < 0.05 level.
Figure 2. Heat map showing significant Spearman correlations between BMI, age, and adherence to
the Mediterranean diet (AMD). ** Correlation significant at p < 0.05 level.
Figure 2. Heat map showing significant Spearman correlations between BMI, age, and adherence to
the Mediterranean diet (AMD). ** Correlation significant at p< 0.05 level.

Nutrients 2025,17, 912 8 of 16
3.2. Portion Size Results
Table 1shows the portion size for each food referenced in the survey [
36
]. According
to the type of food, portion sizes of XXS, XS, S, M, L, and XL were assigned and were
adapted to the usual weight or volume for that food. Thus, Table 3shows a summary of
the mean results per country found in this study. In general, Spanish participants tend to
have a higher average consumption of several food categories compared with the German
participants. For instance, Spaniards showed higher average consumption of rice, meat,
legumes, and fruit portions. On the other hand, Germans exhibited higher consumption of
pizza, lasagne, and stews. Both countries had similar consumption levels for beverages,
raw vegetables, breakfast cereals, (green) salads, cooked vegetables, fruits, pasta, fish,
soups, and cakes. These results reflect differences in dietary preferences and habits between
the populations of Germany and Spain (Wilks’ Lambda = 0.478, p< 0.01), indicating that
certain foods are more popular or consumed in larger quantities in one country compared
to the other.
Table 3. Average food consumption by country according to surveys.
Food Country Average ±SD Portion Size Group p< 0.05 *
Rices (g) Germany 127.43 ±60.96 S 0.0003
Spain 165.42 ±83.85 M
Beverages (mL) Germany 355.40 ±138.40 M 0.4067
Spain 328.57 ±193.62 M
Raw vegetables (g) Germany 121.36 ±33.38 L 0.7752
Spain 121.19 ±35.53 L
Meat (g) Germany 175.66 ±75.77 M 0.0123
Spain 202.90±81.65 M
Breakfast cereals (g) Germany 29.30 ±11.12 S 0.2453
Spain 27.92 ±12.64 S
Salad (g) Germany 287.36 ±119.60 M 0.1556
Spain 264.88 ±109.29 M
Nuts (g) Germany 52.17 ±39.51 S 0.4533
Spain 52.38 ±46.91 S
Stew dish (g) Germany 372.79 ±127.04 L 0.0021
Spain 318.64 ±123.26 M
Bread (g) Germany 62.43 ±34.18 M 0.0001
Spain 35.12 ±27.52 S
Lasagne (g) Germany 402.66 ±89.62 L 0.0005
Spain 350.80 ±112.04 L
Legumes dish (g) Germany 243.48 ±105.75 M 0.0001
Spain 314.88 ±112.03 L
Fruit salad (g) Germany 147.93 ±47.10 M 0.0198
Spain 163.43 ±42.77 M
Cooked vegetables (g) Germany 141.55 ±48.20 L 0.8939
Spain 142.07 ±49.35 L
Fruit portion (g) Germany 284.60 ±165.06 L 0.1463
Spain 315.48 ±176.33 L
Pasta (g) Germany 227.11 ±76.05 M 0.8626
Spain 229.70 ±76.24 M

Nutrients 2025,17, 912 9 of 16
Table 3. Cont.
Food Country Average ±SD Portion Size Group p< 0.05 *
Potatoes (g) Germany 159.04 ±65.14 M 0.0033
Spain 135.62 ±51.37 M
Fish (g) Germany 136.83 ±94.33 M 0.1700
Spain 164.94 ±114.80 M
Pizza (g) Germany 481.39 ±174.19 L 0.0001
Spain 353.23 ±171.75 M
Cheese (g) Germany 49.68 ±22.53 M 0.0258
Spain 42.76 ±21.83 M
Sliced fruit (g) Germany 160.14 ±48.72 M 0.0288
Spain 176.91 ±33.36 L
Soup dish (mL) Germany 296.36 ±86.22 L 0.9097
Spain 297.63 ±90.79 L
Cakes (g) Germany 102.46 ±31.02 M 0.2586
Spain 97.30 ±29.55 M
* Bold numbers denote statistically significant differences.
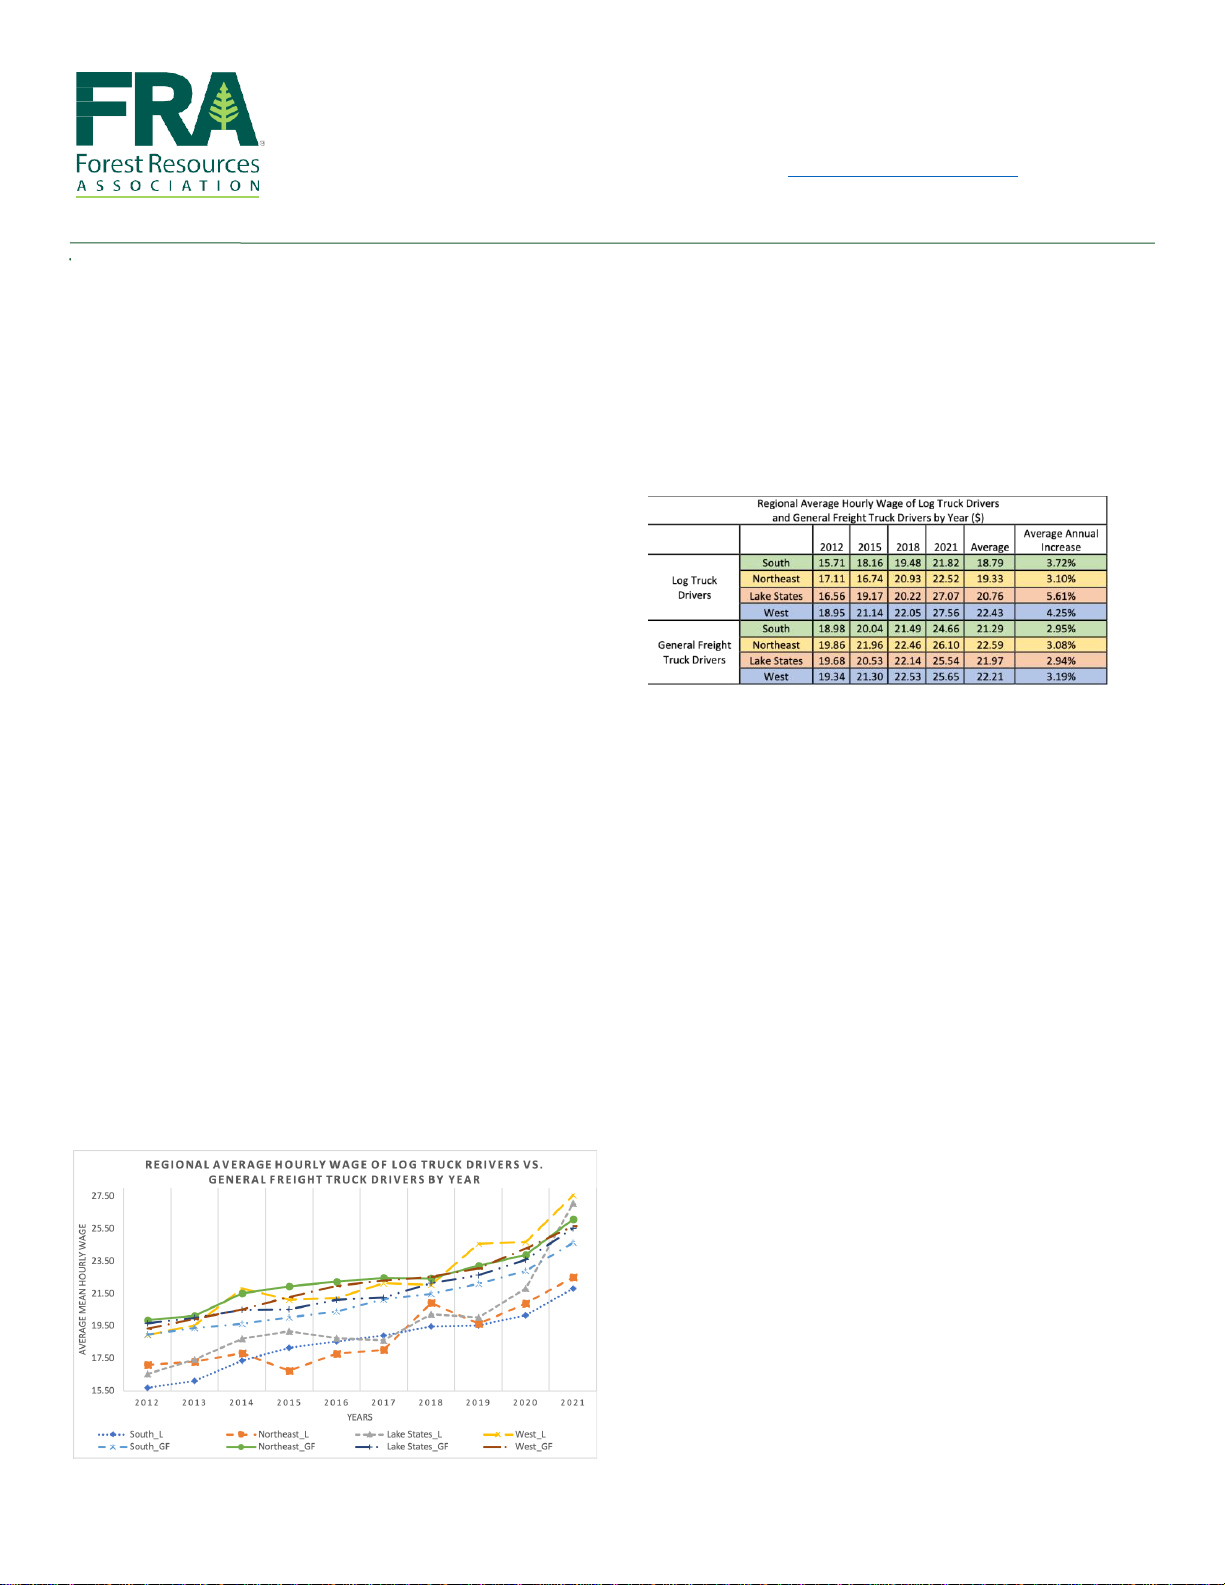
The gender distribution revealed a preponderance of female participants in both
countries, with a particularly pronounced female representation in Germany. The findings
indicated a significant impact of gender on the selection of food portion sizes in total (Wilks’
Lambda = 0.704, p< 0.01) and across different food groups. Figure 3shows the most
frequently selected trends for each group and a mean of the trends by gender, highlighting
significant differences. In general, men selected larger portion sizes than women, with the
exception of raw vegetables.
Nutrients 2025, 17, x FOR PEER REVIEW 9 of 16
Pizza (g) Germany 481.39 ± 174.19 L 0.0001
Spain 353.23 ± 171.75 M
Cheese (g) Germany 49.68 ± 22.53 M 0.0258
Spain 42.76 ± 21.83 M
Sliced fruit (g) Germany 160.14 ± 48.72 M 0.0288
Spain 176.91 ± 33.36 L
Soup dish (mL) Germany 296.36 ± 86.22 L 0.9097
Spain 297.63 ± 90.79 L
Cakes (g) Germany 102.46 ± 31.02 M 0.2586
Spain 97.30 ± 29.55 M
* Bold numbers denote statistically significant differences.
The gender distribution revealed a preponderance of female participants in both
countries, with a particularly pronounced female representation in Germany. The find-
ings indicated a significant impact of gender on the selection of food portion sizes in total
(Wilks’ Lambda = 0.704, p < 0.01) and across different food groups. Figure 3 shows the
most frequently selected trends for each group and a mean of the trends by gender, high-
lighting significant differences. In general, men selected larger portion sizes than women,
with the exception of raw vegetables.
In addition, other factors were analysed, but no clear significant differences were
found, such as by type of employment or education level.
Figure 3. Differences in food size choices by gender and most preferred sizes. Circle size is propor-
tional to frequency. Differences between gender. ** Significant at the p < 0.05 level.
4. Discussion
4.1. Dietary Behaviour of the Subjects and Comparative Portion Size Estimation
The present study examined the influence of individual differences on food portions
selection. These discrepancies can be largely aributed to the presence of similar or
Figure 3. Differences in food size choices by gender and most preferred sizes. Circle size is propor-
tional to frequency. Differences between gender. ** Significant at the p< 0.05 level.

Nutrients 2025,17, 912 10 of 16
In addition, other factors were analysed, but no clear significant differences were
found, such as by type of employment or education level.
4. Discussion
4.1. Dietary Behaviour of the Subjects and Comparative Portion Size Estimation
The present study examined the influence of individual differences on food portions
selection. These discrepancies can be largely attributed to the presence of similar or distinct
attributes within the Spanish and German populations across multiple dimensions, as
illustrated in Table 2.
The results obtained demonstrate statistically significant differences between the two
genders (Figure 3). This difference may be due to men having a higher energy demand
than women, or to the fact that for some food groups such as meat, these women consume
less but consume more vegetables than men [
37
]. In addition, women were more frequently
able to estimate the correct portion size from images than men [
29
], which is in line with
other studies were men had more difficulties estimating the correct portion size [38].
The cohort from Spain was significantly younger (average age of 26.3 years) than that
from Germany (average age of 40.8 years), which may have influenced other variables
such as habits and living conditions [
39
]. The results indicated significant variations in
the selection of food portion sizes depending on the consumer’s age. This may be because
younger people consume more ultra-processed foods [
40
], or that young people have a
greater ability to estimate portion size than older adults [39].
Table 2illustrates the differences in body mass index (BMI) between the two groups.
While both groups had an average BMI within the normal range, the German cohort exhib-
ited a slightly higher BMI than the Spanish cohort. The statistically significant differences
observed in BMI values suggest that there are variations that may be influenced, and this
should be taken into account when evaluating the choice of food portion size [
38
]. Studies
suggest that factors such as BMI, the perceived healthiness, or the energy density of the
product may play a significant role. For example, foods that are perceived to be satiating
were chosen in larger portions, whereas in some cases foods that are perceived to be more
energy-dense were chosen in smaller portions, in line with the idea that portion size is
important for weight maintenance or even loss [
38
]. The results of this study are consistent
with the above, showing that in some cases BMI is a relevant factor in the selection of some
food groups, such as vegetables. Furthermore, it has been demonstrated that factors such as
low income and rural origin have a significant impact on disparities. However, these factors
do not attain statistical significance in the present study. In these cases, food photographs
presented in standardised portion sizes are essential for a correct estimation [41].
As shown in Table 3, a comparison of food consumption between German and Spanish
groups revealed several statistically significant differences in portion sizes for various food
items. In Germany, the average consumption of rice was (
127.43 ±60.96 g
), while in Spain
it was higher (165.42
±
83.85 g). Similarly, meat consumption was higher in the Spanish co-
hort (
202.90 ±81.65 g
) compared to the German one (175.66
±
75.77 g). Notably, Germans
had a statistically significant higher portion size for stews (
372.79 ±127.04 g
) and lasagne
(
402.66 ±89.62 g
) than Spaniards (
318.64 ±123.26 g
) and (
350.80 ±112.04 g
), respectively.
On the other hand, Spanish participants had a higher intake of legumes (
314.88 ±112.03 g
)
compared to Germans (243.48
±
105.75 g). Additionally, Germans ate significantly larger
portions of pizza (
481.39 ±174.19 g
) compared to Spaniards (
353.23 ±171.75 g
), and simi-
larly for sliced fruit (
160.14 ±48.72 g
) in Germany vs. (
176.91 ±33.36 g
) in Spain. These
differences highlight varying dietary habits between the two countries, with some foods
consumed at larger quantities in one country than in the other. These disparities may be
influenced by cultural preferences, dietary guidelines, and lifestyle factors specific to each

Nutrients 2025,17, 912 11 of 16
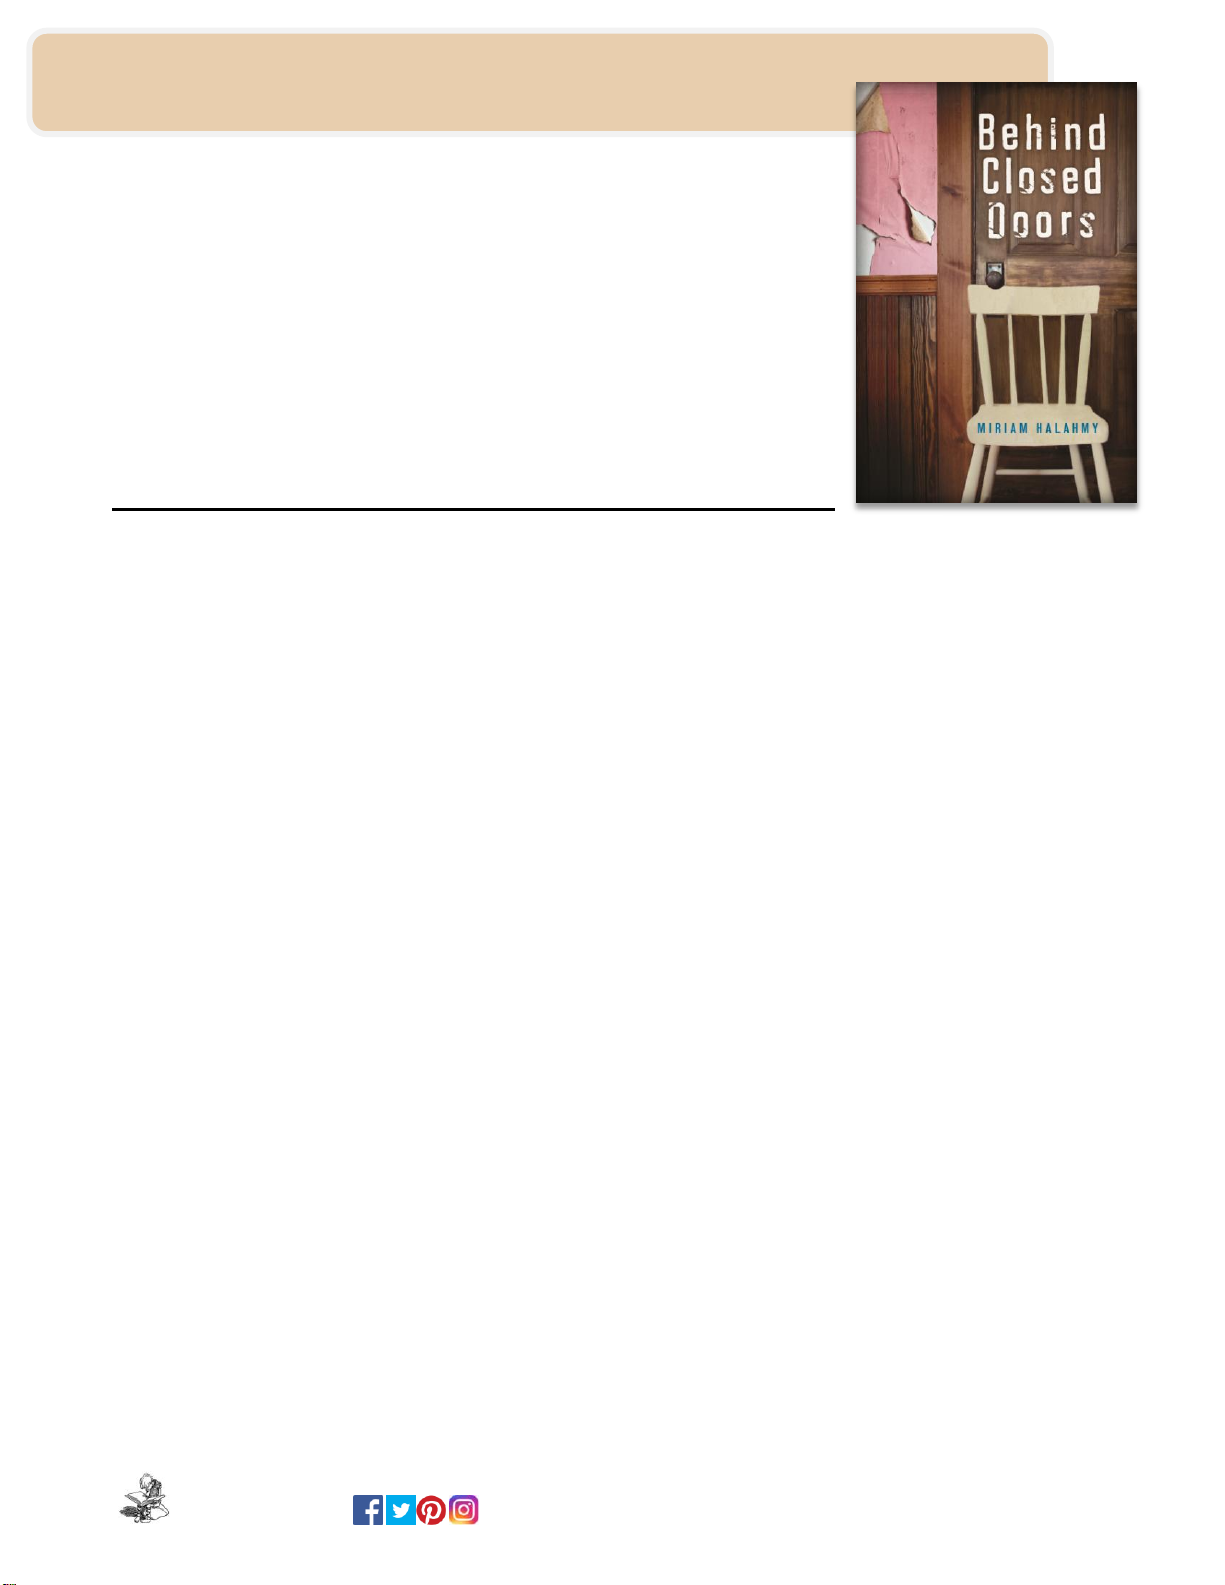
country [
42
]. Considering the differences in food choices between countries (Figure 4), the
results showed that German subjects chose larger portion sizes for dishes such as stews
and potatoes, which could be explained by their traditional food consumption [31].
Nutrients 2025, 17, x FOR PEER REVIEW 11 of 16
Figure 4. Differences in food size choices by country. Circle size is proportional to frequency. Dif-
ferences between country. ** Significant at the p < 0.05 level.
The German population also tended to consume more ultra-processed products,
which could explain why larger sizes of foods such as lasagne or pizza are chosen [43]. In
contrast, individuals in Spain tended to consume larger portions of fruits and vegetables,
which may be aributed to their adherence to a Mediterranean dietary paern [42]. Con-
sistent with other studies, the Spanish cohort exhibited significantly higher adherence to
the Mediterranean diet compared to the German participants (Figure 1) [42]. Significant
differences were observed in populations with high adherence to the Mediterranean diet
in terms of larger portion sizes for foods such as various fruits and legumes, which can be
aributed to the fact that these foods constitute the fundamental elements of the Mediter-
ranean diet [22]. In terms of dietary habits, omnivores comprise the majority of the partic-
ipants, with frequent use of spices, especially in Germany. Bread and dessert consumption
varied, with bread consumption more frequent in Spain and non-dessert consumption
more common in Germany. Water was the preferred beverage in both countries, with no-
table consumption of sparkling water in Germany. The results of this selection are indic-
ative of a cultural phenomenon and an evolution of dietary habits [31].
In general, intermediate portion sizes were the most frequently chosen, which were
designed to align with typical consumption sizes [23,27,29]. This trend was not followed
by raw vegetables, nuts, and cakes (Figure 3). This is consistent with validation studies of
the photographic atlas, where participants selected the image of the correct or adjacent
portion size [29]. This confirms that the assigned average portion sizes and images were
appropriate, except for some of the foods.
Possible explanations exist for why some groups did not follow the trend. For in-
stance, smaller portion sizes are often overestimated [29], or there is often a decrease in
portion sizes of unhealthy foods [44]. For example, this was reflected in cakes or pies,
where poor concordance results were obtained, which could justify the findings of the
present results [29]. Although some studies claim that plate size does not affect estimation,
in some cases, when the large plate size was used, subjects increased their vegetable por-
tion [38]. Furthermore, external factors have been demonstrated to exert influence over
Figure 4. Differences in food size choices by country. Circle size is proportional to frequency.
Differences between country. ** Significant at the p< 0.05 level.
The German population also tended to consume more ultra-processed products, which
could explain why larger sizes of foods such as lasagne or pizza are chosen [
43
]. In contrast,
individuals in Spain tended to consume larger portions of fruits and vegetables, which may
be attributed to their adherence to a Mediterranean dietary pattern [
42
]. Consistent with
other studies, the Spanish cohort exhibited significantly higher adherence to the Mediter-
ranean diet compared to the German participants (Figure 1) [
42
]. Significant differences
were observed in populations with high adherence to the Mediterranean diet in terms of
larger portion sizes for foods such as various fruits and legumes, which can be attributed to
the fact that these foods constitute the fundamental elements of the Mediterranean diet [
22
].
In terms of dietary habits, omnivores comprise the majority of the participants, with fre-
quent use of spices, especially in Germany. Bread and dessert consumption varied, with
bread consumption more frequent in Spain and non-dessert consumption more common in
Germany. Water was the preferred beverage in both countries, with notable consumption
of sparkling water in Germany. The results of this selection are indicative of a cultural
phenomenon and an evolution of dietary habits [31].
In general, intermediate portion sizes were the most frequently chosen, which were
designed to align with typical consumption sizes [
23
,
27
,
29
]. This trend was not followed
by raw vegetables, nuts, and cakes (Figure 3). This is consistent with validation studies
of the photographic atlas, where participants selected the image of the correct or adjacent
portion size [
29
]. This confirms that the assigned average portion sizes and images were
appropriate, except for some of the foods.
Possible explanations exist for why some groups did not follow the trend. For instance,
smaller portion sizes are often overestimated [
29
], or there is often a decrease in portion
sizes of unhealthy foods [
44
]. For example, this was reflected in cakes or pies, where
poor concordance results were obtained, which could justify the findings of the present
Nutrients 2025,17, 912 12 of 16
results [
29
]. Although some studies claim that plate size does not affect estimation, in some
cases, when the large plate size was used, subjects increased their vegetable portion [
38
].
Furthermore, external factors have been demonstrated to exert influence over the selection
and consumption of food portions. Such factors include the price-quality ratio, mindless
eating, and biases. To illustrate this point, the bias of considering a food as a unit can lead
to consuming a portion regardless of food size. Similarly, dividing food into smaller units
has been found to reduce the amount of food that people could eat [38].
In recent years, there has been a global increase in the size of food portions, particularly
in high-calorie foods. This phenomenon highlights a certain complicity on the part of the
food industry [
38
]. This trend is also visible in home-cooked meals, as evidenced by
the evolution of cookbooks and restaurant menus [
38
]. In the context of food portion
classification, the terms ‘XXL’ and ‘S’ typically refer to extra-large and small portion sizes,
respectively. In the food sector, these portion classifications are frequently employed
to standardise portion sizes and assist consumers in selecting more practical portion
sizes [
38
,
45
]. For example, in the context of fast food or restaurant meals, this is frequently
observed [
38
,
45
]. Therefore, the same methodology as used in the Vietnamese atlas was
chosen, allowing recipes to be tabulated with portion sizes for each meal: (XXS–XL). This
study involved six portions, because research has shown that using an impartial number of
portions can cause respondents to be biased towards the intermediate portion [
33
]. The
results suggest that, in general, the tendencies of each subject tend to be similar and that
people who choose large sizes will choose most products. This may help to create a tool
that provides appropriate sizes for each subject. Smaller sizes were chosen as the study
focuses on healthy nutrition and larger sizes are not recommended. Additionally, smaller
sizes could be useful for extrapolation to the child population [32,35].
4.2. Essential Features to Enhance the Usability and Accuracy of the i-Diet App
The application of new technologies has resulted in notable advancements in dietary
research, demonstrating that their efficacy is comparable or superior to that of traditional
methods [
12
]. In recent years, mobile applications have become a useful tool for recording
dietary intake. Speak4Diet is an example of such an application, which uses artificial intelli-
gence to analyse and track dietary habits. However, mobile app-based dietary monitoring
and recommendations have limitations. Users may find it tedious and adherence might be
low [
11
]. Considering food preferences in a personalised nutrition app becomes essential.
The study’s findings will contribute to the development of modules and tools designed
to enhance the user experience in terms of personalisation, with a particular emphasis on
portion size.
Based on the results obtained, being able to choose the bread and beverage consump-
tion and choice separately on the menu proposed by the i-Diet app could help increase
dietary adherence [
20
]. The same could be applied to the choice of one or more dishes, or
the decision to eat a dessert or not. Depending on the country or other factors, the decisions
may vary, so offering free choice to the user will play a key role in the use of a personalised
nutrition app, contributing to the user’s empowerment and autonomy [
46
]. In the culinary
context, spices have been observed to be utilised in a variety of ways, suggesting a potential
for their incorporation into novel culinary preparations. However, it should be noted that
recipes are typically predetermined, thereby diminishing their relevance in relation to other
variables in the context of a more precise personalisation. Therefore, specific modules or
shortcuts were incorporated into the app to take into account user behaviour and offer a
more personalised experience.
Considering allergies and intolerances is critical due to their potential adverse ef-
fects; thus, in addition to the commonly reported allergens, an “allergies” category was
Nutrients 2025,17, 912 13 of 16
also added to i-Diet to allow the user to exclude other foods from the menu generation
process [
20
]. In view of the findings, it is recommended that specific categories, such as
additives, LTP, or further well-known, controversially discussed compounds, be introduced
to facilitate the process for users.
The Mediterranean diet was proposed as a basis due to its health properties and the
results obtained. Usually, Spanish people have a higher adherence to the Mediterranean
diet, but in Germany there were people who used olive oil frequently and adopted certain
Mediterranean eating habits. Consequently, the application was developed on the basis
of this fundamental dietary model, proposing culinary creations that would enhance
adherence to the Mediterranean diet while preserving the distinct characteristics of the
country in which the application is implemented.
The study results allowed for a comparison with estimated typical food consumption
and provided a more precise average range for classifying portion sizes for each subject.
The study results showed that some food groups, such as cakes, vegetables, and nuts, did
not meet the expected average portion sizes. Additionally, in some groups, there were
clear differences between countries, ages, and genders. In fact, the simple indication of
portion sizes, widely used in other food concepts, showed positive results and the use
of XXS–XL sizes now consolidated in the i-Diet app [
20
]. This information will help to
minimise portion size issues associated with the use of the app. Furthermore, the results
facilitated the integration of a module into the project’s app, enabling subjects to select their
portion size range (from S to XL, including food photographs from the previously validated
photographic food atlas) more quickly and accurately. This should help to improve future
dietary recommendations based on these portion size ranges.
4.3. Study Limitations
The present study is subject to some limitations that must be taken into consideration.
Firstly, the sample, although composed of 224 participants, is not designed to establish
generalisations about the findings for both countries; rather, it is intended to be used
as a starting point for the development of more precise nutrition strategies. Secondly,
despite efforts to make the population groups as homogeneous as possible, it only collected
responses from a limited group of people, and there are demographic differences between
the two groups, with the Spanish sample having an average age that is notably younger.
Furthermore, it is important to note that additional factors, such as physiological status
and economic viability, may also influence dietary intake and portion sizes. However,
the present study is specifically focused on the influence of geographic location, gender,
age, and weight on dietary habits. The employment of an online questionnaire, though
widely utilised and validated, is susceptible to self-report bias. The visual perception of
food portions is subject to variation, and the methodology provides only an instantaneous
assessment of eating habits, lacking longitudinal follow-up.
5. Conclusions
Significant differences in dietary behaviour and portion size selection between the stud-
ied populations of Spain and Germany were observed. The Spanish cohort was younger
and showed a higher incidence of other intolerances, whereas the German cohort had a
higher employment rate and more married individuals. In both countries, most people
were omnivores, although bread and dessert consumption were more common in Spanish
participants. The Mediterranean diet was mostly followed in the Spanish group, reflecting
cultural differences in eating habits. The body mass index (BMI) was slightly higher in Ger-
mans, although it was within normal ranges. Portion size comparisons revealed significant
differences in the consumption of various foods between the two countries. The Spanish
Nutrients 2025,17, 912 14 of 16
participants consumed more rice, meat, and legumes, while Germans had larger portions
of stews, lasagne, and pizza. These differences highlight distinct dietary habits influenced
by cultural preferences and dietary guidelines. The findings of this study demonstrate the
potential for the development of personalised nutrition apps that take into account user
preferences, with the objective of increasing dietary adherence. Consequently, this will
facilitate more accurate dietary recommendations and improve health outcomes. The study
provided detailed information on the dietary habits and preferences of the adult population
in Spain and Germany, which has enabled the optimisation of the i-Diet app. The findings
of this study have enabled the i-Diet app to offer users greater choice and empower them
in their decision-making processes, thereby facilitating improved adherence to the dietary
recommendations set out in the project’s intervention study. Therefore, this methodology
could be useful in a general context, reflecting the diversity of people who could use a
personalised nutrition app.
Author Contributions: Conceptualization, S.R. and J.Á.R.-H.; methodology, B.N.-P., S.P., A.D.-O.
and J.J.Q.-G.; software, D.H.-N.; validation, D.H.-N., B.N.-P. and J.J.Q.-G.; formal analysis,
D.H.-N
.
and Á.T.-M.; investigation, D.H.-N., B.N.-P., S.P., A.D.-O.,
Á.T.-M.
and J.Á.R.-H.; data curation,
Á.T.-M.
and J.J.Q.-G.; writing—original draft preparation, D.H.-N.; writing—review and editing,
S.R., J.Á.R.-H.
and J.J.Q.-G.; visualisation, J.Á.R.-H.; supervision, J.J.Q.-G.; project administration,
J.Á.R.-H.; funding acquisition, J.Á.R.-H. All authors have read and agreed to the published version of
the manuscript.
Funding: This research was funded by the European Research Commission (Research Executive Agency)
under the research project Stance4Health (Grant Contract No. 816303) to José Á. Rufián-Henares.
Institutional Review Board Statement: The study was conducted according to the guidelines of the
Declaration of Helsinki and approved in Spain by the Ethics Committee of the University of Granada
(Date 10 June 2020, Decision number 1080/CEIH/2020).
Informed Consent Statement: Informed consent was obtained from all subjects involved in the study.
Data Availability Statement: Data are available on request.
Acknowledgments: This work will be a part of the doctoral thesis of Daniel Hinojosa-Nogueira
conducted within the context of the ‘Program of Nutrition and Food Sciences’ at the University
of Granada.
Conflicts of Interest: The authors declare no conflicts of interest.
References
1.
Gracia-Arnaiz, M. Eating Issues in a Time of Crisis: Re-Thinking the New Food Trends and Challenges in Spain. Trends Food Sci.
Technol. 2021,116, 1179–1185. [CrossRef]
2.
Bradley, J.; Rowland, M.K.; Matthews, J.N.S.; Adamson, A.J.; Spence, S. A Comparison of Food Portion Size Estimation Methods
among 11–12 Year Olds: 3D Food Models vs. an Online Tool Using Food Portion Photos (Intake24). BMC Nutr. 2021,7, 10.
[CrossRef] [PubMed]
3.
Lillford, P.; Hermansson, A.-M. Global Missions and the Critical Needs of Food Science and Technology. Trends Food Sci. Technol.
2021,111, 800–811. [CrossRef]
4.
Ververis, E.; Ackerl, R.; Azzollini, D.; Colombo, P.A.; de Sesmaisons, A.; Dumas, C.; Fernandez-Dumont, A.; da Costa, L.F.;
Germini, A.; Goumperis, T. Novel Foods in the European Union: Scientific Requirements and Challenges of the Risk Assessment
Process by the European Food Safety Authority. Food Res. Int. 2020,137, 109515. [CrossRef]
5.
Alabduljabbar, S.; Zaidan, S.A.; Lakshmanan, A.P.; Terranegra, A. Personalized Nutrition Approach in Pregnancy and Early Life
to Tackle Childhood and Adult Non-Communicable Diseases. Life 2021,11, 467. [CrossRef]
6. Torres, N.; Tovar, A.R. The Present and Future of Personalized Nutrition. Rev. Investig. Clín. 2021,73, 321–325. [CrossRef]
7.
Sempionatto, J.R.; Montiel, V.R.-V.; Vargas, E.; Teymourian, H.; Wang, J. Wearable and Mobile Sensors for Personalized Nutrition.
ACS Sens. 2021,6, 1745–1760. [CrossRef]
Nutrients 2025,17, 912 15 of 16
8.
Conrad, J.; Koch, S.A.; Nöthlings, U. New Approaches in Assessing Food Intake in Epidemiology. Curr. Opin. Clin. Nutr. Metab.
Care 2018,21, 343–351. [CrossRef]
9.
Bailey, R.L. Overview of Dietary Assessment Methods for Measuring Intakes of Foods, Beverages, and Dietary Supplements in
Research Studies. Curr. Opin. Biotechnol. 2021,70, 91–96. [CrossRef]
10.
Vasiloglou, M.F.; Christodoulidis, S.; Reber, E.; Stathopoulou, T.; Lu, Y.; Stanga, Z.; Mougiakakou, S. Perspectives and Preferences
of Adult Smartphone Users Regarding Nutrition and Diet Apps: Web-Based Survey Study. JMIR MHealth UHealth 2021,9, e27885.
[CrossRef]
11. Suryadevara, C.K. Revolutionizing Dietary Monitoring: A Comprehensive Analysis of the Innovative Mobile App for Tracking
Dietary Composition. Int. J. Innov. Eng. Res. Technol. 2023,10, 9.
12. Cunha, C.A.S.; Duarte, R.P. Multi-Device Nutrition Control. Sensors 2022,22, 2617. [CrossRef] [PubMed]
13.
Kusuma, J.D.; Yang, H.-L.; Yang, Y.-L.; Chen, Z.-F.; Shiao, S.-Y.P.K. Validating Accuracy of a Mobile Application against Food
Frequency Questionnaire on Key Nutrients with Modern Diets for mHealth Era. Nutrients 2022,14, 537. [CrossRef] [PubMed]
14.
Yuan, D.; Hu, X.; Zhang, H.; Jia, W.; Mao, Z.-H.; Sun, M. An Automatic Electronic Instrument for Accurate Measurements of Food
Volume and Density. Public Health Nutr. 2021,24, 1248–1255. [CrossRef]
15.
Shinozaki, N.; Murakami, K.; Asakura, K.; Masayasu, S.; Sasaki, S. Development of a Digital Photographic Food Atlas as a Portion
Size Estimation Aid in Japan. Nutrients 2022,14, 2218. [CrossRef]
16.
Villena-esponera, M.P.; Moreno-rojas, R.; Mateos-marcos, S.; Salazar-donoso, M.V.; Molina-Recio, G. Validation of a Photographic
Atlas of Food Portions Designed as a Tool to Visually Estimate Food Amounts in Ecuador. Nutr. Hosp. 2018,36, 363–371.
[CrossRef]
17. Al Marzooqi, H.M.; Burke, S.J.; Al Ghazali, M.R.; Duffy, E.; Yousuf, M.H.S.A. The Development of a Food Atlas of Portion Sizes
for the United Arab Emirates. J. Food Compos. Anal. 2015,43, 140–148. [CrossRef]
18.
Chapman, S.; Rawcliffe, A.; Smith, L.; Izard, R.; Roberts, J. Evaluation of the Current Methods Used for Assessing Dietary Intake
in Military Research Settings: A Scoping Review. BMJ Mil. Health 2021,167, 126–130. [CrossRef]
19.
Dello Russo, M.; Russo, P.; Rufián-Henares, J.Á.; Hinojosa-Nogueira, D.; Pérez-Burillo, S.; de la Cueva, S.P.; Rohn, S.; Fatouros, A.;
Douros, K.; González-Vigil, V. The Stance4Health Project: Evaluating a Smart Personalised Nutrition Service for Gut Microbiota
Modulation in Normal-and Overweight Adults and Children with Obesity, Gluten-Related Disorders or Allergy/Intolerance to
Cow’s Milk. Foods 2022,11, 1480. [CrossRef]
20.
Hinojosa-Nogueira, D.; Ortiz-Viso, B.; Navajas-Porras, B.; Pérez-Burillo, S.; González-Vigil, V.; de la Cueva, S.P.; Rufián-Henares,
J.Á. Stance4Health Nutritional APP: A Path to Personalized Smart Nutrition. Nutrients 2023,15, 276. [CrossRef]
21.
Remiro-Azócar, A.; Heath, A.; Baio, G. Methods for Population Adjustment with Limited Access to Individual Patient Data: A
Review and Simulation Study. Res. Synth. Methods 2021,12, 750–775. [CrossRef]
22.
Jiménez Lorente, C.P.; Pineda Morales, J.; Lama Herrera, C.; Rodríguez Martínez, P.; Escudero Uribe, M.L.; Melo Salor, J.A.;
Arrabal Martín, A.; Cravioto Manrique, I.; Muñoz Alonso, A.; Hernández Cubero, P. Recomendaciones Sobre Hábitos Saludables En
Atención Primaria: Modelo de Atención Para Promover La Actividad Física y La Alimentación Equilibrada En El Sistema Sanitario Público
de Andalucía; Junta de Andalucia: Sevilla, Spain, 2020.
23.
Safefood. Consumer Understanding of Food Portion Sizes; Safefood: Little Island, Ireland, 2014; ISBN 978-1-905767-46-5. Available
online: https://www.safefood.net/admin/getmedia/fe9482e5-1108-44d4-9f50-0361eae38931/portion-size-report_final201114.
aspx?ext=.pdf (accessed on 19 January 2025).
24.
Benhammou, S.; Heras-González, L.; Ibáñez-Peinado, D.; Barceló, C.; Hamdan, M.; Rivas, A.; Mariscal-Arcas, M.; Olea-Serrano,
F.; Monteagudo, C. Comparison of Mediterranean Diet Compliance between European and Non-European Populations in the
Mediterranean Basin. Appetite 2016,107, 521–526. [CrossRef]
25.
Haftenberger, M.; Heuer, T.; Heidemann, C.; Kube, F.; Krems, C.; Mensink, G.B. Relative Validation of a Food Frequency
Questionnaire for National Health and Nutrition Monitoring. Nutr. J. 2010,9, 36. [CrossRef] [PubMed]
26.
Keller, K.; Rodríguez López, S.; Carmenate Moreno, M.M.; Acevedo Cantero, P. Associations between Food Consumption Habits
with Meal Intake Behaviour in Spanish Adults. Appetite 2014,83, 63–68. [CrossRef]
27.
Lyons, J.; Giltinan, M. The Irish Food Portion Sizes Database; Irish Universities Nutrition Alliance at University College Cork:
Cork, Ireland, 2013.
28.
Probst, Y.; Jones, H.; Sampson, G.; Smith, K. Development of Australian Portion Size Photographs to Enhance Self-administered
Online Dietary Assessments for Adults. Nutr. Diet. 2010,67, 275–280. [CrossRef]
29.
Salvesen, L.; Engeset, D.; Øverby, N.C.; Medin, A.C. Development and Evaluation of Image-Series for Portion Size Estimation in
Dietary Assessment among Adults. J. Nutr. Sci. 2021,10, e3. [CrossRef]
30.
Staudigel, M.; Brandl, B.; Roosen, J.; Kiesswetter, E.; Siebentritt, H.M.; Wawro, N.; Linseisen, J.; Skurk, T.; Volkert, D.; Hauner,
H. Association of Eating Motives with Anthropometry, Body Composition, and Dietary Intake in Healthy German Adults.
Appetite 2022,170, 105865. [CrossRef]
31. Weichselbaum, E.; Benelam, B.; Soares Costa, H. Traditional Foods in Europe; EuroFIR: Brussels, Belgium, 2009.
Nutrients 2025,17, 912 16 of 16
32.
Foster, E.; Hawkins, A.; Barton, K.L.; Stamp, E.; Matthews, J.N.S.; Adamson, A.J. Development of Food Photographs for Use
with Children Aged 18 Months to 16 Years: Comparison against Weighed Food Diaries—The Young Person’s Food Atlas (UK).
PLoS ONE 2017,12, e0169084. [CrossRef]
33.
Folson, G.; Bannerman, B.; Ador, G.; Atadze, V.; Akoto, S.; Asante, S.; Abbeyquaye, J.; Anang-Tetteh, A.; Guri, E.; Ibrahim, G.;
et al. A Photographic Food Atlas with Portion Sizes of Commonly Consumed Foods in Accra, Ghana; International Food Policy Research
Institute: Washington, DC, USA, 2022.
34.
Nelson, M.; Haraldsdóttir, J. Food Photographs: Practical Guidelines II. Development and Use of Photographic Atlases for
Assessing Food Portion Size. Public Health Nutr. 1998,1, 231–237. [CrossRef] [PubMed]
35.
Walsh, H. Development of a Photographic Food Atlas to Support Food Portion Estimation Among Children and Adolescents
Aged 9–14 Years in Nairobi, Kenya. Master’s Thesis, University of Helsinki, Helsinki, Finland, 2020.
36.
Nguyen, P.H.; Tran, L.M.; Hoang, N.T.; Trương, D.T.; Tran, T.H.; Huynh, P.N.; Koch, B.; McCloskey, P.; Gangupantulu, R.; Hughes,
D.; et al. A Photographic Food Atlas with Portion Sizes of Commonly Consumed Foods in Thai Nguyen, Viet Nam; International Food
Policy Research Institute: Washington, DC, USA, 2021.
37.
Jalil, A.J.; Tasoff, J.; Bustamante, A.V. Eating to Save the Planet: Evidence from a Randomized Controlled Trial Using Individual-
Level Food Purchase Data. Food Policy 2020,95, 101950. [CrossRef]
38.
Steenhuis, I.; Poelman, M. Portion Size: Latest Developments and Interventions. Curr. Obes. Rep. 2017,6, 10–17. [CrossRef]
[PubMed]
39.
Timon, C.M.; Cooper, S.E.; Barker, M.E.; Astell, A.J.; Adlam, T.; Hwang, F.; Williams, E.A. A Comparison of Food Portion Size
Estimation by Older Adults, Young Adults and Nutritionists. J. Nutr. Health Aging 2018,22, 230–236. [CrossRef]
40.
Lauria, F.; Dello Russo, M.; Formisano, A.; De Henauw, S.; Hebestreit, A.; Hunsberger, M.; Krogh, V.; Intemann, T.; Lissner, L.;
Molnar, D.; et al. Ultra-Processed Foods Consumption and Diet Quality of European Children, Adolescents and Adults: Results
from the I.Family Study. Nutr. Metab. Cardiovasc. Dis. 2021,31, 3031–3043. [CrossRef]
41.
Lazarte, C.E.; Encinas, M.E.; Alegre, C.; Granfeldt, Y. Validation of Digital Photographs, as a Tool in 24-h Recall, for the
Improvement of Dietary Assessment among Rural Populations in Developing Countries. Nutr. J. 2012,11, 61. [CrossRef]
42.
Grams, L.; Nelius, A.-K.; Pastor, G.G.; Sillero-Quintana, M.; Veiga, Ó.L.; Homeyer, D.; Kück, M. Comparison of Adherence to
Mediterranean Diet between Spanish and German School-Children and Influence of Gender, Overweight, and Physical Activity.
Nutrients 2022,14, 4697. [CrossRef] [PubMed]
43.
Mertens, E.; Colizzi, C.; Peñalvo, J.L. Ultra-Processed Food Consumption in Adults across Europe. Eur. J. Nutr. 2022,61, 1521–1539.
[CrossRef]
44.
Westenbrink, S.; Van Der Vossen-Wijmenga, W.; Toxopeus, I.; Milder, I.; Ocké, M. LEDA, the Branded Food Database in the
Netherlands: Data Challenges and Opportunities. J. Food Compos. Anal. 2021,102, 104044. [CrossRef]
45. He, J.; Mao, R.; Shao, Z.; Wright, J.L.; Kerr, D.A.; Boushey, C.J.; Zhu, F. An End-to-End Food Image Analysis System. arXiv 2021,
arXiv:2102.00645. [CrossRef]
46.
Jakob, R.; Harperink, S.; Rudolf, A.M.; Fleisch, E.; Haug, S.; Mair, J.L.; Salamanca-Sanabria, A.; Kowatsch, T. Factors Influencing
Adherence to mHealth Apps for Prevention or Management of Noncommunicable Diseases: Systematic Review. J. Med. Internet
Res. 2022,24, e35371. [CrossRef]
Disclaimer/Publisher’s Note: The statements, opinions and data contained in all publications are solely those of the individual
author(s) and contributor(s) and not of MDPI and/or the editor(s). MDPI and/or the editor(s) disclaim responsibility for any injury to
people or property resulting from any ideas, methods, instructions or products referred to in the content.