Netflix (NFLX US) Entering the AVOD space PDF Free Download
1 / 37/37
100%

CMB International Global Markets | Equity Research | Initiation
PLEASE READ THE ANALYST CERTIFICATION AND IMPORTANT DISCLOSURES ON LAST PAGE
MORE REPORTS FROM BLOOMBERG: RESP CMBR <GO> AND http://www.cmbi.com.hk
Global Entertainment Sector
Sophie Huang
(852) 3900 0889
sophiehuang@cmbi.com.hk
Eason Xu
(852) 3900 0849
easonxu@cmbi.com.hk
Stock Data
Mkt Cap (US$ mn)
179,996
Avg 3 mths t/o (US$ mn)
2,340
52w High/Low (US$)
485/ 252
Total Issued Shares (mn)
438
Source: Bloomberg
Shareholding Structure
Capital Group
9.22%
Vanguard
8.27%
BlackRock
6.84%
Source: Bloomberg
Share Performance
Absolute
Relative
1-mth
6.9%
10.6%
3-mth
-3.8%
6.1%
6-mth
27.5%
17.3%
Source: Bloomberg
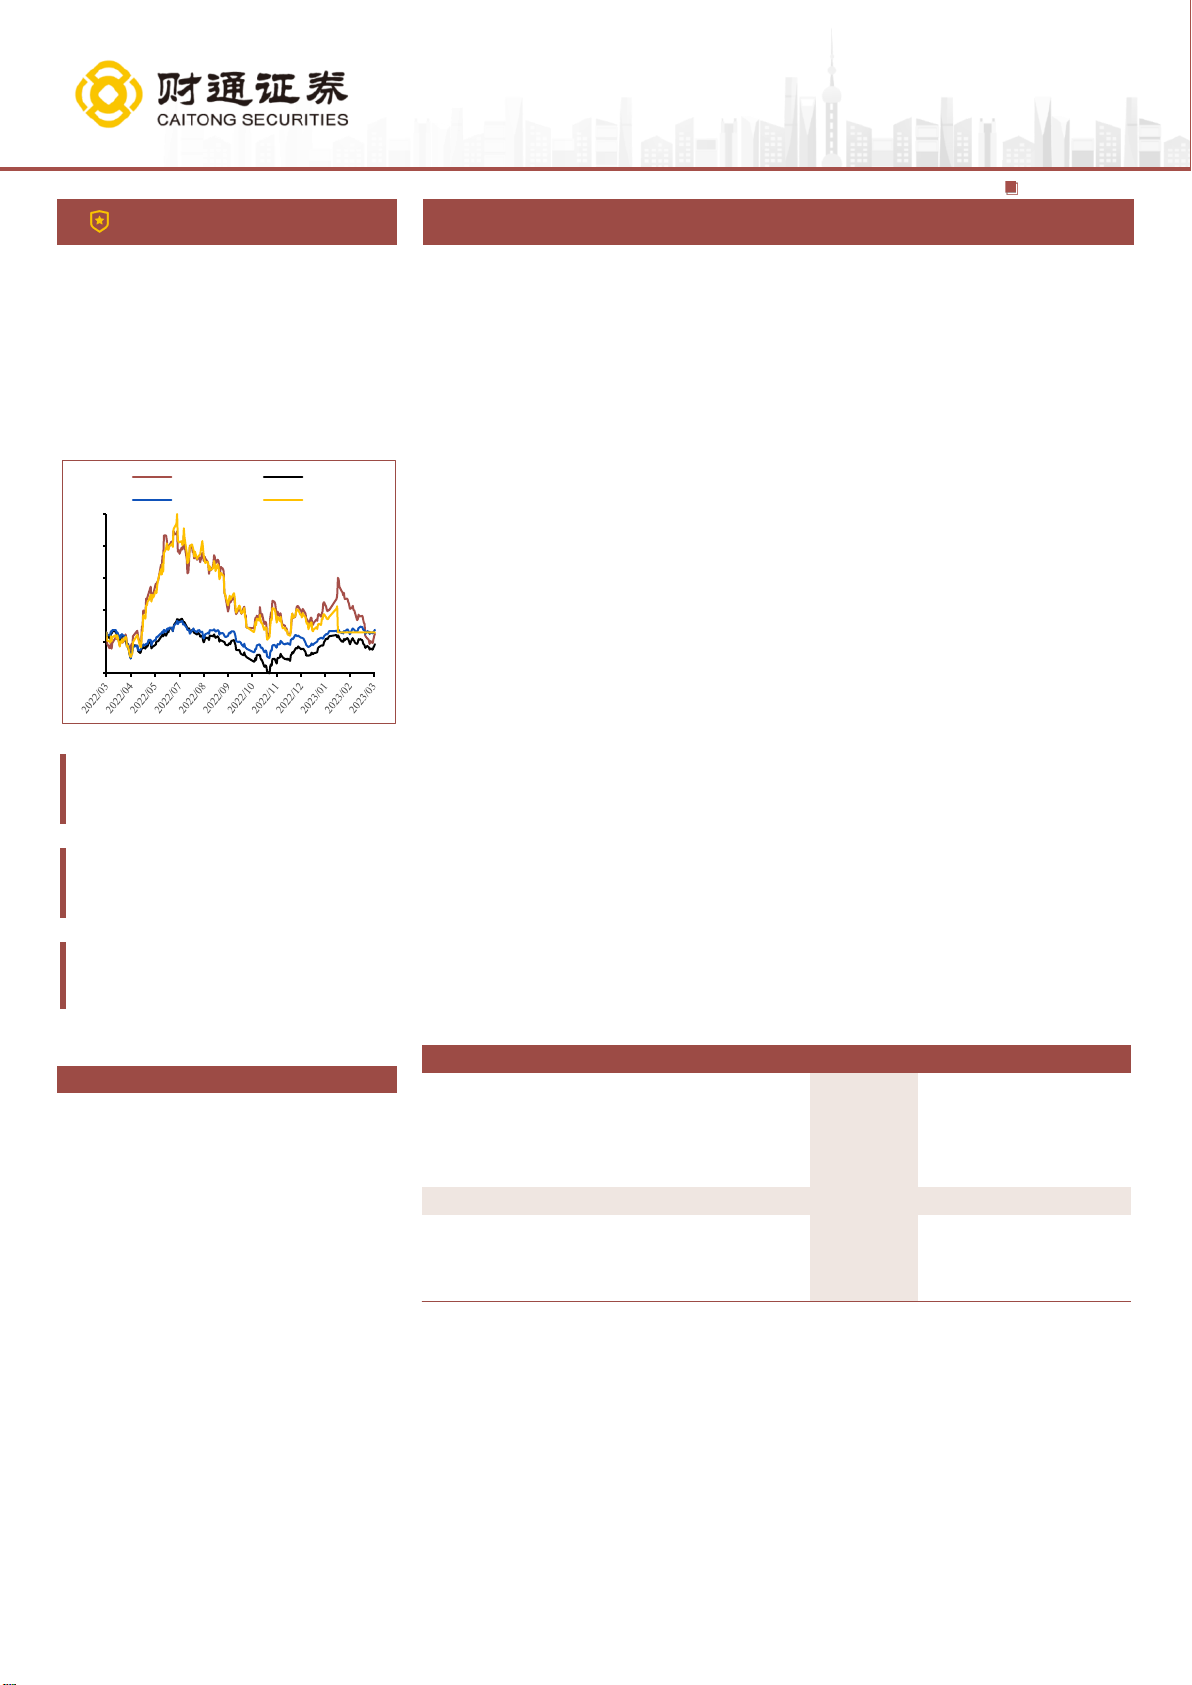
12-mth Price Performance
Source: Bloomberg
Auditor: ERNST & YOUNG LLP
20
70
120
170
220
270
320
370
420
470
520
Oct-22 Jan-23 Apr-23 Jul-23
NFLX US CCMP (rebased)
(US$)
3 Nov 2023
BUY (Initiation)
Target Price US$512
Up/Downside +20.6%
Current Price US$424.7
1
We remain positive on Netflix’s long-term subs trend, AVOD expansion, paid-
sharing rollout and margin expansion, backed by its vibrant original content
pipeline and efficient investment. After its better-than-feared 3Q23, Netflix
demonstrated strong net adds, resilient margin guidance (22%-23% OPM in
FY24E, +2~3ppts YoY) and increasing FCF (guiding US$6.5bn), partly alleviating
market concerns about content spending and competition. Looking ahead, we
forecast Netflix to deliver 11%/24% rev/earnings CAGR during FY23-25E, with
7.6% subs CAGR (driven by international market expansion, AVODs and paid-
sharing penetration). With competition to pull back and strikes to settle, we think
it is a good time to accumulate the stock. Initiate with BUY with TP at US$512.
Global streaming leader on clear growth trajectory. Netflix is a global
leading online video platform, with 247mn subs in >190 countries (by 3Q23).
Backed by its sizable subs, vibrant original content and exclusive IP reserve,
we forecast Netflix to deliver 24% earnings CAGR in FY23-25E.
Leveraging original content edge for share gains and price hikes. Netflix
prides itself on exclusive high-quality original content (e.g. suspense &
survival categories), backed by stepped-up investment and rational industrial
production system with top-tier studios and producers. Such content edge
enhances its leadership and supports its continuous price hike (seven times
in 2011-23, forecasting ARM at 3.4% CAGR in FY23-25E). With competition
to pull back and strikes to settle, we expect its share gain to continue.
Bearing fruit from AVOD expansion and paid-sharing initiatives. We are
bullish on Netflix’s AVOD expansion, and expect positive impact on both net
adds and ARPU. With a lower-priced package, AVOD can help Netflix spread
its global reach and tap into price-sensitive users (forecasting TAM of 380mn
subs worldwide). Netflix has signed up >5mn ad-supported subs in May 2023,
and the US “Standard with Ads” Plan accounted for 30% of new sign-ups in
Sep 2023. Looking ahead, we expect Netflix’s AVOD subs to rise to 32mn in
FY25E (11% subs mix), at 51% CAGR. Moreover, we expect paid-sharing
initiatives (launched on 23 May) to transfer more users into add-on subs
(>100mn password-sharing users in Netflix). We forecast ~30mn extra subs
from paid initiatives by 2025E (6% rev mix), implying ~30% conversion rate.
Initiate with BUY. We set our DCF-based TP at US$512 (implying 33x FY24E
P/E), 15% below historical multiple but largely above industry average. Key
catalysts: 1) Content pipeline to pick up after strikes; 2) resilient net adds; and
3) higher UE and ARPU ahead to drive margin improvement.
Earnings Summary
(YE 31 Dec)
FY21A
FY22A
FY23E
FY24E
FY25E
Revenue (US$ mn)
29,698
31,616
33,580
37,981
41,488
YoY change (%)
19%
6%
6%
13%
9%
Adj. net income (US$)
5,116
4,492
5,397
6,825
8,351
Adj. EPS (US$)
11.24
9.94
12.00
15.45
19.15
YoY growth (%)
NA
NA
21%
29%
24%
Consensus EPS (US$)
NA
NA
12.22
15.96
19.41
P/E (x)
NA
NA
34.3
26.7
21.5
P/S (x)
NA
NA
5.4
4.7
4.3
ROE (%)
38.02
24.53
25.00
27.84
28.27
Source: Company data, Bloomberg, CMBIGM estimates
Netflix (NFLX US)
Entering the AVOD space

3 Nov 2023
PLEASE READ THE ANALYST CERTIFICATION AND IMPORTANT DISCLOSURES ON LAST PAG
2
Table of contents
Focus Charts ............................................................................................ 3
Company Overview .................................................................................. 4
A global streaming leader to embrace full scream era........................................ 4
High barrier with high-quality content library...................................................... 6
Diversifying monetization: from subs to ads....................................................... 7
Clear margin expansion with enhancing scale and effective investment .......... 9
Investment Summary ............................................................................. 10
Competition to pull back, with growing streaming tailwinds ............................ 10
Vibrant original content to strengthen leadership and price hikes .................. 14
Riding on AVOD expansion ................................................................................ 21
Paid sharing initiatives to unlock membership upside ..................................... 24
Financial Analysis .................................................................................. 26
Revenue Breakdown ........................................................................................... 26
Income Statement ............................................................................................... 28
Balance Sheet ..................................................................................................... 30
Cash Flow and Working Capital ......................................................................... 31
Valuation ................................................................................................. 32
Financial Summary ................................................................................ 36

3 Nov 2023
PLEASE READ THE ANALYST CERTIFICATION AND IMPORTANT DISCLOSURES ON LAST PAGE.
3
Focus Charts
Figure 1: Revenue estimates
Source: Company data, CMBIGM estimates
Figure 2: Subs growth estimates by region
Source: Company data, CMBIGM estimates
Note: UCAN – the US and Canada
Figure 3: ARM estimates
Source: Company data, CMBIGM estimates
Note: ARM – average revenue per membership
Figure 4: Revenue mix by region in FY23E
Source: Company data, CMBIGM estimates
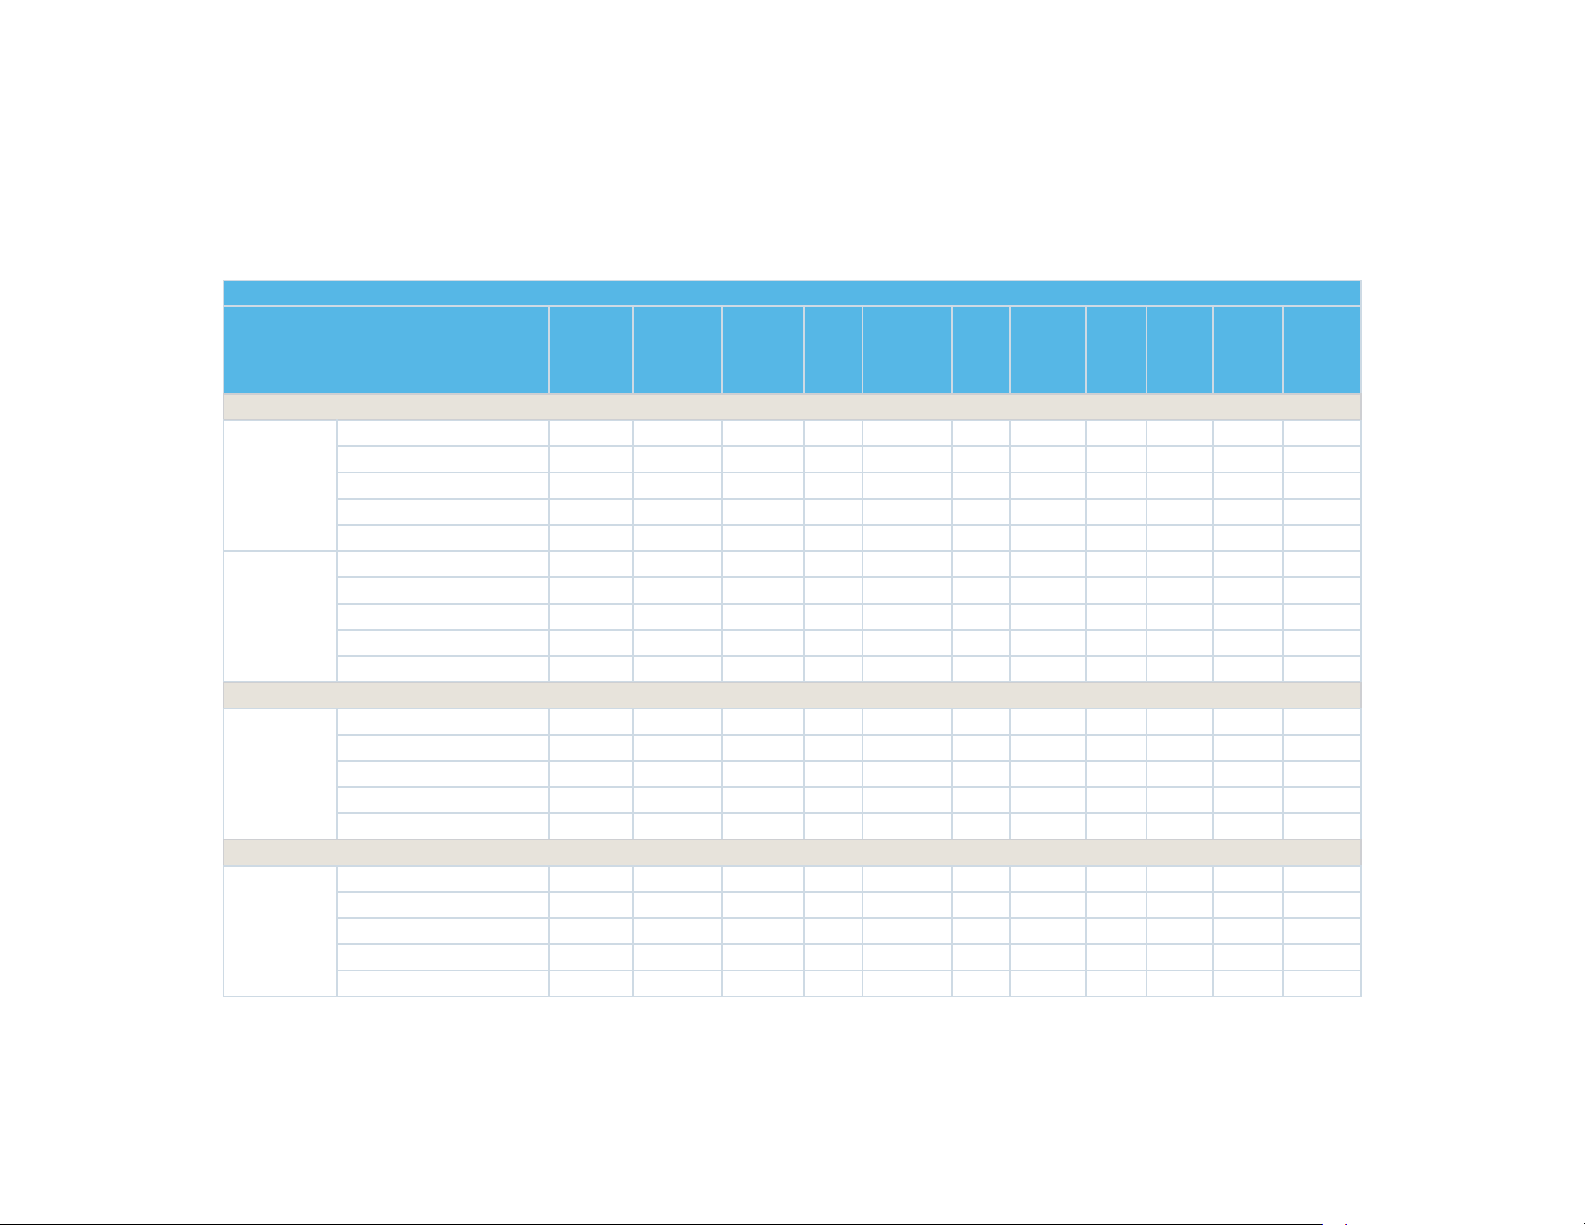
Figure 5: Revenue estimates for ad-supported tier plan
Source: Company data, CMBIGM estimates
0%
5%
10%
15%
20%
25%
-
5,000
10,000
15,000
20,000
25,000
30,000
35,000
40,000
45,000
2021 2022 2023E 2024E 2025E
US$mn
Streaming Rev YoY
-5%
0%
5%
10%
15%
20%
25%
30%
35%
2021 2022 2023E 2024E 2025E
UCAN EMEA
Latin America APAC (ex-China)
Total subs
-2%
-1%
0%
1%
2%
3%
4%
5%
6%
7%
11.00
11.20
11.40
11.60
11.80
12.00
12.20
12.40
12.60
2021 2022 2023E 2024E 2025E
US$
ARM YoY
UCAN
32%
EMEA
33%
Latin America
18%
APAC (ex-
China)
17%
US$ mn 1Q23E 2Q23E 3Q23E 4Q23E 1Q24E 2Q24E 3Q24E 4Q24E 2023E 2024E 2025E 2026E
Paid Ending Subs (mn) 1.2 6.0 10.2 14.2 16.0 17.9 20.4 23.4 14.2 23.4 32.4 40.4
QoQ Growth 400% 70% 39% 13% 12% 14% 15%
YoY Growth 1233% 198% 100% 65% 65% 38% 25%
% mix 1% 3% 4% 6% 6% 7% 8% 9% 6% 9% 11% 13%
Average Paid Subs (mn) 3.6 8.1 12.2 15.1 17.0 19.2 21.9 7.9 19.4 27.9 36.4
Net Adds (mn) 4.8 4.2 4.0 1.8 1.9 2.5 3.0 13.0 9.2 9.0 8.0
QoQ Growth -13% -5% -55% 6% 32% 20%
YoY Growth -60% -40% -25% -29% -2% -11%
% mix 81% 48% 43% 50% 70% 55% 57% 50% 57% 62% 60%
ARPU (US$) 15 15 15 15 15.3 15.3 15.3 15.3 15 15.3 15.6 15.9
YoY Growth 2% 2% 2% 2% 2% 2% 2%
Ad-supported tier rev 162 365 549 693 778 879 1,005 1,076 3,355 5,225 6,953
QoQ Growth 125% 51% 26% 12% 13% 14%
YoY Growth 380% 141% 83% 212% 56% 33%
% mix 2% 4% 6% 7% 8% 9% 10% 3% 9% 13% 15%

3 Nov 2023
PLEASE READ THE ANALYST CERTIFICATION AND IMPORTANT DISCLOSURES ON LAST PAGE.
4
Company Overview
A global streaming leader to embrace full scream era
A video streaming pioneer on the upward trajectory
Netflix is the global leader in subscription video-on-demand over-the-top streaming service,
with 247mn paid subs in more than 190 countries (by 3Q23). Founded in 1997, it started
its business with DVD-by-mail service, and then distributed films and television series from
various genres in multiple languages. By 2022, original productions accounted for half of
Netflix's library in the US. Other than that, Netflix had ventured into other categories, such
as online ads and video game publishing.
Figure 6: Rank of streaming services by subs (by 3Q23)
Source: Company data, Flix Patrol, CMBIGM
Figure 7: Share changes among streaming platforms
Source: Nielsen (by viewing), CMBIGM
Figure 8: Share of streaming platforms in terms of
viewing (in Sep 2023)
Source: Nielsen, CMBIGM
Successful transition into streaming giant, with ramp-up of subs
Phase One (1997-2006): Starting from DVD-rental model. In the late 1990s, DVD rental
was the core business for home-video. Compared to traditional players (e.g. Blockbuster),
Netflix adopted the "online ordering + offline delivering + subscription-based" model,
improving from the offline rentals with late fees. Netflix had accumulated over 4mn paying
users by 2015 and gained share from peers for its innovative mode.
Phase Two (2007-2010): Successful transition into streaming media. In Feb 2007,
Netflix officially launched its online video-on-demand service, after YouTube’s popularity.
Its paying subs climbed up to 20mn in 2020, making it the top 1 streaming provider in the
US, backed by deep cooperation with diverse channels (e.g. PCs, mobile devices). In 2011,
it separated the DVD business from streaming business.
247
0
50
100
150
200
250
300
Netflix Amazon Prime Disney+ Tencent Video IQIYI HBO Max Paramount+ Hulu
mn
0%
5%
10%
15%
20%
25%
30%
35%
40%
Sep-22 Nov-22 Jan-23 Mar-23 May-23 Jul-23 Sep-23
Paramount+ Roku Channel Tubi
Pluto Peacock Max
Disney+ Amazon Hulu
7.8%
9.0%
3.6%
3.6%
1.9%
1.2%
Other streamings
Netflix
YouTube
Hulu
Amazon
Disney+
Max
Peacock
Pluto
Tubi

3 Nov 2023
PLEASE READ THE ANALYST CERTIFICATION AND IMPORTANT DISCLOSURES ON LAST PAGE.
5
Phase Three (2010-2020): Overseas expansion with original content and price
increases. Netflix kicked off global expansion in Sep 2010 by entering Canada, followed
by Latin America, Europe, Australia, and Asia in the ensuing six years. By 2016, it had
covered 150 countries, with overseas subs up to 57.8mn in 2017 (surpassing domestic
subs of 52.8mn). Nowadays, Europe, the Middle East, and Africa are the fastest-growing
markets for Netflix. In 2013, Netflix launched its famous original series <House of Cards>
(纸牌屋), which gained traction. From 2014 to 2020, Netflix raised its subscription prices
seven times, while gradually diversifying its business by stepping into ads, gaming, and
other relevant verticals.
Phase Four (2020-present): Competitive landscape changing; heading into AVOD
mode. Since 2019, two new entrants, Disney and Amazon, have ventured into streaming
business, leading to rising content cost and subs volatility with intensified competition. In
2022, Netflix lost 0.7mn users as it exited the Russia market. In 1H23, competitors began
to cut content cost with priority on profitability amid macro uncertainty, suggesting
competition to pull back. To diversify its monetization, Netflix has headed into the AVOD
mode, with paid sharing initiatives to unlock membership upside.
Figure 9: The four phases of development
Source: Company data, CMBIGM
Figure 10: The path of global expansion
Source: Company data, CMBIGM

3 Nov 2023
PLEASE READ THE ANALYST CERTIFICATION AND IMPORTANT DISCLOSURES ON LAST PAGE.
6
High barrier with high-quality content library
Differentiated content strategy. Compared to other streaming platforms, Netflix focuses
more on original scripted dramas with abundant content reserve, and is famous for
suspense and survival categories. Netflix sometimes does not fully engage in the process
of making original content, but adopts the sole investment and customization model (by
cooperating with third parties); nevertheless, its self-made drama mix has expanded. HBO
MAX (i.e. Max) positions itself as a premium provider of original content, programming for
kids and families, and sports. After the merger of WarnerMedia (parent company) and
Discovery, MAX’s content library comprises HBO Max, Discovery+, Food Network, HGTV,
etc. Disney builds its product portfolio with Disney+ (comedy, animation), Hulu (drama),
and ESPN+ (sports), to cater to diversified needs. It differentiates itself with brand effect,
exclusive IPs and notable movie & animation studios (e.g. Marvel, Pixar, Fox).
Figure 11: Platform comparison by genre, popular shows and content details
Platform
Key categories
Popular shows
Netflix
Drama, crime, fantasy, love, adventure
<Money Heist>, <Friends>, <Pablo Escobar, The
Drug Lord>, <Squid Game>,<The Blacklist>
Amazon Prime
Action, fantasy, sci-fi, drama
<StarTrek Picard>,<The Marvelous Mrs.
Maisel>,<The Lord of the Rings: The Rings of
Power>
Disney+
Family, animation, comedy
Marvel, Pixar, Fox, and National Geographic
Hulu
Drama, comedy
<Harlots>,<Handmaid's Tale>,<Only Murder in the
Building>
ESPN+
Sports
Professional sports events (such as NFL and NBA)
and sports news
HBO MAX
Warner Bros and its subsidiaries
<The Sopranos>,<The Wire>,<Game of Thrones>,
<Lord of the Ring>,<Harry Potter>
Apple TV+
Drama, film, documentary, sports
<Ted Lasso>,<CODA>
Source: Company data, CMBIGM
Figure 12: Top 10 shows on Netflix/Disney+/HBO in 2023 (on Oct 30, 2023)
Platform
Title
Genre
Launch date
IMDb score
Netflix
Bodies
Sci-fi
2023
7.5/10
Life on Our Planet
Documentary
2023
8.2/10
Lupin
Crime
2021
7.5/10
Elite
Crime
2018
7.2/10
Strong Gril Nam-soon
Crime
2023
7.7/10
Beckham
Documentary
2023
8.3/10
Pact of Silence
Drama
2023
6.7/10
Get Gotti
Documentary
2023
7.1/10
The Fall of the House of Usher
Horror
2023
8.1/10
Castaway Diva
Comedy
2023
NA
Disney+
Loki
Superhero
2021
8.2/10
Bluey
Animation
2018
9.4/10
The Simpsons
Animation
1989
8.7/10
Grey's Anatomy
Drama
2005
7.6/10
Goosebumps
Horror
2023
6.5/10
Modern Family
Comedy
2009
8.5/10
Family Guy
Animation
1999
8.2/10
Malcolm in the Middle
Comedy
2000
8.2/10
The Kardashians
Reality-Show
2022
4.5/10
Gravity Falls
Animation
2012
8.9/10
HBO
30 Coins
Horror
2020
7.1/10
The Gilded Age
Drama
2022
8.0/10
Rick and Morty
Animation
2013
9.1/10
The Last of Us
Sci-fi
2023
8.8/10
Teenage Kiss: The Future Is Dead
Drama
2023
NA
Candy Cruz
Comedy
2023
5.5/10
Starstruck
Comedy
2021
7.5/10
And Just Like That..
Comedy
2021
5.7/10
The Winter King
Fantasy
2023
5.6/10
Love Is In The Air
Comedy
2020
7.3/10
Source: FlixPatrol, CMBIGM

3 Nov 2023
PLEASE READ THE ANALYST CERTIFICATION AND IMPORTANT DISCLOSURES ON LAST PAGE.
7
Fruitful awards in originals. Netflix’s original content accounted for 36% of all streaming
originals in 2Q23, ranking the first place among streaming platforms. Netflix has been
rewarded the Emmy Awards, Golden Globe Awards, and Oscars, with various hit series
(e.g. <House of Cards>, <Orange is the New Black>, <Black Mirror>, <The Crown>) and
blockbuster films (e.g. <Roma> and <The Irishman>). Netflix and HBO MAX are key
competitors in terms of nominations for the Emmy Awards. In 2020, Netflix performed well
at the 72nd Emmy Awards (2020), with 160 nominations, surpassing HBO for the first time.
Surprisingly, Disney+ won 71 nominations one year after its launch, and its parent
company, Walt Disney, received 24 Oscar nominations in 2022, closely following Netflix's
27 nominations.
Figure 13: US platform demand share for all
streaming originals in 2Q23
Source: Parrot Analytics, CMBIGM
Figure 14: Emmy Award nominations for streaming
platforms during 2019-22
Source: Public data, CMBIGM
Figure 15: Netflix’s nominations and wins in Emmy
Awards during 2013-2022
Source: Public data, CMBIGM
Figure 16: Netflix USA catalogue share by original
status, 2017-2022 (%)
Source: Ampere, CMBIGM
Diversifying monetization: from subs to ads
Subscription is the key revenue contributor for Netflix. After subs declined in 2022, Netflix
targets to regain momentum in both revenue and profit with diversified monetization,
backed by: 1) password-sharing crackdown to enlarge the subs base; 2) the lower-priced
ad-supported plan; and 3) new initiatives to explore ecommerce and games.
Subs: solid growth in APAC, a slowdown in UCAN. As of 2022, the UCAN and EMEA
markets each contributed 33% of total subs, while LatAm and APAC accounted for 18%
and 16%, respectively, indicating more than half of subs from overseas markets. UCAN
subs have hit a plateau (+0% YoY in 2022, <10% growth since 2019), and subs in
Netflix
36%
Prime video
9%
Disney+
7%
Apple TV
8%
0
20
40
60
80
100
120
140
160
180
Netflix HBO Prime Hulu Disney+ Apple TV
2019 2020 2021 2022
0
20
40
60
80
100
120
140
160
180
2013 2014 2015 2016 2017 2018 2019 2020 2021 2022
0%
10%
20%
30%
40%
50%
60%
70%
80%
90%
100%
2016 2017 2018 2019 2020 2021 2022
Not an Original Netflix Exclusive Netflix Original

3 Nov 2023
PLEASE READ THE ANALYST CERTIFICATION AND IMPORTANT DISCLOSURES ON LAST PAGE.
8
EMEA/LatAm moderated at +6%/4% YoY in 2022, while the APAC is still on fast-growth
trajectory (+23% YoY).
Figure 17: Paid streaming subs, by region
Source: Company data, CMBIGM
Figure 18: Mix of subs, by region (2022)
Source: Company data, CMBIGM
Figure 19: Paid streaming subs, by UCAN and ROW
Source: Company data, CMBIGM
Note: ROW – rest of the world
Figure 20: Growth of subs in UCAN and ROW
Source: Company data, CMBIGM
Figure 21: Annual growth of subs, by region
Source: Company data, CMBIGM
Figure 22: Quarterly growth of subs, by region
Source: Company data, CMBIGM estimates
67 72 74 74
45 60 70 74
28
35
39 40
13
22 29 35
0
50
100
150
200
250
2019 2020 2021 2022
APAC (ex-China) Latin America EMEA UCAN
mn
UCAN
33%
EMEA
33%
Latin America
18%
APAC (ex-
China)
16%
66.53 71.51 74.30 74.15
86.49
116.83
136.88 149.45
0
20
40
60
80
100
120
140
160
2019 2020 2021 2022
UCAN ROW
mn
11% 8% 7% 4% 0%
44%
38% 35%
17%
9%
-5%
0%
5%
10%
15%
20%
25%
30%
35%
40%
45%
50%
2018 2019 2020 2021 2022
UCAN ROW
-10%
0%
10%
20%
30%
40%
50%
60%
70%
2018 2019 2020 2021 2022
UCAN EMEA
Latin America APAC (ex-China)
Total subs
-10%
0%
10%
20%
30%
40%
50%
1Q21 2Q21 3Q21 4Q21 1Q22 2Q22 3Q22 4Q22 1Q23 2Q23 3Q23 4Q23E
UCAN EMEA
Latin America APAC (ex-China)
Total subs

3 Nov 2023
PLEASE READ THE ANALYST CERTIFICATION AND IMPORTANT DISCLOSURES ON LAST PAGE.
9
Ad-supported tier: fast-growing business but limited contribution in near term. As
consumer budgets tighten, lower-priced or free ad-supported streaming is gaining traction.
In Nov 2022, Netflix launched its ad-supported plan which costs US$6.99/month and is
available in 12 countries (including Australia, Brazil, Canada, France, Germany, Italy,
Japan, Korea, Mexico, Spain, the UK, and the US). In May, Netflix said it had signed up
>5mn members for ad-supported plans, with 25% of new subs engaged.
Games: In 2Q21, Netflix announced its plan to enter gaming development, as another new
content category, to offer users with more player enjoyment. Netflix has launched 55
games. Another 40 new launches this year include Terra Nil (a reverse city builder) and
Mighty Quest (the first new game from an internal studio, OXENFREE II).
E-commerce: In Jun 2021, Netflix officially launched its first online retail platform,
Netflix.shop, which regularly sells limited-edition clothing, lifestyle products, and collectibles
related to hit shows.
Clear margin expansion with enhancing scale and effective
investment
Netflix net margin climbed up from 5% in 2017 to 17% in 2021, and slightly declined to 14%
in 2022 for heavy content investment amid competition. As cash payment is more front-
loaded than 2nd-run content licenses, investment in original content would weigh on FCF.
Netflix achieved positive FCF in 2020 for the first time, backed by its higher ROI and price
hikes. We are positive on its margin expansion, attributable to 1) efficient content spending
with competition to pull back; 2) incremental revenue driven by password-sharing
crackdown and the ad-supported tier; and 3) continuous price increases.
Figure 23: FCF trend
Source: Company data, CMBIGM
Figure 24: COGS and opex breakdown
Source: Company data, CMBIGM
-25%
-20%
-15%
-10%
-5%
0%
5%
10%
-4,000
-3,000
-2,000
-1,000
0
1,000
2,000
3,000
2018 2019 2020 2021 2022
FREE CASH FLOW FCF Margin
US$ mn
10.2%
12.9%
18.3% 20.9%
17.8%
0%
5%
10%
15%
20%
25%
0%
10%
20%
30%
40%
50%
60%
70%
80%
90%
100%
2018 2019 2020 2021 2022
G&A Marketing Other COGS Content Amort OPM

3 Nov 2023
PLEASE READ THE ANALYST CERTIFICATION AND IMPORTANT DISCLOSURES ON LAST PAGE.
10
Investment Summary
Competition to pull back, with growing streaming tailwinds
We are positive on streaming’s growth potential, backed by: 1) ramp-up of non-pay TV
viewers; 2) competition among LFVs (long-form video platforms) to normalize; and 3) time
spent on SFVs (short-form video platforms) to stay stable. According to Statista, the global
Video Streaming (SVoD) market size is projected at US$95.9bn in 2023, and to expand to
US$137.7bn in 2027 (9.5% CAGR in 2023-27). By 2027, the number of users could climb
up to 1.6bn, with user penetration at 20.7% (vs. 17% in 2023).
Figure 25: SVoD global market size (by revenue)
Source: Statista, CMBIGM
Figure 26: SVoD users and penetration rate
Source: Statista, CMBIGM
Figure 27: ARPU of SVoD
Source: Statista, CMBIGM
Figure 28: Subs by platforms
Source: Statista, CMBIGM
No. of non-pay TV viewers to ramp up. Significant changes in the television landscape
are taking place, primarily driven by rising non-pay TV viewers, amid the emergence of
alternative platforms (mainly streaming platforms). According to eMarketer, the number of
US non-pay TV viewers (138.1mn) will surpass that of pay TV viewers (129.3mn) for the
first time by 2024, along with declining pay-TV households.
0.00%
5.00%
10.00%
15.00%
20.00%
25.00%
30.00%
35.00%
40.00%
0
20
40
60
80
100
120
140
160
2017 2018 2019 2020 2021 2022 2023E2024E2025E2026E2027E
US$ bn
SVoD YoY
10%
12%
14%
16%
18%
20%
22%
0.0
0.2
0.4
0.6
0.8
1.0
1.2
1.4
1.6
1.8
2017 2018 2019 2020 2021 2022 2023E 2024E 2025E 2026E 2027E
No. of user, bn Penetration rate
bn
0
10
20
30
40
50
60
70
80
90
2017 2018 2019 2020 2021 2022 2023E 2024E 2025E 2026E 2027E
avg. rev per user
US$
0
100
200
300
2017 2018 2019 2020 2021 2022
Netflix Disney+
Hulu Tencent video
Youku iQiYi
Paramount Apple TV
HBO Max Youtube premium
Amazon Prime Video

3 Nov 2023
PLEASE READ THE ANALYST CERTIFICATION AND IMPORTANT DISCLOSURES ON LAST PAGE.
11
Figure 29: US pay TV households
Source: eMarketer, CMBIGM
Figure 30: US pay TV vs. non-pay TV viewers
Source: eMarketer, CMBIGM
Figure 31: Reasons for non-pay TV viewers by demographics (US adults)
Source: eMarketer, CMBIGM estimate
Manageable impact from SFVs with stable time spent. In the US market, TikTok's user
time spent has stabilized since 2020, and this is also the case for streamers. In addition,
SFVs are efficient channels for LFVs to promote and acquire users. Major streaming
platforms have opened official accounts on Tiktok to promote their series and movies.
Notably, Netflix experienced a significant increase in its TikTok audience from Apr 2021 to
Mar 2022, at 70% YoY, surpassing the growth on other social media platforms.
Figure 32: Average daily time spent (US adults)
Source: eMarketer, CMBIGM estimates
Figure 33: No. of Netflix followers and changes on
social platforms
Source: RightMetric, CMBIGM
68.5 65.1 62.3 59.7 57.2
52.4%
49.5% 46.9%
44.6%
42.4%
30%
35%
40%
45%
50%
55%
0
10
20
30
40
50
60
70
80
2022 2023 2024 2025 2026
mn
Pay TV Households as % of Households
0
50
100
150
200
250
2013 2018 2019 2020 2021 2022 2023E 2024E 2025E 2026E
Pay TV viewers Non-pay viewers
mn
16%
30%
9%
24%
21%
26%
63%
0% 10% 20% 30% 40% 50% 60% 70% 80% 90% 100%
Other
Prefer streaming content
Limited or no cable access
Fewer commercials on streaming
Stopped watching live TV
Poor customer service
Cable was too expensive
0
10
20
30
40
50
60
70
2019 2020 2021 2022 2023E 2024E
Netflix Youtube Tiktok
mins
74
27 19 13 11
81
29 23 22 17
10% 10%
20%
70%
51%
0%
10%
20%
30%
40%
50%
60%
70%
80%
0
10
20
30
40
50
60
70
80
90
Facebook Instagram Youtube TikTok Twitter
Apr 2021 Mar 2022 % change in followers
mn

3 Nov 2023
PLEASE READ THE ANALYST CERTIFICATION AND IMPORTANT DISCLOSURES ON LAST PAGE.
12
Competition among LFVs to pull back. LFV competition has intensified as major
platforms increased content investment since 2019. For instance, Amazon spent US$7bn
on original shows and licensed programs and sports in 2022 (vs. US$5bn in 2021).
However, competition tends to be moderate as their focus shifts from growing subs to
profitability and free cash flow. Streaming platforms are now prioritizing content quality and
cost control since 1H23. For example, Warner Bros has reduced DTC (direct-to-consumer)
movie releases and license them out under flat budgets. Disney cut streaming cost by over
50% in 2Q23 (streaming loss narrowed to US$512mn), with prick hikes.
Figure 34: Estimated OPM of streamers in 2023E
Source: Bloomberg, CMBIGM estimates
Figure 35: Capex of streaming platforms
Source: Macroaxis, CMBIGM estimates
Expecting content pick-up with strikes to settle. From May 2023, Hollywood actors and
writers organized strikes to demand additional protection from AI, and better pay with stable
work in the streaming era. The WGA (the Writers Guild of America) settled the strikes on
Sep 27, 2023, with a tentative agreement. With upcoming content production resumption,
streaming platforms will gradually recover from the content shortage. For Netflix, some
favorite shows might get delayed (e.g. <Strange Things>), but we think Netflix would be
more resilient against the strikes for its extensive content library and globalization.
Figure 36: Strike impact across key platforms
Netflix
Disney+
WBD/Max
Amazon Prime
Apple TV
Less effected with extensive
content library and
globalization
Fall somewhere in between
Suffer from a lack of content, but streaming is
not a key business
Netflix has vast volume of
content, as it is likely that Netflix
has anticipated such situations
and stockpiled additional
material. In addition, global
production will greatly benefit
them during these times. they
have a pool of talented writers
and actors who are not affiliated
with the striking unions.
Disney+ fares well due
to its extensive
collection of kids'
content with repeated
viewership, along
strong global presence.
However, Hulu (a
subsidiary) may face
challenges as it heavily
relies on linear
television services and
limited global reach.
Warner Bros Discovery
(WBD)/Max is in a
favorable position due
to its substantial library
content, particularly the
Discovery's vast
catalog.
Amazon seems better
positioned attributable
to extensive content
library backed by an
established partnership
with content providers
and service offerings,
as well as wide global
reach.
Apple won't release
new content during this
period, but the setback
won’t dampen Apple as
a company in the long
run.
Source: CMBIGM
Resilient streaming viewing in Aug & Sep 2023. Streaming views remained robust in
Aug & Sep 2023 although the metric experienced a slight decline of 1.6% vs. Jul, attributed
to school returning. Notably, Netflix maintained its market share with top 2 titles, <Suits>
and <The Lincoln Lawyer>. Meanwhile, broadcast and cable witnessed slight recovery in
market share temporarily, thanks to diverse variety shows and the NFL preseason,
respectively.
6% 6%
18% 20%
0%
5%
10%
15%
20%
25%
Disney+ DMED Paramount Fox Netflix
174
253
498 525
408
235
359
484
307 357
345 324 354 358
0
100
200
300
400
500
600
2018 2019 2020 2021 2022 2023E
Netflix Fox Paramount
US$ mn

3 Nov 2023
PLEASE READ THE ANALYST CERTIFICATION AND IMPORTANT DISCLOSURES ON LAST PAGE.
13
Figure 37: Share changes among TV platforms
Source: Nielsen, CMBIGM
Figure 38: Share changes among streaming platforms
Source: Nielsen, CMBIGM
Solid subs growth potential from overseas expansion. We expect overseas market
expansion to be key driver for Netflix’s organic subs growth, as penetration there (24%-
45% in FY23E) still lags behind the UCAN market (63%). We forecast subs to rise at a
7.6% CAGR in FY23-25E, with APAC (ex-China)/EMEA/LatAm potentially logging
13.5%/8.5%/6.8% CAGRs. By quarter, net adds in subs in 4Q23E could be similar to
3Q23E, at 9mn (up to 256mn), based on our forecasts.
Figure 39: Netflix’s addressable broadband homes
penetration
Source: Statista, Company data, CMBIGM estimates
Figure 40: Subs growth estimates by regions
Source: Company data, CMBIGM estimates
Figure 41: Subs estimates
Source: Company data, CMBIGM estimates
Figure 42: Overseas market to account for 71% of
total subs by FY25E
Source: CMBIGM estimates
0%
10%
20%
30%
40%
50%
60%
70%
80%
90%
100%
Sep-22 Nov-22 Jan-23 Mar-23 May-23 Jul-23 Sep-23
Other Streaming Cable Broadcast
7.3% 7.2% 7.6% 7.5% 7.5% 7.3% 7.3% 6.9% 7.9% 8.2% 8.1% 8.2% 7.8%
0%
5%
10%
15%
20%
25%
30%
35%
40%
Sep-22 Nov-22 Jan-23 Mar-23 May-23 Jul-23 Sep-23
Paramount+ Roku Channel Tubi Pluto
Peacock Max Disney+ Amazon
Hulu YouTube Netflix Other streamings
0%
10%
20%
30%
40%
50%
60%
70%
80%
2020 2021 2022 2023E 2024E 2025E 2026E 2027E
UCAN EMEA Latin America
APAC (ex-China) Total Paid Subs
-5%
0%
5%
10%
15%
20%
25%
30%
35%
2021 2022 2023E 2024E 2025E
UCAN EMEA
Latin America APAC (ex-China)
Total subs
74 74 76 80 82
70 74 81 90 95
39 40 43 46 49
29 35 41 47 53
0
50
100
150
200
250
300
2021 2022 2023E 2024E 2025E
APAC (ex-China) Latin America EMEA UCAN
mn
UCAN
29%
EMEA
34%
Latin America
18%
APAC (ex-
China)
19%

3 Nov 2023
PLEASE READ THE ANALYST CERTIFICATION AND IMPORTANT DISCLOSURES ON LAST PAGE.
14
Vibrant original content to strengthen leadership and price hikes
Enhancing original content edge with effective investment and rational industrial
production system
Stepped-up investment in original content. Netflix has continued to invest in originals to
enhance its core advantage (except for the pandemic outbreak in 2020 and strikes in 2023).
Netflix even invests heavily in individual shows, exemplified by the hit series <House of
Cards S1>, which costs US$5mn per episode, totaling US$65mn. Furthermore, the
critically acclaimed original series <The Crown> in 2016 was the most expensive
production with costs up to US$13mn per episode, totaling US$130mn.
Figure 43: Netflix’s amortization of content
Source: Company data, CMBIGM
Figure 44: Content cost of Netflix and Disney (DTC)
Source: Company data, CMBIGM
Figure 45: Content cost as % of revenue
Source: Company data, CMBIGM
Figure 46: No. of originals Netflix launched
Source: Statista, CMBIGM
Figure 47: Netflix’s investment in original content (partially)
Title
Content cost
(US$ mn)
Episode
Cost per episode
(US$mn)
Launch date
Awards
Orange Is the New Black S1
52
13
4
2013
House of Cards S1
65
13
5
2013
Received 6 nominations in Emmy
Macro Polo
100
10
10
2014
1 win in Busan International Film Festival
Sense8
108
12
9
2015
The Crown S1
130
10
13
2016
1 win of 4 nominations in Emmy
The Get Down
132
12
11
2016
Stranger Things S1
48
8
6
2016
5 wins of 6 nominations in Emmy
The Witcher S1
80
8
10
2019
Bridgerton
56
8
7
2020
Source: Company data, CMBIGM
0%
10%
20%
30%
40%
50%
60%
-
500
1,000
1,500
2,000
2,500
3,000
3,500
4,000
4,500
1Q21 2Q21 3Q21 4Q21 1Q22 2Q22 3Q22 4Q22 1Q23 2Q23
US$ mn
Amortization of streaming content % of revenue
-
500
1,000
1,500
2,000
2,500
3,000
3,500
4,000
4,500
1Q21 2Q21 3Q21 4Q21 1Q22 2Q22 3Q22 4Q22 1Q23
Netflix Disney (DTC)
US$ mn
0%
10%
20%
30%
40%
50%
60%
70%
80%
90%
1Q21 2Q21 3Q21 4Q21 1Q22 2Q22 3Q22 4Q22 1Q23
Netflix Disney (DTC)
59
96 97
122 126
111
125
105 103 96
129 129
0
20
40
60
80
100
120
140
1Q19 2Q19 3Q19 4Q19 1Q20 2Q20 3Q20 4Q20 1Q21 2Q21 3Q21 4Q21

3 Nov 2023
PLEASE READ THE ANALYST CERTIFICATION AND IMPORTANT DISCLOSURES ON LAST PAGE.
15
Rational industrial production system with top-tier producers and directors. Netflix
has signed exclusive agreements with top producers and directors, enabling them to
produce high-quality content that transcends cultural barriers. This approach solidifies
Netflix’s content diversity and globalization. Moreover, Netflix can leverage the rational
Hollywood production system, to build an “assembly line” for efficient production,
distribution and exhibition.
Figure 48: Producers and directors (partially) that have signed contract with Netflix
Producer(s)/Director(s)
Masterpiece(s)
Signing time
Duration
Amblin Partners
Jaws, Extraterrestrial, Saving Private Ryan
2020
Multiple years
David Benioff and D.B
Game of Thrones
2017
Long term
Matt Reeves
Batman, Dawn of the Planet of Apes
2019
Multiple years
Ryan Murphy
American Horror Story
2016
5 years
Shonda Rhimes
Grey's Anatomy, Anatomy of a Scandal
2017.8
Multiple years
Adam Sandler
Hotel Transylvania
2014/17
4 films respectively
Alex Pina
Money Heist
2018.7
Multiple years
Luc Paul Maurice Besson
The Professional
2018.1
Multiple years
Steven S. DeKnight
Pacific Rim: Uprising
2018.6
Multiple years
Source: Company data, CMBIGM estimate
Diversified content pipeline with global exposure
Expanding international content library to meet diversified needs. To cater to global
audience preferences, Netflix invests in local studios and supports them with Hollywood-
standard techniques. In 2Q23, the number of non-English content was on par with that of
English content, with a total of 106 originals. In 3Q23, the number of non-English content
originals amounted to 81. Top non-English dramas include <Squid Game: 鱿鱼游戏>
(South Korean), <Money Heist: 纸钞屋>(Spain), <The Glory: 黑暗荣耀> (South Korean).
Non-English content has gained traction. For example, views of non-English content have
surged 90% in the past three years in UK. In 2022, >70% of the views came from members
watching a title from other countries.
Moving beyond moderate pipeline in 4Q23 due to strikes. Despite a robust pipeline in
3Q23 with 105 originals, Netflix’s 4Q23 pipeline is expected to be moderate with estimated
52 originals, vs. 82/105 in 4Q22/3Q23. We attribute the discrepancy to strikes. Some titles
for 4Q23 will be rescheduled for release in 2024 to address content gaps caused by the
strikes.
Figure 49: Netflix content pipeline in 2H23E
Type
Language
3Q23 pipeline
Total
Language
4Q23 pipeline (partial)
Total
Scripted TV
English
The Lincoln Lawyer S2 Vol.1
20
English
Lupin
13
English
Sweet Magnolias S3
English
Everything Now
English
The Witcher S3 (Vol. 6-8)
Japanese
Last One Standing
English
Heartstopper S3
English
The Fall of the House of Usher
English
PainKiller
German
Bodies
Korean
Mask Girl
Turkish
Creature
English
Ragnarok
Korean
Doona!
Spanish
Who is Erin Carter?
English
Elite
English
Infamy
English
All the Light We Cannot See
English
Top Boy S5
Dutch
Ferry: The Series
German
Dear Child
English
Obliterated
English
Virgin River
French
Pax Massilia
Korean
A Time Called You
English
Money Heist: Berlin
Spanish
Burning Body
English
Spy Ops
French
Class Act
English
Wrestlers

3 Nov 2023
PLEASE READ THE ANALYST CERTIFICATION AND IMPORTANT DISCLOSURES ON LAST PAGE.
16
English
The Club
Portuguese
Sintonia S4
Korean
Song of the Bandits
Comedy /
Stand-up
English
Survival of the Thickest
14
German
Neon
2
English
Mark Normand: Soup to Nuts
English
Tore
English
Heartstopper
English
At Home with Furys
Korean
Zombieverse
English
The Upshaws
English
Lighthouse
English
Tahir's House
Brazilian
Reporting for Duty
Argentinian
Thursday's Widows
English
Surviving Summer
English
Sex Education
English
One Piece S1
India
Guns and Gulaabs S1
Documenta
ries
/Docuseries
English
Unknown: The Lost Pyramid
28
English
Beckham
6
German
Wham !
German
Race to the Summit
English
Unkown: Killer Robots
English
Camp Courage
English
Quarterbacks S1
English
The Devil on Trial
English
Unknown: Cave of Bones
French
Vjeran Tomic: The Spider-Man
of Paris
English
The Deepest Breath
English
Life on Our Planet
English
Unknown: Cosmic Time
Machine
English
Untold: Jake Paul the Problem
Child
English
Mark CavendishL Never
Enough
English
Poisined: The Dirty Truth About
Your Food
English
Untold: Johnny Football
German
Untold: Hall of Shame
Portuguese
A Life Too Short: The Isabella
Nardoni Case
English
The Hunt for Veerappan
English
Predators
English
Scouts Honor: The Secret Files
of the Boy Scouts of America
Spanish
Rose Peral's Tapes
English
Spy Ops
English
Wrestlers
English
Inside the World's Toughest
Prisons
English
The Saint of Second Chances
German
Who Killed Jill Dando
German
Encounters
Spanish
The Darkness within La Luz Del
Mundo
English
Ladies First: A story of Women
in Hip-Hop
English
Untold: Swamp Kings
English
Live to 100: Sectrets of the Blue
Zones
English
Heart of Invictus
Films
German
The Out-laws
22
Spanish
A deadly Invitation
21
English
65
Mandarin
Ballerina
English
They Cloned Tyrone
English
Fair Play
English
Happiness for Beginners
Thai
Once Upon a Star

3 Nov 2023
PLEASE READ THE ANALYST CERTIFICATION AND IMPORTANT DISCLOSURES ON LAST PAGE.
17
Japanese
Zom 100: Bucket List of the
Dead
English
The Conference
Arabic
Head to Head
German
Cryto Boy
Chinese
Marry My Dead Body
German
Old Dads
English
Heart of Stone
Spanish
Sister Death
Spanish
Killer Book Club
English
Pain Hustlers
Spanish
The Great Seduction
French
WingWomen
English
Choose Love
English
Nyad
English
Happy Ending
English
The Killer
English
A Day and A Half
English
Best. Christmas. Ever!
Spanish
EI Conde
English
All-time High
English
Love at First Sight and Suits
English
Rustin
German
Street Flow 2
English
Leo
English
The Wonderful Story of Henry
Sugar
English
Family Switch
German
Znachor
English
May December
German
Love is in the Air
English
Leave the World Behind
Turkey
Do Not Disturb
English
Maestro
Spanish
Nowhere
English
Rebel Moon
German
Reptile
Animated
series/kids
English
StoryBots: Answer Time
12
Japanese
Good Night World
7
English
Sonic Prime S2
Japanese
Pluto
English
Dew Drop Diaries
Japanese
Onimusha
English
Miraculous: Ladybug & Cat Noir
English
Blue Eye Samurai
English
Bastard
English
Scott Pilgrim: Takes Off
English
The Monkey King
English
Chicken Run: Dawn of the
Nugget
English
Gabby's Dollhouse S8
English
Pokemon Concierge
English
Spy Kids Armageddon
German
Power Rangers: Cosmic Fury
English
Disenchantment
Chinese
My Dad the Bounty Hunter S2
Japanese
The Seven Deadly Sins:
Grudge of Edinburgh Part II
Reality
shows/Othe
rs
English
Hack My Home
9
German
Surviving Paradise
3
English
Five Star Chef S1
English
Squid Game: The Challenge
English
Too Hot to Handle
Japanese
Love Like a K-Drama
Korean
Risque Business
Japanese
Is She the Wolf?
English
Selling OC
Portuguese
Love is Blind
Korean
The Devil's Plan
English
The Great British Baking Show
Source: Company data, CMBIGM

3 Nov 2023
PLEASE READ THE ANALYST CERTIFICATION AND IMPORTANT DISCLOSURES ON LAST PAGE.
18
Leveraging AI to enhance recommendation, production and targeting
Extensive tag database to categorize viewers precisely. Netflix employs a dedicated
team to tag every single title in the catalog with highly specific categories to make the
recommendation system more personalized. They label films with multiple elements,
including sex, violence, romance, and narrative storytelling, etc. As a result, Netflix has
developed an extensive tag database with approximately 77,000 categories and 2,000
communities, enabling precise viewer profiling and more tailored viewing experience.
Advanced AI to enhance full service offerings. Netflix has heavily invested in AI to
optimize the entire service offerings. 1) Recommendation: Netflix AI recognizes new
content similar to the viewers’ historical record/preference and recommend it to the targeted
user. 2) Production optimization: AI optimizes the script by understanding successful
characteristics and features in the past, to predict audience reception, and identifies
potential areas for improvement. 3) High-quality streaming: AI optimizes video and audio
encoding, adaptive bitrate selection, and its in-house CDN (accounting for 1/3 of North
America internet traffic). AI algorithms predict peak usage hours and strategically place
video assets near subscribers in advance, ensuring smooth streaming. 4) Effective user
acquisition: AI empowers advertising strategies (advertising spend, channel mix, and
advertising creative) to better target and acquire new subscribers effectively. For instance,
AI-generated thumbnails are designed to prompt user clicks by annotating and ranking
frames from existing movies or TV programs.
Continuous investment in media-focused ML innovations. Netflix remains committed
to investing in multimodal content understanding, a media-focused ML (machine learning),
that utilizes multiple modalities (e.g. video, audio, closed captions, scripts) to fully
understand media content. Netflix has successfully employed different combinations of
modalities, such as video and text, video and audio, script alone, and the integration of
video, audio, and scripts. In the future, multimodal content understanding will be used to
address complex issues including content production, VFX (visual effects), promotion asset
creation, and personalization.
Figure 50: Netflix’s recommendation algorithm
Source: Company data, CMBIGM

3 Nov 2023
PLEASE READ THE ANALYST CERTIFICATION AND IMPORTANT DISCLOSURES ON LAST PAGE.
19
Figure 51: Media-focused ML brings science and art together
Source: Netflix Technology Blog
Strong pricing power with differentiated originals
Price hikes and premiums backed by differentiated originals. Netflix charges a slightly
higher monthly fee of US$15.49/month (standard plan in UCAN), above that of Disney+,
Amazon Prime, and Apple TV. In addition, Netflix has raised prices multiple times in the
past 10 years along with user expansion, backed by high user retention rate and
differentiated originals. Its blended ARPU saw a 4.5% CAGR in FY17-22, rising to US$11.7
in FY22.
Figure 52: Plans comparison on five major streaming platforms
Netflix
Disney+
Amazon Prime
HBO Max
Apple TV
Plans
(US$/mo)
Ad-supported
6.99
7.99
8.99
9.99
-
Basic
-
-
-
-
6.99
Standard
15.49
-
14.99
15.99
-
Premium
22.99
13.99
-
19.99
-
Supported device(s)
2~4
4
6
2~4
6
Max definition
4K
4K
4K
4K
4K
Source: Company data
Figure 53: Netflix’s monthly subs plan
Standard with ads
Standard plan
Premium plan
US$/month
6.99
15.49
22.99
No. of devices for watching
at a time
2
2
4
Rights
All but a few movies
and TV shows
available, unlimited
mobile games
Unlimited ad-free movies, TV shows, and mobile
games
Ads
Ad-supported
Ad-free
Extra member(s)*
-
1 extra member
2 extra members
No. of devices for
download at a time
-
2
6
Definition
Full HD
Full HD
Ultra HD
Source: Company data
Rising ARM with price hikes and AVOD expansion, despite short-term dilution
High visibility for ARM increase in the long run, with content pick-up and industrial
wave of price increases. In 2023, the streaming industry has seen a price hike wave
(+7%-27% across streamers) for creeping inflation and rising costs (especially after
Hollywood strikes). Netflix slightly raised its premium plan price to US$22.99 from
US$19.99 in the US (+15%), to 17.99 pounds in Britain (+12.5%) and 19.99 euros in France
(+11%), in Oct 2023, after strikes. We expect this trend to continue, forecasting blended
ARPU to grow at a 3.4% CAGR in FY23-25E.

3 Nov 2023
PLEASE READ THE ANALYST CERTIFICATION AND IMPORTANT DISCLOSURES ON LAST PAGE.
20
Better ARM with AVOD expansion and removal of basic plan, while expecting
dynamic impacts from paid-sharing initiatives. As management stated higher ARPU
(ad-supported tier ARPU + ads ARPU) for the US ad-supported tier than the Standard plan
in 2Q23, we expect rising adoption of AVODs would boost its long-term ARPU. As Netflix
removed basic plan in the US, the UK, and Canada in Jun & Jul 2023, more subs would
shift to higher-ARM plans. For paid-sharing initiatives, we think it might depend on the
conversion rate. As the paid-sharing plan only contributes ~8% of total revenue in FY25E,
we expect limited impact on ARM from it.
Short-term ARM dilution by overseas expansion, price decreases in emerging
markets, and spindown activity. With continuous overseas expansion, Netflix blended
ARPU might be slightly diluted by higher revenue share of international subs with lower
ARM (US$7.6-10.8 vs. US$16.2 in UCAN in FY23E). International subs mix will climb up
to 70.6% in FY25E, from 68.4% in FY22, in our estimates. Also, Netflix lowered prices by
20%-60% in 100+ regions (mainly in developing countries) in Feb 2023. Although
management stated these markets contributed less than 5% of its total revenue, there could
still be mild ARM dilution until Feb 2024. As such, we expect FY23E blended ARPU to
decline 1% YoY, but gradually pick up in FY24-25E, backed by price hikes and higher
APRU of AVODs.
Figure 54: History of Netflix price increases
Source: Company data, CMBIGM
Figure 55: Price increases in 2023 by platforms
Source: Company data, CMBIGM
Figure 56: ARM estimates
Source: Company data, CMBIGM estimates
Figure 57: Quarterly ARM trend by region
Source: Company data, CMBIGM estimates
24.00
22.00
20.00
18.00
16.00
14.00
12.00
10.00
8.00
6.00 2012 2013 2014 2015 2016 2017 2018 2019 2020 2021 2022 2023
Premium (4K, 4 screens) Basic (HD, 1 screen)
Standard (HD, 2 screens) Standard with ads (HD, 2 screens)
$22.99
$15.49
Eliminated
$6.99
27%
20% 20% 20%
10% 7%
0%
5%
10%
15%
20%
25%
30%
Disney+
(ad-free) Hulu
(ad-free) Paramount+
(ad-free and
ad-supported)
Peacock
(ad-free and
ad-supported)
ESPN+ MAX
(ad-free)
-2%
-1%
0%
1%
2%
3%
4%
5%
6%
7%
11.00
11.20
11.40
11.60
11.80
12.00
12.20
12.40
12.60
2021 2022 2023E 2024E 2025E
US$
ARM YoY
0.00
2.00
4.00
6.00
8.00
10.00
12.00
14.00
16.00
18.00
1Q21 3Q21 1Q22 3Q22 1Q23 3Q23
UCAN EMEA
Latin America APAC (ex-China)
US$

3 Nov 2023
PLEASE READ THE ANALYST CERTIFICATION AND IMPORTANT DISCLOSURES ON LAST PAGE.
21
Riding on AVOD expansion
Ad-supported tier plan to be rolled out. As consumer budgets tighten, lower-priced or
free ad-supported streaming is gaining traction. In Nov 2022, Netflix launched its ad-
supported plan which costs US$6.99/month and is available in 12 countries (including
Australia, Brazil, Canada, France, Germany, Italy, Japan, Korea, Mexico, Spain, the UK,
and the US). In May 2023, Netflix said it had signed up >5mn members for ad-supported
plans, with 25% of new subs engaged. We will address the key market debates surrounding
AVODs’ TAM, ARM dynamics and ads strategy for Netflix.
Figure 58: Ad-supported tier initiatives
Source: Company data, CMBIGM
# TAM of ad-supported tier initiatives?
We are bullish on Netflix’s AVOD (ad-based video-on-demand) expansion and expect
positive impact on both net adds and ARPU. With a lower-priced package, AVODs can
help Netflix spread global reach and tap into price-sensitive users. Before that, some
players have already leveraged subs & ads modes, such as Hulu, Paramount+, Peacock,
and IQIYI. Hulu, Paramount+, and Peacock are key AVOD players in the US
(~45mn/25mn/30mn ad-supported subs by Jun 2023, based on Ampere data), with ad-
supported subs making up >70% of the mix. Major Chinese platforms are also AVOD
players (e.g. Tencent video, IQIYI, Mango), among which IQIYI/Mango ads revenue
accounted for 18.4%/29.1% in 2022. Given the proven record of successful hybrid tiers
from peers, we expect Netflix could gain ads share with its high-quality content and strong
user engagement.
Figure 59: Ad-free/ad-supported subs by platform
Source: Ampere, CMBIGM
Figure 60: Ads revenue share by platform (in 2022)
Source: Walt Disney, company data, CMBIGM
0
10
20
30
40
50
60
70
Netflix Disney+ Paramount+ Discovery+
(Apr 23)
mn
Ad-supported Ad-free
HBO
Max Pea
cock
36%
18% 29%
0%
10%
20%
30%
40%
50%
60%
70%
80%
90%
100%
Hulu IQIYI Mango
Others Ads

3 Nov 2023
PLEASE READ THE ANALYST CERTIFICATION AND IMPORTANT DISCLOSURES ON LAST PAGE.
22
According to Digital TV Research, the global AVOD market would grow up to US$69bn by
2029, from US$39bn in 2023 (vs. SVOD at US$96bn), suggesting a 9.5% CAGR. The US
will account for 31% by 2029, down from 40% in 2023. Ad-supported subs in the US have
already surpassed 100mn (based on Ampere data), and we estimate TAM of ad-supported
subs at 380mn worldwide.
Figure 61: Global AVOD market size
Source: Digital TV Research, CMBIGM
Figure 62: AVOD revenue by country in 2029
Source: Digital TV Research, CMBIGM
Netflix ceased the “basic plan” for new customers in the US, the UK and Canada in Jun &
Jul 2023, and the US “Standard with Ads” Plan accounted for 30% of new sign-ups in Sep
2023, from 10% in Nov 2022, based on Antenna. Combined with gross adds data (2.1mn
in Sep; 6.7mn in 3Q23), we estimate Netflix’s net adds of “Standard with Ads” in Sep/3Q23
reached 0.63mn/1.8mn in the US. In its 3Q23 results, management stated that ads plan
sign-ups rose 70% QoQ, accounting for 30% of sign-ups of its ads countries. Looking
ahead, we expect Netflix AVOD subs to increase to 32.4mn in FY25E (11% of the subs
mix), from 14mn in FY23E, with a 51% CAGR.
Figure 63: Netflix US sign-ups by plan (as % of total)
Source: Antenna, CMBIGM
Figure 64: Netflix US sign-ups by plan
Source: Antenna, CMBIGM estimates
# Ads expansion strategy as new entrant?
Netflix would expand its ads business via multiple strategies, via: 1) cooperating with more
strategic partners: Netflix restructured its exclusive, two-year ad-tech agreement with
Microsoft, to explore more ad-tech partners (despite with reduced guarantee from
Microsoft); 2) enriching ads formats, including title sponsorship (a brand to sponsor a show
or season), “Binge” ads, and live sports events; and 3) enhancing ads tech to improve ads
efficiency (e.g. targeting, matching).
39
69
0
10
20
30
40
50
60
70
80
2023E 2029E
US$ bn
USA
21.6
China
7.4
UK
3.6
Canada
3.5
India
3.0
Germany
2.9
Brazil
2.6
Japan
2.5
Others
22.2
US$ bn
28%
42%
30%
0%
10%
20%
30%
40%
50%
60%
70%
80%
90%
100%
Aug
22 Sep
22 Oct
22 Nov
22 Dec
22 Jan
23 Feb
23 Mar
23 Apr
23 May
23 Jun
23 Jul
23 Aug
23 Sep
23
Standard with ads Basic Standard Premium
0.0
0.5
1.0
1.5
2.0
2.5
3.0
3.5
4.0
Aug
22 Sep
22 Oct
22 Nov
22 Dec
22 Jan
23 Feb
23 Mar
23 Apr
23 May
23 Jun
23 Jul 23 Aug
23 Sep
23
Standard with ads Basic Standard Premium

3 Nov 2023
PLEASE READ THE ANALYST CERTIFICATION AND IMPORTANT DISCLOSURES ON LAST PAGE.
23
# ARM dynamics and revenue contribution with ad-supported tier plan?
Netflix AVOD will limit ad loads to four minutes per hour. Based on Nielsen data, daily time
spent per subs for Netflix reached 1.4h on average in the US in 2022 & 2023. As Netflix
seeks to attract more advertising for shows beyond the top 10, we estimate Netflix ads
CPM (cost per mille) to range at US$40 to US$45 (below US ads pricing of US$65 on
average), based on Digital News Daily. As such, we forecast its ads ARPU at
US$8.8/month.
In 2Q23, the US ad-supported tier generated higher ARPU (ad-supported tier ARPU + ads
ARPU) than the $15.49/month Standard plan, per management. That implies ad revenue
per subscriber surpassed US$8.50/month for the “Standard with Ads” plan, in line with our
estimates.
Assuming relatively stable ARPU of US$15, we forecast ad-supported subs revenue to
climb up to US$5.2bn in FY25E, accounting for 13% of total rev (in line with mgmt’s target
of >10% over time), coupled with 8mn~12mn net adds per year.
Figure 65: Rev estimates for ad-supported tier plan
Source: Company data, CMBIGM estimates
US$ mn 1Q23E 2Q23E 3Q23E 4Q23E 1Q24E 2Q24E 3Q24E 4Q24E 2023E 2024E 2025E 2026E
Paid Ending Subs (mn) 1.2 6.0 10.2 14.2 16.0 17.9 20.4 23.4 14.2 23.4 32.4 40.4
QoQ Growth 400% 70% 39% 13% 12% 14% 15%
YoY Growth 1233% 198% 100% 65% 65% 38% 25%
% mix 1% 3% 4% 6% 6% 7% 8% 9% 6% 9% 11% 13%
Average Paid Subs (mn) 3.6 8.1 12.2 15.1 17.0 19.2 21.9 7.9 19.4 27.9 36.4
Net Adds (mn) 4.8 4.2 4.0 1.8 1.9 2.5 3.0 13.0 9.2 9.0 8.0
QoQ Growth -13% -5% -55% 6% 32% 20%
YoY Growth -60% -40% -25% -29% -2% -11%
% mix 81% 48% 43% 50% 70% 55% 57% 50% 57% 62% 60%
ARPU (US$) 15 15 15 15 15.3 15.3 15.3 15.3 15 15.3 15.6 15.9
YoY Growth 2% 2% 2% 2% 2% 2% 2%
Ad-supported tier rev 162 365 549 693 778 879 1,005 1,076 3,355 5,225 6,953
QoQ Growth 125% 51% 26% 12% 13% 14%
YoY Growth 380% 141% 83% 212% 56% 33%
% mix 2% 4% 6% 7% 8% 9% 10% 3% 9% 13% 15%

3 Nov 2023
PLEASE READ THE ANALYST CERTIFICATION AND IMPORTANT DISCLOSURES ON LAST PAGE.
24
Paid sharing initiatives to unlock membership upside
Tapping into 100mn password-sharing users. On 23 May 2023, Netflix began a
password-sharing crackdown in 103 countries and territories (one account is limited to
three profiles only), in order to convert users who share accounts with others into paying
subs. Members can transfer a profile of someone outside their household so the person
can begin new membership they pay for on their own. Or they can pay an extra fee of
US$7.99/month per person, outside of their household using their account.
The password-sharing crackdown is likely to benefit topline and subs growth, as Netflix
said they had more than 100mn password-sharing users. In the US, 26% of subs are
shared on average (Disney+/Netflix: 33%/30%), based on NPS Prism US Telecom. After
Netflix’s password-sharing crackdown in May, rising account owners have stopped sharing
their accounts, and 42% of those subs who share passwords plan to pay US$7.99 fee,
according to Occam Data in Aug 2023. As the majority of account borrowers are price
sensitive (younger users with lower income), we expect the password-sharing crackdown
to help to transfer more users into new subs of the low-priced package (US$6.99 ad-
supported tier or US$7.99 sharing fee).
For conservative estimates, we forecast ~30mn add-on subs to pay US$7.99/month by the
end of 2025E (<30% of total password-sharing users, vs 42% willingness). Assuming no
price hike for the paid sharing plan, we expect incremental revenue of US$2.7bn in FY25E
from paid sharing crackdown, contributing 6% of total revenue.
Figure 66: Percentage of subs are shared
Source: NPS Prism US Telecom (in 2Q22), CMBIGM
Figure 67: Password crackdown goes into effect
Source: Occam Data, CMBIGM
Figure 68: Paid sharing willingness
Source: Occam Data, CMBIGM
Figure 69: Quit willingness
Source: Occam Data, CMBIGM
19%
22%
26%
28%
28%
30%
33%
0% 5% 10% 15% 20% 25% 30% 35%
Amazon Prime Video
Apple TV+
Industry average
HBO Max
Hulu
Netflix
Disney+
Industry
average
26%
20%
30%
40%
50%
60%
70%
80%
5/4/2023 5/5/2023 5/6/2023 5/7/2023 5/8/2023
To share account with others
Password crackdown goes
into effect (5/23)
Not to shareown account
Unlikely
58%
Likely
42%
Will you pay the additional US$7.99 to continue sharing your account?
(asking of those sharing a Netflix account)
What will you do now that Netflix is charing an additional US$7.99 to share accounts?
(asked of those using someone else's Netflix account)
39%
31%
28%
25%
27%
29%
31%
33%
35%
37%
39%
Jun Jul Aug
I will stop watching Netflix

3 Nov 2023
PLEASE READ THE ANALYST CERTIFICATION AND IMPORTANT DISCLOSURES ON LAST PAGE.
25
Figure 70: Revenue estimates for paid-sharing initiatives
Source: Company data, CMBIGM estimates
US$ mn 2Q23E 3Q23E 4Q23E 1Q24E 2Q24E 3Q24E 4Q24E 2023E 2024E 2025E 2026E
Add-on Ending Subs (mn) 12 16 20.00 21 22.3 23.8 25.6 20 25.6 29.9 32.3
QoQ Growth 33% 25% 5% 6% 7% 8%
YoY Growth 86% 49% 28% 28% 17% 8%
Average Paid Subs (mn) 12.0 14 18 20.5 21.7 23.1 24.7 16.0 23.2 27.75 31.1
Net Adds (mn) 12.0 4.0 4.0 1.0 1.3 1.5 1.8 20 5.6 4.3 2.4
QoQ Growth -67% 0% -75% 30% 15% 20%
YoY Growth -89% -63% -55% -72% -23% -44%
ARPU (US$) 7.99 7.99 7.99 7.99 7.99 7.99 7.99 7.99 7.99 7.99 7.99
YoY Growth 0% 0% 0% 0% 0% 0%
Paid-sharing rev 288 336 431 491 519 553 592 1,055 2,155 2,661 2,982
QoQ Growth 17% 29% 14% 6% 6% 7%
YoY Growth 80% 65% 37% 104% 23% 12%
% mix 4% 4% 5% 5% 6% 6% 6% 3% 6% 6% 7%

3 Nov 2023
PLEASE READ THE ANALYST CERTIFICATION AND IMPORTANT DISCLOSURES ON LAST PAGE.
26
Financial Analysis
Revenue Breakdown
We forecast Netflix revenue to grow 6%/13%/9% YoY in FY23/24/25E, for which
streaming subs still serve as the key contributor. We believe the number of subs backed
by overseas expansion, AVODs and paid-sharing initiatives will be the main revenue driver
in the long run. We anticipate a 7.6% CAGR of subs and 3.4% for ARM during FY23-25E.
Key topline drivers come from:
Subs: We forecast a 7.6% CAGR in FY23-25E, mainly driven by 1) overseas
expansion (esp. in APAC (ex-China)/EMEA/LatAm with 13.5%/8.5%/6.8% CAGR
in FY23-25E); 2) rising adoption of the low-priced ad-supported tier among price-
sensitive users; and 3) the password-sharing crackdown to convert password-
sharing users into paid subs (TAM >100mn).
ARM: We expect a 3.4% CAGR in FY23-25E, mainly on 1) continuous price hikes
on unique content, the wave of industry-wide price increases and higher content
cost due to the WGA strike; 2) better ARPU attributable to scaling ad revenue
under the ad-supported tier, although partially offset by a larger mix shift towards
emerging markets (price reductions seen in CAS, SSA, MENA and CEE).
Figure 71: Revenue estimates
Source: Company data, CMBIGM estimates
Figure 72: Subs estimates
Source: Company data, CMBIGM estimates
Figure 73: ARM estimates
Source: Company data, CMBIGM estimates
Figure 74: Revenue mix by region in FY23E
Source: Company data, CMBIGM estimates
0%
5%
10%
15%
20%
25%
-
5,000
10,000
15,000
20,000
25,000
30,000
35,000
40,000
45,000
2021 2022 2023E 2024E 2025E
US$mn
Streaming Rev YoY
0%
2%
4%
6%
8%
10%
12%
14%
0
50
100
150
200
250
300
2021 2022 2023E 2024E 2025E
mn
Subs YoY
-2%
-1%
0%
1%
2%
3%
4%
5%
6%
7%
11.00
11.20
11.40
11.60
11.80
12.00
12.20
12.40
12.60
2021 2022 2023E 2024E 2025E
US$
ARM YoY
UCAN
32%
EMEA
33%
Latin America
18%
APAC (ex-
China)
17%

3 Nov 2023
PLEASE READ THE ANALYST CERTIFICATION AND IMPORTANT DISCLOSURES ON LAST PAGE.
27
Figure 75: Revenue driver estimates
Source: Company data, CMBIGM estimates
US$ mn, Dec-YE 2021 2022 2023E 2024E 2025E 23-25E CAGR
Streaming Rev 29,515 31,470 33,497 37,981 41,488 11.3%
YoY 19% 7% 6% 13% 9%
Subs (mn) 211 224 241 264 279 7.6%
YoY 12% 6% 8% 9% 6%
ARM (US$) 11.65 11.73 11.58 11.99 12.38 3.4%
YoY 6% 1% -1% 4% 3%
Subs (mn), by region
UCAN 74.3 74.2 76.1 80.0 82.1 3.8%
EMEA 69.7 74.2 81.0 90.0 95.3 8.5%
Latin America 38.6 40.2 42.9 46.5 49.0 6.8%
APAC (ex-China) 28.6 35.1 41.1 47.4 52.9 13.5%
YoY
UCAN 3.9% -0.2% 2.7% 5.1% 2.6%
EMEA 15.8% 6.5% 9.1% 11.1% 6.0%
Latin America 9.9% 4.0% 6.8% 8.4% 5.3%
APAC (ex-China) 32.9% 22.7% 17.1% 15.5% 11.6%
As % of total subs
UCAN 35.2% 33.2% 31.6% 30.3% 29.4%
EMEA 33.0% 33.2% 33.6% 34.1% 34.1%
Latin America 18.3% 18.0% 17.8% 17.6% 17.5%
APAC (ex-China) 13.5% 15.7% 17.0% 18.0% 19.0%
ARM (US$), by region
UCAN 14.55 15.83 16.22 17.21 18.07 5.6%
EMEA 11.60 10.94 10.85 11.31 11.65 3.7%
Latin America 7.72 8.44 8.55 8.83 9.10 3.2%
APAC (ex-China) 9.52 8.48 7.59 7.59 7.89 1.9%
YoY
UCAN 9.0% 8.8% 2.4% 6.1% 5.0%
EMEA 7.8% -5.6% -0.9% 4.3% 3.0%
Latin America 3.1% 9.4% 1.2% 3.3% 3.0%
APAC (ex-China) 3.6% -11.0% -10.4% -0.1% 4.0%

3 Nov 2023
PLEASE READ THE ANALYST CERTIFICATION AND IMPORTANT DISCLOSURES ON LAST PAGE.
28
Income Statement
Cost discipline and price hikes to support margin expansion
Netflix net margin climbed up from 5% in 2017 to 17% in 2021, and slightly declined to 14%
in 2022 for heavy content investment amid competition. Going forward, we expect its OPM
to improve to 19.7%/22.4/24.6% in FY23/24/25E (without significant changes in FX), thanks
to price hikes (better ARPU) and a disciplined approach to balancing margin improvement
and investments (incl. content categories, ads capabilities, live offerings and games).
As such, we estimate its adjusted NPM to see 2% improvement during FY23-25E each
year, attributable to 1) manageable content investment amid a disciplined approach and
normalizing competition; and 2) incremental revenue driven by the password-sharing
crackdown and AVODs. We forecast its bottom line to grow at a 24% CAGR in FY23-25E.
Figure 76: Income statement
Source: Company data, CMBIGM estimates
Figure 77: CMBIGM estimates vs consensus
CMBIGM
Consensus
Diff (%)
US$ mn, Dec-YE
FY23E
FY24E
FY25E
FY23E
FY24E
FY25E
FY23E
FY24E
FY25E
Revenue
33,580
37,981
41,488
33,595
38,265
42,386
0.0%
-0.7%
-2.1%
Gross Profit
13,570
16,123
18,153
13,763
16,345
18,728
-1.4%
-1.4%
-3.1%
Operating Profit
6,617
8,520
10,190
6,665
8,629
10,400
-0.7%
-1.3%
-2.0%
Adj. net profit
5,397
6,825
8,351
5,490
7,172
8,739
-1.7%
-4.8%
-4.4%
EPS (US$)
12.00
15.45
19.15
12.22
15.96
19.41
-1.8%
-3.2%
-1.4%
Gross Margin
40.4%
42.5%
43.8%
41.0%
42.7%
44.2%
-0.6ppts
-0.3ppts
-0.4ppts
Operating Margin
19.7%
22.4%
24.6%
19.8%
22.5%
24.5%
-0.1ppts
-0.1ppts
+0.0ppts
Net Margin
16.1%
18.0%
20.1%
16.3%
18.7%
20.6%
-0.3ppts
-0.8ppts
-0.5ppts
Source: Company data, Bloomberg, CMBIGM estimates
US$ mn, Dec-YE FY21 FY22 FY23E FY24E FY25E 23-25E CAGR
Revenue 29,698 31,616 33,580 37,981 41,488 11.2%
Cost of sales (17,333) (19,168) (20,010) (21,858) (23,335)
Gross profit 12,365 12,447 13,570 16,123 18,153 15.7%
S&M (2,545) (2,531) (2,496) (2,765) (2,874)
Admin.Exp. (1,352) (1,573) (1,758) (1,882) (1,973)
Technology and Development (2,274) (2,711) (2,698) (2,957) (3,116)
Others - (15) - (0) (0)
Operating profit 6,195 5,633 6,617 8,520 10,190 24.1%
Pre-tax profit 5,840 5,264 6,099 8,029 9,825
Tax 724 772 702 1,204 1,474
Profit for the period 5,116 4,492 5,397 6,825 8,351 24.4%
Net profit attributable to ordinary shareholders 5,116 4,492 5,397 6,825 8,351
Margin Analysis
Gross margin 41.6% 39.4% 40.4% 42.5% 43.8%
Operating margin 20.9% 17.8% 19.7% 22.4% 24.6%
Net margin 17.2% 14.2% 16.1% 18.0% 20.1%
Growth Analysis
Revenue 18.8% 6.5% 6.2% 13.1% 9.2%
Gross profit 27.2% 0.7% 9.0% 18.8% 12.6%
Operating profit NA -9.1% 17.5% 28.7% 19.6%
Net profit 85.3% -12.2% 20.2% 26.4% 22.4%

3 Nov 2023
PLEASE READ THE ANALYST CERTIFICATION AND IMPORTANT DISCLOSURES ON LAST PAGE.
29
Figure 78: Quarterly financial forecast
Source: Company data, Bloomberg, CMBIGM estimates
Figure 79: Quarterly revenue breakdown
Source: Company data, CMBIGM estimates
US$ mn 3Q21 4Q21 1Q22 2Q22 3Q22 4Q22 1Q23 2Q23 3Q23 4Q23E QoQ YoY Consensus Diff %
Revenue 7,483 7,709 7,868 7,970 7,926 7,852 8,162 8,187 8,542 8,690 1.7% 10.7% 8,696 0%
Gross profit 3,277 2,470 3,583 3,279 3,137 2,448 3,358 3,514 3,611 3,087 -14.5% 26.1% 3,277 -6%
Operating profit 1,755 632 1,972 1,578 1,533 550 1,714 1,827 1,916 1,160 -39.5% 110.9% 1,203 -4%
Net profit 1,449 607 1,597 1,441 1,398 55 1,305 1,488 1,677 927 -44.7% 1576.9% 1,009 -8%
EPS (US$) 3.19 1.33 3.53 3.20 3.10 0.12 2.88 3.29 3.73 2.08 -44.1% 1601.1% 2.20 -5%
Margin (%)
Gross margin 43.8% 32.0% 45.5% 41.1% 39.6% 31.2% 41.1% 42.9% 42.3% 35.5% 37.7%
Operating margin 23.5% 8.2% 25.1% 19.8% 19.3% 7.0% 21.0% 22.3% 22.4% 13.3% 13.8%
Adj. net margin 19.4% 7.9% 20.3% 18.1% 17.6% 0.7% 16.0% 18.2% 19.6% 10.7% 11.6%
Growth (%)
Revenue (YoY) 16.3% 16.0% 9.8% 8.6% 5.9% 1.9% 3.7% 2.7% 7.8% 10.7% 10.5%
Revenue (QoQ) 1.9% 3.0% 2.1% 1.3% -0.6% -0.9% 3.9% 0.3% 4.3% 1.7% 10.7%
Operating profit 33.5% -33.8% 0.6% -14.6% -12.7% -13.0% -13.1% 15.8% 25.0% 110.9% NA
Net profit 83.4% 12.0% -6.4% 6.5% -3.5% -90.9% -18.3% 3.2% 20.0% 1576.9% NA
3Q21 4Q21 1Q22 2Q22 3Q22 4Q22 1Q23 2Q23 3Q23 4Q23E QoQ YoY
Revenue (US$ mn) 7,483 7,709 7,868 7,970 7,926 7,852 8,162 8,187 8,542 8,690 1.7% 10.7%
Total Streaming Revenues 7,439 7,667 7,828 7,933 7,890 7,818 8,130 8,158 8,519 8,690 2.0% 11.1%
UCAN 3,258 3,309 3,350 3,538 3,602 3,595 3,609 3,599 3,735 3,873 3.7% 7.7%
EMEA 2,432 2,523 2,562 2,457 2,376 2,350 2,518 2,562 2,693 2,766 2.7% 17.7%
LATAM 915 964 999 1,030 1,024 1,017 1,070 1,077 1,143 1,109 -2.9% 9.1%
APAC 834 871 917 908 889 857 934 919 948 942 -0.7% 9.9%
DVD 44 42 40 37 35 34 32 29 22 0NA NA

3 Nov 2023
PLEASE READ THE ANALYST CERTIFICATION AND IMPORTANT DISCLOSURES ON LAST PAGE.
30
Balance Sheet
Healthy cash position along with continued share buybacks
Thanks to its sustainable profitability, Netflix is projected to maintain a healthy cash position.
According to our estimates of PBT and change in working capital, Netflix has solid cash
flow to support content investment in the next three years. We anticipate that Netflix will
maintain cash positions of US$7.7bn/10.3bn/13.9bn in FY23/24/25E.
Netflix’s target minimum cash is approximately two months of revenue (~US$6bn), which
they have already exceeded and continue to stay above. Management plans to return
excess cash (above the minimum threshold) to shareholders as it accumulates on the
balance sheet. In 3Q23, Netflix repurchased US$2.5bn of shares and ramped up buyback
authorization by US$10bn, on the back of a sufficient cash position.
Figure 80: Balance sheet
Source: Company data, CMBIGM estimates
US$ mn, Dec-YE FY21 FY22 FY23E FY24E FY25E
Non-current assets 36,515 39,328 38,362 40,757 42,073
Fixed asset 1,323 1,398 1,535 1,571 1,618
Content library, net 30,920 32,737 31,179 32,701 33,396
Others 4,272 5,193 5,648 6,485 7,059
Current assets 8,070 9,266 11,481 14,458 18,407
Cash 6,028 5,147 7,708 10,314 13,942
Content library, net 0 0 0 0 0
Others 2,042 4,119 3,773 4,144 4,465
Current content liabilities 8,489 7,931 7,895 8,751 9,499
Account payable 4,293 4,480 4,333 4,827 5,254
Deferred revenue 837 672 607 633 663
Accrued expenses 1,209 1,265 1,217 1,476 1,607
Others 1,449 1,515 1,738 1,815 1,976
Non-current liabilities 20,246 19,886 19,151 19,428 18,145
Convertible debt 14,693 14,353 13,901 13,501 11,693
Non-current content liabilities 3,094 3,081 2,715 3,024 3,292
Others 2,459 2,452 2,536 2,904 3,161
Total equity 15,849 20,777 22,398 26,637 32,436
Debt Analysis
Total Debt 14,693 14,353 13,901 13,501 11,693
Total Equity 15,849 20,777 22,398 26,637 32,436
D/E ratio 93% 69% 62% 51% 36%
D/A ratio 39% 30% 28% 24% 19%
Current ratio (x) 1.0 1.2 1.5 1.7 1.9

3 Nov 2023
PLEASE READ THE ANALYST CERTIFICATION AND IMPORTANT DISCLOSURES ON LAST PAGE.
31
Cash Flow and Working Capital
Substantial business expansion with growing FCF
Netflix has delivered sustainable growth in the past few years driven by stepped-up content
investment (content amort. +~2x, from US$6.2bn to US$14.6bn in FY23E), along with
margin expansion (OPM +~3x, from 7% in FY17 to 20% in FY23E) and FCF improvement
(from –US$7bn in FY17 to US$6.5bn in FY23E). We attribute this to valuable content
through strategic partnerships with top creators. We expect FCF to reach
US$6.4bn/6.0bn/8.4bn in FY23/24/25E.
Figure 81: Free cash flow projections
Source: Company data, CMBIGM estimates
Figure 82: Cash flow and working capital analysis
Source: Company data, CMBIGM estimates
(2,020) (3,020) (3,274)
1,922
(159)
1,619
6,449 6,006
8,435
7%
10% 13%
18% 21%
18% 20% 22% 25%
0%
5%
10%
15%
20%
25%
30%
(5,000)
-
5,000
10,000
15,000
20,000
FY17 FY18 FY19 FY20 FY21 FY22 FY23E FY24E FY25E
Content Amortization FCF OPM
US$mn
US$ mn, Dec-YE FY21 FY22 FY23E FY24E FY25E
Cash Flow
Profit before taxation (130) 102 88 118 155
Depreciation and amortization 208 337 372 421 431
Change in working capital (242) (758) (764) (477) (317)
Others 556 2,346 7,160 6,400 8,645
Operating cash flow 393 2,026 6,855 6,462 8,913
CAPEX (525) (408) (406) (456) (479)
Acquisitions (788) (757) - - -
Others (27) (911) 397 - -
Investing cash flow (1,340) (2,076) (9) (456) (479)
Proceeds from share issuance (500) (678) 61 (400) (1,808)
Issuance of convertible bond (600) - (4,295) (3,000) (3,000)
Others (50) 14 (14) - -
Financing cash flow (1,150) (664) (4,249) (3,400) (4,808)
Cash at period end 6,028 5,147 7,708 10,314 13,942
Free cash flow (159) 1,619 6,449 6,006 8,435
Working Capital Turnover
Inventory days NA NA NA NA NA
Trade receivables days 35 25 24 23 22
Trade payables days 46 47 42 38 34
Cash conversion cycle (10) (22) (18) (15) (12)

3 Nov 2023
PLEASE READ THE ANALYST CERTIFICATION AND IMPORTANT DISCLOSURES ON LAST PAGE.
32
Valuation
Investment Thesis
We initiate BUY with a DCF-based TP of US$512, implying 33x FY24E P/E. After its better-
than-feared 3Q23 results, we think Netflix has demonstrated its strong net adds (guiding
similar net adds in 4Q23E), resilient margin guidance (22%-23% OPM in FY24E, +2~3ppts
YoY) and increasing FCF (guiding US$6.5bn, vs. prior US$5.0bn), partly alleviating market
concerns about content spending and competition. Despite global macro uncertainty, we
remain positive on Netflix’s long-term subs trend, AVOD expansion and margin expansion,
backed by its vibrant original content pipeline and efficient investment. In our view, Netflix’s
positive price drivers and catalysts would originate from: 1) Content pipeline to pick up after
strikes; 2) competition to pull back; 3) resilient net adds from paid-sharing initiatives and
AVODs penetration; and 4) higher UE and ARPU ahead to drive margin improvement.
DCF valuation
We use DCF valuation as our primary method since we deem it reasonable to apply DCF
valuation to streaming companies with healthy cash flows in the long run. Assuming a
WACC of 12.2% and a terminal growth rate of 3%, our estimated TP is US$512,
representing 33x FY24E P/E.
Figure 83: DCF valuation
Source: Company data, Bloomberg, CMBIGM estimates
DCF Valuation (US$ mn)
2023E 2024E 2025E 2026E 2027E 2028E 2029E 2030E 2031E 2032E 2033E
EBIT 6,617 8,520 10,190 12,084 14,136 17,104 20,525 24,425 28,577 33,149 38,122
Tax (702) (1,204) (1,474) (1,781) (2,133) (1,814) (2,176) (2,590) (3,030) (3,515) (4,042)
D&A 1,704 (376) 514 1,629 2,985 3,104 3,228 3,358 3,492 3,632 3,777
Change in working capital (764) (477) (317) (346) (319) (287) (259) (233) (209) (189) (170)
CAPEX (406) (456) (479) (502) (528) (554) (582) (611) (641) (673) (707)
FCF 6,449 6,006 8,435 11,083 14,141 17,553 20,737 24,349 28,188 32,404 36,980
FCF Growth 298% -7% 40% 31% 28% 24% 18% 17% 16% 15% 14%
PV 6,449 5,354 6,703 7,851 8,929 9,881 10,405 10,891 11,239 11,518 143,183
Terminal Value 414,918
Assumptions
WACC 12.1799%
Tax rate 11.0%
Risk free rate 4.95%
Cost of debt 6.1%
Beta 1.20
Market risk return 10.7%
Cost of equity 12.2%
Debt/Assets 0.0%
Long term growth 3.0%
Debt 0 WACC
~10% 11% 12% 13% 14%
Equity Value 1.5% 626.7 543.3 466.3 422.7 378.0
PV 232,403 2.0% 652.7 562.4 479.9 433.7 386.6
minus: Net debt (US$ mn) 5,678 2.5% 682.2 583.7 495.0 445.7 395.9
minus: Minority interest (US$ mn) 0 HKD 1.0 3.0% 715.9 607.7 511.7 459.0 406.0
Equity Value(US$ mn) 226,725 3.5% 754.8 634.9 530.3 473.6 417.1
No. of shares (mn) 443 4.0% 800.2 666.0 551.2 489.8 429.3
Target Price (US$) based on DCF 512 4.5% 853.8 701.8 574.8 508.0 442.8
Terminal
growth rate

3 Nov 2023
PLEASE READ THE ANALYST CERTIFICATION AND IMPORTANT DISCLOSURES ON LAST PAGE.
33
Peers comparison
As a crosscheck, we select 10 global TMT giants, eight entertainment & content peers, six
media & streaming peers and seven China video entertainment comps for comparison. The
industry multiple is 18x FY24E P/E, below our DCF-based multiple of 33x FY24E P/E.
For global peers, we see Paramount Global and Disney as the most comparable ones for
the streaming business involved. Currently, Paramount Global and Disney’s FY24E P/E is
9.0x/17x, below our TP-based multiple. Since Netflix is a clear leader in the global market
and derives 100% of its revenue from streaming (vs. Paramount/Disney with streaming
revenue contribution at 16%/21% in 2Q23), we think Netflix deserves a premium multiple,
backed by: 1) healthy FCF and a better margin outlook; and 2) a clear growth trajectory
with AVOD expansion and paid-sharing initiatives. For China video comps, iQIYI and
Mango are now trading at 10x/18x FY24E P/E, with low valuation owing to suppressed
sentiment for China’s entertainment sector. Compared to China peers, we think Netflix can
benefit more from ads monetization, overseas expansion and price hikes. We think our
valuation is not demanding for Netflix (15% below historical P/E mean of 38.8x), since
Netflix differentiates itself with high-quality original content creation, data analytics to better
target user preferences, and valuable IP reserves. We believe its potential hit dramas,
AVOD expansion and margin enhancement should bring further upside.
Figure 84: Peers valuation
Source: Bloomberg, CMBIGM estimates
Note: Data as of Oct 30, 2023
Company Ticker Mkt cap Currency Price CMBI CMBI
(USD mn) Raiting TP FY23E FY24E FY25E FY23E FY24E FY25E
Netflix NFLX US 174,140 USD 412 BUY 512 34.3 26.7 21.5 5.4 4.7 4.3 26%
Global TMT Giants
Meta META US 762,555 USD 297 NA NA 20.7 16.5 14.8 5.7 5.1 4.5 19%
Alphabet GOOGL US 1,536,658 USD 122 NA NA 20.7 17.6 15.4 6.0 5.4 4.7 20%
Netflix NFLX US 174,140 USD 398 NA NA 31.7 24.3 19.9 5.2 4.6 4.1 27%
Amazon AMZN US 1,320,069 USD 128 NA NA 37.5 28.2 21.3 2.3 2.1 1.8 27%
Apple AAPL US 2,629,991 USD 168 NA NA 27.5 26.1 24.8 6.9 6.5 6.1 11%
Microsoft MSFT US 2,451,234 USD 330 NA NA 29.2 25.5 21.5 10.1 8.9 7.7 17%
NVDIA NVDA US 1,000,350 USD 405 NA NA 37.6 23.9 20.9 18.3 12.3 10.3 38%
Oracle ORCL US 276,650 USD 101 NA NA 17.8 15.9 13.9 5.2 4.7 4.3 14%
Salesforce CRM US 191,263 USD 197 NA NA 24.1 21.4 18.0 5.5 5.0 4.4 17%
AMD AMD US 155,799 USD 96 NA NA 34.8 24.3 20.1 6.8 5.7 5.0 36%
Average 28.2 22.4 19.1 5.4 4.9 4.4 18%
Digital entertainment & content
Alphabet GOOGL US 1,536,658 USD 122 NA NA 20.7 17.6 15.4 6.0 5.4 4.7 20%
Meta META US 762,555 USD 297 NA NA 20.7 16.5 14.8 5.7 5.1 4.5 19%
Snap SNAP US 15,311 USD 9 NA NA NA 90.7 68.3 3.3 2.9 2.6 96%
Spotify SPOT US 31,630 USD 159 NA NA NA NA 50.5 2.2 1.9 1.7 NA
Pinterest Pins US 16,321 USD 24 NA NA 23.6 22.2 16.3 5.4 4.7 4.0 19%
Match Group MTCH US 9,449 USD 34 NA NA 16.3 13.4 11.5 2.8 2.5 2.3 22%
Average 20.3 17.4 14.5 4.2 3.7 3.3 20%
Media & streaming
Paramount Global PARA US 7,079 USD 11 NA NA 44.6 8.8 7.1 0.2 0.2 0.2 93%
Disney DIS US 145,156 USD 79 NA NA 23.4 16.7 14.0 1.6 1.5 1.5 26%
Warner Bros Discovery WBD US 23,277 USD 10 NA NA NA NA 20.7 0.6 0.5 0.5 NA
Fox Corporation FOXA US 13,855 USD 29 NA NA 9.1 8.1 8.6 1.0 0.9 0.9 9%
Roku ROKU US 7,974 USD 56 NA NA NA NA NA 2.4 2.1 1.8 NA
New York Times NYT US 6,567 USD 40 NA NA 27.7 25.2 21.7 2.7 2.6 2.4 13%
Average 26.2 14.7 14.4 1.4 1.3 1.2 16%
China entertainment
Tencent 700 HK 357,650 HKD 294 BUY 460 17.9 15.0 13.2 4.2 3.8 3.4 16%
Alibaba BABA US 210,646 USD 83 BUY 155 9.1 8.5 7.6 1.6 1.5 1.3 12%
IQIYI IQ US 4,590 USD 5 BUY 9 13.1 9.5 7.8 1.0 1.0 0.9 28%
Mango 300413 CH 6,427 CNY 25 NA NA 20.8 17.5 15.5 3.1 2.8 2.5 17%
Kuaishou 1024 HK 27,834 HKD 50 BUY 97 26.6 14.5 9.6 1.8 1.6 1.4 69%
Bilibili BILI US 5,523 USD 13 BUY 26 NA NA 49.3 1.8 1.5 1.3 NA
China Literature 772 HK 3,494 HKD 27 NA NA 17.3 15.1 13.4 3.3 3.0 2.8 13%
Average 15.6 13.4 11.2 2.1 1.9 1.7 17%
Average 24.1 18.1 15.5 3.3 2.9 2.6 18%
PE
PS
FY23-25 EPS
CAGR

3 Nov 2023
PLEASE READ THE ANALYST CERTIFICATION AND IMPORTANT DISCLOSURES ON LAST PAGE.
34
Figure 85: Netflix historical P/E band
Source: Bloomberg, company data, CMBIGM
Figure 86: Netflix historical P/S band
Source: Bloomberg, company data, CMBIGM
Figure 87: Financial metrics of Netflix and peers in FY22
US$mn
Netflix
Meta
Paramount
Disney
iQIYI
Mango
Ticker
NFLX US
META US
PARA US
DIS US
IQ US
300413 CH
Revenue
31,616
116,609
30,154
83,745
4,312
2,038
Gross profit
12,447
91,360
10,309
28,671
993
690
GPM
39%
78%
34%
34%
23%
34%
Adj.NP
4,331
27,208
1,116
4,671
42
263
Adj. NPM
14%
23%
4%
6%
1%
13%
Source: Bloomberg, company data, CMBIGM
Figure 88: FY22 revenue comparison
Source: Bloomberg, company data, CMBIGM
Figure 89: Revenue growth comparison
Source: Bloomberg, company data, CMBIGM estimates
Figure 90: Earnings growth comparison
Source: Bloomberg, company data, CMBIGM estimates
Figure 91: GPM comparison
Source: Bloomberg, company data, CMBIGM estimates
0
20
40
60
80
100
120
Oct-18
Jan-19
Apr-19
Jul-19
Oct-19
Jan-20
Apr-20
Jul-20
Oct-20
Jan-21
Apr-21
Jul-21
Oct-21
Jan-22
Apr-22
Jul-22
Oct-22
Jan-23
Apr-23
Jul-23
1-yr fwd P/E Mean Mean +1SD Mean-1SD
0
2
4
6
8
10
12
Oct-18
Jan-19
Apr-19
Jul-19
Oct-19
Jan-20
Apr-20
Jul-20
Oct-20
Jan-21
Apr-21
Jul-21
Oct-21
Jan-22
Apr-22
Jul-22
Oct-22
Jan-23
Apr-23
Jul-23
1-yr fwd P/S Mean Mean +1SD Mean-1SD
0
20,000
40,000
60,000
80,000
100,000
120,000
140,000
Netflix Meta Disney Paramount iQIYI Mango
US$ mn
-20%
-10%
0%
10%
20%
30%
40%
2020 2021 2022 2023E 2024E 2025E
Netflix Meta Paramount
Disney iQIYI Mango
-100%
-50%
0%
50%
100%
150%
2020 2021 2022 2023E 2024E 2025E
Netflix Meta Paramount
Disney iQIYI Mango
0%
10%
20%
30%
40%
50%
60%
70%
80%
90%
2020 2021 2022 2023E 2024E 2025E
Netflix Meta Paramount
Disney iQIYI Mango

3 Nov 2023
PLEASE READ THE ANALYST CERTIFICATION AND IMPORTANT DISCLOSURES ON LAST PAGE.
35
Figure 92: OPM comparison
Source: Bloomberg, company data, CMBIGM estimates
Figure 93: Adj. NPM comparison
Source: Bloomberg, company data, CMBIGM estimates
Key Investment Risks
Key investment risks: 1) subs churning due to price hikes; 2) lower-than-expected
expansion of the ad-supported tier and unsuccessful password-sharing crackdown; 3) ARM
pressure from the low-priced package and overseas expansion; 4) ramped-up content
investment on intensified competition; 5) margin dilution on stepped-up investment; and 6)
global macro uncertainty.
-30%
-20%
-10%
0%
10%
20%
30%
40%
50%
2020 2021 2022 2023E 2024E 2025E
Netflix Meta Paramount
Disney iQIYI Mango
-30%
-20%
-10%
0%
10%
20%
30%
40%
2020 2021 2022 2023E 2024E 2025E
Netflix Meta Paramount
Disney iQIYI Mango

3 Nov 2023
PLEASE READ THE ANALYST CERTIFICATION AND IMPORTANT DISCLOSURES ON LAST PAGE.
36
Financial Summary
Income statement
Cash flow summary
YE 31 Dec (US$ mn)
FY21A
FY22A
FY23E
FY24E
FY25E
YE 31 Dec (US$ mn)
FY21A
FY22A
FY23E
FY24E
FY25E
Revenue
29,698
31,616
33,580
37,981
41,488
Net income
(130)
102
88
118
155
Streaming
29,515
31,470
33,497
37,981
41,488
D&A
208
337
372
421
431
DVD
182
146
83
-
-
Change in WC
(242)
(758)
(764)
(477)
(317)
Others
556
2,346
7,160
6,400
8,645
COGS
(17,333)
(19,168)
(20,010)
(21,858)
(23,335)
Operating CF
393
2,026
6,855
6,462
8,913
Gross profit
12,365
12,447
13,570
16,123
18,153
Capex
(525)
(408)
(406)
(456)
(479)
S&M
(2,545)
(2,531)
(2,496)
(2,765)
(2,874)
Acquisitions
(788)
(757)
-
-
-
Admin.Exp.
(1,352)
(1,573)
(1,758)
(1,882)
(1,973)
Others
(27)
(911)
397
-
-
Technology and
Development
(2,274)
(2,711)
(2,698)
(2,957)
(3,116)
Investing CF
(1,340)
(2,076)
(9)
(456)
(479)
Others
-
(15)
-
(0)
(0)
Operating profit
6,195
5,633
6,617
8,520
10,190
Proceeds from debt
(500)
(678)
61
(400)
(1,808)
Repurchases of common stock
(600)
-
(4,295)
(3,000)
(3,000)
Financial income
(766)
(706)
(698)
(675)
(611)
Others
(50)
14
(14)
-
-
Other income
411
337
179
184
246
Financing CF
(1,150)
(664)
(4,249)
(3,400)
(4,808)
Pre-tax Income
5,840
5,264
6,099
8,029
9,825
Net change in cash
(2,178)
(881)
2,561
2,606
3,627
Income Tax
724
772
702
1,204
1,474
Cash (beg of yr)
8,206
6,028
5,147
7,708
10,314
MI
-
-
-
-
-
Share of equity investment
-
-
-
-
-
Net profit
5,116
4,492
5,397
6,825
8,351
Balance sheet
Key ratios
YE 31 Dec (US$ mn)
FY21A
FY22E
FY23E
FY24E
FY25E
YE 31 Dec
FY21A
FY22E
FY23E
FY24E
FY25E
Non-current assets
36,515
39,328
38,362
40,757
42,073
Sales mix (%)
Fixed asset
1,323
1,398
1,535
1,571
1,618
Streaming
99.4
99.5
99.8
100.0
100.0
Content library, net
30,920
32,737
31,179
32,701
33,396
DVD
0.6
0.5
0.2
0.0
0.0
Others
4,272
5,193
5,648
6,485
7,059
Total
100.0
100.0
100.0
100.0
100.0
Current assets
8,070
9,266
11,481
14,458
18,407
Growth rate (%)
Cash
6,028
5,147
7,708
10,314
13,942
Revenue
18.8
6.5
6.2
13.1
9.2
Content library, net
-
-
-
-
-
Gross profit
27.2
0.7
9.0
18.8
12.6
Others
2,042
4,119
3,773
4,144
4,465
EBIT
NA
NA
NA
28.7
19.6
Net profit
85.3
(12.2)
20.2
26.4
22.4
Current liabilities
8,489
7,931
7,895
8,751
9,499
Current content liabilities
4,293
4,480
4,333
4,827
5,254
P&L ratios (%)
Account payable
837
672
607
633
663
Operating margin
20.9
17.8
19.7
22.4
24.6
Deferred revenue
1,209
1,265
1,217
1,476
1,607
Pre-tax margin
19.7
16.6
18.2
21.1
23.7
Accrued expenses
1,449
1,515
1,738
1,815
1,976
Adj. net margin
17.2
14.2
16.1
18.0
20.1
Effective tax rate
12.4
14.7
11.5
15.0
15.0
Non-current liabilities
20,246
19,886
19,151
19,428
18,145
Convertible debt
14,693
14,353
13,901
13,501
11,693
Returns (%)
Non-current content
liabilities
3,094
3,081
2,715
3,024
3,292
ROE
38.0
24.5
25.0
27.8
28.3
Others
2,459
2,452
2,536
2,904
3,161
ROA
12.2
9.6
11.0
13.0
14.4
Total net assets
15,849
20,777
22,797
27,036
32,835
Per share
Shareholders' equity
15,849
20,777
22,398
26,637
32,436
EPS (US$)
11.2
9.9
12.0
15.5
19.1
DPS (US$)
0.0
0.0
0.0
0.0
0.0
BVPS (US$)
34.8
46.0
49.8
60.3
74.4
Source: Company data, CMBIGM estimates

3 Nov 2023
PLEASE READ THE ANALYST CERTIFICATION AND IMPORTANT DISCLOSURES ON LAST PAGE.
37
Disclosures & Disclaimers
Analyst Certification
The research analyst who is primary responsible for the content of this research report, in whole or in part, certifies that with respect to the securities
or issuer that the analyst covered in this report: (1) all of the views expressed accurately reflect his or her personal views about the subject securities
or issuer; and (2) no part of his or her compensation was, is, or will be, directly or indirectly, related to the specific views expressed by that analyst
in this report.
Besides, the analyst confirms that neither the analyst nor his/her associates (as defined in the code of conduct issued by The Hong Kong Securities
and Futures Commission) (1) have dealt in or traded in the stock(s) covered in this research report within 30 calendar days prior to the date of issue
of this report; (2) will deal in or trade in the stock(s) covered in this research report 3 business days after the date of issue of this report; (3) serve
as an officer of any of the Hong Kong listed companies covered in this report; and (4) have any financial interests in the Hong Kong listed companies
covered in this report.
CMBIGM Ratings
BUY : Stock with potential return of over 15% over next 12 months
HOLD : Stock with potential return of +15% to -10% over next 12 months
SELL : Stock with potential loss of over 10% over next 12 months
NOT RATED : Stock is not rated by CMBIGM
OUTPERFORM : Industry expected to outperform the relevant broad market benchmark over next 12 months
MARKET-PERFORM : Industry expected to perform in-line with the relevant broad market benchmark over next 12 months
UNDERPERFORM : Industry expected to underperform the relevant broad market benchmark over next 12 months
CMB International Global Markets Limited
Address: 45/F, Champion Tower, 3 Garden Road, Hong Kong, Tel: (852) 3900 0888 Fax: (852) 3900 0800
CMB International Global Markets Limited (“CMBIGM”) is a wholly owned subsidiary of CMB International Capital Corporation Limited (a wholly owned
subsidiary of China Merchants Bank)
Important Disclosures
There are risks involved in transacting in any securities. The information contained in this report may not be suitable for the purposes of all investors. CMBIGM does
not provide individually tailored investment advice. This report has been prepared without regard to the individual investment objectives, financial position or special
requirements. Past performance has no indication of future performance, and actual events may differ materially from that which is contained in the report. The value
of, and returns from, any investments are uncertain and are not guaranteed and may fluctuate as a result of their dependence on the performance of underlying assets
or other variable market factors. CMBIGM recommends that investors should independently evaluate particular investments and strategies, and encourages investors
to consult with a professional financial advisor in order to make their own investment decisions.
This report or any information contained herein, have been prepared by the CMBIGM, solely for the purpose of supplying information to the clients of CMBIGM or its
affiliate(s) to whom it is distributed. This report is not and should not be construed as an offer or solicitation to buy or sell any security or any interest in securities or
enter into any transaction. Neither CMBIGM nor any of its affiliates, shareholders, agents, consultants, directors, officers or employees shall be liable for any loss,
damage or expense whatsoever, whether direct or consequential, incurred in relying on the information contained in this report. Anyone making use of the information
contained in this report does so entirely at their own risk.
The information and contents contained in this report are based on the analyses and interpretations of information believed to be publicly available and reliable. CMBIGM
has exerted every effort in its capacity to ensure, but not to guarantee, their accuracy, completeness, timeliness or correctness. CMBIGM provides the information,
advices and forecasts on an "AS IS" basis. The information and contents are subject to change without notice. CMBIGM may issue other publications having information
and/ or conclusions different from this report. These publications reflect different assumption, point-of-view and analytical methods when compiling. CMBIGM may make
investment decisions or take proprietary positions that are inconsistent with the recommendations or views in this report.
CMBIGM may have a position, make markets or act as principal or engage in transactions in securities of companies referred to in this report for itself and/or on behalf
of its clients from time to time. Investors should assume that CMBIGM does or seeks to have investment banking or other business relationships with the companies in
this report. As a result, recipients should be aware that CMBIGM may have a conflict of interest that could affect the objectivity of this report and CMBIGM will not assume
any responsibility in respect thereof. This report is for the use of intended recipients only and this publication, may not be reproduced, reprinted, sold, redistributed or
published in whole or in part for any purpose without prior written consent of CMBIGM.
Additional information on recommended securities is available upon request.
For recipients of this document in the United Kingdom
This report has been provided only to persons (I)falling within Article 19(5) of the Financial Services and Markets Act 2000 (Financial Promotion) Order 2005 (as amended
from time to time)(“The Order”) or (II) are persons falling within Article 49(2) (a) to (d) (“High Net Worth Companies, Unincorporated Associations, etc.,) of the Order, and
may not be provided to any other person without the prior written consent of CMBIGM.
For recipients of this document in the United States
CMBIGM is not a registered broker-dealer in the United States. As a result, CMBIGM is not subject to U.S. rules regarding the preparation of research reports and the
independence of research analysts. The research analyst who is primary responsible for the content of this research report is not registered or qualified as a research
analyst with the Financial Industry Regulatory Authority (“FINRA”). The analyst is not subject to applicable restrictions under FINRA Rules intended to ensure that the
analyst is not affected by potential conflicts of interest that could bear upon the reliability of the research report. This report is intended for distribution in the United States
solely to "major US institutional investors", as defined in Rule 15a-6 under the US, Securities Exchange Act of 1934, as amended, and may not be furnished to any other
person in the United States. Each major US institutional investor that receives a copy of this report by its acceptance hereof represents and agrees that it shall not
distribute or provide this report to any other person. Any U.S. recipient of this report wishing to effect any transaction to buy or sell securities based on the information
provided in this report should do so only through a U.S.-registered broker-dealer.
For recipients of this document in Singapore
This report is distributed in Singapore by CMBI (Singapore) Pte. Limited (CMBIGMG) (Company Regn. No. 201731928D), an Exempt Financial Adviser as defined in the
Financial Advisers Act (Cap. 110) of Singapore and regulated by the Monetary Authority of Singapore. CMBIGMG may distribute reports produced by its respective
foreign entities, affiliates or other foreign research houses pursuant to an arrangement under Regulation 32C of the Financial Advisers Regulations. Where the report is
distributed in Singapore to a person who is not an Accredited Investor, Expert Investor or an Institutional Investor, as defined in the Securities and Futures Act (Cap. 289)
of Singapore, CMBIGMG accepts legal responsibility for the contents of the report to such persons only to the extent required by law. Singapore recipients should contact
CMBIGMG at +65 6350 4400 for matters arising from, or in connection with the report.