Professional Learning Communities and Student Outcomes: A Quantitative Analysis of the PLC at Work Model in Arkansas Schools PDF Free Download
1 / 53/53
100%

Office for Education Policy
University of Arkansas
211 Graduate Education Building
Fayetteville, AR 72701
Phone: (479) 575-3773
Fax: (479) 575-3196
E-mail: oep@uark.edu
Abstract:
This study evaluates the impact of the Professional Learning Communities
(PLC) at Work model on student achievement and growth in Arkansas schools.
Implemented through a partnership between the Arkansas Department of
Education and Solution Tree, the program promotes collaborative professional
development among educators. Using a matching process and an event study
framework, we analyze longitudinal data on student performance in English
Language Arts (ELA) and mathematics from multiple cohorts of schools.
The overall results reveal mixed outcomes. While no statistically significant
improvements were observed in overall student achievement or growth, there
were concerning trends for economically disadvantaged students. This
subgroup exhibited consistent negative associations with program participation,
particularly in mathematics, suggesting the PLC at Work model may not be
positively impacting these students. Additionally, while some cohorts showed
temporary positive effects in ELA growth, these did not persist. The results
raise concerns about the program's current effectiveness and suggest a need for
enhanced oversight and accountability. The study contributes valuable insights
for policymakers and educators aiming to leverage professional development
initiatives to enhance student outcomes.
Keywords: Professional learning communities, PLCs, PLC at Work,
professional development
Arkansas Education Report
Volume 21, Issue 1
Professional Learning Communities
and Student Outcomes:
A Quantitative Analysis of the
PLC at Work Model in Arkansas Schools
Kate Barnes
Sarah McKenzie, Ph.D.
University of Arkansas
June 4, 2024

Professional Learning Communities and Student Outcomes 1
Table of Contents
I. Introduction ............................................................................................................................ 2
II. Study Context......................................................................................................................... 3
Professional Learning Communities and Solution Tree ................................................ 3
Arkansas Context ........................................................................................................... 4
Financial Relationship .................................................................................................... 5
III. Review of Literature .............................................................................................................. 6
IV. Methodology .......................................................................................................................... 8
Data ................................................................................................................................ 8
Sample .......................................................................................................................... 10
Analytic Approach ....................................................................................................... 12
PLC at Work Cohorts............................................................................................ 12
Matching Approach .............................................................................................. 13
Estimation Model ......................................................................................................... 15
Outcomes of Interest: ............................................................................................ 17
V. Results .................................................................................................................................. 19
Overall Results ............................................................................................................. 19
Weighted Average Achievement ................................................................................. 21
Overall Growth............................................................................................................. 26
English Language Arts Growth .................................................................................... 30
Math Growth ................................................................................................................ 35
VI. Conclusions .......................................................................................................................... 39
Limitations ................................................................................................................... 40
Policy Recommendations ............................................................................................. 42
Enhanced Transparency from Solution Tree ........................................................ 42
Strengthened Oversight and Accountability ......................................................... 43
Audit of PLC at Work Program Effectiveness ..................................................... 43
VII. References ............................................................................................................................ 45

Professional Learning Communities and Student Outcomes 2
I. Introduction
Professional Learning Communities (PLCs) have gained significant traction as a model
for professional development within the educational landscape (Stoll et al., 2006). While there is
no single, universally accepted definition of a PLC, they are typically characterized by a
framework of collaborative learning among teachers (Stoll et al., 2006; Ward, 2023). Schools
utilizing PLCs organize teachers into working groups to foster practice-based professional
learning with aims of achieving improved student learning outcomes. PLCs diverge from
traditional, stand-alone professional development (PD) programs by fostering a more
comprehensive, school or district-wide effort prioritizing continuous improvement (DuFour &
Eaker, 1998; Stoll et al., 2006; Ward, 2023). The emphasis extends beyond individual educator
development to encompass the overall school culture and structure.
In 2017, the Arkansas State Legislature passed Act 427 which allocated additional
funding for the development and administration of PLCs to benefit public school districts
(Arkansas Code Annotated, § 6-20-2305(b)(5)). Subsequently, a partnership began between
Arkansas schools and Solution Tree, a consulting and professional development company
specializing in PLC implementation. Through this partnership, Solution Tree’s PLC at Work
program was implemented statewide. Public schools across Arkansas are eligible to apply to
become a PLC at Work school. Selected schools receive intensive on-site professional
development services to support the full implementation of PLCs, including, but not limited to,
up to 50 days of on-site training, coaching, and support from certified Solution Tree PLC at
Work associates, access to a comprehensive resource library, and invitations to attended Solution
Tree conferences and events.
Professional Learning Communities and Student Outcomes 3
This research paper addresses the question: How does Solution Tree's PLC at Work
model impact student achievement and growth in Arkansas schools? Leveraging publicly
available data from the Arkansas Department of Education, we employ a rigorous quantitative
analysis to examine the PLC at Work program's effectiveness across multiple cohorts of schools.
Our methodology incorporates a two-stage matching process and a difference-in-differences
framework to isolate the effects of the PLC at Work initiative on student performance.
This study provides the first large-scale evaluation of the PLC at Work model's
effectiveness, offering valuable insights into its potential to improve educational outcomes in
diverse school settings. The significance of this research lies in its contribution to the empirical
evidence on PLCs. By examining a statewide implementation, this study offers insights into the
scalability and effectiveness of the PLC at Work model in improving student performance. The
findings hold significant implications for policymakers, educators, and researchers interested in
leveraging professional development to enhance educational practices and student outcomes.
II. Study Context
Professional Learning Communities and Solution Tree
Professional Learning Communities (PLCs) are a framework for educational professional
development focusing on collaboration and continuous learning among educators. PLCs aim to
improve student outcomes by fostering an environment where educators work together to explore
best practices, implement instructional strategies, and assess their effectiveness through ongoing,
job-embedded learning. The framework, as Richard DuFour and Robert Eaker articulated,
includes several key characteristics: a shared mission, vision, values, and goals; collaborative
teams focused on learning; a collective inquiry into best practices; action orientation and

Professional Learning Communities and Student Outcomes 4
experimentation; commitment to continuous improvement; and a results-oriented approach
(DuFour & Eaker, 1998).
Solution Tree is a company that supports the implementation of PLCs by providing
professional development services and resources. Their PLC at Work process includes up to 50
days of on-site professional development annually, covering training, coaching, and
observations. Training sessions address topics such as leadership coaching, assessment, and
interventions. Additionally, schools receive extensive print and video resources to support
implementation and are encouraged to participate in conferences to share best practices and
strategies (PLC at Work in Arkansas).
Arkansas Context
The implementation of the PLC model in Arkansas is supported by Act 427 of 2017,
which mandated increases in professional development funding to be used each school year to
develop and administer professional learning communities (Arkansas Code Annotated, § 6-20-
2305(b)(5)). In 2017, the Arkansas Division of Elementary and Secondary Education (DESE)
launched the PLC at Work program in partnership with Solution Tree (Press Release: Arkansas
Launches Professional Learning Communities Pilot Project, 2017). This initiative responded to
the 2016 Adequacy Report recommendations and aimed to enhance learning outcomes for
students and educators by promoting the PLC at Work process in selected Arkansas schools.
DESE defines a PLC as an "ongoing process in which educators work collaboratively in
recurring cycles of collective inquiry and action research to achieve better results for the students
they serve" (Bureau of Legislative Research, 2016). The underlying assumption is that
continuous job-embedded learning for educators is the key to improving student learning.
Professional Learning Communities and Student Outcomes 5
The Arkansas PLC at Work initiative includes 90 schools selected through a rigorous
application and evaluation process (PLC at Work in Arkansas). At the program's start, a needs
assessment examines process and achievement data, while formative assessments throughout the
year evaluate growth and determine the next steps. Each participating school receives a
customized plan based on the needs assessment and is paired with a certified Solution Tree PLC
at Work Associate or Site Coach to coordinate implementation. This coach is overseen by a
project management team that monitors, assesses, and reports on school services, providing
feedback to DESE. Schools receive a comprehensive resource package to ensure successful
program implementation and sustainability. Resources include up to 50 days of on-site
professional development delivered by certified associates, access to a library of digital and print
resources (books, videos, online courses, Global PD subscription), and participation in PLC
events and conferences. Solution Tree's library of PLC-related content (case studies, best
practices, research findings) further supports educators' continuous learning and collaboration.
Throughout the process, ongoing support is provided through regular communication with Site
Coaches, ensuring timely assistance for educators. Participation in the PLC at Work program
aims to increase student achievement and growth through teacher collaboration, a focus on
learning, and a results orientation. PLC members utilize data collected and analyzed at the school
level to drive their decision-making process.
Financial Relationship
The financial relationship between Arkansas and Solution Tree has evolved significantly
since 2017 when the state awarded Solution Tree a one-year $4 million no-bid contract (Roberts,
2024). This contract has grown over the years to a $16.5 million per-year contract. According to
Arkansas State Representative Grant Hodges, the total financial benefit to Solution Tree,

Professional Learning Communities and Student Outcomes 6
considering contracts from the state Department of Education, education service cooperatives,
school districts, and higher education institutions, exceeds $140 million (Roberts, 2024). This
substantial investment has raised questions about the effectiveness of PLC at Work providing
benefits to Arkansas teachers and students.
III. Review of Literature
The materials for Solution Tree's Professional Learning Communities (PLC) program
state that implementing it will "increase student achievement and ensure learning for all,"
however, there is limited peer-reviewed quantitative research examining the relationship between
the implementation of PLCs and increased student performance on standardized assessments. As
noted by Bolam et al. (2005), however, "There is no universal definition of a PLC" (p.5). In a
2008 review of the literature on professional learning communities, only one peer-reviewed
quantitative study that examined the relationship between teachers' participation in learning
communities and student achievement was identified. (Vescio el al., 2008). Although not
specifically Solution Tree's PLC model, the study of 24 schools found that higher achievement
levels were related to strong professional communities in schools (Louis & Marks, 1998).
Several studies have been conducted since Vescio's review that examine the relationship
between teacher collaboration teams and student achievement. A study of 47 elementary schools in
a large midwestern school district found that fourth-grade students have higher achievement in
mathematics and reading when they attend schools characterized by higher levels of teacher
collaboration (Goddard et al., 2007). In a quasi-experimental study, Saunders et al. (2009) found
that nine elementary schools that implemented a process for focusing grade and school-level
instructional teams on improving student learning produced significantly greater achievement
Professional Learning Communities and Student Outcomes 7
gains than those in six comparison schools. A study on a school in Iceland found possible
positive associations between introducing professional learning communities and student
academic outcomes (Sigurðardóttir, 2010). A methodologically rigorous study examining whether
teacher collaborations in 336 Miami-Dade Country, Florida public schools predicted school-level
value-added growth in student achievement found that teachers and schools that engage in better
quality collaboration have small statistically significant impacts on value-added scores in math
and reading (Ronfeldt et al., 2015). Burns et al., 2018 found small to moderate correlations
between the levels of collaborative leadership process and data-driven systems for learning and
student achievement in 181 Missouri schools that implemented PLCs. (Burns et al., 2018). When
examined by content area, mathematics achievement was generally more positively impacted
than literacy achievement, consistent with prior research (Ronfeldt et al., 2015; Sigurðardóttir,
2010).
While the studies discussed previously considered teacher collaboration teams broadly,
some studies have focused on Solution Tree's model of PLCs specifically. A 2015 study of five
elementary schools revealed small but statistically significant correlations between student
achievement on the state assessment for three PLC dimensions: collaboratively reviewing
student work, working with colleagues to judge the quality of student work, and discussing
substantive student-centered educational issues (Ratts et al., 2015). One quasi-experimental
study of three high schools found evidence that PLCs positively impact student achievement
gains when implemented well and alongside project-based learning (Capraro et al., 2016).
While previous studies have examined student achievement related to teacher
collaboration generally or the quality of PLCs specifically, this study examines the effect of
Professional Learning Communities and Student Outcomes 8
implementing the PLC at Work model on student achievement and growth in Arkansas. An
evaluation from Hanson et al. (2021), conducted on behalf of Solution Tree and DESE, found
that after two years of PLC at Work implementation, the model had no effects on English
language arts achievement test scores and positive impacts on math achievement test scores
(0.083 standard deviations, p = 0.014). The following groups performed statistically significantly
better in math: White, Male, Non-English Language Learners, Non-Special Education Students,
both economically disadvantaged and non-economically disadvantaged students, and students
scoring in the top 25% on state assessments in math and English Language Arts prior to PLC at
Work implementation. In English Language Arts, only students who were never economically
disadvantaged showed statistically significant improvement (Hanson et al., 2021).
The authors of the 2021 evaluation suggested that future research evaluate the effects of the
full three-year intervention and replicate the studies for other cohorts of schools in the Arkansas
initiative. This study builds on the initial findings of Hanson et al., expanding to cover all six
cohorts of Arkansas's PLC at Work schools.
IV. Methodology
Data
In this study, we leverage publicly available school data from the Arkansas Department
of Education (ADE) Data Center, including student achievement scores and growth measures, to
investigate the association between student achievement and growth in schools partnered with
Solution Tree as PLC at Work schools.
The ADE Data Center is a comprehensive repository of data systems, tools, and reports
accessible to educational stakeholders. In adherence to state and federal legislative requirements,
Professional Learning Communities and Student Outcomes 9
the ADE collaborates with Arkansas public schools in data collection for public dissemination.
Schools and districts contribute data through secure platforms like eSchoolPlus and
eFinancePlus. The ADE validates data quality and accuracy through established procedures and
reports undergo review to ensure veracity before submission. Finally, districts must sign and
return a "Certification of Data Accuracy" form for each data collection cycle, as mandated by the
ADE.
Student achievement data for this analysis originates from Arkansas's publicly available
school report cards. Act 6-15-1402 of the Arkansas Code mandates the ADE's Division of
Elementary and Secondary Education (DESE) annually produce and publish a school
performance report for each public school within the state. These reports are readily accessible to
schools, parents, and the local community. Furthermore, in alignment with stakeholder input, the
ADE has synchronized the state's accountability system, encompassing the School Rating
System, with the Arkansas Every Student Succeeds Act (ESSA) plan, which reflects federal
accountability measures. The ESSA School Index score and the stakeholder-recommended rating
scale serve as the basis for assigning letter grades (ratings) to schools.
Our analysis utilized a comprehensive longitudinal dataset for each school year from
2016-17 to 2022-23 obtained from the ADE Data Center. This data encompassed student
performance metrics English Language Arts (ELA) and mathematics from required state
assessments for students in grades 3-10. Weighted achievement scores for all students and
economically disadvantaged students, was included along with the corresponding student counts
used for calculating the weighted achievement. Additionally, value-added growth scores were
obtained, for both the overall student population and economically disadvantaged students. The
number of students contributing to each growth score calculation was also included in the data.
Professional Learning Communities and Student Outcomes 10
To facilitate appropriate group comparisons, supplementary school-level data was
collected. This data comprised school characteristics such as grade span, total enrollment, and
the percentage of students meeting benchmark readiness standards in ELA and math. Student
demographic data was obtained, including the percentage of students categorized as male, Black,
Hispanic/Latino, or white. The data also included the percentage of students eligible for various
federal programs such as English language learners (ELL), free or reduced-price lunch (FRL),
and special education services (SPED). Finally, data on teacher experience was collected,
including average years of experience and the percentage of teachers with less than three years of
experience.
Sample
PLC at Work schools received specialized support and resources to implement the PLC at
Work model. DESE selected these schools through a competitive application and evaluation
process (PLC at Work in Arkansas). A panel of education professionals with expertise in the
PLC at Work model reviewed applications and employed a scoring rubric to select schools for
participation. Table 1 presents the characteristics of selected schools in the year preceding their
partnership with Solution Tree with the characteristics of all other Arkansas schools.

Professional Learning Communities and Student Outcomes 11
Table 1
Student Enrollment, Teacher Characteristics, and Baseline Achievement in PLC at Work
Schools vs. Other Arkansas Schools, 2016-2023
Project Schools
All Other
AR Schools
N=90
N=975
Average Student Enrollment Characteristics
Enrollment
488
451
% African American/Black
23
20
% Hispanic/Latino
15
11***
% White
56
63**
% Free or Reduced-Price Lunch
77
68***
% English Language Learners
10
7***
% Special Education
14
14
Average Teacher Characteristics
Years of Teaching Experience
10.48
10.55
% Inexperienced Teachers
20
20
Percentage of Students who Met/Exceeded Benchmark Standards on State Assessments
English Language Arts
37
42***
Math
37
42***
*** p<0.01, **p<0.05, *p<0.1
Note: Due to the selection focus on traditional public schools, data presented in ‘All Other AR Schools’ column
excludes charter schools/charter school networks, private schools, primary schools, and schools providing
special services.
As shown in Table 1, in the year prior to selection to participate in the PLC at Work program,
PLC at Work schools enrolled a statistically significantly greater percentage of students who are
Hispanic/Latino, are eligible for Free or Reduced-Price Lunch, and are English language learners
than schools not selected to be PLC at Work schools. Additionally, in the year before selecting
for participation in the PLC at Work program, students in selected schools were statistically

Professional Learning Communities and Student Outcomes 12
significantly less likely to meet or exceed standards on state assessments in ELA and
mathematics than students in schools not selected to be PLC at Work schools
1
.
Analytic Approach
Following the prior evaluations of PLC at Work schools conducted by Education
Northwest, our study employed a two-stage analytical approach to investigate the association
between in PLC at Work participation and student achievement and growth (Hanson et al.,
2021). The first stage focused on establishing baseline equivalency between treatment and
comparison groups through a matching process, detailed below. Following this matching
procedure, we implemented an event study analysis to estimate the impact of PLC at Work
participation on student academic performance. This event study analysis was conducted for both
the overall student population and a subgroup of students qualifying for free or reduced-price
lunch, a common proxy for low socioeconomic status.
PLC at Work Cohorts
To explore the connections between PLC at Work schools and student academic
outcomes, we employed a cohorting strategy. Schools designated as PLC at Work partners with
Solution Tree were assigned cohorts based on their initial partnership year. This cohort structure
addresses the potential influence of varying implementation timelines across selected schools.
This cohort structure addresses a potential confounding effect, or when a third variable, not
directly related to PLC at Work implementation, influences our outcomes of interest. Table 2
1
Two PLC at Work schools, Booker Arts Magnet School in the Little Rock School District and Pinewood
Elementary School in the Jacksonville North Pulaski Special School District were excluded from the final sample
due to their closure after program participation. Pinewood Elementary merged with Warren Dupree Elementary to
form Jacksonville Elementary School, a PLC at Work school within Cohort 3. To reasonably estimate Jacksonville
Elementary's pre-implementation data, we used the combined weighted averages of the prior year's scores from both
Pinewood Elementary and Warren Dupree Elementary.

Professional Learning Communities and Student Outcomes 13
presents information about cohorts and the year they were selected to be PLC at Work schools.
Note that because standardized testing was cancelled in 2019-20 due to due to COVID-19 school
closures, Cohort 3 includes schools that started as PLC at Work schools in both 2019-20 and
2020-21. A full description schools and districts across cohorts, along with the year they joined
the PLC at Work program, can be found in the appendix.
Table 2
Cohorting and Adoption Years of PLC at Work Schools by Grade Span
Cohort
PLC at Work
Adoption Year
Grade Span
N
Elementary
Middle
High
Cohort 1
2017-18
11
6
2
3
Cohort 2
2018-19
13
8
2
3
Cohort 3
2019-20 & 2020-21
25
13
2
10
Cohort 4
2021-22
18
11
4
3
Cohort 5
2022-23
23
8
6
9
Matching Approach
To achieve baseline equivalency between PLC at Work schools and comparison groups,
we employed a one-stage propensity score matching (PSM) technique (Rosenbaum & Rubin,
1983). In Arkansas, schools applied to participate in the PLC at Work program, introducing the
potential for selection bias. Selection bias could occur if there was non-random assignment of
schools selected as PLC at Work school and comparison schools, distorting the observed
relationship between the PLC at Work schools and students' academic outcomes. PSM addresses
this by creating a group of comparison schools that statistically resemble the treatment group on
a set of relevant characteristics, or covariates, that might influence student outcomes.
Several considerations informed the selection of schools for comparison. District-run
charters were excluded from the matching process due to the focus on traditional public schools
as program schools. Schools catering to specific student populations, such as the Arkansas
Professional Learning Communities and Student Outcomes 14
School for the Blind and Visually Impaired or those within the Arkansas Correctional School
District, were also excluded. Furthermore, our analysis relies on annual data from state-produced
school report cards, which excluded schools lacking letter grades, encompassing alternative
learning environments and early childhood or pre-kindergarten schools.
In our one-stage propensity score matching (PSM) approach, we first calculated a
propensity score, p(xj), for each school j. This score represents the predicted likelihood of a
school being chosen for the PLC at Work program based on baseline characteristics (Xj)
measured in the year before their partnership with Solution Tree. These characteristics
encompass various aspects of the school environment, including enrollment size (total number of
students), student achievement on state-administered standardized assessments in both math and
ELA categorized into achievement levels (In Need of Support, Close, Ready, or Exceeding),
student demographics (percentage of male students and racial/ethnic composition of Black,
Hispanic/Latino, and White students), and programmatic factors (percentage of students
qualifying for free or reduced-price lunch, receiving special education services, or being English
language learners). We also considered teacher experience, measured by average years of
experience, the percentage of inexperienced teachers (with less than three years of experience),
and the school grade span (elementary, middle, or high school). By incorporating these diverse
covariates into the PSM analysis, we create a group of comparison schools that statistically
mirror PLC at Work schools, mitigating the impact of potential selection bias that might arise
due to the non-random selection of program schools.
p(xj) = Pr(PLCatWorkj = 1 | Xj)
(1)
Following the PSM process, the analysis focused exclusively on comparison schools that
had a similar likelihood of participating in the PLC at Work program based on various factors.

Professional Learning Communities and Student Outcomes 15
This entails ensuring that the propensity scores of comparison schools within the matched
sample lie within the range of scores observed in PLC at Work schools. The PSM analysis was
completed for each cohort of PLC at Work schools. Table 3 presents the propensity score range
and the resulting number of comparison schools after adjusting for common support for each
PLC at Work cohort.
Table 3
Propensity Score Ranges and Number of Comparison Schools by PLC at Work Cohort
Propensity Score Ranges
N
N
Cohort
Min
Max
PLC Schools
Comparison Schools
Cohort 1
0.0031
0.1029
11
435
Cohort 2
0.0044
0.2316
13
432
Cohort 3
0.0097
0.1163
25
667
Cohort 4
0.0060
0.2993
18
500
Cohort 5
0.0081
0.2032
23
569
Estimation Model
To assess the relationship between the PLC at Work program and student academic
achievement and growth, we utilized a two-pronged approach that acknowledges the non-random
assignment of schools to the program. First, a difference-in-differences (DiD) frame was utilized
to estimate the program’s overall effect (Callaway & Sant’Anna, 2021). This quasi-experimental
design capitalizes on the staggered implementation of PLC at Work across different school
cohorts, mitigating the influence of confounding variables that might affect student outcomes
over time. The DiD model allows us to compare the change in student outcomes for schools
designated as PLC at Work (treatment) with the change in outcomes for comparison schools
during the same period. The DiD model is formulated as follows:
(2)
Professional Learning Communities and Student Outcomes 16
In equation 2, Yit represents the outcome variable for student i at time t. PLCatWorki is a binary
indicator variable that takes a value of 1 if the school is identified as a PLC at Work school and 0
if otherwise. Postt is a binary indicator variable denoting the post-intervention period. The
variable takes a value of 1 for the year that a school implemented its partnership with Solution
Tree for PLC at Work and for all subsequent years. The coefficient of interest, δ, captures the
difference-in-differences estimator, representing the average treatment effect (ATT) of a school's
participation in PLC at Work on student outcomes. ϵ represents the error term.
Secondly, we employed an Event Study methodology to have a more comprehensive
exploration of the impact of PLC at Work over time. This approach allows us to examine how
the program's effect unfolds across the years following implementation. The event study model
is formulated as follows:
Yit = α +
PLCatWorkStart
itr + ϵit
(3)
In equation 3, Yit again represents the outcome variable for student i at time t. PLCatWorkStart is
an indicator variable capturing the presence of the intervention at time t relative to event year r.
For instance, r could represent -1 year before implementation or +2 years after implementation.
K represents the maximum number of years before and after the start of PLC at Work that are
included in the analysis. K defines the time window around the event. The
r coefficients
represent the regression coefficients, capturing the outcome difference between PLC at Work
and comparison schools in event year r. ϵit represents the error term.
Our study design possesses limitations inherent to observational research. Selection bias
is a potential concern, as schools were not randomly assigned to participate in the PLC at Work
program. While we employed rigorous statistical techniques to mitigate this bias, caution is
Professional Learning Communities and Student Outcomes 17
necessary since the findings should not be interpreted as causal. Additionally, our analysis did
not incorporate control variables for student or school characteristics. This deliberate choice
aimed to maintain a parsimonious model focusing on the core association between a school's
participation in PLC at Work and student outcomes. However, it is important to acknowledge the
significant variation in school composition across Arkansas, encompassing factors like
demographics, socioeconomic status, and prior achievement. Consequently, our results should be
interpreted as the relationship between being selected to participate in the PLC at Work program
on student academic outcomes. Generalizability to other contexts may be limited.
Outcomes of Interest
Our analysis targeted a set of student achievement outcomes aligned with the core
objectives articulated by the program developers. Solution Tree's promotional materials
emphasize the link between improved teacher collaboration and enhanced student learning. Their
website states: "There's nothing more important to us than helping you increase student
achievement." Since the PLC at Work program is implemented at the school level, we adopted
the following student outcomes at the school level as the primary outcomes of interest.
Since PLC at Work implementation begins in the fall semester, and the state-required
assessments occur in the spring semester, assessment scores for a school's first year as a PLC at
Work program participant reflect post-implementation outcomes. PLC at Work schools received
at least seven months of the program’s professional development before students completed the
assessments.
Achievement. Our first outcome of interest is a school's average weighted achievement. This
metric, generated by the ADE, reflects a school's students overall academic performance in math
and ELA based on annual state-required assessments for students in grades 3-10. Unlike a simple
Professional Learning Communities and Student Outcomes 18
average score, weighted average achievement incentivizes schools to improve student
performance across all achievement levels. The ADE assigns points to students based on their
performance categories in state assessments: 0 points for In Need of Support, 0.5 points for
Close, 1 point for Ready, and 1 point for Exceeding. Additionally, schools receive a 0.5 bonus
point for each student scoring Exceeding over the number In Need of Support. Total points
earned by each school are divided by the number of students assessed, resulting in a possible
weighted achievement score of 0 if all students scored well below grade level expectations and
150 if all students exceeded grade level performance expectations. In the 2022-23 school year,
weighted achievement scores for all Arkansas schools ranged from 0 to 113, with a mean of 51.8
and a standard deviation of 16.7.
Value-Added Growth. Our analysis incorporated value-added student growth as a key outcome
measure. This metric, calculated by the ADE, reflects a student's progress in math and ELA over
time as assessed by annual state-required assessments in grades 3-10. This value-added model
uses up to four years of prior academic achievement scores in the content area to compare a
student's actual progress between prior standardized assessments to typical student progress.
Annually, a value-added growth score of 80 represents that a student demonstrated academic
progress typical for students across the state with similar test score histories. Scores below 80
indicate lower-than-average levels of academic progress, while scores above 80 indicate higher
than average among students across the state with similar test score histories. In the 2022-23
school year, school value-added scores for all Arkansas schools ranged from 63 to 92, with a
mean of 80.1 and a standard deviation of 2.8.
Professional Learning Communities and Student Outcomes 19
V. Results
The following sections present the results of our analysis, categorized by the outcome
variable of interest. The figures and tables display single coefficients, representing the average
difference between PLC at Work schools and the comparison schools for each outcome.
To assess the impact of PLC at Work participation, we compared the outcome measure average
for PLC at Work schools in the year before program initiation with their average outcome in
subsequent years. We then performed the same evaluation for the matched comparison schools
within each cohort. The difference in the average outcome change between treatment and
comparison schools signifies the estimated program effect on the outcome variable. This event
study estimate captures the influence of PLC at Work participation on student achievement or
growth measures. The resulting coefficients would be zero if schools experienced no impact
from participation in the PLC at Work program. Similarly, positive coefficients indicate positive
impacts, while negative coefficients suggest negative ones.
Overall Results
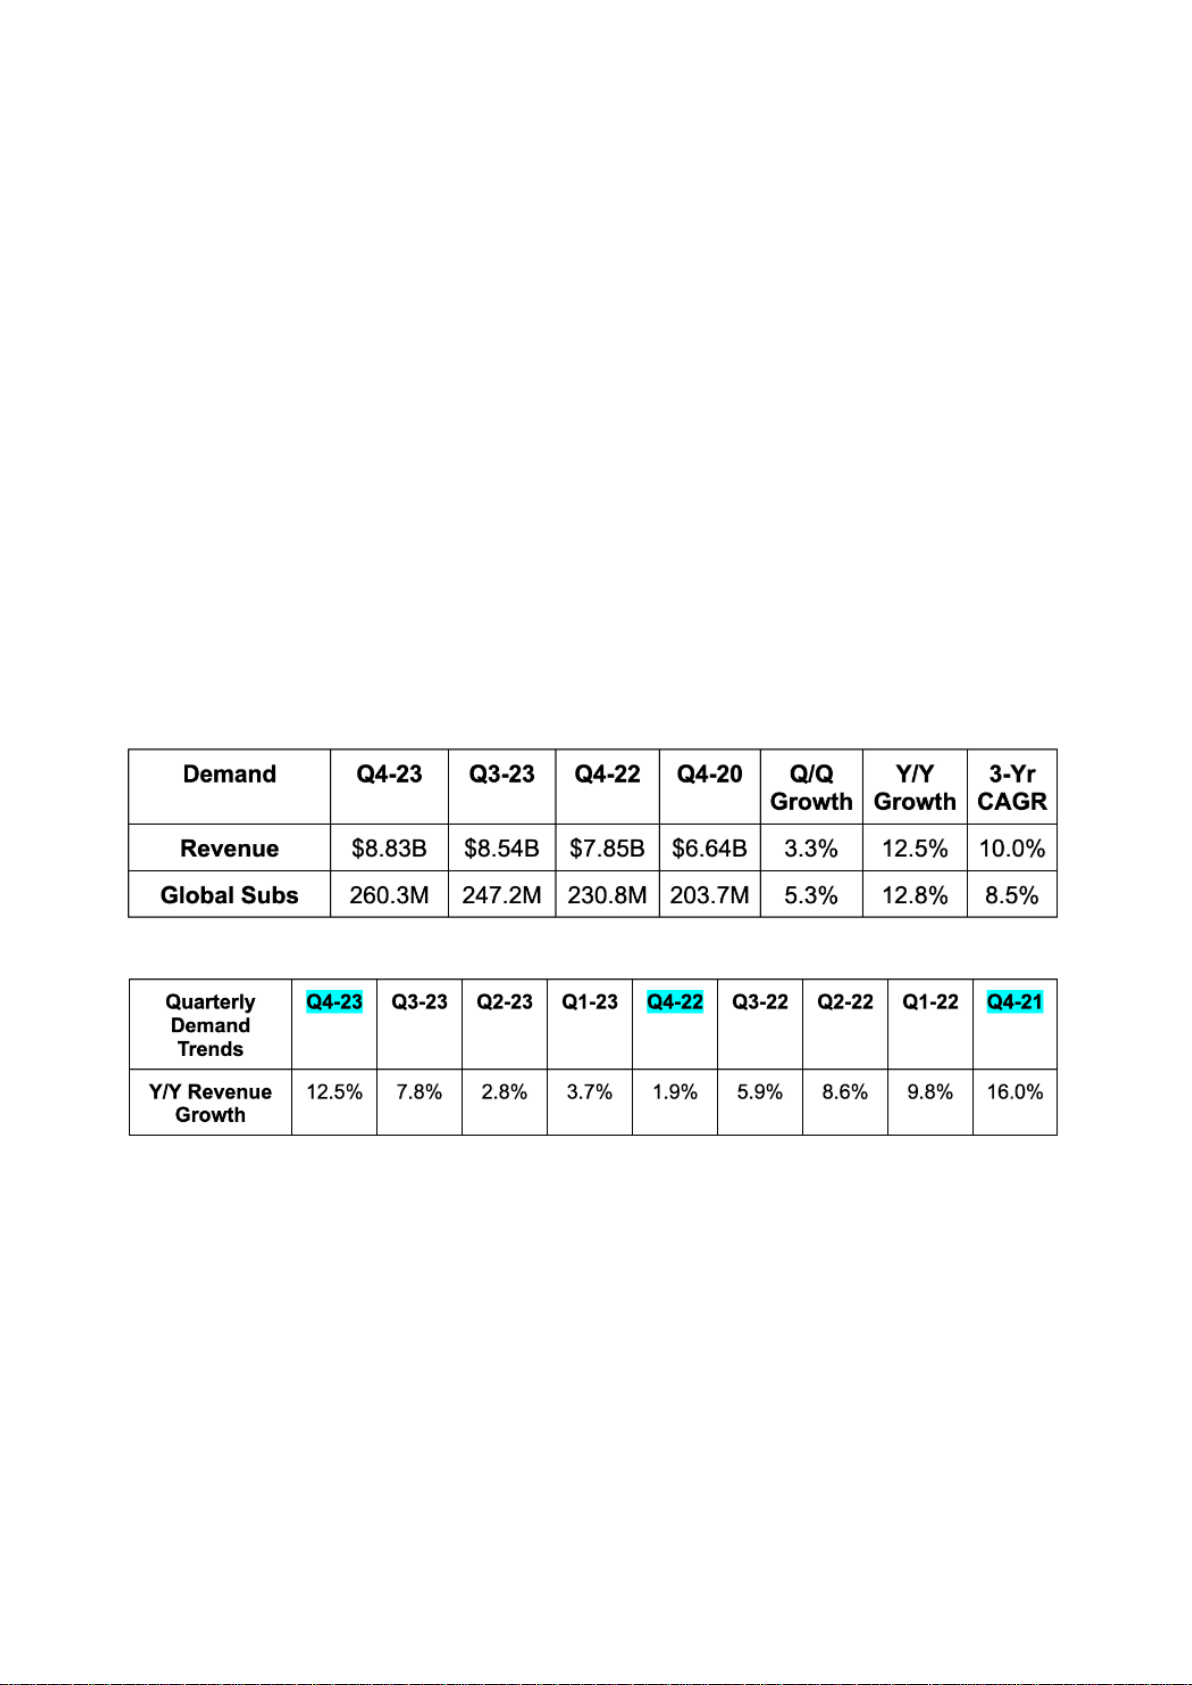
The findings from the difference-in-differences (DiD) analysis are presented in Table 4
below. This table summarizes the pooled estimates for the overall program effects of PLC at
Work on student outcomes, examining both the entire student population and economically
disadvantaged students. For the DiD analysis, the reference of pre-treatment is the average of the
outcome of interest for all years prior to PLC at Work adoption.

Professional Learning Communities and Student Outcomes 20
Table 4
Average Treatment Effect Results from Difference-In-Difference Analysis, All Cohorts
All Students
Economically
Disadvantaged Students
Average Weighted Achievement
-0.721
-1.026
(0.834)
(0.743)
Overall Growth
-0.152
-0.201
(0.310)
(0.364)
ELA Growth
-0.023
-0.068
(0.327)
(0.405)
Math Growth
-0.287
-0.310
(0.355)
(0.377)
Standard errors in parentheses
*** p<0.01, **p<0.05, *p<0.1
The difference-in-differences analysis did not yield statistically significant evidence
indicating effectiveness of the PLC at Work program for any of the outcomes examined across
for students overall or for students facing economically disadvantages. In fact, the estimates
suggest a negative association between PLC at Work participation and student academic
outcomes. Specifically, students enrolled in PLC at Work schools exhibited a 0.721-point
decrease in average weighted achievement compared to their counterparts in non-PLC at Work
schools. This negative association was even more pronounced for economically disadvantaged
students, with a decrease of 1.026 points.
Similarly, analyses of school-level value-added growth revealed negative associations for
PLC at Work schools. Students in these schools experienced a 0.152- and 0.201-point decrease
in overall value-added growth compared to students attending non-PLC at Work schools, for all
students and economically disadvantaged students, respectively. Notably, the declines in growth
scores were more substantial in mathematics compared to ELA.

Professional Learning Communities and Student Outcomes 21
To more rigorously examine the association between PLC at Work participation and our
outcome variables, schools were assigned to cohorts based on their initial program year, as
detailed in Table 5. In the following sections, 'Year 1' through 'Year 5' signify respective years
with available data for analysis. For the event study analysis, the reference of pre-treatment is the
average of the outcome of the year prior to PLC at Work adoption.
Table 5
PLC at Work Start Year and Outcome Year, by Cohort
N
PLC at
Work Start
2017-18
2018-19
2019-20
2020-21
2021-22
2022-23
Cohort 1
11
2017-18
Year 1
Year 2
—
Year 3
Year 4
Year 5
Cohort 2
13
2018-19
Year 1
—
Year 2
Year 3
Year 4
Cohort 3
25
2019-20/
2020-21
—
Year 1
Year 2
Year 3
Cohort 4
18
2021-22
—
Year 1
Year 2
Cohort 5
23
2022-23
—
Year 1
Weighted Achievement
Figures 1 and 2 present the overall findings for average weighted achievement across all
cohorts, for the general student population and economically disadvantaged students,
respectively. The figure presents data on a year-by-year basis. A value of zero on the y-axis
indicates that students in PLC at Work schools performed similarly to comparison schools
relative to their baseline achievement. Positive values suggest that PLC at Work schools
outperformed comparison schools regarding achievement gains, while negative values indicate
that PLC at Work schools experienced smaller achievement gains than non-PLC at Work
schools. Results are statistically significant only if the shaded area does not include zero.

Professional Learning Communities and Student Outcomes 22
Figure 2
Combined Effects of PLC at Work on Average Weighted Achievement by Year, Economically
Disadvantaged Students
Figure 1
Combined Effects of PLC at Work on Average Weighted Achievement by Year, All Students
Professional Learning Communities and Student Outcomes 23
Overall estimates indicate that students in PLC at Work schools demonstrated similar
weighted achievement scores compared to students in comparison schools that were not selected
to participate in the PLC at Work program. Economically disadvantaged students in PLC at
Work schools demonstrated decreases in weighted achievement scores compared to similar
students in schools that were not selected to participate in the PLC at Work program. Differences
between student achievement in PLC at Work schools after participating in the program were not
statistically significantly different than student achievement in non-PLC at Work schools.
Nonetheless, the consistent negative associations and the substantial observed decreases,
particularly for economically disadvantaged students in later years, raise concerns about the
program's impact on student achievement. The findings presented in Figures 1 and 2 suggest that
PLC at Work participation may not be yielding positive results for student learning outcomes.
Tables 6 and 7 provide a more detailed examination, displaying the average weighted
achievement by year and cohort for the overall student population and economically
disadvantaged students. The reference category for each outcome of interest is the baseline year,
or one year prior to PLC at Work adoption. More simply, the event study framework can be seen
as a pre post analysis exploring the outcomes of interest of each year of PLC at Work
participation compared to scores the year prior to adoption.

Professional Learning Communities and Student Outcomes 24
Table 6
Effect of PLC at Work on Average Weighted Achievement by Cohort and Year, All Students
Overall
Year 1
Year 2
Year 3
Year 4
Year 5
Cohort 1
-0.021
0.798
0.260
1.035
-0.829
-1.372
(2.121)
(2.208)
(0.260)
(2.640)
(2.833)
(2.569)
Cohort 2
-2.042
-2.247***
-1.873
-2.316
-1.732
(1.420)
(0.794)
(1.729)
(1.909)
(1.980)
Cohort 3
1.355
0.803
1.139
2.123
(1.060)
(1.306)
(1.218)
(1.125)
Cohort 4
-0.350
-1.313
0.613
(0.688)
(0.820)
(0.873)
Cohort 5
-0.297
-0.297
(0.895)
(0.898)
Standard errors in parentheses
*** p<0.01, **p<0.05, *p<0.1
Examining the event study results by cohort and year reveals a trend of predominantly
negative associations between PLC at Work participation and student achievement. For all
students, fourteen out of the twenty estimates for average weighted achievement indicated
negative associations. Notably, all cohorts except Cohort 3 displayed negative overall estimates
for average weighted achievement compared to non-PLC at Work schools.
Cohort 3 presented a seemingly positive but statistically insignificant finding. Students in
Cohort 3 PLC at Work schools exhibited a 1.355-point increase in average weighted
achievement compared to their counterparts in non-PLC at Work schools. However, the lack of
statistical significance renders this finding inconclusive. Similar to the overall results, the
majority of estimates from the event study analysis by cohort are not statistically significant,
suggesting limited evidence to support the program's effectiveness on student achievement
outcomes across the various cohorts.

Professional Learning Communities and Student Outcomes 25
Table 7
Effect of PLC at Work on Average Weighted Achievement by Cohort and Year,
Economically Disadvantaged Students
Overall
Year 1
Year 2
Year 3
Year 4
Year 5
Cohort 1
-1.349
1.136
0.015
-1.073
-3.058
-3.765**
(1.428)
(1.537)
(0.015)
(2.037)
(2.424)
(1.733)
Cohort 2
-1.912
-2.008***
-2.343
-2.460
-0.836
(2.032)
(0.690)
(2.392)
(2.733)
(2.891)
Cohort 3
1.055
0.916
0.663
1.586
(1.109)
(1.380)
(1.205)
(1.208)
Cohort 4
-0.823
-1.983**
0.337
(0.715)
(0.856)
(0.870)
Cohort 5
-0.680
-0.680
(0.902)
(0.918)
Standard errors in parentheses
*** p<0.01, **p<0.05, *p<0.1
Similar to the findings for all students presented in Table 6, the event study analysis of
economically disadvantaged students presented in Table 7 reveals a predominantly negative
trend. Thirteen out of the twenty estimates for average weighted achievement indicated negative
associations with PLC at Work participation.
Unlike the general student analysis, however, the results for economically disadvantaged
students yielded a slightly higher number of statistically significant negative associations. For
instance, in Cohort 1, economically disadvantaged students in PLC at Work schools exhibited a
statistically significant (95% confidence level) decrease of 3.765 points in average weighted
achievement in Year 5 compared to their counterparts in non-PLC at Work schools. Similarly,
Cohort 2 displayed a statistically significant (99% confidence level) decrease of 2.008 points in
average weighted achievement for economically disadvantaged students in PLC at Work schools
during their first year of program participation (Year 1). Cohort 4 also presented a statistically
Professional Learning Communities and Student Outcomes 26
significant (95% confidence level) decrease of 1.983 points in average weighted achievement for
economically disadvantaged students in Year 1, relative to their non-PLC at Work counterparts.
In summary, the analysis of average weighted achievement raises concerns about the
program's effectiveness, particularly for economically disadvantaged students. While overall
estimates lacked statistical significance, a concerning pattern emerged across cohorts and years.
Negative associations dominated the results, suggesting that PLC at Work participation may not
yield positive results regarding student learning outcomes. These findings necessitate further
investigation to understand the factors contributing to these trends and to explore potential
program modifications or supplementary interventions that could enhance PLC at Work's impact
on student-weighted achievement.
Overall Growth
Following the trends observed in average weighted achievement, we now explore school-
level value-added growth to understand better PLC at Work's impact on student academic
progress. This metric helps isolate the influence of a school's environment on academic progress,
minimizing the impact of factors like socioeconomic background. By comparing a school's
average student growth to students with similar historical growth patterns, we can determine
whether students collectively exceeded, met, or fell short of typically expected progress. For the
2022-23 school year, the average school-level value-added growth for the combined student
population was 80.08, with a standard deviation of 2.81. The average school-level value-added
growth for the economically disadvantaged student population was 79.75, with a standard
deviation of 2.65. Figures 3 and 4 depicts the overall findings for school value-added growth
scores across all cohorts for the general student population and economically disadvantaged
students, respectively.

Professional Learning Communities and Student Outcomes 27
Figure 3
Combined Effects of PLC at Work on School-Level Value-Added Growth by Year, All Students
Figure 4
Combined Effects of PLC at Work on School-Level Value-Added Growth by Year, Economically
Disadvantaged Students

Professional Learning Communities and Student Outcomes 28
Our analysis of student value-added growth revealed the academic growth of students in
PLC at Work schools was similar to that of students in non-PLC at Work schools. Overall
estimates for all students and for economically disadvantaged students indicate that differences
between student growth in PLC at Work schools were not statistically significantly different than
student growth in non-PLC at Work schools.
Tables 8 and 9 offer a more detailed view, presenting the growth scores by year and
cohort for the general student population and economically disadvantaged students, respectively.
Table 8
Effect of PLC at Work on School-Level Value-Added Growth by Cohort and Year, All Students
Overall
Year 1
Year 2
Year 3
Year 4
Year 5
Cohort 1
0.637
0.821
1.325*
0.678
0.249
0.112
(0.578)
(0.650)
(1.325)
(0.570)
(0.686)
(0.711)
Cohort 2
-1.217*
-1.202***
-1.313
-1.207
-1.145*
(0.657)
(0.403)
(1.081)
(0.767)
(0.695)
Cohort 3
0.211
-0.099
0.095
0.638
(0.596)
(0.655)
(0.592)
(0.718)
Cohort 4
0.216
-0.370
0.801
(0.662)
(0.618)
(0.776)
Cohort 5
0.134
0.134
(0.329)
(0.330)
Standard errors in parentheses
*** p<0.01, **p<0.05, *p<0.1
The event study analysis of school-level value-added growth reveals mixed findings
compared to the results for average weighted achievement. While seven out of the twenty
estimates indicated negative associations with PLC at Work participation, the majority were not
statistically significant. The findings suggests that the general student population in PLC at Work
schools did not experience statistically significant differences in value-added growth compared
to their non-PLC at Work counterparts.

Professional Learning Communities and Student Outcomes 29
Cohort 2, however, displayed a pattern of negative results, with some reaching statistical
significance. Specifically, the general student population in Cohort 2’s PLC at Work schools
exhibited a marginally statistically significant (90% confidence level) overall decrease of 1.217
points in school-level value-added growth compared to their non-PLC at Work counterparts. In
Year 1 (first year of program implementation), Cohort 2 presented a statistically significant (99%
confidence level) decrease of 1.202 points in value-added growth for the general student
population in PLC at Work schools relative to the non-PLC at Work group. Year 4 of Cohort 2
also revealed a marginally statistically significant (90% confidence level) decrease of 1.145
points in value-added growth for the general student population in PLC at Work schools
compared to their non-PLC at Work counterparts.
Table 9
Effect of PLC at Work on School-Level Value-Added Growth by Cohort and Year,
Economically Disadvantaged Students
Overall
Year 1
Year 2
Year 3
Year 4
Year 5
Cohort 1
0.715
1.161
1.457
0.748
0.137
0.074
(0.719)
(0.715)
(1.457)
(0.657)
(0.789)
(0.834)
Cohort 2
-1.354*
-1.277***
-1.926*
-1.133
-1.081
(0.772)
(0.433)
(1.162)
(0.893)
(0.824)
Cohort 3
0.114
0.002
-0.102
0.443
(0.622)
(0.670)
(0.637)
(0.773)
Cohort 4
0.268
-0.398
0.934
(0.521)
(0.476)
(0.639)
Cohort 5
0.062
0.062
(0.378)
(0.385)
Standard errors in parentheses
*** p<0.01, **p<0.05, *p<0.1
The event study analysis of school-level value-added growth for economically
disadvantaged students mirrors the findings for the general student population. Seven out of the
twenty estimates indicated negative associations with PLC at Work participation, with the
Professional Learning Communities and Student Outcomes 30
majority lacking statistical significance. The results suggest a lack of statistically significant
differences in value-added growth between economically disadvantaged students in PLC at
Work schools and their non-PLC at Work counterparts.
Like the general student population analysis of school-level value added growth, Cohort
2 displayed a pattern of negative associations, with some reaching statistical significance.
Economically disadvantaged students in Cohort 2’s PLC at Work schools exhibited a marginally
statistically significant (90% confidence level) overall decrease of 1.354 points in school-level
value-added growth compared to their non-PLC at Work counterparts. Furthermore, Year 1 (first
year of program implementation) for Cohort 2 presented a statistically significant (99%
confidence level) decrease of 1.277 points in value-added growth for economically
disadvantaged students in PLC at Work schools relative to the non-PLC at Work group. Year 2
of Cohort 2 also revealed a marginally statistically significant (90% confidence level) decrease
of 1.929 points in value-added growth for economically disadvantaged students in PLC at Work
schools compared to their non-PLC at Work counterparts.
This examination of school-level value-added growth yielded mixed findings regarding
the effectiveness of PLC at Work in promoting student academic progress. While overall
estimates lacked statistical significance, a concerning pattern emerged, particularly for schools in
Cohort 2.
English Language Arts Growth
Building upon the analysis of overall school-level value-added growth, this section and
the next further examine student progress within specific academic domains: English Language
Arts (ELA) and mathematics. Weighted average achievement scores lack subject disaggregation,

Professional Learning Communities and Student Outcomes 31
hindering a comprehensive analysis of subject-specific achievement, attempts to calculate
subject-level achievement were unsuccessful due to reporting limitations.
Available data for value-added growth, however, is readily available in a subject-
disaggregated format, offering valuable insights into student progress within core subjects.
Figure 5 and 6 explores school ELA value-added growth scores, providing a comprehensive
overview of year over-year trends for both the general student population and economically
disadvantaged students, respectively. The data is presented on a year-by-year basis to facilitate
comparisons.
Figure 5
Combined Effects of PLC at Work on ELA School-Level Value-Added Growth by Year, All Students

Professional Learning Communities and Student Outcomes 32
With overall estimates hovering close to zero on the Y-axis, the results indicate that
students in PLC at Work schools demonstrated similar value-added growth scores in ELA
compared to students in comparison schools that were not selected to participate in the PLC at
Work program. The results are similar for both student groups of interest. Additionally,
differences between school-level value-added growth in PLC at Work schools after participating
in the program were not statistically different than school-level value-added growth in ELA at
non-PLC at Work schools. The findings presented in Figures 5 and 6 suggest that PLC at Work
participation may not be yielding positive results for student learning outcomes.
Tables 10 and 11 provide a more detailed examination, displaying the school-level value-
added growth scores in ELA by year and cohort for the overall student population and
Figure 6
Combined Effects of PLC at Work on ELA School-Level Value-Added Growth by Year,
Economically Disadvantaged Students

Professional Learning Communities and Student Outcomes 33
economically disadvantaged students, respectively. The reference category for each outcome of
interest is the baseline year, or one year prior to PLC at Work adoption.
Table 10
Effect of PLC at Work on ELA School-Level Value-Added Growth by Cohort and Year,
All Students
Overall
Year 1
Year 2
Year 3
Year 4
Year 5
Cohort 1
0.657
0.624
0.925
0.800
0.806
0.128
(0.620)
(0.790)
(0.925)
(0.610)
(0.632)
(0.742)
Cohort 2
-0.904
-1.142*
-1.356
-0.603
-0.514
(0.694)
(0.473)
(1.107)
(0.748)
(0.671)
Cohort 3
0.198
-0.149
0.074
0.670
(0.761)
(0.768)
(0.777)
(0.858)
Cohort 4
-0.101
-0.731
0.528
(0.559)
(0.561)
(0.647)
Cohort 5
-0.082
-0.082
(0.370)
(0.370)
Standard errors in parentheses
*** p<0.01, **p<0.05, *p<0.1
Similar to the overall school-level value-added growth results presented earlier, the event
study analysis of ELA growth reveals no statistically significant evidence of positive program
effects for the general student population in PLC at Work schools. Half of the estimates indicated
negative associations with PLC at Work participation, and all but two estimates were less than
one point. These findings suggest that the general student population in PLC at Work schools
experienced similar average growth in ELA compared to their counterparts in non-PLC at Work
schools.
Consistent with the overall value-added growth results, students Cohort 2 displayed the
most consistent pattern of negative associations in ELA growth. For Cohort 2, all estimates for
the general student population's school-level value-added growth in ELA since program adoption
were negative. This translates to an overall negative estimate, suggesting that students in Cohort
2 PLC at Work schools exhibited a 0.904-point decrease in school-level value-added growth in
Professional Learning Communities and Student Outcomes 34
ELA compared to their non-PLC at Work counterparts. However, only one estimate reached
statistical significance, marginal significance (90% confidence level) in Year 1 of Cohort 2.
Table 11
Effect of PLC at Work on ELA School-Level Value-Added Growth by Cohort and Year,
Economically Disadvantaged Students
Overall
Year 1
Year 2
Year 3
Year 4
Year 5
Cohort 1
0.887
0.998**
1.353
0.907
0.868
0.308
(0.838)
(0.862)
(1.353)
(0.800)
(0.812)
(0.895)
Cohort 2
-1.028
-1.099
-1.782
-0.566
-0.663
(0.773)
(0.432)
(1.257)
(0.865)
(0.770)
Cohort 3
0.029
-0.157
-0.287
0.532
(0.748)
(0.717)
(0.770)
(0.906)
Cohort 4
0.110
-0.567
0.788
(0.376)
(0.402)
(0.496)
Cohort 5
-0.226
-0.226
(0.500)
(0.509)
Standard errors in parentheses
*** p<0.01, **p<0.05, *p<0.1
The event study analysis of school-level value-added growth in ELA for economically
disadvantaged students mirrors the trends observed for the general student population. Half of
the estimates indicated negative associations with PLC at Work participation, and all but one
estimate lacked statistical significance. Furthermore, all but three estimates were less than one
point. These findings suggest that economically disadvantaged students in PLC at Work schools
experienced similar average growth in ELA compared to their counterparts in non-PLC at Work
schools.
Table 11 presents one noteworthy finding. Economically disadvantaged students in
Cohort 1 exhibited a statistically significant (95% confidence level) increase of 0.998 points in
school-level value-added growth in ELA compared to their non-PLC at Work counterparts.
However, it is important to consider the magnitude of this effect. With a value less than one

Professional Learning Communities and Student Outcomes 35
standard deviation, this finding suggests a modest improvement that is not seen reflected in other
Cohorts.
Math Growth
Finally, school-level math value-added growth scores are explored in Figures 7 and 8
Tables 12 and 13 below. Figure 4 presents a comprehensive year-by-year analysis of these scores
for all student groups, including both the general student population and economically
disadvantaged students.
Figure 7
Combined Effects of PLC at Work on Math School-Level Value-Added Growth by Year, All Students

Professional Learning Communities and Student Outcomes 36
Like the findings for other student growth outcomes, the event study analysis of school-
level value-added growth in math revealed no statistically significant program effects for either
the general student population or economically disadvantaged students in PLC at Work schools.
Most estimates hovered near zero and lacked statistical significance. This suggests that, on
average, both student groups in PLC at Work schools experienced similar value-added growth in
math compared to their counterparts in non-PLC at Work schools.
It is noteworthy, however, that there was a sharp decrease in math growth scores four
years after program implementation for both student groups. It is important to acknowledge that
data for Year 4 is limited, as it only includes information from Cohorts 1 and 2. Tables 12 and 13
disaggregate the math growth scores by year and cohort for a more detailed examination. Table
Figure 8
Combined Effects of PLC at Work on Math School-Level Value-Added Growth by Year,
Economically Disadvantaged Students

Professional Learning Communities and Student Outcomes 37
12 focuses on the general student population, while Table 13 specifically examines scores for
economically disadvantaged students.
Table 12
Effect of PLC at Work on Math School-Level Value-Added Growth by Cohort and Year,
All Students
Overall
Year 1
Year 2
Year 3
Year 4
Year 5
Cohort 1
0.625
1.022
1.816**
0.371
-0.215
0.133
(0.698)
(0.723)
(0.925)
(0.733)
(0.962)
(0.768)
Cohort 2
-1.885**
-1.648***
-1.617
-2.290**
-2.274**
(0.738)
(0.804)
(1.198)
(1.075)
(1.095)
Cohort 3
-1.207
-1.838*
-2.741**
-1.825
(0.895)
(1.067)
(1.255)
(1.593)
Cohort 4
-0.111
-1.518
-0.817
-0.790
(0.765)
(1.010)
(0.916)
(1.298)
Cohort 5
0.016
0.016
(0.382)
(0.382)
Standard errors in parentheses
*** p<0.01, **p<0.05, *p<0.1
In contrast to the findings for overall and ELA growth, the event study analysis of school-
level value-added growth in math revealed a pattern of statistically significant associations, albeit
with mixed directionality (positive and negative) and larger effect sizes (compared to other
growth outcomes). Fourteen out of the twenty estimates indicated negative associations with
PLC at Work participation, and twelve estimates exceeded one point in absolute value.
Furthermore, seven estimates reached statistical significance.
Cohort 1 displayed the most consistent positive trends. Overall, students in Cohort 1 PLC
at Work schools exhibited a 0.625-point increase in math growth scores compared to their non-
PLC counterparts, although this increase lacked statistical significance. The most notable
positive association for Cohort 1 occurred in Year 2, with a statistically significant (95%
confidence level) increase of 1.816 points in school-level value-added growth in math. However,

Professional Learning Communities and Student Outcomes 38
following Year 2, Cohort 1 experienced a decline in scores, even falling below their non-PLC
counterparts in Year 4. The latter results were not statistically significant.
In contrast, Cohort 2 displayed a pattern of statistically significant negative associations.
On average, students in Cohort 2 PLC at Work schools experienced a statistically significant
(95% confidence level) decrease of 1.885 points in math growth compared to their non-PLC
counterparts. This negative overall result for Cohort 2 was driven by consistently negative
estimates across years. Year 1 of PLC at Work adoption for Cohort 2 was associated with a
statistically significant (99% confidence level) decrease of 1.648 points in school-level value-
added growth in math. Year 2 showed a similar decline, though not statistically significant.
Years 3 and 4 presented statistically significant (95% confidence level) decreases of 2.290 points
and 2.274 points, respectively, in school-level value-added growth in math for students in Cohort
2 PLC at Work schools. These latter estimates approach a one standard deviation decrease.
Table 13
Effect of PLC at Work on Math School-Level Value-Added Growth by Cohort and Year,
Economically Disadvantaged Students
Overall
Year 1
Year 2
Year 3
Year 4
Year 5
Cohort 1
0.582
1.303*
1.633
0.614
-0.540
-0.098
(0.720)
(0.674)
(1.633)
(0.724)
(0.948)
(0.860)
Cohort 2
-1.645*
-1.442**
-2.020
-1.651*
-1.468
(0.868)
(0.663)
(1.267)
(0.998)
(0.957)
Cohort 3
0.231
0.190
0.125
0.378
(0.592)
(0.742)
(0.639)
(0.765)
Cohort 4
0.431
-0.224
1.085
(0.737)
(0.707)
(0.853)
Cohort 5
0.346
0.346
(0.481)
(0.490)
Standard errors in parentheses
*** p<0.01, **p<0.05, *p<0.1
Professional Learning Communities and Student Outcomes 39
The event study analysis of school-level value-added growth in math for economically
disadvantaged students revealed a less pronounced pattern of negative associations compared to
the general student population. Only eight out of the twenty estimates indicated negative
associations with PLC at Work participation, and eight estimates exceeded one point in absolute
value. Furthermore, just three estimates reached statistical significance.
Similar to the general student population analysis, all cohorts except Cohort 2 displayed
positive overall estimates for economically disadvantaged students. However, these positive
estimates were modest and lacked statistical significance. Cohort 2, however, mirrored the
negative trends observed for the general student population. Overall, economically
disadvantaged students in Cohort 2 PLC at Work schools exhibited a marginally statistically
significant (90% confidence level) decrease of 1.645 points in math growth compared to their
non-PLC counterparts. This negative association was driven by consistently negative estimates
across years. Year 1 of PLC at Work adoption for Cohort 2 was associated with a statistically
significant (95% confidence level) decrease of 1.442 points in school-level value-added growth
in math for economically disadvantaged students. Year 2 showed a decline that was not
statistically significant, while Year 3 presented a marginally statistically significant (90%
confidence level) decrease of 1.651 points.
VI. Conclusions
This study investigates the association between student achievement and growth in
schools partnered with Solution Tree as Professional Learning Communities (PLCs) at Work.
We employed multiple evaluation methods to identify positive effects, but the results provided
limited evidence to support the program's overall effectiveness. We found no statistically
significant differences in student performance between PLC at Work and non-PLC schools,
Professional Learning Communities and Student Outcomes 40
measured by average weighted achievement and school-level value-added growth. However, a
concerning trend emerged, particularly for economically disadvantaged students. There were
negative associations between PLC at Work participation and student achievement scores across
cohorts and years.
The analysis of student growth yielded mixed findings. While overall estimates for
school-level value-added growth lacked statistical significance, Cohort 2 consistently displayed
negative associations, with some reaching significance in both ELA and math. Interestingly, a
sharp decrease in math growth scores was observed for both student groups four years after
program implementation. Findings varied by cohort. While Cohort 1 exhibited a temporary,
statistically significant positive association in school-level ELA growth during Year 2, it did not
persist in subsequent years. Conversely, Cohort 2 displayed a consistent pattern of negative
associations across all outcomes.
Overall, these findings raise concerns about the effectiveness of the PLC at Work
program, particularly for economically disadvantaged students and in math growth. Further
research is crucial to explore the reasons behind the observed negative associations, especially
for Cohort 2. Additionally, investigating potential program modifications or supplementary
interventions that could enhance PLC at Work's impact on student learning outcomes is essential.
Limitations
This study has several limitations that should be considered when interpreting the
findings. One significant limitation is the potential for selection bias due to the non-random
assignment of schools to the PLC at Work program. Schools that applied and were selected to
participate may differ systematically from schools that did not, introducing potential
Professional Learning Communities and Student Outcomes 41
confounding variables that could influence the results. Although we employed propensity score
matching to mitigate this bias, we must recognize that our findings should not be interpreted as
causal.
Additionally, the comparison schools in our analysis may have implemented parts of
Solution Tree's PLC model or similar professional development initiatives without being
formally designated as PLC at Work schools. This possibility introduces a dilution effect. Since
comparison schools might also be benefiting from collaborative practices and professional
development resources that align with PLC principles, the observed differences in student
outcomes between PLC at Work schools and comparison schools could be less pronounced.
Ideally, the comparison group would have had no exposure to similar initiatives, allowing for a
clearer picture of the PLC at Work program's isolated impact.
The study also did not control for all possible confounding variables related to student or
school characteristics, such as specific instructional practices, school leadership quality, or
community support structures. While our analysis focused on core associations between PLC at
Work participation and student outcomes, the variability in school contexts across Arkansas,
including demographics, socioeconomic status, and prior achievement levels, could influence the
results. Thus, our findings provide a general picture rather than a definitive assessment of the
program's impact.
Finally, the program's implementation fidelity across different schools and cohorts was
not directly measured. Variations in how well the PLC at Work model was implemented could
influence the outcomes observed. Schools with higher fidelity to the program's principles and
practices might experience different results than those with lower fidelity, affecting the overall
effectiveness of the initiative.
Professional Learning Communities and Student Outcomes 42
While this study provides valuable insights into the association between PLC at Work
participation and student outcomes, the limitations highlight the need for cautious interpretation
and further research. Future studies should address these limitations by incorporating more
rigorous controls, exploring the effects of implementation fidelity, and considering a broader
range of educational outcomes.
Policy Recommendations
This study's findings and the wider context of the Arkansas PLC at Work program
suggest several detailed policy recommendations to improve program effectiveness and address
concerns.
Enhanced Transparency from Solution Tree
We recommend increased data collection and transparency from the PLC at Work
program provider, Solution Tree, to strengthen program evaluation and accountability. Currently,
data collection efforts within the program lack a standardized and centralized approach, making
it challenging for policymakers and school stakeholders to objectively assess the program's
effectiveness and identify areas for improvement.
Therefore, we propose that Solution Tree implement a standardized data collection
system across all participating schools with data available for the public and relevant
stakeholders. This system should mirror the one recommended for schools, capturing student
achievement data disaggregated by subgroups like disadvantaged students. Increased
transparency would enable DESE to conduct comprehensive program evaluations and provide
policymakers with a clearer picture of the program's impact on student achievement across the
state. Furthermore, school stakeholders, including educators and parents, would gain valuable
insights into the program's effectiveness in their schools and the participating districts.
Professional Learning Communities and Student Outcomes 43
Strengthened Oversight and Accountability
Ensuring the long-term success of PLC at Work necessitates a stronger emphasis on
oversight and accountability. Regular independent evaluations, conducted by unbiased outside
researchers, are crucial to assess program effectiveness and its impact on diverse student groups.
Evaluations should consider implementation fidelity, cost-effectiveness, and student academic
outcomes. Additionally, promoting transparency in resource allocation and financial
management through measures like detailed expenditure reports to the Arkansas Department of
Education will foster greater accountability. Prioritizing these measures will provide valuable
insights to stakeholders and ensure that the program effectively serves Arkansas students and
teachers.
Audit of PLC at Work Program Effectiveness
A comprehensive, independent audit is recommended to optimize the PLC at Work
program in Arkansas. This audit should focus on maximizing the impact of Solution Tree's on-
site support (50 days annually). The audit could examine schedules and activity logs to assess
time utilization and conduct stakeholder interviews to identify potential gaps between planned
activities and school needs. Optimizing support distribution across schools is also essential. The
audit should investigate current practices and explore alternative models, ensuring resource
allocation aligns with factors like school size and student demographics. Finally, teacher
perceptions are vital. The audit should incorporate surveys or focus groups to evaluate the
provided resources' helpfulness and alignment with PLC needs. Additionally, it should assess
teacher access to alternative professional development opportunities. By addressing these critical
areas, the audit can provide valuable insights to enhance program effectiveness and ensure PLC
at Work offers impactful support for Arkansas educators.
Professional Learning Communities and Student Outcomes 44
In conclusion, this study sheds light on a complex issue: the association between
participation in the PLC at Work program and student academic achievement in Arkansas. While
the PLC at Work model demonstrates promise in enhancing professional development and
educational practices, the findings from our study indicate that its current implementation in
Arkansas has not resulted in significant improvements in student academic outcomes. While
these results do not definitively establish causality due to limitations like selection bias and
potential dilution effects from similar initiatives in comparison schools, they raise significant
questions about the program's effectiveness in its current form. Further research employing more
rigorous controls and exploring implementation fidelity is necessary to understand the program's
impact definitively. Ultimately, the goal is to ensure that all students in Arkansas, regardless of
background, benefit from the collaborative and professional learning opportunities offered by
PLCs. This study serves as a crucial starting point for ongoing evaluation and refinement, paving
the way for a future where the PLC at Work program becomes a powerful tool for advancing
student achievement across the state.
Professional Learning Communities and Student Outcomes 45
VII. References
Arkansas Code Annotated, § 6-20-2305(b)(5), 6-20-2305(b)(5) Arkansas Code Annotated.
Bureau of Legislative Research. (2016). Professional Development (PD) in Arkansas:
Categorical report (16-001–28a). Arkansas General Assembly.
https://www.arkleg.state.ar.us/Home/FTPDocument?path=%2Feducation%2FAdequacyR
eports%2F2016%2F2016-03-15%2F04-Professional+Development+(PD)+in+Arkansas-
Categorical+Report%2C+BLR+(28a).pdf
Burns, M., Naughton, M., Preast, J., Wang, Z., Gordon, R., Robb, V., & Smith, M. (2018).
Factors of Professional Learning Community Implementation and Effect on Student
Achievement. Journal of Educational and Psychological Consultation, 28(4), 394-412.
https://doi.org/10.1080/10474412.2017.1385396
Callaway, B., & Sant’Anna, P. H. C. (2021). Difference-in-Differences with multiple time
periods. Journal of Econometrics, 225(2), 200–230.
https://doi.org/10.1016/j.jeconom.2020.12.001
Capraro, R., Capraro, M., Scheurich, J., Jones, M., Morgan J., Higgins, K., Sencer Corlu, M.,
Younes, R. & Han, S. (2016). Impact of sustained professional development in STEM on
outcome measures in a diverse urban district. The Journal of Educational Research,
109(2), 181-196. https://doi.org/10.1080/00220671.2014.936997
DuFour, R., & Eaker, R. E. (1998). Professional learning communities at work: Best practices
for enhancing student achievement. National Education Service; ASCD.

Professional Learning Communities and Student Outcomes 46
Goddard, Y., Goddard, R., & Tschannen-Moran, M. (2007). A Theoretical and Empirical
Investigation of Teacher Collaboration for School Improvement and Student
Achievement in Public Elementary Schools. Teachers College Record, 109 (4), 877–896.
Hanson, H., Torres, K., Yoon, S. Y., Merrill, R., Fantz, T., & Velie, Z. (2021). Growing
Together: Professional Learning Communities at Work® Generates Achievement Gains
in Arkansas. Education Northwest. https://educationnorthwest.org/sites/default/files/plc-
at-work-impact-evaluation.pdf
Louis, K. S., & Marks, H. M. (1998). Does professional community affect the classroom?
Teachers’ work and student experiences in restructuring schools. American Journal of
Education, 106, 532–575. https://doi.org/10.2307/1085627
PLC at Work in Arkansas. (n.d.). Retrieved April 23, 2024, from
https://www.solutiontree.com/st-states/arkansas-plc
Press release: Arkansas launches professional learning communities pilot project. (2017).
Arkansas Department of Education.
https://dese.ade.arkansas.gov/Files/20201203111102_Press_Release_Arkansas_Launches
_Professional_Learning_Communities_Pilot_Project_8_1_17.pdf
Ratts, R. F., Pate, J. L., Archibald, J. G., Andrews, S. P., Ballard, C. C., & Lowney, K. S. (2015).
The influence of professional learning communities on student achievement in
elementary schools. Journal of Education & Social Policy, 2(4), 51–61.
Roberts, J. (2024, February 8). Legislators ask for audit of school vendor Solution Tree.
Arkansas Times. https://arktimes.com/arkansas-blog/2024/02/08/legislators-ask-for-
audit-of-school-vendor-solution-tree
Professional Learning Communities and Student Outcomes 47
Ronfeldt, M., Farmer, S. O., McQueen, K., & Grissom, J. A. (2015). Teacher collaboration in
instructional teams and student achievement. American Educational Research Journal,
52, 475–514. https://doi.org/10.3102/0002831215585562
Rosenbaum, P. R., & Rubin, D. B. (1983). The central role of the propensity score in
observational studies for causal effects. Biometrika, 70(1), 41–55.
https://doi.org/10.1093/biomet/70.1.41
Sigurðardóttir, A. K. (2010). Professional learning community in relation to school effectiveness.
Scandinavian Journal of Educational Research, 54, 395–412.
https://doi.org/10.1080/00313831.2010.508904
Stoll, L., Bolam, R., McMahon, A., Wallace, M. W., & Thomas, S. M. (2006). Professional
learning communities: A review of the literature. Journal of Educational Change, 7, 221–
258.
Vescio, V., Ross, D., & Adams, A. (2008). A review of research on the impact of professional
learning communities on teaching practice and student learning. Teaching and Teacher
Education, 24, 80–91.
Ward, H. (n.d.). About – AllThingsPLC. Retrieved May 02, 2024, from
https://allthingsplc.info/about/

Professional Learning Communities and Student Outcomes 48
VIII. Appendix
Table 1.A
Cohort 1 PLC at Work Schools with Baseline Demographic Data, 2016-17
School Name
District
Enrollment
%
FRL
%
SPED
%
ELL
%
White
% Proficient
ELA
Math
Ballman Elementary
Fort Smith
302
73
15
22
52
46
44
Bragg Elementary
West Memphis
535
100
8
00
47
31
50
Douglas MacArthur Junior High
Jonesboro
670
100
14
08
44
43
38
Frank Mitchell Intermediate
Vilonia
757
47
17
2
92
62
63
Greenbrier Eastside Elementary
Greenbrier
415
53
14
2
92
70
69
Monticello Middle School
Monticello
388
56
11
1
60
58
54
Morrilton Intermediate
S. Conway County
501
100
12
4
71
57
63
Prescott Elementary School
Prescott
542
100
12
5
54
34
52
Prescott High School
Prescott
457
100
11
2
54
45
24
Rogers High School
Rogers
2044
49
10
31
49
59
30
Spradling Elementary
Fort Smith
451
98
13
52
19
42
49

Professional Learning Communities and Student Outcomes 49
Table 2.A
Cohort 2 PLC at Work Schools with Baseline Demographic Data, 2017-18
School Name
District
Enrollment
%
FRL
%
SPED
%
ELL
%
White
% Proficient
ELA
Math
Blytheville Primary School
Blytheville
562
100
10
5
13
NA
NA
Cabe Middle School
Gurdon
222
74
14
9
53
33
32
East Pointe Elementary
Greenwood
642
43
14
1
82
59
76
Greer Lingle Middle School
Rogers
930
65
15
24
52
57
57
Gurdon High School
Gurdon
202
67
13
3
51
34
13
Gurdon Primary
Gurdon
286
77
12
12
53
19
23
Hamburg High School
Hamburg
575
54
8
7
60
36
23
Howard Perrin Elementary
Benton
594
39
10
1
86
60
67
Main Street Arts Magnet
Hot Springs
614
93
15
6
31
35
49
Murrell Taylor Elementary
Jacksonville N. Pulaski
524
00
19
2
22
17
31
Quitman Elementary School
Quitman
356
64
22
1
93
58
58
Quitman High School
Quitman
320
47
14
1
94
50
47
Rivercrest Elementary
Rivercrest
608
83
9
1
60
46
49

Professional Learning Communities and Student Outcomes 50
Table 3.A
Cohort 3 PLC at Work Schools with Baseline Demographic Data, 2018-19
School Name
District
Enrollment
%
FRL
%
SPED
%
ELL
%
White
% Proficient
ELA
ELA
Academies at Rivercrest
Rivercrest
570
66
0.1
1
65
31
21
Bayyari Elementary
Springdale
569
92
9
61
11
26
38
Buffalo Island Central Elementary
Buffalo Island Central
382
61
15
11
78
51
65
Buffalo Island Central High
Buffalo Island Central
342
49
13
10
82
45
4
Camden Fairview High School
Camden Fairview
643
66
1
2
31
26
14
Camden Fairview Intermediate
Camden Fairview
384
82
12
2
34
28
32
Centerpoint High School
Centerpoint
519
68
11
12
78
41
4
Clinton Elementary School
Clinton
445
75
19
13
76
44
66
Clinton Elementary School
Clinton
562
100
18
5
88
52
62
Clinton Junior High
Clinton
299
100
17
0
95
63
61
Crossett High School
Crossett
502
5
10
2
62
32
22
Darby Middle School
Fort Smith
628
93
16
28
26
4
33
Eureka Springs Elementary
Eureka Springs
229
67
18
9
90
44
64
Harrisburg High School
Harrisburg
375
100
13
2
93
29
24
Jacksonville Elementary
Jacksonville N. Pulaski
365
100
12
4
31
35
42
Lake Hamilton Intermediate
Lake Hamilton
730
58
11
4
78
48
65
Lake Hamilton Junior High
Lake Hamilton
725
52
9
5
79
49
47
Lakeside High School
Lakeside (Garland)
262
100
11
5
13
34
15
Mabelvale Elementary
Little Rock
524
94
11
23
7
17
27
Mills Univ. Studies High School
Pulaski County
598
68
12
1
22
22
12
Northside High School
Fort Smith
1691
79
10
36
25
35
22
Park Avenue Elementary
Stuttgart
604
100
17
6
37
23
47
Valley Springs Elementary
Valley Springs
314
5
12
0
96
52
60
Watson Elementary
Little Rock
494
93
11
29
2
7
13
Wonderview Elementary
Wonderview
268
68
19
0
94
42
51

Professional Learning Communities and Student Outcomes 51
Table 4.A
Cohort 4 PLC at Work Schools with Baseline Demographic Data, 2020-21
School Name
District
Enrollment
%
FRL
%
SPED
%
ELL
%
White
% Proficient
ELA
Math
Arkansas High School
Texarkana
1069
100
11
1
34
26
16
Booker T. Washington Elementary
Little Rock
376
100
21
1
4
10
11
Camden Fairview Middle
Camden Fairview
564
100
11
1
28
19
7
Carver Steam Magnet Elementary
Little Rock
210
100
23
7
7
10
17
Glenview Elementary
North Little Rock
263
100
22
4
4
6
10
Hellstern Middle School
Springdale
786
49
10
17
56
56
57
Howard Elementary
Fort Smith
304
95
11
48
18
21
23
Lake Hamilton Middle School
Lake Hamilton
686
58
10
4
74
52
59
Leslie Intermediate School
Searcy County
180
100
14
1
94
37
47
Leverett Elementary School
Fayetteville
227
58
15
11
57
31
51
Magazine Elementary School
Magazine
267
79
13
0
95
36
41
Magazine High School
Magazine
253
79
15
1
90
26
22
Marshall Elementary School
Searcy County
206
100
17
0
96
38
60
Marshall High School
Searcy County
342
100
8
0
94
43
27
Meekins Middle School
Stuttgart
250
100
16
5
39
21
35
Oaklawn STEM Magnet Elem.
Hot Springs
542
100
19
12
41
19
28
Parson Hills Elementary
Springdale
418
97
11
69
9
14
25
University Heights Elementary
Nettleton
384
100
16
12
31
NA
NA

Professional Learning Communities and Student Outcomes 52
Table 5.A
Cohort 5 PLC at Work Schools with Baseline Demographic Data, 2021-22
School Name
District
Enrollment
%
FRL
%
SPED
%
ELL
%
White
% Proficient
ELA
Math
Berryville Elementary School
Berryville
432
76
14
25
63
NA
NA
Berryville High School
Berryville
545
66
15
14
64
40
19
Berryville Intermediate School
Berryville
403
71
20
19
62
35
47
Berryville Middle School
Berryville
438
73
20
15
64
42
36
Cabot Freshman Academy
Cabot
856
33
11
2
82
53
44
Carlisle Elementary School
Carlisle
325
66
14
5
78
30
35
Carlisle High School
Carlisle
288
63
13
3
81
32
19
Chicot Elementary
Little Rock
591
100
17
40
5
19
19
Greenwood Freshman Center
Greenwood
331
25
14
1
83
69
45
Greenwood High School
Greenwood
874
23
13
2
86
57
41
Hamburg Middle School
Hamburg
381
67
12
12
58
40
33
Hot Springs World Class High
Hot Springs
733
100
15
9
37
28
9
Lakeside Junior High
Springdale
644
87
13
37
20
20
22
Marked Tree Elementary School
Marked Tree
261
85
17
2
61
35
47
Marked Tree High School
Marked Tree
236
81
12
0
58
26
18
Mountainburg Elementary School
Mountainburg
223
100
22
0
94
35
46
Mountainburg High School
Mountainburg
201
100
14
0
90
44
18
Mountainburg Brain Academy
Mountainburg
199
100
22
1
91
40
38
Norphlet Middle School
Smackover-Norphlet
325
56
7
1
76
38
33
Oakland Heights Elementary
Russellville
429
79
21
35
40
28
28
Smackover Elementary School
Smackover-Norphlet
378
61
11
2
77
33
44
Smackover High School
Smackover-Norphlet
316
49
8
1
72
35
18
Sonora Middle School
Springdale
645
87
16
38
21
27
32