Scaling Solar PDF Free Download
1 / 79/79
100%

CKI Solar-250426_updateBOS
Scaling Solar
Hyae Ryung Kim, Marcelo Cibie, Max de Boer, Lara
Geiger, Isabel Hoyos, Heonjae Lee, Taicheng Jin,
Hassan Riaz, and Gernot Wagner
10 July 2025

The Solar Opportunity

CKI Solar-250426_updateBOS
3 of 79
Solar PV systems can be classified according to purpose and size:
1. Residential system typically ~0.002 to 0.02 megawatts (MW); installed capacity is ~357 GW (2024)
2. Commercial and Industrial system typically ~0.02 to 5 MW; installed capacity is ~522 GW (2024)
3. Utility system typically ~1 to 1,000 MW*; installed capacity is ~1,226 GW (2024)
Solar PV prices dropped ~99.8% since 1975, driven by economies of scale known as
Swanson’s law, in which each doubling of installed capacity has led to an average price drop
of ~20%. This was initially caused by the improvement of module efficiency; after 2001,
economies of scale became a significant driver of cost reduction.
Solar can abate 5.5 to 10 gigatonnes (Gt) of CO2e by 2050 in select subsectors, including
24% to 43% of power and heat, depending on the transition scenario.
(*) Exact classification boundaries vary by sources; the authors present a rough estimation from a combination of sources.
Credit: Hassan Riaz, Isabel Hoyos, Max de Boer, Lara Geiger, Marcelo Cibie, Hyae Ryung Kim, and Gernot Wagner. Share with attribution: Kim et al., “Scaling Solar” (10 July 2025).
Solar projects require a substantial upfront investment in equipment, installation, and site
preparation:
•Typical system cost is ~3.15$/Watt for residential; ~1.51$/Watt for commercial & industrial, and
~1.12$/Watt for utility-scale (1Q24).
•However, they have relatively low maintenance costs relative to other energy sources, and given
electricity savings, tax benefits, and potential revenue generation, the payback period typically ranges from
~2 to 10 years.
Solar electricity generation reached ~1,600 terawatt-hours (TWh) of global capacity in 2023
with 23% CAGR from 2018 to 2023, exceeding growth expectations at every stage.
Key messages
The Solar Opportunity

CKI Solar-250426_updateBOS
4 of 79
CO2e emissions in 2024*: ~50 billion tonnes
Solar can abate 5.5 to 10 Gt of CO2e by 2050 in select subsectors
depending on the transition scenario
(*) 2024 emissions based on projections.
Sources: Rhodium Group, Climate Deck (2024); BNEF, New Energy Outlook (2025); IRENA, Transport (2025); IEA, Net Zero by 2050 (2023); Way et al., Empirically Grounded Technology Forecasts
and the Energy Transition (2022).
Credit: Hassan Riaz, Theo Moers, Hyae Ryung Kim, and Gernot Wagner. Share with attribution: Kim et al., “Scaling Solar” (10 July 2025).
Agriculture fuel
4%
Waste
21%
LULCF
17%
Livestock
32%
Road
50%
Crops
27%
Oil
3%
10%
Natural gas
9%
Aviation
10%
Coal
45%
Marine
11%
Non-ferrous metals
2% Rail
1%
Refining
4% Non-metallic minerals
2%
Coal mining
7%
Other
2%
Chemicals
13%
Residential combustion
47%
Cement
17% HFCs
21%
Oil and gas
21%
Commercial
15%
Iron and steel
13%
Remaining industry
17%
28% 28% 21% 16% 7%
Industry Power and Heat Agriculture, land use and waste Transport Buildings
24% to 43%
in all power and heat
16% to 26%
in road
10% to 17%
in buildings
3% to 5%
in iron and steel
Abatement in Economic Transition Scenario
Additional Abatement in Net Zero Scenario

CKI Solar-250426_updateBOS
5 of 79
Utility-scale solar and wind now cheaper than fossil fuels,
battery storage costs not far behind and falling fast
Levelized cost of electricity (LCOE) & storage (LCOS) ($USD/MWh) Observations
•Solar photovoltaic (PV) prices
dropped by ~80% in the past
decade, wind by ~70%, and lithium-
ion battery costs by ~90%.
−PV price drop primarily driven by
improvements in module efficiency and
economies of scale.
−Onshore wind remained the cheapest for
the longest, now beaten by PV.
−Lithium-ion battery costs fell 20% in 2023
alone.
•Gas combined cycle power plants
cheaper than coal, more expensive
than both solar and wind.
−Rapid scale-up of utility-scale batteries
“killer app” to replace gas on grid.
−Battery prices expected to continue
falling due to cell manufacturing
overcapacity, economies of scale, and
switch to lower-cost lithium-iron-phosphate
(LFP) batteries.
Sources: Lazard, LCOE+ (2025); Our World in Data, Our World in Data (2024); Energy Institute, Statistical Review of World Energy (2024); BNEF, Battery Price Survey (2024); Kavlak et al.,
Evaluating the Causes of Cost Reduction in Photovoltaic Modules (2018).
Credit: Hyae Ryung Kim, Xiaodan Zhu, and Gernot Wagner. Share with attribution: Kim et al., “Scaling Solar” (10 July 2025).
Fossil vs. renewable power prices
0
100
200
300
400
500
600
700
800
900
1,000
1990 1995 2000 2005 2010 2015 2020 2025
Coal
Gas Combined Cycle
US Nuclear
Wind Onshore
Solar PV
+ Storage
Solar PV prices dropped
~90% in 12 years, ~99%
in 40 years.

CKI Solar-250426_updateBOS
6 of 79
Past solar adoption has exceeded expectations at every stage;
China has led most installed capacity growth
Sources: Sun Machines, The Economist;Our World in Data using IRENA (2023); Nemet (2009); Farmer and Lafond (2016); Kavlak et al. (2018); Our World in Data using Lafond et al. (2017), IRENA and
de la Tour (2013); BloombergNEF (2024); Our World in Data, Our World in Data (2024).
Credit: Taicheng Jin, Hassan Riaz, Isabel Hoyos, Hyae Ryung Kim, and Gernot Wagner. Share with attribution: Kim et al., “Scaling Solar”(10 July 2025).
Expectation vs. reality for solar deployment Global installed solar capacity (TWh) Observations
•Solar PV deployment consistently
exceeds expectations due to
Swanson’s law; increased
deployment and lowered price
lead to more demand and more
installations:
•The main bottlenecks for solar
deployment are not technological
maturity, economics, or supply
constraints, but grid stability,
interconnection delays, and
supportive policies.
0
250
500
750
1,000
1,250
1,500
1,750
’12 ’13 ’14 ’15 ’16 ’17 ’18 ’19 ’20 ’21 ’22 ’23
1,580%
China
EU-27
USA
India
ROW Prices
fall
Demand
increases
Solar PV
competitive in
new markets
Increased
solar PV
deployment

CKI Solar-250426_updateBOS
7 of 79
Solar and wind will drive most renewable energy deployment by
2050; must grow 15-fold in IEA’s Net Zero Scenario
Sources: BNEF, 1Q 2024 Global PV Market Outlook (2024);IEA, Electricity (2025).
Credit: Taicheng Jin, Hassan Riaz, Max de Boer, Lara Geiger, Marcelo Cibie, Hyae Ryung Kim, and Gernot Wagner. Share with attribution: Kim et al., “Scaling Solar”(10 July 2025).
Solar PV generation must grow from 1,600 TWh in 2023 to 25,000 TWh in 2050 Observations
•Electricity generation is the
largest source (36%) of
energy‐related CO2emissions today.
•Global electricity demand is
expected to increase from ~25,000
TWh in 2023 to ~60,000 TWh in
2050.
•Increase in electricity demand is
driven by:
–Advanced economies: Increased
electrification and expansion of hydrogen
electrolysis
–Emerging economies: Population growth
and increase in living standards
•In the predicted NZS by 2050
scenario, solar is forecasted to
reach 25,000 TWh of electricity per
year (~100% of today’s energy
production).
–Forecast is based on current solar
adoption trends, competing economics
between other technologies, and total
forecasted power generation.
30
40
20
50
60
10
70
80
0
90
Economic Transition Scenario (ETZ) in thousands TWh
2000 2005 2010 2015 2020 2025 2030 2035 2040 2045 2050
30
40
20
50
60
10
70
80
0
90
Net Zero Scenario (NZS) in thousands TWh
2000 2005 2010 2015 2020 2025 2030 2035 2040 2045 2050
Nuclear
Hydrogen
Unabated oil
Other renewables
Other
Gas with CCS Solar
Unabated gas
Wind
Coal with CCS
Unabated coal

CKI Solar-250426_updateBOS
8 of 79
Price decreased initially due to R&D in module efficiency; since
2001, economies of scale has been the main driver
(*) 1980-2001 price reductions scaled to 100% and align data with 2001-2012. The pre-factor in Equation (5) reflects the baseline operational costs such as electricity, labor, maintenance, and
depreciation for a fixed size plant over time.
Source: Kavlak et al., Evaluating the Causes of Cost Reduction in Photovoltaic Modules (2018).
Credit: Taicheng Jin, Isabel Hoyos, Hassan Riaz, Hyae Ryung Kim, and Gernot Wagner. Share with attribution: Kim et al., “Scaling Solar” (10 July 2025).
Observations
•Technical variables represent
technical improvements, while
economic variables include
public and private R&D, learning
by doing, economies of scale, and
others.
•Module efficiency was the
leading technical variable and
public and private R&D was the
leading economic variable for cost
reduction between 1980 and 2001.
•After 2001, economies of scale
became a significant driver of
cost reduction as the plant size
increased.
23%
21%
17%
14%
10%
8%
7%
-5%
1980-2001
12%
14%
3%
8%
16%
36%
7%
4%
2001-2012
∆ Efficiency
∆ Non-Si material cost
∆ Silicon price
∆ Silicon usage
∆ Wafer area
∆ Plant size
∆ Yield
∆ p0
10%
5%
20%
45%
10%
10%
60%
40%
1980-2001 2001-2012
Public and Private R&D
Learning by doing Economies of scale
Other
Cost change from technical variables* Cost change from economic variables*

CKI Solar-250426_updateBOS
9 of 79
Residential, commercial & industrial distinct from utility solar PV
DISTRIBUTED SOLAR PV UTILITY SOLAR PV
Residential Commercial & industrial Utility
Description •Small systems, most often on residential
rooftops
•Produce electricity directly for the
homeowners; could export and deploy
excess amount to the grid
•Midsize systems, often mounted on the
ground or flat roofs of commercial buildings
•Produce electricity directly for the business
use; could export and deploy excess
amount to the grid
•Large, ground-mounted array that delivers
power to the grid
•Often sell the pre-determined amount through a
Power Purchase Agreement (PPA) to a utility
off-taker
•Supply electricity to the designated
customers through the grid
Typical system size ~0.002-0.02 MW ~0.02-5 MW ~1-1,000 MW
Typical cost per kWh
(LCOE*, 2025, US) $0.117-$0.282 $0.081 –$0.217/kWh $0.038 –$0.078/kWh
Global cumulative installed
capacity (2024) 357 GW 522 GW 1,226 GW
(*) Unsubsidized LCOE (levelized cost of energy) is the average minimum price at which electricity generated must be sold to offset the total cost of production over the project’s assumed lifetime.
The LCOE for commercial and industrial is an average of a commercial rooftop and a commercial ground system.
Sources: SEIA, Solar Industry Research Data (2025); IEA, Renewables 2023 (2024); US DOE, SunShot 2030 (2025); Lazard, LCOE+ (2025); Nuveen, Energy Transition Q2 2024 Update (2024).
Credit: Taicheng Jin, Max de Boer, Lara Geiger, Marcelo Cibie, Hyae Ryung Kim, and Gernot Wagner. Share with attribution: Kim et al., “Scaling Solar” (10 July 2025).

CKI Solar-250426_updateBOS
10 of 79
Typical solar project economics result in payback periods ranging
from 2 to 10 years
Sources: SEIA, Solar Industry Research Data (2024); IEA, Renewables 2023 (2024); SolarKal, What’s the Sun’s Cap Rate? (2023); Revision Energy, How do Solar Panels Work (2025).
Credit: Isabel Hoyos, Taicheng Jin, Hassan Riaz, Hyae Ryung Kim, and Gernot Wagner. Share with attribution: Kim et al., “Scaling Solar”(10 July 2025).
Solar expenses
•High CapEx: Solar projects require substantial upfront investment in
equipment, installation, and site preparation. The average residential system
cost is $10,000 to $25,000, with a levelized cost of energy of $0.081 to $0.217
per kWh. Typical LCOE for commercial and industrial is $0.081 to $0.217 per
kWh and for utility-scale $0.038 to $0.078 per kWh.
•(Relatively) Low OpEx: Low maintenance costs relative to other energy
sources and no fuel costs result in low operating expenses.
Solar revenue
•Tax incentives: Under the IRA, Residential Solar Energy Credit, Investment
Tax Credit, and Production Tax Credit reduced ~30% of the initial cost. Other
state and local incentives can reduce it further.
•Long-term savings: Savings depend on project size and local grid electricity
price. Average annual savings could be $1,500 for residential projects and
range from $10,000 to $100,000 for commercial and industrial projects. The
payback period typically ranges from ~2 to 10 years.
•Additional revenue: Net metering allows surplus to be sold, including via
Renewable Energy Credits (REC) such as performance based SREC in NJ
which require utilities to meet RPS requirements; consumers can access solar
revenue through off-site community solar projects.
•Increased value: Solar installations can boost property value and commercial
appeal, attracting potential buyers, residents, employees, and investors.
Solar technology 101
Photons from sunlight hit solar
cells and release electrons
An inverter converts the DC
electricity into alternating
current (AC) electricity to
directly power buildings
Freed electrons flow through
the circuit and produce an
electric charge
Wiring in the panels captures
the direct electric current
(DC) generated
The system is integrated with
the energy grid to supply
excess AC electricity
Solar panels consist
of photovoltaic (PV)
cells made of silicon
semiconductors
with a negative and
positive layer

CKI Solar-250426_updateBOS
11 of 79
Case study: SolarKal saves businesses costs through a
competitive marketplace model
SolarKal acts as dedicated solar advisors for commercial real estate asset owners
•Asset portfolios are evaluated for solar potential by leveraging a database of
national pricing, injecting transparency into the marketplace
•By fostering a competitive RFP process involving 200+ pre-vetted and approved
vendors, clients' economics are improved by 43% on average
•Savings are structural - with an 80% RFP success rate, higher conversion deal
flows reduces CAC and therefore lowers costs
~50% of solar cost structure is soft costs or gross margins for
residential and commercial PV
(1) Other costs include permitting, inspection and interconnection, transmission line costs, sales tax, overhead, and profit.
(2) MSP - Minimum Sustainable Price, MMP - Modeled Market Price
Sources: NREL, US Solar PV System Cost Benchmark (Q1 2023) (2023); SolarKal, What’s the Sun’s Cap Rate? (2023).
Credit: Taicheng Jin, Max de Boer, Lara Geiger, Marcelo Cibie, Hyae Ryung Kim, and Gernot Wagner. Share with attribution: Kim et al., “Scaling Solar”(10 July 2025).
Solar systems cost1breakdown, 2024 ($USD/KW)2Observations
•Historically, the price of module is ~10-30% and other components (Inverter,
EBOS (Electrical Balance of Systems), SBOS (Structural Balance of Systems))
add ~15-25%; The remaining ~50% is soft costs / gross margins
•Soft costs / gross margins are high in part due to lack of transparency as well as
ultra-low conversion rates and high Customer Acquisition Costs (CAC)
•Higher prices are exacerbated in 3rd-party agreements like site leases where
complexity adds to the opacity, resulting in lower payments to customers
321
393
244
336
241
336
162
358
259
281
166
169
143
140
289
321
183
194
173
186
206
206
332
352
219
229
887
887
156
163
613
708
214
242
117
133
200
400
600
800
1,000
1,200
0
1,400
1,600
1,800
2,000
2,200
2,400
2,600
2,800
3,200
3,000
MMP-Residential
46
MSP-Commercial
55
MMP-CommercialMSP-Residential
32
MSP-Utility
62
33
MMP-Utility
60
3,154
1,341
1,511
985 1,119
2,737
Other
Officework
Fieldwork
EBOS
SBOS
Inverter
Module
Soft Costs

CKI Solar-250426_updateBOS
12 of 79
Deployment environments differ across states and energy markets,
with ISO-NE and CAISO leading in the US
Observations
•A state’s solar attractiveness is principally
determined by:
–Incentives including state rebates, SRECs (solar
renewable energy certificates), and community solar
–Electricity rates determining energy saving, which
make up the bulk of the revenue to repay investment
–Net metering rules setting rates utilities pay for
returned solar energy; e.g. “net metering” pays the retail
unit energy cost (same a customers pay to receive
energy), whereas “net billing” applies wholesale rate,
reducing revenue a customer receives
–Solar irradiation measuring how much sunshine an
area receives, on average, over a period of time
•CA and Northeastern states are the friendliest
solar states due to state level incentives like
NJ’s SREC, PA’s elevated electricity rates, and
NY’s offering of Tax Credit Bridge Loans and
VDER net-metering arrangement
Note: CAISO is the California Independent System Operator and ISO-NE is the Independent State Operator North-East.
Sources: SolarKal, The 50 States of Solar (2024); NREL, NSRDB (2025); EIA, Electric Power Annual Reports (2024); Berkeley Labs, Queued Up (2024).
Credit: Taicheng Jin, Hassan Riaz, Isabel Hoyos, Hyae Ryung Kim, and Gernot Wagner. Share with attribution: Kim et al., “Scaling Solar”(10 July 2025).
State-level solar receptiveness graded on a letter scale

CKI Solar-250426_updateBOS
13 of 79
ELP Greenport project demonstrates the economics of storage
and the delicate balance of community interests
Sources: Columbia CaseWorks, ELP Greenport: Scaling Community Solar (2024); Scenic Hudson, At the Historic Bronson House, a Surprising Solar Success (2025).
Credit: Taicheng Jin, Hassan Riaz, Isabel Hoyos, Hyae Ryung Kim, and Gernot Wagner. Share with attribution: Kim et al., “Scaling Solar”(10 July 2025).
9,400,000
5,210,000
1,500,000
2,350,000
2,400,000
390,000
550,000
Investment
Tax Credit
(ITC) for
Solar
Debt (at
5% for 10
years)
CapEx
Battery
(LiFe)
ITC for
Battery Year 1
Investment
Required
New York
State
Incentives
Capital
Expenditure
Solar Only
Assumptions: 21% tax rate; -0.5% rate of solar
depreciation; depreciation (year 1); 8% discount
rate
1. Electricity generated (number of modules x watts per
module) x the specific production (kWh per year)
*kW of installed capacity
2. Rate of $0.09 per kWh to determine revenue of
electricity generated
3. Rate of $0.28 per kWh for added value for electricity
generated in summer hours between 1 PM and 6 PM
(June, July, and August)
CapEx Required equity contribution (solar PV + storage)
Case study 1: ELP Greenport
•Developer: Eight Light Partners
•Location: Greenport, Columbia, New York
•Status: Operating
•Commission date: March 2020
•Capacity: 7 MWac
•Operator: Conductive Power
•Off-takers: Hudson community subscribers
Facts
•Viability and net present value depended on
multiple factors: solar generation capacity, CapEx,
availability of project financing, New York state’s
Value of Distributed Energy Resources (VDER)
•Metrics:
–NPV: $23 million
–IRR: (15% solar; 16% +storage)
–Margin: ~23%
–MOIC: ~2.12x
Financials
•Solar only or + storage?
–$1.4M additional equity contribution
–+ 30% generation = $175K additional per year
–Capital cost of battery = - $1.5M
–Government incentive for storage ($940K)
> $390K from ITC
> $550K from NYSERDA
•Community Opposition and Conservation
–Scenic Hudson and Historic Hudson banded together to
oppose the construction.
–Solar field initially sat across from the Oliver Bronson
House, a viewshed that gave birth to the Hudson River
School of American landscape painters.
–Consultation was conducted to revise site plan according to
the “Clean Energy, Green Communities” guide to relocate
visible panels away from the view of house.
Issues

CKI Solar-250426_updateBOS
14 of 79
Note: Texas has a larger band of uncertainty around buybacks depending on location
Sources: Solar.com, Solar Incentives by State (2025); Forbes, New Jersey Solar Incentives, Tax Credits And Rebates (2024); Energysage, Texas Solar Rebates and Incentives (2025); Texas Power
Guide, Find Your Best Plan (2025); DSIRE, DSIRE (2025); Canary Media, Florida is Now a Solar Superpower (2025); Solarkal, SolarKal (2025).
Credit: Taicheng Jin, Hassan Riaz, Hyae Ryung Kim, and Gernot Wagner. Share with attribution: Kim et al., “Scaling Solar” (10 July 2025).
Federal ITCs and PTCs provide limited relief, but state incentives
play a crucial role in pushing projects past investors’ hurdle rate
Observations
•Federal incentives provide a significant boost, but strong
state-level incentives can push a project over hurdle rate
–Federal level: ITC, PTC, Accelerated Depreciation
–State level: state Credits, RECs, rebates, state tax exemption, net-
metering, renewable portfolio standards (RPS), interconnection standards
–County level: rebates & grants, buildings standards
–Community level: energy-efficient organizations, regional partnerships
•NJ, FL, and TX offer varying levels of state-incentives,
resulting in different levels of project IRR
–New Jersey: The Successor Solar Incentive (SuSI) program rewards
solar energy production with SREC-II certificates, valued at $85-$90 per
MWh for 15 years. Solar equipment is exempt from sale and property
taxes, and net metering allows generators to sell excess electricity back to
the grid.
–Florida: The state exempts added value of solar energy system from
property taxes and sales taxes. Statewide net metering policy allows full
credit on utility bills. Local utilities offer $2,000-$4,000 rebates for solar
battery installations.
–Texas: Several utilities provide $2,500-$3,000 rebates for solar PV of at
least 3 kW. Some utilities and retail energy providers offer solar buyback
programs that provide bill credits or cash for surplus energy fed back into
the grid.
Annual income in Florida
(+) Energy Savings: $128,000
Project IRR: 11-13%
Payback Period: 7 Years
Annual income in New Jersey
(+) Energy Savings: $150,000
(+) REC Revenue: $125,000
Project IRR: 24-26%
Payback Period: 6 Years
Case study 2: New Jersey vs. Florida or Texas
Annual income in Texas
(+) Energy Savings: ~$128,000
Project IRR: ~8-16%
Payback Period: ~5-10 Years
REC could boost IRR by 7-15% and cut payback by 2-5 years
$1,125,000
$(100,000)
$(50,000)
0
500,000
1,000,000
1,500,000
2,000,000
$400,000
$1,500,000
System Price
$(450,000)
ITC
$(175,000)
Depreciation
Benefit Upfront
Investment
$1,900,000
$(550,000)
$(225,000)
Waterfall of a 1MW project without state-incentives Return Profile if based in:
- Diagonal represent additional cost/savings for range estimate.
- Assuming a standard 1 MW solar project (BTM/direct ownership): On-site system, behind the meter, for self-consumption; direct ownership
provides full control, access to tax incentives, and long-term savings.

CKI Solar-250426_updateBOS
15 of 79
Deregulated Texas energy market boon for solar, surpassing
California in 2024
Total installed utility-scale solar capacity in Texas and California (GW) Observations
•Texas surpassed California as leading solar PV
state after adding 1.6 GW in Q2 of 2024 (ACP).
•Texas installed nearly 9 GW of new solar by the
end of 2024 –over one-fourth of the U.S. 2024
additions –for a total capacity of 27.5 GW (ACP).
•Texas is expected to install 11.6 GW new utility-
scale solar in 2025 (EIA).
•Texas’ advantage:
–Deregulated, electricity-only energy market
–Streamlined approval process
–Abundant land
–Minimal state-incentives
•California’s challenge:
–Strong state incentives
–Strict regulations
–Interconnection delays
Source: ACP, Clean Power in 2024 (2025); EIA, Solar, Battery Storage to Lead New U.S. Generating Capacity Additions in 2025 (2025).
Credit: Hyae Ryung Kim, Taicheng Jin, Isabel Hoyos, and Gernot Wagner. Share with attribution: Kim et al., “Scaling Solar”(10 July 2025).
Case study 3: Texas vs. California
CAGR ‘10-’15
CA: 71%
TX: 87%
CAGR ‘15-’20
CA: 15%
TX: 73%
CAGR ‘20-’24
CA: 12%
TX: 54%
2010 2011 2012 2013 2014 2015 2016 2017 2018 2019 2020 2021 2022 2023 2024
0
2
4
6
8
10
12
14
16
18
20
22
24
26
28 California
Texas
Texas solar capacity
annual growth started
outpacing California in
2014
Texas solar capacity
annual growth started
outpacing California in
2014

CKI Solar-250426_updateBOS
16 of 79
Solar may lose its edge in costly, subsidy-reliant states like NJ with tariffs
and IRA repeal, but TX stays competitive with high output
63
85
41
50
55
59
61
59
61
0
10
20
30
40
50
60
70
80
90
Base Tariff IRA Repeal Combined
57
38
78
Solar vs. gas LCOE by region and scenario ($USD/MWh)
NJ Solar
TX Solar
Gas (National)
(1) Base: Reflects current economic conditions with stable policies; Gas assumes turbine shortage (+75% CapEX)
(2) Tariff: Adds a 10% CapEx increase for solar; Gas reflects turbine shortage and 5% Tariff
(3) IRA Repeal: Removes ITC and RECs; Gas has turbine shortage only
(4) Combined: Combines Tariff (+10% solar, 5% gas CapEX) and IRA Repeal (no ITC/RECs); Gas reflects turbine shortage (+75%) and tariff (+5%)
Sources: Lazard, LCOE+ (2025); Morgan Stanley, The BEAT - Outlook (2025); EIA, Annual Energy Outlook (2025); Offgridai, Offgridai (2024).
Credit: Hyae Ryung Kim and Gernot Wagner. Share with attribution: Kim et al., “Scaling Solar” (10 July 2025).
Data center
Willingness-to-pay
($70-80/MWh)
1 2 3 4
Observations
•NJ Vulnerability: High CapEX and REC
reliance push LCOE to $85/MWh under
tariffs + IRA repeal making solar
uncompetitive showing policy risks.
•TX Resilience: Low CapEX, minimal
RECs, and high output keep LCOE at
$55/MWh making solar competitive.
•Data Center Demand: TX’s solar PPAs
will be below data centers $70-80/MWh
budget even under Combined scenario,
supporting data center growth.
•Gas Constraints: Turbine shortages
(+75% CapEx) and tariff (+5%) elevate
gas LCOE up to $61/MWh.

Solar Technology
Landscape

CKI Solar-250426_updateBOS
18 of 79
(*) Price estimates are based on US market panel costs; ROW c-Si panel costs range from $0.10 to $0.23 per watt
Credit: Isabel Hoyos, Taicheng Jin, Max de Boer, Lara Geiger, Marcelo Cibie, Hyae Ryung Kim, and Gernot Wagner. Share with attribution: Kim et al., “Scaling Solar”(10 July 2025).
Two main solar PV cell technologies:
–Crystalline Silicon (c-Si): Rigid cells made from either mono- (mono-Si) or polycrystalline silicon (poly-
Si), with a commercial efficiency between 17% and 25%; cost ranges between $0.26 for utility-scale
projects to $0.6 per watt for residential projects.*
–Thin-film: Cells can be flexible, have a 7% to 8% commercial efficiency, and cost between $0.75 and
$1.10 per watt.*
Key messages
Solar Technology
Landscape
Trends across the production chain:
–Polysilicon: After a recent spike to $39 per kilogram, prices have come down to about $6 per kg as
production restarted post-COVID. Prices could continue to decline with continued capacity additions.
–Wafers: The industry has started to shift to larger wafer sizes, resulting in a 50% decrease in
polysilicon use per watt of capacity, and to N-type wafers.
–Cells: Production has shifted from BSF cells to PERC cells in the past decade, resulting in an average
1% efficiency gain for mono-Si cells, but could move to TOPCon or HJT in the future. Production has also
shifted from poly-Si cells to mono-Si cells, driven by higher efficiency and a drop in price.
Innovations in solar PV:
–Novel technologies: Silicon heterojunction cells, perovskite cells, and multi-junction cells have not been
able to replace c-Si cells at scale yet. However, their growing efficiencies coupled with potential cost
improvements could make them more competitive.
–Panel modifications: Solar trackers, bifacial panels, and concentrator PV can boost c-Si cell efficiencies
by up to 45%.
–Deployment locations: New developments in location include building integrated PV (BIPV), floating PV
(FPV), agrivoltaics, and vehicle integrated PV (VIPV).

CKI Solar-250426_updateBOS
19 of 79
Solar PV makes up >99% of global installed solar capacity
Solar PV
Concentrated solar power
Description Converts sunlight directly into electricity
using semiconductors Uses focused sunlight to heat a fluid (molten salt), which
produces steam that is used to drive a turbine
to generate
electricity
Advantages •Ease of installation —solar panels can be easily
installed in lots of different places
•Little maintenance required once installed
•Comes with built-in energy storage —thermal energy
can be stored for up to 16 hours
•Can be integrated with an existing fossil fuel plant
(e.g., to share turbine)
Global installed capacity
(2023) 1,055 GW
99% of total installed solar capacity 8.1 GW
1% of total installed solar capacity
Average cost
(LCOE,* global) $0.038 - $0.078 per kWh
(Lazard 2025) $0.118 per kWh
(2022)
2
1
(*) LCOE (levelized cost of electricity) is a way to compare the true costs of different energy sources.
Sources: IRENA, Solar Energy (2025); Our World in Data, Solar Photovoltaic Module Price (2024); HelioCSP, Cost of Concentrated Solar Power (CSP) Projects Fell from USD 0.38/kWh to USD
0.118/kWh (2023); Renewable Energy World, How Solar PV is Winning Over CSP (2013); Statista, Average Installation Cost for Concentrated Solar Power (CSP) Worldwide (2024); US DOE, SunShot
2030 (2025).
Credit: Max de Boer, Lara Geiger, Marcelo Cibie, Hyae Ryung Kim, and Gernot Wagner. Share with attribution: Kim et al., “Scaling Solar” (10 July 2025).
Main focus of this
deck

CKI Solar-250426_updateBOS
20 of 79
Crystalline silicon (c-Si) is the main cell type, while thin-film is
often reserved for highly specific use cases
CRYSTALLINE SILICON CELLS THIN-FILM
Monocrystalline (mono-Si) Polycrystalline (poly-Si, ‘multi-Si’)
Description Cells of polysilicon that have crystallized into a
single Si crystal (Czochralski process)
•One panel is made up of 32 to 96 silicon
wafers
•Black or very dark blue with round corners
•Cells of polysilicon that consists of many
square blocks of multiple Si crystals
•Has a visible grain, giving the cell a blue hue
without rounded corners
•Solar cells produced by depositing thin layers
of photovoltaic material on a base material
•PV material determines color, potentially
flexible depending on base layer
Commercial efficiency (2024) ~17–25% ~13–18% ~7–18%*
Panel cost per watt (2024) $0.26–$0.50 $0.28–$0.50 $0.75–$1.10
Challenges •Limited space or need for maximum output
subject to a surface area constraint •Price is a main concern •Price is a main concern
(*) Peak commercial efficiency of copper indium gallium selenide (CIGS) thin-film cells has reached 22% in lab settings and 18.7% in field tests.
Sources: PVPS, Trends in Photovoltaic Applications (2022); Encyclopedia Britannica, Thin-film Solar Cell (2024); Benda, A Comprehensive Guide to Solar Energy Systems (2018); NREL, US Solar PV
System Cost Benchmark (Q1 2023) (2023); InsideClimateNews, Solar Panel Prices Are Low Again. Here’s Who’s Winning and Losing (2024).
Credit: Max de Boer, Lara Geiger, Marcelo Cibie, Taicheng Jin, Hassan Riaz, Hyae Ryung Kim, and Gernot Wagner. Share with attribution: Kim et al., “Scaling Solar”(10 July 2025).

CKI Solar-250426_updateBOS
21 of 79
The industry shifted to mono-Si and larger wafer sizes, driven by
higher efficiency and cost reduction
Sources: IEA, Solar PV Global Supply Chains (2022); PV Magazine, Polysilicon Costs Have Slid by 96% Watt Over Past Two Decades (2023).
Credit: Taicheng Jin, Hassan Riaz, Max de Boer, Lara Geiger, Marcelo Cibie, Hyae Ryung Kim, and Gernot Wagner. Share with attribution: Kim et al., “Scaling Solar” (10 July 2025).
Mono-Si makes up ~95% of solar PV production
2%
3%
Global PV module production by technology (in % of total GW)
39%
49%
12%
2011 2012 2013 2014 2015 2016 2017 2018 2019 2020
95%
2021
Observations
•From 2018 to 2021, c-Si cell
production has shifted
dramatically from poly-Si to mono-
Si.
•This shift has been driven by the
higher efficiency of mono-Si cells
as well as efficiency improvements
in manufacturing process, leading
to lower prices.
•Thin-film production has increased
slightly over time as its
applications in special use cases
continue to grow.
•Global wafer production shifted from
<158.7 mm wafer sizes to larger
sizes (210 mm max. size).
•The shift to larger wafer sizes has
been one of the main drivers of the
decrease in polysilicon, resulting in
cost savings.
4%
36%
39%
21%
2017 2018 2019 2020 2021 2022e
Wafer sizes have increased since 2017
< 158.7 mm
158.7 - 166.0 mm 182.0 - 210.0 mm
210.0 mm
Mono-Si Poly-Si Thin-film

CKI Solar-250426_updateBOS
22 of 79
PERC cells have gained 65% market share, quickly replacing BSF
(-81%) since 2019, but TOPCon looms large
Note: Other cell types include TOPCon, heterojunction technology, and back contact.
Sources: IEA, Solar PV Global Supply Chains (2022); Solar Magazine, A Complete Guide to PERC Solar Panels (2022); Solar Magazine, TOPCon Solar Cells; The New PV Module Technology in the
Solar Industry (2023).
Credit: Taicheng Jin, Max de Boer, Lara Geiger, Marcelo Cibie, Hyae Ryung Kim, and Gernot Wagner. Share with attribution: Kim et al., “Scaling Solar” (10 July 2025).
0%
20%
40%
60%
80%
100%
2015 2016 2017 2018 2019 2020 2021 2022e
Back Surface Field (BSF) Passivated Emitter and Rear Cell (PERC) Other Cell Types
Observations
•Cell type refers to the materials and
configurations applied to the polysilicon
wafer to transform it into a functional PV
cell.
•Since 2015, we have seen a shift in cell
production where the BSF cell type has
been gradually replaced by the PERC cell
type.
–BSF solar cells: Traditional crystalline silicon cells
with an aluminum layer at the back that creates a
back surface field. This reduces recombination
losses and slightly improves efficiency.
–PERC solar cells: An advanced version of BSF
cells. In addition to the aluminum back, they have a
passivation layer and a dielectric layer that reflects
more light back into the cell, improving efficiency.
•The PERC cell type boosts the efficiency of
monocrystalline cells by about 1%.
•The share of other cell types is projected
to keep increasing (TOPCon cells boost
efficiency of PERC by about 2%).
P-type mono PERC has become the dominant cell type since 2019

CKI Solar-250426_updateBOS
23 of 79
HJT, perovskite, and multi-junction cells boast higher efficiency
but have yet to replace c-Si at commercial scale
Silicon heterojunction cells (HJT) Perovskite cells Multi-junction cells
Description •HJT incorporates thin layer(s) of undoped and
doped amorphous Si (a-Si:H) on both sides of
the crystalline silicon (c-Si) core used in
regular solar PV cells.
•Indium tin oxide is the preferred transparent
conductive oxide layer.
•Perovskites, or halide perovskites, are a family
of metal-based halides that have a distinct
octahedral crystal structure with the
potential
to replace crystalline silicon in PV cells.
•Whereas traditional solar cells have only one
layer of crystalline silicon, multi-junction
solar cells contain multiple layers of
photovoltaic material.
•Each layer is specifically designed to absorb
a different sunlight wavelength.
Efficiency ~26–29% ~26–34%1) ~30–47%2)
(depending on number of layers)
Estimated cost per watt ~$1.10–$1.60
(~10% more expensive than monocrystalline cells) ~$0.32–$0.37
(~70% cheaper than monocrystalline cells) ~$300
(~240x more expensive than monocrystalline cells)
Pros and cons •Has better performance at higher
temperatures than crystalline silicon cells; ─
useful in desert environments, for example
•Requires more expensive materials for
electrical contacts than regular silicon cells
•Can be produced at much lower
temperatures than crystalline silicon, leading
to lower costs
•Degrade when exposed to moisture and
oxygen, leading to shorter cell life spans
•Require much less space because of higher
efficiency —therefore, can be used in
satellites, for example
•Different layers made of rare elements are
much more expensive than crystalline silicon
(1) Highest efficiencies achieved for perovskite cells that also incorporate a crystalline silicon layer in a multi-junction setup; pure perovskite cell efficiency is ~26.1% (2023).
(2) Highest efficiencies achieved in combination with concentrators.
Sources: Akkerman and Manna, What Defines a Halide Perovskite? (2020); US EERE, Perovskite Solar Cells (2025);IEA, ETP Clean Energy Technology Guide (2025); NREL, Photovoltaics Research
(2025); NREL, Crystalline Silicon Photovoltaic Module Manufacturing Costs (2020);PV-Manufacturing.org, Silicon Heterojunction Cells (2025); SolarReviews, Exciting New Solar Technologies that Actually
Matter (2025); US DOE, Multijunction III-V Photovoltaics Research (2025); US DOE, Perovskite Solar Cells (2025); Z. Song et al., Manufacturing Cost Analysis of Perovskite Solar Modules (2018).
Credit: Taicheng Jin, Hassan Riaz, Max de Boer, Lara Geiger, Marcelo Cibie, Hyae Ryung Kim, and Gernot Wagner. Share with attribution: Kim et al., “Scaling Solar”(10 July 2025).
321

CKI Solar-250426_updateBOS
24 of 79
Efficiency of perovskite cells increased ~85% over 10 years
(6% CAGR) vs. multi-Si’s ~61% gain over 40 years (1% CAGR)
1975 1980 1985 1990 1995 2000 2005 2010 2015 2020 2025
10
15
20
25
30
35
40
Highest confirmed cell efficiency for research solar PV cells in lab conditions (in %)
+85%
Monocrystalline Si cell
Multicrystalline Si cell
Silicon heterojunction cell
Perovskite cell
Perovskite - Si tandem cell
Two-junction cell
Three-junction (or more) cell
Significant efficiency gains have been achieved for most cell types in past 10 years
Note: For the sake of simplicity, many nascent technologies have been left out of this chart. For the full interactive version of this chart, please see here.
Source: NREL, Photovoltaics Research (2025).
Credit: Taicheng Jin, Max de Boer, Lara Geiger, Marcelo Cibie, Hyae Ryung Kim, and Gernot Wagner. Share with attribution: Kim et al., “Scaling Solar” (10 July 2025).
Observations
•Poly-Si cells have still improved
somewhat in recent years, but
efficiency gains for mono-
crystalline cells have been
minimal since the 1990s.
•Perovskite cells have booked the
most impressive efficiency
gains:
–Regular perovskite cells’ efficiency
improved by 12% between 2021 and
2023 to 26%.
–Perovskite - Si tandem cells, which
consist of a perovskite cell layered on
top of a regular c-Si cell, improved by
10% between 2015 and 2023 to 34%.
•In multi-junction cells, most
efficiency gains have been booked
recently for three-junction (three
layer) cells (7% since 2002) ─
even getting close to four-
junction cells.

CKI Solar-250426_updateBOS
25 of 79
Panel modifications such as tracker and concentrators could
increase efficiency by an additional 40+%
Solar trackers
Bifacial solar PV
Concentrator PV (CPV)
Description •Single-axis trackers follow the position of the
sun as it moves from east to west; more
common in utility projects.
•Dual-axis trackers follow the sun both east to
west and north to south; more common in
commercial projects.
•Bifacial solar modules have solar cells on
both
sides of the panel.
•The backside uses light that is reflected off
the ground.
•Panels consist of a large array of mirrors
angled at a single solar PV cell, which is often
a more efficient and expensive cell like a
multi-junction cell.
•Panels work only in areas with strong direct
sunlight and need trackers to achieve the
highest efficiency.
Estimated efficiency gain Single-axis tracker: +25–35%
Dual-axis tracker: +35–45% Up to +30%, depending on the surface below the
panels Monocrystalline cell: +5–10%
Multi-junction cell: +10–20%
Estimated additional cost Residential scale: +40–100%
Utility scale: +7–10%* +10–20% Price estimates vary —up to 30% cheaper in
the right circumstances.
321
(*) For utility-scale, single-axis tracker.
Sources: California Energy Commission, Self-Tracking Concentrator Photovoltaics (2020); EnergySage, Is a Solar Tracking System Worth It? (2023); NREL, A Bottom-Up Cost Analysis of a High
Concentration of PV Module (2015); Marketwatch, A Guide to Bifacial Solar Panels (2024); Renogy, Bifacial Solar Panels (2024); Penn State, Utility Solar Power and Concentration (2025);PVPS, Trends
in PV Applications 2022 (2022); SolarReviews, What Is a Solar Tracker and Is It Worth the Investment? (2025).
Credit: Taicheng Jin, Max de Boer, Lara Geiger, Marcelo Cibie, Hyae Ryung Kim, and Gernot Wagner. Share with attribution: Kim et al., “Scaling Solar”(10 July 2025).

CKI Solar-250426_updateBOS
26 of 79
Solar has been tested in many deployment scenarios, integrating
with agriculture, urban architecture, and personal mobility
Building integrated PV (BIPV)
•BIPV serves a dual purpose: generating electricity
and insulating building from the environment.
•Panels can be retrofitted; the greatest value is gained
by including them in the initial building design.
•Aesthetically pleasing: Blends seamlessly to a
building’s façade and roof, or when integrated into
windows using semi-transparent thin-film
•Generation efficiency: Tends to be less efficient than
traditional PV
Agrivoltaics
•Agrivoltaics refers to the colocation of PV panels
and
crops, grassland, or animal husbandry.
•Space efficiency: By coexisting with existing farmland,
expands available space for PV installation
•Dual income: Provides diversified income streams for
farmers
Higher costs: Currently, requires higher upfront
investment in BoS components vs. traditional PV
Floating PV (FPV) or floatovoltaics
•FPV consists of panels placed on water, often near
hydroelectric dams.
•The panels can be rotated to track the sun; water
below keeps the panels cool, increasing efficiency.
•Space efficiency: Doesn’t require scarce land, and
available water surfaces are abundant; Japan, with
scarce land, is a leader in FPV
•Higher costs: Currently, requires higher upfront
investment and maintenance costs than traditional PV
Vehicle integrated PV (VIPV)
•VIPV refers to the integration of thin-film PV into the
roof or bonnet of electric vehicles.
•VIPV modules blend seamlessly into the vehicle’s
exterior and connect to the electric loads or battery.
•Increases mileage
•Decreases load on charging infrastructure
•Generation efficiency: Vehicles are not oriented to
optimize for the utilization of solar energy
Sources: BBC, The Floating Solar Panels That Track the Sun (2022); Fraunhofer ISE, Vehicle-Integrated PV (2025);PVPS, Trends in PV Applications 2022 (2022);SEIA, Photovoltaics (2025); US DOE,
The Potential of Agrivoltaics for the US Solar Industry, Farmers, and Communities (2023).
Credit: Isabel Hoyos, Max de Boer, Lara Geiger, Marcelo Cibie, Hassan Riaz, Hyae Ryung Kim, and Gernot Wagner. Share with attribution: Kim et al., “Scaling Solar”(10 July 2025).

Solar Supply Chain

CKI Solar-250426_updateBOS
28 of 79
Credit: Isabel Hoyos, Taicheng Jin, Max de Boer, Lara Geiger, Marcelo Cibie, Hyae Ryung Kim, and Gernot Wagner. Share with attribution: Kim et al., “Scaling Solar” (2 June 2025).
Silicon and silver make up >50% of the material costs of solar c-Si panels, with other major
material costs being glass (~13%), aluminum (~11%), polymers (~9%), and copper (~9%).
The solar panel production process consists of five main steps:
(1) The carbothermic reduction of quartzite (SiO2) to form metallurgical Si
(2) Creation of polysilicon through CVD or FBR
(3) Slicing of casted ingots into wafers
(4) Transformation of wafers into cells
(5) Combination of cells into panels, which are stacked, laminated, and fitted with frames and
junction boxes
Currently, manufacturing capacity exceeds demand along each step of the production
process by at least 70%. Overcapacity is expected to persist until at least 2030.
Over time, China has become the dominant player along every step of the solar panel
production chain, with at least 75% market share in every step. China’s market dominance is
driven by low production costs and high investment barriers.
U.S. manufacturing capacity has grown rapidly from ~7GW in 2020 to over ~58 GW as of
May 2025, driven by billions in public and private investment unlocked by IRA.
Solar module production is the most localized step of the supply chain, with 19 countries
having more than 1 gigawatt of assembly capacity.
Key messages
Solar Supply Chain

CKI Solar-250426_updateBOS
29 of 79
•Polysilicon is produced by
refining SiO₂into metallurgical-
grade silicon, then purifying it via
the Siemens process to
achieve ultra-high purity (7–10N)
SiO2is refined to produce ingots, which are cut into wafers and then
assembled into cells and modules
Sources: IEA PVPS, Trends in Photovoltaic Applications 2024 (2024); PV Education, Refining Silicon (2025); PV Manufacturing, Wafering (2025); images from IEA, Solar PV Global Supply Chains
(2022); IEA, Solar PV Manufacturing Capacity by Country and Region (2021).
Credit: Taicheng Jin, Hassan Riaz, Max de Boer, Lara Geiger, Marcelo Cibie, Heonjae Lee, Hyae Ryung Kim, and Gernot Wagner. Share with attribution: Kim et al., “Scaling Solar” (10 July 2025).
Polysilicon Ingots Wafers Cells Panel/Modules
China
APAC
India
ROW
74.7
15.4
2.8
7.1
85.1
12.4
1.1
1.4
China
APAC
India
ROW
96.8
2.5
0.5
0.2
China
APAC
Europe
ROW
79.4
8.0
6.0
6.6
China
Europe
APAC
ROW
•Polysilicon chunks are melted
into ingots - either as
multicrystalline blocks or
monocrystalline columns using
the Czochralski process for
higher purity and efficiency
•Polysilicon ingots are sliced into
ultra-thin wafers (≈200 µm)
using diamond wire or slurry-
based methods, with diamond
wire increasingly favored for its
efficiency
•Wafers become solar cells
through doping (with boron or
phosphorus), adding metal
contacts for conductivity, and
applying an antireflective
coating to boost sunlight
absorption
•In the final step, solar cells are
soldered into arrays,
encapsulated with protective
layers, mounted in a metal
frame, and fitted with a
connector to form a complete
solar panel
Process
Regions (%)

CKI Solar-250426_updateBOS
30 of 79
Demand for fossil fuels in the refinement step contributes most of
the CO2in the supply chain
Source: Bernreuter Research, Bernreuter Research (2025); Takla et al., Energy and Exergy Analysis of the Silicon Production Process (2013); PVTech, GCL-Poly Touts FBR Silicon Matching Siemens
Process on Purity (2021); Yin et al., Carbon Emission Analysis of Two Crystalline Silicon Components Throughout the Life Cycle (2021).
Credit: Taicheng Jin, Hyae Ryung Kim, and Gernot Wagner. Share with attribution: Kim et al., “Scaling Solar” (10 July 2025).
Observations
•Silica undergoes carbon-thermic reduction, which
requires arc furnaces to be heated up to ~1500 to
2000 degrees Celsius.
•Next, Poly-Si is refined either through the Siemens
process (left) or the FBR process (right)
•The exergetic efficiency of silicon production is
around 0.33 - 0.41, which means only about one-
third of the available energy is successfully
converted into useful work.
•The high energy consumption of sustaining electro-
arc furnaces means access to cheap energy
sources, which until now has largely been fossil
fuel-sourced electricity, is further contributing to
GHG emissions.
•Some look to FBR for energy reduction (10-12%).
GCL-Poly’s 10K MT plant reduced CO2emission
by 130,000 tonnes (-74% to the Siemens process).
•Most carbon emissions are in the production
phase, specifically 41% from poly-Si refinement.
•PERC P-mono has a 10% higher life-cycle
carbon emission than PERC P-poly.
•Left figure: The Siemens process, which uses trichlorosilane, reacts with H2and accretes on rods through chemical vapor deposition.
•Right figure: Silicon-containing gas is injected together with hydrogen (H2) through nozzles at the bottom to form a fluidized bed that
carries tiny silicon seed particles fed from above.
Siemens dominates 80% of production … but FBR is catching up

CKI Solar-250426_updateBOS
31 of 79
Silicon and silver make up the bulk of material cost; cell-to-module
assembly represents the largest chunk of in-house cost (~60%)
Notes: Cash cost assumes in-house production from polysilicon modules to integrated solar makers, D&A, SG&A excluded; median used for silicon cost: $6 ~$7/kg, $2.14/g polysilicon, $1=¥7 when
referring to mainland China factories.
Source: Sinovoltaics, Solar Panel Manufacturing Process (2025); IEA, Solar PV Global Supply Chains (2022); PV-Manufacturing.org, Photovoltaic Manufacturing and Technology (2025).
Credit: Taicheng Jin, Isabel Hoyos, Max de Boer, Lara Geiger, Marcelo Cibie, Hyae Ryung Kim, and Gernot Wagner. Share with attribution: Kim et al., “Scaling Solar” (10 July 2025).
1.6
11.0
0
2
4
6
8
10
Silicon
Cost Silicon
to Wafer Wafer
to Cell Cell to
Module In-house
Cost
Observations
•Silicon input accounts for around
15% of total in-house cost:
–Silicon and silver make up >50% of
materials costs of solar c-Si panels, but
material use is becoming more efficient.
–Polysilicon intensity for c-Si cells
dropped by more than six times between
2004 and 2020 thanks to cell efficiency
improvements.
•Cell to module is nearly 60% of total
in-house cost.
–Cells are stringed and placed between
sheets of EVA (ethylene vinyl acetate) and
laminated; the structure is then supported
with aluminum frames.
•Big, integrated companies can exert
pressure on small players that have
less cost control.
–Companies with cost advantage and cash
holdings will end up expanding market
share.
0%
20%
40%
60%
80%
100%
Glass
70%
Aluminum
13%
Polymers 9%
Silicon 4%
By weight
Glass
13%
Aluminum
11%
Polymers
9%
Silicon
40%
Copper 9%
Silver
16%
Other 4%
By value
Breakdown of total cost (cents per
watt) –(Q3, 2023) Material composition shares of c-Si
solar panels (in %) –(world, 2021)

CKI Solar-250426_updateBOS
32 of 79
~60% cost reduction from R&D efficiency improvements, ~20%
from economies of scale, ~10% from yield from learning by doing
Source: Our World in Data, Solar Photovoltaic Module Price (2024); Nemet, How Solar Energy Became Cheap (2019); Farmer & Lafond, How Predictable is Technological Progress? (2016); Kavlak et
al., Evaluating the Causes of Cost Reduction in Photovoltaic Modules (2018); Our World in Data, Learning Curves: What Does It Mean for a Technology to Follow Wright’s Law? (2023); BNEF, 1Q 2024
Global PV Market Outlook (2024); IEA, Solar PV Global Supply Chains (2022), Business AnalyticIQ, Polysilicon Price Index (2025); PV Magazine, Polysilicon Prices Can Hit All-time Low (2023).
Credit: Taicheng Jin, Isabel Hoyos, Hassan Riaz, Hyae Ryung Kim, and Gernot Wagner. Share with attribution: Kim et al., “Scaling Solar” (10 July 2025).
Observations
•Polysilicon prices rose to $39 per
kilogram due to COVID-related
closures of Chinese production
facilities between 2020 and 2022; as
restrictions eased and new
production capacity grew, prices fell
back to less than $10 per kg.
–With new capacity still being added,
analysts estimate the price could drop
under $7 per kg in China in the near future.
•Global wafer production has shifted
from <158.7 mm wafer sizes to
larger sizes since 2017.
•Larger wafer sizes use fewer grams
of polysilicon per watt, driving
considerable cost savings.
•Manufacturing overcapacity may
temporarily decline in coming years
as factories pause for upgrades
needed to produce larger wafer sizes.
0
10
20
30
40
2018
China’s actual polysilicon price by month ($/kg)
2020 2021 2022
$39/kg
2017 2023 2024
$6/kg
2019
Polysilicon prices peaked in 2022Change in manufacturing parameters (’80-’20)
0.0
0.1
0.2
0.3
0.4
0.5
0.6
0.7
0.8
0.9
1.0
1980 2000 2020
-6%
+27%
+81%
-84%
Yield (%)
Silicon usage = cm
Share of material cost (θ)
Module efficiency (η)
COVID (’19-’22)
Russia-Ukraine
conflict (’22 -
present)

CKI Solar-250426_updateBOS
33 of 79
0
200
400
600
800
1,000
1,200
1,400
1,600
Global solar PV manufacturing capacity along steps of the value chain (in GW)
2015 2016 2017 2018 2019 2020 2021 2022 Announced
capacity 2030
exp.
demand
2023 2024
Solar PV manufacturing capacity exceeds demand at every step by
at least 70%; overcapacity is expected to last at least until 2030s
Solar PV demand
Polysilicon
Wafers
Cells
Modules
Note: Expected demand in 2030 is based on IEA’s Net Zero Emissions (NZE) scenario.
Source: IEA, Solar PV Manufacturing Capacity (2025).
Credit: Yosafat Partogi, Taicheng Jin, Hassan Riaz, Max de Boer, Lara Geiger, Marcelo Cibie, Hyae Ryung Kim, and Gernot Wagner. Share with attribution: Kim et al., “Scaling Solar” (10 July 2025).
In 2024, the lowest capacity in the
production chain was for wafers at
1118 GW vs. demand of 507 GW,
resulting in 120% overcapacity.
Since 2017, solar PV manufacturing capacity has outstripped demand Observations
•Since 2015, global solar PV
manufacturing capacity has
consistently exceeded demand.
•Global capacity is expected to more
than double in the next five years,
based on investment
announcements and the expected
impact of industrial policies:
–IRA –United States
–The Green Deal –EU
–Production Linked Initiative –India
•With demand in 2030 expected at
900 gigawatts per year, all currently
announced production capacity
would result in a 9% overcapacity in
2030.

CKI Solar-250426_update (1)BOS
34 of 79
Bolstered by the IRA, the United States’ solar PV manufacturing
capacity grew ~50% annually since 2020
15
25
7
15
42
56
0
5
10
15
20
25
30
35
40
45
50
55
60
2020 2022 2023 2024 2025E1
19
9
19
38
Global solar PV panel production (GW)
(1) US solar PV manufacturing & installation capacity as of May 2025 (SEIA, 2025)
Source: SEIA, Solar Industry Research Data (2025); IEA PVPS, Trends in Photovoltaic Applications 2024 (2024); IRENA, Stats Tool (2025).
Credit: Yosafat Partogi, Heonjae Lee, Isabel Hoyos, Hyae Ryung Kim, and Gernot Wagner. Share with attribution: Kim et al., “Scaling Solar” (10 July 2025).
Observations
•China still dominates the global market:
– As of 2025, China’s manufacturing capacity exceeds 1,200
GW/year which accounts for 80-90% of the global
supply across key stages (polysilicon, wafers, cells,
modules).
–China has aggressively increased solar module
production along with producing in countries in APAC
region such as Vietnam, Malaysia, and S. Korea.
–China benefits from economies of scale, vertically
integrated supply chains and low productions costs.
•US manufacturing capacity is growing rapidly:
–US module manufacturing capacity grew from ~7 GW in
2020 to over 56 GW as of May 2025.
–The IRA was a game changer unlocking billions in public
and private investment.
•China’s market faces headwinds as
overcapacity and price crashes in 2024/2025 are
pressuring Chinese manufacturers.
•While the US cannot match China’s scale, the
country strategically built high-quality, incentivized
and politically supported capacity from 2022 to
2025, starting to position itself as a strategic
alternative supplier in the West to mitigate
geopolitical and supply chain risks.
0
50
100
150
200
250
300
350
400
450
500
550
600
650
2016 2017 2018 2019 2020 2021 2022 2023
66
103 117 138
178
242
379
612
China
Vietnam
ROW
Malaysia
S. Korea
USA
India Installation
Manufacturing
US PV manufacturing & installation capacity (GW)

CKI Solar-250426_updateBOS
35 of 79
Despite increased geographic diversification, China firmly
sustains market dominance across entire solar supply chain
Sources: IEA, Solar PV Global Supply Chains (2022); IEA, 2027 Solar PV Global Supply Chain Projections (2022); SEIA, Solar & Storage Supply Chain Dashboard (2025); IEA PVPS, Trends in
Photovoltaic Applications 2024 (2024).
Credit: Shaurir Ramanujan, Taicheng Jin, Max de Boer, Lara Geiger, Marcelo Cibie, Heonjae Lee, Hyae Ryung Kim, and Gernot Wagner. Share with attribution: Kim et al., “Scaling Solar” (10 July 2025).
55%
65%
74%
85%
13%
7%
3%
8%
4%
3%
8%
18%
20%
15%
4%
4%
3%
2010 2015 2021
2%
3%
2023
Modules
China Europe North America APAC India Rest of world
CellsWafersPolysilicon
58%
66%
85%
93%
7%
3%
7%
4%
2%
28%
28%
12%
2010 2015 2021
1%
2023
78%
82%
97%
98%
3%
4%
18%
14%
2010 2015 2021
2%
2023
28%
48%
80%
92%
19%
14%
7%
29%
15%
6%
21%
23%
6%
3%
2010 2015 2021
2%
2023
Observations
•China’s share in all solar
PV manufacturing stages
exceeds 75% -more than
double its 36% share in
global PV demand.
•In 2025, solar module
manufacturing in the United
States surpassed 50 GW of
capacity
–U.S. solar and storage
manufacturing has reached
$40.6 billion since Q3 2022
•China faces cells and
modules competition from
Vietnam, Malaysia, and
Thailand.
•With increased incentives,
North America and India
are projected to scale
wafer, cell, and module
production by 2027.

CKI Solar-250426_updateBOS
36 of 79
China’s low production costs are enabled by vertical integration
and a focus on mega-scale plants
Lowest production costs globally Lowest investment costs for new plants
0.00
0.10
0.20
0.30
0.40
0.50
Total production costs for mono PERC c-Si solar components
by input (2022, USD per watt)
China ASEAN India United
States Korea Europe
0.24 0.25 0.26 0.29 0.31 0.33
Materials
Energy
Manufacturing labor
Depreciation
Other overhead costs
Source: IEA, Solar PV Global Supply Chains (2022).
Credit: Max de Boer, Lara Geiger, Marcelo Cibie, Hyae Ryung Kim, and Gernot Wagner. Share with attribution: Kim et al., “Scaling Solar” (10 July 2025).
67
69
38
25
136
63
132
95
82
52
51
0
40
80
120
160
Investment required for new solar PV production capacity
(in USD millions per GW of production capacity)
Polysilicon Ingots,
wafers Cells Modules
152
76 72
114
31
China
Europe / US
India
ASEAN
Observations
•Driven by government
investments in the early
2000s, China built an
enormous lead in solar
PV manufacturing
•Over the past 10 years,
producers have also
vertically integrated
along the value chain to
realize further economies
of scale
•Finally, China now has
extensive expertise in
developing mega-scale
PV manufacturing
facilities that no other
country can match

Solar Deployment
Landscape

CKI Solar-250426_updateBOS
38 of 79
Credit: Isabel Hoyos, Taicheng Jin, Max de Boer, Lara Geiger, Marcelo Cibie, Hyae Ryung Kim, and Gernot Wagner. Share with attribution: Kim et al., “Scaling Solar”(10 July 2025).
To achieve net zero by 2050, solar PV capacity must grow 15-fold —from 1,600 TWh in
2023 to 25,000 TWh in 2050.
–Only 55% of global solar PV generation capacity has been deployed by utility companies.
–Residential capacity has proportionally grown the fastest at +31% (’17–’22 CAGR), while utility
capacity has grown the most in absolute terms from 230 TWh to 961 TWh (+731 TWh ’17-’22).
Residential solar challenges include financing access.
–Recently in the United States, solar loans and direct purchases gained traction over once-dominant
third-party ownership models.
–Utilities either pay homeowners directly for their power (direct payment mechanisms) or give credits to
offset future consumption (credit systems).
–Community solar projects are a different way for non-homeowners to get access to solar PV.
Commercial and industrial players can opt for on-site installation of solar panels, signing a
power purchase agreement (PPA) or opting for a solar lease with a solar PV provider.
–PPAs have surged in popularity recently, with global volume covered by PPAs growing from 14 GW to
110 GW from 2016 to 2021.
–Solar leases have also grown in popularity in the Northeast corridor and recently California with very
attractive lease rates ranging from $68,000 to $100,000 a year per 100,000 square feet.
Project finance has become an increasingly popular financing method for utility-scale solar
PV projects given a surge in projects covered by PPAs. Project finance benefits include:
–Risk isolation
–Ability to optimize capital structure
Key messages
Solar Deployment
Landscape

CKI Solar-250426_updateBOS
39 of 79
~70% of solar PV investment comes from private sources, mostly
commercial financial institutions and corporations
30%
29%
15%
9%
8%
1%
1%
1%
0%
10%
20%
30%
40%
50%
60%
70%
80%
90%
100%
3% 3%
2%
Investment by percentage
$348B
Sources: CPI and IRENA, Global Landscape of Renewable Energy Finance 2023 (2023); IRENA, Investment Trends (2023).
Credit: Isabel Hoyos, Taicheng Jin, Hassan Riaz, Hyae Ryung Kim, and Gernot Wagner. Share with attribution: Kim et al., “Scaling Solar” (10 July 2025).
Observations
•In 2020, 68% of funding for solar PV came from
private sources.
–Private capital tends to flow to regions with low risk, making
public investment in regions like Sub-Saharan Africa
necessary.
–State-owned financial institutions and national development
finance institutions provided most of the public funding for
renewable energy in 2020.
•Households and individuals accounted for 10% of
investment in all renewable energy in 2020 —85%
of that for solar PV.
•Commercial financial institutions and
corporations accounted for ~59% of all renewable
energy investment in 2020.
•Institutional investors accounted for only 1% of
investment in renewable energy in 2020 and tend to
favor established technologies like solar PV and
onshore wind.
–In 2020, solar PV accounted for 74% of renewable energy
funding by institutional investors.
Global renewable energy finance,
by type of investor (2020)
State-Owned Enterprises
Multilateral Development
Finance Institutions
National Development
Finance Institutions
Government
Households/Individuals
Institutional Investors
State-Owned Financial
Institutions
Bilateral Development
Finance Institutions
Corporation
Funds
Commercial Financial
Institutions
41%
37%
9%
5%
10%
20%
30%
40%
50%
60%
70%
0%
90%
100%
80%
2%
3%
$339B
2%
Hydropower
Other
Bioenergy
Onshore wind
Solar thermal
including CSP
Offshore wind
Solar PV
Global renewable energy finance,
by technology (2020)

CKI Solar-250426_updateBOS
40 of 79
Residential solar incurs relatively high soft costs; commercial &
industrial and utility-scale face long permitting processes
Residential Commercial & industrial Utility-scale
Description •Powers a single residence
•Typically installed on rooftops or backyard,
consisting of an average of 8 to 20 panels
•2–10 kW
•Powers a commercial business, including small
businesses and large manufacturing facilities
•Typically installed on rooftops or adjacent land
•10 kW–10 MW
•Large-scale solar projects that generate power
to feed the energy grid, supplying a wide array
of potential off-
takers (spot market, commercial,
industrial, and utility companies)
•10 MW or larger
Global cumulative installed
capacity, 2024 357 GW 522 GW 1,226 GW
US system price ($ per watt), 2024 $3.36 $1.46 $1.05–$1.18
Deployment options •PPAs
•Lease
•Loan
•Direct purchase
•PPAs
•Direct purchase for on-site installation
•Lease
•Project-level financing (equity or debt)
•Balance sheet (equity or debt)
•Grants
•VPPAs
Stakeholders •Homeowners (off-takers)
•Financial institutions
•Contractors and installers
•Solar and energy storage equipment manufacturers
•Corporate and industrial customers (off-takers)
•Project developers and EPCs (engineering,
procurement, construction)
•Project financiers
•Contractors and installers
•Local government agency project owners
•Solar and energy storage equipment manufacturers
•Solar project owner
•Off-takers
•Project developers and EPCs (engineering,
procurement, construction)
•Project financiers
•Contractors and installers
•Local government agencies
•Solar and energy storage equipment manufacturers
•Solar project owners
Challenges •Relatively high soft costs
•Relatively high cost per watt •Relatively long permitting process
•Interconnection roadblocks •Relatively long permitting process
•Interconnection roadblocks
321
Sources: SEIA, Solar Industry Research Data (2025); IEA, Solar PV-Technology Deployment (2025); Wood Mackenzie, US Solar Market Insight (2025).
Credit: Isabel Hoyos, Taicheng Jin, Heonjae Lee, Hyae Ryung Kim, and Gernot Wagner. Share with attribution: Kim et al., “Scaling Solar”(10 July 2025).

CKI Solar-250426_updateBOS
41 of 79
~55% of installed solar PV capacity comes from utility, rest from
commercial and residential
0
200
400
600
800
1,000
1,200
1,400
1,600
1,800
Global cumulative installed solar capacity by producer type (in TWh)
2015 2016 2017 2018 2019 2020 2021 2022 2023 2024
Utility
Commercial
& Industrial
Residential
Note: Off-grid capacity in 2022 is 9 GW.
Sources: IEA, Renewables 2022 (2022); IEA, Solar Power PV Capacity (2025).
Credit: Taicheng Jin, Hassan Riaz, Max de Boer, Lara Geiger, Marcelo Cibie, Hyae Ryung Kim, and Gernot Wagner. Share with attribution: Kim et al., “Scaling Solar” (10 July 2025).
CAGR
’15-’24
+31%
+20%
+23%
+25.2%
Strongest growth in recent solar PV deployment comes from residential projects Observations
•Residential solar PV trends:
–Governments support residential solar
PV rollout through net metering and tax
breaks and credits.
–Electricity price increases in Europe
make residential solar more attractive.
–Self-sufficiency concerns return to US.
•Large-scale (C&I and utility) trends:
–High electricity prices in the EU (as a
result of natural gas) drive profits for
renewables.
–Considerable growth in China:
>New business models in China, like
power transmission via underutilized
ultra-high-voltage transmission
lines, enable faster solar PV rollout.
>Rising electricity prices in China, due
to internalization of externalities
from coal-electricity, speeds up PV
deployment.

CKI Solar-250426_updateBOS
42 of 79
Residential solar can be financed with different structures —key
difference is actual ownership
Description
Who
owns the
system? Upfront costs
Long-term
benefits for
homeowner Example companies
(US)
Solar PPA •Agreement where a company installs a solar system on a homeowner’s
property. The company owns the panels and is responsible for
maintenance.
•The homeowner buys the generated electricity from the company
, at a rate
that is often lower than the retail grid rate.
Company None
Lower
Also highly
dependent on
contract terms
Solar lease
•Agreement where a company installs a solar system on a homeowner’s
property. The company owns the panels and is responsible for
maintenance.
•The homeowner pays the lease company a fixed monthly lease fee, giving
them the right to use the produced electricity.
•Revenue from excess electricity production is allocated to either the
company or homeowner, based on the lease agreement.
Company None
Lower
Also highly
dependent on
contract terms
Solar loan
•The homeowner borrows money from a bank or other institution to finance
the purchase and installation of a solar system on their home.
•The homeowner repays the principal and interest over time.Homeowner None –Low Higher
Direct
purchase
•Direct purchase of a solar system by a homeowner
, without the involvement
of any other third party. Homeowner High Highest Not applicable
Sources: EnergySage, Solar Leases: What to Know Before You Sign (2025); NREL, Residential Solar PV: Comparison of Financing Benefits, Innovations, and Options (2012); SEIA, Solar Power
Purchase Agreements (2024); SolarReviews, An Expert Guide to Solar Leasing: Pros, Cons, and Red Flags (2025).
Credit: Max de Boer, Lara Geiger, Marcelo Cibie, Hyae Ryung Kim, and Gernot Wagner. Share with attribution: Kim et al., “Scaling Solar” (10 July 2025).
In the United States, the residential solar PV market has shifted over the past 10 years
from third-party ownership models (PPA and lease) to solar loans and direct purchases.
Residential

CKI Solar-250426_updateBOS
43 of 79
Consumers can receive either direct payments or credits for
surplus electricity produced
Credit systemsDirect payment mechanisms
Examples Feed-in tariffs, value-of-solar tariffs Net metering, net billing
Description •Homeowners receive direct financial compensation for
all the electricity they produce.
•Typically, homeowners pay the retail rate for any
electricity they themselves use.
•Financial compensation can be set below, at, or above
the retail rate of electricity depending on
policy goals.
•Homeowners receive credits for any surplus electricity
their solar panels feed back into
the grid, which can be used to offset future
consumption.
•When the received credit is valued at the retail price of
electricity, we call it net metering; if the value is lower
(e.g., at wholesale rate), it’s called net billing.
Sources: EnergySage, Feed-in Tariffs (2023); EnergySage, Net Metering vs. Net Billing (2022); NREL, Value of Solar Tariffs (2014).
Credit: Max de Boer, Lara Geiger, Marcelo Cibie, Hyae Ryung Kim, and Gernot Wagner. Share with attribution: Kim et al., “Scaling Solar” (10 July 2025).
Residential

CKI Solar-250426_updateBOS
44 of 79
Pay-as-you-go structure can bring affordability, expand service,
and improve financial inclusion
Sources: IRENA, PAYG Models (2020); USAID, PAYG Solar as a Driver of Financial Inclusion (2017).
Credit: Isabel Hoyos, Taicheng Jin, Hyae Ryung Kim, and Gernot Wagner. Share with attribution: Kim et al., “Scaling Solar” (10 July 2025).
Observations
•Electrification is a priority, but grid expansion is
expensive and has a long lead time. Therefore,
distributed solar PV, coupled with pay-as-you-go
(PAYG) could be an answer.
–Kenya and Tanzania represent 85% of market share, but
deployment is also in other countries, including Ethiopia,
Uganda, Sierra Leone, Malawi, and Zimbabwe.
•PAYG structure: A home solar system that
customers pay for using mobile payment
technologies and mobile phone credit.
–Certain rural populations have access to mobile internet and
ample solar potential but don’t have access to financial
accounts.
•Combination of payment rules and ownership and
financing schemes:
–Lease to own: Customers pay for the entire generation
capacity (i.e., solar home system) in small installments over
a period of one to three years.
–Usage-based: Customers prepay for the electricity supply
(in kilowatt-hours).
Residential
Provides funding to the
ESP for installing solar
home systems
Receives payment
from user
Provides machine-to-
machine tech and
monitoring
Provides mobile
services to enable
payments
Energy service provider Mobile network operatorFinancier
Roles and responsibilities of different stakeholders
Provides system
components,
installation, and
operations and
management, and
collects payments from
customers
Process: Installation
Payment by user with Mobile Money
Activation code sent by ESP
User input coded into PAYG
System unlocked for a set allowance

CKI Solar-250426_updateBOS
45 of 79
Commercial companies can install panels or buy electricity
through a power purchasing agreement
PPAOn-site solar installation
No attribution requiredAttribution required
Description •An agreement between a company and an owner of a solar
installation (e.g., a utility or a financial institution) to buy energy
directly.
•This long-term agreement locks in a fixed rate, ensuring
stability for the provider and often securing discounted rates
for the buyer compared to current wholesale prices.
•Companies can deploy larger solar systems on their
properties (e.g., flat roofs of manufacturing halls) typically
around ~500 kW, in contrast to 5 to 20 kW for residential setups.
•These systems often operate “behind the meter,” with energy
either consumed on site or sold back to the grid with feed-in
tariffs.
Sources: Avana Capital, How Does a Commercial Solar PPA Work (2019); Coldwell Solar, What Is a Commercial Solar PV System (2025); US DOE, Power Purchase Agreement (2025).
Credit: Max de Boer, Lara Geiger, Marcelo Cibie, Hassan Riaz, Hyae Ryung Kim, and Gernot Wagner. Share with attribution: Kim et al., “Scaling Solar”(10 July 2025).
Pros •Significant cost savings, as all produced energy comes at a
marginal cost of zero dollars
•Often allows company to make use of tax benefits (consisting
of federal investment tax credit and accelerated depreciation)
•Fixed prices provide certainty and stability for financial
planning
•Company has no concerns about installation or
maintenance, which is all done by the solar installation owner
Cons •Requires CapEx for purchase and installation and has
maintenance costs over time
•Continued dependence on grid electricity at wholesale rate
when panels are not producing electricity
•Requires long-term commitment (10 to 20 years)
•Company will not benefit financially if energy prices drop
Commercial

CKI Solar-250426_updateBOS
46 of 79
PPAs have surged in popularity over the past few years, driven by
companies looking to make credible sustainability commitments
Note: Graph excludes on-site PPAs. Pre-reform PPAs in Mexico and sleeved PPAs in Australia are excluded.
Sources: CGEP, The role of Corporate Renewable PPAs (2021); Climate Group RE100, 2024 RE100: Annual Disclosure Report (2024); WEF, Clean Energy CPPAs (2021).
Credit: Max de Boer, Lara Geiger, Marcelo Cibie, Hyae Ryung Kim, and Gernot Wagner. Share with attribution: Kim et al., “Scaling Solar” (10 July 2025).
5
10
15
20
25
30
35
40
45
50
02013 2014 2015 2016 2017 2018 2020 2021 2022 2023
1.0 2.3 4.7 4.3 6.2
13.6
20.2
25.1
31.1
40.9
46.0
2019
Strong growth in the signing of PPAs over past 5 years, especially in US
Global volume of corporate power purchase agreements signed per year (in GW)
Americas
EMEA
APAC
Observations
•Corporate power purchase agreements
have become increasingly popular.
–Companies are setting public sustainability
goals with renewable energy as a focal point.
–A growing focus on additionality, which prioritizes
adding new capacity over using existing ones, is
shifting companies from buying green energy
certificates to PPAs.
•There is still potential for growth:
Columbia University’s Center for Global
Energy policy estimates that only 3% of the
US commercial and industrial energy
market is covered by PPAs.
–Despite being the largest PPA market, the US
has seen deals decrease by 16% from a record
high in 2022 due to interest rate and PPA price
CGEP.
•Regulatory challenges also remain a
barrier in many markets, with issues ranging
from state-controlled utilities to
restrictions on transporting electricity to
the end user for PPAs.
Commercial
PPAs are now active
in 75 countries,
including the US, EU,
China, and India

CKI Solar-250426_updateBOS
47 of 79
Community solar is an increasingly popular way for more
consumers to access the benefits of residential solar PV
Sources: NREL, Community Solar Deployment (2024); NREL, Community Solar 101 (2020).
Credit: Isabel Hoyos, Hassan Riaz, Max de Boer, Lara Geiger, Marcelo Cibie, Hyae Ryung Kim, and Gernot Wagner. Share with attribution: Kim et al., “Scaling Solar” (10 July 2025).
Community solar deployment focused on small number of states Observations
•Community solar is a solar project an
asset owner pursues with
residential participants signing up
to receive a share of the benefits
and funding the project.
•Homeowners, renters, and
businesses can have equal access to
community solar, including low- to
moderate-income customers. This
builds a stronger, more distributed,
and more resilient electric grid.
•Customers either buy or lease a part
of a larger, off-site solar PV site.
•A utility company buys the electricity
generated by the community solar
project. In return, the participants
receive credits to offset their own
electricity bills.
Commercial - Community
0
1,000
2,000
200
400
600
800
1,200
1,400
1,600
1,800
2,400
2,200
2,308
936
1,604
2,100
593
New community solar capacity added by year and state (in MWac)
2014 2015 2016 2017 2018 2019 2020 2021 2022 2023 2024
25
844 143
582 712
2013
1,250
Florida
Minnesota
New York
Massachusetts
Texas
Illinois
New Jersey
Maine
Colorado
Arcanzo
Maryland
Other

CKI Solar-250426_updateBOS
48 of 79
Utility-scale PV can take a variety of equity-debt structures, but
project finance with tax equity remains a preferred staple
Sources: FS-UNEP, Global Trends In Renewable Energy Investment 2020 (2020); CPI and IRENA, Global Landscape of Renewable Energy Finance 2023 (2023); Steffen, The Importance of Project
Finance for Renewable Energy Projects (2018); PV Magazine, Utility-scale Solar Projects Secure Billions in Financing (2023); WSGR, Project Finance Primer for Renewable Energy and Clean Tech
Projects (2010).
Credit: Isabel Hoyos, Taicheng Jin, Hassan Riaz, Hyae Ryung Kim, and Gernot Wagner. Share with attribution: Kim et al., “Scaling Solar” (10 July 2025).
Observations
•Since 2013, the share of debt financing
in global renewable investments has
increased from ~23% to ~55%, primarily
driven by increased cash flow visibility
through PPAs
•Since 2004, project finance has become an
established financing alternative,
increasing its share from ~15% to ~35% of
renewable energy asset finance
•Project finance offers two main benefits to
renewable projects vis-à-vis balance
sheet alternatives:
–Corporate or balance sheet financing: Decision
is based on the entire balance sheet
–Project finance: On the cash flow generating
capacity of a special purpose vehicle (SPV)
–Use of an SPV, legally and commercially
separate from the project developer
–SPV financed with limited guarantees from the
project developer; lenders do not have
recourse on the other businesses of the project
developer and rely on the project’s cash flows for
repayment
Utility-scale
Excelsior Energy’s $1.41 billion package for Faraday Solar
28%
33%
21%
18%
Tax Equity (PTC Partnership)
Syndicated Loan
Ancillary Facilities
Tax Equity Bridge Loan
$1.41B
Typical lending fees for project financing:
(i) 2–6% of the aggregate loan commitment as an arranging
or structuring fee
(ii) 1% of aggregate loan commitment as a syndication fee
(iii) $75,000 annual administrative agency fee
(iv) $50,000 annual collateral agency fee
(v) Facility fees to each lender in the syndicate in an amount
between 0.75–1.5% of each lender’s commitment.
In addition, the project company will be required to pay the
professional fees and administrative expenses of each of the
lenders in evaluating the transaction, negotiating the loan
documents, and providing the loans.
Project Revenues
Construction / Operating
Debt Payment
Debt Service Reserve
Maintenance Reserve
Subordinated Debt
Distribution
Typical project finance waterfall (accounts)
C&O expenses
Fees, interest / principal
Maintain debt service reserve
Maintain maintenance reserve
Payment of sub-debt
Distribute to equity holder

CKI Solar-250426_updateBOS
49 of 79
There are many options for utility-scale solar to raise debt, each
with its advantages regarding debt load, rate and tenor, and risks
Source: WSGR, Project Finance Primer for Renewable Energy and Clean Tech Projects (2010).
Credit: Taicheng Jin, Hyae Ryung Kim, and Gernot Wagner. Share with attribution: Kim et al., “Scaling Solar” (10 July 2025).
Utility-scale
Syndicated and club loans
(BSL)
•Coordinated by one or more
arranger bank, whereas in club
deals, a handful of lenders
take equal roles in leading
•A group of banks each take a
portion of a larger loan so
minimize the risk
•Syndicated loan structures are
often preferred to accessing
the capital markets through
144A offerings because:
–Capital markets investors are
generally less likely to assume
construction risk
–The disclosure documentation
for a 144A offering is generally
more extensive than that
prepared in connection with
syndicating a commercial loan
Project bonds (144A)
•Private placement through
144A offerings:
–Exempt from registration with the
SEC if the purchasers are
“qualified institutional buyers
under the Securities Exchange
Act of 1933
•Amount raised disbursed at
closing, leads to negative carry
•Less restrictive covenants
•Issued in relatively small
amounts (making them ideal
for smaller project financing)
•Fixed rate with certainty
removes the upside potential
of floating rates that are
available pursuant to
commercial bank loans
•Faster to execute andless
inexpensive than BSL
Term loan B (TLB)
•Shorter tenors and lower or
delayed amortization, often
with bullet payments due at
maturity
•Higher risk profiles and usually
were non-investment grade
•Terms and conditions less
onerous than traditional project
debt that amortized over a
longer period
•As a result of the subprime
lending crisis and the
subsequent credit crunch, TLB
market all but disappeared
Construction loans
•Used only for the period in
which the project is under
construction
•Interest rate can be higher vis-
a-vis a term loan (reflecting
increased risk to lenders
during the construction period),
but more frequent drawdowns
of construction loans permitted
•At the end of the construction
loan availability period,
construction loan usually
converts to a term loan
Working capital loans
•Primarily for ordinary course
expenses such as inventory
purchases
•Sized smaller than
construction or term loans and
subject to a maximum
available amount tied to the
value of a project company’s
inventory and cash (often
80%)
•Usually revolving in nature,
meaning amounts borrowed
can be reborrowed once they
are repaid
Options for utility project to raise debt

CKI Solar-250426_updateBOS
50 of 79
Parties to a ‘bankable’ project generally include a sponsor,
lender(s), the project company, and an off-taker
(1) Tripartite agreements are between the project company, the security lender/guarantor, and one of: landowner, contractor, O&M, NPS, and off-taker.
(2) Key supplies could be directly purchased and allocated to the EPC by the project company.
Source: PwC, EPC Projects in the Solar Industry (2022).
Credit: Taicheng Jin, Hassan Riaz, Isabel Hoyos, Hyae Ryung Kim, and Gernot Wagner. Share with attribution: Kim et al., “Scaling Solar”(10 July 2025).
Solar PV Project
Company
Sub-contract
side deed
Utility-scale
Responsible
Authority Development
Approval
Landowner Lease
Lenders
Guarantor /
Security Trustee
Facility
Agreement
Tripartite
Agreement1)
Shareholder’s
Agreement Developer/
Sponsor
Buyer Share
Purchase
Agreement
Equity
Investor(s)
EPC
Contractor
PPA
Connection
Agreement
O&M operator
NSP
Off-taker
O&M
Agreement
EPC Contract
Supply
Contract
Supplier(s)2)
Advantages of Project Finance
•Easy project management::
Customers invest less time and
resources in the project than if they
were to do it themselves. And
contracting with the same company
for operations and management
later could mean (1) legal
enforceability and (2) less of a
learning curve with its own
installment.
•Better financing terms: Less need
for owner’s equity contribution
allows access to debt, as a cheaper
form of capital financing; risk
offloading also increases lenders’
appetite.
•Risk allocation: The project risk is
shifted to the EPC contractor. The
contractor is responsible for all
project activities from the design
phase through to the turnkey
moment.

CKI Solar-250426_updateBOS
51 of 79
Project finance sequesters risk, optimizes cap structure, and
offers alignment of interests for all parties involved
Advantages of project finance
Sources: FS-UNEP, Global Trends In Renewable Energy Investment 2020 (2020); Steffen, The Importance of Project Finance for Renewable Energy Projects (2018).
Credit: Taicheng Jin, Isabel Hoyos, Max de Boer, Lara Geiger, Marcelo Cibie, Hyae Ryung Kim, and Gernot Wagner. Share with attribution: Kim et al., “Scaling Solar” (10 July 2025).
Risk isolation
A special purpose vehicle
(SPV) isolates risks,
commercially and legally, and
provides separation from
project developer.
The only risk for the project
developer is its invested
capital.
If the project encounters
difficulties, lenders would
have claim only against the
project's assets, not the
broader assets of the
developer.
Alignment of interests
By creating a distinct project
entity, all stakeholders, from
investors to suppliers, hold
aligned incentivized for its
success, as returns are tied
to project performance, not
the developer's broader
assets.
Optimized capital
structure
Predictable cash flows from
fixed-rate power purchase
agreements can support a
higher debt load.
Debt financing allows retaining
of equity and overall is a more
cost-effective form of
capital with certain tax
advantages.
Flexibility in ownership
A distinct project entity
offers easier transfers in
ownership or sales of the
project to third parties at
various stages of the project.
Utility-scale

CKI Solar-250426_updateBOS
52 of 79
Most of operating period term loans in the US are back levered to
tax equity, a unique form of equity with loan-like characteristics
Observations
•Projects have high levels of contracted revenue, limited
variable OpEx, and relatively predictable cash flows, often held
in an LLC and taxed as partnerships.
•Tax equity typically covers 35% of the cost of a typical solar
project, plus or minus 5%.
•JPMorgan and Bank of America dominate 80% to 90% of
the market but could face headwinds as capital requirement*
is set to quadruple under Basel III.*
•The market is forecasted to grow from $20 billion to $50 billion
with recent innovations in transferability of tax credits.
–Blackstone’s Foss & Co. ITC transfer.
–Bank of America's launch of a tax credit transfer desk in 2023
Typical Structures
•Partnership flip (P-flip): Investors contribute cash for tax
benefits up to a certain date (~5 years), after which the
partnership terms flip. The developer instead receives the bulk
of the tax benefits and cash.
•Sale leaseback (SLB): The developer sells the solar system to
a tax equity investor that leases the system back to the
developer.
(*) Currently at 100% risk weight if bank’s total equity investments are below 10% of its capital. The excess equity investments exceeding 10% of a bank’s capital would be assessed at 400% risk weight.
Sources: US DOE, US DOE (2025), GoCardless, Tax Equity Definition (2021), YSG, Solar Tax Equity (2025).
Credit: Taicheng Jin, Isabel Hoyos, Hyae Ryung Kim, and Gernot Wagner. Share with attribution: Kim et al., “Scaling Solar” (10 July 2025).
Back-
Levered
Lenders
Borrower Tax Equity
Investor
Tax Equity
Partnership
Project Co.
Project
Sponsor
Typical back-leverage financing structure
Collateral Package
Back-Levered Loans
Sponsor Tax Equity
Investor
Period Tax Cash Tax Cash
11% Majority
share 99% Minority
share
295% 95% 5% 5%
Typical flip schedule

Solar Policy Landscape

CKI Solar-250426_updateBOS
54 of 79
Credit: Isabel Hoyos, Taicheng Jin, Hyae Ryung Kim, and Gernot Wagner. Share with attribution: Kim et al., “Scaling Solar” (10 July 2025).
Governments worldwide have implemented solar PV supportive policies, including subsidies
and tax breaks, feed-in tariffs, and net metering. In 2010, feed-in tariffs backed 85% of
global solar PV; by 2021 that dropped to only 28%, with other policies covering 49% and 23%
operating without support.
By extending and increasing solar tax credits, the US Inflation Reduction Act of 2022 has
mobilized $42 billion from 2022 to 2024 and was projected to generate an additional ~50%
(~160 GW) of solar capacity by 2033 before the Trump Administration’s repeal.
–Residential Solar Energy Credit: 30% of the expenses of an installed solar PV system can be
subtracted from federal income taxes
–Solar Investment Tax Credit (ITC): 30% (up to 50% if certain conditions are met) of the expenses of an
installed solar PV system can be subtracted from federal income taxes*
–Solar Production Tax Credit (PTC): ¢2.75 per kWh (up to ¢3.35 if certain conditions are met) of
produced solar energy can be subtracted from federal income taxes*
*ITC and PTC were mutually exclusive
Key messages
Solar Policy
Landscape
China has an installed solar capacity of ~6 GWh in 2023 (21% of total power generation
capacity).
– China’s 11th to 14th Five-Year Plans, from 2006 to 2021, focus on electrification, supply-side support for
renewable energy, and a “great push” for solar and wind.
In response to China’s market dominance, the US has introduced advanced manufacturing
tax credits, put tariffs on imported solar PV components, and included a domestic
content bonus in the solar tax credits for businesses to encourage domestic production.

CKI Solar-250426_updateBOS
55 of 79
Most governments’ policies focus on risk reduction or subsidies
Sources: Clean Energy Solutions Center, Solar Power Policy Overview and Good Practices (2015); PVPS, Trends in PV Applications 2022 (2022); US EIA, Portfolio Standards (2025).
Credit: Max de Boer, Lara Geiger, Marcelo Cibie, Hyae Ryung Kim, and Gernot Wagner. Share with attribution: Kim et al., “Scaling Solar” (10 July 2025).
Can be used to encourage:
Policy
Description
Residential C&I Utility
Direct subsidies
and tax breaks •Consists of governments providing direct financial support either in the form of subsidies or tax
breaks for the purchase of a solar PV system
Feed-in tariff (FiT) •A long-term, guaranteed price (often above prevailing market prices) for generated electricity from a
renewable source
•Fixed price eliminates market price risk for developers
FiTs through
tender •Developers bid on FiTs they will accept for specified generation capacity
•Government picks the lowest bid, leading to lower overall costs while still eliminating market price
risk for developers
•Similar tender setup can be used for commercial power purchase agreements
Net metering
(self-
consumption)
•Policy allowing a utility customer to subtract any power they generate from renewable sources
from
the power they consume
•Customer billed only for the difference, regardless of when the power was produced
Renewable
Portfolio Standard
(RPS)
•A regulatory mandate that requires a certain percentage of electricity produced by utility
providers in an area to come from renewable sources
•A common feature of RPS is the Renewable Energy Credit (REC) trading system, which can
reduce
compliance costs
•A utility that generates more renewable electricity than required may sell RECs to other utilities that
do not meet the RPS requirement

CKI Solar-250426_updateBOS
56 of 79
US Inflation Reduction Act included solar investment and
production tax credits, since repealed by Trump administration
Solar Production Tax Credit (PTC)
Solar Investment Tax Credit (ITC)Residential Solar Energy Credit
Homeowners Businesses
Sources: IRS, Residential Clean Energy Credit (2025); SEIA, Solar Investment Tax Credit (ITC) (2025); US DOE, Homeowner’s Guide to Going Solar (2025); US DOE, Federal Solar Tax Credits
Resources (2022).
Credit: Taicheng Jin, Max de Boer, Lara Geiger, Marcelo Cibie, Hyae Ryung Kim, and Gernot Wagner. Share with attribution: Kim et al., “Scaling Solar” (10 July 2025).
•Expenses covered by the tax credit include:
–Solar PV panels or cells
–Contract labor for installation
–Balance-of-system equipment
–Energy storage
–Sales tax
•The tax credit can also be used against
participation in an off-site community solar
project
•The tax credit begins phasing out in 2032 and
ends by 2035, or when the US treasury secretary
determines there has been a 75% reduction in
annual greenhouse gas emissions.
•Large-scale utility farms that have access to ample
sunshine are likely to benefit from the PTC.
•Expenses covered by the tax credit include:
–Solar PV panels, inverters, racking, balance-of-system
equipment, and associated sales and use taxes
–Installation costs
–Step-up transformer, circuit breakers, and surge arrestors
–Energy storage devices
–Interconnection costs (for projects of 5 MW or less)
Business owners cannot claim the ITC and PTC for the same solar PV installation. In general, large-
scale projects that are expected to generate lots of electricity benefit more from the PTC.
30%
of the expenses of an installed solar PV system
can be subtracted from federal income taxes
30%
of the expenses of an installed solar PV system
can be subtracted from federal income taxes
(up to 50% if certain conditions are met)
¢2.75 per kWh
of produced solar energy can be
subtracted from federal income taxes
(up to ¢3.35 if certain conditions are met)
The residential and commercial solar investment tax credits have helped the US solar industry grow by a factor of more
than 200x since it was implemented in 2006, with an average annual growth of 33% over the past decade alone

CKI Solar-250426_updateBOS
57 of 79
New transferability rule provides simple fungibility to investors,
reducing soft costs and eliminating uncertainties
Sources: ACORE, The Risk Profile of Renewable Energy Tax Equity Investments (2023); Bloomberg Tax, Insight: Tax Equity Remains an Under-Utilized Tool for Corporate Tax Strategy (2019); David
Riester, Segue, The End of Tax Equity as You Know It (2022); White & Case, Clean Energy Tax Credits –Transferability and Deal Structure Alternatives (2024).
Credit: Taicheng Jin, Isabel Hoyos, Hyae Ryung Kim, and Gernot Wagner. Share with attribution: Kim et al., “Scaling Solar” (10 July 2025).
Observations
•IRA allowed sponsors without tax appetite to sell ITC to a third party, but direct
transfer has disadvantages for the sponsor.
•New hybrid structures, in addition to the traditional P-flip, inverted lease, and sale
leasebacks, help address challenges.
•A solution to the chicken-and-egg problem:
–Elegant solution to various risks that plague development (EPC, off-take, and financing), increasing
project value & viability through decreased risk premium & debt load.
–Tax appetite prompts a tax equity check which help assure lenders and secures construction
financing, positively (albeit indirectly) impacting a project viability.
•Transferability’s value to sponsors:
–Lowers sponsor’s aversion to construction risk, who will fund a large portion of the CapEx of
the project, but demand seniority under the pre-negotiated cash-flow waterfall.
–Taxpayers who claim the business solar ITC could use an accelerated depreciation schedule
(MACRS curve), which allows for a greater depreciation expense in the early years of the life of an
asset, reducing tax liabilities; full tax basis —half the ITC depreciated over a five-year schedule using
a half-year convention.
•Transferability’s value to developers:
–Long-term commitment helps raise construction finance and facilitate entrance of large buyers.
–Transferability rule diffuses this problem because construction lenders will underwrite loans
without a hard tax equity commitment with a more liquid, simpler tax equity market.
Factors that favor using direct transferability
Loan proceeds Debt is “front” leverage, sized against more cash flow; less
subordination and no forbearance, reduced interest rate and
DSCR WACC ↓
Equity proceeds from
cash flow ↑ Without tax investor cash allocation, more cash for equity buyer
to value
Equity proceeds from
target return ↓ Simpler structure with less subordination and bigger check size
equity returns will compress further
Soft costs ↓ Eliminates or reduces legal-, independent engineer-, insurance
consultant-related costs
No tax investor buyout Eliminates uncertainty of cash equity to make assumptions
about details around buyouts in 5 to 10 years
Factors that favor sticking to full tax equity structures
Credits purchased at
discount Transferrable credits often sold at discount (95 on the dollar)
Accelerated depreciation Value of MACRS/bonus depreciation and the TVM of avoided
taxes is lost
Basis step-up (↑) Opportunity to step-up ITC basis in SLB/LPT
Q: Avoided soft costs + lower WACC >ITC buyer discount + lost MACRS + basis step-up value
Direct transfer reduces uncertainties, but tax equity structure
could still be valuable to capture depreciation and basis step-up

CKI Solar-250426_updateBOS
58 of 79
Adders over next 10 to 12 years aimed to boost domestic content
and labor and increase deployment in low-income areas
(1) Applicable date is either as after 2032 or when US treasury secretary finds that 75% reduction in annual GHG emission has been achieved compared to 2022 baseline.
(2) Base rate refers to scenario if project does not meet labor requirement (prevailing wage and apprenticeship requirement).
Source: US DOE, Summary of Investment Tax Credit (ITC) and Production Tax Credit (PTC) Values Over Time (2023).
Credit: Taicheng Jin, Hyae Ryung Kim, and Gernot Wagner. Share with attribution: Kim et al., “Scaling Solar” (10 July 2025).
Start of Construction (year)
’06
-
’19
’20
-
’21
’22 ’23-’33 ’34 (2+) ’35 (3+) ’36 (4+)
ITC
Full (Base)
Base
30% (
-
)
26% (
-
)
30%
(6%) 30% (6%) 22.5% 15% (3%) 0%
Domestic
Content
No Incentive
None
10%
7.5% (1.5%)
5% (1%) 0%
Energy
Community
10%
7.5% (1.5%)
5% (1%) 0%
Low
-
income adder
<5 MW (LMI)
10% 10% 10% 10%
Qualified
Projects 20% 20% 20% 20%
PTC
Full (Base)
Base
¢2.75
(¢0.55)
¢2.75 ¢2.0(¢0.4) ¢1.3(¢0.3) ¢0
Domestic
Content None ¢0.3 0.2 ¢ (¢0) ¢0.1(¢0) ¢0
Energy
Community
¢0.3 0.2 ¢(¢0) ¢0.1(-) ¢0
Observations
•Base ─ bonus two-tier setup:
–Adders boost domestic content
sourcing, energy communities, and
qualified areas.
–Prevailing wage and apprenticeship
allow company to claim under full
case.
•Step downs motivate enterprises
to take advantage of construction
when need is critical through
reduction in tax liabilities.
•But step downs could create
logjams and leave developers and
consumers frustrated.
•The 2035 to 2036 expiration
indicates a compact timeline (10 to
15 years), while many utility solar
projects may need long lead-in
time.
Step-down schedules and adders for ITC and PTC1) 2)

CKI Solar-250426_updateBOS
59 of 79
IRA mobilized $42B from 2022 to 2024; projected to add ~50%
(~160 GW) of solar capacity by 2033, before Trump repeal
Sources: Wood Mackenzie, US Solar Market Insight (2025); IRENA, Stats Tool (2025); Wood & Mackenzie, The Inflation Reduction Act and Its Impact So Far (2023); US Department of Treasury, The
Inflation Reduction Act (2024) The Inflation Reduction Act (2023); HEATMAP, The First IRA Tax Credit Data Is In (2024); SEIA, Impact of the Inflation Reduction Act (2022); Rhodium Group, Clean
Investment in 2023 (2024); American Clean Power, Investing in America 2024 (2024).
Credit: Taicheng Jin, Isabel Hoyos, Heonjae Lee, Hyae Ryung Kim, and Gernot Wagner. Share with attribution: Kim et al., “Scaling Solar” (10 July 2025).
Actual Post-IRA Solar Growth
•From August 2022 to August 2024, $42 billion in investment was
realized, 33 GW of solar capacity was added, and 95 new solar
manufacturing facilities were announced.
•Residential clean energy credit adoption has surpassed
expectations, boosting deployment of residential solar.
–Over 1.2 million Americans used residential clean energy tax credits
–The government budgeted $2 billion in 2023, but actual spending was more
than triple
–30% more people filed for energy efficiency and/or rooftop solar tax credits in
2022 tax returns compared with 2021
•Utility-scale solar expansion is leading clean electricity
expansion post-IRA, generating the majority of renewable energy
capacity additions. However, clean electricity is at risk of falling
short of post-IRA growth projections.
–The IRA has made renewable electricity cost competitive with coal and
natural gas. With reduced cost barriers, tackling remaining non-cost barriers
like permitting, intermittency, and supply chain is critical to achieving climate
change mitigation goals.
•Clean energy investment is growing fastest in so-called
energy communities —areas with coal mine or plant closures,
brownfield sites, or previously high fossil fuel employment and
high unemployment.
The IRA is projected
to drive an additional
160 GW of solar
deployment over the
next 10 years when
compared to a non-
IRA scenario,
according to the
SEIA
Projections include
over $565 billion in
new investment over
the next decade, a
$144 billion increase
from baseline
Post-Inflation Reduction Act (IRA) solar projections
25
30
35
40
45
0
5
55
10
60
15
65
20
50
’25 ’26 ’27 ’28 ’29 ’30 ’31 ’32 ’33’24
No IRA
Post-IRA
Annual US solar installations (GW)

CKI Solar-250426_updateBOS
60 of 79
Feed-in tariffs (FiT) used to be the predominant form of support;
now phased out in favor of other policies or no support at all
85%
60%
28%
11%
7%
20%
16%
16%
15%
10%
17%
6%
20%
40%
60%
80%
100%
0%
Evolution of solar PV global policies over time (in % of global GW of solar PV covered)
2010
2%
2015
3%
2021
3%
Green certificates or RPS
Net metering (self-consumption)
No policy support
Direct subsidies or tax breaks
No policy support (self-consumption)
FiT through tender or PPA
FiT
Less solar PV requires policy support
Sources: Clean Energy Solutions Center, Solar Power Policy Overview and Good Practices (2015); PVPS, Trends in PV Applications 2022 (2022).
Credit: Max de Boer, Lara Geiger, Marcelo Cibie, Hyae Ryung Kim, and Gernot Wagner. Share with attribution: Kim et al., “Scaling Solar” (10 July 2025).
Global trends
•A significant increase has been observed for
non-incentivized solar PV (generated energy is
sold at the market rate, also called merchant
PV).
•FiTs are becoming less popular. Existing tariffs
are reduced or replaced with new pricing
mechanisms:
–Feed-in premiums: Instead of guaranteeing a fixed
price, government guarantees a fixed premium on top of
prevailing market prices.
–Contracts for difference: These also guarantee a fixed
payout per energy unit, with the government covering
the gap between the agreed upon and market price.
•FiTs through tender are evolving to encourage
competition and shifting away from single
focus on price:
–Tech-neutral tenders specify an amount of generation
capacity but do not specify what renewable energy
technology must be used. This puts solar PV in direct
competition with wind and other forms of renewable
energy.
–Multiple-factor tenders add criteria on factors such as
environmental protection and local origin of components.

CKI Solar-250426_updateBOS
61 of 79
From the 11th to the 14th Five-Year Plan, China’s solar strategy
adapts through each iteration from 2006 to 2021
Source: Chinapower, CEC China (2024).
Credit: Taicheng Jin, Hyae Ryung Kim, and Gernot Wagner. Share with attribution: Kim et al., “Scaling Solar” (10 July 2025).
China’s total installed power generation capacity (2006 vs. 2023, GWh)
Observations
• China’s strategy is motivated by industrial
competitiveness as a slowdown in GDP
growth, rising labor costs, and
pollution.
•Energy bases that combine wind and solar
arrays in areas with low populations are
excellent learning projects.
•Utility SOEs pushed to learn by doing,
often politically backed to stomach
upfront CAPEX costs through easy
access to debt financing
•Strategy was looking up the supply
chain, all the way to mining and
processing of the rare earth and strategic
minerals.
2006 2011 2016 2021
•Electrification through (1)
cleaner coal, (2) larger plants, (3)
new hydro, (4) nuclear, and (5)
grid capacity and west-east
transportation corridors
•Rapid expansion into
renewables through financial
incentives, for the first time
making solar a priority
•Solar again in focus (both PV
and CSP); need for more
detailed guidance on materials
innovation and electric
vehicles and plug-in hybrid
electric vehicles as strategic
sectors
• “Energy revolution that builds a
clean, low-
carbon, safe, efficient,
modern energy system” through
improved supply-side support
•Building comprehensive energy
“bases” and pushing for smart
“management systems” on
the demand side that interacts
with traffic net and internet
•A “great push” for wind and
solar, acceleration in distributing
across east and central China
•First target of 20% energy
demand from renewables; still a
heavy focus on coal for
stability and security but willing
to push to replace with
electrification
78%
46%
21%
21%
16%
15%
0%
10%
20%
30%
40%
50%
60%
70%
80%
90%
100% 1% 1% 0%
2006
2%
2023
729
Hydro
Oil/Gas/Coal
Nuclear
Wind
Solar
China’s fossil fuel as a
proportion of installed
capacity decreased 41%
The strategy was motivated by industrial
competitiveness as GDP slows, labor costs rise and
pollution increases

CKI Solar-250426_updateBOS
62 of 79
US relies on import tariffs and tax credits conditioned on local
labor and content requirements
Sources: Reuters, US Finalizes Tariffs on Southeast Asian Solar Imports (2025); Enel, Unlocking the Domestic Content Bonus Tax Credit (2023); New York Times, President Biden Extends Solar Tariffs
(2022); The Conversation, To Understand Why Biden Extended Tariffs on Solar Panels, Take a Closer Look at Their Historical Impact (2022); US ITA, Commerce Initiates Antidumping and
Countervailing Duty Investigations of Crystalline Silicon Photovoltaic Cells from Cambodia, Malaysia, Thailand, and the Socialist Republic of Vietnam (2024).
Credit: Taicheng Jin, Isabel Hoyos, Hyae Ryung Kim, and Gernot Wagner. Share with attribution: Kim et al., “Scaling Solar” (10 July 2025).
2012 and 2015: The US
Commerce Department
under President Obama
placed an AD/CVD of about
30% on Chinese solar cells
and modules, alleging that
the Chinese government
was subsidizing solar PV
producers.
February 2022: President
Biden announced that the
section 201 tariffs would
be extended (at 15%) to
provide continued support
for the domestic solar
industry.
2018: The United States
imposed a section 201 tariff
(sunset in 2026, starting at
30% and declining to 15%)
on all imported solar cells
and modules, not just
Chinese made (includes
Canada, Mexico, Indonesia,
etc.), in part to counteract
Chinese firms avoiding
tariffs by producing in
Southeast Asia.
June 2022: US Border
Control banned imports
suspected of having input
from Xinjiang.
May 2024: Investigation
began for a fourth AD/CVD
on cells from Cambodia,
Malysia, Thailand, and
Vietnam.
April 2025: Tariffs as high
as 3,500% are targeted
towards Chinese-owned
solar cell manufacturers in
response to American
manufacturers accusing
Chinese companies of
flooding the market with
cheap goods.

Solar PV: Overcoming
Future Challenges

CKI Solar-250426_updateBOS
64 of 79
Delays caused by interconnection (connecting new solar PV projects to the grid) are now
one of the biggest obstacles preventing new solar PV capacity from coming online.
–Solar and energy storage made up 80% of the US interconnection queue in 2022.
–New rules by the US Federal Energy Regulatory Commission force grid operators to study projects in
batches instead of individually and prioritize those closest to construction to combat this problem.
Solar PV is an intermittent source of energy.
–Demand response can incentivize power consumers to time their daily consumption during peak
solar PV production hours.
–Energy storage in the form of batteries or pumped hydropower can help address both daily and
seasonal variations in solar PV output.
The annual number of solar panels reaching end of life will grow 25x in the next 30 years.
–EU panel producers are directly responsible for the costs of collecting and recycling end-of-life panels.
–China announced a national recycling program as of 2025.
–The United States has not announced a recycling initiative yet.
Credit: Isabel Hoyos, Taicheng Jin, Max de Boer, Lara Geiger, Marcelo Cibie, Hyae Ryung Kim, and Gernot Wagner. Share with attribution: Kim et al., “Scaling Solar” (10 July 2025).
Key messages
Overcoming Future
Challenges
Delays caused by permitting issues like zoning issues, environmental studies, complex
regulations, and appeals are also significant obstacles to capacity deployment.
–The United States proposed the Bipartisan Permitting Reform Implementation rule in the summer of
2023 to speed up environmental assessments.
–The EU updated its Renewable Energy Directive to make permitting easier and appealing harder.

CKI Solar-250426_updateBOS
65 of 79
Interconnection delay is one of the main obstacles preventing new
solar capacity coming online
0
100
200
300
400
500
600
700
900
1,000
1,100
1,200
1,300
1,400
1,500
800
2007 2008 2009
201
110 115 126 95 78 127 136 202 234 277 295 348
596
730
908
20241
2023202220212020201920182017
258
2016201520142013201220112010
1,438
Breakdown of US interconnection queues by energy source (GW)
Solar
Wind
Other renewables2
Batteries, other storage
Coal
Gas
Nuclear
(1) 2024 data estimated on ’14-’23 CAGR.
(2) Other renewables include geothermal; hydro; solar and wind; solar, wind, and battery; unknown and other.
Sources: Berkeley Lab, Generation, Storage, and Hybrid Capacity in Interconnection Queues (2025); FERC, FERC Transmission Reform (2023); US DOE, Tackling High Costs and Long Delays for
Clean Energy Interconnection (2023); Eclareon, RES Policy Monitoring Database (2025).
Credit: Taicheng Jin, Max de Boer, Lara Geiger, Marcelo Cibie, Heonjae Lee, Isabel Hoyos, Hyae Ryung Kim, and Gernot Wagner. Share with attribution: Kim et al., “Scaling Solar” (10 July 2025).
Observations
•Connecting new solar PV
projects to the grid is one of the
largest obstacles in both the
US and EU. These delays are
caused by:
–Long feasibility studies by grid
authorities, which were designed
when only a handful of new coal
or gas plants would connect to
the grid each year.
–Grids at maximum capacity,
meaning project developers need to
pay for new transmission lines
and other upgrades or wait for
grid authorities to expand the
grid.
•To reduce interconnection
delays, the US Federal Energy
Regulatory Commission now
requires grid operators to
study projects in batches vs.
individually and to prioritize
those closest to construction.
Solar and energy
storage made up ~80%
of U.S. interconnection
queue in 2024

CKI Solar-250426_updateBOS
66 of 79
Permitting issues can cause serious delays as well, but both US
and EU are taking steps to streamline the process
The US aims to shorten environmental reviews
The EU makes applying easier and appealing harder
Typical permitting issues
(*) NIMBYism refers to “Not in my backyard” syndrome.
Sources: Popular Science, Outdated Zoning Laws (2022); Eclareon, Barriers and Best Practices for Wind and Solar Electricity in the EU27 and UK (2022); SEIA, Utility-Scale Solar Power on Federal
Land Permitting Process (2025); Reuters, Europe on Verge of Permitting Leap for Wind, Solar Farms (2023); White House, Reform to Modernize Environmental Reviews (2024).
Credit: Max de Boer, Lara Geiger, Marcelo Cibie, Hyae Ryung Kim, and Gernot Wagner. Share with attribution: Kim et al., “Scaling Solar” (10 July 2025).
•In response to the Russian invasion of Ukraine, the EU updated its Renewable
Energy Directive, which outlines goals nation-states must achieve:
•Proposed changes include:
–Two-year maximum duration for the permitting of new solar and wind projects
–Solar and wind classified as projects of overriding public interest, which reduces (but doesn’t
eliminate) the possibilities for appeals
–Governments required to digitize the solar and wind permitting process
•The Biden administration proposed the Bipartisan Permitting Reform
Implementation rule in 2023 to speed up environmental assessments.
•Proposed changes include:
–Two-year limit on environmental impact studies and a page limit on documents that need to
be submitted for an environmental review
–Clarification of the roles of leading and cooperating agencies in conducting environmental
reviews
–Climate change effects as consideration to environmental impact studies
Complex regulations
•In the US, counties set regulations
while following state guidelines,
leading to strong variations.
•In the EU, countries set their own
solar PV deployment regulations.
Appeals
•NIMBYism* can lead to residents
appealing against solar PV
projects in their neighborhoods.
•Even if an appeal does not lead to
overturning a project approval, it can
still cause significant delays.
Zoning issues
•For many types of suitable land
(e.g., agricultural land), using it for
solar PV requires rezoning.
•Rezoning can take a long time,
especially when there is the
opportunity for appeals.
Environmental studies
•Studies assess the environmental
impact of a solar PV project.
•In the US, an environmental impact
study for utility solar PV on federal
land can take 2 to 4 years.

CKI Solar-250426_updateBOS
67 of 79
Daily and seasonal intermittency requires battery storage to
smooth consumption
Sources: Scientific American, Renewable Energy Intermittency (2015); Solar4ever, Solar Power Calculator Australia (2025); US EIA, Total Energy Overview (2025); Tencent, Running on Sunshine (2024).
Credit: Taicheng Jin, Isabel Hoyos, Hyae Ryung Kim, and Gernot Wagner. Share with attribution: Kim et al., “Scaling Solar” (10 July 2025).
Observations
•As the sun moves across the sky during the day, it
changes the angle at which the sunlight hits the
panels. Generation typically peaks around noon,
when sunlight directly strikes the panels.
•Weather conditions also affect daily power
generation. Overcast skies or fog reduce the
amount of sunlight that reaches the solar panels.
•Direct seasonal variation comes from the fact that
the position of the sun in the sky changes
throughout the year. In winter, days are shorter
and the sun is lower in the sky, leading to less
solar power generation.
•This effect is more pronounced at higher
latitudes. In regions closer to the poles, days
shorten more drastically in winter.
•Seasonal weather patterns also impact annual
solar generation (e.g., less solar generation during
rainy season in Southeast Asia).
Energy storage helps smooth out the intermittency of output
High
Medium
Low

CKI Solar-250426_updateBOS
68 of 79
Integrating Battery Energy Storage Systems (BESS) lowers
emissions, reduces bills, and boosts reliability and self-sufficiency
100
45
10
38
20
5
35
65
50
0
10
20
30
40
50
60
70
80
90
100
Carbon
Emission (%) Electricity Bill (%) Reliability
Index (%) Self-
Sufficiency (%) Renewable
Penetration (%)
0
-95%
Observations
•Without energy storage, fossil fuels will
be used to support energy deficit.
•Solar can significantly reduce carbon
emissions by up to 95%.
•Solar-only systems designed with 100%
usage usually offset only ~55% of the
original bill. With storage, it is expected
to offset the entire electricity bill.
•The reliability as measured by LOLP
can improve from 10% to 35%.
•Integrating energy storage can improve
residential self-sufficiency from 38% to
65%.
•With energy storage, the renewable
penetration could increase from
between 20% and 25% to 50% in
California.
Sources: Solar.com, What is the Carbon Footprint of Solar Panels? (2025); Solar.com, Electrum’s New NEM 3.0 Savings Calculations Show Path to Maximum Bill Reduction in California (2023); Singh
and Fernandez, Reliability Evaluation of a Solar Photovoltaic System With and Without Battery Storage (2015); Ciocia et al., Self-Consumption and Self-Sufficiency in Photovoltaic Systems (2021);
NREL, Energy Storage Requirements for Achieving 50% Solar Photovoltaic Energy Penetration in California (2016).
Credit: Xiaodan Zhu, Taicheng Jin, Hyae Ryung Kim, and Gernot Wagner. Share with attribution: Kim et al., “Scaling Solar” (10 July 2025).
Without storage
With storage
Comparison of project parameter with and without storage component

CKI Solar-250426_updateBOS
69 of 79
Batteries and pumped hydro are two ways to store energy
Pumped HydropowerBatteries
Sources: AEI, Solar Panel Battery Storage (2022); BNEF, Top 10 Energy Storage Trends in 2023 (2023); Greentech Media, Pumped Hydro Moves to Retain Storage Market Leadership (2020); ABC
News, Batteries, Solar, Wind, Hydropower (2022); The Conversation, Batteries Get Hyped, but Pumped Hydro Provides the Vast Majority of Long-term Energy Storage Essential for Renewable Power
(2022); Victoria, Victorian Big Battery (2023); Renewable Energy World, Commercializing Standalone Thermal Energy Storage (2016); Entura, Batteries vs Pumped Hydro (2017).
Credit: Max de Boer, Lara Geiger, Marcelo Cibie, Hyae Ryung Kim, and Gernot Wagner. Share with attribution: Kim et al., “Scaling Solar” (10 July 2025).
Description Solar PV power is stored as chemical energy in (most frequently)
lithium-ion batteries and discharged later. Excess solar energy is used to pump water from a reservoir of lower
elevation to one of higher elevation. Later, the water is released and flows
through a turbine to generate electricity.
Cost
($ per MWh) $350 to $1,000 per MWh of annual energy output
(Lithium-ion batteries) $200 to $260 per MWh of annual energy output
Example
installation Victoria Big Battery in Victoria, Australia
(300 MW storage capacity) Kidston plant in Queensland, Australia
(250 MW storage capacity)
Pros •Longest duration storage compared to alternatives like batteries
•Tends to be cheaper at present than batteries for overnight and
longer term storage
•Increasing mass production of batteries (related to demand for
electric vehicles) leading to continuing cost declines
•Modular design allows for scalability, from residential systems to
large-scale utility projects
Cons •Land-, water-, and capital-intensive to construct; dam construction
may permanently damage surrounding ecosystems
•Can be implemented only in certain geographies due to elevation
required
•At present, batteries are still the more expensive option
•Limited lifespan of batteries (currently about 5 to 15 years) requires
replacement of equipment

CKI Solar-250426_updateBOS
70 of 79
Developing countries with high solar irradiance and low
seasonality can benefit from solar PV deployment
Average global solar potential (kWh/kWp)
Note: Solar Atlas does not provide data on solar PV potential in northern regions (northern Canada, Russia, and Europe).
Sources: World Bank, Solar Photovoltaic Power Potential by Country (2020); Unsustainable Magazine, Solar Power in Developing Countries (2023).
Credit: Hassan Riaz, Taicheng Jin, Max de Boer, Lara Geiger, Marcelo Cibie, Hyae Ryung Kim, and Gernot Wagner. Share with attribution: Kim et al., “Scaling Solar” (10 July 2025).
Concentration of Solar PV Power
•In approximately 70 countries worldwide, the solar PV daily
output is at least 1,500 kWh/kWp. Most of the countries that
demonstrate the highest energy production are in the Middle
East, Sub-Saharan Africa, and North Africa, as well as desert
regions in major countries.
•High-potential countries tend to have low seasonality in
solar photovoltaic output, meaning the solar resource is
relatively constant between different months of the year.
Future Investment Potential
•Solar power generation can help developing countries expand
the agricultural sector in areas of irrigation, cold storage, and
food processing.
•Countries with high levels of solar radiation exposure are
more optimally positioned. Ethiopia could cover its total
energy demand with just 0.005% of its land dedicated to solar
power.
•Some solar-focused programs are bringing large-scale
businesses to developing countries, such as Tata Power Solar
in India and M-KOPA Solar in Kenya. The African
Development Bank approved a US$49.92 million fund to build
a 30 MW solar PV plant.
>1,7501,500 - 1,7501,250 - 1,5001,000 - 1,250<1,000
Most developing countries
exceed 1,500 kWh/kWp

CKI Solar-250426_updateBOS
71 of 79
Demand response can help mitigate daily power fluctuations by
incentivizing users to time their consumption
NY state has an active demand response programDemand response financially incentivizes consumers
•Demand response programs try to shift energy consumption based on
energy availability.
•Globally, the IEA projects that 500 GW of demand response availability will
be needed by 2030. At present, only a fraction of that (<50 GW) is
available.
•Participation in these programs can be either active or passive:
–Active programs require explicit actions by participating consumers and companies
(e.g., turning off the AC).
–When enrolled in a passive program, consumer devices or commercial machines
automatically respond to signals sent by utilities (via a device like a smart thermostat).
Incentive-basedPrice-based
Demand is managed through
dynamic electricity prices, with
prices peaking at times of low
availability and prices dropping
during high availability.
Consumers receive financial
incentives to reduce their
consumption when energy
availability is low.
Sources: IEA, Demand Response (2025); Steele and Breitenstein, The History and Evolvement of Electrical Peak Load Control Systems in Europe and the U.S. (2010).
Credit: Max de Boer, Lara Geiger, Marcelo Cibie, Hyae Ryung Kim, and Gernot Wagner. Share with attribution: Kim et al., “Scaling Solar” (10 July 2025).

CKI Solar-250426_updateBOS
72 of 79
By 2050, ~10 million tons of solar PV panels will retire; EU and
China have announced recycling plans
Global annual amount of end-of-life PV panels will increase 25x by 2050
2,000
4,000
6,000
8,000
10,000
12,000
02020 2030
Annual installed and end-of-live PV panel mass (in millions of kg)
2050
4,867
217
9,157
1,304
6,552
3,400
6,769
5,453
2040
Mass of installed capacity
Mass of end-of-life PV panels
(*) Waste Electrical and Electronic Equipment Directive.
Sources: IRENA, End-of-Life Management: Solar Photovoltaic Panels (2016); NREL, Solar Photovoltaic Module Recycling (2021); PV-Tech, China to Build Solar Recycling System by 2025 (2023);
Solarwaste.eu, Waste from Electrical and Electronic Equipment (WEEE) (2025).
Credit: Max de Boer, Lara Geiger, Marcelo Cibie, Hyae Ryung Kim, and Gernot Wagner. Share with attribution: Kim et al., “Scaling Solar” (10 July 2025).
The average expected life span of a
solar panel is about 30 years
Observations
•Recycling solar PV panels has two main
benefits:
–Environmental damage prevention
–High-value material recovery
•In the EU, panel producers are directly
responsible for the costs of collecting and
recycling end-of-life panels under the EU
WEEE* directive.
–Often producers team up to centralize collection
and recycling (e.g., Germany).
•US and China do not have national
recycling programs. However:
–China announced the ambition to establish a
national recycling system for end-of-life panels by
2025.
–In the US, California and Washington have passed
state laws addressing solar PV panel recycling.

CKI Solar-250426_updateBOS
73 of 79
CKI Solar PV Team
Gernot Wagner
Senior Lecturer, Columbia Business School
Faculty Director, Climate Knowledge Initiative
Email: gwagner@columbia.edu
Isabel Hoyos
Master of Science in Sustainability Management
Staff Associate
Hassan Riaz
Master of Business Administration
CKI Fellow
Taicheng Jin
Master of International Affairs
CKI Fellow
Marcelo Cibie
Master of Business Administration
CKI Fellow
Lara Geiger
Master of International Affairs
CKI Fellow
Max de Boer
Master of Business Administration
CKI Fellow
Hyae Ryung (Helen) Kim
PhD in Sustainable Development
Senior Research Fellow
Email: hk2901@columbia.edu
Attribution: Kim et al., "Scaling Solar," Columbia Business School Climate Knowledge Initiative (10 July 2025).
Heonjae Lee
Bachelor of Arts in Financial Economics
CKI Fellow

CKI Solar-250426_updateBOS
Appendix

CKI Solar-250426_updateBOS
75 of 79
Scenarios
ETS
The Economic Transition Scenario (ETS) reflects a world where policymakers pursue an energy
transition relying only on
historical efficiency trends and economically competitive,
commercially at
-scale clean energy technologies.
The ETS requires no further support for clean technologies beyond existing measures, although it
does hinge on a level playing field that allows these solutions to access markets and compete with
incumbent technologies.
NZS
The Net Zero Scenario (NZS) reveals the sheer scale and scope of the challenge of remaining
within 1.75C of global warming and achieving the goals of the Paris Agreement.
Source: BNEF, New Energy Outlook 2025 (2025).
Credit: Isabel Hoyos, Taicheng Jin, Hyae Ryung Kim, and Gernot Wagner. Share with attribution: Kim et al., “Scaling Solar” (10 July 2025).

CKI Solar-250426_updateBOS
76 of 79
Balance of System components [ref. Slide 10]
Sources: NREL, US Solar PV System Cost Benchmark (Q1 2023) (2023); SolarEdge, Balance of System and Energy Production Comparison (2024).
Credit: Max de Boer, Lara Geiger, Marcelo Cibie, Hyae Ryung Kim, and Gernot Wagner. Share with attribution: Kim et al., “Scaling Solar” (10 July 2025).
BoS component Description
Inverters Solar panels produce
direct current (DC) while power grids are alternating current (AC). Inverters convert the DC power generated by the
panels to AC, making them the most crucial component of PV systems after solar panels.
Wiring Connects the solar panels and other electrical parts of the PV system.
Switches Used for safety reasons (can disconnect the panels from the grid in case of a power surge or emergency) and to direct the flow of power
(e.g., either to the grid or to a battery).
Junction boxes Metallic or plastic boxes used as meeting points for electrical connections.
Mounting systems Provide support for the panels and fixes them in place.
Metering systems Measure the amount of electricity flowing through them.
Batteries Optional item: Store energy generated by the panels. Can provide power when the sun is not shining.
Charge controllers Optional item: Devices that manage the electricity flow to and from batteries and protect them from overcharging.
Sensors Optional item: More common in utility-scale projects. Help to keep track of environmental variables like panel temperature and solar
irradiance. Used for monitoring and maintenance purposes

CKI Solar-250426_updateBOS
77 of 79
Material components in crystalline silicon (c-Si) solar panels
[ref. Slide 30]
Note: Material composition percentages are averages.
Sources: IEA, Solar PV Global Supply Chains (2022); PV-Manufacturing.org, Photovoltaic Manufacturing and Technology (2025).
Credit: Isabel Hoyos, Taicheng Jin, Hyae Ryung Kim, and Gernot Wagner. Share with attribution: Kim et al., “Scaling Solar” (10 July 2025).
Material Main uses
Glass Module cover
Aluminum Module frame, mounting structure, connectors, back contact, inverters
Polymers Back sheet of the solar module, encapsulation of solar cells
Silicon Mono-Si or poly-Si wafers (core component of solar cells)
Copper Cables, wires, ribbons, inverters
Silver Electronic contacts, wiring across solar cells
Antimony Added to glass to create solar-grade glass (reduces long-term impact of ultraviolet radiation on the solar
performance of glass), added to encapsulant
Lead Soldering paste and ribbon coating
Tin Solder and ribbon coating

CKI Solar-250426_updateBOS
78 of 79
Glossary
Credit: Isabel Hoyos, Taicheng Jin, Hyae Ryung Kim, and Gernot Wagner. Share with attribution: Kim et al., “Scaling Solar” (10 July 2025).
AD/CVD
APAC
ASEAN
BIPV
BoS
BSF
c-
Si
C&I
CAGR
CapEx
CCS
CO
2
CPV
CSP
EMEA
Antidumping and countervailing duties
Asia Pacific
Association of Southeast Asian Nations
Building integrated PV
Balance of System
Back Surface Field
Crystalline silicon
Commercial & industrial
Compound annual growth rate
Capital expenditures
Carbon capture and storage
Carbon dioxide
Concentrator PV
Concentrated solar power
Europe, Middle East, and Africa
EPC
ESP
EVA
FiT
FBR
FPV
HJT
IRA
IRR
ITC
LID
MOIC
mono
-Si
NPV
OpEx
Engineering, procurement, and construction
Energy service provider
Ethylene vinyl acetate
Feed
-in tariff
Fluidized bed reactor
Floating PV
Silicon heterojunction cells
Inflation Reduction Act
Internal rate of returns
Investment tax credit
Light
-induced degradation
Multiple on invested capital
Monocrystalline silicon
Net present value
Operating expenses
O&M
PAYG
PERC
Poly
-Si
PPA
PTC
PV
REC
R&D
RPS
SG&A
SiO
2
SPV
TCO
VIPV
VOST
Operating and maintenance
Pay as you go
Passivated emitter and rear cell
Polycrystalline silicon
Power purchase agreement
Production tax credit
Photovoltaic
Renewable energy credit
Research and development
Renewable portfolio standard
Selling, general, and admin. expenses
Quartzite
Special purpose vehicle
Transparent conductive oxide
Vehicle integrated PV
Value
-of-solar tariffs

CKI Solar-250426_updateBOS
79 of 79
Units, calculations, and references
Kilowatt (kW) 1,000 (one thousand) watts
Megawatt (MW) 1,000,000 (one million) watts
Gigawatt (GW) 1,000,000,000 (one billion) watts
Terawatt (TW) 1,000,000,000,000 (one trillion) watts
•One watt equates to one joule of energy per second
•In electrical systems, power (watts) is calculated by multiplying voltage (volts)
by current (amps)
Source: Sunshineworks, Solar Calculation (2025).
Credit: Isabel Hoyos, Taicheng Jin, Hyae Ryung Kim, and Gernot Wagner. Share with attribution: Kim et al., “Scaling Solar” (10 July 2025).


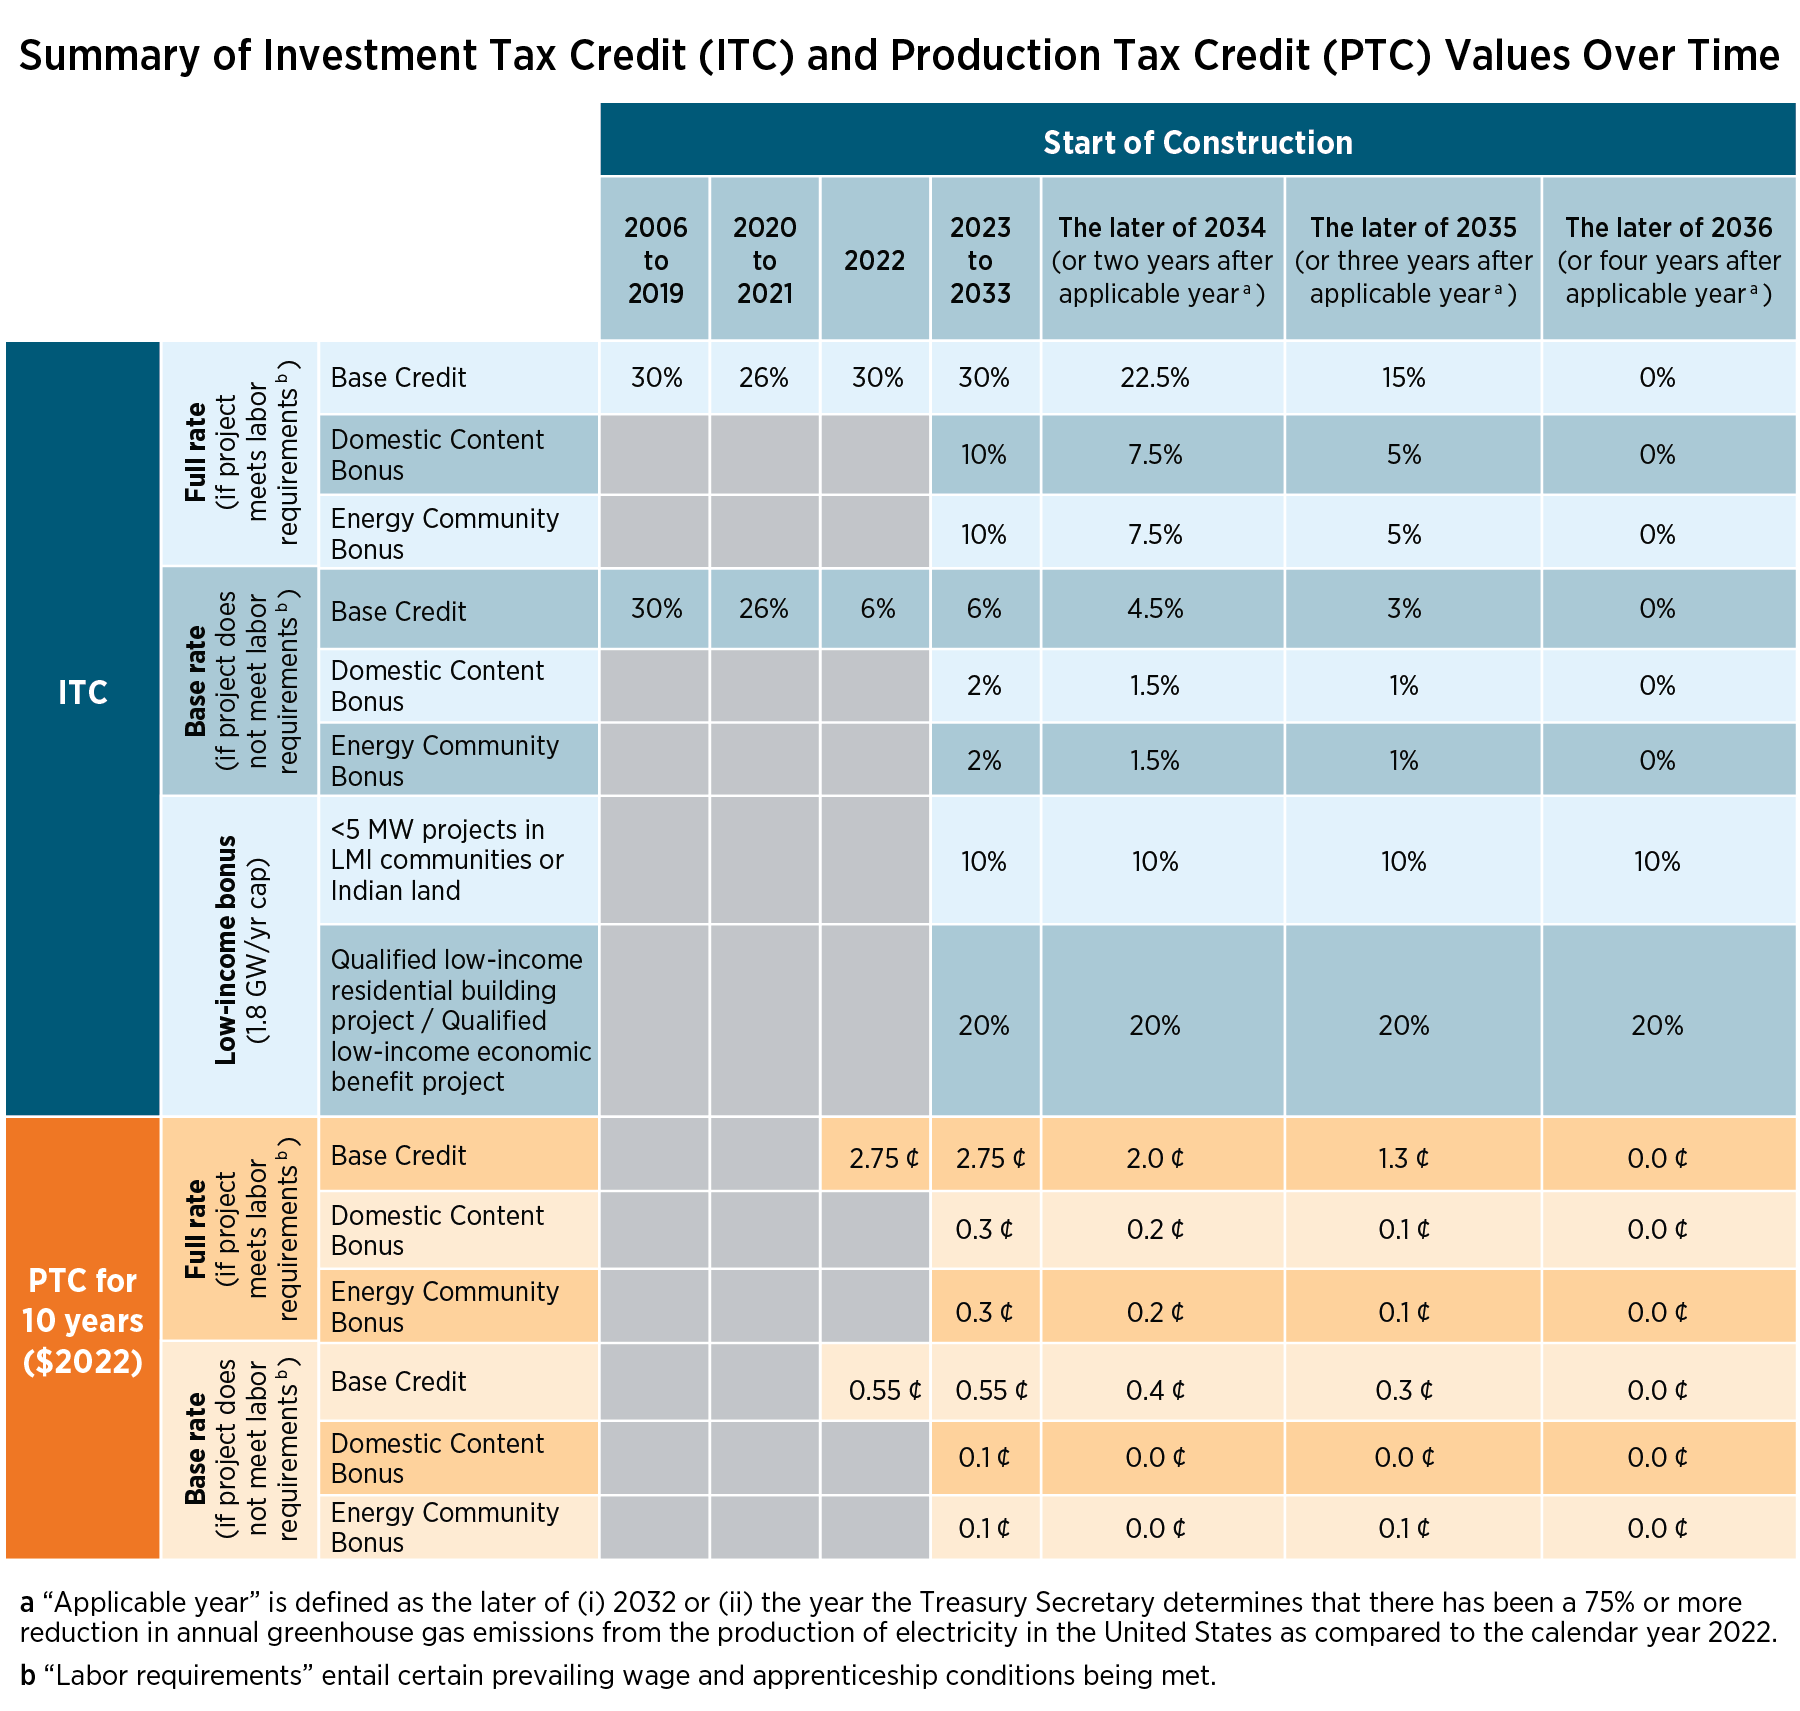