School Report Card 2023 - 2024 PDF Free Download
1 / 2/2
100%

Page 1 of 2 To access user guide and see more detailed information, please visit
https://msrc.mdek12.org. Last updated 10/30/2025.
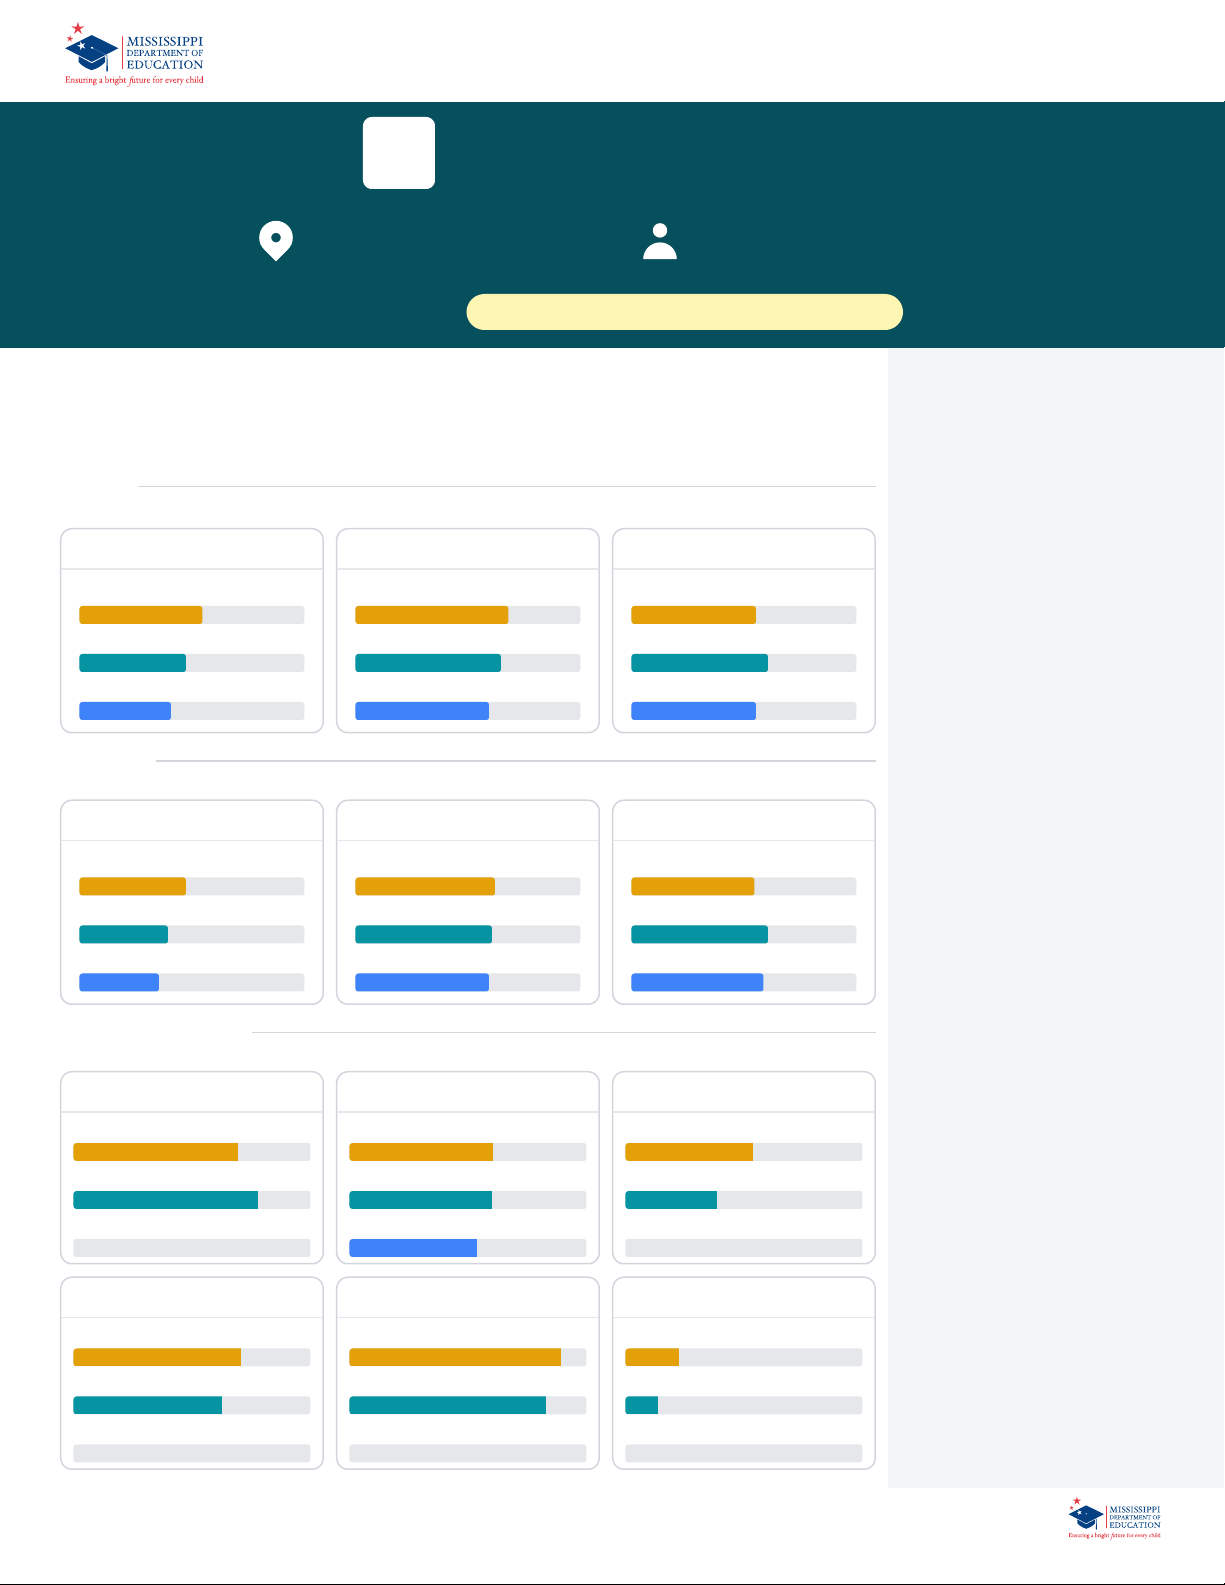
School Report Card 2023 - 2024
For more detailed information, please visit https://msrc.mdek12.org.
BHolmes County Central High School
Holmes Consolidated School District
9749 Brozville Road
Lexington, MS 39095
ANTWAYN PATRICK
apatrick@holmesccsd.org
School Accountability Grade Components
Mississippi's accountability system assigns "A" through "F" letter grades for schools and districts.
Grades are based on student achievement, student growth, student participation in testing, and other
academic measures.
Math
Measurements of student performance on the statewide math assessment.
Proficiency
State 55.9%
District 39.7%
School 61.8%
Growth
State 73.6%
District 72.5%
School 92.5%
Growth Lowest 25%
State 67.0%
District 83.8%
School 100.0%
English
Measurements of student performance on the statewide English language arts (ELA) assessment.
Proficiency
State 47.9%
District 25.1%
School 22.1%
Growth
State 61.4%
District 54.5%
School 56.5%
Growth Lowest 25%
State 50.6%
District 57.7%
School 54.2%
Other Measures
Other measurements of student performance that factor into the accountability grade.
US History Proficiency
State 71.1%
District 50.2%
School 50.2%
Science Proficiency
State 63.4%
District 46.7%
School 37.1%
College & Career Readiness
State 51.9%
District 17.7%
School 17.7%
Acceleration
State 68.4%
District 59.9%
School 59.8%
Graduation Rate
State 89.4%
District 91.8%
School 91.8%
English Learners
State 10.2%
District 0.0%
School
N/A
Teacher Data
50.5
Teachers
Experienced Teachers
Provisional Teachers
In-Field Teachers
76.5%
3.9%
90.5%

Page 2 of 2 To access user guide and see more detailed information, please visit
https://msrc.mdek12.org. Last updated 10/30/2025.
2023 - 2024 Holmes County Central High School
Detailed Assessment and Other Data
Student Performance
The following information shows each level of student performance on statewide assessments.
Math
Level 1
State 0-10%
District 0-10%
School 0-10%
Minimal
Level 2
State 11-20%
District 21-30%
School 0-10%
Basic
Level 3
State 21-30%
District 31-40%
School 31-40%
Passing
Level 4
State 31-40%
District 31-40%
School 51-60%
Proficient
Level 5
State 11-20%
District 0-10%
School 0-10%
Advanced
English
Level 1
State 9.1%
District 11-20%
School 21-30%
Minimal
Level 2
State 17.9%
District 21-30%
School 31-40%
Basic
Level 3
State 27.3%
District 31-40%
School 21-30%
Passing
Level 4
State 28.8%
District 11-20%
School 11-20%
Proficient
Level 5
State 16.9%
District 0-10%
School 0-10%
Advanced
Science
Level 1
State 11.2%
District 21.7%
School 31-40%
Minimal
Level 2
State 11.0%
District 18.0%
School 21-30%
Basic
Level 3
State 19.5%
District 23.6%
School 11-20%
Passing
Level 4
State 34.8%
District 26.8%
School 21-30%
Proficient
Level 5
State 23.5%
District 9.8%
School 0-10%
Advanced
Student Assessment Participation
English Participation Math Participation Science Participation
Discipline
84
Incidents of Violence Out-of-School Suspension
Other Data
46.9 %
Chronic Absenteeism
$15,448.53
Per-Pupil Expenditure
44.8 %
Post-Secondary Enrollment
53.3%
Advanced Course
Participation
99.3%
95.5%
99.3%
23.2%