SINGULAR DILIGENCE PDF Free Download
1 / 116/116
100%

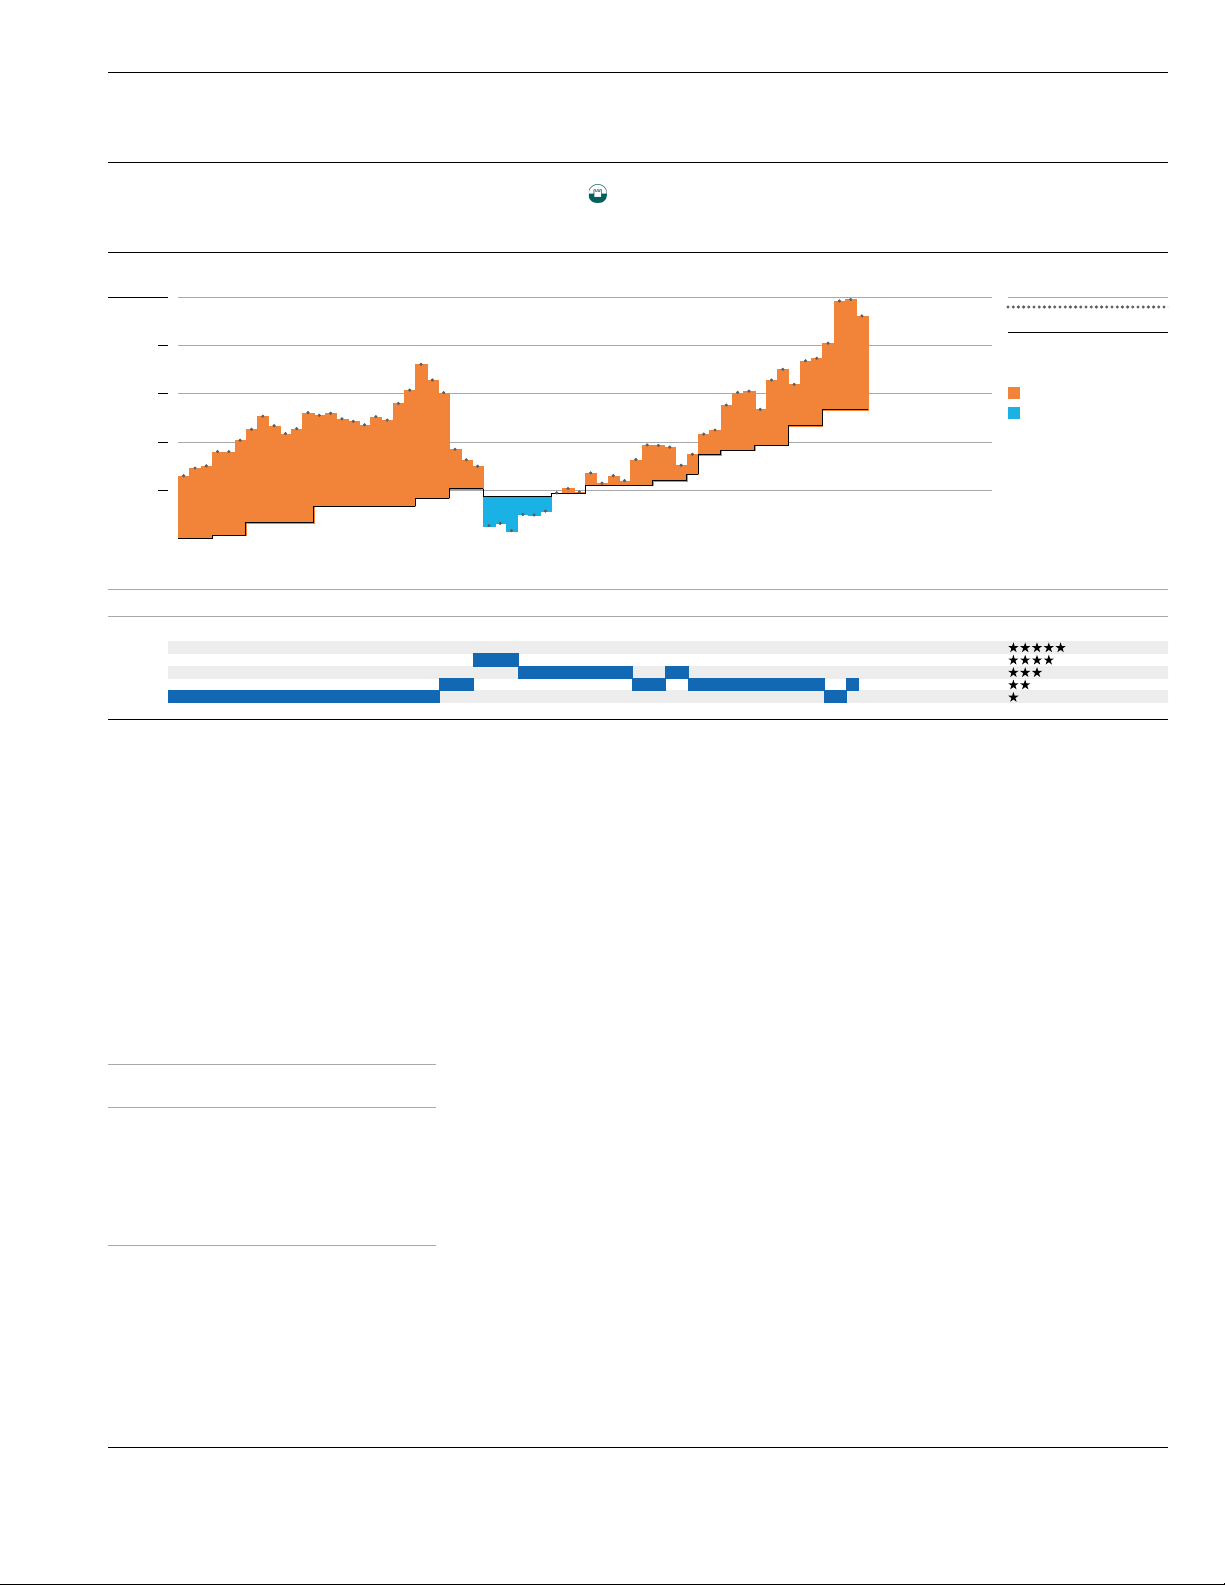
The Restaurant Group
London: RTN

16% 16% 16% 15% 16% 16%
19% 18% 18% 19% 19% 19% 19% 19% 18% 19% 19% 19%
10% 10% 10% 9% 9% 10% 11% 11%
13% 14% 14% 13% 13% 13% 13% 14% 13% 14%
EBITDA EBIT

TABLE OF CONTENTS
DURABILITY 3
MOAT 5
QUALITY 8
CAPITAL ALLOCATION 9
VALUE 11
GROWTH 13
MISJUDGMENT 15
FUTURE 17
APPRAISAL 20
NOTES 22
The Restaurant Group (London: RTN) Runs Casual Dining Chains
in the United Kingdom
SINGULAR DILIGENCE
Geoff Gannon, Writer Quan Hoang, Analyst
Tobias Carlisle, Publisher
OVERVIEW
The Restaurant Group runs several
restaurant chains in the United
Kingdom. These are casual dining
restaurants. The customer eats their
food in the restaurant while a waiter
provides table service. The company
does not run any fast food chains. The
majority (52%) of the company’s sales
come from its Frankie & Benny’s chain.
Frankie & Benny’s is a U.K. created
restaurant concept that is inspired by
Italian-American restaurants. Despite
being a U.K. company, most of the
Restaurant Group’s concepts are based
on some variaon of U.S. cuisine.
Frankie & Benny’s (52% of sales) has an
Italian-American themed menu,
Chiquito (17% of sales) has a Tex-Mex
themed menu, and Coast to Coast (4%
of sales) has a general American theme.
So, 73% of sales come from three
American inspired restaurant concepts.
The other 27% of sales comes mostly
from concessions (12%) and pubs
(11%). In this issue, we will focus
mostly on the three concepts that
make up 73% of The Restaurant
Group’s sales. There are a few reasons
for making this choice. One, the 27% of
sales that come from other sources are
dicult to discuss because the
economics of concessions and pubs
aren’t especially similar. Two, the pubs
and concessions are not grouped under
a single brand name. For example, each
of the pub locaons The Restaurant
Group owns maintains its own name.
This means the future of The
Restaurant Group is unlikely to be
radically shaped by pubs or
concessions. However, a concept for a chain – like Frankie & Benny’s, Chiquito, or
Coast to Coast – could spread across the U.K. to become a collecon of a hundred or
more locaons using the same name. Finally, The Restaurant Group’s strategy seems
more focused on expanding its exisng concepts rather than acquiring more pubs
and concessions. However, we can’t guarantee that will connue to be true. The
organic growth of exisng chains seems more repeatable than doing deals to buy
pubs and get concessions. So, we will conne our speculaon to the three American
themed chains that The Restaurant Group already runs. Before we discuss those
individual chains, let’s take a look at the history of The Restaurant Group.
The Restaurant Group was founded in 1987 as City Centre Restaurant. The purpose
of this enty was to manage the Garfunkel restaurant chain. Garfunkel’s is a U.K.
family restaurant roughly analogous to something like a Denny’s in the United
States. One dierence between Garfunkel’s and Denny’s though is that Garfunkel’s
locaons were focused on high trac areas like airports, London tourist aracons,
and movie theaters. In 1989, City Centre acquired the Mexican themed Chi-Chi’s. It
renamed the chain Chiquito. Now 27 years later, the company sll owns this chain.
About twenty years ago – in 1995 – City Centre opened the rst Frankie & Benny’s.
This chain would go on to be the company’s most successful. Today, Frankie &
Benny’s contributes a lile over half of The Restaurant Group’s sales. By the late
SINGULAR DILIGENCE 1
The Restaurant Group’s two largest chains (Frankie & Benny’s and
Chiquito) account for 69% of sales.

1990s, City Centre owned many
dierent concepts. These included the
family restaurant Garfunkel’s, the Tex-
Mex Chiquito, the Italian-American
Frankie & Benny’s, the rusc Italian
themed Cae Uno, the Pizza Hut
competor Deep Pan Pizza, the Asian
themed Wok Wok, the upscale Italian
themed Est Est Est, the Mexican
canna themed Nachos, and the 1940s
American diner themed OK Diner. By
the turn of the millennium, some of
these concepts were underperforming.
Deep Pan Pizza was a parcular
problem. And there was a trend of less
trac on the high streets – a U.K. term
for town centers roughly synonymous
with ‘Main Street’ in American English
– where these chains had many of their
locaons. In October of 2000, the
company’s CEO resigned and was
replaced by Andrew Guy. In March of
2001, Alan Jackson was made Execuve
Chairman. With these men in charge,
The Restaurant Group would reshape
itself over the next 5 years or so.
Underperforming brands like Deep Pan
Pizza, OK Diner, and Wok Wok were
quickly sold. Management said it was
focused on business segments with
high returns on capital, good growth
prospects, and some sort of barrier to
entry. They found these in ‘leisure park’
locaons. Leisure parks are to the U.K.
what strip malls and ‘power centers’
with big box retailers in them are to the
U.S. They are oen anchored by a
movie theater, bowling alley, or some
other leisure aracon. Especially
important is their ample parking and
locaon away from the high streets.
Land development is much more
restricve in the U.K. than in most parts
of the U.S. Even in leisure park
locaons, U.K. restaurants have to pay
their landlords a far higher share of
their sales as rent than American
restaurants do. It seems the demand
for new casual dining opons had
outstripped the number of planning
permission approvals to open new
restaurants. This explains why The
Restaurant Group’s management saw a
‘barrier to entry’ in this business
segment when it wouldn’t appear that
way to an American restaurant chain.
The other area with a barrier to entry is concessions. These are located in airports.
So, basically we are talking about chains in outdoor mall type locaons and then
concessions run in airports. Both have barriers insofar as there are a limited
number of locaons available to competors. Also, landlords can acvely avoid
pung two similar concepts in head-to-head compeon. In fact, it’s in their
interest to do so. Therefore, a landlord would prefer a mix of a fast food restaurant,
a low end casual dining restaurant, and a high end casual dining restaurant over say
two American themed restaurants with similar menus and prices. The restaurant
operators would prefer to avoid such direct compeon. And so would the
landlords. The Restaurant Group kept its other well-performing businesses for a
me. However, it mostly just milked them for cash. TRG sold its two Italian
concepts – Est Est Est and Cae Uno – in 2005. Garfunkel’s shrunk from 33
locaons in 2001 to just 13 locaons in 2015. The sale of Cae Uno in 2005 was
prey much the end of TRG’s high street era. Even the company’s pubs – which it
acquired in two dierent deals made in 2005 and 2007 – are in drive to locaons.
TRG has since said its focus is limited to just 3 areas: 1) Leisure and retail parks 2)
Concessions (so, airports), and 3) Rural and semi-rural pubs. From 2002 through
2015, TRG grew sales by 9% a year and EBITDA by 11% a year while paying out
more than half its reported earnings in dividends.
What does TRG look like today? The 3 key chains you need to know about are
Frankie & Benny’s (261 locaons), Chiquito (86), and Coat to Coast (21). Frankie &
Benny’s has a New York Lile Italy theme. The dishes are basically New York-
Northern New Jersey type Italian and just plain American food adjusted for a Brish
palate. There are plenty of booths creang a casual family dinner type atmosphere.
Chiquito is less focused on families. Coast to Coast is a general American themed
restaurant that is similar to a TGI Friday’s or TRG’s own Frankie & Benny’s. All three
of these chains are located in leisure and retail parks which means there are oen
acvies like movies or bowling in the same area. Each locaon has about 150
seats. The average check is about 15 to 17 GBP (about $20 to $22 U.S.) Tips are
generally much lower in the U.K. than they are in the U.S. However, TRG’s concepts
are American themed and they seem to follow some American pracces like free
rells on non-alcoholic drinks (coee, soda, etc.). This is not typical of restaurants in
countries where there is minimal pping. The lack of standardized pping in the
U.K. also complicates the minimum wage situaon versus the U.S. In the U.S.,
waiters who work for ps can be paid very, very lile in wages without violang
any minimum wage laws. This is not true in the U.K. In addion, the U.K. has
adopted an age based minimum wage law that makes it cheaper to employ
younger workers and more expensive to employ older workers. In the U.K., you
have to pay a 25-year-old waiter about twice what you’d pay a 16-year-old waiter.
This isn’t true in the U.S. because minimum wage laws don’t discriminate on the
basis of age and U.S. waiters work for ps that eecvely count toward their
minimum wage requirement. In the U.S., workers who generate the most ps take
home the most money. This isn’t necessarily true in the U.K. We’ll discuss this issue
more a bit later in the issue. But, Quan and I – and TRG’s management – don’t think
recent changes to the minimum wage are a big issue because the minimum wage
level aects TRG and its competors equally and because the primary compeon
between restaurants is on customer trac rather than price. So, changes in U.K.
planning rules are more important than changes in the minimum wage.
TRG is a growth stock. It targets 850 to 900 locaons within the next 8-10 years.
That means the company would more than double its revenue by 2025 if
everything went according to plan. That’s a big ‘if’. However, a 10-year plan with a
sales growth trajectory of about 8% a year certainly qualies the company as a
growth stock. Nominal GDP in the U.K. is not going to grow anywhere near 8% a
year through 2025. So, TRG hopes to grow faster than the economy it operates in.
SINGULAR DILIGENCE 2
The stock is very cheap. In relave
terms, It’s one of the cheapest stocks
we’ve wrien about in Singular
Diligence. Right now, TRG trades at
about 6 mes EBIT. Meanwhile, U.S.
restaurant chains are trading at 12 to
15 mes EBIT. Another way to look at
TRG’s price is relave to past
acquisions of U.K. restaurants. A lot of
acquisions of U.K. restaurant chains
were done around 10 mes EBITDA.
TRG now trades at 4 mes EBITDA. It’s
unusual for any restaurant that isn’t
seriously troubled to trade for just 4
mes EBITDA. So, The Restaurant
Group combines relavely good growth
prospects with a relavely low price. It
is cheaper than many peers while also
having beer growth prospects than
those peers.
DURABILITY
TRG’s Future Earning Power
Depends on the Connued
Popularity of the Italian American
Themed Frankie & Benny’s Chain
The durability of a restaurant stock
depends on the popularity of its chains.
The Restaurant Group has three
concepts worth worrying about. The
biggest is Frankie & Benny’s. This chain
accounts for a lile more than half of
The Restaurant Group’s sales. The next
biggest is Chiquito. That chain accounts
for just 17% of sales. Coast to Coast
accounts for 4% of sales. Coast to Coast
might be worth worrying about in
terms of potenal future upside. It
might have growth potenal. But it
isn’t worth worrying about in terms of
downside. Aer all, the worst Coast to
Coast can do is cost The Restaurant
Group 4% of its total sales. Meanwhile,
a 10% drop in Frankie & Benny’s prots
as a chain would cost The Restaurant
Group more than 5% of its prots per
share. So, Frankie & Benny’s is by far
the most important chain when it
comes to assessing the durability of
The Restaurant Group’s earnings.
Chiquito is also important. No other
part of the business is really big enough
to worry about. So, we’ll conne our
discussion to the popularity of Frankie & Benny’s and Chiquito.
Casual dining chains fall in and out of favor. Their sales can decline when they are in
unpopular – which usually means outdated – locaons. Or their sales can decline
when they sck to an unpopular – which usually means outdated – theme. In other
words, their physical posioning can become out of step with the mes or their
markeng posioning can become out of step with the mes. The industry as a
whole is perfectly durable. In fact, as economies become more developed they
spend more and more of their income on restaurants. The U.S. is a higher per
capita income country than the U.K. and not surprisingly the U.S. spends more per
person at restaurants than the U.K. does. But the U.K. is a higher per capita income
country than it was a quarter century ago and not surprisingly the U.K. spends
more per person at restaurants than it did in 1990. You can see the paern here.
Some things like food consumed at home and clothing decline as a percent of total
household spending as a country develops. Other things – like food eaten in a
restaurant – increase as a percent of total household spending as a country
develops. If a category increases as a proporon of total household spending, we
should expect that category to grow – in the very long run – at a rate at least as
great as the increase in output per person. So, if you expect the U.K. to grow real
GDP per capita at say 1% a year in the decades to come – you would expect the
overall restaurant industry to enjoy growth in real spending per capita that is no
slower than 1% a year. Economies of scale at the individual restaurant locaon are
not great enough beyond 100 to 150 seats or so to encourage the building of really
big sites. People like variety. And they like a restaurant to be within driving distance
of them. So, restaurants as businesses tend not to grow in size per locaon but only
in terms of number of locaons run under the same concept. The chain replicates.
But each site stays the same size. From 2003 through 2016, TRG experienced same
store sales growth of 2.4% a year. All other growth came from opening new
locaons. The restaurant business is durable and predictable for a chain that
maintains its popularity. For example, in the 14 years from 2003 through 2016, The
Restaurant Group only had same store sales declines in 2009, 2010, and 2016. The
worst year was 2009. Even during that nancial crisis, the decline was only 2% in
2009 and an addional 1.5% in 2010. So, over the enre course of the crisis, The
Restaurant Group’s same store sales declined less than 4%. Why is this?
One likely explanaon is that restaurant compete for volume (seat occupancy)
rather than price (average cket). They change their menus, their adversing, their
décor, they move locaons, they invest in leasehold improvements, etc. instead of
cung prices. All these things are sll compeve acons. They are acts born of
rivalry. And they hurt the rivals. Moving to a beer locaon means paying more in
rent. Invesng in upgrades to the physical layout of the restaurant es up more
capital and reduces the shareholder’s return on assets. Adversing is an expense.
And so on. Note however that what restaurants tend not to compete on is gross
margin. Basically, casual dining restaurants apply a standard mark up over their
food costs and sell the items on their menu for that price. So, if the direct costs –
like ingredients – that go into a steak dinner cost $8 the restaurant might apply a
mark-up of 3 to 4 mes and list that item for $24 to $32 on its dinner menu. This
would give the restaurant a gross margin of between 65% and 75%. In reality, the
gross margin on menu items with high priced ingredients like steak is actually lower
than the margin on menu items with low prices like pizza. A customer’s willingness
to pay $15 for a pizza can be greater than their willingness to pay $30 for a steak
even though the $30 steak can be ‘a beer value’ in the sense of the mark-up being
lower. This might look like a trivial point to make. But, it’s important when looking
at why restaurants have dierent gross margins. In many cases, it’s not that one
restaurant is trying to undercut another on price. It’s actually just that they have a
SINGULAR DILIGENCE 3

dierent menu mix. Finally, when a
restaurant does compete on price it
may actually be reposioning itself as a
cheaper, lower quality alternave. If
you see a $20 steak on one menu and a
$30 steak on another menu – it’s
unlikely one restaurant is trading prot
per customer for quanty of customers
by doing this. It’s more likely the
restaurant selling the $20 steak is
simply buying cheaper meat. Both
chains have equal access to all kinds of
meats at all kinds of prices. One
chooses the lower quality ingredient
and the lower price to segment the
market and focus on customers who
want a cheaper steak even if it’s an
inferior steak. Another chain does the
opposite. In a sense, this really comes
down to markeng posion rather than
direct price compeon. Making the
choice to sell a steak as cheaply as
possible could damage a chain’s
durability. But probably not because
it’ll set o a price war. Instead, the
chain is more likely to aract a certain
kind of customer and lose another kind
of customer. Societal shis that aect a
chain’s customer base are the real
threat to durability. So, when looking at
a restaurant chain’s durability ask two
quesons: 1) What is the physical
posion of the individual restaurants in
the chain? 2) What is the societal
posion of the concept as a whole?
The physical posion of TRG’s
individual restaurants is good. Frankie
& Benny’s is focused on retail parks.
U.K. customer trac is connually
moving away from the high streets and
toward the retail parks. Retail parks are
also doing beer at gaining customers
in the evenings – which is what
restaurants care most about. E-
commerce obviously hurts retail parks.
However, 80% of TRG’s restaurants are
in retail parks with at least one leisure
acvity such as a movie theater or
bowling alley. As more shopping in the
U.K. moves from the high streets and
retail parks to the internet more
locaons in retail parks should be
converted into eang and
entertainment venues rather than
shops.
Restaurant chains fall in and out of favor with the public. This can be caused by
societal shis. It can also be caused by a restaurant’s themac posioning
pendulum swinging too far in one direcon. A restaurant may pander to its base
and lose touch with the center in the same way a polical party can. In the early
2000s, Chiquito was underperforming. Same store sales dropped 5.3% in 2003. TRG
replaced Chiquito management. It changed the décor at one-third of the chains
locaons to downplay the “garish” Mexican theme. And it reposioned the chain
away from customers looking to get drunk toward more families. In 2004, same
store sales rose 5.8%.
This kind of thing happens all the me in the restaurant industry. It happens both in
the U.K. and the U.S. Let’s look at a stock Quan and I wanted to pick for Singular
Diligence a couple years back. We desperately wanted to pick this stock. But, you
never read an issue about it. Why? Because the stock plunge that had suddenly
made it aracve enough to include in Singular Diligence was reversed too quickly.
Between the me we started research on the stock and the me we were set to
publish the issue – the share price had gone up, up, up. This happens all the me
with restaurant stocks. They move violently along with even the slightest same
store sales trend.
The stock Quan and I wanted to pick was Greggs. This is a fast food concept in the
U.K. It is bigger outside the London area than inside it. And it is known for selling
unhealthy food in high street locaons. Same store sales dropped 2.7% in 2012 and
0.8% in 2013. That’s not much of a drop. And, actually, customer fooall near
Greggs locaons probably dropped by at least that much. But the high street was
seen as a bad place to be and unhealthy food was seen as a bad thing to be selling
in a society that was more interested in less processed food than the previous
generaon of Brits had been. So, the stock dropped a lot more than the company’s
sales. Greggs responded by opening stores away from the high street. It started
opening in retail parks, bus terminals, train staons. New locaons would be ‘food
on the go’ locaons. These needed to be near where people worked, traveled, and
sought out entertainment. Greggs also reed its stores. It removed some features
of its bakery legacy like bread slicers and bread ovens. It added seang. It put some
“healthy sandwiches” on its menu. Same store sales rose 4.5% in 2014 and 4.7% in
2015. The stock went from a P/E range of 10-13 to a P/E range of 18-20. The share
price went from under 500 pence to over 1,200 pence.
What does Greggs have to do with The Restaurant Group? This is what happens all
the me with restaurant concepts and with restaurant stocks. In 4 out of 5 years,
everything looks good with same store sales. In 1 out of 5 years, the concept loses
some popularity. Every decade or two there is a string of a couple bad years in a
row. Analysts and investors focus on this trend. Sales may drop a lile. Earnings
SINGULAR DILIGENCE 4
Frankie & Benny’s is 3 times the size of TRG’s next largest chain
may drop a decent amount. But you
can be sure the stock will drop a
tremendous amount. You can nd
restaurant stocks where a 3% to 5%
decline in same store sales sets o a
30% to 50% – or more – decline not
just in the stock price but actually in
the P/E rao. The Greggs example is
just one such case. Same store sales
dropped less than 5%. The P/E rao
contracted more than 50%.
Let’s talk now about a more directly
comparable stock: Brinker’s. Brinker’s is
the owner of Chili’s. Chili’s is a very big
chain – both owned and franchised – in
the U.S. It’s Tex-Mex. But it’s Tex-Mex
in a very general American sense.
Chiquito and Chili’s are probably prey
comparable. From 1994 through 1996,
Chili’s same store sales declined for 7
straight quarters. Chili’s changed its
menu and its adversing. And same
store sales started growing again.
TGI Friday’s is another good example.
This concept actually started as a
singles bar as much as a restaurant. But
the concept went naonal. And the
customers who had used TGI Friday’s
as a singles bar in the 1980s now had
families. They went to the same place
they had once gone on dates with their
children in tow. TGI Friday’s evolved
with its customer base. As baby
boomers aged, TGI Friday’s changed. It
encouraged more of a family
atmosphere. It added more upscale
items. There was more steak. Some of
it was branded Jack Daniel’s Grill. It
started serving food on sizzling plaers.
Basically, it started featuring the food
more and more. Once the concept had
saturated drive through locaons in the
U.S. it started adding Chili’s in places
like airports, mall food courts, and
stadiums. These are the kinds of places
TRG has concessions. This all sounds
very mundane and obvious as I
condense 30 years of history into a
paragraph about TGI Friday’s
development. It sounds especially
obvious now and especially to
Americans who aged in step with this
chain. But, TGI Friday’s has become
something really quite dierent than
what it started out as. So has Greggs. TGI Friday’s was a singles bar that became a
family restaurant. Greggs was a high street bakery that became a ‘food on the go’
sandwich shop. The company makes as much on sandwiches now as it does on
“savories”. These are the kinds of transions restaurant chains make. They evolve
to ll a niche. As society generally and their customer base specically changes –
they make slight, incremental changes along with it. Management uses the
individual sites as test labs. They don’t decide to refurbish all the restaurants at
once. Instead they refurbish a third of them and wait a year. If same store sales go
well in the refurbished sites they apply the change to the whole chain. Through all
of this they keep the physical locaons they control. The locaons and the concept
are key. A chain has to make sure it stays in popular locaons and it has to make
sure it manages the popularity of its concept well. But the thing about a chain like
Frankie & Benny’s is that it’s essenally a U.K. version of Chili’s or TGI Friday’s. The
Frankie & Benny’s of 2026 won’t look exactly like the Frankie & Benny’s of today.
But it will be hard to point to an exact moment in me where there was a huge
transion and a break in the chain’s history. More important than that, the chain
will sll be in many of the same locaons it is in today. This might be hard for U.S.
investors to realize, but Frankie & Benny’s is actually – adjusted for the U.K.’s much
smaller populaon than the U.S. – already of the same relave size as U.S. chains
like Chili’s and TGI Friday’s. It’s easier to nd a Frankie & Benny’s near you in the
U.K. than it is to nd either a Chili’s or a TGI Friday’s in the U.S. So, Frankie &
Benny’s is not a new chain. It is already prey saturated. But, it can evolve to stay
relevant in the U.K. the way Chili’s and TGI Friday’s did in the U.S. As far as Chiquito
– that chain should benet from being owned by the same company that owns
Frankie & Benny’s. Frankie & Benny’s has similar food as Coast to Coast. It has
dierent food than Chiquito. So, it makes sense for TRG to try to get two locaons
in a retail park whenever possible and put one Chiquito in there with either one
Frankie & Benny’s or one Coast to Coast. All metaphors are lies to the extent the
comparisons are imperfect. But, the best we can do is say that Frankie & Benny’s
really isn’t that dierent from a U.K. version of TGI Friday’s and Chiquito really isn’t
that dierent from a U.K. version of Chili’s. Each chain will have years with
especially good same store sales trends and especially bad same store sales trends.
But, both should be capable of rehabilitang their image when they inevitably
falter – the same way countless U.S. casual dining chains have over the past several
decades.
MOAT
The Economics of the Average Chain Restaurant Locaon are Beer than
the Economics of the Average Independent Restaurant – and Frankie &
Benny’s is Beer than the Average Chain Restaurant
No single restaurant has much market share either in the United Kingdom or in any
other country. For example, TRG owns Frankie & Benny’s which is one of the
biggest casual dining restaurant chains in the U.K. And yet when we segment the
U.K. restaurant industry into even as narrow a sliver as casual dining restaurants
with an average spend of between 10 GBP and 20 GBP per person we sll nd that
TRG has less than 15% of that very narrowly dened market. And, of course, people
in the U.K. don’t limit their eang choices to just casual dining restaurants in that
price range. They have a variety of choices in fast food: McDonald’s, Burger King,
KFC, Subway, Greggs, Costa Coee, Starbucks, etc. The average cket at these
chains is about one-third the price of a meal at a TRG type locaon. Are they
substutes? Not really. It would be extraordinarily rare for anyone to ever nd
themselves choosing between going to Greggs or going to Frankie & Benny’s. But,
let’s move one step closer to TRG’s market segment. Now let’s look at ‘fast casual’
restaurants in the U.K. These are places like Nando’s, Pizza Hut, Wagamama,
SINGULAR DILIGENCE 5

Gourmet Burger Chicken, and Five
Guys. They’re fast. And they’re like fast
food in a lot of ways. But, they aren’t
that cheap. The average cket at a “fast
casual” chain is about 9 GBP. That’s
twelve dollars U.S. There are places in
the U.S. where you can get a twelve-
dollar meal at a fast casual restaurant.
Especially for lunch. Because those are
lunch focused fast casual chains I just
menoned. Some of these chains do
get prey close to compeng with
casual dining. The food quality of Five
Guys is equal to the food quality of
some casual dining. Pizza Hut has – at
least at mes in its history – been a lot
closer to a low-end casual dining
restaurant than it has been to true fast
food. What we’ve outlined here is
prey much how the restaurant market
segments look in both the U.K. and the
U.S. But now we’re going to talk about
a segment of the market that exists
only in the U.K. Let’s talk about pubs.
The average spend at a pub in the U.K.
is very, very low. It’s about 5 GBP to 10
GBP. Think roughly $7 to $13 in the U.S.
So, a ten-dollar meal give or take a few
dollars. Pubs started out focused on
selling beer. In the U.K., people did not
keep beer in their household at the
same levels as Americans did. Beer
drinkers in a household went much
more frequently to their local pub. This
frequency is important to a pub’s
business model because it makes it
very dierent from the casual dining
restaurant. Beer sales declined over
me. And pubs focused more and more
on food. However, a pub is kind of in
the same situaon as something like a
Starbucks when it comes to food.
Starbucks is a coee shop. It gets lots of
very frequent visitors. People will go to
a Starbucks every day on their
commute to work. Starbucks would like
to sell these people food. Let’s say
Starbucks has a great idea for a
breakfast sandwich. They can make it
tasty and healthy and just all around
wonderful. But it will cost $8. Is that a
problem? A lot of diners in the U.S.
charge $8 or even $10 for a breakfast
entrée that includes meat and eggs and
so on. Plus, you have to p at those sit
down restaurant. And ps are big in the
U.S. So, even a $6.95 breakfast sandwich turns into at least an $8 item when you
include the p. Compevely it would seem that if a place like Starbucks which has
the convenient locaon and the coee a commuter wants could make a beer
breakfast sandwich than a diner and sell that sandwich for less than a diner – they’ll
have a hit menu item on their hands. Won’t they? Actually, they won’t. The
problem is frequency. Food – in the restaurant sense – is not a commodity product
that is sold based on price and quality without regard to where and when and how
oen it is consumed. In the U.S., the same person might go to Starbucks as much as
5 mes a week and a diner as lile as one me a week. So, an $8 breakfast
sandwich at Starbucks is more like a $40 a week or $173 a month indulgence. A
bagel and cream cheese bought at a bakery costs a lot less. I’m sure you
understand this intuively when I just menon the names of restaurants. If you’re
an American and I say Dunkin Donuts, Starbucks, Burger King, Denny’s, and
Outback you understand that Starbucks competes head on with donut and bagel
places, competes in some ways with Burger King, almost not at all with Denny’s,
and denitely not at all with Outback. This isn’t really about the food though. There
is nothing magical that puts coee in compeon with bagels and donuts. What’s
happening is that a $4 drive through breakfast sandwich at a McDonalds or a
Burger King is compeon for a place like Starbucks while an $8 breakfast sandwich
at a sit down diner is not compeon. It’s not about the food. It’s about the visit.
Starbucks’s best customers are the chains best customers because they visit it very,
very frequently. To visit a place very frequently you need each visit to be
consistent, quick, and cheap. You might be the kind of person who would be willing
to pay more for the best type of food. But doing so might make you less likely to
visit as frequently. And if your visits to Starbucks shrank from 5 mes a week to
three mes to two mes – suddenly Starbucks would be in direct compeon with
a diner for your business. You’ve become a once a week visitor who is willing to
stay longer, pay more, etc. for the best quality stu. But this has shied you into a
dierent kind of selecon process. So, compeon for a customer in the restaurant
business is really about how the customer is using your restaurant. It’s about the
visit.
That’s part of the reason why restaurants can evolve. They can move up and down
in price. They can develop faster service or slow their service down. A restaurant is
mostly just xed in terms of its name and its locaons. It takes a very long me to
reposion a restaurant concept in your mind. And it takes a very long me to
reposion the locaons surrounding you – the customer – in terms of how close
they are to you, how near they are to your work or the train staon you visit or the
movie theater you go to or whatever. Those are the more permanent features of a
SINGULAR DILIGENCE 6
TRG’s sales per location are 27% higher than the average chain
restaurant and 155% higher than the average independent restaurant.
restaurant chain. They are the concept
and the locaons. This is where we nd
a moat. Most of the other stu is just
eciency. It takes a long me for one
chain to be in all the same locaons as
another chain. It takes a long me for
one chain to develop the kind of name
and image that another chain has. It
doesn’t take much me at all to put the
same menu item in its stores as you
have in yours. Restaurants can add
quinoa and ghost pepper and sriracha
and black angus beef and anything else
they want to their menus almost
overnight. These things are easy to
copy. What’s hard to copy – and what
depends a lot on the history of how
your chain developed – is where a
chain’s locaons are and what image
pops into the public’s mind when it
hears the name of that restaurant.
Locaons and brand take me to
develop.
Pubs started out as places to drink.
They depend on a local customer base
of frequent visitors. They are ed to
one name and one locaon. It isn’t easy
for them to shi to a higher average
cket because this will reduce the
frequency of visitors to their “local”.
Once that happens, the place is no
longer your local pub. It’s just a casual
dining restaurant you go to every so
oen. It’s just something in direct
compeon with places like Frankie &
Benny’s, Chiquito, and Coast to Coast.
So, obviously pubs can keep their
locaons and re-posion themselves
over me into casual dining spots.
Given enough me, any restaurant can
aempt to do this. It risks losing its
customer base. But as we saw with TGI
Friday’s and Chiquito it is possible to
shi from a less family oriented place
to a more family oriented place. This
happens through evoluon born out of
experimentaon. Management sees
what works on a small scale and then
doubles down on that approach across
the whole chain. If some locaons are
working beer than others they target
locaons with similar demographics to
open new locaons in.
TRG discovered that leisure park retail locaons work best. Leisure parks and retail
parks are basically the U.K. equivalent of strip malls. They are planned shopping
and entertainment enclaves away from the high streets. The restaurants in these
locaons are usually chains. Many are fast food and fast casual locaons. You are
more likely to nd a Starbucks or a Subway or a Pizza Hut there than you are to nd
a pub type restaurant. Retail parks normally have 2 or 3 casual dining restaurants.
Big retail parks can have 5 to 6 casual dining restaurants. And TRG has between 1
and 3 restaurants in the same park.
TRG doesn’t really have advantages over other casual dining chains. But the
damage one chain can do to another is small. Landlords limit the number of casual
dining restaurants they put in the same locaon. And U.K. planning rules limit the
number of new retail parks – oen to protect the high streets from compeon.
The trend in the U.K. is for chains located in retail parks to benet at the expense of
independent restaurants located on the high street. From 2012 through 2015, sales
at independent restaurants declined at a rate of 1.6% a year. Meanwhile, sales at
branded restaurants rose at a rate of 6.1% a year. A lot of this is due to openings
and closings. Same store sales gains even at successful chains are small. TRG has a
long history of 2% to 2.5% a year same store sales gains. That means inaon
adjusted sales at each locaon barely increase. But the number of new locaons
provides a lot of growth.
TRG’s locaons are well posioned physically. Are TRG’s concepts well posioned
psychologically? It’s hard to say. The evidence points to yes. But we aren’t in the
U.K. So, it’s hard for Quan and I to talk much about something as subjecve as that.
On top of that problem, there just aren’t many publicly traded restaurants in the
U.K. So, we can’t do the kind of peer comparisons it is very easy to do in the U.S.
TRG’s sales per locaon seems very high. We don’t have median data for sales per
locaon. That would be more useful than the arithmec mean. But, all we have is
the mean. So, we’ll do our best with that awed gure. The average independent
restaurant locaon in the U.K. generates 530,000 GBP in annual sales. The average
branded restaurant does 1.06 million GBP. So, branded restaurants tend to do
twice as much business per locaon as independent restaurants. They are
obviously a lot more ecient on a per outlet basis. Wagamama, Carluccio’s, and
Cote all do more sales per locaon than TRG. They do 1.5 million to 1.6 million GBP.
Wagamama is fast casual. Customers share tables with strangers. So that’s really
like a fast food concept. Carluccio’s and Cote are on the high streets. Nando’s also
does more in sales than TRG. But it’s fast casual too. So, I’d say the best comparison
in terms of per locaon performance is that Carluccio’s and Cote outsell Frankie &
Benny’s. However, Frankie & Benny’s has 261 locaons and a minimal presence in
London. Carluccio’s has 98 locaons and more than 30 of those locaons are in
London. Cote has 73 locaons and is a midmarket French bistro focused on high
streets. Many of the most popular chains in the U.K. are Italian themed. In fact, TRG
actually owns both of the two biggest casual dining chains in the U.K. that aren’t
Italian themed. Frankie & Benny’s is Italian-American (but very American) and
Chiquito is Tex-Mex. So, within the market segment TRG focuses on – it seems to
do well. Margin protecon is very high in this business. So, new concepts don’t hurt
compeng restaurants much in terms of their prot levels relave to sales. The
greatest risk to TRG’s moat is self-inicted mismanagement of its brands or loose
planning in the U.K. If the rate of new casual dining locaon openings in retail parks
gets too high, TRG will suer. However, it is fairly easy for restaurants to exit the
market. When a chain has a lot of underperforming locaons, it closes them down.
When a landlord has more restaurants that customer trac to support these
restaurants – they start lling their space with entertainment or shopping venues
instead.
SINGULAR DILIGENCE 7

QUALITY
U.K. Casual Dining Restaurant
Chains Tend to Have an EBITDA
Margin Between 10% and 20% of
Sales
TRG earns a high return on capital. This
is partly due to TRG being an above
average U.K. restaurant chain. But it’s
also partly due to the enre U.K.
restaurant industry having an especially
high return on capital. The high returns
on capital are due to high margins. U.K.
restaurant chains have high EBITDA
margins and even high EBITDAR
(Earnings Before Interest Taxes
Depreciaon and RENT) compared to
U.S. restaurant chains. One possible
explanaon for this is that the potenal
demand for U.K. casual dining
restaurants is higher than the amount
of locaons that get planning
permission each year to add a
restaurant. One way to think about
restaurant margins is to talk about
“prime cost”. Prime cost is labor cost
plus food cost. In theory, both of these
are variable costs. However, food cost
is more variable than labor cost. If you
have less customers, it’s easy to buy
less ingredients. However, if you have
less customers, it is not as easy to give
your sta fewer hours or to re them.
But the quit rate in the restaurant
industry is very high. It’s not unusual
for 50% to 100% of a restaurant’s sta
to quit in a year. So, a restaurant that
stopped hiring for a month could
actually reduce labor by 5% to 10%. I
bring this up because it means labor is
potenally more short-run variable
than you might think. Very few rms in
other industries can reduce their labor
costs as quickly as restaurants can.
Now, let’s compare “prime cost” at TRG
and the U.S. restaurant chains Quan
collected data on. We don’t have good
data on other publicly traded casual
dining restaurants in the U.K. – because
there just aren’t many publicly traded
restaurants in the U.K. right now. There
are many, many publicly traded
casually dining restaurants in the U.S.
So, we are using mostly U.S.
restaurants for our peer comparisons.
For U.S. restaurants, “prime cost” – which you’ll remember is food cost plus labor
cost – is oen 57% to 60% of sales. At TRG, prime cost has been about 54% of sales
in almost every year for which we have data. Other expenses are about 33% of
sales. This is true for both TRG and U.S. chains. The big dierences for TRG and its
U.S. peers are that TRG has lower food and labor costs as a percent of sales and
TRG has higher rent as a percent of sales. This seems to always be the case in the
U.K. versus the U.S. Landlords can simply charge higher rents for casual dining
restaurants. That makes sense because planning permission is oen more
restricve in the U.K. than zoning laws are in the U.S. and then the U.K. also has
higher populaon density than the U.S.
The key to a successful restaurant on a per outlet basis in both the U.S. and the U.K.
is simply generang enough sales relave to xed costs. As an illustraon, TRG
averages 1.35 million GBP per locaon. This is 2.5 mes more than the average
independent restaurant in the U.K. Assume – probably prey conservavely since
we know a TRG locaon oen has fewer than 150 seats – that since TRG is doing
2.5 mes more sales than an independent locaon it is doing 1.5 mes more sales
per square foot. If xed costs are 30% of sales – then having a 50% higher level of
sales per square foot will result in a 15% lower level of xed costs to sales. And
remember that rent is an especially high expense in the U.K. It’s also xed. On top
of this, U.K. restaurants seem to have lower asset turnover than U.S. restaurants.
This may be due to invesng more in improving the physical locaon than occupy.
For example, TRG spends 1 million GBP ouing a typical locaon. The most likely
explanaon for U.K. restaurants being more asset intensive than U.S. restaurants is
higher construcon costs. There’s no evidence U.K. restaurants focus more on the
physical plant of their restaurants compared to U.S. peers. But higher costs for
doing the same work as in the U.S. would lead to a great inial investment in the
locaon. High xed costs can make it harder for small and independent restaurants
to survive. And higher inial start-up costs for a locaon can raise the barrier of
entry in the U.K. relave to the U.S. This could explain why there aren’t enough
U.K. restaurant locaons to push EBITDA levels down to what we see in the U.S. It
could be that compeon for limited locaons is a bigger deal in the U.K. Landlords
may do beer there. And chains with good leases may do beer. In the U.K.,
EBITDA margins for restaurants range from about 10% to 20%. In the U.S., they
range from more like 10% to 14%. For example, TRG has a 19% EBITDA margin
while Brinker (Chili’s) has a 13% margin, Cheesecake Factory has a 13% margin,
Darden (Olive Garden) has a 12% margin, Ruby Tuesday has a 12% margin, and
Bloomin Brands (Outback) has a 10% margin. Those are all successful U.S.
SINGULAR DILIGENCE 8
TRG’s 19% EBITDA margin is near the very top end of the range for
U.K. casual dining restaurants.
restaurant chains. How can TRG have
so much higher margins?
We’re not a hundred percent sure.
We’re very, very sure of the dierence
in rent. For example, the U.K.
restaurant chains of TRG, Gondola,
Prezzo, and Wagamama have rent
expense in the 8% to 11% of sales
range. Meanwhile, all the U.S.
restaurants I menoned before from
Cheesecake Factory, to Chili’s, to Olive
Garden, and Outback have rent
expense ranging from just 3% to 5% of
sales. As a rule, U.K. restaurant chains
have a rent expense level roughly
double what you’d see at a comparable
chain in the U.S. This has to do with
planning permissions. It’s easier for
U.S. restaurants to locate in places
people can drive to and park at along a
major road without any big aracons
in the same area. American subscribers
to this newsleer will know where
Olive Gardens tend to be located and
Olive Garden spends just 3% of its sales
on its rent. TRG spends 11% of its sales
on its rent. In other words, a Frankie &
Benny’s may be paying as much as 4
mes more on the space it occupies
than an Olive Garden. But that’s
unavoidable as long as the U.K. doesn’t
develop more land for casual dining
restaurants the way the U.S. has been
doing for many, many decades.
For a stascal discussion of how
similar or dissimilar the U.S. and U.K.
restaurant industries are you can read
the “Quality” notes secon further on
in this PDF. My own opinion is that the
U.S. and U.K. restaurant industries are
very similar with the big excepon
being that the U.S. has developed far
more of its land for the use of casual
dining restaurant chains than the U.K.
has. The U.K. restaurant industry is only
less compeve – and more protable
– than the U.S. restaurant industry
insofar as it has less access to land than
it would want. Basically, the rate of
growth in U.K. casual dining locaons
hasn’t been as fast as it otherwise
could be. But it’s not like the U.S.
restaurant industry has a low return on
capital. U.S. restaurant chains can make
25% to 35% pre-tax on their net tangible assets. Even aer-tax, these guys are all
making 15% or more on their investment in new locaons. So, the more perfect
compeon in the U.S. hasn’t driven down returns on capital for casual dining
chains to a normal level. If it had, you’d expect returns on equity near 10% instead
of 20% for a successful chain. In both countries, the restaurant industry is really
very win or lose by concept. Most new restaurant concepts fail and fail quickly. An
independent restaurant is probably going to close its doors within three years of
opening them. The owners will lose everything they put into that locaon. The
return on equity is negave. A few concepts will become successful. As they spread
from having 1 locaon to 10 locaons to 100 locaons and beyond, each new
locaon the company adds will have a return on equity of 20% or more aer taxes.
In a sense, the high return on equity of successful concepts can simply be explained
by the fact that the vast majority of aempted new entrants have a concept that
fails. Excess prots in the restaurant industry are really only earned by opening
more locaons under a proven concept. Think of it this way. Within 3 years: an
unsuccessful restaurant will probably close. And yet within 3 years: a successful
restaurant will probably have earned enough money to open a second locaon.
This is because the failure rate for new restaurants is 60% in the rst 3 years aer
opening. And it’s because the payback period for a successful restaurant is oen no
more than 3 years. You can see how quickly a successful chain can take over spots
vacated by new restaurants that come and go. There’s no trend towards successful
U.S. chains having their margins competed away over me. We have data on chains
that were successful in 1993 and are sll successful today. They’ve kept their
margins virtually idencal over those 23 years. The reason for this is probably that
the economics of a concept can be best understood at the unit level. Once you
know what a single successful Olive Garden looks like it isn’t hard to imagine that
1,000 Olive Gardens will have similar economics to 100 Olive Gardens – the
company will just be ten mes bigger in every respect. A chain’s return on capital
can certainly deteriorate. But it’s likely to be from self-inicted wounds. Ruby
Tuesday’s problems aren’t really that competors slowly came in and chipped away
at the company’s prots through underpricing them or something. Ruby Tuesday
has simply done a bad job of keeping the concept as popular as it once was. The
same thing can happen at Frankie & Benny’s or Chiquito. In fact, it did happen at
Chiquito once before. But, absent a change in the popularity of the concepts
themselves, TRG’s margins and returns on capital should be the same in the future
as they have been in the past.
CAPITAL ALLOCATION
TRG Uses its Free Cash Flow to Add More Locaons to Its Exisng Chains and
to Pay Dividends
TRG is a growth stock. But it also has a relavely high dividend payout rao. From
2005 through 2015, TRG more than doubled its locaons (from 237 to 506) while
paying out 50% of its earnings in dividends. From 2007 through 2015, the dividend
payout rao was very stable at almost exactly 45% of earnings. So, TRG has a more
consistent dividend payout rao than most stocks we pick for Singular Diligence.
Such a stable dividend payout rao is unusual among American public companies.
This stable dividend payout rao might make you think management is less focused
on the share price than the CEO of a U.S. company would be. That’s probably not
true. Half of the long-term incenve awards that TRG pays to its management are
based simply on share price performance. Compensaon comes in three parts. One
part is the base salary. Another part is an annual bonus of up to 150% of the base
salary. This is based simply on the company’s prot level. And then there is the long
-term incenve. This can be twice the base salary. It vests over a 3-year period. And
the vesng depends on the total stock return versus an industry subsector of the
FTSE (a U.K. stock index). So, management is rewarded for a good stock
SINGULAR DILIGENCE 9

performance relave to the industry
benchmark. The only other factor in the
long-term incenve plan is EPS growth.
This raises some quesons. There is a
bit of a mismatch between what TRG
management talks about and seems to
actually focus on versus what they are
rewarded for. Management has a
nancial incenve to increases EPS
growth as much as possible – since that
determines 50% of the incenve
compensaon – and to try to “talk up
the stock” to get the highest P/E rao.
Dividends can improve the total return
in the stock. But, half of TRG’s incenve
plan is determined by EPS growth
without regard to dividends. So,
management’s nancial incenve is
clearly to try to generate the greatest
possible growth in earnings per share
and get analysts and investors to think
of TRG as a growth stock. That’s what
the incenves say.
But what does management say?
Management is focused on return on
invested capital. This may be a
consequence of the company’s
turnaround in the early 2000s. At the
me of that turnaround, the new
management team talked about
focusing the business on barriers to
entry, high returns on capital, and good
growth prospects. In other words, they
would sell o those chains that lacked
barriers to entry, didn’t generate high
enough returns on capital, or didn’t
have any good ways to grow for the
long-term. They would focus on
keeping those chains that seemed to
have barriers to entry, that were
already generang high returns on
capital, and which could have their
success repeated at more and more
locaons opened each year. This
focused the company on selling o its
underperforming chains, milking the
chains that had lile growth prospects
but were otherwise performing okay,
and expanding the best chains in the
best locaons. The locaons TRG
focused on were concessions at places
like airports and pung concepts like
Frankie & Benny’s and Chiquito in retail
parks and especially leisure parks. This
is a good strategy. And the execuon of
that strategy is what drove TRG’s results over the last 10 plus years.
However, this is not really what management is incenvized to do. Looking
narrowly at purely pecuniary incenves – management is incenvized to focus on
EPS growth and P/E mulple expansion. There may be some incenve to pay
dividends when nothing else can be done. But, that’s about it. There really isn’t
much nancial incenve to focus on returns on capital. For example, management
would be beer rewarded if they took on as much debt as possible to open as
many stores as possible and buy back as much stock as possible in order to speed
up the EPS growth rate.
That’s not how management has behaved. And it’s not how management talks to
investors. They actually don’t focus on EPS growth alone. Instead they talk about
cash ow and return on investment. The company’s presentaon to investors
shows a calculaon of site and company EBIT/(Net Assets plus Debt). That’s a
return on investment calculaon. But noce how it is earnings before interest and
taxes on one side and debt on the other. That’s not actually how management is
incenvized. Management is not incenvized based on cash ow. Nor is
management incenvized based on either the return on capital at the site level or
the company level. The unleveraged return on net tangible assets is a great way to
incenvize management to align execuves with shareholders. Quan and I would
love for TRG to use a mix of EPS growth and return on retained earnings. In other
words, we’d love for management to be compensated in direct proporon to the
protability of the growth the company achieves. Don’t just reward management
for growth. And don’t just reward management for paying out earnings as
dividends. Instead, reward management for how much the company grows its
earnings relave to how much of those earnings it retains. This may in fact be how
TRG’s management thinks. It is certainly how they talk to investors. But it is not
how management is compensated. Management is compensated as if TRG was just
focused on being a growth stock.
So how will TRG allocate capital in the future? You can probably assume TRG will
pay out half of earnings in dividends. A successful restaurant has a quick payback
period. So, restaurant chains don’t need to borrow to grow. The best use of the
earnings TRG chooses to retain is probably to open more Coast to Coast locaons.
Coast to Coast is an American themed chain. The rst Coast to Coast restaurant was
opened in Brighton in 2011. The company quickly opened 4 more Coast to Coasts in
2012, 5 in 2013, 3 in 2014, and then 8 in 2015. This chain has about 20 restaurants
now. In theory, the U.K. could easily support 100 Coast to Coast locaons. TRG likes
SINGULAR DILIGENCE 10
Over the last decade, TRG grew its locations by 8% a year while
paying more than 50% of its earnings out in dividends.
to open Coast to Coast in places where
it already has a Frankie & Benny’s or a
Chiquito. There are places where you
can actually nd one of all three chains.
TRG also has another concept called
Joe’s Kitchen. There were only 4 of
these restaurants as of last year. There
are probably more by the me you’re
reading this. Again, if the chain is
successful, the U.K. could one day
support 100 Joe’s Kitchen locaons. So,
ignoring the prospect for more Frankie
& Benny’s and Chiquito, TRG has the
potenal for between 80 and 180 more
restaurants under the Coast to Coast
and Joe’s Kitchen names depending on
whether Joe’s Kitchen is successful or
not. This means TRG could double in
size within a decade.
TRG rarely uses much debt. It had 88
million GBP of debt in 2008. That was
its peak level. Net debt to EBITDA was
about one to one. TRG should denitely
avoid debt. Fixed expenses are high for
any restaurant. But they are much
higher in the U.K. than in the U.S. TRG’s
rent is about 11% of sales. This rent is
in the form of long-term leases. Those
leases are not easy to get out of. Right
now, EBITDAR/(Rent + Interest
Expense) is 2.7. This is essenally a cash
ow measure of xed charge coverage.
Most of TRG’s peers use much more
debt. But, in many cases, this can be
traced back to their ownership by a
private equity rm. That’s actually a big
reason why we are menoning U.S.
peers for TRG more oen than U.K.
peers. In the U.S., there are a lot of
restaurant chains in public hands. In
the U.K., these chains are more likely to
be controlled by a private equity rm.
Their stock just isn’t traded. So, we
don’t have the data we’d like to have.
Finally, it’s worth menoning TRG has
paid a special dividend twice in the last
10 years. If we include these special
dividends, we get a slightly higher
average dividend payout rao in the
post turnaround era. Let’s look at 2002
through 2015. From 2002 through
2015: TRG grew sales by 9% a year,
prots by 11% a year, and paid out 56%
of its earnings in dividends.
VALUE
TRG Trades at a Discount Both to the Mulples at Which U.K. Restaurants
Were Acquired in the Past and to the Mulples at Which U.S. Restaurants
Trade Right Now
The Restaurant Group is trading at a very low price in absolute terms. It is trading at
an even lower price in relave terms. Both in the U.K. and in the U.S., restaurant
stocks tend to trade at high prices. In the past, U.K. casual dining chains that went
private did so at a price of around 10 mes EBITDA. Right now in the United States,
publicly traded restaurants tend to be priced in the 12 to 14 mes EBIT range. What
does TRG’s EV/EBIT look like? Let’s start by adjusng EBIT for pre-opening
expenses. Once you do that, you get current EBIT of 94 million GBP. This is what
TRG would earn in pre-tax prots if it stopped opening restaurants. We could look
at TRG’s EBIT a dierent way though. This is the way Quan and I prefer to look at
most stocks – and certainly how we like to look at restaurant stocks. Since 2005,
TRG has been limited to chains located away from the high street. So, we can look
at the last 10 years of the company’s history as being similar to what the company
is like now. If we assume those 10 years are “normal” for the company, we can
simply average the margin level over those 10 years. We get 13%. TRG has tended
to earn 13 pence pre-tax for every one pound of sales it makes. Sales are much
more stable than EBIT at a restaurant. So, we should – as long-term investors –
price restaurant stocks using their current level of sales rather than their current
level of EBIT. If we do this at TRG we get 89 million GBP as our “normal” EBIT gure.
This works out to an EV/Normal EBIT of 6.3. Remember, TRG is a U.K. stock. A U.S.
restaurant chain would pay a minimum tax rate of 35%. So, a U.S. stock with an EV/
Normal EBIT of 6.3 would be equivalent to an unleveraged P/E of 9.7. A U.K.
restaurant company only pays a 20% tax rate. So, at that same EV/EBIT of 6.3 – a
U.K. restaurant stock would have a normalized P/E of 7.9. Basically, we are saying
that TRG is trading at a P/E of 8 if you replace the “E” with our esmate of normal
earnings and if you include debt in the “P” part of the equaon. U.S. peers tend to
trade at 12 to 14 mes EBIT. Should we take the tax dierence into account? A
dollar earned in the U.K. is 23% more valuable (0.80 / 0.65 = 123%) than a dollar
earned in the U.S., because a company keeps more of its money aer tax in the
U.K. If you give U.K. companies full credit for this lower tax rate, you would believe
that U.K. stocks should be priced 23% higher than U.S. stocks in terms of EV/EBIT. If
you don’t give U.K. companies any credit for their country’s lower tax rate, you
would believe U.K. and U.S. stocks should be priced equally in terms of EV/EBIT.
Under no circumstances, would you believes the U.K. stocks should be priced at a
discount to their U.S. peers. So, let’s go with that. TRG is in a country with a lower
tax rate than the U.S. So, TRG certainly should not trade at a lower price to PRE-tax
prots than its U.S. peers. The lower bound of what TRG should trade for then is
the price to pre-tax prots that the U.S. restaurant stocks most like TRG trade for.
What are these stocks?
Let’s start with Darden. Darden’s most important assets are Olive Garden and
Longhorn Steakhouse. The stock trades for 11 mes EBITDA and 19 mes EBIT.
However, Darden’s margin is abnormally low right now. The current margin is 6%.
The historical median margin is 8%. So, we’d esmate that Darden is trading for an
EV/EBIT of about 15 if we use a typical year. If we use a peak margin year, the stock
trades for just 12 mes EBIT. Darden’s management is focused on improving the
company’s margin. So, maybe investors are giving the company the benet of the
doubt when it comes to these plans. Maybe they think the company’s margin in the
future will normally be as high as it was in only the best years. That’s possible. Right
now, Quan and I would say Darden is trading at 15 mes normal pre-tax prots and
perhaps 12 mes the most opmisc assessment of what a leaner Darden would
SINGULAR DILIGENCE 11

fact, Ruby Tuesday would pay a 35% tax rate in the U.S. while TRG pays a 20% tax
rate in the U.K. So, the two stocks are actually priced the same based on normal
aer-tax prot. No one would argue that Ruby Tuesday is a higher quality business
with a beer future than TRG. But they are priced the same.
There are other stocks we could use as peers. Bravo Brio is priced at 9 mes normal
EBIT. Again, it has been experiencing same store sales declines. So, Bravo is priced
above TRG but is an inferior peer in terms of same store sales trend. Chuy’s is a
very expensive stock that is fast growing. It is priced at 15 mes EBITDA and 20
mes normal EBIT. Chuy’s could easily be a superior growth stock versus TRG. So,
we will exclude it as a peer.
That leaves us with 6 possible peers for TRG. Here they are along with their EV/EBIT
rao. Ruby Tuesday (5), Bravo Brio (9), Cheesecake Factory and Bloomin Brands
(12), and nally Darden and Brinker’s (15). TRG doesn’t have the troubled recent
history of either Bravo Brio or Ruby Tuesday. The best peers for TRG in my view are
Cheesecake, Bloomin, Darden, and Brinker’s. All of these stocks trade in the 12 to
15 mes pre-tax prot range and have to pay higher taxes than TRG does because
they are in the United States.
For this reason, I think it’s appropriate to value TRG at not less than 12 mes EBIT.
The stock now trades at a lile over 6 mes normal EBIT. So, TRG is worth double
what the market has priced it at.
Now, you might be wondering if it’s fair to price TRG like a U.S. restaurant chain
since it’s a U.K. chain. In some ways, it’s not. But all of those ways favor TRG over
the U.S. peers. Let’s look at the 5-year growth rate of TRG’s U.S. peers. Cheesecake
has 5-year sales growth of 5%, Bloomin has 4%, Brinker has 1%. Darden hasn’t
grown recently. All of these stocks have grown slower than TRG. Meanwhile, TRG’s
return on capital (calculated as EBIT/Net Tangible Assets) is higher than these
peers. Here are the stocks in descending ROC order: TRG (31%), Cheesecake (26%),
Chuy’s (24%), Brinker’s (23%), Darden (23%), Bloomin (22%). If we consider TRG’s
U.S. peer group to consist of 4 stocks – Cheesecake, Bloomin, Darden, and Brinker’s
– we can say that TRG has the lowest EV/EBIT, the lowest tax rate, the highest
return on capital, and the highest growth rate of that group. U.K. stocks may be
underpriced versus U.S. stocks right now because of the recent referendum which
will eventually lead to the U.K. exing the European Union. Let’s assume this will
cause a recession in the U.K. and yet no recession in the U.S. But, if you are a long-
earn in a normal year. So, Starboard –
the fund that controls Darden – might
say the stock only trades at 12 mes
pre-tax prot. But, Quan and I would
say it trades at 15 mes pre-tax prots.
So, Darden is a peer of TRG. And
Darden’s priced at an EV/EBIT of 15.
Brinker’s owns Chili’s and Maggiano’s.
The stock trades at 8 mes EBITDA and
12 mes EBIT. However, if we use the
historical median EBIT margin and
apply it to today’s sales we get an EV/
Normalized EBIT of 15. Brinker’s has an
especially high margin right now.
Darden has an especially low margin. In
reality, they are both trading at an EV/
Normal EBIT of about 15.
Cheesecake Factory is trading at 9
mes EBITDA and 13 mes EBIT. Using
the historical median margin and
applying it to today’s sales we get an
EV/Normal EBIT of just 12 mes. So,
our EV/EBIT range is: Cheesecake (12),
Darden and Brinker’s (15).
Bloomin Brands owns Outback
Steakhouse, Bonesh Grill, Carrabba’s,
and Fleming’s. The company’s margin is
right in line with its past history. So, the
EV/EBIT of 12 is normal. That gives us
two pairs of dierently priced peers.
Cheesecake and Bloomin on the low
end with 12. And Darden and Brinker’s
on the high end with 15.
Finally, we have Ruby Tuesday’s. This
stock is hard to price. It might be very
cheap. But it is troubled. Whether that
trouble is short-term or long-term is
the queson. Ruby Tuesday’s same
store sales have declined in 8 of the last
9 years. That’s very unusual for a long
established chain. The company’s pre-
tax margin is 2.5% as I write this. The
historical median level is 6.7%. If the
company could ever string together a
chain of same store sale increases as
long as the same store sales decreases
it has experienced, this stock would
turn around in a big way. The stock’s
EV/EBIT is 14 right now. But,
normalized EV/EBIT is 5. Ruby
Tuesday’s may not be a good peer for
TRG. However, it is the U.S. restaurant
stock that TRG is priced most like. In
SINGULAR DILIGENCE 12
Past acquisitions of U.K. casual dining chains tended to be done at prices
between 8 and 14 times EBITDA with a price near 10 times EBITDA
being the most common.
term investor who intends to hold
whichever restaurant stock you buy in
2016 through the year 2021, does this
maer? The answer is no. TRG is
cheaper than these U.S. peers now –
when you are considering buying the
stock. And TRG is likely to be earning as
high a return on capital or higher,
growing as fast or faster, and being
taxed at the same rate or less than all 4
of these peers in the year 2021. If you
can buy TRG for a lower EV/EBIT than
you can buy U.S. restaurant stocks for
today, the queson you need to ask is
what TRG’s ROC, sales growth, and tax
rate will look like in 2021. Is there any
reason to believe TRG will go from
being beer than these 4 peers today
in these areas to being worse than
them? In the short-term – maybe. TRG
may perform worse over the next 1 to
3 years. U.K. households may do worse
than U.S. households over the next
year or three. There’s no reason for
them to connue to do worse over the
next 5 years. So, a long-term investor
should prefer TRG over all other
restaurant stocks. A conservave
relave valuaon for TRG is 12 mes
EBIT. This is the price the perhaps
slightly inferior U.S. restaurant chains
that are most like TRG trade at today.
GROWTH
TRG’s Future Growth Will Come
from Fully Saturang the U.K.
Market with its Exisng Chains
We know that the fastest growing parts
of the U.K. restaurant industry are fast
casual restaurants and casual dining.
TRG runs casual dining restaurants. So
it is in one of the best posioned parts
of the U.K. restaurant industry. We also
know that trac to retail parks and
leisure parks is growing at the expense
of trac to the high streets. TRG’s
locaons are in retail parks and leisure
parks rather than on the high street.
So, TRG is well posioned for growth in
that way as well. Finally, we used peers
from the U.S. when comparing TRG to
other restaurants. The U.S. food away
from home market is more mature
than the U.K. market. So, there may be
a longer runway for growth in the U.K. than in the U.S. However, this point is the
most debatable. Households spend a greater fracon of their income at restaurants
as they have more income. In other words, spending at restaurants grows faster
than household income. So, it may not be the case that there is a point of maturity
that we should look at as an end point. Instead, we should just imagine that
whichever countries grow household income the fastest are likely to have the
fastest growing restaurant industries. One big dierence between the U.K. and the
U.S. is that the U.K. has pubs and the U.S. doesn’t. The market share of
independent restaurants in the U.K. declined from 80% of the industry in 2012 to
just 76% today. This sounds like a small shi relave to branded chains. But, it leads
to a huge dierence in annual growth trends. Over the last 3 years, independent
restaurants have shrunk 1.6% a year while branded restaurants have grown 6% a
year. TRG runs branded restaurants. So, while the U.K. restaurant industry may not
be growing very quickly as a whole – the only part that TRG competes in (branded
chains) is growing more than 5% a year. That’s quite fast considering how slow U.K.
nominal GDP growth was over the last few years.
Of course, TRG’s exisng concepts will eventually reach a point of saturaon in the
U.K. Some of these chains are already quite big. Here is the exisng restaurant
count and the potenal number of locaons TRG management says that chain can
one day support: Frankie & Benny’s 261 (350), Chiquito 86 (200), Coast to Coast 21
(100). TRG also believes they can add some concessions, pubs, and “other”
restaurants. This would include things like Joe’s Kitchen. That might be true. But
let’s ignore all that. Let’s just use the 3 chains of Frankie & Benny’s, Chiquito, and
Coast to Coast. And let’s trust TRG’s potenal targets. We have no idea if these
potenal targets are realisc or not. But they’re the best esmates we have. So,
let’s see how many total new locaons TRG thinks it can add to each chain. Frankie
& Benny’s has 261 locaons now and TRG thinks it can reach 350 or more. That’s a
potenal 89 more locaons. Chiquito has 86 locaons now and TRG thinks that
chain can reach 200 or more sites. That’s 114 more potenal locaons. Coast to
Coast has 21 locaons now. TRG thinks Coast to Coast can reach 100 or more
locaons. That’s a potenal 79 more locaons. So, TRG thinks it may eventually be
able to add 114 more Chiquito locaons, 89 more Frankie & Benny’s, and 79 more
Coast to Coasts. That’s a total of 282 more locaons TRG thinks it can add. Those 3
chains now have 368 locaons combined. So, that’s an addion of about 75%.
TRG’s same store sales have tended to grow about 2% a year over the last 10 to 15
years. Let’s assume TRG can grow its number of locaons by 75% over the next
decade and grow same store sales at all its locaons by 2% a year for the next
decade. What would that look like in terms of sales and prot growth for the
company?
Remember, we’re assuming this growth takes a full decade. So, this is sales growth
from 2016 to 2026 we’re thinking about. That works out to 8% annual sales growth.
Growing these 3 chains from 368 locaons now to 650 locaons by 2026 would
mean 5.8% compound annual growth in the number of locaons. So, if same store
sales were roughly at, these chains would grow about 6% a year. Of course, at
same store sales would cause bad locaon economics and poor prot growth or
even declining prots. What I want to show here is that perhaps TRG can grow at
about 8% a year for the next 10 years. And, if it does so, TRG will be able to get
most of that growth simply from adding more locaons to exisng chains.
Are these targets that TRG has for the eventual size of each chain realisc? Let’s
compare the U.K. to the U.S. We can divide the U.S. populaon by the U.K.
populaon to get a mulplier. This mulplier can then be applied to the number of
locaons TRG projects for each chain to get us a “U.S. equivalent” size. For
example, Frankie & Benny’s already has 261 sites in the U.K. That’s equivalent to a
1,305 site chain in the U.S. This is because the U.S. populaon is 5 mes the size of
SINGULAR DILIGENCE 13

the U.K. populaon. A 350 site goal is
very ambious. That would be
equivalent to a 1,750 site chain in the
U.S. Is there such a chain? Yes. There’s
one. It’s called Applebee’s. And it has
1,878 sites in the U.S. There are very,
very few casual dining chains in the U.S.
with more than 1,000 locaons. This
tells us there should be very, very few
casual dining chains in the U.K. with
more than 200 locaons. In the U.S.:
Applebee’s has 1,878 sites, IHOP has
1,441 sites (though it’s mostly a
breakfast place), Chili’s has 1,252 sites,
Olive Garden has only 840 sites. So,
even the ubiquitous Olive Garden falls
short of the 1,000 site mark in the U.S.
That means we shouldn’t assume the
U.K. can support more than 3 or so
chains with more than 200 locaons.
Frankie & Benny’s is the biggest casual
dining chain in the U.S. If it reaches 350
locaons in the U.K., that would be like
reaching 1,750 sites in the U.S.
Applebee’s is the largest casual dining
chain in the U.S. It has 1,878 sites right
now. So, yes, 350 sites sounds like the
maximum number of locaons we
could expect Frankie & Benny’s to ever
have. TRG says Chiquito has the
potenal to reach 200 locaons. That’s
equivalent to 1,000 locaons in the U.S.
Chili’s has 1,252 sites in the U.S. Chili’s
and Chiquito are prey comparable. So,
again, TRG’s esmate of the future
potenal of that chain is just within the
realm of reasonability. Finally, TRG has
esmated Coast to Coast’s future
potenal is 100 sites. That’s equivalent
to 500 sites in the U.S. Olive Garden
has 840 sites, Outback has 753, Ruby
Tuesday has 687 sites, and so on. As
you can see, chains of 500 locaons
aren’t unthinkable in the U.S. And
chains of 100 locaons aren’t
unthinkable in the U.K. It’s possible
Coast to Coast could one day support
100 locaons. Any other chains that
turn out to be successful – like let’s say
Joe’s Kitchen – could also be assumed
to have a ceiling at 100 locaons.
The type of culinary theming of U.K.
restaurants isn’t exactly the same as in
the U.S. Italian themes – especially
pizza – are big in the U.K. We looked at
the 40 largest casual dining chains in the U.K. These account for a huge number of
all branded restaurants. So, we’ll use them as a biased by illustrave sample to
stand in for the branded casual dining market as a whole. The top 40 have 4,970
locaons. Pubs account for 1,902 (38%) of the top 40 chain locaons. Italian
themed restaurants – excluding pizza – account for 1,088 locaons (22%). So, pubs
and Italian restaurants account for 2,990 locaons. American themed restaurants –
excluding pizza – account for 334 outlets. There are only two American themed
restaurants in the top 40: Frankie & Benny’s (261 locaons) and TGI Friday’s (73).
Pizza Hut has about as many locaons as Frankie & Benny’s. Pizza Hut is posioned
more as a casual dining restaurant in the U.K. I excluded it because a pizza focused
restaurant doesn’t seem to count as American themed. The food being served is
really American style pizza. But, I don’t think people eang out in the U.K. think of
pizza as especially American. Other top 40 chains include Japanese, French, and
Mexican themed restaurants. Taken together, these 3 themes are bigger than the
American theme. Taken separately, each is about half the size of the total number
of American themed locaons. Right now, TRG has the biggest American themed
restaurant in Frankie & Benny’s and the biggest Mexican themed restaurant in
Chiquito. Coast to Coast is American themed. But it is much smaller than TGI
Friday’s. There is plenty of room for more American themed restaurants. Mexican
themed restaurants may also do ne.
Since 2005, TRG grew its store count by 7.9% annually. TRG opened 44 restaurants
last year. They plan to open 40 restaurants this year. If they connued at this pace,
the annual growth in locaons would be 7% a year over the next 5 years. More
conservavely, we could imagine a number as low as 5% a year over the next 10
years to ll out all the exisng chains to the sizes TRG has talked about being their
full potenal. So, growth in the number of locaons of 5% to 7% is possible at the
big chains. Concessions, pubs, and other may not grow at all. This can drag down
the overall company’s growth rate. Locaon growth of at least 5% a year seems
reasonable in most years. At least for the next 5-10 years. Let’s take the shortest of
those me periods and the lowest growth rate. Let’s assume 5% annual growth in
the number of total locaons at TRG from 2016 through 2021. That would leave the
company 28% bigger in locaon terms than it is now. That’s perfectly reasonable.
Same store sales are harder to predict. Historically, TRG oen achieved 3% annual
same store sales growth. The number of new restaurant openings can drag down
same store sales growth. New locaon openings for the industry as a whole slowed
from 2.8% in 2014 to 1.5% in 2105. This sounds like a slow growth rate. However,
SINGULAR DILIGENCE 14
Going by TRG’s own estimates: Frankie & Benny’s is now at 75% of
total saturation, Chiquito is at 43%, Coast to Coast is at 21%, and Joe’s
Kitchen is at maybe 7%.
what seems to be happening is that
pubs are shrinking while restaurants
are growing. In fact, there have been
years where the number of food led
restaurants – so not pubs, which focus
on drink – grew by almost 7%. That’s
probably too rapid a rate of growth to
allow for much if any same store sales
growth. However, if this gure slowed
to say 4% to 5% a year, you could easily
see same store sales growth.
Obviously, TRG’s same store sales can
decline as Bravo Brio’s sales have
recently and as Ruby Tuesday’s sales
have for almost a decade now. This can
happen because of a change in the
popularity of Frankie & Benny’s
primarily and secondarily a decline in
Chiquito’s popularity. TRG is sensive
to the popularity of Frankie & Benny’s.
That chain now provides half of all
sales. A reasonable expectaon for
TRG’s same store sales – if the
company is able to maintain the
popularity of those chains – is maybe
1% to 2% annual same store sales
growth. So, over the next 5-10 years,
you might see locaon growth of 5% to
7% a year and same store sales growth
of 1% to 2% a year. This could lead to
sales growth of about 6% to 9% a year.
I think it’s reasonable to expect TRG
will grow companywide sales by about
6% a year over the next 5 years. This
would make the company about one-
third bigger in 2016 than it is today.
The stock’s return would be a
combinaon of the earnings per share
growth rate (for which companywide
sales growth is a good proxy), the
dividend yield, and the earnings
mulple’s expansion or contracon.
TRG’s earnings mulple (EV/EBIT = 6.4)
is so low right now, that it’s actually
this “value” part of the investment case
that could provide the most return.
Assume the EV/EBIT mulple expands
from 6.4 to 12 over the next 10 years.
That’s a long me to converge with its
U.S. peers. Even over such a long
period of mulple expansion, this
factor would contribute 6.5% a year to
the stock’s annual return. That’s
potenally as high or higher than the
contribuon from actual earnings
growth. In fact, if the mulple expansion from an EV/EBIT of about 6 to an EV/EBIT
of about 12 happened in as lile as 5 years – the contribuon to your return in
holding the stock would be about 13% a year from the mulple expansion. So, is
TRG a growth stock or a value stock? Quan and I think TRG can grow faster than
U.K. GDP. That makes it a growth stock. But we also think the stock is cheap enough
that the contribuon from “value” to your return in the stock even if you hold TRG
shares for 5 years or more could actually be greater than the contribuon from
“growth”. This is especially true if you consider the dividend yield to be another
form of “value” invesng. So, we think TRG is a solid moderate growth company.
But TRG stock may be a bit more of a value stock than a growth stock right now.
MISJUDGMENT
We Are Assuming TRG Can Grow About 6% While Paying a 4% Dividend
Yield – The P/E Rao on the Stock Shows the Market Does Not Believe TRG
Will Connue to Grow
There are several ways we might misjudge The Restaurant Group as a stock. The
most likely way is for us to be wrong about same store sales. Restaurant chains
oen go through periods of consecuve gains in same store sales one quarter aer
another. And then they oen go through other periods during which they have
consecuve declines in same store sales in quarter aer quarter. If TRG posts same
store sales declines for a year or two years in a row – the stock may react very
negavely. This would be jused if you – the investor – knew that the same store
sales trend of TRG would follow the sort of almost decade long declines that have
plagued Ruby Tuesday. The problem is that you can’t know that ahead of me.
Even very good restaurant concepts can have a year or two of declining same store
sales. It doesn’t even have to be caused by anything specic to the company. For
example, the U.K. recently held a referendum on whether or not to leave the
European Union. The majority of votes cast in that referendum were for “leave”.
That means the U.K. is likely to leave the European Union someme in the next two
years or so. Untangling itself from the European Union, could do damage to the
U.K.’s short-term economic growth. In other ways, it could obviously benet parts
of the economy. For example, if the Pound is cheaper versus the Euro, the U.S.
dollar, etc. this can help U.K. exporters and U.K. tourism. Since the referendum, the
Pound has dropped quite a lot. That could be temporary. And other ill eects of
leaving the E.U. could make it more likely the U.K. will enter a recession. Same
store sales depend in part on nominal GDP growth. The rate of inaon maers.
And the real rate of GDP growth maers. On top of this, people spend more at
restaurants – or rather, they visit them more frequently – when they are feeling
opmisc about their income situaon. And they visit less when they are feeling
poorer. So, the U.K. leaving the E.U. could hurt U.K. stocks like TRG. It could make it
more likely TRG will post negave same store sales for a couple years in a row. And
it could make it more likely TRG shares will react violently to such a same store
sales decline. Also keep in mind that TRG earns its income in Pounds. If you are a
U.K. investor, this presents no problem. Your savings are in Pounds right now. But,
if you are a U.S. investor, a Canadian investor, etc. you are taking savings in a
currency that is not the same as what TRG earns its money in. And then you are
trading that currency for Pounds to buy TRG shares. Is this a good deal right now?
It’s certainly a beer deal than it was before the referendum. We have only two
pieces of advice on currency exchange rates for long-term investors. One is that
there’s nothing wrong with having say 50% of your porolio in stocks denominated
in currencies other than your home country’s currency. So, if you are an American,
and you have more than 50% of your money in the U.S. – go right ahead and buy
TRG stock without worrying at all about the currency. Don’t try to hedge any
posions you have in other countries. Our second piece of advice is that – other
SINGULAR DILIGENCE 15

things equal – you want to avoid
swapping into a currency that is trading
above purchasing power parity with
your own. This issue will quickly be out
of date in terms of exchange rates. So,
you’ll need to check currency exchange
rates yourself if you’re worried about
that. You can look at The Economist’s
“Big Mac Index” for a very rough gauge
of where currencies are versus where
they should be. You can also simply go
on Google and search for currencies
and their premium or discount to
purchasing power parity (PPP) with the
U.S. Dollar. As I write this, the Great
Brish Pound is not especially
overvalued versus the U.S. Dollar. So –
for Americans at least – there is
absolutely nothing to worry about in
terms of the currency TRG trades in.
This is advice for long-term investors.
The Pound could do anything next
month or next year. When we
recommend a stock in Singular
Diligence we expect you to buy that
stock today and then hold that stock
for a full ve years. If you aren’t willing
to hold a stock for ve years – currency
uctuaons could be more of a
problem. Purchasing power parity is a
very good yardsck for the long-run.
It’s not going to help you gure out
where the Pound will be versus the
Dollar in a year or two though. Both
Quan and I have no problems pung
our own money into stocks
denominated in Pounds at today’s
exchange rates. It’s not something we
think you should worry about either.
But, your brokerage account will of
course show the combinaon of TRG’s
gains and losses in Pounds while you
hold it and the added uctuaons of
translang those Pounds back into your
home currency. I don’t think we’re
likely to have “misjudged” the long-
term future of the Pound. But, I do
think we have no idea what short-term
to medium-term movements in
currencies will be. So, this isn’t so much
a misjudgment risk as a pure
uncertainty risk. You could easily be
hurt more than we expect by the
Pound’s performance. But you could
just as easily benet from the Pound’s
performance. We’ve assumed complete neutrality as far as currencies go. When we
discuss the total return potenal of TRG, we’re just talking in Pounds. Basically,
we’re talking as if you were a U.K. based investor buying this stock. Of course, Quan
and I aren’t U.K. based. I invest in U.S. dollars. And TRG is – among the stocks we’ve
picked for Singular Diligence so far in 2016 – the stock I’m most interested in
invesng my own money in right now.
There are a few other risks of misjudgment. Most are prey small. The U.K.
changed its minimum wage laws. See the “Misjudgment” secon of the notes at
the back of this PDF for details. Basically, the lowest wage an employer is allowed
to pay has increased for workers 21 years and older. It hasn’t changed for teens.
The U.K. government plans to increase the minimum wage by about 25% within the
next 5 years. Undercung each other on price isn’t really a feature of compeon
in the restaurant industry. And the industry is completely localized. Minimum wage
laws have the most potenal to harm a rm if it’s something like a price focused
exporter. In such a case, they’d now be compeng against other rms that can sll
access cheap labor they no longer can. Restaurants aren’t doing anything like that.
The minimum wage law will raise the cost of labor for all of them. For restaurants,
labor and food costs are considered variable and are together taken as the “prime
cost”. You can then mark-up your menu prices by some percentage over prime
cost. So, an increase in the minimum wage is basically the same thing as an
increase in food costs. In either case, there can be a short-term negave impact as
restaurants are slower to change their menu prices than their costs change. But,
the long-run impact is simply fewer people eang out because it’s more expensive.
TRG can see the same volume declines in trac that all restaurants would see if
they raise their menu prices. Higher minimum wages also incenvize a company to
nd ways to eliminate labor. And, in the case of the U.K. where older workers have
higher minimum wages, it also encourages hiring younger workers in place of older
workers. So, hiring more people in their teens. And avoiding hiring people in their
early twenes who have no prior experience. It’s a short-term negave. Looking
out 5 years, I don’t think we’ll remember this minimum wage thing being an issue
at all. The same is true of “Brexit”. I expect you’ll see headlines about Brexit’s
negave impact on the U.K. economy generally and consumer condence
specically throughout 2016, 2017, and 2018. But by 2020 and 2021, I imagine we
won’t hear a thing about Brexit anymore. I consider a long-term investment to be 5
years or more. This is a newsleer for long-term investors. So, I expect you won’t
be selling TRG before 2021. In other words, I expect talk of both the minimum wage
hike and Brexit to have petered out by the me you sell TRG.
SINGULAR DILIGENCE 16
Over the last year, TRG’s P/E ratio dropped more than 40% (from 20 to
11) while same store sales dropped less than 3%.
The reason the stock is down so much
recently is probably the same store
sales declines. For example, TRG’s
same store sales have decline 2.7% so
far in 2016. This is a concern. In fact,
it’s a big concern. But, TRG is now
trading at about half the price of a
typical restaurant stock. A so far brief
record of moderate declines in same
store sales does not warrant pricing a
stock at 50% o what a normal
restaurant chain goes for. TRG also has
beer growth prospects than the U.S.
peers we discussed in the “value”
secon. So, you have to believe same
store sales declines will be sustained to
jusfy this price.
How do we know TRG won’t keep
posng same store sales declines
forever? We don’t. Ruby Tuesday
prey much has. We might misjudge
TRG’s prospects here. We might be
ignoring a warning sign that the Frankie
& Benny’s concept is now in permanent
decline. But, the other risk of
misjudgment is being biased by recent
informaon. Greggs is a good example.
Greggs posted same store sales
performance that was weak in 2009-
2013. It was up 0.8% in 2009, up 0.2%
in 2010, up 1.4% in 2011, then down
2.7% in 2012, and down another 0.8%
in 2013. The stock got down to a P/E
around 12. And that P/E rao was on
the company’s lowest operang margin
number in 25 years. So, the P/S rao –
which is probably a beer indicator for
a restaurant – was even cheaper. The
media, analysts, etc. were prey
negave on Greggs during the same
store sales declines in 2012 and 2013.
In 2014, Greggs grew same store sales
by 4.5%. In 2015, Greggs grew same
store sales by another 4.7%. Margin
expanded. The P/E went from about 12
to about 20. The stock more than
doubled. And people prey much
forgot the risk that the concept might
be obsolete which worried them so
much in 2012 and 2013. I can’t say
whether that fear was absurd or
reasonable. But, I can say the market
took the risk perhaps too seriously
while the most recent same store sales
gures were negave and took the risk
perhaps not seriously enough when the most recent same store sales gures were
posive. In other words, the market focused on just the most recent same store
sales number. It didn’t look at the last quarter century or so of really prey
predictable results at Greggs. TRG’s recent same store sales numbers are bad. But,
you’re only buying TRG stock today. You’re not going to sell it for at least 5 years.
That means you don’t want to focus on what TRG’s same store sales will be in 2016.
You want to focus on want TRG’s same store sales will be in 2021. The most recent
numbers won’t help you make that esmate. The long-term trend over the last 15
years or so is probably a beer guide. Quan and I would guess that TRG’s same
store sales are more likely to be up between 1% and 2% when you sell the stock in
2021 than they are to be down 1% to 2% as they are right now. This is the biggest
risk of misjudging TRG stock. The market might be right in pung so much weight
on the most recent results. But, Quan and I think the market tends to focus way too
much on the very recent past.
FUTURE
TRG is So Cheap Compared to Peers the Stock Can Provide a Solid 5-Year
Return Even if Same Store Sales Are Close to Flat From Now Through 2021
We’re now going to look out ve years at what a possible 2021 could look like for
TRG. We’re doing this because we – as long-term investors – always want to focus
on what a business will look like when we sell it rather than what a business looks
like when we buy it. Some bad things could happen to TRG between now and 2021.
One, the company’s same store sales could connue to decline. As I menoned
earlier, same store sales declined 2.7% in the early part of this year. So, TRG has
declining same store sales right now. If that connued for several years, it would
leave TRG in a bad place for 2021. Two, the country TRG is in – the U.K. – could
have a recession. It could last for a few years. That might put TRG in a slightly worse
place than we’d imagine for 2021. However, this macroeconomic factor actually
can’t be very big when looking out to 2021. Recessions are neither very deep in
percentage terms nor very long lasng when compared to company and even
industry specic factors. So, if you’re concerned about both TRG’s same store sales
and “Brexit” – the popularity of TRG’s concept and the impact that has on same
store sales should be your much bigger concern. Obviously, if you are a momentum
type investor, a trader, or someone with an investment me horizon of less than 3
years – these factors could and probably should put you o TRG stock. The
company is experiencing same store sales declines right now. And the U.K. is about
to leave the E.U. These trends are bad for TRG. And they would be bad for an
investor who held the stock in 2016, 2017, and 2018. I don’t think they are a big
issue for an investor planning to hold the stock through 2021. I certainly don’t think
“Brexit” is anything to worry about if you’re a long-term investor. Finally, there is
the industry problem that could crop up. Casual dining chains in the U.K. could
open too many new locaons. So, let’s organize the three risks for the next 5 years
into the company risk, the industry risk, and the country risk. The company risk is
that the Frankie & Benny’s and Chiquito chains will decline in popularity and TRG
will connue to post negave same store sales. The industry risk is that TRG’s
competors will open too many new restaurants especially in retail parks and
leisure parks. And the country risk is that the U.K.’s “Brexit” will cause a recession
that lasts mulple years. Same store sales declines will lead to even bigger
percentage declines in earnings. So, a 5% drop in same store sales leads to a much,
much larger drop in earnings. This is because a large poron – as much as 40% to
50% – of a restaurant company’s expenses are relavely xed. The truly variable
part of a restaurant’s costs are just the “prime cost” of food plus labor. Everything
else will sll be an expense even on lower sales. Connuously declining same store
sales are a huge problem for restaurant companies. But many restaurant chains
SINGULAR DILIGENCE 17

experience a couple quarters or even a
couple years of same store sales
declines and then turn them around.
This may happen once or twice a
decade even to a good chain. We know
TRG’s own Chiquito had a brief bad
period in the early 2000s. And, of
course, TRG had negave same store
sales during the nancial crisis – as did
almost all restaurant chains. It’s likely
TRG would have negave same store
sales during a U.K. recession. But will
TRG sll be posng same store sales
declines in 2021? And will the U.K. sll
be in a recession in 2021? I think the
answer to both these quesons is likely
to be no. TRG is no more likely to have
negave same store sales in 2021 than
any other restaurant stock you can buy
today. And the U.K. is no more likely to
be in a recession in 2021 than the U.S.
is. It’s a fair point to say that the U.K.
may be more likely to be in a recession
than the U.S. in 2016, 2017, or 2018.
But it doesn’t make any sense to say
the U.K. is more likely to be in a
recession in 2021. So, if you’re willing
to commit to a 5-year holding period –
as Quan and I expect all readers of
Singular Diligence to be – than Brexit is
simply something you have to endure
holding the stock through rather than
something you have to worry will be
depressing the stock’s price at the very
moment you hope to sell. Let’s leapfrog
over the next few years. What might
2021 look like?
We don’t know how many restaurants
competors will open. If the U.K. enters
a recession, they’ll plan to open fewer
locaons. And if all casual dining chains
– not just Frankie & Benny’s – are
showing weaker same store sales,
they’ll plan to open fewer locaons.
Restaurant openings are likely to be
trend chasers. As long as the same
store sales trends of the most recently
opened locaons looks good, chains
will keep pushing into more and more
places. They’ll stop when
oversaturaon is hurng same store
sales. And they’ll stop when they are in
the middle of a recession. Otherwise,
they’ll be relentless in opening new
locaons because the return on capital
for an addional locaon in a successful chain is very high.
How many locaons will TRG open? The company could open up to 150 stores over
the next 5 years. It’s reasonable to assume that – if same store sales eventually
turn back to posive – TRG could have as many as 650 stores in 2021. And it could
have plans on the table to open another 40 to 50 stores annually in 2021 and
beyond. So, when you are planning to sell TRG in 2021, the stock could have a total
of 650 stores and be opening new stores at a rate of 40 to 50 a year. That would
mean the unit growth rate in terms of locaons would be running at about 6% a
year. At that rate of 40 or more store openings a year – TRG would be able to pay a
dividend equal to half of earnings. It might actually be able to pay a bit more than
that. But, we’ll assume half. Assume an inaon level type rate of same store sales
growth. Even if you expect really low inaon in the U.K. in 2021 – and I’m not sure
we’ll sll be in quite as low an inaon world 5 years from now as we are today –
you’d sll want to assume same store sales growth of between 0% and 2% a year.
So, in 2021, you’d own a stock growing its EPS by about 6% to 8% a year and paying
out half of that EPS in dividends. This rosy scenario could get you a return in the
stock over the next 5 years of up to 18% a year if the earnings mulple on the stock
rises to the same EV/EBIT rao that U.S. restaurant chains have right now.
What about a gloomy scenario? Quan sketched out an arbitrary one of those. This
is meant to show how bad things would have to be before TRG would start
underperforming as a long-term investment. This is not our actual predicon of
how we expect the company to look in 2021. Let’s assume TRG has 0% same store
sales growth between now and 2021. But let’s also assume that TRG and its
competors connue to open new locaons at an aggressive rate. This causes
TRG’s margin to decline. It goes from the roughly 13% EBIT margin it has had
recently to just a 10% EBIT margin. That’s the level TRG had in 1998-2005 during its
turnaround. The stock would sll be able to pay a dividend yield of around 4% on
today’s price. And the expansion in the earnings mulple from today’s low level to
what we think would be a fair level (a P/E of 15) for a decent restaurant chain
would add close to 6% a year to your total return. In fact, we’d expect your total
return in the stock to be 9% to 10% a year even without any net cumulave same
store sales growth between 2016 and 2021 if TRG could manage to keep its margin
at 10%. In other words, if TRG’s prots per store decline by 20% to 25% between
2016 and 2021, we sll think you could make almost 10% a year buying the stock
and holding it through 2021. Obviously, this return would be a pure “value” stock
return. You’d get a dividend yield of about 4% a year. And you’d get earnings
mulple expansion from today’s P/E of about 8 to a future P/E of about 15. There’s
a simpler way of looking at this. Right now, TRG is a value stock. It has a dividend
SINGULAR DILIGENCE 18
TRG trades at a 50% discount to publicly traded U.S. peers like the owner
of Outback Steakhouse (Bloomin) and Chili’s (Brinker).

yield of about 5.4%. Let’s call that 5%.
And it has an EV/EBITDA of about 5.
Historically, acquisions of U.K.
restaurant chains have been done at
around 10 mes EBITDA. Assume you
buy TRG stock today and hold it for 5
years. Then assume the company goes
private or is otherwise acquired at 10
mes EBITDA. If the stock had stagnant
EBITDA between now and 2021, you’d
sll earn close to 20% a year over your
5 years holding the stock. That’s
because the dividend yield is 5% and
because a mulple expansion from 5 to
10 completed in 5 years requires a
compound capital gain of 15% per year.
Should you expect a 20% annual return
in TRG? Absolutely not. For one, TRG
won’t pay as high a dividend in the
future as it did in the past if the
company’s earnings decline. It’s only
safe to assume the same payout rao.
Not the same dividend level. Secondly,
those restaurant chain acquisions
done at 10 mes EBITDA were during a
period of very low interest rates and
very high stock prices. Stocks could be
cheaper in the future. And restaurant
chain acquisions in the U.K. could
tend to be done at a much lower
mulple. Let’s assume TRG can’t pay a
dividend yield of 5% a year. Instead, it
cuts the payout by about 20%. So, you
get a dividend yield of just 4% on your
purchase price. And let’s further
assume that restaurant acquisions in
the U.K. are done at 7 mes EBITDA
instead of 10 mes EBITDA. TRG now
trades at 5 mes EBITDA. So, it would
need to increase in price by 7% a year
between now and 2021 to trade at 7
mes EBITDA even if it has a stagnant
EBITDA level. That 7% annual price
appreciaon plus the 4% dividend yield
would give you an 11% annual return
over a 5 year holding period. I think
that’s a good “base case” for buying
TRG stock. It now pays a dividend yield
of more than 5%. You ancipate geng
a dividend yield between 2017 and
2021 of about 4% on your purchase
price. It now trades at 5 mes EBITDA.
You expect the stock to trade at 7 mes
EBITDA when you sell it. You’re willing
to hold the stock for 5 years. That gets
you to a scenario where you can make 10% a year even if the company doesn’t
increase its earnings. That’s the denion of a value stock. You can hold it for 5
years. It doesn’t have to grow. And you can sll make 10% a year. That’s value
invesng. I personally think TRG has more growth potenal than most value stocks.
I can see the company expanding Frankie & Benny’s, Chiquito, and maybe Coast to
Coast to a lot more locaons over the next 10 years. I don’t know if that progress
will stall because of problems with the chains or problems with the U.K. economy.
But, I think you can buy TRG as a value stock and expect a 10% a year annual return
while knowing it might turn out to be a growth stock that delivers a return more
like 15% to 20% a year. In either case, you need to go in to the stock planning to
hold it through 2021. Restaurant stocks have extreme price swings depending on
their very recent same store sales trends. A stock with a negave 2% same store
sales trend can have a P/E under 10 while the same stock in a year with posive 2%
same store sales can have a P/E over 20. This is obvious advice. But, don’t sell the
stock when it has a P/E of 10 and same store sales are down 2%. Sell the stock
when it has a P/E of 20 and same store sales are up 2%. Of course, this means you
need to have faith in a year when same store sales are down that they will one day
be up again. That faith is crical to any restaurant stock investment. If you don’t
think you can hold a restaurant stock while same store sales are down and geng
worse – you can’t buy a restaurant stock in the rst place. If you can handle seeing
bad same store sales trends and you have the paence to hold a stock for 5 years,
Quan and I think TRG is your best investment choice for 2016 so far.
SINGULAR DILIGENCE 19

Price-to-Appraisal: 47%
SINGULAR DILIGENCE 20

Geo Gannon, Writer
Geo is a writer, blogger, podcaster, and interviewer. He has wrien hundreds of
arcles for Seeking Alpha and GuruFocus. He hosted the Gannon On Invesng
Podcast, The Investor Quesons Podcast, and The Investor Quesons Podcast
Interview Series. He wrote the Gannon On Invesng newsleer in 2006 and two
GuruFocus newsleers from 2010-2012. In 2013, he co-founded The Avid Hog
(the predecessor to Singular Diligence) with Quan Hoang. Geo has been blogging
at Gannon On Invesng since 2005.
Quan Hoang, Analyst
Quan is a stock analyst. Quan won rst prize in Vietnam’s Naonal Olympiad in
Informacs in 2006. He graduated from Manhaanville College in 2012 with a B.A.
in nance and a minor in math. In 2013, Quan co-founded The Avid Hog (the
predecessor to Singular Diligence) with Geo Gannon.
Tobias Carlisle, Publisher
Tobias Carlisle is the founder and managing director of Eyquem Investment
Management LLC, and serves as porolio manager of the Eyquem Fund LP and the
separately managed accounts.
He is best known as the author of the well regarded website Greenbackd, the
book Deep Value: Why Acvists Investors and Other Contrarians Bale for
Control of Losing Corporaons (2014, Wiley Finance), and Quantave Value: a
Praconer’s Guide to Automang Intelligent Investment and Eliminang
Behavioral Errors (2012, Wiley Finance). He has extensive experience in
investment management, business valuaon, public company corporate
governance, and corporate law.
Prior to founding Eyquem in 2010, Tobias was an analyst at an acvist hedge fund,
general counsel of a company listed on the Australian Stock Exchange, and a
corporate advisory lawyer. As a lawyer specializing in mergers and acquisions he
has advised on transacons across a variety of industries in the United States, the
United Kingdom, China, Australia, Singapore, Bermuda, Papua New Guinea, New
Zealand, and Guam. He is a graduate of the University of Queensland in Australia
with degrees in Law (2001) and Business Management (1999).
ABOUT THE TEAM
SINGULAR DILIGENCE 21
NOTES
The Restaurant Group
London: RTN
SINGULAR DILIGENCE 22

N1
Overview
The Restaurant Group: a Giant Casual Dining Group with a Focus on Niche
Locations
85% of TRG’s restaurants are in leisure and retail parks or concession areas
- TRG was originally founded in 1987
o As City Centre Restaurant plc.
o With the objective of owning and managing the Garfunkel’s restaurant chain
Garfunkel’s is a casual family restaurant
Similar to Denny’s
Garfunkel’s operated in
1
Airports
Prime tourist locations in London
o Feeding off tourists and cinema-goers
- Over the year, City Centre acquired and developed new brands
o Acquired the Mexican chain Chi chi’s
In 1989
Renamed the chain as Chiquito
o City Centre’s greatest development was Frankie & Benny’s
Opened the first restaurant in 1995
Frankie & Benny’s is an nostalgic American dinner chain
Themed to reflect the 1950s Italian-American backstory
- City Centre had a structure that promote development of new brands
2
F&B
52%
Chiquito
17%
Coast to
Coast
4%
Concessions
12%
Pub
Restaurants
11%
Others
4%
N2
o Citi Centre gave generous autonomy to its divisional leaders
Quickly scrapped unsuccessfully test launches
Rolled out those that earn good ROI just as quickly
o Maintained minimal corporate management staff
Financial staff
40 accountants, payroll clerks and purchasing managers
A human-resources director
Set policy
But doesn’t handle hiring or recruiting
A corporate chef
Barbara Eggar
o A American-born graduate of The Culinary Institute of
America
Gets involved in the development of new concepts
But leaves day-to-day menu management to the executive chef
at each of the chains
o Central office was almost like a bank or an investor
Finance is the only area where brands have no latitude
o The company appointed a “champion” to spearhead the development of a
prototype
For the so-called embryo concept (2)
The concept champion shares office space with one of other brands
Until the concept proves viable
o => has 2 or 3 units open
=> the champion finds and staffs his own office
- By late 1990s, City Centre owned a bunch of brands
3
o Garfunkel’s
o Chiquito
o Frankie & Benny
o Caffé Uno
Casual Italian eateries
Rustic “Tuscany farmhouse” décor
A menu boasting made-from-scratch dishes
o Deep Pan Pizza
A sit-down pizza restaurant
Compete head-to-head against Pizza Hut
o Wok Wok
N3
Offers a menu of house-made noodles
And other made from-scratch Asian dishes
o Est Est Est
A high-end Italian chain
With a light, exposed-steel décor
Operating in affluent communities in northern England
o Nachos Mexican Bar & Restaurant
Old-fashioned neighborhood cantinas
Selling burritos, enchiladas and other basic Mexican fare
o O K Diner
1940s-style American diners
Offering burgers, hot dogs and other typical diner fare
- Then came problems
o Its biggest brand Deep Pan Pizza underperformed
o Other high street brands struggled
o Analysts criticized City Centre for
Having too many brands
Operating in too many markets
o James Naylor resigned as CEO
In 03 October 2000
Andrew Guy was promoted to CEO
- In March 2001, Alan Jackson was appointed as Executive Chairman
o Andrew Page joined two months later
As Finance director
- The new management refocused the business
o Sold underperforming brands
Deep Pan Pizza
O K Diners
Wok Wok
o Focus on business segments with 3 key characteristics
4
High return on capital
Good growth prospects
Barrier to entry
o They found two best performing segments that meet these criteria
Leisure Parks
Restaurants operate in out-of-town leisure parks
o Frankie & Benny’s
N4
o Chiquito
Concessions
Operates at U.K. airports
o They kept well-performing High Street brands
Garfunkel’s
Caffé Uno
Est Est Est
These are cash cow
But they let the business shrink overtime
Sold Est Est Est
o In March 2005
Sold Caffé Uno
o In November 2005
The number of Garfunkel’s declined
o 2001: 33 locations
o 2006: 29 locations
o 2011: 23 locations
o 2015: 13 locations
- The company was renamed as The Restaurant Group
o In 2004
- The sale of Caffé Uno basically signal the end of TRG’s High Street presence
o In 2005
- TRG also made two small acquisitions to enter the pub business
o Blubeckers
5
In June 2005
Paid £27 million
A chain of 12 family-oriented pub-restaurants
Operates in semi-rural locations
These pub-restaurants are a drive-to destination
Within easy reach of large urban populations
TRG planned to expand by taking leases on existing pubs
From large pubcos such as
o Punch
o Enterprise
o Brunning & Price
6
In October 2007
Paid £32 million
N5
12 quality pubs
Most sites are in rural or semi-rural locations
5 are freeholds
B&P’s sales: £18 million
Pre-tax profit: £1.2 million
B&P pubs have a more relaxed feel compared with Blubeckers
B&P’s pubs aren’t branded
But share a similar type of fit out and operating style
High quality food
o Won the Good Pub Guide’s Food Pub of the Year for the
3rd time
In 2007
Attract a regular and loyal customer base
- TRG focused its growth on
o Leisure and retail parks
o Concessions
o Rural and semi-rural pub-restaurants
- TRG’s strategy paid off
o TRG benefit from controlled supply in its locations
Construction and extension of leisure and retail parks are difficult
Due to restrictive planning law
o This allowed TRG make high ROIC
EBIDA margin: 19%
EBIT/NTA: 31%
o Since 2002
Sales CAGR: 9.28%
2002: £216 million
2015: £685 million
EBITDA CAGR: 11%
2002: £34 million
2015: £133 million
While TRG return more than 50% of earnings in dividends
- Today, TRG has
o 506 restaurants
Frankie & Benny’s: 261 (F&B)
Chiquito: 86
Coast to Coast: 21
N6
Garfunkel’s: 13
Joe Kitchen: 3
Pub restaurants: 54
Concessions + fillings: 68
o F&B offers traditional home-style dishes from Little Italy
7
Combined with popular American dishes
Provides value for money
Cozy booth
Casual family meal
Or a catch up with friends
Restaurant walls are filled with family snapshots
And memorabilia showing life on the lowest side of the Big Apple
o Helping you into a “New York state-of-mind”
o Chiquito
8
Fun, amazing atmosphere
Fantastic food
Décor draws inspiration from Mexican architecture and Latin style
The menu offers traditional Mexican
Open 7 days for
Lunch
Lazy afternoons
Lively evenings
Attract a broad mix of
Young adults
Couples
Teenagers
Families
Large parties
o Coast to coast
Coast to Coast takes its inspiration from the Lincoln High way
9
Spans the U.S. from New York to San Francisco
Great range of authentic food and drinks
o Best of classic American food
Aberdeen Angus beef burger
Deep dish style Chicago pizzas
Distinctive steaks
Etc.
N7
A great bar serving specialty cocktails
Wide range of beers, spirits and traditional milkshakes
Music is an eclectic mix of
o Motown
o American rock
Customers are guarantee to lift their spirits
Coast to Coast has similar menu to F&B or TGI Friday’s
10
o Pubs
11
An ideal place for people who like to get together
Eat
Drink
Talk
In a relaxed friendly atmosphere
Each pub has its own style and personality
Mostly in beautiful rural or semi-rural locations
Has local feel
Set in intriguing buildings with fascinating histories
o Preserve the character of the buildings
o Frankie & Benny’s, Chiquito, and Coast to Coast are usually found in leisure
retail parks
Leisure and retail parks usually feature
Cinemas
Family lifestyle offers
o Bowling
Many times they’re in the same leisure/retail parks
Restaurants are about 3,000-4,000 square feet in size
140-150 seats
Average check:
Frankie & Benny’s: £15-17
Chiquito: £15.5
Coast to Coast: £16.75
- TRG target 850-950 locations
o In the next 8-10 years
o At this rate, TRG can easily double its revenue

N8
1
“If you thought The Restaurant Group, owner of the Garfunkel's chain, was a high
street operator, then think again.
Okay, so the 237-strong company still operates 30 Garfunkel's outlets. But the
evergreen brand - founded in the 1979 - remains a predominantly central London
affair, feeding off tourists and cinema-goers in the city's West End. "It's very
much a cash cow," explains TRG property director Kieran Pitcher, who joined the
group late last year from the Laurel Pub Co. "There would be no sense in exiting that
because it's a profitable business."
Despite that, TRG's focus has been slowly shifting away from the high street for the
past four years. The shift was underlined in March 2005 when the 17-strong Est Est Est
chain was sold to bar group Living Ventures for £16.401. But it was the sale in
November of the 53-strong Caffé Uno brand to Paramount Restaurants, owner of Chez
Gérard, for £33m, that effectively signalled the end of TRG's high street representation,
and in particular a move away from the crowded high street pizza and pasta market.” –
Beyond the High Street, David Shrimpton, The Estates Gazette, 18 March 2006
2
“City Centre's success in developing new concepts has been a direct result of its
decentralized management style, according to Guy. The company awards generous
autonomy to its divisional leaders, quickly scraps unsuccessful test launches
and just as quickly rolls out those that earn a good return on investment.
…
One of the cornerstones of the company's growth strategy is to channel new
brands continually into the market in a never-ending gamble to win consumers'
favor.
"We truly believe failure is the price of success," Guy said. He cited as an example the
company's recent effort to launch an Indian-menu restaurant, which was shuttered after
only eight weeks when it did not meet sales projections.
"I really believe a well-intentioned failure is better than not taking a risk," he said.
City Centre maintains a minimal corporate management staff, pushing
responsibility for development, operations and marketing onto each of its
divisions.
"The one thing that is central is finance," Guy said. "Each of the divisions has a
lot of accountability - we have very tight financial controls. That is the only area
where they have no latitude. Other than that they have a lot of leeway as to how
they run their concepts."

N9
Guy described the central office as being "almost like a bank or an investor" in
each of the brands.
In addition to the centralized financial staff, which includes about 40 accountants,
payroll clerks and purchasing managers, City Centre has a human-resources director,
who sets policy but does not handle hiring or recruiting, and a corporate chef, who gets
involved in the development of new concepts but leaves day-to-day menu management
to the executive chef at each of the chains.
The corporate chef, Barbara Eggar, is an American-born graduate of The Culinary
Institute of America. Her background in Southern California style cuisine brings an
emphasis on the use of fresh ingredients and made-from scratch menu items to the
company, Guy said.
As an idea evolves for a new restaurant brand, the company appoints a
"champion" to spearhead the development of a prototype for the so-called
embryo concept. The concept champion shares office space with one of the
company's other brands until the brand proves viable and has two to three units open,
at which point the director finds and staffs his or her own office.
The brand leaders are reassigned to other posts if their concepts do not prove viable,
according to Guy.” – City Centre Restaurants Thrive on Decentralized Management
Structure, Nation’s Restaurants News, 23 March 1998
3
“Included among the strongest brands in City Centre's portfolio are the following:
* Garfunkel's, a 40-unit chain -- including 12 airport locations -- which Guy described as
being "similar to a Denny's" with an all-day breakfast menu and an all-you-can-eat
salad bar.
* Chiquito Restaurant & Bar, a 22-unit chain of Tex-Mex eateries specializing in
oversized margaritas.
* Caffe Uno, a 50-unit chain of casual Italian eateries with a rustic "Tuscany farmhouse"
decor and a menu boasting made-from-scratch dishes.
* Frankie & Benny's, a fast-growing, midpriced Italian chain featuring a "1950s Little
Italy" ambience and a fun menu that plays off its fictional namesake characters.
* Est Est Est, a high-end Italian chain with a light, exposed-steel decor operating in
affluent communities in northern England.

N10
* Nachos Mexican Bar & Restaurant, a six-unit chain of old-fashioned neighborhood
cantinas selling burritos, enchiladas and other basic Mexican fare and generating about
40 percent of its sales from the bar.
* Deep Pan Pizza Co., a 90unit chain of sit-down pizza restaurants that pits its
panpizza offerings head-to-head against Pizza Hut.
* OK Diner, a 20-unit chain of 1940s-style American diners offering burgers, hot dogs
and other typical diner fare.
Included in the company's "embryonic" category are three experimental concepts,
including FoodWorld, Fraternity House and Cafe Metro, a gourmet-coffee concept.” –
City Centre Restaurants Thrive on Decentralized Management Structure, Nation’s
Restaurants News, 23 March 1998
4
“We have also focused considerable effort on the future shape of the Group and have
developed a strategy for growth which will focus on those business segments
which display the following three key characteristics:
• High returns on capital
• Good growth prospects
• Barriers to entry
Our two best performing business segments Leisure Parks and Concessions
display all of these three key characteristics and are segments where we have been
able to leverage our core competencies. We intend to focus our development efforts
in these areas and gradually to reduce the Company's dependency on High
Street restaurants. Consequently we have also decided to disclose our results under
the following three principal categories: Leisure Parks; Concessions; and High Street
Restaurants.” – City Centre 2001 Annual Report
5
“TRG bought the 12-strong Blubeckers chain from Cl Traders of the Channel Islands
for £27m last June. The acquisition forms another aspect of TRG's flight from the
high street, this time into family-oriented pub-restaurants in semi-rural locations.
"They're very much a drive-to destination, within easy reach of large urban
populations," says Pitcher. TRG is looking to expand by taking leases on existing
pubs from large pubcos such as Punch and Enterprise. However, it is not looking
to expand sister brand Edwinns, a more upmarket food offering that trades from five
sites.” – Beyond the High Street, David Shrimpton, The Estates Gazette, 18 March
2006

N11
6
“Following the acquisition of Brunning & Price ('B&P'), we added a further 14 new pub
restaurants to our portfolio. We are delighted with the performance of the B&P pub
restaurants since the acquisition and we intend to grow the business. The B&P pub
restaurants have a more relaxed feel compared with Blubeckers. Although B&P's
pubs are not branded they all share a similar type of fit out and operating style.
The quality of food is high B&P won the Good Pub Guide's Food Pub of the Year
Award for the third time in 2007 and they attract a regular and loyal customer
base. We are delighted to have retained all of the operational management team at
Brunning & Price. It is an experienced, talented and successful team and we look
forward to working with the team to further develop and grow our Pub Restaurant
business.
During 2008 we are expecting to open a total of 5-10 new pub restaurants and,
Longer-term, the Pub Restaurant business has the potential to become a
significant part of the Group.” – TRG 2007 Annual Report
7
“Frankie & Benny’s brings together the best of classic American and Italian style
and cuisine, offering traditional home-style dishes from Little Italy combined with
popular American dishes that always provide great value for money.
The kitchen buzzes with bustling activity as the chefs prepare dishes from our broad
menu – pizza, pastas, burgers, grills and other favourites while, in typical stateside
fashion, service at Frankie & Benny’s is second to none!
Settle into a cosy booth to enjoy delicious, perfectly cooked and filling food while
enjoying a casual family meal or a catch up with friends and observe the clatter
and chatter of the open kitchen and the familiar classic 50’s and 60’s soundtrack
playing in the background. The restaurant walls are filled with family snapshots and
memorabilia showing life on the lower east side of the Big Apple, helping you into a
“New York state-of-mind”.
Frankie & Benny’s provides a fun and friendly atmosphere for all to enjoy delivering
fantastic value, great food and brilliant service.
First opened in 1995 in Leicester, Frankie & Benny’s has become one of the best
known casual dining brands in the United Kingdom, and trades successfully in
leisure and retail locations, stand-alone sites and at five airports. The estate
comprises almost 200 restaurants spread across the country from Aberdeen to St
Austell.” – TRG 2009 Annual Report
8
“Mexican for fun, for fantastic food, for an amazing atmosphere – for a good
time, guaranteed.
N12
Chiquito offers great value, authentic Mexican food in a fun and lively venue, with
fantastic Latin American music. What more do you need for a great night out? The
décor draws inspiration from Mexican architecture and Latin style. Some sites have
a rustic and relaxed feel while others demonstrate the buzz and graphic energy
of contemporary Mexico City.
The menu offers traditional Mexican, including nachos, burritos, enchiladas and
our signature sizzling fajitas, as well as favourites from “North of the Border” –
burgers, salads and steaks from the grill. We specialise in Mexican beer and fantastic
cocktails to ensure every meal is a fiesta.
Chiquito is open seven days a week for lunch, lazy afternoons and lively
evenings, so whether you’re out shopping, meeting friends after work or
planning a party it’s the only place to be!
Trading in the UK for over 20 years, Chiquito continues to attract a broad mix of young
adults, couples, teenagers, families and large parties. More than 60 leisure, retail and
stand-alone sites cover the United Kingdom with more development planned for the
years ahead.” – TRG 2009 Annual Report
9
“Coast to Coast takes its inspiration from the Lincoln Highway, which spans the
United States of America from New York to San Francisco. This is reflected in our
great range of authentic food and drinks, all served with superb hospitality and service.
We offer the best of classic American food – Aberdeen Angus beef burgers, deep
dish style Chicago pizzas, distinctive steaks, amazing seafood dishes, wraps and
South-West American specials. Coast to Coast is more than just a restaurant, with
a great bar serving speciality cocktails and a wide range of beers, spirits and
traditional milkshakes. The music is an eclectic mix of Motown and American
Rock, songs you may not have heard in a little while, but are absolutely
guaranteed to lift your spirits and make you smile. We currently have five
restaurants open and see significant opportunities to grow Coast to Coast into a great
brand.” – TRG 2012 Annual Report
10
One customer reviewed in Tripadvisor: “A large group of us pounced on Coast to
Coast one night, some of us had already dined there before and reported back good
things, for me it was my first time there and probably not my last.
First things first, Coast is an alternative to Frankie & Benny's and TGI, they
practically serve the same menu - pizzas, steaks, ribs, if you've been to any if the
American themed/styled franchises then you will probably know what to expect
menu-wise. However, it is a pretty good alternative.
N13
Drinks are eye wateringly expensive, but then they always are in these types of
restaurants, and food is of a similar price and quality to its competitors. Between
us we had various starters covering much of what was available - prawns, mushrooms,
platters, chowder, wings, all of it very good and what you expect.
The mains were similarly good, and between us we had steaks, burgers, wraps, pizza,
again no nonsense food and nothing to complain about. There just isn't anything to
distinguish it from the other restaurants mentioned.
I have to mention that our main waiter was tremendous, always within earshot and
bringing our drinks mere seconds after we ordered them throughout the meal.
Very good venue, just don't expect anything wildly different to the other two
restaurants.”
11
“Really great pubs are timeless, familiar and very British. Everybody knows what
their perfect pub looks like. For us it’s an ideal place for people who like to get
together, eat, drink and talk in a relaxed friendly atmosphere.
Each of our pubs has its own style and personality, and you’ll always find a warm
welcome, ageless interiors, fine British pub food, a large variety of great real ales and
fine wine and great coffee.
Mostly set in beautiful rural or semi-rural locations, each pub has a ‘local’ feel
and many are set in intriguing buildings with fascinating histories. We don’t want
all our pubs to look and feel the same – instead we preserve the character of the
building, which after all was what attracted us to the pub in the first place.
We open all day, and you can pop in for a fresh coffee, a pint of real ale, glass of
wine or some honest home cooking at any time. The range of beers available
changes frequently and seasonal and local specials mean the menu also offers new
choices alongside trusted favourites each time you visit.
There’s friendly, engaging service from the moment you arrive, ensuring that all your
needs are taken care of. We hire people who genuinely like people and enjoy “being
there” for our customers, and have the flair to operate their own business within our
Group.
We believe that really great pubs will never go out of fashion, and that
opportunities to expand in the sector are available for experienced operators
with the right offer for customers. In 2007 The Restaurant Group bought Brunning &
Price, an award winning pub business. By blending the expertise that Brunning & Price
N14
brings with our own resources, ideas and experience, we will develop our pubs
business and aim to open three or four new sites a year going forward.” – TRG 2009
Annual Report

N15
Durability
Restaurant Chains Can Adapt to Stay Relevant
TRG’s like-for-like growth averaged 2.4% over the last 14 years
- Biggest Negative: Chains can go out of favor
- 2 factors can hurt a restaurants
o Outdated location
o Outdated concept
- TRG focuses on locations with favorable secular trend
o TRG focuses mostly on retail and leisure parks
o Retail parks have evolved
Historically, retail parks were large out-of-town locations
1
Contained big box retailers
o Furniture stores
o Home improvement stores
o Garden centers
o Supermarkets
Leasing these spaces is significantly less expensive than in
o Shopping center, or
(Shopping center is like in-door mall)
o High street
Retail parks weren’t aesthetically pleasing
But was a convenient location
3.0%
5.0%
3.0%
5.0%
5.5%
1.5%
-2.0%
-1.0%
3.3%
4.5%
3.5%
2.8%
1.5%
-1.5%
2003 2004 2005 2006 2007 2008 2009 2010 2011 2012 2013 2014 2015 2016
Like-for-like sales growth
N16
o Large amount of parking
Retail parks started attracting high street retailers and leisure operators
2
For cheaper rent
Increased floor space
o Marks and Spencer and Next could display their entire
offering
Food
Clothes
Furniture
Home ware
o The Arcadia Group could house all their brands under one
roof
Topshop
Dorothy Perkins
Topman
Burton
Retail parks transformed into a softer environment, filled with
3
Home wares
Fashion retailers
Improved leisure provision
o Common fixtures
Restaurants
Cinemas
Gyms
=> Customers can now browse and eat
Leisure and restaurants help
4
o Increase dwell time
o Extend trading hours
o Increase traffic
=> Benefit other retailers
o Making retail parks even more attractive to retailers
Example:
Consumers spend about 48% more on retail goods
o If they use the catering facilities in out-of-town parks
At Glasgow Fort scheme
o After the expansion of the leisure
Footfall grew 8%
N17
Retail sales grew 6%
Leisure spend grew 35%
Average customer spend on leisure is £22 per
person
o Out-of-town locations for leisure work for the same reasons as for retailing
5
Accessible locations
Free parking
Managed environments
o Retail parks make out-of-home dining and socializing
6
Easy
Attractive
Affordable
o This is especially true for TRG’s target customers
7
Families or
Couples
o The strength of retail parks made TRG resilient during the Great Recession
Same store sales declined only
2% in 2009
1% in 2010
TRG was the only listed restaurant group to increase earnings in 2009
8
o Recent data reflect the trend
9
Retail footfall in the U.K. was down by 1.1%
In February 2016
High street footfall declined by 2.9%
Shopping centers declined 0.6%
Retail parks: increase 2.5%
As a result of additional attractions
o Restaurants
o Entertainment
Customer footfall in the evening increased 0.2%
o E-commerce may hurt retail-only retail parks
10
Only 20% of TRG’s restaurants are in retail-only retail parks
These parks may add leisure operators overtime
- Restaurant chains are durable
o Chains have shown the ability to adapt
Can change menu or in-store atmosphere to stay relevant
N18
Rolling out winning formula to existing restaurants is easier and faster
than opening new restaurants with that formula
Existing restaurants already have visibility
o Just need to get the new message out
While not alienating current customers
o Example:
o Chiquito
Underperforming in early 2000s
Chiquito’s like-for-like sales declined 5.3% in 2003
TRG changed Chiquito management
Revamps its menu
Refresh the store format
o Refurbished 1/3 of the “garish” Mexican-themed sites
o Move away from a “let’s-go-out-and-get-pissed-on-
slammers” clientele
Towards the family market
=> Chiquito’s like-for-like sales grew 5.8% in 2004
o Greggs
Over 90% of Greggs stores were on high streets
Greggs also faced competition from supermarket in traditional bakery
Like-for-like sales declined
2012: -2.7%
2013: -0.8%
Greggs even has the stigma of selling unhealthy foods
Greggs transformed into a food-on-the-go chain
Started opening stores away from high street
o Retail parks
o Bus terminal
o Train stations
o Industrial estates
o Where people are at
Work
Travel
Leisure
Greggs refitted its stores
o Removed things like bread slicer or bread ovens
o Add seating to the stores
N19
Revamped its menu
o Added “healthy sandwich” range
o Relies less on traditional bakery products
Sandwich: 1/3 of revenue
Savory: 1/3 of revenue
Drinks: 1/6 of revenue
Result:
Same store sales grew again
o 2014: 4.5%
o 2015: 4.7%
Share price more than doubled to 1,000-1,200 pence per share
o From less than 500 pence per share in 2012-2014
P/E increased
o From 10-13
o To 18-20
o Brinker
Brinkers faced challenges in 1990s
11
Chili’s comparable sales fell for 7 quarters
o (570 restaurants)
o From October 1994 to June 1996
The menu had grown tired
Chili’s overhauled its menu and its advertising
And sales grew again
o TGI Friday
12
In 1990s, TGI was able to keep pace with the aging baby boomer crowd
These customers once frequented its singles-oriented bars
o They then brought their kids in for food
Described as “familiar with a twist”
In a more family-oriented atmosphere
TGI upscaled its core concept
o More upscale choices are being added
Friday’s Jack Daniel’s Grill
Combines steak, chicken or salmon with a
bourbon sauce
Chophouse Classics:
Same protein portions served with an onion-
based sauce

N20
On sizzling platters
o Began setting up shop in nontraditional locations
Airports
Food courts
Stadiums
1
“Historically, Retail Parks were large out of town locations that contained big box
retailers – furniture stores, home improvement stores, garden centres,
supermarkets – ideal due to the size of the stores on offer and the fact that leasing
these spaces is significantly less expensive than it would be in a Shopping Centre.
They were never the most aesthetically pleasing of places – but they didn’t need to
be. They served a purpose, and their purpose was a convenient location to house
large stores, which catered to the side of retail that didn’t work as well in other
locations. The out of town aspect meant there was a large amount of parking which
was suitable for the products on sale and customers could go and get what they
needed relatively hassle-free.” – Retail Park Evolution,
http://www.foundationrecruitment.co.uk/news/retail-park-evolution/
2
“With the rise of the Internet it was increasingly less necessary for people to travel to
get the sort of products on offer at Retail Parks – customers could compare prices
online and they could get large items delivered. Unlike Shopping Centres, Retail
Parks were not designed for people to ‘browse’ – they were designed for people
to stop off in the car, get what they needed and leave. If they wanted a day out
shopping they would visit a Shopping Centre where there would be a large retail
mix and a leisure offering. Retail Parks still held a purpose, however they were losing
their USP and with that the grasp of their customer base as more options became
available to them.
So they started to evolve – high street retailers and leisure companies saw the
appeal of expanding their portfolios into Retail Parks, enticed by the cheaper rent
and the increased floor space.
Retailers like Marks and Spencer and Next could display their entire offering;
food, clothes, furniture, home ware. The Arcadia group could house all their brands
under one roof – OUTFIT is a fixture at a large number of Retail Parks and carries
Topshop, Dorothy Perkins, Topman, Burton. All of which had huge benefits to the
brands, but also the consumer.

N21
Other fixtures now prevalent are cinemas, gyms and restaurants – with well-
known brands such as Frankie and Bennies and Nandos being regularly available
at a number of schemes. A huge improvement on what Retail Parks were previously –
customers could still visit and purchase things they couldn’t get else where, but,
like at a Shopping Centre, they could also browse, eat and had now had reason
to ‘dwell’.” – Retail Park Evolution, http://www.foundationrecruitment.co.uk/news/retail-
park-evolution/
3
“Retail park sales growth has eclipsed in-town performance and has encouraged
more leisure operators to expand their out-of-town locations.
Few shoppers now find themselves at a retail park with little more than a burger van,
although it wasn't so long ago that a hot cup of tea and a chip butty passed for
the food and beverage provision at many out-of-town sites.
The transformation from locations selling bulky goods to a softer environment
filled with homewares and fashion retailers has helped the leisure provision
improve at most retail parks. Restaurants, cinemas and even gyms are now
common fixtures.” – Out-of-town Locations Top the Charts for Retailers, Retail Week,
22 February 2013
4
“Retail just can’t get enough of leisure. For landlords it’s the sector’s vitality during the
downturn and the raft of expansionist operators that are springing up; for retailers,
leisure potentially extends trading hours, increases footfall and improves dwell
times. Not every retailer is sold, but most are.
It’s a trend firmly established in out-of-town parks and the increasingly complementary
nature of retail and leisure was underlined in the latest analysis by data intelligence
specialist CACI. Based on 170,000 exit interviews with shoppers in more than 100
retail centres across the UK as part of its annual Shopper Dimensions report,
CACI’s research showed that consumers who use the catering facilities spend
approximately 48% more on retail goods than those who do not.
The findings also indicated a positive shift upwards – the average spend on catering
increased 9% between 2012 and 2013. Plus, the growth in restaurant spend
outpaced the outlay in cafes and fast-food restaurants.
…
The findings support research carried out by British Land at its recently leisure-
extended Glasgow Fort scheme. “Since the expansion of the leisure, footfall is up
8%, retail sales are up 6% and leisure spend is up 35%. Average customer spend
on leisure is £22 per person,” says John Maddison, head of retail warehouse asset

N22
management at British Land. “If any retailers were not convinced by the benefits of
leisure, these figures make a very compelling argument.”” – The Increasingly
Complementary Nature of Retail and Leisure, Mark Faithfull, Retail Week, 30 April 2014
5
“Not surprisingly then, out-of-town parks are adding leisure facilities at full throttle –
expanding their food and beverage offers, putting in drive-thru coffee shops and
extending into new areas including gyms, cinemas and family lifestyle offers such as
bowling.
Out-of-town locations for leisure work for largely the same reasons as retailing –
consumers want accessible locations, free parking and managed environments,
while landlords want relatively cheap development and the potential to produce rental
uplift across a park, plus long leases.” – The Increasingly Complementary Nature of
Retail and Leisure, Mark Faithfull, Retail Week, 30 April 2014
6
“Diana Wehrle, marketing and insights director at Springboard, said the
disproportionately large fall in high street shopping traffic was down to “the tough retail
trading environment”, which has led to shops competing on price to capture customers’
disposable income.
She said the simultaneous increase seen in retail parks, which tend to feature larger,
warehouse-style outlets, reflected demand for furniture and household goods.
She also identified a shift towards shopping in the evening, with customer footfall in
February showing a 0.2% increase in the evening, compared with a 3.9% fall during
daytime hours.
Retail parks were able to poach customers from the high street, she said, by
“providing the right environments and price points to make out-of-home dining
and socialising easy, attractive and affordable”.” – UK High Street Struggles in
February as Shoppers Head for Retail Parks, Rob Davies, The Guardian, 14 March
2016
7
“"The high street became just too competitive as a trading environment," says Pitcher.
"We had reached saturation point in most provincial locations." An added problem, says
Ben Page, head of property acquisitions for TRG, was that many high streets had
been gaining a reputation as late-night binge drinking locations. "It was not a
particularly attractive place to be. It wasn't appealing to our core customer base,
which is the family market. They prefer a secure environment, out of the town
centre, where there's easy access and it's easy to park."

N23
And where its customers are heading, TRG is following. It is now focusing on two
areas: out-of-town leisure and retail parks, and concession-based outlets in airports
and shopping centres. "They are delivering higher levels of growth and they have
higher barriers to entry," explains Pitcher.” – Beyond the High Street, David Shrimpton,
The Estates Gazette, 18 March, 2006
8
“TRG was the only listed restaurant group to increase earnings in 2009. Yet this
does not appear to be reflected in its rating. The shares are trading on about 11.4
times 2010 pre-tax profit of 49.6m, compared with Clapham House's 16.9 times or
Carluccio's' 16.5 times. One reason could be that in terms of brand TRG appears
less racy than its high street rivals. But investors ignore TRG at their peril. The
current year has started well and with the group likely to pay off all its debt in three
years or expand, it is well positioned to create further value.” – Blockbuster Films Help
TRG Defy Recession, Kwan Yuk Pan, Financial Times, 03 March 2010
9
“Shoppers are deserting the high street in favour of purpose-built retail parks,
according to figures that underline tough conditions for retailers.
Total retail footfall in the UK was down by 1.1% in February, according to figures
from the data analysts Springboard and the British Retail Consortium.
The bulk of the decline was down to a fall-off in visits to the high street, which
were 2.9% lower than the same month in 2015.
Shopping centres also welcomed fewer visitors, down 0.6%, but retail parks
reported an increase of 2.5%, partly as a result of additional attractions such as
restaurants and entertainment.” – UK High Street Struggles in February as Shoppers
Head for Retail Parks, Rob Davies, The Guardian, 14 March 2016
10
“Many of its restaurants are located in shopping parks. Mr Breithaupt acknowledged
that about 20pc of its sites are essentially "retail-only" and so have been hit by
falling footfall at shops.
"One of the things that's probably driving that is internet shopping and home
deliveries getting better and faster," he said. "We'll look very carefully about
opening on retail-only sites."
Recent consumer industry data have suggested the looming vote on Britain's
membership of the European Union is affecting consumer confidence, the Restaurant
Group boss added.
N24
The recent fall in like-for-like revenues was also partly due to the company's
expansion plan, he argued, which has resulted in new sites cannibalising
customers from the more established locations.” – Frankie & Benny’s Seen as Bid
Target after It Warns of Tough Trading, Ben Martin, Daily Telegraph, 10 March 2016
11
“For its part, Brinker has struggled to revive several concepts that had gone
stale. Comparable-store sales at Chili's, with 570 restaurants, fell for seven
quarters, starting in October 1994 until June 1996, and the menu had grown tired.
The chain, the Brinker flagship, accounts for about 70% of Brinker's annual sales of
$1.34 billion in the most recent fiscal year, ended July 31.
"As Chili's goes, it leads the company, up or down," Mr. McDougall says.
…
Four months later, Mr. McDougall dumped three flailing concepts -- Grady's
American Grill, Spageddies Italian Kitchen and Kona Ranch Steak House. Brinker Chief
Financial Officer Russell Owens describes the process as "painful," but said he
believes it made employees realize that the company won't let a strong chain, such
as Chili's, carry underperforming ones. "It sends a message that there's
accountability for each brand," he says.
Mr. McDougall calls those deals "a real defining moment in the history of this
company." He adds, "We traded three concepts, average players, for Michael Jordan,
Scottie Pippen."
In addition, Mr. McDougall, 55 years old, finalized a new management plan a year
ago to put each of the company's nine restaurant chains under a separate team,
each with its own chefs and marketers. Some longtime executives left in the shuffle -
- for a variety of reasons. Today, Brinker operates more like a holding company
with a few central functions such as finance and legal. The different "concept
teams" are even grouped together at Brinker headquarters in offices decorated like
their specific restaurants.
Under the new structure, Chili's has overhauled its menu and its advertising and
has reported positive sales growth for 13 months running. The chain also is testing
a takeout window; one Dallas store added the equivalent of a week's sales from
takeout business, says Doug Brooks, president of Chili's Grill & Bar, who adds that the
chain "needed to be brought up to the '90s."” – Brinker Readies New Path for Its
Casual-Dining Empire, Emily Nelson, the Wall Street Journal, 05 March 1998
N25
12
“At T.G.I. Friday's, which helped pioneer the segment with menu innovations such as
potato skins and fried mozzarella, change has been ongoing and insightful. It has kept
pace with the aging baby boomer crowd that once frequented its singles-oriented
bars and is now bringing the kids in for food described as "familiar with a twist"
in a more family-oriented atmosphere.
…
Friday's has upscaled its core concept, adding items that raised sales in 1998.
Like many others in casual dining and quickservice segments alike, it has also begun
setting up shop in nontraditional locations such as airports, food courts and
stadiums. International growth is also a key strategic initiative.
On the menu, more upscale choices are being added. Recent hits include
Friday's Jack Daniel's Grill, which combines steak, chicken or salmon with a
bourbon sauce, and Chophouse Classics, the same protein portions served with
an onion-based sauce on sizzling platters. Priced from $11 to $15, the new items
are popular and are helping to increase check averages.” – Coming of Age: Operators
Upgrade, Reinvent Casual Dining, Dana Tanyeri, Bill Communications, June 1999

N26
Moat
The Restaurant Group Focuses on Locations with High Barrier to Entry
TRG’s sales per restaurant is 2.5 times higher than those of independent restaurants
- Biggest Negative:
o The industry has low barrier to entry
o Leisure and retail park owners can have power over tenants
- Michael Porter Questions
o (-) means low
o (=) means medium
o (+) means high
o For the industry
Is the threat of new entrants high or low?
(=) Barrier to entry is low
o But the impact on successful chains isn’t very high
Is the bargaining power of buyers high or low?
(=) Customers have a lot of choice
Is the threat of substitutes high or low?
(-) people spend more on eating out as they have more
disposable income
Is the bargaining power of suppliers high or low?
(-) Inputs are commodity
o Employees are paid low wages
£1,355
£1,063
£532
TRG Branded Service-lead
Restaurant
Independent Service-lead
Restaurant
Average sales per restaurant (£000's)
N27
o But the government set minimum wages
Is the rivalry within the industry high or low?
(+) Very intense
o For the company
Is the threat of new entrant different for this company specifically?
(-) Lower than the industry
Is the bargaining power of buyers different for this company
specifically?
(-) Customer don’t as many choice at leisure and retail parks
Is the threat of substitutes different for this company specifically?
(-) As low as the industry
Is the bargaining power of suppliers different for this company
specifically?
(-) As low as the industry
Is the rivalry within the industry different for this company specifically?
(=) There’s less direct competition in leisure and retail parks
- Competitive landscape
o The U.K.’s Office of National Statistics (ONS) estimate the total consumer
spend on catering services: £87.6 billion
o Industry consultants say this number massively overstates the market
Horizons said that ONS’s figure includes
All drink served in pubs
o Whether or not it was consumed with food
Overnight hotel accommodation
o If you have spent £20 on a night in a pub
o then slept it off in a hotel charging £80 for the overnight
stay
o ONS says that you have spent £100 on eating out
o Horizons estimates the U.K. out-of-home food service market at £46.6 billion
In 2014
Managed pubs accounted for 30.3% of restaurant meals
In 2013
o NPD estimates U.K.’s out-of-home food service market: £52.2 billion
In 2015
Including
Restaurants
QSR

N28
Food served in pubs, hotel, and other venues
o Allegra has a different estimate
(TRG uses Allegra data)
Total market: £57.61 billion
Service-lead restaurant: £20.91 billion
Fast food and take away: £12.78 billion
Pubs: £23.92 billion
o Mintel has a far different estimate:
2015: £31.05 billion
Fast food: £9.7 billion
o (excluding coffee shops)
2014: £30.47 billion
Fast food: £9.4 billion
Mintel says the market include
Takeaway and fast food,
Full-service restaurant
Pubs/clubs/taverns/bars etc.
Mintel’s estimate might be close to Allegra if the £30 billion number
doesn’t include pubs
o NPD estimate the casual dining market at £4.7 billion
(Restaurants with average spend per head between £10-20)
=> TRG has 14% market share of this narrowly defined segment
Restaurants with average spend per head between £10-20
o The market include
Fast food, sandwich bars, and coffee shop:
Average spend per head: £3-5
Fast food chains include
o McDonald’s
o Burger King
o KFC
Sandwich bars include
o Subway
o Greggs
Coffee shop include
o Costa Coffee
o Starbucks
o Etc.
N29
Fast casual:
Average spend per head: £9
Fast casual players include
o Nando’s
o Pizza Hut
o Wagamama
o Gourmet Burger Chicken
o Five Guys
Pub-restaurants
Average spend per head: £5-10
These are neighborhood pubs that started sell more food
o As beer sales declined
Customers visit local pubs frequently
o => so local pubs must keep spend per head low
They can’t transform into a upmarket restaurant
Without alienating existing customers
9 of the top 15 biggest chains are pub restaurants
o Hungry Horse
o Sizzling Pub
o Harvester
o Toby Carvery
o Fayre & Square
o Brewer Fayer
o Beefeater
o Ember Inns
o Flaming Grills
Family-oriented pub restaurant like Harvester is opening in retail
parks
Full-service casual dining
Average spend per head: £10-20
Biggest chains are mostly Italian chains
o Focus on pizza and pasta
o Example:
Pizza Express
Prezzo
Zizzi
Ask
N30
Carlucio’s
Bella Italia
Fine dining
Mainly independent restaurants
o Many casual dining competitors focus on high streets
And London
o TRG focuses on leisure and retail parks
And has little presence in London
o At leisure retail parks
Restaurants are mostly chains
Mostly fast food and fast casual restaurants
Familiar names
o Coffee shops
Starbucks
Costa Coffee
Café Nero
o Sandwich bars
Greggs
Subway
o Fast food
McDonald’s
Burger King
KFC
o Pub-restaurants
(occasionally)
Harvester
Hungry Horse
o Fast casuals
Nando’s
Pizza Hut
Five Guys
Wagamama
Ed’s Easy Dinner
o Casual dining
Frankie & Benny’s (F&B)
Chiquito
Coast to Coast
N31
Prezzo
Pizza Express
Zizzi
YO! Sushi
Chimichanga
TGI Friday
A retail parks normally have about 2-3 casual dining restaurants
Big retail parks can have 5-6 casual dining retaurants
TRG can have 1-3 restaurants in the same parks
- Customer retention
o No specific data for TRG
o Casual dining doesn’t enjoy high frequency purchase
Like coffee shops
o People have a lot of choices
o Normally, people have a preferred restaurants for a certain type of food
Or a certain type of occasions
o Once people like a restaurant, they may repeat visit
If it’s in a 5- to 10-minute drive
- Customer acquisition: better than average
o TRG’s restaurants benefit from being in places with limited supply
Retail parks construction and extension are carefully planned
Retail parks usually have only 1-3 casual dining restaurants
(In addition to quick service and fast casual restaurants)
Very big retail parks may have 5-6 casual dining restaurants
That helps TRG get people try it first
Then retain the customers if it’s good
o Chains in general enjoy advantage in customer acquisitions
They have greater awareness than independent restaurants
They have greater experience and scale in marketing
F&B has a data base of 1.4 million opted in users
Frankie & Benny’s apps had over 500,000 downloads
F&B’s Facebook page has
410,798 people likes
2,275,549 people visited
For comparisons
o Harvester: 280,047 people like
Harvester is a pub-restaurants that attract families

N32
Harvester is owned by Mitchells & Butlers
Harvester’s average spend per head is £7-10
o Pizza Express: 264,056 people like
o Prezzo: 162,463 people like
o Zizzi: 67,948 people like
o Chiquito: 53,282 people like
o Chains have been gaining market share
According to Allegra, service-led restaurant market: £20.38 billion
(in 2015)
Independent restaurants: £15.49 billion
o 3-year CAGR: -1.6%
o 76% market share
Declined from 80% in 2012
Branded restaurants: £4.89 billion
o 3-year CAGR: 6.1%
o 24% market share
Increased from 20% in 2012
o There’s evidence that TRG has higher than average sales per outlet
According to Allegra – The UK Restaurant Market 2015 report
Sales per outlet of service-lead restaurants: £0.9 million
o Independent restaurants: £0.53 million
£15.49 billion revenue
29,100 outlets
o Branded restaurants: £1.06 million
£4.89 billion revenue
4,600 outlets
Estimated sales per outlet of major chains:
Wagamama: £1.6 million
o Wagamama is a noodle bar
With canteen-style
Customers share table with strangers
o It’s more of a fast casual
Carluccio’s: £1.5 million
o Carluccio’s operates on high streets
o 1/3 of Carluccio’s locations are in London
Côte: £1.5 million
o Operates on high streets
N33
Nando’s: £1.44 million
o Fast casual
TRG: £1.35 million
YO! Sushi: £1 million
Strada: £1 million
Pizza Express, Ask, Zizzi: £0.85-0.9 million
Prezzo: £0.85-0.9 million
Café Rouge: £0.85 million
Bella Italian: £0.8 million
Giraffe: £0.8 million
o Frankie & Benny’s is a big brand
It has 261 locations in the U.K.
Equivalent to having 1,305 restaurants in the U.S.
Pizza Express is the only casual dining chains with more sites
o Pizza Express has 443 locations in the U.K.
Average £15 spend per head
o Nando’s has 365 locations
But it’s a fast casual chain
Average £5-10 spend per head
o Pizza Hut has 270 locations
But it’s a fast casual chain
Average £10-11 spend per head
(repositioned itself away from fast food)
Next big casual dining chains are mostly pasta/pizza chains
o Prezzo: 234 locations
Average £14-15 spend per head
o Zizzi: 141 locations
Average £18 spend per head
o Ask: 111 locations
Average £14 spend per head
PizzaExpress, Ask and Zizzi were owned by
Gondola Holdings
Ask and Zizzi are now owned by Bridgepoint
o Carluccio’s: 98 locations
Average £16 spend per head
1/3 of the sites are in London
o Bella Italia: 97 locations
N34
Average £10-12 spend per head
Other than Italian chains, next big chains are
o Wagamama: 119 locations
A Japanese noodle chain
With canteen-style layout
Average £8-10 spend per head
Wagamama is more like a fast casual chain
o Café Rouge: 90 locations
A French-themed chain
Predominantly a high street brand
Average £10 spend per head
o Chiquito: 86 locations
Mexican food
Average £15.5 spend per head
o YO! Sushi: 75 locations
A conveyor belt sushi chain
Average spend per head: £15
o TGI Friday’s: 73 locations
Average spend per head: £15-17
o Côte: 73 locations
A mid-market French bistro
Focus on high streets and town centers
Average spend per head: £17-20
o Bill’s: 72 locations
Bill’s is an English brand
It was originally a green grocer
Average spend per head: £15-17
o Other chains have less than 100 sites
=> excluding Italian chains, TRG owns 2 largest casual dining chains
Frankie & Benny’s
Chiquito
- Margin protection: Good
o Margin in this business depends on volume
Restaurants don’t compete on price
They target certain market segment
o Have a certain mark-up over food and labor cost
Volume helps leverage fixed costs
N35
Volume explains the high rate of failures in this business
According to Cornell University and the National Restaurant
Association
o 60% of restaurants fail within the first 3 years
o 75% of restaurants fail within the first 5 years
o Oversupply can leads to lower margin
o TRG’s locations provides some volume protection
Supply is controlled
1
Planning laws in the U.K. are restrictive
All development must get “planning permission”
Approved by local planning authority
Commercial properties have different use classes
Class A1: shop
o For the retail of goods other than hot foods
o As a post office
o For the sale of tickets by a travel agency
o For the sale of sandwich or other cold food
For consumption off the premises
o For hairdressing
o Etc.
Class A2: Financial and professional services
o Financial services
o Professional services
(other than health and medical services)
o Any other services which is appropriate to provide in a
shopping area
Including use as a betting office
Class A3: Food and drink
o For sale of food or drink for consumption on the premises
Or of hot food for consumption off the premises
Change of uses requires planning permission
The decision on any planning application is based on local planning
policies
Some key focuses of local planning policies:
o (Source: National Planning Policy Framework)
o Building a strong, competitive economy
o Ensuring the viability of town centers
N36
o Supporting a prosperous rural economy
o Promoting sustainable transport
o Conserving and enhancing the natural environment
o Conserving and enhancing the historic environment
The number of new leisure and retail parks is small
There are 1,550 leisure and retail parks/schemes in the U.K.
o (Source: TRG 2015 Final Result presentation)
Only 79 new schemes in pipeline
o From 2016 to 2021
o 5% increase over 5 years
About ¾ changes on an existing retail park need planning permission
(Source: one CBRE out-of-town retail expert said)
By local committee
o They care about
The impact on town center
The impact on local economy
Job creation
GDP growth
The impact on local population
Traffic
Safety
Etc.
The process is usually slow and bureaucratic
It takes a lot of time and effort to get permissions
o Some projects never get passed
o Example:
o Inverness Estate
Inverness applied for 6 new restaurants
3 drive-through takeaways
2 restaurants
1 pub
The scheme was rejected
In 2011
Reasons
It would take people away from city center
It breaches the Inverness Local Plan
N37
o Earmarked for business use
Restaurant chains should instead be directed
towards vacant premises in the city center
Inverness submitted a new proposal
4 restaurants, including
o Frankie & Benny’s
o Chiquito
o A drive-through McDonald’s
The new proposal was rejected
In 2013
18 months after the first proposal was rejected
Reasons
Potential impact of the new restaurants on business
in Inverness city center
The land is zoned for offices
o Rather than food outlets
The park submitted another application
For a £13million expansion
o Add 3 new big name restaurants
Frankie & Benny’s
TGI Friday
Nando’s
=> add 180 jobs
o Revamp its shop fronts
o Redesign its car park
The project was opposed by key city center players
Inverness Bid
o That would be against the council and Scottish
Government’s commitment to supporting city
centers
o These are destination restaurants
People choose to go there
Rather than simply catering for people
already at the retail park
Eastgate Shopping Center
o The restaurants would draw footfall out-of-
town
N38
Planning officer John Kelly supported the plan
There would be no significant impact on the viability
of the city center
The park began operating 20 years ago
o Beginning to show its age
o Lack basic user amenities
Public toilets
o There’s limited restaurant provision to serve
the retail park
o Teesside Park
The old Springs Health Club was closed in the park
In 2007
Park owner applied for a £7.5 million development
Replace the gym with 3 separate buildings
o A Nando’s restaurant
o A Harvester family pub
o A 66-bed Travelodge hotel
The Stockton council blocked the plan
In 2013
It would hurt the town center business
The site was later used to build a furniture store
Baker and Stonehouse
o One of Teesside’s flagship home-grown
businesses
Retail parks can get extension overtime
But park owners are rational
o (usual funds)
They plan the number of food units based on traffic
2
o They can estimate food demand from shoppers
o 70-75% of the demand is for low-spend catering
o The rest is for higher-spend casual dining
This explains why there are only a few casual dining
restaurants in each retail park
Landlords pay attention to tenant mix
o Unlikely to have two restaurants with the same concept
3
o Landlords may have power over restaurateurs
They may demand higher rent if supply is limited
N39
It’s more competitive in leisure parks now than before
4
o Always 8-10 operators vying for a site
But restaurateurs usually enter 20- to 25- year lease contracts
With rent increase in line with RPI/CPI
By the end of the lease term, retail parks may have done some
extensions
Adding some catering units
=> Average sales per restaurant remain stable
o So does margin
Otherwise, average sales per restaurants increase a lot
Landlords may demand higher rents
And restaurateurs won’t benefit from margin expansion
o TRG has become more significant to landlords
Winning restaurant formats help
5
Increase footfall
increase dwell time
Extend trading hours
TRG’s restaurants can be destination-type restaurants
A lot of people use TRG restaurants as a pure destination
6
TRG opened more restaurants in the same leisure/retail parks
Most Chiquitos and Coast to Coast co-locate with F&B
o Example:
o F&B and Chiquito co-locate at
Brougton Shopping Park
Kingswood Parks
Cambridge Leisure
Kingston Retail Park
Glasgow Fort
Etc.
o F&B, Chiquito, and Coast to Coast co-locate at
Middlebrook Retail Park
Valley Centertainment Leisure Park
- Moat evaluation
o Barrier to entry:
Low for restaurants in general
But failure rate is very high
o 60% within 3 years

N40
o 75% within 5 years
Supply is controlled in TRG’s locations
o Impact of new entrant
A new restaurant in a retail parks is likely to have a different concept
But a good entrant can hurt traffic to existing restaurants
TRG’s strategy to co-locate several casual dining concepts may help
mitigate this risk
Negligible level of cannibalization
7
o Rivalry among existing firms
Very tough
A lot of price point
A lot of concepts
A lot of innovation
- Conclusion
o TRG doesn’t have a wide moat
o But it can have a more stable business than most restaurant chains
F&B is a big/strong brand
Chiquito and Coast to Coast are the biggest in its concept
o Can follow F&B’s growth
o By co-locating with F&B
TRG operates in a controlled-supply environment
Faces familiar competitors
o Fast foods
o Fast casuals
This is the most important factor in TRG’s moat
1
“Mr Page is heading into semi-retirement after the group behind chains such as
Frankie & Benny's and Garfunkel's broke through the pound(s)1bn market capitalisation
last year.
Shares in Restaurant Group hit the 500p mark last year, which achieved Mr Page's
personal target. "I said to my wife: 'When we get to a fiver, I will feel that we have done
a good job.'" Shares have since rallied to 620p.
The performance of the group was aided by its decisions to leave the high street
and not overload itself with debt - as many leisure groups did - in the noughties.

N41
The Restaurant Group moved its estate to retail and leisure parks, as well as
transport hubs, rather than the high street. Mr Page said that the decision to move
off the high street was "blindingly obvious" in retrospect.
"The logic behind it was clear: there was bags of growth in eating out, but my
concern was that everyone would see that and throw capital at it," said Mr Page.
"We wanted to capture the demand, but mitigate the supply side: we looked for
areas with barriers to entry."” – Page to Leave Restaurant Group on a High, Duncan
Robinson, Financial Times, 21 January 2014
2
“Stephen Logue, founder and non-executive chairman of Logue & Bailey Consultants,
gives his views on the sustainability of F&B at Westfield London: Westfield hopes to
attract 25 million visitors each year and, on that basis, the shopper-generated
demand for catering should be around £30m.
Conventionally, 70-75% of this demand is for low-spend catering, with an average
per-person spend of £4. This leaves roughly £8m for the higher spend on casual
dining - equivalent to eight restaurants.
Westfield has a plethora of table service restaurants that outstrip shopper demand, so it
will need a high level of nocturnal, non-shopping related demand. As the immediate
local market is not particularly affluent diners will need to be persuaded to travel from
Chiswick, Holland Park, the rest of west London and beyond. In addition, the absence
of alcohol-led operations will deter the 18- to 24-year-old evening visitors.
Equally, there are not many affordable outlets, such as McDonald's, Burger King
and KFC, to meet the demand of the core shopper, representing about £20m of
spend. If families can't find affordable food and drink, repeat visits will drop off.
Nando's has a day-long queue, which has been attributed to the local demographic. I
would add that Nando's comes close to meeting demand for a fast, no-frills,
manageable eating experience.
Overall, Westfield has been magnificently executed, but it faces a serious challenge.
The catering has an inadequate sustenance supply, an oversupply of shopper-related
leisure dining and a serious glut in destination dining unless the nocturnal scene can be
animated to a level beyond that ever achieved elsewhere.” – A Food Court of Fine
Dining, Rosalind Mullen, Caterer & Hotelkeeper, 11 December 2008

N42
3
“During 2005, the concessions division opened five new airport units, including three
at Luton. But although the growth of regional airports is offering the possibility of
putting in quick-service, grab-and-go offerings, the opportunities at airports are
limited. This has led TRG to broaden its focus once again, turning its attention
increasingly to shopping centres, in which it opened three units last year.
The attractions are similar to those offered by the out-of-town leisure and retail parks -
a secure, safe environment appealing to the family market and with higher barriers to
entry. Unlike the free-for-all of the high street, where TRG could have opened a
Chiquito only for another Mexican eatery to spring up next door, shopping centre
landlords are more likely to have an eye for tenant mix and be unwilling to flood
the scheme with restaurants.” – Beyond the High Street, David Shrimpton, The
Estate Gazette, 18 March 2006
4
“As you know, we’re not into the high street: there are no barriers to entry there,
so you can really struggle, with people stealing your trade. We look at places like
leisure parks, though even there the scene has changed. When we first started
going into them, not so many other operatives there. Now, there’s always a good
8-10 vying for a site.” - Danny Breithaupt said in an interview with the Eat Out
Magazine, 10 January 2015
5
“TRG's profits rose 15 percent to pounds sterling 30 million in the first half on
revenues up 11 percent at pounds sterling 280 million as the group saw an increase in
customer numbers and a rise in spending per head.
Page said: "Consumers are becoming more selective but also there are signs of greater
confidence and they still want affordable treats." He added that the group's pipeline of
new restaurants was the best it has ever been, with the big out-of-town shopping
centres keen to attract winning restaurant formats that increase footfall and
make shoppers stay longer.” – Frankie & Benny's Owner TRG Toasts a Tasty Time
for Sales, Evening Standard, 30 August 013
6
“The Restaurant Group, which owns the Frankie & Benny's and Chiquito chains, said it
was likely to beat market expectations for 2010 in spite of "unusually harsh weather" in
November and December.
The group revealed a 1 per cent fall in like-for-like sales for the year compared with a
0.25 per cent increase before the weather-related disruptions.

N43
"People were fearful of going out in the evenings, and evening trade is important to us,
especially at that time of year," said Andrew Page, chief executive. "But these things
happen."
…
Analysts at Liberum Capital said that even the steep fall in like-for-like sales in
November and December - an estimated 7 to 8 per cent decline - beat the
performance of Cineworld, which also operates in leisure parks and shopping
centres. Cineworld experienced a 13 per cent decline in box office earnings during a
similar period.
"Whilst films are important to our business, they are not the be-all and end-all,"
said Mr Page. "A lot of people use the restaurants as a pure destination."” –
Restaurant Group Weathers Severe Trading Conditions, Rose Jacobs, Financial
Times, 12 January 2011
7
“Following its launch at the end of 2011 in Brighton, Coast to Coast is now a well-
established and successful part of the Group’s portfolio of brands. Most of our Coast
to Coast restaurants are co-located with Frankie & Benny’s and in a number of
cases both Frankie & Benny’s and Chiquito. It has a distinct market position and
as a result we see negligible levels of cannibalisation in such co-located
situations. Our location strategy for Coast to Coast tends to be on leisure and retail
schemes in larger markets. We are also confident that the brand can work well in some
UK city centre locations, following the successful Birmingham Broad Street opening at
the end of 2013.” – TRG 2014 Annual Report

N44
Quality
Are U.K. Restaurants Over-Earnings?
U.K. casual dining chains earn about 10-20% EBITDA margin
- Biggest Negative:
o U.K. restaurants might be over-earning
o U.K. restaurants seem to have lower asset turnover than U.S. peers
- Michael Porter Questions
o (-) means low
o (=) means medium
o (+) means high
o For the industry
Can the industry charge a high price?
(+) The industry can have high mark-up on food and labor cost
Does the industry have low costs?
(=) food costs are commodity
o Minimum wages are set by the government
Does the industry have low need for assets?
(+) the industry has high need for assets
o Asset turnover is about 2x
(for leasehold restaurants)
o For the company
Can the company charge a higher or lower price than the industry?
22%
19% 19% 17% 17% 16% 14% 13% 13% 12% 11% 10% 10%
EBITDA Margin
N45
(=) same as the industry
Does the company have higher or lower cost than the industry?
(-) TRG has higher sales per store than the industry
Does the company have more or less need for NTA than the industry?
(-) TRG seems to have higher asset turnover than the industry
- Restaurants don’t compete on price
o Restaurateurs use a method called “pricing by gross profit”
They estimate
Cost to search each person entering the restaurant
Fixed cost
A range of potential volume
=> Decide a mark-up to gain a reasonable profit margin
They usually watch prime cost
Prime cost = (labor + food cost)/sales
These are controllable cost
o Although labor costs are less variable than food cost
According to the U.K. Restaurant Benchmarks by Baker Tilly
o Food cost: 28-32% of sales
This number can varies
Pasta or pizza has low input cost
=> low food cost/sales
Steak has high input cost
=> high food cost/sales
o Labor cost: 30-35% of total sales
Fixed cost is significant
Occupancy
o Rent
Restaurants usually enter 15- or 20-year lease
Long lease help depreciate high fit-out cost slowly
TRG’s CapEx per new site is about £1 million
o Common area maintenance costs
o Property insurance and taxes
o Etc.
Operating cost
o Supplies
o Utilities
o Repair and maintenance

N46
o Credit card fees
o Marketing
o Training
o Recruiting
o Etc.
G&A
Depreciation
In TRG’s case
Prime cost is about 54% of sales
o In almost every year
Other expenses: 33% of sales
o Including:
Rent: 11% of sales
D&A: 6% of sales
G&A: 6% of sales
Operating cost: 10% of sales
If we consider prime cost variable (it’s not)
o Fixed cost is about 33% of sales
A typical U.S. restaurants
(based on data of many U.S. casual dining chains we collected)
Prime cost: 57-60%
Operating cost: 15-16%
Occupancy: 6%
G&A: 5-6%
D&A: 4-5%
EBITDA margin: 12-14%
EBIT margin: 8-10%
o It’s very hard to underprice successful chains
Successful chains have huge volume
According to Allegra – The UK Restaurant Market 2015 report
Sales per outlet of service-lead restaurants: £0.9 million
o Independent restaurants: £0.53 million
£15.49 billion revenue
29,100 outlets
o Branded restaurants: £1.06 million
£4.89 billion revenue
4,600 outlets
N47
TRG averages £1.35 million revenue per outlet
=> 2.5 times more in independent sales per outlet
TRG restaurants are unlikely to be 2 times bigger in size
o Sales per square foot might be 50% higher or more
If fixed cost is 30% of sales
50% higher volume result in 15% lower fixed cost/sales
Underpricing successful chains require getting higher volume than them
A daunting task
o Each of their site has built up awareness for many years
o They have higher than average volume
o => new restaurants don’t compete on price
They compete on volume, by
Being unique
o Being unique means having a unique selling point
o Good food or great service isn’t unique
Having good marketing
o Get people try out
o Get people increase visit frequency
Providing good food and service
o Help retain customers
- U.K. restaurants have higher EBITDA than U.S. restaurants
o EBITDA margin of U.K. chains varies greatly:
Côte: 22%
TRG: 19%
Gondola: 19%
Owned Pizza Express, Ask, Zizzi, and Byron
Prezzo: 17%
Casual Dining Group: 17%
Owns Café Rouge and Bella Italia
Wagamama: 16%
Brasserie Bar Co: 14%
High-end restaurants with £30 average spend per head
Bill’s: 13%
YO! Sushi: 13%
Jamie’s Italia: 12%
Carluccio’s: 11%
Wahaca: 10%

N48
Giraffe: 10%
o EBITDA margin of U.S. casual dining chains clusters around 10-14%
Chuy’s Holdings: 14%
Brinker: 13%
Cheesecake: 13%
Darden: 12%
Ruby Tuesday: 12%
Brio Bravo: 11%
Bloomin: 10%
o Differences
U.K. restaurants have significant higher rent
U.K. casual dining chains pay about 10% of sales for rent:
o TRG: 11%
o Gondola: 10%
o Prezzo: 9%
o Wagamama: 8%
Wagamama is like a fast casual chain
Customers share table with strangers
U.S. peers pay about 4% of sales for rent:
o Cheesecake: 6%
o Chuy’s Holdings: 5%
o Brio Bravo: 4%
o Brinker: 4%
o Bloomin: 4%
o Ruby Tuesday: 4%
o Darden: 3%
Reasons:
o U.K. casual dining chains are predominantly on
High streets
Shopping centers
Leisure and retail parks
Rent are most expensive in shopping centers
Least expensive on out-of-town retail parks
o U.S. casual dining restaurants aren’t usually in high profile
locations
U.K. restaurants may have higher mark-up on food
We don’t have a lot of data to prove this point

N49
We have only food cost/sales data of TRG
o It’s about 23% of sales
U.S. peers spend about 26-32% of sales in food costs
o Cheesecake: 26%
o Ruby Tuesday: 27%
o Brinker: 28%
o Darden: 31%
(Activists want to reduce Darden’s food costs)
o Bloomin: 32%
Bloomin has expensive ingredients (steak)
But U.K. restaurant benchmarks seem similar
o (According to Baker Tilly)
o Food cost: 28-32% of sales
Staff costs/sales are remarkably similar
o Bloomin: 28%
Steakhouse has high food cost and low labor cost
o Cheesecake: 31%
o Brinker: 32%
o Darden: 32%
o Ruby: 33%
o Gondola: 32%
o Prezzo: 32%
o TRG: 32%
It’s possible that U.K. restaurants have slightly higher mark-up
over food cost
o Because of
Higher labor cost
U.K. has higher minimum wages:
o 18-20 years old: £5.30 ($8.48)
o 21-24 years old: £6.70 ($10.72)
o 25 and over: £7.20 ($11.52)
Tips don’t count toward minimum wages
Higher rent expense
U.K. restaurants have lower asset turns
Sales/Average NTA:
o U.K. chains:
TRG: 2.35x
N50
Gondola: 2.20x
Prezzo: 1.61x
o U.S. chains:
Bloomin: 3.92x
Bravo Brio: 2.93x
Brinker: 2.75x
Cheesecake: 2.73x
Darden: 2.67x
Chuy’s Holdings: 2.53x
Ruby Tuesday: 1.53x
No good reason
o Wild guess: U.K. restaurants spend more on fit-out?
Estimated sales per square foot
o TRG: £340 ($540)
o Cheesecake: $1,050
o Brinker: $650
o Olive Garden: $570
o Bloomin: $500-550
o Chuy’s Holding: $537
o Bravo Brio: $500
- Will EBITDA margin of U.K. restaurants decline?
o 3 lines of thought
o #1: U.K. restaurants aren’t really more profitable
They have lower asset turns => need higher margin
If U.S. restaurants has 25% higher asset turnover
o And U.S. restaurants make 12% EBITDA margin
o => U.K. restaurants need 15% EBITDA margin
To achieve similar EBITDA/NTA
Site economics varies greatly
Giraffe or Wahaca makes only 10% EBITDA margin
At 1.6x asset turn like Prezzo
o => They can make only 16% EBITDA/NTA
o Lower than U.S. peers’ EBITDA/NTA
Bloomin: 38%
Brinker: 36%
Cheesecake: 36%
Chuy’s Holdings: 36%
N51
Darden: 33%
Bravo Brio: 27%
According to Baker Tilly’s U.K. restaurant benchmarks
Under £200 sales per square foot: likely make operating loss
At £200 to £300 sales per square foot: 0-5% EBIT margin
At £300 to £400 sales per square foot: 5-10% EBIT margin
TRG’s high margin might be due to company-specific quality
Not due to U.K. industry’s overearning
o #2: U.K. restaurants might be naturally more profitable than U.S. peers
U.K. restaurants have higher fixed cost
High minimum wages
High rent expense
=> higher risk
=> need higher reward to justify the risk
According to Mitchells & Butlers
1
o The rule of thumb in the industry
Freehold assets: require mid to high teens ROIC
Leasehold assets: require 25% ROIC
An industry consultant explain that restaurant has high risk/high
reward
2
o Failure rate is high
60% of new restaurants fail in 3 years
75% fail in 5 years
o Successful restaurants can have 3-year payback period
o #3: U.K. restaurants are over-earning
U.K. restaurants may really have higher ROIC than U.S. peers now
Chains will keep opening due to high ROIC
More outlets will reduce average volume
o Leading to lower ROIC
Problem with this argument:
Restaurant isn’t a new industry
TRG has been enjoying high margin, high ROIC since 2002
One may say that the U.K. market is not mature yet
o And profitability may decline as the market saturates
But that didn’t happen to U.S. chains
o Darden, Brinker, and Cheesecake don’t have lower margin
than they did in 1993
N52
EBITDA margin was basically flat
Just went up and down through cycles
- Conclusion: there’s possibility that U.K. restaurants are over-earnings
o This is the biggest risk to an investment in TRG
o In this case, TRG may have some protection
Thanks to its locations
Supply is controlled
In worst case, TRG’s EBITDA margin may decline to 15%
(if asset turns don’t improve)
EBIT margin: 10%
It will still make an above average return
- 8 dimensions of quality
o Relative size
Customers are individual
Suppliers can be big
But they sell commodity
TRG is the biggest casual dining group in the U.K.
o Focus
TRG have several brands
F&B
Chiquito
Coast to Coast
TRG focuses on several segment
Leisure and retail park
Concessions
Rural and semi-rural pub
o Pubs aren’t branded
o Customer engagement
F&B has a data base of 1.4 million opted in users
o Cross-selling
F&B, Chiquito, and Coast to Coast can open in the same places
Help segment the market
o Retention
No information
o Words of mouth
No information
o Reinvestment rate

N53
TRG doesn’t spend much on advertising
Spent over £600 million in CapEx since 2002
o Stock’s popularity
Market cap: £780 million
Float: 198 million shares
Share turnover: 126%
(= 3-month average daily volume * 252/Float)
Daily trading value: almost £4 million
TRG name is difficult to look for in
Google Finance
Stockopedia
1
“Well, we have internal hurdle rates, which are important for discipline but, of course,
it's not the actual hurdle rate that matters, it's what -- it's not the hurdle rate, it's what
you actually achieve that matters.
I think there is a general rule of thumb in the industry that, on a freehold asset,
you'd want to be producing income in mid to high teens, and Tim did say, if you
look at our freehold investments, we're satisfied with what we've got but we'd like
them to do better. And certainly, we'd expect a higher return, as everybody
would, from leasehold sites. And a benchmark of most people producing 25%
returns and north is the market target, so, clearly, we want to be in that same kind of
space.
If you get returns at those kind of levels, in and around those kind of levels, then we
would be producing significant shareholder value.” – Alistair Darby, Mitchells & Butlers’
former CEO, 2012 Final Result Presentation, 27 November 2012
2
“The cold fact of the matter is that opening up a restaurant may be one of the worst
investments you could make with your money. That's a horrible, sobering statement
coming from someone like me who's in the business of helping restaurants succeed,
but it's the truth. Most restaurant fail. Oh, the failure rate isn't the "90%" you may have
heard from friends and family, but according to Cornell University, and the National
Restaurant Association, 60% of restaurants fail within the first three years of
operation. After five years, the number might be as high as 75%.
Uggghh!
Why the hell would anyone want to get into this business with a failure rate like

N54
that? Risk and reward my friend, risk and reward.
As with other high risk investments, opening the right kind of restaurant in the
right kind of market can pay off very well financially. Some of the better chains
can see average net profits approaching, and even exceeding 30% of sales. That's
a great return! While the risk of opening a restaurant is huge, the reward can also be
huge. If you happen upon the right concept, and manage it well, you could see
your investment paid off in 3 years or less, and have lots of residual cash flow to
boot.” – The Biggest Mistakes Restaurants Make, and Why They Have a High Failure
Rate, Brandon O’Dell, http://www.evancarmichael.com/

N55
Capital Allocation
The Restaurant Group Just Open New Restaurants and Pay Dividends
Since 2005, TRG more than doubled the number of restaurants while paying about
50% of earnings
- Biggest Negative:
o 50% of Long-term incentive awards are based on share performance
- Share dilution is negligible
- Compensation includes
o Base salary
o Annual bonus
Mainly based on pre-tax profit during the year
Annual bonus is up to 150% of basic salary
o Long-term Incentive Plan (LTIP)
Up to 200% of base salary
Vest over 3 years depends on
3-year TSR vs. the FTSE 350 Travel and Leisure sector
o (excluding airline)
o Weight: 50%
o 30% of this element of the award vests for a median
ranking
o Increasing to full vesting for an upper quartile ranking
237
284
330 354 367 389 400 422 445 472
506
66%
112%
49% 47% 46% 45% 48% 46% 45% 45% 47%
2005 2006 2007 2008 2009 2010 2011 2012 2013 2014 2015
Total Restaurants Dividend payout ratio
N56
o Question: Does this make management focus on share
price???
EPS growth
o Weight: 50%
o 30% of this element of award vests for annual growth equal
to RPI + 4%
o Increasing to full vesting for growth equal to or in excess of
RPI + 10%
LTIP award are granted in the form of nil cost options
Equivalent to restricted stock unit?
- TRG management is focused on ROIC
o Although: ROIC isn’t an element in TRG’s incentive plan
o They’re clear about 3 key characteristics it seek:
Distinct barrier to entry
High return on capital
Good growth prospects
o In TRG’s presentation, they show calculation of site and company ROI
= EBIT/(Net asset + debt)
o TRG’s touchstones are
1
Cash flow, and
Return on investment
o Most sites are leasehold
But TRG may buy freehold when potential return is satisfactory
o In 2008-2009, the credit crunch cause many developments delayed
2
TRG didn’t replace postponed projects with less attractive projects
- They focus on organic growth
3
o Opened stores in areas with barriers to entry
4
On-edge or out-of-town leisure and retail parks
Rural & semi-rural pubs
Concessions
Mainly airports
o Developed new formats
Coast to Coast was successful launched in 2011
In Brighton
In 2001
Coast to Coast takes its inspiration from the Lincoln High way
5
Spans the U.S. from New York to San Francisco
N57
Great range of authentic food and drinks
o Best of classic American food
Aberdeen Angus beef burger
Deep dish style Chicago pizzas
Distinctive steaks
Etc.
A great bar serving specialty cocktails
Wide range of beers, spirits and traditional milkshakes
Music is an eclectic mix of
o Motown
o American rock
Customers are guarantee to lift their spirits
The first Coast to Coast restaurant was a great success
=> TRG opened more stores
o 4 in 2012
o 5 in 2013
o 3 in 2014
o 8 in 2015
Currently has 21 Coast to Coast stores
Potential: over 100 stores
TRG opens Coast to Coast store in the same place with
Frankie & Benny’s, or
Chiquito, or
Both
TRG recently has a new brand
6
Joe’s Kitchen
o Currently has 4 sites
TRG plans to open 100 Joe’s Kitchen
o In 10 years
- TRG uses little debt
o Debt level peaked at £88 million
In 2008
Reasons:
TRG paid £35 million special dividend
o In 2006
Acquired Brunning & Price
o In 2007
N58
o £33 million
Net Debt/EBITDA was about 1x
o Net debt has declined to £32 million today
0.24x EBITDA
o TRG has significant fixed charge
Rent is about 11% of sales
EBITDAR/(Rent + Interest Expense): 2.7
o Peers tend to use more debt
Most casual dining chains are owned by PE firms
Tragus
Tragus owns
o Café Rouge
o Bella Italia
o Strada
Blackstone paid £267 million for Tragus
o In December 2006
o At the peak of the buyout boom
o Used £167 million debt
In 2013
o Tragus’s pretax losses doubled to £36 million
o The bulk of this loss stemmed from interest on its net debt
£324.6 million on June 02, 2013
Apollo acquired Tragus’s debt
o In the secondary market
Tragus agreed a restructuring deal
o In 2014
o Slashing its debt burden from £354 to £91 million
o Undergo a company voluntary arrangement
Cut its rent bill to make the company profitable again
Landlords at 51 of its 290 sites will be asked to agree
to rent reductions
40% in 19 cases
50% in the remaining cases
Hopes to exist 30 to 40 of these leases over the next
few years
Landlords would be left with less than a penny if it
went bankrupt
N59
Apollo has agreed a debt-for-equity swap to reduce Tragus’s debt
burden
Tragus’s debt burden hindered it during the downturn
7
o Mid-market restaurants prospered
o But large interest payments meant it couldn’t invest in its
estate
Posted £36 million pre-tax loss last year
Sold Strada
o For £37 million
Had previously acquired Strada for £140 million
In 2007
o Strada suffered worse trading than Bella Italia and Café
Tragus couldn’t invest in Strada
Gondola
Gondola owns
o Pizza Express
o Ask
o Zizzi
o Byron
Cinven bought Gondola for £900 million
o In 2007
Cinven used about £600 million debt
o Net Debt/EBITDA was 5.8x in 2007
o Besides, rent expense is about 9-10% of sales
Gondola eventually sold all of its brands
o Sold Byron for £100 million
In 2013
To Hutton Collins Partners
Hutton Collins also owns Wagamama
o Sold Pizza Express for £900 million
In 2014
To Hony Capital
A Chinese private equity firm
o Sold Ask and Zizzi for £250 million
To Bridgepoint
Bridgepoint also owns Pret a Manger
Mitchells & Butlers

N60
Mitchells & Butlers’ Net Debt/EBITDA: 4.3x
But Mitchells & Butlers owns most of its pubs
o Like most pubcos
EBITDAR/(Rent + Interest): 2.73x
- TRG returns moss excess cash to shareholders
o TRG maintains about 50% dividend payout ratio
8
o TRG also pay special dividend 2 times over the last 10 years
In 2006: 16 pence per share
In addition to 6-pence-per-share regular dividend
In 2014: 3.45 pence per share
In additional to 14.85-pence-per-share regular dividend
o TRG created great value for shareholder
From 2002 to 2015
Total income: £483 million
Total dividend: £269 million
o Averaging 56% payout rate
Sales CAGR: 9.28%
o 2002: £216 million
o 2015: £685 million
EBITDA CAGR: 11%
o 2002: £34 million
o 2015: £133 million
=> implies about 20% after-tax return on equity
1
“Our core objective continues to be growth in shareholder value and our strategy to
achieve this is to build a business capable of delivering long-term, sustainable and
growing cash flows. Our touchstones are cash flow and return on investment. Our
business model enables our shareholders to enjoy the benefits of high returns
on capital, growth in profits and cash flow and sizeable income distributions
from our progressive dividend policy. The Group has a consistent record of
converting profits into cash at a very healthy rate, and delivering increasing cash flows
each year, and in 2013 this was again the case.” – TRG 2013 Annual Report
2
“Our philosophy regarding capital expenditure remains consistent that is, we
focus on cash generation and return on invested capital at rates ahead of TRG's
weighted average cost of capital. We will continue to apply the same high level of
analytical rigour, commercial analysis, experience and risk adjustment to each capital
project that we undertake. This approach has served TRG well over the last seven
N61
years and we do not intend to deviate from it. This means that projects that have
been postponed or delayed by the developers will not be substituted with unduly
risky and/or less attractive projects. Rather, we will retain our cash until such
time as either the original projects reappear or other equally attractive
opportunities become available. In the meantime, our surplus cashflow will be
applied towards reducing debt.” – TRG’s 2008 Final Result statement
3
“Our core objective is to grow shareholder value by building a business capable
of delivering long-term sustainable and growing cash flows. We do this by
providing great food, drink and service in well-appointed restaurants and pubs. Within
the eating out market we focus on sectors where there are barriers to entry, good
growth prospects and strong returns. Our growth model is primarily based on
organic roll out of new sites. While most such sites are leasehold, we also
acquire freehold premises where these give a satisfactory level of return.
Although not a core part of our development plans, we remain open to evaluating
acquisitions of existing businesses where there is a clear strategic rationale and
where this would enhance shareholder value.
Our business model is to grow through a combination of like-for-like sales growth and
new site development. The profits from this growth are converted into cash at a
healthy rate, which we use to maintain our existing estate in good order, pay
dividends and invest in more new sites generating high levels of return. This has
proven to be a very successful and value-accretive business model which has enabled
the Group to grow in a predominately organic way funded principally by internally
generated cash flows. This model delivers high returns, growth and income for
shareholders in the form of dividends.
Key to achieving all of this is that we continue to provide great service and food in our
restaurants, and evolve our brands and offerings in line with changing consumer
trends.” – TRG 2014 Annual Report
4
“The Restaurant Group’s key objective is to grow shareholder value and the strategy
deployed to achieve this is to build a business capable of generating long-term,
sustainable and growing cash flows. In pursuit of this we have built a scalable business
model which is focused on the growing casual eating out market. We have targeted
areas of this market which offer distinct barriers to entry, where we can be
confident of delivering good growth in profits and cash flows and where there is
potential for high returns on investment. This has led the Group to focus on edge
and out of town leisure and retail developments, rural and semi-rural pubs and
our Concessions business which operates principally on airports. The Group
operates in the expanding casual dining market, and our offerings continue to provide
N62
good value for money in comfortable surroundings with excellent service from our
dedicated teams.
The Group’s strategy is to deliver further organic growth through the roll out of our
brands. We have a solid pipeline of sites for development, coupled with a strong focus
on continuing to deliver like-for-like sales growth from our existing restaurants. Our
Concessions business operates in a dynamic and complex market where our
management teams have market-leading expertise and a track record of innovation and
improving sales performance. The Group continues to look for opportunities to expand
this area of the business.” – TRG 2014 Annual Report
5
“Coast to Coast takes its inspiration from the Lincoln Highway, which spans the
United States of America from New York to San Francisco. This is reflected in our
great range of authentic food and drinks, all served with superb hospitality and service.
We offer the best of classic American food – Aberdeen Angus beef burgers, deep
dish style Chicago pizzas, distinctive steaks, amazing seafood dishes, wraps and
South-West American specials. Coast to Coast is more than just a restaurant, with
a great bar serving speciality cocktails and a wide range of beers, spirits and
traditional milkshakes. The music is an eclectic mix of Motown and American
Rock, songs you may not have heard in a little while, but are absolutely
guaranteed to lift your spirits and make you smile. We currently have five
restaurants open and see significant opportunities to grow Coast to Coast into a great
brand.” – TRG 2012 Annual Report
6
“The Restaurant Group is planning a major expansion of its new casual dining chain
Joe's Kitchen.
The company, which owns other brands including Frankie & Benny's, Garfunkel's and
Mexican concept Chiquito, plans to open 100 Joe's Kitchen outlets over the next
five to 10 years across the UK.
It has appointed Savills to advise on the expansion and is seeking sites of
between 3,000 sq ft and 4,000 sq ft.
It will focus on sites in prime high street locations, as well as shopping centres
and major mixed-use schemes.
Cities including London, Edinburgh, Manchester and Birmingham top the shopping list
which also includes second-tier regional cities and affluent market towns.
The all-day casual dining concept first opened in Borough, SE1, in 2005, and it
has since opened three more restaurants in Derby, Manchester Airport and

N63
Bromley.” – Expansion goes on the menu at Joe's Kitchen, Rolt Ember, Estates
Gazette, 12 September 2015
7
“Apollo, which owns the group alongside Oak Hill Capital Partners, Deutsche Bank
and York Capital Management, has agreed a debt-for-equity swap to reduce Tragus’s
debt burden.
Tragus’s large debt pile hindered the group during the downturn. Although mid-
market restaurants prospered in this period, Tragus’s large interest payments
meant that the group could not invest in its estate. Last year, it posted a £36m pre-
tax loss.
The decision to sell Strada caps a difficult period for the 56-strong chain of Italian
restaurants, which has suffered worse trading than the group’s Bella Italia and Café
Rouge brands. “If we were to carry on just parking and not investing in Strada, it
would not be good for the brand,” said Mr Richards. “The business is still
profitable. It has some fabulous sites.”” – Café Rouge Owner Tragus to Sell
Struggling UK Strada Brand, Duncan Robinson, Financial Times, 04 June 2014
8
“As a result of the strong financial performance in the year, the Board is
recommending a final dividend of 9.3p per share to give a total for the year of 15.4p, an
increase of 10% on the prior year. This dividend is covered almost two times by
earnings per share, in line with our stated dividend policy.” – TRG 2014 Annual
Report

N64
Value
TRG Is Trading at a Big Discount to Other Casual Dining Chains
U.K. casual dining chains are usually acquired at 10x EBITDA
- Biggest Negative:
o Share price is sensitive to like-for-like sales growth
- Key inputs
o Share price: 265 pence per share
o Number of outstanding shares: 199.4 million
o Market cap: £528 million
o EV: £560 million
o Current EBIT: £94 million
Excluding pre-opening expenses
o Normal EBIT: £89 million
Using 13% long-term median EBIT margin
Since 2005, when TRG sold other high street brands
o EV/Current EBIT: 5.96
o EV/Normal EBIT: 6.29
o Tax rate: 20%
- U.S. peers trade at about 12-14 EV/EBIT
o Darden
Main assets include
Olive Garden
10.3
12.5
14.5
10.0 9.8 10.3 11.3 10.4
13.3
8.1
EV/EBITDA
N65
o Average check: $16.5
LongHorn Steakhouse
o Average check: $18.75
Darden is trading at
$62.07 per share
EV: $8,090 million
10.80 EV/EBITDA
18.81 EV/EBIT
Darden’s margin is currently lower than normal
Current margin: 6%
Historical median margin: 8%
o Implies 14.95 EV/EBIT
Margin in good year: 10%
o Implies 12 EV/EBIT
Starboard’s plan is to improve Darden’s margin
o Brinker
Brinker owns
Chili’s Grill & Bar
o Average check: $14.52
Maggiano’s Little Italy
o Average check: $27
Brinker is trading at
$47.15 per share
EV: $3,736 million
8.19 EV/EBITDA
12.01 EV/EBIT
If we use historical median EBIT margin
o 15.18x EV/EBIT
o Cheesecake
Average check: $20.8
Cheesecake is trading at
$49.19 per share
EV: $2,494 million
9.10 EV/EBITDA
13.26 EV/EBIT
If we use historical median EBIT margin

N66
o 11.87x
o Bloomin
Bloomin owns
Outback Steakhouse
o Average check: $22
Carrabba’s Italian Grill
o Average check: $21
Bonafish
o Average check: $25
Fleming’s Prime Steakhouse & Wine Bar
o Average check: $72
Bloomin is trading at
$17.29 per share
EV: $3,330 million
7.27 EV/EBITDA
12.43 EV/EBIT
If we use historical median EBIT margin
o 12.43x
o Ruby Tuesday
Average check: $14
Ruby is trading at
$3.54 per share
EV: $390 million
5.00 EV/EBITDA
13.92 EV/EBIT
Ruby’s current margin is low
o Ruby has been in trouble
o Comparable store sales decline in 8 of the last 9 year
o The last time comparable store sales grew was in 2011
0.9%
o Comparable store sales decline in the last 3 years:
2013: 1%
2014: 5.3%
2015: 0.5%
Ruby’s current EBIT margin: 2.5%
Historical median EBIT margin: 6.7%
Implies 5.16 EV/EBIT
N67
o Bravo Brio
Bravo Brio owns 2 Italian restaurant chains
Bravo
o 51 restaurants
o Average check: $21.8
Lunch: $16.79
Dinner: $25
Brio Tuscan Grille
o Average check: $26.17
Lunch: $20.05
Dinner: $30.48
o 65 restaurants
Bravo Brio is trading at
$8.18 per share
EV: $231 million
5.93 EV/EBITDA
14.45 EV/EBIT
Bravo Brio has been in trouble
Comparable store sales declined in the last 3 years
o 2013: -2.8%
o 2014: -5.0%
o 2015: - 2.8%
EBIT margin declined:
o 2015: 3.9%
o Peak: 8.5%
In 2010
o Median 5.8%
Assuming median margin, Bravo Brio is trading at 9.40 EV/EBIT
o Chuy’s Holdings
Chuy’s is a fast-growing, full-service restaurant concept
Offering authentic and freshly-prepared Mexican and Tex Mex
inspired food
Average check: $14.23
Chuy’s is trading at
$33.46 per share
EV: $586 million
14.64 EV/EBITDA
N68
20.92 EV/EBIT
Chuy’s has grown very fast
Number of restaurants
o 2007: 8
o 2010: 23
o 2013: 48
o 2014: 59
o 2015: 69
5-year sales CAGR: 25%
- U.S. peers are less attractive than TRG
o Only Chuy’s has higher growth than TRG
o Other peers have lower growth
Darden, Ruby Tuesday, and Bravo Brio are struggling
Ruby has lower sales than 5 years ago
Bravo Brio’s 5-year sales CAGR was only 4.3%
o 2010: $343 million
o 2015: $424 million
Cheesecake’s growth has slowed down
Grew over 20% annually before 2006
5-year sales CAGR was only 4.8%
o 2010: $1,659 million
o 2015: $2,101 million
Bloomin’s 5-year sales CAGR was 3.8%
2010: $3,628 million
2015: $4,378 million
Brinker’s 5-year sales CAGR was 1%
2010: $2,858 million
2015: $3,002 million
o U.S. peers have lower ROIC
EBIT/NTA
TRG: 31%
Cheesecake: 26%
Chuy’s: 24%
Brinker: 23%
Darden: 23%
Bloomin: 22%
N69
Brio Bravo: 19%
- U.K. casual dining chains are often acquired at about 10x EBITDA
o Recent deals include
Gourmet Burger Chicken
In September 2010
Price: £30 million
EBITDA: £1.5 million
EV/EBITDA: 20
Wagamama
In March 2011
Price: £215 million
EBITDA: £20.9 million
o Wagamama’s EBITDA margin in 2011 was 19%
o It’s normal EBITDA margin is 16%
o => £17.4 million normal EBITDA at the time of the deal
EV/EBITDA: 10.3
o 12.4x normal EBITDA
Giraffe
In March 2013
Price: £49 million
EBITDA: £3.9 million
EV/EBITDA: 12.5
Byron
In October 2013
Price: £100 million
EBITDA: £6.9 million
EV/EBITDA: 14.5
Pizza Express:
In July 2014
Price: £900 million
EBITDA: £90 million
EV/EBITDA: 10
o Pizza Express is considered mature in the U.K.
o Has 443 sites
o Acquirer was Hony Capital
A Chinese private equity firm
N70
Honey might want to grow Pizza Express in China
Prezzo
In November 2014
Price: £304 million
Forward EBITDA: £31 million
EV/EBITDA: 9.8
Analysts urged Prezzo to reject the bid
1
o Price was low
Doesn’t reflect Prezzo’s prospect
Prezzo at that time had
o 200 Prezzo restaurants
o 37 Chimichanga restaurants
Ask and Zizzi
In December 2014
Gondola sold to Bridgepoint
Price: £250 million
EBITDA: £24.3 million
EV/EBITDA: 10.3
TGI Friday’s UK franchise
In December 2014
Price: £225 million
EBITDA: £19.9 million
EV/EBITDA: 11.3
Côte
In July 2015
Price: £250 million
EBITDA: £24 million
EV/EBITDA: 10.4
Las Iguanas
In July 2015
Price: £85 million
EBITDA: £6.4 million
EV/EBITDA: 13.3
YO! Sushi
In November 2015
Price: £81 million
N71
EBITDA: £10 million
EV/EBITDA: 8.1
YO! Sushi was rumored to be sold for £100-130 million in early
2015
o Implies 10-13 EV/EBITDA
o It was eventually sold for 8.1 times EBITDA
In November 2015
This might reflect the change in market valuation of
restaurants
- TRG is currently trading at only 6.1x EBITDA
o At 10x EBITDA, it’s worth £1,330 million
£1,298 million equity value
Or 651 pence per share
- Historically, TRG’s share price was sensitive to like-for-like sales growth
o On January 04, 2008, share price declined by 31%
From 176 pence per share
To 120 pence per share
o On January 14, 2016, share price declined by 14%
From 638 pence per share
To 550 pence per share
Reasons: like-for-like sales growth trended lower
Grew just 1.5% in December 2015
o On March 09, 2016, share price declined by 17%
From 540.5 pence per share
To 446 pence per share
Reason: like-for-like sales declined 1.5% for the first 10 weeks of 2016
o TRG was expensive in 2013-2015
P/E was between 19 and 25
Analysts were optimistic
Just in December 2015, UBS set TRG’s price target at 860 pence per
share
2
Expected over 1,000 possible additional locations
o Vs. management’s target of 250 additional sites
The least optimistic analyst set target at 635 pence per share
TRG was trading at 676.5 pence per share that day
o Declined to less than 390 pence per share today
o Within 3 months

N72
o TRG wasn’t expensive in the 2009-2013 period
P/E was between 9 and 13
“TRG appears less racy than its high street rivals”
3
- TRG was rumored as bid target
4
- Quan’s take: TRG share price can go up very quickly
1
“Peel Hunt analyst Nick Batram said there was "no doubt" TPG was buying Prezzo
at "a very attractive price" that was "not so good for independent shareholders".
The analyst urged them to reject the bid: "History has shown that independent
shareholders that have been able to hold unquoted equity have done well rejecting
unattractive bids in the past - Fitness First is a good example. Therefore, for those that
can, we would reject the bid."
Douglas Jack, analyst at Numis, said he expected many of the independent
investors "to conclude that this cash offer does not fully reflect the value and
future prospects of the business".
However, sources close to the situation said the offer valued the business in line
with recent leisure deals, for example the sale of restaurant rival Pizza Express to
Hony in July was done at roughly ten times its earnings and offered the Chinese
bidder huge Asian expansion opportunities.” – Prezzo Gobled up by TPG, Ashley
Armstrong, 06 November 2014, Telegraph
2
“Last month, the company said it had opened 25 new restaurants at that stage in
2015, and expected to open between 43 and 45 in the year as a whole, up from 40 in
2014. It expects to open as many again in 2016.
UBS thinks the opening plan could continue for the next five years.
“Management has a track record of delivering strong returns through value-creating
new site additions. Our detailed analysis of the existing restaurant locations of its
key brands F&B, Chiquito and Coast to Coast versus town population density
suggests over 1,000 possible additional locations (280% site uplift), versus the
circa 250 sites that management targets (c70% site uplift),” writes Analyst Heidi
Richardson.
“While our base case is more conservatively set, the analysis supports our view that
TRG could accelerate its restaurant roll-out rate, adding 45-50 sites per annum through

N73
the forecast period, and highlights the scale of the group’s potential medium-term
upside,” she adds.
If the company does manage to meet the UBS forecast for new openings, then
this would drive double-digit revenue growth for 18 years assuming 2.5% like-for-
like sales growth, Richardson says.
“We believe that a combination of management initiatives to continue driving volume,
and a more favourable pricing environment, will see sustainable like-for-like sales
growth going forward, following the average 2.6% like-for-like growth posted in 2011-
14. We also see limited risk from wider market supply growth given that total
restaurant numbers in the UK are declining, while TRG’s predominantly out-of-
town locations provide a controlled supply environment,” she writes.
UBS is forecasting that the company will report 10.5% compound annual revenue
growth between 2015 and 2019, and 12.0% compound earnings growth over the
same period.
It is starting coverage of the stock with a Buy rating and a 860 pence target price.
Restaurant Group shares are up 3.2% at 676.50 pence on Friday, meaning they are
up 2.5% for the year-to-date.
The wider analyst community is overwhelmingly positive about the stock. Four have it
at Strong Buy, six at Buy, three at Hold and just one at Sell, according to data
compiled by Thomson Reuters.
Nomura is the bank with a Reduce rating on the stock. It downgraded it in November
from Neutral, warning that the impending introduction of the National Living Wage
would hit Restaurant Group’s margins. It thinks the market is under-appreciating the
impact the higher wage bill will have on the company.
It thinks the UK restaurant industry will try and pass higher wage costs on to customers,
but thinks this would put pressure on like-for-like sales growth.
Nomura cut its price target on Restaurant Group to 635 pence when it downgraded the
stock last month.” – Restaurant Group growth set to continue as it plans more
openings, 18 December 2015 News Markets
3
“TRG was the only listed restaurant group to increase earnings in 2009. Yet this
does not appear to be reflected in its rating. The shares are trading on about 11.4

N74
times 2010 pre-tax profit of 49.6m, compared with Clapham House's 16.9 times or
Carluccio's' 16.5 times. One reason could be that in terms of brand TRG appears
less racy than its high street rivals. But investors ignore TRG at their peril. The
current year has started well and with the group likely to pay off all its debt in three
years or expand, it is well positioned to create further value.” – Blockbuster Films Help
TRG Defy Recession, Pan Kwan Yuk, Financial Times, 03 March 2010
4
“Sales from sites open for more than a year slumped by 1.5pc in the first 10 weeks of
2016, said the company, which also owns the Chiquito, Coast to Coast and Garfunkel's
brands, in its annual results. The recent weak trading rattled investors, who sent
Restaurant Group's stock to its lowest in three years, and prompted analysts at
brokers Peel Hunt and Cenkos to warn the business is now a potential target for
buy-out firms.
Private equity houses own many of the branded casual dining chains that have grown
explosively in recent years, including Nando's and Las Iguanas, and which are
increasingly vying with Restaurant Group for customers. Buy-out firms find restaurant
chains attractive because they can be expanded quickly and are highly cash-
generative.
"We wonder how long before private equity predators look to capitalise on the
group's strong trading positions," Simon French, of Cenkos, said following
Restaurant Group's share price plunge. Nick Batram, analyst at Peel Hunt, added: "We
believe private equity may start running the slide rule over the business."
However, despite the mounting speculation, Danny Breithaupt, chief executive of
Restaurant Group, said the company, which reported an 11.2pc rise in pre-tax
profits to PS86.8m, had not received any approaches from interested bidders.
Full-year revenues rose 7.9pc to PS685.4m.” – Frankie & Benny's Seen as Bid Target
After It Warns of Tough Trading, Ben Martin, Telegraph, 10 March 2016

N75
Growth
TRG Can Keep Opening 40-50 Restaurants a Year
TRG has potential to open up to about 900 restaurants
- Biggest Negative:
o Like-for-like sales growth is hard to predict
- The casual dining market is less mature than in the U.K. than in the U.S.
o According to Mintel, the U.S. restaurant market: $482 billion
In 2014
Including
Limited-service restaurant: 41.9%
o (fast food, fast casual)
o $202 billion
Full-service restaurant: 49.6%
o $239 billion
o Mintel estimate the casual dining market at $124 billion
Including restaurants with average check
Between $8 and $20 per entrée
$20 per person
Example: Red Lobster, Chili’s, Applebee’s
o => casual dining is about 25.7% of the market
Fine/upscale dining is about 23.9% of the market
Other limited service: 8.5%
261
86
21 54 61 23
506
350
200
100 100 80 60
890
2015 Potential
N76
o (snack and beverage bars, cafeterias/grills/grill buffets)
o $41 billion
o The U.K.’s Office of National Statistics (ONS) estimate the total consumer
spend on catering services: £87.6 billion
o Industry consultants say this number massively overstates the market
Horizons said that ONS’s figure includes
All drink served in pubs
o Whether or not it was consumed with food
Overnight hotel accommodation
o If you have spent £20 on a night in a pub
o then slept it off in a hotel charging £80 for the overnight
stay
o ONS says that you have spent £100 on eating out
o Horizons estimates the U.K. out-of-home food service market at £46.6 billion
In 2014
Managed pubs accounted for 30.3% of restaurant meals
In 2013
o NPD estimates U.K.’s out-of-home food service market: £52.2 billion
In 2015
Including
Restaurants
QSR
Food served in pubs, hotel, and other venues
o Allegra has a different estimate
(TRG uses Allegra data)
Total market: £57.61 billion
Service-lead restaurant: £20.91 billion
Fast food and take away: £12.78 billion
Pubs: £23.92 billion
o Mintel has a far different estimate:
2015: £31.05 billion
Fast food: £9.7 billion
o (excluding coffee shops)
2014: £30.47 billion
Fast food: £9.4 billion
Mintel says the market include
Takeaway and fast food,
N77
Full-service restaurant
Pubs/clubs/taverns/bars etc.
Mintel’s estimate might be close to Allegra if the £30 billion number
doesn’t include pubs
o NPD estimate the casual dining market at £4.7 billion
(Restaurants with average spend per head between £10-20)
o These data show the restaurant market is underpenetrated in the U.K.
According to Mintel
U.S. restaurant market: $482 billion
U.K. restaurant market: £30.47 billion (about $48 billion)
=> U.S. restaurant market is 10x bigger
o But the U.S. population is only 5x
According to Allegra, Horizons, and NPD
U.K. out-of-home food service: about £50 billion ($80 billion)
U.S. out-of-home food service is about $500 billion
o (if including Bars and Taverns)
o Source: National Restaurant Association
=> U.S. out-of-home food service is 6.25x bigger
According to Allegra, service-led restaurant market is just £20.91 billion
Or about $33 billion
=> 7.25 times less than U.S. full-service restaurant market
o $239 billion
According to NPD, U.K. casual dining market is £4.7 billion
Or about $7.5 billion
o 16x less than the U.S. casual dining market
The U.K. eat-out market seems dominated by
Fast food and takeaway: 31% (according to Mintel)
o Average spend per head: £3-5
Pubs: 30% (according to Horizons)
o Average spend per head: £5-10
According to Allegra
o Fast food, takeaway, and pubs: 64% of market
These data indicate that full-service restaurant + fast casual
represent about 36-39% of U.K. eat out market
o Full-service restaurants represent about 50% of the U.S
eat out market
o Fact: the fastest growing segments in the U.K. are
N78
Fast casual
Casual dining
o Trends are:
British will drink out less and eat out more
Fast casual and casual dining will grow faster than the market
Branded restaurants gain market share
According to Allegra, service-led restaurant market: £20.38 billion
o (in 2015)
o Independent restaurants: £15.49 billion
3-year CAGR: -1.6%
76% market share
Declined from 80% in 2012
o Branded restaurants: £4.89 billion
3-year CAGR: 6.1%
24% market share
Increased from 20% in 2012
- TRG can continue opening more restaurants
o TRG currently has 506 restaurants
Frankie & Benny’s: 261
Chiquito: 86
Coast to Coast: 21
Pub restaurants: 54
Concessions: 61
Other: 23
o TRG’s expectation about its market potential: 850-950+
Frankie & Benny’s: 350+
Chiquito: 200+
Coast to Coast: 100+
Pub restaurants: 100+
Concessions: 80+
Other: 60+
o Frankie & Benny’s (F&B) is already very big
261 sites in the U.K. is equivalent to 1,305 sites in the U.S.
Few casual dining chains have more than 1,000 sites in the U.S.
o Applebee’s has 1,878 sites in the U.S.
o IHOP has 1,441 sites in the U.S.
o Chili’s has 1,252 sites in the U.S.
N79
Brinker said 34% of Chili’s sites in the U.S. are
operated by franchisees
It owns 826 sites in the U.S.
o Olive Garden has 840 restaurants in the U.S.
o Outback Steakhouse has 753 restaurants in the U.S.
o Ruby Tuesday has 687 restaurants in the U.S.
o 350 sites can be a realistic target for F&B
Pizza Express has 443 sites
With similar average spend per head: £15
Pizza Express compete against many big Italian chains
Prezzo: 234 sites
Zizzi: 141 sites
Ask: 111 sites
Carluccio’s: 98 sites
Bella Italia: 97 sites
o U.K. chains are predominantly Italian and pubs
Among the top 40 biggest casual dining chains
(Source: Morar Consulting)
These chains had a total of 4,970 outlets as of 2015
Pub restaurants totaled 1,902 outlets
Italian chains totaled 1,358 outlets
o Including 270 Pizza Hut sites
Focus on pizza
=> Italian chains and pubs account for almost 2/3 of total outlets
American-themed chains totaled 334 outlets
o Including
F&B: 261
TGI Friday’s: 73
o Adding Coast to Coast result in 355 outlets
o These chains have similar menus
Pizzas
Burger
Steaks
Ribs
Japanese chains totaled 194 outlets
o Wagamama: 119
o YO! Sushi: 75
N80
French chains totaled 181 outlets
o Café Rouge: 90
o Côte: 73
o Brasserie Blanc: 18
Mexican chains totaled 144 outlets
o Chiquito: 86
o Chimichanga: 38
o Wahaca: 20
o It’s possible that F&B, Chiquito and Coast to Coast will continue to penetrate
the market
There are 1,550 leisure and retail parks/schemes in the U.K.
242 of these schemes have development proposal
79 new schemes in pipeline from 2016 to 2021
Chiquito and Coast to Coast can follow F&B footprint
o Since 2005, store-count grew 7.9% annually
2005: 237 stores
2015: 506 stores
o It’s likely that TRG can open 40-50 restaurants a year
TRG plans to open 41 restaurants in 2016
Opened 44 restaurants in 2015
o 40 restaurants in 2014
o If TRG opens 200 restaurants in the next 5 years
Annual store-count growth would be 6.9%
- Same-store-sales (SSS) growth is uncertain
o Historically SSS growth was about 3%
o However, there’s concern about overcapacity in the market
According to AlixPartners and CGA Peach
1
The number of restaurants increased by 6.9%
o (In the year to June 2015)
While the number of drink-led pubs and bars declined by 4.4%
For the whole year in 2015
The number of food-led premises rose 1.6%
o While the number of drink-led premises declined by 1.2%
Restaurant openings have slowed recently
2
Managed pub and restaurant businesses grew 1.5% in 2015
o Down from 2.8% in 2014
o Oversupply can create challenges for SSS growth

N81
o But restaurant chains are sensitive to SSS growth
It’s unreasonable to expect them to continue opening stores
When SSS declines
Overcapacity may have a smaller impact on TRG than on competitors
Independent stores are the most vulnerable
o They have lower margins
Sales per outlet is ½ that of branded outlets
They’re likely to have lower sales per square foot
Other chains are mostly owned by P-E firms
o Have a lot of debt
Supply is more controlled in TRG’s locations
=> unreasonable to expect TRG’s SSS to decline in the long run
Reasonable expectation: 1-3% growth
- Conclusion
o TRG can grows in the high single digit over the next 5 years
o TRG can double its sales in the longer term
850-950 sites
1
“Despite the continuing closure of pubs across Britain, the eating and drinking
out market saw a net 1,770 new restaurants open in the last 12 months, according
to latest data compiled for the new Market Growth Monitor from AlixPartners and CGA
Peach.
The contrast between the 6.9% growth in restaurant sites and the 4.4% decline in
drink-led pubs and bars – including a 5.1% fall in community pub numbers – in
the year to the end of June reflects the continuing shift in consumer preferences
towards eating-out occasions.
The first quarterly Monitor figures show that there was growth too in numbers of
wine bars, café bars and food-led pubs – the latter increasing by 1.1% over the
last 12 months. Branded food pubs saw a 9% growth in numbers – and the bulk
of the overall growth in restaurants came from the, largely branded, chain
restaurant market.” – New Restaurant Openings top 1,700, Peter Margin, Market
Growth Monitor, September 2015
2
“The Monitor’s data from CGA’s Outlet Index shows Britain’s number of drink-
led licensed premises fell by 1.2% in the year to December 2015 – equivalent to
808 sites.
N82
However, the number of food-led premises rose by 1.6% during the same period,
thanks largely to the roll-out of casual dining operators around the country.
The net result is Britain had more than 124,000 licensed premises in December, up by
0.1% on the same point a year earlier.
After years of steady decline driven by the closure of drink-led pubs, the figures show
restaurants have restored the licensed trade to expansion mode. But overall growth
of 0.1% is significantly lower than the totals revealed in the previous two editions
of the Market Growth Monitor.
This indicates the pace of restaurant openings is slowing due, in part, to fragile
consumer confidence and the availability and costs of property. The findings on
supply echo similarly modest trends in sales during the past year.
The Coffer Peach Business Tracker measured 1.5% growth for managed pub and
restaurant businesses in 2015, well down on the 2014 figure of 2.8%.
It has prompted speculation although many casual dining chains continue to expand,
restaurant supply might soon start to outstrip demand in some places.” – CGA’s Peach
Market Growth Monitor – pace of restaurant openings slows, Eat Out Magazine, 26
February 2016

N83
Misjudgment
The U.K. Stock Market Doesn’t Know How to Value The Restaurant Group
TRG was expensive in 2013-2015 but cheap in other periods
- Biggest Negative:
o TRG has a new chairwoman
- What is the impact of higher minimum wage?
o Minimum wage was
Apprentice: £3.30
Under 18: £3.87
18-20: £5.30
21 and over: £6.70
o Current minimum wage (from April 2016)
Apprentice: £3.30
Under 18: £3.87
18-20: £5.30
21-24: £6.70
25 and over: £7.20
o The U.K. government plans to increase minimum wage to £9 per hour
By the end of the decade
o For 2016, TRG expect £2 million direct cost impact
o It’s unclear what the long-term impact is on the restaurant industry
The industry may use less labor
10.8
13.8 13.6
15.9
21.1
20.0 20.1
11.4
2009 2010 2011 2012 2013 2014 2015 2016
TRG's P/E at year-end
N84
Waiters don’t like their employers to hire more workers
o They want to work on as many table as possible
To maximize tips
The industry may pass prices on to customers
And experience slower growth
Or the industry may have lower profit
This might be a reason to be negative on the industry
But Greggs is trading at
o 1,097 pence per share
o 9.4 EV/EBITDA
o 14.5 EV/EBIT
- TRG has a new chairwoman
o Alan Jackson retired recently
He had informed shareholders of his retirement in 2014
o Alan Jackson and Andrew Page were responsible for TRG’s success
1
Alan Jackson was appointed Executive chairman in 2001
Andrew Page joined as finance director
2 months later
Alan Jackson became non-executive chairman in 2006
When Andrew Page was promoted to CEO
TRG was facing troubles at the time
Had too many brands
Its biggest brands was declining
o Deep Pan Pizza
Other high street brands was struggling
Andrew Page helped change the culture and mindset at TRG
Focus firmly on cash flow and generating returns
Focus on out-of-town leisure and retail site
o Andrew Page retired in 2014
He was succeeded by Danny Breithaupt
Breithaupt had started off at the bottom at the Casual Dining Group
Casual Dining Group was acquired by Whitbread
=> he worked with Whitbread from 1995
o For a number of year
o They had a fantastic development program
Breithaupt also joined TRG in 2001
2
He held a number of senior positions within Frankie & Benny’s
N85
Became
o Operations Director in 2003
o Managing Director in 2009
Grew Frankie & Benny’s from 75 to over 200 units
He launched Coast to Coast
o In 2011
He became MD of TRG’s leisure division
o In 2012
He became CEO in 2014
o Danny Breithaupt can be a good CEO like Andrew Page
o Alan Jackson retired
Debbie Hewitt is the new non-executive Chairwoman
Debbie Hewitt served as the Managing Director of RAC Plc.
A British automotive service company
She also worked at Mark and Spencer
She’s chairman of Moss Bros Group
One of the U.K.’s top menswear stores
Market cap: £94 million
Revenue: £115 million
EBIT: £5 million
She’s non-executive director of Redrow plc. since 2009
And has been its Senior Independent Director since 2014
Redrow is a residential development company
o Market cap: £1.5 billion
o EV: £1.7 billion
o 2015 Revenue: £1,150 million
o 2015 EBIT: £213 million
She has been Senior Independent Non-Executive Director of NCC
Group
An information assurance company, providing
o Escrow and verification
o Security consulting
o Web performance
o Domain services
Market cap: £676 million
EV: £749 million
Revenue: £134 million
N86
EBIT: £23 million
She may know nothing about TRG’s business
- Will U.K. restaurants make lower margin?
o It’s possible that U.K. restaurants don’t really make higher ROIC than U.S.
restaurants
They have lower asset turnover
Sales/Average NTA:
U.K. chains:
o TRG: 2.35x
o Gondola: 2.20x
o Prezzo: 1.61x
U.S. chains:
o Bloomin: 3.92x
o Bravo Brio: 2.93x
o Brinker: 2.75x
o Cheesecake: 2.73x
o Darden: 2.67x
o Chuy’s Holdings: 2.53x
o Ruby Tuesday: 1.53x
o TRG is just an outperformer
TRG has one of the highest EBITDA margin in the industry
o If there’s a decline in margin
There’s must be a lot of openings
The industry must expand
New openings may hurt TRG’s competitors more
Independent stores are the most vulnerable
o They have lower margins
Sales per outlet is ½ that of branded outlets
They’re likely to have lower sales per square foot
Other chains are mostly owned by P-E firms
o Have a lot of debt
Supply is more controlled in TRG’s locations
- The market seems inefficient
o TRG’s share price was sensitive to like-for-like sales growth
On January 04, 2008, share price declined by 31%
From 176 pence per share
To 120 pence per share
N87
On January 14, 2016, share price declined by 14%
From 638 pence per share
To 550 pence per share
Reasons: like-for-like sales growth trended lower
o Grew just 1.5% in December 2015
On March 09, 2016, share price declined by 17%
From 540.5 pence per share
To 446 pence per share
Reason: like-for-like sales declined 1.5% for the first 10 weeks of
2016
TRG was expensive in 2013-2015
P/E was between 19 and 25
Analysts were optimistic
Just in December 2015, UBS set TRG’s price target at 860 pence
per share
3
o Expected over 1,000 possible additional locations
Vs. management’s target of 250 additional sites
o The least optimistic analyst set target at 635 pence per
share
o TRG was trading at 676.5 pence per share that day
Declined to less than 390 pence per share today
Within 3 months
TRG wasn’t expensive in the 2009-2013 period
P/E was between 9 and 13
“TRG appears less racy than its high street rivals”
4
o A similar story:
Over 90% of Greggs stores were on high streets
The great recession came
Greggs also faced competition from supermarket in traditional bakery
Like-for-like sales growth was weak
2009: 0.8%
2010: 0.2%
2011: 1.4%
2012: -2.7%
2013: -0.8%
People started thinking that Greggs became obsolete

N88
Share price stay below 500 pence per share for years
P/E stayed in the 12-13 range
But Greggs transformed into a food-on-the-go chain
It opened stores away from high street
o Retail parks
o Bus terminal
o Train stations
o Industrial estates
o Where people are at
Work
Travel
Leisure
Greggs refitted its stores
o Removed things like bread slicer or bread ovens
o Add seating to the stores
Revamped its menu
o Added “healthy sandwich” range
o Relies less on traditional bakery products
Sandwich: 1/3 of revenue
Savory: 1/3 of revenue
Drinks: 1/6 of revenue
Result:
Same store sales grew again
o 2014: 4.5%
o 2015: 4.7%
Share price more than doubled to 1,000-1,200 pence per share
o 18-20 P/E
1
“With the support of the new chairman, Alan Jackson, who had joined CCR two
months earlier, Page set about changing the culture and mindset of the business,
which owns the Chiquito, Frankie & Benny's, Garfunkel's, Est Est Est, and Caffé Uno
brands.
By placing the emphasis firmly on cash-flow and generating returns, along with
career development and reward programmes for staff, he initiated 18 months of
pain, but an approach that ultimately led to last month's confirmation of recovery with a
great set of interim results.

N89
Now called The Restaurant Group, the company showed record pre-tax profits for the
six months to 30 June, up 40% to £9.8m on sales of £118m.
With the turnaround complete, The Restaurant Group is ramping up its
expansion programme. Page aims to grow the group from 260 to 300 sites by the
end of 2005, building on its lucrative presence in leisure-park sites by moving
into out-of-town retail sites, which are growing at the expense of the high street.” –
From Pariah to a City Trading, Karl Cushing, Caterer & Hotelkeeper, 07 October 2004
2
“TRG has a new chief executive who’s already making his mark with some exciting
developments at TRG, the group he’s worked for since 2001. Andrew Pring talks with
Danny Breithaupt about why he’s “Proud to be TRG”
Danny Breithaupt became Chief Executive of The Restaurant Group in September
last year. He joined TRG in 2001, within the Frankie & Benny’s division, becoming
Operations Director in 2003 and MD in 2009 and growing it from 75 to over 200
units. In 2011 he launched Coast to Coast and in 2012 was appointed MD of
TRG’s Leisure division.” – Interview with Danny Breithaupt, Eat Out Magazine, 10
January 2015
3
“Last month, the company said it had opened 25 new restaurants at that stage in
2015, and expected to open between 43 and 45 in the year as a whole, up from 40 in
2014. It expects to open as many again in 2016.
UBS thinks the opening plan could continue for the next five years.
“Management has a track record of delivering strong returns through value-creating
new site additions. Our detailed analysis of the existing restaurant locations of its
key brands F&B, Chiquito and Coast to Coast versus town population density
suggests over 1,000 possible additional locations (280% site uplift), versus the
circa 250 sites that management targets (c70% site uplift),” writes Analyst Heidi
Richardson.
“While our base case is more conservatively set, the analysis supports our view that
TRG could accelerate its restaurant roll-out rate, adding 45-50 sites per annum through
the forecast period, and highlights the scale of the group’s potential medium-term
upside,” she adds.
If the company does manage to meet the UBS forecast for new openings, then
this would drive double-digit revenue growth for 18 years assuming 2.5% like-for-
like sales growth, Richardson says.

N90
“We believe that a combination of management initiatives to continue driving volume,
and a more favourable pricing environment, will see sustainable like-for-like sales
growth going forward, following the average 2.6% like-for-like growth posted in 2011-
14. We also see limited risk from wider market supply growth given that total
restaurant numbers in the UK are declining, while TRG’s predominantly out-of-
town locations provide a controlled supply environment,” she writes.
UBS is forecasting that the company will report 10.5% compound annual revenue
growth between 2015 and 2019, and 12.0% compound earnings growth over the
same period.
It is starting coverage of the stock with a Buy rating and a 860 pence target price.
Restaurant Group shares are up 3.2% at 676.50 pence on Friday, meaning they are
up 2.5% for the year-to-date.
The wider analyst community is overwhelmingly positive about the stock. Four have it
at Strong Buy, six at Buy, three at Hold and just one at Sell, according to data
compiled by Thomson Reuters.
Nomura is the bank with a Reduce rating on the stock. It downgraded it in November
from Neutral, warning that the impending introduction of the National Living Wage
would hit Restaurant Group’s margins. It thinks the market is under-appreciating the
impact the higher wage bill will have on the company.
It thinks the UK restaurant industry will try and pass higher wage costs on to customers,
but thinks this would put pressure on like-for-like sales growth.
Nomura cut its price target on Restaurant Group to 635 pence when it downgraded the
stock last month.” – Restaurant Group growth set to continue as it plans more
openings, 18 December 2015 News Markets
4
“TRG was the only listed restaurant group to increase earnings in 2009. Yet this
does not appear to be reflected in its rating. The shares are trading on about 11.4
times 2010 pre-tax profit of 49.6m, compared with Clapham House's 16.9 times or
Carluccio's' 16.5 times. One reason could be that in terms of brand TRG appears
less racy than its high street rivals. But investors ignore TRG at their peril. The
current year has started well and with the group likely to pay off all its debt in three
years or expand, it is well positioned to create further value.” – Blockbuster Films Help
TRG Defy Recession, Pan Kwan Yuk, Financial Times, 03 March 2010

N91
Future
TRG Will Make £1 Billion Revenue Someday
TRG can grow revenue by 30-40% over the next 5 years
- Biggest Negative:
o Like-for-like sales growth can be weak
o Margin can decline
- In the next 5 years, TRG will
o Keep opening new restaurants
o Maintaining 50% or more dividend payout
As store count growth declines
- Opening 150 stores over 5 years is very likely
o TRG may have 656 stores by 2021
o And it can still open 40-50 stores for several years
- Margin and same store sales growth are less certain
- In a bad scenario
o Restaurant openings in the industry continues at a high rate
o Higher minimum wage hurts the industry
o TRG may have flat same store sales growth over the next 5 year
o Industry margin declines by 3%
TRG’s EBIT margin declines to 10%
The level TRG made in 1998-2005
o Today’s sales per store is £1.355 million per store
£685
£889
£984
2015 2020 - Bear Case 2020 - Bull Case
Revenue (£ millions)
N92
o In 2021, TRG would make
£889 million revenue
£89 million EBIT
Assuming 10% EBIT margin
£71 million after-tax earnings
At 15x earnings, TRG will be worth £1,065 million
=> 13.7% annual growth from today’s EV of £560 million
Adding 4.1% dividend yield
o => 17.8% return
- In a more reasonable scenario
o 2% annual sales store growth
o EBIT margin is stable around 13%
o Sales per store would be £1.5 million in 2021
o => total revenue: £984 million
o Potential EBIT: £128 million
o Potential after-tax earnings: £102 million
o At 15x earnings, TRG will be worth £1,530 million
=> 22.3% annual growth from today EV of £809 million
Adding 4.1% dividend yield => 26.4% return