Smartphone Addiction and Sleep Disturbances Among Medical Students: A Cross-Sectional Study PDF Free Download
1 / 12/12
100%

Review began 08/29/2025
Review ended 09/06/2025
Published 09/10/2025
© Copyright 2025
BH et al. This is an open access article
distributed under the terms of the Creative
Commons Attribution License CC-BY 4.0.,
which permits unrestricted use, distribution,
and reproduction in any medium, provided
the original author and source are credited.
DOI: 10.7759/cureus.91985
Smartphone Addiction and Sleep Disturbances
Among Medical Students: A Cross-Sectional Study
Gayathri BH , Sravan JS , Sweta Shah , Sajidali S. Saiyad
1. Physiology, Pacific Medical College and Hospital, Udaipur, IND 2. Forensic Medicine, Pacific Medical College and
Hospital, Udaipur, IND 3. Forensic Medicine and Toxicology, All India Institute of Medical Sciences, Bhopal, Bhopal,
IND 4. Physiology, Ram Krishna Dharmarth Foundation (RKDF) Medical College Hospital & Research Centre, Bhopal,
IND
Corresponding author: Sravan JS, jssravan@gmail.com
Abstract
Background
Smartphone use has become prevalent among young adults to the extent that it is affecting their sleep and
overall well-being. First-year MBBS students, who are new to academic and environmental changes, may be
particularly vulnerable to sleep disturbances. This study aims to explore the prevalence of smartphone
addiction and sleep quality in this population.
Methods
This cross-sectional study was conducted among first-year MBBS students of a private medical college in
central India. The study aimed to assess the prevalence of smartphone addiction and poor sleep quality,
evaluate the correlation between them, and examine whether gender-wise differences were prevalent.
Eighty-nine students voluntarily agreed to participate in the study. Data were collected using the
Smartphone Addiction Scale-Short Version (SAS-SV) and the Pittsburgh Sleep Quality Index (PSQI).
Qualitative variables were represented as frequencies and percentages; quantitative variables were reported
as mean along with standard deviation. Chi-square was applied for statistical significance, and a p-value
<0.05 was considered. Pearson correlation was used to analyze the relation between two variables.
Results
Among the 89 participants, 55.1% were found to have addiction to smartphones, and 53.9% had poor sleep
quality. SAS-SV showed good reliability (α = 0.747), while PSQI showed lower internal consistency (α =
0.401). Significant associations were between components of PSQI, like subjective sleep quality, sleep
efficiency, and total SAS-SV score. No significant correlation was found between total smartphone addiction
scores and global sleep quality scores (r = 0.126, p = 0.254).
Conclusion
Smartphone addiction and poor sleep are very prevalent among first-year MBBS students. No significant
association was found between poor sleep and mobile addiction, but PSQI components, subjective sleep
quality, and sleep efficiency showed a significant association with mobile addiction. Awareness programs
focusing on responsible smartphone use and healthy sleep habits are the need of the hour, especially in
medical students, who are particularly vulnerable to academic stress.
Categories: Psychology, Medical Education, Public Health
Keywords: medical education, pittsburgh sleep quality index, sleep disturbances, sleep quality, smartphone
addiction, smartphone addiction scale-short version (sas-sv)
Introduction
Mobile phones have become a ubiquitous part of our daily lives. Although phones have made life more
convenient and safer on one side, excessive use of mobile phones has led to numerous adverse side effects,
such as tiredness, stress, headaches, and difficulty in concentration, which definitely affect academic
performance [1]. The continuous use of something for the sake of relief, comfort, or stimulation, which often
causes cravings when it is absent, is defined as addiction by the WHO [2]. Therefore, excessive mobile use
can be considered a behavioral addiction.
Kwon et al. defined smartphone addiction as users underestimating the amount of time spent on their
smartphones or being unable to regulate their use, resulting in negative consequences in daily life [3].
Research shows that 41.9% of Asian medical students had smartphone addiction, and it is positively
correlated with poor sleep quality [4,5].
1 2, 3 4 1
Open Access Original Article
How to cite this article
BH G, JS S, Shah S, et al. (September 10, 2025) Smartphone Addiction and Sleep Disturbances Among Medical Students: A Cross-Sectional
Study. Cureus 17(9): e91985. DOI 10.7759/cureus.91985

This may be due to rigorous academic schedules, prolonged study sessions, examination stress, and high
parental expectations and digital media use [2]. Use of mobile phones, especially engaging in social media
platforms, provides a sense of satisfaction and helps in escaping from real-world stress. This leads to a
reinforcement mechanism, often causing increased mobile phone use [4].
Sleep is very important to maintain adequate physical and mental well-being. Lowry et al. reported that on
average, 15% of college students were unsatisfied with their quality of sleep [6].
Many studies have reported that sleep disturbance will adversely affect cognitive skills, emotional
intelligence, and academic performance [4,7]. This ultimately alters their work performance in the long run
as medical practitioners, which can have a significant impact on healthcare.
This study aims to explore the prevalence and association of smartphone addiction and poor sleep quality
among first-year MBBS students at a private medical college in Bhopal, a tier 2 city in central India.
Materials And Methods
Study design
This is a cross-sectional, observational study, conducted among consenting first-year medical graduates of a
private medical college in Bhopal. In this study, we evaluated the relationship between smartphone
addiction and poor sleep quality using standardized questionnaires.
Study population and sample size
The total strength of the first-year batch of medical students was 150. A formal sample size calculation was
not conducted prior to data collection due to the convenience-based nature of participant recruitment
within the institutional setting. Out of 106 total consenting participants, 17 responses were excluded due to
incomplete questionnaire responses. A total of 89 participants (n=89) voluntarily completed both
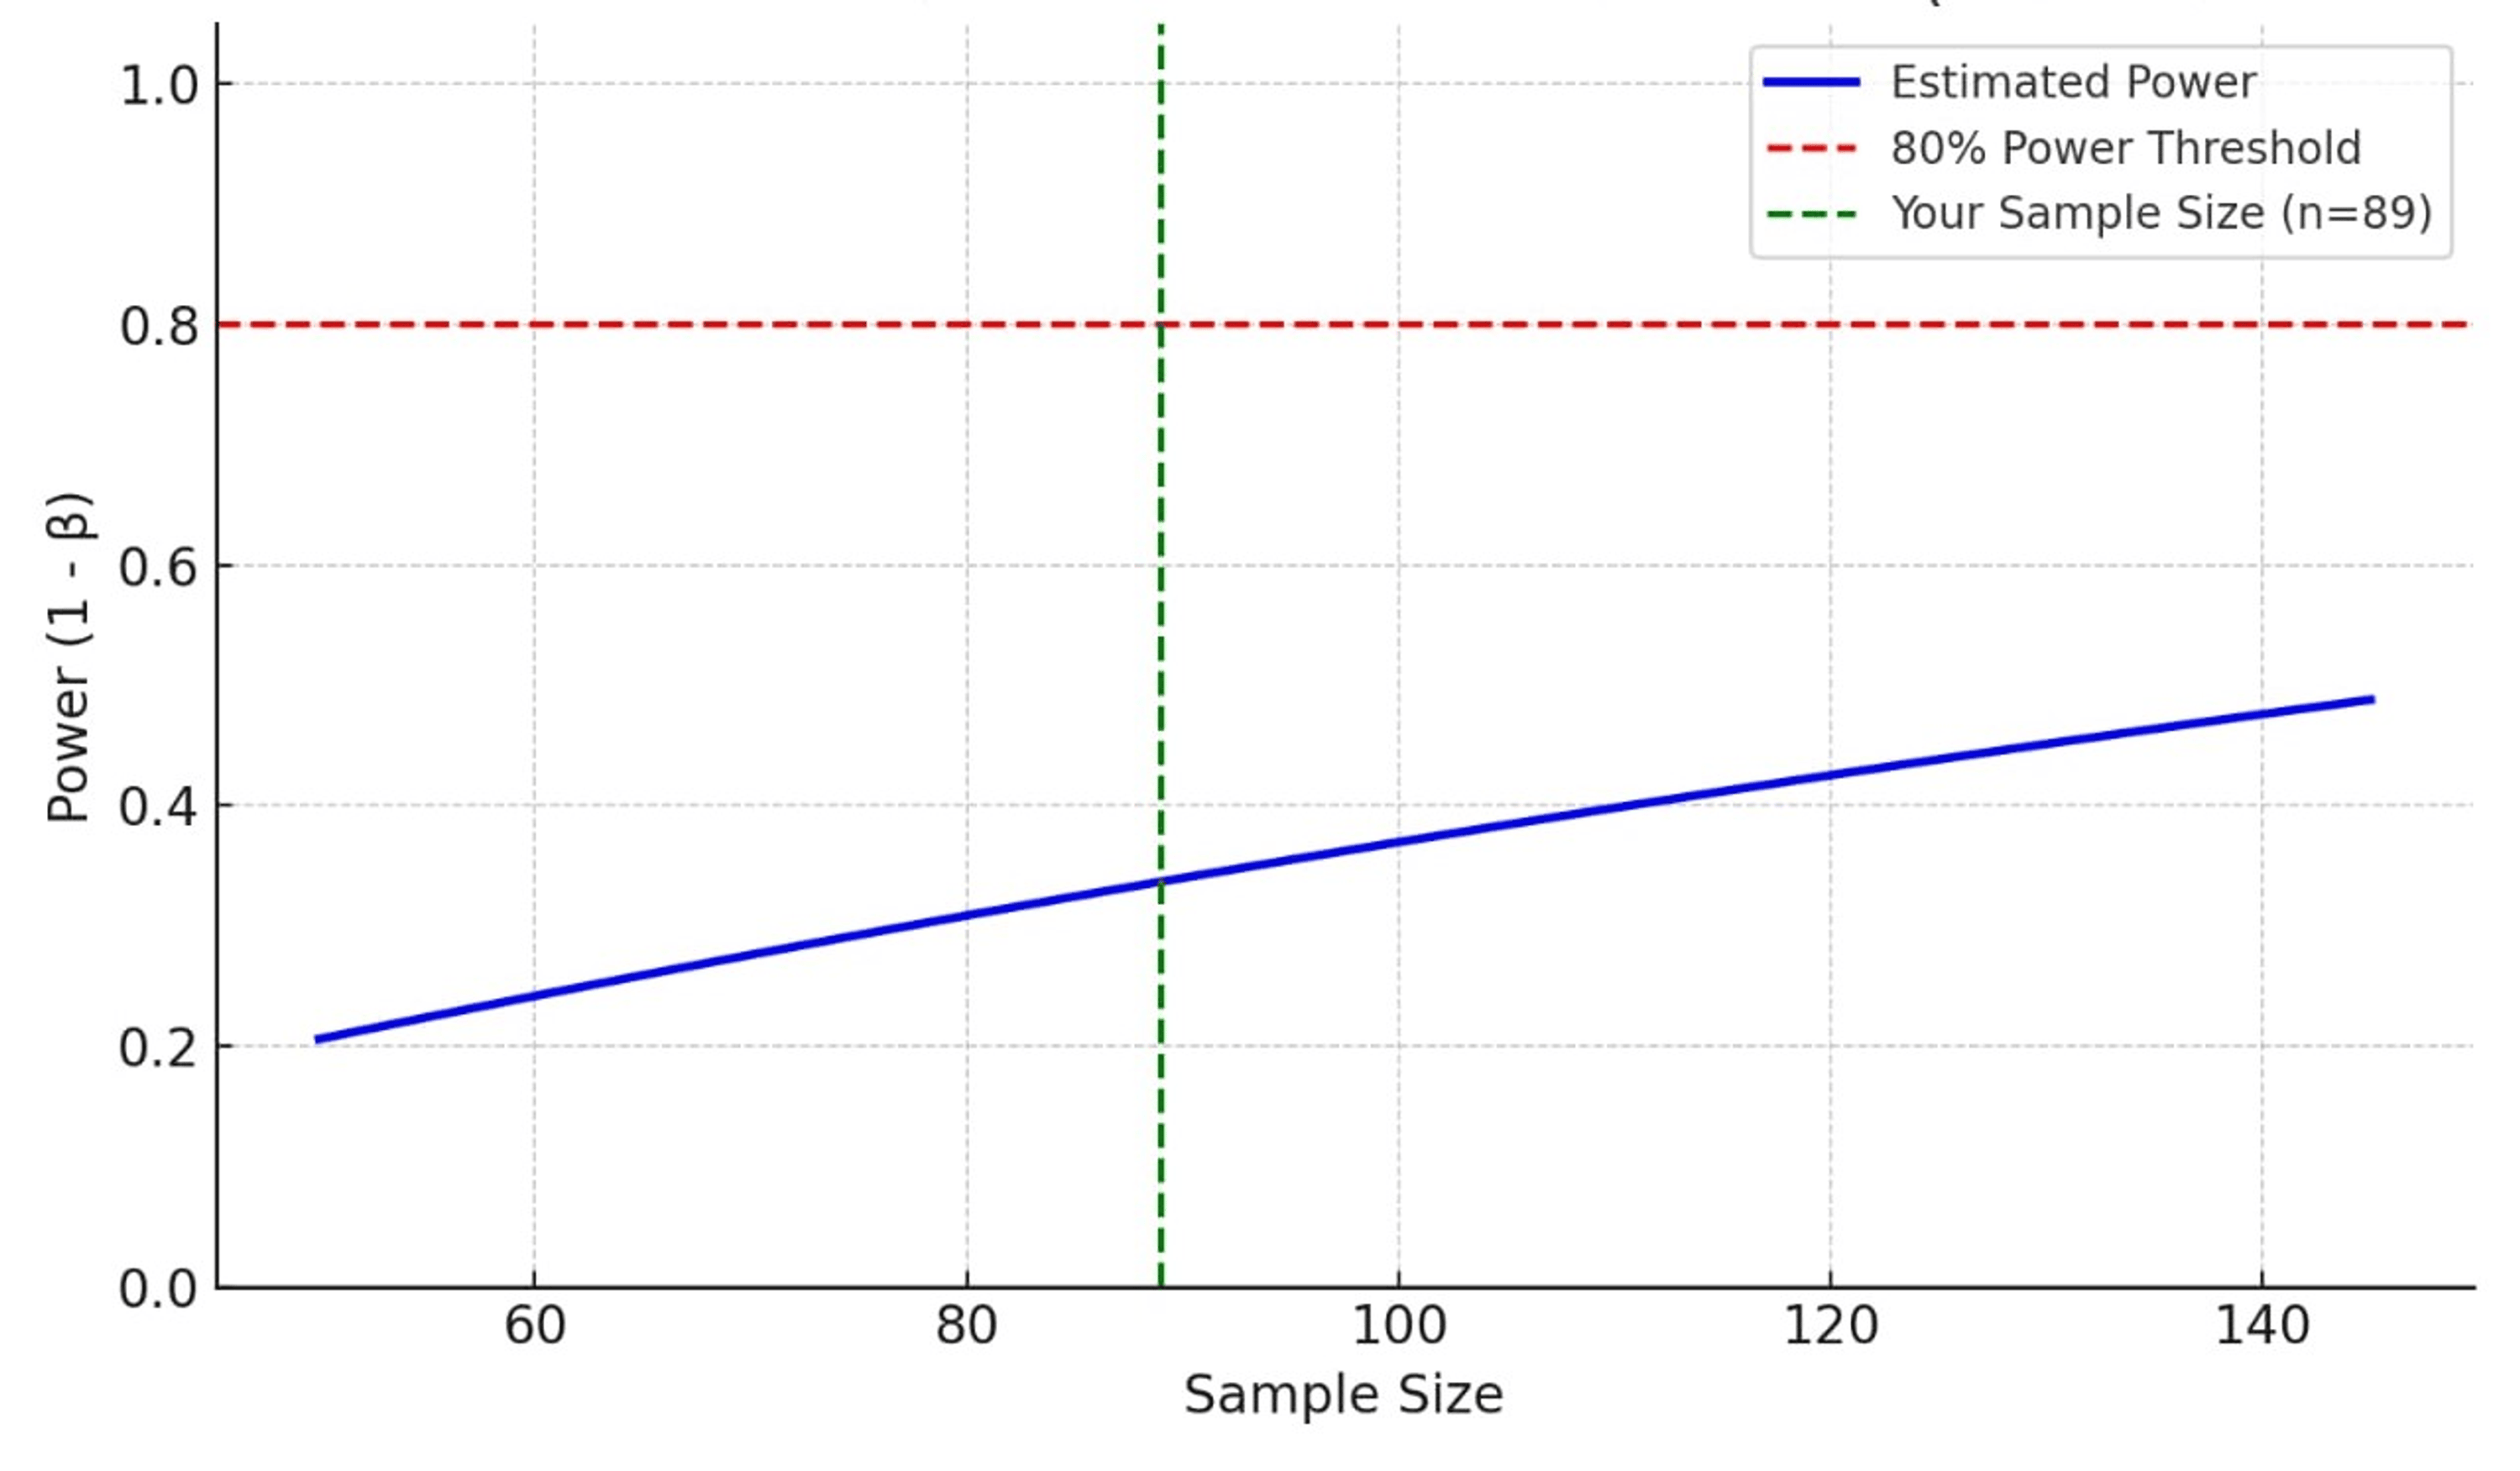
questionnaires for this study. A post hoc power analysis was performed using G*Power software (version 3.1;
Heinrich-Heine-Universität Düsseldorf, Düsseldorf, Germany) for Pearson’s correlation test (two-tailed).
Assuming a medium effect size (r = 0.3), alpha = 0.05, and sample size = 89, the achieved power was
approximately 0.85 (85%), indicating sufficient power to detect statistically significant correlations between
Pittsburgh Sleep Quality Index (PSQI) and Smartphone Addiction Scale-Short Version (SAS-SV) scores as
visually evident in Figure 1.
FIGURE 1: Post hoc power estimation for Pearson correlation (effect
size = 0.3)
Inclusion and exclusion criteria
All first-year MBBS students who provided informed consent and completed both questionnaires were
included in the study. Students with a diagnosed neurological disorder, as well as those with incomplete
questionnaire responses, were excluded from the analysis.
Data collection technique
2025 BH et al. Cureus 17(9): e91985. DOI 10.7759/cureus.91985 2 of 12

Demographic data of all participants were recorded. They were briefed about the research objectives and
were given instructions on how to fill out the questionnaires (Appendix A and B). The questionnaires were
administered online via Google Forms (Google LLC, Mountain View, CA, USA) with anonymized entries.
Students completed them voluntarily at their own convenience, independent of examination schedules, and
without supervision. They were assured of confidentiality and informed that participation would not affect
academic grades; clarifications were provided on request.
Smartphone Addiction Scale-Short Version (SAS-SV)
SAS-SV (Appendix A) was used to assess the extent of mobile addiction [3]. SAS-SV is a self-reported
measure for the assessment of smartphone addiction severity. The scale consists of 10 items, and responses
were recorded by a 6-point Likert scale ranging from 1 (strongly disagree) to 6 (strongly agree). A total score
of more than 31 for males and more than 33 for females in SAS-SV indicates smartphone addiction. This
version, SAS-SV, was specifically designed for rapid screening in research settings and should not be
confused with the original 33-item full SAS, which includes 6 factors.
Pittsburgh Sleep Quality Index (PSQI)
PSQI (Appendix B) was used to assess sleep quality [8]. PSQI is a seven-component questionnaire assessing
subjective sleep quality, latency, duration, efficiency, disturbances, medication use, and daytime
dysfunction. Global PSQI score was calculated from this, and those with a score >5 were classified as poor
sleepers.
The SAS-SV questionnaire is licensed under Creative Commons (CC BY 4.0). The PSQI is copyrighted and
reproduced with permission. The full English versions of the questionnaires are included in Appendix A and
Appendix B, respectively, with proper citation and licensing.
Approval for the study was obtained from the Research Advisory Committee (RAC), the ethics committee of
Ram Krishna Dharmarth Foundation (RKDF) Medical College Hospital & Research Centre, Bhopal, the
medical university where the study was conducted, prior to initiation (Ref. No. RKDF/1350 dated
01/07/2023). The objectives of the study were (1) to assess the prevalence of sleep quality and smartphone
addiction among first-year MBBS students, (2) to assess the correlation between smartphone addiction and
sleep quality, and (3) to examine gender-wise distribution in smartphone addiction and sleep quality.
Statistical analysis
Data were entered into Microsoft Excel Office 365 (Microsoft Corp., Redmond, WA, USA) and analyzed using
IBM SPSS Statistics for Windows, version 25 (IBM Corp., Armonk, NY, USA) [9]. Descriptive statistics such as
frequency, percentage, mean, and standard deviation were used to summarize sociodemographic variables
and questionnaire scores. Internal consistency of the SAS-SV and PSQI was assessed using Cronbach’s
alpha. The association between categorical variables (e.g., gender and smartphone addiction, gender and
sleep quality) was tested using the Chi-square test. A p-value <0.05 was considered statistically significant.
To examine the relationship between smartphone addiction and sleep quality, both Pearson correlation and
the Chi-square test were used. Pearson correlation was applied to evaluate the association between
continuous total scores of the SAS-SV and the global PSQI. Additionally, participants were categorized into
groups (e.g., addicted/not addicted; good/poor sleep) based on standard cut-offs, and the Chi-square test
was used to assess associations between these categorical variables.
Results
Gender composition
Understanding the gender composition is essential for interpreting subgroup analysis, especially when
examining variables like sleep behavior and smartphone usage patterns, which may vary between male and
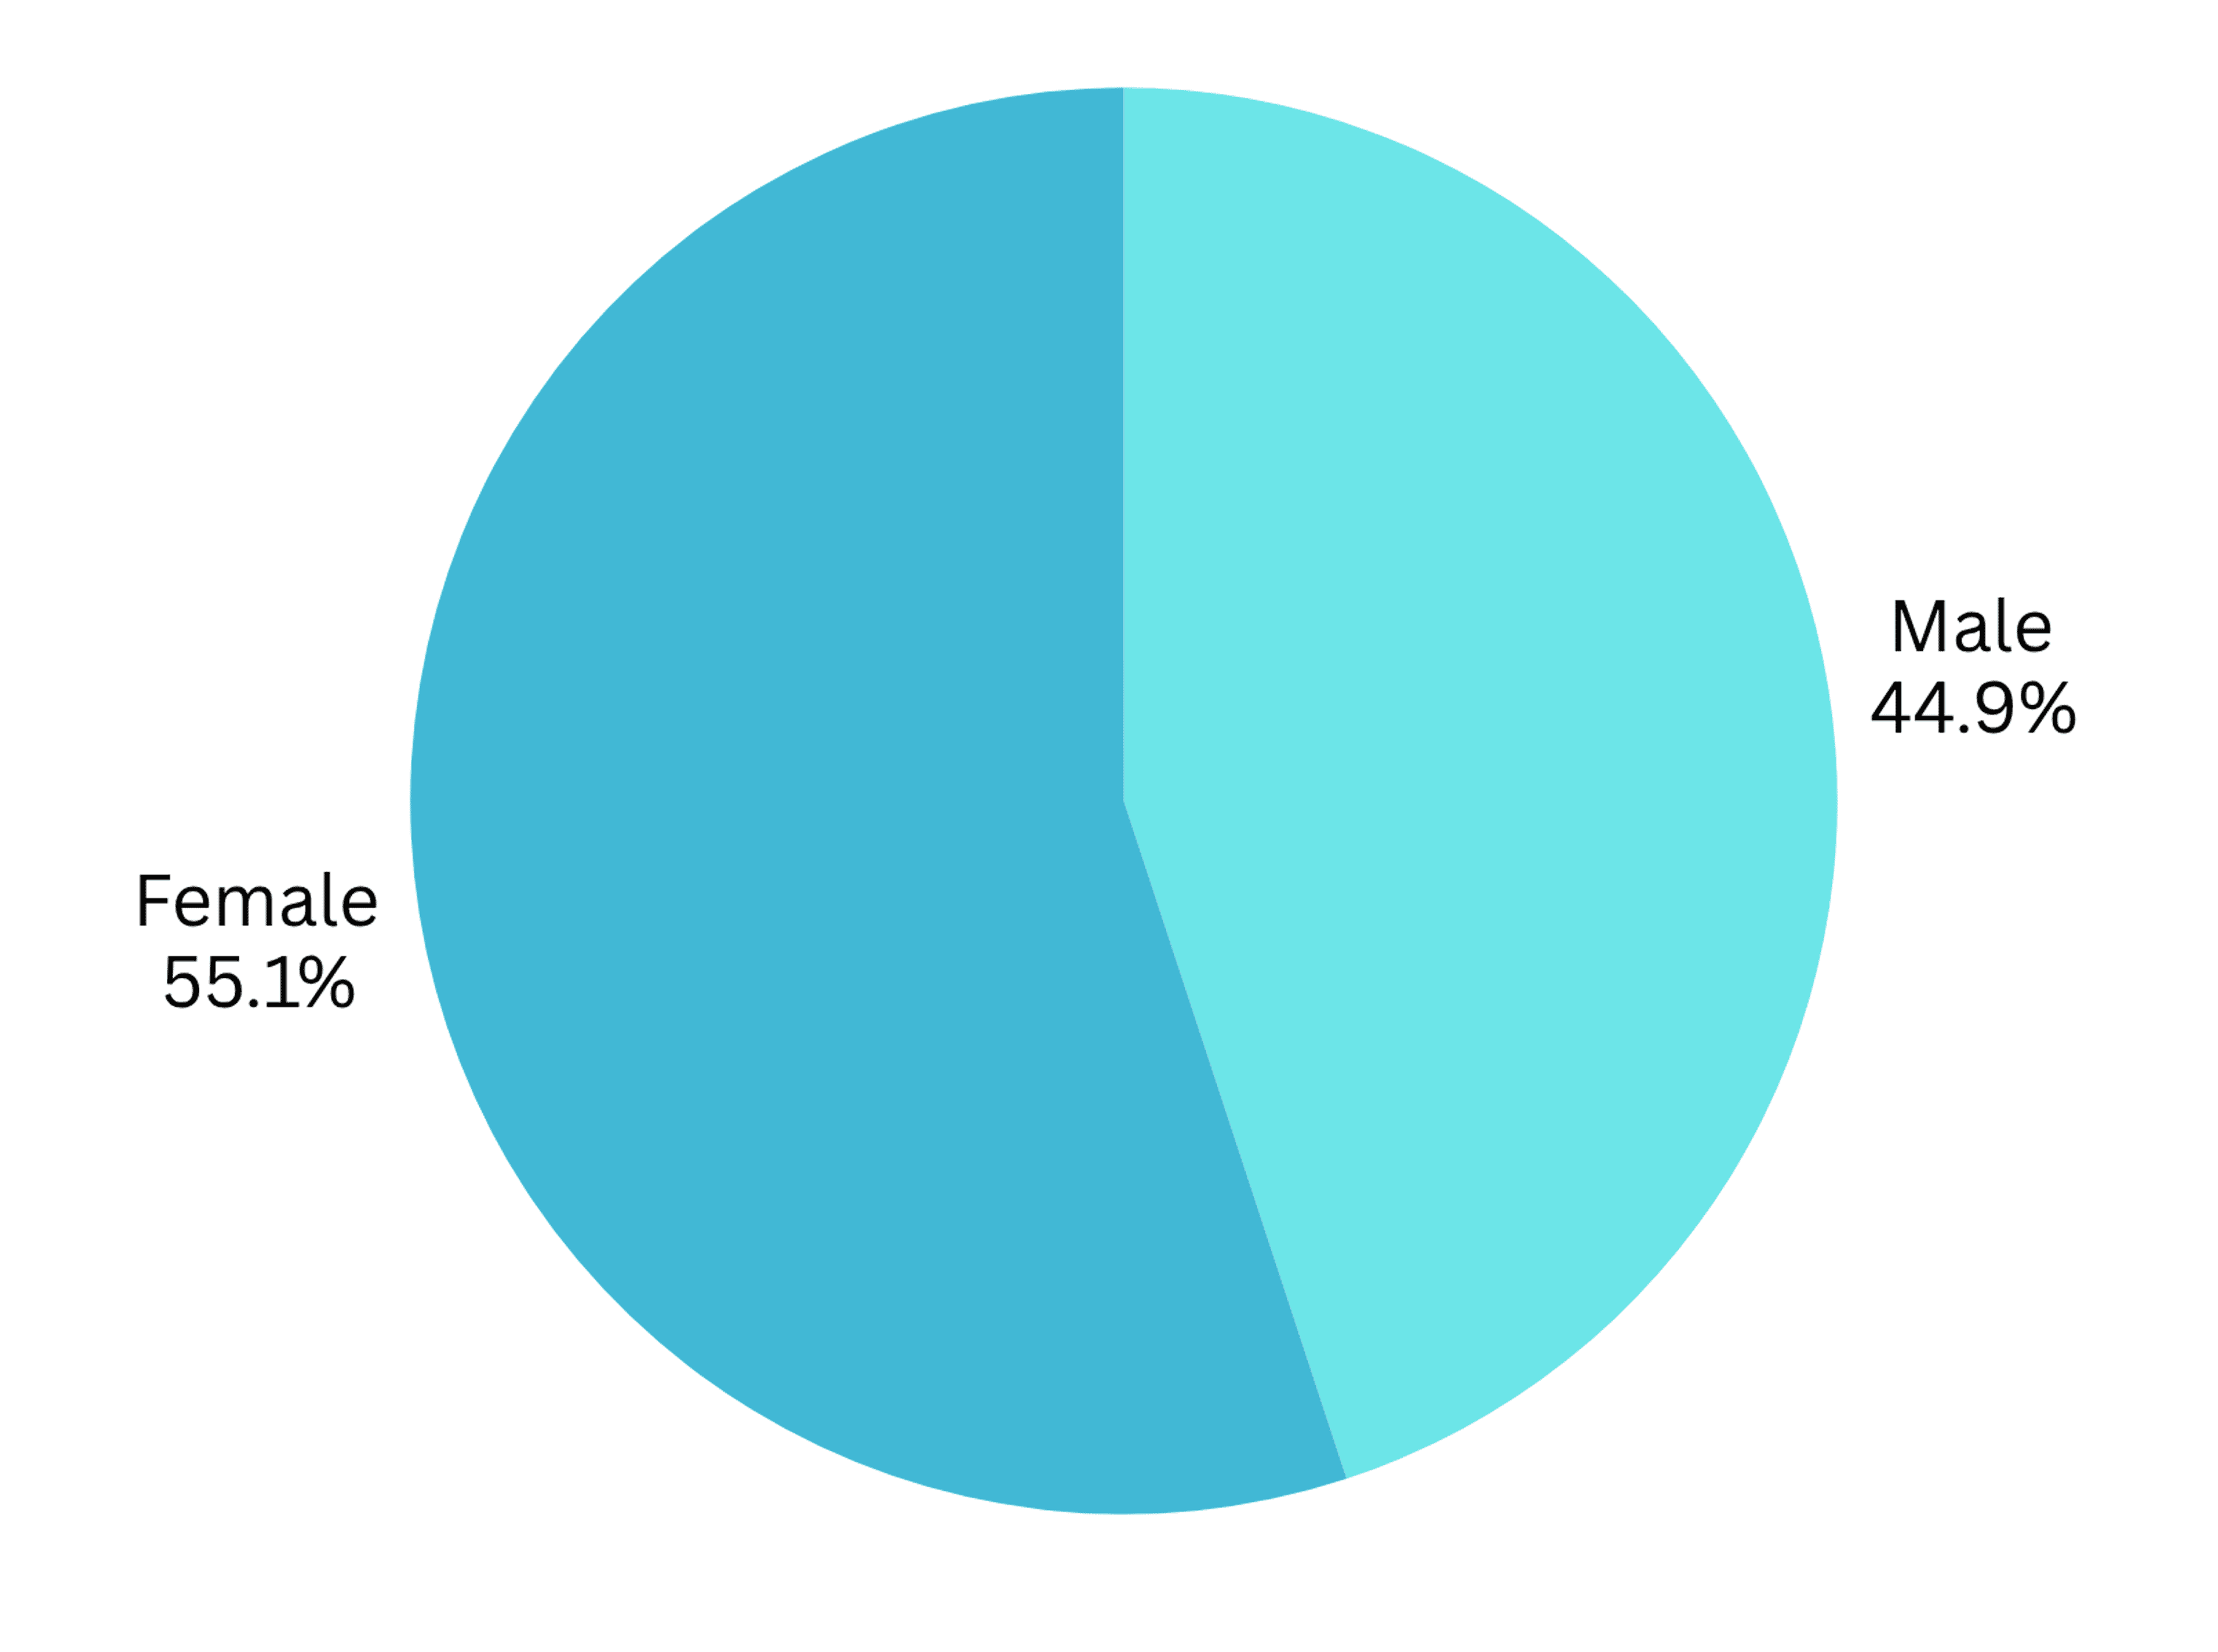
female medical students. Among the 89 participants, 40 (44.9%) were male and 49 (55.1%) were female
medical students. The sample shows a slightly higher representation of female students compared to males
(Figure 2). This near-balanced distribution provides a reasonable demographic spread for comparing gender-
related differences in smartphone addiction and sleep quality.
2025 BH et al. Cureus 17(9): e91985. DOI 10.7759/cureus.91985 3 of 12

FIGURE 2: Gender distribution (n = 89)
Internal consistency of measurement scales
Cronbach’s alpha is a measure of internal consistency or reliability, indicating how well a set of items in a
questionnaire measures a single underlying construct. Values can range between 0 to 1, with scores above
0.7 generally considered acceptable for reliability in social science research. The SAS-SV, comprising 10
items, demonstrated acceptable reliability with a Cronbach’s alpha of 0.747, indicating good internal
consistency. In contrast, the PSQI, which contains 7 components, yielded a lower Cronbach’s alpha value of
0.401, suggesting relatively poor reliability in this sample. This could reflect contextual or cultural
differences in the interpretation of sleep-related items or variability in responses, and highlights the need
for cautious interpretation of PSQI results in this setting.
Prevalence of smartphone addiction among students
The distribution of smartphone addiction among the 89 first-year MBBS students based on the SAS-SV is
shown in Table 1. Among the participants, 49 students (55.1%) were classified as addicted to smartphone
use, while 40 students (44.9%) were categorized as not addicted. The classification was determined using
gender-specific cut-off scores recommended for the SAS-SV (greater than 31 for males and greater than 33
for female students). The findings indicate that more than half of the students surveyed demonstrated signs
of problematic smartphone use. This high prevalence highlights the growing concern regarding smartphone
dependency in young adult populations, particularly among medical students who are already vulnerable to
academic and psychological stress.
Addiction status Frequency Percentage
Addicted 49 55.1%
Not addicted 40 44.9%
Total (n) 89 100%
TABLE 1: Frequency of smartphone addiction
Patterns of smartphone use based on SAS-SV components
The SAS-SV, as reported by the students who participated in the study, is presented in Table 2. Among the
components, the highest mean score was observed for the item “Using smartphone even when not
necessary” (mean = 4.63 ± 1.54), indicating a strong compulsion among students to use their phones beyond
2025 BH et al. Cureus 17(9): e91985. DOI 10.7759/cureus.91985 4 of 12

intended necessity. This was followed by “Missing planned work due to smartphone usage” (mean = 4.34 ±
1.43) and “Constantly checking phone to not miss notifications” (mean = 3.79 ± 1.79), both suggesting
frequent disruption of routine activities. Lower mean scores were noted for items such as “Having
smartphone in mind even when not using it” (mean = 2.64 ± 1.90) and “Feeling impatient while not holding
the phone” (mean = 2.94 ± 1.89), which reflect subtler psychological dependence.
SAS-SV component Mean ± Standard Deviation
1. Missing planned work due to smartphone usage 4.34 ± 1.43
2. Won’t be able to stand not having smartphone 3.38 ± 1.70
3. Feeling impatient while not holding the phone 2.94 ± 1.89
4. Having smartphone in mind even when not using it 2.64 ± 1.90
5. Will never give up using my smartphone even when daily life is affected 2.91 ± 1.71
6. Constantly checking phone to not miss notifications 2.89 ± 1.61
7. Using smartphone longer than intended 3.07 ± 1.89
8. People around me say I use my phone too much 3.79 ± 1.79
9. Using smartphone even when not necessary 4.63 ± 1.54
10. The people around me tell that I am using my phone too much 3.13 ± 1.67
TABLE 2: Mean and standard deviation of components of SAS-SV
SAS-SV: Smartphone Addiction Scale-Short Version
The distribution of smartphone addiction status among male and female first-year MBBS students based on
the SAS-SV is explained in Table 3. Among males, 25 students (62.5%) were classified as addicted, while 15
students (37.5%) were not addicted. Similarly, among females, 32 students (65.3%) were found to be
addicted, and 17 (34.7%) were not. Overall, 57 students (64.0%) met the criteria for smartphone addiction,
while 32 (36.0%) did not.
Gender Addicted n (%) Not addicted n (%) Total n (%) Test statistic p-value
Male 25 (62.5%) 15 (37.5%) 40 (100.0%) - -
Female 32 (65.3%) 17 (34.7%) 49 (100.0%) - -
Total (n=89) 57 (64.0%) 32 (36.0%) 89 (100.0%) χ² = 0.003 0.958
TABLE 3: Association between gender with SAS-SV
Values are presented as number (percentage). χ²: Chi-square test. No significant association was observed between gender and SAS-SV.
SAS-SV: Smartphone Addiction Scale-Short Version
To assess the association between gender and smartphone addiction, a Chi-square test was performed. The
result yielded a χ² value of 0.003 with a p-value of 0.958, indicating no statistically significant relationship
between gender and addiction status (Table 3). This suggests that the prevalence of smartphone addiction
was relatively similar across both genders in this sample. The lack of significance may reflect the widespread
use and accessibility of smartphones among students, regardless of gender.
Descriptive analysis of Pittsburgh Sleep Quality Index (PSQI)
Detailed descriptive analysis of individual items from the Pittsburgh Sleep Quality Index (PSQI)
revealed most common complaint was difficulty in maintaining sleep, with 36 participants (40.5%) reporting
taking more than 30 minutes to fall asleep at least once a week. Seventeen (19.1%) students have
experienced this three or more times a week. Night-time awakenings were also frequent; 31 participants
2025 BH et al. Cureus 17(9): e91985. DOI 10.7759/cureus.91985 5 of 12

(34.8%) reported waking up in the middle of the night or early morning at least once a week, and 15
participants (16.8%) had woken up three or more times a week.
Among the 89 participants, the average bedtime was 12:31 AM ± 1 hour 53 minutes, with the most common
bedtime being 12:00 AM. The mean wake-up time was 7:12 AM ± 1 hour 16 minutes, with 8:00 AM being the
most frequent (Table 4). The average sleep duration reported was 7.01 ± 1.45 hours, with 7 hours as the
modal value. These findings indicate that while most students maintained a consistent wake-up time, there
was greater variability in bedtimes, suggesting delayed sleep onset in a significant portion of participants,
potentially affecting overall sleep quality.
Parameter Mean ± SD Mode
Bedtime 12:31 AM ± 1 hour 53 minutes 12:00 AM
Wake-up time 07:12 AM ± 1 hour 16 minutes 08:00 AM
Sleep duration (hours) 7.01 ± 1.45 hours 7
TABLE 4: Summary of bedtime, wake-up time, and sleep duration among participants (n = 89)
Regarding sleep disturbances, symptoms like bad dreams (34 participants, 38.2%) and nocturnal awakenings
to use the bathroom (29 participants, 32.6%) were commonly reported. Pain-related sleep interruptions
affected 29 participants (32.6%), of whom 10 (11.2%) experienced it frequently (three or more times a week).
The use of sleep medication was low, with only 9 participants (10.1%) reporting use at least once in the past
month. However, daytime dysfunction was more prevalent; 42 participants (47.2%) reported trouble staying
awake during daily activities at least once a week.
Subjective sleep quality ratings showed that 26% of participants rated their sleep as “very good”, 58% as
“fairly good”, while 16% reported it as “fairly bad” or “very bad”. Components contributing most to poor
sleep scores were Sleep Latency, Sleep Disturbances, and Daytime Dysfunction. Use of Sleep Medication
showed minimal variability and was a negligible contributor to overall sleep quality scores as per responses
from participants.
Sleep quality distribution
Among all participants, 46.1% (n = 41) were identified as good sleepers, while 53.9% (n = 48) were classified
as poor sleepers (Table 5). The findings reveal a higher proportion of poor sleepers in the sample, indicating
that sleep disturbances may be an important area of concern among medical students.
Sleep quality Frequency (n) Percentage (%)
Good sleep 41 46.1%
Poor sleep 48 53.9%
Total 89 100.0%
TABLE 5: Frequency of good and poor sleepers based on PSQI
PSQI: Pittsburgh Sleep Quality Index
The mean and standard deviation were calculated (Table 6) for each of the seven components of the
Pittsburgh Sleep Quality Index (PSQI) among the 89 first-year MBBS students. The highest mean score was
observed for daytime dysfunction (1.60 ± 1.08), followed by sleep disturbance (1.30 ± 1.23) and sleep latency
(1.21 ± 0.92), indicating that students commonly experienced issues in these domains. In contrast,
components such as sleep efficiency (0.10 ± 0.48) and use of sleep medication (0.17 ± 0.53) had the lowest
scores, suggesting these were not significant concerns within the sample. Subjective sleep quality (0.97 ±
0.75) and sleep duration (0.62 ± 0.87) showed moderate levels of disturbance.
2025 BH et al. Cureus 17(9): e91985. DOI 10.7759/cureus.91985 6 of 12

PSQI component Mean ± Standard Deviation
Subjective sleep quality 0.97 ± 0.75
Sleep latency 1.21 ± 0.92
Sleep duration 0.62 ± 0.87
Sleep efficiency 0.10 ± 0.48
Sleep disturbance 1.30 ± 1.23
Use of sleep medication 0.17 ± 0.53
Daytime dysfunction 1.60 ± 1.08
TABLE 6: Mean of PSQI components
PSQI: Pittsburgh Sleep Quality Index
A Chi-square test of independence was performed to assess the association between gender and sleep
quality, classified as good or poor based on the global PSQI (Table 7). The sample included 89 participants,
comprising 40 male and 49 female students. Among males, 50.0% reported good sleep quality and 50.0%
reported poor sleep quality. Among females, 42.9% had good sleep quality and 57.1% had poor sleep quality.
Overall, 46.1% of participants had good sleep quality, while 53.9% had poor sleep quality. The chi-square test
showed no statistically significant association between gender and sleep quality (χ² = 0.210, p = 0.646).
These results suggest that sleep quality distribution is relatively similar between male and female
participants in this sample. While a slightly higher proportion of females reported poor sleep compared to
males, the difference was not significant.
Gender Good sleep n (%) Poor sleep n (%) Total n (%) Test statistic p-value
Male 20 (50.0%) 20 (50.0%) 40 (100.0%) - -
Female 21 (42.9%) 28 (57.1%) 49 (100.0%) - -
Total (n=89) 41 (46.1%) 48 (53.9%) 89 (100.0%) χ² = 0.210 0.646
TABLE 7: Association between gender and PSQI
Values are presented as number (percentage). χ²: chi-square test.
PSQI: Pittsburgh Sleep Quality Index
Correlation between overall smartphone addiction and sleep quality
A Pearson correlation analysis was conducted to examine the relationship between smartphone addiction
and sleep quality using the total SAS-SV score and the Global PSQI score, respectively (Table 8). The results
indicated a very weak positive correlation between SAS-SV and PSQI scores (r = 0.023, p = 0.829). This
correlation was not statistically significant, suggesting that smartphone addiction levels, as measured by the
SAS-SV, were not meaningfully associated with sleep quality in this sample.
2025 BH et al. Cureus 17(9): e91985. DOI 10.7759/cureus.91985 7 of 12

Parameters r value p value
Sleep quality 0.226 0.03
Sleep latency 0.19 0.07
Sleep duration -0.08 0.43
Sleep efficiency 0.22 0.04
Sleep disturbance 0.204 0.06
Sleep medication 0.05 0.59
Daytime dysfunction 0.1 0.2
TABLE 8: Pearson correlation between smartphone addiction (SAS-SV) and PSQI components
r value = Pearson correlation coefficient; measures the strength and direction of a linear relationship between two variables. SAS-SV score has a
significant correlation with sleep quality and sleep efficiency.
SAS-SV: Smartphone Addiction Scale-Short Version; PSQUI: Pittsburgh Sleep Quality Index
The relationship between smartphone addiction, as measured by the SAS-SV, and various components of
sleep quality assessed by the PSQI was examined using Pearson correlation analysis. Among the sleep
parameters, significant positive correlations were observed between smartphone addiction and poorer sleep
quality (r = 0.226, p = 0.03), suggesting that individuals with higher levels of smartphone addiction tend to
report lower subjective sleep quality (Table 8). Additionally, a significant correlation was identified between
smartphone addiction and sleep efficiency (r = 0.22, p = 0.04), indicating that greater smartphone use is
associated with reduced sleep efficiency.
Other sleep dimensions, including sleep latency (r = 0.19, p = 0.07), sleep disturbance (r = 0.204, p = 0.06),
sleep duration (r = -0.08, p = 0.43), sleep medication use (r = 0.05, p = 0.59), and daytime dysfunction (r = 0.1,
p = 0.2), did not reach statistical significance (p > 0.05), though the positive directions of the correlations for
several components suggest potential trends worth further investigation.
Discussion
This study revealed a moderately high prevalence of smartphone addiction (n=49,55.1%) and a considerable
prevalence of poor sleep quality (n=48,53.9%) among first-year MBBS students. Even though no significant
correlation was found between overall smartphone addiction (SAS-SV) and global sleep quality (PSQI),
specific components of PSQI, such as sleep quality (r = 0.226, p = 0.03) and sleep efficiency (r = 0.22, p =
0.04), showed statistically significant associations. This shows that while overall sleep quality may not
always be impacted, certain domains of sleep are adversely affected by excessive smartphone usage.
Tettamanti et al. reported that overuse of smartphones was significantly related to increased sleep latency
and reduced sleep quality in university students [10]. Many studies have pointed to increasing behavioral
and psychological changes in people with smartphone addiction, emphasizing how constant blue light
exposure can increase arousal and delay sleep onset [11].
Sleep disruption associated with smartphone use can be physiologically explained. Blue light emitted by
screens interferes with melatonin secretion and disrupts the circadian rhythm [12]. These mechanisms
explain why even short bursts of smartphone use prior to bedtime can reduce total sleep time and delay
rapid eye movement (REM) cycles [13].
A longitudinal study by Lemola et al. reinforced these concerns by linking night-time media usage with
long-term negative effects on academic performance and psychological well-being [14]. In a prospective
study, reported that mobile phone use predicted subsequent stress, depression, and sleep disorders,
especially among young adults [1,14].
The low Cronbach’s alpha (0.401) observed for PSQI in our study may indicate a limitation in the cultural or
contextual adaptability of this scale among Indian students. It is important to note that all participants were
undergraduate medical students, representing a homogenous academic stream. This lack of academic
diversity may affect the generalizability of the findings, as sleep behaviors and interpretations of sleep-
related questions might differ across disciplines. This necessitates further validation studies or potential
localization of the tool for more reliable results in future research, and that too among various young adult
populations.
2025 BH et al. Cureus 17(9): e91985. DOI 10.7759/cureus.91985 8 of 12
In this study, we did not find significant gender differences in smartphone addiction and sleep disturbance.
It is crucial to consider that all participants resided in on-campus hostel accommodations provided by the
medical college. This shared residential and academic environment may minimize the influence of external
variables such as family responsibilities, societal gender roles, or differing daily routines, which might
otherwise contribute to behavioral differences. However, Roberts et al. noted that while patterns of usage
differ by gender, addiction traits can manifest similarly in both [15]. Exelmans and Van den Bulck, in their
research, indicated that bedtime mobile phone use, regardless of gender, is a strong predictor of shorter
sleep duration and poor sleep quality [16].
Many studies across the world have highlighted moderate-to-strong associations between smartphone
addiction and sleep disturbances [12]. Cha and Seo indicated that even middle-school children experience
sleep loss due to rising smartphone addiction [17]. In our study, we could not establish an association
between the global PSQI score and the total SAS-SV score, which may be due to low sample size. However,
our study indicated that subjective sleep quality and sleep efficiency are poor in students with smartphone
addiction. Twenge et al. showed that the strongest negative impact on sleep comes from portable screens
like smartphones, as they are used close to bedtime and in bed [18].
Nurturing habits like setting the phone to do not disturb (DND) or airplane mode during bedtime can help
reduce sleep disruptions. A systematic review suggested that more outdoor activities, psychological and
cognitive behavioral therapy could be used to address depression, anxiety, and impulsivity associated with
smartphone addiction [7].
There is a pressing need for multicenter studies with larger sample sizes involving medical students and
students from other academic streams from different regions to improve generalizability. Also, there are
scopes for future studies involving interventional trials testing the efficacy of mindfulness, digital hygiene
programs, along with sleep, monitored in a sleep lab with polysomnography would give more objective
results.
A limitation of this study is the relatively small sample size and homogenous study population, which may
restrict the generalizability of the findings. In addition, the absence of objective sleep laboratory
measurements limits the accuracy of sleep quality assessment. Future research with larger, more diverse
populations and objective sleep measures is warranted.
Conclusions
The study revealed a considerable burden of smartphone addiction and poor sleep quality among first-year
MBBS students. Even though no significant correlation was found between overall smartphone addiction
and global sleep quality scores, specific sleep components, namely (a) sleep quality and (b) sleep efficiency,
showed a statistically significant association with smartphone addiction. These findings show that although
smartphone overuse may not uniformly disrupt sleep, it does impact certain aspects of sleep health. This
study underscores the importance of raising awareness about responsible smartphone use and importance of
healthy sleep habits, especially in high-stress academic environments like medical colleges.
Appendices
Appendix A
Smartphone Addiction Scale-Short Version (SAS-SV) Questionnaire
2025 BH et al. Cureus 17(9): e91985. DOI 10.7759/cureus.91985 9 of 12

Item
no. Question Response options (score)
1 Missing planned work due to smartphone usage 1 = Strongly disagree; 2 = Disagree; 3 = Weakly disagree; 4 = Weakly
agree; 5 = Agree; 6 = Strongly agree
2Hard time concentrating in class or while doing
assignments due to phone use Same as above
3Feeling pain in wrist or back of neck while using
smartphone Same as above
4Wouldn’t be able to stand not having smartphone with
you Same as above
5 Feeling impatient while not holding the phone Same as above
6 Having smartphone in mind even while not using it Same as above
7Will never give up using my smartphone even when
daily life is affected by it Same as above
8Constantly checking phone so as not to miss
notifications Same as above
9 Using my smartphone longer than I intended Same as above
10 People around me say I am using my phone too
much Same as above
TABLE 9: Smartphone Addiction Scale-Short Version (SAS-SV)
Self-assessment of smartphone-related behaviors using a 6-point Likert scale (1 = Strongly Disagree to 6 = Strongly Agree).
Source: Kwon et al. [3]. Permission to use the SAS-SV was obtained from the original publisher.
This questionnaire is published under the Creative Commons Attribution License (CC BY 4.0), which permits unrestricted use, distribution, and
reproduction in any medium, provided the original author and source are credited.
Appendix B
Pittsburgh Sleep Quality Index (PSQI) Questionnaire
2025 BH et al. Cureus 17(9): e91985. DOI 10.7759/cureus.91985 10 of 12

Item
no. Question Response options/frequency labels
1 Usual bedtime during the past month Record time (hh:mm, AM/PM)
2 Usual time to fall asleep each night (minutes) Record number of minutes
3 Usual wake-up time during the past month Record time (hh:mm, AM/PM)
4Hours of actual sleep per night (may differ from time in
bed) Record hours
5a Trouble sleeping: Cannot get to sleep within 30 minutes 0 = Not during past month; 1 = <1/week; 2 = 1–2/week; 3 = ≥3/week
5b Trouble sleeping: Wake up in the middle of the night or
early morning Same as above
5c Trouble sleeping: Have to get up to use the bathroom Same as above
5d Trouble sleeping: Cannot breathe comfortably Same as above
5e Trouble sleeping: Cough or snore loudly Same as above
5f Trouble sleeping: Feel too cold Same as above
5g Trouble sleeping: Feel too hot Same as above
5h Trouble sleeping: Had bad dreams Same as above
5i Trouble sleeping: Have pain Same as above
5j Trouble sleeping: Other reason(s) Describe reason; then same frequency coding as above
6 Overall sleep quality during the past month 0 = Very good; 1 = Fairly good; 2 = Fairly bad; 3 = Very bad
7Frequency of taking medicine to help sleep (prescribed
or OTC) 0 = Not during past month; 1 = <1/week; 2 = 1–2/week; 3 = ≥3/week
8Trouble staying awake during driving, meals, or social
activity Same as above
9 Problem keeping up enthusiasm to get things done 0 = No problem; 1 = Slight problem; 2 = Somewhat of a problem; 3 =
Very big problem
10a (If bed partner/roommate) Loud snoring 0 = Not during past month; 1 = <1/week; 2 = 1–2/week; 3 = ≥3/week
10b Long pauses between breaths while asleep Same as above
10c Legs twitching or jerking while you sleep Same as above
10d Episodes of disorientation or confusion during sleep Same as above
10e Other restlessness while you sleep Describe reason; then same frequency coding as above
TABLE 10: Pittsburgh Sleep Quality Index (PSQI)
Instructions: The following questions relate to your usual sleep habits during the past month only. Your answers should indicate the most accurate reply for
the majority of days and nights in the past month. Please answer all questions.
Source: Buysse et al. [8]. Permission to use the PSQI was obtained from the copyright holder.
Additional Information
Author Contributions
All authors have reviewed the final version to be published and agreed to be accountable for all aspects of the
work.
Concept and design: Sravan JS, Gayathri BH
Acquisition, analysis, or interpretation of data: Sravan JS, Gayathri BH, Sajidali S. Saiyad, Sweta Shah
2025 BH et al. Cureus 17(9): e91985. DOI 10.7759/cureus.91985 11 of 12
Drafting of the manuscript: Sravan JS, Gayathri BH
Critical review of the manuscript for important intellectual content: Sravan JS, Gayathri BH, Sajidali S.
Saiyad, Sweta Shah
Disclosures
Human subjects: Informed consent for treatment and open access publication was obtained or waived by all
participants in this study. Research Advisory Committee, Ram Krishna Dharmarth Foundation (RKDF)
Medical College Hospital & Research Centre, Bhopal issued approval RKDF/1350, dated 01/07/2023. Animal
subjects: All authors have confirmed that this study did not involve animal subjects or tissue. Conflicts of
interest: In compliance with the ICMJE uniform disclosure form, all authors declare the following:
Payment/services info: All authors have declared that no financial support was received from any
organization for the submitted work. Financial relationships: All authors have declared that they have no
financial relationships at present or within the previous three years with any organizations that might have
an interest in the submitted work. Other relationships: All authors have declared that there are no other
relationships or activities that could appear to have influenced the submitted work.
References
1. Thomée S, Härenstam A, Hagberg M: Mobile phone use and stress, sleep disturbances, and symptoms of
depression among young adults--a prospective cohort study. BMC Public Health. 2011, 11:66. 10.1186/1471-
2458-11-66
2. Sharma N, Advani U, Sharma L, Jain M, Sharma K, Dixit AM: Pattern of mobile phone usage among medical
students. Int J Acad Med. 2019, 5:118-23. 10.4103/IJAM.IJAM_61_18
3. Kwon M, Lee JY, Won WY, et al.: Development and validation of a smartphone addiction scale (SAS) . PLoS
One. 2013, 8:e56936. 10.1371/journal.pone.0056936
4. Rathakrishnan B, Bikar Singh SS, Kamaluddin MR, Yahaya A, Mohd Nasir MA, Ibrahim F, Ab Rahman Z:
Smartphone addiction and sleep quality on academic performance of university students: an exploratory
research. Int J Environ Res Public Health. 2021, 18: 10.3390/ijerph18168291
5. Azad MC, Fraser K, Rumana N, Abdullah AF, Shahana N, Hanly PJ, Turin TC: Sleep disturbances among
medical students: a global perspective. J Clin Sleep Med. 2015, 11:69-74. 10.5664/jcsm.4370
6. Lowry M, Dean K, Manders K: The link between sleep quantity and academic performance for the college
student. Univ Minn Undergrad J Psychol. 2010, 3:16-9.
7. Leow MQ, Chiang J, Chua TJ, Wang S, Tan NC: The relationship between smartphone addiction and sleep
among medical students: A systematic review and meta-analysis. PLoS One. 2023, 18:e0290724.
10.1371/journal.pone.0290724
8. Buysse DJ, Reynolds CF 3rd, Monk TH, Berman SR, Kupfer DJ: The Pittsburgh Sleep Quality Index: a new
instrument for psychiatric practice and research. Psychiatry Res. 1989, 28:193-213. 10.1016/0165-
1781(89)90047-4
9. IBM SPSS Statistics for Windows, Version 25.0 . (2017). Accessed: July 22, 2025:
https://www.ibm.com/products/spss.
10. Tettamanti G, Auvinen A, Åkerstedt T, et al.: Long-term effect of mobile phone use on sleep quality: results
from the cohort study of mobile phone use and health (COSMOS). Environ Int. 2020, 140:105687.
10.1016/j.envint.2020.105687
11. Shang Z, Wang D, Liu Z, Zhang X: Exploring the impact of smartphone addiction on mental health among
college students during the COVID-19 pandemic: the role of resilience and parental attachment. J Affect
Disord. 2024, 367:756-67. 10.1016/j.jad.2024.09.035
12. Sinha S, Dhooria S, Sasi A, et al.: A study on the effect of mobile phone use on sleep . Indian J Med Res. 2022,
155:380-6. 10.4103/ijmr.ijmr_2221_21
13. Kheirinejad S, Visuri A, Ferreira D, Hosio S: "Leave your smartphone out of bed": quantitative analysis of
smartphone use effect on sleep quality. Pers Ubiquitous Comput. 2023, 27:447-66. 10.1007/s00779-022-
01694-w
14. Lemola S, Perkinson-Gloor N, Brand S, Dewald-Kaufmann JF, Grob A: Adolescents' electronic media use at
night, sleep disturbance, and depressive symptoms in the smartphone age. J Youth Adolesc. 2015, 44:405-
18. 10.1007/s10964-014-0176-x
15. Roberts JA, Yaya LH, Manolis C: The invisible addiction: cell-phone activities and addiction among male
and female college students. J Behav Addict. 2014, 3:254-65. 10.1556/JBA.3.2014.015
16. Exelmans L, Van den Bulck J: Bedtime mobile phone use and sleep in adults . Soc Sci Med. 2016, 148:93-101.
10.1016/j.socscimed.2015.11.037
17. Cha SS, Seo BK: Smartphone use and smartphone addiction in middle school students in Korea: prevalence,
social networking service, and game use. Health Psychol Open. 2018, 5:2055102918755046.
10.1177/2055102918755046
18. Twenge JM, Campbell WK: Associations between screen time and lower psychological well-being among
children and adolescents: Evidence from a population-based study. Prev Med Rep. 2018, 12:271-83.
10.1016/j.pmedr.2018.10.003
2025 BH et al. Cureus 17(9): e91985. DOI 10.7759/cureus.91985 12 of 12


