The 2024 Crypto Crime Report PDF Free Download
1 / 114
/114
100%

FEBRUARY 2024
The 2024 Crypto
Crime Report
The latest trends in ransomware, scams, hacking, and more
0

Introduction
Introduction 2

Illicit Activity Down as Scamming and
Stolen Funds Fall, But Ransomware
and Darknet Markets See Growth
2023 was a year of recovery for cryptocurrency, as the industry rebounded from the scandals, blowups,
and price declines of 2022. With crypto assets rebounding and market activity growing over the course of
2023, many believe that crypto winter is ending, and a new growth phase may soon be upon us.
But what did all of that mean for crypto crime? Let’s look at the high-level trends.
Total cryptocurrency value received by illicit addresses
2018 - 2023
2023 saw a significant drop in value received by illicit cryptocurrency addresses, to a total of $24.2 billion.
As always, we have to caveat by saying that these figures are lower bound estimates based on inflows to
the illicit addresses we’ve identified today. One year from now, these totals will almost certainly be higher,
as we identify more illicit addresses and incorporate their historic activity into our estimates. For instance,
when we published our Crypto Crime Report last year, we estimated $20.6 billion worth of illicit
transaction volume for 2022. One year later, our updated estimate for 2022 is $39.6 billion. Much of that
growth came from the identification of previously unknown, highly active addresses hosted by sanctioned
Introduction 3

services, as well as our addition of transaction volume associated with services in sanctioned jurisdictions
to our illicit totals.
Another key reason the new total is so much higher, besides the identification of new illicit addresses:
We’re now counting the $8.7 billion in creditor claims against FTX in our 2022 figures. In last year’s report,
we said that we would hold off on including transaction volumes associated with FTX and other firms that
collapsed that year under allegedly fraudulent circumstances in our illicit totals until legal processes played
out. Since then, a jury has convicted FTX’s former CEO of fraud.
Typically, we only include measurable on-chain activity in our estimates for illicit activity. In the case of FTX,
it’s impossible to use on-chain data alone to measure the scope of the fraudulent activity, as there’s no way
to isolate illegitimate movements of user funds. As such, we believe the $8.7 billion in creditor claims
against FTX is the best estimate to include. Given the size and impact of the FTX situation, we are treating
it as an exception to our usual on-chain methodology. If courts convict in similar, ongoing cases, we plan to
include their activity in our illicit transaction data as well in the future.
All other totals exclude revenue from non-crypto native crime, such as conventional drug trafficking in
which crypto is used as a means of payment. Such transactions are virtually indistinguishable from licit
transactions in on-chain data. Of course, law enforcement with off-chain context can still investigate these
flows using Chainalysis solutions. In cases where we’re able to confirm such information, we count the
transactions as illicit in our data, but there are almost certainly many instances where that isn’t the case,
and therefore the numbers wouldn’t be reflected in our totals.
Introduction 4

CHAINALYSIS ESTIMATES
How big was crypto crime in 2023?
$24.2 B
received by illicit
addresses
0.34%
of total on-chain
transaction volume
Estimates of illicit transaction activity DO include:
✓Funds sent to addresses we’ve identified as illicit
✓Funds stolen in crypto hacks
Estimates of illicit transaction activity DO NOT include:
xFunds sent to addresses we have not yet identified as illicit. Why? Because we don’t know that
they’re illicit yet. But we update our numbers on a rolling basis as we make more identifications.
xFunds derived from non-crypto native crime, except for cases brought to our attention by
customers. Why? Because these transactions are impossible to identify as illicit without more
information.
xFunds associated with crypto platforms accused of fraud, absent convictions in court. Why?
Because only a judge and jury can make that determination.
xTransaction volume associated with potential market manipulation. Why? Because our research
heuristics are designed to catch suspected instances of market manipulation based on on-chain
behavior, but aren’t definitive.
xFunds associated with crypto money laundering. Why? Because our goal here is to calculate
total revenue from illicit activity, based on inflows to illicit addresses. We share the total value
laundered on-chain in the report’s money laundering section, calculated based on the value
sent from illicit addresses to off-ramping services. Including money laundering totals here based
on outflows would effectively be double counting, and artificially inflate our estimates of
on-chain criminal activity.
Introduction 5

In addition to the reduction in absolute value of illicit activity, our estimate for the share of all crypto
transaction volume associated with illicit activity also fell, to 0.34% from 0.42% in 2022.1
Illicit share of all cryptocurrency transaction volume
2018 - 2023
We’re also seeing a shift in the types of assets involved in cryptocurrency-based crime.
Illicit transaction volume by asset type
2018 - 2023
1Transaction volume is a measure of all economic activity, a proxy for funds changing hands. We remove peel chains, internal
service transactions, change, and any other type of transaction that would not count as an economic transaction between
distinct economic actors.
Introduction 6

Through 2021, Bitcoin reigned supreme as the cryptocurrency of choice among cybercriminals, likely due to
its high liquidity. But that’s changed over the last two years, with stablecoins now accounting for the
majority of all illicit transaction volume. This change also comes alongside recent growth in stablecoins’
share of all crypto activity overall, including legitimate activity. However, stablecoin dominance isn’t the
case for all forms of cryptocurrency-based crime.
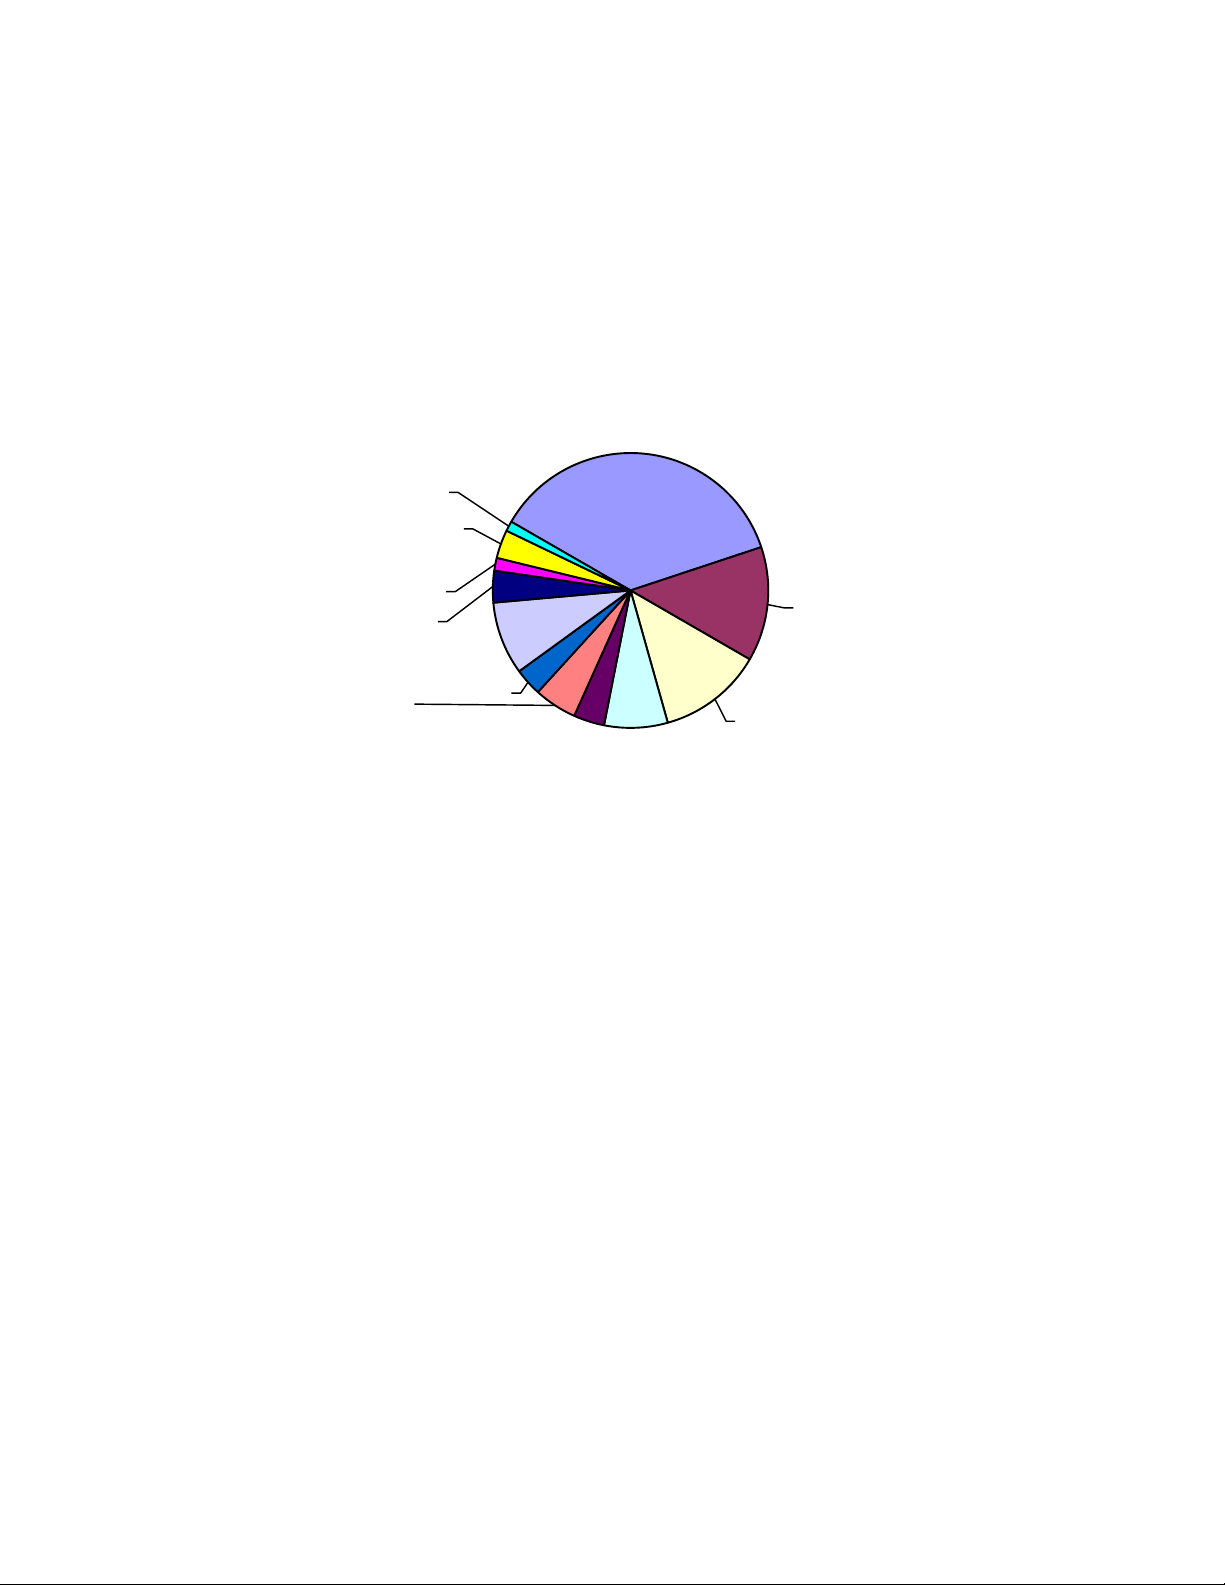
Illicit transaction volume by crime category and asset type
2023
Some forms of illicit cryptocurrency activity, such as darknet market sales and ransomware extortion, still
take place predominantly in Bitcoin.2Others, like scamming and transactions associated with sanctioned
entities, have shifted to stablecoins. Those also happen to be the biggest forms of crypto crime by
transaction volume, thereby driving the larger trend. Sanctioned entities, as well as those operating in
sanctioned jurisdictions or involved with terrorism financing, also have a greater incentive to use
stablecoins, as they may face more challenges accessing the U.S. dollar through traditional means, but still
want to benefit from the stability it provides. However, stablecoin issuers can freeze funds when they
become aware of their illicit use, as Tether recently did with addresses linked to terrorism and warfare in
Israel and Ukraine.
Below, we’ll look at three key trends that defined crypto crime in 2023 and will be important to watch
moving forward.
2These estimates do not include privacy coins like Monero.
Introduction 7

Scamming and stolen funds down big
Crypto scamming and hacking revenue both fell significantly in 2023, with total illicit revenue for each
down 29.2% and 54.3% respectively.
As we discuss later in our scams section, many crypto scammers have now adopted romance scam tactics,
targeting individuals and building relationships with them in order to pitch them on fraudulent investing
opportunities, rather than advertising them far and wide, which often makes them more difficult to
uncover. Although the FBI has published data showing that reports of crypto investment scams in the U.S.
has been increasing year over year through 2022, our on-chain metrics suggest scamming revenues
globally have been trending down since 2021. We believe this aligns with the long-standing trend that
scamming is most successful when markets are up, exuberance is high, and people feel like they are
missing out on an opportunity to get rich quickly. Of course, the impact of romance scams on individual
victims is devastating and should not be understated. And while increased reporting – at least in the U.S. –
is a good sign, we still believe insights into romance scams in particular suffer from underreporting. We
hypothesize that the true damage of scamming is greater than what reporting to the FBI and our on-chain
metrics show, but overall, scamming is down, given broader market dynamics.
Crypto hacking, on the other hand, is much more difficult for criminals to hide, as industry observers can
quickly spot the unusual outflows from a given service or protocol when a hack occurs. As we’ll discuss
later, the decline in stolen funds is driven largely by a sharp dropoff in DeFi hacking. That dropoff could
represent the reversal of a disturbing, long-term trend, and may signify that DeFi protocols are improving
their security practices. That said, stolen funds metrics are heavily outlier-driven, and one large hack could
again shift the trend.
Ransomware and darknet market activity on the rise
Ransomware and darknet markets, on the other hand, are two of the most prominent forms of crypto crime
that saw revenues rise in 2023, in contrast with overall trends. The growth of ransomware revenue is
disappointing following the sharp declines we covered last year, and suggests that perhaps ransomware
attackers have adjusted to organizations’ cybersecurity improvements, a trend we first reported earlier
this year.
Similarly, this year’s growth in darknet market revenue also comes after a 2022 decline in revenue. That
decline was driven largely by the shutdown of Hydra, which was once the world’s most dominant market
by far, capturing over 90% of all darknet market revenue at its peak. While no single market has yet
emerged to take its place, the sector as a whole is rebounding, with total revenue climbing back towards
its 2021 highs.
Transactions with sanctioned entities drive the vast majority
of illicit activity
Perhaps the most obvious trend that emerges when looking at illicit transaction volume is the prominence
of sanctions-related transactions. Sanctioned entities and jurisdictions together accounted for a combined
Introduction 8

$14.9 billion worth of transaction volume in 2023, which represents 61.5% of all illicit transaction volume
we measured on the year. Most of this total is driven by cryptocurrency services that were sanctioned by
the U.S. Department of the Treasury's Office of Foreign Assets Control (OFAC), or are located in sanctioned
jurisdictions, and can continue to operate because they’re in jurisdictions where U.S. sanctions are not
enforced.
While those services can and have been used for nefarious purposes, it also means that some of that
$14.9 billion in sanctions-related transaction volume includes activity from average crypto users who
happen to reside in those jurisdictions. For example, Russia-based exchange Garantex, which was
sanctioned by OFAC and OFSI in the U.K. for its facilitation of money laundering on behalf of ransomware
attackers and other cybercriminals, was one of the biggest drivers of transaction volume associated with
sanctioned entities in 2023. Garantex continues to operate because Russia does not enforce U.S. sanctions.
So, does that mean all of Garantex’s transaction volume is associated with ransomware and money
laundering? No. Nevertheless, exposure to Garantex introduces serious sanctions risk for crypto platforms
subject to U.S. or U.K. jurisdiction, which means those platforms must remain ever-more vigilant and screen
for exposure to Garantex in order to be compliant.
Introduction 9

Ransomware
Ransomware 10

Ransomware Payments Exceed $1 Billion
in 2023, Hitting Record High After 2022
Decline
In 2023, ransomware actors intensified their operations, targeting high-profile institutions and critical
infrastructure, including hospitals,schools, and government agencies. Major ransomware supply chain
attacks were carried out exploiting the ubiquitous file transfer software MOVEit, impacting companies
ranging from the BBC to British Airways. As a result of these attacks and others, ransomware gangs
reached an unprecedented milestone, surpassing $1 billion in extorted cryptocurrency payments
from victims.
Last year’s developments highlight the evolving nature of this cyber threat and its increasing impact
on global institutions and security at large.
2023: A watershed year for ransomware
2023 marks a major comeback for ransomware, with record-breaking payments and a substantial increase
in the scope and complexity of attacks — a significant reversal from the decline observed in
2022, which we forewarned in our Mid-Year Crime Update.
Total value received by ransomware attackers
2019 - 2023
Ransomware 11

Ransomware payments in 2023 surpassed the $1 billion mark, the highest ever observed. Although 2022
saw a decline in ransomware payment volume, the overall trend line from 2019 to 2023 indicates that
ransomware is an escalating problem. Keep in mind that this number does not capture the economic
impact of productivity loss and repair costs associated with attacks. This is evident in cases like the
ALPHV-BlackCat and Scattered Spider’s bold targeting of MGM resorts. While MGM did not pay the
ransom, it estimates damages cost the business over $100 million.
The ransomware landscape is not only prolific but continually expanding, making it challenging to monitor
every incident or trace all ransom payments made in cryptocurrencies. It is important to recognize that our
figures are conservative estimates, likely to increase as new ransomware addresses are discovered over
time. For instance, our initial reporting for 2022 in last year’s crime report showed $457 million in ransoms,
but this figure has since been revised upward by 24.1%.
Looking back at 2022: An anomaly, not a trend
Several factors likely contributed to the decrease in ransomware activity in 2022, including geopolitical
events like the Russian-Ukrainian conflict. This conflict not only disrupted the operations of some cyber
actors but also shifted their focus from financial gain to politically motivated cyberattacks aimed at
espionage and destruction.
As we noted in our 2023 Crypto Crime Report, other factors that played a role in this downturn included a
reluctance among some Western entities to pay ransoms to certain strains due to potential sanctions risks.
Conti in particular faced issues, suffering from reported links to sanctioned Russian intelligence agencies,
exposure of the organization's chat logs, and overall internal disarray. This led to a decrease in their
activities and contributed to the overall reduction in ransomware incidents in 2022. But researchers have
noted that many ransomware actors linked to Conti have continued to migrate or launch new strains,
making victims more willing to pay.
Another significant factor in the reduction of ransomware in 2022 was the successful infiltration of the Hive
ransomware strain by the Federal Bureau of Investigation (FBI), as announced by the Department of
Justice early in 2023. Our analysis highlights the substantial impact of this single enforcement action.
Law enforcement takes on ransomware: The Hive intervention
During the infiltration of Hive, the FBI was able to provide decryption keys to over 1,300 victims, effectively
removing the need for ransom payments. The FBI estimates that this intervention prevented approximately
$130 million in ransom payments to Hive. But the impact of this intervention extends further than that.
Total tracked ransomware payments for 2022 currently stand at just $567 million, indicating the ransom
payments prevented by the Hive infiltration significantly altered the ransomware landscape as a whole
last year.
Ransomware 12

Top RaaS strains by ransomware revenue
2022 − 2023
Furthermore, the FBI’s $130 million reduced payment estimate may not tell the whole story of just how
successful the Hive infiltration was. That figure only looks directly at ransoms averted through the
provision of decryptor keys, but does not account for knock-on effects. The Hive infiltration also most likely
affected the broader activities of Hive affiliates, potentially lessening the number of additional attacks they
could carry out, even using strains other than Hive.
During the six months the FBI infiltrated Hive, total ransomware payments across all strains hit $290.35
million. But our statistical models estimate an expected total of $500.7 million during that time period,
based on attacker behavior in the months before and after the infiltration — and that’s a conservative
estimate. Based on that figure, we believe the Hive infiltration may have averted at least $210.4 million in
ransomware payments.
FBI’s Tampa Division Special Agent in Charge, David Walker, provided further insights into the importance
of the infiltration. “The Hive investigation is an example of a gold standard for deploying the key services
model.” Said Walker. “The FBI continues to see, through its investigations and victim engagements, the
significant positive impact actions such as the Hive takedown have against cyber threat actors. We will
continue to take proactive disruptive measures against adversaries.”
Ransomware 13

Ransomware resurges: 2023 threat landscape
In 2023, the ransomware landscape saw a major escalation in the frequency, scope, and volume
of attacks.
Ransomware attacks were carried out by a variety of actors, from large syndicates to smaller groups and
individuals — and experts say their numbers are increasing. Allan Liska, Threat Intelligence Analyst at
cybersecurity firm Recorded Future, notes, “A major thing we’re seeing is the astronomical growth in the
number of threat actors carrying out ransomware attacks.” Recorded Future reported 538 new
ransomware variants in 2023, pointing to the rise of new, independent groups.
We can see some of that variety on the graph below, which shows the most active ransomware strains
by quarter for 2023.
Top ransomware strains by revenue by quarter
2023
We can also see significant differences in the victimization strategies of the top ransomware strains on the
chart below, which plots each strain’s median ransom size versus its frequency of successful attacks. The
chart also illustrates numerous new entrants and offshoots in 2023, who we know often reuse existing
strains’ code. This suggests an increasing number of new players, attracted by the potential for high profits
and lower barriers to entry.
Ransomware 14

Top 50 ransomware strains by median payment size and payment frequency
Note: Bubble size denotes total 2023 ransom inflows
Some strains, like Cl0p, exemplify the “big game hunting” strategy, carrying out fewer attacks than many
other strains, but collecting large payments with each attack. As we’ll explore later, Cl0p leveraged
zero-day vulnerabilities that allowed it to extort many large, deep-pocketed victims en masse, spurring the
strain’s operators to embrace a strategy of data exfiltration rather than encryption.
Overall, big game hunting has become the dominant strategy over the last few years, with a bigger and
bigger share of all ransomware payment volume being made up of payments of $1 million or more.
Ransomware 15

$1M+ ransoms as a share of all ransomware payment volume
Jan 2021 - Dec 2023
Other strains, like Phobos, have adopted the Ransomware as a Service (RaaS) model, in which outsiders
known as affiliates can access the malware to carry out attacks, and in exchange pay the strain’s core
operators a cut of the ransom proceeds. Phobos simplifies the process for less technically sophisticated
hackers to execute ransomware attacks, leveraging the typical encryption process that is the hallmark of
ransomware. Despite targeting smaller entities and demanding lower ransoms, the RaaS model is a force
multiplier, enabling the strain to carry out a large quantity of these smaller attacks.
ALPHV-BlackCat is also a RaaS strain like Phobos, but is more selective in the affiliates it allows to use its
malware, actively recruiting and interviewing potential candidates for their hacking capabilities. This
enables the group to attack bigger targets for larger sums.
It’s also important to keep in mind that rebranding and overlapping strain usage remains prevalent for
ransomware attackers. As we’ve covered previously, ransomware administrators often rebrand or launch
new strains, while affiliates often switch strains or work for multiple simultaneously. Rebrands often allow
ransomware attackers to distance themselves from strains publicly linked to sanctions or that have
incurred too much scrutiny. Rebrands and affiliate switching can also allow attackers to hit the same
victims twice under different strain names.
Fortunately, blockchain analysis makes it possible to identify ransomware rebrands, by showing on-chain
links between wallets of seemingly disparate strains. We can see an example on the Chainalysis Reactor
Ransomware 16

graph below, which shows links between the Trickbot administrator known as Stern, Royal ransomware,
and its newer iteration known as 3am.
The frequency of rebranding, especially among actors behind the biggest and most notorious strains, is an
important reminder that the ransomware ecosystem is smaller than the large number of strains would
make it appear.
The spread of Ransomware-as-a-Service (RaaS) and availability of hacking tools
have made it easier to launch attacks
The growth of initial access brokers (IABs) has made it easier for bad actors to carry out ransomware
attacks. As their name would suggest, IABs penetrate the networks of potential victims, then sell that
access to ransomware attackers for as little as a few hundred dollars. We found a correlation between
inflows to IAB wallets and an upsurge in ransomware payments, suggesting monitoring IABs could provide
early warning signs and allow for potential intervention and mitigation of attacks.
IABs combined with off-the-shelf RaaS, means that much less technical skill is required to carry out a
successful ransomware attack. Andrew Davis, General Counsel at Kivu Consulting, a firm specializing in
cybersecurity incident response, told us more about this trend. “The increase in attack volume can be
attributed to the affiliate model's ease of access and the adoption of ransomware-as-a-service, a
disturbingly effective business model for cybercriminals,” said Davis.
We can see examples of this activity on the following Reactor graph, which shows a ransomware operator
sending funds to several IABs and other purveyors of tools useful for ransomware attacks.
Ransomware 17

The ransomware actors depicted above have executed attacks that have brought in millions of dollars.
CASE STUDY
Cl0p: How zero-day attacks enable big game hunting
2023 was remarkable for the number of high-impact ransomware incidents that utilized zero-day
vulnerabilities, which are particularly beneficial for threat actors because they leverage security gaps
before developers have the opportunity to create and distribute a fix. Zero-day exploits can be even more
damaging if they affect software that is ubiquitous but not well-known to end users who are the ultimate
victims of an attack, usually because the software is used primarily by vendors serving those end users.
Cl0p’s most notorious attack of 2023 was its exploitation of the MOVEit zero-day. MOVEit is a file transfer
software used by many IT and cloud applications, so this vulnerability exposed the data of hundreds of
organizations and millions of individuals at once. “Many victims of the MOVEit exploitation did not know
that they were affected because they were not aware that they were exposed to the software,” said Allan
Liska of Recorded Future.
Ransomware 18

Beginning in May of 2023, Cl0p began exploiting the MOVEit vulnerability, enabling the group to target a
huge number of victims. With so many targets, encrypting data and distributing decryptor keys to those
who pay becomes logistically impractical. Data exfiltration – stealing data without blocking access and
threatening to release it to the public – proves to be a more efficient tactic and hedges against possible
decryptors foiling the attack. Lizzie Cookson, Senior Director of Incident Response at Coveware, comments
on this tactic. “Encryption requires more expertise, resources, and a specific type of victim landscape,” said
Cookson. “Exfiltration requires less dwell time, less experience and skill to execute and can often be
accomplished without malicious software.”
Cl0p’s MOVEit campaign allowed it to become for a time the most prominent strain in the entire ecosystem,
amassing over $100 million in ransom payments and accounting for 44.8% of all ransomware value
received in June, and 39.0% in July.
Cl0p's share of all ransomware revenue by month
2023
In addition to being extremely lucrative, Cl0p’s MOVEit campaign shows that leaner extortion efforts can
still get victims to pay.
Ransomware off-ramping: Where do the funds go?
Analyzing the movement of ransomware funds provides essential insights into the methods and services
used by threat actors, enabling law enforcement to target and disrupt their financial networks and
infrastructure.
It is important to keep in mind that threat actors may take weeks, months, or even years to launder their
proceeds from ransomware, and so some of the laundering observed in 2023 is from attacks that occurred
well into the past.
Ransomware 19

Centralized exchanges and mixers have consistently represented a substantial share of transactions,
suggesting they are preferred methods for laundering ransomware payments. However, this year saw the
embrace of new services for laundering, including bridges, instant exchangers, and gambling services. We
assess that this is a result of takedowns disrupting preferred laundering methods for ransomware, some
services’ implementation of more robust AML/KYC policies, and also as an indication of new ransomware
actors’ unique laundering preferences.
We also see significant concentration in the specific services within each category that ransomware actors
turn to for laundering.
Ransomware 20
Destination of funds sent from ransomware wallets
2022-2023

Concentration in ransomware money laundering by off-ramping service category:
Share of value going to the top service in category vs. All others
2023
Exchanges showed the lowest level of concentration, while gambling services, cross-chain bridges, and
sanctioned entities showed the highest levels of concentration. Mixers, no-KYC exchanges, and
underground exchanges were in the middle, with roughly half of all funds sent to each category from
ransomware wallets went to one service. Mixer concentration may have increased as a result of the
Chipmixer takedown, which eliminated a popular option for ransomware attackers. In general, this
overconcentration may expose ransomware actors to bottlenecks that make them vulnerable, as law
enforcement could significantly disrupt operations by taking down a relatively small number of services.
Lessons from 2023
The ransomware landscape underwent significant changes in 2023, marked by shifts in tactics
and affiliations among threat actors, as well as the continued spread of RaaS strains and swifter
attack execution, demonstrating a more efficient and aggressive approach. The movement of affiliates
highlighted the fluidity within the ransomware underworld and the constant search for more
lucrative extortion schemes.
Threat actors continue to innovate and adapt to regulatory changes and law enforcement actions,
but 2023 also saw significant victories in the fight against ransomware with collaboration between
international law enforcement, affected organizations, cybersecurity firms, and blockchain intelligence.
Lizzie Cookson of Coveware pointed out, "The Hive takedown and the BlackCat disruption are both
great examples of how the FBI has been prioritizing victims' assistance, helping victims and imposing
costs on bad actors." Andrew Davis of Kivu Consulting also noted an uptick in proactive engagement
from law enforcement, indicating a stronger, more determined approach to aiding victims and
tracking down cybercriminals.
Ransomware 21

Money Laundering
Money Laundering 22

Money Laundering Activity Spread Across
More Service Deposit Addresses in 2023,
Plus New Tactics from Lazarus Group
The goal of money laundering is to obscure the criminal origins of funds so that they can be accessed and
spent. In the context of cryptocurrency-based crime, that generally means moving funds to services where
they can be converted into cash, while often taking extra steps to conceal where the funds came from. Our
on-chain analysis of crypto money laundering therefore focuses on two distinct groups of services and
on-chain entities:
●Intermediary services and wallets. This category includes personal wallets, mixers, instant
exchangers, various types of DeFi protocols, and other services both legitimate and illicit. Crypto
criminals generally use services in this category to hold funds, or to obfuscate their criminal origins,
often by obscuring the on-chain link between their source address and their current address.
●Fiat off-ramping services. This category includes any service where cryptocurrency can be
converted into fiat currency, the most common being centralized exchanges. However, it can also
include P2P exchanges, gambling services, and crypto ATMs. It’s also important to consider nested
services that operate using the infrastructure of centralized exchanges and allow for fiat
off-ramping, such as many OTC trade desks.
It’s important to remember that all of these services have different capabilities and options when it comes
to addressing money laundering. Centralized exchanges, for instance, have much more control in that they
can freeze funds coming from suspicious or illicit sources. DeFi protocols, however, generally don’t have this
option, as they run autonomously and don’t take custody of users’ funds. Of course, DeFi protocols’
decentralized nature also means that blockchain analysts can generally trace funds moving through DeFi
protocols to their next stop, which isn’t the case with centralized services. And of course, illicit services
purposely facilitating money laundering can generally be stopped only through law enforcement
operations or other legal processes. It’s also important to keep in mind that token issuers can play a
positive role as well. Stablecoins like USDT and USDC, for instance, have functionalities allowing them to
freeze assets held by addresses associated with crime.
With that in mind, let’s look at the key crypto money laundering trends of 2023.
2023 crypto money laundering: Key trends
In 2023, illicit addresses sent $22.2 billion worth of cryptocurrency to services, which is a significant
decrease from the $31.5 billion sent in 2022. Some of this drop may be attributed to an overall decrease in
crypto transaction volume, both legitimate and illicit. However, the drop in money laundering activity was
steeper, at 29.5%, compared to the 14.9% drop in total transaction volume.
Money Laundering 23

Total cryptocurrency laundered by year
2019 - 2023
Overall, centralized exchanges remain the primary destination for funds sent from illicit addresses, at a rate
that has remained relatively stable over the last five years. Over time, the role of illicit services has shrunk,
while the share of illicit funds going to DeFi protocols has grown. We attribute this primarily to the overall
growth of DeFi generally during the time period, but must also note that DeFi’s inherent transparency
generally makes it a poor choice for obfuscating the movement of funds.
2023 mostly resembled 2022 in terms of the breakdown of service types used for money laundering, but
we did see a slight decrease in the share of illicit funds moving to illicit service types, and an increase in
funds moving to gambling services and bridge protocols.
Money Laundering 24

Destination of funds leaving illicit wallets
2019 - 2023
However, if we zoom in to look at how specific types of crypto criminals laundered money, we can see that
there was in fact significant change in some areas. Most notably, we saw a huge increase in the volume of
funds sent to blockchain bridges from addresses associated with stolen funds, a trend we’ll examine in
greater detail later. We also observed a substantial increase in funds sent from ransomware to gambling
platforms, and in funds sent to bridges from ransomware wallets.
Money Laundering 25

YoY change change in money laundering services utilized by crime category
2022 vs 2023
Money laundering concentration at fiat off-ramps
Fiat off-ramping services are important because they’re where criminals can convert their crypto into cash
— the culmination of the money laundering process. While there are thousands of off-ramping services in
operation, most money laundering activity is concentrated to a select few services. Of all illicit funds sent to
off-ramping services in 2023, 71.7% went to just five services, up slightly from 68.7% in 2022.
Share of all illicit funds going to five off-ramping services
2019 - 2023
Money Laundering 26

We can also go one level deeper and examine money laundering concentration at the deposit address
level. Deposit addresses are addresses at centralized services associated with individual users — you can
think of them as akin to bank accounts. Examining money laundering activity at the deposit address level
therefore lets us get a better sense of the individuals or nested services most directly responsible for the
majority of crypto money laundering activity. Looking at things through this lens, we can see that money
laundering actually became less concentrated at the deposit address level in 2023, even as it became
slightly more concentrated at the service level.
All illicit cryptocurrency received by fiat off-ramp service deposit addresses
2023
How to read this graph: This graph shows service deposit addresses bucketed by how much total illicit cryptocurrency each
address received individually in 2023. Each grey bar represents the number of deposit addresses in the bucket, while each blue
bar represents the total illicit cryptocurrency value received by all deposit addresses in the bucket. Using the first bucket as an
example, we see that 2,235,329 deposit addresses received between $5 and $100 worth of illicit cryptocurrency, and together
all of those deposit addresses received a total of $69.4 million worth of illicit cryptocurrency.
In 2023, 109 exchange deposit addresses received over $10 million worth of illicit cryptocurrency each, and
collectively, they received $3.4 billion in illicit cryptocurrency. While that still represents significant
concentration, in 2022, only 40 addresses received over $10 million in illicit crypto, for a collective total of
just under $2.0 billion. In 2022, just 542 deposit addresses received over $1 million in illicit cryptocurrency,
for a total of $6.3 billion, which was over half of all illicit value received by centralized exchanges that year.
In 2023, 1,425 deposit addresses received over $1 million in illicit cryptocurrency, for a total of $6.7 billion,
which accounts for just 46% of all illicit value received by exchanges for the year.
However, it’s also worth noting that money laundering concentration differs by criminal type. For instance,
CSAM vendors and ransomware operators show a high degree of concentration — just seven deposit
Money Laundering 27

addresses account for 51.0% of all value received from CSAM vendors by exchanges, while for
ransomware, just nine addresses account for 50.3%. On the other side of the spectrum, scams and darknet
markets show much less concentration. Forms of crypto crime displaying higher concentration may be
more vulnerable to law enforcement, as their money laundering activity relies on comparatively fewer
services that can be disrupted.
Money laundering concentration by crime type:
Share of total illicit value received by top deposit addresses
2023
Overall, it’s possible that crypto criminals are diversifying their money laundering activity across more
nested services or deposit addresses in order to better conceal it from law enforcement and exchange
compliance teams. Spreading the activity across more addresses may also be a strategy to lessen the
impact of any one deposit address being frozen for suspicious activity. As a result, fighting crypto crime via
the targeting of money laundering infrastructure may require greater diligence and understanding of
interconnectedness through on-chain activity than in the past, as the activity is more diffuse.
Money Laundering 28

Money laundering tactics changing: Most sophisticated
crypto criminals utilizing bridges and mixers
A big share of crypto money laundering activity is relatively unsophisticated, and consists of bad actors
simply sending funds directly to exchanges. We can see this on the Chainalysis Reactor graph below,
which shows the now-defunct phone number spoofing service iSpoof — which facilitated over £100 million
in scamming activity before being shut down by law enforcement — sending millions in Bitcoin directly to
a group of deposit addresses at a centralized exchange.
However, crypto criminals with more sophisticated on-chain laundering skill sets —such as the notorious
North Korean cybercriminals associated with hacking gangs like Lazarus Group — tend to utilize a greater
variety of crypto services and protocols. Below, we’ll look at two important ways sophisticated bad actors
adjusted their money laundering strategy, illustrated through examples from Lazarus Group:
●Use of a new mixer following Sinbad’s takedown and OFAC designation
●Chain hopping via cross-chain bridges
Let’s take a closer look at both.
Money Laundering 29

New mixer: YoMix takes over for Sinbad
Overall, 2023 saw a decline in funds sent to mixers from illicit addresses, from $1.0 billion in 2022 to
$504.3 million in 2023.
Total illicit value moving to mixers
2019 - 2023
Much of this is likely due to law enforcement and regulatory efforts, such as the sanctioning and shutdown
of mixer Sinbad in November 2023. But sophisticated cybercriminal groups like Lazarus Group have
adapted their mixer usage. As we covered in last year’s Crypto Crime Report, Sinbad became a preferred
mixer for North Korea-affiliated hackers in 2022, soon after the sanctioning of Tornado Cash, which had
previously been the go-to for these sophisticated cybercriminals. With Sinbad out of the picture,
Bitcoin-based mixer YoMix has acted as a replacement. We can see an example of this on the Reactor
graph below, which shows a wallet associated with North Korean hacking activity receiving funds from
YoMix, whereas it had previously received funds from Sinbad.
Money Laundering 30

Overall, YoMix saw huge growth in 2023, with inflows growing by more than 5x over the course of
the year.
Quarterly indexed growth of funds sent to Yomix
2023 | Index: Q1 2023 = 100
Based on Chainalysis data, roughly one third of all YoMix inflows have come from wallets associated with
crypto hacks. The growth of YoMix and its embrace by Lazarus Group is a prime example of sophisticated
actors’ ability to adapt and find replacement obfuscation services when previously popular ones are
shut down.
Money Laundering 31

Use of cross-chain bridges
Cross-chain bridges allow users to move funds from one blockchain to another. Generally, anyone can
access these smart contracts, although in theory a bridge could implement a blacklist. All of this activity
happens on-chain, which means that blockchain analysts can trace funds through bridges, as no
centralized entity ever takes custody of the funds that move to bridges.
As discussed previously, illicit actors’ use of bridge protocols for money laundering purposes grew
substantially in 2023, particularly amongst crypto thieves.
Total illicit value moving to bridges
2019 - 2023
Overall, bridge protocols received $743.8 million in crypto from illicit addresses in 2023, up from just
$312.2 million in 2022.
North Korea-affiliated hackers have been among those to utilize bridges for money laundering the most,
and we can see an example of this activity on the Reactor graph below.
Money Laundering 32

In this case, funds associated with the 2022 Harmony hack moved to a popular bridge protocol in May
2023, where they were moved from the Bitcoin blockchain to the Avalanche blockchain. The funds were
then swapped for a stablecoin, and then bridged again using a different protocol, this time from the
Avalanche blockchain to the TRON blockchain.
Sophisticated bad actors adapt frequently
The changes in money laundering strategy we’ve seen from crypto criminals like Lazarus Group serve as
an important reminder that the most sophisticated illicit actors are always adapting their money
laundering strategy and exploiting new kinds of crypto services. Law enforcement and compliance teams
can be more effective by studying these new laundering methods and becoming familiar with the on-chain
patterns associated with them.
Money Laundering 33
Stolen Funds
Stolen Funds 34

Funds Stolen from Crypto Platforms Fall
More Than 50% in 2023, but Hacking
Remains a Significant Threat as Number of
Incidents Rises
Over the last few years, cryptocurrency hacking has become a pervasive and formidable threat, leading to
billions of dollars stolen from crypto platforms and exposing vulnerabilities across the ecosystem. As we
revealed in last year’s Crypto Crime Report, 2022 was the biggest year ever for crypto theft with $3.7
billion stolen. In 2023, however, funds stolen decreased by 54.3% to $1.7 billion, though the number of
individual hacking incidents actually grew, from 219 in 2022 to 231 in 2023.
Yearly total value stolen in crypto hacks and number of hacks
2016 - 2023
Why the huge drop in stolen funds? Mostly due to a drop in DeFi hacking. Hacks of DeFi protocols largely
drove the huge increase in stolen crypto that we saw in 2021 and 2022, with cybercriminals stealing more
than $3.1 billion in DeFi hacks last year. But this year, hackers stole just $1.1 billion from DeFi protocols.
This amounts to a 63.7% drop in the total value stolen from DeFi platforms year-over-year. There was also
a significant drop in the share of all funds stolen accounted for by DeFi protocol victims in 2023, as we see
on the chart below.
Stolen Funds 35

Cryptocurrency stolen in hacks by victim platform type
2016 - 2023
We’ll explore the possible reasons for the drop in DeFi hacking in greater detail later on. Despite that drop,
there still were several large hacks of notable DeFi protocols throughout 2023. In March, for instance, Euler
Finance, a borrowing and lending protocol on Ethereum, experienced a flash loan attack, leading to roughly
$197 million in losses. July 2023 saw 33 hacks — the most of any month — which included $73.5 million
stolen from Curve Finance. We can see the spikes driven by those hacks below.
Monthly total value stolen in crypto hacks and number of hacks
2023
Stolen Funds 36

Similarly, several large exploits occurred in September and November 2023 on both DeFi and CeFi
platforms: Mixin Network ($200 million), CoinEx ($43 million), Poloniex Exchange ($130 million), HTX
($113.3 million), and Kyber Network ($54.7 million).
Keep reading to learn more about crypto hacking trends in 2023, including how North Korea-affiliated
cyber criminals had one of their most active years, executing more individual crypto hacks than ever before.
Attack vectors affecting DeFi are sophisticated and diverse
DeFi hacking exploded in 2021 and 2022, with attackers stealing approximately $2.5 billion and $3.1
billion, respectively, from protocols. Mar Gimenez-Aguilar, Lead Security Architect and Researcher at our
partner Halborn, a security company specializing in web3 and blockchain solutions, told us more about the
rise in DeFi hacking during those years. “There’s been a worrying trend in the escalation of both the
frequency and severity of attacks within the DeFi ecosystem,” she explained. “In our comprehensive
analysis of the top 50 DeFi hacks, we observed that EVM-based chains and Solana are among the most
targeted chains, largely due to their popularity and capability to execute smart contracts.” When
examining this trend last year, security experts told us that they believe many DeFi vulnerabilities stemmed
from protocol operators focusing primarily on growth, and not enough on implementing and maintaining
robust security systems.
However, for the first time since DeFi’s emergence as a key sector of the crypto economy, the yearly total
stolen from DeFi protocols fell — and fell significantly.
Value stolen in DeFi hacks
2019 - 2023
The value lost in DeFi hacks declined by 63.7% year-over-year in 2023, and median loss per DeFi hack
dropped by 7.4%. And, while the number of individual crypto hacks rose in 2023, the number of DeFi hacks
specifically declined by 17.2%.
Stolen Funds 37

In order to understand this trend better, we worked with Halborn to analyze 2023 DeFi hacking activity
through the lens of the specific attack vectors hackers utilized.
Classifying and analyzing attack vectors within the DeFi landscape
Attack vectors affecting DeFi are diverse and constantly evolving; it is therefore important to classify them
to understand how hacks occur and how protocols might be able to reduce their likelihood in the future.
According to Halborn, DeFi attack vectors can be placed into one of two categories: vectors originating
on-chain and vectors originating off-chain.
On-chain attack vectors stem not from vulnerabilities inherent to blockchains themselves, but rather from
vulnerabilities in the on-chain components of a DeFi protocol, such as their smart contracts. These aren’t a
point of concern for centralized services, as centralized services don’t function as decentralized apps with
publicly visible code the way DeFi protocols do. Off-chain attack vectors stem from vulnerabilities outside
of the blockchain — one example could be the off-chain storage of private keys in, say, a faulty cloud
storage solution — and therefore apply to both DeFi protocols and centralized services.
Hack attack vector sub-category
Definition
On-chain or off-chain
Protocol exploitation
When an attacker exploits vulnerabilities
in a blockchain component of a protocol,
such as ones pertaining to validator
nodes, the protocol’s virtual machine, or in
the mining layer.
On-chain
Insider attack
When an attacker working inside a
protocol, such as a rogue developer, uses
privileged keys or other private
information to directly steal funds.
Off-chain
Phishing
When an attacker tricks users into signing
permissions, often done by supplanting a
legitimate protocol, allowing the attacker
to spend tokens on users’ behalf. Phishing
may also happen when an attacker tricks
users into directly sending funds to
malicious smart contracts.
Off-chain
Contagion
When an attacker exploits a protocol due
to vulnerabilities created by a hack in
another protocol. Contagion also includes
hacks that are closely related to hacks in
other protocols.
On-chain
Compromised server
When an attacker compromises a server
that is owned by a protocol, thereby
disrupting the protocol’s normal workflow
or gaining knowledge to further exploit
the protocol in the future.
Off-chain
Stolen Funds 38

Wallet hack
When an attacker exploits a protocol that
provides custodial/ wallet services and
subsequently acquires information about
the wallets’ operation.
Off-chain
Price manipulation hack
When an attacker exploits a smart
contract vulnerability or utilizes a flawed
oracle that does not reflect accurate asset
prices, facilitating the manipulation of a
digital token’s price.
On-chain
Smart contract exploitation
When an attacker exploits a vulnerability
in a smart contract code, which typically
grants direct access to various control
mechanisms of a protocol and token
transfers.
On-chain
Compromised private key
When an attacker acquires access to a
user’s private key, which can occur
through a leak or a failure in off-chain
software, for example.
Off-chain
Governance attacks
When an attacker manipulates a
blockchain project with a decentralized
governance structure by gaining enough
influence or voting rights to enact a
malicious proposal.
On-chain
Third-party compromised
When an attacker gains access to an
off-chain third-party program that a
protocol uses, which provides information
that can later be used for an exploit.
Off-chain
Other
Either the attack does not fit in any of the
previous categories or there is not enough
information to properly classify it.
On-chain/Off-chain
Source: Halborn
According to Gimenez-Aguilar, both on-chain and off-chain vulnerabilities present serious concerns.
“Historically, the majority of DeFi hacks have stemmed from vulnerabilities in smart contract design and
implementation — a large proportion of the affected contracts we examined had either not undergone any
audit or had been audited inadequately,” she said, explaining on-chain vulnerabilities. “Another notable
trend is the increase in attacks as a result of compromised private keys, which underscores the importance
of improvements in security practices outside of a given blockchain.”
Indeed, the data shows that both the on-chain and off-chain vulnerabilities Gimenez-Aguilar describes —
in particular the compromise of private keys, price manipulation hacks, and smart contract exploitation —
drove hacking losses in 2023.
Stolen Funds 39

Yearly share of value stolen in DeFi hacks by attack vector
2023
Source: Halborn
Overall, on-chain vulnerabilities drove the majority of DeFi hacking activity in 2023, but as we see on the
chart below, that changed over the course of the year, with compromised private keys driving a larger
share of hacks in the third and fourth quarters.
Quarterly share of value stolen from DeFi protocols by attack vector
2023
Source: Halborn
Stolen Funds 40

On a hack-by-hack basis, hacks stemming from contagion (on-chain) were the most destructive, with a
median loss of $1.4 million. Governance attacks (on-chain), insider attacks (off-chain), and compromised
private keys (off-chain) follow, with all three accounting for a median hack value of roughly $1 million.
Median value stolen in hacks: Breakdown by subtype
2023
Source: Halborn
Overall though, the data provides reasons for optimism. Both the drop in raw value stolen from DeFi, and
the relative decline in on-chain vulnerability-driven hacking over the course of 2023 suggests that DeFi
operators may be getting better at smart contract security. “I do think that the increase of security
measures in DeFi protocols is a key factor in the reduction in the quantity of hacks related to smart
contracts vulnerabilities. If we compare the top 50 hacks by value lost from this year with those from
previous ones (studied in Halborn’s Top 50 hacks report), there is a reduction in percentage of losses from
47.0% of the total to 18.2%. Price manipulation attacks, nevertheless, remain almost constant with around
20.0% of the total value lost. This is an indication that, when performing an audit, protocols should also
take into account how they interact with the whole DeFi ecosystem,” said Gimenez-Aguilar. However, she
also stressed that the growth in hacks driven by attack vectors such as compromised private keys indicates
that DeFi operators must move beyond smart contract security and address off-chain vulnerabilities as
well: “Doing the same comparison as before, losses related to compromised private keys increased from
22.0% to 47.8%.” As we see above, both on-chain and off-chain vulnerabilities can be highly destructive.
However, Gimenez-Aguilar also acknowledged that the drop in DeFi hacking losses may be driven in part
by the overall drop in DeFi activity in 2023, which may have simply decreased the number of DeFi protocols
Stolen Funds 41

that made ripe targets for hackers. Total value locked (TVL), which measures the total value held or staked
in DeFi protocols, was down for all of 2023, following a sharp decrease in the middle of 2022.
Monthly total value locked (TVL) in DeFi protocols
Jan 2021 - Dec 2023
Source: DeFiLlama
We can’t say for sure whether the drop in DeFi hacking was driven primarily by better security practices or
the drop in DeFi activity overall — most likely, it was a mix of the two. But, if the decrease in hacking was
primarily driven by the drop in overall activity, then it would be important to watch whether DeFi hacking
rises again in tandem with another DeFi bull market. Such a bull market would lead to higher TVL and
therefore a larger pool of DeFi funds for hackers to target.
Regardless, there are steps DeFi operators should take to improve security. DeFi protocols vulnerable to
on-chain failures can develop systems that monitor on-chain activity related to economic risks and prior
platform losses. Companies such as Hypernative and Hexagate, for example, produce customized alerts to
prevent and react to cyber attacks, which can help platforms better secure integrations with third parties
such as bridges, and communicate with customers who might be at risk. Platforms vulnerable to off-chain
failures may aim to reduce reliance on centralized products and services.
North Korea hacked more crypto platforms than ever in
2023, but stole less in total than in 2022
North Korea-linked hacks have been on the rise over the past few years, with cyber-espionage groups such
as Kimsuky and Lazarus Group utilizing various malicious tactics to acquire large amounts of crypto assets.
Stolen Funds 42

Just last year, cryptocurrency stolen by hackers associated with North Korea reached its highest level of
approximately $1.7 billion. In 2023, we estimate that the total amount stolen is slightly over $1.0 billion, but
as we see below, the number of hacks rose to 20 — the highest number on record — in the context of the
overall crypto bear market.
Estimated value stolen by DPRK-linked hackers
2016 - 2023
North Korea-linked hackers stole approximately $428.8 million from DeFi platforms in 2023, and also
targeted centralized services ($150.0 million stolen), exchanges ($330.9 million), and wallet providers
($127.0 million).
Share of value stolen in DPRK-linked hacks by crypto service type
2016 - 2023
Stolen Funds 43

2023 saw a notable decrease in North Korean targeting of DeFi protocols, mirroring the overall drop in DeFi
hacking that we discussed above.
CASE STUDY
The DPRK’s Atomic Wallet exploit
In June 2023, thousands of users of Atomic Wallet, a non-custodial cryptocurrency wallet service, were
targeted by a hacker, leading to estimated losses of $129 million. The FBI later attributed this attack to
North Korea-affiliated hacking group TraderTraitor and stated that the Atomic Wallet exploit was the first
in a series of similar attacks, including the Alphapo and Coinspaid exploits later in the month. Although the
specifics of how the attack occurred remain unclear, we used on-chain analysis to look at what happened
to the funds after the initial attack, which we’ve broken down into four phases.
In the first phase, the attacker chain hopped — moving assets from one blockchain to another, typically to
obfuscate the flow of ill-gotten funds — to the Bitcoin blockchain via the following three methods:
1. Sending funds to centralized exchanges. While we can’t continue to trace funds on-chain following
their movement to a centralized service, we know in this case that funds stolen from Atomic Wallet
were converted into Bitcoin at centralized exchanges because we gathered intelligence from other
trusted sources with whom we regularly collaborate.
2. Sending funds to cross-chain bridges where they could be moved to the Bitcoin blockchain.
3. Sending funds to wrapped Ether (wETH) contracts, then moving to the Bitcoin blockchain via the
Avalanche Bridge.
The Chainalysis Reactor graph below illustrates the third method whereby the stolen funds (in Ether at the
time) moved through several intermediary addresses before reaching the Avalanche Bridge and converting
to Bitcoin.
Stolen Funds 44

In the second phase, the attacker sent the stolen funds to the OFAC-sanctioned Sinbad, a mixing service
that obscures on-chain transaction details and has been previously used by North Korean money
launderers. Then, the attacker withdrew the funds from Sinbad and moved them to consolidation
addresses on Bitcoin.
In the third phase, the attacker’s money laundering strategy shifted to focusing almost exclusively on the
Tron blockchain rather than the Bitcoin blockchain. The attacker chain hopped to the Tron blockchain via
one of the following methods:
1. Sending funds to Avalanche through the Avalanche Bridge where they could be moved to the Tron
blockchain.
2. Sending funds to centralized services, then moving them to the Tron blockchain.
3. Sending funds through additional mixers or privacy-enhancing services to further obfuscate the
flow of funds, then moving them to the Tron blockchain.
In the fourth and final phase, the attacker deposited the funds at various services on the Tron blockchain.
Some of these funds were mixed via Tron’s JustWrapper Shielded Pool, whereas others were ultimately
sent to high-activity Tron addresses suspected of belonging to over-the-counter traders.
Stolen Funds 45

Additional on-chain activity revealed that funds stolen from Atomic were consolidated with assets from
other sources before moving elsewhere, which is likely related to the subsequent Alphapo and Coinspaid
exploits.
The future of crypto hacking
Although the total amount stolen from crypto platforms in 2023 was down significantly from prior years, it
is clear that attackers are becoming increasingly sophisticated and diverse in their exploits. The good news
is, crypto platforms are becoming more sophisticated in their security and responses to attacks, too.
When crypto platforms act promptly after exploits, law enforcement agencies will be better equipped to
contact exchanges where frozen funds are located to initiate seizure and contact services through which
the funds flowed to gather relevant information about accounts and users. Over time, as these processes
improve, it is likely that funds stolen from crypto hacks will continue to decline.
Stolen Funds 46

Market Manipulation
Market Manipulation 47

54% of ERC-20 Tokens Listed on DEXes
in 2023 Display Patterns That May Be
Suggestive of Pump and Dump Schemes,
but Represent just 1.3% of DEX Trading
Volume
For most of the research that we publish in our annual Crypto Crime Report, the data tells a clear story. For
instance, funds sent to ransomware operators, darknet markets, or sanctioned entities can be measured
and trends can be analyzed with Chainalysis labeling and data. But on-chain data can also be used to
detect suspicious trading patterns. In these cases, the evidence on the blockchain is less definitive. Instead,
on-chain data can provide a starting point for deeper investigations, usually combined with other, off-chain
information. For this reason, we do not include possible market manipulation proceeds or estimates of
victim losses in our count of total illicit transaction volume — there isn’t enough information to determine
whether the activity is criminal or not without additional context.
Pump and dump schemes typically involve an actor or group of actors investing in a token, heavily
promoting that token to spur a price increase, and subsequently dumping their holdings at a significant
profit. This often results in a heavy decline or even collapse of a token’s price, impacting unsuspecting
holders.
For this analysis, we designed a methodology to surface data points that identify potential areas for
further investigation into possible market manipulation. We focused on DeFi, given its transparency and
the availability of on-chain trading data, which is not similarly available for centralized exchanges.
Specifically, we looked at the Ethereum network, which has experienced rapid growth and innovation in
recent years. Thanks to the ecosystem’s ERC-20 standard, or technical guidelines for Ethereum-based
fungible tokens, it’s never been easier to build new tokens on top of Ethereum, with all tokens able to be
traded with one another and used on a variety of decentralized applications (dApps).
Below, we’ll use on-chain analysis to consider what some of these patterns look like, a critical tool for
market operators and government agencies alike.
How on-chain data could be used to identify elements of
possible pump and dump schemes
Between January and December 2023, just over 370,000 tokens were launched on Ethereum,
approximately 168,600 of which were available to trade on at least one decentralized exchange (DEX). As
we see below, the number of monthly tokens launched has been increasing since mid-2022, with recent
spikes in activity nearing 50,000 per month.
Market Manipulation 48

This data comes from Transpose, the comprehensive source for indexed real-time blockchain data.
Not all of those tokens get significant traction, though. In any given month, less than 14.1% of all tokens
launched achieve more than $300 of DEX liquidity within the subsequent month, and only 5.7% of all
tokens launched in 2023 are currently above that threshold. Although this is an increase from the previous
two years, low liquidity values suggest that the majority of tokens launched still cannot be easily
exchanged with liquid assets such as ETH, wETH, USDC, USDT, and wBTC without having their prices
significantly affected.
Share of tokens launched on Ethereum to achieve >$300 in DEX liquidity one month after launch
Jan 2021 - Dec 2023
Market Manipulation 49
Number of tokens launched on Ethereum
Jan 2021 - Dec 2023

There are many reasons that could explain the failure to reach more liquid trading volumes. As the
popularity of tokenization grows, launching new tokens into an increasingly crowded marketplace
becomes more challenging.
However, some may be attempts at pump and dump schemes. Here is an example of how one type of
token manipulation could occur:
1. An actor (or group of actors) either launches a new token or buys a large share of supply for an
existing token — usually one with historically low volume.
2. This actor hypes up the token as an opportunity to “get rich quick,” typically using social media and
online chat rooms like Discord and Telegram.
3. The persistent marketing on social media and chat rooms attracts attention from users, leading to
an increase in buying.
4. The actor may also engage in wash trading, which involves the simultaneous buying and selling of
the same asset with the intent of falsifying its level of activity.
5. If successful, the token rises in value.
6. Once the token reaches the desired price target, the actor liquidates their position for a profit.
7. The price of the token rapidly drops due to increased selling pressure, leaving many victims
“holding the bag.”
8. If the actor is also the token creator, they may completely abandon the token project, taking more
users’ funds with them, also known as a “rug pull.” However, this is not always possible depending
on the governance of the project.
Many of these elements can be identified in on-chain data. We utilized Transpose to look for ERC-20
tokens that met the following three criteria, which we’ll refer to as Criteria A:
1. The token was purchased five times or more by DEX users with no on-chain connection to the
token’s biggest holders, indicating that it achieved some level of traction in the market.
2. A single address removed more than 70.0% of the liquidity in the token’s DEX liquidity pool,
indicating that the biggest holder dumped the token. In most cases, the address removed the
token’s liquidity within the first few weeks of launch.
3. The token currently has liquidity of $300 or less, indicating that the market for the token essentially
ceased following the removal of liquidity. If the token was involved with multiple DEX pools, we
combined the liquidity of each one.
We found that approximately 90,408 tokens launched in 2023 met Criteria A. This number represents
24.4% of all tokens launched on Ethereum and 53.6% of tokens that were listed on a DEX during the time
period studied. However, over the course of the year, the volume of transactions made with tokens that
met Criteria A accounted for only 1.3% of total trade volume on Ethereum DEXes.
Market Manipulation 50

Number of tokens
Percent of all tokens launched
Total tokens launched
370,066
100.0%
Tokens listed on DEX
168,623
53.6%
Tokens currently with less than $300 in liquidity
where a single address removed more than
70.0% of liquidity in a single transaction with
five or more previous DEX purchases
90,408
24.4%
This methodology does not mean these tokens were the subjects of pump and dump schemes — rather, it
illustrates how operators or regulators can leverage on-chain trading data to identify and prioritize
patterns that may suggest illicit activity and warrant further investigation.
The monthly number of new tokens meeting Criteria A has been declining since mid-2023, although it is
still higher than the number from 2022.
Number of ERC-20 tokens that met criteria for possible pump and dump
Jan 2022 - Dec 2023
Source: Transpose
Market Manipulation 51

How much did actors who launched tokens meeting Criteria A profit before their tokens plummeted in
value? We can calculate this using the following formula, based on how wallets associated with a token’s
launch interacted with its DEX liquidity pools and traded the token itself.
A= Amount withdrawn from DEX pool by possible illicit actor
B= Amount deposited into DEX pool by possible illicit actor
C= Funds spent by illicit actor to trade token, possibly via wash trading
Profit = A - B - C
Using this formula, we calculate that actors who launched tokens meeting Criteria A collectively made
approximately $241.6 million in profit in 2023, not accounting for other costs to build and launch the token.
Estimated monthly profit generated by tokens that met criteria for possible pump and dump
2023
Source: Transpose
Although the total profit amassed by these actors is significant, individual tokens meeting our criteria on
average produce just $2,672 each in profit and, again, account for just 1.3% of total Ethereum DEX trading
volume for 2023. The data paints a picture of an ecosystem in which potentially bad actors could generate
tens of thousands of potential pump and dump tokens, most of which fail to generate significant profit and
don’t attract meaningful trading volume.
Market Manipulation 52

CASE STUDY
One of 2023’s most prolific token creators generated
81 different token types
Some of the actors involved also appear to launch multiple tokens that meet our criteria.
During the time period studied, we identified one address — Wallet 1 on the chart below — that appears
to have been involved in the most launches of tokens meeting Criteria A. The operator of this address
launched 81 different token types to generate an estimated $830,000 in profits.
Top 20 wallets by number of tokens launched that met criteria for possible pump and dump
2023
In one instance, this address earned approximately $46,000 on the launch and DEX listing of a token we’ll
refer to as Token A.
We can see a breakdown of how this address operator successfully executed these activities and more
using Chainalysis Storyline. First, on August 5, 2023, the address operator sent wrapped Ether (wETH)
and Token A to a liquidity pool. Next, the address operator appears to have wash traded using ETH and
wETH, shown by the eight subsequent transactions, and removed some liquidity on August 6, likely to
take partial profits.
Market Manipulation 53

After executing these trades, the address operator removed all wETH and Token A liquidity on August 9 by
selling existing positions, and left remaining users with no liquidity to sell their own assets. Since these last
removals, there have been no additional transactions in this liquidity pool, suggesting a rug pull in addition
Market Manipulation 54

to the suspected pump and dump scheme. Taken together, this activity suggests the actor may have
employed different tactics for a relatively complex attack.
The below chart illustrates how the liquidity of the DEX pool shifted during this period, showing several
sharp increases in the wETH balance on August 6. On the far right, we see that the liquidity moved back to
zero once the address operator withdrew all funds on August 9. Overall, 108 other market participants
using this DEX pool appear to have lost funds; they had purchased approximately $55,000 in Token A
during this period.
Amount of wETH in liquidity pool during Token A rise and decline
Aug 5, 2023 - Aug 9, 2023
Source: Transpose
Monitoring market patterns to maintain crypto market
integrity and stability
Market manipulation, such as pump and dump schemes, are destructive to the crypto markets in the same
way they are to traditional markets. However, cryptocurrency’s inherent transparency provides an
opportunity to build safer markets. Market operators and government agencies can deploy monitoring tools
that can help identify and prioritize areas for further investigation in a way that wouldn’t be possible in
traditional markets.
Tools like Transpose can help monitor on-chain data for signs of unusual activity, and help surface
actionable leads in conjunction with various forms of off-chain data.
Market Manipulation 55

CSAM
CSAM 56

On-chain Analysis Suggests CSAM Vendors
May Benefit from Privacy Coins Like Monero
and Other Obfuscation Measures
CSAM (child sexual abuse material) is an understudied part of the crypto crime ecosystem. The industry is
broadly aware that there are digital spaces where CSAM can be bought and sold using crypto, and there
are well-publicized instances of law enforcement shutting down crypto-based CSAM marketplaces like
Welcome to Video.
Not all CSAM activity involves cryptocurrency, and in many cases, users simply trade CSAM amongst
themselves. But cryptocurrency-based sales of CSAM are a growing problem. Tamsin McNally, Hotline
Manager at the Internet Watch Foundation (IWF) shared with us that they “find virtual currency is the
dominant choice for buyers and sellers of commercial child sexual abuse content, so much so that we now
have a dedicated crypto unit that works with law enforcement and the finance industry to help provide
evidence for investigations.” This analysis is our first attempt to produce a comprehensive, objective
measure of the CSAM-cryptocurrency ecosystem.
First, we debut a methodology for measuring the scope of the crypto-based CSAM ecosystem across a
number of different variables, based on on-chain activity. Overall, our data suggests that while the size of
the crypto-based CSAM market has decreased in 2023, the sophistication of CSAM sellers and in turn their
resilience to detection and takedowns has increased over time. In addition, we’ll look at CSAM vendors’ use
of obfuscation measures such as mixers and privacy coins like Monero, and examine how vendors may
benefit from them.
All of the CSAM data we analyze here is based on a subset of over 400 on-chain CSAM vendor wallets
we’ve identified that were active between 2020 and 2023 and met a specific threshold of transaction
activity. We observed over 10,000 wallets that sent funds to CSAM vendor wallets in 2023, which for the
purposes of this analysis we label as CSAM buyers. Identifying CSAM vendors isn’t easy, as most shy
away from advertising even on the darknet due to the stigma associated with this particularly abhorrent
form of crime — virtually all darknet markets, for example, explicitly ban the sale of this material. Our
identifications of CSAM vendor wallets come from a variety of sources, including the IWF, other partners
and customers, and our own investigations.
We are almost certainly not capturing all on-chain CSAM activity, but given the breadth of sources we
draw from, as well as the fact that we have a big enough sample size to measure non-scale based
characteristics like longevity and sophistication, we believe this analysis sheds valuable light on how
on-chain CSAM marketplaces operate and have changed over time.
CSAM 57

How crypto’s CSAM problem has changed over time: A
four-component measurement
We quantify most forms of cryptocurrency-based crime primarily based on the crypto value received by
illicit addresses. However, this would be misleading in the case of CSAM. As a recent research report by the
European Parliament explains, there’s more CSAM on the internet than ever before, and it’s never been
cheaper to produce. Given the flood of inexpensive material, and the fact that each piece of content
inherently involves abuse, we don’t believe that a dollar figure can accurately measure the true damage of
CSAM.
Instead, we’ve come up with a four-component measurement to assess the unique problem of CSAM over
time based on different on-chain metrics. For any given period of time, we can assign a score for each of
the four components, and in that way see how the cryptocurrency-based CSAM market changes across
each component over time. Those four components are listed below.
1. Scale
Scale captures the size of the CSAM market in terms of transactions and participants.
On-chain metrics here include:
●Number of wallets sending to CSAM vendors3
●Number of distinct CSAM vendors active during the time period
●Number of transactions incoming to CSAM vendors
●Total value sent to CSAM vendors
2. Severity
Severity is intended to capture the extremity and volume of the content being shared on a per transaction
basis. While this can’t be directly seen on-chain, we can infer these characteristics based on the price of
individual transactions with CSAM vendors.
On-chain metrics here include:
●Mean payment size
●Median payment size
●Number of CSAM vendors that have received payments of $70 or more in size — these represent
the highest tier of payments that CSAM vendors typically charge in a single transaction for
content. We’ll explain the five-tier payment classification system experts use for CSAM
marketplace analysis in more detail later.
3For the purposes of this analysis, we do not count transactions from services to CSAM vendors, which could also represent
people purchasing this material. We also do not count instances where one individual may be purchasing CSAM from another
who made the initial purchase from a CSAM vendor. For example, if personal wallet 1 transfers to CSAM vendor 1, and then
personal wallet 2 transfers to personal wallet 1, we don’t count that second transaction, which might be redistribution. Again,
we are almost certainly not capturing all on-chain CSAM activity.
CSAM 58
3. Sophistication
Sophistication refers to the level of obfuscation measures taken by CSAM providers during a given time
period. Later in the report, we’ll examine the relationship between sophistication and CSAM vendors’ ability
to stay in operation for longer.
On-chain metrics here include:
●Inflows to CSAM vendors from mixers (which we assume to be customer payments made via
mixers)
●Outflows from CSAM vendors to mixers (which we assume represent efforts by CSAM vendors to
launder funds)
●Outflows from CSAM vendors to instant exchange services that support privacy coins like Monero
(which we assume are possible conversions into privacy coins by CSAM vendor operators for
money laundering purposes)
4. Resilience
Resilience refers to CSAM vendors’ ability to become active and stay in business.
On-chain metrics here include:
●Average cumulative lifespan of active CSAM vendors
●Number of CSAM vendors that became inactive during the time period (this would negatively
impact the resilience score)
●Number of new services that became active during the time period
●The net growth or decline of CSAM vendors, calculated by subtracting the number of services that
became inactive during a given year from the number of new services that emerged in that year
CSAM 59

Let’s look at how the crypto-based CSAM market has changed over the last four years along each of those
four axes.
CSAM activity on-chain by year: A four-component measurement
Overall, we see that the scale and severity of CSAM activity peaked in 2021 after relatively low activity in
2020. The fluctuations in severity become clearer when we incorporate our five-tier payment classification
system. This tiered pricing system has been identified by the IWF as being used by many CSAM vendors,
with higher tiers being more expensive and giving users a greater volume of content, and often more
extreme content, in the context of a single purchase. The tiering system is as follows:
●Tier 1: $10 - $20
●Tier 2: $20 - $35
●Tier 3: $35 - $50
●Tier 4: $50 - $70
●Tier 5: >$70
As we can see on the chart below, purchases in Tiers 4 and 5 have decreased as a share of overall CSAM
transactions over time since 2021, while the share for Tiers 1 and 2 has increased.
CSAM 60

CSAM purchases by severity tier
2020 - 2023
This may indicate that the CSAM being disseminated is becoming less extreme, or that less material is
being provided on a per purchase basis. Of course, it could also mean that the market is being flooded with
content, leading to price drops across the board regardless of the extremity of the content. For instance,
researchers have noted that AI is enabling the dissemination of synthetic CSAM — a glut of such content
could drive prices down.
We also see that the resilience of CSAM vendors has gone up. Look at the following chart, which shows
the lifespan of all CSAM vendors we track by start date and end date.
CSAM 61

Average lifespan for active CSAM vendors by year
2020 - 2023
Lifespans are trending upwards: In 2023, the lifespan of the average active CSAM vendor is 884 days, up
from 560 days in 2022. However, relatively few new CSAM vendors have cropped up in 2023 — just 43,
compared to 112 in 2022. Still, how is it that so many CSAM vendors are able to persist for so long, and
why is resilience going up?
Of course, there are many steps CSAM vendors could be taking to obfuscate their activity that have
nothing to do with cryptocurrency, such as the use of internet anonymity tools like Tor. But when it comes
to crypto specifically, the data suggests CSAM vendors may be benefiting from the use of Monero. Monero
is the most popular of the so-called “privacy coins,” which are cryptocurrencies whose blockchains employ
unique privacy enhancing features that make it more difficult to follow the flow of funds or discern their
original source.
This screenshot shows a CSAM vendor soliciting Monero donations on its darknet website.
Many CSAM vendors have adopted Monero in recent years, though Bitcoin is by far the most widely used
cryptocurrency for CSAM purchasing. In fact, while the screenshot above shows a vendor asking users to
pay in Monero, the data suggests Monero’s role is more prevalent in CSAM vendors’ efforts to launder their
on-chain earnings, rather than to obscure the purchases themselves. It’s difficult to show Monero’s role
directly on-chain using standard blockchain analysis techniques, but we can look at CSAM vendors’ use of
CSAM 62

Monero-friendly instant exchangers to estimate their potential Monero use. Unlike traditional centralized
exchanges (CEXes), which have largely delisted Monero, instant exchangers are non-custodial and
generally don’t offer crypto-to-fiat conversion — but unlike, say, a DeFi protocol, they are centrally
managed by a single organization. Instant exchangers typically draw on the liquidity of multiple CEXes to
give users the best possible prices, and facilitate the exchange of one crypto for another directly between
users’ wallets, such that the transaction is often difficult to trace on-chain. That, along with the fact that
many instant exchangers don’t require KYC, can make them helpful for concealing the original source of
cryptocurrency.
It is also possible that CSAM vendors are swapping into other cryptocurrencies, including privacy coins
other than Monero. But based on vendors’ specific solicitation of Monero and our own investigations, we
believe Monero to be the currency of choice for laundering via instant exchangers.
Our data shows that CSAM vendors’ usage of instant exchangers that allow for Monero conversion has
increased significantly over the last few years.
Monthly value sent to exchanges by CSAM services:
Monero-friendly instant exchangers vs. Traditional CEXes
2020-2023
Traditional CEXes have always been the biggest recipient of funds sent by illicit services, including CSAM
vendors. However, Monero-friendly instant exchangers have narrowed the gap in recent years, suggesting
that CSAM vendor wallets may be increasing their usage of Monero for money laundering purposes, even
though they continue to receive the bulk of customer payments in Bitcoin. Some CSAM vendors have
transitioned almost entirely away from direct sending to CEXes, instead sending funds only to
CSAM 63

Monero-friendly instant exchangers. We can see two examples of CSAM vendors that made that switch in
2022 on the chart below.
Two example CSAM vendor wallets that are potentially using more Monero
If CSAM vendors’ usage of Monero-friendly instant exchangers does indeed correlate with actual usage of
Monero, the data suggests that Monero may be helping those CSAM vendors survive longer. Check out the
following chart, which compares the survival rates over time of a sample of CSAM vendors that send funds
to Monero-friendly instant exchangers versus those that do not.
CSAM 64

Survival of CSAM services by potential Monero Use
CSAM vendors that use Monero-friendly instant exchangers are much more likely to survive initially than
those that don’t — within 50 days of launching, the survival rate of potential Monero using CSAM vendors
is roughly 77.6%, compared to just 57.0% for all others. Furthermore, at the 1,000 day mark, 19.2% of
potential Monero using CSAM vendors are still active, compared to just 3.8% of all others. While the lack of
KYC at many instant exchangers and inability to trace through these centralized services may also play a
role, the data suggests that Monero could be a huge boon to CSAM vendors.
It’s important to note that the use of an instant exchanger does not necessarily provide anonymity for
users. Some instant exchangers do have KYC and other compliance processes, including transaction
monitoring. We also know that many comply with law enforcement requests related to investigations,
including ones involving CSAM.
Overall, 52.0% of CSAM vendor wallets active in 2023 have sent funds to Monero-friendly instant
exchangers. One reason that number isn’t higher could be Monero’s comparative difficulty of use. Many
exchanges don’t support Monero for off-ramping purposes, though users could always swap back from
Monero to a different cryptocurrency that’s easier to convert into cash. Regardless, the data suggests that
the availability of privacy coins like Monero may help CSAM vendors stay in business longer. Law
enforcement may consider investment in specialized blockchain analysis services that can make tracing
Monero and other assets possible, and instant exchangers that do not employ traditional compliance
practices may consider building programs that contribute to a safer ecosystem.
CSAM 65

CASE STUDY
Using blockchain analysis to track down CSAM vendors
and administrators
Now that we’ve examined how the CSAM marketplace has changed over time, and the techniques vendors
may be using to evade detection, the question remains: How can law enforcement catch the people buying
and selling CSAM with cryptocurrency? We’ve got one example courtesy of Homeland Security
Investigations (HSI). Using blockchain analysis tools, HSI Special Agents, Analysts and New York Police
Department (NYPD) detectives were able to identify the administrator of a large-scale darkweb CSAM
service and rescue a child being victimized by one of the service’s customers. The team accomplished this
starting with nothing more than a web address scrawled on a piece of paper, discovered while searching
the apartment of what appeared to be a lone sex offender. We’ll describe how they did it below.
Following the trail from one arrest to an online network
In 2019, an NYPD detective working with HSI New York’s Cyber Division arrested New York City resident
Jason Seto in an undercover operation, in which Seto believed he was meeting up with a 14-year-old boy
for sexual activity. Soon after, the investigators discovered something interesting while executing a search
warrant at the suspect’s apartment: A TOR web address written on a piece of paper next to the suspect’s
computer. The detective visited the darkweb website and immediately discovered a directory of CSAM
forums and websites, one of which allowed users to purchase CSAM and even arrange meetups with
underage victims, all paid for in Bitcoin.
Being well-versed in blockchain analysis, the detective worked alongside HSI New York’s Darkweb and
Cryptocurrency Task Force in pursuing next steps. Investigators sent a small test payment of Bitcoin to the
address provided by the service, and communicated with the site’s administrator. The detective posed as a
user seeking CSAM content, and promised to send a full payment once the administrator confirmed receipt
of the initial transaction. Once the administrator confirmed he’d received the Bitcoin, the detective knew the
address truly belonged to the administrator, and ceased communication. From there, a task force analyst
watched the address’ on-chain activity using Chainalysis Reactor, and waited for the administrator to
move the funds. Sure enough, the administrator eventually sent Bitcoin to a peer to peer (P2P) exchange.
From there, the task force’s investigation led to the identity of the individual.
CSAM 66

Immediately, one can see why it’s crucial for law enforcement professionals in all agencies and divisions —
not just those focused on cybercrime — to understand the basics of cryptocurrency and blockchain
analysis. “Law enforcement has to evolve and keep up with technology in order to identify cyber criminals,”
said HSI New York Supervisory Special Agent (SSA) Anthony V. With cryptocurrency now playing a role in
many forms of crime with a financial component — including sex crimes against minors, as we see in this
case study — law enforcement must know how to identify and analyze cryptocurrency addresses in order
to be as effective as possible.
In this case, the darkweb administrator was identified as residing outside of the United States and
investigators are working diligently to follow up on viable leads.
Blockchain analysis leads to second arrest and rescue of child
The HSI task force wasn’t done yet. Thanks to the unique transparency of blockchains, investigators could
do more than watch where the darkweb administrator sent funds after discovering his Bitcoin address.
They could also observe incoming funds from other customers. This is an important advantage that law
enforcement agents gain when investigating criminal activity being conducted with cryptocurrency rather
than fiat currency. “Understanding the illicit flow of cryptocurrency allows law enforcement to unravel
complex investigations,” explained SSA Anthony V.
While observing the darkweb administrator’s Bitcoin wallet, investigators saw another address sending
Bitcoin in an amount suggesting the purchase of CSAM videos. The agents saw that the new address had
been funded by a centralized cryptocurrency exchange, and began investigating further. The task force
identified the CSAM buyer and discovered that he was also producing his own CSAM, abusing a
12-year-old victim to do so. Courts eventually sentenced this buyer to 55 years in prison.
CSAM 67
How law enforcement agents can use blockchain analysis to fight CSAM
As we discussed above, law enforcement agents can fight CSAM more successfully — as well as other
forms of crime — if they become familiar enough with blockchain analysis to spot crypto addresses and
analyze their on-chain activity for actionable leads.
However, cryptocurrency exchanges have an important role to play as well. With the right transaction
monitoring tools, exchanges can get alerted in real time if their users transact with any addresses
identified as belonging to a CSAM vendor, and proactively report those transactions to the proper
authorities. Exchanges can also help by collaborating with law enforcement when agents request
information.
HSI encourages collaboration between the private sector and law enforcement, especially when it comes
to the exploitation of the most vulnerable in our society — our children. We commend our partners at the
HSI and the NYPD for their work on this case.
CSAM 68
Sanctions
Sanctions 69

In 2023, OFAC’s Crypto-linked Sanctions
More than Double, Tornado Cash Inflows
Slowly Climb
In 2023, the U.S. Office of Foreign Assets Control (OFAC) imposed a total of 18 sanctions on individuals or
entities that included cryptocurrency addresses in their designation. Additionally, Chainalysis has identified
crypto addresses belonging to other entities that OFAC designated in 2023, such as ransomware gang
members associated with Trickbot. Each year, OFAC continues to expand on its crypto-related
designations, including a wider variety of entities under additional sanctions programs.
Overall, crypto inflows to sanctioned entities and jurisdictions comprised 61.5% of all illicit transaction
volume last year as seen in the chart below, representing $14.9 billion in transaction volume. Notably, the
targets of OFAC’s crypto-linked sanctions shifted from the previous year. While OFAC designated major
services like Garantex, Hydra, and mixers Tornado Cash and Blender.io in 2022, its sanctions mostly
targeted groups and individual actors in 2023, with the exception of fraud shop Genesis Market and crypto
mixer Sinbad.io.
Share of all illicit transaction volume associated with sanctioned entities and jurisdictions
2018 - 2023
Sanctions 70

As we see on the chart, sanctions-related transaction volume is making up a larger and larger share of all
illicit transaction volume over the last few years, in part due to the number of entities being sanctioned, but
also due to the difficulty of enforcing sanctions against entities in regions that don’t comply with OFAC’s
designations or against decentralized operations. In addition to the increased number of crypto sanctions,
OFAC has also designated larger services over time. As mentioned, this includes some entities that cannot
concurrently be shut down by law enforcement — like the notorious decentralized mixer Tornado Cash that
was sanctioned in 2022 — and therefore continues to transact after being sanctioned, though at much
smaller volumes. Garantex, a Russia-based crypto exchange sanctioned in 2022, also continues to receive
crypto as it is in a region that doesn’t comply with OFAC’s sanctions. In this section of the crime report,
we’ll provide an overview of sanctions trends, share who was sanctioned and why, examine Tornado
Cash’s post-designation crypto activities, and discuss the origin points of crypto inflows to Iran.
Sanctions activity and trends in 2023
Since 2022, total crypto transaction value associated with sanctioned entities has remained high, as seen
in the chart below. Two services are mostly responsible for this elevated volume: Garantex — sanctioned
on April 5, 2022 for its affiliation with illicit actors including ransomware as a service (RaaS) groups — and
Tornado Cash, sanctioned on August 8, 2022, for its role in laundering crypto stolen by the North
Korean-linked hacking organization Lazarus Group. As for crypto sent to sanctioned jurisdictions, that has
trended downward from the bull market peaks of 2021.
Quarterly value sent to sanctioned entities and jurisdictions
Q1 2022 - Q4 2023
When examining the top five entities sanctioned in 2023 by volume and their crypto inflows in the year
leading up to their designations, we see below that they collectively received $821.4 million in crypto
during that time. Sinbad.io — a Bitcoin mixer which OFAC sanctioned and law enforcement shut down in
November of 2023 — was used by North Korea-affiliated hacking outfit Lazarus Group for crypto
Sanctions 71

laundering, and took the lion’s share of those inflows with $665.4 million in crypto received. As mentioned
earlier, 2023 mostly saw sanctions against smaller targets and individuals, rather than major services.
Crypto inflows one year prior to sanctioning for the top sanctioned entities in 2023
Drug-related sanctions with a crypto nexus in 2023
As the U.S. fentanyl crisis persists, drug-related sanctions appeared to be a priority in 2023. OFAC imposed
nine fentanyl-related sanctions including crypto addresses as identifiers in their designations, across four
different sanctioning events. On April 17, OFAC designated individuals and entities in China and Latin
America for their role in fentanyl manufacturing and trafficking. On September 26, it sanctioned individuals
involved in illegal fentanyl, cocaine, and methamphetamine trafficking into the United States on behalf of
Mexico’s Sinaloa Cartel. And on October 3, it sanctioned China-based individuals and companies involved
in the manufacturing and distribution of fentanyl, other drugs, and associated precursor chemicals. It’s also
worth noting that, in 2023, OFAC updated a designation to add a crypto address for China-based chemical
company Hebei Atun, which was sanctioned in 2021 for its involvement in fentanyl precursor chemical
sales.
North Korea-related sanctions with a crypto nexus in 2023
Last year, across three different sanctioning events, OFAC designated five individuals/entities tied to its
North Korea Sanctions Regulations program that included crypto addresses in their designations. The first
event occurred on April 24, against China-based individuals facilitating crypto money laundering activities
used to fund North Korean weapons of mass destruction and missile programs. The second event, on May
23, was a joint action by OFAC and South Korea’s Ministry of Foreign Affairs (MOFA), against entities and
individuals associated with illicit North Korean revenue generation schemes. The third on November 29
was a sanction against crypto mixer Sinbad.io for its use by Lazarus Group — a North Korea-affiliated
cybercriminal syndicate — to launder millions of dollars in stolen crypto. And while no crypto addresses
Sanctions 72

were included in its designation, on November 30 OFAC and Japan’s Ministry of Foreign Affairs jointly
sanctioned North Korean hacking group Kimsuky for its cyber espionage activity and support of North
Korea’s nuclear weapons program. This came after South Korea’s Ministry of Foreign Affairs sanctioned
Kimsuky in June of that year, where cryptocurrency addresses were included in the designation.
Crypto-linked entities sanctioned in 2023: Who they are and
what they do
Below is a breakdown of individuals and entities with ties to cryptocurrency that were sanctioned by OFAC
in 2023, along with the reason they were sanctioned.
Name
Reason for sanction
North Korea hacking group Kimsuky
Cyber espionage
Crypto mixer Sinbad.io
Crypto money laundering
Russian national Ekaterina Zhdanova
Crypto money laundering
Gaza-based MSB Buy Cash
Terrorism financing
China-based illicit drug producers
Fentanyl manufacturing and distribution
Sinaloa cartel affiliates
Drug trafficking & crypto money laundering
Trickbot affiliates
Ransomware
Roman Semenov, Tornado Cash co-founder
Money laundering
ISIS and Al-Qaeda operatives
Terrorism
North Korea hackers
Hacking and money laundering
Dubai-based financial services firm, its CEO John Desmond
Hanafin, and affiliates
Russian sanctions evasion
Russian national Mikhail Matveev
Ransomware
China-based individuals facilitating DPRK
Crypto money laundering
Chinese chemical businesses and Latin American drug cartel
associates
Fentanyl production and purchase
Fraud shop Genesis Market
Stolen PII
Russia-based cybercrime gang Trickbot
Malware
Igor Vladimirovich Zimenkov and affliates
Russian arms dealing
Sanctions 73

OFAC’s crypto-linked sanctions by program
Since OFAC began including crypto addresses in its designations six years ago, it’s worth examining the
variety of sanctions programs on which it based these actions. Year to year, we can observe compositional
changes in the types of sanctions OFAC has imposed according to these programs. Before we look at
those trends, here are the programs where crypto has been included and any corresponding Executive
Orders (EOs).
OFAC program name
Description
CYBER2
Malicious cyber threat actors, EO 13694 and EO 13757
DPRK2
Activity related to the Democratic People's Republic of Korea (DPRK), EO 13687
DPRK3
Activity related to DPRK, EO 13722
DPRK4
Activity related to DPRK, EO 13810
ELECTION-EO13848
Foreign actors interfering with US elections, EO 13848
IRGC/IFSR
Iranian actors/Iranian Financial Sanctions Regulations
ILLICIT-DRUGS
Foreign persons involved in global illicit drug trade, EO 14059
NPWMD
Weapons of mass destruction proliferators
RUSSIA-EO14024
Specified harmful activities of the Russian government, EO 14024
SDGT
Global terrorism
SDNTK
Foreign narcotics kingpin
UKRAINE-EO13661
Persons contributing to the situation in Ukraine, EO 13661
When looking at the history of OFAC’s crypto-linked sanctions, we see an expansion in the programs it’s
employed since the first designation in 2018, starting with single programs in the first and second years,
and branching out to several more in the years following. This highlights just how many sanctions
programs have a cryptocurrency connection, underscoring the pervasive use of crypto by bad actors, and
the steps the industry has taken to react to that.
Sanctions 74

In the chart below, we see that crypto-linked sanctions tied to OFAC’s illicit drugs program increased
substantially in 2023, with four times as many designations as 2022. Crypto-related sanctions against
North Korea (DPRK2-4) also rose, as did designations against cybercriminals (CYBER2).
OFAC's crypto-linked sanction activity by program
2018 - 2023
Tornado Cash inflows slowly rebound post-sanctioning
In August of 2022, Ethereum mixer Tornado Cash was sanctioned for its role in laundering over $455
million worth of cryptocurrency stolen by Lazarus Group. Despite this action and OFAC’s delisting and
redesignation of Tornado Cash that November, due to the decentralized nature of its operations, Tornado
Cash could not physically be shut down. While on-chain data indicates that, relative to the pre-sanctions
monthly average, the mixer’s monthly inflows dropped by as much as 93% immediately following OFAC’s
designation, Tornado Cash inflows have since risen from that low by 28 percentage points, and the mixer
has received a total of $822.0 million in crypto since the designation.
Sanctions 75

Tornado Cash crypto inflows by month
Jan 2022 - Dec 2023
However, it’s important to note that when looking at the comparable period prior to OFAC’s designation,
Tornado Cash processed over $7.6 billion in crypto, indicating that the sanctioning event has since reduced
crypto sent to the mixer by 89.2%. It’s still worth watching Tornado Cash as its continued activity in the last
year highlights the challenge of enforcing sanctions on decentralized entities, while also demonstrating the
efficacy of sanctions and reinforcing the need for regulation in the DeFi ecosystem.
Sources of crypto inflows to Iranian exchanges in 2023
Iran continues to be a major cryptocurrency adopter, with dozens of exchanges in the country processing
billions of dollars in transactions, which begs the question: How is Iran using crypto? And how is it
potentially using it to evade international sanctions? The following chart shows crypto inflows to Iran by
source between 2020 and 2023.
Sanctions 76

Quarterly crypto inflows to Iran by top three origin points
2020 - 2023
In 2023, 73.3% inflows to Iranian exchanges came from international mainstream exchanges and could
indicate that Iranian services are heavily used to facilitate transfer of value in and out of the country.
With the broad-reaching international sanctions against Iran, crypto could be a mechanism used to evade
detection. This is further evidenced by how-to videos regularly posted on social media platforms that
explicitly detail ways for Iranian entities to skirt sanctions by using crypto. For example, one video
description states, "Because of sanctions on Iran, it is impossible for Iranians to have international
transactions easily. So you might ask how is it possible for people in Iran to buy and sell cryptos in Iran?
I will explain for you in this video.”
Screenshot of a video that claims to instruct Iranians on how to evade sanctions using crypto
Sanctions 77

Interestingly, the second largest counterpart to Iranian crypto exchanges is other Iranian crypto exchanges,
at 17.1% of the total volume. This may indicate Iranians are also using crypto exchanges for either
in-country transactions or to send funds amongst friends and relatives. Given the extreme volatility of the
Iranian Rial, it’s possible that Iranians are seeking other mechanisms to transfer value, which may account
for Iran’s relatively high ranking in the Chainalysis Global Crypto Adoption Index at 28th in the world.
The third largest counterpart to Iranian crypto services is mining pools, with 3.16% of the total volume
across all assets and 29.1% of Bitcoin flows. Iran legalized cryptocurrency mining in 2019 and it’s also the
eighth largest oil producer in the world, with 4% of global oil production. Given the extensive sanctions
against Iran and its access to affordable energy, experts have warned that Iran could use crypto mining as
arevenue generation tool to mitigate the impact of global sanctions.
Considering this data, in the absence of access to traditional financial systems, Iranian exchange users
may be leveraging licit services like the international mainstream exchange ecosystem to transfer and store
value.
Recapping crypto-related sanctions in 2023
Crypto inflows to sanctioned entities and jurisdictions took the largest share of illicit inflows in 2023. This
could be happening partly because entities in heavily sanctioned jurisdictions lack access to traditional
financial systems and are attempting to use crypto to evade sanctions. It could also be because of the
aforementioned challenges associated with enforcing sanctions against entities like Tornado Cash or
Garantex. And though Tornado Cash couldn’t be completely stopped after its designation, it’s evident that
OFAC’s sanctions have substantially diminished the mixer’s inflows. When looking at the increasing
number of crypto-linked sanctions programs, it’s apparent that as crypto adoption by illicit actors
continues to grow, sanctioning bodies like OFAC are continually evolving their methods to identify these
actors and disrupt their activities.
Sanctions 78
Terrorism Financing
Terrorism Financing 79

Assessing Terrorism Financing On-chain is
Crucial and Complex
The use of cryptocurrency by terrorist organizations represents a small share of illicit transactions in the
cryptocurrency ecosystem, but it is an ever-present concern. At the same time, the inherent transparency
and traceability of blockchain technology makes crypto a less favorable vehicle for terrorism financing.
The gravity of any funds contributing to terrorism, regardless of the amount, requires the utmost attention
from the public and private sectors. The challenge of validating terror related activities in both fiat and
cryptocurrency complicates efforts to draw clear estimates on overall volumes. Misinterpretation of crypto
transaction data may result in unnecessary de-risking on the one hand, or non-compliance and increased
risk of facilitating terrorism financing on the other. Furthermore, analyzing the flow of funds in this nuanced
ecosystem without proper context can lead to inaccurate conclusions about the true scale of terrorism
financing.
The situation is further complicated when considering the necessity of humanitarian aid in many
jurisdictions that also present terrorism financing risk, primarily those in ongoing states of war. There's an
ethical dilemma in potentially blocking legitimate humanitarian aid in efforts to curb terror financing.
Blanket labeling of transactions as terrorist activities by private entities who lack the authority to make
such designations can have far-reaching implications. A multifaceted approach incorporating not only
intelligence, but also regulatory and ethical considerations with a commitment to factual accuracy and
thorough verification is essential.
How terrorist organizations have used cryptocurrency
In this analysis of on-chain terrorism financing, we will focus on two primary mechanisms: complex
organizational-level financial facilitation and small crowdfunding campaigns.
First, we look at groups like Hezbollah, known for their complex networks in traditional finance and their
efforts to extend these operations with cryptocurrency. We review on-chain activity associated with
Hezbollah, including their reliance on service providers and engagement with mainstream exchanges.
Then, we examine a second, less sustainable method: crowdfunding, where terrorist organizations have
only achieved limited success.
Exploring the financial networks of complex terrorist organizations
In June 2023, Israel's National Bureau for Counter Terror Financing (NBCTF) announced the first ever
seizure of cryptocurrency linked to Hezbollah and Iran’s Quds Force. This seizure, totaling about $1.7
million, targeted financial facilitator Tawfiq Muhammad Said Al-Law and the crypto wallet network he
utilized to facilitate his activity. Al-Law is a Syria-based hawala operator who was involved in running
Hezbollah's cryptocurrency infrastructure along with sanctioned senior Hezbollah members.
Terrorism Financing 80

The NBCTF seizure provides a unique look at Hezbollah’s cryptocurrency financing infrastructure, which
uses a mix of service providers and mainstream exchanges, not unlike their traditional financial exploits.
For groups like Hezbollah, service providers like money services businesses (MSBs) frequently emerge as
key facilitators, processing financial transactions that exceed the scale of typical individual dealings but fall
well below the activity of most cryptocurrency exchanges. These intermediaries vary widely in their
operations, with some functioning similarly to over-the-counter (OTC) brokers, handling a significant
volume of transactions. Others, like hawalas, operate on a smaller street-level scale.
The involvement of service providers that may facilitate illicit transactions introduces a significant obstacle.
Calculating terrorism financing totals based on the flow of funds through these intermediary service
providers significantly increases the risk of overestimating terrorism-related activities, as these services
generally also process unrelated transactions carried out by everyday users with no illicit intent. A service
that attracts illicit activity due to lax compliance practices would present a significantly different risk profile
from one whose operators are actively facilitating on behalf of terrorist organizations or state sponsors of
terror, like Iran. Although there are no confirmed on-chain instances of the latter case, that is not to say it
cannot happen — it simply means they have not utilized known Iranian services to potentially facilitate this
activity. Therefore, government agencies with access to off-chain intelligence are more likely to detect
these activities, and can leverage blockchain analysis tools to further investigate these financial flows.
Complex organizations like Hezbollah have historically leveraged facilitators like Al-Law, who are not
necessarily on sanctions lists or did not have clear open affiliation with Hezbollah, which makes it difficult
for financial institutions and virtual asset service providers (VASPs) to effectively flag risks in both
traditional finance and cryptocurrency. Their deliberate attempts to evade detection and sanctions mean
that mainstream and regional service providers may inadvertently become exposed to these illicit
networks.
Al-Law used a network of legitimate mainstream exchanges, as well as other service providers, to facilitate
the movement of his funds. Out of 904 total transfers made by the known Al-Law wallet in just under one
year, 145 involved mainstream exchanges.
Terrorism Financing 81

We can see some of this activity on-chain in the Chainalysis Reactor graph below.
Al-Law also employed an extensive network of wallets beyond mainstream exchanges for cryptocurrency
transactions. These wallets collectively received funds ranging from millions to over $1 billion in
cryptocurrency, involving hundreds to tens of thousands of transfers separate from those with Al-Law. This
suggests the potential involvement of service providers. Whether these service providers are aware or not,
their involvement in terrorist financing activities can contribute to a complex web used by terrorist
organizations to deliberately conceal the source, destination, and purpose of the transactions.
Terrorism Financing 82

The Chainalysis Reactor graph below highlights Al-Law’s usage of a complex network of potential service
providers:
Financially astute terrorist organizations may attempt to leverage more intricate networks to evade
detection. This includes the use of OTCs, hawalas, smaller informal exchanges, and even mainstream
services. The transparent nature of public blockchains, combined with blockchain analysis tools, can
provide unparalleled insights into the on-chain activity of major terrorism networks. When terrorists use
cryptocurrency, transactions are traceable across public ledgers, making it possible to follow the flow of
funds with a level of detail not typically available with traditional financial avenues. Investigators can
decipher and map the intricate financial maneuvers of these organizations, identifying tactics of crypto
movement and management.
How small-scale crowdfunding campaigns subsidize terror activity
Public donation campaigns are less sophisticated than the elaborate financial networks of some terrorist
groups. These campaigns are typically run under the guise of charities or crowdfunding, which have
generally proven to be less effective over time. The public nature of these efforts, paired with the
Terrorism Financing 83

transparency and immutability of the blockchain, make social media campaigns for known terrorist
organizations a challenging fundraising method. Last year, Al-Qassam Brigades (AQB), the military wing
of Hamas, announced their decision to stop accepting crypto donations, due to the risk of prosecution for
potential donors.
Despite these obstacles, terrorist organizations continue to turn to social media to solicit donations.
Consider the case of Farrukh Furkatovitch Fayzimatov, a Tajik national and Syria-based fundraiser and
recruiter for Hay’at Tahrir Al-Sham (HTS) — a designated terrorist organization. The Office of Foreign
Assets Control (OFAC) sanctioned Fayzimatov in 2021 for using social media to disperse propaganda and
solicit donations on behalf of HTS, which included a specific bitcoin address in this designation.
Nevertheless, Fayzimatov continues to create new crypto addresses in various currencies since his
designation, amassing over $12,000 from various counterparts. These funds include small contributions
from mainstream exchanges, hosted wallets, and even Russian exchanges without Know Your Customer
(KYC) processes.
We can see some of this activity on the Chainalysis Reactor graph below.
The case of Fayzimatov is more clear-cut due to his official sanctions designation, but distinguishing
between terror financing and legitimate humanitarian efforts is often challenging, particularly in war-torn
regions. To help address this, OFAC issued an advisory clarifying the provision of permissible humanitarian
Terrorism Financing 84

support to Syria in August of 2023. A risk remains, however, that terrorist organizations might exploit the
nuance of general licenses to raise funds under the veil of legitimate charity.
Chainalysis has observed efforts by militant and pro-ISIS social media accounts to raise funds, including
via cryptocurrency. These fundraising campaigns frequently purport to be gathering humanitarian aid,
often focusing on the well-known al-Hol and al-Roj detainment camps. They emphasize the plight of
imprisoned women and children, leveraging narratives of neglect, abuse, and poor conditions in these
camps to gain legitimacy and bolster fundraising. Cases such as these, in which legitimate humanitarian
concerns mesh with extreme ideology and lack of accountability as to the ultimate destination of all funds
raised, present significant analytic and ethical quandaries.
Some of the al-Hol and al-Roj fundraising channels are fairly circumspect regarding their ideology, focusing
entirely on daily life in the camps and humanitarian needs. Below is a machine translation of an example
fundraising post:
A fundraising channel focusing on humanitarian aid
Terrorism Financing 85

However, other donation channels are more explicit regarding their ideology and show higher levels of
operational security, including fundraising campaigns in which prospective donors must contact the
channel administrator directly. The below post from a separate donation channel shows concerning
imagery (left), with text evoking the ISIS flag (right):
This donation channel shows more signs of possible links to extremist ideology
Terrorism Financing 86

As seen in the Chainalysis Reactor graph below, al-Hol and al-Roj camp crypto donation campaigns are
becoming more commonplace, receiving funds from a variety of sources including mainstream exchanges,
Russian language charities, and other private wallets.
Distinguishing between legitimate humanitarian aid and terrorist financing becomes more challenging for
the private sector, especially when considering the analysis to make a decision of whether to block funds
and de-risk, or to allow the transfer, based solely on details from social media donation campaigns. These
social media accounts often have minimal identifying information about the operator or ultimate use of all
funds raised.
The challenge lies in distinguishing legitimate humanitarian aid, such as fundraising for disasters like the
Syria/Turkey earthquakes last year, and fundraising that might inadvertently support terrorism-related
activities. Monitoring these broad donation networks to ensure funds are used appropriately is difficult,
underscoring the risk of mistakenly labeling all such contributions as terrorism related, which could hinder
much-needed humanitarian aid. In response, OFAC issued another compliance advisory in November of
2023 to provide guidance around the provision of aid to the Palestinian people, similar to the one issued for
Syria. This issue has gained urgency as the conflict between Israel and Hamas intensifies, balancing dire
humanitarian needs against the risks of terror financing.
The difficulties of identifying and combating complex terrorism financing networks on-chain are both
intricate and high-stakes. How does one define the line between legitimate financial transactions and
those that are tied to terrorism? Who holds the authority to draw this crucial line, and how do we account
for the nuances that often blur it?
Terrorism Financing 87

Collaboration between the private and public sectors to
combat terrorism financing
Contrary to common belief, cryptocurrency is not a widely used or effective tool for terrorism funding due to
its transparency, traceability, and immutability. Nonetheless, even small amounts of funds sent to terrorists
can have devastating consequences.
Public-private partnerships play a fundamental role in identifying, analyzing, and validating potential
terrorist financing risks. Absent this collaboration, private sector firms struggle to make informed,
risk-based decisions, which could result in either mistakenly blocking legitimate funds or inadvertently
allowing funds to reach the hands of terrorists. Bridging this gap requires cooperation between public and
private sectors, with financial institutions, exchanges, and blockchain analytics companies contributing to
lead generation and insight sharing. Additionally, the public sector's communication around campaigns
with potential terrorist financing risks is critical. Such cooperation ensures that the financial ecosystem
does not inadvertently support terrorism, while also facilitating the flow of legitimate, critical humanitarian
aid to its intended recipients.
These efforts have already resulted in the seizure of funds from groups like Hamas and Hezbollah,
demonstrating that it is possible to deconstruct and disrupt financial infrastructure supporting terrorism.
However, identifying terrorism financing on the blockchain is a complex, high-stakes task that requires a
nuanced approach, clear delineation, and ongoing collaboration between the public and private sectors.
Terrorism Financing 88
Darknet Markets
Darknet Markets 89

Darknet Market Revenues rise as Markets
Develop Role Specialization
As discussed at the outset of our report, darknet markets were one of two categories of crypto crime that
saw revenues rise in 2023. In total, darknet markets and fraud shops received $1.7 billion last year, a
rebound from 2022 — the year that saw the sizable Hydra Marketplace close. The ensuing war for darknet
market dominance that began in 2022 continued into 2023, but no other market has since matched
Hydra’s financial success. We’ll discuss theories as to why, and other darknet market trends here.
Darknet market and fraud shop revenue
2021-2023
The chart above shows that, while values haven’t risen back to 2021 levels, darknet market revenue has
slightly rebounded since Hydra’s closure in 2022.
The continuing battle for darknet market dominance
In terms of individual market success, Mega Darknet Market led the pack with over half a billion in crypto
inflows, and Kraken Market (not to be confused with the popular cryptocurrency exchange Kraken) in
particular gained prominence among Russian darknet markets, as shown on the following chart.
Blacksprut and OMG!OMG!, markets that jockeyed for position in the wake of Hydra’s closure, are still top
players in the darknet market ecosystem.
Darknet Markets 90

Top ten darknet markets and fraud shops in 2023
Blue = Darknet market Orange = Payment processor Yellow = Fraud shop
In recent years, some darknet markets and fraud shops have been integrating crypto payment processors
on their websites via APIs, possibly as a way to improve operational efficiency and increase security.
Essentially, these payment processors provide a white label service for darknet markets and fraud shops,
and a seamless checkout experience for those services’ customers. UAPS, shown in the chart above, is one
such example of a payment processor that many fraud shops, including the OFAC-designated Genesis
Market, used in 2023. The value received by UAPS in this chart includes payments sent to multiple fraud
shops using the service as a payment processor.
Another newer trend: Darknet markets that employed brazen marketing tactics in 2022 appeared to gain a
competitive edge in 2023. Take Kraken Market for instance, which opened in 2022 and bills itself as
Hydra’s successor. As a way to tease its impending launch, in the fall of 2022, Kraken Market employed an
immersive 3D billboard in Moscow containing an animated kraken.
Darknet Markets 91

Kraken Market’s immersive 3D billboard in Moscow. Source: Lenta.ru
And, perhaps the most aggressive marketing stunt the darknet market ecosystem has seen yet, in
December of that year, Kraken Market wrapped a bus in an advertisement that included a QR code for the
market’s website. The bus blocked two traffic lanes on a road near Russia’s Ministry of Foreign Affairs
before security forces removed it an hour later.
On a smaller scale, Mega Darknet Market placed a few ads with QR codes in public places like Moscow
subway trains. While tactics like these may have helped boost revenue for both markets, again, they have
yet to match Hydra’s sizable financial success.
Darknet market services show fragmentation in 2023
Throughout the history of the darknet market ecosystem, at different turns one marketplace has typically
played the dominant role. The last several years’ examples include Silk Road, AlphaBay, Wall Street
Market, and Hydra, most recently. Historically, as law enforcement closed each dominant marketplace, a
new leader emerged. We can see this pattern on the following chart, which shows the level of market
share controlled by the dominant market of each epoch. The recovery pattern is fairly consistent until the
Hydra Marketplace closure, after which no dominant darknet market emerged.
Darknet Markets 92

Top market share surrounding major darknet market closures
2013 − 2023
Darknet market role specialization provides one possible explanation as to why the ecosystem has yet to
see a dominant player.
Darknet markets differentiate themselves by unique service offering
Historically, darknet markets have been heavily associated with illicit drug trade, a reputation that Silk
Road played a significant role in creating. However, over the years some markets have evolved beyond this
capacity to develop a robust catalog of illicit services like money laundering, fiat offramping, and products
that enable cybercriminal activities like ransomware and malware attacks. One such sophisticated darknet
market, Hydra, offered all that and more.
By contrast, it appears today’s darknet markets largely serve specific niches and have individually
organized themselves into unique criminal functions, which we determined when examining the origin
points for darknet market inflows last year. As such, the chart below illustrates darknet market share by
crime type based on the following categories:
Darknet Markets 93

●Cybercriminal enablement. Darknet market services related to ransomware, malware, stolen
funds, and other types of cybercrime. Enablement could include root kits, access to personally
identifiable information (PII), and potentially, offramping for stolen funds.
●Drug sourcing and supply. Online pharmacies or darknet markets that sell drugs to vendors on
other darknet markets.
●Other illicit laundering/buying. Transfers made to darknet markets for the purpose of obfuscating
on-chain activity or purchasing illegal products.
●Rest of world drug exchange. Drug purchases made on darknet markets serving a global
customer base, as opposed to primarily a Western or Russian customer base.
●Russian-serving drug exchange. Drug purchases made on darknet markets by customers based
in Russia.
●Western-facing drug exchange. Drug purchases made on darknet markets by customers
generally based in the United States and Western Europe.
Dominant darknet markets by criminal function in 2023
The categorization in the chart above is based on origin points. Cybercrime enablement represents flows
from ransomware, stolen funds, malware, or fraud shops to darknet markets.
Darknet Markets 94
Drug-related revenue comes from sources like exchanges. Western drug flows in particular come from
US-domiciled exchanges and trace flows from those to darknet markets. The entity “DNM Aggregator” that
appears within each category refers to a service we’ve identified as being in control of multiple, disparate
darknet markets.
When it comes to cybercriminal enablement, markets like Kraken Market, the DNM Aggregator, and
Exploit.in are go-to services, providing bad actors with tools to carry out ransomware attacks, hacks, and
more. Kraken Market also captured the largest share of transfers potentially sent for the purpose of
obfuscating funds, as well as buying illegal products. In addition to that activity, markets like these host
vendors that advertise their own cashout or swapping services, resulting in tens of millions of dollars in
laundered funds.
Mega Darknet Market is the dominant drug supply source for drug vendors on other darknet sites, holding
a 63.4% share of that market. When looking at darknet drug markets serving Russia-based customers,
Kraken Market captured 30.9% of market share, with Blacksprut and Mega Darknet markets closely
following. As for drug markets serving Western customers, ASAP Market held a 25.0% share, followed by
Mega and Incognito.
Darknet market revenue based on drug-purchasing behaviors
When looking at 2023 drug-purchasing habits for customers from exchanges primarily serving users in
North America and Western Europe, the data indicate that just two markets played dominant roles across
drug purchase types, while most captured smaller, fragmented shares of total revenue received.
Here are category definitions for the chart below. Keep in mind that these categories are based solely on
purchase sizes, which we use to make assumptions about their likely purpose.
●Small retail. Purchases of less than $100, likely made for personal consumption.
●Large retail. Purchases between $100 and $500, likely made for personal consumption.
●Social supply. Purchases between $500 and $1,000, which indicate customers may be sharing
drugs with other third parties in social settings.
●Potential wholesale. Purchases over $1,000, more likely to be made by drug sellers and
distributors.
Darknet Markets 95

Crypto inflows from Western−domiciled exchanges to darknet markets
2023
The chart above shows that ASAP and Mega Darknet markets led the large retail and wholesale segments
respectively. Looking closer at ASAP Market inflows, it won some share of revenue across all drug
purchase types, receiving 37.1% of social supply, 35.7% of large retail, 16.5% of small retail, and 13.5% of
wholesale purchases.
Though Mega Darknet Market typically serves a Russian customer base, the drug revenue shown in the
chart above likely came from customers based in Europe. Mega clearly dominated the realm of wholesale
drug purchases, capturing 51.9% of that segment.
Fentanyl sales in darknet markets
Despite most darknet markets banning the sale of fentanyl in their terms of service, nearly all mainstream
Western-facing markets have vendors that sell fentanyl-laced products. While it received a relatively small
Darknet Markets 96

share of large retail purchases as shown in the previous chart, Abacus Market is one such example.
Though many customers are concentrated in Australia, Abacus has vendors and customers around the
world, including the United States.
Customer reviews found on the Abacus site indicate that some of its American vendors sell drug products
laced with fentanyl. Additionally, vendors found on Abacus and many top Western-facing markets sell
an analog of fentanyl called a-Methylfentanyl — colloquially known as "China White.” According
to the Universal Journal of Clinical Medicine, drug researchers believe that this analog is the product of
contamination during important parts of the fentanyl synthesis process, and is sold for its powerful
effects, which can be up to 300 times more potent than morphine. It has appeared in overdose deaths
in recent years.
U.S.-based drug vendors on Abacus Market advertising a synthetic opioid called China White, which its customers can
purchase using Bitcoin or Monero.
Another darknet market known for facilitating fentanyl sales to the United States was Canada-based
AlphaBay. A once-sizable illicit enterprise that began in 2014, AlphaBay was closed by authorities in 2017
and then reopened in 2021. The last version of the market operated until February of 2023, and a month
after that closure, a former AlphaBay vendor pled guilty to distributing fentanyl that caused fatal
overdoses in Oregon.
Fentanyl and fentanyl-laced drugs also arrive in the United States through Latin America based cartels.
U.S. customers predominantly purchase drugs from these groups that are known to have used crypto to
Darknet Markets 97

source fentanyl precursor chemicals from labs based in China. The cartels then use those chemicals to
manufacture fentanyl that is later sold in the U.S.
Crime forums and markets specializing in cybercrime enablement
Much like with drug sales, a similar pattern of task differentiation emerged among darknet markets
providing cybercriminal services. In the chart below, we see that the DNM Aggregator emerged as the clear
leader among fraud shops enabling cybercrime, and Exploit.in and Kraken Market almost equally sold tools
used to facilitate ransomware attacks. Kraken Market also received the largest share of stolen funds. As for
cybercriminal administration, the category includes inflows from ransomware affiliate wallets. This
includes purchases such as malicious software and supporting services which cybercriminals sometimes
make using escrow services on crime forums.
Market dominance in the cybercrime enablement space
2023
Darknet Markets 98

Dutch National Police share depth and sophistication of
Genesis Market identity theft operation
Fraud shops are vendors that typically operate on the dark web and facilitate the sale of stolen data and
personally identifiable information (PII), which cybercriminals abuse in illicit activities like scamming,
identity theft, and ransomware. One fraud shop that provided services like these, Genesis Market, saw its
end last April after a coordinated, international law enforcement effort called Operation Cookie Monster
closed it down, and OFAC sanctioned it.
Though it’s common for fraud shops to operate on the dark web, Genesis Market was accessible on the
clearnet via Google search, and simply required an invitation code to create an account. This ease of
access attracted a new breed of criminals not typically associated with cybercrime. To them and others,
Genesis sold forms of stolen PII like credentials for email and social media accounts, as well bank accounts
and crypto service accounts, and in its lifetime received tens of millions of dollars in crypto, mostly Bitcoin.
For a fraud shop, Genesis Market demonstrated an unusual level of sophistication by offering
Impersonation-as-a-Service (IMPaaS), meaning robust “online fingerprints” of victims rather than just their
credentials for individual services; Genesis’ IMPaaS packages included access to victims’ browser cookies,
which allowed cybercriminals to circumvent two-factor authentication (2FA) and wreak havoc with victims’
accounts.
We spoke with Ruben van Well, Chief Inspector of Team Cybercrime Rotterdam from the Dutch National
Police, to learn about their involvement in the Genesis Market case, and how the Genesis operation worked.
How Genesis Market stole the identity of over 2 million victims worldwide
In 2019, the FBI started its investigation into Genesis Market and enlisted other government agencies and
law enforcement organizations across the world, working towards the market’s closure on April 4, 2023.
As part of the investigation, the Dutch National Police took the lead on cybercrime prevention, and Van
Well shared his insight on the sophistication of the fraud shop’s operation.
In order to gain control of victims’ computers, the malware Genesis Market employed used a legacy Bitcoin
address to determine the command-and-control (C2) server, from which cybercriminals initiated remote
access to infected devices.
Darknet Markets 99

The legacy Bitcoin address pivotal to the malware side of the Genesis operation
The information-stealing malware package that Genesis Market used to exploit victims included a hidden
Chromium-based browser plugin, made to look like a Google Drive plug-in, which captured credentials
stored in victims’ browsers.
Hidden browser which captured credentials stored in victims’ browsers
As it retrieved data from malware-infected computers, Genesis sold victims’ online footprints — which it
called “bots” — on its market. Each bot represented a compromised computer or device and the credentials
associated with its owner. While it operated, Genesis Market sold 1.6 million bots. On the fraud shop’s
website, cybercriminals could comb through hundreds of thousands of bots on its robust user interface (UI),
filtering results by criteria like country or searching for credentials tied to a particular domain name. The UI
showed how many logins and what accounts each bot contained; the more logins provided, the more
expensive the bot, especially when it included bank or crypto account credentials. The UI also showed
when the victim’s device was infected by the malware and when it was last updated, and Genesis
provided customers with a wiki on how to abuse victims’ credentials.
Darknet Markets 100

A page on the former Genesis Market showing bots (i.e., victims’ profiles) for sale. Source: ZDNet
One of its most insidious innovations — the Genesium browser — was a browser plugin that Genesis built
for its customers to use. Any time the information-stealing malware detected changes to a victim’s
passwords or a new account, it would update the Genesium browser with the latest credentials. In addition
to stealing logins, the malware scraped browser cookies, granting cybercriminals control over session
cookies which helped them mimic victims’ computers. Since many website cookies persist for 30 days,
criminals were often able to evade 2FA processes.
“This made Genesis Market extremely dangerous because they had their hands on a lot of credentials but
they could also impersonate the victim online,” says Van Well. “We saw bank accounts and crypto wallets
being cleared, as well as identity being misused to open new accounts. We saw goods being bought from
online shops, and a variety of cybercrime, which was all related to Genesis Market.”
In one particularly devastating case, a man lost his entire $80,000 pension. Using his credentials,
cybercriminals committed a variety of online fraud activity over the course of six months. Given the
tooling’s ability to capture new password updates, the perpetrators could easily maintain control over his
accounts, and they opened bank accounts in his name and had his physical mail sent to an address where
they could receive it.
How the Dutch National Police helped Genesis Market victims
In addition to investigating individual incidents of crime against Dutch citizens, the Dutch National Police
worked with public and private sector partners to investigate the infection chain — the path of distribution
and installation — for the information-stealing malware that enabled Genesis Market to steal victims’
Darknet Markets 101

identities. The results of that investigation were published in a report called Technical analysis of the
Genesis Market. Van Well explained that his organization doesn’t typically share so much detailed
technical information around investigations, but it felt imperative to provide these details to law
enforcement and tech companies around the world to help them fight future cybercrimes. Though Genesis
Market domains and servers were seized and antivirus programs have been updated, cybercriminals have
already rebuilt illicit services like these.
To help Genesis Market victims and prevent future crimes, the Dutch Police created a Check your hack tool
that lets victims see if their credentials were sold or for sale on Genesis Market. The tool is still available
today, and interested parties simply need to enter their email address to place an inquiry. If the address is
in one of the cybercrime datasets, the person will receive an email that includes personalized instructions
on how to clean up their computer and make it safe again. In the first 24 hours of launching Check your
hack, two million people took advantage of the service. So far, five million people have used the tool, and
over 13,000 victims have been notified that their computer was infected, and received instructions to help
them make their device safe again.
As far as financial recourse for victims, some banks and insurance companies have provided payouts and
will include those funds as damages in lawsuits against Genesis Market cybercriminals. As for Genesis
Market cybercriminals located in the Netherlands, three have already been convicted and received prison
sentences considered severe for that jurisdiction. The first received 24 months and the second, four years.
The third convicted cybercriminal — the biggest Dutch user and the number 10 user worldwide — received
a four-year sentence.
Fraud shops use payment processor to boost efficiency
In 2023, Chainalysis discovered that some popular fraud shops rely on payment processors as a way to
reduce their own costs, add efficiency to their operations, and perhaps add a layer of security to
transactions. Genesis Market extensively used a payment processor called UAPS, so much that the
processor’s average inflows fell by 25.7% after Genesis closed last April. Regardless, UAPS remains a key
provider of payment infrastructure to top fraud shops.
Darknet market revenues rose slightly, but have yet to regain
Hydra Marketplace highs
While the darknet market ecosystem showed signs of recovery in 2023, it has yet to return to the revenues
it experienced before the Hydra Marketplace closure in 2022, given the financial success of that operation.
It’s noteworthy that, despite some unusual marketing efforts, no other darknet market has since assumed
Hydra’s mantle of being the one-stop-shop for illicit products and services. Though the sanctioning and
closure of fraud shop Genesis Market occurred last year, there were no other sanction events for the
darknet market ecosystem, or major market takedowns. We’ll continue monitoring darknet market trends in
2024, and are curious to see what new tactics markets and fraud shops may employ to find more
customers.
Darknet Markets 102

Scams
Scams 103

Scam Revenue Down But Approval Phishing
and Romance Scams Stand Out as Threats
Yearly crypto scam revenue
2019 - 2023
Based on Chainalysis data and designations, scams were once again one of the biggest drivers of
cryptocurrency-based crime, with associated wallets bringing in at least $4.6 billion in revenue in 2023.
While that represents a year-over-year decline compared to 2022, readers should keep in mind that this is
a lower-bound estimate based on value sent to addresses currently identified as scams. Chainalysis will
almost certainly catch more such addresses in the future, and add their historical activity to our analysis,
which will increase the numbers you see here. For example, when we published our report last year, we
identified $5.9 billion in scamming revenue for 2022. That estimate has now increased to $6.5 billion.
As scammers in this category become more sophisticated and varied in their tactics, it also becomes more
and more difficult to identify addresses associated with crypto scams. The bad actors behind romance
scams (also frequently known as "pig butchering" scams), for instance, often communicate addresses to
victims in one-to-one communication channels like text, and unless victims report their losses to the
authorities — far from a guarantee — it can be difficult for blockchain analysts to identify those addresses
as scam-related, especially as compared to the enormous crypto ponzi schemes we’ve seen in years past,
which go out of their way to advertise themselves to the masses. These complications likely cause more
undercounting of scam activity, especially in the past two years as romance scams have become
more prevalent.
Scams 104

As we’ll also explore, approval phishing scams, which have become more prominent in 2023, function
differently on-chain from most other scam types we examine, in ways that can make them difficult to
measure at scale. For that reason, most of our approval phishing scam research will focus on specific
approval phishing scammers whose on-chain operations we have thoroughly identified and therefore may
not capture all on-chain approval phishing activity.
Nevertheless, the scamming activity we’ve identified as of today cuts across all categories and enables us
to identify key trends in crypto scamming broadly. It’s also worth noting that many people are likely being
scammed by bad actors who claim to be promoting a cryptocurrency investment opportunity, but receive
funds from victims in fiat — those numbers wouldn’t be reflected in our data at all.
Comparing scams by category
Chainalysis labels on-chain entities as scams based on methodologies and research findings which point
to the presence of certain patterns and criteria. As a unifying theme, we consider all scam activity to
involve a target failing to receive what they understood they were being promised by the perpetrator, or
otherwise being misled by the perpetrator as to an expected outcome.
Despite the aggregate decline in total value sent to scams, revenues for different categories of crypto
scams don’t rise and fall together. Some categories of scams have risen significantly in revenue taken
from victims.
Index: Revenue growth by scam sub-class
2020 - 2023 | Index: 2020 = 100
Romance scams in particular grew significantly in 2023, more than doubling revenue year-over-year. In
fact, our data suggests that romance scam activity has grown by 85x since 2020. This is especially
Scams 105

concerning when we factor in that romance scams have the worst impact on victims of all scam types,
based on average payment size.
Average payment size by scam sub-class
2023
Keep in mind too that many victims likely make multiple payments to an individual scam address, so the
actual losses per victim can be much higher than these averages.
It’s also worth noting that some scams could theoretically fit into multiple categories. Many romance
scams, for instance, have an online footprint that’s virtually indistinguishable from the typical investment
scam, with websites and social media posts promising improbably high returns. We primarily categorize
these scams as romance scams based on information from victims, customers or partners, and other
sources indicating that the scammers are utilizing the tactics typical of a romance scam, meaning that
they’re contacting individuals and attempting to build relationships in order to con them. As such, readers
should keep in mind that some scams we categorize as generic investment scams are likely also engaging
in romance scam tactics.
Targeted approval phishing scams see explosive growth
over last two years, with at least $374 million suspected
stolen in 2023
Approval phishing is a scamming tactic that has existed for many years. But whereas approval phishing
scammers have historically targeted wide swaths of crypto users through the proliferation of fake crypto
apps, romance scammers (also known as pig butchering scammers) appear to have adopted this
technique to great effect in recent years.
Scams 106

Approval phishing differs from other crypto scams in a small but important way. Typically, scammers trick
victims into sending them cryptocurrency, usually through a phony investment opportunity or by
impersonating somebody else. But in an approval phishing scam, the scammer tricks the user into signing
a malicious blockchain transaction that gives the scammer’s address approval to spend specific tokens
inside the victim’s wallet, allowing the scammer to then drain the victim’s address of those tokens at will.
Some victims have lost tens of millions to these scams.
It’s important to note that in general, approval phishers send the victim’s funds to a separate wallet from
the one granted approval to make transactions on the victim’s behalf. The on-chain pattern typically
proceeds as follows:
●Victim address signs transaction approving second address to spend its funds
●Second address, which we’ll refer to as approved spender address, executes transaction to move
funds to a new destination address
In general, if transactions unfold in this manner, and the approved spender address is the initiator of the
draining transaction, rather than the victim address as we’d expect in a non-malicious transaction, it’s likely
an instance of approval phishing. However, further investigation would be necessary to know for sure.
Anatomy of an approval phishing scam
Many decentralized apps (dApps) on smart contract-enabled blockchains, like Ethereum, require users to
sign approval transactions giving the dApps’ smart contracts permission to move funds held by the user’s
address. Approvals granted to secure dApps are generally safe because properly designed smart contracts
can only use that approval when directed to do so by the user, or when such approval is required in the
normal functioning of the dApp. In those cases, we would generally expect the dApp user’s address to be
the one initiating the transaction to spend the funds. But, approval phishers can take advantage of the fact
that many crypto users are used to signing approval transactions — the trick is in what permissions are
given, and the trustworthiness of the party receiving that permission. For instance, one approval phishing
scam saw bad actors promote a bogus story of a Uniswap approval phishing scam, and set up a fake
Etherscan page where users could check their transaction approvals by connecting their wallets and
Scams 107

signing an approval transaction to see if they’d fallen victim — that last transaction was the core of the
actual approval phishing scam.
However, research suggests that approval phishers are now more and more targeting specific victims,
building relationships with them and using tactics associated with romance scams to convince victims to
sign approval transactions. Metamask lead product manager Taylor Monahan (aka @tayvano_) has
tracked romance scam-style approval phishing on a custom Dune Analytics dashboard.
We identified a set of 1,013 addresses involved in what appears to be targeted approval phishing by
starting with a smaller list of approval phishing addresses whose owners are known to be using romance
scam tactics. We then identified other addresses connected to those in the initial list that had executed
similar transactions, effectively allowing us to build out a more complete network of interconnected
approval phishers’ on-chain activity. We estimate that victims of the addresses we started with, plus those
we identified based on their distinct pattern of activity, have lost approximately $1.0 billion to approval
phishing scams since the start of our dataset in May 2021. While it’s important to note that this $1.0 billion
total is an estimate based on on-chain patterns, and that some of it could represent laundering of funds
already controlled by the scammers, this figure is likely just the tip of a much larger iceberg. Romance
scams are notoriously underreported, and our analysis began from a limited set of reported instances.
Value stolen through suspected approval phishing scams
May 2021 - Nov 2023
The suspected approval phishing scammers we’re tracking saw their revenue peak in May 2022. Overall,
2022 saw victims lose an estimated $516.8 million to approval phishing, versus just $374.6 million in 2023
through November. Like many forms of cryptocurrency-based crime, the vast majority of approval phishing
theft is driven by a few highly successful actors. We can see this on the distribution graph below, which
Scams 108

shows the approval phishing revenue of our 1,013 addresses during the time period studied, and the
cumulative share of all value stolen through approval phishing by the addresses in our sample in
descending order.
Distribution of suspected approval phishing address revenue
May 2022 - Nov 2023
The most successful approval phishing address likely stole $44.3 million from thousands of victim
addresses, representing 4.4% of the total estimated stolen during the time period studied. The ten largest
approval phishing addresses combined account for 15.9% of all value stolen during the time period studied,
while the 73 biggest account for half of all value stolen.
We believe that the industry can address the approval phishing scam problem in a variety of ways, from
user education to employing pattern recognition tactics similar to those we used to compile this data.
Generally speaking, the relevant addresses and wallets in approval phishing scams are:
●Approved spender wallets victims are tricked into designating as approved to spend funds in
their wallet
●Destination addresses to which victim funds are drained
●Consolidation addresses where funds drained from many victims are gathered
Funds are typically moved from consolidation addresses to cash out points — primarily centralized
exchanges — as we see on the graph below.
Scams 109

Recognizing the patterns of approval phishing
Based on the patterns identified above, exchange compliance teams could monitor the blockchain for
suspected approval phishing consolidation wallets with heavy exposure to destination addresses. They
could then see in real time when those wallets move funds to their platform, and then could take steps
such as automatically freezing the funds or reporting to law enforcement. More broadly, the industry can
work to educate users not to sign approval transactions unless they’re absolutely sure they trust the person
or company on the other side, or understand the level of access they’re granting.
Inside the KK Park: Myanmar’s most notorious pig
butchering compound
We spoke with Eric Heintz, Global Analyst at the Global Fusion Center of the International Justice Mission.
There, Heintz and his team assist IJM’s field offices in their work to help human trafficking victims of pig
butchering gangs. As part of this effort, they also track the gangs themselves, monitoring their recruiting
activity on social media, mapping out their compounds through satellite imagery, and communicating
with victims.
“The conditions these people face are horrible,” he told us. “They’re forced to work 12 or more hours per
day, and if they don’t meet quotas on contacting potential scam victims, the gangs beat them, torture
them, and even withhold food.”
Heintz also told us a bit more about the compounds themselves. Typically, one company owns the land and
the buildings, and then rents them out to other companies who carry out the actual romance scams.
According to Heintz, the owners of the compounds often also provide “security” for their tenants, meaning
guards who will prevent human trafficking victims from escaping.
Scams 110

How do the companies within these compounds use cryptocurrency? Of course, we know that they take
crypto payments from scam victims. But Heintz also told us that pig butchering gangs will often tell the
families of trafficked workers to pay them ransoms in exchange for their family member’s freedom — those
payments also often happen in cryptocurrency. Heintz sent us ransom payment addresses provided to him
by trafficking victims and their families, associated with a pig butchering gang at KK Park, one of the most
notable compounds in Southeast Asia. “Some scam operations may be mixing proceeds from scams with
ransom payments from victim families,” said Heintz. Indeed, the addresses he provided show on-chain
connections to addresses associated with romance scams, in addition to activity likely related to ransom
payments.
Satellite image of KK Park ©2023 Maxar Technologies
First, some context on KK Park before we dive into on-chain analysis. KK Park is one of the biggest, most
notorious romance scam compounds in operation today. Located in the aforementioned Myanmarese town
of Myawaddy, KK Park is reported to hold over 2,000 trafficked romance scam workers. The two ransom
addresses provided to us by Heintz are, according to him, associated with a Chinese romance front
company for a pig butchering gang that operates out of KK Park. The following Chainalysis Reactor graph
shows some of the addresses’ on-chain activity.
Scams 111

From just the two ransom addresses provided to us by Heintz, we’re able to gain insight into millions of
dollars’ worth of activity associated with this prolific pig butchering gang. First, we see that while the
addresses were provided to victims’ families as a means of ransom payment, both have also received
significant funds from a number of known scam addresses. Ransom address 1, for instance, has received
roughly $24.2 million in crypto from the four scam-associated wallets to its left. Both ransom addresses
send and receive significant amounts to and from mainstream exchanges — some of those incoming
transactions are likely ransoms.
Our on-chain analysis shows how tightly interwoven pig butchering gangs’ ransom-taking operations are
with their primary business of conducting romance scams. The brutal conditions trafficking victims face on
the compounds also lend additional urgency to solving the problem of romance scamming — not only are
consumers being bilked out of hundreds of millions of dollars each year, but the gangs behind those scams
are also perpetuating a humanitarian crisis. The good news is the cryptocurrency ecosystem is taking
action: In November, the stablecoin issuer Tether and the cryptocurrency exchange OKX announced that
they collaborated with the United States Department of Justice in an investigation that led to Tether
freezing approximately $225 million in USDT tokens linked to an international human trafficking syndicate
in Southeast Asia responsible for romance scams, helped in part by Chainalysis solutions. Additionally, a
South Korea-led Interpol operation in late 2023 saw authorities arrest 3,500 cybercriminals associated
with online scamming and seize $300 million in funds, $100 million of which was made up of digital assets.
We encourage all cryptocurrency businesses to search for any possible exposure they may have to this
activity, and report as much information as they can to law enforcement.
Scams 112

Building trust
in blockchains
About Chainalysis
Chainalysis is the blockchain data platform. We provide data, software, services, and research to
government agencies, exchanges, financial institutions, and insurance and cybersecurity companies in over
70 countries. Our data powers investigation, compliance, and market intelligence software that has been
used to solve some of the world’s most high-profile criminal cases and grow consumer access to
cryptocurrency safely. Backed by Accel, Addition, Benchmark, Coatue, GIC, Paradigm, Ribbit, and other
leading firms in venture capital, Chainalysis builds trust in blockchains to promote more financial freedom
with less risk. For more information, visit www.chainalysis.com.
FOR MORE INSIGHTS FOLLOW US ON X
chainalysis.com/blog @chainalysis
GET IN TOUCH FOLLOW US ON LINKEDIN
info@chainalysis.com linkedin.com/company/chainalysis
This material is for informational purposes only, and is not intended to provide legal, tax, financial, or investment advice.
Recipients should consult their own advisors before making these types of decisions. Chainalysis has no responsibility or
liability for any decision made or any other acts or omissions in connection with Recipient’s use of this material.
Chainalysis does not guarantee or warrant the accuracy, completeness, timeliness, suitability or validity of the information
in this report and will not be responsible for any claim attributable to errors, omissions, or other inaccuracies of any part
of such material.