The Double-Layer Clustering Based on K-Line Pattern Recognition Based on Similarity Matching PDF Free Download
1 / 17/17
100%

Citation: Li, X.; Liu, Q.; Hu, Y.; Liu, H.
The Double-Layer Clustering Based
on K-Line Pattern Recognition Based
on Similarity Matching. Information
2024,15, 821. https://doi.org/
10.3390/info15120821
Academic Editor: Francesco
Fontanella
Received: 22 October 2024
Revised: 20 November 2024
Accepted: 2 December 2024
Published: 23 December 2024
Copyright: © 2024 by the authors.
Licensee MDPI, Basel, Switzerland.
This article is an open access article
distributed under the terms and
conditions of the Creative Commons
Attribution (CC BY) license (https://
creativecommons.org/licenses/by/
4.0/).
Article
The Double-Layer Clustering Based on K-Line Pattern
Recognition Based on Similarity Matching
Xinglong Li 1, Qingyang Liu 2,*, Yanrong Hu 1,* and Hongjiu Liu 1,*
1College of Mathematics and Computer Science, Zhejiang A & F University, Hangzhou 311300, China;
2022611011032@stu.zafu.edu.cn
2Institute of Informatics, Georg-August-Universität Göttingen, 37073 Göttingen, Germany
*Correspondence: qingyang.liu@stud.uni-goettingen.de (Q.L.); yanrong_hu@zafu.edu.cn (Y.H.);
joe_hunter@zafu.edu.cn (H.L.)
Abstract: Candlestick charts provide a visual representation of price trends and market sentiment,
enabling investors to identify key trends, support, and resistance levels, thus improving the success
rate of stock trading. The research presented in this paper aims to overcome the limitations of
traditional candlestick pattern analysis, which is constrained by fixed pattern definitions, quantity
limitations, and subjectivity in pattern recognition, thus improving its effectiveness in dynamic
market environments. To address this, a two-layer clustering method based on a candlestick sequence
simlarity matching model is proposed for identifying valid candlestick patterns and constructing
a pattern library. First, the candlestick sequence similarity matching model is used to address the
pattern matching issue; then, a two-layer clustering method based on the K-means algorithm is
designed to identify valid candlestick patterns. Finally, a valid candlestick pattern library is built,
and the predictive ability and profitability of some patterns in the library are evaluated. In this study,
ten stocks from different industries and of various sizes listed on the Shanghai Stock Exchange were
selected, using nearly 1000 days of their data as the test set. The predictive ability of some patterns
in the library was evaluated using out-of-sample data from the same period. This selection method
ensures the diversity of the dataset. The experimental results show that the proposed method can
effectively distinguish between bullish and bearish patterns, breaking through the limitations of
traditional candlestick pattern classification methods that rely on predefined patterns. By clearly
distinguishing these two patterns, it provides clear buy and sell signals for investors, significantly
improving the reliability and profitability of trading strategies.
Keywords: double-layer clustering; similarity matching; K-line patterns; pattern library; predictive
capability
1. Introduction
Since the Dow theory was first introduced in the late 19th century, technical analysis
has been favored by market participants for its intuitiveness and practicality. It encompasses
various methods such as chart analysis, pattern recognition, and seasonal and cyclical
analysis. These techniques aim to predict future market trends by studying historical
prices and trading volume data. However, in modern financial theory, Fama’s weak-
form efficient market hypothesis [
1
] asserts that market prices fully reflect all past price
information. Therefore, in a weak-form efficient market, technical analysis is considered
ineffective in providing predictive insights into future prices. Furthermore, traditional
capital asset pricing models (CAPMs) [
2
–
4
] are based on the assumption of market efficiency,
advocating a linear relationship between an asset’s systematic risk and its expected return.
This theory further reinforces the notion of random walks in market prices, denying the
possibility of achieving abnormal returns by utilizing historical data [
5
]. Jönsson et al.
investigated the predictive power of candlestick patterns in the Swedish stock market. The
Information 2024,15, 821. https://doi.org/10.3390/info15120821 https://www.mdpi.com/journal/information

Information 2024,15, 821 2 of 17
results indicated that candlestick patterns did not show significant predictive effectiveness
in the Swedish market, suggesting that they may lack universality in certain market
environments [
6
]. Stasiak et al. explored the limitations of using candlestick charts in
high-frequency markets, pointing out that over-reliance on candlestick charts could lead to
erroneous economic research conclusions. The authors emphasized that high-frequency
data and more complex market factors should be considered to avoid errors from relying
solely on pattern analysis [7].
However, recent studies suggest that markets may not be completely efficient, and
candlestick analysis is not ineffective in all situations. In the short term, investors can profit
using technical analysis tools, such as candlestick patterns [8–13].
One relevant branch of technical analysis involves recognizing chart patterns from
Japanese candlestick charts [
14
]. Discretionary traders often use candlestick patterns to
predict the direction of future stock prices. To benefit from the integration of specific
domain knowledge in data-driven methods, there is growing interest in combining pattern
recognition techniques applied to candlestick charts with machine learning models used for
stock-related data [15–18]. However, existing hybrid solutions have two main drawbacks:
(1) machine learning models often generate too many trade signals, leading to a relatively
high false alarm rate [
19
]; (2) models trained on hybrid candlestick patterns and stock
price-related features may suffer from the curse of dimensionality [
20
]. To overcome these
issues, the steps of pattern recognition and machine learning can be decoupled to generate
profitable trading signals [
8
]. By including machine learning-based suggestions in the
candidate list through pattern recognition, the number of generated trading signals is
limited to a reduced subset of more reliable, double-checked recommendations.
Therefore, identifying effective candlestick patterns plays a crucial role in optimizing
trading strategies and promoting the application of machine learning models in stock pre-
diction research. Currently, many scholars have proposed different methods for classifying
candlestick patterns, which can be categorized into supervised and unsupervised classifica-
tion. In supervised classification, rule-based (RB) methods are widely applied [
8
,
21
]. Fuzzy
logic reasoning has also been used for the classification of candlestick patterns [22–28].
Unsupervised classification typically uses clustering methods for candlestick pat-
terns, including agglomerative hierarchical clustering with Euclidean distance metrics [
29
],
nearest-neighbor clustering algorithms based on candlestick sequence similarity matching
models [
30
], and content-based image retrieval (CBIR) techniques [
31
]. Clustering algo-
rithms can automatically uncover hidden patterns or categories from large datasets, thus
helping users simplify data and discover the underlying structure of the data.
Although the results of these systems have been proven valuable, previous methods
in supervised classification required traders and researchers to manually define which
candlestick chart patterns were important. This meant that they needed to understand and
identify these patterns beforehand, a process that was both time-consuming and subjective.
Additionally, the predefined pattern rules were typically derived from historical data and
may not adapt to current market changes. If market conditions change significantly, these
rules may become invalid or no longer applicable. This paper proposes an unsupervised
learning method that can identify important candlestick chart patterns without any prior
knowledge or manual definition. The method analyzes large amounts of historical data to
uncover hidden patterns that can predict stock price movements. Because it does not rely on
human experience or predefined rules, this approach is both reliable and flexible, making it
suitable for developing more robust trading systems. The output of this method can also
create an effective pattern library, with each pattern containing substantial historical data,
which can be used alongside trading systems or strategies.
This study optimizes the process of candlestick pattern recognition through a two-layer
clustering method, improving both accuracy and efficiency. Unlike traditional candlestick
pattern recognition methods, the two-layer clustering approach automatically identifies and
classifies valid candlestick patterns by analyzing the similarity of stock data, overcoming
the limitations of fixed patterns and manual intervention. The research also advances the

Information 2024,15, 821 3 of 17
automation and intelligence of financial data analysis. By combining similarity matching
with clustering methods, this study introduces a new data-driven tool for financial market
prediction. This method can automatically uncover hidden patterns from large datasets,
reducing manual intervention and thereby improving both the efficiency and accuracy
of data analysis. Furthermore, this study provides more reliable support for investment
decisions. By identifying effective candlestick patterns and building a pattern library, this
study offers a more scientific basis for generating trading signals, optimizing trading strate-
gies, and enhancing their reliability, thus helping investors make more precise decisions in
dynamic markets.
To achieve effective stock prediction, this paper includes the following sections: a
comparison of the recent and relevant research literature (Section 2); an introduction to the
proposed method (Section 3); and a presentation of the experimental results (Section 4).
2. Review of the Literature
2.1. The Origin of Candlestick Charts and Their Application in Market Analysis
The origin of candlestick charts (also known as K-line charts) dates back to 18th
century Japan, where they were invented by the rice merchant Munehisa Homma. By
observing rice price fluctuations and recording price changes, he gradually developed
the candlestick chart. Candlestick charts display price fluctuations and market sentiment
through the shape and color of the body and wicks. Investor sentiment can alter expected
profit growth and the required rate of return, thus influencing stock prices [
32
]. Nison
provided a detailed description of the structure and history of candlestick charts and
explained their applications, which contributed to the global popularity of candlestick
charts [33].
The core assumption of candlestick pattern analysis is that the emotions and behaviors
of market participants repeat, creating specific price fluctuation patterns. By identifying
historical candlestick patterns, the underlying market trends can be revealed. Early studies
showed that candlestick patterns could effectively predict stock price movements, espe-
cially in short-term trading strategies [
14
]. Lu et al. explored the profitability of candlestick
chart trading strategies and proposed analyzing the predictability and profitability of
candlestick shapes from a new perspective. Their research used more complex statistical
methods to explore whether different candlestick patterns could effectively predict market
trends [
9
]. Later studies discussed the influence of trend definitions and position strategies
on the profitability of candlestick chart strategies, analyzing how various strategies affect
trading results in practice. These studies demonstrated that combining trend definitions
with position strategies could significantly improve the profitability of candlestick trading
strategies, especially in highly volatile markets, where timely trend identification and
appropriate position strategies can effectively reduce risks and increase returns [
10
]. Heinz
et al. conducted a statistical analysis of the bullish and bearish markets engulfing can-
dlestick patterns on the S&P 500 index, examining their market forecasting ability. Their
study found that these patterns exhibit some degree of trend predictive power, particularly
during periods of high market volatility [11].
2.2. Supervised Classification
With the development of technology, more algorithms have been proposed to au-
tomatically identify candlestick patterns, improving prediction accuracy [
8
]. Currently,
many researchers have introduced different methods for classifying candlestick patterns. In
supervised classification, rule-based (RB) methods have been widely applied. RB methods
directly identify candlestick patterns using explicit rules. Lu et al. classified two-day
candlestick patterns using 1
×
4 vectors and systematically studied candlestick shapes,
then evaluated their profitability on three European stocks [
21
]. Cagliero et al. separated
pattern recognition from the machine learning steps, using candlestick patterns to filter
data, and combining technical characteristics with expert confidence to generate more
reliable trading suggestions [8].

Information 2024,15, 821 4 of 17
Fuzzy logic reasoning has also been widely used in candlestick pattern classification.
Etschberger et al. described the size, relationships, and colors of candlestick charts using
fuzzy logic [
22
]. Leon et al. introduced a fuzzy logic-based candlestick pattern recognition
system, which compares different patterns by calculating Hamming distance and iden-
tifies candlestick patterns with specific size, relationships, colors, and trends [
23
]. Roy
et al. used fuzzy reasoning mechanisms to predict future trends based on the “Hammer”
pattern classification method [
24
]. Vásquez et al. employed fuzzy classification to identify
candlestick patterns in real data sequences and designed trading strategies based on the
extracted patterns [
25
]. Chen et al. identified fuzzy candlestick patterns from large amounts
of financial transaction data in a prototype system and stored investment strategies in a
knowledge base [
26
]. Arévalo et al. proposed and validated a trading rule based on flag
pattern recognition, which improved profitability and reduced trading risk [27]. Cervelló-
Royo et al. proposed risk-adjusted profit trading rules based on technical analysis and
newly defined flag patterns, clarifying buy and sell timing, target profits, and maximum
acceptable losses [28].
2.3. Unsupervised Classification
Clustering methods have also been widely used for the unsupervised classification
of candlestick patterns. Martiny et al. employed a hierarchical agglomerative clustering
method with Euclidean distance metrics to automatically discover important candlestick
patterns from the price data’s time series, integrating the current trend [
29
]. Tao et al.
proposed a nearest-neighbor clustering algorithm based on a candlestick sequence similarity
matching model to test the profitability of patterns and mine these patterns from time
series data [
30
]. Additionally, image retrieval methods have been used to search for
similar historical candlestick charts represented by image features. Quan et al. applied
content-based image retrieval (CBIR) techniques, utilizing low-level image features of
candlestick charts, such as wavelet textures and Canny edges, to search for similar historical
candlestick charts. Based on these charts’ “future” trends, they predicted stock prices for
query charts [31].
2.4. Machine Learning Models
In recent studies, the combination of candlestick patterns and modern machine learn-
ing techniques has been widely applied to stock market timing prediction. Jasemi et al.
proposed a model combining candlestick analysis with neural networks, which effec-
tively predicts market up and down trends, demonstrating the effectiveness of candlestick
patterns in capturing market trends [
15
]. Marszałek et al. introduced an ordered fuzzy can-
dlestick model, using fuzzy logic to handle uncertainty in market data, thereby improving
the accuracy of stock market predictions [
16
]. Additionally, Ahmadi et al. developed an
efficient hybrid candlestick analysis model by combining support vector machines with
heuristic algorithms, such as genetic algorithms and imperialist competitive algorithms, fur-
ther optimizing stock market timing predictions [
17
]. Bustos et al. conducted a systematic
review of the application of candlestick patterns in stock market predictions, emphasizing
the potential of combining candlestick patterns with other technical analysis tools to im-
prove market prediction accuracy [
19
]. Mahmoodi et al. proposed a method combining
support vector machine (SVM) and particle swarm optimization (PSO) for the classification
analysis of candlestick patterns. By optimizing the parameters of SVM, the study improved
the classification accuracy of candlestick charts, thereby enhancing the accuracy of stock
market predictions [
18
]. Cohen et al. explored the application of optimized candlestick
pattern analysis in Bitcoin trading systems, proposing a machine learning-based approach
to improve prediction accuracy. The results showed that the optimized model significantly
enhanced decision-making in Bitcoin trading [12].
An increasing number of studies show that combining machine learning with K-line
pattern techniques or trading strategies can significantly improve the accuracy of stock
price trend predictions. As a result, efficiently identifying valid K-line patterns has become
Information 2024,15, 821 5 of 17
a key research direction in stock market analysis. Although current research can classify
K-line patterns, most methods rely on domain experts to define valid patterns, which may
involve subjectivity or even misinterpretation of the patterns. The systems developed by
Martiny et al. and Tao et al. reduce the reliance on expert knowledge, but the former
does not consider the impact of the weight of wicks and bodies on the model’s accuracy,
while the latter, although considering these factors, cannot automatically classify valid
K-line patterns. To address these issues, this paper proposes a two-layer clustering method
based on a K-line sequence similarity matching model, which has the following advantages:
(1) Automated Pattern Recognition: The model can automatically extract K-line shape
features from historical data without predefining pattern rules, effectively avoiding the
influence of human factors and subjective bias; (2) Improved Market Adaptability: Tradi-
tional methods struggle to cope with market environmental changes, whereas this model
can dynamically identify new K-line patterns through unsupervised learning, improving
adaptability to different market conditions; (3) Enhanced Model Robustness: The two-layer
clustering structure optimizes pattern recognition from both global and local levels, more
effectively distinguishing noise from key patterns, thus enhancing the model’s robustness
and resistance to interference; (4) Support for Decision-Making: The model’s output pattern
library can be integrated with trading systems to provide specific trading signals and strate-
gies, improving the scientific and effective nature of trading decisions; (5) Compatibility
with Machine Learning Models: The pattern library generated by the model can further
enhance the intelligence of the prediction system. When combined with advanced models
such as deep learning, it can optimize trading signal generation and risk control strategies,
reduce data dimensions, and improve the overall decision-support capability of the system.
3. Material and Method
3.1. Data Acquisition
The dataset used in this paper comes from East Money Information, selecting 10 stocks
from various industries with different total market capitalizations on the Shanghai Stock
Exchange. The data covers 1000 days of post-adjustment K-line data from 11 November
2019 to 20 December 2023 and is used as the training set. Additionally, Shanxi Fenjiu’s
1000 days of post-adjustment K-line data during the same period was used for out-of-
sample testing of selected patterns. Each data point includes four indicators: the opening
price, closing price, highest price, and lowest price, resulting in a total of 11,000 data points,
with the selected stocks listed in Table 1.
Firstly, this time period encompasses both the pre- and post-outbreak stages of the
COVID-19 pandemic, providing a rich data context for analyzing the pandemic’s impact
on the financial market. During this period, global financial markets experienced extreme
volatility and uncertainty. The economic shock triggered by the pandemic caused fluctua-
tions in stock prices across various industries. By selecting stocks from different industries
with various total market capitalizations, this dataset provides a comprehensive reflection
of overall market trends. Furthermore, the 10 selected stocks include companies from both
top- and middle-ranking industries, ensuring diversity in the dataset and allowing the
model to learn more general and representative patterns. Given the background of the
pandemic, this dataset is helpful in deeply analyzing stock performance under special
market conditions, aiding in the development of a trading system that remains robust even
under high uncertainty.
The relevant parameter settings for the K-line sequence similarity matching algorithm
are as follows:
ωS
= 0.8,
ωP
= 0.2,
ωBd
= 0.6,
ωUS
= 0.2,
ωLS
= 0.2,
ωt
Sp
=
ωt
Rp
= 1, and the
random seed is set to 42.

Information 2024,15, 821 6 of 17
Table 1. The selected stocks.
Stock Code Stock Name Industry Market Size/USD
sh601012 Longi Green Energy Photovoltaic Equipment 20.85 billion
sh600519 Kweichow Moutai Liquor Industry 271.64 billion
sh601127 Seres Automotive 29.87 billion
sh601888 China Duty Free Group Tourism and Hotels 21.02 billion
sh600630 Longtou Shares Textiles and Apparel 0.62 billion
sh600036 China Merchants Bank Banking 130.64 billion
sh600571 Xinyada Internet Services 0.92 billion
sh601318 Ping An Insurance Insurance 142.6 billion
sh600900 China Yangtze Power Electric Power Industry 91.81 billion
sh603178 Shenglong Shares Automotive Parts 0.73 billion
sh600809 Shanxi Fenjiu Liquor Industry 37.26 billion
3.2. K-Line Sequence Similarity Matching
A K-line consists of the opening price, closing price, highest price, and lowest price.
Each K-line includes the following parts: The body, which is the main portion of the K-line,
represents the price fluctuation range between the opening and closing prices. The shape
and color of the body provide important information about market trends. The opening
price (O) is the first trading price of the day, while the closing price (C) is the last trading
price of the day. The color of the body typically indicates whether the price has increased
or decreased. In the Chinese stock market, red or white indicates that the closing price is
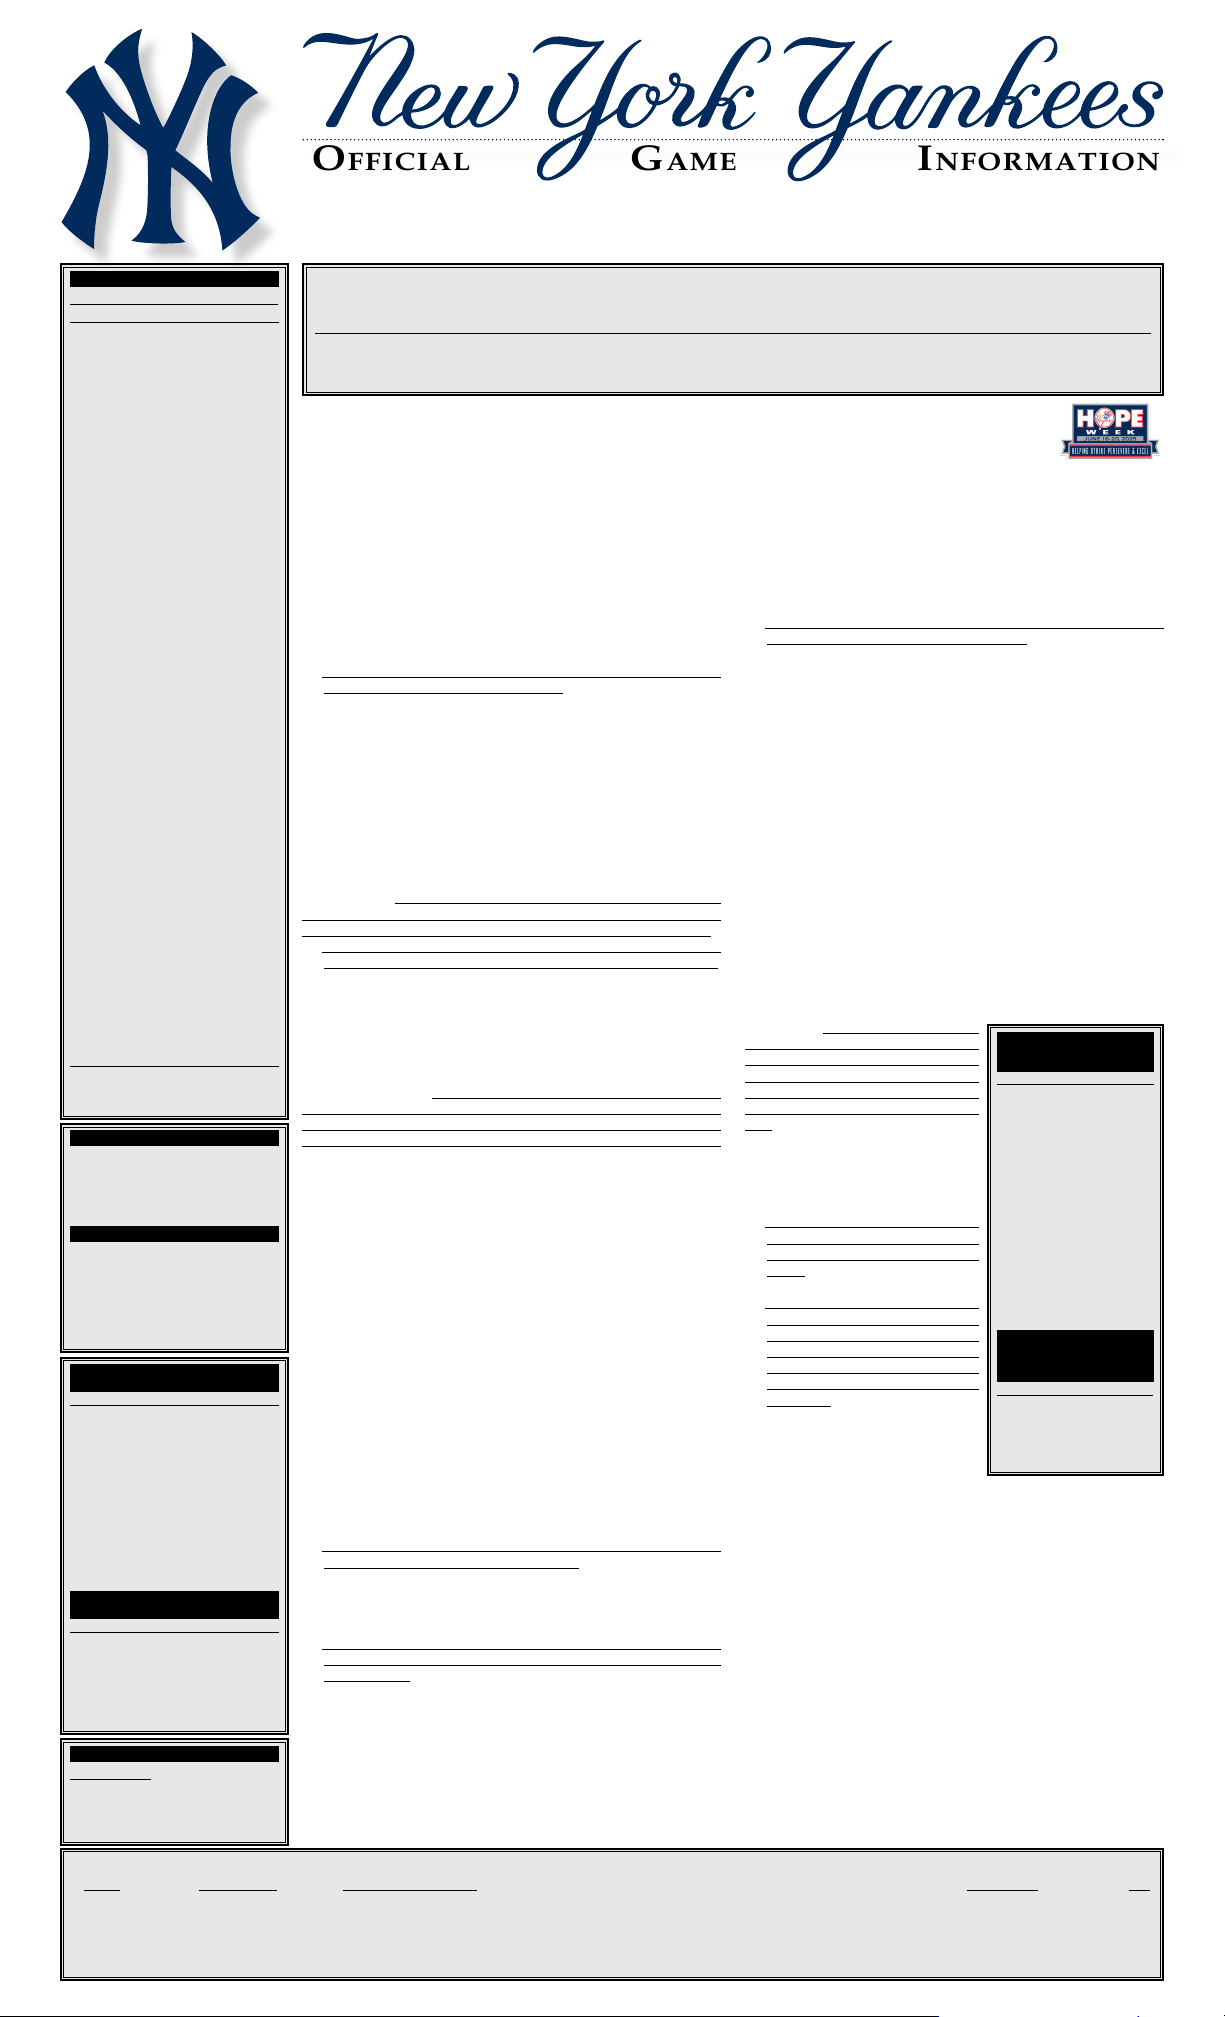
higher than the opening price (i.e., an increase), as shown in Figure 1a, while green or black
indicates that the closing price is lower than the opening price (i.e., a decrease), as shown
in Figure 1b. In contrast, this color scheme is reversed in Western stock markets. If the
opening price is equal to the closing price, the K-line is called a doji, which signifies market
stability, as shown in Figure 1c.
Information 2024, 15, x FOR PEER REVIEW 6 of 17
Table 1. The selected stocks.
Stock Code Stock Name Industry Market Size/USD
sh601012 Longi Green Energy Photovoltaic Equipment 20.85 billion
sh600519 Kweichow Moutai Liquor Industry 271.64 billion
sh601127 Seres Automotive 29.87 billion
sh601888 China Duty Free Group Tourism and Hotels 21.02 billion
sh600630 Longtou Shares Textiles and Apparel 0.62 billion
sh600036 China Merchants Bank Banking 130.64 billion
sh600571 Xinyada Internet Services 0.92 billion
sh601318 Ping An Insurance Insurance 142.6 billion
sh600900 China Yange Power Electric Power Industry 91.81 billion
sh603178 Shenglong Shares Automotive Parts 0.73 billion
sh600809 Shanxi Fenjiu Liquor Industry 37.26 billion
3.2. K-Line Sequence Similarity Matching
A K-line consists of the opening price, closing price, highest price, and lowest price.
Each K-line includes the following parts: The body, which is the main portion of the K-
line, represents the price fluctuation range between the opening and closing prices. The
shape and color of the body provide important information about market trends. The
opening price (O) is the first trading price of the day, while the closing price (C) is the last
trading price of the day. The color of the body typically indicates whether the price has
increased or decreased. In the Chinese stock market, red or white indicates that the closing
price is higher than the opening price (i.e., an increase), as shown in Figure 1a, while green
or black indicates that the closing price is lower than the opening price (i.e., a decrease),
as shown in Figure 1b. In contrast, this color scheme is reversed in Western stock markets.
If the opening price is equal to the closing price, the K-line is called a doji, which signifies
market stability, as shown in Figure 1c.
The upper shadow is a thin line above the body, representing the price fluctuation
between the highest price during the period and the top of the body (either the opening
or closing price). The highest price (high price, H) is the highest trading price during the
period, and the length of the upper shadow extends from the top of the body to the highest
price. The lower shadow is a thin line below the body, representing the price fluctuation
between the lowest price and the boom of the body (either the opening or closing price).
The lowest price (low price, L) is the lowest trading price during the period, and the length
of the lower shadow extends from the boom of the body to the lowest price.
Figure 1. K-line legend showing (a) an increase with red or white K-line, (b) a decrease with green or
black K-line, and (c) market stability with a Doji K-line [30].
The upper shadow is a thin line above the body, representing the price fluctuation
between the highest price during the period and the top of the body (either the opening
or closing price). The highest price (high price, H) is the highest trading price during the

Information 2024,15, 821 7 of 17
period, and the length of the upper shadow extends from the top of the body to the highest
price. The lower shadow is a thin line below the body, representing the price fluctuation
between the lowest price and the bottom of the body (either the opening or closing price).
The lowest price (low price, L) is the lowest trading price during the period, and the length
of the lower shadow extends from the bottom of the body to the lowest price.
The similarity of K-line sequences affects the model’s performance and is divided
into two main aspects: (1) Shape similarity: This involves comparing the opening price,
closing price, highest price, and lowest price of corresponding K-lines in two sequences to
measure their consistency in shape; (2) Position similarity: This evaluates the similarity in
the relative positions of corresponding K-lines within the sequences. Therefore, this paper
proposes both a shape similarity matching model and a position similarity matching model,
which are integrated to build a comprehensive K-line sequence similarity matching model.
Suppose there are two K-line sequences,
KSi
and
KSj
, that need to be compared, and let the
similarity between them be denoted as Sim i, j. The specific introduction to the similarity
matching model between
KSi
and
KSj
is as follows:
KSi
represents i sets of K-line sequence,
which means
KSi
= {
Di
t
|t
∈N
,1
≤
t
≤
|
KSi
|},
|KSi|
(
|KSi| ∈ N
) represents items of
KSi
.
Di
t
represents the K-line of
KSi
of t-th days. Each
Di
t
represents K-line data, which is defined
as a four-element array:
Di
t
= {
Oi
t, Ci
t
,
Hi
t
,
Li
t
}.
Oi
t, Ci
t
,
Hi
t
,
Li
t
represent opening price, closing
price, highest price, and lowest price of KSiat day t.
3.2.1. Candlestick Pattern Similarity
First, based on the structural features of the K-line, the K-line shape is divided into
three parts: upper shadow shape, lower shadow shape, and body shape. Then, similarity
measurement methods are defined for each of these three shapes. Finally, the similarity of
these three shapes is weighted and summed to obtain the overall shape similarity of the
K-line.
Di
t
and
Dj
t
represent the
KSi
and
KSj
of K-line day t separately. The shape similarity
measurement model between them is as follows:
(1) The upper shadow of Di
tis USi[t], which formula is shown below:
USi[t] = Hi
t−max(Oi
t,Ci
t)
Ci
(t−1)∗0.1 (1)
where
Ci
t−1
*0.1 is primarily for normalization. The purpose of normalization is to standard-
ize the K-line shapes of different stocks and time periods, allowing them to be comparable
across different price levels.
The upper shadow similarity of
Di
t
and
Dj
t
is
Simi,j
US(t)
, which formula is shown below:
Sim(i,j)
us =
0, USi[t]∗USj[t] = 0, USi[t]=USj[t]
Min(USi[t],USj[t])
Max(USi[t],USj[t]) ,USi[t]∗USj[t]>0
1, USi[t] = USj[t] = 0
(2)
(2) The lower shadow length of Di
tis LSi[t], which formula is shown below:
LSi[t] = min(Oi
t,Ci
t)−Li
t
Ci
(t−1)∗0.1 (3)
The lower shadow similarity of Di
tand Dj
tis Simi,j
LS(t), which formula is shown below:
Sim(i,j)
LS =
0, LSi[t]∗LSj[t] = 0, LSi[t]=LSj[t]
Min(LSi[t],LSj[t])
Max(LSi[t],LSj[t]) ,LSi[t]∗LSj[t]>0
1, LSi[t] = LSj[t] = 0
(4)

Information 2024,15, 821 8 of 17
(3) The body length of is [t], which formula is shown below:
Bi[t] = Ci
t−Oi
t
Ci
(t−1)∗0.1 (5)
The body similarity of Di
tand Dj
tis Simi,j
Bd(t), which formula is shown below:
Sim(i,j)
Bd =
0, Bi[t]∗Bj[t]<0
0, Bi[t]∗Bj[t] = 0, Bi[t]=Bj[t]
1, Bi[t] = Bj[t] = 0
Min(Bi[t],Bj[t])
Max(Bi[t],Bj[t]) ,Bi[t]∗Bj[t]>0
(6)
(4) The pattern similarity of Di
tand Dj
tis Simi,j
Sp(t), which formula is shown below:
Simi,j
Sp(t) = ωUS ∗Simi,j
US(t) + ωBd ∗Simi,j
Bd(t) + ωLS ∗Simi,j
LS(t)
ωUS +ωBd +ωLS =1
ωUS ≥0, ωBd ≥0, ωLS ≥0
(7)
where
ωUS,ωBd
,
ωLS
represent the weight of
Simi,j
US(t)
,
Simi,j
US(t)
,
Simi,j
Bd(t)
,
Simi,j
LS(t)
. Gen-
erally, in K-line technical analysis, the importance of the body is equal to that of the
shadows. Therefore, under normal circumstances, the weights of these parameters can be
set as follows: ωBd =0.6 and ωUS =ωLS =0.2 [30].
(5) The pattern similarity of KSiand KSjis SSimi,j, which formula is shown below:
SSimi,j=ωt
Sp ∗
n
∑
t=1
Simi,j
Sp(t)(8)
where n
=
|
KSi
|,
∑n
t=1ωt
Sp =
1, and
ωt
Sp
represents the weight of
Simi,j
Sp(t)
. Generally, the
weight of each candlestick in the K-line sequence is the same [30].
3.2.2. K-Line Position Similarity
When calculating the similarity of K-line sequences, both shape and spatial position
similarity must be considered. To address the issue of position similarity matching, this
paper introduces the concept of a coordinate system. Specifically, the order of the K-lines is
used as the horizontal axis, while the daily closing price change relative to the previous
day’s closing price is used as the vertical axis. The y-coordinate of the first candlestick in
the sequence is set to 1; therefore, the x-coordinate of
Di
t
(t = 1) is 1, and the y-coordinate
is 1; the x-coordinate of
Di
t
is t, and the y-coordinate is
Ci
t−Ci
t−1
/(
Ci
t−1*
0.1). The K-line
sequence position similarity measurement model based on K-line coordinates is shown
as follows:
(1) (xi
t,yi
t) represents the axis of Di
t, which formula is shown below:
xi
t=t,yi
t=
1, t=1
Ci
t−Ci
(t−1)
Ci
(t−1)∗0.1 ,t>1(9)

Information 2024,15, 821 9 of 17
The positional similarity of Di
tand Dj
tis Simi,j
RP(t), which formula is shown below:
Sim(i,j)
RP (t) =
0, yi
t∗yj
t=0, yi
t=yj
t
0, yi
t∗yj
t<0
1, yi
t=yj
t=0
Min(yi
t,yj
t)
Max(yi
t,yj
t),yi
t∗yj
t>0
(10)
(2) The positional similarity of
KSi
and
KSj
is
PSimi,j
, which formula is shown below:
PSim(i,j)=n
∑
t=1
Sim(i,j)
RP (t)∗ωt
RP (11)
where n
=
|
KSi
|,
∑n
t=1ωt
RP =
1, and
ωt
RP
represents weight of
Simi,j
RP(t)
. Generally, each
candlestick in the K-line sequence has the same weight [30].
3.2.3. K-Line Sequence Similarity
Based on the shape similarity and position similarity of the K-line sequences, the
overall similarity of the entire K-line sequence can be obtained. Therefore, the similarity
matching model for KSiand KSjis shown below:
Sim(i,j)=ωS∗SSim(i,j)+ωP∗PSim(i,j)(12)
where
ωS
represents the weight of the K-line sequence’s shape similarity, and
ωP
represents
the weight of the position similarity. Generally, the shape similarity is considered more
important than the position similarity, so the recommended weight settings are as follows:
ωS=0.8 and ωP=0.2 [30].
3.3. Double-Layer Clustering of K-Line Sequences
The distinguishing pattern can accurately predict the direction for the next day, but if
the prediction is extended further into the future, its reliability decreases significantly [
29
].
Therefore, this paper investigates the probability of price increase or decrease for the short-
term closing price after the pattern appears. The similarity matching model based on K-line
sequences uses the K-means algorithm to cluster K-line patterns. The K-means algorithm
requires the number of clusters to be predefined, but the number of effective K-line patterns
is not clearly defined. Hence, a two-layer clustering method is used to determine the exact
number of effective K-line patterns.
3.3.1. First-Layer Clustering
The first layer of clustering for K-line patterns aims to obtain a complete set of initial
valid patterns. To ensure these initial valid K-line patterns can effectively predict the price
direction for the next day, their prediction probability (P_R/P_D) must be greater than
60%. If the prediction probability is below 60%, the clustering results may be influenced by
randomness, indicating that the clustered patterns might lack sufficient representativeness
or stability. For example, in a stock market prediction model using clustering algorithms to
classify stock K-line patterns, if the prediction probability (P_R/P_D) is 55%, it means the
model has low confidence in predicting this pattern, suggesting that the classification result
might not be stable or could be the result of random fluctuations. This low probability
indicates that the model may struggle to distinguish between valid patterns and noise
data, potentially affecting its real-world application. To ensure the reliability and practical
value of the clustering results, setting a higher prediction probability threshold helps avoid
incorporating low-confidence patterns into the model, thus improving the accuracy and
effectiveness of the clustering results.
Information 2024,15, 821 10 of 17
Additionally, the number of pattern members within each cluster must exceed a
specific value, x, since rare valid patterns have no value in practical applications. Due to the
high volatility and complexity of financial market data, a fixed value may not be suitable
for all datasets. The chosen x value may vary depending on the scale, characteristics, and
market conditions of the data. Therefore, to ensure the model adapts to different datasets
and demonstrates good robustness, we have not set a fixed threshold for x.
We start with two clusters and gradually increase the number of clusters until any
cluster in the current clustering fails to meet the prediction probability requirement due
to insufficient members, at which point we stop the first-layer clustering and tally all the
initial valid K-line patterns obtained from the first to the last clustering. Through these
steps, we can determine the final number of clusters in the first layer.
3.3.2. Second-Layer Clustering
The goal of the second layer of clustering is to identify redundant and invalid patterns
within the initial valid K-line patterns. Redundant patterns are similar K-line patterns
that consistently predict the same direction for the next day’s stock closing price, while
invalid patterns are those clustered together but fail to consistently predict the stock closing
price direction. Based on the principles of the K-means algorithm, when the number of
clusters is adjusted, the algorithm recalculates the cluster centers. Therefore, each new
clustering could reveal redundant patterns or uncover new ones. Relying solely on the
patterns obtained from the final clustering might overlook many hidden patterns. To ensure
a comprehensive and accurate set of target patterns, we re-cluster the cluster centers of all
initial valid K-line patterns from the first layer of clustering. Starting with two clusters,
we gradually increase the number of clusters until the proportion of invalid K-line pat-
terns reaches a predefined threshold, at which point the clustering stops. By eliminating
redundant and invalid patterns, we can obtain the final set of valid K-line patterns.
3.4. Pattern Library Creation
The final effective K-line patterns will be compiled into a pattern library, which in-
cludes the price data and predictive capability information of the patterns. Each pattern
will contain at least thirty different instances for direct use by traders or trading systems.
A sufficient number of instances ensures that trading strategies perform well under dif-
ferent market conditions, thereby enhancing the robustness of the trading strategies and
improving the flexibility of the trading systems.
3.5. Pattern Profitability Analysis
This paper uses cumulative return to calculate the return of K-line patterns. The
specific trading strategy is as follows: (1) Buy stocks at the opening price on the first day
after the pattern appears, which is the initial asset value. (2) Hold for a period of time and
then sell. This period is the holding period, denoted as f. Since K-line technical analysis is
mainly used for short-term prediction, we set the holding period as 1
≤
f
≤
5. (3) Sell the
stock at the closing price on the f-th day after the pattern appears. This price is the final
asset value. (4) Calculate the return of the K-line pattern holding for f days based on the
initial asset price and final asset value, denoted as
Ef
. If
Ef
> 0, the return is positive; if
Ef< 0, the return is negative. The formula for calculating Efis shown in Equation (13).
Ef=(Initial Value −Final Value)/Initial Value (13)
4. Results and Discussion
4.1. Cluster Analysis
Based on the K-line sequence similarity matching model defined earlier, the first-layer
clustering was performed on 10,000 stock data points in the training dataset. The stopping
condition for clustering was set to 144 clusters, resulting in a total of 832 initial effective
K-line pattern clusters, as detailed in Table 2.

Information 2024,15, 821 11 of 17
Table 2. Initial effective K-line pattern cluster.
Pattern ID First-Layer Cluster Count
(Effective Pattern Label)
Occurrence
Count PRPD
0 32–28 103 0.39 0.61
1 32–29 55 0.36 0.60
2 37–13 67 0.36 0.63
3 40–5 78 0.37 0.62
4 41–39 57 0.37 0.61
5 43–2 84 0.61 0.37
. . . . . . . . . . . . . . .
828 144–11 35 0.34 0.63
829 144–65 33 0.33 0.67
830 144–107 31 0.65 0.35
831 144–113 30 0.27 0.73
To filter out redundant duplicate patterns and remove invalid patterns, we conducted
a second-layer clustering analysis on the cluster centers of the 832 initial effective K-line
pattern clusters. In each class, the group with the best predictive ability (the highest of
PR/PD
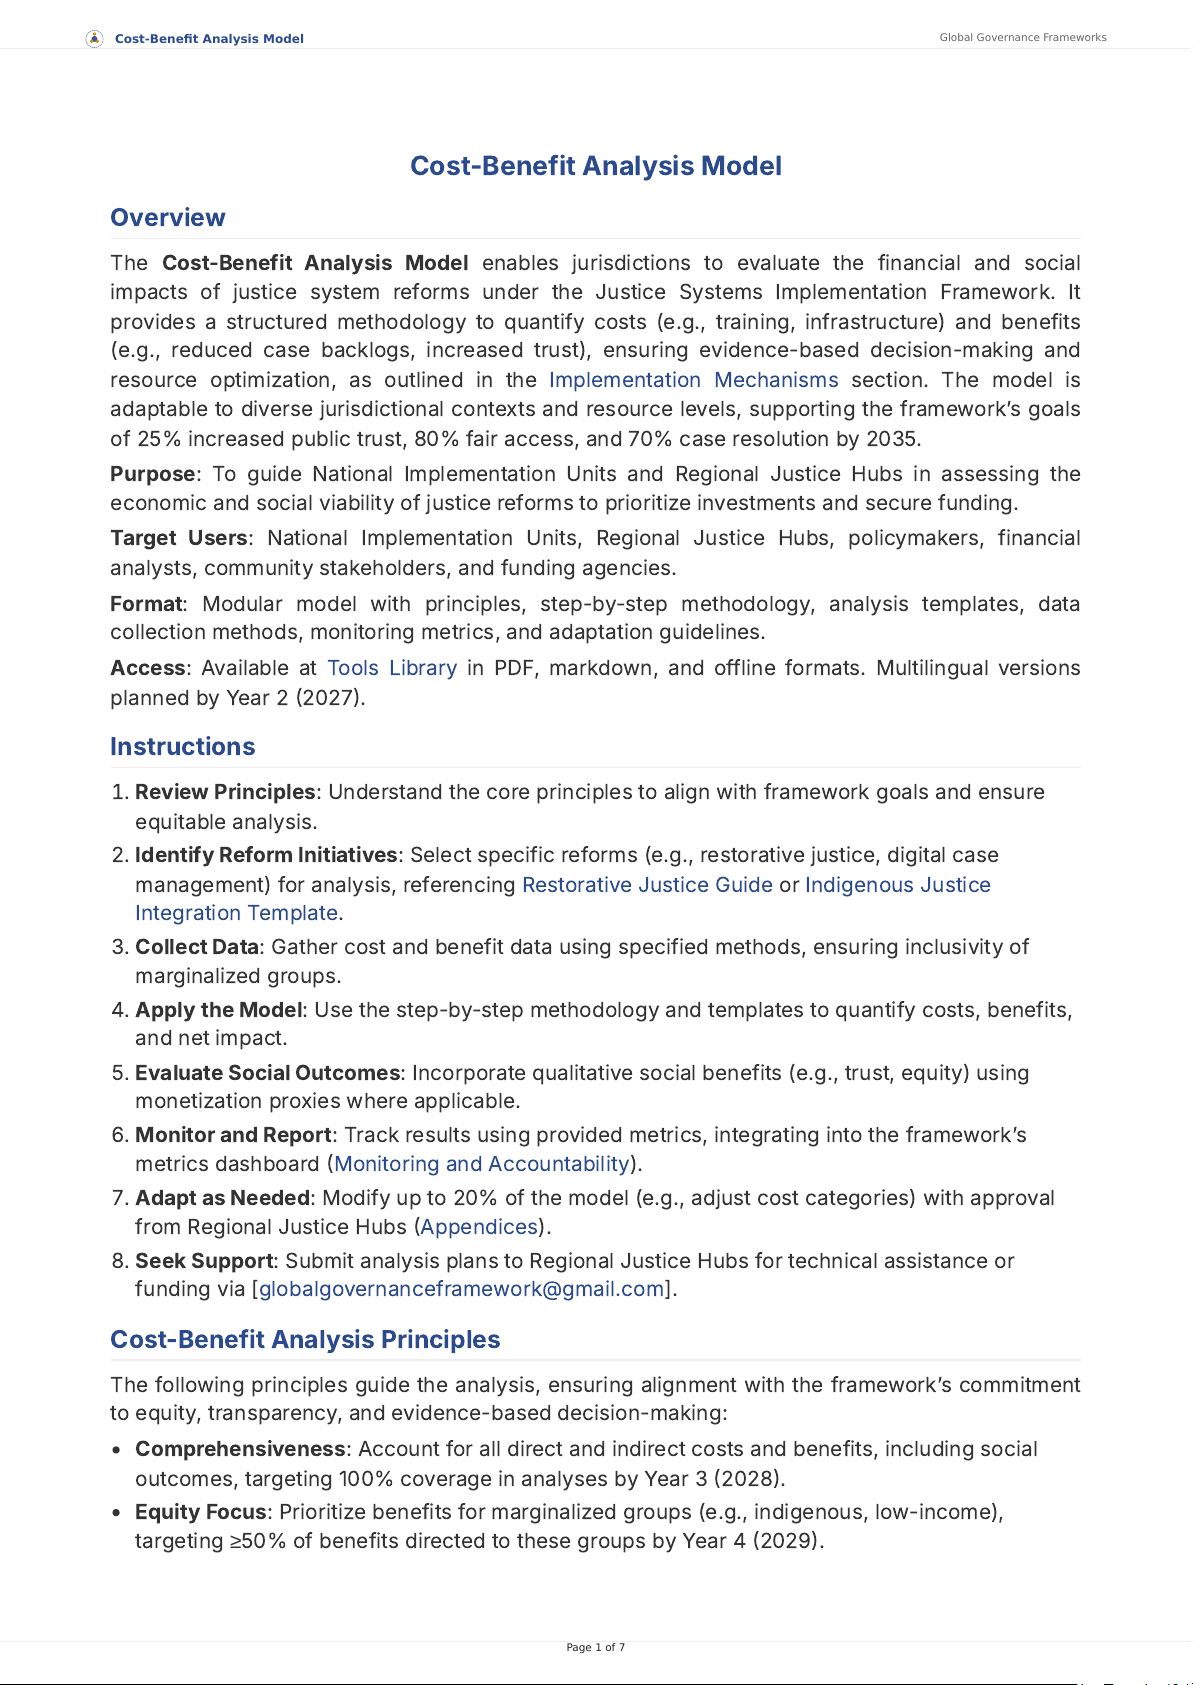
) was selected as the final effective K-line pattern group. As shown in Figure 2, as
the number of clusters gradually increased to 110, the rate of invalid K-line patterns rapidly
decreased; when the number of clusters increased from 110 to 170, the rate of decline
in invalid K-line patterns slowed; and after exceeding 170 clusters, the rate of invalid
K-line patterns stabilized. Since similar K-line patterns with the same predictive ability
are regarded as the same pattern, having too many clusters may lead to the same K-line
pattern being split into multiple clusters, increasing the difficulty of identifying effective
patterns. Therefore, a higher number of clusters does not necessarily yield more effective
results. Based on this principle, we determined 170 as the final number of clusters. After
screening and removing 14 invalid patterns, the number of final effective K-line patterns
in the library was reduced to 156. The rate of invalid K-line patterns corresponding to
different cluster counts is shown in Figure 2, and detailed information about the effective
K-line pattern library can be found in Table 3.
Figure 2. Ineffective candlestick pattern rate for different numbers of clusters.

Information 2024,15, 821 12 of 17
Table 3. Effective K-line pattern library.
Pattern ID First-Layer Cluster Count
(Effective Pattern Label)
Occurrence
Count PRPDPrice
0 49–35 76 0.36 0.63 . . .
1 52–46 41 0.63 0.37 . . .
2 53–44 55 0.33 0.67 . . .
3 55–5 47 0.62 0.36 . . .
4 56–34 44 0.32 0.68 . . .
5 56–44 62 0.36 0.63 . . .
. . . . . . . . . . . . . . . . . .
152 141–71 33 0.64 0.33 . . .
153 142–122 31 0.68 0.32 . . .
154 144–11 33 0.33 0.67 . . .
155 144–113 31 0.65 0.35 . . .
In the effective K-line pattern library, each pattern contains price data for at least
30 K-line sequences and the price data for the next day following the occurrence of the
pattern. For the evaluation of the pattern’s predictive ability, if
PR≥
0.6, the pattern is
considered a bullish pattern; if
PD≥
0.6, it is considered a bearish pattern. Among the
156 effective patterns in the library, there are 44 bullish patterns and 112 bearish patterns.
4.2. Patterns Validation
In this study, we validated four randomly selected bullish patterns and four bearish
patterns from the library using the stock data of Shanxi Fenjiu during the same period. First,
we employed a sliding window technique to divide the 1000 days of data for this stock,
resulting in a validation set of 998 three-day K-line patterns. Next, we clustered the selected
K-line patterns with the validation set data, using the same number of clusters as that of
the first-layer clustering for the respective patterns. Finally, we counted the occurrences of
the stock price rise or fall for the next day after the selected patterns appeared, along with
other patterns in the same group. Examples of the selected K-line patterns are shown in
Tables 4and 5.
Table 4. Selection of patterns shape.
1234
Bullish pattern
Information 2024, 15, x FOR PEER REVIEW 12 of 17
Figure 2. Ineffective candlestick paern rate for different numbers of clusters.
In the effective K-line paern library, each paern contains price data for at least 30
K-line sequences and the price data for the next day following the occurrence of the pat-
tern. For the evaluation of the paern’s predictive ability, if 𝑃 ≥ 0.6, the paern is con-
sidered a bullish paern; if 𝑃 ≥ 0.6, it is considered a bearish paern. Among the 156
effective paerns in the library, there are 44 bullish paerns and 112 bearish paerns.
4.2. Paerns Validation
In this study, we validated four randomly selected bullish paerns and four bearish
paerns from the library using the stock data of Shanxi Fenjiu during the same period.
First, we employed a sliding window technique to divide the 1000 days of data for this
stock, resulting in a validation set of 998 three-day K-line paerns. Next, we clustered the
selected K-line paerns with the validation set data, using the same number of clusters as
that of the first-layer clustering for the respective paerns. Finally, we counted the occur-
rences of the stock price rise or fall for the next day after the selected paerns appeared,
along with other paerns in the same group. Examples of the selected K-line paerns are
shown in Tables 4 and 5.
Table 4. Selection of paerns shape.
1 2 3 4
Bullish pattern
Bearish pattern
Information 2024, 15, x FOR PEER REVIEW 13 of 17
Bearish pattern
Table 5. Selection of paerns.
Paern Name Paern Label Occurrence Count 𝑷𝑹 𝑷𝑫
Bullish paern 1 106–56 31 0.65 0.35
Bullish paern 2 92–32 35 0.69 0.31
Bullish paern 3 115–9 35 0.77 0.23
Bullish paern 4 107–66 31 0.65 0.35
Bearish paern 1 82–58 31 0.29 0.71
Bearish paern 2 102–41 34 0.29 0.71
Bearish paern 3 78–3 32 0.28 0.69
Bearish paern 4 109–90 33 0.33 0.64
Bullish paern 1: This K-line paern is a common three consecutive bullish candle-
stick formation. The three consecutive bullish candlesticks consist of three continuous ris-
ing bullish candles, where the body of each bullish candle is longer than the previous one.
Additionally, the opening price of each bullish candle is usually higher than the closing
price of the preceding candle, typically indicating positive market sentiment and the po-
tential for further upward movement in the future.
Bullish paern 2: This K-line paern features a first candlestick that is a bearish can-
dle, with the closing price slightly lower than the opening price, followed by two consec-
utive bullish candles, each with an opening price higher than the previous day’s closing
price. This formation typically indicates a shift in market sentiment from negative to pos-
itive, suggesting that prices may rise in the future.
Bullish paern 3: This K-line paern consists of a long bearish candle as the first can-
dlestick, followed by a smaller bearish candle as the second, and a bullish candle as the
third, with its closing price higher than the previous day’s closing price. This formation
typically suggests that the market may rebound and rise.
Bullish paern 4: This K-line paern consists of three consecutive bearish candles,
with each candle’s closing price lower than that of the previous one. However, the entity
of the bearish candle on the last day is smaller than that of the previous two days. This
formation typically suggests that the selling pressure in the market is gradually weaken-
ing, and a rebound or upward movement may be imminent.
Bearish paern 1: This K-line paern consists of three candles: the first is a bullish
candle, the second is a shorter candle (usually a doji or a small bearish candle), and the
third is a long bearish candle, with each day’s closing price lower than the previous day.
This formation indicates that the market may continue to move downward.
Bearish paern 2: This K-line paern consists of three candles: the first is a long bull-
ish candle, the second is a shorter doji or small bullish candle, and the third is a long
bearish candle. This formation indicates market hesitation and suggests that a downward
reversal may be imminent.
Bearish paern 3: This K-line paern consists of the first two candles being short bull-
ish candles or dojis, followed by a third long bearish candle. This formation suggests that
a downward reversal may be imminent.
Bearish paern 4: This K-line paern consists of three increasingly shorter bullish
candles, indicating that market optimism has peaked, which suggests that a downward
reversal may be imminent.
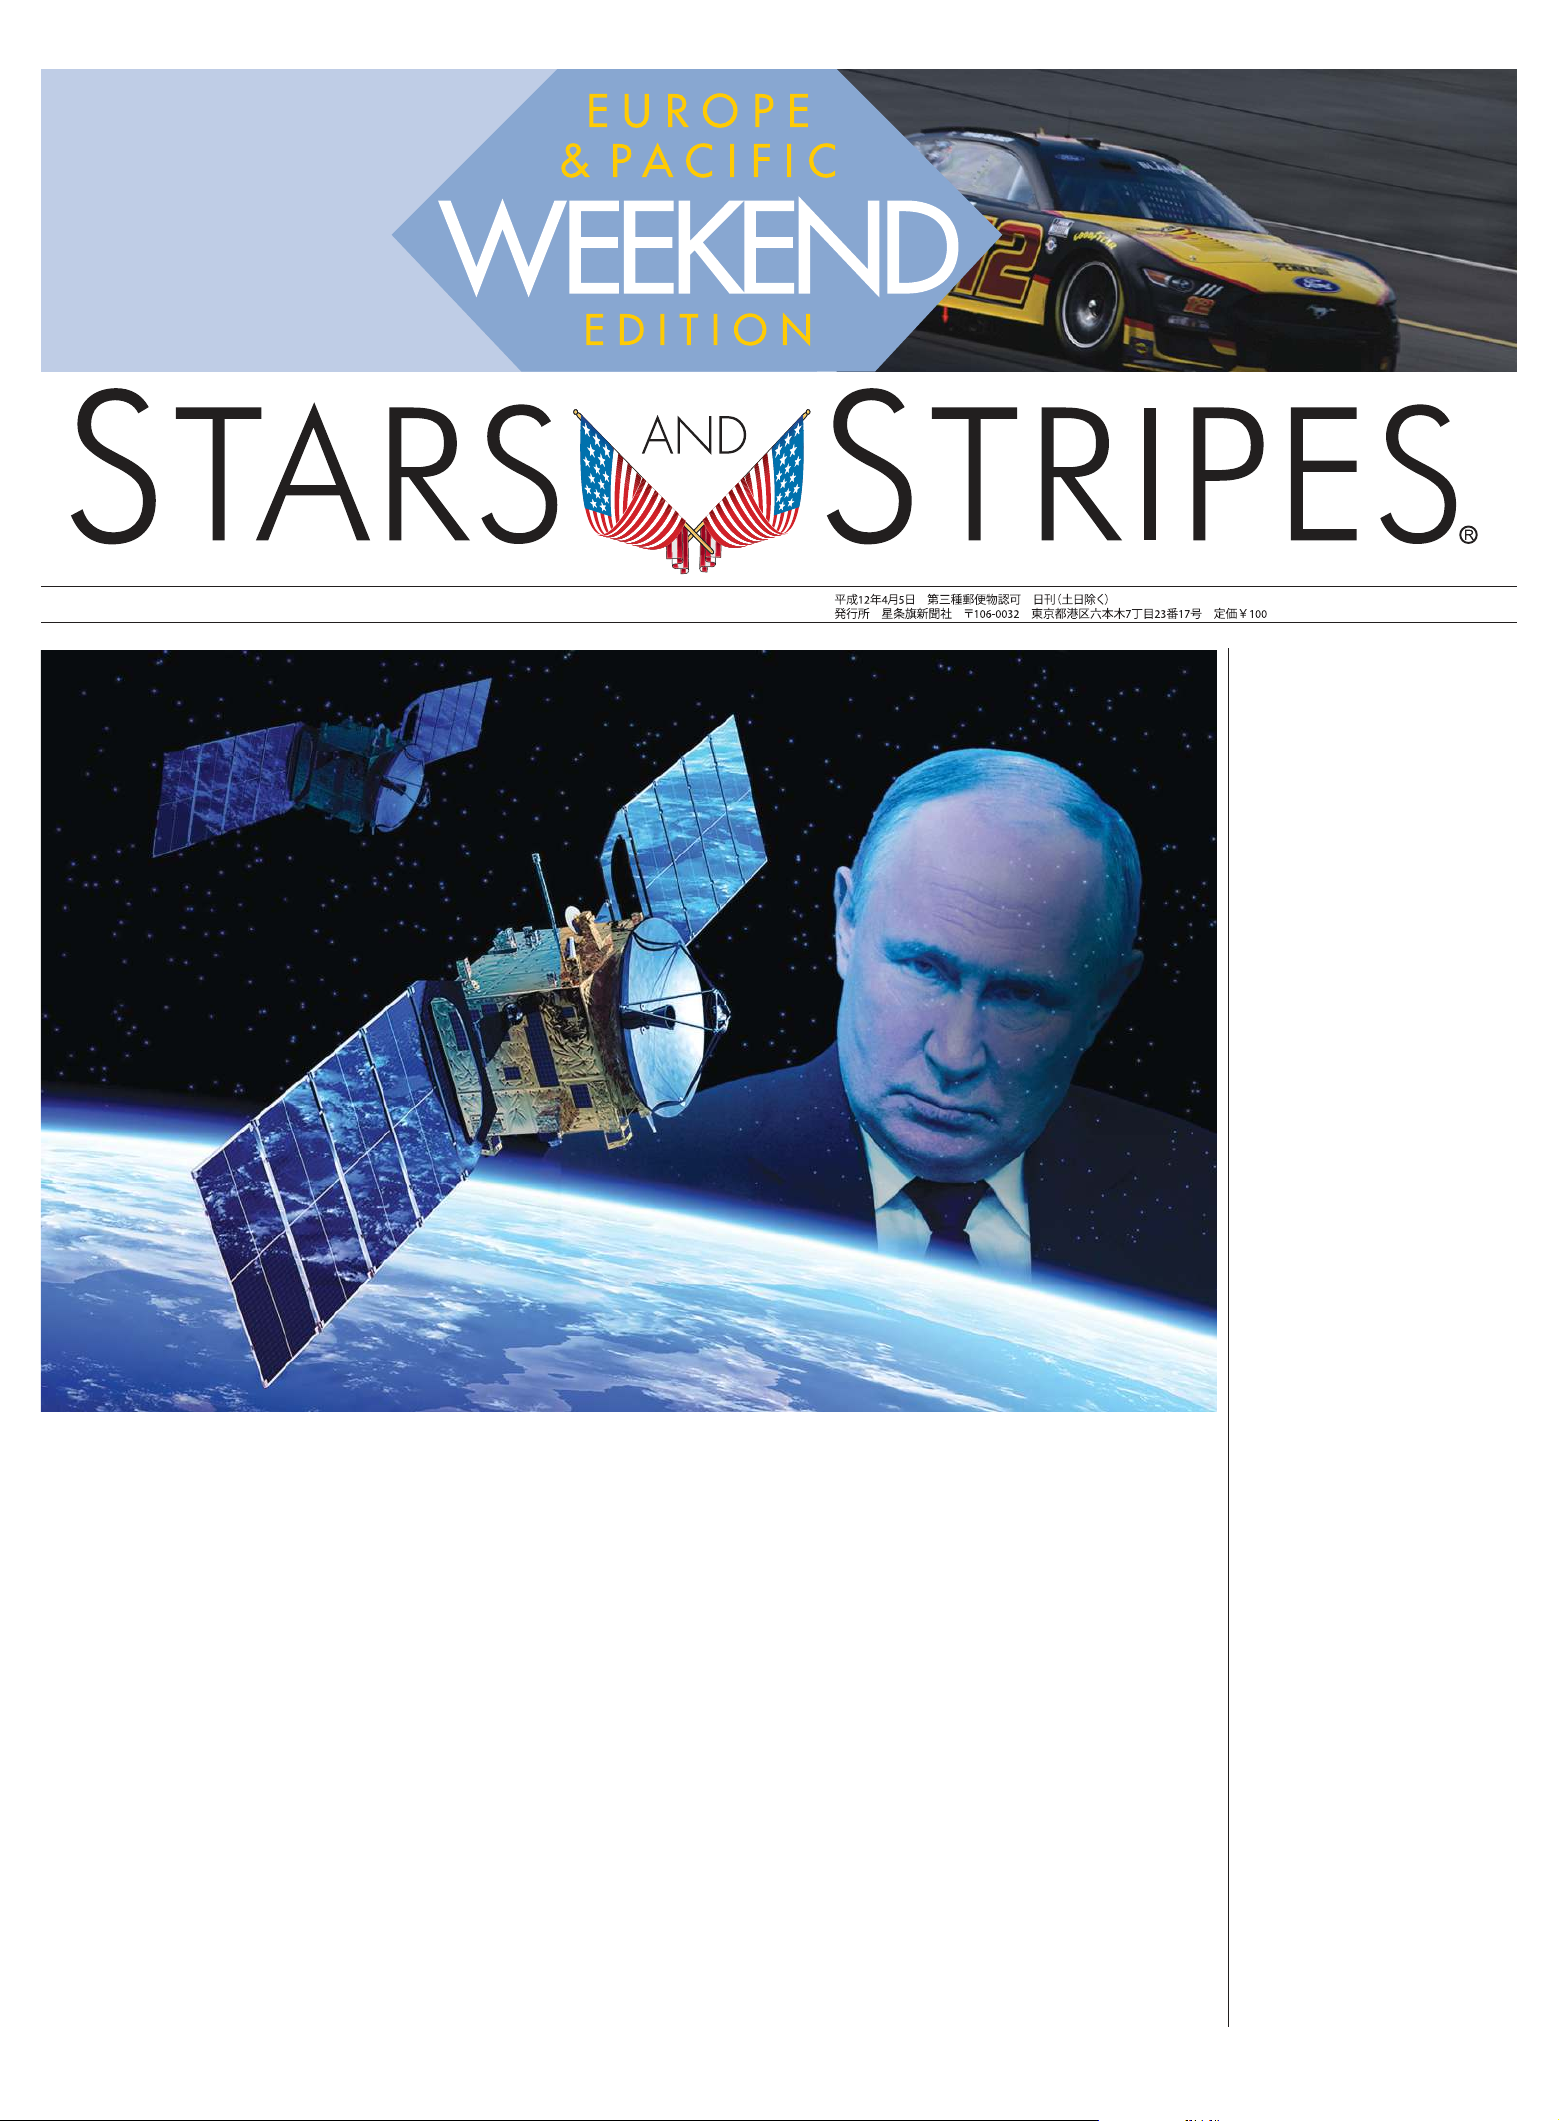
Bullish pattern 1: This K-line pattern is a common three consecutive bullish candlestick
formation. The three consecutive bullish candlesticks consist of three continuous rising
bullish candles, where the body of each bullish candle is longer than the previous one.
Additionally, the opening price of each bullish candle is usually higher than the closing price

Information 2024,15, 821 13 of 17
of the preceding candle, typically indicating positive market sentiment and the potential
for further upward movement in the future.
Table 5. Selection of patterns.
Pattern Name Pattern Label Occurrence Count PRPD
Bullish pattern 1 106–56 31 0.65 0.35
Bullish pattern 2 92–32 35 0.69 0.31
Bullish pattern 3 115–9 35 0.77 0.23
Bullish pattern 4 107–66 31 0.65 0.35
Bearish pattern 1 82–58 31 0.29 0.71
Bearish pattern 2 102–41 34 0.29 0.71
Bearish pattern 3 78–3 32 0.28 0.69
Bearish pattern 4 109–90 33 0.33 0.64
Bullish pattern 2: This K-line pattern features a first candlestick that is a bearish candle,
with the closing price slightly lower than the opening price, followed by two consecutive
bullish candles, each with an opening price higher than the previous day’s closing price.
This formation typically indicates a shift in market sentiment from negative to positive,
suggesting that prices may rise in the future.
Bullish pattern 3: This K-line pattern consists of a long bearish candle as the first
candlestick, followed by a smaller bearish candle as the second, and a bullish candle as the
third, with its closing price higher than the previous day’s closing price. This formation
typically suggests that the market may rebound and rise.
Bullish pattern 4: This K-line pattern consists of three consecutive bearish candles,
with each candle’s closing price lower than that of the previous one. However, the entity
of the bearish candle on the last day is smaller than that of the previous two days. This
formation typically suggests that the selling pressure in the market is gradually weakening,
and a rebound or upward movement may be imminent.
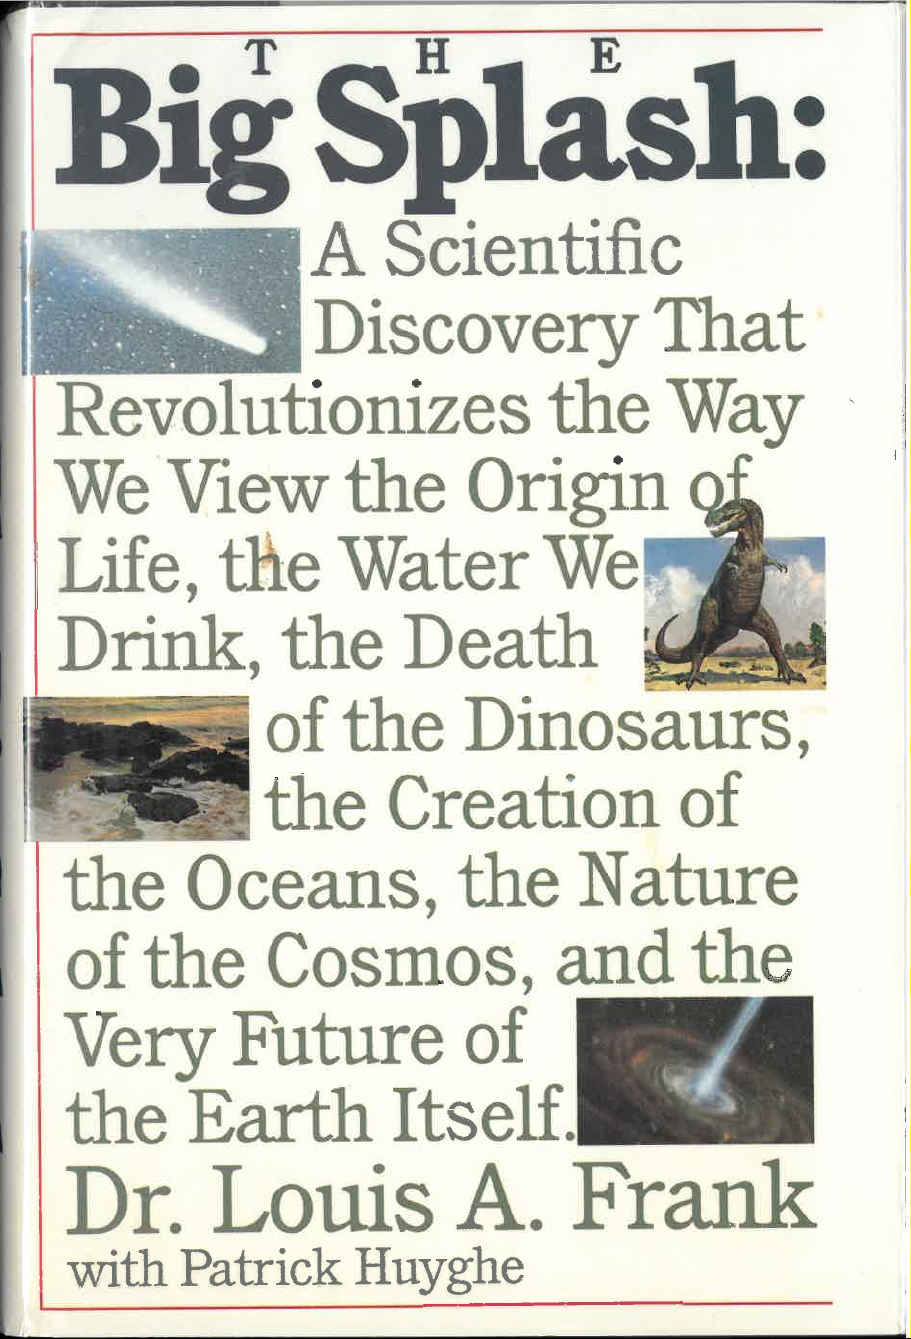
Bearish pattern 1: This K-line pattern consists of three candles: the first is a bullish
candle, the second is a shorter candle (usually a doji or a small bearish candle), and the
third is a long bearish candle, with each day’s closing price lower than the previous day.
This formation indicates that the market may continue to move downward.
Bearish pattern 2: This K-line pattern consists of three candles: the first is a long bullish
candle, the second is a shorter doji or small bullish candle, and the third is a long bearish
candle. This formation indicates market hesitation and suggests that a downward reversal
may be imminent.
Bearish pattern 3: This K-line pattern consists of the first two candles being short
bullish candles or dojis, followed by a third long bearish candle. This formation suggests
that a downward reversal may be imminent.
Bearish pattern 4: This K-line pattern consists of three increasingly shorter bullish
candles, indicating that market optimism has peaked, which suggests that a downward
reversal may be imminent.
The verification results are shown in Table 6. In the concurrent data of Shanxi Fenjiu
stocks, the actual performance of the patterns is as follows: Bullish Pattern 1 appeared
thirteen times, with the closing price rising the next day on twelve occasions; Bullish
Pattern 2 appeared seventeen times, with the closing price rising the next day on eleven
occasions; Bullish Pattern 3 appeared fourteen times, with the closing price rising the next
day on eight occasions; Bullish Pattern 4 appeared eight times, with the closing price rising
the next day on five occasions. Bearish Pattern 1 appeared eighteen times, with the closing
price falling the next day on eleven occasions; Bearish Pattern 2 appeared thirteen times,
with the closing price falling the next day on ten occasions; Bearish Pattern 3 appeared
ten times, with the closing price falling the next day on seven occasions; Bearish Pattern
4 appeared eleven times, with the closing price falling the next day on seven occasions.
The verification results indicate that the actual performance of each K-line pattern in the

Information 2024,15, 821 14 of 17
concurrent data of Shanxi Fenjiu stocks is generally consistent with expectations. Both
bullish and bearish patterns demonstrate high accuracy in predicting price movements the
following day. Specifically, bullish patterns have a high probability of an increase the next
day, while bearish patterns correspond to a high probability of a decline.
Table 6. Validation results of bullish/bearish patterns.
Pattern Name Occurrence Count
Number of Next-Day
Increases/Number
of Occurrences
Number of Next-Day
Decreases/Number
of Occurrences
Bullish pattern 1 13 0.92 0.08
Bullish pattern 2 17 0.65 0.35
Bullish pattern 3 14 0.57 0.43
Bullish pattern 4 8 0.625 0.375
Bearish pattern 1 18 0.39 0.61
Bearish pattern 2 13 0.23 0.77
Bearish pattern 3 10 0.30 0.70
Bearish pattern 4 11 0.36 0.64
4.3. Analysis of Pattern Profitability
The profitability of the patterns is shown in Table 7. When a bullish pattern appears,
we buy the stock at the opening price the next day and sell it at the closing price after
holding it for f days, with all stocks realizing positive returns. Conversely, when a bearish
pattern appears, the same operation is performed, but the returns on the stocks during the
holding period are negative.
Table 7. Profitability analysis of bullish/bearish patterns.
fBullish
Pattern 1
Bullish
Pattern 2
Bullish
Pattern 3
Bullish
Pattern 4
Bearish
Pattern 1
Bearish
Pattern 2
Bearish
Pattern 3
Bearish
Pattern 4
1 1.0% 1.3% 1.2% 1.8% −1.3% −2.1% −1.9% −1.5%
2 1.6% 1.1% 1.7% 1.6% −1.2% −1.8% −1.7% −1.6%
3 1.9% 0.9% 1.6% 1.7% −1.5% −1.8% −1.6% −1.3%
4 3.8% 1.4% 1.4% 2.4% −1.9% −1.7% −1.3% −1.2%
5 5.1% 1.1% 1.0% 4.3% −1.2% −2.2% −1.5% −1.8%
Although only a subset of patterns was verified in this study, their actual performance
in the concurrent data of Shanxi Fenjiu stock closely aligns with the expected results.
This indicates that the method proposed in this paper is highly applicable and reliable in
predicting short-term stock price movements. Through pattern selection and clustering,
the retained valid patterns can accurately determine the short-term direction of stock
price changes, providing strong support for subsequent market applications. The pattern
profitability analysis further confirms that the proposed model effectively distinguishes
between bullish and bearish patterns, offering clear buy and sell signals for investors and
significantly enhancing the reliability and profitability of trading strategies.
5. Conclusions
In previous studies, candlestick charts have often been used for predicting stock
prices or market trends, typically relying on experts’ deep understanding and knowledge
of specific candlestick patterns. However, the unsupervised pattern detection method
used in this paper allows for the construction of an independent and complete pattern
knowledge base, enabling the development of an adaptive system for predicting the
next day’s price movements. This method can automatically identify potential important
Information 2024,15, 821 15 of 17
patterns from training data and can re-match patterns when the stock market changes,
providing flexibility to adapt to the complex variations in different stocks.
This research has significant theoretical implications. First, it enriches the theoretical
framework in the field of technical analysis of candlestick patterns by proposing a dual-
layer clustering model based on candlestick sequence similarity matching, overcoming
the limitations of traditional pattern definitions that rely on domain experts’ subjective
understanding. Secondly, the study provides a new perspective on combining candlestick
patterns with machine learning techniques, deepening the understanding of financial
market price behavior and pushing technical analysis toward a data-driven, intelligent
direction. Additionally, our findings validate the potential application of unsupervised
learning in financial time series analysis, providing theoretical support for exploring
automated pattern recognition in other market domains. Finally, the proposed model is
highly versatile, offering a reference for future financial technology research and expanding
the boundaries of candlestick pattern recognition methods.
The research also holds important practical significance. By constructing an automated
candlestick pattern recognition and prediction system, companies can efficiently identify
patterns with potential investment value without the need for extensive domain expert
involvement. This technology can be applied in quantitative trading platforms, assisting
in the formulation of dynamic trading strategies and improving the scientific accuracy
of trading decisions. Moreover, businesses can leverage the reliable buy and sell signals
provided by the model to optimize investment portfolios and reduce market risks. Espe-
cially in volatile market environments, this method can capture market trends in a timely
manner, enhance capital efficiency, and improve overall profitability. By integrating the
results of this research into existing financial analysis and trading systems, companies can
gain a competitive edge in the capital markets, achieving breakthroughs in both technology
and business.
The results indicate that the proposed candlestick pattern recognition system shows
certain advantages in terms of effectiveness and potential, though some limitations still
exist. For example: (1) Only a subset of patterns from the library was randomly selected for
predictive ability and profitability analysis, without covering all patterns comprehensively;
(2) Validation was only carried out on a single stock out-of-sample, lacking extensive
verification across multiple stocks; (3) Insufficient consideration of weights for body and
shadow in patterns like the doji could have impacted the model’s accuracy. Future research
can expand and deepen in the following areas: (1) Broadening the validation scope to
test more stocks and verify the effectiveness of other patterns in the pattern library; (2) In-
vestigating how different weight combinations affect model performance to optimize it
further; (3) Combining machine learning methods with candlestick pattern recognition,
utilizing technologies such as deep learning or reinforcement learning to improve pattern
recognition accuracy and the model’s adaptability, better responding to changes in various
market conditions.
Author Contributions: Conceptualization, X.L.; Data curation, X.L.; Formal analysis, X.L.; Funding
acquisition, H.L.; Investigation, X.L.; Methodology, X.L.; Project administration, X.L.; Resources,
X.L.; Software, X.L.; Supervision, X.L.; Validation, X.L.; Visualization, X.L.; Writing—original draft,
X.L.; Writing—review and editing, X.L., Q.L., Y.H. and H.L. All authors have read and agreed to the
published version of the manuscript.
Funding: The work was supported by the Humanity and Social Science Foundation of Ministry
of Education of China (No. 18YJA630037, 21YJA630054). Zhejiang Province Soft Science Research
Program Project (No. 2024C350470).
Data Availability Statement: The data in this paper are available from the website netease (https:
//finance.sina.com.cn/).
Conflicts of Interest: Xinglong Li, Qingyang Liu, Yanrong Hu and Hongjiu Liu declare that there is
no conflicts of interests regarding the publication of our paper “The Double-Layer clustering k-line
pattern recognition based on similarity matching”.
Information 2024,15, 821 16 of 17
References
1. Fama, E.F.; French, K.R. The Cross-Section of Expected Stock Returns. J. Financ. 1992,47, 427–465.
2.
Lintner, J. The Valuation of Risk Assets and the Selection of Risky Investments in Stock Portfolios and Capital Budgets. In
Stochastic Optimization Models in Finance; Elsevier: Amsterdam, The Netherlands, 1975; pp. 131–155.
3. Sharpe, W.F. Capital Asset Prices: A Theory of Market Equilibrium under Conditions of Risk. J. Financ. 1964,19, 425–442.
4. Mossin, J. Equilibrium in a Capital Asset Market. Econom. J. Econom. Soc. 1966, 768–783. [CrossRef]
5.
Marshall, B.R.; Cahan, R.H.; Cahan, J.M. Does Intraday Technical Analysis in the US Equity Market Have Value? J. Empir. Financ.
2008,15, 199–210. [CrossRef]
6. Jönsson, M.; Jönsson, M. The Predictive Power of Candlestick Patterns. Math. Financ. 2016,5, 181–205.
7.
Stasiak, M.D. Candlestick—The Main Mistake of Economy Research in High Frequency Markets. Int. J. Financ. Stud. 2020,8, 59.
[CrossRef]
8.
Cagliero, L.; Fior, J.; Garza, P. Shortlisting Machine Learning-Based Stock Trading Recommendations Using Candlestick Pattern
Recognition. Expert Syst. Appl. 2023,216, 119493. [CrossRef]
9.
Lu, T.-H.; Shiu, Y.-M.; Liu, T.-C. Profitable Candlestick Trading Strategies—The Evidence from a New Perspective. Rev. Financ.
Econ. 2012,21, 63–68. [CrossRef]
10.
Lu, T.-H.; Chen, Y.-C.; Hsu, Y.-C. Trend Definition or Holding Strategy: What Determines the Profitability of Candlestick Charting?
J. Bank. Financ. 2015,61, 172–183. [CrossRef]
11.
Heinz, A.; Jamaloodeen, M.; Saxena, A.; Pollacia, L. Bullish and Bearish Engulfing Japanese Candlestick Patterns: A Statistical
Analysis on the S&P 500 Index. Q. Rev. Econ. Financ. 2021,79, 221–244. [CrossRef]
12.
Cohen, G. Optimizing Candlesticks Patterns for Bitcoin’s Trading Systems. Rev. Quant. Financ. Account. 2021,57, 1155–1167.
[CrossRef]
13.
Chen, S.; Bao, S.; Zhou, Y. The Predictive Power of Japanese Candlestick Charting in Chinese Stock Market. Phys. Stat. Mech. Its
Appl. 2016,457, 148–165. [CrossRef]
14. Murphy, J. Technical Analysis on the Financial Markets; New York Institute of Finance: New York, NY, USA, 1999.
15.
Jasemi, M.; Kimiagari, A.M.; Memariani, A. A Modern Neural Network Model to Do Stock Market Timing on the Basis of the
Ancient Investment Technique of Japanese Candlestick. Expert Syst. Appl. 2011,38, 3884–3890. [CrossRef]
16.
Marszałek, A.; Burczy´nski, T. Modeling and Forecasting Financial Time Series with Ordered Fuzzy Candlesticks. Inf. Sci. 2014,
273, 144–155. [CrossRef]
17.
Ahmadi, E.; Jasemi, M.; Monplaisir, L.; Nabavi, M.A.; Mahmoodi, A.; Jam, P.A. New Efficient Hybrid Candlestick Technical
Analysis Model for Stock Market Timing on the Basis of the Support Vector Machine and Heuristic Algorithms of Imperialist
Competition and Genetic. Expert Syst. Appl. 2018,94, 21–31. [CrossRef]
18.
Mahmoodi, A.; Hashemi, L.; Jasemi, M.; Laliberté, J.; Millar, R.C.; Noshadi, H. A Novel Approach for Candlestick Technical
Analysis Using a Combination of the Support Vector Machine and Particle Swarm Optimization. Asian J. Econ. Bank. 2023,7, 2–24.
[CrossRef]
19.
Bustos, O.; Pomares-Quimbaya, A. Stock Market Movement Forecast: A Systematic Review. Expert Syst. Appl. 2020,156, 113464.
[CrossRef]
20. Goodfellow, I.; Bengio, Y.; Courville, A. Deep Learning; MIT Press: Cambridge, MA, USA, 2016.
21. Lu, T.-H.; Chen, J. Candlestick Charting in European Stock Markets. JASSA J. Secur. Inst. Aust. 2013,2, 20–25.
22.
Etschberger, S.; Fock, H.; Klein, C.; Zwergel, B. The Classification of Candlestick Charts: Laying the Foundation for Further Empirical
Research; Spiliopoulou, M., Kruse, R., Borgelt, C., Nürnberger, A., Gaul, W., Eds.; Springer: Berlin/Heidelberg, Germany, 2006;
pp. 526–533.
23.
Leon Lee, C.-H.; Liu, A. Applying Fuzzy Candlestick Pattern Ontology to Investment Knowledge Management. J. Internet Technol.
2008,9, 307–315.
24.
Roy, P.; Kumar, D.; Sharma, D. Fuzzy Candlestick Based Stock Market Trading System Using Hammer Pattern. Am. Int. J. Res. Sci.
Technol. Eng. Math. 2014,1, 6–10.
25.
Vásquez, M.L.; González Osorio, F.A.; Hernández Losada, D.F. Mining Candlesticks Patterns on Stock Series: A Fuzzy Logic Approach;
Huang, R., Yang, Q., Pei, J., Gama, J., Meng, X., Li, X., Eds.; Springer: Berlin/Heidelberg, Germany, 2009; pp. 661–670.
26.
Chen, W.; Lee, C.; Liu, A. Pattern Discovery of Fuzzy Time Series for Financial Prediction. IEEE Trans. Knowl. Amp Data Eng. 2006,
18, 613–625. [CrossRef]
27.
Arévalo, R.; García, J.; Guijarro, F.; Peris, A. A Dynamic Trading Rule Based on Filtered Flag Pattern Recognition for Stock Market
Price Forecasting. Expert Syst. Appl. 2017,81, 177–192. [CrossRef]
28.
Cervelló-Royo, R.; Guijarro, F.; Michniuk, K. Stock Market Trading Rule Based on Pattern Recognition and Technical Analysis:
Forecasting the DJIA Index with Intraday Data. Expert Syst. Appl. 2015,42, 5963–5975. [CrossRef]
29.
Martiny, K. Unsupervised Discovery of Significant Candlestick Patterns for Forecasting Security Price Movements. In Proceedings
of the International Conference on Knowledge Discovery and Information Retrieval, Barcelona, Spain, 4–7 October 2012.
30.
Tao, L.; Hao, Y.T.; Hao, Y.J.; Shen, C.F. K-Line Patterns’ Predictive Power Analysis Using the Methods of Similarity Match and
Clustering. Math. Probl. Eng. 2017,2017, 3096917. [CrossRef]
31.
Quan, Z.Y. Stock Prediction by Searching Similar Candlestick Charts. In Proceedings of the 2013 IEEE 29th International
Conference on Data Engineering Workshops (ICDEW), Brisbane, QLD, Australia, 8 April 2013; pp. 322–325.
Information 2024,15, 821 17 of 17
32.
Zhu, B.; Niu, F. Investor Sentiment, Accounting Information and Stock Price: Evidence from China. Pac.-Basin Financ. J. 2016,38,
125–134. [CrossRef]
33.
Nison, S. Japanese Candlestick Charting Techniques: A Contemporary Guide to the Ancient Investment Techniques of the Far East; Penguin:
London, UK, 2001; ISBN 0-7352-0181-1.
Disclaimer/Publisher’s Note: The statements, opinions and data contained in all publications are solely those of the individual
author(s) and contributor(s) and not of MDPI and/or the editor(s). MDPI and/or the editor(s) disclaim responsibility for any injury to
people or property resulting from any ideas, methods, instructions or products referred to in the content.