Uncorking Rural Potential: Wine Tourism and Local Development in Nemea, Greece PDF Free Download
1 / 28/28
100%

Academic Editors: Camelia
Teodorescu, Ana-Irina Lequeux-Dinc˘a
and Florentina-Cristina Merciu
Received: 27 July 2025
Revised: 15 September 2025
Accepted: 22 September 2025
Published: 1 October 2025
Citation: Liontakis, A., & Bogdani, E.
(2025). Uncorking Rural Potential:
Wine Tourism and Local Development
in Nemea, Greece. Economies,13(10),
287. https://doi.org/10.3390/
economies13100287
Copyright: © 2025 by the authors.
Licensee MDPI, Basel, Switzerland.
This article is an open access article
distributed under the terms and
conditions of the Creative Commons
Attribution (CC BY) license
(https://creativecommons.org/
licenses/by/4.0/).
Article
Uncorking Rural Potential: Wine Tourism and Local
Development in Nemea, Greece
Angelos Liontakis * and Elona Bogdani
Department of Agribusiness and Supply Chain Management, Agricultural University of Athens,
32200 Thiva, Greece; bogdanielona48@gmail.com
*Correspondence: aliontakis@aua.gr
Abstract
This study investigates the economic role of wine tourism in Nemea, Greece, a promi-
nent Protected Designation of Origin (PDO) wine-producing region. Employing a mixed-
methods approach, the research combines interviews with local stakeholders and a struc-
tured post-wine-tasting visitor survey to assess wine tourism’s contribution to local de-
velopment. A two-step multivariate analysis, incorporating Multiple Correspondence
Analysis and Hierarchical Cluster Analysis, reveals five distinct visitor profiles differing
in spending behaviour, familiarity with the destination, and engagement patterns. While
high-spending visitors support winery revenues, their limited local integration reduces
their broader developmental impact. Conversely, younger and repeat domestic visitors
offer more dispersed economic benefits through overnight stays, gastronomy, and cultural
participation. In addition, local stakeholders highlight the region’s viticultural identity
and growing tourism interest as strengths but also note persistent weaknesses such as
inadequate infrastructure, limited coordination, and underdeveloped visitor services. The
study concludes that visitor segmentation offers actionable insights for enhancing wine
tourism’s developmental role. Targeted strategies tailored to specific visitor types are
essential for improving integration with the local economy. These findings contribute to
ongoing discussions on how wine tourism can act as a lever for inclusive, sustainable rural
development in traditional wine regions.
Keywords: wine tourism; rural economy; visitor segmentation; sustainable development;
tourism strategies; regional branding; Multiple Correspondence Analysis; Hierarchical
Cluster Analysis
1. Introduction
Wine tourism, also referred to as oenotourism, can be defined as visitation to vineyards,
wineries, wine festivals and wine shows for which wine tasting and/or experiencing the
attributes of a wine region are the primary motivating factors for visitors (Hall et al.,2000,
p. 3). In line with this, Byrd et al. (2016) highlight the focus on unique and immersive
experiences, such as cellar-door visits, tastings, vineyard walks, and participation in wine-
related events. Building on these perspectives, Alebaki and Ioannides (2017) emphasise
the visitor-centred understanding of wine tourism as a multifaceted experience shaped
not only by the wine product itself but also by the destination’s natural, cultural, and
social attributes.
Moreover, wine tourism can foster synergies across sectors by linking wine produc-
tion with gastronomy, retail, and cultural heritage, while promoting the conservation
Economies 2025,13, 287 https://doi.org/10.3390/economies13100287

Economies 2025,13, 287 2 of 28
of natural and intangible resources, as emphasised in the Georgia Declaration on Wine
Tourism (UNWTO,2016). In this sense, beyond being an experiential form of rural and
cultural tourism, it can act as a pathway toward sustainable development by integrating
environmental stewardship, heritage preservation, and inclusive local economic benefits
(UNWTO,2016;Montella,2017;Sharpley,2020). It can thus serve as a strategic tool for rural
development, contributing to economic diversification, place branding, and sustainability
(Martínez-Falcó et al.,2024). This role is especially relevant in traditional wine-producing
regions, where viticulture is embedded in cultural heritage and regional identity. As
such, wine tourism reinforces the link between production and place-based identity while
generating spillover benefits for local economies, making it a central component of rural
development strategies.
Research from Mediterranean Europe highlights that wine tourism initiatives often
generate measurable economic impacts across related sectors, particularly gastronomy
and hospitality (Croce & Perri,2017;López-Guzmán et al.,2011;Alebaki & Ioannides,
2017;Alebaki et al.,2020;Vazquez Vicente et al.,2021;Martínez-Falcó et al.,2024). This is
also revealed in Asociación Española de Ciudades del Vino (ACEVIN) report (ACEVIN,
2024), according to which 2023 visits to wineries and museums generated over €102 mil-
lion, whereas non-direct expenditures may triple this amount. Moreover, national as-
sessments in Australia show that the combined sector of wine, including wine tourism,
delivered A$40.2 billion to GDP and supported about 170,000 jobs, with wine-tourism
alone accounting for A$9.2 billion, thus demonstrating powerful rural multiplier outcomes
(Gillespie & Clarke,2019).
Despite its potential, the implementation of wine tourism faces significant barriers.
Correia and Brito (2016) highlight that many wine producers fail to recognise tourism
as a value-adding enterprise because they lack understanding of core tourism principles,
hampering the integration of wine and tourism networks. Research by López-Guzmán et al.
(2014) and Getz and Carlsen (2005) highlights that limited knowledge of tourism manage-
ment and inadequate training often hinder the ability of wineries to deliver high-quality,
visitor-oriented experiences. Finally, governance and infrastructure deficits, especially
in emerging regions, exacerbate these challenges by creating poorly signposted routes,
limited accommodations, and regulatory hurdles (Baggio,2008;Vos,2019). Together, these
structural, institutional, and educational deficiencies underline the need for comprehen-
sive planning, stakeholder collaboration, and capacity-building strategies to realise wine
tourism’s full potential.
In the case of Greece, initiatives such as wine routes have been introduced to enhance
the visibility of regional wines and offer visitors experiential opportunities, including win-
ery tours, tastings and participation in cultural activities (Tzimitra-Kalogianni et al.,1999).
These efforts aim to foster stakeholder collaboration, promote local products and diversify
rural economies (Gatti & Incerti,1997;Millán-Tudela et al.,2024). In addition, several re-
gions have established wine tourism networks and branding strategies through coordinated
efforts involving wineries, local authorities and tourism stakeholders
(Alebaki et al.,2020)
.
The role of wine tourism in rural development in Greece has gained attention, with
recent studies focusing on visitor motivation, supply side organisation, and territorial
branding (Alebaki & Ioannides,2017;Anastasiadis & Alebaki,2021). However, there is
still limited empirical research on how different visitor profiles contribute economically
at the local level and how this relates to the development goals in wine-producing areas.
This study addresses that gap by exploring the interlinkages between wine tourism and
wider local economic activities, aiming to assess its contribution to the local development of
Nemea, one of the Greece’s most prominent PDO red wine region. Wine tourism in Nemea,
while established, remains at an early stage of structured development and integration

Economies 2025,13, 287 3 of 28
with the broader tourism economy, especially when compared to other major European
wine regions (e.g., Tuscany, Bordeaux, or Rioja).
The present study draws on open-ended interviews with key stakeholders, a structured
post-visit questionnaire and a purposive scan of TripAdvisor reviews as supplementary
evidence to evaluate the impacts of wine tourism on local businesses and community
dynamics. In doing so, the study provides insights into how place-based tourism strategies
can foster sustainable rural development and support the long-term viability of winemak-
ing communities.
2. Methodology
This study employed a mixed-methods design to examine the contribution of wine
tourism to local development in Nemea (see Figure 1). The approach integrated qualitative
and quantitative components to enhance robustness and capture different dimensions of
the research scope. Specifically, three sources of evidence were combined: (i) open-ended
interviews with key local stakeholders to explore perceptions of wine tourism and devel-
opment challenges; (ii) a structured visitor survey analysed with multivariate statistical
techniques (MCA and cluster analysis) to identify behavioural patterns and visitor profiles;
and (iii) a purposive scan of TripAdvisor reviews, used solely as supplementary evidence
for triangulation, to check whether visitor perceptions echoed the themes emerging from
interviews and surveys.
Stakeholders Interviews
(Qualitative)
Visitors Survey
(Quantitative)
Stakeholders’ insights in five themes:
Socio-demographics, spending behaviour, per-
ceptions, satisfaction
Visitors Profiles
(MCA and cluster analysis)
Results
TripAdvisor purposive
scanning of reviews
Figure 1. Mixed-methods research workflow (triangulated design).
The integration of these three components ensures that results are not solely dependent
on one source of data. Instead, qualitative interviews provide depth and local context, the
survey offers structured evidence for statistical segmentation, and TripAdvisor reviews
extend the scope by reflecting spontaneous visitor experiences. This triangulation strategy is
particularly valuable given the relatively small survey sample. In addition, this triangulated
design is particularly appropriate for the Nemea context, where wine tourism still remains
at an early stage of development. Only a limited number of wineries are fully open to
visitors and are those most oriented toward wine tourism, having invested in tasting
facilities, guided tours, or limited lodging services. On the other hand, many other wine
producers in the region remain primarily focused on production and are not regularly open
to visitors.
Given the above fact, the survey was conducted in wineries that are accessible to the
public without prior arrangement. Although exact visitation shares across all wineries in
Nemea are not systematically reported, local stakeholders consistently highlighted that
five wineries are those that attract the vast majority of wine tourists. For this reason, they
effectively represent the main gateway to wine tourism experiences in the region.

Economies 2025,13, 287 4 of 28
2.1. Qualitative Analysis
Participants included two wine-tour guides working in wineries that are actively
engaged in wine tourism, the director of the Public Institute of Vocational Training (ELGO-
DIMITRA, Agricultural School of Nemea), the president of the Nemea PDO Winemakers
Association, the owner of a wine-focused restaurants in the municipality, and two managers
of local hotels. These actors were purposively selected to represent diverse positions across
the wine-tourism value chain and to reflect institutional, entrepreneurial, and service-
sector viewpoints.
Interviews followed a concise guide (see Appendix B) covering five themes: (i) regional
assets and constraints; (ii) winery readiness and service capacity; (iii) visitor profiles
and behaviours; (iv) linkages with gastronomy, accommodation, and cultural/heritage
offerings; and (v) policy, training, and governance needs. Additional stakeholder-specific
prompts were used to ensure relevance (e.g., winery readiness, hotel capacity, vocational
training), while all interviews covered the same core themes. Questions were open-ended
to allow participants to elaborate freely, while the guide ensured coverage of core topics
and comparability across interviews. Each interview lasted approximately 30–45 min and
was conducted in person during spring–early summer 2025. The material was analysed
thematically, combining deductive coding (see interview guide) with inductive coding to
capture emergent issues.
2.2. Quantitative Analysis: Multivariate Framework
The Multivariate Analysis utilised in this study targets to identify distinct groups
of visitors based on the questionnaires collected after their visitation to the wineries.
Firstly, a Multiple Correspondence Analysis (MCA) is conducted to reduce dimensionality
and identify latent behavioural patterns across responses to the survey questionnaires.
Secondly, a Cluster analysis (combination of Hierarchical Cluster Analysis (HCA) and
K-means clustering) is applied to the dimensions produced by the MCA aiming to classify
wine-tourists into distinct clusters. The use of this approach is well-suited to small but high-
dimensional categorical datasets, allowed for the robust identification of visitor profiles
and behavioural patterns.
The analysis is based on the outcomes of 50 structured questionnaires that were filled
by wine tourists in the five wineries that have, according to local stakeholders, among the
biggest visitations shares and are inside, or very close to the Nemea municipality. The
respondents completed the survey after their wine-tourism experience during the spring
and early summer of year 2025, while experienced interviewers were present to reply to
potential question and/or comments.
The questionnaire included items related to respondents’ socio-demographic charac-
teristics, their spending behaviour, their satisfaction levels, their previous wine tourism
experience, and their perception regarding their contribution to the local economy. More
specifically, the survey includes indicators such as daily expenditures, satisfaction rates,
and perceived local contributions are used to evaluate wine tourism’s role in rural develop-
ment (Millán-Tudela et al.,2024;Martínez-Falcó et al.,2024). Followed also Gillespie and
Clarke (2019), there are also questions to capture the main economic sectors affected by the
development of wine tourism. A frequency distribution of survey responses is shown in
Figure 2. The following chapters presents the two-step multivariate analytical framework
that is followed in this analysis.

Economies 2025,13, 287 5 of 28
*the summation of spending scores in all categories including spending scores (i) for gas, (ii) super-
market and (iii) other retail markets
Figure 2. Frequency of question responses.
2.2.1. Multiple Correspondence Analysis (MCA)
MCA is a statistical technique used to explore and visualise relationships among
several categorical variables (Greenacre,2017). MCA reduces the complexity of large
datasets by converting categorical data into numerical coordinates in a multidimensional
space. These coordinates define new dimensions (or axes) that capture the greatest variation
in the dataset, allowing for easier interpretation of the underlying structure and patterns
among variable categories. Each dimension produced by MCA explains a portion of the

Economies 2025,13, 287 6 of 28
overall inertia (i.e., variability), and the dimensions are ordered based on the amount of
variance they account for, which simplifies both the interpretation and visualisation of
the results (Husson et al.,2017). Given that the variables used in this analysis are mainly
measured on Likert scales, MCA is preferred over Principal Component Analysis (PCA), as
it is more appropriate for categorical data and avoids the metric assumptions required by
PCA (Abdi & Valentin,2007).
Mathematically, MCA begins by converting the categorical dataset into a binary in-
dicator matrix, where each category of each variable is represented as a separate column.
Formally, consider a dataset comprising
n
observations and
p
categorical variables. Each
categorical variable
j has kj
categories. The dataset is transformed into an
n×K
indicator
matrix
X
, where
K=∑p
j=1kj
. Each row in
X
corresponds to an observation, and each col-
umn corresponds to a specific category of a variable, with elements
xik =
1 if observation
i
belongs to category
k
, and 0 otherwise. From this matrix, MCA constructs a multidi-
mensional space and extracts underlying dimensions that summarise the associations and
patterns among the variable categories.
The MCA consists of the following steps (Greenacre,2017):
1.
Standardisation of the Indicator Matrix: The indicator matrix is centred and scaled to
produce matrix Zwhich is defined as:
Z=1
√np X−1nr⊤D−1/2
c(1)
where 1
n
is an
n
-dimensional vector of ones,
rand c
are the row and column marginals
(proportions), respectively, and Dcis the diagonal matrix of column sums.
2. Singular Value Decomposition (SVD): Perform the SVD on matrix Z:
Z=UΣV⊤(2)
where
Uand V
containing left and right singular vectors, respectively, and
Σ
is a
diagonal matrix of singular values.
3.
Determination of Dimensions: The principal dimensions are chosen based on the
largest singular values. The inertia (analogous to variance in PCA) explained by each
dimension is given by:
Inertia =∑σ2
l(3)
where
σl
are the l-th singular value of the matrix Z, represents the contribution of the
l-th dimension to the total inertia (i.e., the total variance explained).
4.
Coordinates Calculation: The coordinates of the observations (rows) and categories
(columns) in the reduced space are computed as:
F=UΣ(row coordinates), G =VΣ(column coordinates)(4)
5.
Interpretation and Visualisation: Observations and categories can then be plotted in
the reduced-dimensional space. The proximity of points in the scatterplot reflects
associations or similarities among observations and categories.
Table 1presents the specific variables incorporated in MCA.

Economies 2025,13, 287 7 of 28
Table 1. Variables incorporated in the MCA.
Categories Variables
Demographics
Gender (1: Man; 0: Woman)
Age class (1: 18–24; 2: 25–39; 3: 40–64; 4: >64)
Education (1: Primary & secondary; 2: University; 3: Master)
Nationality (1: Greek; 0: foreigner)
Income class (1: <1000, 2: 1000–1500; 3: 1500–2500; 4: >2500)
Tourism behaviour
First Visit in Nemea (1: Yes, 0: No)
Number of wineries visited (1: one, 2: two to three; 3: >three)
Days spent in Nemea
Spending patterns:
Spending money for buying in wineries (1: <5 €,2: 5–49 €;3: 50–99 €;4: 100–149 €;5: 150+ €)
Spending money for restaurants (1: <5 €,2: 5–49 €;3: 50–99 €;4: 100–149 €;5: 150+ €)
Spending money for hotels (1: <5 €,2: 5–49 €;3: 50–99 €;4: 100–149 €;5: 150+ €)
Spending money for café (1: <5 €,2: 5–49 €;3: 50–99 €;4: 100–149 €;5: 150+ €)
Total spending score, i.e., the summation of spending scores in all categories including
spending scores (i) for gas, (ii) super-market and (iii) other retail markets
Perceptions &
preferences:
Perceived contribution to local economy (1: not at all; 2: slight; 3: moderate, 4: High)
Rate of experience (from 1 to 5)
Plan to revisit (2: Yes, 1: maybe; 0: No)
2.2.2. Cluster Analysis: Hierarchical Cluster Analysis (HCA)/K-Means Clustering
HCA is a multivariate technique that groups observations according to their similarity
across multiple dimensions, aiming to maximise intra-cluster homogeneity and inter-cluster
heterogeneity. In this study, the HCA is applied to classify wine tourists based on the factor
scores obtained from the Multiple Correspondence Analysis (MCA).
The analysis employed Euclidean distance as the dissimilarity metric, and Ward’s
linkage method for agglomeration. Ward’s method minimises the total within-cluster
variance by selecting at each step the pair of clusters whose merger results in the smallest
possible increase in the total within-cluster sum of squares. Formally, for two clusters A
and B, the change in within-cluster inertia ∆W after merging is defined as:
∆W=(na×nβ)/(na+nβ)×∥xa˘xβ∥2(5)
where
∆
W is the increase in within-cluster inertia when merging two clusters; n
a
, n
β
: the
number of observations in clusters A and B, respectively;
xa
,
xβ
are the centroids (mean
vectors) of clusters A and B, respectively, and
∥xa˘xβ∥2
is the Squared Euclidean distance
between the two centroids. To determine the optimal number of clusters, the dendrogram
structure and the applied internal validation indices, including the Calinski–Harabasz and
Duda–Hart criteria are considered (Cali ´nski & Harabasz,1974;Duda et al.,2001;StataCorp,
2013). More specifically, the Calinski-Harabasz pseudo-F index and Duda/Hart Je(2)/Je(1)
index criteria, are calculated using STATA 13.0. For both criteria, larger values indicate
more distinct clustering. Presented with the Duda–Hart Je(2)/Je(1) values are pseudo-
T-squared values. Smaller pseudo-T-squared values indicate more distinct clustering
(StataCorp,2013).
Following the identification of the optimal number of clusters, K-means clustering is
performed using the predefined number of groups suggested by HCA. K-means is a widely
used partitioning technique that aims to minimise within-cluster variance by iteratively

Economies 2025,13, 287 8 of 28
optimising cluster assignments based on distance to cluster centroids (MacQueen,1967).
This approach combines the hierarchical structure detection of HCA with the refinement
and stability of K-means partitioning (Murtagh & Legendre,2011;Singh & Kaur,2013).
The algorithm operates initialising K centroids, here based on the results of Ward’s
hierarchical clustering, and then proceeds through by two consecutive steps; the assignment
step and the update step. During the former step, each observation is assigned to the cluster
whose centroid is closest, typically based on Euclidean distance. In the latter step, the
centroid of each cluster is recalculated as the mean of all observations currently assigned
to that cluster. These steps are repeated until convergence, typically defined as no further
changes in cluster membership or centroid positions. The objective function minimised by
K-means is the total within-cluster sum of squares (WCSS):
min ∑k=1K∑i∈Ck∥xi−µk∥2(6)
where
∑k=1K
: is the sum over clusters (from k = 1 to K);
∑i∈
C
k
is the sum over all observa-
tions i in cluster C
k
; x
i
is observation I;
µk
is the centroid of cluster k and
∥
x
i−µk∥2
is the
squared Euclidean distance between observation and its cluster centroid.
After the implementation of the cluster analysis, cross-tabulations, descriptive statis-
tics, and graphical techniques are used to characterise each cluster according to demo-
graphic, behavioural, and operational variables. This facilitated a clearer interpretation of
each group’s defining features and provided actionable insights into the heterogeneity of
wine tourist profiles.
2.3. Triangulation with Online Visitor Reviews (TripAdvisor)
A purposive scan of TripAdvisor reviews related to winery visits in Nemea was
undertaken as supplementary evidence for triangulation. Reviews posted within the two
years before fieldwork were screened. Only substantive written comments were included
and ratings-only entries were excluded. A simple thematic validation frame was used to
code comments against service quality, infrastructure and accessibility, accommodation
and gastronomy, authenticity and atmosphere, and overall satisfaction and loyalty. The
reviews were used only to test convergence with interview and survey findings and were
not used in the multivariate modelling.
This use of a third source follows well established guidance on triangulation, which
seeks convergence across independent strands to enhance credibility rather than to give
equal analytical weight to every source, as discussed by Decrop (1999) in tourism methods
and recently by Pagliara et al. (2025). Treating online reviews as qualitative material is
consistent with netnography (see e.g., Thanh & Kirova,2018;Papadopoulou & Alebaki,
2022;Kozinets & Gretzel,2024) and with applications that analyse TripAdvisor content as
contextual evidence rather than model inputs, for example Mkono and Tribe (2017).
The supplementary use of TripAdvisor reviews is relevant in the case of Nemea, as
they provide triangulation and reflect the experiences of a wider set of visitors, including
international tourists who may not have been represented in the survey. A coding matrix
with representative categories and excerpts from reviews is provided in Appendix C.
2.4. The Area of Nemea
One of the most prominent wine-producing areas in Greece is Nemea. It stretches
across approximately 2100 hectares within 17 villages in the northeast Peloponnese, span-
ning the southern part of Corinthia and a small segment of Argolida at elevations between
200 and 850 m (see Figures 3and 4). The region is closely associated with the Agiorgitiko
grape variety, primarily cultivated within the Nemea Protected Designation of Origin

Economies 2025,13, 287 9 of 28
(PDO), which holds both economic and oenological significance for the Greek red wine
sector (Miliordos et al.,2024;Kazou et al.,2023).
Figure 3. Map of PDO wines in Greece and location of Nemea. Source: https://vineyards.com/
photos/maps/Greece%20Wine%20Map.png, accessed on 16 July 2025.
Figure 4. Map of the wine-zone altitude in Nemea. Source: https://nemeawineland.com/wp
-content/uploads/2024/06/Nemea
_
ElevationMapFinal-sm-1024x724.jpg, accessed on: 16 July 2025.
Within this physically diverse landscape, approximately forty wineries operate, com-
prising large modern estates, alongside small family-run cellars. Besides the predominance
Economies 2025,13, 287 10 of 28
of Agiorgitiko, wineries conduct altitude-informed sub-zone production, ranging from
pale, fresh rosés to robust age-worthy reds. Nemea is also the base of a Public Institute of
Vocational Training for viticulture. Located at the heart of the region’s viticultural zone, the
institute offers specialised education in viticulture and oenology, playing a strategic role in
building local capacity and supporting the modernization of the wine sector.
3. Results
3.1. Open Interviews with Local Stakeholders
Open-ended interviews with local stakeholders revealed a multidimensional perspec-
tive on wine tourism in Nemea. While participants acknowledged numerous constraints,
they also highlighted important assets underpinning the region’s potential as a wine
tourism destination. One of the wine-tour guides emphasised that: “tourism is still seen
by many producers as secondary to winemaking.” Similarly, according to the hotel manager
that participated in the survey: “
. . .
until recently, the accommodation options in town were
limited, something that limited their willingness to extend their stay.” At the same time, several
encouraging developments were highlighted. A wine-tour guide also stressed that “events
like the Great Days of Nemea really help us showcase our wines and attract new visitors who
might not have considered the region otherwise.” The PDO Association president observed that
“Nemea’s PDO status gives us a strong identity, Agiorgitiko is a brand in itself, and this recognition
is a real advantage for wine tourism.” Finally, one of the hotel managers that was interviewed
added a forward-looking note: “we notice more visitors are staying overnight compared to a few
years ago, a promising sign that the region’s potential is gradually being realized.”
Stakeholders consistently underscored endogenous strengths that position Nemea
well for wine tourism growth. For example, one of the wine-tour guides points out that
“younger staff trained locally are more open to welcoming visitors”. Proximity to Athens was also
highlighted as a major advantage. One of the hotel managers states: “less than two hours
from the capital makes it ideal for weekend escapes.”
Interviewees also identified structural constraints that limit performance and visitor
integration. Infrastructure was the most persistent issue, e.g. “the appearance of the town
itself does not reflect the quality of the vineyards,” and “Nemea feels underdeveloped compared to
the landscapes around it.” The restaurant owner also echoed the concerns about the urban
environment: “The town looks uninviting; even if the wines are excellent, visitors leave with the
impression that Nemea itself does not match the quality of its vineyards.”
Several participants also emphasised fragmentation across HORECA and wine actors:
“everyone invests individually, but without a shared strategy we lose opportunities.” Beyond infras-
tructure, stakeholders pointed to an insufficient tourism mindset. As one of them explained:
“many producers still see tourism as a distraction, not as a core part of their business model,” and
linked this to “a lack of trained staff for storytelling and hospitality.” The vocational training
director emphasised the role of education in shifting this mindset: “Without structured
training in hospitality and tourism, we cannot expect consistent quality of wine tourism experience;
training is essential for professionalising services.” This perspective aligns with the view that
“younger generations of winemakers need to embrace wine tourism as an important part of wineries’
activities,” highlighting that professional training and a cultural shift among new entrants
to the sector are both necessary for wine tourism sector to be sustainably developed.
Market-level issues were also highlighted, especially seasonality: “international tourists
arrive but find few wineries open, which discourages them from staying longer.” The limited inte-
gration of archaeological and cultural heritage was viewed as another missed opportunity.
One interviewee said, “we have the ancient stadium and the sanctuary of Zeus just next door,
yet most tours ignore them, this is a wasted synergy.” However, as a hotel manager observed:
“seasonality in tourist arrivals has recently shown diminishing signs”, and encouraging change,

Economies 2025,13, 287 11 of 28
indicative of untapped potential for further growth and diversification of wine tourism
throughout the year.
Taken together, the interviews highlighted both assets and constraints. Stakeholders
pointed to Nemea’s PDO identity, its proximity to Athens, seasonal anchor events and the
presence of a vocational training institute as important strengths, while also underlining
enduring weaknesses such as inadequate infrastructure, fragmented investment, a lim-
ited tourism culture, weak links with cultural heritage and modest international visibility.
Overall, these findings depict a sector at a crossroads: strong assets coexist with persistent
barriers, leaving wine tourism underdeveloped and fragmented. As a stakeholder sum-
marised, “the potential is here, but unless we organise ourselves better, Nemea will never be much
more than a day-trip stop.”
3.2. Multivariate Analysis
3.2.1. MCA
The results of the MCA are provided in Figures 5–8and in Table 2, while the statistics
for each dimension are provided in detail in Appendix A. According to Figure 5, the first
five dimensions (above the red line) account for a cumulative 60.15% of the total inertia
which exceeds commonly accepted thresholds in social science studies (e.g., Sulewski
et al.,2018;Guédé & Koffi,2019), and strikes an appropriate balance between analytical
depth and parsimony for subsequent clustering and interpretation (e.g., Husson et al.,2017;
Greenacre,2017). Especially in case of MCA studies in social sciences, it is common to
retain dimensions until approximately 60% of variance is explained, because variance is
typically more evenly spread across dimensions compared to PCA (Hjellbrekke,2018). The
6th dimension, while still interpretable, only contributes 4.12%, and its marginal increase in
explained variance does not outweigh the loss in clarity and complexity it would introduce
to subsequent cluster analysis or interpretation. Furthermore, there is a clear drop in the
contribution to explained inertia after the fifth dimension. Using 5 dimensions instead of 6
also improves the performance and stability of the subsequent cluster analysis, especially
with the relatively small sample n= 50. In general, the more dimensions used, the more the
risk of overfitting or artificial segmentation.
Figure 5. Results of the MCA (STATA print screen).

Economies 2025,13, 287 12 of 28
Figure 6. Graphical Abstract of MCA dimensions.
Figure 7. MCA coordination Plot for the two most important dimensions (dimensions 1 and 2)
(STATA print screen).

Economies 2025,13, 287 13 of 28
Figure 8. MCA dimension projection plot (STATA print screen).
Table 2. Summary table of the dimensions.
Dimension % Inertia Suggested Name Key Contrasts Interpretive Insight
Dim 1 21.11% Overall Economic
Engagement
High-spending, multiday
tourists vs. low-spending,
short-stay/day-trippers
Distinguishes high-value
visitors with greater local
economic contribution
Dim 2 17.55% Visitor Type & Familiarity
Repeat, engaged visitors vs.
first-time,
low-engagement tourists
Captures depth of visitor
experience and future
return potential
Dim 3 9.28% Demographic &
Educational Profile
Older, affluent, highly
educated vs. younger, less
affluent and less educated
Reveals socioeconomic
diversity and orientation
toward premium
experiences
Dim 4 7.81% Spending Orientation
(Gastronomy vs. Winery)
Food- and café-oriented
visitors vs. winery-focused
spenders
Indicates variation in visitor
priorities and preferred
types of experiences
Dim 5 4.40% Tour Structure (Overnight
vs. Local)
Hotel-using, multiday
tourists vs. day-trippers or
local participants
Reflects logistical and
infrastructural engagement
with the destination
Note: Although the MCA extracted up to 15 dimensions, only the first five were retained for analysis, as they
explain 60.15% of the total inertia. Dimensions beyond the fifth contributed only marginally and were excluded to
ensure clarity and parsimony.
Ultimately, based on the cumulative explained variance, interpretability, and dimin-
ishing marginal inertia contributions beyond the fifth dimension, five MCA dimensions

Economies 2025,13, 287 14 of 28
were retained. Below there is a presentation of the five dimensions (see also Figure 6and
Table 2).
•
Dimension 1: Overall Economic Engagement (21.11% of inertia explained). This is
the most impactful dimension in terms of inertia explained. It captures the contrast
between economically impactful visitors and more modest or passive tourists. High
scorers on this axis are characterised by significant expenditures across multiple cate-
gories, particularly wineries, restaurants, and hotels, and longer stays, often exceeding
two days. These individuals likely contribute the most to the local economy, not only
through direct purchases in wineries but also through their use of local services. At
the other end of the spectrum, low scorers tend to be day-trippers or budget-conscious
tourists, making minimal purchases and engaging with fewer tourism touchpoints.
Their economic footprint is relatively limited, even if their presence is valued from a
volume or awareness-building perspective. This dimension is crucial in distinguishing
high-value segments from low-intensity visitors, both of which play different but
complementary roles in the regional tourism ecosystem.
•
Dimension 2: Visitor Type and Familiarity (17.55% of inertia explained). The second
dimension, explaining 17.55% of the inertia, reflects visitor experience and relational
familiarity with Nemea as a wine tourism destination. Tourists with high scores on
this axis tend to be repeat visitors, often visiting multiple wineries and expressing
clear intentions to return. Their behaviour indicates both personal investment in
the destination and sustained interest in its wine-related offerings. In contrast, low
scorers are primarily first-time visitors, many of whom limit their exploration to a
single winery and do not plan a return trip in the near future. These visitors may
have arrived through broader tourism flows rather than a dedicated interest in wine.
This dimension therefore articulates a spectrum from loyal, targeted wine tourists to
casual or accidental participants, offering insight into how engagement evolves across
different types of visitors.
•
Dimension 3: Demographic and Educational Profile (9.28% of inertia explained). This
dimension explained a much lower but still significant portion of the inertia (9.28%).
It reveals clear demographical patterns in terms of age, income, and education level.
High scores are associated with older, highly educated, and affluent individuals,
typically those aged 40–64, holding postgraduate degrees, and reporting household
incomes above €2500. These visitors may exhibit preferences for more structured,
refined, or educational wine tourism experiences. On the lower end of the axis, tourists
tend to be younger (18–24), less formally educated, and within lower income brackets.
While still important to the tourism base, they may be less likely to engage with
premium offerings or complex narratives around terroir and wine production. This
axis thus captures the socioeconomic and cultural capital of visitors, which influences
both their motivations and the types of experiences they value.
•
Dimension 4: Spending Orientation—Gastronomy vs. Winery (7.81% of inertia ex-
plained). The fourth dimension differentiates visitors based on how they allocate their
spending during their visit. High scorers prioritise gastronomic experiences, spending
significantly in restaurants and cafes, often emphasising food and social interaction as
key components of their trip. By contrast, low scorers tend to focus their spending on
direct winery purchases, suggesting a more wine-driven orientation. These may be
individuals who are interested in building their personal wine collection or learning
about wine as a commodity, rather than as part of a wider cultural experience. This
dimension offers useful insight into visitor priorities, highlighting opportunities for
targeted promotion, e.g., food pairing events for high scorers, or cellar-door incentives
for low scorers.
Economies 2025,13, 287 15 of 28
•
Dimension 5: Tour Structure—Overnight vs. Local (4.40% of inertia explained). This
dimension contrasts the structure of a visitor’s trip, particularly whether they are
overnight guests or local/same-day visitors. High scorers report hotel spending and
longer stay, reflecting a more immersive travel model, often with time allocated to
additional cultural or leisure activities. Low scorers, on the other hand, are typically
day-trippers or residents of nearby areas, who may participate in winery tours without
engaging with the broader tourism infrastructure. Their presence is valuable for
volume, local brand awareness, and word-of-mouth, even if their per-visit impact
is limited. This dimension is essential for tourism planning, as it relates directly to
infrastructure usage, accommodation demand, and strategic investment needs.
The above findings are further justified by the MCA coordination Plot and the MCA
dimension projection plot (Figures 7and 8, respectively). The coordination plot (Figure 7)
displays the relationships among the categorical variables across dimensions 1 and 2,
the two primary dimensions, which together explain approximately 38.6% of the total
inertia (21.1% and 17.5%, respectively). The projection of categories in this space reveals
meaningful patterns in how visitors differ based on their demographics, behaviours, and
perceived impact on the local economy.
The MCA coordination plot articulates a spectrum: from committed, high-spending,
repeat wine tourists, to casual or first-time visitors with lower engagement. As is also
presented in the dimension description, the first dimension appears to capture variations
in economic engagement. Categories positioned on the positive end, such as higher income
classes, longer stays in Nemea, and increased spending in wineries and restaurants, suggest
a profile of visitors who are not only more wealthy but also more likely to make a substantial
contribution to the local economy. In contrast, the negative side of this axis is associated
with lower-income groups, minimal spending, and shorter visits, pointing to a segment of
tourists with limited economic impact.
The second dimension is more closely aligned with familiarity and purpose of visit.
Visitors who have previously travelled to Nemea or other Greek wine regions, and who
indicate a stronger intention to revisit, cluster on the upper end of this axis. This contrasts
with first-time visitors or those who view the experience more casually, who appear
on the lower end. This axis helps differentiate experienced, wine-motivated tourists
from accidental or leisure-driven participants with less direct engagement with wine as a
travel motivator.
The MCA dimension projection plot (Figure 8) offers a view of how each categorical
variable contributes across all five retained dimensions. Dimension 1 is strongly shaped
by income level, number of days spent in Nemea, and spending behaviours, reinforcing
its interpretation as a measure of economic involvement. Dimension 2 is defined largely
by variables such as first-time visitation and familiarity with other wine regions, further
validating its link to experiential orientation and touristic intentionality. Additional dimen-
sions, though accounting for smaller portions of inertia, capture more subtle differences.
For example, Dimension 3 appears to reflect demographic traits such as nationality and
gender, while Dimension 5 includes perceptions of local economic impact, suggesting a
latent awareness of tourism’s broader contribution.
Overall, the findings highlight the multidimensional nature of wine tourist profiles
in Nemea. Visitors differ not only in terms of how much they spend or how long they
stay, but also in their prior exposure to wine-related tourism and their intentions for future
engagement. Understanding these patterns can help inform strategies for segmenting
the wine tourism market and tailoring offers to different types of visitors, from loyal,
high-spending oenophiles to first-time, experience-seeking travellers.

Economies 2025,13, 287 16 of 28
3.2.2. HCA and K-Means
The dendrogram and the stopping rules used for this analysis are presented in
Figures 9and 10
. As the cluster analysis results indicate the optimal cluster numbers
appeared to be between 4 and 5 clusters, based on the Calinski/Harabasz pseudo-F index
and Duda/Hart Je(2)/Je(1) index criteria, respectively. This is also visually presented in the
cluster dendrogram (see Figure 10) where the two alternative cluster groups are presented.
The difference between the two results is based on the splitting or not of the one bigger
cluster in two groups. Indeed, Table 3presents the population per cluster in the four and
five-cluster solutions. The difference appears in the case of clusters 3 and 4 which are
grouped together in the 4-cluster solution. The optical appearance of the dendrogram,
support the adoption of the 5-clusters solution that keep the dissimilarity index low and
allow the formation of relatively more balanced (at least in terms of population) groups.
15 13.20
14 13.43
13 12.85
12 12.72
11 12.39
10 11.26
9 11.22
8 10.93
7 10.98
6 10.13
5 10.51
4 10.02
3 9.15
2 7.90
clusters pseudo-F
Number of Harabasz
Calinski/
15 0.0000 .
14 0.3638 6.99
13 0.4563 4.77
12 0.3988 7.54
11 0.0157 62.81
10 0.2845 5.03
9 0.5932 4.80
8 0.5596 7.87
7 0.5219 6.41
6 0.5336 3.50
5 0.5452 10.01
4 0.6833 9.73
3 0.6068 12.31
2 0.7548 8.77
1 0.8586 7.90
clusters Je(2)/Je(1) T-squared
Number of pseudo
Duda/Hart
Figure 9. Results of the Calinski/Harabasz and Duda/Hart criteria (STATA screenshot).
Figure 10. Dendrogram presenting the 4 and 5 cluster solutions, respectively.

Economies 2025,13, 287 17 of 28
Table 3. Populations of Four- vs. Five-clusters solution.
Five-Cluster
Four-cluster 1 2 3 4 5 Total
1 12 12
2 9 9
3 14 9 23
4 6 6
Total 12 9 14 9 6 50
Table 4present a summary of the clusters based on the average score per dimension
and a corresponding profile summary, while Table 5provides the results of a Kruskal- Wallis
test for the for equality of dimensions’ scores across clusters. The results of Table 5indicate
clearly statistically significant differences across clusters. Finally, Table 6summarises
the five identified clusters, based on their structural characteristics and their effect in
local economy.
Table 4. Average dimension scores per cluster.
Cluster
Overall
Economic
Engagement
(dim1)
Visitor Type &
Familiarity
(dim2)
Demographic
& Educational
Profile (dim3)
Spending
Orientation
(Gastronomy
vs. Winery)
(dim4)
Tour Structure
(Overnight vs.
Local) (dim5) Profile Summary
1−0.77 0.71 0.62 0.49 −0.46
Local Day-Trippers (24%):
Repeat visitors; short stays,
food-focused
2−0.33 0.68 −0.29 −1.38 0.56
Repeat Mid-Spenders (18%):
Repeat visitors focused on
wine purchases; moderate
income
3 0.79 0.16 −0.24 0.23 −0.43
High-Spend Short-Stay
Tourists (28%):
High-spending one-timers;
low overnight stay
4−0.14 −0.78 −1.17 0.68 0.65
Curious, Educated
Explorers (18%):
First-timers; younger; food &
experience-driven
5 0.40 −1.63 1.51 −0.48 0.10
International Premium
Tourists (12%)
Affluent, new visitors;
detached but valuable
Table 5. Results from Kruskal–Wallis tests for equality of dimensions’ scores across clusters.
Dimensions Kruskal–Wallis Average Rank Sum per Cluster Kruskal–Wallis, χ2Test and Associated
Probability
Clus_1 Clus_2 Clus_3 Clus_4 Clus_5 Chi-Squared (4 d.f.) Probability
Dimension 1 13.50 36.25 35.92 32.67 18.25 20.85 0.000
Dimension 2 21.22 35.33 22.56 7.22 33.67 28.29 0.000
Dimension 3 38.93 26.43 23.86 27.64 19.93 33.79 0.000
Dimension 4 24.44 13.11 5.00 36.33 36.22 24.21 0.000
Dimension 5 26.17 5.67 43.67 17.33 24.67 12.73 0.013

Economies 2025,13, 287 18 of 28
Table 6. Summary table of Cluster characteristics and effect in local economy.
Cluster Type/Naming Demographic Visit Duration Spending Focus Revisit
Intention
Economic
Impact
Cluster 1 Local Day-Trippers
Older, well
educated, likely
higher income
<1 day
Food-oriented,
limited
overnight stay
High Low
Cluster 2 Repeat
Mid-Spenders Mid-age, loyal ~2 days Winery purchases,
product-focused Moderate Medium
Cluster 3 High-Spend
Short-Stay Tourists Mixed, affluent <1 day Food, wine Low High
Cluster 4 Curious, younger
explorers
Younger, lower
income/education 1–2 days Wineries &
gastronomy High High
Cluster 5 International
Premium Tourists
Non-Greek,
affluent 2–3 days Winery-focused Low High
Cluster 1, Local Day-Trippers (24%), represents a group of repeat wine tourists who
are relatively familiar with the Nemea region. They score highly on Visitor Familiarity
(dim2 = 0.71) and show positive values on Demographic Profile (dim3 = 0.62), suggesting
they are well-educated, and likely more affluent. Their spending orientation is skewed
toward gastronomy (dim4 = 0.49), indicating interest in culinary experiences beyond just
wine. However, they report low overall economic engagement (dim1 =
−
0.77) and less
overnight stay behaviour (dim5 =
−
0.46), pointing to frequent short visits with moderate
economic impact to the local economy.
Cluster 2, Repeat Mid-Spenders (18%), also includes repeat visitors (dim2 = 0.68), but
unlike Cluster 1, they report higher engagement with accommodations (dim5 = 0.56). Their
scores on Demographic Profile and Economic Engagement are slightly negative, suggesting
middle-income or moderate-resource travellers. What sets this group apart is their strongly
negative value on Spending Orientation (dim4 =
−
1.38), indicating that they are highly
product-focused, i.e., they are primarily interested in wine purchases over food or broader
cultural offerings.
Cluster 3, High-Spend Short-Stay Tourists (28%), contains tourists with the highest
levels of Economic Engagement (dim1 = 0.79), suggesting significant spending across
multiple categories. They score negatively on Tour Structure (dim5 =
−
0.43), suggesting
more limited overnight stay behaviour, and their Demographic Profile (dim3 =
−
0.24)
suggests they are less affluent or younger. These may be high-spending one-off visitors
who travel for a special occasion or premium winery experience.
Cluster 4, Curious, Educated Explorers (18%), includes visitors who are clearly
first-timers (dim2 =
−
0.78) and are the most socioeconomically distinct from the rest
(
dim3 = −1.17
). Interestingly, they show relatively high values on Spending Orientation
(
dim4 = 0.68
) and Tour Structure (dim5 = 0.65), indicating that although new to wine
tourism and less affluent, they are willing to stay overnight and spend more on gastronomy
and experience-based services. This group may represent a valuable emerging segment of
younger, engaged explorers.
Finally, cluster 5, International Premium Tourists (12%), stands out for having the high-
est values on Demographic Profile (dim3 = 1.51), pointing to older, highly educated, and
affluent individuals. However, they score very low on Visitor Familiarity (
dim2 = −1.63
),
indicating a lack of previous contact with Nemea and weak intentions to return. Their
moderate scores on Economic Engagement (dim1 = 0.40) and other dimensions suggest
these may be more detached, event-driven tourists, i.e., high-value in one visit but not yet
committed to long-term engagement.

Economies 2025,13, 287 19 of 28
3.3. Triangulation with Online Visitor Reviews (TripAdvisor)
To triangulate interview and survey findings, we screened recent TripAdvisor reviews
of winery visits in Nemea. These reviews are supplementary evidence and were not used
in the MCA or clustering; they serve only to validate whether visitor perceptions converge
with stakeholder views and survey results.
The reviews largely echoed the same themes, showing a consistent pattern of positive
evaluations alongside recurring challenges. On the positive side, visitors consistently
praised wine quality and the distinctiveness of the PDO Agiorgitiko variety. One reviewer
described this as an “authentic PDO Agiorgitiko identity,” highlighting the role of local
grape varieties in shaping the experience. The vineyard landscapes and built environment
were also highly valued, with travellers praising the “vineyard views and traditional stone
cellars” that contributed to “a very authentic experience.” In addition, the professionalism
and hospitality of staff were frequently mentioned, with comments underscoring the
knowledge, friendliness and engaging style of guides. Reviewers also appreciated the
integration of food and wine, noting that cheese accompaniments and meals provided
alongside tastings enhanced the experience.
At the same time, several limitations appeared. Some visitors reported navigation
challenges and limited road signage. Others noted that accommodation options close to
Nemea can be thin. A minority of comments pointed to organisational issues at busy
times, such as tastings that felt rushed during harvest. In sum, the reviews indicate that
Nemea’s wine tourism offer is anchored in strong oenological and experiential resources,
notably the quality of PDO Agiorgitiko wines, the authenticity of vineyard settings and
the professionalism of staff, while future development is constrained by practical gaps in
accessibility, logistics and nearby accommodation.
Taken as triangulation, these online reviews reinforce the findings from interviews
and surveys: Nemea’s wine tourism is built on strong oenological and experiential assets
but constrained by persistent infrastructural and organisational weaknesses.
4. Discussion
The qualitative findings highlight a consistent set of strengths and weaknesses shaping
wine tourism development in Nemea. The core strengths are the Agiorgitiko PDO identity,
authentic vineyard landscapes and built heritage. These assets drive satisfaction and
explain why visitors speak about authenticity, scenery and the welcome they receive.
At the same time, the analysis pointed to persistent weaknesses in infrastructure and
service provision. Many wineries are small-scale and lack dedicated hospitality infras-
tructure. These deficiencies restrict the capacity of the region to host and retain visitors.
Education and training initiatives are therefore essential for building a skilled workforce
and professionalising wine tourism services. The current variability in service quality
suggests that positive visitor experiences often depend on individual initiative rather than
a coordinated regional standard. Stakeholders also acknowledged that many wineries lack
the training, readiness, or inclination to deliver structured visitor services, which constrains
the potential for consistent destination branding. These gaps align with findings from
strategic assessments elsewhere and underline the relevance of the resilience benchmark-
ing framework proposed by Alebaki et al. (2020), which stresses flexibility, stakeholder
coordination, and service innovation as prerequisites for long-term viability.
Institutional and organisational constraints further limit the sector’s development.
Stakeholders underlined the lack of coordinated promotion, joint route development, and
bundled offers that integrate wine with gastronomy and culture. Seasonal events such as the
“Great Days of Nemea” generate short-term visitation peaks but fail to establish year-round
flows, leaving the sector dependent on a narrow seasonal window. Both stakeholders and
Economies 2025,13, 287 20 of 28
visitors highlighted the limited integration of wine tourism with Nemea’s archaeological
and cultural heritage. Therefore, despite being home to Greece’s most prominent red wine
and a well-established PDO, the region has not fully leveraged the coexistence of a strong
viticultural identity with significant cultural landmarks, including the ancient site of Nemea
with its sanctuary of Zeus and the Panhellenic games.
This underutilised synergy represents a strategic opportunity. Curated itineraries that
combine winery visits with guided tours of archaeological sites, joint ticketing schemes,
and co-branded events such as wine festivals in heritage venues could extend visitor stays
and strengthen the perception of Nemea as both a cultural and viticultural landscape.
Storytelling that links the symbolism of wine in ancient Greek rituals with modern PDO
production could further enrich the visitor experience, deepening both emotional attach-
ment and cultural appreciation. In practical terms, partnerships between wineries, cultural
authorities, and heritage organisations could facilitate cross-promotion, resource sharing,
and the design of multidimensional packages attractive to both domestic and international
markets. Compared with established international wine destinations such as Tuscany or
Bordeaux, Nemea lacks the governance structures, integrated branding, and international
visibility needed to translate these opportunities into long-term development.
Parallel to this qualitative framework, the MCA and Cluster analyses provides further
insights into how different visitor clusters contribute to the local economy. Cluster 3 (High-
Spend Short-Stay Tourists) shows the highest overall economic engagement, with broad
spending at the cellar door and ancillary services. Their trips are typically short and their
revisit propensity appears weaker than the repeat-oriented segments, which limits wider
spillovers beyond the winery. Their connection to the region appears transactional, as
they engage mainly with the wine rather than developing a deeper cultural attachment.
This highlights an important consideration: while Cluster 3 significantly supports winery
income, their effect on year-round local development (employment, hospitality sector
viability, off-season activity) remains constrained. Strategies aimed at deepening their
connection to the destination, such as exclusive events, branded experiences, or return
incentives, could increase their contribution beyond the cellar door.
In contrast, Cluster 1 (Local Day-Trippers) consists of repeat, well-educated visitors
who are loyal to the destination. They tend to make short visits with modest overall
spend and a food-leaning orientation, which limits their per-visit impact but supports
awareness and events. They are also more likely to promote the destination informally
through word-of-mouth and social circles. Although this group may not drive immediate
revenue, their long-term value lies in maintaining a stable base of visitors who keep local
businesses survive in off-peak periods and act as cultural ambassadors for the region. They
may also participate in community-based development, such as volunteering or returning
for educational events, making their role important for local engagement.
Cluster 4 (Curious, Educated Explorers) is composed largely of younger, first-time
visitors with moderate spending power. Despite their lower incomes, they exhibit notably
high engagement with local gastronomy and overnight stays, indicating a broader footprint
across the local economy. Their openness to experiences and longer staying, position them
as high-potential contributors to local development, particularly through the food service,
accommodation, and experiential tourism sectors. Investing in the “experience economy”
(e.g., wine-food pairings, local tours, workshops) tailored to this group could convert them
into loyal return visitors and encourage greater integration into the local tourism ecosystem.
Over time, they could become a foundation for sustainable growth, particularly if linked to
affordable tourism products and youth-focused branding.
Cluster 5 (International Premium Tourists) includes the most socioeconomically ad-
vantaged visitors, marked by high levels of education and income, with a spending pattern
Economies 2025,13, 287 21 of 28
that remains more winery-focused than gastronomy- or stay-led. Yet, they show limited
attachment to the region and low familiarity with its wines, suggesting that their visits may
be accidental, event-driven, or opportunistic. This group represents an untapped opportu-
nity for high-value engagement. If converted through personalised storytelling, cultural
interpretation, and premium offers, they could support boutique lodging, fine dining,
and export-oriented wine purchasing. Their spending capacity has clear implications for
economic diversification, supporting upscale services and job creation. However, without
strategic targeting, their impact will remain sporadic and peripheral to local development.
Leveraging this group requires more deliberate brand-building and integration with high-
end tourism circuits, possibly through international partnerships or cross-marketing with
heritage tourism.
Cluster 2 (Repeat Mid-Spenders) represents moderate economic engagement but
demonstrates valuable behavioural patterns: repeat visits, consistent use of local accommo-
dation and a product-focused spending pattern centred on cellar-door purchases while also
presents high interest in winery-based experiences. These traits make them ideal candidates
for loyalty-building programmes, wine club enrolment, and off-season travel incentives.
Their steady presence supports multiple local sectors (e.g., lodging, gastronomy, retail)
and may contribute to employment stability and income retention for small businesses.
From a development perspective, Cluster 2 can serve as a core group sustaining year-round
tourism activity, reducing the sector’s dependence on seasonal events.
Taken together, the segmentation confirms that wine tourism’s economic contribution
in Nemea does not strictly correlate with visit frequency or familiarity. Clusters 3 and 5 are
high spenders, but not necessarily loyal; Clusters 1 and 2 offer stability and brand reinforce-
ment, but differ in financial impact; and Cluster 4 presents long-term potential through
youth engagement and economic integration. These dynamics underline the importance
of designing differentiated destination strategies that follows established guidance that
destination development should be segment-driven and network-coordinated, leveraging
wine routes to integrate wineries with gastronomy, hospitality, and cultural assets (Dolnicar,
2020;Tkaczynski et al.,2009;Croce & Perri,2017;López-Guzmán et al.,2011).
To translate the cluster typology into implementable actions, the proposals are aligned
with segmentation-led destination planning and wine-route literature. Prior work shows
that segment-specific interventions and route coordination improve market fit and local
spillovers (Dolnicar,2020;Tkaczynski et al.,2009;Croce & Perri,2017;López-Guzmán et al.,
2011;OECD,2014). In addition, evidence from Spain indicates that coordinated wine-route
strategies strengthen regional growth and cross-sector linkages (Vazquez Vicente et al.,
2021;ACEVIN,2024), while sustainability frameworks emphasise designing offers that
connect wine, gastronomy, culture, and place identity (UNWTO,2016;Montella,2017;
Martínez-Falcó et al.,2024). Within this evidence base, our cluster-specific strategies are:
•
Clusters 3 and 5 (high-spend, low-loyalty): premium, export-friendly programmes
(private tastings, cellar allocations, limited releases), and curated cultural add-ons
to deepen attachment beyond the cellar door (Croce & Perri,2017;UNWTO,2016;
López-Guzmán et al.,2014).
•
Cluster 2 (repeat mid-spenders): loyalty schemes and route-based passes that bundle
accommodation, tastings, and gastronomy to drive off-season demand (Dolnicar,2020;
Vazquez Vicente et al.,2021;ACEVIN,2024).
•
Cluster 4 (younger, experience-oriented): affordable experiential products (food-
wine pairings, workshops, short trails) that enhance learning and local engagement
(UNWTO,2016;Montella,2017;Martínez-Falcó et al.,2024).
Economies 2025,13, 287 22 of 28
•
Cluster 1 (local day-trippers): event-led programming and urban-amenity upgrades
to sustain frequent short visits and strengthen place branding (OECD,2014;Baggio,
2008;Alebaki et al.,2020).
These actions are consistent with Greek evidence on wine route networking and
supply chain integration (Tzimitra-Kalogianni et al.,1999;Alebaki & Ioannides,2017;
Anastasiadis & Alebaki,2021) as well as Spanish experience, where coordinated wine route
management has generated measurable economic benefits (Vazquez Vicente et al.,2021;
ACEVIN,2024). Sustainability frameworks further emphasise designing experiences that
link wine with heritage and local identity to enhance both visitor value and community
benefits (UNWTO,2016;Montella,2017;Martínez-Falcó et al.,2024). By recognising these
distinctions and aligning wine tourism development efforts accordingly, local actors in
Nemea can amplify the sector’s contribution to inclusive, sustainable local development,
spanning employment, entrepreneurship, infrastructure use, and cultural vitality.
Survey responses also revealed that average daily expenditure per visitor remained
relatively modest, typically below €50, with spending distributed across wineries, restau-
rants, retail, and accommodation. While this supports a range of local enterprises, it falls
short of the levels observed in other destinations. Prior Greek studies confirm that wine
tourism has the potential to activate wider local value chains (Tzimitra-Kalogianni et al.,
1999), and recent research on the Greek wine supply chain underscores the interdependence
between wineries, hotels, gastronomy, and cultural services in co-delivering the tourism
experience (Anastasiadis & Alebaki,2021). The evidence suggests that wine tourism in
Nemea is embedded within a broader regional economic system rather than operating as
an isolated activity.
Despite high visitor satisfaction, which is consistent across both survey responses
and online reviews, challenges in infrastructure, training, and coordination remain major
barriers to competitiveness. Visitors valued the natural setting, hospitality, and perceived
authenticity, all of which are known drivers of competitiveness and loyalty in rural wine
tourism (Martínez-Falcó et al.,2024). Nevertheless, the sector remains fragmented, seasonal,
and underdeveloped, with significant scope for professionalisation and capacity building.
Importantly, the patterns identified through the survey and statistical analysis were
consistent with the qualitative insights from stakeholder interviews and online reviews.
No contradictions emerged across methods; instead, the triangulation of evidence con-
firmed overlapping strengths such as the PDO identity, gastronomy potential, and hos-
pitality, alongside weaknesses including infrastructure gaps, seasonal dependency, and
fragmented coordination.
5. Conclusions
This study examined the contribution of wine tourism to local development in Nemea,
Greece, using a mixed-methods design that combined stakeholder interviews and a visitor
survey, with online reviews used for triangulation. The findings confirm that wine tourism
already supports the local economy through visitor spending, spillovers to gastronomy,
hospitality and retail, and reinforcement of regional branding. However, its potential
remains underutilised due to fragmented promotion, infrastructural gaps and uneven
service provision.
Five visitor profiles were identified with different economic footprints and levels of
engagement. High-spending visitors primarily support wineries, while younger and repeat
domestic visitors spread expenditure more widely across sectors. In practice, develop-
mental impact depends not only on how much visitors spend but on how and where they
engage with the destination. To maximise that impact, destination strategy should be dif-
ferentiated by cluster, from cultivating loyalty among repeat domestic visitors to curating

Economies 2025,13, 287 23 of 28
premium offers for high-spending but less engaged segments. Unlocking this potential
also requires tackling structural constraints: improving infrastructure and wayfinding,
raising skills through professional training and shared service standards, and strengthening
coordination among wineries, local authorities and tourism operators.
Re-examining Nemea against international benchmarks such as Tuscany, Bordeaux and
Rioja provides context. Like these mature destinations, Nemea shows clear segmentation
in which high-spending tourists coexist with loyalty-driven repeat visitors, each offering
distinct economic and cultural value. Unlike its international counterparts, Nemea still
faces capacity gaps and limited coordination that hinder the translation of visitor diversity
into sustained local development. Aligning segmentation-led policies with investment in
infrastructure, professionalisation and cultural integration can move Nemea towards more
resilient, year-round models.
Future research should monitor seasonal variation in visitor behaviour and test
the effectiveness of targeted interventions. By aligning wine-tourism strategy with vis-
itor segmentation, Nemea can enhance inclusivity, extend stays, and generate broader
local benefits.
Author Contributions: Conceptualization, A.L. and E.B.; methodology, A.L.; software, A.L.; vali-
dation, A.L.; formal analysis, A.L.; investigation, A.L. and E.B.; data curation, A.L.; writing, A.L.;
visualisation, A.L.; supervision, A.L. All authors have read and agreed to the published version of
the manuscript.
Funding: This research received no external funding.
Institutional Review Board Statement: The study was approved by the Ethics Committee of Agri-
cultural University of Athens (Protocol No. 39/20.05.2025).
Informed Consent Statement: Informed consent was obtained from all subjects involved in the study.
Data Availability Statement: Dataset and questionnaire is available upon request.
Acknowledgments: Authors would like to thank the anonymous interviewees and the wineries
for their assistance during the field visits. During the preparation of this manuscript, the authors
used ChatGPT 4.0 for the purposes of review and revise the draft text as well as for the creation of
Figure 6. The authors have reviewed and edited the output and take full responsibility for the content
of this publication.
Conflicts of Interest: The authors declare no conflicts of interest.
Appendix A.
Table A1. Statistics for the Dimensions of the MCA Analysis.
Overall Dimension_1 Dimension_2 Dimension_3 Dimension_4 Dimension_5
mass
Quality
% inert
coord
Sq. corr
contrib
coord
Sq. corr
contrib
coord
sqcorr
contrib
coord
Sq. corr
contrib
coord
Sq. corr
contrib
gender
No 0.05 0.63 0.01 0.15 0.02
0.00
0.58
0.27
0.02
0.07
0.00
0.00
0.26
0.03
0.00
0.89
0.16
0.04
Yes 0.04 0.63 0.01 −
0.21
0.02
0.00
−
0.80 0.27
0.02 −
0.10
0.00
0.00
−
0.36 0.03
0.01 −
1.22
0.16
0.05
age class
18–24 0.02 0.73 0.03 −
0.86
0.12
0.02
1.58
0.33
0.05 −
0.20
0.00
0.00
−
2.16 0.28
0.09 −
0.09
0.00
0.00
25–39 0.04 0.66 0.02 0.70 0.26
0.02
0.52
0.12
0.01 −
0.71
0.12
0.02
0.86
0.15
0.03
0.00
0.00
0.00
40–64 0.02 0.75 0.04 −
0.46
0.03
0.01
−
2.25 0.59
0.12
1.39
0.12
0.05
0.37
0.01
0.00
0.08
0.00
0.00
education
Primary 0.01 0.70 0.02 −
1.70
0.29
0.03
0.36
0.01
0.00
1.04
0.05
0.01
2.81
0.30
0.08 −
0.05
0.00
0.00
Secondary 0.04 0.71 0.01 −
0.26
0.04
0.00
0.64
0.22
0.02 −
0.76
0.16
0.03
−
1.05 0.26
0.05 −
0.26
0.01
0.00
Tertiary 0.03 0.76 0.02 1.37 0.44
0.05
−
0.51 0.05
0.01
1.48
0.22
0.06
0.45
0.02
0.01
0.12
0.00
0.00
+MSc 0.01 0.64 0.03 −
1.21
0.05
0.01
−
3.71 0.40
0.07 −
2.91
0.13
0.04
1.19
0.02
0.01
1.78
0.02
0.02

Economies 2025,13, 287 24 of 28
Table A1. Cont.
Overall Dimension_1 Dimension_2 Dimension_3 Dimension_4 Dimension_5
nationality
Foreigner 0.03 0.77 0.02 0.10 0.00
0.00
−
1.74 0.70
0.09 0.27 0.01 0.00 −
0.39 0.02
0.00 −
0.12
0.00
0.00
Greek 0.06 0.77 0.01 −
0.05
0.00
0.00
0.90
0.70
0.04 −
0.14
0.01 0.00 0.20
0.02
0.00 0.06 0.00
0.00
Income level
800–999 0.03 0.76 0.02 −
0.81
0.16
0.02
1.33
0.37
0.05 0.31 0.01 0.00 −
1.45 0.19
0.06 0.77 0.03
0.02
1000–1499 0.03 0.70 0.02 1.08 0.36
0.03
0.59
0.09
0.01 0.69 0.07 0.01 1.04
0.12
0.03 −
0.71
0.03
0.01
1500–2499 0.01 0.49 0.01 0.40 0.02
0.00
0.02
0.00
0.00 −
1.14
0.08 0.01 0.19
0.00
0.00 −
2.15
0.13
0.04
2500 0.02 0.74 0.03 −
0.50
0.03
0.01
−
2.37 0.64
0.12 −
0.79
0.04 0.01 0.44
0.01
0.00 0.76 0.02
0.01
First visit in Nemea?
No 0.02 0.85 0.03 2.11 0.77
0.10
0.29
0.01
0.00 0.38 0.01 0.00 −
0.83 0.04
0.02 0.57 0.01
0.01
Yes 0.06 0.85 0.01 −
0.74
0.77
0.03
−
0.10 0.01
0.00 −
0.13
0.01 0.00 0.29
0.04
0.01 −
0.20
0.01
0.00
Visits to other wineries throughout Greece
No 0.03 0.76 0.03 −
1.66
0.62
0.08
−
0.14 0.00
0.00 0.53 0.03 0.01 −
0.41 0.01
0.01 1.01 0.05
0.03
Yes 0.05 0.76 0.02 0.93 0.62
0.05
0.08
0.00
0.00 −
0.30
0.03 0.01 0.23
0.01
0.00 −
0.57
0.05
0.02
Number of Wineries visited/planning to visit in Nemea during stay?
1 0.02 0.76 0.04 −
1.89
0.49
0.08
−
0.43 0.02
0.00 1.79 0.19 0.07 −
0.41 0.01
0.00 −
0.80
0.02
0.02
2–3 0.05 0.73 0.01 0.39 0.13
0.01
0.34
0.08
0.01 −
1.05
0.42 0.06 0.15
0.01
0.00 0.26 0.01
0.00
>3 0.01 0.74 0.03 3.52 0.55
0.08
−
1.24 0.06
0.01 2.17 0.09 0.03 0.21
0.00
0.00 0.72 0.01
0.00
Days in Nemea
0 0.03 0.73 0.03 −
0.77
0.14
0.02
1.34
0.36
0.05 0.93 0.09 0.02 0.89
0.07
0.02 −
1.02
0.05
0.03
1 0.03 0.68 0.02 0.34 0.05
0.00
−
0.79 0.21
0.02 −
1.36
0.33 0.05 0.72
0.08
0.02 −
0.33
0.01
0.00
2 0.01 0.49 0.02 0.45 0.03
0.00
−
0.75 0.07
0.01 0.49 0.02 0.00 −
1.27 0.09
0.02 1.41 0.06
0.02
3 0.01 0.57 0.03 2.95 0.45
0.06
0.54
0.01
0.00 0.81 0.02 0.00 −
1.90 0.07
0.02 −
0.87
0.01
0.01
4 0.01 0.52 0.02 −
1.12
0.06
0.01
0.51
0.01
0.00 1.03 0.02 0.01 −
2.54 0.12
0.03 4.66 0.23
0.11
5 0.00 0.46 0.02 −
2.24
0.08
0.01
−
3.86 0.21
0.03 0.99 0.01 0.00 −
4.02 0.10
0.03 −
3.95
0.05
0.03
6 0.00 0.50 0.02 −
2.02
0.06
0.01
−
4.00 0.21
0.03 −
3.32
0.08 0.02 0.76
0.00
0.00 6.50 0.14
0.07
€spend in wineries
<5 0.02 0.76 0.03 −
1.40
0.28
0.03
0.96
0.11
0.02 2.04 0.26 0.07 0.96
0.05
0.02 −
0.23
0.00
0.00
5–49 0.04 0.72 0.02 −
0.10
0.01
0.00
0.11
0.01
0.00 −
1.47
0.50 0.08 0.88
0.15
0.03 0.48 0.03
0.01
50–99 0.02 0.55 0.02 0.39 0.03
0.00
−
0.47 0.03
0.00 0.22 0.00 0.00 −
2.52 0.44
0.12 −
1.03
0.04
0.02
100–149 0.01 0.58 0.03 2.28 0.29
0.04
−
0.90 0.04
0.01 2.74 0.19 0.05 −
0.07 0.00
0.00 2.26 0.06
0.03
150 0.00 0.37 0.01 1.40 0.10
0.01
−
1.64 0.12
0.01 −
0.01
0.00 0.00 −
0.86 0.01
0.00 −
3.24
0.12
0.04
Total score for €spending in Nemea for HORECA and other retail services
6 0.01 0.66 0.02 −
2.24
0.29
0.03
1.45
0.10
0.01 1.84 0.09 0.02 1.06
0.02
0.01 −
0.95
0.01
0.01
7 0.01 0.39 0.01 −
0.94
0.14
0.01
−
0.07 0.00
0.00 −
0.60
0.03 0.00 0.65
0.03
0.00 −
1.72
0.10
0.03
9 0.01 0.38 0.02 −
0.05
0.00
0.00
−
1.89 0.14
0.02 −
0.44
0.00 0.00 −
2.17 0.09
0.02 −
3.39
0.12
0.06
10 0.02 0.70 0.02 0.25 0.01
0.00
1.47
0.28
0.03 0.94 0.06 0.01 2.26
0.29
0.08 −
0.67
0.02
0.01
11 0.01 0.33 0.01 0.55 0.05
0.00
1.08
0.15
0.01 0.04 0.00 0.00 −
0.87 0.04
0.01 1.11 0.04
0.01
12 0.01 0.54 0.02 −
0.10
0.00
0.00
−
2.23 0.49
0.06 0.31 0.01 0.00 0.12
0.00
0.00 0.27 0.00
0.00
13 0.01 0.45 0.01 0.86 0.07
0.01
0.82
0.05
0.00 −
0.84
0.03 0.01 −
2.04 0.15
0.03 −
1.74
0.06
0.02
14 0.01 0.53 0.02 0.25 0.01
0.00
−
0.40 0.01
0.00 −
2.23
0.17 0.04 1.91
0.10
0.03 1.71 0.05
0.02
15 0.01 0.57 0.02 −
1.63
0.26
0.02
−
0.37 0.01
0.00 −
1.38
0.08 0.02 −
1.80 0.12
0.03 2.06 0.09
0.04
17 0.00 0.56 0.03 4.87 0.34
0.04
−
2.22 0.06
0.01 4.11 0.11 0.03 −
2.28 0.03
0.01 −
2.16
0.01
0.01
18 0.00 0.63 0.03 4.77 0.31
0.04
−
2.36 0.06
0.01 5.52 0.18 0.05 0.13
0.00
0.00 4.47 0.06
0.03
20 0.00 0.54 0.02 0.56 0.01
0.00
2.67
0.11
0.01 −
0.31
0.00 0.00 −
6.17 0.26
0.06 4.99 0.10
0.04
Revisit plan
No 0.00 0.69 0.03 −
3.02
0.26
0.03
−
0.80 0.02
0.00 4.97 0.31 0.08 1.59
0.03
0.01 2.71 0.04
0.03
Maybe 0.03 0.54 0.02 −
0.78
0.18
0.02
−
0.76 0.14
0.01 −
0.46
0.03 0.01 −
0.62 0.04
0.01 −
1.52
0.14
0.06
Yes 0.06 0.64 0.01 0.54 0.36
0.02
0.39
0.16
0.01 −
0.09
0.01 0.00 0.19
0.02
0.00 0.53 0.07
0.02
Appendix B.
Semi-Structured Interview Guide: Wine Tourism and Local Development in Nemea
Purpose
Capture informed stakeholder perspectives on how wine tourism operates in Nemea,
its links to the local economy, current constraints, and practical strategies for improvement.
The guide ensures coverage of core themes while allowing open-ended elaboration.
Ethics and Consent Script
“Thank you for meeting with me. I’m researching wine tourism and local development
in Nemea. The interview will take about 30–45 min. Your participation is voluntary, and
you can skip any question or stop at any time. With your permission, I would like to take
brief notes/record audio to ensure accuracy. Your responses will be anonymized; only your
Economies 2025,13, 287 25 of 28
stakeholder role (e.g., wine-tour guide, hotel manager) will be reported. Do I have your
consent to proceed? May I record?”
Warm-up and Role Context
•Please describe your role and main responsibilities.
•How long have you been involved in the Nemea wine/visitor economy?
•What does a typical week/month look like in terms of visitor interaction?
Core Themes and Prompts
Use neutral probes such as “could you give an example?”, “what makes you say that?”,
“how typical is this?”
Theme 1. Regional assets and constraints
•What are Nemea’s main strengths as a wine tourism destination?
•What are the main constraints that limit performance or visitor satisfaction?
•How, if at all, have these changed in the past 2–3 years?
Theme 2. Winery readiness and service capacity
•
From your perspective, how prepared are wineries to host visitors (spaces, staffing,
languages, booking, pricing)?
Which services do visitors value most at the cellar door? Which are lacking?
Theme 3. Visitor profiles and behaviours
•
Who are the main types of visitors you see (domestic/international, first-time/repeat,
age/income ranges, group vs. independent)?
•
How do they typically spend their time and money (wineries, restaurants, cafés, hotels,
retail, culture)?
•What drives satisfaction or dissatisfaction?
Theme 4. Linkages and spillovers (gastronomy, accommodation, culture/heritage)
•
In what ways does wine tourism support other local sectors (restaurants, cafés, hotels,
retail, transport, guides)?
•
Are there existing or potential synergies with archaeological and cultural heritage in
the area?
•What bundleable experiences would work well here?
Theme 5. Infrastructure and accessibility
•
How adequate are signage, roads, parking, public amenities, and digital wayfinding
for independent travellers?
•What practical improvements would make the biggest difference?
Theme 6. Marketing, branding, and digital presence
•How effectively is Nemea’s PDO/Agiorgitiko identity communicated to visitors?
•What marketing channels or partnerships work best? What is missing?
Theme 7. Skills, training, and governance
•
Where are the main skills gaps (hospitality, languages, storytelling, digital book-
ing/CRM)?
•What role can the vocational training institute and other bodies play?
•How well do producers and local actors collaborate?
Theme 8. Strategies and priorities
•
Thinking of different visitor types (e.g., high-spend short-stay; repeat mid-spenders;
younger experience-seekers; local day-trippers; international premium), what targeted
actions would you prioritize for each?

Economies 2025,13, 287 26 of 28
•If you could implement three actions in the next 12 months, what would they be?
Closing
•Is there anything important I didn’t ask that you would like to add?
•May I contact you if I need to clarify a point?
Note
Depending on the stakeholder role (e.g., wine-tour guide, hotel manager, restaurant
owner, director of the Agriculture School of Nemea), additional role-specific prompts were
included to ensure relevance. All interviews, however, covered the same core themes.
Appendix C. Coding Matrix for TripAdvisor Reviews
This appendix provides a coding matrix summarizing the thematic framework used
to analyse TripAdvisor reviews. Categories were aligned with the study objectives, and
representative excerpts are presented with their corresponding interpretation. The coding
process involved assigning comments to pre-defined categories (service quality, infrastruc-
ture & accessibility, accommodation & gastronomy, authenticity & atmosphere, overall
satisfaction & loyalty), while allowing for inductive themes to emerge when necessary. This
ensured transparency and consistency in using online reviews as supplementary evidence.
Category Example Review Excerpt Theme/Interpretation
Service quality
“The tasting was very well
organised and the host was
knowledgeable.”
Positive service quality,
knowledgeable staff
Service quality
“The tasting felt rushed during a
busy period and some questions
went unanswered.”
Service inconsistency,
training gaps
Infrastructure and
accessibility
“Easy to find, with parking right
next to the cellar door.” Good accessibility
Infrastructure and
accessibility
“Signage between wineries could
be clearer and we relied on GPS
to navigate.”
Wayfinding and
navigation issues
Accommodation and
gastronomy
“The food and wine pairing made
the visit special.” Gastronomy as added value
Accommodation and
gastronomy
“Lodging options in town felt
limited, so we stayed
outside Nemea.”
Thin accommodation capacity
near the destination
Authenticity and
atmosphere
“Vineyard views and traditional
stone cellars made the visit
feel authentic.”
Authenticity, place identity
linked to Agiorgitiko and the
PDO
Authenticity and
atmosphere
“More storytelling about local
history would have enriched the
experience.”
Opportunity to strengthen
cultural integration
Overall satisfaction
and loyalty
“We would definitely come back
and recommend it to friends.”
High satisfaction, revisit
intention
Overall satisfaction
and loyalty
“Good experience, but probably a
one-time visit for us.” Satisfied but low loyalty
References
Abdi, H., & Valentin, D. (2007). Multiple correspondence analysis. Encyclopedia of Measurement and Statistics,2(4), 651–657.
Economies 2025,13, 287 27 of 28
Alebaki, M., & Ioannides, D. (2017). Threats and obstacles to resilience: Insights from Greece’s wine tourism. In Tourism, resilience and
sustainability (pp. 132–148). Routledge.
Alebaki, M., Liontakis, A., & Koutsouris, A. (2020, September 17–18). Benchmark analysis of wine tourism destinations: Integrating a
resilience system perspective into the comparative framework. 2nd International Research Workshop in Wine Tourism “Wine Tourism:
Challenges, Innovation and Futures” (pp. 17–18), Santorini, Greece.
Anastasiadis, F., & Alebaki, M. (2021). Mapping the Greek wine supply chain: A proposed research framework. Foods,10(11), 2859.
[CrossRef] [PubMed]
Asociación Española de Ciudades del Vino (ACEVIN). (2024). Wine tourism on Spain’s wine routes generates an economic impact of
more than 100 million euros. Ruta del Vino Ribera del Duero. Available online: https://rutadelvinoriberadelduero.es/en/
wine-tourism-on-spains-wine-routes-generates-an-economic-impact-of-more-than-100-million-euros/ (accessed on 21 July 2025).
Baggio, R. (2008). Symptoms of complexity in a tourism system. Tourism Analysis,13(1), 1–20. [CrossRef]
Byrd, E. T., Canziani, B., Hsieh, Y. C. J., Debbage, K., & Sonmez, S. (2016). Wine tourism: Motivating visitors through core and
supplementary services. Tourism Management,52, 19–29. [CrossRef]
Cali´nski, T., & Harabasz, J. (1974). A dendrite method for cluster analysis. Communications in Statistics-Theory and Methods,3(1), 1–27.
[CrossRef]
Correia, R., & Brito, C. (2016). Wine tourism and regional development. In M. Peris-Ortiz, M. Del Río Rama, & C. Rueda-Armengot
(Eds.), Wine and tourism. Springer.
Croce, E., & Perri, G. (2017). Food and wine tourism: Integrating food, travel and territory (2nd ed.). CABI.
Decrop, A. (1999). Triangulation in qualitative tourism research. Tourism Management,20(1), 157–161. [CrossRef]
Dolnicar, S. (2020). Market segmentation analysis in tourism: A perspective paper. Tourism Review,75(1), 45–48. [CrossRef]
Duda, R. O., Hart, P. E., & Stork, D. G. (2001). Pattern classification (2nd ed.). Wiley.
Gatti, S., & Incerti, F. (1997, June 19–21). The wine routes as an instrument for the valorisation of typical products and rural areas. 52nd
European Association of Agricultural Economists Seminar (pp. 213–224), Parma, Italy.
Getz, D., & Carlsen, J. (2005). Family business in tourism: State of the art. Annals of Tourism Research,32(1), 237–258. [CrossRef]
Gillespie, R., & Clarke, M. (2019). Economic contribution of the wine sector to Western Australia. AgEconPlus Report for the Wine
Industry Association of Western Australia. Available online: https://winewa.asn.au/wp-content/uploads/2019/10/AgEconPlus
-Gillespie-Economic-Contribution-Wine-Report-2019.-1-1.pdf (accessed on 21 July 2025).
Greenacre, M. (2017). Correspondence analysis in practice (2nd ed.). Chapman and Hall/CRC.
Guédé, R., & Koffi, A. T. (2019). Artisanal mining, employment and empowerment in the north and east of Côte d’Ivoire. Theoretical
Economics Letters,9(08), 2914. [CrossRef]
Hall, C. M., Sharples, L., Cambourne, B., & Macionis, N. (2000). Wine tourism around the world: Development, management and
markets. Elsevier.
Hjellbrekke, J. (2018). Multiple correspondence analysis for the social sciences. Routledge.
Husson, F., Le, S., & Pagès, J. (2017). Exploratory multivariate analysis by example using R (2nd ed.). Chapman and Hall/CRC.
Kazou, M., Pagiati, L., Dotsika, E., Proxenia, N., Kotseridis, Y., & Tsakalidou, E. (2023). The microbial terroir of the Nemea zone
Agiorgitiko cv.: A first metataxonomic approach. Australian Journal of Grape and Wine Research,2023(1), 8791362. [CrossRef]
Kozinets, R. V., & Gretzel, U. (2024). Netnography evolved: New contexts, scope, procedures and sensibilities. Annals of Tourism
Research,104, 103693. [CrossRef]
López-Guzmán, T., Rodríguez-García, J., Sánchez-Cañizares, S., & José Luján-García, M. (2011). The development of wine tourism in
Spain. International Journal of Wine Business Research,23(4), 374–386. [CrossRef]
López-Guzmán, T., Vieira-Rodríguez, A., & Rodríguez-García, J. (2014). Profile and motivations of European tourists on the Sherry
wine route of Spain. Tourism Management Perspectives,11, 63–68. [CrossRef]
MacQueen, J. (1967). Some methods for classification and analysis of multivariate observations. In Proceedings of the fifth Berkeley
symposium on mathematical statistics and probability (Vol. 1, pp. 281–297). University of California Press.
Martínez-Falcó, J., Martínez-Falcó, J., Marco-Lajara, B., & Sánchez-García, E. (2024). Wine tourism as a catalyst for green performance:
The mediating role of green knowledge sharing. Journal of Foodservice Business Research,1, 1–28. [CrossRef]
Miliordos, D. E., Goulioti, E., Lola, D., Kanapitsas, A., Kontoudakis, N., & Kotseridis, Y. (2024). Chemical and sensory differentiation of
Nemea PDO sub-zones wines: Two vintages experiment. Ciência e Técnica Vitivinícola,39(2), 103–119. [CrossRef]
Millán-Tudela, L. A., Marco-Lajara, B., Martínez-Falcó, J., & Sánchez-García, E. (2024). Economic structure and geographic scope of
Spanish wine routes. In Wine tourism and sustainability: The economic, social and environmental contribution of the wine industry
(pp. 33–48). Springer Nature Switzerland.
Mkono, M., & Tribe, J. (2017). Beyond reviewing: Uncovering the multiple roles of tourism social media users. Journal of Travel Research,
56(3), 287–298. [CrossRef]
Montella, M. M. (2017). Wine tourism and sustainability: A review. Sustainability,9(1), 113. [CrossRef]
Economies 2025,13, 287 28 of 28
Murtagh, F., & Legendre, P. (2011). Ward’s hierarchical clustering method: Clustering criterion and agglomerative algorithm. arXiv,
arXiv:1111.6285.
OECD. (2014). Tourism and the creative economy, OECD studies on tourism. OECD Publishing. [CrossRef]
Pagliara, F., Aria, M., Brancati, G., Moradpour, A., & Morrison, A. M. (2025). A mixed-method study for the identification of the factors
affecting the performance of a tourist destination. Journal of Destination Marketing & Management,37, 101018. [CrossRef]
Papadopoulou, G., & Alebaki, M. (2022). Capturing core experiential aspects in winery visitors’ TripAdvisor reviews: Netnographic
insights from Santorini and Crete. In Routledge handbook of wine tourism (pp. 533–543). Routledge.
Sharpley, R. (2020). Tourism, sustainable development and the theoretical divide: 20 years on. Journal of Sustainable Tourism,28(11),
1932–1946. [CrossRef]
Singh, H., & Kaur, K. (2013). New method for finding initial cluster centroids in K-means algorithm. International Journal of Computer
Application,74(6), 27–30. [CrossRef]
StataCorp. (2013). Stata: Release 13. Statistical software. StataCorp LP.
Sulewski, P., Kłoczko-Gajewska, A., & Sroka, W. (2018). Relations between agri-environmental, economic and social dimensions of
farms’ sustainability. Sustainability,10(12), 4629. [CrossRef]
Thanh, T. V., & Kirova, V. (2018). Wine tourism experience: A netnography study. Journal of Business Research,83, 30–37. [CrossRef]
Tkaczynski, A., Rundle-Thiele, S. R., & Beaumont, N. (2009). Segmentation: A tourism stakeholder view. Tourism Management,30(2),
169–175. [CrossRef]
Tzimitra-Kalogianni, I., Papadaki-Klavdianou, A., Alexaki, A., & Tsakiridou, E. (1999). Wine routes in Northern Greece: Consumer
perceptions. British Food Journal,101(11), 884–892. [CrossRef]
Vazquez Vicente, G., Martín Barroso, V., & Blanco Jimenez, F. J. (2021). Sustainable tourism, economic growth and employment—The
case of the wine routes of Spain. Sustainability,13(13), 7164. [CrossRef]
Vos, K. (2019). The development of wine tourism in atypical wine regions: The challenge of multistakeholder cooperation? International
Studies: Interdisciplinary Political and Cultural Journal,24(2), 127–142.
World Tourism Organization (UNWTO). (2016). Georgia declaration on wine tourism: Fostering sustainable tourism development through the
promotion of cultural heritage. UNWTO. Available online: https://webunwto.s3-eu-west-1.amazonaws.com/imported
_
images/
46325/georgia_declaration.pdf (accessed on 21 July 2025).
Disclaimer/Publisher’s Note: The statements, opinions and data contained in all publications are solely those of the individual
author(s) and contributor(s) and not of MDPI and/or the editor(s). MDPI and/or the editor(s) disclaim responsibility for any injury to
people or property resulting from any ideas, methods, instructions or products referred to in the content.


![JOINT STANDARD [-] OF 2023: CYBERSECURITY AND CYBER RESILIENCE REQUIREMENTS](https://s3.us-east-1.amazonaws.com/outstation.idea/pdf-mt/2041946698733694976/pdf/f0170b21-d2c2-47f8-92fd-8ccc6cd9af36/imgs/page1.png)


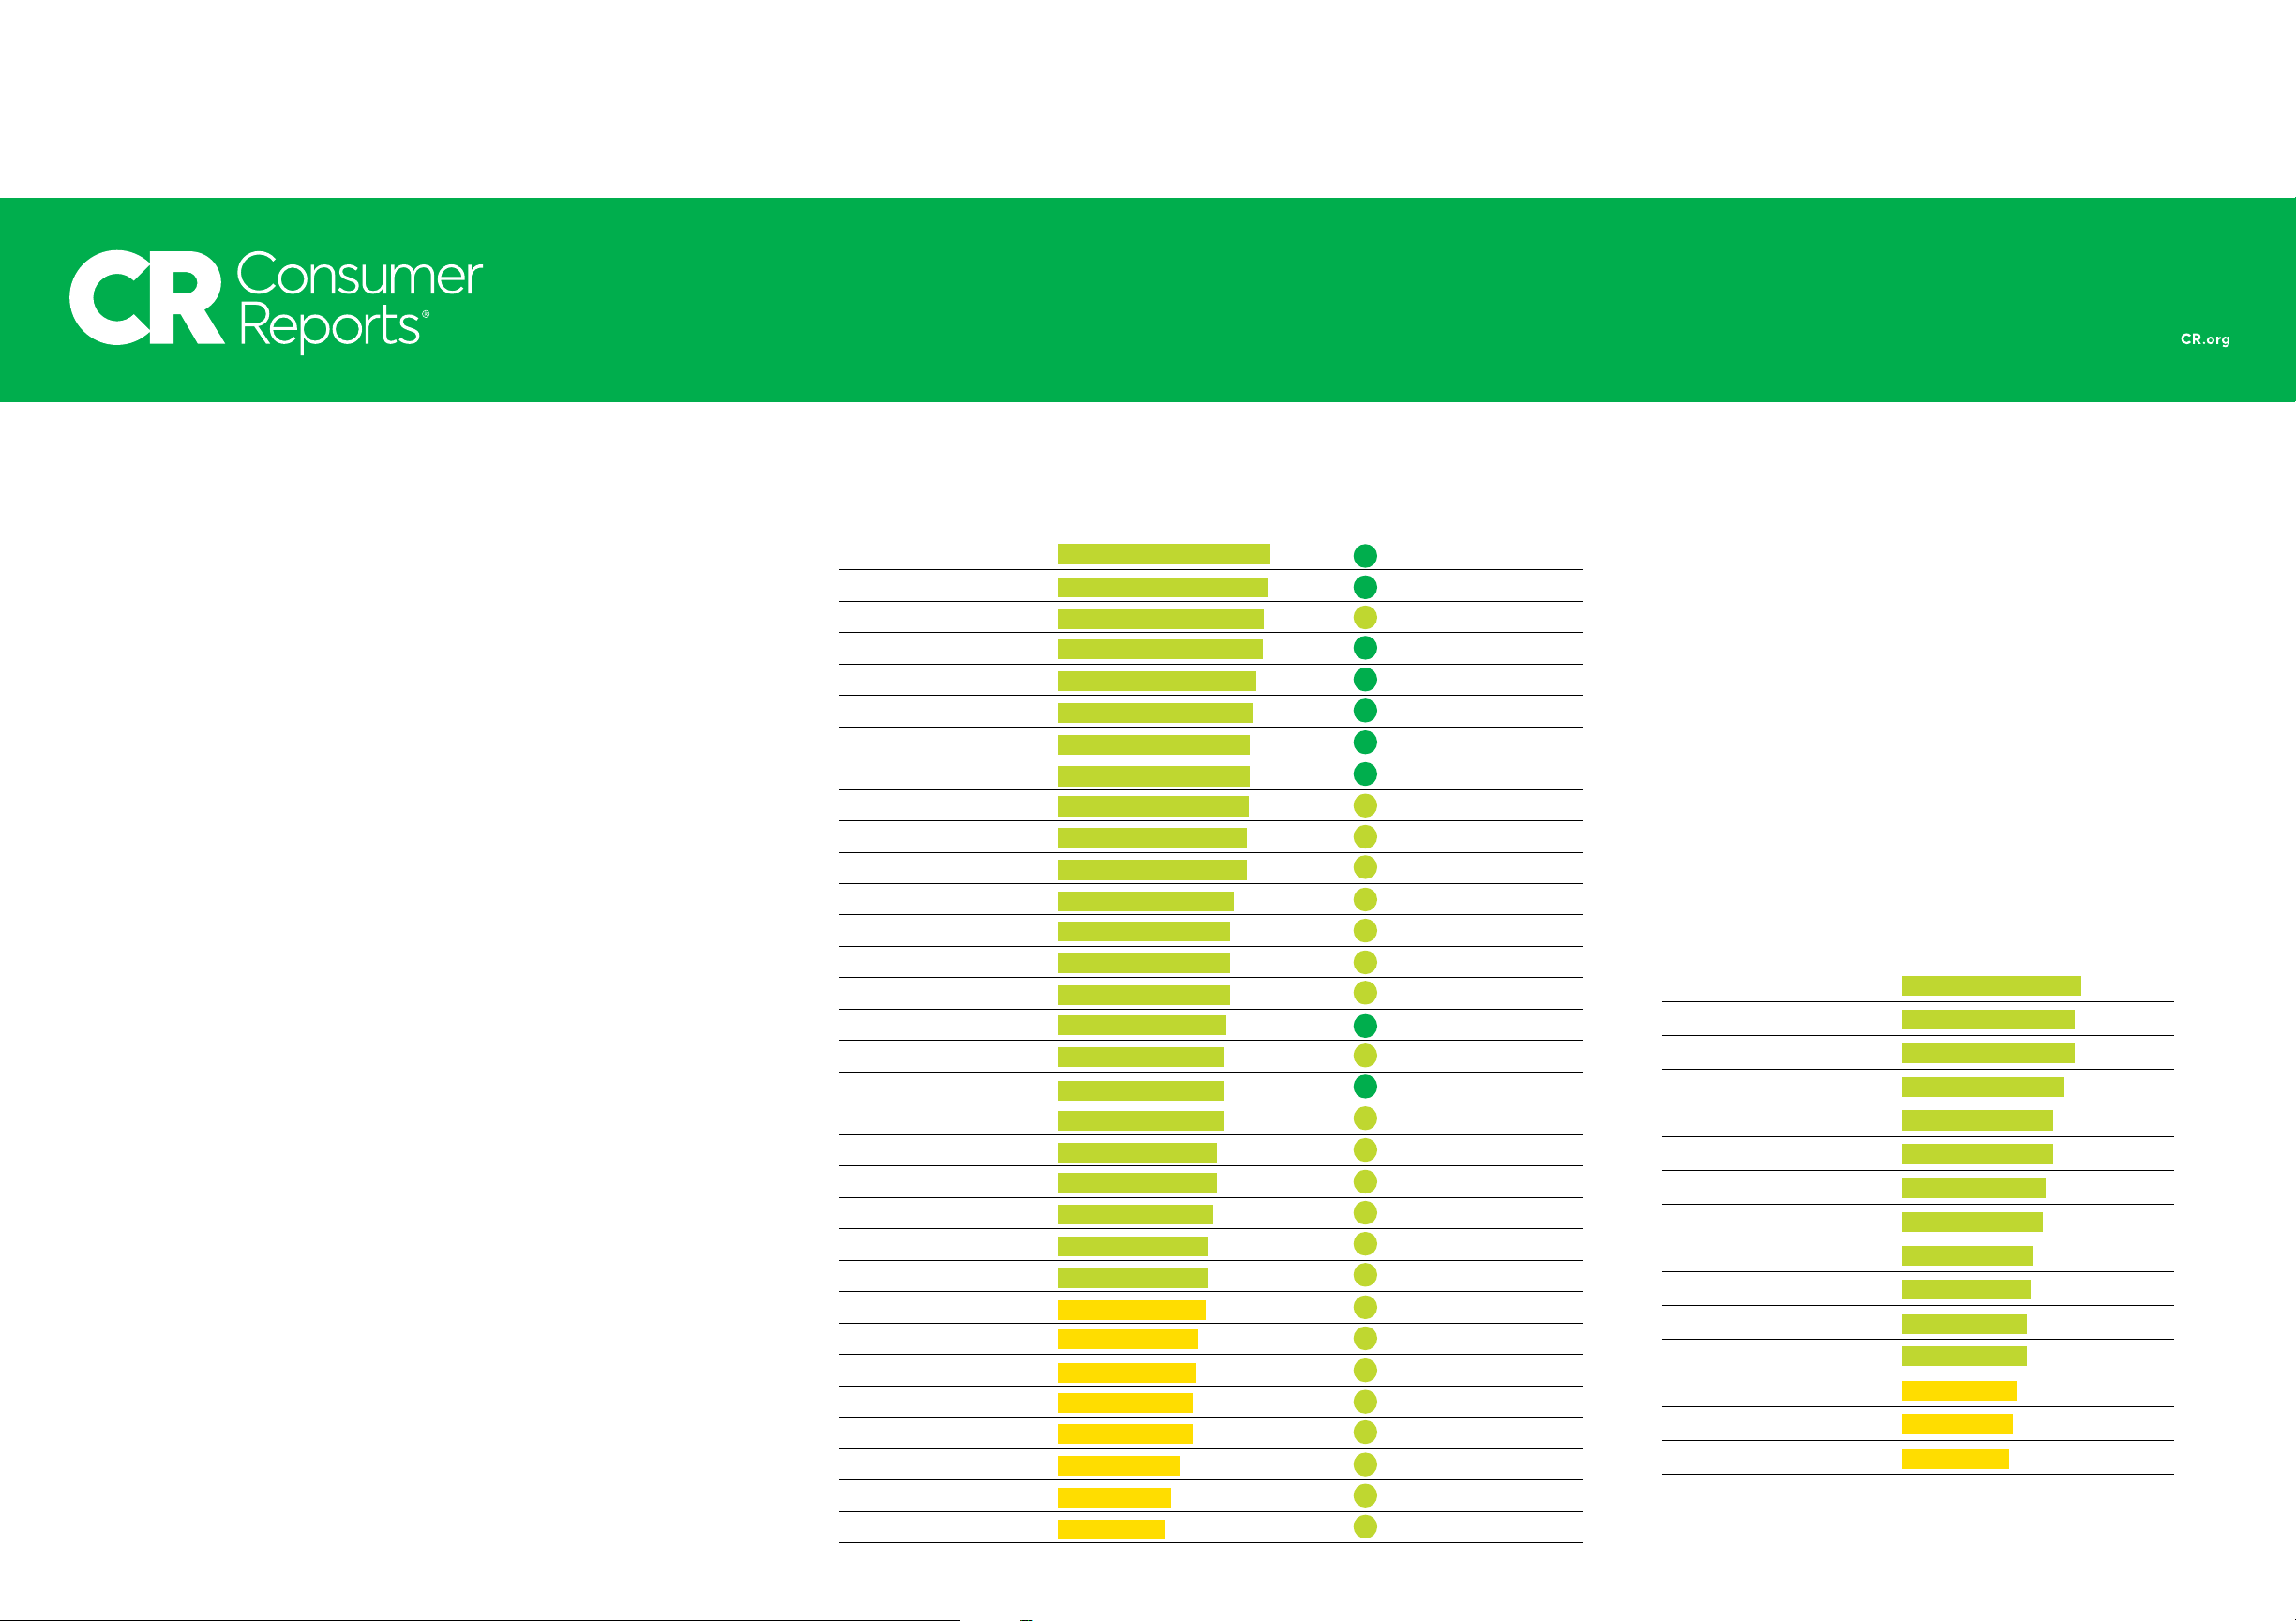
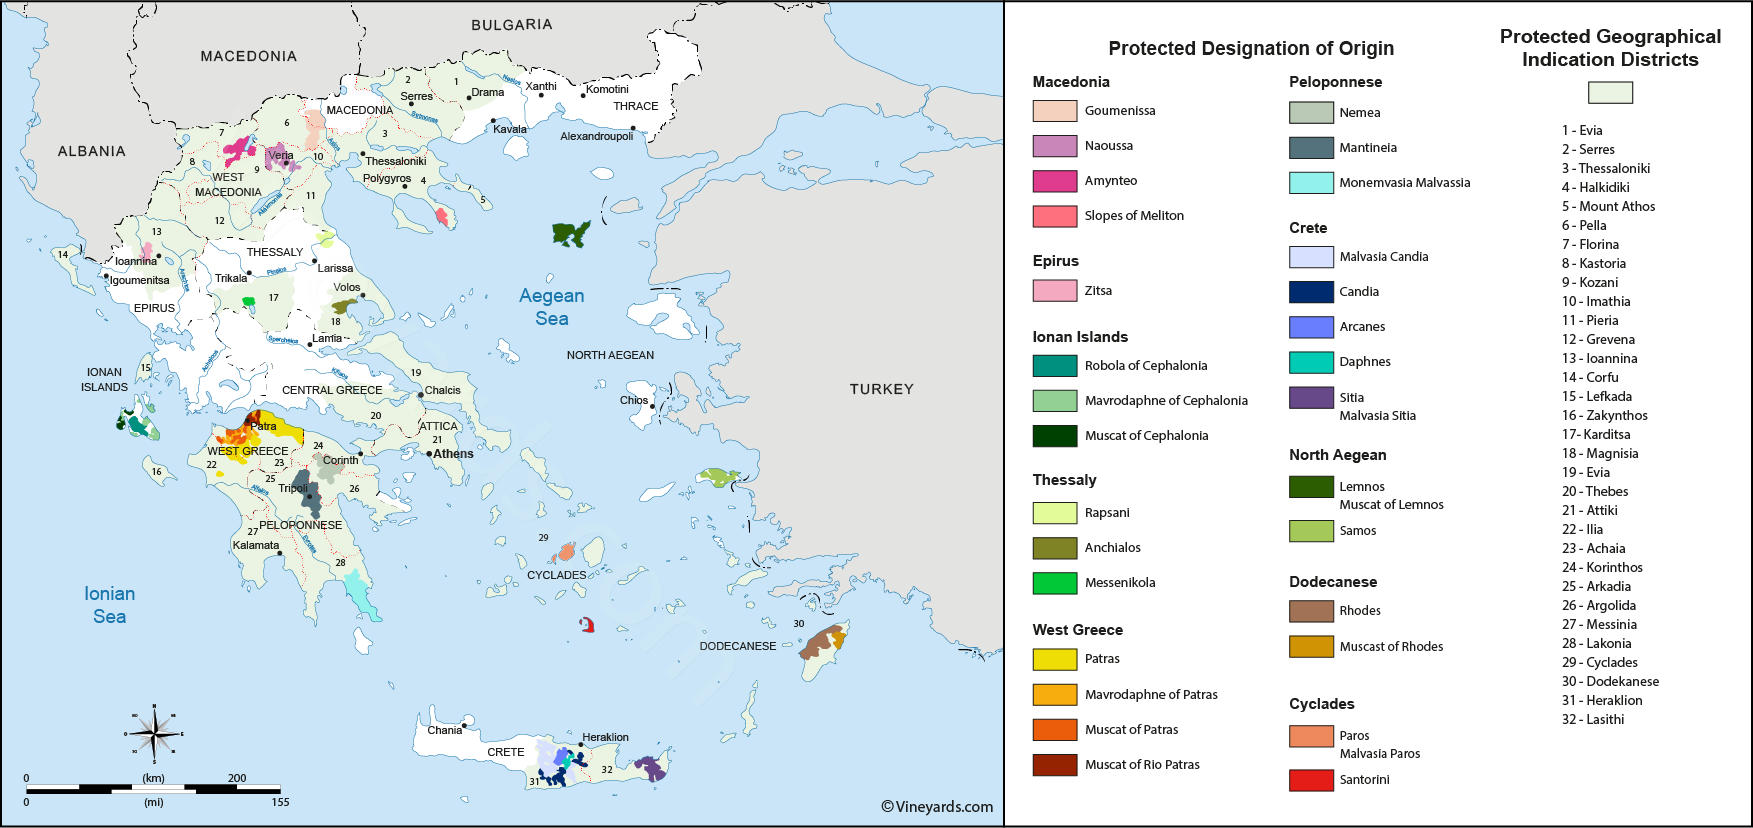
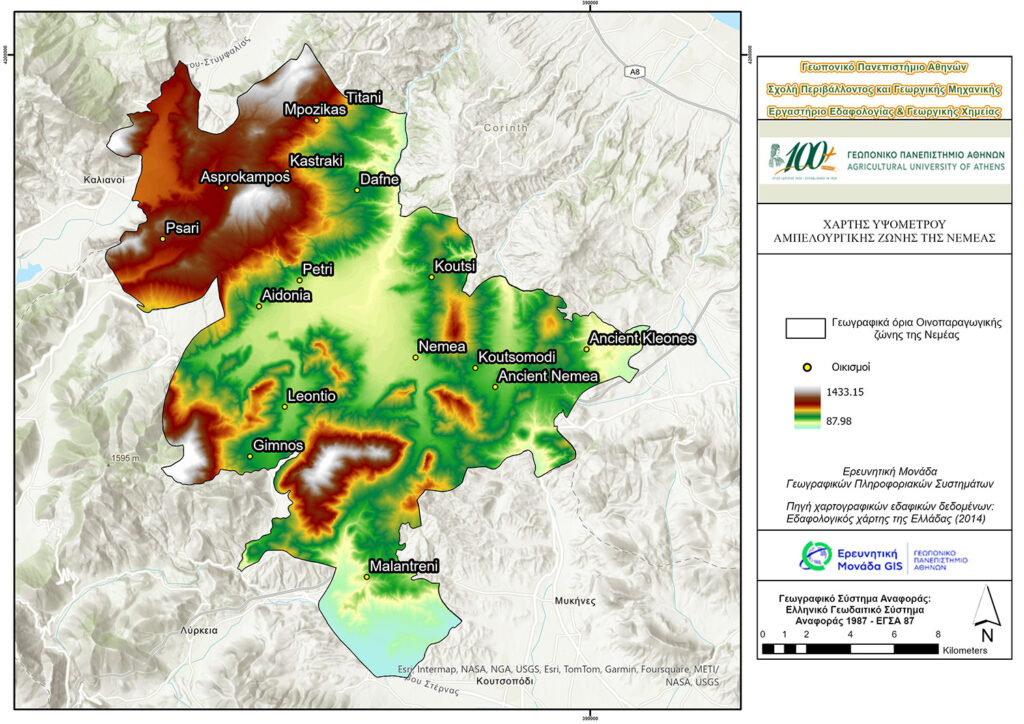