World Happiness Report 2024 PDF Free Download
1 / 158/158
100%

2024

This publication may be reproduced using the
following reference: Helliwell, J. F., Layard, R., Sachs,
J. D., De Neve, J.-E., Aknin, L. B., & Wang, S. (Eds.). (2024).
World Happiness Report 2024.
University of Oxford: Wellbeing Research Centre.
Full text and supporting documentation
can be downloaded from the website:
worldhappiness.report
ISBN 978-1-7348080-7-0
The World Happiness Report is a partnership of Gallup, the Oxford Wellbeing
Research Centre, the UN Sustainable Development Solutions Network, and
the WHR’s Editorial Board. The report is produced under the editorial control
of the WHR Editorial Board.
From 2024, the World Happiness Report is a publication of the Wellbeing
Research Centre at the University of Oxford, UK.
Any views expressed in this report do not necessarily reect the views
of any organization, agency or program of the United Nations.
John F. Helliwell, Richard Layard, Jeffrey D. Sachs,
Jan-Emmanuel De Neve, Lara B. Aknin, and Shun Wang

Table of Contents
World Happiness Report
2024
1 Happiness and Age: Summary ......................3
Helliwell, Layard, Sachs, De Neve, Aknin, and Wang
2 Happiness of the Younger, the Older, and
Those In Between .................................9
Helliwell, Huang, Shiplett, and Wang
3 Child and Adolescent Well-Being:
Global Trends, Challenges and Opportunities ........61
Marquez, Taylor, Boyle, Zhou, and De Neve
4 Supporting the Well-being of an Aging Global
Population: Associations between Well-being
and Dementia ...................................103
Britton, Hill, and Willroth
5 Differences in Life Satisfaction Among Older Adults
in India ........................................129
Paul, Pai, Thalil, and Srivastava
The World Happiness Report was written by a group of independent experts acting
in their personal capacities. Any views expressed in this report do not necessarily
reflect the views of any organization, agency, or program of the United Nations.
This version last updated March 8, 2024. Please see worldhappiness.report for latest data.
Photo Janaya Dasiuk on Unsplash

Chapter 1
Happiness and Age:
Summary
John F. Helliwell
Vancouver School of Economics,
University of British Columbia
Richard Layard
Wellbeing Programme, Centre for Economic Performance,
London School of Economics and Political Science
Jeffrey D. Sachs
Center for Sustainable Development at Columbia University
Jan-Emmanuel De Neve
Wellbeing Research Centre, University of Oxford
Lara B. Aknin
Department of Psychology, Simon Fraser University
Shun Wang
International Business School Suzhou,
Xi’an Jiaotong-Liverpool University
Photo Janaya Dasiuk on Unsplash
doi.org/10.18724/whr-kk3m-b586
This version last updated March 8, 2024. Please see worldhappiness.report for latest data.
Photo Yusron El Jihan on Unsplash
1
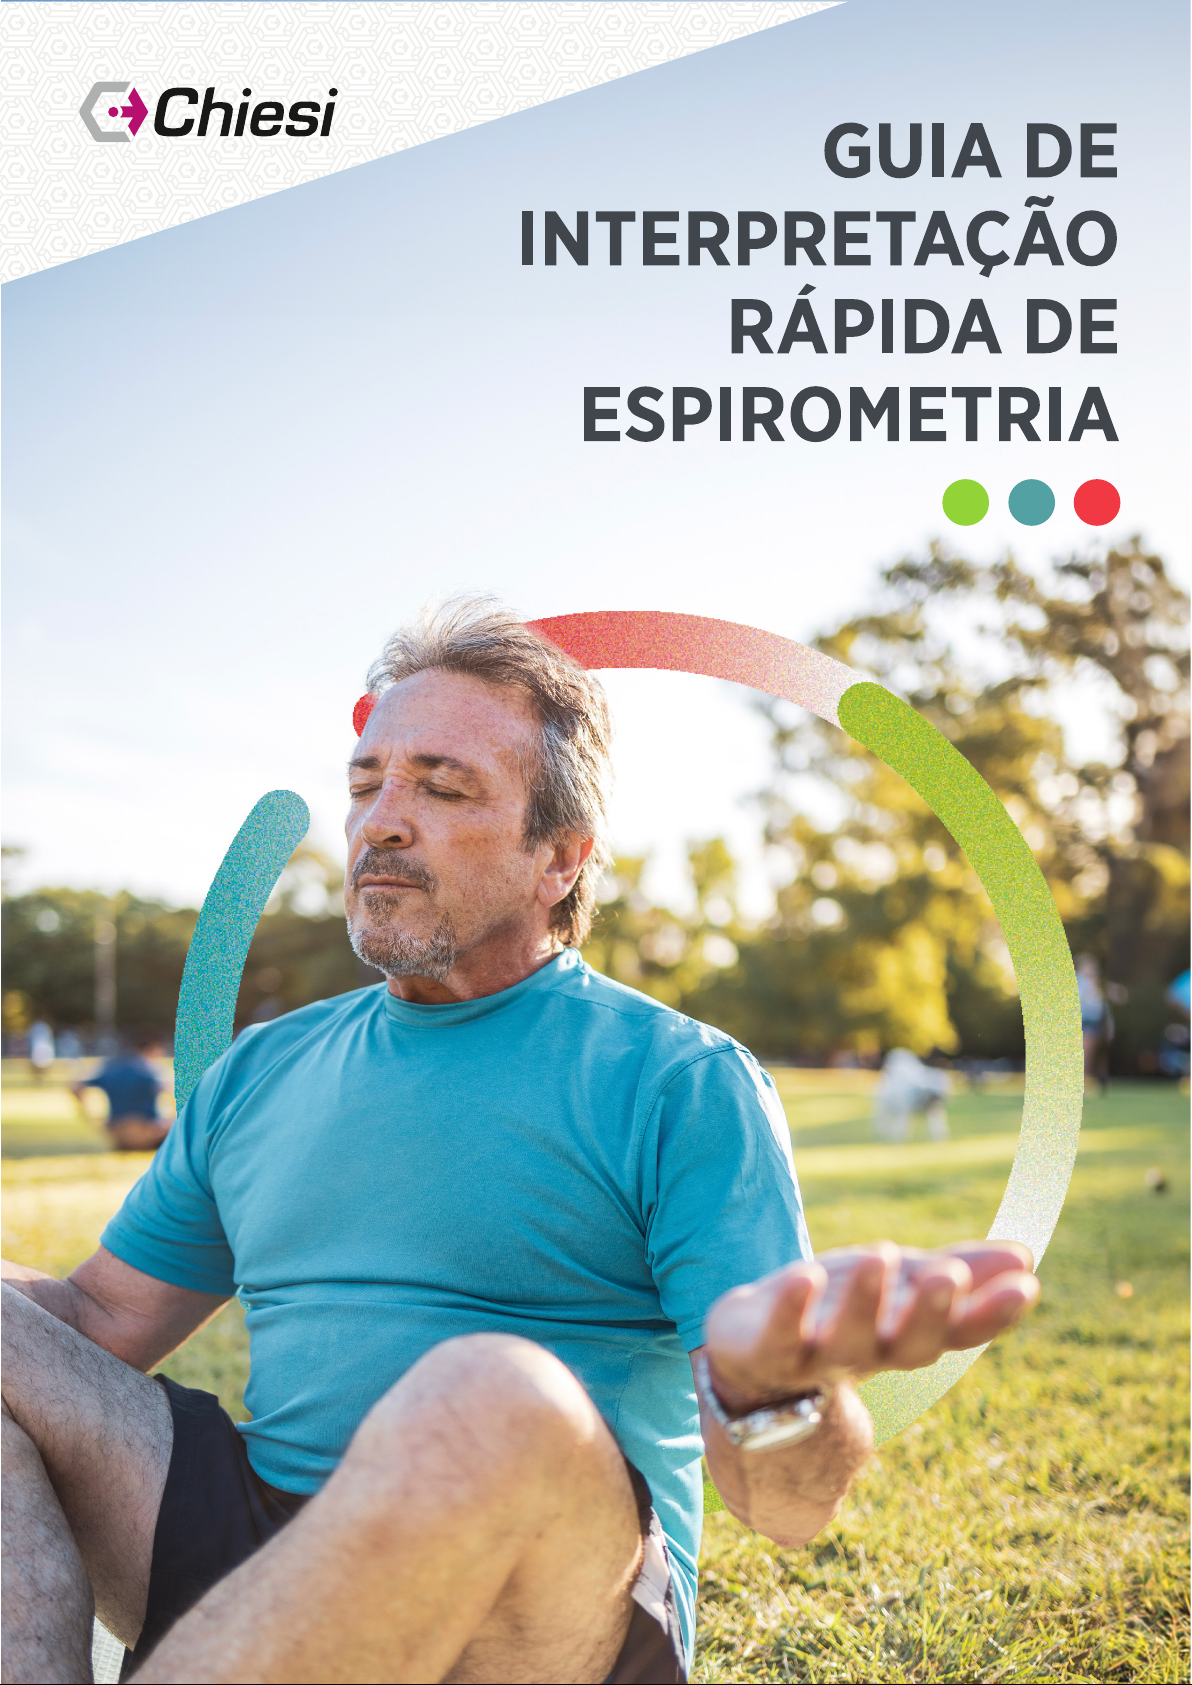
In the seven ages of man in
Shakespeare’s As You Like It,
the later stages of life are
portrayed as deeply depressing.
But happiness research shows
a more nuanced picture, and
one that is changing over time.

World Happiness Report 2024
5
In this issue of the World Happiness Report we
focus on the happiness of people at different
stages of life. In the seven ages of man in
Shakespeare’s As You Like It, the later stages
of life are portrayed as deeply depressing. But
happiness research shows a more nuanced
picture, and one that is changing over time.
In the West, the received wisdom was that the
young are the happiest and that happiness
thereafter declines until middle age, followed by
substantial recovery. But since 2006-10, as we
shall see, happiness among the young (aged
15-24) has fallen sharply in North America – to a
point where the young are less happy than the
old. Youth happiness has also fallen (but less
sharply) in Western Europe.
By contrast, happiness at every age has risen
sharply in Central and Eastern Europe, so that
young people are now equally happy in both
parts of Europe. In the former Soviet Union and
East Asia too there have been large increases in
happiness at every age, while in South Asia and
the Middle East and North Africa happiness has
fallen at every age.
It is of course an issue to what extent these
changes reect generational changes that can be
expected to persist as each generation gets older.
In pioneering work, Chapter 2 disentangles the
effect of which cohort you are in from that of age.
At the global level, it reveals a lower level of
happiness among people born since 1980.
One thing is the average level of happiness,
another is its dispersion. Since 2006-10, the
inequality of happiness has increased in every
region except Europe – another worrying trend.
As usual, all these trends are discussed in
Chapter 2, together with the country rankings.
The position of the young is discussed in ner
detail in Chapter 3. This draws on a wide range
of data sources and also includes data for young
people aged 10-15. The rest of the report focuses
on the old. As Chapter 4 stresses, the greatest
plague in old age is dementia. Fortunately, new
and accumulating research demonstrates that
higher well-being is a protective factor against
future dementia. In addition, there are signicant
environmental and behavioral strategies that
improve the lives of those living with dementia.
Finally, Chapter 5 focuses on India, the rst such
chapter in the World Happiness Report. It stresses
that in India, the world’s most populous country,
with a rapidly growing elder share, happiness
rises into old age,more so for men than women.
In what follows, we give summaries of each
chapter, which will hopefully tempt readers to
read further.
Chapter 2
Happiness of the Younger, the Older,
and Those In Between
Overall rankings
• The top 10 countries have remained much
the same since before COVID. Finland is still
top, with Denmark now very close, and all ve
Nordic countries in the top 10. But in the next
10, there is more change, with the transition
countries of Eastern Europe rising in happiness
(especially Czechia, Lithuania and Slovenia).
Partly for this reason the United States
and Germany have fallen to 23 and 24 in
the rankings.
Happiness by age group
• In many but not all regions, the young are
happier than the old. But in North America
happiness has fallen so sharply for the young
that they are now less happy than the old. By
contrast, in the transition countries of Central
and Eastern Europe, the young are much
happier than the old. In Western Europe as a
whole happiness is similar at all ages, while
elsewhere it tends to decline over the life cycle
(with an occasional upturn for the old).
• For these reasons, the ranking of countries by
happiness is very different for the young and
for the old. As between generations, after
taking into account age and life circumstances,
those born before 1965 have life evaluations
about one-quarter of a point higher than those
born after 1980.
Photo Yusron El Jihan on Unsplash

World Happiness Report 2024
6
Changes in happiness since 2006-2010:
by age group
• The countries of Central and Eastern Europe
have had the largest increase in happiness – by
similar amounts in all age groups. The gains in
the former Soviet Union were half as large.
In East Asia too there were large increases,
especially among the old.
• By contrast, happiness fell in South Asia in
all age groups. It also fell in North America,
especially among the young. And it fell in the
Middle East and North Africa in all age groups.
• In Central and Eastern Europe, the young are
now as happy as in Western Europe, and among
the old the gap between East and West is one
half of what it was in 2006-10, though still large
(one whole point on the scale of 0 to 10).
Inequality of happiness
• Since 2006-10 there has been a large increase
in the inequality of happiness in every region
except Europe. And it has increased especially
for the old. The biggest increase is in
Sub-Saharan Africa.
Negative emotions
• Negative emotions are more frequent now
than in 2006-2010 everywhere except in East
Asia and in Europe. In fact in Central and
Eastern Europe, negative emotions are now
less frequent in all age groups than they were
in 2006-2010.
• In 2021-2023 negative emotions were in every
region more prevalent for females than males.
Almost everywhere the gender gap is larger at
older ages.
Positive emotions
• In all regions the frequency of positive emotions
has changed since 2006-2010 in the same
direction as life evaluations. But the age patterns
differ. The frequency of positive emotions in
every region is highest for those under 30,
thereafter steadily declining with age in every
region except North America, where positive
emotions are least frequent for those in the
middle age groups.
Benevolence by generation
• The COVID crisis led to a worldwide increase
in the proportion of people who have helped
others in need. This increase in benevolence has
been large for all generations, but especially so
for those born since 1980, who are even more
likely than earlier generations to help others
in need.
Social support, loneliness and social interactions
• In almost every global region comparably
measured feelings of social support are more
than twice as prevalent as loneliness. Both
social support and loneliness affect happiness,
with social support usually having the larger
effect. Social interactions of all kinds also add
to happiness, in addition to their effects owing
through increases in social support and
reductions in loneliness.
Chapter 3
Child and Adolescent Well-being:
Global Trends, Challenges and
Opportunities
• In most countries life satisfaction drops
gradually from childhood through adolescence
and into adulthood. Globally, young people
aged 15-24 still report higher life satisfaction
than older adults. But this gap is narrowing in
Western Europe and recently reversed in North
America due to falling life satisfaction among
the young. Conversely, in Sub-Saharan Africa
life satisfaction has increased among the young.
• Overall, globally, young people aged 15-24
experienced improved life-satisfaction between
2006 and 2019, and stable life satisfaction since
then. But the picture varied by region. Youth
wellbeing fell in North America, Western
Europe, Middle East and North Africa, and
South Asia. In the rest of the world it rose.
• Turning to younger ages (10-15), evidence is
limited. In high income countries, life satisfaction
has declined since 2019, especially for girls. For
East Asian countries, life satisfaction increased
in 2019. Before 2019, the evidence on trends
is mixed.

World Happiness Report 2024
7
• Girls report lower life satisfaction than boys
by around the age of 12. This gap widens at
ages 13 and 15, and the pandemic has amplied
the difference. These points apply only to
high-income countries since data on these
young ages is rarely gathered elsewhere. For
ages 15-24, global data shows no global gender
differences from 2006 until 2013. But from
2014, females began reporting higher life
satisfaction than males, although the gap has
narrowed after the pandemic. This global
gender gap masks regional differences, and is
more pronounced in lower-income countries.
There are no gender differences in high-income
countries.
Chapter 4
Supporting the Well-being of an
Aging Global Population:
Associations between Well-being
and Dementia
• As the global population of older adults
increases, the number of worldwide dementia
cases is also expected to increase. Dementia is
associated with reduced quality of life and
well-being, and thus dementia prevention is
critical to maintaining the well-being of an
aging global population.
• Higher levels of prior well-being have been
robustly associated with lower risk for future
dementia, suggesting that increasing well-being
may be a promising non-pharmacological
approach to dementia prevention. Among
individuals living with dementia, there are
environmental changes and well-being
enhancing activities which have been shown
to improve well-being.
Chapter 5
Differences in Life Satisfaction among
Older Adults in India
• Older age is associated with higher life
satisfaction in India, refuting some claims that
the positive association between age and life
satisfaction only exists in high-income nations.
However, older women in India report lower life
satisfaction than older men.
• Older adults with secondary or higher
education and those of higher social castes
report higher life satisfaction than counterparts
without formal education and those from
scheduled castes and scheduled tribes.
• Satisfaction with living arrangements, perceived
discrimination, and self-rated health emerged as
the top three predictors of life satisfaction.
Acknowledgments
We have had a remarkable range of contributing
authors and expert reviewers to whom we are
deeply grateful for their willingness to share their
knowledge with our readers. Although the editors
and authors of the World Happiness Report are
volunteers, there are administrative and research
support costs covered by our partners: Glico, the
Katsuiku Foundation, Blue Zones, illycaffè, and
Fondazione Ernesto Illy. We greatly value our
special relationship with Gallup who enable the
early access to the World Poll data that underpins
so much of the report. We very much appreciate
the continued work by Ryan Swaney and
Stislow Design for their skills in design and web
development. New this year, we are deeply
grateful to Jonathan Whitney and Leoni Boyle for
their extraordinary efforts on the production of
the report and media engagement. All of these
contributions together are what makes the World
Happiness Report the go-to source for so many
around the world wanting to nd out the latest
evidence on the global state of happiness.
John Helliwell, Richard Layard, Jeffrey D. Sachs,
Jan-Emmanuel De Neve, Lara B. Aknin, and
Shun Wang.
World Happiness Report 2024
8
Photo Nathan Dumlao on Unsplash

Chapter 2
Happiness of the
Younger, the Older, and
Those In Between
John F. Helliwell
Vancouver School of Economics,
University of British Columbia
Haifang Huang
Department of Economics, University of Alberta
Hugh Shiplett
Faculty of Business, University of New Brunswick
Shun Wang
International Business School Suzhou,
Xi’an Jiaotong-Liverpool University
The authors are grateful for the financial support of the WHR sponsors and for
data from the Gallup World Poll and the Gallup/Meta State of Social Connections
study. For much helpful assistance and advice, we are grateful to Lara Aknin,
Chris Barrington-Leigh, Leoni Boyle, Felix Cheung, Jan-Emmanuel De Neve, Anat
Noa Fanti, Len Goff, Carol Graham, Richard Layard, Jessica Mahoney, Max Norton,
Andrew Oswald, Julie Ray, Laura Rosella, Marwan Saleh, Jonathan Whitney, Meik
Wiking, and Maggie Zhou.
doi.org/10.18724/whr-f1p2-qj33
This version last updated March 8, 2024. Please see worldhappiness.report for latest data.

Photo Ben White on Unsplash
2
Our happiness rankings are
based on life evaluations,
as the more stable measure
of the quality of people’s lives.

World Happiness Report 2024
11
Photo Ben White on Unsplash
Key Insights
Ranking convergence continues between the two halves of Europe, with Czechia, Lithuania and Slovenia
at positions 18, 19 and 21, contributing to the fall of the United States and Germany from 15 and 16 last
year to 23 and 24 this year.
Rankings differ a lot for the young and the old. In some cases these differences favour the old, as in
the United States and Canada, where the rankings for those aged 60 and older are 50 or more places
higher than for those under 30. In other cases, especially in Central and Eastern Europe, the reverse is
true, with many rankings being more than 40 places higher for the young than for the old.
From 2006-2010 to 2021-2023 changes in overall happiness varied greatly from country to country,
ranging from increases as large as 1.8 points in Serbia, (up 69 ranks from WHR2013 to WHR2024) and
1.6 points in Bulgaria (up 63 ranks from WHR2013 to WHR2024) to decreases as large as 2.6 points in
Afghanistan (13th from bottom in WHR2013 to unhappiest country in WHR2024).
Happiness changes also varied by global region. Central and Eastern Europe had the largest increases,
of the same size for all age groups. Gains were half as large in the CIS countries. East Asia also had large
increases, especially for the older population. By contrast, life evaluations fell in South Asia in all age
groups, especially in the middle age groups. Happiness fell signicantly in the country group including
the United States, Canada, Australia and New Zealand, by twice as much for the young as for the old.
Happiness has fallen from 2006-2010 to 2021-2023 in the Middle East and North Africa, with larger
declines for those in the middle age groups than for the old and the young.
For those under 30, happiness levels are now equal in both halves of Europe. For those ever 60, the
gap between the two halves of Europe is about half of what it was in 2006-2010. But it is still very large,
more than a full point in 2021-2023.
In 2021-2023 negative emotions were in every region more prevalent for females than males, with
almost everywhere the gender gap being larger at higher ages.
Negative emotions are more frequent than in 2006-2010 everywhere except East Asia and both parts
of Europe. In Central and Eastern Europe, in contrast to the rest of the world, but consistently with the
happiness convergence taking place within Europe, negative emotions are now less frequent in all age
groups than they were in 2006-2010.
Positive emotions have not changed much, while still remaining more frequent for the young than for
older age groups.
Global happiness inequality has increased by more than 20% over the past dozen years, in all regions
and age groups, to an extent that differs a lot by age and by region.
Post-COVID increases in benevolence, whether measured as shares of the population, or percentage
increases from pre-pandemic levels, are large for all generations, but especially so for the Millennials and
Generation Z, who are even more likely than their predecessors to help others in need.
New global social connections data show feelings of social support to have been more than twice as
prevalent as loneliness in 2022. Both social support and loneliness affect happiness, with social support
usually having the larger effect. Social interactions add to happiness, with their effects owing through
increases in social support and reductions in loneliness.
Age and generation both matter for happiness. As between generations, those born before 1965
(Boomers and their predecessors) have life evaluations about one-quarter of a point higher than those
born after 1980 (Millennials and Gen Z). Within each generation, life evaluations rise with age for those in
the older generations and fall with age for the younger ones, with little age effect for those in between.

World Happiness Report 2024
12
This chapter is about happiness during different
life stages and of those in different generations. It
is not the rst time we have looked at happiness
by age and gender.1 But it is the rst time we
have enough survey years to start separating the
life course from the ever-changing patterns of
history. Some important parts of life are tied
mainly to age, such as schooling, employment
and health. Others depend more on what is going
on in society and the world. These society-wide
factors range from violence, earthquakes and
pandemics to how new technologies and changing
natural and social environments interact with
also-changing ways of seeing history, facing
inequalities, and connecting with each other.
While most of our analysis deals with life at
different ages, we bring in generational effects
where we nd them most salient.
Our early sections relate to happiness as measured
by life evaluations and emotions, showing their
levels and changes for the younger (<30), the
older (60+), and those in between divided into
two groups, aged 30-44 and 45-59. For our later
analysis by generation, we make a three-way
split: those born before 1965, 1965-1980, and
after 1980. Although the best separation points
for generational differences will differ from
country to country, depending on their key
events, our separation does match some widely
used denitions,2 and also divides the sample
fairly evenly, with roughly 30% in each of the rst
two groups, and 40% in the youngest cohort,
which includes Millennials and their successors.
We start by presenting our usual ranking and
modelling of national happiness of the population
as a whole. In Figure 2.1 we rank countries by their
average life evaluations over the three preceding
years, 2021-2023. We have two versions of
Figure 2.1. The rst version presents actual life
evaluations alone on centre stage. We include
horizontal whiskers showing the 95% condence
bands for our national estimates, supplemented
by a measure for each country of the range of
rankings within which its own ranking is likely to
be. The second version includes bars showing
how much each of the six variables explains each
country’s average life evaluation. We also present
the latest version, in Table 2.1, of the equation we
use to explain how and why life evaluations vary
among countries and over time.
Subsequent sections look separately at the life
evaluations for the young, the old, and those in
between, compare country rankings for each age
group, and show how life evaluations at different
ages have changed from a base period3 of 2006-
2010 to the three most recent years, 2021-2023.
We then consider differences among age groups
in the levels and trends of positive and negative
emotions, proceeding from there to the important
topic of inequality. We show that inequality of
well-being is generally greater at higher age
(perhaps due to differences in health status
increasing more among people as individuals
age), and has been increasing in all age groups
in most global regions.
In the subsequent sections of the chapter, we
consider differences by generation as well as by
age. In the rst of these sections we return to one
of the most striking ndings in our two previous
reports: the sharp increase, in every global region,
of benevolent acts in 2020 and after, relative to
Photo S B Vonlanthen on Unsplash

World Happiness Report 2024
13
Measuring and Explaining National
Differences in Life Evaluations
Box 2.1: Measuring Subjective Well-Being
Our measurement of subjective well-being
continues to rely on three main well-being
indicators: life evaluations, positive emotions,
and negative emotions (described in the
report as positive and negative affect).
Our happiness rankings are based on life
evaluations, as the more stable measure of
the quality of people’s lives.
Life evaluations. The Gallup World Poll, which
remains the principal source of data in this
report, asks respondents to evaluate their
current life as a whole using the image of a
ladder, with the best possible life for them as a
10 and worst possible as a 0. Each respondent
provides a numerical response on this scale,
referred to as the Cantril ladder. Typically,
around 1,000 responses are gathered annually
for each country. Weights are used to
construct population-representative national
averages for each year in each country.
We base our usual happiness rankings on a
three-year average of these life evaluations,
since the larger sample size enables more
precise estimates.
Positive emotions. Positive affect is given by
the average of individual yes or no answers
about three emotions: laughter, enjoyment,
and interest (for details see Technical Box 2).
Negative emotions. Negative affect is given
by the average of individual yes or no answers
about three emotions: worry, sadness,
and anger.
Comparing life evaluations and emotions:
• Life evaluations provide the most informative
measure for international comparisons
because they capture quality of life in a more
complete and stable way than do emotional
reports based on daily experiences.
• Life evaluations vary more between countries
than do emotions and are better explained
by the diverse life experiences in different
countries. Emotions yesterday are well
explained by events of the day being asked
about, while life evaluations more closely
reect the circumstances of life as a whole.
We show later in the chapter that emotions
are signicant supports for life evaluations.
• Positive emotions are still more than twice as
frequent as negative emotions, even during
the years since the onset of COVID.
their levels in the three pre-COVID years
2017-2019. This year we ask whether there
have been differences in the extent to which
different generations stepped to help others
during the pandemic.
We then use new evidence from the Gallup/Meta
global state of social connections survey included
in the 2022 round of the Gallup World Poll for 140
countries to show how generational differences in
feelings of social support, loneliness, and being
socially connected relate to six types of reported
social interactions and to overall life evaluations.
Finally, we return to international differences in
life evaluations at different ages and in different
generations. We assess the extent to which the
often-found U-shape in age is present or absent
across the globe, how these results have changed
between 2006-2010 and 2021-2023, and attempt
to separate the age-related changes from
generational ones.
The concluding section highlights our key results.

World Happiness Report 2024
14
Ranking of Happiness 2021-2023
Countries are ranked according to their self-
assessed life evaluations (answers to the Cantril
ladder question in the Gallup World Poll),
averaged over the years 2021-2023.4 The overall
length of each country bar in Figure 2.1 represents
the average response to the ladder question. The
condence intervals for each country’s average
life evaluation are shown by horizontal whiskers
at the right-hand end of each country bar.
Condence intervals for the rank of a country
are shown in Figure 2.1 to the right of each country’s
bar.5 These ranking ranges are wider where there
are many countries with similar averages, and for
countries with smaller sample sizes.6
The online version Figure 2.1 also includes
colour-coded sub-bars in each country row,
representing the extent to which six key variables
contribute to explaining life evaluations. These
variables (described in more detail in Technical
Box 2) are GDP per capita, social support, healthy
Scores are based on individuals’
own assessments of their lives,
in particular their answers to
the single-item Cantril ladder
life-evaluation question.
life expectancy, freedom, generosity, and
corruption. As already noted, our happiness
rankings are not based on any index of these six
factors. Rather, scores are based on individuals’
own assessments of their lives, in particular
their answers to the single-item Cantril ladder
life-evaluation question. We use observed data
on the six variables and estimates of their
associations with life evaluations to help explain
the variation of life evaluations across countries,
much as epidemiologists estimate the extent to
which life expectancy is affected by factors such
as smoking, exercise, and diet.
Photo Alexander Grey on Unsplash

World Happiness Report 2024
15
Figure 2.1: Country Rankings by Life Evaluations in 2021-2023
0 1 2 3 4 5 6 7 8
95% c.i. for rank: 89–107
95% c.i. for rank: 90–107
95% c.i. for rank: 90–107
95% c.i. for rank: 95–107
95% c.i. for rank: 95–107
95% c.i. for rank: 96–107
95% c.i. for rank: 95–108
95% c.i. for rank: 96–108
95% c.i. for rank: 96–107
95% c.i. for rank: 97–108
95% c.i. for rank: 97–109
95% c.i. for rank: 104–114
95% c.i. for rank: 107–120
95% c.i. for rank: 108–120
95% c.i. for rank: 108–121
95% c.i. for rank: 108–121
95% c.i. for rank: 108–123
95% c.i. for rank: 108–122
95% c.i. for rank: 109–123
95% c.i. for rank: 109–125
95% c.i. for rank: 109–125
95% c.i. for rank: 109–125
95% c.i. for rank: 109–125
95% c.i. for rank: 111–125
95% c.i. for rank: 109–126
95% c.i. for rank: 114–126
95% c.i. for rank: 114–126
95% c.i. for rank: 116–126
95% c.i. for rank: 116–126
95% c.i. for rank: 121–130
95% c.i. for rank: 124–131
95% c.i. for rank: 126–131
95% c.i. for rank: 126–131
95% c.i. for rank: 127–131
95% c.i. for rank: 127–133
95% c.i. for rank: 131–139
95% c.i. for rank: 131–138
95% c.i. for rank: 132–140
95% c.i. for rank: 132–141
95% c.i. for rank: 132–141
95% c.i. for rank: 132–141
95% c.i. for rank: 132–141
95% c.i. for rank: 133–141
95% c.i. for rank: 135–141
95% c.i. for rank: 134–141
95% c.i. for rank: 142–142
95% c.i. for rank: 143–143
143. Afghanistan (1.721)
142. Lebanon (2.707)
141. Lesotho (3.186)
140. Sierra Leone (3.245)
139. Congo (Kinshasa) (3.295)
138. Zimbabwe (3.341)
137. Botswana (3.383)
136. Malawi (3.421)
135. Eswatini (3.502)
134. Zambia (3.502)
133. Yemen (3.561)
132. Comoros (3.566)
131. Tanzania (3.781)
130. Ethiopia (3.861)
129. Bangladesh (3.886)
128. Sri Lanka (3.898)
127. Egypt (3.977)
126. India (4.054)
125. Jordan (4.186)
124. Togo (4.214)
123. Madagascar (4.228)
122. Mali (4.232)
121. Liberia (4.269)
120. Ghana (4.289)
119. Cambodia (4.341)
118. Myanmar (4.354)
117. Uganda (4.372)
116. Benin (4.377)
115. Tunisia (4.422)
114. Kenya (4.470)
113. Chad (4.471)
112. Gambia (4.485)
111. Mauritania (4.505)
110. Burkina Faso (4.548)
109. Niger (4.556)
108. Pakistan (4.657)
107. Morocco (4.795)
106. Namibia (4.832)
105. Ukraine (4.873)
104. Cameroon (4.874)
103. State of Palestine (4.879)
102. Nigeria (4.881)
101. Azerbaijan (4.893)
100. Iran (4.923)
99. Senegal (4.969)
98. Turkiye (4.975)
97. Guinea (5.023)
95% c.i. for rank: 39–57
95% c.i. for rank: 45–66
95% c.i. for rank: 46–66
95% c.i. for rank: 46–67
95% c.i. for rank: 46–69
95% c.i. for rank: 47–68
95% c.i. for rank: 47–69
95% c.i. for rank: 47–69
95% c.i. for rank: 50–72
95% c.i. for rank: 50–72
95% c.i. for rank: 50–71
95% c.i. for rank: 50–71
95% c.i. for rank: 48–73
95% c.i. for rank: 47–78
95% c.i. for rank: 50–72
95% c.i. for rank: 50–73
95% c.i. for rank: 52–78
95% c.i. for rank: 50–78
95% c.i. for rank: 50–80
95% c.i. for rank: 54–78
95% c.i. for rank: 54–79
95% c.i. for rank: 57–78
95% c.i. for rank: 57–79
95% c.i. for rank: 60–79
95% c.i. for rank: 58–79
95% c.i. for rank: 64–80
95% c.i. for rank: 64–80
95% c.i. for rank: 64–80
95% c.i. for rank: 64–80
95% c.i. for rank: 64–80
95% c.i. for rank: 70–83
95% c.i. for rank: 73–83
95% c.i. for rank: 79–89
95% c.i. for rank: 79–89
95% c.i. for rank: 79–90
95% c.i. for rank: 80–93
95% c.i. for rank: 80–93
95% c.i. for rank: 81–94
95% c.i. for rank: 81–96
95% c.i. for rank: 82–96
95% c.i. for rank: 82–98
95% c.i. for rank: 82–98
95% c.i. for rank: 84–98
95% c.i. for rank: 84–99
95% c.i. for rank: 84–99
95% c.i. for rank: 86–99
95% c.i. for rank: 87–102
95% c.i. for rank: 88–105
96. Ivory Coast (5.080)
95. Gabon (5.106)
94. Laos (5.139)
93. Nepal (5.158)
92. Iraq (5.166)
91. Georgia (5.185)
90. Mozambique (5.216)
89. Congo (Brazzaville) (5.221)
88. Tajikistan (5.281)
87. Albania (5.304)
86. Hong Kong S.A.R. of China (5.316)
85. Algeria (5.364)
84. North Macedonia (5.369)
83. South Africa (5.422)
82. Armenia (5.455)
81. Bulgaria (5.463)
80. Indonesia (5.568)
79. Venezuela (5.607)
78. Colombia (5.695)
77. Mongolia (5.696)
76. Montenegro (5.707)
75. Kyrgyzstan (5.714)
74. Ecuador (5.725)
73. Bolivia (5.784)
72. Russia (5.785)
71. Moldova (5.816)
70. Mauritius (5.816)
69. Dominican Republic (5.823)
68. Peru (5.841)
67. Jamaica (5.842)
66. Libya (5.866)
65. Bosnia and Herzegovina (5.877)
64. Greece (5.934)
63. Croatia (5.942)
62. Bahrain (5.959)
61. Honduras (5.968)
60. China (5.973)
59. Malaysia (5.975)
58. Thailand (5.976)
57. Paraguay (5.977)
56. Hungary (6.017)
55. Portugal (6.030)
54. Vietnam (6.043)
53. Philippines (6.048)
52. South Korea (6.058)
51. Japan (6.060)
50. Cyprus (6.068)
49. Kazakhstan (6.188)
95% c.i. for rank: 1–1
95% c.i. for rank: 2–3
95% c.i. for rank: 2–3
95% c.i. for rank: 4–7
95% c.i. for rank: 4–7
95% c.i. for rank: 4–7
95% c.i. for rank: 4–7
95% c.i. for rank: 8–13
95% c.i. for rank: 8–15
95% c.i. for rank: 8–15
95% c.i. for rank: 8–16
95% c.i. for rank: 8–19
95% c.i. for rank: 8–19
95% c.i. for rank: 11–20
95% c.i. for rank: 9–22
95% c.i. for rank: 11–21
95% c.i. for rank: 12–25
95% c.i. for rank: 12–25
95% c.i. for rank: 12–25
95% c.i. for rank: 15–28
95% c.i. for rank: 16–28
95% c.i. for rank: 14–29
95% c.i. for rank: 17–29
95% c.i. for rank: 17–29
95% c.i. for rank: 17–33
95% c.i. for rank: 20–33
95% c.i. for rank: 20–33
95% c.i. for rank: 20–36
95% c.i. for rank: 22–38
95% c.i. for rank: 25–40
95% c.i. for rank: 25–42
95% c.i. for rank: 25–43
95% c.i. for rank: 26–44
95% c.i. for rank: 27–44
95% c.i. for rank: 28–44
95% c.i. for rank: 28–44
95% c.i. for rank: 28–45
95% c.i. for rank: 31–48
95% c.i. for rank: 29–49
95% c.i. for rank: 31–49
95% c.i. for rank: 32–49
95% c.i. for rank: 32–50
95% c.i. for rank: 32–49
95% c.i. for rank: 33–49
95% c.i. for rank: 37–49
95% c.i. for rank: 38–52
95% c.i. for rank: 38–58
95% c.i. for rank: 38–5948. Argentina (6.188)
47. Uzbekistan (6.195)
46. Latvia (6.234)
45. Slovakia (6.257)
44. Brazil (6.272)
43. Nicaragua (6.284)
42. Guatemala (6.287)
41. Italy (6.324)
40. Malta (6.346)
39. Panama (6.358)
38. Chile (6.360)
37. Serbia (6.411)
36. Spain (6.421)
35. Poland (6.442)
34. Estonia (6.448)
33. El Salvador (6.469)
32. Romania (6.491)
31. Taiwan Province of China (6.503)
30. Singapore (6.523)
29. Kosovo (6.561)
28. Saudi Arabia (6.594)
27. France (6.609)
26. Uruguay (6.611)
25. Mexico (6.678)
24. Germany (6.719)
23. United States (6.725)
22. United Arab Emirates (6.733)
21. Slovenia (6.743)
20. United Kingdom (6.749)
19. Lithuania (6.818)
18. Czechia (6.822)
17. Ireland (6.838)
16. Belgium (6.894)
15. Canada (6.900)
14. Austria (6.905)
13. Kuwait (6.951)
12. Costa Rica (6.955)
11. New Zealand (7.029)
10. Australia (7.057)
9. Switzerland (7.060)
8. Luxembourg (7.122)
7. Norway (7.302)
6. Netherlands (7.319)
5. Israel (7.341)
4. Sweden (7.344)
3. Iceland (7.525)
2. Denmark (7.583)
1. Finland (7.741)
Average Life Evaluation
95% condence interval
0 1 2 3 4 5 6 7 8
95% c.i. for rank: 89–107
95% c.i. for rank: 90–107
95% c.i. for rank: 90–107
95% c.i. for rank: 95–107
95% c.i. for rank: 95–107
95% c.i. for rank: 96–107
95% c.i. for rank: 95–108
95% c.i. for rank: 96–108
95% c.i. for rank: 96–107
95% c.i. for rank: 97–108
95% c.i. for rank: 97–109
95% c.i. for rank: 104–114
95% c.i. for rank: 107–120
95% c.i. for rank: 108–120
95% c.i. for rank: 108–121
95% c.i. for rank: 108–121
95% c.i. for rank: 108–123
95% c.i. for rank: 108–122
95% c.i. for rank: 109–123
95% c.i. for rank: 109–125
95% c.i. for rank: 109–125
95% c.i. for rank: 109–125
95% c.i. for rank: 109–125
95% c.i. for rank: 111–125
95% c.i. for rank: 109–126
95% c.i. for rank: 114–126
95% c.i. for rank: 114–126
95% c.i. for rank: 116–126
95% c.i. for rank: 116–126
95% c.i. for rank: 121–130
95% c.i. for rank: 124–131
95% c.i. for rank: 126–131
95% c.i. for rank: 126–131
95% c.i. for rank: 127–131
95% c.i. for rank: 127–133
95% c.i. for rank: 131–139
95% c.i. for rank: 131–138
95% c.i. for rank: 132–140
95% c.i. for rank: 132–141
95% c.i. for rank: 132–141
95% c.i. for rank: 132–141
95% c.i. for rank: 132–141
95% c.i. for rank: 133–141
95% c.i. for rank: 135–141
95% c.i. for rank: 134–141
95% c.i. for rank: 142–142
95% c.i. for rank: 143–143
143. Afghanistan (1.721)
142. Lebanon (2.707)
141. Lesotho (3.186)
140. Sierra Leone (3.245)
139. Congo (Kinshasa) (3.295)
138. Zimbabwe (3.341)
137. Botswana (3.383)
136. Malawi (3.421)
135. Eswatini (3.502)
134. Zambia (3.502)
133. Yemen (3.561)
132. Comoros (3.566)
131. Tanzania (3.781)
130. Ethiopia (3.861)
129. Bangladesh (3.886)
128. Sri Lanka (3.898)
127. Egypt (3.977)
126. India (4.054)
125. Jordan (4.186)
124. Togo (4.214)
123. Madagascar (4.228)
122. Mali (4.232)
121. Liberia (4.269)
120. Ghana (4.289)
119. Cambodia (4.341)
118. Myanmar (4.354)
117. Uganda (4.372)
116. Benin (4.377)
115. Tunisia (4.422)
114. Kenya (4.470)
113. Chad (4.471)
112. Gambia (4.485)
111. Mauritania (4.505)
110. Burkina Faso (4.548)
109. Niger (4.556)
108. Pakistan (4.657)
107. Morocco (4.795)
106. Namibia (4.832)
105. Ukraine (4.873)
104. Cameroon (4.874)
103. State of Palestine (4.879)
102. Nigeria (4.881)
101. Azerbaijan (4.893)
100. Iran (4.923)
99. Senegal (4.969)
98. Turkiye (4.975)
97. Guinea (5.023)
95% c.i. for rank: 39–57
95% c.i. for rank: 45–66
95% c.i. for rank: 46–66
95% c.i. for rank: 46–67
95% c.i. for rank: 46–69
95% c.i. for rank: 47–68
95% c.i. for rank: 47–69
95% c.i. for rank: 47–69
95% c.i. for rank: 50–72
95% c.i. for rank: 50–72
95% c.i. for rank: 50–71
95% c.i. for rank: 50–71
95% c.i. for rank: 48–73
95% c.i. for rank: 47–78
95% c.i. for rank: 50–72
95% c.i. for rank: 50–73
95% c.i. for rank: 52–78
95% c.i. for rank: 50–78
95% c.i. for rank: 50–80
95% c.i. for rank: 54–78
95% c.i. for rank: 54–79
95% c.i. for rank: 57–78
95% c.i. for rank: 57–79
95% c.i. for rank: 60–79
95% c.i. for rank: 58–79
95% c.i. for rank: 64–80
95% c.i. for rank: 64–80
95% c.i. for rank: 64–80
95% c.i. for rank: 64–80
95% c.i. for rank: 64–80
95% c.i. for rank: 70–83
95% c.i. for rank: 73–83
95% c.i. for rank: 79–89
95% c.i. for rank: 79–89
95% c.i. for rank: 79–90
95% c.i. for rank: 80–93
95% c.i. for rank: 80–93
95% c.i. for rank: 81–94
95% c.i. for rank: 81–96
95% c.i. for rank: 82–96
95% c.i. for rank: 82–98
95% c.i. for rank: 82–98
95% c.i. for rank: 84–98
95% c.i. for rank: 84–99
95% c.i. for rank: 84–99
95% c.i. for rank: 86–99
95% c.i. for rank: 87–102
95% c.i. for rank: 88–105
96. Ivory Coast (5.080)
95. Gabon (5.106)
94. Laos (5.139)
93. Nepal (5.158)
92. Iraq (5.166)
91. Georgia (5.185)
90. Mozambique (5.216)
89. Congo (Brazzaville) (5.221)
88. Tajikistan (5.281)
87. Albania (5.304)
86. Hong Kong S.A.R. of China (5.316)
85. Algeria (5.364)
84. North Macedonia (5.369)
83. South Africa (5.422)
82. Armenia (5.455)
81. Bulgaria (5.463)
80. Indonesia (5.568)
79. Venezuela (5.607)
78. Colombia (5.695)
77. Mongolia (5.696)
76. Montenegro (5.707)
75. Kyrgyzstan (5.714)
74. Ecuador (5.725)
73. Bolivia (5.784)
72. Russia (5.785)
71. Moldova (5.816)
70. Mauritius (5.816)
69. Dominican Republic (5.823)
68. Peru (5.841)
67. Jamaica (5.842)
66. Libya (5.866)
65. Bosnia and Herzegovina (5.877)
64. Greece (5.934)
63. Croatia (5.942)
62. Bahrain (5.959)
61. Honduras (5.968)
60. China (5.973)
59. Malaysia (5.975)
58. Thailand (5.976)
57. Paraguay (5.977)
56. Hungary (6.017)
55. Portugal (6.030)
54. Vietnam (6.043)
53. Philippines (6.048)
52. South Korea (6.058)
51. Japan (6.060)
50. Cyprus (6.068)
49. Kazakhstan (6.188)
95% c.i. for rank: 1–1
95% c.i. for rank: 2–3
95% c.i. for rank: 2–3
95% c.i. for rank: 4–7
95% c.i. for rank: 4–7
95% c.i. for rank: 4–7
95% c.i. for rank: 4–7
95% c.i. for rank: 8–13
95% c.i. for rank: 8–15
95% c.i. for rank: 8–15
95% c.i. for rank: 8–16
95% c.i. for rank: 8–19
95% c.i. for rank: 8–19
95% c.i. for rank: 11–20
95% c.i. for rank: 9–22
95% c.i. for rank: 11–21
95% c.i. for rank: 12–25
95% c.i. for rank: 12–25
95% c.i. for rank: 12–25
95% c.i. for rank: 15–28
95% c.i. for rank: 16–28
95% c.i. for rank: 14–29
95% c.i. for rank: 17–29
95% c.i. for rank: 17–29
95% c.i. for rank: 17–33
95% c.i. for rank: 20–33
95% c.i. for rank: 20–33
95% c.i. for rank: 20–36
95% c.i. for rank: 22–38
95% c.i. for rank: 25–40
95% c.i. for rank: 25–42
95% c.i. for rank: 25–43
95% c.i. for rank: 26–44
95% c.i. for rank: 27–44
95% c.i. for rank: 28–44
95% c.i. for rank: 28–44
95% c.i. for rank: 28–45
95% c.i. for rank: 31–48
95% c.i. for rank: 29–49
95% c.i. for rank: 31–49
95% c.i. for rank: 32–49
95% c.i. for rank: 32–50
95% c.i. for rank: 32–49
95% c.i. for rank: 33–49
95% c.i. for rank: 37–49
95% c.i. for rank: 38–52
95% c.i. for rank: 38–58
95% c.i. for rank: 38–5948. Argentina (6.188)
47. Uzbekistan (6.195)
46. Latvia (6.234)
45. Slovakia (6.257)
44. Brazil (6.272)
43. Nicaragua (6.284)
42. Guatemala (6.287)
41. Italy (6.324)
40. Malta (6.346)
39. Panama (6.358)
38. Chile (6.360)
37. Serbia (6.411)
36. Spain (6.421)
35. Poland (6.442)
34. Estonia (6.448)
33. El Salvador (6.469)
32. Romania (6.491)
31. Taiwan Province of China (6.503)
30. Singapore (6.523)
29. Kosovo (6.561)
28. Saudi Arabia (6.594)
27. France (6.609)
26. Uruguay (6.611)
25. Mexico (6.678)
24. Germany (6.719)
23. United States (6.725)
22. United Arab Emirates (6.733)
21. Slovenia (6.743)
20. United Kingdom (6.749)
19. Lithuania (6.818)
18. Czechia (6.822)
17. Ireland (6.838)
16. Belgium (6.894)
15. Canada (6.900)
14. Austria (6.905)
13. Kuwait (6.951)
12. Costa Rica (6.955)
11. New Zealand (7.029)
10. Australia (7.057)
9. Switzerland (7.060)
8. Luxembourg (7.122)
7. Norway (7.302)
6. Netherlands (7.319)
5. Israel (7.341)
4. Sweden (7.344)
3. Iceland (7.525)
2. Denmark (7.583)
1. Finland (7.741)

World Happiness Report 2024
16
Figure 2.1: Country Rankings by Life Evaluations in 2021-2023 (continued)
0 1 2 3 4 5 6 7 8
95% c.i. for rank: 89–107
95% c.i. for rank: 90–107
95% c.i. for rank: 90–107
95% c.i. for rank: 95–107
95% c.i. for rank: 95–107
95% c.i. for rank: 96–107
95% c.i. for rank: 95–108
95% c.i. for rank: 96–108
95% c.i. for rank: 96–107
95% c.i. for rank: 97–108
95% c.i. for rank: 97–109
95% c.i. for rank: 104–114
95% c.i. for rank: 107–120
95% c.i. for rank: 108–120
95% c.i. for rank: 108–121
95% c.i. for rank: 108–121
95% c.i. for rank: 108–123
95% c.i. for rank: 108–122
95% c.i. for rank: 109–123
95% c.i. for rank: 109–125
95% c.i. for rank: 109–125
95% c.i. for rank: 109–125
95% c.i. for rank: 109–125
95% c.i. for rank: 111–125
95% c.i. for rank: 109–126
95% c.i. for rank: 114–126
95% c.i. for rank: 114–126
95% c.i. for rank: 116–126
95% c.i. for rank: 116–126
95% c.i. for rank: 121–130
95% c.i. for rank: 124–131
95% c.i. for rank: 126–131
95% c.i. for rank: 126–131
95% c.i. for rank: 127–131
95% c.i. for rank: 127–133
95% c.i. for rank: 131–139
95% c.i. for rank: 131–138
95% c.i. for rank: 132–140
95% c.i. for rank: 132–141
95% c.i. for rank: 132–141
95% c.i. for rank: 132–141
95% c.i. for rank: 132–141
95% c.i. for rank: 133–141
95% c.i. for rank: 135–141
95% c.i. for rank: 134–141
95% c.i. for rank: 142–142
95% c.i. for rank: 143–143
143. Afghanistan (1.721)
142. Lebanon (2.707)
141. Lesotho (3.186)
140. Sierra Leone (3.245)
139. Congo (Kinshasa) (3.295)
138. Zimbabwe (3.341)
137. Botswana (3.383)
136. Malawi (3.421)
135. Eswatini (3.502)
134. Zambia (3.502)
133. Yemen (3.561)
132. Comoros (3.566)
131. Tanzania (3.781)
130. Ethiopia (3.861)
129. Bangladesh (3.886)
128. Sri Lanka (3.898)
127. Egypt (3.977)
126. India (4.054)
125. Jordan (4.186)
124. Togo (4.214)
123. Madagascar (4.228)
122. Mali (4.232)
121. Liberia (4.269)
120. Ghana (4.289)
119. Cambodia (4.341)
118. Myanmar (4.354)
117. Uganda (4.372)
116. Benin (4.377)
115. Tunisia (4.422)
114. Kenya (4.470)
113. Chad (4.471)
112. Gambia (4.485)
111. Mauritania (4.505)
110. Burkina Faso (4.548)
109. Niger (4.556)
108. Pakistan (4.657)
107. Morocco (4.795)
106. Namibia (4.832)
105. Ukraine (4.873)
104. Cameroon (4.874)
103. State of Palestine (4.879)
102. Nigeria (4.881)
101. Azerbaijan (4.893)
100. Iran (4.923)
99. Senegal (4.969)
98. Turkiye (4.975)
97. Guinea (5.023)
95% c.i. for rank: 39–57
95% c.i. for rank: 45–66
95% c.i. for rank: 46–66
95% c.i. for rank: 46–67
95% c.i. for rank: 46–69
95% c.i. for rank: 47–68
95% c.i. for rank: 47–69
95% c.i. for rank: 47–69
95% c.i. for rank: 50–72
95% c.i. for rank: 50–72
95% c.i. for rank: 50–71
95% c.i. for rank: 50–71
95% c.i. for rank: 48–73
95% c.i. for rank: 47–78
95% c.i. for rank: 50–72
95% c.i. for rank: 50–73
95% c.i. for rank: 52–78
95% c.i. for rank: 50–78
95% c.i. for rank: 50–80
95% c.i. for rank: 54–78
95% c.i. for rank: 54–79
95% c.i. for rank: 57–78
95% c.i. for rank: 57–79
95% c.i. for rank: 60–79
95% c.i. for rank: 58–79
95% c.i. for rank: 64–80
95% c.i. for rank: 64–80
95% c.i. for rank: 64–80
95% c.i. for rank: 64–80
95% c.i. for rank: 64–80
95% c.i. for rank: 70–83
95% c.i. for rank: 73–83
95% c.i. for rank: 79–89
95% c.i. for rank: 79–89
95% c.i. for rank: 79–90
95% c.i. for rank: 80–93
95% c.i. for rank: 80–93
95% c.i. for rank: 81–94
95% c.i. for rank: 81–96
95% c.i. for rank: 82–96
95% c.i. for rank: 82–98
95% c.i. for rank: 82–98
95% c.i. for rank: 84–98
95% c.i. for rank: 84–99
95% c.i. for rank: 84–99
95% c.i. for rank: 86–99
95% c.i. for rank: 87–102
95% c.i. for rank: 88–105
96. Ivory Coast (5.080)
95. Gabon (5.106)
94. Laos (5.139)
93. Nepal (5.158)
92. Iraq (5.166)
91. Georgia (5.185)
90. Mozambique (5.216)
89. Congo (Brazzaville) (5.221)
88. Tajikistan (5.281)
87. Albania (5.304)
86. Hong Kong S.A.R. of China (5.316)
85. Algeria (5.364)
84. North Macedonia (5.369)
83. South Africa (5.422)
82. Armenia (5.455)
81. Bulgaria (5.463)
80. Indonesia (5.568)
79. Venezuela (5.607)
78. Colombia (5.695)
77. Mongolia (5.696)
76. Montenegro (5.707)
75. Kyrgyzstan (5.714)
74. Ecuador (5.725)
73. Bolivia (5.784)
72. Russia (5.785)
71. Moldova (5.816)
70. Mauritius (5.816)
69. Dominican Republic (5.823)
68. Peru (5.841)
67. Jamaica (5.842)
66. Libya (5.866)
65. Bosnia and Herzegovina (5.877)
64. Greece (5.934)
63. Croatia (5.942)
62. Bahrain (5.959)
61. Honduras (5.968)
60. China (5.973)
59. Malaysia (5.975)
58. Thailand (5.976)
57. Paraguay (5.977)
56. Hungary (6.017)
55. Portugal (6.030)
54. Vietnam (6.043)
53. Philippines (6.048)
52. South Korea (6.058)
51. Japan (6.060)
50. Cyprus (6.068)
49. Kazakhstan (6.188)
95% c.i. for rank: 1–1
95% c.i. for rank: 2–3
95% c.i. for rank: 2–3
95% c.i. for rank: 4–7
95% c.i. for rank: 4–7
95% c.i. for rank: 4–7
95% c.i. for rank: 4–7
95% c.i. for rank: 8–13
95% c.i. for rank: 8–15
95% c.i. for rank: 8–15
95% c.i. for rank: 8–16
95% c.i. for rank: 8–19
95% c.i. for rank: 8–19
95% c.i. for rank: 11–20
95% c.i. for rank: 9–22
95% c.i. for rank: 11–21
95% c.i. for rank: 12–25
95% c.i. for rank: 12–25
95% c.i. for rank: 12–25
95% c.i. for rank: 15–28
95% c.i. for rank: 16–28
95% c.i. for rank: 14–29
95% c.i. for rank: 17–29
95% c.i. for rank: 17–29
95% c.i. for rank: 17–33
95% c.i. for rank: 20–33
95% c.i. for rank: 20–33
95% c.i. for rank: 20–36
95% c.i. for rank: 22–38
95% c.i. for rank: 25–40
95% c.i. for rank: 25–42
95% c.i. for rank: 25–43
95% c.i. for rank: 26–44
95% c.i. for rank: 27–44
95% c.i. for rank: 28–44
95% c.i. for rank: 28–44
95% c.i. for rank: 28–45
95% c.i. for rank: 31–48
95% c.i. for rank: 29–49
95% c.i. for rank: 31–49
95% c.i. for rank: 32–49
95% c.i. for rank: 32–50
95% c.i. for rank: 32–49
95% c.i. for rank: 33–49
95% c.i. for rank: 37–49
95% c.i. for rank: 38–52
95% c.i. for rank: 38–58
95% c.i. for rank: 38–5948. Argentina (6.188)
47. Uzbekistan (6.195)
46. Latvia (6.234)
45. Slovakia (6.257)
44. Brazil (6.272)
43. Nicaragua (6.284)
42. Guatemala (6.287)
41. Italy (6.324)
40. Malta (6.346)
39. Panama (6.358)
38. Chile (6.360)
37. Serbia (6.411)
36. Spain (6.421)
35. Poland (6.442)
34. Estonia (6.448)
33. El Salvador (6.469)
32. Romania (6.491)
31. Taiwan Province of China (6.503)
30. Singapore (6.523)
29. Kosovo (6.561)
28. Saudi Arabia (6.594)
27. France (6.609)
26. Uruguay (6.611)
25. Mexico (6.678)
24. Germany (6.719)
23. United States (6.725)
22. United Arab Emirates (6.733)
21. Slovenia (6.743)
20. United Kingdom (6.749)
19. Lithuania (6.818)
18. Czechia (6.822)
17. Ireland (6.838)
16. Belgium (6.894)
15. Canada (6.900)
14. Austria (6.905)
13. Kuwait (6.951)
12. Costa Rica (6.955)
11. New Zealand (7.029)
10. Australia (7.057)
9. Switzerland (7.060)
8. Luxembourg (7.122)
7. Norway (7.302)
6. Netherlands (7.319)
5. Israel (7.341)
4. Sweden (7.344)
3. Iceland (7.525)
2. Denmark (7.583)
1. Finland (7.741)
Average Life Evaluation
95% condence interval
0 1 2 3 4 5 6 7 8
95% c.i. for rank: 89–107
95% c.i. for rank: 90–107
95% c.i. for rank: 90–107
95% c.i. for rank: 95–107
95% c.i. for rank: 95–107
95% c.i. for rank: 96–107
95% c.i. for rank: 95–108
95% c.i. for rank: 96–108
95% c.i. for rank: 96–107
95% c.i. for rank: 97–108
95% c.i. for rank: 97–109
95% c.i. for rank: 104–114
95% c.i. for rank: 107–120
95% c.i. for rank: 108–120
95% c.i. for rank: 108–121
95% c.i. for rank: 108–121
95% c.i. for rank: 108–123
95% c.i. for rank: 108–122
95% c.i. for rank: 109–123
95% c.i. for rank: 109–125
95% c.i. for rank: 109–125
95% c.i. for rank: 109–125
95% c.i. for rank: 109–125
95% c.i. for rank: 111–125
95% c.i. for rank: 109–126
95% c.i. for rank: 114–126
95% c.i. for rank: 114–126
95% c.i. for rank: 116–126
95% c.i. for rank: 116–126
95% c.i. for rank: 121–130
95% c.i. for rank: 124–131
95% c.i. for rank: 126–131
95% c.i. for rank: 126–131
95% c.i. for rank: 127–131
95% c.i. for rank: 127–133
95% c.i. for rank: 131–139
95% c.i. for rank: 131–138
95% c.i. for rank: 132–140
95% c.i. for rank: 132–141
95% c.i. for rank: 132–141
95% c.i. for rank: 132–141
95% c.i. for rank: 132–141
95% c.i. for rank: 133–141
95% c.i. for rank: 135–141
95% c.i. for rank: 134–141
95% c.i. for rank: 142–142
95% c.i. for rank: 143–143
143. Afghanistan (1.721)
142. Lebanon (2.707)
141. Lesotho (3.186)
140. Sierra Leone (3.245)
139. Congo (Kinshasa) (3.295)
138. Zimbabwe (3.341)
137. Botswana (3.383)
136. Malawi (3.421)
135. Eswatini (3.502)
134. Zambia (3.502)
133. Yemen (3.561)
132. Comoros (3.566)
131. Tanzania (3.781)
130. Ethiopia (3.861)
129. Bangladesh (3.886)
128. Sri Lanka (3.898)
127. Egypt (3.977)
126. India (4.054)
125. Jordan (4.186)
124. Togo (4.214)
123. Madagascar (4.228)
122. Mali (4.232)
121. Liberia (4.269)
120. Ghana (4.289)
119. Cambodia (4.341)
118. Myanmar (4.354)
117. Uganda (4.372)
116. Benin (4.377)
115. Tunisia (4.422)
114. Kenya (4.470)
113. Chad (4.471)
112. Gambia (4.485)
111. Mauritania (4.505)
110. Burkina Faso (4.548)
109. Niger (4.556)
108. Pakistan (4.657)
107. Morocco (4.795)
106. Namibia (4.832)
105. Ukraine (4.873)
104. Cameroon (4.874)
103. State of Palestine (4.879)
102. Nigeria (4.881)
101. Azerbaijan (4.893)
100. Iran (4.923)
99. Senegal (4.969)
98. Turkiye (4.975)
97. Guinea (5.023)
95% c.i. for rank: 39–57
95% c.i. for rank: 45–66
95% c.i. for rank: 46–66
95% c.i. for rank: 46–67
95% c.i. for rank: 46–69
95% c.i. for rank: 47–68
95% c.i. for rank: 47–69
95% c.i. for rank: 47–69
95% c.i. for rank: 50–72
95% c.i. for rank: 50–72
95% c.i. for rank: 50–71
95% c.i. for rank: 50–71
95% c.i. for rank: 48–73
95% c.i. for rank: 47–78
95% c.i. for rank: 50–72
95% c.i. for rank: 50–73
95% c.i. for rank: 52–78
95% c.i. for rank: 50–78
95% c.i. for rank: 50–80
95% c.i. for rank: 54–78
95% c.i. for rank: 54–79
95% c.i. for rank: 57–78
95% c.i. for rank: 57–79
95% c.i. for rank: 60–79
95% c.i. for rank: 58–79
95% c.i. for rank: 64–80
95% c.i. for rank: 64–80
95% c.i. for rank: 64–80
95% c.i. for rank: 64–80
95% c.i. for rank: 64–80
95% c.i. for rank: 70–83
95% c.i. for rank: 73–83
95% c.i. for rank: 79–89
95% c.i. for rank: 79–89
95% c.i. for rank: 79–90
95% c.i. for rank: 80–93
95% c.i. for rank: 80–93
95% c.i. for rank: 81–94
95% c.i. for rank: 81–96
95% c.i. for rank: 82–96
95% c.i. for rank: 82–98
95% c.i. for rank: 82–98
95% c.i. for rank: 84–98
95% c.i. for rank: 84–99
95% c.i. for rank: 84–99
95% c.i. for rank: 86–99
95% c.i. for rank: 87–102
95% c.i. for rank: 88–105
96. Ivory Coast (5.080)
95. Gabon (5.106)
94. Laos (5.139)
93. Nepal (5.158)
92. Iraq (5.166)
91. Georgia (5.185)
90. Mozambique (5.216)
89. Congo (Brazzaville) (5.221)
88. Tajikistan (5.281)
87. Albania (5.304)
86. Hong Kong S.A.R. of China (5.316)
85. Algeria (5.364)
84. North Macedonia (5.369)
83. South Africa (5.422)
82. Armenia (5.455)
81. Bulgaria (5.463)
80. Indonesia (5.568)
79. Venezuela (5.607)
78. Colombia (5.695)
77. Mongolia (5.696)
76. Montenegro (5.707)
75. Kyrgyzstan (5.714)
74. Ecuador (5.725)
73. Bolivia (5.784)
72. Russia (5.785)
71. Moldova (5.816)
70. Mauritius (5.816)
69. Dominican Republic (5.823)
68. Peru (5.841)
67. Jamaica (5.842)
66. Libya (5.866)
65. Bosnia and Herzegovina (5.877)
64. Greece (5.934)
63. Croatia (5.942)
62. Bahrain (5.959)
61. Honduras (5.968)
60. China (5.973)
59. Malaysia (5.975)
58. Thailand (5.976)
57. Paraguay (5.977)
56. Hungary (6.017)
55. Portugal (6.030)
54. Vietnam (6.043)
53. Philippines (6.048)
52. South Korea (6.058)
51. Japan (6.060)
50. Cyprus (6.068)
49. Kazakhstan (6.188)
95% c.i. for rank: 1–1
95% c.i. for rank: 2–3
95% c.i. for rank: 2–3
95% c.i. for rank: 4–7
95% c.i. for rank: 4–7
95% c.i. for rank: 4–7
95% c.i. for rank: 4–7
95% c.i. for rank: 8–13
95% c.i. for rank: 8–15
95% c.i. for rank: 8–15
95% c.i. for rank: 8–16
95% c.i. for rank: 8–19
95% c.i. for rank: 8–19
95% c.i. for rank: 11–20
95% c.i. for rank: 9–22
95% c.i. for rank: 11–21
95% c.i. for rank: 12–25
95% c.i. for rank: 12–25
95% c.i. for rank: 12–25
95% c.i. for rank: 15–28
95% c.i. for rank: 16–28
95% c.i. for rank: 14–29
95% c.i. for rank: 17–29
95% c.i. for rank: 17–29
95% c.i. for rank: 17–33
95% c.i. for rank: 20–33
95% c.i. for rank: 20–33
95% c.i. for rank: 20–36
95% c.i. for rank: 22–38
95% c.i. for rank: 25–40
95% c.i. for rank: 25–42
95% c.i. for rank: 25–43
95% c.i. for rank: 26–44
95% c.i. for rank: 27–44
95% c.i. for rank: 28–44
95% c.i. for rank: 28–44
95% c.i. for rank: 28–45
95% c.i. for rank: 31–48
95% c.i. for rank: 29–49
95% c.i. for rank: 31–49
95% c.i. for rank: 32–49
95% c.i. for rank: 32–50
95% c.i. for rank: 32–49
95% c.i. for rank: 33–49
95% c.i. for rank: 37–49
95% c.i. for rank: 38–52
95% c.i. for rank: 38–58
95% c.i. for rank: 38–5948. Argentina (6.188)
47. Uzbekistan (6.195)
46. Latvia (6.234)
45. Slovakia (6.257)
44. Brazil (6.272)
43. Nicaragua (6.284)
42. Guatemala (6.287)
41. Italy (6.324)
40. Malta (6.346)
39. Panama (6.358)
38. Chile (6.360)
37. Serbia (6.411)
36. Spain (6.421)
35. Poland (6.442)
34. Estonia (6.448)
33. El Salvador (6.469)
32. Romania (6.491)
31. Taiwan Province of China (6.503)
30. Singapore (6.523)
29. Kosovo (6.561)
28. Saudi Arabia (6.594)
27. France (6.609)
26. Uruguay (6.611)
25. Mexico (6.678)
24. Germany (6.719)
23. United States (6.725)
22. United Arab Emirates (6.733)
21. Slovenia (6.743)
20. United Kingdom (6.749)
19. Lithuania (6.818)
18. Czechia (6.822)
17. Ireland (6.838)
16. Belgium (6.894)
15. Canada (6.900)
14. Austria (6.905)
13. Kuwait (6.951)
12. Costa Rica (6.955)
11. New Zealand (7.029)
10. Australia (7.057)
9. Switzerland (7.060)
8. Luxembourg (7.122)
7. Norway (7.302)
6. Netherlands (7.319)
5. Israel (7.341)
4. Sweden (7.344)
3. Iceland (7.525)
2. Denmark (7.583)
1. Finland (7.741)

World Happiness Report 2024
17
Figure 2.1: Country Rankings by Life Evaluations in 2021-2023 (continued)
0 1 2 3 4 5 6 7 8
95% c.i. for rank: 89–107
95% c.i. for rank: 90–107
95% c.i. for rank: 90–107
95% c.i. for rank: 95–107
95% c.i. for rank: 95–107
95% c.i. for rank: 96–107
95% c.i. for rank: 95–108
95% c.i. for rank: 96–108
95% c.i. for rank: 96–107
95% c.i. for rank: 97–108
95% c.i. for rank: 97–109
95% c.i. for rank: 104–114
95% c.i. for rank: 107–120
95% c.i. for rank: 108–120
95% c.i. for rank: 108–121
95% c.i. for rank: 108–121
95% c.i. for rank: 108–123
95% c.i. for rank: 108–122
95% c.i. for rank: 109–123
95% c.i. for rank: 109–125
95% c.i. for rank: 109–125
95% c.i. for rank: 109–125
95% c.i. for rank: 109–125
95% c.i. for rank: 111–125
95% c.i. for rank: 109–126
95% c.i. for rank: 114–126
95% c.i. for rank: 114–126
95% c.i. for rank: 116–126
95% c.i. for rank: 116–126
95% c.i. for rank: 121–130
95% c.i. for rank: 124–131
95% c.i. for rank: 126–131
95% c.i. for rank: 126–131
95% c.i. for rank: 127–131
95% c.i. for rank: 127–133
95% c.i. for rank: 131–139
95% c.i. for rank: 131–138
95% c.i. for rank: 132–140
95% c.i. for rank: 132–141
95% c.i. for rank: 132–141
95% c.i. for rank: 132–141
95% c.i. for rank: 132–141
95% c.i. for rank: 133–141
95% c.i. for rank: 135–141
95% c.i. for rank: 134–141
95% c.i. for rank: 142–142
95% c.i. for rank: 143–143
143. Afghanistan (1.721)
142. Lebanon (2.707)
141. Lesotho (3.186)
140. Sierra Leone (3.245)
139. Congo (Kinshasa) (3.295)
138. Zimbabwe (3.341)
137. Botswana (3.383)
136. Malawi (3.421)
135. Eswatini (3.502)
134. Zambia (3.502)
133. Yemen (3.561)
132. Comoros (3.566)
131. Tanzania (3.781)
130. Ethiopia (3.861)
129. Bangladesh (3.886)
128. Sri Lanka (3.898)
127. Egypt (3.977)
126. India (4.054)
125. Jordan (4.186)
124. Togo (4.214)
123. Madagascar (4.228)
122. Mali (4.232)
121. Liberia (4.269)
120. Ghana (4.289)
119. Cambodia (4.341)
118. Myanmar (4.354)
117. Uganda (4.372)
116. Benin (4.377)
115. Tunisia (4.422)
114. Kenya (4.470)
113. Chad (4.471)
112. Gambia (4.485)
111. Mauritania (4.505)
110. Burkina Faso (4.548)
109. Niger (4.556)
108. Pakistan (4.657)
107. Morocco (4.795)
106. Namibia (4.832)
105. Ukraine (4.873)
104. Cameroon (4.874)
103. State of Palestine (4.879)
102. Nigeria (4.881)
101. Azerbaijan (4.893)
100. Iran (4.923)
99. Senegal (4.969)
98. Turkiye (4.975)
97. Guinea (5.023)
95% c.i. for rank: 39–57
95% c.i. for rank: 45–66
95% c.i. for rank: 46–66
95% c.i. for rank: 46–67
95% c.i. for rank: 46–69
95% c.i. for rank: 47–68
95% c.i. for rank: 47–69
95% c.i. for rank: 47–69
95% c.i. for rank: 50–72
95% c.i. for rank: 50–72
95% c.i. for rank: 50–71
95% c.i. for rank: 50–71
95% c.i. for rank: 48–73
95% c.i. for rank: 47–78
95% c.i. for rank: 50–72
95% c.i. for rank: 50–73
95% c.i. for rank: 52–78
95% c.i. for rank: 50–78
95% c.i. for rank: 50–80
95% c.i. for rank: 54–78
95% c.i. for rank: 54–79
95% c.i. for rank: 57–78
95% c.i. for rank: 57–79
95% c.i. for rank: 60–79
95% c.i. for rank: 58–79
95% c.i. for rank: 64–80
95% c.i. for rank: 64–80
95% c.i. for rank: 64–80
95% c.i. for rank: 64–80
95% c.i. for rank: 64–80
95% c.i. for rank: 70–83
95% c.i. for rank: 73–83
95% c.i. for rank: 79–89
95% c.i. for rank: 79–89
95% c.i. for rank: 79–90
95% c.i. for rank: 80–93
95% c.i. for rank: 80–93
95% c.i. for rank: 81–94
95% c.i. for rank: 81–96
95% c.i. for rank: 82–96
95% c.i. for rank: 82–98
95% c.i. for rank: 82–98
95% c.i. for rank: 84–98
95% c.i. for rank: 84–99
95% c.i. for rank: 84–99
95% c.i. for rank: 86–99
95% c.i. for rank: 87–102
95% c.i. for rank: 88–105
96. Ivory Coast (5.080)
95. Gabon (5.106)
94. Laos (5.139)
93. Nepal (5.158)
92. Iraq (5.166)
91. Georgia (5.185)
90. Mozambique (5.216)
89. Congo (Brazzaville) (5.221)
88. Tajikistan (5.281)
87. Albania (5.304)
86. Hong Kong S.A.R. of China (5.316)
85. Algeria (5.364)
84. North Macedonia (5.369)
83. South Africa (5.422)
82. Armenia (5.455)
81. Bulgaria (5.463)
80. Indonesia (5.568)
79. Venezuela (5.607)
78. Colombia (5.695)
77. Mongolia (5.696)
76. Montenegro (5.707)
75. Kyrgyzstan (5.714)
74. Ecuador (5.725)
73. Bolivia (5.784)
72. Russia (5.785)
71. Moldova (5.816)
70. Mauritius (5.816)
69. Dominican Republic (5.823)
68. Peru (5.841)
67. Jamaica (5.842)
66. Libya (5.866)
65. Bosnia and Herzegovina (5.877)
64. Greece (5.934)
63. Croatia (5.942)
62. Bahrain (5.959)
61. Honduras (5.968)
60. China (5.973)
59. Malaysia (5.975)
58. Thailand (5.976)
57. Paraguay (5.977)
56. Hungary (6.017)
55. Portugal (6.030)
54. Vietnam (6.043)
53. Philippines (6.048)
52. South Korea (6.058)
51. Japan (6.060)
50. Cyprus (6.068)
49. Kazakhstan (6.188)
95% c.i. for rank: 1–1
95% c.i. for rank: 2–3
95% c.i. for rank: 2–3
95% c.i. for rank: 4–7
95% c.i. for rank: 4–7
95% c.i. for rank: 4–7
95% c.i. for rank: 4–7
95% c.i. for rank: 8–13
95% c.i. for rank: 8–15
95% c.i. for rank: 8–15
95% c.i. for rank: 8–16
95% c.i. for rank: 8–19
95% c.i. for rank: 8–19
95% c.i. for rank: 11–20
95% c.i. for rank: 9–22
95% c.i. for rank: 11–21
95% c.i. for rank: 12–25
95% c.i. for rank: 12–25
95% c.i. for rank: 12–25
95% c.i. for rank: 15–28
95% c.i. for rank: 16–28
95% c.i. for rank: 14–29
95% c.i. for rank: 17–29
95% c.i. for rank: 17–29
95% c.i. for rank: 17–33
95% c.i. for rank: 20–33
95% c.i. for rank: 20–33
95% c.i. for rank: 20–36
95% c.i. for rank: 22–38
95% c.i. for rank: 25–40
95% c.i. for rank: 25–42
95% c.i. for rank: 25–43
95% c.i. for rank: 26–44
95% c.i. for rank: 27–44
95% c.i. for rank: 28–44
95% c.i. for rank: 28–44
95% c.i. for rank: 28–45
95% c.i. for rank: 31–48
95% c.i. for rank: 29–49
95% c.i. for rank: 31–49
95% c.i. for rank: 32–49
95% c.i. for rank: 32–50
95% c.i. for rank: 32–49
95% c.i. for rank: 33–49
95% c.i. for rank: 37–49
95% c.i. for rank: 38–52
95% c.i. for rank: 38–58
95% c.i. for rank: 38–5948. Argentina (6.188)
47. Uzbekistan (6.195)
46. Latvia (6.234)
45. Slovakia (6.257)
44. Brazil (6.272)
43. Nicaragua (6.284)
42. Guatemala (6.287)
41. Italy (6.324)
40. Malta (6.346)
39. Panama (6.358)
38. Chile (6.360)
37. Serbia (6.411)
36. Spain (6.421)
35. Poland (6.442)
34. Estonia (6.448)
33. El Salvador (6.469)
32. Romania (6.491)
31. Taiwan Province of China (6.503)
30. Singapore (6.523)
29. Kosovo (6.561)
28. Saudi Arabia (6.594)
27. France (6.609)
26. Uruguay (6.611)
25. Mexico (6.678)
24. Germany (6.719)
23. United States (6.725)
22. United Arab Emirates (6.733)
21. Slovenia (6.743)
20. United Kingdom (6.749)
19. Lithuania (6.818)
18. Czechia (6.822)
17. Ireland (6.838)
16. Belgium (6.894)
15. Canada (6.900)
14. Austria (6.905)
13. Kuwait (6.951)
12. Costa Rica (6.955)
11. New Zealand (7.029)
10. Australia (7.057)
9. Switzerland (7.060)
8. Luxembourg (7.122)
7. Norway (7.302)
6. Netherlands (7.319)
5. Israel (7.341)
4. Sweden (7.344)
3. Iceland (7.525)
2. Denmark (7.583)
1. Finland (7.741)
0 1 2 3 4 5 6 7 8
95% c.i. for rank: 89–107
95% c.i. for rank: 90–107
95% c.i. for rank: 90–107
95% c.i. for rank: 95–107
95% c.i. for rank: 95–107
95% c.i. for rank: 96–107
95% c.i. for rank: 95–108
95% c.i. for rank: 96–108
95% c.i. for rank: 96–107
95% c.i. for rank: 97–108
95% c.i. for rank: 97–109
95% c.i. for rank: 104–114
95% c.i. for rank: 107–120
95% c.i. for rank: 108–120
95% c.i. for rank: 108–121
95% c.i. for rank: 108–121
95% c.i. for rank: 108–123
95% c.i. for rank: 108–122
95% c.i. for rank: 109–123
95% c.i. for rank: 109–125
95% c.i. for rank: 109–125
95% c.i. for rank: 109–125
95% c.i. for rank: 109–125
95% c.i. for rank: 111–125
95% c.i. for rank: 109–126
95% c.i. for rank: 114–126
95% c.i. for rank: 114–126
95% c.i. for rank: 116–126
95% c.i. for rank: 116–126
95% c.i. for rank: 121–130
95% c.i. for rank: 124–131
95% c.i. for rank: 126–131
95% c.i. for rank: 126–131
95% c.i. for rank: 127–131
95% c.i. for rank: 127–133
95% c.i. for rank: 131–139
95% c.i. for rank: 131–138
95% c.i. for rank: 132–140
95% c.i. for rank: 132–141
95% c.i. for rank: 132–141
95% c.i. for rank: 132–141
95% c.i. for rank: 132–141
95% c.i. for rank: 133–141
95% c.i. for rank: 135–141
95% c.i. for rank: 134–141
95% c.i. for rank: 142–142
95% c.i. for rank: 143–143
143. Afghanistan (1.721)
142. Lebanon (2.707)
141. Lesotho (3.186)
140. Sierra Leone (3.245)
139. Congo (Kinshasa) (3.295)
138. Zimbabwe (3.341)
137. Botswana (3.383)
136. Malawi (3.421)
135. Eswatini (3.502)
134. Zambia (3.502)
133. Yemen (3.561)
132. Comoros (3.566)
131. Tanzania (3.781)
130. Ethiopia (3.861)
129. Bangladesh (3.886)
128. Sri Lanka (3.898)
127. Egypt (3.977)
126. India (4.054)
125. Jordan (4.186)
124. Togo (4.214)
123. Madagascar (4.228)
122. Mali (4.232)
121. Liberia (4.269)
120. Ghana (4.289)
119. Cambodia (4.341)
118. Myanmar (4.354)
117. Uganda (4.372)
116. Benin (4.377)
115. Tunisia (4.422)
114. Kenya (4.470)
113. Chad (4.471)
112. Gambia (4.485)
111. Mauritania (4.505)
110. Burkina Faso (4.548)
109. Niger (4.556)
108. Pakistan (4.657)
107. Morocco (4.795)
106. Namibia (4.832)
105. Ukraine (4.873)
104. Cameroon (4.874)
103. State of Palestine (4.879)
102. Nigeria (4.881)
101. Azerbaijan (4.893)
100. Iran (4.923)
99. Senegal (4.969)
98. Turkiye (4.975)
97. Guinea (5.023)
95% c.i. for rank: 39–57
95% c.i. for rank: 45–66
95% c.i. for rank: 46–66
95% c.i. for rank: 46–67
95% c.i. for rank: 46–69
95% c.i. for rank: 47–68
95% c.i. for rank: 47–69
95% c.i. for rank: 47–69
95% c.i. for rank: 50–72
95% c.i. for rank: 50–72
95% c.i. for rank: 50–71
95% c.i. for rank: 50–71
95% c.i. for rank: 48–73
95% c.i. for rank: 47–78
95% c.i. for rank: 50–72
95% c.i. for rank: 50–73
95% c.i. for rank: 52–78
95% c.i. for rank: 50–78
95% c.i. for rank: 50–80
95% c.i. for rank: 54–78
95% c.i. for rank: 54–79
95% c.i. for rank: 57–78
95% c.i. for rank: 57–79
95% c.i. for rank: 60–79
95% c.i. for rank: 58–79
95% c.i. for rank: 64–80
95% c.i. for rank: 64–80
95% c.i. for rank: 64–80
95% c.i. for rank: 64–80
95% c.i. for rank: 64–80
95% c.i. for rank: 70–83
95% c.i. for rank: 73–83
95% c.i. for rank: 79–89
95% c.i. for rank: 79–89
95% c.i. for rank: 79–90
95% c.i. for rank: 80–93
95% c.i. for rank: 80–93
95% c.i. for rank: 81–94
95% c.i. for rank: 81–96
95% c.i. for rank: 82–96
95% c.i. for rank: 82–98
95% c.i. for rank: 82–98
95% c.i. for rank: 84–98
95% c.i. for rank: 84–99
95% c.i. for rank: 84–99
95% c.i. for rank: 86–99
95% c.i. for rank: 87–102
95% c.i. for rank: 88–105
96. Ivory Coast (5.080)
95. Gabon (5.106)
94. Laos (5.139)
93. Nepal (5.158)
92. Iraq (5.166)
91. Georgia (5.185)
90. Mozambique (5.216)
89. Congo (Brazzaville) (5.221)
88. Tajikistan (5.281)
87. Albania (5.304)
86. Hong Kong S.A.R. of China (5.316)
85. Algeria (5.364)
84. North Macedonia (5.369)
83. South Africa (5.422)
82. Armenia (5.455)
81. Bulgaria (5.463)
80. Indonesia (5.568)
79. Venezuela (5.607)
78. Colombia (5.695)
77. Mongolia (5.696)
76. Montenegro (5.707)
75. Kyrgyzstan (5.714)
74. Ecuador (5.725)
73. Bolivia (5.784)
72. Russia (5.785)
71. Moldova (5.816)
70. Mauritius (5.816)
69. Dominican Republic (5.823)
68. Peru (5.841)
67. Jamaica (5.842)
66. Libya (5.866)
65. Bosnia and Herzegovina (5.877)
64. Greece (5.934)
63. Croatia (5.942)
62. Bahrain (5.959)
61. Honduras (5.968)
60. China (5.973)
59. Malaysia (5.975)
58. Thailand (5.976)
57. Paraguay (5.977)
56. Hungary (6.017)
55. Portugal (6.030)
54. Vietnam (6.043)
53. Philippines (6.048)
52. South Korea (6.058)
51. Japan (6.060)
50. Cyprus (6.068)
49. Kazakhstan (6.188)
95% c.i. for rank: 1–1
95% c.i. for rank: 2–3
95% c.i. for rank: 2–3
95% c.i. for rank: 4–7
95% c.i. for rank: 4–7
95% c.i. for rank: 4–7
95% c.i. for rank: 4–7
95% c.i. for rank: 8–13
95% c.i. for rank: 8–15
95% c.i. for rank: 8–15
95% c.i. for rank: 8–16
95% c.i. for rank: 8–19
95% c.i. for rank: 8–19
95% c.i. for rank: 11–20
95% c.i. for rank: 9–22
95% c.i. for rank: 11–21
95% c.i. for rank: 12–25
95% c.i. for rank: 12–25
95% c.i. for rank: 12–25
95% c.i. for rank: 15–28
95% c.i. for rank: 16–28
95% c.i. for rank: 14–29
95% c.i. for rank: 17–29
95% c.i. for rank: 17–29
95% c.i. for rank: 17–33
95% c.i. for rank: 20–33
95% c.i. for rank: 20–33
95% c.i. for rank: 20–36
95% c.i. for rank: 22–38
95% c.i. for rank: 25–40
95% c.i. for rank: 25–42
95% c.i. for rank: 25–43
95% c.i. for rank: 26–44
95% c.i. for rank: 27–44
95% c.i. for rank: 28–44
95% c.i. for rank: 28–44
95% c.i. for rank: 28–45
95% c.i. for rank: 31–48
95% c.i. for rank: 29–49
95% c.i. for rank: 31–49
95% c.i. for rank: 32–49
95% c.i. for rank: 32–50
95% c.i. for rank: 32–49
95% c.i. for rank: 33–49
95% c.i. for rank: 37–49
95% c.i. for rank: 38–52
95% c.i. for rank: 38–58
95% c.i. for rank: 38–5948. Argentina (6.188)
47. Uzbekistan (6.195)
46. Latvia (6.234)
45. Slovakia (6.257)
44. Brazil (6.272)
43. Nicaragua (6.284)
42. Guatemala (6.287)
41. Italy (6.324)
40. Malta (6.346)
39. Panama (6.358)
38. Chile (6.360)
37. Serbia (6.411)
36. Spain (6.421)
35. Poland (6.442)
34. Estonia (6.448)
33. El Salvador (6.469)
32. Romania (6.491)
31. Taiwan Province of China (6.503)
30. Singapore (6.523)
29. Kosovo (6.561)
28. Saudi Arabia (6.594)
27. France (6.609)
26. Uruguay (6.611)
25. Mexico (6.678)
24. Germany (6.719)
23. United States (6.725)
22. United Arab Emirates (6.733)
21. Slovenia (6.743)
20. United Kingdom (6.749)
19. Lithuania (6.818)
18. Czechia (6.822)
17. Ireland (6.838)
16. Belgium (6.894)
15. Canada (6.900)
14. Austria (6.905)
13. Kuwait (6.951)
12. Costa Rica (6.955)
11. New Zealand (7.029)
10. Australia (7.057)
9. Switzerland (7.060)
8. Luxembourg (7.122)
7. Norway (7.302)
6. Netherlands (7.319)
5. Israel (7.341)
4. Sweden (7.344)
3. Iceland (7.525)
2. Denmark (7.583)
1. Finland (7.741)
Average Life Evaluation
95% condence interval
0 1 2 3 4 5 6 7 8
95% c.i. for rank: 89–107
95% c.i. for rank: 90–107
95% c.i. for rank: 90–107
95% c.i. for rank: 95–107
95% c.i. for rank: 95–107
95% c.i. for rank: 96–107
95% c.i. for rank: 95–108
95% c.i. for rank: 96–108
95% c.i. for rank: 96–107
95% c.i. for rank: 97–108
95% c.i. for rank: 97–109
95% c.i. for rank: 104–114
95% c.i. for rank: 107–120
95% c.i. for rank: 108–120
95% c.i. for rank: 108–121
95% c.i. for rank: 108–121
95% c.i. for rank: 108–123
95% c.i. for rank: 108–122
95% c.i. for rank: 109–123
95% c.i. for rank: 109–125
95% c.i. for rank: 109–125
95% c.i. for rank: 109–125
95% c.i. for rank: 109–125
95% c.i. for rank: 111–125
95% c.i. for rank: 109–126
95% c.i. for rank: 114–126
95% c.i. for rank: 114–126
95% c.i. for rank: 116–126
95% c.i. for rank: 116–126
95% c.i. for rank: 121–130
95% c.i. for rank: 124–131
95% c.i. for rank: 126–131
95% c.i. for rank: 126–131
95% c.i. for rank: 127–131
95% c.i. for rank: 127–133
95% c.i. for rank: 131–139
95% c.i. for rank: 131–138
95% c.i. for rank: 132–140
95% c.i. for rank: 132–141
95% c.i. for rank: 132–141
95% c.i. for rank: 132–141
95% c.i. for rank: 132–141
95% c.i. for rank: 133–141
95% c.i. for rank: 135–141
95% c.i. for rank: 134–141
95% c.i. for rank: 142–142
95% c.i. for rank: 143–143
143. Afghanistan (1.721)
142. Lebanon (2.707)
141. Lesotho (3.186)
140. Sierra Leone (3.245)
139. Congo (Kinshasa) (3.295)
138. Zimbabwe (3.341)
137. Botswana (3.383)
136. Malawi (3.421)
135. Eswatini (3.502)
134. Zambia (3.502)
133. Yemen (3.561)
132. Comoros (3.566)
131. Tanzania (3.781)
130. Ethiopia (3.861)
129. Bangladesh (3.886)
128. Sri Lanka (3.898)
127. Egypt (3.977)
126. India (4.054)
125. Jordan (4.186)
124. Togo (4.214)
123. Madagascar (4.228)
122. Mali (4.232)
121. Liberia (4.269)
120. Ghana (4.289)
119. Cambodia (4.341)
118. Myanmar (4.354)
117. Uganda (4.372)
116. Benin (4.377)
115. Tunisia (4.422)
114. Kenya (4.470)
113. Chad (4.471)
112. Gambia (4.485)
111. Mauritania (4.505)
110. Burkina Faso (4.548)
109. Niger (4.556)
108. Pakistan (4.657)
107. Morocco (4.795)
106. Namibia (4.832)
105. Ukraine (4.873)
104. Cameroon (4.874)
103. State of Palestine (4.879)
102. Nigeria (4.881)
101. Azerbaijan (4.893)
100. Iran (4.923)
99. Senegal (4.969)
98. Turkiye (4.975)
97. Guinea (5.023)
95% c.i. for rank: 39–57
95% c.i. for rank: 45–66
95% c.i. for rank: 46–66
95% c.i. for rank: 46–67
95% c.i. for rank: 46–69
95% c.i. for rank: 47–68
95% c.i. for rank: 47–69
95% c.i. for rank: 47–69
95% c.i. for rank: 50–72
95% c.i. for rank: 50–72
95% c.i. for rank: 50–71
95% c.i. for rank: 50–71
95% c.i. for rank: 48–73
95% c.i. for rank: 47–78
95% c.i. for rank: 50–72
95% c.i. for rank: 50–73
95% c.i. for rank: 52–78
95% c.i. for rank: 50–78
95% c.i. for rank: 50–80
95% c.i. for rank: 54–78
95% c.i. for rank: 54–79
95% c.i. for rank: 57–78
95% c.i. for rank: 57–79
95% c.i. for rank: 60–79
95% c.i. for rank: 58–79
95% c.i. for rank: 64–80
95% c.i. for rank: 64–80
95% c.i. for rank: 64–80
95% c.i. for rank: 64–80
95% c.i. for rank: 64–80
95% c.i. for rank: 70–83
95% c.i. for rank: 73–83
95% c.i. for rank: 79–89
95% c.i. for rank: 79–89
95% c.i. for rank: 79–90
95% c.i. for rank: 80–93
95% c.i. for rank: 80–93
95% c.i. for rank: 81–94
95% c.i. for rank: 81–96
95% c.i. for rank: 82–96
95% c.i. for rank: 82–98
95% c.i. for rank: 82–98
95% c.i. for rank: 84–98
95% c.i. for rank: 84–99
95% c.i. for rank: 84–99
95% c.i. for rank: 86–99
95% c.i. for rank: 87–102
95% c.i. for rank: 88–105
96. Ivory Coast (5.080)
95. Gabon (5.106)
94. Laos (5.139)
93. Nepal (5.158)
92. Iraq (5.166)
91. Georgia (5.185)
90. Mozambique (5.216)
89. Congo (Brazzaville) (5.221)
88. Tajikistan (5.281)
87. Albania (5.304)
86. Hong Kong S.A.R. of China (5.316)
85. Algeria (5.364)
84. North Macedonia (5.369)
83. South Africa (5.422)
82. Armenia (5.455)
81. Bulgaria (5.463)
80. Indonesia (5.568)
79. Venezuela (5.607)
78. Colombia (5.695)
77. Mongolia (5.696)
76. Montenegro (5.707)
75. Kyrgyzstan (5.714)
74. Ecuador (5.725)
73. Bolivia (5.784)
72. Russia (5.785)
71. Moldova (5.816)
70. Mauritius (5.816)
69. Dominican Republic (5.823)
68. Peru (5.841)
67. Jamaica (5.842)
66. Libya (5.866)
65. Bosnia and Herzegovina (5.877)
64. Greece (5.934)
63. Croatia (5.942)
62. Bahrain (5.959)
61. Honduras (5.968)
60. China (5.973)
59. Malaysia (5.975)
58. Thailand (5.976)
57. Paraguay (5.977)
56. Hungary (6.017)
55. Portugal (6.030)
54. Vietnam (6.043)
53. Philippines (6.048)
52. South Korea (6.058)
51. Japan (6.060)
50. Cyprus (6.068)
49. Kazakhstan (6.188)
95% c.i. for rank: 1–1
95% c.i. for rank: 2–3
95% c.i. for rank: 2–3
95% c.i. for rank: 4–7
95% c.i. for rank: 4–7
95% c.i. for rank: 4–7
95% c.i. for rank: 4–7
95% c.i. for rank: 8–13
95% c.i. for rank: 8–15
95% c.i. for rank: 8–15
95% c.i. for rank: 8–16
95% c.i. for rank: 8–19
95% c.i. for rank: 8–19
95% c.i. for rank: 11–20
95% c.i. for rank: 9–22
95% c.i. for rank: 11–21
95% c.i. for rank: 12–25
95% c.i. for rank: 12–25
95% c.i. for rank: 12–25
95% c.i. for rank: 15–28
95% c.i. for rank: 16–28
95% c.i. for rank: 14–29
95% c.i. for rank: 17–29
95% c.i. for rank: 17–29
95% c.i. for rank: 17–33
95% c.i. for rank: 20–33
95% c.i. for rank: 20–33
95% c.i. for rank: 20–36
95% c.i. for rank: 22–38
95% c.i. for rank: 25–40
95% c.i. for rank: 25–42
95% c.i. for rank: 25–43
95% c.i. for rank: 26–44
95% c.i. for rank: 27–44
95% c.i. for rank: 28–44
95% c.i. for rank: 28–44
95% c.i. for rank: 28–45
95% c.i. for rank: 31–48
95% c.i. for rank: 29–49
95% c.i. for rank: 31–49
95% c.i. for rank: 32–49
95% c.i. for rank: 32–50
95% c.i. for rank: 32–49
95% c.i. for rank: 33–49
95% c.i. for rank: 37–49
95% c.i. for rank: 38–52
95% c.i. for rank: 38–58
95% c.i. for rank: 38–5948. Argentina (6.188)
47. Uzbekistan (6.195)
46. Latvia (6.234)
45. Slovakia (6.257)
44. Brazil (6.272)
43. Nicaragua (6.284)
42. Guatemala (6.287)
41. Italy (6.324)
40. Malta (6.346)
39. Panama (6.358)
38. Chile (6.360)
37. Serbia (6.411)
36. Spain (6.421)
35. Poland (6.442)
34. Estonia (6.448)
33. El Salvador (6.469)
32. Romania (6.491)
31. Taiwan Province of China (6.503)
30. Singapore (6.523)
29. Kosovo (6.561)
28. Saudi Arabia (6.594)
27. France (6.609)
26. Uruguay (6.611)
25. Mexico (6.678)
24. Germany (6.719)
23. United States (6.725)
22. United Arab Emirates (6.733)
21. Slovenia (6.743)
20. United Kingdom (6.749)
19. Lithuania (6.818)
18. Czechia (6.822)
17. Ireland (6.838)
16. Belgium (6.894)
15. Canada (6.900)
14. Austria (6.905)
13. Kuwait (6.951)
12. Costa Rica (6.955)
11. New Zealand (7.029)
10. Australia (7.057)
9. Switzerland (7.060)
8. Luxembourg (7.122)
7. Norway (7.302)
6. Netherlands (7.319)
5. Israel (7.341)
4. Sweden (7.344)
3. Iceland (7.525)
2. Denmark (7.583)
1. Finland (7.741)
¨
World Happiness Report 2024
18
What do the latest data show for the
2021-2023 country rankings?7
Two features carry over from previous editions of
the World Happiness Report. First, there is still a
lot of year-to-year consistency in the way people
rate their lives in different countries, and since our
rankings are based on a three-year average there
is information carried forward from one year
to the next. In the case of cataclysmic events
happening during a particular year, their effect
on the rankings will depend on when the survey
took place, and will be muted by the three-year
averaging. In the case of the October 7th attack
on Israel and the subsequent war between Israel
and Hamas, the survey in Palestine took place
earlier in the year and the Israel survey after the
hostage taking but before much of the subsequent
warfare. Life evaluations fell sharply in Israel, by
0.9 on the 10-point scale, only one-third of which
will enter the three-year averages discussed
below. (See the Statistical Appendix for individual
country trajectories on an annual basis, plotted
separately by age group and by generation).8
Second, there remains a large gap between the
top and bottom countries, a full six points (on
the 0 to 10 scale) between Finland at the top and
Afghanistan at the bottom. The top countries are
more tightly grouped than the bottom ones. The
top twenty countries all fall within 1 point of each
other, compared with a 2.5 point spread among
the bottom twenty. The remaining 100-odd
countries cover the remaining 2.5 points of the
total range. This means that relatively modest
changes in a national average can lead to a large
shift in ranks, as illustrated by the 95% condence
region exceeding 25 ranks for several countries
in the middle of the global list.
Happiness scores are based on the resident
populations in each country, rather than their
citizenship or place of birth. In World Happiness
Report 2018 we split the responses between the
locally and foreign-born populations in each
country and found the happiness rankings to be
essentially the same for the two groups.9 There
was some footprint effect after migration, and
some tendency for migrants to move to happier
countries, so that among 20 happiest countries in
that report, the average happiness for the locally
born was about 0.2 points higher than for the
foreign-born.
How have the rankings changed since last year?
While the top ten countries remain largely
unchanged, there has been much more action in
the top twenty. Costa Rica and Kuwait are both
new entrants10 to the top 20, at positions 12 and
13. The continuing convergence in happiness
levels between the two sides of Europe led last
year to Czechia and Lithuania being in the top
twenty, nearly joined now by Slovenia in 21st
place. The new entrants are matched by the
departures of the United States and Germany
from the top 20, dropping from 15 and 16 last
year to 23 and 24 this year.
The top countries no longer include any of the
largest countries. In the top ten countries only
the Netherlands and Australia have populations
over 15 million. In the whole of the top twenty,
only Canada and the United Kingdom have
populations over 30 million.
Why do happiness levels differ?
In Table 2.1 we present our latest modelling of
national average life evaluations and measures
of positive and negative emotions (affect) by
country and year.11 The results in the rst column
explain national average life evaluations in terms
of six key variables: GDP per capita, healthy life
expectancy, having someone to count on,
freedom to make life choices, generosity, and
freedom from corruption.12 Taken together, these
six variables explain more than three-quarters of
the variation in national annual average ladder
scores across countries and years, using data
from 2005 through 2023.13 The six variables were
originally chosen as the best available measures
of factors established in both experimental and
survey data as having signicant links to subjective
well-being, and especially to life evaluations.14 The
While the top ten countries
remain largely unchanged,
there has been much more
action in the top twenty.

World Happiness Report 2024
19
explanatory power of the unchanged model has
gradually increased as we have added more years
to the sample, which is now almost three times as
large as when the equation was rst introduced in
World Happiness Report 2013. We keep looking
for possible improvements when and if new
evidence becomes available.15
The second and third columns of Table 2.1 use the
same six variables to estimate equations for
national averages of positive and negative affect,
where both are based on answers about yesterday’s
emotional experiences (see Technical Box 2 for
how the affect measures are constructed). In
general, emotional measures, and especially
negative ones, are differently and much less
fully explained by the six variables than are life
evaluations. Per-capita income and healthy life
expectancy have signicant effects on life
evaluations,16 but not, in these national average
data, on positive emotions.17 But the social
variables do have signicant effects on both
positive and negative emotions. Bearing in mind
that positive and negative emotions are measured
on a 0 to 1 scale, while life evaluations are on a
0 to 10 scale, having someone to count on can
be seen to have similar proportionate effects
on positive and negative emotions as on life
evaluations. Freedom and generosity have even
larger associations with positive emotions than
with the Cantril ladder. Negative emotions are
signicantly reduced by social support, a sense
of freedom, and the absence of corruption.
In the fourth column, we re-estimate the life
evaluation equation from column 1, adding
both positive and negative emotions to partially
implement the Aristotelian presumption that
sustained positive emotions are important
supports for a good life.18 The results continue
to buttress a nding in psychology that the
existence of positive emotions matters more than
the absence of negative ones when predicting
either longevity19 or resistance to the common
cold.20 Consistent with this evidence, we nd that
positive affect has a large and highly signicant
impact in the nal equation of Table 2.1, while
negative affect has none. In a parallel way, we
show in a later section of this chapter that the
effects of a positive social environment are
larger than the effects of loneliness in all age
groups and generations.
As for the coefcients on the other variables in
the fourth column, the changes are substantial
only on those variables – especially freedom and
generosity – that have the largest impacts on
positive affect. Thus we can infer that positive
emotions play a strong role in supporting life
evaluations, and that much of the impact of
freedom and generosity on life evaluations is
channelled through their inuence on positive
emotions. That is, freedom and generosity have
large impacts on positive affect, which in turn
has a major impact on life evaluations. The
Gallup World Poll does not have a widely
available measure of life purpose to test whether
it also would play a strong role in support of
high life evaluations.
Photo Francis Odeyemi on Unsplash

World Happiness Report 2024
20
Table 2.1: Regressions to Explain Average Happiness across Countries (Pooled OLS)
Dependent Variable
Independent Variable Cantril Ladder Positive Affect Negative Affect Cantril Ladder
Log GDP per capita
0.349 -.015 -.002 0.382
(0.068)*** (0.009) (0.007) (0.066)***
Social support
2.563 0.315 -.342 1.936
(0.349)*** (0.056)*** (0.045)*** (0.349)***
Healthy life expectancy at birth
0.028 -.0007 0.003 0.029
(0.011)*** (0.001) (0.001)*** (0.011)***
Freedom to make life choices
1.378 0.376 -.090 0.571
(0.295)*** (0.044)*** (0.039)** (0.273)**
Generosity
0.487 0.084 0.029 0.296
(0.252)* (0.032)*** (0.027) (0.241)
Perceptions of corruption
-.733 -.012 0.093 -.724
(0.256)*** (0.027) (0.022)*** (0.243)***
Positive affect
2.206
(0.33)***
Negative affect
0.193
(0.381)
Year xed effects Included Included Included Included
Number of countries 155 155 155 155
Number of obs. 2103 2098 2102 2097
Adjusted R-squared 0.757 0.43 0.343 0.781
Notes: This is a pooled OLS regression for a tattered panel explaining annual national average
Cantril ladder responses from all available surveys from 2005 through 2023. See Technical Box 2 for detailed information about each of the predictors. Coefcients
are reported with robust standard errors clustered by country (in parentheses). ***, **, and * indicate signicance at the 1, 5, and 10 percent levels respectively.

World Happiness Report 2024
21
Box 2.2: Detailed information about each of the predictors in Table 2.1
1. GDP per capita is in terms of Purchasing
Power Parity (PPP) adjusted to constant
2017 international dollars, taken from the
World Development Indicators (WDI) by
the World Bank (version 23, metadata last
updated on September 27, 2023). See
Statistical Appendix for more details. GDP
data for 2023 are not yet available, so we
extend the GDP time series from 2022 to
2023 using country-specic forecasts of
real GDP growth from the OECD Economic
Outlook No. 113 (June 2023) or, if missing,
from the World Bank’s Global Economic
Prospects (last updated: June 6, 2023),
after adjustment for population growth. The
equation uses the natural log of GDP per
capita, as this form ts the data signicantly
better than GDP per capita.
2. The time series for healthy life expectancy
at birth are constructed based on data from
the World Health Organization (WHO)
Global Health Observatory data repository,
with data available for 2005, 2010, 2015,
2016, and 2019. To match this report’s
sample period (2005-2023), interpolation
and extrapolation are used. See Statistical
Appendix for more details.
3. Social support is the national average of the
binary responses (0=no, 1=yes) to the Gallup
World Poll (GWP) question “If you were in
trouble, do you have relatives or friends you
can count on to help you whenever you
need them, or not?”
4. Freedom to make life choices is the national
average of binary responses to the GWP
question “Are you satised or dissatised
with your freedom to choose what you do
with your life?”
5. Generosity is the residual of regressing
the national average of GWP responses to
the donation question “Have you donated
money to a charity in the past month?”
on log GDP per capita.
6. Perceptions of corruption are the average
of binary answers to two GWP questions:
“Is corruption widespread throughout the
government or not?” and “Is corruption
widespread within businesses or not?”
Where data for government corruption
are missing, the perception of business
corruption is used as the overall
corruption-perception measure.
7. Positive affect is dened as the average of
previous-day affect measures for laughter,
enjoyment, and doing interesting things. The
inclusion of doing interesting things (rst
added for World Happiness Report 2022),
gives us three components in each of
positive and negative affect, and slightly
improves the equation t in column 4. The
general form for the affect questions is: Did
you experience the following feelings during
a lot of the day yesterday? See Statistical
Appendix 1 for more details.
8. Negative affect is dened as the average of
previous-day affect measures for worry,
sadness, and anger.
World Happiness Report 2024
22
The variables we use in our Table 2.1 modelling
may be taking credit properly due to other
variables, or to unmeasured factors. There are
also likely to be vicious or virtuous circles, with
two-way linkages among the variables. For
example, there is much evidence that those who
have happier lives are likely to live longer,21 and
be more trusting, more cooperative, and generally
better able to meet life’s demands.22 This will
double back to improve health, income, generosity,
corruption, and a sense of freedom. Collectively,
these possibilities suggest that we should interpret
the observed relationships with some caution.
Another possible reason for a cautious interpreta-
tion of our results is that some of the data come
from the same respondents as the life evaluations
and are thus possibly determined by common
factors. This is less likely when comparing national
averages because individual differences in
personality and individual life circumstances tend
to average out at the national level. To provide
even more assurance that our results are not
signicantly biassed because we are using the
same respondents to report life evaluations, social
support, freedom, generosity, and corruption, we
tested the robustness of our procedure by split-
ting each country’s respondents randomly into
two groups (see Table 10 of Statistical Appendix 1
of World Happiness Report 2018 for more detail).
We then examined whether the average values of
social support, freedom, generosity, and absence
of corruption from one half of the sample
explained average life evaluations in the other
half of the sample. The coefcients on each of the
four variables fell slightly, just as we expected.23
But the changes were reassuringly small (ranging
from 1% to 5%) and were not statistically signicant.24
Overall, the model explains average life evaluation
levels quite well within regions, among regions,
and for the world as a whole.25 On average, the
countries of Latin America still have mean life
evaluations that are signicantly higher (by about
0.5 on the 0 to 10 scale) than predicted by the
model. This difference has been attributed to a
variety of factors, including some unique features
of family and social life in Latin American countries.26
In partial contrast, countries in East Asia have
average life evaluations below predictions,
although only slightly and insignicantly so in our
latest results.27 This may reect, at least in part,
cultural differences in the way people think about
and report on the quality of their lives.28 It is
reassuring that our ndings about the relative
importance of the six factors are generally
unaffected by whether or not we make explicit
allowance for these regional differences.29
We once again used the model of Table 2.1 to
assess the overall effects of COVID-19 on life
evaluations. If we add an indicator for the four
COVID years 2020-2023 to our Table 2.1 equation,
we nd no net increase or decrease in life evalua-
tions.30 This suggests, in a preliminary way, that
the undoubted pains of living through a pandemic
were offset by increases in countervailing forces,
such as the extent to which respondents had
been able to discover and share the capacity to
care for each other in difcult times.
How do happiness rankings vary
by age group?
Figure 2.2 shows the happiness rankings for the
young (under 30), and Figure 2.3 does the same
for those over 60.31
As shown by Figures 2.2 and 2.3, country rankings
for the young and the old are quite different, and
systematically so. For example, Lithuania, a recent
entrant to the overall top twenty, ranks number 1
for those under 30 compared to 44 for those over
60, underscoring the fact that convergence
between the two halves of Europe has been
driven mainly by the rising happiness of the
young. Countries ranking highest for the old are
generally countries with high overall rankings, but
include several where the young have recently
fared very poorly.
Countries ranking highest for the
old are generally countries with
high overall rankings, but include
several where the young have
recently fared very poorly.

World Happiness Report 2024
23
Figure 2.2: Ranking of Happiness - the Young (Age below 30): 2021-2023
0 1 2 3 4 5 6 7 8
143. Afghanistan (1.827)
142. Lebanon (2.997)
141. Sierra Leone (3.225)
140. Congo (Kinshasa) (3.441)
139. Zimbabwe (3.661)
138. Lesotho (3.700)
137. Malawi (3.710)
136. Zambia (3.794)
135. Yemen (3.822)
134. Eswatini (3.894)
133. Botswana (4.012)
132. Comoros (4.111)
131. Ethiopia (4.125)
130. Egypt (4.126)
129. Tanzania (4.161)
128. Bangladesh (4.200)
127. India (4.281)
126. Togo (4.323)
125. Mali (4.332)
124. Madagascar (4.334)
123. Sri Lanka (4.339)
122. Myanmar (4.354)
121. Ghana (4.426)
120. Chad (4.462)
119. Mauritania (4.517)
118. Tunisia (4.560)
117. Burkina Faso (4.601)
116. Niger (4.616)
115. Benin (4.665)
114. Jordan (4.667)
113. Liberia (4.670)
112. Cambodia (4.699)
111. Uganda (4.718)
110. Gambia (4.735)
109. Kenya (4.906)
108. Nigeria (4.906)
107. Pakistan (4.949)
106. Cameroon (4.996)
105. Namibia (5.089)
104. Laos (5.091)
103. Guinea (5.106)
102. State of Palestine (5.120)
101. Turkiye (5.173)
100. Ivory Coast (5.251)
99. Senegal (5.266)
98. Morocco (5.281)
97. Hong Kong S.A.R. of China (5.329)
96. Iran (5.331)
95. Azerbaijan (5.352)
94. Mozambique (5.352)
93. Algeria (5.379)
92. Nepal (5.467)
91. Gabon (5.477)
90. Iraq (5.486)
89. Tajikistan (5.500)
88. Congo (Brazzaville) (5.574)
87. South Africa (5.650)
86. Mongolia (5.758)
85. Mauritius (5.791)
84. Jamaica (5.826)
83. Venezuela (5.896)
82. Ukraine (5.907)
81. Kyrgyzstan (5.935)
80. Libya (5.937)
79. China (5.949)
78. Georgia (6.031)
77. Bahrain (6.034)
76. Colombia (6.035)
75. Indonesia (6.089)
74. Bolivia (6.157)
73. Japan (6.232)
72. Armenia (6.245)
71. Uzbekistan (6.283)
70. Philippines (6.305)
69. Kazakhstan (6.324)
68. Russia (6.328)
67. North Macedonia (6.329)
66. Albania (6.358)
65. Vietnam (6.363)
64. Malaysia (6.372)
63. Peru (6.382)
62. United States (6.392)
61. Dominican Republic (6.407)
60. Brazil (6.436)
59. Ecuador (6.437)
58. Canada (6.439)
57. Malta (6.452)
56. Honduras (6.462)
55. Spain (6.463)
54. Singapore (6.484)
53. Greece (6.502)
52. South Korea (6.503)
51. Cyprus (6.525)
50. Montenegro (6.536)
49. Guatemala (6.548)
48. France (6.561)
47. Germany (6.578)
46. Portugal (6.588)
45. Thailand (6.597)
44. Estonia (6.599)
43. Poland (6.605)
42. Saudi Arabia (6.617)
41. Italy (6.618)
40. Bulgaria (6.621)
39. Chile (6.662)
38. Slovakia (6.674)
37. Paraguay (6.715)
36. Hungary (6.720)
35. United Arab Emirates (6.732)
34. Argentina (6.746)
33. Bosnia and Herzegovina (6.746)
32. United Kingdom (6.754)
31. Latvia (6.766)
30. Uruguay (6.775)
29. Moldova (6.786)
28. Nicaragua (6.789)
27. New Zealand (6.859)
26. Panama (6.883)
25. Taiwan Province of China (6.908)
24. Belgium (6.947)
23. Kosovo (6.949)
22. Mexico (6.954)
21. Ireland (6.954)
20. Norway (6.995)
19. Australia (7.013)
18. Sweden (7.026)
17. El Salvador (7.057)
16. Kuwait (7.104)
15. Slovenia (7.111)
14. Croatia (7.116)
13. Switzerland (7.138)
12. Austria (7.142)
11. Costa Rica (7.150)
10. Czechia (7.198)
9. Netherlands (7.248)
8. Romania (7.284)
7. Finland (7.300)
6. Luxembourg (7.301)
5. Denmark (7.329)
4. Iceland (7.598)
3. Serbia (7.658)
2. Israel (7.667)
1. Lithuania (7.759)
48. Romania (5.902)
47. Nicaragua (5.904)
46. Chile (5.946)
45. Argentina (5.948)
44. Lithuania (5.965)
43. Philippines (5.976)
42. Kazakhstan (6.000)
41. Thailand (6.001)
40. Poland (6.051)
39. Kosovo (6.096)
38. Italy (6.119)
37. Brazil (6.124)
36. Japan (6.146)
35. Estonia (6.164)
34. Taiwan Province of China (6.284)
33. Mexico (6.287)
32. Slovenia (6.310)
31. Malta (6.353)
30. China (6.359)
29. Spain (6.363)
28. Mauritius (6.388)
27. Saudi Arabia (6.431)
26. Singapore (6.477)
25. France (6.524)
24. Uruguay (6.561)
23. Czechia (6.591)
22. Uzbekistan (6.633)
21. Germany (6.734)
20. United Kingdom (6.812)
19. Belgium (6.842)
18. Israel (6.854)
17. Costa Rica (6.932)
16. Ireland (6.932)
15. Austria (6.939)
14. Switzerland (7.084)
13. Kuwait (7.154)
12. Luxembourg (7.214)
11. United Arab Emirates (7.248)
10. United States (7.258)
9. Australia (7.304)
8. Canada (7.343)
7. Netherlands (7.360)
6. New Zealand (7.390)
5. Iceland (7.585)
4. Sweden (7.588)
3. Norway (7.660)
2. Finland (7.912)
1. Denmark (7.916)
Average Life Evaluation
95% confidence interval
96. Ivory Coast (4.682)
95. Iraq (4.684)
94. Chad (4.689)
93. Mauritania (4.691)
92. Turkiye (4.694)
91. Georgia (4.719)
90. Bulgaria (4.775)
89. Mozambique (4.804)
88. Armenia (4.865)
87. Tajikistan (4.888)
86. Moldova (4.896)
85. Congo (Brazzaville) (4.918)
84. Ecuador (4.927)
83. Paraguay (5.013)
82. South Africa (5.083)
81. Guinea (5.128)
80. Croatia (5.137)
79. Indonesia (5.159)
78. Bosnia and Herzegovina (5.241)
77. Laos (5.256)
76. Nepal (5.259)
75. Dominican Republic (5.269)
74. Hong Kong S.A.R. of China (5.297)
73. Peru (5.313)
72. Colombia (5.393)
71. Malaysia (5.418)
70. Hungary (5.474)
69. Vietnam (5.521)
68. Jamaica (5.529)
67. Greece (5.534)
66. Russia (5.544)
65. Bolivia (5.565)
64. Venezuela (5.570)
63. Portugal (5.571)
62. Algeria (5.631)
61. Bahrain (5.640)
60. Slovakia (5.641)
59. South Korea (5.642)
58. Honduras (5.645)
57. Cyprus (5.665)
56. Panama (5.687)
55. Kyrgyzstan (5.687)
54. Serbia (5.696)
53. Mongolia (5.701)
52. El Salvador (5.716)
51. Latvia (5.811)
50. Libya (5.835)
49. Guatemala (5.887)
0 1 2 3 4 5 6 7 8
143. Afghanistan (1.456)
142. Zambia (2.484)
141. Lebanon (2.490)
140. Botswana (2.528)
139. Congo (Kinshasa) (2.703)
138. Lesotho (2.808)
137. Zimbabwe (3.021)
136. Eswatini (3.075)
135. Comoros (3.305)
134. Uganda (3.403)
133. Sierra Leone (3.471)
132. Malawi (3.498)
131. Ethiopia (3.563)
130. Nigeria (3.720)
129. Yemen (3.740)
128. Sri Lanka (3.772)
127. Togo (3.790)
126. Tanzania (3.826)
125. Ghana (3.839)
124. Egypt (3.969)
123. Jordan (4.024)
122. Pakistan (4.030)
121. India (4.095)
120. Bangladesh (4.124)
119. Kenya (4.134)
118. Tunisia (4.167)
117. Benin (4.206)
116. Mali (4.211)
115. Ukraine (4.279)
114. Namibia (4.285)
113. Morocco (4.293)
112. Gambia (4.346)
111. Senegal (4.366)
110. Cambodia (4.401)
109. Madagascar (4.416)
108. Azerbaijan (4.417)
107. Cameroon (4.428)
106. Gabon (4.457)
105. Burkina Faso (4.505)
104. Liberia (4.534)
103. Iran (4.596)
102. Myanmar (4.626)
101. Niger (4.634)
100. Albania (4.643)
99. State of Palestine (4.643)
98. North Macedonia (4.658)
97. Montenegro (4.674)
Average Life Evaluation
95% condence interval

World Happiness Report 2024
24
Figure 2.2: Ranking of Happiness - the Young (Age below 30): 2021-2023 (continued)
48. Romania (5.902)
47. Nicaragua (5.904)
46. Chile (5.946)
45. Argentina (5.948)
44. Lithuania (5.965)
43. Philippines (5.976)
42. Kazakhstan (6.000)
41. Thailand (6.001)
40. Poland (6.051)
39. Kosovo (6.096)
38. Italy (6.119)
37. Brazil (6.124)
36. Japan (6.146)
35. Estonia (6.164)
34. Taiwan Province of China (6.284)
33. Mexico (6.287)
32. Slovenia (6.310)
31. Malta (6.353)
30. China (6.359)
29. Spain (6.363)
28. Mauritius (6.388)
27. Saudi Arabia (6.431)
26. Singapore (6.477)
25. France (6.524)
24. Uruguay (6.561)
23. Czechia (6.591)
22. Uzbekistan (6.633)
21. Germany (6.734)
20. United Kingdom (6.812)
19. Belgium (6.842)
18. Israel (6.854)
17. Costa Rica (6.932)
16. Ireland (6.932)
15. Austria (6.939)
14. Switzerland (7.084)
13. Kuwait (7.154)
12. Luxembourg (7.214)
11. United Arab Emirates (7.248)
10. United States (7.258)
9. Australia (7.304)
8. Canada (7.343)
7. Netherlands (7.360)
6. New Zealand (7.390)
5. Iceland (7.585)
4. Sweden (7.588)
3. Norway (7.660)
2. Finland (7.912)
1. Denmark (7.916)
Average Life Evaluation
95% confidence interval
96. Ivory Coast (4.682)
95. Iraq (4.684)
94. Chad (4.689)
93. Mauritania (4.691)
92. Turkiye (4.694)
91. Georgia (4.719)
90. Bulgaria (4.775)
89. Mozambique (4.804)
88. Armenia (4.865)
87. Tajikistan (4.888)
86. Moldova (4.896)
85. Congo (Brazzaville) (4.918)
84. Ecuador (4.927)
83. Paraguay (5.013)
82. South Africa (5.083)
81. Guinea (5.128)
80. Croatia (5.137)
79. Indonesia (5.159)
78. Bosnia and Herzegovina (5.241)
77. Laos (5.256)
76. Nepal (5.259)
75. Dominican Republic (5.269)
74. Hong Kong S.A.R. of China (5.297)
73. Peru (5.313)
72. Colombia (5.393)
71. Malaysia (5.418)
70. Hungary (5.474)
69. Vietnam (5.521)
68. Jamaica (5.529)
67. Greece (5.534)
66. Russia (5.544)
65. Bolivia (5.565)
64. Venezuela (5.570)
63. Portugal (5.571)
62. Algeria (5.631)
61. Bahrain (5.640)
60. Slovakia (5.641)
59. South Korea (5.642)
58. Honduras (5.645)
57. Cyprus (5.665)
56. Panama (5.687)
55. Kyrgyzstan (5.687)
54. Serbia (5.696)
53. Mongolia (5.701)
52. El Salvador (5.716)
51. Latvia (5.811)
50. Libya (5.835)
49. Guatemala (5.887)
0 1 2 3 4 5 6 7 8
143. Afghanistan (1.456)
142. Zambia (2.484)
141. Lebanon (2.490)
140. Botswana (2.528)
139. Congo (Kinshasa) (2.703)
138. Lesotho (2.808)
137. Zimbabwe (3.021)
136. Eswatini (3.075)
135. Comoros (3.305)
134. Uganda (3.403)
133. Sierra Leone (3.471)
132. Malawi (3.498)
131. Ethiopia (3.563)
130. Nigeria (3.720)
129. Yemen (3.740)
128. Sri Lanka (3.772)
127. Togo (3.790)
126. Tanzania (3.826)
125. Ghana (3.839)
124. Egypt (3.969)
123. Jordan (4.024)
122. Pakistan (4.030)
121. India (4.095)
120. Bangladesh (4.124)
119. Kenya (4.134)
118. Tunisia (4.167)
117. Benin (4.206)
116. Mali (4.211)
115. Ukraine (4.279)
114. Namibia (4.285)
113. Morocco (4.293)
112. Gambia (4.346)
111. Senegal (4.366)
110. Cambodia (4.401)
109. Madagascar (4.416)
108. Azerbaijan (4.417)
107. Cameroon (4.428)
106. Gabon (4.457)
105. Burkina Faso (4.505)
104. Liberia (4.534)
103. Iran (4.596)
102. Myanmar (4.626)
101. Niger (4.634)
100. Albania (4.643)
99. State of Palestine (4.643)
98. North Macedonia (4.658)
97. Montenegro (4.674)
0 1 2 3 4 5 6 7 8
143. Afghanistan (1.827)
142. Lebanon (2.997)
141. Sierra Leone (3.225)
140. Congo (Kinshasa) (3.441)
139. Zimbabwe (3.661)
138. Lesotho (3.700)
137. Malawi (3.710)
136. Zambia (3.794)
135. Yemen (3.822)
134. Eswatini (3.894)
133. Botswana (4.012)
132. Comoros (4.111)
131. Ethiopia (4.125)
130. Egypt (4.126)
129. Tanzania (4.161)
128. Bangladesh (4.200)
127. India (4.281)
126. Togo (4.323)
125. Mali (4.332)
124. Madagascar (4.334)
123. Sri Lanka (4.339)
122. Myanmar (4.354)
121. Ghana (4.426)
120. Chad (4.462)
119. Mauritania (4.517)
118. Tunisia (4.560)
117. Burkina Faso (4.601)
116. Niger (4.616)
115. Benin (4.665)
114. Jordan (4.667)
113. Liberia (4.670)
112. Cambodia (4.699)
111. Uganda (4.718)
110. Gambia (4.735)
109. Kenya (4.906)
108. Nigeria (4.906)
107. Pakistan (4.949)
106. Cameroon (4.996)
105. Namibia (5.089)
104. Laos (5.091)
103. Guinea (5.106)
102. State of Palestine (5.120)
101. Turkiye (5.173)
100. Ivory Coast (5.251)
99. Senegal (5.266)
98. Morocco (5.281)
97. Hong Kong S.A.R. of China (5.329)
96. Iran (5.331)
95. Azerbaijan (5.352)
94. Mozambique (5.352)
93. Algeria (5.379)
92. Nepal (5.467)
91. Gabon (5.477)
90. Iraq (5.486)
89. Tajikistan (5.500)
88. Congo (Brazzaville) (5.574)
87. South Africa (5.650)
86. Mongolia (5.758)
85. Mauritius (5.791)
84. Jamaica (5.826)
83. Venezuela (5.896)
82. Ukraine (5.907)
81. Kyrgyzstan (5.935)
80. Libya (5.937)
79. China (5.949)
78. Georgia (6.031)
77. Bahrain (6.034)
76. Colombia (6.035)
75. Indonesia (6.089)
74. Bolivia (6.157)
73. Japan (6.232)
72. Armenia (6.245)
71. Uzbekistan (6.283)
70. Philippines (6.305)
69. Kazakhstan (6.324)
68. Russia (6.328)
67. North Macedonia (6.329)
66. Albania (6.358)
65. Vietnam (6.363)
64. Malaysia (6.372)
63. Peru (6.382)
62. United States (6.392)
61. Dominican Republic (6.407)
60. Brazil (6.436)
59. Ecuador (6.437)
58. Canada (6.439)
57. Malta (6.452)
56. Honduras (6.462)
55. Spain (6.463)
54. Singapore (6.484)
53. Greece (6.502)
52. South Korea (6.503)
51. Cyprus (6.525)
50. Montenegro (6.536)
49. Guatemala (6.548)
48. France (6.561)
47. Germany (6.578)
46. Portugal (6.588)
45. Thailand (6.597)
44. Estonia (6.599)
43. Poland (6.605)
42. Saudi Arabia (6.617)
41. Italy (6.618)
40. Bulgaria (6.621)
39. Chile (6.662)
38. Slovakia (6.674)
37. Paraguay (6.715)
36. Hungary (6.720)
35. United Arab Emirates (6.732)
34. Argentina (6.746)
33. Bosnia and Herzegovina (6.746)
32. United Kingdom (6.754)
31. Latvia (6.766)
30. Uruguay (6.775)
29. Moldova (6.786)
28. Nicaragua (6.789)
27. New Zealand (6.859)
26. Panama (6.883)
25. Taiwan Province of China (6.908)
24. Belgium (6.947)
23. Kosovo (6.949)
22. Mexico (6.954)
21. Ireland (6.954)
20. Norway (6.995)
19. Australia (7.013)
18. Sweden (7.026)
17. El Salvador (7.057)
16. Kuwait (7.104)
15. Slovenia (7.111)
14. Croatia (7.116)
13. Switzerland (7.138)
12. Austria (7.142)
11. Costa Rica (7.150)
10. Czechia (7.198)
9. Netherlands (7.248)
8. Romania (7.284)
7. Finland (7.300)
6. Luxembourg (7.301)
5. Denmark (7.329)
4. Iceland (7.598)
3. Serbia (7.658)
2. Israel (7.667)
1. Lithuania (7.759)
Average Life Evaluation
95% condence interval

World Happiness Report 2024
25
Figure 2.2: Ranking of Happiness - the Young (Age below 30): 2021-2023 (continued)
0 1 2 3 4 5 6 7 8
143. Afghanistan (1.827)
142. Lebanon (2.997)
141. Sierra Leone (3.225)
140. Congo (Kinshasa) (3.441)
139. Zimbabwe (3.661)
138. Lesotho (3.700)
137. Malawi (3.710)
136. Zambia (3.794)
135. Yemen (3.822)
134. Eswatini (3.894)
133. Botswana (4.012)
132. Comoros (4.111)
131. Ethiopia (4.125)
130. Egypt (4.126)
129. Tanzania (4.161)
128. Bangladesh (4.200)
127. India (4.281)
126. Togo (4.323)
125. Mali (4.332)
124. Madagascar (4.334)
123. Sri Lanka (4.339)
122. Myanmar (4.354)
121. Ghana (4.426)
120. Chad (4.462)
119. Mauritania (4.517)
118. Tunisia (4.560)
117. Burkina Faso (4.601)
116. Niger (4.616)
115. Benin (4.665)
114. Jordan (4.667)
113. Liberia (4.670)
112. Cambodia (4.699)
111. Uganda (4.718)
110. Gambia (4.735)
109. Kenya (4.906)
108. Nigeria (4.906)
107. Pakistan (4.949)
106. Cameroon (4.996)
105. Namibia (5.089)
104. Laos (5.091)
103. Guinea (5.106)
102. State of Palestine (5.120)
101. Turkiye (5.173)
100. Ivory Coast (5.251)
99. Senegal (5.266)
98. Morocco (5.281)
97. Hong Kong S.A.R. of China (5.329)
96. Iran (5.331)
95. Azerbaijan (5.352)
94. Mozambique (5.352)
93. Algeria (5.379)
92. Nepal (5.467)
91. Gabon (5.477)
90. Iraq (5.486)
89. Tajikistan (5.500)
88. Congo (Brazzaville) (5.574)
87. South Africa (5.650)
86. Mongolia (5.758)
85. Mauritius (5.791)
84. Jamaica (5.826)
83. Venezuela (5.896)
82. Ukraine (5.907)
81. Kyrgyzstan (5.935)
80. Libya (5.937)
79. China (5.949)
78. Georgia (6.031)
77. Bahrain (6.034)
76. Colombia (6.035)
75. Indonesia (6.089)
74. Bolivia (6.157)
73. Japan (6.232)
72. Armenia (6.245)
71. Uzbekistan (6.283)
70. Philippines (6.305)
69. Kazakhstan (6.324)
68. Russia (6.328)
67. North Macedonia (6.329)
66. Albania (6.358)
65. Vietnam (6.363)
64. Malaysia (6.372)
63. Peru (6.382)
62. United States (6.392)
61. Dominican Republic (6.407)
60. Brazil (6.436)
59. Ecuador (6.437)
58. Canada (6.439)
57. Malta (6.452)
56. Honduras (6.462)
55. Spain (6.463)
54. Singapore (6.484)
53. Greece (6.502)
52. South Korea (6.503)
51. Cyprus (6.525)
50. Montenegro (6.536)
49. Guatemala (6.548)
48. France (6.561)
47. Germany (6.578)
46. Portugal (6.588)
45. Thailand (6.597)
44. Estonia (6.599)
43. Poland (6.605)
42. Saudi Arabia (6.617)
41. Italy (6.618)
40. Bulgaria (6.621)
39. Chile (6.662)
38. Slovakia (6.674)
37. Paraguay (6.715)
36. Hungary (6.720)
35. United Arab Emirates (6.732)
34. Argentina (6.746)
33. Bosnia and Herzegovina (6.746)
32. United Kingdom (6.754)
31. Latvia (6.766)
30. Uruguay (6.775)
29. Moldova (6.786)
28. Nicaragua (6.789)
27. New Zealand (6.859)
26. Panama (6.883)
25. Taiwan Province of China (6.908)
24. Belgium (6.947)
23. Kosovo (6.949)
22. Mexico (6.954)
21. Ireland (6.954)
20. Norway (6.995)
19. Australia (7.013)
18. Sweden (7.026)
17. El Salvador (7.057)
16. Kuwait (7.104)
15. Slovenia (7.111)
14. Croatia (7.116)
13. Switzerland (7.138)
12. Austria (7.142)
11. Costa Rica (7.150)
10. Czechia (7.198)
9. Netherlands (7.248)
8. Romania (7.284)
7. Finland (7.300)
6. Luxembourg (7.301)
5. Denmark (7.329)
4. Iceland (7.598)
3. Serbia (7.658)
2. Israel (7.667)
1. Lithuania (7.759)
48. Romania (5.902)
47. Nicaragua (5.904)
46. Chile (5.946)
45. Argentina (5.948)
44. Lithuania (5.965)
43. Philippines (5.976)
42. Kazakhstan (6.000)
41. Thailand (6.001)
40. Poland (6.051)
39. Kosovo (6.096)
38. Italy (6.119)
37. Brazil (6.124)
36. Japan (6.146)
35. Estonia (6.164)
34. Taiwan Province of China (6.284)
33. Mexico (6.287)
32. Slovenia (6.310)
31. Malta (6.353)
30. China (6.359)
29. Spain (6.363)
28. Mauritius (6.388)
27. Saudi Arabia (6.431)
26. Singapore (6.477)
25. France (6.524)
24. Uruguay (6.561)
23. Czechia (6.591)
22. Uzbekistan (6.633)
21. Germany (6.734)
20. United Kingdom (6.812)
19. Belgium (6.842)
18. Israel (6.854)
17. Costa Rica (6.932)
16. Ireland (6.932)
15. Austria (6.939)
14. Switzerland (7.084)
13. Kuwait (7.154)
12. Luxembourg (7.214)
11. United Arab Emirates (7.248)
10. United States (7.258)
9. Australia (7.304)
8. Canada (7.343)
7. Netherlands (7.360)
6. New Zealand (7.390)
5. Iceland (7.585)
4. Sweden (7.588)
3. Norway (7.660)
2. Finland (7.912)
1. Denmark (7.916)
Average Life Evaluation
95% confidence interval
96. Ivory Coast (4.682)
95. Iraq (4.684)
94. Chad (4.689)
93. Mauritania (4.691)
92. Turkiye (4.694)
91. Georgia (4.719)
90. Bulgaria (4.775)
89. Mozambique (4.804)
88. Armenia (4.865)
87. Tajikistan (4.888)
86. Moldova (4.896)
85. Congo (Brazzaville) (4.918)
84. Ecuador (4.927)
83. Paraguay (5.013)
82. South Africa (5.083)
81. Guinea (5.128)
80. Croatia (5.137)
79. Indonesia (5.159)
78. Bosnia and Herzegovina (5.241)
77. Laos (5.256)
76. Nepal (5.259)
75. Dominican Republic (5.269)
74. Hong Kong S.A.R. of China (5.297)
73. Peru (5.313)
72. Colombia (5.393)
71. Malaysia (5.418)
70. Hungary (5.474)
69. Vietnam (5.521)
68. Jamaica (5.529)
67. Greece (5.534)
66. Russia (5.544)
65. Bolivia (5.565)
64. Venezuela (5.570)
63. Portugal (5.571)
62. Algeria (5.631)
61. Bahrain (5.640)
60. Slovakia (5.641)
59. South Korea (5.642)
58. Honduras (5.645)
57. Cyprus (5.665)
56. Panama (5.687)
55. Kyrgyzstan (5.687)
54. Serbia (5.696)
53. Mongolia (5.701)
52. El Salvador (5.716)
51. Latvia (5.811)
50. Libya (5.835)
49. Guatemala (5.887)
0 1 2 3 4 5 6 7 8
143. Afghanistan (1.456)
142. Zambia (2.484)
141. Lebanon (2.490)
140. Botswana (2.528)
139. Congo (Kinshasa) (2.703)
138. Lesotho (2.808)
137. Zimbabwe (3.021)
136. Eswatini (3.075)
135. Comoros (3.305)
134. Uganda (3.403)
133. Sierra Leone (3.471)
132. Malawi (3.498)
131. Ethiopia (3.563)
130. Nigeria (3.720)
129. Yemen (3.740)
128. Sri Lanka (3.772)
127. Togo (3.790)
126. Tanzania (3.826)
125. Ghana (3.839)
124. Egypt (3.969)
123. Jordan (4.024)
122. Pakistan (4.030)
121. India (4.095)
120. Bangladesh (4.124)
119. Kenya (4.134)
118. Tunisia (4.167)
117. Benin (4.206)
116. Mali (4.211)
115. Ukraine (4.279)
114. Namibia (4.285)
113. Morocco (4.293)
112. Gambia (4.346)
111. Senegal (4.366)
110. Cambodia (4.401)
109. Madagascar (4.416)
108. Azerbaijan (4.417)
107. Cameroon (4.428)
106. Gabon (4.457)
105. Burkina Faso (4.505)
104. Liberia (4.534)
103. Iran (4.596)
102. Myanmar (4.626)
101. Niger (4.634)
100. Albania (4.643)
99. State of Palestine (4.643)
98. North Macedonia (4.658)
97. Montenegro (4.674)
Average Life Evaluation
95% condence interval
¨

World Happiness Report 2024
26
Figure 2.3: Ranking of Happiness - the Old (age 60 and above): 2021-2023
48. Romania (5.902)
47. Nicaragua (5.904)
46. Chile (5.946)
45. Argentina (5.948)
44. Lithuania (5.965)
43. Philippines (5.976)
42. Kazakhstan (6.000)
41. Thailand (6.001)
40. Poland (6.051)
39. Kosovo (6.096)
38. Italy (6.119)
37. Brazil (6.124)
36. Japan (6.146)
35. Estonia (6.164)
34. Taiwan Province of China (6.284)
33. Mexico (6.287)
32. Slovenia (6.310)
31. Malta (6.353)
30. China (6.359)
29. Spain (6.363)
28. Mauritius (6.388)
27. Saudi Arabia (6.431)
26. Singapore (6.477)
25. France (6.524)
24. Uruguay (6.561)
23. Czechia (6.591)
22. Uzbekistan (6.633)
21. Germany (6.734)
20. United Kingdom (6.812)
19. Belgium (6.842)
18. Israel (6.854)
17. Costa Rica (6.932)
16. Ireland (6.932)
15. Austria (6.939)
14. Switzerland (7.084)
13. Kuwait (7.154)
12. Luxembourg (7.214)
11. United Arab Emirates (7.248)
10. United States (7.258)
9. Australia (7.304)
8. Canada (7.343)
7. Netherlands (7.360)
6. New Zealand (7.390)
5. Iceland (7.585)
4. Sweden (7.588)
3. Norway (7.660)
2. Finland (7.912)
1. Denmark (7.916)
Average Life Evaluation
95% confidence interval
96. Ivory Coast (4.682)
95. Iraq (4.684)
94. Chad (4.689)
93. Mauritania (4.691)
92. Turkiye (4.694)
91. Georgia (4.719)
90. Bulgaria (4.775)
89. Mozambique (4.804)
88. Armenia (4.865)
87. Tajikistan (4.888)
86. Moldova (4.896)
85. Congo (Brazzaville) (4.918)
84. Ecuador (4.927)
83. Paraguay (5.013)
82. South Africa (5.083)
81. Guinea (5.128)
80. Croatia (5.137)
79. Indonesia (5.159)
78. Bosnia and Herzegovina (5.241)
77. Laos (5.256)
76. Nepal (5.259)
75. Dominican Republic (5.269)
74. Hong Kong S.A.R. of China (5.297)
73. Peru (5.313)
72. Colombia (5.393)
71. Malaysia (5.418)
70. Hungary (5.474)
69. Vietnam (5.521)
68. Jamaica (5.529)
67. Greece (5.534)
66. Russia (5.544)
65. Bolivia (5.565)
64. Venezuela (5.570)
63. Portugal (5.571)
62. Algeria (5.631)
61. Bahrain (5.640)
60. Slovakia (5.641)
59. South Korea (5.642)
58. Honduras (5.645)
57. Cyprus (5.665)
56. Panama (5.687)
55. Kyrgyzstan (5.687)
54. Serbia (5.696)
53. Mongolia (5.701)
52. El Salvador (5.716)
51. Latvia (5.811)
50. Libya (5.835)
49. Guatemala (5.887)
0 1 2 3 4 5 6 7 8
143. Afghanistan (1.456)
142. Zambia (2.484)
141. Lebanon (2.490)
140. Botswana (2.528)
139. Congo (Kinshasa) (2.703)
138. Lesotho (2.808)
137. Zimbabwe (3.021)
136. Eswatini (3.075)
135. Comoros (3.305)
134. Uganda (3.403)
133. Sierra Leone (3.471)
132. Malawi (3.498)
131. Ethiopia (3.563)
130. Nigeria (3.720)
129. Yemen (3.740)
128. Sri Lanka (3.772)
127. Togo (3.790)
126. Tanzania (3.826)
125. Ghana (3.839)
124. Egypt (3.969)
123. Jordan (4.024)
122. Pakistan (4.030)
121. India (4.095)
120. Bangladesh (4.124)
119. Kenya (4.134)
118. Tunisia (4.167)
117. Benin (4.206)
116. Mali (4.211)
115. Ukraine (4.279)
114. Namibia (4.285)
113. Morocco (4.293)
112. Gambia (4.346)
111. Senegal (4.366)
110. Cambodia (4.401)
109. Madagascar (4.416)
108. Azerbaijan (4.417)
107. Cameroon (4.428)
106. Gabon (4.457)
105. Burkina Faso (4.505)
104. Liberia (4.534)
103. Iran (4.596)
102. Myanmar (4.626)
101. Niger (4.634)
100. Albania (4.643)
99. State of Palestine (4.643)
98. North Macedonia (4.658)
97. Montenegro (4.674)
Average Life Evaluation
95% condence interval
48. Romania (5.902)
47. Nicaragua (5.904)
46. Chile (5.946)
45. Argentina (5.948)
44. Lithuania (5.965)
43. Philippines (5.976)
42. Kazakhstan (6.000)
41. Thailand (6.001)
40. Poland (6.051)
39. Kosovo (6.096)
38. Italy (6.119)
37. Brazil (6.124)
36. Japan (6.146)
35. Estonia (6.164)
34. Taiwan Province of China (6.284)
33. Mexico (6.287)
32. Slovenia (6.310)
31. Malta (6.353)
30. China (6.359)
29. Spain (6.363)
28. Mauritius (6.388)
27. Saudi Arabia (6.431)
26. Singapore (6.477)
25. France (6.524)
24. Uruguay (6.561)
23. Czechia (6.591)
22. Uzbekistan (6.633)
21. Germany (6.734)
20. United Kingdom (6.812)
19. Belgium (6.842)
18. Israel (6.854)
17. Costa Rica (6.932)
16. Ireland (6.932)
15. Austria (6.939)
14. Switzerland (7.084)
13. Kuwait (7.154)
12. Luxembourg (7.214)
11. United Arab Emirates (7.248)
10. United States (7.258)
9. Australia (7.304)
8. Canada (7.343)
7. Netherlands (7.360)
6. New Zealand (7.390)
5. Iceland (7.585)
4. Sweden (7.588)
3. Norway (7.660)
2. Finland (7.912)
1. Denmark (7.916)
Average Life Evaluation
95% confidence interval
96. Ivory Coast (4.682)
95. Iraq (4.684)
94. Chad (4.689)
93. Mauritania (4.691)
92. Turkiye (4.694)
91. Georgia (4.719)
90. Bulgaria (4.775)
89. Mozambique (4.804)
88. Armenia (4.865)
87. Tajikistan (4.888)
86. Moldova (4.896)
85. Congo (Brazzaville) (4.918)
84. Ecuador (4.927)
83. Paraguay (5.013)
82. South Africa (5.083)
81. Guinea (5.128)
80. Croatia (5.137)
79. Indonesia (5.159)
78. Bosnia and Herzegovina (5.241)
77. Laos (5.256)
76. Nepal (5.259)
75. Dominican Republic (5.269)
74. Hong Kong S.A.R. of China (5.297)
73. Peru (5.313)
72. Colombia (5.393)
71. Malaysia (5.418)
70. Hungary (5.474)
69. Vietnam (5.521)
68. Jamaica (5.529)
67. Greece (5.534)
66. Russia (5.544)
65. Bolivia (5.565)
64. Venezuela (5.570)
63. Portugal (5.571)
62. Algeria (5.631)
61. Bahrain (5.640)
60. Slovakia (5.641)
59. South Korea (5.642)
58. Honduras (5.645)
57. Cyprus (5.665)
56. Panama (5.687)
55. Kyrgyzstan (5.687)
54. Serbia (5.696)
53. Mongolia (5.701)
52. El Salvador (5.716)
51. Latvia (5.811)
50. Libya (5.835)
49. Guatemala (5.887)
0 1 2 3 4 5 6 7 8
143. Afghanistan (1.456)
142. Zambia (2.484)
141. Lebanon (2.490)
140. Botswana (2.528)
139. Congo (Kinshasa) (2.703)
138. Lesotho (2.808)
137. Zimbabwe (3.021)
136. Eswatini (3.075)
135. Comoros (3.305)
134. Uganda (3.403)
133. Sierra Leone (3.471)
132. Malawi (3.498)
131. Ethiopia (3.563)
130. Nigeria (3.720)
129. Yemen (3.740)
128. Sri Lanka (3.772)
127. Togo (3.790)
126. Tanzania (3.826)
125. Ghana (3.839)
124. Egypt (3.969)
123. Jordan (4.024)
122. Pakistan (4.030)
121. India (4.095)
120. Bangladesh (4.124)
119. Kenya (4.134)
118. Tunisia (4.167)
117. Benin (4.206)
116. Mali (4.211)
115. Ukraine (4.279)
114. Namibia (4.285)
113. Morocco (4.293)
112. Gambia (4.346)
111. Senegal (4.366)
110. Cambodia (4.401)
109. Madagascar (4.416)
108. Azerbaijan (4.417)
107. Cameroon (4.428)
106. Gabon (4.457)
105. Burkina Faso (4.505)
104. Liberia (4.534)
103. Iran (4.596)
102. Myanmar (4.626)
101. Niger (4.634)
100. Albania (4.643)
99. State of Palestine (4.643)
98. North Macedonia (4.658)
97. Montenegro (4.674)

World Happiness Report 2024
27
Figure 2.3: Ranking of Happiness - the Old (age 60 and above): 2021-2023 (continued)
48. Romania (5.902)
47. Nicaragua (5.904)
46. Chile (5.946)
45. Argentina (5.948)
44. Lithuania (5.965)
43. Philippines (5.976)
42. Kazakhstan (6.000)
41. Thailand (6.001)
40. Poland (6.051)
39. Kosovo (6.096)
38. Italy (6.119)
37. Brazil (6.124)
36. Japan (6.146)
35. Estonia (6.164)
34. Taiwan Province of China (6.284)
33. Mexico (6.287)
32. Slovenia (6.310)
31. Malta (6.353)
30. China (6.359)
29. Spain (6.363)
28. Mauritius (6.388)
27. Saudi Arabia (6.431)
26. Singapore (6.477)
25. France (6.524)
24. Uruguay (6.561)
23. Czechia (6.591)
22. Uzbekistan (6.633)
21. Germany (6.734)
20. United Kingdom (6.812)
19. Belgium (6.842)
18. Israel (6.854)
17. Costa Rica (6.932)
16. Ireland (6.932)
15. Austria (6.939)
14. Switzerland (7.084)
13. Kuwait (7.154)
12. Luxembourg (7.214)
11. United Arab Emirates (7.248)
10. United States (7.258)
9. Australia (7.304)
8. Canada (7.343)
7. Netherlands (7.360)
6. New Zealand (7.390)
5. Iceland (7.585)
4. Sweden (7.588)
3. Norway (7.660)
2. Finland (7.912)
1. Denmark (7.916)
Average Life Evaluation
95% confidence interval
96. Ivory Coast (4.682)
95. Iraq (4.684)
94. Chad (4.689)
93. Mauritania (4.691)
92. Turkiye (4.694)
91. Georgia (4.719)
90. Bulgaria (4.775)
89. Mozambique (4.804)
88. Armenia (4.865)
87. Tajikistan (4.888)
86. Moldova (4.896)
85. Congo (Brazzaville) (4.918)
84. Ecuador (4.927)
83. Paraguay (5.013)
82. South Africa (5.083)
81. Guinea (5.128)
80. Croatia (5.137)
79. Indonesia (5.159)
78. Bosnia and Herzegovina (5.241)
77. Laos (5.256)
76. Nepal (5.259)
75. Dominican Republic (5.269)
74. Hong Kong S.A.R. of China (5.297)
73. Peru (5.313)
72. Colombia (5.393)
71. Malaysia (5.418)
70. Hungary (5.474)
69. Vietnam (5.521)
68. Jamaica (5.529)
67. Greece (5.534)
66. Russia (5.544)
65. Bolivia (5.565)
64. Venezuela (5.570)
63. Portugal (5.571)
62. Algeria (5.631)
61. Bahrain (5.640)
60. Slovakia (5.641)
59. South Korea (5.642)
58. Honduras (5.645)
57. Cyprus (5.665)
56. Panama (5.687)
55. Kyrgyzstan (5.687)
54. Serbia (5.696)
53. Mongolia (5.701)
52. El Salvador (5.716)
51. Latvia (5.811)
50. Libya (5.835)
49. Guatemala (5.887)
0 1 2 3 4 5 6 7 8
143. Afghanistan (1.456)
142. Zambia (2.484)
141. Lebanon (2.490)
140. Botswana (2.528)
139. Congo (Kinshasa) (2.703)
138. Lesotho (2.808)
137. Zimbabwe (3.021)
136. Eswatini (3.075)
135. Comoros (3.305)
134. Uganda (3.403)
133. Sierra Leone (3.471)
132. Malawi (3.498)
131. Ethiopia (3.563)
130. Nigeria (3.720)
129. Yemen (3.740)
128. Sri Lanka (3.772)
127. Togo (3.790)
126. Tanzania (3.826)
125. Ghana (3.839)
124. Egypt (3.969)
123. Jordan (4.024)
122. Pakistan (4.030)
121. India (4.095)
120. Bangladesh (4.124)
119. Kenya (4.134)
118. Tunisia (4.167)
117. Benin (4.206)
116. Mali (4.211)
115. Ukraine (4.279)
114. Namibia (4.285)
113. Morocco (4.293)
112. Gambia (4.346)
111. Senegal (4.366)
110. Cambodia (4.401)
109. Madagascar (4.416)
108. Azerbaijan (4.417)
107. Cameroon (4.428)
106. Gabon (4.457)
105. Burkina Faso (4.505)
104. Liberia (4.534)
103. Iran (4.596)
102. Myanmar (4.626)
101. Niger (4.634)
100. Albania (4.643)
99. State of Palestine (4.643)
98. North Macedonia (4.658)
97. Montenegro (4.674)
Average Life Evaluation
95% condence interval
¨

World Happiness Report 2024
28
Figure 2.3: Ranking of Happiness - the Old (age 60 and above): 2021-2023 (continued)
48. Romania (5.902)
47. Nicaragua (5.904)
46. Chile (5.946)
45. Argentina (5.948)
44. Lithuania (5.965)
43. Philippines (5.976)
42. Kazakhstan (6.000)
41. Thailand (6.001)
40. Poland (6.051)
39. Kosovo (6.096)
38. Italy (6.119)
37. Brazil (6.124)
36. Japan (6.146)
35. Estonia (6.164)
34. Taiwan Province of China (6.284)
33. Mexico (6.287)
32. Slovenia (6.310)
31. Malta (6.353)
30. China (6.359)
29. Spain (6.363)
28. Mauritius (6.388)
27. Saudi Arabia (6.431)
26. Singapore (6.477)
25. France (6.524)
24. Uruguay (6.561)
23. Czechia (6.591)
22. Uzbekistan (6.633)
21. Germany (6.734)
20. United Kingdom (6.812)
19. Belgium (6.842)
18. Israel (6.854)
17. Costa Rica (6.932)
16. Ireland (6.932)
15. Austria (6.939)
14. Switzerland (7.084)
13. Kuwait (7.154)
12. Luxembourg (7.214)
11. United Arab Emirates (7.248)
10. United States (7.258)
9. Australia (7.304)
8. Canada (7.343)
7. Netherlands (7.360)
6. New Zealand (7.390)
5. Iceland (7.585)
4. Sweden (7.588)
3. Norway (7.660)
2. Finland (7.912)
1. Denmark (7.916)
Average Life Evaluation
95% confidence interval
96. Ivory Coast (4.682)
95. Iraq (4.684)
94. Chad (4.689)
93. Mauritania (4.691)
92. Turkiye (4.694)
91. Georgia (4.719)
90. Bulgaria (4.775)
89. Mozambique (4.804)
88. Armenia (4.865)
87. Tajikistan (4.888)
86. Moldova (4.896)
85. Congo (Brazzaville) (4.918)
84. Ecuador (4.927)
83. Paraguay (5.013)
82. South Africa (5.083)
81. Guinea (5.128)
80. Croatia (5.137)
79. Indonesia (5.159)
78. Bosnia and Herzegovina (5.241)
77. Laos (5.256)
76. Nepal (5.259)
75. Dominican Republic (5.269)
74. Hong Kong S.A.R. of China (5.297)
73. Peru (5.313)
72. Colombia (5.393)
71. Malaysia (5.418)
70. Hungary (5.474)
69. Vietnam (5.521)
68. Jamaica (5.529)
67. Greece (5.534)
66. Russia (5.544)
65. Bolivia (5.565)
64. Venezuela (5.570)
63. Portugal (5.571)
62. Algeria (5.631)
61. Bahrain (5.640)
60. Slovakia (5.641)
59. South Korea (5.642)
58. Honduras (5.645)
57. Cyprus (5.665)
56. Panama (5.687)
55. Kyrgyzstan (5.687)
54. Serbia (5.696)
53. Mongolia (5.701)
52. El Salvador (5.716)
51. Latvia (5.811)
50. Libya (5.835)
49. Guatemala (5.887)
0 1 2 3 4 5 6 7 8
143. Afghanistan (1.456)
142. Zambia (2.484)
141. Lebanon (2.490)
140. Botswana (2.528)
139. Congo (Kinshasa) (2.703)
138. Lesotho (2.808)
137. Zimbabwe (3.021)
136. Eswatini (3.075)
135. Comoros (3.305)
134. Uganda (3.403)
133. Sierra Leone (3.471)
132. Malawi (3.498)
131. Ethiopia (3.563)
130. Nigeria (3.720)
129. Yemen (3.740)
128. Sri Lanka (3.772)
127. Togo (3.790)
126. Tanzania (3.826)
125. Ghana (3.839)
124. Egypt (3.969)
123. Jordan (4.024)
122. Pakistan (4.030)
121. India (4.095)
120. Bangladesh (4.124)
119. Kenya (4.134)
118. Tunisia (4.167)
117. Benin (4.206)
116. Mali (4.211)
115. Ukraine (4.279)
114. Namibia (4.285)
113. Morocco (4.293)
112. Gambia (4.346)
111. Senegal (4.366)
110. Cambodia (4.401)
109. Madagascar (4.416)
108. Azerbaijan (4.417)
107. Cameroon (4.428)
106. Gabon (4.457)
105. Burkina Faso (4.505)
104. Liberia (4.534)
103. Iran (4.596)
102. Myanmar (4.626)
101. Niger (4.634)
100. Albania (4.643)
99. State of Palestine (4.643)
98. North Macedonia (4.658)
97. Montenegro (4.674)
48. Romania (5.902)
47. Nicaragua (5.904)
46. Chile (5.946)
45. Argentina (5.948)
44. Lithuania (5.965)
43. Philippines (5.976)
42. Kazakhstan (6.000)
41. Thailand (6.001)
40. Poland (6.051)
39. Kosovo (6.096)
38. Italy (6.119)
37. Brazil (6.124)
36. Japan (6.146)
35. Estonia (6.164)
34. Taiwan Province of China (6.284)
33. Mexico (6.287)
32. Slovenia (6.310)
31. Malta (6.353)
30. China (6.359)
29. Spain (6.363)
28. Mauritius (6.388)
27. Saudi Arabia (6.431)
26. Singapore (6.477)
25. France (6.524)
24. Uruguay (6.561)
23. Czechia (6.591)
22. Uzbekistan (6.633)
21. Germany (6.734)
20. United Kingdom (6.812)
19. Belgium (6.842)
18. Israel (6.854)
17. Costa Rica (6.932)
16. Ireland (6.932)
15. Austria (6.939)
14. Switzerland (7.084)
13. Kuwait (7.154)
12. Luxembourg (7.214)
11. United Arab Emirates (7.248)
10. United States (7.258)
9. Australia (7.304)
8. Canada (7.343)
7. Netherlands (7.360)
6. New Zealand (7.390)
5. Iceland (7.585)
4. Sweden (7.588)
3. Norway (7.660)
2. Finland (7.912)
1. Denmark (7.916)
Average Life Evaluation
95% confidence interval
96. Ivory Coast (4.682)
95. Iraq (4.684)
94. Chad (4.689)
93. Mauritania (4.691)
92. Turkiye (4.694)
91. Georgia (4.719)
90. Bulgaria (4.775)
89. Mozambique (4.804)
88. Armenia (4.865)
87. Tajikistan (4.888)
86. Moldova (4.896)
85. Congo (Brazzaville) (4.918)
84. Ecuador (4.927)
83. Paraguay (5.013)
82. South Africa (5.083)
81. Guinea (5.128)
80. Croatia (5.137)
79. Indonesia (5.159)
78. Bosnia and Herzegovina (5.241)
77. Laos (5.256)
76. Nepal (5.259)
75. Dominican Republic (5.269)
74. Hong Kong S.A.R. of China (5.297)
73. Peru (5.313)
72. Colombia (5.393)
71. Malaysia (5.418)
70. Hungary (5.474)
69. Vietnam (5.521)
68. Jamaica (5.529)
67. Greece (5.534)
66. Russia (5.544)
65. Bolivia (5.565)
64. Venezuela (5.570)
63. Portugal (5.571)
62. Algeria (5.631)
61. Bahrain (5.640)
60. Slovakia (5.641)
59. South Korea (5.642)
58. Honduras (5.645)
57. Cyprus (5.665)
56. Panama (5.687)
55. Kyrgyzstan (5.687)
54. Serbia (5.696)
53. Mongolia (5.701)
52. El Salvador (5.716)
51. Latvia (5.811)
50. Libya (5.835)
49. Guatemala (5.887)
0 1 2 3 4 5 6 7 8
143. Afghanistan (1.456)
142. Zambia (2.484)
141. Lebanon (2.490)
140. Botswana (2.528)
139. Congo (Kinshasa) (2.703)
138. Lesotho (2.808)
137. Zimbabwe (3.021)
136. Eswatini (3.075)
135. Comoros (3.305)
134. Uganda (3.403)
133. Sierra Leone (3.471)
132. Malawi (3.498)
131. Ethiopia (3.563)
130. Nigeria (3.720)
129. Yemen (3.740)
128. Sri Lanka (3.772)
127. Togo (3.790)
126. Tanzania (3.826)
125. Ghana (3.839)
124. Egypt (3.969)
123. Jordan (4.024)
122. Pakistan (4.030)
121. India (4.095)
120. Bangladesh (4.124)
119. Kenya (4.134)
118. Tunisia (4.167)
117. Benin (4.206)
116. Mali (4.211)
115. Ukraine (4.279)
114. Namibia (4.285)
113. Morocco (4.293)
112. Gambia (4.346)
111. Senegal (4.366)
110. Cambodia (4.401)
109. Madagascar (4.416)
108. Azerbaijan (4.417)
107. Cameroon (4.428)
106. Gabon (4.457)
105. Burkina Faso (4.505)
104. Liberia (4.534)
103. Iran (4.596)
102. Myanmar (4.626)
101. Niger (4.634)
100. Albania (4.643)
99. State of Palestine (4.643)
98. North Macedonia (4.658)
97. Montenegro (4.674)
48. Romania (5.902)
47. Nicaragua (5.904)
46. Chile (5.946)
45. Argentina (5.948)
44. Lithuania (5.965)
43. Philippines (5.976)
42. Kazakhstan (6.000)
41. Thailand (6.001)
40. Poland (6.051)
39. Kosovo (6.096)
38. Italy (6.119)
37. Brazil (6.124)
36. Japan (6.146)
35. Estonia (6.164)
34. Taiwan Province of China (6.284)
33. Mexico (6.287)
32. Slovenia (6.310)
31. Malta (6.353)
30. China (6.359)
29. Spain (6.363)
28. Mauritius (6.388)
27. Saudi Arabia (6.431)
26. Singapore (6.477)
25. France (6.524)
24. Uruguay (6.561)
23. Czechia (6.591)
22. Uzbekistan (6.633)
21. Germany (6.734)
20. United Kingdom (6.812)
19. Belgium (6.842)
18. Israel (6.854)
17. Costa Rica (6.932)
16. Ireland (6.932)
15. Austria (6.939)
14. Switzerland (7.084)
13. Kuwait (7.154)
12. Luxembourg (7.214)
11. United Arab Emirates (7.248)
10. United States (7.258)
9. Australia (7.304)
8. Canada (7.343)
7. Netherlands (7.360)
6. New Zealand (7.390)
5. Iceland (7.585)
4. Sweden (7.588)
3. Norway (7.660)
2. Finland (7.912)
1. Denmark (7.916)
Average Life Evaluation
95% confidence interval
96. Ivory Coast (4.682)
95. Iraq (4.684)
94. Chad (4.689)
93. Mauritania (4.691)
92. Turkiye (4.694)
91. Georgia (4.719)
90. Bulgaria (4.775)
89. Mozambique (4.804)
88. Armenia (4.865)
87. Tajikistan (4.888)
86. Moldova (4.896)
85. Congo (Brazzaville) (4.918)
84. Ecuador (4.927)
83. Paraguay (5.013)
82. South Africa (5.083)
81. Guinea (5.128)
80. Croatia (5.137)
79. Indonesia (5.159)
78. Bosnia and Herzegovina (5.241)
77. Laos (5.256)
76. Nepal (5.259)
75. Dominican Republic (5.269)
74. Hong Kong S.A.R. of China (5.297)
73. Peru (5.313)
72. Colombia (5.393)
71. Malaysia (5.418)
70. Hungary (5.474)
69. Vietnam (5.521)
68. Jamaica (5.529)
67. Greece (5.534)
66. Russia (5.544)
65. Bolivia (5.565)
64. Venezuela (5.570)
63. Portugal (5.571)
62. Algeria (5.631)
61. Bahrain (5.640)
60. Slovakia (5.641)
59. South Korea (5.642)
58. Honduras (5.645)
57. Cyprus (5.665)
56. Panama (5.687)
55. Kyrgyzstan (5.687)
54. Serbia (5.696)
53. Mongolia (5.701)
52. El Salvador (5.716)
51. Latvia (5.811)
50. Libya (5.835)
49. Guatemala (5.887)
0 1 2 3 4 5 6 7 8
143. Afghanistan (1.456)
142. Zambia (2.484)
141. Lebanon (2.490)
140. Botswana (2.528)
139. Congo (Kinshasa) (2.703)
138. Lesotho (2.808)
137. Zimbabwe (3.021)
136. Eswatini (3.075)
135. Comoros (3.305)
134. Uganda (3.403)
133. Sierra Leone (3.471)
132. Malawi (3.498)
131. Ethiopia (3.563)
130. Nigeria (3.720)
129. Yemen (3.740)
128. Sri Lanka (3.772)
127. Togo (3.790)
126. Tanzania (3.826)
125. Ghana (3.839)
124. Egypt (3.969)
123. Jordan (4.024)
122. Pakistan (4.030)
121. India (4.095)
120. Bangladesh (4.124)
119. Kenya (4.134)
118. Tunisia (4.167)
117. Benin (4.206)
116. Mali (4.211)
115. Ukraine (4.279)
114. Namibia (4.285)
113. Morocco (4.293)
112. Gambia (4.346)
111. Senegal (4.366)
110. Cambodia (4.401)
109. Madagascar (4.416)
108. Azerbaijan (4.417)
107. Cameroon (4.428)
106. Gabon (4.457)
105. Burkina Faso (4.505)
104. Liberia (4.534)
103. Iran (4.596)
102. Myanmar (4.626)
101. Niger (4.634)
100. Albania (4.643)
99. State of Palestine (4.643)
98. North Macedonia (4.658)
97. Montenegro (4.674)
Average Life Evaluation
95% condence interval

World Happiness Report 2024
29
To better illustrate the overall patterns of interna-
tional differences in happiness at different ages,
Table 2.2 shows for each country the ranking of
its life evaluations for the whole population (in
the rst column) and then four age groups- under
30, 30-44, 45-59, and 60+. The two columns at
the right hand side of the table show for each
country the happiest and least happy ages. The
countries are listed in order of 2021-2023 average
life evaluations for the whole population, the
same order as is used for Figure 2.1. Countries
with very different rankings at different ages
reect something unusual, relative to the world
average experience for each age group. For
example, the four countries in the NANZ group -
the United States, Canada, Australia and New
Zealand - all have rankings for the young that
are much lower than for the old, with the biggest
discrepancies in the United States and Canada
where the gap is 50 places or more. As we shall
see in the following sections, these gaps have
mainly arisen since 2010, and probably involve
some mix of generational and age effects.
There are many more countries where the rankings
for the young are more than 40 places higher
than for the old, mainly in Central and Eastern
Europe and Latin America. The biggest gap is
in Croatia, where the ranking for the young is
66 places higher than for the old. There are gaps
of 50 or more places for Bulgaria, Moldova, and
Serbia, and between 40 and 50 places in
Romania, Bosnia and Herzegovina, Montenegro,
and Paraguay. There are clearly generational as
well as age effects at play here as well, as the
older populations of Bosnia, Serbia, Croatia, and
Montenegro bear the most scars from the early
1990s wars and genocide following the breakup
of the former Yugoslavia.32
Photo Philip White on Unsplash

World Happiness Report 2024
30
Country All Ages The Young Lower Middle Upper Middle The Old Happiest Least Happy
Finland 1 7 1 1 2 Old Young
Denmark 2 5 3 4 1 Old Young
Iceland 3 4 4 2 5 Young LowerMiddle
Sweden 418 8 3 4 Old Young
Israel 5 2 2 7 18 Young Old
Netherlands 6 9 5 5 7 Old Young
Norway 720 6 6 3 Old Young
Luxembourg 8 6 11 812 Young LowerMiddle
Switzerland 913 911 14 Young UpperMiddle
Australia 10 19 14 10 9Old LowerMiddle
New Zealand 11 27 18 13 6Old LowerMiddle
Costa Rica 12 11 15 23 17 Young UpperMiddle
Kuwait 13 16 20 913 Old LowerMiddle
Austria 14 12 17 18 15 Young UpperMiddle
Canada 15 58 28 12 8Old Young
Belgium 16 24 13 15 19 LowerMiddle Old
Ireland 17 21 21 21 16 Young UpperMiddle
Czechia 18 10 12 22 23 Young Old
Lithuania 19 1 7 20 44 Young Old
United Kingdom 20 32 27 19 20 Old LowerMiddle
Slovenia 21 15 10 27 32 Young Old
United Arab Emirates 22 35 25 16 11 Old LowerMiddle
United States 23 62 42 17 10 Old LowerMiddle
Germany 24 47 16 28 21 LowerMiddle Young
Mexico 25 22 19 32 33 Young Old
Uruguay 26 30 22 34 24 Young UpperMiddle
France 27 48 23 26 25 LowerMiddle Old
Saudi Arabia 28 42 39 14 27 UpperMiddle LowerMiddle
Kosovo 29 23 37 33 39 Young Old
Singapore 30 54 36 25 26 UpperMiddle Old
Taiwan Province of China 31 25 35 31 34 Young Old
Romania 32 826 35 48 Young Old
El Salvador 33 17 38 45 52 Young Old
Estonia 34 44 24 30 35 LowerMiddle Old
Poland 35 43 34 24 40 UpperMiddle Old
Spain 36 55 40 29 29 UpperMiddle Old
Serbia 37 329 44 54 Young Old
Chile 38 39 32 42 46 Young Old
Panama 39 26 43 41 56 Young Old
Malta 40 57 41 38 31 Young UpperMiddle
Italy 41 41 31 39 38 Young Old
Guatemala 42 49 46 54 49 Young Old
Nicaragua 43 28 53 61 47 Young UpperMiddle
Brazil 44 60 44 40 37 Young Old
Slovakia 45 38 33 37 60 Young Old
Latvia 46 31 30 49 51 Young Old
Uzbekistan 47 71 62 36 22 Old LowerMiddle
Argentina 48 34 52 64 45 Young UpperMiddle
Kazakhstan 49 69 48 43 42 Young Old
Table 2.2: Ranking of life evaluations by age group, 2021- 2023

World Happiness Report 2024
31
Country All Ages The Young Lower Middle Upper Middle The Old Happiest Least Happy
Cyprus 50 51 49 62 57 Young Old
Japan 51 73 63 52 36 Young LowerMiddle
South Korea 52 52 45 55 59 Young Old
Philippines 53 70 68 58 43 Young LowerMiddle
Vietnam 54 65 54 53 69 Young Old
Portugal 55 46 50 46 63 Young Old
Hungary 56 36 51 48 70 Young Old
Paraguay 57 37 59 75 83 Young Old
Thailand 58 45 69 69 41 Young UpperMiddle
Malaysia 59 64 66 60 71 Young Old
China 60 79 67 57 30 Old LowerMiddle
Honduras 61 56 72 73 58 Young UpperMiddle
Bahrain 62 77 60 50 61 Young Old
Croatia 63 14 47 59 80 Young Old
Greece 64 53 58 56 67 Young Old
Bosnia and Herzegovina 65 33 65 67 78 Young Old
Libya 66 80 73 51 50 UpperMiddle LowerMiddle
Jamaica 67 84 61 47 68 UpperMiddle Old
Peru 68 63 64 80 73 Young UpperMiddle
Dominican Republic 69 61 70 79 75 Young Old
Mauritius 70 85 77 63 28 Old LowerMiddle
Moldova 71 29 55 66 86 Young Old
Russia 72 68 57 78 66 Young UpperMiddle
Bolivia 73 74 75 77 65 Young UpperMiddle
Ecuador 74 59 79 89 84 Young Old
Kyrgyzstan 75 81 81 68 55 Young LowerMiddle
Montenegro 76 50 56 70 97 Young Old
Mongolia 77 86 74 65 53 Young LowerMiddle
Colombia 78 76 78 71 72 Young Old
Venezuela 79 83 80 83 64 Young UpperMiddle
Indonesia 80 75 82 84 79 Young Old
Bulgaria 81 40 71 74 90 Young Old
Armenia 82 72 83 88 88 Young Old
South Africa 83 87 84 81 82 Young Old
North Macedonia 84 67 76 85 98 Young Old
Algeria 85 93 85 82 62 Old UpperMiddle
Hong Kong S.A.R. of China 86 97 89 72 74 UpperMiddle LowerMiddle
Albania 87 66 86 97 100 Young Old
Tajikistan 88 89 88 86 87 Young Old
Congo (Brazzaville) 89 88 97 90 85 Young Old
Mozambique 90 94 87 96 89 Young UpperMiddle
Georgia 91 78 91 91 91 Young Old
Iraq 92 90 96 94 95 Young Old
Nepal 93 92 101 93 76 Young UpperMiddle
Laos 94 104 93 76 77 UpperMiddle LowerMiddle
Gabon 95 91 99 100 106 Young Old
Ivory Coast 96 100 92 95 96 Young Old
Guinea 97 103 94 99 81 Old UpperMiddle
Türkiye 98 101 98 92 92 Young Old
Table 2.2: Ranking of life evaluations by age group, 2021- 2023 (continued)

World Happiness Report 2024
32
Country All Ages The Young Lower Middle Upper Middle The Old Happiest Least Happy
Senegal 99 99 104 102 111 Young Old
Iran 100 96 100 104 103 Young UpperMiddle
Azerbaijan 101 95 103 103 108 Young Old
Nigeria 102 108 95 87 130 UpperMiddle Old
State of Palestine 103 102 105 109 99 Young UpperMiddle
Cameroon 104 106 102 98 107 Young Old
Ukraine 105 82 90 110 115 Young Old
Namibia 106 105 106 101 114 Young Old
Morocco 107 98 108 107 113 Young Old
Pakistan 108 107 109 113 122 Young Old
Niger 109 116 110 114 101 Old UpperMiddle
Burkina Faso 110 117 107 116 105 LowerMiddle UpperMiddle
Mauritania 111 119 112 106 93 Old LowerMiddle
Gambia 112 110 116 115 112 Young LowerMiddle
Chad 113 120 111 111 94 Old UpperMiddle
Kenya 114 109 119 123 119 Young UpperMiddle
Tunisia 115 118 113 108 118 Young Old
Benin 116 115 117 122 117 Young UpperMiddle
Uganda 117 111 118 124 134 Young Old
Myanmar 118 122 115 105 102 Old LowerMiddle
Cambodia 119 112 122 120 110 Young LowerMiddle
Ghana 120 121 114 119 125 Young Old
Liberia 121 113 126 127 104 Young UpperMiddle
Mali 122 125 120 118 116 Young LowerMiddle
Madagascar 123 124 123 117 109 Old LowerMiddle
Togo 124 126 121 112 127 UpperMiddle Old
Jordan 125 114 124 130 123 Young UpperMiddle
India 126 127 127 121 121 Young LowerMiddle
Egypt 127 130 125 126 124 Young UpperMiddle
Sri Lanka 128 123 128 128 128 Young UpperMiddle
Bangladesh 129 128 129 129 120 Young UpperMiddle
Ethiopia 130 131 130 125 131 Young LowerMiddle
Tanzania 131 129 132 131 126 Young UpperMiddle
Comoros 132 132 139 133 135 Young LowerMiddle
Yemen 133 135 135 136 129 Young UpperMiddle
Zambia 134 136 131 138 142 Young Old
Eswatini 135 134 134 137 136 Young UpperMiddle
Malawi 136 137 140 135 132 Young LowerMiddle
Botswana 137 133 133 140 140 Young Old
Zimbabwe 138 139 138 139 137 Young UpperMiddle
Congo (Kinshasa) 139 140 137 134 139 Young Old
Sierra Leone 140 141 136 132 133 Old LowerMiddle
Lesotho 141 138 141 142 138 Young UpperMiddle
Lebanon 142 142 142 141 141 Young Old
Afghanistan 143 143 143 143 143 Young Old
Table 2.2: Ranking of life evaluations by age group, 2021- 2023 (continued)

World Happiness Report 2024
33
The ranking gaps are imperfect measures of the
happiness gaps between the old and young,
because the distribution of country averages is
much more tightly spaced in the middle, where a
small change in average happiness can translate
to many ranks. There are fewer countries with
large rank differences at both ends of the distri-
bution, where the ranks are most consistent. A
country at the top of the overall ranking has to
have pretty high happiness in all age groups,
while in the really unhappy countries there are no
happy age groups. Thus to assess happiness at
different ages it is better to look at the average
reported happiness levels at different ages, as we
now do.
What is typical for happiness at different ages?33
Figure 2.4 shows average life evaluations in the
four age groups for the world as a whole and for
each of ten regions, separately for males and
females. For the world as a whole, in recent years,
there is a gradual slight decline in average happiness
as age increases.34 As will be shown by Figure 2.5
and 2.6 in the next section, it has not always been
thus, as in the early years of the Gallup World Poll
(2006-2010) the young were the happiest group,
followed by those over 60 and then those 30 to
44, with 45-59 as the least happy group.
Figure 2.4: Happiness at different ages, 2021-2023
Cantril Ladder
Age Group
Males
Females
Middle East
and North Africa
Sub-Saharan Africa
< 30 30–44 45–59 60+ < 30 30–44 45–59 60+
North America and ANZ
7
6
5
4
3
< 30 30–44 45–59 60+
Southeast Asia
7
6
5
4
3
South Asia East Asia Latin America
and Caribbean
< 30 30–44 45–59 60+
World
7
6
5
4
3
Western Europe Central and Eastern Europe Commonwealth of
Independent States
World Happiness Report 2024
34
The rst panel of Figure 2.4 displays a fairly at
global pattern of life evaluations across age
groups, with the young on average happier than
the old, and a slight gender difference favouring
females.35 This global average obscures a range
of regional experiences. When considering the
regional differences, and how they contribute to
the global average, it is important to remember
that every country has equal weight in the regional
and global averages, so that the regions with
more countries contribute correspondingly more
to the global averages.36 Considering the regions
in the order shown in Table 2.4, Western Europe
has an almost completely at prole across the
age groups, although Table 2.2 and Figures 2.2
and 2.3 show a variety of experiences within the
region. For example, Norway, Sweden, Germany,
France, the United Kingdom and Spain are coun-
tries where the old are now signicantly happier
than the young, while Portugal and Greece show
the reverse pattern.
The countries of Central and Eastern Europe show
much higher life evaluations for the young, with
a steady decline across age groups thereafter,
accumulating to a gap between the young and the
old of more than a full point on the 0 to 10 scale.
This pattern is slightly more pronounced for females
than for males. The twelve countries in the
Commonwealth of Independent States, with Russia
and Ukraine as the largest, show a more muted
pattern than in Central and Eastern Europe, and with
a larger mid-life drop for males than for females.
The ten countries of Southeast Asia, with Indonesia
the largest and Singapore the smallest, show a
declining structure of happiness across age
groups and a gender difference favouring young
females, with the largest contribution to this
effect coming from Singapore.
In South Asia, happiness is lowest in the middle
age groups, especially for males, exposing a
large middle age life evaluation gap favouring
females, with a denite U-shape for males.
In East Asia, there is a general slight downward
tilt with age, with females happier than males in
all age groups.
In Latin America and the Caribbean, there is a
general downward trend across ages less than
60, with an increase thereafter for females.
Male and female happiness is equal under the
age of 30, with a growing age gap thereafter
favouring females.
In North America, Australia and New Zealand, life
evaluations in 2021-2023 were lowest among the
young, rising gradually with age to be highest
among the old. The age gap favouring the old is
evident in all four countries, while being much
larger in the United States and Canada. The only
signicant gender gap is in older middle age,
favouring females.
For the twenty countries of the Middle East and
North Africa, by contrast, happiness is highest for
the young, especially young females, and then
falls steadily thereafter before rising again for
females 60 and over. There is diversity within the
region, with the gap favouring the young found
especially in Israel, while being reversed in the
UAE and Saudi Arabia, both of which have large
numbers of foreign-born workers in their lower
age groups.
Averaging across more than 40 countries in
Sub-Saharan Africa, life evaluations are highest
for the young, fairly similar in the two middle age
groups, and then higher for males and lower for
females in the 60+ age group.
What about global differences within age groups?
Within the group of those under the age of 30,
average life evaluations drop signicantly with
age,37 a nding that has echoes in Chapter 3
dealing with a broader range of evidence on
adolescent and youth well-being. Within the
global sample of those over 60, we nd life
evaluations rising with age, as is also found in the
Indian evidence in Chapter 5.38 For a global
sample including both of the middle age groups,
Norway, Sweden, Germany,
France, the United Kingdom and
Spain are countries where the old
are now signicantly happier than
the young, while Portugal and
Greece show the reverse pattern.

World Happiness Report 2024
35
there is a negative inuence from age and a
positive one from age-squared, with an implied
low point slightly below age 50.39 Within the
30 to 44 age group, the age effect is generally
down, with no sign of a low point within that age
range. Within the 45 to 59 group, there is an
implied U-shape in age, with an estimated low
point just over 50 years of age. More on this later
in the chapter.
Is life getting better or worse,
and for which age groups?
The most ne-grained national-level indication
of how the quality of life has been changing in
each country is provided in Figures 7 through 34
in the Statistical Appendix. Figures 7-20 plot for
each country the year-by-year trajectories for
life evaluations in each of the four age groups,
and Figures 21-34 repeat the analysis with the
population divided into three birth cohorts: those
born before 1964, between 1965 and 1980, and
after 1980.
For the population as a whole, Figure 2.5 below
shows for each country the change in happiness
from 2006-2010 to 2021-2023. Seventeen countries
have increases in average life evaluations of a full
point or more, compared to seven countries with
reductions of a point or more on the 0 to 10 scale.
Among the larger gainers, there are several
countries in Eastern Europe where the increases
were more than one-third of their average
happiness scores in 2006-2010. Some of the
worst faring countries, especially Lebanon and
Afghanistan saw their life evaluations halved from
their base values.
Photo Aleksandar Popovski on Unsplash

World Happiness Report 2024
36
Figure 2.5: Changes in Happiness: from 2006-2010 to 2021-2023
50. Indonesia (0.410)
49. Morocco (0.411)
48. South Korea (0.414)
47. Niger (0.434)
46. Czechia (0.462)
45. Senegal (0.472)
44. Russia (0.501)
43. Cameroon (0.510)
42. Moldova (0.510)
41. El Salvador (0.513)
40. Taiwan Province of China (0.516)
39. Mozambique (0.524)
38. Chad (0.552)
37. Nepal (0.554)
36. Montenegro (0.560)
35. Paraguay (0.578)
34. Peru (0.583)
33. Kazakhstan (0.593)
32. Slovakia (0.600)
31. Burkina Faso (0.622)
30. Iceland (0.637)
29. Poland (0.638)
28. Tajikistan (0.667)
27. Vietnam (0.683)
26. Portugal (0.702)
25. Uruguay (0.713)
24. Dominican Republic (0.787)
23. Slovenia (0.821)
22. Ivory Coast (0.883)
21. Benin (0.884)
20. Kyrgyzstan (0.885)
19. Uzbekistan (0.970)
18. Armenia (0.981)
17. North Macedonia (1.000)
16. Bosnia and Herzegovina (1.020)
15. Hungary (1.074)
14. Estonia (1.118)
13. Mongolia (1.134)
12. Kosovo (1.141)
11. Nicaragua (1.169)
10. Togo (1.207)
9. Philippines (1.223)
8. Lithuania (1.229)
7. Georgia (1.292)
6. China (1.293)
5. Romania (1.313)
4. Congo (Brazzaville) (1.402)
3. Latvia (1.473)
2. Bulgaria (1.573)
1. Serbia (1.847)
100. Turkiye (0.259)
99. Italy (0.255)
98. Norway (0.222)
97. Belgium (0.219)
96. Ukraine (0.216)
95. United Arab Emirates (0.200)
94. Greece (0.199)
93. Netherlands (0.193)
92. United Kingdom (0.187)
91. France (0.138)
90. Hong Kong S.A.R. of China (0.107)
89. Algeria (0.100)
88. Madagascar (0.081)
87. Comoros (0.078)
86. Tanzania (0.069)
85. Mexico (0.062)
84. Argentina (0.054)
83. Namibia (0.054)
82. Sweden (0.035)
81. Singapore (0.027)
80. Laos (0.022)
79. Japan (0.001)
78. Guatemala (0.010)
77. Mauritania (0.011)
76. Saudi Arabia (0.014)
75. Nigeria (0.025)
74. Uganda (0.058)
73. Luxembourg (0.071)
72. Israel (0.142)
71. Bahrain (0.143)
70. Germany (0.146)
69. Bolivia (0.151)
68. Malaysia (0.152)
67. Finland (0.162)
66. Albania (0.171)
65. Thailand (0.172)
64. Liberia (0.229)
63. Chile (0.232)
62. Kenya (0.250)
61. Cambodia (0.252)
60. Mali (0.265)
59. Ecuador (0.300)
58. Azerbaijan (0.311)
57. Iraq (0.311)
56. Croatia (0.320)
55. South Africa (0.321)
54. State of Palestine (0.366)
53. Kuwait (0.379)
52. Malta (0.386)
51. Honduras (0.404)
134. Afghanistan (2.599)
133. Lebanon (2.324)
132. Jordan (1.522)
131. Venezuela (1.316)
130. Malawi (1.203)
129. Zambia (1.202)
128. Botswana (1.197)
127. Yemen (0.997)
126. Egypt (0.993)
125. India (0.920)
124. Bangladesh (0.887)
123. Congo (Kinshasa) (0.688)
122. Tunisia (0.675)
121. Canada (0.599)
120. United States (0.545)
119. Colombia (0.507)
118. Panama (0.504)
117. Pakistan (0.479)
116. Zimbabwe (0.463)
115. Ireland (0.446)
114. Switzerland (0.439)
113. Brazil (0.425)
112. Ghana (0.416)
111. Sri Lanka (0.377)
110. Jamaica (0.366)
109. Cyprus (0.348)
108. New Zealand (0.343)
107. Sierra Leone (0.341)
106. Spain (0.340)
105. Iran (0.338)
104. Austria (0.323)
103. Costa Rica (0.296
102. Australia (0.273)
101. Denmark (0.273)
−2−1.5 −1�.5 0 .5 1 1.5 2
Changes from 2006–2010 to 2021–2023
95% condence interval

World Happiness Report 2024
37
Figure 2.5: Changes in Happiness: from 2006-2010 to 2021-2023 (continued)
50. Indonesia (0.410)
49. Morocco (0.411)
48. South Korea (0.414)
47. Niger (0.434)
46. Czechia (0.462)
45. Senegal (0.472)
44. Russia (0.501)
43. Cameroon (0.510)
42. Moldova (0.510)
41. El Salvador (0.513)
40. Taiwan Province of China (0.516)
39. Mozambique (0.524)
38. Chad (0.552)
37. Nepal (0.554)
36. Montenegro (0.560)
35. Paraguay (0.578)
34. Peru (0.583)
33. Kazakhstan (0.593)
32. Slovakia (0.600)
31. Burkina Faso (0.622)
30. Iceland (0.637)
29. Poland (0.638)
28. Tajikistan (0.667)
27. Vietnam (0.683)
26. Portugal (0.702)
25. Uruguay (0.713)
24. Dominican Republic (0.787)
23. Slovenia (0.821)
22. Ivory Coast (0.883)
21. Benin (0.884)
20. Kyrgyzstan (0.885)
19. Uzbekistan (0.970)
18. Armenia (0.981)
17. North Macedonia (1.000)
16. Bosnia and Herzegovina (1.020)
15. Hungary (1.074)
14. Estonia (1.118)
13. Mongolia (1.134)
12. Kosovo (1.141)
11. Nicaragua (1.169)
10. Togo (1.207)
9. Philippines (1.223)
8. Lithuania (1.229)
7. Georgia (1.292)
6. China (1.293)
5. Romania (1.313)
4. Congo (Brazzaville) (1.402)
3. Latvia (1.473)
2. Bulgaria (1.573)
1. Serbia (1.847)
100. Turkiye (0.259)
99. Italy (0.255)
98. Norway (0.222)
97. Belgium (0.219)
96. Ukraine (0.216)
95. United Arab Emirates (0.200)
94. Greece (0.199)
93. Netherlands (0.193)
92. United Kingdom (0.187)
91. France (0.138)
90. Hong Kong S.A.R. of China (0.107)
89. Algeria (0.100)
88. Madagascar (0.081)
87. Comoros (0.078)
86. Tanzania (0.069)
85. Mexico (0.062)
84. Argentina (0.054)
83. Namibia (0.054)
82. Sweden (0.035)
81. Singapore (0.027)
80. Laos (0.022)
79. Japan (0.001)
78. Guatemala (0.010)
77. Mauritania (0.011)
76. Saudi Arabia (0.014)
75. Nigeria (0.025)
74. Uganda (0.058)
73. Luxembourg (0.071)
72. Israel (0.142)
71. Bahrain (0.143)
70. Germany (0.146)
69. Bolivia (0.151)
68. Malaysia (0.152)
67. Finland (0.162)
66. Albania (0.171)
65. Thailand (0.172)
64. Liberia (0.229)
63. Chile (0.232)
62. Kenya (0.250)
61. Cambodia (0.252)
60. Mali (0.265)
59. Ecuador (0.300)
58. Azerbaijan (0.311)
57. Iraq (0.311)
56. Croatia (0.320)
55. South Africa (0.321)
54. State of Palestine (0.366)
53. Kuwait (0.379)
52. Malta (0.386)
51. Honduras (0.404)
134. Afghanistan (2.599)
133. Lebanon (2.324)
132. Jordan (1.522)
131. Venezuela (1.316)
130. Malawi (1.203)
129. Zambia (1.202)
128. Botswana (1.197)
127. Yemen (0.997)
126. Egypt (0.993)
125. India (0.920)
124. Bangladesh (0.887)
123. Congo (Kinshasa) (0.688)
122. Tunisia (0.675)
121. Canada (0.599)
120. United States (0.545)
119. Colombia (0.507)
118. Panama (0.504)
117. Pakistan (0.479)
116. Zimbabwe (0.463)
115. Ireland (0.446)
114. Switzerland (0.439)
113. Brazil (0.425)
112. Ghana (0.416)
111. Sri Lanka (0.377)
110. Jamaica (0.366)
109. Cyprus (0.348)
108. New Zealand (0.343)
107. Sierra Leone (0.341)
106. Spain (0.340)
105. Iran (0.338)
104. Austria (0.323)
103. Costa Rica (0.296
102. Australia (0.273)
101. Denmark (0.273)
−2−1.5 −1�.5 0 .5 1 1.5 2
Changes from 2006–2010 to 2021–2023
95% condence interval

World Happiness Report 2024
38
Figure 2.5: Changes in Happiness: from 2006-2010 to 2021-2023 (continued)
50. Indonesia (0.410)
49. Morocco (0.411)
48. South Korea (0.414)
47. Niger (0.434)
46. Czechia (0.462)
45. Senegal (0.472)
44. Russia (0.501)
43. Cameroon (0.510)
42. Moldova (0.510)
41. El Salvador (0.513)
40. Taiwan Province of China (0.516)
39. Mozambique (0.524)
38. Chad (0.552)
37. Nepal (0.554)
36. Montenegro (0.560)
35. Paraguay (0.578)
34. Peru (0.583)
33. Kazakhstan (0.593)
32. Slovakia (0.600)
31. Burkina Faso (0.622)
30. Iceland (0.637)
29. Poland (0.638)
28. Tajikistan (0.667)
27. Vietnam (0.683)
26. Portugal (0.702)
25. Uruguay (0.713)
24. Dominican Republic (0.787)
23. Slovenia (0.821)
22. Ivory Coast (0.883)
21. Benin (0.884)
20. Kyrgyzstan (0.885)
19. Uzbekistan (0.970)
18. Armenia (0.981)
17. North Macedonia (1.000)
16. Bosnia and Herzegovina (1.020)
15. Hungary (1.074)
14. Estonia (1.118)
13. Mongolia (1.134)
12. Kosovo (1.141)
11. Nicaragua (1.169)
10. Togo (1.207)
9. Philippines (1.223)
8. Lithuania (1.229)
7. Georgia (1.292)
6. China (1.293)
5. Romania (1.313)
4. Congo (Brazzaville) (1.402)
3. Latvia (1.473)
2. Bulgaria (1.573)
1. Serbia (1.847)
100. Turkiye (0.259)
99. Italy (0.255)
98. Norway (0.222)
97. Belgium (0.219)
96. Ukraine (0.216)
95. United Arab Emirates (0.200)
94. Greece (0.199)
93. Netherlands (0.193)
92. United Kingdom (0.187)
91. France (0.138)
90. Hong Kong S.A.R. of China (0.107)
89. Algeria (0.100)
88. Madagascar (0.081)
87. Comoros (0.078)
86. Tanzania (0.069)
85. Mexico (0.062)
84. Argentina (0.054)
83. Namibia (0.054)
82. Sweden (0.035)
81. Singapore (0.027)
80. Laos (0.022)
79. Japan (0.001)
78. Guatemala (0.010)
77. Mauritania (0.011)
76. Saudi Arabia (0.014)
75. Nigeria (0.025)
74. Uganda (0.058)
73. Luxembourg (0.071)
72. Israel (0.142)
71. Bahrain (0.143)
70. Germany (0.146)
69. Bolivia (0.151)
68. Malaysia (0.152)
67. Finland (0.162)
66. Albania (0.171)
65. Thailand (0.172)
64. Liberia (0.229)
63. Chile (0.232)
62. Kenya (0.250)
61. Cambodia (0.252)
60. Mali (0.265)
59. Ecuador (0.300)
58. Azerbaijan (0.311)
57. Iraq (0.311)
56. Croatia (0.320)
55. South Africa (0.321)
54. State of Palestine (0.366)
53. Kuwait (0.379)
52. Malta (0.386)
51. Honduras (0.404)
134. Afghanistan (2.599)
133. Lebanon (2.324)
132. Jordan (1.522)
131. Venezuela (1.316)
130. Malawi (1.203)
129. Zambia (1.202)
128. Botswana (1.197)
127. Yemen (0.997)
126. Egypt (0.993)
125. India (0.920)
124. Bangladesh (0.887)
123. Congo (Kinshasa) (0.688)
122. Tunisia (0.675)
121. Canada (0.599)
120. United States (0.545)
119. Colombia (0.507)
118. Panama (0.504)
117. Pakistan (0.479)
116. Zimbabwe (0.463)
115. Ireland (0.446)
114. Switzerland (0.439)
113. Brazil (0.425)
112. Ghana (0.416)
111. Sri Lanka (0.377)
110. Jamaica (0.366)
109. Cyprus (0.348)
108. New Zealand (0.343)
107. Sierra Leone (0.341)
106. Spain (0.340)
105. Iran (0.338)
104. Austria (0.323)
103. Costa Rica (0.296
102. Australia (0.273)
101. Denmark (0.273)
−2−1.5 −1�.5 0 .5 1 1.5 2
50. Indonesia (0.410)
49. Morocco (0.411)
48. South Korea (0.414)
47. Niger (0.434)
46. Czechia (0.462)
45. Senegal (0.472)
44. Russia (0.501)
43. Cameroon (0.510)
42. Moldova (0.510)
41. El Salvador (0.513)
40. Taiwan Province of China (0.516)
39. Mozambique (0.524)
38. Chad (0.552)
37. Nepal (0.554)
36. Montenegro (0.560)
35. Paraguay (0.578)
34. Peru (0.583)
33. Kazakhstan (0.593)
32. Slovakia (0.600)
31. Burkina Faso (0.622)
30. Iceland (0.637)
29. Poland (0.638)
28. Tajikistan (0.667)
27. Vietnam (0.683)
26. Portugal (0.702)
25. Uruguay (0.713)
24. Dominican Republic (0.787)
23. Slovenia (0.821)
22. Ivory Coast (0.883)
21. Benin (0.884)
20. Kyrgyzstan (0.885)
19. Uzbekistan (0.970)
18. Armenia (0.981)
17. North Macedonia (1.000)
16. Bosnia and Herzegovina (1.020)
15. Hungary (1.074)
14. Estonia (1.118)
13. Mongolia (1.134)
12. Kosovo (1.141)
11. Nicaragua (1.169)
10. Togo (1.207)
9. Philippines (1.223)
8. Lithuania (1.229)
7. Georgia (1.292)
6. China (1.293)
5. Romania (1.313)
4. Congo (Brazzaville) (1.402)
3. Latvia (1.473)
2. Bulgaria (1.573)
1. Serbia (1.847)
100. Turkiye (0.259)
99. Italy (0.255)
98. Norway (0.222)
97. Belgium (0.219)
96. Ukraine (0.216)
95. United Arab Emirates (0.200)
94. Greece (0.199)
93. Netherlands (0.193)
92. United Kingdom (0.187)
91. France (0.138)
90. Hong Kong S.A.R. of China (0.107)
89. Algeria (0.100)
88. Madagascar (0.081)
87. Comoros (0.078)
86. Tanzania (0.069)
85. Mexico (0.062)
84. Argentina (0.054)
83. Namibia (0.054)
82. Sweden (0.035)
81. Singapore (0.027)
80. Laos (0.022)
79. Japan (0.001)
78. Guatemala (0.010)
77. Mauritania (0.011)
76. Saudi Arabia (0.014)
75. Nigeria (0.025)
74. Uganda (0.058)
73. Luxembourg (0.071)
72. Israel (0.142)
71. Bahrain (0.143)
70. Germany (0.146)
69. Bolivia (0.151)
68. Malaysia (0.152)
67. Finland (0.162)
66. Albania (0.171)
65. Thailand (0.172)
64. Liberia (0.229)
63. Chile (0.232)
62. Kenya (0.250)
61. Cambodia (0.252)
60. Mali (0.265)
59. Ecuador (0.300)
58. Azerbaijan (0.311)
57. Iraq (0.311)
56. Croatia (0.320)
55. South Africa (0.321)
54. State of Palestine (0.366)
53. Kuwait (0.379)
52. Malta (0.386)
51. Honduras (0.404)
134. Afghanistan (2.599)
133. Lebanon (2.324)
132. Jordan (1.522)
131. Venezuela (1.316)
130. Malawi (1.203)
129. Zambia (1.202)
128. Botswana (1.197)
127. Yemen (0.997)
126. Egypt (0.993)
125. India (0.920)
124. Bangladesh (0.887)
123. Congo (Kinshasa) (0.688)
122. Tunisia (0.675)
121. Canada (0.599)
120. United States (0.545)
119. Colombia (0.507)
118. Panama (0.504)
117. Pakistan (0.479)
116. Zimbabwe (0.463)
115. Ireland (0.446)
114. Switzerland (0.439)
113. Brazil (0.425)
112. Ghana (0.416)
111. Sri Lanka (0.377)
110. Jamaica (0.366)
109. Cyprus (0.348)
108. New Zealand (0.343)
107. Sierra Leone (0.341)
106. Spain (0.340)
105. Iran (0.338)
104. Austria (0.323)
103. Costa Rica (0.296
102. Australia (0.273)
101. Denmark (0.273)
−2−1.5 −1�.5 0 .5 1 1.5 2
50. Indonesia (0.410)
49. Morocco (0.411)
48. South Korea (0.414)
47. Niger (0.434)
46. Czechia (0.462)
45. Senegal (0.472)
44. Russia (0.501)
43. Cameroon (0.510)
42. Moldova (0.510)
41. El Salvador (0.513)
40. Taiwan Province of China (0.516)
39. Mozambique (0.524)
38. Chad (0.552)
37. Nepal (0.554)
36. Montenegro (0.560)
35. Paraguay (0.578)
34. Peru (0.583)
33. Kazakhstan (0.593)
32. Slovakia (0.600)
31. Burkina Faso (0.622)
30. Iceland (0.637)
29. Poland (0.638)
28. Tajikistan (0.667)
27. Vietnam (0.683)
26. Portugal (0.702)
25. Uruguay (0.713)
24. Dominican Republic (0.787)
23. Slovenia (0.821)
22. Ivory Coast (0.883)
21. Benin (0.884)
20. Kyrgyzstan (0.885)
19. Uzbekistan (0.970)
18. Armenia (0.981)
17. North Macedonia (1.000)
16. Bosnia and Herzegovina (1.020)
15. Hungary (1.074)
14. Estonia (1.118)
13. Mongolia (1.134)
12. Kosovo (1.141)
11. Nicaragua (1.169)
10. Togo (1.207)
9. Philippines (1.223)
8. Lithuania (1.229)
7. Georgia (1.292)
6. China (1.293)
5. Romania (1.313)
4. Congo (Brazzaville) (1.402)
3. Latvia (1.473)
2. Bulgaria (1.573)
1. Serbia (1.847)
100. Turkiye (0.259)
99. Italy (0.255)
98. Norway (0.222)
97. Belgium (0.219)
96. Ukraine (0.216)
95. United Arab Emirates (0.200)
94. Greece (0.199)
93. Netherlands (0.193)
92. United Kingdom (0.187)
91. France (0.138)
90. Hong Kong S.A.R. of China (0.107)
89. Algeria (0.100)
88. Madagascar (0.081)
87. Comoros (0.078)
86. Tanzania (0.069)
85. Mexico (0.062)
84. Argentina (0.054)
83. Namibia (0.054)
82. Sweden (0.035)
81. Singapore (0.027)
80. Laos (0.022)
79. Japan (0.001)
78. Guatemala (0.010)
77. Mauritania (0.011)
76. Saudi Arabia (0.014)
75. Nigeria (0.025)
74. Uganda (0.058)
73. Luxembourg (0.071)
72. Israel (0.142)
71. Bahrain (0.143)
70. Germany (0.146)
69. Bolivia (0.151)
68. Malaysia (0.152)
67. Finland (0.162)
66. Albania (0.171)
65. Thailand (0.172)
64. Liberia (0.229)
63. Chile (0.232)
62. Kenya (0.250)
61. Cambodia (0.252)
60. Mali (0.265)
59. Ecuador (0.300)
58. Azerbaijan (0.311)
57. Iraq (0.311)
56. Croatia (0.320)
55. South Africa (0.321)
54. State of Palestine (0.366)
53. Kuwait (0.379)
52. Malta (0.386)
51. Honduras (0.404)
134. Afghanistan (2.599)
133. Lebanon (2.324)
132. Jordan (1.522)
131. Venezuela (1.316)
130. Malawi (1.203)
129. Zambia (1.202)
128. Botswana (1.197)
127. Yemen (0.997)
126. Egypt (0.993)
125. India (0.920)
124. Bangladesh (0.887)
123. Congo (Kinshasa) (0.688)
122. Tunisia (0.675)
121. Canada (0.599)
120. United States (0.545)
119. Colombia (0.507)
118. Panama (0.504)
117. Pakistan (0.479)
116. Zimbabwe (0.463)
115. Ireland (0.446)
114. Switzerland (0.439)
113. Brazil (0.425)
112. Ghana (0.416)
111. Sri Lanka (0.377)
110. Jamaica (0.366)
109. Cyprus (0.348)
108. New Zealand (0.343)
107. Sierra Leone (0.341)
106. Spain (0.340)
105. Iran (0.338)
104. Austria (0.323)
103. Costa Rica (0.296
102. Australia (0.273)
101. Denmark (0.273)
−2−1.5 −1�.5 0 .5 1 1.5 2
Changes from 2006–2010 to 2021–2023
95% condence interval
¨

World Happiness Report 2024
39
Figure 2.6 returns to a regional focus to show
how average life evaluations have changed
between 2006-2010 and 2021-2023 for each of
the ten regions, as well as for the average of all
countries, for each of four age groups.
Looking rst at the global average across countries,
life evaluations have improved very slightly in all
age groups. Once again, this global average
masks some very different regional trajectories.
Happiness has generally increased for all age
groups in East Asia, Central and Eastern Europe,
and the CIS, and fallen in South Asia, the NANZ
group and the Middle East and North Africa.
There are interesting age group differences within
this general pattern.
In Western Europe, life evaluations among the
young are signicantly lower in 2021-2023 than
they were in 2006-2010, with a lesser drop in lower
middle age and a small increase for those over 60.
In Central and Eastern Europe, life has improved
by a full point or more at all ages, especially in the
middle age groups. Happiness continues to be
much higher in the younger age groups, although
by less now than in 2006-2010. The convergence
of happiness levels in Central and Eastern Europe
toward those in Western Europe has continued.
For those under 30, this convergence is complete,
as happiness levels for them are essentially equal
in both halves of Europe. For those over 60, the
gap between the two halves of Europe is about
half of what it was in 2006-2010, while still being
more than a full point in 2021-2023.
Life evaluations have also risen for all age groups
in the CIS countries, by on average half as much
as in Central and Eastern Europe, even though
starting a half-point lower in 2006-2020. Hence
the increased gap between these two regional
groups, especially so for the young and lower-
middle age groups.
Figure 2.6: Happiness changes from 2006-2010 to 2021-2023
Cantril Ladder
Age Group
2006 – 2010
2021 – 2023
Middle East
and North Africa
Sub-Saharan Africa
< 30 30–44 45–59 60+ < 30 30–44 45–59 60+
North America and ANZ
8
7
6
5
4
< 30 30–44 45–59 60+
Southeast Asia
8
7
6
5
4
South Asia East Asia Latin America
and Caribbean
< 30 30–44 45–59 60+
World
8
7
6
5
4
Western Europe Central and Eastern Europe Commonwealth of
Independent States

World Happiness Report 2024
40
For the United States, Canada, Australia and
New Zealand, happiness has decreased in all age
groups, but especially for the young, so much so
that the young are now, in 2021-2023, the least
happy age group. This is a big change from
2006-2010, when the young were happier than
those in the midlife groups, and about as happy
as those aged 60 and over. For the young, the
happiness drop was about three-quarters of a
point, and greater for females than males.
In the Middle East and North Africa, average life
evaluations fell in all groups between 2006-2010
and 2021-2023, by almost twice as much for
those over 60 and for those under 30. Thus
there has been in the past dozen years a
steepening of the age gradient favouring the
young over the old.
Figure 2.7: Negative emotions by gender and age, 2021-2023
Finally, average life evaluations in Sub-Saharan
Africa have not changed for those in the middle
age groups, while rising slightly for both the
young and the old.
Emotions at different ages
How do emotions differ by age? We shall rst
consider negative emotions and then positive
ones, following the denitions in Technical Box 2.
Females have more frequent negative
emotions at all ages
Figure 2.7 shows negative emotions in the years
2021-2023 by age, separately for females and
males. For the world as a whole, the average
frequency of the selected negative emotions is
higher for females than males, with the gender
gap growing slightly from the young to the old.
Negative Affect
Age Group
Males
Females
Middle East
and North Africa
Sub-Saharan Africa
< 30 30–44 45–59 60+ < 30 30–44 45–59 60+
North America and ANZ
.5
.4
.3
.2
.1
< 30 30–44 45–59 60+
Southeast Asia
.5
.4
.3
.2
.1
South Asia East Asia Latin America
and Caribbean
< 30 30–44 45–59 60+
World
.5
.4
.3
.2
.1
Western Europe Central and Eastern Europe Commonwealth of
Independent States

World Happiness Report 2024
41
Looking across the regions, there is a mixed
pattern. In Western Europe, negative emotions
are relatively less frequent for males than females
at all ages, and decline slightly with age for both
males and females. Negative emotions in 2021-
2023 were generally more frequent in Central and
Eastern Europe than in Western Europe, have a
slightly larger gender gap, and rise with age for
both females and males, but by more for females
than males. The same pattern repeats when
moving to the CIS countries, with negative
emotions more frequent at higher ages, and more
for females than males.
The three parts of Asia show quite different
patterns. In Southeast Asia, negative emotions
yesterday are more frequent for females than
males for the two younger age groups, and
less frequent for those over 60. In South Asia,
negative emotions are more frequent than
elsewhere in the world, especially at higher ages
and for females. In East Asia, negative emotions
are globally low, and show little difference by
age and gender.
In Latin America and the Caribbean, negative
emotions are more frequent for females than
males, especially in the middle age groups, and
generally rise with age.
The group including the United States, Canada,
Australia and New Zealand shows a quite differ-
ent pattern than elsewhere. Negative emotions
are at all ages more frequent for females than
males, especially for those under 30. In this
region, unlike anywhere else except Western
Europe, negative emotions are more frequent
among the young and least frequent for the old.
Negative emotions in SubSaharan Africa are
equally frequent for males and females under the
age of 30, and rise with age for both genders
thereafter, by more for females than males. In the
Middle East and North Africa, the biggest gender
gap is in the middle age groups, anked by rough
gender equality for the young and old.
Negative emotions have gone up in some
regions, and down in others
We now consider changes in emotions between
2006-2010 and 2021-2023. As shown in Figure 2.8,
negative emotions are more frequent now than
in 2006-2010 everywhere, only slightly so in East
Asia and Western Europe. The big exception is
in Central and Eastern Europe, where there
has been a drop in the frequency of negative
emotions in all age groups, in contrast to the rest
of the world, but consistent with the happiness
convergence taking place within Europe.
Increases in negative emotions have been most
frequent in South Asia and Sub-Saharan Africa,
especially at higher ages. In Latin America there
has been no increased frequency of negative
emotions among those under 30, but a substantial
increase in the older age groups. The CIS countries
show a similar but somewhat muted pattern.
Photo Bill Wegener on Unsplash

World Happiness Report 2024
42
There is the reverse pattern in the NANZ countries
where negative emotions have increased more for
the young than for the old. No other region shows
negative emotions increasing more for the young
than for the old.
Positive emotions are more frequent at
lower ages, and have changed less
As shown in Figure 2.9, positive emotions, which
include laughter, enjoyment, and doing interesting
things,40 are based on experience the previous
day, are almost everywhere more frequent in the
youngest age groups, and are gradually less
frequent at higher ages. The only exception is in
the NANZ group of countries, which show a
U-shape in age, with those 60+ having about the
same frequency of positive emotions as those
under 30. Age-related decreases in the frequency
Figure 2.8: Negative affect levels by age 2006-2010 vs 2021-2023
of positive emotions, coupled with increases in
the prevalence of physical pain, encourage a
deeper look at why life evaluations as a whole so
frequently rise after a mid-life low. We do this in
later sections.
What about changes from 2006-2010 to 2021-
2023? Figure 2.9 shows no change at the global
level, except for those over 60 where positive
emotions are now more frequent than before. The
unchanged global average shows the net effects
of differing regional patterns. The increased
global frequency of positive emotions among
those over 60 is driven by the countries of
Sub-Saharan Africa, Central and Eastern Europe,
and the CIS. In all other regions, positive emotions
at all ages are either unchanged or lower in
2021-2013 than they were in 2006-2010.
Negative Affect
Age Group
2006 – 2010
2021 – 2023
Middle East
and North Africa
Sub-Saharan Africa
< 30 30–44 45–59 60+ < 30 30–44 45–59 60+
North America and ANZ
.5
.4
.3
.2
.1
< 30 30–44 45–59 60+
Southeast Asia
.5
.4
.3
.2
.1
South Asia East Asia Latin America
and Caribbean
< 30 30–44 45–59 60+
World
.5
.4
.3
.2
.1
Western Europe Central and Eastern Europe Commonwealth of
Independent States

World Happiness Report 2024
43
How unequal is happiness
at different ages?
From the outset of our WHR research, we have
emphasised the importance of the distribution of
happiness. Research has shown that inequality of
well-being has a bigger effect on overall happiness
than does inequality of income.41 This is, we think,
because it is a broader and more encompassing
measure. Inequality in the distribution of happiness
reects inequalities of access to any of the direct
and indirect supports for well-being, including
income, education, health care, social acceptance,
trust, and the presence of supportive social
environments at the family, community and
national levels. People are happier living in countries
where the equality of happiness is greater. The
use of a 0 to 10 scale for life evaluations permits
us to measure inequality as the standard deviation
of each country’s distribution - the bigger the
average gap between the happier and less happy
people, the higher will be our inequality measure.42
This is the rst report to consider equality of
happiness by age group, set in a global environ-
ment of increasing inequality. At the global level,
averaged across all ages and regions, inequality
of happiness has increased by more than 20%
over the past dozen years. This is shown in the
world panel of Figure 2.10.
Figure 2.9: positive affect levels by age 2006-2010 vs 2021-2023
People are happier living in
countries where the equality
of happiness is greater.
Posiative Affect
Age Group
2006 – 2010
2021 – 2023
Middle East
and North Africa
Sub-Saharan Africa
< 30 30–44 45–59 60+ < 30 30–44 45–59 60+
North America and ANZ
.8
.7
.6
.5
.4
< 30 30–44 45–59 60+
Southeast Asia
.8
.7
.6
.5
.4
South Asia East Asia Latin America
and Caribbean
< 30 30–44 45–59 60+
World
.8
.7
.6
.5
.4
Western Europe Central and Eastern Europe Commonwealth of
Independent States

World Happiness Report 2024
44
The red line in each panel of Figure 2.10 shows
the most recent values for happiness inequality in
each group, with the grey line showing inequality
by age group in 2006-2010. Inequality of happiness,
as measured by the standard deviation of life
evaluations within an age group, has increased
in every region, except in Western Europe, where
it has on average remained constant, with an
increase in inequality among the old being offset
by a drop for the young. In the North America
plus ANZ group, inequality has increased for the
young but not for the old. Every other region has
seen inequality increases for the old that have
been greater than those for the young, sometimes
by very large amounts, as in Latin America, South-
east Asia, and the Commonwealth of Independent
States. Happiness inequality in Sub-Saharan
Africa has increased by more than 50% for all
age groups, and only slightly less so for those of
middle age than for the old and the young.
In light of the diverse regional trends for inequality
at different ages, the overall inequality rankings
by age are not the same as they were a dozen
years ago. Inequality among those over 60 is now
greatest in Latin America, followed closely by
Sub-Saharan Africa, then, signicantly lower, by
Southeast and South Asia, followed then by the
Middle East and North Africa, the CIS countries,
and East Asia. Both halves of Europe, and the
United States, Canada, Australia, and New Zealand
group currently have the lowest levels of inequality,
without signicant age-group differences.
For those under 30, inequality of happiness is by
far the greatest in Sub-Saharan Africa, followed
by Southeast Asia, South Asia, and MENA.
Although happiness inequality among the young
has grown, it is still lowest in Western Europe,
as it was in our base period of 2006-2010.
Figure 2.10: Inequality of Happiness by age group, time and region
Standard Deviation of Ladder
Age Group
2006 – 2010
2021 – 2023
Middle East
and North Africa
Sub-Saharan Africa
< 30 30–44 45–59 60+ < 30 30–44 45–59 60+
North America and ANZ
3.0
2.5
2.0
1.5
< 30 30–44 45–59 60+
Southeast Asia
3.0
2.5
2.0
1.5
South Asia East Asia Latin America
and Caribbean
< 30 30–44 45–59 60+
World
3.0
2.5
2.0
1.5
Western Europe Central and Eastern Europe Commonwealth of
Independent States

World Happiness Report 2024
45
Are there generational differences
in benevolence?
We updated last year the startling nding in
World Happiness Report 2022 that all three
benevolent actions surveyed in the Gallup World
Poll - donations, volunteering and especially the
helping of strangers - showed remarkably large
increases over their pre-pandemic values. Now
we can expand on those results in two important
ways, rst by adding a fourth year of COVID
experience and second by seeing the extent
to which benevolence levels and post-COVID
frequencies differ by generation.
There has been much discussion about possible
shifts of values, including benevolence, from one
generation to the next since the middle of the
last century. In particular, in the US context the
Millennials have been alternatively called the ‘me
generation’, the ‘we generation’ or just another
generation.43 With almost twenty years of data
from the Gallup World Poll, it is becoming feasible
to decouple the age of respondents from their
year of birth, with the latter dening which
generation they represent. These data permit us
to make a more global assessment of generational
shifts in benevolent actions. In addition, the
COVID pandemic provided a natural experiment
to capture generational differences in benevo-
lence. It has been argued that greater levels of
social trust among older than among younger
Americans was likely to represent mainly a
generational effect rather than a consequence
of the ageing process.44 There have also been
studies, based on smaller samples of data, of
whether benevolent values have shifted from one
generation to the next, and whether they have
changed over time within a given cohort.45 All
three of our benevolence measures can be
interpreted as proxy measures of the quality
of community-level social capital. How these
behaviours were altered by COVID for people in
different generations provides a nice test of
generational differences. If there has been a
generational shift, with those born more recently
being less inclined towards benevolent acts,
then we would expect to nd that the surge in
benevolence we have found would be larger
among those in earlier generations. If the increases
in benevolence have been equally or more present
in recent generations, then that is an encouraging
nding. Either there has not been a signicant
generational shift towards less societal connection,
or possibly it has been offset by more recent
positive generational shifts or masked by the
inability of sheltered-in-place older adults to
perform the benevolent acts they would otherwise
have liked to do.
To sort out these possibilities, it is useful to
compare the pre-pandemic and COVID-era
frequencies of benevolent acts by birth cohort. To
do this, we divide respondents into three cohorts:
those born before 1965 (Boomers and their
predecessors), those born between 1965 and
1980 inclusive (Gen X), and those born after 1980
(Millennials and Gen Z).
Figure 2.11 shows the percentage of the population
performing the three benevolent acts by each of
these birth-year cohorts, with grey bars showing
the 2017-2019 values and the red bars the
frequencies in and after 2020.46
For all cohorts, both before COVID and now, the
helping of strangers is most frequent, followed by
donations and then volunteering. The pre-COVID
generational patterns differ for the three acts. The
helping of strangers was most common among the
younger cohorts, and lowest for those born before
1965, perhaps reecting in part their lesser ability
to be out and about. Charitable donations were
less frequent in the younger generations than for
the other age groups, perhaps reecting their
lower disposable incomes. Volunteering was fairly
equal in the three generations. These data do not
show levels that would suggest a generational shift
to less social engagement, although there remains
the problem of separating age and cohort effects.
For that purpose, the COVID experience provides
a very useful natural experiment.
The post-COVID increases are large in both size
and statistical signicance for all three birth
cohorts and all three benevolent acts. For all
three acts, the increases in benevolence, whether
measured as shares of the population, or
percentage increases from pre-pandemic levels,
are greatest for Millennials and Gen Z, suggesting
that Millennials are even more likely than their

World Happiness Report 2024
46
predecessors47 to increase their benevolent acts
when a new need like COVID arises. In any event,
the difference between generations in their
responses is dwarfed by the general size of the
increases in all generations. These benevolence
results, if we compare 2017-2019 to 2020-2023,
apply in every global region.48 This increased
benevolence provides an important part of our
explanation for the relative stability of life evalua-
tions during COVID. The chance to help those in
need, and to see others doing the same, serves to
give purpose and increase trust in the benevolence
of others, all of which is associated with higher
ratings of life as a whole.49
Social support, loneliness and
social interactions by generation
There is widespread concern, especially in the
United States, about an emerging epidemic of
loneliness, and about the consequences of
loneliness for mental and physical health.50 In
World Happiness Report 2023 we showcased the
Gallup/Meta social connections and loneliness
data from seven large countries51 representing six
global regions. We found that in all of the seven
countries, feelings of social support were generally
twice or more prevalent than feelings of loneliness.
In subsequent use of the seven-country data, we
have found that what respondents thought about
the trustworthiness and kindness of others were
Figure 2.11: Frequency of benevolent acts by generation, before and since COVID
70%
60%
50%
40%
30%
20%
10%
0%
Pre-Pandemic Post-Pandemic
Helped a Stranger Donation Volunteering
Millennials + Gen X Boomers +Millennials + Gen X Boomers +Millennials + Gen X Boomers +

World Happiness Report 2024
47
very strong supports for overall satisfaction with
social relations.52 This year we are able to provide
full global coverage, since some of the social
connections variables were included in the 2022
Gallup World Poll, and can be analysed using data
for 140 countries.53 We developed separate
measures for each of our three generations, thus
bringing the Gallup/Meta data directly to bear on
how these important relations vary by generation.
Also valuable are data on the reported frequency
of six types of social interactions. These permit us
to compare the extent of social interaction with
reported feelings of loneliness and social support,
and see how they are correlated with our key
overall life evaluation, the Cantril ladder.
Figure 2.12: Social Support, Loneliness, and Social Interactions by Generation
Figure 2.12 shows regional averages of individual
responses for each of the three generations.
The rst column shows how socially supported
respondents feel using four response possibilities,
with ‘not-at-all’ coded as 0 and ‘very’ as 1.0.54
The second column reports on feelings of
loneliness, using the same scale. Strong social
support is generally two times as prevalent
as loneliness. The third column turns to the
reported average frequency of six types of social
interactions, including those with family and
friends, at work, school, community groups,
neighbours and strangers.
World
Western Europe
Central and
Eastern Europe
Commonwealth of
Independent States
Southeast Asia
South Asia
East Asia
Latin America
and Caribbean
North America
and ANZ
Middle East and
North Africa
Sub-Saharan Africa
Social Support Loneliness Social Interactions
Millennials + Gen X Boomers +
0 .1 .2 .3 .4 .5 .6 .7 .8 .9 1.0 0 .1 .2 .3 .4 .5 .6 .7 .8 .9 1.0 0 .1 .2 .3 .4 .5 .6 .7 .8 .9 1.0
World Happiness Report 2024
48
Globally, perceived social support is highest
in East Asia, Western Europe and the NANZ
countries, and lowest in South Asia, especially in
the intermediate age groups. The age gradient
favours the old in Western Europe and the
NANZ countries, and the young in Central and
Eastern Europe, mirroring what was found earlier
for life evaluations.
Loneliness, when measured on the same scale as
social support, is in all regions generally half as
prevalent as social support. It displays somewhat
matching patterns, being low where social
support is high, and vice versa. Only in Southeast
Asia, Western Europe and the NANZ countries is
loneliness signicantly higher for the Millennials
than for the Boomers, a pattern that is reversed
in Central and Eastern Europe.
An earlier study found age to be the most important
factor in explaining loneliness differences among
survey respondents in the United States.55 They
found a peak in loneliness at age 20, with a
steady age-related decline thereafter. This same
phenomenon is evident in the Gallup/Meta data
for the group of four countries including the
United States. Although overall levels of loneli-
ness are not unduly high in global terms56, there is
a signicantly different pattern across the genera-
tions. Loneliness is almost twice as high among
the Millennials than among those born before
1965.57 Millennials also feel less socially supported
than Boomers in those countries, another place in
which these countries look different from the rest
of the world. This is despite the fact that actual
social connections are much more frequent for
Millennials than Boomers, and about as frequent
as for Generation X.
Do the high prevalence of loneliness and the
lesser feelings of social support help to explain
the very large ranking disparities between the
old and young for the NANZ countries shown in
Figures 2.2 and 2.3, and in Table 2.2? To some
extent yes, but they can only be part of the story.
If we add the three variables of Figure 2.12 to our
preferred58 individual-level equation, all three
variables add very signicantly to explaining life
evaluations in 2022, the year in which the social
connections data were collected. Feelings of
social support are the most important, followed
by loneliness and social interactions.59 If those
under 30 in the NANZ region had the same
feelings of loneliness and social support as those
over 60, their average life evaluations would be
predicted to be higher by slightly more than
one-tenth of a point on the 0 to 10 scale, about
one-seventh of the happiness gap between those
under 30 and those 60 and older in that region.
Another interesting feature of the Gallup/Meta
results, applicable in all global regions, is that the
oldest members of the population, those in the
boomer and earlier generations, feel more socially
supported and less lonely than those in the
younger generations despite having less frequent
actual interactions with all groups except neigh-
bours. This ability to gain more perceived support
with fewer interactions likely helps to explain why
life satisfaction so often rises after middle age
even as the frequency and seriousness of health
problems increases. We turn now to consider
these issues in more detail.
What are the happiest and least happy
stages of life in different countries?
Our international rankings and trends of life
across life stages show big differences. How does
our evidence relate to the many studies of the
U-shape in life evaluations frequently found in
Western Europe and North America? The Gallup
World Poll provides the largest set of countries
ever available to study the generality of the
U-shape in age. As suggested by the name, the
U-shape describes a situation where there is a
mid-life low in life satisfaction, with most ndings
placing the low point at about 50 years of age.60
The rst major age-related study with Gallup
World Poll data61 used evidence from 2006-2010.
The study found a U-shape in the high-income
In the four-country group including
North America loneliness is
almost twice as high among the
Millennials as among those born
before 1965.

World Happiness Report 2024
49
English speaking countries, accompanied by a at
prole in Africa and life evaluations falling with
age in Eastern Europe, the Commonwealth of
Independent States (CIS) and Latin America. In
this chapter we start with evidence from the
same early years of Gallup World Poll data used
in the earlier analysis, and then repeat the analysis
using the three most recent years, allowing us to
see the extent that age patterns for life evaluations
have changed in the past fteen years.
Most studies of life evaluations based on large
samples of survey data include both age and
age-squared among their variables, with the
almost universal nding being a negative
coefcient on age and a positive one on age-
squared. The relative sizes of these two
coefcients can be used to calculate the low
point in the estimated relationship, usually found
to be about 50 years of age.62 These age effects
are sometimes estimated with other variables
in the equation, and sometimes not, with the
differences in the estimated age of minimum
happiness depending on what other variables
are included, but generally found to be similar
to those based on the age terms alone. For this
chapter, we rst look at the effects of age alone,
without including other variables, and without
forcing any particular functional form for the
relationship, echoing what was done in World
Happiness Report 2015, where we examined the
global distribution of life evaluations and emotions
by country, region, age and gender.63 We then
turn later to conrming the generality of this sort
of curvature after allowing for our full set of
variables linked to life evaluation differences
among individuals and among countries. We nd
as well that signicant U-shape patterns persist
even after allowing for generational differences.
In this chapter we are rst interested in knowing
the happiest and least happy age groups in each
country. For this purpose it is helpful to have the
in-between group split into low-middle (30-44)
Photo Brian Wangenheim on Unsplash

World Happiness Report 2024
50
and high-middle (44-59) groups, because the
high-middle group includes the most commonly
estimated low points for happiness.64 We consider
a country to exhibit a U-shape in age if average
life evaluations in either of the two middle-age
groups are below those for both the young and
the old. Table 2.3 shows the number of countries
in each global region according to which age
group was the least happy using data from
2021-2023. Globally the old age group is the least
happy in about half of the countries, the young
the least happy group in seven countries, with the
remaining countries having a mid-life low, most
of them in the 45 to 60 age range. So by this
denition the U-shape is currently found in almost
half of our countries. It is currently evident in
more than half the countries of Asia and Africa,
and less than half in Europe and Latin America. In
Western Europe the unhappiest age groups are
diverse: one-third each for those below 30, 60+,
and those in between. In all of the countries in
Central and Eastern Europe and in two-thirds of
the CIS countries those 60 and older are the least
happy. In the NANZ group the reverse holds true,
with the young and the early middle age groups
being the least happy.
How do these results compare with those
revealed by the Gallup World Poll data for
2006-2010, as shown in the Statistical Appendix?
There have been remarkable changes over the
past dozen years, especially in Africa, where for
the continent as a whole the old were the least
happy group in 24 of the 34 counties in the
2006-2010 data, compared to just over one-third
now. Latin America shows a similar pattern, with
unhappy-old countries being much less numerous
now than in 2006-2010. There are also fewer
unhappy-old countries in Western Europe now
than earlier, while in Eastern Europe and the CIS
the change has gone in the reverse direction, with
more unhappy-old countries now than previously.
The overall drop since 2006-2010 in the number
of unhappy-old countries has been offset by an
increase in the number of unhappy-young
countries, and in the 30-44 age group. Thus the
U-shape in age is more prevalent now than it was
a dozen years ago, when it was present in just a
third of the countries. We show below that this
change in patterns by age may be linked in part
to generational shifts favouring earlier generations
over the Millennials and their successors.
The most interesting questions for us relate not to
whether a U-shape exists but whether and why
these patterns differ from one country or time
period to another.65 The life satisfaction evidence
is matched by other evidence of a mid-life crisis.66
Many factors inuencing life evaluations differ in
prevalence for people at different ages, and may
Table 2.3: Numbers of Countries/Territories by Least Happy Age Group,
Period 2021 to 2023
Region The Young Lower Middle Upper Middle The Old Total
Western Europe 6 3 4 7 20
Central and Eastern Europe 0 0 0 17 17
Commonwealth of Independent States 0 2 1 7 10
Southeast Asia 0 4 1 4 9
South Asia 0 1 3 2 6
East Asia 0 4 0 2 6
Latin America and Caribbean 0 0 8 11 19
North America and ANZ 1 3 0 0 4
Middle East and North Africa 0 4 6 7 17
Sub-Saharan Africa 0 9 12 14 35
All 730 35 71 143

World Happiness Report 2024
51
matter more at one stage of life than another.
Self-assessed health status provides a striking
example. The relevant individual-level Gallup
World Poll question asks respondents whether
they have health problems,with the possible
answers being yes or no. The national level for
this variable is thus the share of respondents in
that age group who have health problems. This
proportion rises strikingly across our three main
age groups, trebling from under 15% for those
under 30 to more than 45% for those over 60.
There is also a difference among the age groups
in how much having health problems affects life
evaluations. As shown by our individual level
global modelling in the Statistical Appendix, the
damage to life evaluations from having a health
problem rises from 0.3 for those under 30 to
about 0.45 for those in the middle age groups,
and 0.6 for those 60 and over. Thus not only the
prevalence but also the well-being consequences
of health problems are greater for those over 60.
Putting these two differences together suggests
that the impact of health problems on average life
evaluations rises from 0.045 for those under 30
to 0.3 for those 60 and over, a sixfold increase.67
Given the general downward inuence of health
problems on the life evaluations of the old, what
helps to explain their greater happiness? One
reason may simply be a lessening of the often
taxing need to balance the competing demands
of work and family pressures. This hypothesis is
supported by the slightly rising prevalence of
freedom to make key life decisions, from 75% of
respondents in the middle groups to 80% for
those over 60. Such freedom is apparently valued
even more highly by the old than by those in
middle age, with a combined effect raising life
satisfaction for those over 60 by about the
same as it is pushed down from middle to old
age by the increasing frequency and severity of
health problems.
Is there also perhaps something more fundamental
in the ageing process that might help to explain
the extent to which life evaluations can rise after
middle age even if circumstances do not improve?
That life evaluations can rise after middle age
without any matching improvement in life circum-
stances is suggested by many studies that nd a
U-shape in age even when several important life
circumstances are taken into account.68 One
possible explanation is provided by experiments
showing an age-related increase in the relevance
of positive over negative information in both
perception and memory.69 This increase in
positivity occurs against a backdrop of a prevailing
negative bias in the way people view and react to
new information.70 There is a growing strand of
experimental research suggesting that, as people
age, they generally attach more importance to
remembering the positive aspects of their lives,
and less to remembering the negative aspects.71
This could help to explain why life evaluations rise
with age, especially in countries where this
transfer of attention is more likely. These are likely
to be where a larger fraction of the population
has the basic necessities of life, as suggested
by evidence that the increase in positivity is
greater where there are fewer externally imposed
constraints.72
Does the age-related increase in trust and
positivity, accompanied by possible technological
obsolescence, and age-related increases in
dementia, mean that online scammers will more
successfully target the elderly, and make them
the major victims? Early studies of the effects
of scamming concentrated on older victims,
assuming them to be especially vulnerable.73
Ten years ago there was a recognized lack of
evidence comparing the scamming susceptibility
of the young and the old.74 That research gap is
being lled, with results showing that although
lesser mental capacities and technological smarts
do increase susceptibility to scams, ageing can
produce a trust that is greater but also wisely
directed,75 so that the older targets are more
likely to be suspicious and less likely to fall for
the scam than are the young.76
There is also some evidence that changes in life
evaluations as people age depend on their social
environment. To feel a sense of belonging meets
an essential human need.77 Evidence shows a
sense of community belonging to have a larger
inuence on life satisfaction and to be more
prevalent at higher ages,78 providing yet another
explanation for life evaluations that rise at
higher ages.
World Happiness Report 2024
52
Marriage and the family are important elements
of the social context whose importance to happi-
ness may vary by age. For example, it has been
found that in some countries that normally exhibit
a U-shape the protective effects of marriage and
living together are greatest for those in the
middle age group, so that the U-shape is atter,
and mid-life relatively happier for the married, a
nding we have been able to conrm with our
global data.79
An age-related positivity effect also helps to explain
our nding in previous World Happiness Reports
that life evaluations among the old were maintained
or even improved despite COVID morbidity and
mortality being much higher for that age group.80
Although age-related positivity research has
mainly focused on positive and negative emotions,
it clearly has implications for overall life evaluations,
as illustrated by results reported above and
elsewhere. As people age, the prevailing negativity
bias of younger ages is on average across the
world increasingly offset as age leads people to
focus more on positive news and memories, to
accumulate enriching life experiences,81 to think
better of others, and to rate their lives more highly.
We can now exploit the growing number of years
of Gallup World Poll data to attempt to separate
the effects of age from those of being in a
particular generation. For example, the changes in
age patterns that we have found when comparing
2006-2010 with 2021-2023 may reect genera-
tional shifts as well as age. To assess those
possibilities, we have used our individual-level
data to estimate happiness equations (as shown
in Table 12 in the Statistical Appendix) showing
a U-shape in age appearing in concert with
generational shifts in average happiness, with the
Boomers and earlier generations being happier
than Gen Xers, who are in turn happier than
Millennials and their 21st century successors.82
These differences vary by region, of course, while
across the globe the Millennials as a group, after
taking into account their other life circumstances,
have life evaluations that are about one-quarter
of a point lower than the Boomers, with Gen X in
between, but closer to the Millennials.83 The U-shape
in age continues to operate, both between and
within generations. Within the boomer group, life
evaluations rise with each extra year of age, while
falling by a bigger annual amount for the Millennials.84
Summary
Overall ranking of happiness
The biggest change this year is within the top 20.
There are two new entrants, Costa Rica and
Kuwait at 12 and 13. Coupled with the continuing
convergence between the two halves of Europe,
with Czechia, Lithuania and Slovenia at positions
18, 19 and 21, have contributed to the fall of the
United States and Germany from 15 and 16 last
year to 23 and 24 this year.
The top 10 have remained fairly stable, with
Finland still in rst position, although now followed
more closely by Denmark. All of the top 10
countries, except for Australia and the Netherlands,
have populations less than 15 million, while in the
top twenty, only Canada and the United Kingdom
have populations over 30 million.
Rankings by age group
Rankings differ a lot for the young and the old. In
some cases these favour the old, as in the United
States and Canada, where the rankings for those
aged 60 and older are 50 or more places higher
than for those under 30. In other cases, especially
in Central and Eastern Europe, the reverse is true,
with many rankings being more than 40 places
higher for the young than for the old.
Changes in happiness overall and by age group
From 2006-2010 to 2021-2023 changes in overall
happiness varied greatly from country to country,
ranging from increases as large as 1.8 points
(Serbia) to decreases as large as 2.6 points
(Afghanistan).
Boomers and earlier
generations are happier
than Gen Xers, who are in
turn happier than their
21st Century successors.

World Happiness Report 2024
53
Central and Eastern Europe had the largest
increases, of the same size for all age groups.
Gains were half as large in the CIS countries. East
Asia also had large increases, especially for the
older population. By contrast, life evaluations fell
in South Asia in all age groups, especially in the
middle age groups.
Happiness also fell signicantly in the NANZ
group, by twice as much for the young as for the
old. There were also signicant declines in the
Middle East and North Africa, with larger declines
for those in the middle age groups than for the
old and the young.
The convergence of happiness levels in Central
and Eastern Europe toward those in Western
Europe has continued. For those under 30, this
convergence is essentially complete, as their
happiness levels are now equal in both halves of
Europe. For those ever 60, the gap between the
two halves of Europe is about half of what it was
in 2006-2010. But it is still very large, more than
a full point in 2021-2023.
Emotions at different ages
In 2021-2023 negative emotions were in every
region more prevalent for females than males,
with almost everywhere the gender gap being
larger at higher ages. The exception to this global
pattern is provided by the small group of countries
that includes the United States, Canada, Australia
and New Zealand, where females under 30 have
one-third more negative emotions than males, a
gap that is smaller at higher ages. There is no
corresponding gap in life evaluations, as the
gender gap is small at all ages, and tends to
favour females.
Negative emotions are more frequent now than in
2006-2010 everywhere except East Asia and both
parts of Europe. In Central and Eastern Europe, in
contrast to the rest of the world, but consistently
with the happiness convergence taking place
within Europe, negative emotions are now less
frequent in all age groups than they were in
2006-2010.
Positive emotions have not changed much, while
still remaining more frequent for the young than
for older age groups.
Inequality by age
Global happiness inequality has increased by
more than 20% over the past dozen years, in all
regions and age groups, to an extent that differs
a lot by age and by region. It has increased most
for the old in Latin America, Southeast Asia and
the CIS, and at all ages in SubSaharan Africa,
South Asia, and the Middle East and North Africa.
Benevolence by generation
The COVID crisis provided a natural experiment to
compare the benevolence of different generations.
The Post-COVID increases in benevolence, whether
measured as shares of the population, or percentage
increases from pre-pandemic levels, are large for all
generations, but especially so for the Millennials
and Generation Z, who are even more likely than
their predecessors to help others in need.
Social support, loneliness and
social interactions by generation
In almost every global region, as conrmed by the
new Gallup/Meta global social connections data,
comparably measured feelings of social support
are more than twice as prevalent as loneliness.
Both social support and loneliness affect happiness,
with social support usually having the larger
effect. Social interactions add to happiness, with
their effects owing through increases in social
support and reductions in loneliness.
The U-shape in age
The U-shape in age, with a mid-life low, is
widespread, accompanied by a generational
effect favouring earlier generations. Among those
born before 1965, life evaluations rise with age, as
also shown in Chapter 5. Among those born after
1980, happiness falls with each year of age, as
also shown in Chapter 3.
As between generations, after taking into account
age and life circumstances other than generation,
those born before 1965 (Boomers and their
predecessors) have life evaluations about
one-quarter of a point higher than those born
after 1980 (Millennials and gen Z).85
World Happiness Report 2024
54
Endnotes
1 See Fortin et al. (2015).
2 Our groups follow the approximate demarcation lines
between Boomers and their predecessors, Generation X,
the Millennials (often called Gen Y) and Gen Z (those born
1995 or later. Our global data show that these Western-
centric denitions do not apply to many of the key
generational shifts we nd, such as those before and after
the collapse of the USSR, civil wars and genocides, and rst
and subsequent generations of migrants from one country
to another. Generational differences have been highlighted
in the workplace (Parry & Unwin 2011, Campbell et al. 2015),
in voting behaviour (Van den Brug & Kritzinger 2012) and
values more generally (Twenge et al. 2012).
3 The base period also includes data collected from 27
countries in 2005, as the rst round of the Gallup World
Poll was divided between 2005 and 2006. Only one
country, France, had surveys in both 2005 and 2006. Thus
our base period includes all data collected before 2011.
4 A country’s average answer to the Cantril ladder question
is exactly equivalent to a notion of average underlying
satisfaction with life under an assumption of “cardinality:”
the idea that the difference between a 4 and a 3 should
count the same as the difference between a 3 and a 2, and
be comparable across individuals. Some social scientists
argue that too little is known about how people choose
their answer to the Cantril ladder question to make this
assumption and that if it is wrong enough, then rankings
based on average survey responses could differ from
rankings based on underlying satisfaction with life (Bond &
Lang, 2019). Other researchers have concluded that answers
to the Cantril ladder question are indeed approximately
cardinal (Bloem & Oswald, 2022; Ferrer-i-Carbonell &
Frijters, 2004; Kaiser & Oswald, 2022; Krueger & Schkade,
2008).
5 For any pair of countries, the condence intervals for the
means (depicted in Figure 2.1 as whiskers) can be used to
gauge which country’s mean is higher than the other,
accounting for statistical uncertainty in the measurement
of each. The condence interval for a country’s rank (given
in Figure 2.1 as text) represents a range of possible values
for the ranking of their mean among all countries, accounting
for uncertainty in the measurement of all of the means
(following Mogstad et al., 2024). The ranges are constructed
so that the chance that the range does not contain the
country’s true rank is no more than 5%.
6 Not every country has a survey every year. The total
sample sizes are reported in Statistical Appendix 1, and are
reected in Figure 2.1 by the size of the 95% condence
intervals for the mean, indicated by horizontal lines. The
condence intervals are naturally tighter for countries with
larger samples.
7 Countries marked with an * do not have survey information
in 2023. Their averages are based on the 2021 and/or 2022
surveys.
8 The actual average values for each survey year may be
found in the online data le supporting the equations in
Table 2.1. For Israel, the average ladder for 2021-2022 was
7.61, compared to 6.78 in 2023. The latter average, if
compared to the three-year averages used for other
countries, would put Israel 19th in the rankings.
9 For detailed analysis of the life satisfaction of immigrants
to the United Kingdom and Canada from many source
countries of, see Helliwell et al. (2020).
10 Costa Rica is actually a re-entrant, having also been in 12th
position in WHR 2013. Kuwait was out of the rankings last
year for lack of surveys during the three-year period, so its
ranking in WHR 2024 is based only on the 2023 survey.
11 The statistical appendix contains alternative forms without
year effects (Appendix Table 9), and a repeat version of
the Table 2.1 equation showing the estimated year effects
(Appendix Table 8). These results continue to conrm that
inclusion of year effects makes no signicant difference to
any of the coefcients. In these aggregate equations,
adding regional or country xed effects would lower the
coefcients on relatively slow moving variables where most
of the variance is across countries rather than over time,
such as healthy life expectancy and the log of GDP. With
equations based on individual observations, where income
and health are measured by individual-level variables,
adding country xed effects makes little difference to any
of the coefcients.
12 The denitions of the variables are shown in Technical Box
2, with additional detail in the online Statistical Appendix.
13 The model’s predictive power is little changed if the year
xed effects in the model are removed, with adjusted
R-squared falling only from 0.757 to 0.753.
14 The data and rankings for the 2021-2023 averages for the
six variables are to be found in Figures 68-91 of the
Statistical Appendix. The underlying annual data used in
estimating the equations shown in Table 2.1 can be found
in an online le accompanying the chapter.
15 For example, unemployment responses at the individual
level are available in most waves of the Gallup World Poll.
While they show an effect size similar to that found in other
research, the coefcient has never been signicant in the
country-level equation, and their inclusion does not
inuence the size of the other coefcients.
16 Below, we use the term “effect” when describing the
coefcients in these regressions; some caveats to this
interpretation are discussed later in this section.
17 In the equation for negative affect, healthy life expectancy
takes a signicant positive coefcient, despite its positive
simple correlation with life evaluations in this aggregate
dataset. This may be due to the fact that in the global
sample there is a positive correlation between age and the
frequency of reports of negative emotions. Countries with
higher healthy life expectancies have respondents who are
on average older, since the sample data are weighted to
replicate the actual age shares of the population.
18 This inuence may be direct, as many have found, e.g.
De Neve et al. (2013). It may also embody the idea, as
made explicit in Fredrickson’s broaden-and-build theory
(Fredrickson, 2001), that good moods help to induce the
sorts of positive connections that eventually provide the
basis for better life evaluations.
19 See, for example, the well-known study of the longevity of
nuns, Danner et al. (2001).

World Happiness Report 2024
55
20 See Cohen et al. (2003), and Doyle et al. (2006).
21 The meta analysis by Chida & Steptoe (2008) shows
signicant linkages from positive affect to health,
independent of the effects of negative affect. For a recent
survey of the links running from positive emotions and life
evaluations to subsequent morbidity and mortality, see
Pressman et al. (2019).
22 The prevalence of these feedbacks was documented in
Chapter 4 of World Happiness Report 2013, De Neve et al.
(2013).
23 We expected the coefcients on these variables (but not
on the variables based on non-survey sources) to be
reduced to the extent that idiosyncratic differences among
respondents tend to produce a positive correlation
between the four survey-based factors and the life
evaluations given by the same respondents. This line of
possible inuence is cut when the life evaluations are
coming from an entirely different set of respondents than
are the four social variables. The fact that the coefcients
are reduced only very slightly suggests that the common-
source link is real but very limited in its impact.
24 The coefcients on GDP per capita and healthy life
expectancy were affected even less, and in the opposite
direction in the case of the income measure, being
increased rather than reduced, once again just as expected.
The changes were very small because the data come from
other sources, and are unaffected by our experiment.
However, the income coefcient does increase slightly,
since income is positively correlated with the other four
variables being tested, so that income is now able to pick
up a fraction of the drop in inuence from the other four
variables. We also performed an alternative robustness
test, using the previous year’s values for the four survey-
based variables. Because each year’s respondents are from
a different random sampling of the national populations,
using the previous year’s average data also avoids using
the same respondent’s answers on both sides of the
equation. This alternative test produced similarly reassuring
results as shown in Table 13 of Statistical Appendix 1 in
World Happiness Report 2018. The Table 13 results are very
similar to the split-sample results shown in Tables 11 and 12,
and all three tables give effect sizes very similar to those in
Table 2.1 in the main text. Because the samples change only
slightly from year to year, there was no need to repeat
these tests with this year’s sample.
25 Actual and predicted national and regional average
2021-2023 life evaluations are plotted in Figure 92 of the
Statistical Appendix. The 45-degree line in each part of the
Figure shows a situation where the actual and predicted
values are equal. A predominance of country dots below
the 45-degree line shows a region where actual values are
below those predicted by the model, and vice versa.
Southeast and South Asia provide the largest current
example of the former case, and Latin America of the latter.
26 See Rojas (2018).
27 If special variables for Latin America and Southeast Asia
are added to the equation in column 1 of Table 2.1, the
Latin American coefcient is +0.49 (t=5.2) while that for
Southeast Asia is -0.31 (t=2.3). Special variables for East
Asia and South Asia are not signicant.
28 See Chen et al. (1995) for differences in response style, and
Chapter 6 of World Happiness Report 2022 for data on
regional differences in variables thought to be of special
importance in Asian cultures.
29 One slight exception is that the negative effect of corruption
is estimated to be slightly larger (0.87 rather than 0.73),
although not signicantly so, if we include a separate
regional variable for Latin America. This is because
perceived corruption is worse than average in Latin
America, and its happiness effects there are offset by
stronger close-knit social networks, as described in Rojas
(2018). The inclusion of a special Latin American variable
thereby permits the corruption coefcient to take a
higher value.
30 More precisely, the test vehicle is the equation in column 1
with no year xed effects, given our wish to compare the
four COVID years to the preceding years. Aknin et al.
(2022), in a study for the Lancet task force, used the high
frequency COVID policy stringency data of Hale el al.
(2021) and longitudinal survey data of well-being in
15 countries to show that COVID deaths and policy
stringency both to have negative partial linkages to mental
health, with the stringency effect being small and offset in
many countries by the corresponding lower death rates.
See also Bu et al. (2020).
31 The corresponding rankings for the two intermediate age
groups are in the Statistical Appendix.
32 Although Rwanda is not in the current rankings, its data
from earlier years also conrms that past internecine
violence leaves bigger scars on the lives of those who lived
through them. In Rwanda, the average life evaluation of
those 60 and over is lower than that of those under 30 by
nearly two-thirds of a point.This is in contrast to natural
disasters, which have been shown, where initial levels of
social trust are sufciently high, to lead to subsequent
increases as people reach out to help others in need. See,
for examples, Toya & Skidmore (2014), Yamamura et al.
(2015), Kang & Skidmore (2018), Dussaillant & Guzman
(2014) and Aldrich (2011). And for COVID-19, see Bartscher
et al. (2021), Bu et al. (2020), and the COVID death rate
modelling in Helliwell et al. (2021).
33 It has been argued that response styles of respondents (the
extent to which they tend to give middling or end-point
answers, for example) varies by age, and hence might
inuence conclusions about relative happiness at different
ages (Stone et al. 2019). However, their evidence suggests
the potential effects on life evaluations are not signicant.
See also Benjamin et al. (2023). Barrington-Leigh (2024)
argues that differing use of focal points may be leading to
underestimating the effects of education and income, while
Nilsson et al. (2024) argue that the ladder framing of the
Gallup life evaluation question may induce higher estimates
of the effects of income and power.
34 What is plotted here is the average across countries of
each country’s average happiness in the age group in
question. If we were instead to use the number of people in
our global sample in each age group, we would show
average happiness being greatest for those over 60, since
those countries with greater longevity (and hence more
people over 60) also have higher average happiness, for
that and other related reasons.
World Happiness Report 2024
56
35 Montgomery (2022) studies gender differences in the
ranking of life vignettes in the Gallup World Poll, nding a
difference of about the same size as the average global
ladder advantage for females, and hence a sufcient
explanation for the global average gap. This is less likely to
affect the analysis of differences among regions or over
time. There is no matching vignette analysis available for
the Gallup data on emotions.
36 We have calculated and compared these ‘one-county-one-
vote’ data with population-weighted averages in several
earlier reports. The latter tend in some regions to reect
almost entirely the experience of the largest country in the
region, and to depend on circumstances and measurement
issues best studied on a national level rather than as part of
a regional average.
37 The drop is about .04 per year of age in the context of our
full model specication,including country and year xed
effects. The drop is only slightly less without any control
variables and is slightly greater for males than females.
38 This evidence of life evaluations being higher at higher
ages, even among those over 60 years of age, is not found
in the earlier years of Gallup World Poll data for India, but
is clearly evident in the surveys since 2016, the time period
within which the Indian survey was elded. In Chapter 5 of
this volume, the average increase in SWL (on a 0 to 10
scale) is 0.012 per year. In a similar equation for all the
global data from the Gallup World Poll, the increase is
0.008 per year. For the South Asian countries as a group
the average annual increase is .023. As for other regions,
the average annual increase is .025 in Latin America and in
the NANZ group, .023 in SE Asia, .013 in East Asia, and
approximately zero in Africa and all parts of Europe and
the CIS.
39 These equations are run with country xed effects and the
control variables used in the micro equations reported in
the statistical appendix.
40 The pattern of declining frequency of positive emotions is
roughly the same for laughter, enjoyment and doing
something interesting yesterday. It also applies if the
sample is split by generation rather than age, reecting the
relatively high correlation between age and generation, due
to the still limited number of years in our synthetic panel.
41 See Goff et al. (2018).
42 We cannot measure inequality for the positive and
negative emotions because they are only available in
the Gallup World Poll as binary yes/no answers about
experiences yesterday.
43 Twenge et al. (2012) summarise key papers presenting
each of these alternative positions. Their own analysis
modestly favours the ‘me generation’ view, except in the
case of volunteering, where the evidence is more mixed.
44 See especially Putnam (2000), where it was estimated the
generational change “might account for perhaps half of
the overall decline” (p.283) in civic engagement and social
capital in the last third of the 20th century. See also
Putnam (2020).
45 Leijen et al. (2022) found benevolent values in 2020 to be
similar in all generations in their longitudinal study of Dutch
data. Their Millennials started with a lower benevolence
value in 2008, but this gradually rises to reach the average
of the other generations by 2020.
46 The sample makes use of the data from the 136 countries
with surveys in at least ve of the seven years spanning
2017-2023. The results are qualitatively similar if the
analysis is done using only the 81 countries (as of mid-
February 2024) with surveys reported for all seven years.
This more restricted sample leaves out countries where
surveys were not possible in 2020, the rst year of the
pandemic.
47 For donations, the COVID-induced increases are similar in
magnitude for all generations.
48 If we compare the 2021-2023 data to the average of all
previous Gallup years, then there are no increases in
benevolence in the NANZ and Western European countries.
That is because these countries, which have always had
globally high levels of benevolent acts, but have seen
signicant drops over the past dozen years. Thus for them
the COVID-induced growth in benevolence represented the
reversal of a downward trend rather than an increase over
the levels in 2006-2010.
49 See Dolan et al. (2021) for COVID-related evidence, and
more generally, Aknin et al. (2011), Helliwell et al. (2018),
and Helliwell & Wang (2011).
50 Murthy (2023), Holt-Lunstad et al. (2015), Kannan & Veazie
(2023), Leigh-Hunt et al. (2017), Steptoe et al. (2013).
51 Gallup/Meta (2022)
52 Folk et al. (2024).
53 See Gallup/Meta (2023)
54 The intermediate answers ‘a little’ and ‘a lot’ are coded as
0.33 and 0.67 respectively, reecting a linear conversion of
the original 4-point response scale.This replicates the Likert
scale are adopted in the Mate/Gallup (2022) study,
transformed from the 1 to 4 scale to a 0 to 1 scale.
55 See Shovestul et al. (2020).
56 In 2022 it averaged 27% across all countries, and 21% for
the four-country group including the US, Canada, Australia
and New Zealand.
57 With only a single year of data it is not possible to
distinguish age and cohort effects. Those under 30 years of
age (who are only have as numerous as the Millennials+Gen
Z) have a frequency of loneliness more than twice that for
those 60 and over (who are very similar in number to the
Boomers, and are hence the same people)
58 In column 1 of Table 12 of the Statistical Appendix.
59 The standardized betas for the three variables are .076,
.053 and .036, respectively. The estimated coefcients are
.623 (t=17.7) for feelings of social support, .456 (t=12.4) for
feelings of loneliness, and .473 (t=8.5) for the reported
frequency of social interactions.
60 See, for example, Blanchower & Oswald (2008) and Stone
et al. (2010).
61 Steptoe et al. (2015).

World Happiness Report 2024
57
62 The equation being estimated is y=a +b*age + c*age
squared, The slope is b+2 c*age, equaling zero where
b-2c*age=0, or at age=b/2c. If b is 100 times as large as c,
then the age of minimum happiness is 50 years. The
equation is often estimated using age and 100*age-squared
in order to show more signicant gures for c. In this case
the low point is equal to 50 years if -c=b., and is less than
50 if -c>b. See Blanchower (2021) for a survey of studies
using this method, most of which produce minima within
the 45-59 age range.
63 Fortin et al. (2015). That chapter uses data from the
beginning of the Gallup World Poll in 2005-2006 through
most of 2014.
64 See the review of recent estimates in Blanchower (2021).
65 In the same vein, see Graham & Ruiz Pozuelo (2017).
66 For a wide-ranging review, see Giuntella et al. (2023).
67 For the young, the effect is 0.15*0.30=0.045, while for the
old it is 0.5*0.6=0.3.
68 E.g. Blanchower (2021). However, see another research
stream (e.g. Gerstorf et al. 2010) that nds in some
countries a sharp drop in subjective well-being as death
becomes imminent.
69 Charles et al. (2003) and Mather & Carstensen (2003). Zak
et al. (2022) nds a corroborating age-related increase in
oxytocin release.
70 Baumeister et al. (2001) provide an inuential review of
many sorts of evidence that people perceive and react to
the bad rather than the good, and prefer to avoid losses
rather than to make gains. The authors argue that there is,
or at least may once have been, an evolutionary advantage
in doing so.
71 See Reed et al. (2014) for a meta analysis of more than
100 experimental studies showing that events are seen in
more positive terms at higher ages.
72 According to the socioemotional selectivity theory
advanced by Carstensen (2006) the positivity effect is
likely to be absent for those who are constrained by
experimental or life constraints.
73 James et al. (2014), Burnes et al. (2017).
74 Reed & Carstensen (2012).
75 Mueller et al. (2020).
76 Walzak (2023).
77 Baumeister & Leary (1995).
78 See Michalski et al. (2020) and Helliwell et al. (2019)
79 See Anusic et al. (2014), Clark et al. (2021), Grover &
Helliwell (2019) and Helliwell et al. (2019). Using our global
model (from Table 12 in the Statistical Appendix) based on
individual data for those under 50 years of age, we
estimated equations for those who are married (or
cohabiting) separately from the rest of the population. The
estimated annual drop in life evaluations is one-third less
for the married/cohabiting group. Thus the global data
conrm the earlier ndings based on data mainly from the
UK and other countries in Western Europe.
80 See Carstensen et al. (2020) for survey evidence showing
robustness of the age-related positivity effect during
COVID in a US sample. The authors argue that this
robustness in the face of a highly salient and powerful
threat tends to favour its generality. Some argue that this
effect may be muted or reversed when death is imminent
(Charles, 2010).
81 Oishi and Westgate (2022) argue that a rich life, which
prioritises curiosity and seeks challenges, has a value quite
beyond happiness and meaning. They argue that such
richness ‘grows over time in response to perspective-
changing life experiences’ (Oishi & Westgate, 2022, p. 17).
As such it is likely to provide an additional reason for life
evaluations to rise at older ages.
82 It requires a substantial number of years of data to attempt
to identify separate effects for age, time and generation, as
in a single year the three are linked by the identity whereby
for each individual age+ year of birth = year. The ability to
partition the effects among age, cohort and time is heavily
dependent on the number of years, the selection of
cohorts, and the functional forms used (Bell & Jones, 2018).
Our identication attempt makes use of an established
quadratic form for the effects of age on life satisfaction and
a fairly well established split of respondents into three
generational groups. It also includes xed effects for each
year. The results conrm the usual positive coefcient on
age and a negative coefcient of age squared while
delivering also highly signicant generational coefcients,
with t-values of about 10 for the intergenerational differences.
Much of the increase in life satisfaction for those in the
older age group is in this equation transferred from the age
squared term to a generational advantage for the Boomers
and, to a lesser extent, Gen X.
83 See column 1 of Table 12.
84 The annual rise for the Boomers is 0.006 (from column 4 of
Table 12) while the annual fall for the Millennials is 0.029
(column 2 of Table 12).
85 See column 1 in Table 12 of the Statistical Appendix. That
equation includes country and year xed effects, gender,
age, age-squared, and individual-level counterparts to the
six variables in the model of Table 2.1. The age effects
within each generation are shown in columns 2 and 4 of
Appendix Table 12.
World Happiness Report 2024
58
References
Aknin, L. B., Dunn, E. W., & Norton, M. I. (2011). Happiness
runs in a circular motion: Evidence for a positive feedback
loop between prosocial spending and happiness. Journal of
Happiness Studies, 13(2), 347–355.
Aknin, L. B., Andretti, B., Goldszmidt, R., Helliwell, J. F.,
Petherick, A., De Neve, J. E., ... & Zaki, J. (2022). Policy
stringency and mental health during the COVID-19 pandemic:
a longitudinal analysis of data from 15 countries. The Lancet
Public Health, 7(5), e417–e426.
Aldrich, D. P. (2011). The externalities of strong social capital:
Post-tsunami recovery in Southeast India. Journal of Civil
Society, 7(1), 81–99.
Anusic, I., Yap, S. C., & Lucas, R. E. (2014). Testing set-point
theory in a Swiss national sample: Reaction and adaptation to
major life events. Social indicators research, 119, 1265-1288.
Bartscher, A. K., Seitz, S., Siegloch, S., Slotwinski, M., &
Wehrhöfer, N. (2021). Social capital and the spread of Covid-19:
Insights from European countries. Journal of Health Economics,
80, 102531.
Barrington-Leigh, C. P. (2024). The econometrics of happiness:
Are we underestimating the returns to education and income?.
Journal of Public Economics, 230, 105052.
Baumeister, R. F., & Leary, M. R. (1995). The need to belong:
Desire for interpersonal attachments as a fundamental human
motivation. Psychological Bulletin, 117(3), 497.
Baumeister, R. F., Bratslavsky, E., Finkenauer, C., & Vohs, K. D.
(2001). Bad is stronger than good. Review of general psychology,
5(4), 323-370.
Bell, A., & Jones, K. (2018). The hierarchical age–period–cohort
model: Why does it nd the results that it nds?. Quality &
quantity, 52, 783-799.
Benjamin, D. J., Cooper, K., Heffetz, O., Kimball, M. S., & Zhou, J.
(2023). Adjusting for Scale-Use Heterogeneity in Self-Reported
Well-Being (No. w31728). National Bureau of Economic
Research.
Blanchower, D. G. (2021). Is happiness U-shaped everywhere?
Age and subjective well-being in 145 countries. Journal of
Population Economics, 34(2), 575-624.
Blanchower, D. G., & Oswald, A. J. (2008). Is well-being
U-shaped over the life cycle?. Social science & Medicine, 66(8),
1733-1749.
Bloem, J. R., & Oswald, A. J. (2022). The analysis of human
feelings: a practical suggestion for a robustness test. Review of
Income and Wealth, 68(3), 689-710.
Bond, T. N., & Lang, K. (2019). The sad truth about happiness
scales. Journal of Political Economy, 127(4), 1629–1640.
Bu, F., Steptoe, A., & Fancourt, D. (2020). Who is lonely in
lockdown? Cross-cohort analyses of predictors of loneliness
before and during the COVID-19 pandemic. Public health, 186,
31-34.
Burnes, D., Henderson Jr, C. R., Sheppard, C., Zhao, R., Pillemer,
K., & Lachs, M. S. (2017). Prevalence of nancial fraud and
scams among older adults in the United States: A systematic
review and meta-analysis. American journal of public health,
107(8), e13-e21.
Campbell, W. K., Campbell, S. M., Siedor, L. E., & Twenge, J. M.
(2015). Generational differences are real and useful. Industrial
and Organizational Psychology, 8(3), 324-331.
Carstensen, L. L. (2006). The inuence of a sense of time on
human development. Science, 312(5782), 1913-1915.
Carstensen, L. L., Shavit, Y. Z., & Barnes, J. T. (2020). Age
advantages in emotional experience persist even under threat
from the COVID-19 pandemic. Psychological science, 31(11),
1374-1385.
Charles, S. T. (2010). Strength and vulnerability integration: a
model of emotional well-being across adulthood. Psychological
bulletin, 136(6), 1068.
Charles, S. T., Mather, M., & Carstensen, L. L. (2003). Aging and
emotional memory: the forgettable nature of negative images
for older adults. Journal of Experimental Psychology: General,
132(2), 310.
Chen, C., Lee, S. Y., & Stevenson, H. W. (1995). Response style
and cross-cultural comparisons of rating scales among East
Asian and North American students. Psychological Science,
6(3), 170–175.
Chida, Y., & Steptoe, A. (2008). Positive psychological
well-being and mortality: a quantitative review of prospective
observational studies. Psychosomatic medicine, 70(7), 741-756.
Cogin, J. (2012). Are generational differences in work values
fact or ction? Multi-country evidence and implications. The
International Journal of Human Resource Management, 23(11),
2268-2294.
Cohen, S., Doyle, W. J., Turner, R. B., Alper, C. M., & Skoner, D.
P. (2003). Emotional style and susceptibility to the common
cold. Psychosomatic Medicine, 65(4), 652-657.
Clark, A. E., d’Albis, H., & Greulich, A. (2021). The age U-shape
in Europe: The protective role of partnership. Vienna Yearbook
of Population Research, 19, 293-318. https://shs.hal.science/
halshs-03467204/document
Danner, D. D., Snowdon, D. A., & Friesen, W. V. (2001). Positive
emotions in early life and longevity: Findings from the nun
study. Journal of Personality and Social Psychology, 80(5),
804–813.
De Neve, J. E., Diener, E., Tay, L., & Xuereb, C. (2013). The
objective benets of subjective well-being. In J. F. Helliwell, R.
Layard, & J. Sachs (Eds.), World Happiness Report 2013
(pp. 54–79). New York: SDSN.
Dolan, P., Krekel, C., Shreedhar, G., Lee, H., Marshall, C., & Smith,
A. (2021). Happy to help: The welfare effects of a nationwide
micro-volunteering programme. IZA Discussion Paper 14431.
Doyle, W. J., Gentile, D. A., & Cohen, S. (2006). Emotional style,
nasal cytokines, and illness expression after experimental
rhinovirus exposure. Brain, Behavior, and Immunity, 20(2),
175-181.
Dussaillant, F., & Guzmán, E. (2014). Trust via disasters: The
case of Chile’s 2010 earthquake. Disasters, 38(4), 808–832.
Ferrer-i-Carbonell, A., & Frijters, P. (2004). How important is
methodology for the estimates of the determinants of
happiness?. The Economic Journal, 114(497), 641–659.

World Happiness Report 2024
59
Folk, D. P., Helliwell, J. F., Holt-Lunstad, J., Norton, M., & Tov, W.
(2024). Comparing the Effects of Loneliness, Social Support,
and Social Connection on Relationship Satisfaction in Seven
Countries. PsyArXiv. https://doi.org/10.31234/osf.io/vzpk4
Fortin, N., Helliwell, J.F., & Wang, S. (2015) How does subjective
well-being vary around the world by gender and age? In J. F.
Helliwell, R. Layard, & J. Sachs (Eds.), World Happiness Report
2015 (pp. 42–75). New York: SDSN.
Fredrickson, B. L. (2001). The role of positive emotions in
positive psychology: The broaden-and-build theory of positive
emotions. American Psychologist, 56(3), 218–226.
Gallup/Meta (2022). The State of Social Connections study.
https://dataforgood.facebook.com/dfg/docs/2022-state-of-
social-connections-study
Gallup/Meta (2023). The Global State of Social Connections.
Gerstorf, D., Ram, N., Mayraz, G., Hidajat, M., Lindenberger, U.,
Wagner, G. G., & Schupp, J. (2010). Late-life decline in well-
being across adulthood in Germany, the United Kingdom, and
the United States: Something is seriously wrong at the end of
life. Psychology and aging, 25(2), 477.
Giuntella, O., McManus, S., Mujcic, R., Oswald, A. J., Powdthavee,
N., & Tohamy, A. (2023). The midlife crisis. Economica, 90(357),
65-110.
Goff, L., Helliwell, J. F., & Mayraz, G. (2018). Inequality of
subjective well-being as a comprehensive measure of inequality.
Economic Inquiry, 56(4), 2177–2194.
Graham, C., & Ruiz Pozuelo, J. (2017). Happiness, stress, and
age: How the U curve varies across people and places. Journal
of Population Economics, 30, 225-264.
Grover, S., & Helliwell, J. F. (2019). How’s life at home? New
evidence on marriage and the set point for happiness. Journal
of Happiness Studies, 20(2), 373-390.
Hale, T., Angrist, N., Goldszmidt, R., Kira, B., Petherick, A.,
Phillips, T., ... & Tatlow, H. (2021). A global panel database of
pandemic policies (Oxford COVID-19 Government Response
Tracker). Nature human behaviour, 5(4), 529-538.
Helliwell, J. F., & Wang, S. (2011). Trust and well-being. Interna-
tional Journal of Wellbeing, 1(1), 42–78.
Helliwell, J. F., Aknin, L. B., Shiplett, H., Huang, H., & Wang, S.
(2018). Social capital and prosocial behaviour as sources of
well-being. In E. Diener, S. Oishi, & L. Tay (Eds.), Handbook of
well-being. (pp. 528–543). Salt Lake City, UT: DEF Publishers.
Helliwell, J., Huang, H., Norton, M., and Wang, S. (2019).
Happiness at different ages: The social context matters. In
The economics of happiness: How the Easterlin paradox
transformed our understanding of well-being and progress,
ed. M. Rojas, New York: Springer.
Helliwell, J. F., Shiplett, H., & Bonikowska, A. (2020). Migration
as a test of the happiness set-point hypothesis: Evidence from
immigration to Canada and the United Kingdom. Canadian
Journal of Economics/Revue canadienne d’économique, 53(4),
1618–1641.
Helliwell, J. F., Huang, H., Wang, S., & Norton, M. (2021). World
happiness, trust and deaths under COVID-19. World Happiness
Report 2021, 13-57.
Holt-Lunstad, J., Smith, T. B., Baker, M., Harris, T., & Stephenson,
D. (2015). Loneliness and social isolation as risk factors for
mortality: a meta-analytic review. Perspectives on Psychological
Science, 10(2), 227–237.
James, B. D., Boyle, P. A., & Bennett, D. A. (2014). Correlates of
susceptibility to scams in older adults without dementia.
Journal of elder abuse & neglect, 26(2), 107-122.
Kannan, V. D., & Veazie, P. J. (2023). US trends in social
isolation, social engagement, and companionship—nationally
and by age, sex, race/ethnicity, family income, and work hours,
2003–2020. SSM-Population Health, 21, 101331.
Kaiser, C., & Oswald, A. J. (2022). The scientic value of
numerical measures of human feelings. Proceedings of the
National Academy of Sciences, 119(42), e2210412119.
Kang, S. H., & Skidmore, M. (2018). The effects of natural
disasters on social trust: Evidence from South Korea.
Sustainability, 10(9), 2973.
Krueger, A. B., & Schkade, D. A. (2008). The reliability of
subjective well-being measures. Journal of Public Economics,
92(8-9), 1833–1845.
Leigh-Hunt, N., Bagguley, D., Bash, K., Turner, V., Turnbull, S.,
Valtorta, N., & Caan, W. (2017). An overview of systematic
reviews on the public health consequences of social isolation
and loneliness. Public Health, 152, 157–171.
Leijen, I., van Herk, H., & Bardi, A. (2022). Individual and
generational value change in an adult population, a 12-year
longitudinal panel study. Scientic Reports, 12(1), 17844.
Mather, M., & Carstensen, L. L. (2003). Aging and attentional
biases for emotional faces. Psychological science, 14(5),
409-415.
Michalski, C. A., Diemert, L. M., Helliwell, J. F., Goel, V., &
Rosella, L. C. (2020). Relationship between sense of
community belonging and self-rated health across life stages.
SSM-population health, 12, 100676.
Mogstad, M. Romano J.P., Shaikh, A. & Wilhelm D.,(2024)
Inference for Ranks with Applications to Mobility across
Neighbourhoods and Academic Achievement across Countries,
The Review of Economic Studies, Volume 91, Issue 1, January
2024, Pages 476–518.
Montgomery, M. (2022). Reversing the gender gap in happiness.
Journal of Economic Behavior & Organization, 196, 65-78.
Mueller, E. A., Wood, S. A., Hanoch, Y., Huang, Y., & Reed, C. L.
(2020). Older and wiser: age differences in susceptibility to
investment fraud: the protective role of emotional intelligence.
Journal of Elder Abuse & Neglect, 32(2), 152-172.
Murthy, V.H. (2023). Our Epidemic of Loneliness and Isolation:
The U.S. Surgeon General’s Advisory on the Healing Effects of
Social Connection and Community. https://www.hhs.gov/sites/
default/les/surgeon-general-social-connection-advisory.pdf
Nilsson, A. H., Eichstaedt, J. C., Lomas, T., Schwartz, A., & Kjell,
O. (2024). The Cantril Ladder elicits thoughts about power and
wealth. Scientic Reports, 14(1), 2642.
Oishi, S., & Westgate, E. C. (2022). A psychologically rich
life: Beyond happiness and meaning. Psychological Review,
129(4), 790.
World Happiness Report 2024
60
World Happiness Report 2024
60
Parry, E., & Urwin, P. (2011). Generational differences in work
values: A review of theory and evidence. International journal
of management reviews, 13(1), 79-96.
Pressman, S. D., Jenkins, B. N., & Moskowitz, J. T. (2019).
Positive affect and health: What do we know and where next
should we go?. Annual review of psychology, 70, 627-650.
Putnam, R. D. (2000). Bowling alone: The collapse and revival
of American community. Simon and schuster.
Putnam, R. D. (2020). The upswing: How America came
together a century ago and how we can do it again. Simon
and Schuster.
Reed, A. E., & Carstensen, L. L. (2012). The theory behind the
age-related positivity effect. Frontiers in psychology, 3, 339.
https://doi.org/10.3389/fpsyg.2012.00339
Reed, A. E., Chan, L., & Mikels, J. A. (2014). Meta-analysis of the
age-related positivity effect: age differences in preferences for
positive over negative information. Psychology and aging,
29(1), 1.
Rojas, M. (2018). Happiness in Latin America has social
foundations. In J. F. Helliwell, R. Layard, & J. Sachs (Eds.),
World happiness report 2018 (pp. 114–145). New York: SDSN.
Shovestul, B., Han, J., Germine, L., & Dodell-Feder, D. (2020).
Risk factors for loneliness: The high relative importance of age
versus other factors. PloS one, 15(2), e0229087.
Steptoe, A., Deaton, A., & Stone, A. A. (2015). Subjective
wellbeing, health, and ageing. The Lancet, 385(9968), 640-648.
Steptoe, A., Shankar, A., Demakakos, P., & Wardle, J. (2013).
Social isolation, loneliness, and all-cause mortality in older men
and women. Proceedings of the National Academy of Sciences,
110(15), 5797-5801.
Stone, A. A., Schwartz, J. E., Broderick, J. E., & Deaton, A.
(2010). A snapshot of the age distribution of psychological
well-being in the United States. Proceedings of the National
Academy of Sciences, 107(22), 9985-9990.
Stone, A. A., Schneider, S., Junghaenel, D. U., & Broderick, J. E.
(2019). Response styles confound the age gradient of four
health and well-being outcomes. Social Science Research, 78,
215-225.
Toya, H., & Skidmore, M. (2014). Do natural disasters enhance
societal trust?. Kyklos, 67(2), 255–279.
Twenge, J. M., Campbell, W. K., & Freeman, E. C. (2012).
Generational differences in young adults’ life goals, concern for
others, and civic orientation, 1966–2009. Journal of personality
and social psychology, 102(5), 1045.
Van der Brug, W., & Kritzinger, S. (2012). Generational differences
in electoral behaviour. Electoral Studies, 31(2), 245-249.
Walzak, L. C. (2023). Fraud susceptibility across adulthood:
Age, context, and the role of individual differences.
https://summit.sfu.ca/_ysystem/fedora/2023-11/etd22730.pdf
Yamamura, E., Tsutsui, Y., Yamane, C., Yamane, S., & Powdthavee,
N. (2015). Trust and happiness: Comparative study before and
after the Great East Japan Earthquake. Social Indicators
Research, 123(3), 919–935.
Zak, P. J., Curry, B., Owen, T., & Barraza, J. A. (2022).
Oxytocin release increases with age and is associated with life
satisfaction and prosocial behaviors. Frontiers in behavioral
neuroscience, 16, 846234.

Chapter 3
Child and Adolescent
Well-Being:
Global Trends, Challenges
and Opportunities
Jose Marquez
Manchester Institute of Education, University of Manchester, UK
and Wellbeing Research Centre, University of Oxford, UK
Laura Taylor
Wellbeing Research Centre, University of Oxford, UK
Leoni Boyle
Wellbeing Research Centre, University of Oxford, UK
Wanying Zhou
Wellbeing Research Centre, University of Oxford, UK
Jan-Emmanuel De Neve
Wellbeing Research Centre, University of Oxford, UK
Acknowledgement: The authors are grateful for the support from Ferran Casas;
Gwyther Rees (UNICEF Innocenti); Camila Teixeira (UNICEF); Olivier Thevenon (OECD);
Mental Health and Wellbeing Focus Group (HBSC); Coordinating Team of the Adolescent
Well-being Measurement Expert Consultative Group (WHO); as well as the editors
of the WHR, including John F. Helliwell; Lara B. Aknin, and Richard Layard.
doi.org/10.18724/whr-91b0-ek06
This version last updated March 8, 2024. Please see worldhappiness.report for latest data.
3
Photo Maxim Hopman on Unsplash
There is a global need for
improving data collection and
assessment to enhance child and
adolescent well-being globally.

World Happiness Report 2024
63
Key Insights
Life satisfaction gradually drops from childhood through adolescence into adulthood.
Globally, adolescents aged 15-24 report higher life satisfaction than adults aged 25 or above,
but the gap is narrowing in Western Europe and recently reversed in North America and
Australia and New Zealand (ANZ) due to negative trends for young people. Conversely, the
gap is widening in Sub-Saharan Africa due to increasing life satisfaction among the youth.
In middle-to-late adolescence (age 15-24), there was a positive 2006-2019 global trend in
life satisfaction, which ended with the pandemic, in line with adult trends.
Global trends obscure regional variations, some of which differ from adult trends. Negative
trends between 2006 and 2022 at age 15-24 are found in North America and ANZ, Western
Europe, Middle East and North Africa (MENA), and South Asia, and positive trends in
Sub-Saharan Africa, Central and Eastern Europe, the Commonwealth of Independent States,
Latin America and the Caribbean, and Southeast Asia.
In early-to-middle adolescence (age 10-15), global well-being data is lacking, with many
world regions having no available information. Evidence primarily from high-income
countries indicates significant life satisfaction declines post-COVID-19, especially among
females, contrasting with East Asian countries, where life satisfaction increased. There is
mixed evidence regarding pre-pandemic trends.
Females start reporting lower life satisfaction than males by around age 12. This gap
widens at ages 13 and 15, and the pandemic has amplified these inequalities. These patterns
are primarily observed in high-income countries due to limited data worldwide. In contrast,
global data for middle-to-late adolescence (age 15-24) shows no global gender differences
from 2006 until 2013, but from 2014, females began reporting higher life satisfaction than
males, although the gap has narrowed following the pandemic. This global gender gap
masks regional differences, and is more pronounced in lower-income countries, with no
gender differences observed in high-income countries.
Life satisfaction levels, trends and correlates vary across age, gender, world regions and
countries, and economic development levels. This underscores the importance of addressing
current data gaps to enhance our understanding of child and adolescent well-being and how
to promote it globally.
Photo Maxim Hopman on Unsplash
World Happiness Report 2024
64
This chapter is the first across the 10+ years of
the World Happiness Report that explores child
and adolescent well-being in some detail. In
this chapter, we examine data from four well-
established international datasets with respondents
aged 10-24. We present the global state of child
and adolescent well-being, with a focus on levels,
trends, inequalities, and correlates. An important
aspect of this chapter is a discussion of the
shortcomings of the available international data
and what action should be taken to improve data
quantity and quality, and thereby improve our
understanding of child and adolescent well-being
and how to improve it worldwide.
Defining Childhood and Adolescence
In this chapter, we define childhood and adoles-
cence within the age range of 10 to 24, reflecting
critical brain development stages.1 The extended
upper age boundary might surprise some readers,
but contemporary understanding considers
adolescence to persist until around 24 years of
age,2 aligning with the ongoing brain development
linked to adolescence that extends into the early
20s,3 and other aspects of individual development
and cultural norms.4 Similarly, childhood spans
birth (or conception) to around 10 years, however,
we acknowledge that childhood can extend
beyond age 10, prompting us to include both
terms childhood and adolescence throughout
this chapter.
In the analysis and discussion, we differentiate
between early-to-middle adolescence (ages 10-15)
and middle-to-late adolescence (ages 15-24).
This distinction is needed due to differences in
available international datasets, requiring distinct
approaches to analyze and interpret the data.
We also acknowledge that significant hormonal,
physical, neurobiological, psychological, social,
and environmental changes occur not only from
age 10-24, but also within the two age ranges
examined.5 We consider these in the interpretation
of the results (e.g. life satisfaction declines from
age 10 to 15).
Defining Well-Being in Childhood
and Adolescence
Similar to adult research featured in previous
World Happiness Reports, this chapter centers on
child and adolescent subjective well-being, which
is how young individuals perceive and assess their
own lives. Every time we use the term ‘well-being’
in this chapter, we refer to subjective well-being.
The prevailing theoretical framework for subjective
well-being in childhood and adolescence (and
adulthood) includes affective evaluations (positive
and negative emotions), cognitive evaluations
(life satisfaction), and sometimes also comprises
eudaimonic evaluations (such as meaning and
purpose).6 However, there are nuanced differences
between approaches in adult and child/adolescent
subjective well-being research. Cognitive evalua-
tions, covering overall life satisfaction, also tend
to consider domain-specific assessments, such
as satisfaction with school, school peers, physical
appearance, and time use, to cite a few.7
Additionally, in certain fields like health sciences,
mental health is integral to child and adolescent
well-being, and the terms are often used inter-
changeably.8 It is important to acknowledge that
these components are primarily derived from a
Western perspective due to the origin of much
of the research. In this chapter, we focus on
cognitive evaluations, specifically overall life
satisfaction measured on a 0-10 response scale,
driven by data availability and comparability.
There are slight differences in the life satisfaction/
evaluation scales used across the data sets
examined, which are described below. However,
for ease, we refer to them as life satisfaction as
this is the established term in the child and
adolescent literature.9
Child and Adolescent Well-Being:
What We Know
While research into subjective well-being in
adulthood has been an established field for many
decades,10 subjective well-being as a specific field
with children and adolescents is a more recent
field of inquiry. Particularly in the last 15 years,
increased interest in this field has been driven by
advances in child development theory, increased
children’s rights legislation, and developments in

World Happiness Report 2024
65
positive psychology and social science.11 Interest
has also increased following some specific research
findings. A detailed literature review is beyond
the scope of this chapter, but there are a few key
findings worth noting. Most of them refer to
school-age children and adolescents.
Research has highlighted the importance of
consulting children directly, as their subjective
well-being is weakly correlated with that of adults
or families, and parents’ reports of their children’s
well-being are not always aligned with children’s
own reports.12 There is evidence supporting the
validity and reliability of measuring child subjective
well-being and related factors from age 8.13
Evidence from the health literature further
supports children as reliable and accurate reporters
of their health and well-being, emphasizing the
importance of their self-reported perceptions in
understanding their experiences.14 There is also
specific evidence on the validity of the Cantril
Ladder as a measure for adolescent samples of
11, 13, and 15-year-olds.15
Children and adolescents generally report higher
subjective well-being than adults, with variations
across societies and vulnerable groups, including
females, immigrants, children in care, and certain
minorities.16 Subjective well-being trajectories
show a decline from age 10 to late adolescence
and adulthood,17 varying among groups and
countries, with evidence suggesting a more
profound decline in lower-income countries.18
Furthermore, studies indicate that adolescent
subjective well-being is declining in many
countries, including evidence from both before19
and after the onset of the COVID-19 pandemic.20
There is also evidence that these declines are
more pronounced among females than males,21
and that the drivers of this decline may differ
between countries,22 which emphasizes the need
for cross-cultural insights.
Childhood and adolescence, besides being crucial
life stages in their own right,23 are subjects of
interest for their impact on individuals as they
transition into adulthood. Research on develop-
mental trajectories from these periods to adulthood
reveals a significant influence on later life outcomes,
encompassing adult well-being, labor market
success, physical health, and relationships. There
is evidence that indicates that the best predictor
for adult life satisfaction is subjective well-being
and emotional health during childhood, and that
the next major influence on emotional health,
after family, is school both in childhood and
adolescence.24 In addition, further research
suggests that subjective well-being in adolescence
predicts levels of income in adulthood, even
when employing family-fixed-effects (with sibling
clusters) and controlling for factors such as
education, intelligence quotient, physical health,
height, self-esteem, and later happiness. These
findings were mediated by a higher probability
of obtaining a college degree, getting hired and
promoted, having higher degrees of optimism
and extraversion, and less neuroticism.25 Thus,
childhood and adolescence represent periods of
considerable importance and a unique window
opportunity for intervention, allowing for strong
and positive impacts on global society.
A range of factors have been found to explain
variations in child and adolescent subjective
well-being. There is a nuanced association with
socio-economic status, with stronger links to
material deprivation – especially when measured
via child-derived indices – than family income.26
Relationships, both with parents and peers, play
a substantial role, and schools are considered as
key domains where policy interventions can make
a significant impact. Factors like bullying and
school-related anxiety influence subjective
well-being, but this relationship is nuanced and
varies across population groups, countries,
and measures.27 Other influential drivers include
aspects related to various life domains, including
health, physical activity, time use, neighborhood,
safety, and children’s rights.28 Most of the drivers
identified in the literature are factors in the
close environment, such as family, school, and
community.29 Associations with subjective
well-being have been found for some child-
The best predictor for adult
life satisfaction is subjective
well-being and emotional health
during childhood.
World Happiness Report 2024
66
focused macro-level factors (e.g.spending on
families and education as a percentage of GDP).30
However, for many others, and particularly
macro-economic factors, associations are found
for adults but not for children and adolescents
aged 10-15.31 Indeed, researchers have reported
counterintuitive results, such as findings on the
negative association between the country level of
economic development and adolescent subjective
well-being at age 15.32 However, some of these
counterintuitive findings may be the results of
adolescents from non-high-income countries not
being considered in these analyses as data in
these countries is not available for younger
adolescents.33
It is important to note that most of what we know
about child and adolescent subjective well-being
is mainly from adolescents in high-income
countries. Thus, improved worldwide data collec-
tion is crucial for understanding and promoting
adolescent subjective well-being globally.
International Data on Child and
Adolescent Well-Being
Despite the surge of interest in these critical
developmental periods, the available international
data on child and adolescent subjective well-being
remains notably limited. As a result, while subjective
well-being research within specific cultural
contexts is abundant,34 international research
remains comparatively scarce. Four major
cross-sectional datasets provide information on
child and/or adolescent subjective well-being
(see Box 1 for details): the Programme for Inter-
national Student Assessment (PISA) survey; the
Health Behaviour in School-aged Children (HBSC)
survey; the International Survey of Children’s
Well-being (ISCWeB or “Children’s Worlds”); and
the Gallup World Poll (GWP). Children’s Worlds
explicitly centers on child subjective well-being,
and not only measures life satisfaction (the
cognitive component) but also affective and
eudaimonic components, which are crucial for
holistic analyses.35 In contrast, the other studies
measure subjective well-being but not as their
primary focus. The GWP, though collecting
nationally representative data for their entire
sample aged 15+ to late adulthood, lacks such
representation for the subset used in this chapter,
focusing on adolescents aged 15-24 (middle-to-late
adolescence). However, the GWP collects global
data from 120-140 countries in most world regions,
including many low-income countries. By contrast,
PISA, HBSC, and Children’s Worlds collect nationally
representative samples of adolescents aged 10 to
15 (early-to-middle adolescence) in some 20-70
countries and territories, mostly in high-income,
Western societies.
The World Happiness Report 2023 underscored
the natural approach of measuring a nation’s
happiness by asking a nationally-representative
sample about their life satisfaction.36 In the annual
World Happiness Report rankings, the Cantril
Ladder from the Gallup World Poll gauges
well-being or “happiness”.37 In this chapter on
childhood and adolescence well-being, data is
drawn from these four surveys focusing on their
overall life satisfaction/evaluation measures on an
11-point response scale. This is the only comparable
measure in the four data sets, although each
survey uses a slightly different version, as de-
scribed in Box 1. This 11-point scale enhances
sensitivity for adolescent respondents in most
countries compared to shorter scales,38 and
enables us to develop measures of subjective
well-being inequalities (e.g. gender and age-based
differences) that are consistent across surveys.
As explained earlier, for ease, we use the term life
satisfaction throughout this chapter.
The four surveys examined represent significant
endeavors in collecting extensive international
child and adolescent well-being data. However,
before delving into the results of our analyses,
it is essential to acknowledge a few key data
limitations affecting the analysis and the subse-
quent discussion. A primary challenge is the lack
of a standardized subjective well-being measure
across surveys. Two surveys (HBSC and GWP)
utilize a version of the Cantril Ladder, akin to the
one used for the adult global happiness ranking
in the World Happiness Report, while PISA and
Children’s Worlds employ a question about
overall life satisfaction. Another limitation stems
from the age distribution in the datasets; none
cover the entire span from childhood to late
adolescence or adulthood, constraining the ability

World Happiness Report 2024
67
Box 3.1: Which large international datasets include measures of child and
adolescent well-being?
PISA is the OECD’s Programme for International
Student Assessment which surveys nationally
representative samples of young people aged
15 across 70 countries/territories.39 The main
focus of the questionnaire is young people’s
ability to apply their mathematical, reading,
and science skills to real-life challenges. While
subjective well-being questions have inconsist-
ently been included in the PISA, data on life
satisfaction has been systematically collected
in most participating countries in the last three
waves (2015, 2018, 2022). In 2022, 74 countries
and territories collected life satisfaction data
(43 high-income, 24 upper-middle-income,
7 lower-middle-income, zero low-income in
the 2022 edition). PISA employs a one-item
measure of life satisfaction: “The following
question asks how satisfied you feel about
your life, on a scale from “0” to “10”. Zero
means you feel ‘not at all satisfied’ and “10”
means ‘completely satisfied’. Overall, how
satisfied are you with your life as a whole
these days?”.
The HBSC survey is conducted in collaboration
with the WHO Regional Office for Europe.
It assesses the health and well-being of
adolescents across Europe, North America,
and – more recently – Central Asia, using
nationally representative samples at ages
11, 13, and 15. There are six waves of data that
include subjective well-being measurements
(2002, 2006, 2010, 2014, 2018, 2022). The
most recent waves included 39 European and
North American countries and 5 Common-
wealth of Independent States (CIS) in Central
Asia in 2022 (35 high-income, seven upper-
middle-income, one lower-middle-income,
and one low-income). Subjective well-being is
assessed using an adapted version of the
Cantril Ladder measuring life satisfaction:
“Here is a picture of a ladder. The top of the
ladder ‘10’ is the best possible life for you, and
the bottom ‘0’ is the worst possible life for
you. In general, where on the ladder do you
feel you stand at the moment? Tick the box
next to the number that best describes where
you stand.”
The Children’s Worlds survey explores the
subjective well-being of children aged 8, 10,
and 12, using nationally representative samples
of 1000 children in up to 35 countries per
wave. There have been three waves of data
collection (2011-12, 2013-14, 2017-19), plus a
post-COVID-19 wave in 2020-22, which was
not nationally representative. The 2017-19
wave expanded to include 30-35 countries
(depending on age group; 21-25 high-income,
five upper-middle-income, five lower-middle-
income, and zero low-income). This study
includes a “0” to “10” life satisfaction item:
“How satisfied are you with each of the
following things in your life? […] 0 = Not at
all satisfied; 10 = totally satisfied […]. Your life
as a whole”. Data from children aged 8 was
excluded in this chapter as the response scale
used was different making comparability
more challenging.
The Gallup World Poll has tracked the most
important issues annually worldwide since
2005. Responses from 15-64-year-olds are
representative across 140-160 countries, and
the sample includes many lower-middle and
low-income countries. For the 15-24 age group
employed in this chapter, the sample is not
representative. The Cantril Ladder is used to
assess life satisfaction: “Please imagine a
ladder with steps numbered from zero at the
bottom to 10 at the top. The top of the ladder
represents the best possible life for you, and
the bottom of the ladder represents the worst
possible life for you. On which step of the
ladder would you say you personally feel you
stand at this time?”.

World Happiness Report 2024
68
to consistently analyze well-being responses
across various age groups. Additionally, a
predominant focus on high- and upper-middle-
income countries (mostly Western nations) in the
data covering early-to-middle adolescence (age
10-15) raises concerns about the generalizability
of many findings to lower-income countries.
A more detailed discussion of these and other
limitations follows at the end of this chapter.
This Chapter
Despite these limitations, this chapter provides a
comprehensive examination of global child and
adolescent subjective well-being. It begins by
exploring life satisfaction levels and trends among
children and adolescents, with consideration of
regional, gender, and age group variations. The
following section offers an overview of current
country-level life satisfaction in the post-pandemic
world and how these vary across different age
groups. We then present correlational analyses
to examine inequalities across different socio-
demographic groups, and assess how factors
within distinct life domains contribute to variations
in adolescent life satisfaction. Subsequently, we
discuss our findings, as well as shortcomings in
international child and adolescent subjective
well-being data and how these limitations impact
our understanding. Finally, we conclude the
chapter by highlighting initiatives that are making
major inroads in improving data availability and
assessing and promoting child and adolescent
well-being, which serve as inspiration for exploring
further necessary steps to collectively enhance
the well-being of children and adolescents globally.
Trends in Child and
Adolescent Well-Being
The four data sets examined differ significantly in
participant age, data collection commencement,
number and frequency of waves, representative-
Photo Tucker Tangeman on Unsplash

World Happiness Report 2024
69
ness of the samples, and participating countries
and territories. These differences, described
above, imply that different analytical approaches
are needed to study trends across these data
sets. Specifically, in middle-to-late adolescence
(age 15-24), we use the GWP to study population
changes over time at the global- and regional-level,
similar to past World Happiness Report editions.40
The small n per country and wave (see Table A1.1
in Appendix 1) prevent us from conducting
rigorous assessments at the country level. In
contrast, in early-to-middle adolescence (age
10-15), conducting robust analyses at the global
level and in most regions is not possible. Thus,
we analyze PISA, HBSC, and Children’s Worlds
data to examine trends in country means and
discuss them in the context of regional trends
when feasible.
Furthermore, in view of evidence of pre-COVID-19
trends in adolescent life satisfaction in multiple
countries,41 the further negative impact of the
COVID-19 pandemic on children and young
people’s subjective well-being,42 and gender
differences in adolescent subjective well-being
trends,43 our analyses emphasize the distinction
between pre- and post-COVID-19 trends and
examine gender differences whenever possible.
Global Levels and Trends in Middle-to-Late
Adolescence (Age 15-24): Gallup World Poll
In our analysis of global trends using the GWP
data, we assign countries equal weight in the
analysis regardless of their population to replicate
the main analysis presented in previous editions
of the World Happiness Report for the adult
population (e.g. Figure 2.2 in the 2022 edition).44
Four main findings emerge (Figure 3.1A). First,
global life satisfaction is higher at age 15-24 than
at age 25 or above. Second, trends in middle-to-
late adolescence (age 15-24) are similar to those
observed in the adult population45 and those
aged 25 or above before the COVID-19 pandemic,
with evidence of a moderate increase in global
life satisfaction between 2006 and 2019. Third,
the pandemic ended positive global trends. And
fourth, there are no gender differences until 2013,
but females aged 15-24 begin to report higher life
satisfaction than males from 2014, although this
gender gap has narrowed after the COVID-19
pandemic. Despite 95% confidence interval
overlap in 2022 in Figure 3.1B, small gender
differences are still observed in 2022 in the
correlational analysis presented below in
Table 3.3, which uses a slightly different (more
global) sample of countries.
The use of slightly different samples of countries
in different parts of the analysis is needed due to
data limitations. In 2020, the number of countries
where data were collected dropped significantly,
especially in low-income countries (see Table A1.1
in Appendix 1). In the global trends in Figures 3.1A
and 3.1B, we decided to use data only from the
countries where data were collected in 2020
(i.e. consistent sample) to ensure that these
trends represent a consistent sample of countries.
The main caveat is that these global trends are
somewhat less global as they exclude a number
of low-income countries that were not sampled in
2020. For clarity, Figure A1.1 in Appendix 1 shows
a comparison of global trends using an inconsistent
sample (i.e. considering all the countries with
available data each year) and a consistent sample
(i.e. considering only the countries where data
were collected in 2020). The former shows a peak
in 2020/21 due to the reduced number of low-
income countries, where life satisfaction tends to
be lower on average. In contrast to this approach,
in the analysis of regional trends presented in the
next section, we considered more adequate to
use data from all the countries with available
data each year as otherwise some regions (e.g.
Sub-saharan Africa) would represent a small, far
less representative sample of countries. The main
caveat is that 2020-21 levels in certain low-
income regions are to be interpreted with caution.
Regional Levels and Trends in Middle-to-Late
Adolescence (Age 15-24): Gallup World Poll
Positive 2006 to 2022 global trends contrast with
the large body of research reporting on interna-
tional declines in youth subjective well-being in
the last 10-15 years. Since declines have largely
been documented in high-income, Western
nations, it seems plausible that positive global
trends mask regional and country trends moving
in opposite directions, with increases in less

World Happiness Report 2024
70
Fig. 3.1A: Global levels and trends in life satisfaction from 2006 through 2022.
Gallup World Poll (age 15-24 vs. age 25+)
Fig. 3.1B: Global levels and trends in life satisfaction from 2006 through 2022.
Gallup World Poll (age 15-24), by gender
5
5.2
5.4
5.6
5.8
6
6.2
6.4
Life Satisfaction
Age 15-24
Age 25+
2005-06 2010 2014 2018 2022
2005-06 2010 2014 2018 2022
5.6
5.8
6
6.2
6.4
Life Satisfaction
Female
Male

World Happiness Report 2024
71
surveyed regions compensating for potential
declines in the most commonly surveyed regions.
We now turn our attention to this issue by exam-
ining trends at regional and country levels. Using
GWP data, we explore regional trends across the
10 world regions commonly examined in the
World Happiness Report (see Figure 3.2A and
Figure A1.2C, Figure 3.2B, Figure 3.2C, and
Figure A1.3), revealing four key findings.
Positive Regional Trends
Positive trends emerged in various regions during
the period 2006-2019, including the CIS, Central
and Eastern Europe, Sub-Saharan Africa, Latin
America and the Caribbean, and Southeast Asia.
The former two regions exhibit more sustained
trends, while the latter three display greater
volatility. Comparatively, life satisfaction levels in
2022, when contrasted with 2019, remain similar
in the CIS and Central and Eastern Europe,
decrease in Sub-Saharan Africa, and slightly
increase in Latin America and the Caribbean.
There is also some evidence of a positive trend in
East Asia, where life satisfaction is substantially
higher in 2006 than in 2007 partly due to the
non-inclusion of Mongolia in 2006, which drags
down the East Asian series, and the non-inclusion
of Taiwan in 2007, the happiest country in the
region in 2006. When considering 2007 or 2008
as a reference instead, a positive pre-COVID-19
trend is observed in East Asia, followed by a
further increase from 2019 to 2022. There is
minimal evidence of gender differences throughout
the series in the CIS, Central and Eastern Europe,
Latin America and the Caribbean, and Southeast
Asia. In contrast, females exhibit higher life
satisfaction than males in East Asia during the
period 2006-11 and in Sub-Saharan Africa during
the period 2018-21.
Negative Regional Trends
Negative trends preceding the COVID-19 era
(2006/07-2019) are evident in the Middle East
and North Africa (MENA), South Asia, North
America (Canada and the United States), Australia
and New Zealand (ANZ), and Western Europe. In
Western Europe, despite minimal 95% confidence
interval overlap between 2006 and 2019 estimates,
the declining trend is noticeable when comparing
the periods 2006-12 and 2013-18. Regarding
post-COVID-19 trends in these regions, life
satisfaction levels in 2022 are similar to 2019 in all
these regions, except for Western Europe, where
a clear decline is apparent. However, the small
sample size, leading to larger 95% confidence
intervals, may obscure further declines in North
America and ANZ. The 2020 increase in South
Asia is explained by Afghanistan, which drags
down South Asian levels throughout the entire
series, especially in recent years (see Figure A1.2A
in Appendix 1), and did not collect data in 2020.
There are no gender differences in any of these
regions, except for the MENA, which is the only
world region where females consistently exhibit
higher life satisfaction than males throughout the
entire series.
Sub-Regional and Country Trends
Positive and negative trends at both sub-regional
and country levels can be observed within specific
regions. For instance, when separating North
America from ANZ in Figure A1.3 in Appendix 1,
despite limitations in sample size, we identify
stable pre-COVID-19 trends from 2006 to 2019
and a post-COVID-19 decline in ANZ. In contrast,
declining trends in North America appear to
have started several years before the COVID-19
pandemic. Rigorous assessment of gender
differences is hindered by a small sample size. It is
conceivable that other intra-regional trends may
exist in some of these large and diverse regions.
Unfortunately, small sample size limitations
involving this age group restrict our ability to
thoroughly explore this question. However, in
Figure A1.2A-B in Appendix 1, we present some
instances of country-level trends in countries
where previous evidence on adolescent subjective
well-being is almost non-existent as these data
are rarely collected in these nations. This includes
some positive trends (Mongolia, Togo, Ivory
Coast, and Gabon) and negative trends (Lebanon
and Afghanistan).
Contrasts with Adult Trends
When comparing regional trends for those ages
15-24 and aged 25 or above, contrasting patterns
are evident. These are illustrated in Figure A1.3 in
Appendix 1, as well as in Figure 3.2C for some

World Happiness Report 2024
72
selected regions. The gap is notably large in the
CIS, Latin America and the Caribbean, and espe-
cially in Central and Eastern Europe. Additionally,
the gap varies over the years in some regions as
shown in Figure 3.2C. In Sub-Saharan Africa, the
gap widened from 2013 due to stable life satisfac-
tion levels among those aged 25+ and positive
trends among those aged 15-24. In contrast, the
gap has narrowed in Western Europe for over a
decade due to a moderate negative trend among
adolescents (age 15-24) and a moderate positive
trend among those aged 25 and above. In North
America and ANZ, despite 95% confidence
interval overlaps in some years, there is evidence
of a potential reversal in this gap in recent years,
suggesting that life satisfaction could now be
higher among those aged 25+ than among those
aged 15-24, which is not observed anywhere else.
Separate analyses for North America and ANZ are
shown in Figure A1.3 in Appendix 1, which suggest
the same pattern in both regions – and especially
in North America – despite 95% confidence
interval overlaps likely due to small sample size.
Further evidence of age-based differences in
regional trends can be observed in Chapter 2.46
Regional and Country Levels and Trends in
Early-to-Middle Adolescence (Age 10-15).
Data from PISA (Age 15), HBSC (Age 15, 13, 11),
and Children’s Worlds (Age 12, 10)
In early-to-middle adolescence (age 10-15), global
subjective well-being analyses are not possible
due to limited data, mainly available in high-
income Western countries. Consequently, we
focus on regional and country trends, starting
with those aged 15 and then shifting to age 10-13.
Assessing regional trends is complex in PISA and
HBSC, and unfeasible in Children’s Worlds, due to
a limited number of participating countries and
data gaps across waves. This limitation hampers
the ability to make robust, evidence-based claims
about regional trends. As a result, we turn to
national trends, presented in Tables A1.2-A1.3 in
Appendix 1, with discussions considering regional
contexts where possible.
Fig. 3.2A: Regional levels and trends in life satisfaction from 2006 through 2022.
Gallup World Poll (age 15-24)
Life Satisfaction (age 15-24)
3.5
4
4.5
5
5.5
6
6.5
7
7.5
8
2005-06 2010 2014 2018 2022
North America and ANZ
Western Europe
Latin America & Caribbean
Central and Eastern Europe
East Asia
Middle East & North Africa
Southeast Asia
Commonwealth of Independent States
South Asia
Sub-Saharan Africa

World Happiness Report 2024
73
Fig. 3.2B: Regional levels and trends in life satisfaction from 2006 through 2022.
Gallup World Poll (age 15-24), by gender
Western Europe
3.5
4
4.5
5
5.5
6
6.5
7
7.5
8
8.5
2005-06 2010 2014 2018 2022
Male
Female
3.5
4
4.5
5
5.5
6
6.5
7
7.5
8
8.5
Commonwealth of Independent States
Male
Female
2005-06 2010 2014 2018 2022
Southeast Asia
Male
Female
3.5
4
4.5
5
5.5
6
6.5
7
7.5
8
8.5
2005-06 2010 2014 2018 2022
Central and Eastern Europe
Male
Female
3.5
4
4.5
5
5.5
6
6.5
7
7.5
8
8.5
2005-06 2010 2014 2018 2022
South Asia
Male
Female
3.5
4
4.5
5
5.5
6
6.5
7
7.5
8
8.5
2005-06 2010 2014 2018 2022
East Asia
Male
Female
3.5
4
4.5
5
5.5
6
6.5
7
7.5
8
8.5
2005-06 2010 2014 2018 2022

World Happiness Report 2024
74
Age 15
From PISA and HBSC data, two key findings
emerge. Firstly, both datasets reveal a significant
post-COVID-19 decline in most countries with
available data (mainly high-income, Western
nations), with a more pronounced decrease
among females. Notably, some countries in East
Asia (Japan, Macau, Taiwan, and Hong Kong)
show an increase, as indicated by PISA data, the
only study collecting information in these regions.
In HBSC, post-pandemic declines are noted in
countries in North America (Canada), Western
Europe, Central and Eastern Europe, and the CIS. In
PISA, similar declines are observed across countries
in these regions, as well as in the MENA, Latin
America and the Caribbean, and Southeast Asia.
The second key finding at age 15 is the existence
of mixed results concerning pre-COVID-19 trends,
with notable disparities in country means and
trends between PISA and HBSC. This is detailed
in Table 3.1, and further explored in Appendix 2
(Table A2.1 and Figure A2.1). PISA indicates a
pre-COVID-19 decline in most countries with data
from 2015 and 2018, encompassing North America,
Western Europe, Central and Eastern Europe, the
CIS (Russia), Latin America and the Caribbean,
MENA, and East Asia. This decline is more promi-
nent among females, particularly in Central and
East Europe, the CIS (Russia), Latin America and
the Caribbean, and East Asia (see Table A1.2 in
Appendix 1). Notably, the only pre-COVID-19
increase is observed in South Korea, though this
Fig. 3.2B: Regional levels and trends in life satisfaction from 2006 through 2022. (continued)
Gallup World Poll (age 15-24), by gender
North America and ANZ
Male
Female
3.5
4
4.5
5
5.5
6
6.5
7
7.5
8
8.5
2005-06 2010 2014 2018 2022
a
Sub-Saharan Africa
Male
Female
3.5
4
4.5
5
5.5
6
6.5
7
7.5
8
8.5
2005-06 2010 2014 2018 2022
Latin America & Caribbean
Male
Female
3.5
4
4.5
5
5.5
6
6.5
7
7.5
8
8.5
2005-06 2010 2014 2018 2022
Middle East & North Africa
Male
Female
2005-06 2010 2014 2018 2022
3.5
4
4.5
5
5.5
6
6.5
7
7.5
8
8.5

World Happiness Report 2024
75
masks a decline among females and an increase
among males (see Table A1.2 in Appendix 1).
This underscores the importance of assessing
inequalities across distinct socio-demographic
groups within countries, achievable only through
nationally representative samples of the studied
population group.
In contrast, in many countries where PISA
indicates a pre-COVID-19 decline between 2015
and 2018, this decline is absent in HBSC data
from 2013/14 to 2017/18. In Western Europe,
HBSC data depicts a mixed picture, predominantly
showing increases, while PISA consistently
indicates declines. In Central and Eastern Europe,
HBSC shows an overall increase and PISA an
overall decline. In Russia, the only CIS country
with comparable data, PISA indicates a decline,
contrasting with HBSC’s absence of statistically
Fig. 3.2C: Regional levels and trends in life satisfaction from 2006 through 2022.
Gallup World Poll (age 15-24 vs. age 25+)
3.5
4
4.5
5
5.5
6
6.5
7
7.5
8
3.5
4
4.5
5
5.5
6
6.5
7
7.5
8
Sub-Saharan Africa
Age 15-24
Age 15-24
Age 25+
North America and ANZ
Age 25+
2005-06 2010 2014 2018 2022
2005-06 2010 2014 2018 2022
World Happiness Report 2024
76
significant changes (p<0.05). Discrepancies in
country means, as seen in Table A2.1 and Figure
A2.1 in Appendix 2, may explain disparities in
trends. Although most differences in country
means are minor, a few instances reveal surpris-
ingly large gaps, with PISA estimates generally
lower than HBSC estimates. In the U.K., for
instance, HBSC 2017/18 shows life satisfaction
levels almost 1 point higher than PISA 2018.
Considering research evidence of subjective
well-being declines throughout adolescence,47
this discrepancy may partly be explained by the
fact that most students surveyed in HBSC are
enrolled in Year 10, while in PISA, unlike most
participating countries, most students surveyed
in England, Northern Ireland, Scotland and Wales
are enrolled in Year 11. Appendix 2 delves into a
detailed discussion of factors potentially
explaining PISA-HBSC discrepancies, including
variations in the life satisfaction measure, the year
and month of data collection, survey context
(e.g., right after/before taking an academic test in
PISA), the target population (e.g. differences in
the average age and school year), and sampling
issues (notably exclusions in PISA).
In view of the above, it is evident that while there
is robust evidence of post-COVID-19 declines in
nearly all examined countries (with increases in
most East Asian nations), caution is warranted
when interpreting evidence on pre-COVID-19
trends at age 15, where contrasting results
emerge in many countries. National studies, such
as those in the U.K. outlined in Appendix 2, can
provide further support to trends observed in
international studies. However, in countries
lacking alternative data, making definitive claims
about trends during these years for this age
group is challenging. Further research is essential
to elucidate the factors contributing to these
discrepancies.
Age 10-13
Unlike PISA, HBSC collects data from younger
adolescents aged 13 and 11, enabling an examination
of longer-term trends starting from 2001/02.
Table A1.3 and Figure A1.4 in Appendix 1 show
stability in most countries and sustained pre-
pandemic trends in some regions. Canada, the
only North American country with data throughout
the series, exhibits a continuous negative trend
predating the pandemic, persisting into 2022,
primarily driven by a decrease among females
(see Figure A1.4 in Appendix 1). Males in Canada
experience a negative trend affecting only
15-year-olds post-COVID-19, while females endure
a prolonged negative trend impacting those aged
13 and 15 for over a decade before the pandemic,
as well as those aged 11 after the pandemic.
Negative pre-pandemic trends (2005/06-17/18)
are also observed in the MENA countries Turkey
and Israel. Conversely, sustained pre-pandemic
positive trends are noted across several HBSC
waves in countries in Central and Eastern Europe,
including Croatia, Latvia, and Estonia. The picture
is more mixed in the CIS and Western Europe.
Lastly, the post-pandemic decline observed in
those aged 15 is mirrored in those aged 13 and 11,
affecting all regions with available data, including
North America (Canada), Western Europe, and
Central and Eastern Europe. This decline is
prevalent across most countries surveyed in
2017/18 and 2021/22, with a more substantial
impact on females and older age groups.
Moving to younger children and adolescents,
trend analyses in Children’s Worlds (age 12, 10)
are not feasible due to the data limitations
explained earlier. However, country-level
estimates by survey wave and gender, presented
in Table A1.5 in Appendix 1, suggest a decline
in most participating countries following the
COVID-19 pandemic.
Current Global State of Child and
Adolescent Well-Being
Providing an overview of the current global state
of child and adolescent subjective well-being in
the post-pandemic world is imperative given
the widespread post-COVID-19 decline in life
satisfaction, along with age-related and
geographic patterns and the earlier-discussed
data limitations. Country means in life satisfaction
across age groups, studies, and countries/territories
are outlined in Tables 3.2A-J (alphabetically
ordered within each of the 10 world regions) and
Tables A1.6A-D in Appendix 1 (countries ranked
by GDP).

World Happiness Report 2024
77
Middle-to-Late Adolescence (Age 15-24):
Gallup World Poll
There are notable regional differences in life
satisfaction in middle-to-late adolescence, with
Israel, parts of Central and Eastern Europe
(Croatia, Serbia, Lithuania, Romania), and
Northern Europe reporting the highest levels
and Sub-Saharan Africa and South Asia recording
the lowest in the GWP (age 15-24). The poor
performance in South Asia is mostly driven by
the extremely low life satisfaction reported by
adolescents in Afghanistan. All this is consistent
with adult data, with the exception of the cited
Central and Eastern European countries, which
are found much lower in the adult ranking, and
North America, ANZ, and Western Europe, where
adult life satisfaction is much higher compared
to other regions.48
Early-to-Middle Adolescence (Age 10-15):
PISA, HBSC, and Children’s Worlds
The main observation is the limited number
of countries collecting subjective well-being
data in early-to-middle adolescence, primarily
high-income Western nations (although
Table A2.1 in Appendix 2 indicates increased
participation from lower-income countries in
recent years, notably in PISA 2022). In the
available data, regional variations are evident.
PISA 2022 data reveal the highest life satisfaction
in Central and Eastern Europe (particularly in the
Balkans), and the CIS, with the lowest in East
Asia, North America and ANZ, and MENA. HBSC
data, primarily focused on Europe, North America
and the CIS, indicates highest life satisfaction
levels in the Balkans and CIS countries, and
lowest in North America (Canada) and specific
European nations like Ireland, the U.K., Italy,
image TK
Photo Yingchou Han on Unsplash

World Happiness Report 2024
78
Table 3.1: Regional and country in PISA (2015-18-22) and HBSC (2013/14-17/18-21/22)
PISA (Age 15) HBSC (Age 15)
Country means Trends Country means Trends
Country 2015 2018 2022 2015–18 2018–22 2013/14 2017/18 2021/22 2013/14–17/18 2017/18–21/22
Western Europe
Austria 7.52 7.14 6.69 -0.39 -0.44 7.53 7.29 7.20 -0.24 non.sign.
Belgium 7.49
Belgium (Flemish) 6.89 7.48 7.46 0.60 non.sign.
Belgium (French) 7.19 7.22 6.81 non.sign. -0.41
Cyprus 6.99 7.45
Denmark* 7.19 7.37 7.48 7.10 non.sign. -0.39
Finland 7.89 7.61 7.41 -0.28 -0.21 7.47 7.46
France 7.63 7.19 6.77 -0.44 -0.42 6.97 7.28 6.91 0.32 -0.37
Germany 7.35 7.02 6.51 -0.33 -0.51 7.05 7.33 7.12 0.28 -0.21
Greece 6.91 6.99 6.62 non.sign. -0.37 7.16 7.04 6.70 non.sign. -0.34
Greenland 7.48 7.49 6.66 non.sign. -0.83
Iceland 7.80 7.34 6.90 -0.46 -0.44 7.47 7.26 7.12 -0.21 -0.14
Ireland* 7.30 6.74 6.59 -0.57 -0.15 7.01 6.89 6.22 non.sign. -0.67
Italy 6.89 6.91 6.53 non.sign. -0.38 6.95 7.11 6.55 0.16 -0.55
Luxembourg 7.38 7.04 -0.34 7.01 7.35 7.10 0.33 -0.24
Malta 6.24 7.11 6.71 6.48 -0.40 -0.23
Netherlands* 7.83 7.50 7.29 -0.33 -0.21 7.36 7.33 6.90 non.sign. -0.43
Norway 7.54 7.48 7.05 non.sign. -0.43
Portugal 7.36 7.13 7.06 -0.24 non.sign. 6.99 7.35 7.05 0.36 -0.29
Spain 7.42 7.35 6.88 non.sign. -0.46 7.30 7.64 6.77 0.34 -0.87
Sweden 6.91 6.83 7.10 6.80 0.27 -0.30
Switzerland 7.72 7.38 7.06 -0.34 -0.31 7.54 7.34 6.99 -0.19 -0.35
U.K.* 6.98 6.16 6.07 -0.81 non.sign.
U.K. (England) 6.94 6.12 6.01 -0.82 non.sign. 6.81 7.11 6.51 0.30 -0.60
U.K. (Northern Ireland) 7.24 6.58 6.50 -0.67 non.sign.
U.K. (Scotland) 7.17 6.25 6.48 -0.92 0.23 7.14 7.03 6.66 non.sign. -0.37
U.K. (Wales) 7.13 6.45 6.16 -0.68 -0.29 6.93 7.09 6.61 0.16 -0.48
Average 7.37 6.94 6.69 -0.51 -0.31 7.17 7.25 6.90 0.15 -0.43
Central and Eastern Europe
Albania 8.01 7.71 7.56 8.14 non.sign. 0.58
Bulgaria 7.42 7.15 7.04 -0.26 non.sign. 7.43 7.59 7.10 0.16 -0.49
Croatia 7.90 7.69 7.37 -0.22 -0.32 7.49 7.72 7.57 0.23 -0.15
Czech Republic 7.05 6.91 6.56 -0.14 -0.36 6.99 7.43 7.26 0.44 -0.17
Estonia 7.50 7.19 6.91 -0.31 -0.28 7.33 7.35 6.95 non.sign. -0.40
Hungary 7.17 7.12 7.21 non.sign. non.sign. 7.09 7.14 6.99 non.sign. non.sign.
Kosovo 7.87
Latvia* 7.37 7.16 6.76 -0.21 -0.40 7.06 7.00 6.73 non.sign. -0.27
Lithuania 7.86 7.61 7.14 -0.26 -0.47 7.47 6.95 -0.52
Montenegro 7.75 7.69 7.52 non.sign. -0.16
North Macedonia 7.65 7.11 7.82 7.42 0.70 -0.39
Poland 7.18 6.74 6.26 -0.44 -0.49 6.80 7.03 6.20 0.23 -0.84
Romania 7.53 7.61 7.94 7.76 0.32 -0.18
Serbia 7.48 7.85 7.89 non.sign.
Slovakia 7.47 7.22 7.02 -0.25 -0.20 7.06 7.36 6.00 0.29 -1.35
Slovenia 7.17 6.86 6.61 -0.32 -0.25 7.41 7.45 7.08 non.sign. -0.36
Average 7.44 7.21 7.18 -0.27 -0.33 7.26 7.48 7.15 0.34 -0.38
Note: Countries marked with an asterisk (*) should exercise caution when interpreting estimates, as they may not fully meet one or more PISA sampling standards

World Happiness Report 2024
79
Table 3.1: Regional and country trends at age 15 in PISA (2015-18-22) and
HBSC (2013/14-17/18-21/22) continued
PISA (Age 15) HBSC (Age 15)
Country means Trends Country means Trends
Country 2015 2018 2022 2015–18 2018–22 2013/14 2017/18 2021/22 2013/14–17/18 2017/18–21/22
CIS
Armenia 8.19 8.06 8.15 non.sign. non.sign.
Azerbaijan 7.83
Baku (Azerbaijan) 6.80
Georgia 7.62 7.57
Kazakhstan 8.41 8.18 7.97 -0.21
Kyrgyzstan 7.95
Republic of Moldova 7.01 7.87 7.85 7.70 non.sign. -0.15
Russia 7.76 7.32 -0.44 6.94 6.92 non.sign.
Tajikistan 8.00
Ukraine 7.31 7.34 non.sign.
Uzbekistan 8.20
Average 7.76 7.32 7.61 -0.44 7.58 7.68 7.95 -0.18
North America and ANZ
Canada 7.18 6.98 6.63 -0.19 -0.36
New Zealand* 6.27
U.S.* 7.36 6.75 -0.60
Average 7.36 6.75 6.27 -0.60 7.18 6.98 6.63 -0.19 -0.36
Middle East and North Africa
Israel 7.56 7.47 non.sign.
Jordan 6.77
Morocco 6.76
Qatar 7.41 6.84 6.77 -0.56 non.sign.
Saudi Arabia 7.36
Tunisia 6.90
Turkey 6.12 5.62 4.90 -0.50 -0.72 6.09
United Arab Emirates 7.30 6.88 6.85 -0.42 non.sign.
Average 6.93 6.45 6.57 -0.49 -0.72 7.56 6.78
Latin America and the Caribbean
Argentina 6.69
Brazil 7.59 7.05 6.85 -0.53 -0.21
Chile 7.37 7.03 6.41 -0.34 -0.62
Colombia 7.88 7.62 6.96 -0.27 -0.66
Costa Rica 8.21 7.96 7.32 -0.25 -0.64
Dominican Republic 8.50 8.09 7.44 -0.41 -0.65
El Salvador 7.40
Guatemala 7.72
Jamaica* 5.83
Mexico 8.27 8.11 7.26 -0.16 -0.85
Panama* 7.04
Paraguay 7.32
Peru 7.50 7.31 6.37 -0.19 -0.94
Uruguay 7.70 7.54 7.03 -0.16 -0.50
Average 7.88 7.59 6.97 -0.29 -0.63
Note: Countries marked with an asterisk (*) should exercise caution when interpreting estimates, as they may not fully meet one or more PISA sampling standards

World Happiness Report 2024
80
Table 3.1: Regional and country trends at age 15 in PISA (2015-18-22) and
HBSC (2013/14-17/18-21/22) continued
PISA (Age 15) HBSC (Age 15)
Country means Trends Country means Trends
Country 2015 2018 2022 2015–18 2018–22 2013/14 2017/18 2021/22 2013/14–17/18 2017/18–21/22
East Asia
China (B-S-J-G) 6.83
Hong Kong* 6.48 6.27 6.49 -0.20 0.22
Japan 6.80 6.18 6.76 -0.62 0.58
Macau 6.59 6.07 6.41 -0.52 0.34
Mongolia 7.20
South Korea 6.36 6.52 6.36 0.15 -0.16
Taiwan 6.59 6.52 6.85 non.sign. 0.33
Average 6.61 6.31 6.68 -0.30 0.26
Southeast Asia
Brunei Darussalam 5.86
Cambodia 7.65
Indonesia 7.22
Malaysia 7.04 6.63 -0.40
Philiphines 6.97
Thailand 7.71 7.64 7.12 non.sign. -0.51
Vietnam 7.35
Average 7.71 7.34 6.97 -0.46
Note: Countries marked with an asterisk (*) should exercise caution when interpreting estimates, as they may not fully meet one or more PISA sampling standards
image TK
Photo Artur Rekstad on Unsplash

World Happiness Report 2024
81
Table 3.2A: Adolescent life satisfaction in Western Europe, by country and age
GWP PISA HBSC CW
2020/22 2022 2021/22 2021/22 2021/22 2020/22 2020/22
Age 15-24 Age 15 Age 15 Age 13 Age 11 Age 12-13 Age 10-11
Austria 7.34 6.69 7.20 7.70 8.36
Belgium 6.95 8.05 8.27
Belgium (Flemish) 7.46 7.78 8.05
Belgium (French) 6.81 7.20 7.80
Cyprus 6.88 7.45 7.99 8.46 9.28
Denmark 7.45 7.19 7.10 7.32 7.76
Finland 7.41 7.41 7.46 7.66 8.13 8.69 8.78
France 6.83 6.77 6.91 7.16 7.68
Germany 6.58 6.51 7.12 7.50 8.17 7.41 8.11
Greece 6.66 6.62 6.70 7.09 8.43
Greenland 6.66 6.78 6.98
Iceland 7.76 6.90 7.12 7.28 7.79
Ireland 7.08 6.59 6.22 6.87 7.73
Italy 6.71 6.53 6.55 7.16 7.55 8.71 9.13
Luxembourg 7.12 7.10 7.46 8.12
Malta 6.69 6.24 6.48 7.00 7.81
Netherlands 7.30 7.29 6.90 7.22 7.95
Norway 7.28 7.05 7.24 7.67
Portugal 6.83 7.06 7.05 7.54 8.21
Spain 6.46 6.88 6.77 7.13 8.25
Spain (Catalonia only) 8.18 8.88
Sweden 7.24 6.91 6.80 6.91 7.83
Switzerland 7.06 6.99 7.21 7.95
U.K. (England) 6.01 6.51 6.89 7.37
U.K. (North Ireland) 6.50
U.K. (Scotland) 6.48 6.66 6.97 7.64
U.K. (Wales) 6.16 6.61 7.09 7.70 7.76 8.52
U.K. 6.92 6.07
Table 3.2B: Adolescent life satisfaction in Central and Eastern Europe, by country and age
GWP PISA HBSC CW
2020/22 2022 2021/22 2021/22 2021/22 2020/22 2020/22
Age 15-24 Age 15 Age 15 Age 13 Age 11 Age 12-13 Age 10-11
Albania 6.51 8.01 8.14 8.67 9.18 8.51 9.16
Bosnia and Herzegovina 6.88
Bulgaria 6.29 7.04 7.10 7.34 7.64
Croatia 7.51 7.37 7.57 7.91 8.47 8.50 9.03
Czech Republic 7.17 6.56 7.26 7.51 8.04
Estonia 6.79 6.91 6.95 7.26 7.91 8.00 8.53
Hungary 7.03 7.21 6.99 7.33 7.92
Kosovo 6.94 7.87
Latvia 6.86 6.76 6.73 7.06 7.64
Lithuania 7.39 7.14 6.95 7.21 7.71
Montenegro 6.56 7.52
North Macedonia 6.58 7.65 7.42 7.79 8.42
Poland 6.55 6.26 6.20 6.28 7.06
Romania 7.62 7.53 7.76 8.06 8.67 9.00 9.09
Serbia 7.53 7.48 7.89 8.30 8.84
Slovak Republic 6.70 7.02 6.00 6.28 6.91
Slovenia 7.17 6.61 7.08 7.34 8.05

World Happiness Report 2024
82
Table 3.2C: Adolescent life satisfaction in Commonwealth of Independent States,
by country and age
GWP PISA HBSC CW
2020/22 2022 2021/22 2021/22 2021/22 2020/22 2020/22
Age 15-24 Age 15 Age 15 Age 13 Age 11 Age 12-13 Age 10-11
Armenia 6.16 8.15 8.52 8.80
Azerbaijan 5.34
Azerbaijan (Baku) 6.80
Georgia 6.08 7.62
Kazakhstan 6.52 8.41 7.97 8.30 8.49
Kyrgyz Republic 6.15 7.95 8.30 8.60
Moldova, Republic of 6.94 7.01 7.70 8.02 8.47
Russian Federation 6.34 7.76
Tajikistan 5.61 8.00 8.07 8.10
Ukraine 6.23
Uzbekistan 5.98 8.20
Table 3.2D: Adolescent life satisfaction in East Asia, by country and age
GWP PISA HBSC CW
2020/22 2022 2021/22 2021/22 2021/22 2020/22 2020/22
Age 15-24 Age 15 Age 15 Age 13 Age 11 Age 12-13 Age 10-11
China, People's Republic of 6.05
Hong Kong S.A.R. of China 5.33 6.49 7.74 7.55
Japan 6.51 6.76
Macao S.A.R. of China 6.41
Mongolia 5.94 7.20
South Korea 6.59 6.36 7.36
Taiwan Province of China 7.12 6.85 7.80 7.91
Table 3.2E: Adolescent life satisfaction in Latin America and Caribbean region,
by country and age
GWP PISA HBSC CW
2020/22 2022 2021/22 2021/22 2021/22 2020/22 2020/22
Age 15-24 Age 15 Age 15 Age 13 Age 11 Age 12-13 Age 10-11
Argentina 6.55 6.69
Bolivia 6.23
Brazil 6.46 6.85
Chile 6.65 6.41 7.76 8.44
Colombia 5.95 6.96 8.82
Costa Rica 6.93 7.32
Dominican Republic 6.38 7.44
Ecuador 6.40
El Salvador 6.72 7.40
Guatemala 6.65 7.72
Honduras 6.47
Jamaica 5.81 5.83
Mexico 6.77 7.26
Nicaragua 6.84
Panama 6.94 7.04
Paraguay 6.18 7.32
Peru 6.23 6.37
Uruguay 6.77 7.03
Venezuela 5.59

World Happiness Report 2024
83
Table 3.2F: Adolescent life satisfaction in Middle East and North Africa,
by country and age
GWP PISA HBSC CW
2020/22 2022 2021/22 2021/22 2021/22 2020/22 2020/22
Age 15-24 Age 15 Age 15 Age 13 Age 11 Age 12-13 Age 10-11
Algeria 5.54 8.15 7.94
Bahrain 6.52
Egypt 4.38
Iran 5.46
Iraq 5.61
Israel 7.98 8.58 8.78
Jordan 4.86 6.77
Kuwait 7.39
Lebanon 2.93
Libya 5.93
Morocco 5.34 6.76
Palestine, State of 5.25
Qatar 6.77
Saudi Arabia 6.45 7.36
Tunisia 4.87
Turkish Republic
of Northern Cyprus
5.32
Türkiye, Republic of 5.07 4.90 7.28 8.11
United Arab Emirates 6.54 6.85
Yemen 3.93
Table 3.2H: Adolescent life satisfaction in South Asia, by country and age
GWP PISA HBSC CW
2020/22 2022 2021/22 2021/22 2021/22 2020/22 2020/22
Age 15-24 Age 15 Age 15 Age 13 Age 11 Age 12-13 Age 10-11
Afghanistan 1.96
Bangladesh 4.72 7.55 7.66
India 4.33
Nepal 5.67
Pakistan 5.17
Sri Lanka 4.80 8.22 7.96
Table 3.2G: Adolescent life satisfaction in North America and ANZ, by country and age
GWP PISA HBSC CW
2020/22 2022 2021/22 2021/22 2021/22 2020/22 2020/22
Age 15-24 Age 15 Age 15 Age 13 Age 11 Age 12-13 Age 10-11
Australia 6.94
Canada 6.70 6.63 7.00 7.54
New Zealand 6.85 6.27
U.S. 6.61

World Happiness Report 2024
84
Table 3.2I: Adolescent life satisfaction in Southeast Asia, by country and age
GWP PISA HBSC CW
2020/22 2022 2021/22 2021/22 2021/22 2020/22 2020/22
Age 15-24 Age 15 Age 15 Age 13 Age 11 Age 12-13 Age 10-11
Brunei Darussalam 5.86
Cambodia 4.62 7.65
Indonesia 5.81 7.22 8.12 8.46
Lao P.D.R. 4.90
Malaysia 6.41 6.63
Myanmar 4.40
Philippines 6.12 6.97
Singapore 6.45
Thailand 6.75 7.12
Vietnam 6.06 7.35
Table 3.2J: Adolescent life satisfaction in Sub-Saharan Africa, by country and age
GWP PISA HBSC CW
2020/22 2022 2021/22 2021/22 2021/22 2020/22 2020/22
Age 15-24 Age 15 Age 15 Age 13 Age 11 Age 12-13 Age 10-11
Benin 4.52
Botswana 4.09
Burkina Faso 4.98
Cameroon 5.36
Chad 4.56
Comoros 4.01
Congo 5.78
Congo, Democratic Republic of the 3.37
Côte d'Ivoire 5.32
Eswatini 3.84
Ethiopia 4.48
Gabon 5.52
Gambia 4.52
Ghana 4.84
Guinea 5.05
Kenya 4.78
Lesotho 3.80
Liberia 4.73
Madagascar 4.17
Malawi 3.83
Mali 4.47
Mauritania 4.61
Mauritius 6.03
Mozambique 5.32
Namibia 5.05
Niger 4.63
Nigeria 5.28
Senegal 5.06
Sierra Leone 3.19
South Africa 5.75 8.60 8.86
Tanzania 4.15
Togo 4.34
Uganda 4.69
Zambia 4.09
Zimbabwe 3.77

World Happiness Report 2024
85
Fig. 3.3: Life satisfaction declines throughout early-to-middle adolescence
(HBSC 2021/22), by gender
5.5
6.5
7.5
8.5
9.5
5.5
6.5
7.5
8.5
9.5
5.5
6.5
7.5
8.5
9.5
5.5
6.5
7.5
8.5
9.5
Age 11 Age 13 Age 15
Western Europe
Male
Female
Age 11 Age 13 Age 15
North America (Canada only)
Male
Female
Age 11 Age 13 Age 15
Commonwealth of Independent States
Male
Female
Age 11 Age 13 Age 15
Male
Female
Central and Eastern Europe
World Happiness Report 2024
86
have been explored in some of the previous
analyses, and further insights are provided in the
correlational analysis presented in this section.
Middle-to-Late Adolescence (Age 15-24):
Gallup World Poll
The correlational analysis of GWP data (age
15-24) considers all the countries where data
were collected in 2022, and delves into socio-
demographic factors (gender, rural/urban
residence, household income, and country GDP)
and 10 items on satisfaction with different aspects
of life.49 This analysis is summarized in Table 3.3,
which shows the results for Model 1 (socio-demo-
graphic factors only) and Model 2 (10 satisfaction
items, controlling for socio-demographic factors).
Separate analyses by GDP levels are available in
Tables A1.7.A-D in Appendix 1.
Inequalities Across Socio-Demographic Groups
On average, females report a life satisfaction
0.09 points higher than males (Table 3.3), and
this gap is larger in lower-income countries, with
no gender differences noted in high-income
countries (Tables A1.7.A-D in Appendix 1). Similarly,
life satisfaction is -0.10 points lower in rural
communities compared to urban ones, and this
gap is larger in lower-income countries, with no
differences observed in high-income countries.
Additionally, compared to those in the first
(lowest) quintile of the country’s household
income distribution, those in the third, fourth,
and fifth (highest) quintiles report 0.16, 0.30, and
0.43 points higher life satisfaction respectively,
with smaller effects in high-income countries than
lower-income ones. Moreover, compared to
residents of high-income countries, those in
upper-middle-, lower-middle-, and low-income
countries report -0.63, -1.74, and -2.91 points
lower life satisfaction respectively. This associa-
tion can also be visualized in Table A1.7.A-D in
Appendix 1, which ranks all countries by GDP.
Chapter 2 of this World Happiness Report
presents a similar analysis for those aged 15-29,
including a broader range of correlates. This
analysis suggests that the relative importance of
household income diminishes when controlling
for other important factors.50
Malta, Poland, and Slovakia. HBSC and Children’s
Worlds data also show that regional and country
differences decrease in younger children and
adolescents.
Finally, it is also evident that younger children
and adolescents consistently report higher life
satisfaction than their older counterparts, illustrating
an early start to the decline from childhood to
middle age. Figure 3.3 shows the decline from age
11 to 15 in HBSC data, indicating a larger decline
among females, particularly between age 11 and
13, with some variation across regions. Including
data from the other three studies, Tables 3.2A-J
shows that this declining pattern is evident from
age 10 to 15 in all countries, and continues into
late adolescence (age 15-24) in most of them. The
decline from age 10-12 to age 15-24 is remarkably
larger in lower-income countries. This is observed
in the lowest-income countries with available
data, including Algeria, Turkey, Bangladesh, Sri
Lanka, Tajikistan, Indonesia and South Africa. In
contrast, in many Western countries (mostly in
Europe), there is no further decline at age 15-24,
and in some of them (notably, Iceland, Ireland,
Sweden, and the U.K.), there seems to be higher
life satisfaction at age 15-24 than at age 15.
Adolescent Well-Being Inequalities
and Correlates
To offer a more comprehensive view of the
current global state of child and adolescent
well-being, we enhance the preceding analyses
on subjective well-being levels and trends by
presenting a series of correlational analyses.
Using data from the GWP and PISA, we examine
subjective well-being inequalities across socio-
demographic groups, and life domain factors
explaining variation in adolescent subjective
well-being. Inequalities across gender and age
PISA 2022 data reveals the
highest life satisfaction for
individuals aged 15 is found in
Central and Eastern Europe.

World Happiness Report 2024
87
Satisfaction with Different Aspects of Life
Life satisfaction tends to be higher amongst
those who report being satisfied with: standards
of living, the city or region they reside in, oppor-
tunities for social interactions and friendships in
their city or area, accessibility of quality healthcare
services in their city or area, availability of good
and affordable housing in their city or area, and
the public transportation system. Satisfaction
with standards of living has – by far – the most
significant impact on life satisfaction, emphasizing
the role of material well-being. In contrast, statis-
tically significant associations (p<0.05) are not
found for the quality of roads, air quality, water
quality, and the quality of the schools and education
system within their city or area.
Separate analyses by GDP levels reveal additional
insights:
• In upper-middle-income countries, there are no
statistically significant associations (p<0.05)
between life satisfaction and satisfaction with
the public transportation system and access to
quality healthcare.
• In lower-middle-income countries, there are no
statistically significant associations (p<0.05)
between life satisfaction and satisfaction with
the public transportation system, access to
quality healthcare and opportunities to meet
people and make friends. In contrast, there is an
association with satisfaction with the education
system/schools.
• In low-income countries, there are no statistically
significant associations (p<0.05) between life
satisfaction and satisfaction with the public
transportation system, opportunities to meet
people and make friends, and the city/area of
residence. In contrast, there is an association
with satisfaction with water quality and the
education system/schools.
Table 3.3: Correlates of life satisfaction. Gallup World Poll 2022 (age 15-24)
Model 1 Model 2
S.E. S.E.
Socio-demographic factors
Gender (ref.: male)
Female 0.09 ** 0.03 0.12 *** 0.03
Urban/rural residence (ref.: urban residence)
Rural residence -0.10 ** 0.03 -0.08 ** 0.03
Household income (ref.: lowest 20%)
Second 20% 0.04 0.04 0.03 0.05
Middle 20% 0.16 *** 0.04 0.11 *0.05
Fourth 20% 0.30 *** 0.04 0.24 *** 0.05
Highest 20% 0.43 *** 0.05 0.33 *** 0.05
Country's economic development (ref.: high-income countries)
Upper middle-income countries -0.63 *** 0.04 -0.40 *** 0.04
Lower middle-income countries -1.74 *** 0.04 -1.40 *** 0.04
Low-income countries -2.91 *** 0.05 -2.07 *** 0.06
10 satisfaction items
Satised with the public transportation system in your city/area 0.08 *0.03
Satised with the roads and highways in your city/area -0.04 0.03
Satised with the quality of air in your city/area 0.03 0.04
Satised with the quality of water in your city/area 0.02 0.04
Satised with the availability of affordable housing in your city/area 0.20 *** 0.03
Satised with the education system/schools in your city/area 0.07 0.04
Satised with the quality healthcare in your city/area 0.24 *** 0.04
Satised with opportunities to meet people and make friends in your city/area 0.28 *** 0.04
Satised with the city/area where you live 0.37 *** 0.04
Satised with your standard of living (things you can buy and do) 1.42 *** 0.04
Note. Signicance Levels: * 0.05 ** 0.01 *** 0.001. Model 1: R2= 0.15; N=25,877, p<.001. Model 2: R2= 0.25; N=22699, p<.001

World Happiness Report 2024
88
Middle Adolescence (Age 15): PISA
Similar to the GWP correlational analysis, the
correlational analysis of PISA 2022 data (age 15)
examines inequalities across socio-demographic
groups (gender, rural/urban residence, household
possessions, and economic development of the
country of residence) and 10 items on satisfaction
with different aspects of life. The results are
presented in Table 3.4. Model 1 examines socio-
demographic factors in the 74 countries and
territories with available life satisfaction data,
and Model 2 examines the 10 satisfaction items –
controlling for socio-demographic factors – in the
13 countries where these data were collected (Brazil,
Hong Kong, Hungary, Ireland, Macau, Mexico, the
Netherlands, New Zealand, Panama, Saudi Arabia,
Slovenia, Spain, and the United Arab Emirates).
Inequalities Across Socio-Demographic Groups
On average, life satisfaction is -0.78 points lower
among females than males. This contrasts with
findings at age 15-24 showing higher life satisfaction
among females than males since 2014 globally
(see Figure 3.1B and Table 3.4). This could largely
be explained by the focus on mostly high-income,
Western countries in the available data. Indeed,
GWP results at age 15-24 show no gender
differences (p<0.05) in high-income countries
(Table A1.7A in Appendix 1). Evidence from HBSC
(Table A1.4 and Figure A1.4 in Appendix 1), and
Children’s Worlds (Table A1.5 in Appendix 1) from
mainly high-income Western countries shows that
the gender gap is rarely observed at age 10-11,
tends to become noticeable from age 12, and
widens at age 13-15.
Similarly, life satisfaction is lower in more
populated areas compared to more rural areas.
The GWP analysis at age 15-24 reveals the
opposite pattern globally, but no statistically
significant differences in high-income countries
(Table A1.7A in Appendix 1). This suggests again
that these differences could partly be explained
by the different nature of countries collecting
PISA and GWP data.
Moreover, compared to those in the lowest
quintile of the household possessions distribution
within each country, those in higher quintiles
report increasingly higher life satisfaction. By
contrast, there is a negative association between
the level of economic development in the country
of residence (log GDP)51 and life satisfaction. This
association is also illustrated in Table A1.7 in
Appendix 1, which ranks all countries by GDP. This
table shows a distinct pattern at age 15-24, when
a clear positive association is evident, compared
to age 10-15, when no clear association is
observed, arguably due in part to the nature of
participating countries in each study.
Satisfaction with Different Aspects of Life
The 10 satisfaction items analysis in Model 2
shows that, compared to those who report not
being satisfied, life satisfaction is higher among
those who report being satisfied with their body
image (1.02 points), their relationship with their
parents (1.01 points), their life at school (0.88
points), their health (0.57 points), their use of
their time (0.56 points), their neighborhood
(0.24 points), and what they learn at school
(0.13 points). Interestingly, differences are not
Photo Muhammad Taha Khan on Unsplash

World Happiness Report 2024
89
statistically significant (p<0.05) for satisfaction
with the things you have (material well-being), and
a small negative association is found for satisfaction
with the friends you have (-0.05 points) and
relationships with teachers (-0.11 points). These
results (especially those involving a small effect
size) are to be interpreted with caution given the
small number of countries considered in Model 2
due to data availability limitations.
Discussion
The analyses presented in this chapter have
provided insights into the state of child and
adolescent subjective well-being and the key data
limitations affecting the field. These are discussed
below. We also present a discussion on the
necessary steps to collectively enhance the
well-being of children and adolescents globally.
Main Findings
Life Satisfaction Levels
In the post-pandemic world, the life satisfaction of
those aged 10-15 tends to be the highest in Central
and Eastern Europe (notably in the Balkans), and
the CIS, and the lowest in East Asia, North America
and ANZ, and MENA. However, it is important to
note that, for this age group, data is only available
in some world regions, including mostly high-
income countries. Cross-country inequalities
among younger adolescents (age 10-15) are smaller
compared to older adolescents (age 15-24).
Table 3.4: Correlates of life satisfaction. PISA (age 15)
Model 1 Model 2
S.E. S.E.
Socio-demographic factors
Gender (ref.: male)
Female -0.78 *** 0.01 -0.51 *** 0.01
Urban/rural residence (ref.: population of +10 million people)
1 million to 10 million 0.02 0.03 -0.09 *0.04
100,000 to 1 million 0.26 *** 0.03 -0.02 0.04
15,000 to 100,000 0.34 *** 0.03 0.02 0.04
3,000 to 15,000 0.55 *** 0.03 0.07 0.04
Less than 3,000 0.62 *** 0.03 0.05 0.05
Household possessions (ref.: lowest 20%)
Second 20% 0.17 *** 0.02 0.20 *** 0.02
Middle 20% 0.27 *** 0.02 0.28 *** 0.03
Fourth 20% 0.39 *** 0.02 0.40 *** 0.04
Highest 20% 0.50 *** 0.02 0.49 *** 0.05
Log GDP -0.04 *** 0.01
10 satisfaction items
Satised with your health 0.57 *** 0.02
Satised with the way you look 1.02 *** 0.02
Satised with what you learn at school 0.13 *** 0.02
Satised with the friends you have -0.05 *0.03
Satised with the neighbourhood you live in 0.24 *** 0.02
Satised with all the things you have 0.02 0.03
Satised with how you use your time 0.56 *** 0.02
Satised with the relationship with your parents/guardians 1.01 *** 0.02
Satised with your relationships with your teachers -0.11 *** 0.02
Satised with your life at school 0.88 *** 0.02
Note. Signicance Levels: * 0.05 ** 0.01 *** 0.001. Model 1 (43 countries): R2 = 0.03; N=295,345, p<.001. Model 2 (13 countries):
R2 = 0.25; N=92,666, p<.001. GDP= Gross Domestic Product per capita, constant prices. We follow World Bank Analytical
Classications (GNI per capita in US$; Atlas methodology (World Bank, n.d.)), to categorize countries as high-income, upper
middle-income, lower middle-income and low-income.

World Happiness Report 2024
90
For those aged 15-24, global data is available and
the highest life satisfaction is observed in Israel,
Northern Europe and some Central and Eastern
European countries, and the lowest in Sub-Saha-
ran Africa and South Asia. This contrasts with the
adult ranking in Chapter 2, where most Central
and Eastern European countries rank much lower,
and life satisfaction in North America and ANZ
and Western Europe is much higher compared to
other regions. These differences have been
shaped by distinct trends for these age groups
observed in the last 15 years.
Trends in Middle-to-Late Adolescence
In middle-to-late adolescence (age 15-24), there
was a positive 2006-2019 global trend in life
satisfaction, in line with adult trends, which ended
with the pandemic, in line with adult trends.
Global trends mask regional trends – which, at the
same time, mask sub-regional and national trends
Photo Aditya Enggar Perdana on Unsplash

World Happiness Report 2024
91
– that do not always match adult trends. Our
results suggest that the widely reported
pre-COVID-19 declines in young people’s subjec-
tive well-being observed across countries52 may
concentrate in those regions that tend to collect
data systematically (e.g. North America and
Western Europe), as well as in other regions such
as the MENA and South Asia. However, when
young people from (almost) the whole world are
considered, these negative trends start to look
less global as positive trends are observed in
Sub-Saharan Africa, Central and Eastern Europe,
the CIS, Latin America and the Caribbean, and
Southeast Asia. As a result of these trends, while
life satisfaction for those aged 15-24 and adults
was the highest in Western Europe, and North
America and ANZ in the late 2000s, in 2022 this
held true only for adults, while for those aged
15-24 life satisfaction was on par and not higher
compared to Central and Eastern Europe, and
Latin America and the Caribbean.
Trends in Early-to-Middle Adolescence
In early-to-middle adolescence (age 10-15),
assessments of global trends are not possible as
data is only available mostly in high-income,
Western countries. PISA, HBSC and Children’s
Worlds data show substantial post-COVID-19
declines in almost all of the countries analyzed,
which tend to be more severe among females
and older adolescents. However, as opposed
to declines in (mostly) Western countries, increases
are observed in most East Asian countries at
age 15.
While there seems to be robust evidence regarding
post-pandemic trends, evidence is more mixed
with regards to pre-pandemic trends, including
some discrepancies between HBSC and PISA at
age 15. Contrasting results emerge in many
Western European nations and almost all the
Central and Eastern European countries examined
at age 15 in the 5-6 years preceding the COVID-19
pandemic. These discrepancies highlight the
need for caution when interpreting trends for this
age group only on the basis of evidence from
international studies in the absence of further
evidence from national studies (see Appendix 2).
This speaks of the need to address shortcomings
in the available international data, which is
discussed in the next section. Despite discrepancies
affecting some countries and regions, there is
consistent evidence in others, including declines
in North America (Canada, and the U.S.), some
Western European countries (e.g. Austria, Iceland,
Ireland, and the Netherlands), and two MENA
countries (Turkey and Israel), which are largely
driven by female declines. Canada emerges as
the country with the longest female decline in
the available data, which started in the early
2010s, and is still ongoing. In contrast, HBSC
data (age 11, 13, 15) shows evidence of positive
trends in some countries in Central and Eastern
Europe (Estonia, Latvia, Croatia) in the 2000s
and early 2010s.
Age Decline
Consistent with existing literature,53 we find life
satisfaction declines from childhood through
adolescence into adulthood. This decline is more
pronounced among females and in lower-income
countries. From age 15 to 24, declines are not
observed in multiple European countries, and
increases are observed in some of them. Moreover,
although adults tend to report lower life satisfaction
than adolescents, the gap between those aged
15-24 and those 25 and older is contracting in
Western Europe and reversing in North America,
juxtaposed with a widening gap in Sub-Saharan
Africa.
Gender Differences
Also consistent with prior research,54 we observe
no gender differences at age 10-11, but females
start to report lower life satisfaction than males at
around age 12 and the gap further expands from
age 13 to 15. This gender gap has widened after
the pandemic. In contrast, when moving from
analyses in early-to-middle adolescence (age
10-15) in mostly high-income, Western countries,
to global analyses in middle-to-late adolescence
(age 15-24), a distinct picture emerges. Our global
analyses show no gender differences between
2006 and 2013 at age 15-24, but that females
started reporting higher life satisfaction than
males from 2014. The global gender gap has
narrowed after the pandemic. Regional analyses
at age 15-24 show that gender differences are
small or non-existent in most world regions
World Happiness Report 2024
92
during most years in the 2006-2022 series,
with the notable exception of the MENA, where
females consistently report higher life satisfaction
than males. In 2022, this gender gap favoring
females over males was more pronounced in
lower-income countries, with no gender differences
observed in high-income countries.
Other Inequalities
Beyond the gender, age and geographic
inequalities discussed above, the correlational
analysis in middle-to-late adolescence (age 15-24)
shows higher life satisfaction in urban areas than
in rural areas. However, this is not observed in
high-income countries or in early-to-middle
adolescence (age 15), where data was collected
mainly in high-income nations.
We also find that the higher the country’s GDP
the higher the average life satisfaction in middle-
to-late adolescence (age 15-24), which contrasts
with findings in early-to-middle adolescence (age
10-15), where no association is observed at age
10-12, and a paradoxical negative association is
found at age 15.55 Recent evidence suggests
this contradiction may stem from limited data
collection in non-high-income countries in
early-to-middle adolescence because when
adolescents from these countries are considered,
a positive association is observed in middle
adolescence (age 15-17). Notably, this association
is stronger in lower-income countries for
adolescents but this pattern reverses with age
in adulthood.56
Correlates of Life Satisfaction
The correlational analyses presented in this
chapter using GWP data in middle-to-late adoles-
cence (age 15-24) underscore the significance of
socio-economic indicators not only at the national
level (GDP) but also at the household (household
income quintile within each country) and individual
levels (satisfaction with living standards). Among
the life domain factors examined, satisfaction
with living standards emerges as the strongest
correlate of life satisfaction by far. Moreover,
we find differences across levels of economic
development again. For instance, satisfaction with
schools and the education system is positively
associated with life satisfaction in lower middle-
and low-income countries, but not in upper
middle- and high-income countries. The
correlational analysis in middle adolescence
(age 15) highlights the importance of body image,
relationships with parents, school life, health, and
time-use to the life satisfaction of 15-year-olds,
although this is only reflective of the 13 countries
that collected these data in PISA 2022, which
limits the generalizability of these results.
Several of the above findings underscore disparities
when considering adolescents from lower-income
countries and regions with limited subjective
well-being data, challenging prevailing literature
largely derived from high-income, Western
countries. Given that the majority of our under-
standing of child and adolescent subjective
well-being stems from data in these more affluent
Western contexts, the implications are substantial
for global initiatives aimed at enhancing the
well-being of children and young people worldwide.
These and other data limitations are discussed next.
Addressing Limitations in International Data
on Child and Adolescent Well-Being
The existing data limitations represent a substantial
challenge in generating evidence-based insights
to advance the well-being of children and adoles-
cents on a global scale. Despite substantial efforts
in the past 15 years to enhance data availability
across countries, a considerable gap persists in
global data for children and adolescents compared
to adults. This chapter has shone some light on
the key gaps and limitations in international data,
together with some other data issues (see Appendix
2) that warrant attention. The main limitations are:
• The absence of a common subjective well-
being measure. Establishing at least one identical
subjective well-being item in each survey would
facilitate data comparability across children’s,
adolescents’, and adults’ subjective well-being.
Females start to report lower
life satisfaction than males at
around age 12 and the gap further
expands between age 13 to 15.

World Happiness Report 2024
93
This becomes crucial in the absence of large
international panel surveys exploring well-being
from childhood to adulthood globally.
• The limited number of subjective well-being
measures. Since the existing surveys, on the
whole, are not primarily subjective well-being
focused – with the exception of Children’s
Worlds – they tend to only include one aspect
of subjective well-being, predominantly overall
life satisfaction, usually measured using a single
item. It would be advantageous to have the
capacity to explore affect and eudaimonia in
the child and adolescent surveys to give us a
more nuanced understanding of how the three
components interact in global samples, compa-
rable with what exists in the literature on adults.
It is also important to improve data availability
on drivers of subjective well-being to be able to
rigorously examine what explains variations in
subjective well-being levels and trends – and
among whom.
• The ages of the samples. No one dataset spans
across the range of middle-childhood (when
self-report measures become reliable, at around
age 8) to late-adolescence (at the upper bound,
age 24), nor into adulthood. Moreover, data
from representative samples in late adolescence
(age 16-24) is lacking. This means that comparing
across ages and exploring how subjective
well-being changes globally over time is limited
to using multiple datasets, which are not
consistent and comparable.
• Data in early-to-middle adolescence (age
10-15) is only available in high- and upper
middle-income countries, mostly in the
Western World. This is largely due to the fact
that gaining access to children in lower-income
countries is challenging, expensive, and time
consuming for researchers.57 School is a
common point of access for researchers to
survey children across the world, and children
in lower-income countries have less access to
schooling and are less likely to attend for a
myriad of reasons.58 The findings in this chapter
referring to early-to-middle adolescents (age
10-15), and those from the existing literature,
largely represent what we find in high-income,
and a few middle-income countries. As noted,
there is recent evidence suggesting that, when
adolescents from lower-income countries are
considered, findings may contradict the existing
literature from higher-income countries.59 This
is troubling, as it means that children and
adolescents across the largest parts of the
world, who arguably need the most support,
are not represented in global samples, which
prevent us from reaching a better understanding
on how we can promote their well-being.
Promoting the Well-Being of Children and
Adolescents Globally
It is evident that for younger populations
international data collection and availability are
lagging due to a variety of difficulties in collecting
data from younger people. However, there is a
global appetite for improving data collection and
Photo Andrej Lisakov on Unsplash
World Happiness Report 2024
94
assessment to enhance child and adolescent
well-being globally. This is being materialized in
efforts in three main areas.
Addressing Shortcomings in International Data
The four data providers whose data has been
used in this chapter have made huge efforts over
the last decade in expanding the number of
available measures (e.g. the OECD has included a
well-being questionnaire in the last two editions
of PISA), and the number of participating countries,
including more non-Western non-high-income
countries (e.g. HBSC, which began to collect data
in Central Asian countries in its latest wave, and has
a global Linked Projects initiative which enables
countries outside of Europe and North America
to collect comparable data using a common
protocol).60 Beyond these four studies, there are
some excellent initiatives making inroads at the
international level with the collection of data from
lower-income populations such as PISA for
Development by the OECD;61 and Multiple Indicator
Cluster Surveys (MICS) by UNICEF.62 In Europe,
there is ongoing work to conduct the first
cross-national birth cohort survey of child
well-being through GUIDE (Growing Up In Digital
Europe), supported by the Coordinate project.63
This project is mobilizing researchers and organi-
zations, fostering coordinated efforts to enhance
the harmonization and accessibility of international
survey data, specifically focusing on panel survey
data for examining the well-being of children and
young individuals as they grow up. This initiative
will contribute significantly to a key longer-term
goal in the field: obtaining more comparable
longitudinal data across countries to enable more
robust evidence on how to promote child and
adolescent well-being.
Improving Current Approaches to Assess Child
and Adolescent Well-Being Across Nations
Various international actors are leading the way
on this issue. For example, the OECD has estab-
lished a Child Well-Being Data Portal64 with data
from the major international surveys and a focus
on inclusivity, with consideration of inequalities
across relevant socio-demographic groups.
Moreover, OECD’s WISE Centre is updating the
‘Guidelines on Measuring Subjective Well-being’,
also among children and adolescents, with a
call for considering broader and more globally
inclusive measures.65 Similarly, UNICEF Innocenti
is expanding its work on child well-being in
high-income nations to include the views and
experiences of children living in lower-income
countries, where this type of work is far more
scarce.66 Moreover, the World Health Organisation,
in collaboration with the Partnership for Maternal,
Newborn and Child Health and United Nations
partners and together with the support of an
Expert Consultative Group, is developing an
adolescent well-being measurement approach for
use at global, regional, and country levels, with an
emphasis on existing data use and adolescent
and youth engagement.67 Apart from these
well-known international actors, other organizations
such as the Wellbeing for Planet Earth Foundation68
are working to establish a more inclusive and
global understanding of well-being by incorporating
cross-cultural perspectives.
From Data to Action
At the international level, the OECD has recently
published a report to facilitate the development
of policies aimed at enhancing child well-being,69
and UNICEF is working towards policy initiatives
to promote child well-being.70 At the national
level, South Korea is a good from-data-to-action
example. In its efforts to make children’s happi-
ness a national priority, South Korea aims to
integrate a child-centered perspective into all
government policy by using insights into child
and adolescent subjective well-being.71 An
The widely reported negative
trends in adolescent well-being
in Western Europe and North
America, supported by our
analysis, contrast with positive
pre-pandemic trends in regions
like Sub-Saharan Africa and
positive post-pandemic trends
in East Asia.

World Happiness Report 2024
95
important consideration is that initiatives such as
this require effective inter-sectoral collaborations
encompassing data collection, analysis, and
evidence-based responses, which may be difficult
to achieve at the national and international levels.
In certain contexts, regional or local cooperation
can be more feasible, particularly where regions
and local authorities wield influence over crucial
aspects of children’s lives, such as education
and social services. A pioneering project that
exemplifies the potential of such initiatives is
#BeeWell, a youth-centered programme led by
the University of Manchester, The Gregson Family
Foundation and Anna Freud, initially launched in
Greater Manchester, U.K., and now expanding to
other locations in England. This programme
brings together academic expertise, policy-
makers, and hundreds of local organizations
to make adolescents’ well-being everybody’s
business. Utilizing data from the #BeeWell survey
(co-produced with adolescents) and linked to
data from other sources, it offers schools and
local authorities personalized well-being
dashboards and advice to facilitate evidence-
based responses. #BeeWell provides valuable
insights into the efficacy of bottom-up approaches
for assessing and promoting child and adolescent
well-being. While focused on a Western socio-
cultural context, these insights can be applicable
to regions and countries facing challenges in
country-level initiatives, fostering progress across
diverse parts of the world.
Conclusions
There is a growing interest in improving child and
adolescent well-being globally. Despite notable
progress in research and data availability over the
past 15 years, along with recent ground-breaking
initiatives at regional, national, and international
levels, a significant data gap persists for children
and adolescents compared to adults. These
limitations prevent researchers from substantially
improving our understanding of how to promote
child and adolescent well-being worldwide.
This chapter outlines the crucial necessary next
steps to address existing data limitations: the use
of – at least one – standardized subjective well-
being measure(s) across the available international
studies, a broader age coverage from age 8 to late
adolescence and into adulthood, and collecting
data from more world regions, with particular
attention to improving data collection in middle-
and low-income countries.
The chapter aims to provide the most accurate
picture of the global state of child and adolescent
subjective well-being that is possible despite
existing data limitations. The analysis reveals a
nuanced picture: life satisfaction levels, trends,
and correlates vary across age, gender, world
regions, countries, and levels of economic
development. Notably, the analysis suggests that
shifting the focus from constantly surveyed
high-income countries in the Western World
reveals different patterns. For instance, the widely
reported negative trends in adolescent subjective
well-being (and related constructs) in Western
Europe and North America, supported by our
analysis, contrast with positive pre-pandemic
trends in regions like Sub-Saharan Africa and
positive post-pandemic trends in East Asia.
These and other findings presented in this
chapter underscore the importance of addressing
data limitations to understand what drives
positive and negative change – and among whom
– in different parts of the world.
World Happiness Report 2024
96
Endnotes
1 Batalle et al. (2019); Innocenti and Price (2005); Watson
et al. (2006)
2 Nelson et al. (2016); Sawyer et al. (2018)
3 Blakemore (2018); Foulkes et al. (2018); Giedd et al. (1999);
Tamnes et al. (2017); Vijayakumar et al. (2016)
4 Arian et al. (2013)
5 Sawyer et al. (2018)
6 Diener et al. (2002)
7 Huebner (2004)
8 Campbell et al. (2021); Fuhrmann et al. (2022); Orben and
Przybylski (2019); Stewart-Brown et al. (2009)
9 Aymerich et al. (2021); González-Carrasco et al. (2017);
Savahl et al. (2023)
10 Diener et al. (1999); Pavot and Diener (2004)
11 Savahl et al. (2021)
12 Bedin and Sarriera (2014); Casas (2011); Casas et al. (2012);
Clair (2012)
13 Bevans et al. (2010); Gilman and Huebner (2003); Lewis
et al. (2011)
14 Bevans et al. (2010); Riley (2004)
15 Levin and Currie (2014)
16 Cerna et al. (2023); Marquez and Main (2021); Weinstein
(2022)
17 Casas and Gonzále-Carrasco (2019); Goldbeck et al.
(2007); Orben et al. (2022)
18 Casas et al. (2014)
19 Marquez and Long (2021); The Children’s Society (2020)
20 Cosma et al. (2023); Savahl et al. (2022)
21 Cosma et al. (2023); Marquez and Long (2021)
22 Marquez and Long (2021)
23 Ben-Arieh (2008)
24 Clark et al. (2018)
25 De Neve and Oswald (2012)
26 Knies (2017); Main (2014)
27 Casas and González (2017); Marquez and Main (2020)
28 Azzopardi et al. (2019); Casas et al., 2018; Department for
Education (2022); OECD (2021)
29 Lee and Yoo (2015)
30 Bradshaw (2015)
31 Casas et al. (2022); Helliwell et al. (2023); Lee and Yoo
(2015)
32 Rudolf and Bethmann (2023)
33 Marquez et al. (2024)
34 Diener and Suh (2003); Helliwell et al. (2023)
35 Diener et al. (1999); Huebner (2004)
36 Helliwell et al. (2023)
37 Lucas and Diener (2009); Veenhoven (2008)
38 Casas (2016); Cummins (2016)
39 We follow World Bank Analytical Classications (GNI per
capita in US$; Atlas methodology (World Bank, n.d.)), to
categorize countries as high-income, upper middle-income,
lower middle-income and low-income. World Bank (n.d.).
World Bank Country and Lending Groups. Country
Classication. The World Bank. Accessible at:
https://datahelpdesk.worldbank.org/knowledgebase/
articles/906519-world-bank-country-and-lending-groups
40 Helliwell et al. (2019); Helliwell et al. (2020); Helliwell et al.
(2022)
41 Marquez and Long (2021)
42 Engel De Abreu et al. (2021); Pigaiani et al. (2020)
43 Engel De Abreu et al. (2021); Marquez and Long (2021)
44 Helliwell et al. (2022)
45 Helliwell et al. (2022)
46 See Chapter 2 of the current World Happiness Report
47 Casas and González-Carrasco (2019); Goldbeck et al.
(2007); Orben et al. (2022)
48 See Chapter 2 of the current World Happiness Report
49 Cummins (1996)
50 See Chapter 2 of the current World Happiness Report
51 PISA includes mostly high-income countries, so logGDP is
the only option.
GWP includes many high-, upper middle-, lower middle-,
and low-income countries, which allows for a more
nuanced comparison across GDP tiers. We believe this
is preferable to visualize the magnitude of well-being
inequalities across countries from different GDP tiers
compared to the other inequalities examined. This
approach also facilitates the discussion on the links
between GDP and life satisfaction (negative or non-existent
in high-income countries; positive everywhere else) and the
limitations on available data that explain counterintuitive
results found in the literature (Marquez et al., 2024).
52 Cosma et al. (2023); Due et al. (2019)
53 Daly (2022); Orben et al. (2022)
54 Chen et al. (2020); Orben et al. (2022);
55 Campbell et al. (2021); Rudolf and Bethmann (2023)
56 Marquez et al. (2024)
57 Byrne et al. (2021); Colom and Rohloff (2018)
58 Huisman and Smits (2009)
59 Marquez et al. (2024)

World Happiness Report 2024
97
60 Cosma et al. (2023); see Gallup World Poll retrieved from:
https://www.gallup.com/analytics/318875/global-research.
aspx ; see PISA Participants retrieved from:
https://www.oecd.org/pisa/aboutpisa/pisa-participants.
htm; see HBSC Participants retrieved from:
https://hbsc.org/network/countries/; see Children’s
Worlds retrieved from: https://isciweb.org/wp-content/
uploads/2019/12/Session1-ChildrensWorlds.pdf
61 OECD (2018)
62 See MICS by UNICEF retrieved from: https://mics.unicef.org/
63 See Coordinate Project retrieved from:
https://www.coordinate-network.eu/
64 See OECD retrieved from: https://www.oecd.org/els/
family/child-well-being/data/
65 Mahoney (2023); OECD (2017)
66 See UNICEF retrieved from: https://www.unicef.org/
health/child-and-adolescent-health-and-well-being;
Gramoda et al. (2020)
67 Guthold et al. (2023)
68 See Wellbeing for Planet Earth retrieved from:
https://www.globalwellbeinginitiative.org/about-us
69 OECD (2021)
70 See https://www.unicef.org/globalinsight/media/2116/le/
UNICEF-Global-Insight-Understanding-Child-Subjective-
Wellbeing-2021.pdf
71 OECD (2019)
World Happiness Report 2024
98
References
Anaya, L. M., & Zamarro, G. (2023). The role of student
effort on performance in PISA: Revisiting the gender gap
in achievement. Oxford Economic Papers, gpad018.
https://doi.org/10.1093/oep/gpad018
Anders, J., Has, S., Jerrim, J. et al. Is Canada really an
education superpower? The impact of non-participation on
results from PISA 2015. Educ Asse Eval Acc 33, 229–249 (2021).
https://doi.org/10.1007/s11092-020-09329-5
Andersson, C., & Sandgren Massih, S. (2023). PISA 2018: Did
Sweden exclude students according to the rules? Assessment
in Education: Principles, Policy & Practice, 30(1), 33–52.
https://doi.org/10.1080/0969594X.2023.2189566
Arain, M., Haque, M., Johal, L., Mathur, P., Nel, W., Rais, A.,
Sandhu, R., & Sharma, S. (2013). Maturation of the adolescent
brain. Neuropsychiatric Disease and Treatment, 9, 449–461.
https://doi.org/10.2147/NDT.S39776
Atasever, U., Jerrim, J., & Tieck, S. (2023). Exclusion rates
from international large-scale assessments: An analysis of
20 years of IEA data. Educational Assessment, Evaluation and
Accountability. https://doi.org/10.1007/s11092-023-09416-3
Aymerich, M., Cladellas, R., Castelló, A., Casas, F., & Cunill, M.
(2021). The Evolution of Life Satisfaction Throughout
Childhood and Adolescence: Differences in Young People’s
Evaluations According to Age and Gender. Child Indicators
Research, 14(6), 2347–2369. https://doi.org/10.1007/
s12187-021-09846-9
Azzopardi, P. S., Hearps, S. J. C., Francis, K. L., Kennedy, E. C.,
Mokdad, A. H., Kassebaum, N. J., Lim, S., Irvine, C. M. S., Vos, T.,
Brown, A. D., Dogra, S., Kinner, S. A., Kaoma, N. S., Naguib, M.,
Reavley, N. J., Requejo, J., Santelli, J. S., Sawyer, S. M., Skirbekk,
V., … Patton, G. C. (2019). Progress in adolescent health and
wellbeing: Tracking 12 headline indicators for 195 countries
and territories, 1990–2016. The Lancet, 393(10176), 1101–1118.
https://doi.org/10.1016/S0140-6736(18)32427-9
Ball, J., Grucza, R., Livingston, M., Ter Bogt, T., Currie, C., &
De Looze, M. (2023). The great decline in adolescent risk
behaviours: Unitary trend, separate trends, or cascade? Social
Science & Medicine, 317, 115616. https://doi.org/10.1016/
j.socscimed.2022.115616
Banks, J., & Smyth, E. (2015). ‘Your whole life depends on it’:
Academic stress and high-stakes testing in Ireland. Journal
of Youth Studies, 18(5), 598–616. https://doi.org/10.1080/
13676261.2014.992317
Batalle, D., O’Muircheartaigh, J., Makropoulos, A., Kelly, C. J.,
Dimitrova, R., Hughes, E. J., Hajnal, J. V., Zhang, H., Alexander,
D. C., Edwards, A. D., & Counsell, S. J. (2019). Different patterns
of cortical maturation before and after 38 weeks gestational
age demonstrated by diffusion MRI in vivo. NeuroImage, 185,
764–775. https://doi.org/10.1016/j.neuroimage.2018.05.046
Bedin, L. M., & Sarriera, J. C. (2014). Dyadic Analysis of
Parent-Children Subjective Well-Being. Child Indicators
Research, 7(3), 613–631. https://doi.org/10.1007/s12187-
014-9235-9
Ben-Arieh, A. (2008). The Child Indicators Movement:
Past, Present, and Future. Child Ind Res 1, 3–16 (2008).
https://doi.org/10.1007/s12187-007-9003-1
Bevans, K. B., Riley, A. W., & Forrest, C. B. (2010).
Development of the Healthy Pathways Child-Report Scales.
Quality of Life Research, 19(8), 1195–1214. https://doi.
org/10.1007/s11136-010-9687-4
Blakemore, S.-J. (2018). Avoiding Social Risk in Adolescence.
Current Directions in Psychological Science, 27(2), 116–122.
https://doi.org/10.1177/0963721417738144
Bradshaw, J. (2015). Subjective Well-Being and Social Policy:
Can Nations Make Their Children Happier? Child Indicators
Research, 8(1), 227–241. https://doi.org/10.1007/s12187-014-
9283-1
Byrne, J., Day, E., & Raftree, L. (2021) The Case for Better
Governance of Children’s Data: A Manifesto. UNICEF. New York.
Campbell, A. (1976). Subjective measures of well-being.
American Psychologist, 31(2), 117–124.
https://doi.org/10.1037/0003-066X.31.2.117
Campbell, O. L. K., Bann, D., & Patalay, P. (2021). The gender
gap in adolescent mental health: A cross-national investigation
of 566,829 adolescents across 73 countries. SSM - Population
Health, 13, 100742. https://doi.org/10.1016/j.ssmph.2021.100742
Cantril, H. (1965). The pattern of human concerns.
New Brunswick, NJ: Rutgers University Press
Casas, F. (2011). Subjective Social Indicators and Child and
Adolescent Well-being. Child Indicators Research, 4(4),
555–575. https://doi.org/10.1007/s12187-010-9093-z
Casas, F. (2016). Children, Adolescents and Quality of Life: The
Social Sciences Perspective Over Two Decades. In: Maggino, F.
(eds) A Life Devoted to Quality of Life. Social Indicators
Research Series, 60. https://doi.org/10.1007/978-3-319-20568-7_1
Casas, F., Coenders, G., González, M., Malo, S., Bertran, I., &
Figuer, C. (2012). Testing the Relationship Between Parents’
and Their Children’s Subjective Well-Being. Journal of
Happiness Studies, 13(6), 1031–1051. https://doi.org/10.1007/
s10902-011-9305-3
Casas, F., & González, M. (2017). School: One world or two
worlds? Children’s perspectives. Children and Youth Services
Review, 80, 157–170. https://doi.org/10.1016/j.
childyouth.2017.06.054
Casas, F., & González-Carrasco, M. (2019). Subjective Well-Being
Decreasing With Age: New Research on Children Over 8. Child
Development, 90(2), 375–394. https://doi.org/10.1111/
cdev.13133
Casas, F., González-Carrasco, M., & Luna, X. (2018). Children’s
rights and their subjective well-being from a multinational
perspective. European Journal of Education, 53(3), 336–350.
https://doi.org/10.1111/ejed.12294
Casas, F., González-Carrasco, M., Oriol, X., & Malo, S. (2022).
Economic and Children’s Subjective Well-Being Indicators at
the National Level in 35 Countries. Child Indicators Research,
15(5), 1539–1563. https://doi.org/10.1007/s12187-022-09918-4
Casas, F., Tiliouine, H., & Figuer, C. (2014). The Subjective
Well-being of Adolescents from Two Different Cultures:
Applying Three Versions of the PWI in Algeria and Spain. Social
Indicators Research, 115(2), 637–651. https://doi.org/10.1007/
s11205-012-0229-z

World Happiness Report 2024
99
Cerna, L., Brussino, O., & Mezzanotte, C. (2023). Social and
emotional skills (SES): Latest evidence on teachability and
impact on life outcomes (OECD Education Working Papers
304; OECD Education Working Papers, Vol. 304).
https://doi.org/10.1787/ba34f086-en
Chen, X., Cai, Z., He, J., & Fan, X. (2020). Gender Differences
in Life Satisfaction Among Children and Adolescents: A
Meta-analysis. Journal of Happiness Studies, 21(6), 2279–2307.
https://doi.org/10.1007/s10902-019-00169-9
Clair, A. (2012). The Relationship Between Parent’s
Subjective Well-Being and the Life Satisfaction of Their
Children in Britain. Child Indicators Research, 5(4), 631–650.
https://doi.org/10.1007/s12187-012-9139-5
Clark, A. E., Flèche, S., Layard, R., Powdthavee, N., & Ward, G.
(2018). The Origins of Happiness: The Science of Well-Being
over the Life Course. Princeton University Press.
https://doi.org/10.2307/j.ctvc77dgq
Colom, M., & Rohloff, P. (2018). Cultural considerations for
informed consent in paediatric research in low/middle-income
countries: A scoping review. BMJ Paediatrics Open, 2(1),
e000298. https://doi.org/10.1136/bmjpo-2018-000298
Cosma A., Abdrakhmanova, S., Taut, D., Schrijvers, K.,Catunda,
C., & Schnohr, C. (2023). A focus on adolescent mental health
and well- being in Europe, central Asia and Canada. Health
Behaviour in School-aged Children international report from
the 2021/2022 survey. Volume 1. Copenhagen: WHO Regional
Ofce for Europe; 2023. Licence: CC BY-NC-SA 3.0 IGO.
Cosma, A., Stevens, G., Martin, G., Duinhof, E. L., Walsh, S. D.,
Garcia-Moya, I., Költo, A., Gobina, I., Canale, N., Catunda, C.,
Inchley, J., & De Looze, M. (2020). Cross-National Time Trends
in Adolescent Mental Well-Being From 2002 to 2018 and the
Explanatory Role of Schoolwork Pressure. Journal of Adolescent
Health, 66(6), S50–S58. https://doi.org/10.1016/j.
jadohealth.2020.02.010
Cummins, R. A. (1996). The domains of life satisfaction: An
attempt to order chaos. Social Indicators Research, 38(3),
303–328. https://doi.org/10.1007/BF00292050
Cummins, R. A. (2016). The Theory of Subjective Wellbeing
Homeostasis: A Contribution to Understanding Life Quality.
In F. Maggino (Ed.), A Life Devoted to Quality of Life (Vol. 60,
pp. 61–79). Springer International Publishing. https://doi.
org/10.1007/978-3-319-20568-7_4
Cummins, R., & Gullone, E. (2000). Why we should not use
5-point Likert scales: The case for subjective quality of life
measurement. Proceedings, Second International Conference
on Quality of Life in Cities, 74–93.
Daly, M. (2022). Cross-national and longitudinal evidence for
a rapid decline in life satisfaction in adolescence. Journal of
Adolescence, 94(3), 422–434. https://doi.org/10.1002/
jad.12037
Deaton, A. (2008). Income, Health, and Well-Being around
the World: Evidence from the Gallup World Poll. Journal of
Economic Perspectives, 22(2), 53–72. https://doi.org/10.1257/
jep.22.2.53
De Neve, J.-E., & Oswald, A. J. (2012). Estimating the inuence
of life satisfaction and positive affect on later income using
sibling xed effects. PNAS Proceedings of the National
Academy of Sciences of the United States of America, 109(49),
19953–19958. https://doi.org/10.1073/pnas.1211437109
Department for Education. (2022). State of the nation 2021:
Children and young people’s wellbeing. Department for
Education.
Diener, E., Kahneman, D., & Helliwell, J. (2010). International
Differences in Well-Being (1st ed.). Oxford University Press
New York. https://doi.org/10.1093/acprof:o-
so/9780199732739.001.0001
Diener, E., Lucas, R. E., & Oishi, S. (2002). Subjective well-being:
The science of happiness and life satisfaction. In C. R. Snyder &
S. J. Lopez (Eds.), Handbook of positive psychology
(pp. 463–73). Oxford University Press.
Diener, E., & Suh, E. M. (Eds.). (2003). Culture and subjective
well-being. MIT press.
Diener, E., Suh, E. M., Lucas, R. E., & Smith, H. L. (1999).
Subjective well-being: Three decades of progress. Psychological
Bulletin, 125(2), 276–302. https://doi.org/10.1037/0033-
2909.125.2.276
Due, P., Eriksson, C., Torsheim, T., et al. (2019). Trends in high
life satisfaction among adolescents in ve Nordic countries
2002–2014. Nordisk välfärdsforskning, 4, 54–66.
https://doi.org/10.18261/issn.2464-4161-2019-02-03
Elgar, F. J., Sen, A., Gariépy, G., Pickett, W., Davison, C.,
Georgiades, K., Hammami, N., Azevedo Da Silva, M., Gordon, D.,
& Melgar-Quiñonez, H. R. (2021). Food insecurity, state fragility
and youth mental health: A global perspective. SSM -
Population Health, 14, 100764. https://doi.org/10.1016/j.
ssmph.2021.100764
Engel De Abreu, P. M. J., Neumann, S., Wealer, C., Abreu, N.,
Coutinho Macedo, E., & Kirsch, C. (2021). Subjective Well-Being
of Adolescents in Luxembourg, Germany, and Brazil During the
COVID-19 Pandemic. Journal of Adolescent Health, 69(2),
211–218. https://doi.org/10.1016/j.jadohealth.2021.04.028
Foulkes, L., Leung, J. T., Fuhrmann, D., Knoll, L. J., & Blakemore,
S. (2018). Age differences in the prosocial inuence effect.
Developmental Science, 21(6), e12666. https://doi.org/10.1111/
desc.12666
Fuhrmann, D., Madsen, K. S., Johansen, L. B., Baaré, W. F. C., &
Kievit, R. A. (2022). The midpoint of cortical thinning between
late childhood and early adulthood differs between individuals
and brain regions: Evidence from longitudinal modelling in a
12-wave neuroimaging sample. NeuroImage, 261, 119507.
https://doi.org/10.1016/j.neuroimage.2022.119507
Giedd, J. N., Blumenthal, J., Jeffries, N. O., Castellanos, F. X., Liu,
H., Zijdenbos, A., Paus, T., Evans, A. C., & Rapoport, J. L. (1999).
Brain development during childhood and adolescence: A
longitudinal MRI study. Nature Neuroscience, 2(10), 861–863.
https://doi.org/10.1038/13158
Gilman, R., & Huebner, S. (2003). A review of life satisfaction
research with children and adolescents. School Psychology
Quarterly, 18(2), 192–205. https://doi.org/10.1521/
scpq.18.2.192.21858
Goldbeck, L., Schmitz, T. G., Besier, T., Herschbach, P., &
Henrich, G. (2007). Life Satisfaction Decreases during
Adolescence. Quality of Life Research, 16(6), 969–979.
http://www.jstor.org/stable/27641333
World Happiness Report 2024
100
González-Carrasco, M., Casas, F., Viñas, F., Malo, S., Gras, M. E.,
& Bedin, L. (2017). What Leads Subjective Well-Being to
Change Throughout Adolescence? An Exploration of Potential
Factors. Child Indicators Research, 10(1), 33–56.
https://doi.org/10.1007/s12187-015-9359-6
Gromada, A., Rees, G., & Chzhen, Y(2020). Worlds of Inuence:
Understanding What Shapes Child Well-being in Rich
Countries, Innocenti Report Card, no. 16, UNICEF Ofce of
Research - Innocenti, Florence
Guthold, R., Newby, H., Keogh, S., A, R. A., Austrian, K., Baird,
S., Blum, R. W., Bundy, D. A. P., Deardorff, J., Engel, D., Klein, J.
D., Kostelecky, S. M., Mackworth-Young, C., Marquez, J.,
NicGabhainn, S., Requejo, J., Ross, D. A., Saewyc, E., & Mohan,
A. (2023). Developing a Global Approach for Measurement
of Adolescent Well-Being. The Journal of adolescent health:
ofcial publication of the Society for Adolescent Medicine,
73(6), 972–974. https://doi.org/10.1016/j.
jadohealth.2023.08.029
Handa, S., Pereira, A., & Holmqvist, G. (2023). The Rapid
Decline of Happiness: Exploring Life Satisfaction among Young
People across the World. Applied Research in Quality of Life,
18(3), 1549–1579. https://doi.org/10.1007/s11482-023-10153-4
Helliwell, J., Huang, H., & Wang, S. Changing World Happiness.
In Helliwell, J., Layard, R., & Sachs, J. (2019). World Happiness
Report 2019, New York: Sustainable Development Solutions
Network.
Helliwell, J., Huang, H., Wang, S., & Norton, M. Social Environments
for World Happiness. In Helliwell, J., Layard, R., Sachs, J., &
De Neve, J E. (2020). World Happiness Report 2020, New
York: Sustainable Development Solutions Network.
Helliwell, J., Huang, H., Wang, S., & Norton, M. Happiness,
Benevolence, and Trust During COVID-19 and Beyond. In
Helliwell, J., Huang, H., Wang, S., & Norton, M.Helliwell, J. F.,
Layard, R., Sachs, J. D., De Neve, J.-E., Aknin, L. B., & Wang, S.
(Eds.). (2022). World Happiness Report 2022. New York:
Sustainable Development Solutions Network.
Helliwell, J., Huang, H., Wang, S., & Norton, M.Helliwell, J. F.,
Layard, R., Sachs, J. D., De Neve, J.-E., Aknin, L. B., & Wang, S.
(Eds.). (2022). World Happiness Report 2022. New York:
Sustainable Development Solutions Network.
Helliwell, J. F., Layard, R., Sachs, J. D., Aknin, L. B., De Neve,
J.-E., & Wang, S. (Eds.). (2023). World Happiness Report 2023
(11th ed.). Sustainable Development Solutions Network.
Holte, A., Barry, M. M., Bekkhus, M., Borge, A. I. H., Bowes, L.,
Casas, F., Friborg, O., Grinde, B., Headey, B., Jozeak, T., Lekhal,
R., Marks, N., Muffels, R., Nes, R. B., Røysamb, E., Thimm, J. C.,
Torgersen, S., Trommsdorff, G., Veenhoven, R., … Zachrisson, H.
D. (2014). Psychology of Child Well-Being. In A. Ben-Arieh, F.
Casas, I. Frønes, & J. E. Korbin (Eds.), Handbook of Child
Well-Being (pp. 555–631). Springer Netherlands.
https://doi.org/10.1007/978-90-481-9063-8_13
Huebner, E. S. (2004). Research on Assessment of
Life Satisfaction of Children and Adolescents. Social
Indicators Research, 66(1/2), 3–33.
https://doi.org/10.1023/B:SOCI.0000007497.57754.e3
Huisman, J., & Smits, J. (2009). Effects of Household- and
District-Level Factors on Primary School Enrollment in 30
Developing Countries. World Development, 37(1), 179–193.
https://doi.org/10.1016/j.worlddev.2008.01.007
Inchley, J. (Ed.). (2016). Growing up unequal: Gender and
socioeconomic differences in young people’s health and
well-being: health behaviour in school-aged children (HBSC)
study: International Report from the 2013/2014 survey. World
Health Organization, Regional Ofce for Europe.
Inchley, J., Currie, D., Budisavljevic, S., Torsheim, T., Jåstad, A.,
& Cosma, A. (2020). Spotlight on adolescent health and
well-being. Findings from the 2017/2018 Health Behaviour in
School-aged Children (HBSC) survey in Europe and Canada.
International report. Volume 1. Key ndings. Copenhagen:
WHO Regional Ofce for Europe; 2020
Innocenti, G. M., & Price, D. J. (2005). Exuberance in the
development of cortical networks. Nature Reviews Neuroscience,
6(12), 955–965. https://doi.org/10.1038/nrn1790
Jerrim, J. (2021). PISA 2018 in England, Northern Ireland,
Scotland and Wales: Is the data really representative of all
four corners of the UK? Review of Education, 9(3), e3270.
https://doi.org/10.1002/rev3.3270
Knies, G. (2017). Income effects on children’s life satisfaction:
Longitudinal evidence for England. Institute for Social
and Economic Research. University of Exeter.
https://repository.essex.ac.uk/21104/1/2017-02.pdf
Lee, B. J., & Yoo, M. S. (2015). Family, School, and Community
Correlates of Children’s Subjective Well-being: An International
Comparative Study. Child Indicators Research, 8(1), 151–175.
https://doi.org/10.1007/s12187-014-9285-z
Levin, K. A., & Currie, C. (2014). Reliability and validity of an
adapted version of the Cantril Ladder for use with adolescent
samples. Social Indicators Research, 119(2), 1047–1063.
https://doi.org/10.1007/s11205-013-0507-4
Lewis, A. D., Huebner, E. S., Malone, P. S., & Valois, R. F. (2011).
Life Satisfaction and Student Engagement in Adolescents.
Journal of Youth and Adolescence, 40(3), 249–262.
https://doi.org/10.1007/s10964-010-9517-6
Lucas, R. E., & Diener, E. (2009). Personality and subjective
well-being. In E. Diener (Ed.), The science of well-being: The
collected works of Ed Diener (pp. 75–102). Springer Science +
Business Media.
Mahoney, J. (2023), “Subjective well-being measurement:
Current practice and new frontiers”, OECD Papers on
Well-being and Inequalities, No. 17, OECD Publishing, Paris,
https://doi.org/10.1787/4e180f51-en.
Main, G. (2014). Child Poverty and Children’s Subjective
Well-Being. Child Indicators Research, 7(3), 451–472.
https://doi.org/10.1007/s12187-014-9237-7
Main, G., Montserrat, C., Andresen, S., Bradshaw, J., & Lee,
B. J. (2019). Inequality, material well-being, and subjective
well-being: Exploring associations for children across 15 diverse
countries. Children and Youth Services Review, 97, 3–13.
https://doi.org/10.1016/j.childyouth.2017.06.033
Marquez, J. (2023). Gender Differences in School Effects
on Adolescent Life Satisfaction: Exploring Cross-National
Variation. Child & Youth Care Forum. https://doi.org/10.1007/
s10566-023-09756-7
Marquez, J., Casas, F., Taylor, L., & De Neve, JE. (2024, under
review). Economic development and adolescent wellbeing in
139 countries. [under review in Child Indicators Research].
Preprint: https://osf.io/preprints/socarxiv/7cqen/

World Happiness Report 2024
101
Marquez, J., & Long, E. (2021). A Global Decline in Adolescents’
Subjective Well-Being: A Comparative Study Exploring
Patterns of Change in the Life Satisfaction of 15-Year-Old
Students in 46 Countries. Child Indicators Research, 14(3),
1251–1292. https://doi.org/10.1007/s12187-020-09788-8
Marquez, J., & Main, G. (2021). Can Schools and Education
Policy Make Children Happier? A Comparative Study in
33 Countries. Child Indicators Research, 14(1), 283–339.
https://doi.org/10.1007/s12187-020-09758-0
Nelson, E. E., Jarcho, J. M., & Guyer, A. E. (2016). Social
re-orientation and brain development: An expanded and
updated view. Developmental Cognitive Neuroscience, 17,
118–127. https://doi.org/10.1016/j.dcn.2015.12.008
OECD (2017). PISA for Development Assessment and Analytical
Framework: Reading, Mathematics and Science. Preliminary
Version. OECD Publishing, Paris.
OECD. (2018). PISA for Development Assessment and Analytical
Framework: Reading, Mathematics and Science. OECD.
https://doi.org/10.1787/9789264305274-en
OECD. (2019). Rejuvenating Korea: Policies for a Changing
Society. OECD. https://doi.org/10.1787/c5eed747-en
OECD. (2021). Measuring What Matters for Child Well-Being
and Policies. OECD. https://doi.org/10.1787/e82fded1-en
Orben, A., Lucas, R. E., Fuhrmann, D., & Kievit, R. A. (2022).
Trajectories of adolescent life satisfaction. Royal Society Open
Science, 9(8), 211808. https://doi.org/10.1098/rsos.211808
Orben, A., & Przybylski, A. K. (2019). The association between
adolescent well-being and digital technology use. Nature
Human Behaviour, 3(2), 173–182. https://doi.org/10.1038/
s41562-018-0506-1
Pavot, W., & Diener, E. (2004). The subjective evaluation of
well-being in adulthood: Findings and implications. Ageing
International, 29(2), 113–135. https://doi.org/10.1007/
s12126-004-1013-4
Pigaiani, Y., Zoccante, L., Zocca, A., Arzenton, A., Menegolli, M.,
Fadel, S., Ruggeri, M., & Colizzi, M. (2020). Adolescent Lifestyle
Behaviors, Coping Strategies and Subjective Wellbeing during
the COVID-19 Pandemic: An Online Student Survey. Healthcare,
8(4), 472. https://doi.org/10.3390/healthcare8040472
Riley, A. W. (2004). Evidence That School-Age Children Can
Self-Report on Their Health. Ambulatory Pediatrics, 4(4),
371–376. https://doi.org/10.1367/A03-178R.1
Rudolf, R., & Bethmann, D. (2023). The Paradox of Wealthy
Nations’ Low Adolescent Life Satisfaction. Journal of Happiness
Studies, 24(1), 79–105. https://doi.org/10.1007/s10902-022-
00595-2
Ryff, C. D., Boylan, J. M., & Kirsch, J. A. (2021). Eudaimonic and
Hedonic Well-Being: An Integrative Perspective with Linkages
to Sociodemographic Factors and Health. In M. T. Lee, L. D.
Kubzansky, & T. J. VanderWeele (Eds.), Measuring Well-Being
(1st ed., pp. 92–135). Oxford University Press New York.
https://doi.org/10.1093/oso/9780197512531.003.0005
Savahl, S., Casas, F., & Adams, S. (2021). The Structure of
Children’s Subjective Well-being. Frontiers in Psychology, 12,
650691. https://doi.org/10.3389/fpsyg.2021.650691
Savahl, S., Casas, F., & Adams, S. (2023). Considering a Bifactor
Model of Children’s Subjective Well-Being Using a Multinational
Sample. Child Indicators Research, 16(6), 2253–2278.
https://doi.org/10.1007/s12187-023-10058-6
Savahl, S., Lee, B. J., & Casas, F. (eds.), (2022). Children’s
views on their lives and well-being during Covid- 19: A report
on the Children’s Worlds project, 2020-2022. Jerusalem, Israel:
Children’s Worlds Project (ISCWeB).
Save the Children. (2021). Adolescent Wellbeing Framework –
A Critical Opportunity to Full Human Rights and Drive
Change. Save the Children International. https://resourcecentre.
savethechildren.net/pdf/adolescent_wellbeing_framework.pdf/
Sawyer, S. M., Azzopardi, P. S., Wickremarathne, D., & Patton,
G. C. (2018). The age of adolescence. The Lancet Child &
Adolescent Health, 2(3), 223–228. https://doi.org/10.1016/
S2352-4642(18)30022-1
Stevenson, B., & Wolfers, J. (2013). Subjective Well-Being
and Income: Is There Any Evidence of Satiation? American
Economic Review, 103(3), 598–604. https://doi.org/10.1257/
aer.103.3.598
Stewart-Brown, S., Tennant, A., & Tennant, R. (2009). Internal
construct validity of the Warwick-Edinburgh Mental Well-being
Scale (WEMWBS): a Rasch analysis using data from the
Scottish Health Education Population Survey. Health Qual Life
Outcomes 7, 15. https://doi.org/10.1186/1477-7525-7-15
Sutcliffe, K., Ball, J., Clark, T. C., Archer, D., Peiris-John, R.,
Crengle, S., & Fleming, T. (Theresa). (2023). Rapid and unequal
decline in adolescent mental health and well-being 2012–2019:
Findings from New Zealand cross-sectional surveys. Australian
& New Zealand Journal of Psychiatry, 57(2), 264–282.
https://doi.org/10.1177/00048674221138503
Tamnes, C. K., Herting, M. M., Goddings, A.-L., Meuwese, R.,
Blakemore, S.-J., Dahl, R. E., Güroglu, B., Raznahan, A., Sowell,
E. R., Crone, E. A., & Mills, K. L. (2017). Development of the
cerebral cortex across adolescence: A multisample study of
inter-related longitudinal changes in cortical Vol., surface area,
and thickness. The Journal of Neuroscience, 37(12), 3402–3412.
https://doi.org/10.1523/JNEUROSCI.3302-16.2017
The Children’s Society (2020). The Good Childhood Report
2020. https://www.childrenssociety.org.uk/sites/default/
les/2020-11/Good-Childhood-Report-2020.pdf
The Children’s Society (2020). The Good Childhood Report
2023. https://www.childrenssociety.org.uk/sites/default/
les/2023-09/The%20Good%20Childhood%20Report%20
2023.pdf
Twenge, J. M., Martin, G. N., & Campbell, W. K. (2018). Decreases
in psychological well-being among American adolescents after
2012 and links to screen time during the rise of smartphone
technology. Emotion, 18(6), 765–780. https://doi.org/10.1037/
emo0000403
UNICEF. (2013). UNICEF Multiple Indicator Cluster Surveys.
https://mics.unicef.org
Veenhoven, R. (2008). Healthy happiness: Effects of happiness
on physical health and the consequences for preventive
health care. Journal of Happiness Studies: An Interdisciplinary
Forum on Subjective Well-Being, 9(3), 449–469.
https://doi.org/10.1007/s10902-006-9042-1
World Happiness Report 2024
102
Vijayakumar, N., Allen, N. B., Youssef, G., Dennison, M., Yücel,
M., Simmons, J. G., & Whittle, S. (2016). Brain development
during adolescence: A mixed-longitudinal investigation of
cortical thickness, surface area, and volume. Human Brain
Mapping, 37(6), 2027–2038. https://doi.org/10.1002/
hbm.23154
Von Der Embse, N., Jester, D., Roy, D., & Post, J. (2018). Test
anxiety effects, predictors, and correlates: A 30-year meta-
analytic review. Journal of Affective Disorders, 227, 483–493.
https://doi.org/10.1016/j.jad.2017.11.048
Watson, R. E., DeSesso, J. M., Hurtt, M. E., & Cappon, G. D.
(2006). Postnatal growth and morphological development of
the brain: a species comparison. Birth Defects Research Part B:
Developmental and Reproductive Toxicology, 77(5), 471-484.
Weinstein, N. (2022). ‘Life is getting better’ for most looked-
after children. Children & Young People Now.
https://www.cypnow.co.uk/news/article/life-is-getting-better-
for-most-looked-after-children
Wierzbicka, A. (2004). “Happiness” in Cross-Linguistic &
Cross-Cultural Perspective. Daedalus, 133(2), 34–43.
http://www.jstor.org/stable/20027911

Chapter 4
Supporting the
Well-being of an Aging
Global Population:
Associations between
Well-being and Dementia
Karysa Britton
PhD Student, Washington University in St. Louis
Kyrsten C. Hill
Postdoctoral Researcher, Washington University in St. Louis
Emily C. Willroth
Assistant Professor, Washington University in St. Louis
All three authors contributed equally. This research was supported by the National
Institutes of Health (R00AG071838). The content is solely the responsibility of the
authors and does not represent the official views of the National Institutes of Health.
doi.org/10.18724/whr-21fb-sb82
This version last updated March 8, 2024. Please see worldhappiness.report for latest data.
4
More than a decade of research
demonstrates that people with
higher well-being are less likely
to develop dementia.
Photo Center for Ageing Better

World Happiness Report 2024
Photo Center for Ageing Better
105
Key Insights
As the global population of older adults increases, the number of
worldwide dementia cases is also expected to increase.
Dementia is associated with reduced quality of life and lower
well-being, and thus dementia prevention is critical to maintain the
well-being of an aging global population.
Higher levels of well-being have been robustly associated with lower
risk for future dementia, suggesting that increasing well-being maybe
a promising non-pharmacological approach to dementia prevention.
Among individuals living with dementia, environmental changes
and activities that enhance autonomy, competence, and relatedness
have been shown to improve well-being.

World Happiness Report 2024
106
By the year 2050, the World Health Organization
estimates that the global population of people 65
and older will double1 (see Figure 4.1 for historic
population growth of older adults by world
region). As the global population of older adults
continues to rise, the number of people living with
dementia is also expected to grow, reaching
approximately 139 million dementia cases by the
year 2050.2 Dementia is an age-related clinical
syndrome that results in progressive or persistent
loss of memory and thinking abilities,3 which in
turn can negatively impact well-being.4 Given that
there is currently no cure for dementia and
biomedical treatments remain limited, it is vital to
evaluate and implement non-pharmacological
dementia prevention strategies. A growing body
of evidence suggests that well-being may be a
promising target for dementia prevention efforts,
given its associations with better cognitive health
and lower dementia risk.5 However, dementia
prevention science is still a long way away from
preventing all dementia cases.6 Thus, it is also
crucial to evaluate and implement strategies to
support the well-being of people living with
dementia and their care partners.
In this chapter, we begin by reviewing evidence
for well-being as a potential prevention target
that may reduce the risk for dementia, in turn
promoting continued well-being in later life. Then,
we review evidence for strategies to increase
the well-being of people living with dementia.
Throughout the chapter, we consider evidence
from international data sources and describe
innovative dementia care models from around
the world. We conclude by discussing how these
research ndings can inform policy to support
the well-being of an aging global population.
Fig. 4.1: Population of Adults Age 65 and Older
Millions
400
300
200
100
0
1960 1970 1980 1990 2000 2010 2020
East Asia & Pacific
Latin America & Caribbean
North America
Europe & Central Asia
South Asia
Middle East & North Africa
Sub-Saharan Africa
Figure 4.1. Data were retrieved from https://data.worldbank.org/indicator/SP.POP.65UP.TO. The World Bank (2022).
Population ages 65 and above, total.

World Happiness Report 2024
107
Well-being as a Protective Factor
against Dementia
More than a decade of research demonstrates
that people with higher well-being are less likely
to develop dementia.7 These studies have dened
well-being in many different ways, including
positive emotional experiences, cognitive
evaluations of one’s satisfaction with their life,
and one’s sense that their life has purpose or
meaning. However, a recent meta-analysis
suggests that the association between well-being
and dementia may be more consistent for some
types of well-being, such as sense of purpose,
than for others, such as positive affect.8 Prior
research suggests that well-being may protect
health through social, behavioral, and biological
pathways,9 and similar mechanisms may link
well-being to lower dementia risk. For example,
research suggests that well-being promotes
social engagement, which is critical for supporting
cognitive functioning and preventing dementia.10
Higher well-being also supports positive health
behaviors that are benecial for cognitive and
brain health, such as greater physical activity and
abstinence from smoking.11 Finally, research
suggests that higher well-being is associated with
better cardiovascular functioning,12 which in turn
reduces dementia risk.13
To test the possibility that well-being may protect
against dementia, dozens of research studies
have followed people across middle and older
adulthood in numerous countries and world
regions, including Australia, China, Europe, Israel,
Korea, Singapore, and the United States.14 These
studies have found that people with higher
well-being have better memory and thinking
abilities,15 experience less declines in memory
and thinking abilities,16 and are less likely to
develop dementia.17 For example, a research
study conducted at the Rush Alzheimer’s Disease
Center in Chicago, United States, found that
people with higher well-being appear resilient
to the brain diseases that cause dementia.18
Well-being was assessed at the beginning of the
study period, and memory and thinking abilities
were assessed yearly for the rest of the participants’
lives. After participants died, the researchers
conducted autopsies to quantify the amount of
Fig. 4.2: Higher well-being may
support memory and thinking abilities
and lower risk for later dementia.
Healthy
Cognition
Higher well-being
supports maintenance
of healthy cognition
and lowers risk for
later dementia
Pre-
symptomatic
Higher well-being
protects cognition
from the accumulation
of dementia-related
neuropathology
Dementia
Well-being-enhancing
activities and environ-
ments can support
well-being of people
living with dementia
MCI
Well-being
interventions may
slow cognitive decline
Figure 4.2. In individuals with healthy cognition, research
suggests that higher well-being may support memory and
thinking abilities and lower risk for later dementia. After
dementia-related neuropathology accumulates but while
individuals remain pre-symptomatic, evidence suggests that
well-being protects memory and thinking abilities from the
accumulating neuropathology. In the early stages of cognitive
impairment (e.g., mild cognitive impairment; MCI), well-being
interventions are a promising but largely untested strategy
to slow declines in memory and thinking abilities. Finally,
well-being-enhancing activities and environments are crucial
for supporting the well-being of people living with dementia
and their care partners.

World Happiness Report 2024
108
dementia-related neuropathology that was
present in participants’ brains. People with higher
levels of well-being experienced better-than-
expected memory and thinking abilities and
less-than-expected declines in memory and
thinking abilities in their nal years of life relative
to the amount of dementia-related neuropathology
that researchers discovered in their brains during
autopsy (see Figure 4.3.). The association was
present above and beyond other known resilience
factors (i.e., socioeconomic status, education,
cognitive activity, personality, low depression)
and known dementia risk factors (i.e., genetic
risk for dementia, medical comorbidities). This
suggests that well-being may protect memory
and thinking abilities from the brain diseases that
cause dementia.
Fig. 4.3: Resilience to Dementia-Related Neuropathy
2
0
-2
20-2
Resilience to Dementia-Related Neuropathology
Well-being
Figure 4.3. People with higher well-being at the study baseline demonstrated better-than-expected memory and thinking
abilities relative to the amount of dementia-related neuropathology present in their brains (i.e., cognitive resilience). Both well-being
and cognitive resilience are shown in units of standard deviations. Willroth, E. C., James, B. D., Graham, E. K., Kapasi, A., Bennett,
D. A., & Mroczek, D. K. (2023). Well-being and cognitive resilience to dementia-related neuropathology. Psychological Science, 34(3),
283-297. Copyright © 2022 (the authors).

World Happiness Report 2024
109
Overview of Causal Evidence
Taken together, high-quality international data
sources provide strong evidence that higher
well-being is associated with lower dementia risk
(see Table 4.1). However, this does not necessarily
mean that well-being causes lower dementia risk.
Establishing a causal effect of well-being on
dementia is challenging because well-being and
dementia share many common causes, including
lifestyle, medical, and socioeconomic factors.
For example, social isolation, low educational
attainment, or poor physical and mental health
may simultaneously reduce well-being and
increase dementia risk. Reverse causality is also
possible. For example, lower levels of well-being
may be an early indicator of underlying brain
changes that occur prior to the development of
dementia. In this case, intervening to improve
well-being may not necessarily change the course
of underlying brain changes or future dementia.
Therefore, it is crucial to establish whether the
effects of well-being on dementia are causal
because this determines whether interventions
and policies that increase well-being would also
reduce dementia incidence. A strong causal path
from well-being to dementia would increase the
likelihood of positive feedback to well-being
attributable to the lower incidence of dementia.
Randomized controlled trials are one of the
most common methods researchers use to
investigate causality. In randomized controlled
trials, researchers randomly assign participants
to either an experimental condition in which the
theorized causal variable is manipulated or to a
control condition. This random assignment
reduces the risk of confounding or reverse
causality. Randomized controlled trials of
well-being interventions have been shown to
effectively increase well-being.19 However,
further research is needed to test the effects of
those interventions on cognitive health and
dementia incidence.
Photo Center for Ageing Better

World Happiness Report 2024
110
An alternative to experimental randomization
is Mendelian randomization, a technique that
leverages the random allocation of genetic
variants to test for causal effects. In a recent
Mendelian randomization study, researchers
examined associations between genetic variants
associated with well-being (i.e., life satisfaction
and positive affect) and incidence of dementia.20
The researchers found that genetically predicted
well-being was associated with a lower risk for
dementia. The strength of the evidence was
“suggestive” of a causal effect, which means that
more research is needed to investigate this
possibility further.
Future Directions for Research on Well-being
and Dementia Risk
As the evidence for a potentially causal effect
of well-being on lower dementia risk grows, a
critical next step is to test well-being-enhancing
interventions to prevent or delay dementia. The
eld may benet from testing the effects of
existing well-being interventions on changes in
memory and thinking abilities and, ultimately,
dementia diagnosis. This will require longer-term
follow-ups than most previous randomized
controlled trials of well-being interventions.
Researchers may also consider pairing well-being
Table 4.1: Selection of research ndings regarding the association
between well-being and dementia risk.
Authors Country of
Data Collection
Well-being
Measurement
Cognitive
Measurement
Key Findings
Sutin et al. 2020 Austria, Belgium,
Czech Republic,
Denmark, France,
Germany, Greece,
Israel, Italy, the
Netherlands, Poland,
Spain, Sweden,
Switzerland
“How often do
you feel that your
life has meaning?”
Incident cognitive
impairment based
on scores on
memory and verbal
uency tasks
People who experienced more
meaning in life were less likely
to develop cognitive impairment
across a nine-year period.
Findings were consistent in four
regions of Europe and Israel.
Willroth et al., 2022 United States Satisfaction
with Life Scale;
Ryff Psychological
Well-being Scale
Functioning on
19 cognitive tests
relative to the amount
of neuropathology
present in participants’
brains at autopsy
People with higher well-being
had better-than-expected
memory and thinking abilities
and less-than-expected declines
in memory and thinking abilities
relative to the dementia-related
neuropathology present in their
brains and discovered at
autopsy.
Ma et al. 2021 Europe, United States Genetic variants
associated with
overall life
satisfaction and
positive affect
based on the largest
meta-analysis
of genome-wide
association studies
Alzheimer’s disease
diagnosis according
to the National
Institute on Aging
Alzheimer's
Association (NIA/AA),
the NINCDS-ADRDA
criteria, DSM-IV
criteria, or the ICD-10
criteria, or autop-
sy-conrmed
Higher genetically-predicted
well-being was associated
with a lower risk for dementia.
The effect was considered
“causally suggestive.”
Bell et al., 2022 Austria, Belgium,
China, Czech Republic,
Denmark, England,
France, Germany,
Greece, Ireland, Israel,
Italy, the Netherlands,
Poland, Singapore,
Sweden, Switzerland,
Spain, United States,
Purpose and
meaning in life,
positive affect,
life satisfaction,
optimism
Incident cognitive
impairment or
dementia based on
clinical diagnoses,
cognitive status
assessments,
task-based cognitive
functioning, and/or
neuropsychiatric
interview
Meta-analytic ndings suggest
that purpose and meaning in
life are associated with lower
incident cognitive impairment
and dementia. Results were
mixed for life satisfaction and
optimism, and positive affect
was not signicantly associated
with incident cognitive
impairment or dementia.
Table 4.1. Selection of research ndings regarding the association between well-being and dementia risk.

World Happiness Report 2024
111
interventions with existing lifestyle interventions
designed to lower dementia risk, such as those
targeting health behaviors and other lifestyle
factors. Given the pressing need to lower dementia
risk worldwide, it is important to test well-being-
enhancing interventions that are highly scalable
and are accessible and effective in racially,
ethnically, and geographically diverse samples.21
To increase the likelihood of successful intervention,
researchers should investigate several other basic
science questions about the association between
well-being and dementia. First, it is not clear
when in the lifespan well-being may reduce
dementia risk. On the one hand, increasing
well-being as early in the lifespan as possible
may enable individuals to experience life-long
benets of higher well-being, and these benets
may accumulate to lower dementia risk in late
life. On the other hand, increasing well-being in
midlife and older adulthood when individuals are
at greatest risk for developing dementia may be
an effective strategy. Relatedly, we don’t yet
know on what timescale well-being may impact
cognitive functioning or dementia risk. Studies
have observed associations between well-being
and later cognitive functioning or dementia risk
across one- to 20-year intervals, but the impact
of these different timescales on the strength of
associations has not been tested. In addition to
questions about timing, more research is needed
to test the associations between well-being and
dementia in socioculturally diverse samples.
One of the strengths of existing research on
well-being and dementia is the use of samples
from many different countries and world regions.
However, more research is needed on the groups
at greatest risk for developing dementia, including
people living in low- and middle-income countries,
racial and ethnic minority groups, and people of
lower socioeconomic status.
Given the complexity of research on well-being
and dementia risk, future research on this topic
will benet from the continuation and adoption
of open science practices. For example, many
existing studies of well-being and dementia have
made their data publicly available. This allows
the research community to reproduce scientic
ndings and test new research questions,
accelerating scientic progress. Multi-site and
multi-study collaborations are also useful, as they
allow researchers to test their questions in large
samples and to evaluate the generalizability of
ndings across diverse populations. Moving
forward, the eld would also benet from more
widespread adoption of preregistration. Preregis-
tration involves specifying research questions,
hypotheses, methods, and/or analytic approaches
prior to collecting or analyzing data. This enables
researchers to distinguish predicted ndings from
unexpected or exploratory ndings, which in
turn can help readers calibrate condence in
researchers’ ndings. Finally, research ndings
should be made widely accessible to the research
community, healthcare providers, policymakers,
and the general public.
Well-being in People Living
with Dementia
In the previous section, we considered well-being
across the lifespan as a potential resource to
lower dementia risk, in turn further supporting
well-being in older adulthood. However, dementia
prevention science is still a long way away from
preventing all dementia cases, with 10 million new
diagnoses each year.22 As the global population of
people living with dementia grows, it is crucially
important to evaluate strategies to increase the
well-being of people living with dementia.
People living with dementia or exhibiting cognitive
decline often experience decreased well-being.23
Yet, it is still possible to live well with dementia.
Well-being and quality of life are widely studied
More research is needed
on the groups at greatest
risk for developing dementia,
including people living in low-
and middle-income countries,
racial and ethnic minority
groups, and people of lower
socioeconomic status.
World Happiness Report 2024
112
and often used interchangeably in research
examining the lived experiences of people with
dementia.24 Quality of life is a multidimensional
concept that can include individuals’ physical
condition, mood, relationships, nancial situation,
and engagement in activities.25 Some researchers
suggest that well-being is a component of quality
of life, whereas others dene well-being as an
outcome of quality of life. Similar to well-being,
studies have found declines in quality of life for
people living with cognitive impairment and
dementia.26Awareness of one’s diagnosis and
prognosis also play a role, such that individuals
with cognitive impairment and dementia report
lower quality of life when they are aware of their
diagnosis and when they expect their condition
to worsen over time.27
Despite these ndings, research also shows that
people living with dementia retain personal
strengths and positive lived experiences.28 A
recent study using a nationally representative
sample of community-dwelling older adults found
that life satisfaction did not differ for people
living with and without dementia.29 However,
this study also found that dementia status was
modestly associated with lower life satisfaction
via greater limitations in activities of daily living.
Qualitative research from the perspective of
people living with dementia highlights the impor-
tance of living with and adapting to change while
also striving for continuity.30Additionally, people
living with dementia report that the sociocultural
and physical environment can be both helpful and
harmful for the quality of life and well-being.31
Well-being Measurement in People Living with
Dementia
Researchers have developed several tools to test
how different factors impact the quality of life
and well-being of people living with dementia.
These tools include self-report measures that
people living with dementia complete directly, as
well as proxy ratings from nurses, clinicians, and
family members. Some researchers have debated
the self-report abilities of people living with
dementia. On the one hand, researchers have
argued that declines in cognitive functioning can
distort self-reports of well-being.32 On the other
hand, self-reports by people living with mild and
moderate-to-severe dementia have been found to
be reliable across several studies.33 Proxy ratings
by relatives and staff are often lower than
self-ratings of well-being and are therefore not
interchangeable.34 Researchers generally agree
that self-ratings by people living with dementia
should be used whenever possible, as they better
capture individuals’ subjective perceptions of
well-being.35 Methods also exist that enable
researchers to observe people living with dementia
and rate the extent to which they engage in
behaviors typically associated with well-being.
A systematic review examining quality of life and
well-being in people living with dementia found
that the Quality of Life in Alzheimer’s Disease
scale36 was the most commonly used measure of
quality of life and the Psychological Well-Being in
Cognitively Impaired Persons scale37 was the
most commonly used measure of well-being.38
A conceptual scoping review identied 35 self-
report instruments that have been used to assess
well-being in people living with dementia, but
only six of those measures were specically
designed for people living with dementia.39 There
is a lack of consensus on optimal measurement
instruments and a need for more rigorously
tested measures of well-being and quality of life
in people living with dementia.40 Further, research
is needed that assesses specic aspects of
well-being in people living with dementia rather
than quality of life more generally. As well-being
and quality of life are not clearly distinguished in
the literature, the remainder of this section will
use well-being as an umbrella term that includes
quality of life.
Individual Interventions and Strategies
Using the tools described above, researchers
have identied several factors that contribute
to the well-being of people living with dementia
(see Table 4.2, Table 4.3 and Figure 4.4). Social
Determination Theory posits that the basic
psychological needs of autonomy, competence,
and relatedness are essential for psychological
well-being.41 According to Social Determination
Theory, autonomy refers to a feeling of choice
and ownership over one’s actions, competence

World Happiness Report 2024
113
refers to a sense of mastery, and relatedness
refers to a sense of mutual belonging and
support.42 Qualitative research suggests that
these basic psychological needs are often
negatively impacted by dementia.43As such,
interventions targeting autonomy, competence,
and relatedness may help to enhance well-being
among people living with dementia.
Qualitative studies highlight the importance of
activity engagement to promote well-being in
people living with dementia.44 An integrative
review of 45 studies found that engagement
in activities is related to positive affect and
well-being among nursing home residents both
with and without cognitive impairment.45 This
review examined a wide range of activities and
interventions, such as animal-facilitated activities,
cultural arts interventions, exercise programs,
massage, life review/reminiscence, and outdoor
activities such as gardening. Results suggested
that activities are most effective when tailored
to the individual. Research emphasizes the
importance of activities that are not only pleasant
but also personally meaningful to the individual.46
Consistent with Social Determination Theory,
engagement in meaningful activity is thought
to promote well-being in people living with
dementia by addressing fundamental
psychological needs.47
Fig. 4.4: Several activities and interventions have been shown to support
the well-being of people living with dementia.
Story
Telling
Outdoor
Activities
Montessori-
based
Activities
Reminiscence
and Life
Review
Animal
Facilitated
Therapy
Physical
Activity
Cultural Arts
Interventions
Social
Engagement
/ Support
Groups
Strategies
to increase
well-being of
people with
dementia
Figure 4.4. Several activities and interventions have been shown to support the well-being of people living with dementia.

World Happiness Report 2024
114
Engagement in social and leisure activities can
enhance well-being in people living with dementia
by increasing feelings of agency, autonomy, and
purpose while also providing opportunities for
social connection.48 Engaging in hobbies and
maintaining an active social life have been found
to be more strongly related to well-being in
people living with dementia compared to other
everyday activities.49 Systematic reviews of the
literature consistently nd that social interaction
is important to the well-being of people living
with dementia,50 and for people in general (see
Chapter 2). Although additional research is
needed in this area, studies have shown that
social support groups for people living with
dementia may have benets for self-esteem and
well-being.51 Support groups can offer a sense of
belonging, increase social interaction, and provide
strategies for coping, each of which is related to
reductions in depressive symptoms and improve-
ments in well-being among people living with
dementia.52 Social and leisure activities therefore
have the potential to increase autonomy, compe-
tence, and relatedness among people living with
dementia, leading to improvements in well-being.
Cultural arts interventions have gained attention
as one potential way to increase engagement
in meaningful activity and improve well-being
among people living with dementia. Research
on cultural arts interventions has found music
therapy, visual arts interventions, and dance/
movement therapy to increase well-being in
people living with dementia.53 Despite these
positive outcomes, researchers have cited a
Table 4.2: Strategies and activities for increasing well-being for people living with dementia.
Individual Interventions and Strategies
Strategy or Activity Benets Evidentiary Support
Animal facilitated therapy Improved mood; Improved verbalizations Consistent evidence
supporting benets
Behavioral activation Improved health-related quality of life; Improved
everyday function; Increased participation in
meaningful activities
Consistent evidence supporting
benets, but evidence is limited
to few studies
Cultural arts interventions
(e.g., music, dance, and
visual arts interventions)
Improved mood; Increased quality of life,
meaning, and engagement; Decreased agitation
and aggressive behaviors; Enhanced
communication; Positive impacts on cognitive
processes; Decreased anxiety
Consistent evidence supporting
benets; Methodology has been
criticized
Literature / storytelling Increased positive affect and life satisfaction;
Increased meaning, engagement, and pleasure;
Improved communication
Mixed evidence
Montessori-based activities Increased engagement and positive affect;
Improved eating behaviors; Benets for memory
and attention
Mixed evidence
Outdoor activities
(e.g., gardening)
Increased life satisfaction, engagement, and
enjoyment; Decreased agitation
Mixed evidence
Physical exercise Improved mood, sleep, and cognition;
Decreased agitation; Increased mobility
and functional ability
Consistent evidence supporting
benets for people living with
dementia in nursing homes; Mixed
evidence for individuals not living
in nursing homes
Reminiscence and life review Improved mood and well-being;
Improved autobiographical memory
Consistent evidence
supporting benets
Robotic animal companions Increased social engagement Consistent evidence supporting
benets of reduced agitation
and depression; Mixed evidence
for benets on QoL
Social engagement /
support groups
Increased well-being; Foster a sense of
belonging; Provide coping strategies;
Improved self-esteem
Consistent evidence
supporting benets
Table 4.2 Strategies and activities for increasing well-being for people living with dementia.

World Happiness Report 2024
115
need for greater methodological rigor and
theoretical underpinnings in research on cultural
arts interventions. Across cultural arts interven-
tions, research provides the strongest support
for music therapy, and systematic reviews have
shown signicant effects of music therapy on
lowering anxiety in people living with dementia.54
Although the mechanisms underlying the effects
of music therapy are not well understood, it is
likely that cultural arts interventions play a role
in supporting the basic psychological needs of
people living with dementia. Using a Social
Determination Theory framework, a cultural arts
intervention was recently developed with a
focus on promoting autonomy, competence,
and relatedness among older adults with mild
cognitive impairment.55
There is also a growing body of research
supporting the benets of reminiscence
interventions for people living with dementia.
Reminiscence interventions are widely used in
dementia care but have also shown psychological
benets for cognitively unimpaired older adults.56
Reminiscence interventions for people living with
dementia have used several different structures
and approaches. Broadly, reminiscence involves
the discussion of past experiences with another
person or group, often using prompts such as
photographs, music, or personal possessions.57
Some reminiscence interventions take a narrative
approach based on sharing stories and memories.
Others take an integrative approach to help
individuals make sense of their life stories.58 One
particular integrative intervention called life
review involves the creation of a life storybook
containing photographs and written accounts.59
Studies suggest that structured life review
interventions, including the use of life story
books, may have greater benets for mood and
well-being in people living with dementia relative
to other reminiscence approaches.60 Reminiscence
and life review interventions are typically led by
trained professionals (e.g., psychologists, social
workers, nurses) and can be conducted in individual
or group formats. However, there is a growing
interest in intergenerational reminiscence inter-
ventions using trained young adult volunteers,
such as college students.61
Intergenerational programs are a promising way
to enhance well-being among people living with
dementia while also promoting social connection
and relatedness. Intergenerational programs bring
together different generations by involving them
in combined activities. Examples include intergen-
erational classrooms, where students complete
their curriculum alongside older adult volunteers
or senior care residents,62 or arts programs such
as intergenerational choirs.63 Intergenerational
programs have also been developed specically
for people living with dementia, with the most
common being music, art, and narrative/reminis-
cence programs.64 These programs are mutually
benecial for younger and older generations
and have been associated with increased
activity engagement, reduced social isolation, and
enhanced well-being among people living with
dementia.65
Intergenerational programs
are a promising way to enhance
well-being among people
living with dementia while also
promoting social connection
and relatedness.
Photo Center for Ageing Better

World Happiness Report 2024
116
Advances in technology have also been used
to enhance individual and group interventions
promoting well-being in people living with
dementia. For example, one study found that
participants showed greater improvements in
well-being when virtual reality was used to
project realistic memories during reminiscence
therapy.66 Digital storytelling, which uses
technology to create audio-visual story clips,
has also been incorporated into reminiscence
interventions. Given increased interest in digital
storytelling, more rigorous research is needed to
determine the effectiveness and mechanism of
these methods.67 Robotic animal companions,
which can replace more traditional animal-assisted
therapies, represent another unique use of
Table 4.3: Environmental factors supporting well-being for people living with dementia.
Environmental factors
Strategy or Activity Benets Evidentiary Support
Aging in place Maintenance of autonomy and independence;
Comfort and security of a familiar environment;
Reduced nancial burden; Increased social
engagement; Engagement with natural
environments and access to public space;
Improved well-being
Consistent evidence
upporting benets
Dementia Villages Improved well-being; Increased social
engagement; Maintenance of physical
health; Engagement with everyday activities
Consistent evidence supporting
benets, but evidence is limited
to few studies
Long-term care facilities Increased social engagement;
Improved mood
Mixed evidence; Benets may
vary based on well-being initiatives
in place
Assistive Technology
(e.g., sensors, location
monitoring, cognitive
stimulation, medication
dispensers)
Improved mood, coping, stress, autonomy,
activities of daily living, overall health and
well-being; Reduced wandering; Fall prevention;
Independence
Mixed evidence
Snoezelen Rooms Improved well-being via sensory stimulation;
Reduced agitation; Improved mood
Consistent evidence supporting
benets, but evidence is limited
to few studies
Table 4.3 Environmental factors supporting well-being for people living with dementia.

World Happiness Report 2024
117
technology in the care of people living with
dementia.68 Technology has also been incorporated
into cultural arts interventions, with one study
utilizing a touchscreen-based art intervention
where people living with dementia viewed art
on a tablet computer.69 In fact, one systematic
review found that a diverse range of touch-
screen-based interventions have been used with
people living with dementia.70 The authors noted
that, while more research is needed in this area,
there is some evidence that these interventions
may be benecial for well-being.
Environmental Factors
In addition to individual activities and interven-
tions, several environmental factors can support
the well-being of people living with dementia (see
Table 4.3). Community-dwelling older adults
prefer remaining in their own homes within the
community instead of moving to a long-term care
facility.71 This is known as “aging in place,” and
research suggests that people living with demen-
tia can experience well-being benets from aging
in place.72 This is especially true for people living
with dementia since their risk of death increases
after being placed in long-term care facilities.73
People living with dementia who continue to live
in their homes benet from the comfort and
security of a familiar space, the opportunity to
maintain healthy social relationships with friends
and family, continued participation in activities
with others in their community, engagement with
natural environments, and reduced nancial
burden.74 In alignment with Social Determination
Theory, the ability to maintain one’s autonomy
and independence by continuing to live at home
is one way to improve the well-being of people
living with dementia.
While many older adults and people living with
dementia prefer aging in place, researchers
emphasize the importance of safety while doing
so. As people living with dementia progress to
later stages, they typically lose the ability to
complete activities of daily living.75 To address
safety concerns, researchers have sought to make
adaptations to homes through simple, low-cost
changes and through the assistance of technology.
These methods have been used to enhance the
independence of people aging in place and to
divert the need for transfer to long-term care. The
use of a screener to identify the specic abilities
and limitations of an individual living with dementia
may be an important rst step in understanding
the adjustments to the home that should be
made. For individuals in the earlier stages of
dementia, small changes in the home can have a
positive impact on well-being. The National
Institute on Aging in the United States suggests
making changes to reduce fall risk, including
removing area rugs, installing grab bars around
the home, and placing light switches at the
bottom and top of stairs for easy access.76 In
addition to these recommendations, the National
Health System in the United Kingdom suggests
incorporating contrasting colors to help individuals
with dementia differentiate between objects,
removing mirrors to avoid confusion, adding
visual cues such as clear labels around the home,
replacing analog clocks with digital clocks, and
adding easy-to-read calendars to assist with
orientation to time.77
People living with dementia can also use techno-
logical aids in their homes to support aging in
place and maintenance of autonomy. Literature
suggests that assistive technology is both feasible
and acceptable for people living with dementia
and their caregivers, although people in the later
stages of dementia may experience challenges
using technologies.78 Importantly, studies have
People living with dementia who
continue to live in their homes
benet from the comfort and
security of a familiar space, the
opportunity to maintain healthy
social relationships with friends
and family, continued participation
in activities with others in their
community, engagement with
natural environments, and
reduced nancial burden.

World Happiness Report 2024
118
reported improved mood, coping, stress, autonomy,
activities of daily living, and overall health in
response to the adoption of assistive technology,
all culminating in better overall well-being.79
Assistive technology in the home can include
sensors, location monitoring, cognitive stimulation
mechanisms, and medication dispensing devices.80
Both sensors and GPS can be useful for people
living with dementia who engage in wandering, or
getting lost or confused about their location.81
Sensors can be installed on doors to detect
wandering and forced entry and can alert care-
givers in case of emergency.82 GPS is also useful
for detecting night wandering and wandering
during the winter. GPS can be used to promote
autonomy and encourage outdoor activities,
which are especially important for overall health
in this population.83 Importantly, people living
with dementia have reported that using GPS has
provided them with a sense of freedom, further
promoting their well-being. However, challenges
using GPS should be considered and can include
forgetting to take the device when leaving the
home or low battery of the device. Wearable
sensors have also been successfully used for fall
detection, and installation of light pathways on
the ground and brightly lit handrails are utilized
for fall prevention.84 These mechanisms promote
safety and independence, putting less strain on
both the person living with dementia and their
caregiver. Item locators and reminder systems
can be used to further enhance independence.
Item locators can be placed on objects such as
phones or television remote controls and can
reduce search time, whereas reminder systems
can improve medication compliance and reduce
hospitalization.85
A recent systematic review highlights the use of
mobile applications to support activities of daily
Photo Center for Ageing Better

World Happiness Report 2024
119
living, including maintaining hygiene, cooking,
remembering appointments, and even setting a
dinner table.86 This type of support may bolster
a fundamental psychological need of Social
Determination Theory, a sense of mastery and
competence, that can be reduced in people living
with dementia. This is accomplished with applica-
tions that support various types of cognition,
including memory, by providing prompts and
reminders. For example, calendar applications are
used to remind people living with dementia of
their daily schedule, while visual or vocal prompts
help remind people to complete tasks. In sum,
aging in place can enhance the well-being of
people living with dementia, and aging in place
can be supported with inexpensive home
modications and technological aids. However,
additional research and innovation on technological
systems are still needed to maximize their efcacy
and address ethical considerations.87
While aging in place is an option for people living
with mild to moderate dementia, it may not be an
option for everyone due to advanced disease
stage or lack of access to at-home caregivers. An
alternative option for people living with advanced
dementia is an innovative residential care model
known as dementia villages, which are communities
that encourage a supportive, homelike environ-
ment that is conducive to well-being.88 The
overarching goal of dementia villages is to
deinstitutionalize dementia through a pa-
tient-centered approach. Several countries have
built or are building dementia villages to promote
the well-being of people living with advanced
dementia, including Amsterdam, Australia,
Denmark, France, Germany, Ireland, Italy, Japan,
New Zealand, Norway, Scotland, Switzerland.
The rst dementia village, De Hogeweyk, was
conceived in the Netherlands and aimed to
provide individuals with an engaging life using
meaningful activities. The Hogeweyk Care
Concept includes six pillars of a dementia village:
1) favorable surroundings (e.g., a familiar home
space, outdoor space), 2) life’s pleasure and
meaning, 3) health, 4) lifestyle (e.g., acknowledging
that the person living with dementia is the same
person they were before their diagnosis), 5) staff
and volunteers trained in dementia care, and
6) the organization (e.g., policies and staff facilitate
a “normal” life for the residents).89 Well-being is
supported through social relationships and
opportunities to engage in activities of interest,
including eating at restaurants, attending concerts,
and maintaining physical health through walking
in the outdoor spaces within the village. Like the
use of assistive technology in one’s own home
within the community, dementia villages utilize
sensors to aid in the maintenance of the autonomy
of their residents. An alternative to dementia
villages in the United States is the Green House
Project, which is comprised of individual residences
that focus on viewing individuals with dementia
as people outside of their medical label.
Consistent with Social Determination Theory,
dementia villages promote both autonomy and
relatedness, supporting the well-being of people
living with dementia. Of note, while dementia
villages were designed to promote well-being,
little research has been conducted to assess if
there are meaningful differences in the well-being
of dementia village residents compared to
individuals living in more traditional dementia
care environments.90 More research is needed to
better understand the impacts of dementia
villages in comparison to traditional long-term
care facilities. Further, countries should continue
to develop and assess care models that are
designed with the goal of enhancing the
well-being of people living with dementia.
If aging in place or residing in a dementia village
is not an option, long-term care facilities like
nursing homes may be an alternative. One way
that well-being is encouraged in this setting is
through the use of multisensory environments.
Research exploring two types of multisensory
environments including Snoezelen rooms and
landscaped gardens suggests that they both aid
in the well-being of people living with dementia.91
Snoezelen rooms were developed in the
Netherlands and are used to stimulate the senses
via light, smell, sound, and taste.92 Like the dementia
villages, Snoezelen rooms utilize a patient-centered
approach. This mode of multisensory stimulation
is effective for people living with dementia at
various stages of the disease and increases
well-being by reducing agitation and improving
mood symptoms including depression and anxiety.93
World Happiness Report 2024
120
Together, long-term care facilities can enhance
the well-being of people living with dementia by
implementing various interventions and activities
including multisensory environments, animal-facil-
itated activities, cultural arts interventions, exercise
programs, massage, life review/reminiscence, and
outdoor activities such as gardening.
Despite the challenges that can accompany a
diagnosis of dementia, people living with dementia
can live well. This is evidenced through both
individual and group activities that promote
well-being via engagement in interventions and
hobbies that facilitate a sense of purpose and
improve mood. Importantly, each of these methods
can be applied to people living with dementia
both in the community and in care facilities like
dementia villages or nursing homes, aiming to
promote well-being. The global population of
people living with dementia continues to grow,
invoking a pressing need for researchers and
policymakers to place well-being at the forefront
of approaches to care.
Moreover, research is needed to extend well-being
interventions developed for broader older adult
populations to people living with dementia. For
example, positive psychological interventions
using practices such as gratitude and savoring
have been shown to increase well-being among
older adults. In a sample of healthy, community-
living adults aged 60+, a ‘three good things in life’
gratitude intervention was found to increase
well-being from baseline to day 45.94 In a pilot
study examining a savoring intervention, older
adults who completed the intervention with high
delity reported increased happiness over
time.95Another study found that older adults who
engaged in a positive psychological intervention
showed increases in life satisfaction and subjective
happiness compared to the control group.96
However, prior studies testing positive psycho-
logical interventions typically exclude people
experiencing cognitive impairment or living with
dementia. Future research is needed to determine
whether these well-being interventions are
effective for people living with dementia and to
determine best practices for adapting these
interventions for this population.
Policy Implications
The research reviewed in this chapter suggests
that policies designed to increase well-being may
lower dementia risk, which in turn would result in
a happier and healthier older adult population.
Policies that enable equitable access to well-being-
and health-enhancing activities may be especially
benecial, such as those that increase equitable
access to education, safe public spaces for
physical and social activity, health screenings,
and affordable and effective health care. Such
policies would provide individuals with the
resources needed to maintain their well-being
and health, resulting in widespread benets for
dementia prevention.
In addition, resources should be invested to test
the long-term effects of well-being-enhancing
interventions on cognitive health and dementia.
Because targeting well-being as a dementia
prevention strategy requires large-scale
dissemination in the general population, resources
should be invested into potentially scalable
interventions such as those that can be delivered
digitally, single-session interventions, and
micro-interventions.97
Policies that enable equitable
access to well-being- and
health-enhancing activities may
be especially benecial, such
as those that increase equitable
access to education, safe public
spaces for physical and social
activity, health screenings,
and affordable and effective
health care. Such policies would
provide individuals with the
resources needed to maintain
their well-being and health,
resulting in widespread benets
for dementia prevention.

World Happiness Report 2024
121
In addition to policies designed to decrease
dementia prevalence, policies are needed to
enhance the well-being of people living with
dementia. A critical rst step is to invest resources
into collecting more high-quality data on the
well-being of individuals living with dementia,
ideally using self-report instruments that enable
individuals living with dementia to report their
own well-being. Such data are invaluable to
better understand the lived experiences of
individuals living with dementia, and to enable
evaluations of the impact of different environments
on the well-being of people living with dementia.
Given existing research suggesting individuals
living with dementia benet from continuing to
live at home or in the community, policies should
aim to increase access to and the affordability of
assistive technology and paid care partners to
enable more individuals living with dementia to
remain at home. For individuals who can no
longer safely live at home, assisted living facilities
should aim to create more home-like environments
and to implement activities and interventions
shown to enhance well-being. Critically, the
development and evaluation of the policies
described here will require a shift away from a
decit-focused medical model and toward a
strengths-based model that recognizes and
preserves the personhood of people living with
dementia.
Conclusion
All over the world, people are living longer than
ever. In most countries, the average person can
expect to live to age 65 or older. As the global
population ages, it is crucial to develop and
implement dementia prevention strategies and to
help individuals live well with dementia. This
chapter reviewed evidence from multiple scientic
disciplines and world regions showing that
investing in well-being across the lifespan is
essential to achieve these goals. In early and
midlife, higher well-being may serve as a protective
factor that prevents or delays dementia onset,
which in turn further supports late-life well-being.
In older adulthood, interventions and policies that
facilitate continued engagement in social, physical,
and intellectual activities are critical for the
maintenance of both well-being and cognitive
health. Among older adults living with dementia,
interventions, environments, and policies that
support the basic needs of autonomy, competence,
and relatedness may help promote well-being.
Photo Center for Ageing Better
World Happiness Report 2024
122
Endnotes
1 World Health Organization (2020)
2 Alzheimer’s Association (2020)
3 Alzheimer’s Association (2023)
4 Meléndez et al. (2018); Wilson et al. (2013)
5 See Willroth et al. (2023) for review
6 Alzheimer’s Disease International (2023)
7 Willroth (2023)
8 Bell et al. (2022); Sutin et al. (2018); Willroth et al., (2023).
Beck et al. (2023). Results of one meta-analysis found that
purpose in life was signicantly associated with a reduced
risk of dementia; however, results for positive affect were
non-signicant (Bell et al., 2022). There were not enough
studies on life satisfaction to conduct a meta-analysis, how-
ever, individual study results were mixed. Consistent with
these meta-analytic ndings, another paper by Sutin and
colleagues (2018) examined associations between several
well-being constructs (life satisfaction, optimism, mastery,
purpose in life, and positive affect) and incident dementia,
and found that only purpose in life was signicantly
associated with dementia after adjusting for covariates
(psychological distress, other clinical and behavioral risk
factors, income/wealth, and genetic risk). Similarly, Willroth
and colleagues (2023) found that both life satisfaction and
eudaimonic well-being were associated with greater
cognitive resilience to dementia-related neuropathology,
but only the association of eudaimonic well-being remained
when adjusting for covariates (socioeconomic status,
education, cognitive activity, low neuroticism, low depres-
sion, ApoE genotype, medical comorbidities). Finally, a
recent individual participant data meta-analysis found that
positive affect, but not life satisfaction, was signicantly
associated with lower incident dementia (Beck et al., 2023).
These ndings highlight the complex associations between
particular facets of well-being and dementia risk.
9 Cross & Grimm (2018)
10 Middleton & Yaffe (2009); Livingston et al. (2020); Marioni
et al. (2015)
11 Grant et al. (2009)
12 Sin (2016)
13 Livingston et al. (2020)
14 Wilroth et al. (2023)
15 Dewitte et al. (2021); Lee (2016); Wagner et al. (2022)
16 Hittner et al. (2020); Gerstorf et al. (2007); Zainal &
Newman (2022); Boyle et al. (2010); Kim et al. (2019)
17 Bell et al. (2022); Sutin et al. (2018); Boyle et al. (2010);
Peitsch et al. (2016); Rawtaer et al. (2017); Zhu et al. (2022);
Sutin et al. (2020)
18 Boyle et al. (2012); Willroth et al. (2022)
19 Carr et al. (2023). A meg-analysis of 198 meta-analyses of
4,065 primary studies found that interventions designed to
enhance well-being through pathways consistent with
positive psychological theory had small to medium positive
effects on well-being, and these well-being increases were
partially maintained at 7.5 months post-intervention.
20 Ma et al. (2021)
21 Kubzansky et al. (2023). Time-intensive, multi-component,
face-to-face interventions often show the largest effect
sizes. However, light-touch interventions delivered in
digital formats are likely to be more scalable for delivery to
the general population. Thus, more work is needed to
enhance and test the effectiveness of these more scalable
alternatives.
22 Alzheimer’s Disease International (2023)
23 Meléndez et al. (2018); Wilson et al. (2013). Memory and
thinking changes can impact well-being directly by causing
frustration or embarrassment, or indirectly by impacting
one’s ability to participate in necessary or valued activities.
In addition, the brain changes that cause dementia can
directly impact mood.
24 Clarke et al. (2020); Kaufmann et al. (2016)
25 Logsdon et al. (1999)
26 Missotten et al. (2008); van de Beek et al. (2019)
27 Sites et al. (2017)
28 Wolverson et al. (2016)
29 Gotanda et al. (2023)
30 Górska et al. (2018)
31 Górska et al. (2018)
32 Katschnig (1997)
33 Brod et al. (1999); Hoe et al. (2005); Thorgrimsen et al.
(2003)
34 Grifths et al. (2020); Ready et al (2004); Römhild et al.
(2018)
35 Brod et al. (1999); Thorgrimsen et al. (2003)
36 Logsdon et al. (1999)
37 Burgener et al. (2005)
38 Martyr et al. (2018)
39 Clarke et al. (2020)
40 Bowling et al. (2015)
41 Deci & Ryan (2011)
42 Ryan & Deci (2017)
43 Górska et al. (2018)
44 Górska et al. (2018)
45 Shyrock & Meeks (2022)
46 Dewitte et al. (2022); Nyman & Szymczynska (2016)
47 Nyman & Szymczynska (2016)
48 Orgeta et al. (2019)
49 Giebel & Sutcliffe (2018)
50 Shropshire (2020)
51 Leung (2015)
52 Leung et al. (2015); Logsdon et al. (2007)

World Happiness Report 2024
123
53 de Medeiros & Basting (2014)
54 Shryock & Meeks (2022); Ueda et al. (2013)
55 Huang et al. (2023)
56 Tam et al. (2021)
57 Woods et al. (2018)
58 Subramaniam & Woods (2012)
59 Haight et al. (2006); Haight et al. (1992)
60 Shryock & Meeks (2022); Subramaniam & Woods (2012)
61 Xu et al. (2023)
62 Proulx et al. (2023)
63 Harris & Caporella (2019)
64 Galbraith et al. (2015)
65 Gerritzen et al. (2020)
66 Tominari et al. (2021)
67 Rios Rincon et al. (2022)
68 Tummers et al. (2020)
69 Tyack et al. (2017)
70 Tyack & Camic (2017)
71 Ratnayake et al. (2022); Wiles et al. (2012)
72 Ratnayake et al. (2022)
73 McClendon et al. (2006)
74 Ratnayake et al. (2022); Wiles et al. (2012)
75 Circo et al. (2015)
76 National Institute on Aging (2023)
77 Soilemezi et al. (2019)
78 Farina et al. (2019); Malmgren et al. (2020); Astell et al.
(2019); Kruse et al. (2020)
79 Kruse et al. (2020)
80 Soilemezi et al. (2019); Kruse et al. (2020); Daly et al.
(2019); Behera et al. (2021); Gettel et al. (2021); Pappadà et
al. (2021)
81 Behera et al. (2021)
82 Pappadà et al. (2021)
83 Behera et al. (2021); Liu et al. (2017)
84 Pappadà et al. (2021)
85 Behera et al. (2021)
86 Pappadà et al. (2021)
87 Astell et al. (2019); Kruse et al. (2020)
88 Harris et al. (2017)
89 Harris et al. (2017)
90 Hestevik et al. (2022); Krier et al. (2023)
91 Cox et al. (2004)
92 Van Weert et al. (2005)
93 Cox et al. (2004); Van Weert et al. (2005); Solé et al.
(2022); Berkheimer et al. (2017)
94 Killen & Macaskill (2015)
95 Smith & Hanni (2019)
96 Ramírez et al. (2014)
97 Kubzansky et al. (2023)
World Happiness Report 2024
124
References
Aging in Place: Tips on Making Home Safe and Accessible.
(n.d.). National Institute on Aging. Retrieved September 21,
2023, from https://www.nia.nih.gov/health/infographics/
aging-place-tips-making-home-safe-and-accessible
Alzheimer’s Association. (2023a). Alzheimer’s Disease Facts
and Figures. https://www.alz.org/alzheimers-dementia/
facts-gures
Alzheimer’s Association. (2023b). What is Dementia? https://
www.alz.org/alzheimers-dementia/what-is-dementia
Alzheimer’s Disease International. (2023). Dementia statistics.
https://www.alzint.org/about/dementia-facts-gures/
dementia-statistics
Astell, A. J., Bouranis, N., Hoey, J., Lindauer, A., Mihailidis, A.,
Nugent, C., Robillard, J. M., & Technology and Dementia
Professional Interest Area ... (2019). Technology and Dementia:
The Future is Now. Dementia and Geriatric Cognitive Disorders,
47(3), 131–139. https://doi.org/10.1159/000497800
Beck, E. D., Yoneda, T., James, B. D., Bennett, D. A., Hassenstab,
J., Katz, M. J., ... & Graham, E. K. (2023). Personality predictors
of dementia diagnosis and neuropathological burden: An
individual participant data meta-analysis. Alzheimer’s &
Dementia.
Behera, C. K., Condell, J., Dora, S., Gibson, D. S., & Leavey, G.
(2021). State-of-the-Art Sensors for Remote Care of People
with Dementia during a Pandemic: A Systematic Review.
Sensors, 21(14), Article 14. https://doi.org/10.3390/s21144688
Bell, G., Singham, T., Saunders, R., John, A., & Stott, J. (2022).
Positive psychological constructs and association with reduced
risk of mild cognitive impairment and dementia in older adults:
A systematic review and meta-analysis. Ageing Research
Reviews, 77, 101594. https://doi.org/10.1016/j.arr.2022.101594
Berkheimer, S. D., Qian, C., & Malmstrom, T. K. (2017). Snoezel-
en Therapy as an Intervention to Reduce Agitation in Nursing
Home Patients With Dementia: A Pilot Study. Journal of the
American Medical Directors Association, 18(12), 1089–1091.
https://doi.org/10.1016/j.jamda.2017.09.009
Bowling, A., Rowe, G., Adams, S., Sands, P., Samsi, K., Crane, M.,
Joly, L., & Manthorpe, J. (2015). Quality of life in dementia: A
systematically conducted narrative review of dementia-specic
measurement scales. Aging & Mental Health, 19(1), 13–31.
https://doi.org/10.1080/13607863.2014.915923
Boyle, P. A., Buchman, A. S., Barnes, L. L., & Bennett, D. A.
(2010). Effect of a purpose in life on risk of incident Alzheimer
disease and mild cognitive impairment in community-dwelling
older persons. Archives of General Psychiatry, 67(3), 304–310.
https://doi.org/10.1001/archgenpsychiatry.2009.208
Boyle, P. A., Buchman, A. S., Wilson, R. S., Yu, L., Schneider, J.
A., & Bennett, D. A. (2012). Effect of purpose in life on the
relation between alzheimer disease pathologic changes on
cognitive function in advanced age. Archives of General
Psychiatry, 69(5), 499–504. https://doi.org/10.1001/archgen-
psychiatry.2011.1487
Brod, M., Stewart, A. L., Sands, L., & Walton, P. (1999). Concep-
tualization and measurement of quality of life in dementia: The
Dementia Quality of Life Instrument (DQoL). The Gerontologist,
39(1), 25–36. https://doi.org/10.1093/geront/39.1.25
Burgener, S. C., Twigg, P., & Popovich, A. (2005). Measuring
psychological well-being in cognitively impaired persons.
Dementia, 4(4), 463–485. https://doi.
org/10.1177/1471301205058303
Carr, A., Finneran, L., Boyd, C., Shirey, C., Canning, C., Stafford,
O., ... & Burke, T. (2023). The evidence-base for positive
psychology interventions: a mega-analysis of meta-analyses.
The Journal of Positive Psychology, 1-15.
Ciro, C. A., Anderson, M. P., Hershey, L. A., Prodan, C. I., & Holm,
M. B. (2015). Instrumental Activities of Daily Living Perfor-
mance and Role Satisfaction in People With and Without Mild
Cognitive Impairment: A Pilot Project. The American Journal of
Occupational Therapy, 69(3), 6903270020p1-6903270020p10.
https://doi.org/10.5014/ajot.2014.015198
Clarke, C., Woods, B., Moniz-Cook, E., Mountain, G., Øksnebjerg,
L., Chattat, R., Diaz, A., Gove, D., Vernooij-Dassen, M., &
Wolverson, E. (2020). Measuring the well-being of people with
dementia: A conceptual scoping review. Health and Quality of
Life Outcomes, 18(1), 249. https://doi.org/10.1186/s12955-020-
01440-x
Cox, H., Burns, I., & Savage, S. (2004). Multisensory Environ-
ments for Leisure: Promoting Well-being in Nursing Home
Residents With Dementia. Journal of Gerontological Nursing,
30(2), 37–45. https://doi.org/10.3928/0098-9134-20040201-
08
Cross, M. P., & Grimm, M. (2018). Subjective well-being and
physical health. Handbook of Well-Being.
Daly Lynn, J., Rondón-Sulbarán, J., Quinn, E., Ryan, A., McCor-
mack, B., & Martin, S. (2019). A systematic review of electronic
assistive technology within supporting living environments for
people with dementia. Dementia, 18(7–8), 2371–2435. https://
doi.org/10.1177/1471301217733649
de Medeiros, K., & Basting, A. (2014). “Shall I compare thee to a
dose of donepezil?”: Cultural arts interventions in dementia
care research. The Gerontologist, 54(3), 344–353. https://doi.
org/10.1093/geront/gnt055
Deci, E. L., & Ryan, R. M. (2011). Self-determination theory. In P.
A. M. Van Lange, E. T. Higgins, & A. W. Kruglanski (Eds.),
Handbook of theories of social psychology. Sage. http://digital.
casalini.it/9781446269008
Dewitte, L., Haugan, G., Vandenbulcke, mathieu, & Dezutter, J.
(2022). Living meaningfully with dementia. In Dementia &
society (pp. 63–80). Cambridge University Press. https://doi.
org/10.1017/9781108918954.005
Dewitte, L., Lewis, N. A., Payne, B. R., Turiano, N. A., & Hill, P. L.
(2021). Cross-lagged relationships between sense of purpose in
life, memory performance, and subjective memory beliefs in
adulthood over a 9-year interval. Aging & Mental Health, 25(11),
2018–2027. https://doi.org/10.1080/13607863.2020.1822284
Farina, N., Sherlock, G., Thomas, S., Lowry, R. G., & Banerjee, S.
(2019). Acceptability and feasibility of wearing activity
monitors in community-dwelling older adults with dementia.
International Journal of Geriatric Psychiatry, 34(4), 617–624.
https://doi.org/10.1002/gps.5064

World Happiness Report 2024
125
Galbraith, B., Larkin, H., Moorhouse, A., & Oomen, T. (2015).
Intergenerational programs for persons with dementia: A
scoping review. Journal of Gerontological Social Work, 58(4),
357–378. https://doi.org/10.1080/01634372.2015.1008166
Gerritzen, E. V., Hull, M. J., Verbeek, H., Smith, A. E., & de Boer,
B. (2020). Successful elements of intergenerational dementia
programs: A scoping review. Journal of Intergenerational
Relationships, 18(2), 214–245. https://doi.org/10.1080/1535077
0.2019.1670770
Gerstorf, D., Lövdén, M., Röcke, C., Smith, J., & Lindenberger, U.
(2007). Well-being affects changes in perceptual speed in
advanced old age: Longitudinal evidence for a dynamic link.
Developmental Psychology, 43(3), 705–718. https://doi.
org/10.1037/0012-1649.43.3.705
Gettel, C. J., Chen, K., & Goldberg, E. M. (2021). Dementia Care,
Fall Detection, and Ambient-Assisted Living Technologies Help
Older Adults Age in Place: A Scoping Review. Journal of
Applied Gerontology. https://doi.
org/10.1177/07334648211005868
Giebel, C. M., & Sutcliffe, C. (2018). Initiating activities of daily
living contributes to well-being in people with dementia and
their carers. International Journal of Geriatric Psychiatry, 33(1),
e94–e102. https://doi.org/10.1002/gps.4728
Górska, S., Forsyth, K., & Maciver, D. (2018). Living with
dementia: A meta-synthesis of qualitative research on the lived
experience. The Gerontologist, 58(3), e180–e196. https://doi.
org/10.1093/geront/gnw195
Gotanda, H., Tsugawa, Y., Xu, H., & Reuben, D. B. (2023). Life
satisfaction among persons living with dementia and those
without dementia. Journal of the American Geriatrics Society,
71(4), 1105–1116. https://doi.org/10.1111/jgs.18174
Grant, N., Wardle, J., & Steptoe, A. (2009). The Relationship
Between Life Satisfaction and Health Behavior: A Cross-cultural
Analysis of Young Adults. International Journal of Behavioral
Medicine, 16(3), 259–268. https://doi.org/10.1007/s12529-009-
9032-x
Grifths, A. W., Smith, S. J., Martin, A., Meads, D., Kelley, R., &
Surr, C. A. (2020). Exploring self-report and proxy-report
quality-of-life measures for people living with dementia in care
homes. Quality of Life Research, 29(2), 463–472. https://doi.
org/10.1007/s11136-019-02333-3
Haight, B. K., Gibson, F., & Michel, Y. (2006). The Northern
Ireland life review/life storybook project for people with
dementia. Alzheimer’s & Dementia, 2(1), 56–58. https://doi.
org/10.1016/j.jalz.2005.12.003
Haight, B. K., Jones, G. M. M., & Miesen, B. M. L. (1992). The
structured life-review process: A community approach to the
ageing client. In Caregiving in dementia: Research and
applications (Vol. 1, pp. 272–292).
Harris, J. Topfer, L., & Ford, C. (2017) Dementia Villages: Innova-
tive Residential Care for People With Dementia. https://www.
cadth.ca/dementia-villages-innovative-residential-care-peo-
ple-dementia
Harris, P. B., & Caporella, C. A. (2019). Making a university
community more dementia friendly through participation in an
intergenerational choir. Dementia, 18(7–8), 2556–2575. https://
doi.org/10.1177/1471301217752209
Hestevik, Christine Hillestad, Rosness, Tor, Holte, Hilde H., &
Bjerk, Maria. (2022, January 14). Dementia villages and other
modern forms of residential care for persons with dementia.
Norwegian Institute of Public Health. https://www.fhi.no/en/
publ/2022/Dementia-villages-and-other-modern-forms-of-resi-
dential-care-for-persons-with-dementia/
Hittner, E. F., Stephens, J. E., Turiano, N. A., Gerstorf, D.,
Lachman, M. E., & Haase, C. M. (2020). Positive affect is
associated with less memory decline: Evidence from a 9-year
longitudinal study. Psychological Science, 31(11), 1386–1395.
https://doi.org/10.1177/0956797620953883
Hoe, J., Katona, C., Roch, B., & Livingston, G. (2005). Use of the
QOL-AD for measuring quality of life in people with severe
dementia—The LASER-AD study. Age and Ageing, 34(2),
130–135. https://doi.org/10.1093/ageing/a030
Huang, C., Yan, Y., Lin, R., Sun, W., Ye, Y., Wang, N., & Li, H.
(2023). Effect of self-determination theory-based integrated
creative art (SDTICA) program on older adults with mild
cognitive impairment in nursing homes: Study protocol for a
cluster randomised controlled trial. BMC Geriatrics, 23(1), 238.
https://doi.org/10.1186/s12877-023-03896-0
Katschnig, H. (1997). How useful is the concept of quality of life
in psychiatry? Current Opinion in Psychiatry, 10(5). https://
journals.lww.com/co-psychiatry/fulltext/1997/09000/how_
useful_is_the_concept_of_quality_of_life_in.1.aspx
Kaufmann, E. G., & Engel, S. A. (2016). Dementia and well-be-
ing: A conceptual framework based on Tom Kitwood’s model
of needs. Dementia, 15(4), 774–788. https://doi.
org/10.1177/1471301214539690
Killen, A., & Macaskill, A. (2015). Using a gratitude intervention
to enhance well-being in older adults. Journal of Happiness
Studies, 16(4), 947–964. https://doi.org/10.1007/s10902-014-
9542-3
Kim, G., Shin, S. H., Scicolone, M. A., & Parmelee, P. (2019).
Purpose in life protects against cognitive decline among older
adults. The American Journal of Geriatric Psychiatry, 27(6),
593–601. https://doi.org/10.1016/j.jagp.2019.01.010
Krier, D., Boer, B. de, Hiligsmann, M., Wittwer, J., & Amieva, H.
(2023). Evaluation of Dementia-Friendly Initiatives, Small-Scale
Homelike Residential Care, and Dementia Village Models: A
Scoping Review. Journal of the American Medical Directors
Association, 24(7), 1020-1027.e1. https://doi.org/10.1016/j.
jamda.2023.03.024
Kruse, C. S., Fohn, J., Umunnakwe, G., Patel, K., & Patel, S.
(2020). Evaluating the Facilitators, Barriers, and Medical
Outcomes Commensurate with the Use of Assistive Technolo-
gy to Support People with Dementia: A Systematic Review
Literature. Healthcare, 8(3), Article 3. https://doi.org/10.3390/
healthcare8030278
Kubzansky, L. D., Kim, E. S., Boehm, J. K., Davidson, R. J.,
Huffman, J. C., Loucks, E. B., Lyubomirsky, S., Picard, R. W.,
Schueller, S. M., Trudel-Fitzgerald, C., VanderWeele, T. J.,
Warran, K., Yeager, D. S., Yeh, C. S., & Moskowitz, J. T. (2023).
Interventions to modify psychological well-being: Progress,
promises, and an agenda for future research. Affective Science,
4(1), 174–184. https://doi.org/10.1007/s42761-022-00167-w
World Happiness Report 2024
126
Lee, P.-L. (2016). A Joyful Heart is Good Medicine: Positive
Affect Predicts Memory Complaints. The American Journal of
Geriatric Psychiatry, 24(8), 662–670. https://doi.org/10.1016/j.
jagp.2016.04.001
Leung, P., Orrell, M., & Orgeta, V. (2015). Social support group
interventions in people with dementia and mild cognitive
impairment: A systematic review of the literature. International
Journal of Geriatric Psychiatry, 30(1), 1–9. https://doi.
org/10.1002/gps.4166
Liu, L., Miguel Cruz, A., Ruptash, T., Barnard, S., & Juzwishin, D.
(2017). Acceptance of Global Positioning System (GPS)
Technology Among Dementia Clients and Family Caregivers.
Journal of Technology in Human Services, 35(2), 99–119.
https://doi.org/10.1080/15228835.2016.1266724
Livingston, G., Huntley, J., Sommerlad, A., Ames, D., Ballard, C.,
Banerjee, S., Brayne, C., Burns, A., Cohen-Manseld, J., Cooper,
C., Costafreda, S. G., Dias, A., Fox, N., Gitlin, L. N., Howard, R.,
Kales, H. C., Kivimäki, M., Larson, E. B., Ogunniyi, A., … Mukad-
am, N. (2020). Dementia prevention, intervention, and care:
2020 report of the Lancet Commission. The Lancet,
396(10248), 413–446. https://doi.org/10.1016/S0140-
6736(20)30367-6
Logsdon, R. G., Gibbons, L. E., McCurry, S. M., & Teri, L. (1999).
Quality of life in Alzheimer’s disease: Patient and caregiver
reports. Journal of Mental Health and Aging, 5(1), 21–32.
Logsdon, R. G., McCurry, S. M., & Teri, L. (2007). Evi-
dence-based interventions to improve quality of life for
individuals with dementia. Alzheimers Care Today, 8, 309.
Ma, Y.-H., Yang, Y.-X., Shen, X.-N., Chen, S.-D., Tan, L., Dong, Q.,
& Yu, J.-T. (2021). Evaluation relationships between subjective
wellbeing, personality traits, and Alzheimer’s disease: A
two-sample Mendelian randomization study. Journal of
Psychiatric Research, 137, 498–505. https://doi.org/10.1016/j.
jpsychires.2021.03.033
Malmgren Fänge, A., Carlsson, G., Chiatti, C., & Lethin, C.
(2020). Using sensor-based technology for safety and
independence – the experiences of people with dementia and
their families. Scandinavian Journal of Caring Sciences, 34(3),
648–657. https://doi.org/10.1111/scs.12766
Martyr, A., Nelis, S. M., Quinn, C., Wu, Y.-T., Lamont, R. A.,
Henderson, C., Clarke, R., Hindle, J. V., Thom, J. M., Jones, I. R.,
Morris, R. G., Rusted, J. M., Victor, C. R., & Clare, L. (2018).
Living well with dementia: A systematic review and correlation-
al meta-analysis of factors associated with quality of life,
well-being and life satisfaction in people with dementia.
Psychological Medicine, 48(13), 2130–2139. Cambridge Core.
https://doi.org/10.1017/S0033291718000405
McClendon, M. J., Smyth, K. A., & Neundorfer, M. M. (2006).
Long-Term-Care Placement and Survival of Persons With
Alzheimer’s Disease. The Journals of Gerontology: Series B,
61(4), P220–P227. https://doi.org/10.1093/geronb/61.4.P220
Meléndez, J. C., Satorres, E., Redondo, R., Escudero, J., &
Pitarque, A. (2018). Wellbeing, resilience, and coping: Are there
differences between healthy older adults, adults with mild
cognitive impairment, and adults with Alzheimer-type demen-
tia? Archives of Gerontology and Geriatrics, 77, 38–43. https://
doi.org/10.1016/j.archger.2018.04.004
Middleton, L. E., & Yaffe, K. (2009). Promising Strategies for the
Prevention of Dementia. Archives of Neurology, 66(10),
1210–1215. https://doi.org/10.1001/archneurol.2009.201
Missotten, P., Squelard, G., Ylieff, M., Di Notte, D., Paquay, L., De
Lepeleire, J., & Fontaine, O. (2008). Quality of life in older
Belgian people: Comparison between people with dementia,
mild cognitive impairment, and controls. International Journal
of Geriatric Psychiatry, 23(11), 1103–1109. https://doi.
org/10.1002/gps.1981
Nyman, S. R., & Szymczynska, P. (2016). Meaningful activities
for improving the wellbeing of people with dementia: Beyond
mere pleasure to meeting fundamental psychological needs.
Perspectives in Public Health, 136(2), 99–107. https://doi.
org/10.1177/1757913915626193
Orgeta, V., Tuijt, R., Leung, P., Verdaguer, E. S., Gould, R. L.,
Jones, R., & Livingston, G. (2019). Behavioral activation for
promoting well-being in mild dementia: Feasibility and
outcomes of a pilot randomized controlled trial. Journal of
Alzheimer’s Disease, 72(2), 563–574. https://doi.org/10.3233/
JAD-190696
Pappadà, A., Chattat, R., Chirico, I., Valente, M., & Ottoboni, G.
(2021). Assistive Technologies in Dementia Care: An Updated
Analysis of the Literature. Frontiers in Psychology, 12, 644587.
https://doi.org/10.3389/fpsyg.2021.644587
Peitsch, L., Tyas, S. L., Menec, V. H., & John, P. D. S. (2016).
General life satisfaction predicts dementia in community living
older adults: A prospective cohort study. International
Psychogeriatrics, 28(7), 1101–1109. https://doi.org/10.1017/
S1041610215002422
Proulx, J. D. E., Van de Vondervoort, J. W., Hamlin, J. K.,
Helliwell, J. F., & Aknin, L. B. (2023). Are real-world prosociality
programs associated with greater psychological well-being in
primary school-aged children? International Journal of
Environmental Research and Public Health, 20(5). https://doi.
org/10.3390/ijerph20054403
Ramírez, E., Ortega, A. R., Chamorro, A., & Colmenero, J. M.
(2014). A program of positive intervention in the elderly:
Memories, gratitude and forgiveness. Aging & Mental Health,
18(4), 463–470. https://doi.org/10.1080/13607863.2013.856858
Ratnayake, M., Lukas, S., Brathwaite, S., Neave, J., & Henry, H.
(2022). Aging in Place: Delaware Journal of Public Health, 8(3),
28–31. https://doi.org/10.32481/djph.2022.08.007
Rawtaer, I., Gao, Q., Nyunt, M. S. Z., Feng, L., Chong, M. S., Lim,
W. S., Lee, T.-S., Yap, P., Yap, K. B., & Ng, T. P. (2017). Psycho-
social risk and protective factors and incident mild cognitive
impairment and dementia in community dwelling elderly:
Findings from the singapore longitudinal ageing study. Journal
of Alzheimer’s Disease, 57(2), 603–611. https://doi.org/10.3233/
JAD-160862
Ready, R. E., Ott, B. R., & Grace, J. (2004). Patient versus
informant perspectives of quality of life in mild cognitive
impairment and Alzheimer’s Disease. International Journal of
Geriatric Psychiatry, 19(3), 256–265. https://doi.org/10.1002/
gps.1075

World Happiness Report 2024
127
Rios Rincon, A. M., Miguel Cruz, A., Daum, C., Neubauer, N.,
Comeau, A., & Liu, L. (2022). Digital Storytelling in Older Adults
With Typical Aging, and With Mild Cognitive Impairment or
Dementia: A Systematic Literature Review. Journal of Applied
Gerontology, 41(3), 867–880. https://doi.
org/10.1177/07334648211015456
Römhild, J., Fleischer, S., Meyer, G., Stephan, A., Zwakhalen, S.,
Leino-Kilpi, H., Zabalegui, A., Saks, K., Soto-Martin, M., Sutcliffe,
C., Rahm Hallberg, I., Berg, A., & on behalf of the RightTime-
PlaceCare Consortium. (2018). Inter-rater agreement of the
Quality of Life-Alzheimer’s Disease (QoL-AD) self-rating and
proxy rating scale: Secondary analysis of RightTimePlaceCare
data. Health and Quality of Life Outcomes, 16(1), 131. https://
doi.org/10.1186/s12955-018-0959-y
Ryan, R. M., & Deci, E. L. (2017). Self-Determination Theory:
Basic Psychological Needs in Motivation, Development, and
Wellness. Guilford Publications. https://books.google.com/
books?id=Bc_DDAAAQBAJ
Shropshire, M. (2020). Reminiscence intervention for communi-
ty-dwelling older adults without dementia: A literature review.
British Journal of Community Nursing, 25(1), 40–44. https://doi.
org/10.12968/bjcn.2020.25.1.40
Shryock, S. K., & Meeks, S. (2022). Activity, activity personaliza-
tion, and well-being in nursing home residents with and without
cognitive impairment: An integrative review. Clinical Gerontolo-
gist, 45(5), 1058–1072. https://doi.org/10.1080/07317115.2020.1
844356
Sin, N. L. (2016). The Protective Role of Positive Well-Being in
Cardiovascular Disease: Review of Current Evidence, Mecha-
nisms, and Clinical Implications. Current Cardiology Reports,
18(11), 106. https://doi.org/10.1007/s11886-016-0792-z
Smith, J. L., & Hanni, A. A. (2019). Effects of a savoring
intervention on resilience and well-being of older adults.
Journal of Applied Gerontology, 38(1), 137–152. https://doi.
org/10.1177/0733464817693375
Social activity, cognitive decline and dementia risk: A 20-year
prospective cohort study | BMC Public Health | Full Text. (n.d.).
Retrieved October 10, 2023, from https://bmcpublichealth.
biomedcentral.com/articles/10.1186/s12889-015-2426-6
Soilemezi, D., Drahota, A., Crossland, J., & Stores, R. (2019). The
Role of the Home Environment in Dementia Care and Support:
Systematic review of Qualitative Research. Dementia, 18(4),
1237–1272. https://doi.org/10.1177/1471301217692130
Solé, C., Celdrán, M., & Cifre, I. (2022). Psychological and
Behavioral Effects of Snoezelen Rooms on Dementia. Activities,
Adaptation & Aging, 0(0), 1–16. https://doi.org/10.1080/019247
88.2022.2151805
Stites, S. D., Karlawish, J., Harkins, K., Rubright, J. D., & Wolk, D.
(2017). Awareness of mild cognitive impairment and mild
Alzheimer’s Disease dementia diagnoses associated with lower
self-ratings of quality of life in older adults. The Journals of
Gerontology: Series B, 72(6), 974–985. https://doi.org/10.1093/
geronb/gbx100
Subramaniam, P., & Woods, B. (2012). The impact of individual
reminiscence therapy for people with dementia: Systematic
review. Expert Review of Neurotherapeutics, 12(5), 545–555.
https://doi.org/10.1586/ern.12.35
Sutin, A. R., Luchetti, M., Stephan, Y., & Terracciano, A. (2020).
Meaning in life and risk of cognitive impairment: A 9-Year
prospective study in 14 countries. Archives of Gerontology and
Geriatrics, 88, 104033. https://doi.org/10.1016/j.arch-
ger.2020.104033
Sutin, A. R., Stephan, Y., & Terracciano, A. (2018). Psychological
well-being and risk of dementia. International Journal of
Geriatric Psychiatry, 33(5), 743–747. https://doi.org/10.1002/
gps.4849
Tam, W., Poon, S. N., Mahendran, R., Kua, E. H., & Wu, X. V.
(2021). The effectiveness of reminiscence-based intervention
on improving psychological well-being in cognitively intact
older adults: A systematic review and meta-analysis. Interna-
tional Journal of Nursing Studies, 114, 103847. https://doi.
org/10.1016/j.ijnurstu.2020.103847
Thorgrimsen, L., Selwood, A., Spector, A., Royan, L., de
Madariaga Lopez, M., Woods, R. T., & Orrell, M. (2003). Whose
quality of life is it anyway?: The validity and reliability of the
Quality of Life-Alzheimer’s Disease (QoL-AD) Scale. Alzheimer
Disease & Associated Disorders, 17(4). https://journals.lww.
com/alzheimerjournal/fulltext/2003/10000/whose_quality_
of_life_is_it_anyway___the_validity.2.aspx
Tominari, M., Uozumi, R., Becker, C., & Kinoshita, A. (2021).
Reminiscence therapy using virtual reality technology affects
cognitive function and subjective well-being in older adults
with dementia. Cogent Psychology, 8(1), 1968991. https://doi.or
g/10.1080/23311908.2021.1968991
Tummers, A. I. M., Hillen, M. F., De Kort, Y. A. W., & Ijsselsteijn,
W. A. (2020). Use of robotic animal companions in dementia
care: A qualitative study of the immediate and long-term
effects to enhance quality of life and feelings of wellbeing for
individuals living with dementia. Annual Review of CyberThera-
py and Telemedicine, 18, 45–49. APA PsycInfo.
Tyack, C., & Camic, P. M. (2017). Touchscreen interventions and
the well-being of people with dementia and caregivers: A
systematic review. International Psychogeriatrics, 29(8),
1261–1280. Cambridge Core. https://doi.org/10.1017/
S1041610217000667
Tyack, C., Camic, P. M., Heron, M. J., & Hulbert, S. (2017).
Viewing art on a tablet computer: A well-being intervention for
people with dementia and their caregivers. Journal of Applied
Gerontology, 36(7), 864–894. https://doi.
org/10.1177/0733464815617287
Ueda, T., Suzukamo, Y., Sato, M., & Izumi, S.-I. (2013). Effects of
music therapy on behavioral and psychological symptoms of
dementia: A systematic review and meta-analysis. Ageing
Research Reviews, 12(2), 628–641. https://doi.org/10.1016/j.
arr.2013.02.003
van de Beek, M., van Steenoven, I., Ramakers, I. H. G. B., Aalten,
P., Koek, H. L., Olde Rikkert, M. G. M., Manniën, J., Papma, J. M.,
de Jong, F. J., Lemstra, A. W., & van der Flier, W. M. (2019).
Trajectories and determinants of quality of life in dementia with
lewy bodies and Alzheimer’s Disease. Journal of Alzheimer’s
Disease, 70(2), 389–397. https://doi.org/10.3233/JAD-190041
Van Weert, J. C. M., Van Dulmen, A. M., Spreeuwenberg, P. M.
M., Ribbe, M. W., & Bensing, J. M. (2005). Behavioral and Mood
Effects of Snoezelen Integrated into 24-Hour Dementia Care.
Journal of the American Geriatrics Society, 53(1), 24–33.
https://doi.org/10.1111/j.1532-5415.2005.53006.x
World Happiness Report 2024
128
Wagner, M., Guimond, A.-J., Kubzansky, L. D., Zhang, Y.,
Bennett, D. A., Barnes, L. L., & Grodstein, F. (2022). Negative
and Positive Psychosocial Factors in Relation to Cognitive
Health in Older African Americans. Innovation in Aging, 6(3),
igac019. https://doi.org/10.1093/geroni/igac019
Wiles, J. L., Leibing, A., Guberman, N., Reeve, J., & Allen, R. E. S.
(2012). The Meaning of “Aging in Place” to Older People. The
Gerontologist, 52(3), 357–366. https://doi.org/10.1093/geront/
gnr098
Willroth, E. C., James, B. D., Graham, E. K., Kapasi, A., Bennett,
D. A., & Mroczek, D. K. (2022). Well-being and cognitive
resilience to dementia-related neuropathology. Psychological
Science, 09567976221119828. https://doi.
org/10.1177/09567976221119828
Willroth, E. C., Pfund, G. N., McGhee, C., & Rule, P. (2023).
Well-being as a protective factor against cognitive decline and
dementia: A review of the literature and directions for future
research. The Journals of Gerontology: Series B, 78(5),
765–776. https://doi.org/10.1093/geronb/gbad020
Wilson, R. S., Boyle, P. A., Segawa, E., Yu, L., Begeny, C. T.,
Anagnos, S. E., & Bennett, D. A. (2013). The inuence of
cognitive decline on well-being in old age. Psychology and
Aging, 28(2), 304–313. https://doi.org/10.1037/a0031196
Wolverson, E. L., Clarke, C., & Moniz-Cook, E. D. (2016). Living
positively with dementia: A systematic review and synthesis of
the qualitative literature. Aging & Mental Health, 20(7),
676–699. https://doi.org/10.1080/13607863.2015.1052777
Woods, B., O’Philbin, L., Farrell, E., Spector, A., & Orrell, M.
(2018). Reminiscence therapy for dementia. Cochrane Database
of Systematic Reviews, 3. https://doi.org/10.1002/14651858.
CD001120.pub3
World Health Organization. (2020). Decade of Healthy Aging
2021-2030.
Xu, L., Fields, N. L., Daniel, K. M., Cipher, D. J., & Troutman, B. A.
(2023). Reminiscence and digital storytelling to improve the
social and emotional well-being of older adults with Alzhei-
mer’s Disease and related dementias: Protocol for a mixed
methods study design and a randomized controlled trial. JMIR
Res Protoc, 12, e49752. https://doi.org/10.2196/49752
Zainal, N. H., & Newman, M. G. (2022). Life satisfaction prevents
decline in working memory, spatial cognition, and processing
speed: Latent change score analyses across 23 years. European
Psychiatry, 65(1), e27. https://doi.org/10.1192/j.eurpsy.2022.19
Zhu, X., Luchetti, M., Aschwanden, D., Sesker, A. A., Stephan, Y.,
Sutin, A. R., & Terracciano, A. (2022). Satisfaction With Life and
Risk of Dementia: Findings From the Korean Longitudinal
Study of Aging. The Journals of Gerontology: Series B, 77(10),
1831–1840. https://doi.org/10.1093/geronb/gbac064

Chapter 5
Differences in Life
Satisfaction among
Older Adults in India
Ronak Paul
Senior Research Fellow
Department of Public Health and Mortality Studies
International Institute for Population Sciences
Manacy Pai, Ph.D.
Associate Professor
Department of Sociology and Criminology
Kent State University
Muhammad Thalil, Ph.D.
Postdoctoral Scholar, Center for Healthy Aging
The Pennsylvania State University
Shobhit Srivastava, Ph.D.
Independent Researcher
Acknowledgement: we would like to express our sincere gratitude to the editors
for their invaluable insights and suggestions on our chapter drafts.
doi.org/10.18724/whr-2f21-he52
This version last updated March 8, 2024. Please see worldhappiness.report for latest data.
5
Though population aging reects
social and economic progress,
scientists across the globe
continue to debate the factors
that contribute to quality of life
in older age.
Photo Sapeksh Singh Siwach on Unsplash

World Happiness Report 2024
131
Photo Sapeksh Singh Siwach on Unsplash
Key Insights
Older age is associated with higher life satisfaction in India,
refuting some claims that the positive association between age
and life satisfaction only exists in high-income nations.
On average, older men in India are more satised with life than
older women (Table 5.1), but when taking all other measures into
account, older women report higher life satisfaction than their
male counterparts (Table 5.2).
Older adults with secondary or higher education and those of
higher social castes report higher life satisfaction than counterparts
without formal education and those from scheduled castes and
scheduled tribes.
Satisfaction with living arrangements, perceived discrimination,
and self-rated health emerge as the top three predictors of life
satisfaction in this study.

World Happiness Report 2024
132
India’s older population is the second largest
worldwide, with 140 million Indians aged 60 and
over, second only to its 250 million Chinese
counterparts.1 Additionally, the average growth
rate for Indians aged 60 and above is three times
higher than the overall population growth rate of
the country.2 Though population aging reects
social and economic progress, scientists across
the globe continue to debate the factors that
contribute to quality of life in older age.
Life satisfaction, which is the best indicator of
quality of life3 reects the subjective assessment
of one’s life as a whole. Although participants,
when inquired, rate their present quality of life,
life satisfaction in older ages may serve as a
measure to evaluate whether one’s life has been
successful overall.4 Older adults with higher life
satisfaction report healthy behaviors5, which
translates into better overall health.6 However,
it can become difcult to maintain higher levels
of life satisfaction with advancing age, often
accompanied by social, physical, and mental
health challenges.7 As such, zeroing in on the
factors that contribute to life satisfaction is
central to creating policies and programs that
can improve the quality of life in older ages.8
A systematic review of 24 studies among
older adults (60+ years) in Asian countries,
including India, has identied age, gender,
social relationships, social engagement, living
arrangements, education, income, caste, religion,
health behaviors, health conditions, and health
care to affect life satisfaction in later life.9 Few
studies have examined life satisfaction among
older adults in India, yet those that have found
that factors such as poor childhood, nancial
status, lack of social support in late life, physical
frailty, and feelings of loneliness are associated
with lower levels of life satisfaction.10 However,
past studies have focused on particular factors
determining satisfaction with life in old age,
meaning that comprehensive assessment of
diverse predictors of life satisfaction among older
men and women in a gendered sociocultural
context of India remains limited. In this chapter,
we strive to ll this gap by estimating the extent
to which various sociodemographic, household,
and health-related factors contribute to the
differences in life satisfaction among older
adults in India.
Methods
Data
This chapter used the baseline wave of the
Longitudinal Aging Study in India (LASI, 2017-19),
which is the Health and Retirement Studies’ (HRS)
Indian adaptation11. The LASI provides vital
information on demography, health symptoms,
conditions, disabilities, health service utilization,
household socioeconomic status, family and
social networks, and life expectations of 73,396
adults aged 45 years and above.12 LASI used a
Though population aging
reects social and economic
progress, scientists across
the globe continue to debate
the factors that contribute to
quality of life in older age.
Photo Amol Sonar on Unsplash

World Happiness Report 2024
133
multistage stratied area probability cluster
sampling design to arrive at the nal observation
units: older individuals aged 45 and above, as
well as their spouses of any age.13
This study used a sample of 31,902 individuals
aged 60 and above, whom we refer to as “older
adults’’ from here on forward. The sample who
responded to the questions on life satisfaction
totals 30,795 older adults.
Outcome Variable
All respondents reported their life satisfaction,
which served as this study’s primary outcome
variable. Life satisfaction is dened as a person’s
cognitive appraisal of their life as a whole.14
During LASI round-I, the interviewers collected
information on the following ve life satisfaction
indicators:
• In most ways, the respondents’ life is close
to ideal.
• The conditions of the respondents’ life
are excellent.
• The respondents are satised with their lives.
• The respondents have achieved the essential
things they want in their lives so far.
• If the respondents could relieve their life, they
would change almost nothing.
Ratings were provided on a scale ranging from
1-7, where one meant strongly disagree and seven
meant strongly agree. The life satisfaction score15
of older persons, which ranges from 5-35, was
then calculated by adding the ve indicators with
greater scores implying higher levels of life
satisfaction. To maintain comparability and
continuity with life satisfaction measures used in
other chapters of the World Happiness Report,
we transformed this life satisfaction variable into
a 0-10 scale by subtracting 5 and then dividing by
3. Notably, the average Indian older adult scored
6.32 points in the life satisfaction scale. It is worth
pointing out that life satisfaction in our study is
self-reported, thus there always lingers the
possibility of misreporting due to the fear of
social stigma.
Explanatory Variables
Given their relevance to older adults’ life
satisfaction, we included sociodemographic,
health, and household characteristics in this
study. The sociodemographic characteristics
of the older adults are:
• Age group was coded as young-old (60-69
years), old-old (70-79 years), and oldest-old
(80+ years).
• Gender was coded as male and female.
• Level of education was coded as no formal
education, up to primary, secondary and
above.
• Work status was categorized as never
worked, currently not working, currently
working, and retired.
• Marital status was coded as currently not
married and currently married.
• The importance of religion was coded as
not important and important.
• Living arrangement satisfaction was coded
as satised, neutral, and not satised.
• Victim of ill-treatment (within one year of
the interview) was coded as no and yes.
• Perceived discrimination was coded as no
and yes.
• Social participation was coded as: socially
active and socially inactive. The family and
social networks module of the LASI survey
questionnaire includes detailed questions
about older adults’ participation and engage-
ment in social activities, organizations or
society. The survey asked participants whether
they were a member of any of the organizations,
religious groups, clubs, or societies from a
given list and how many meetings/regular
gatherings, if any, they attend in a year. Older
adults who engage in the above social activities
were classied as “socially active” and other-
wise as “socially inactive.”
World Happiness Report 2024
134
The next set of variables included the following
health-related characteristics of older adults:
• Depression symptoms were coded as: 0 “Not
depressed” and 1 “Depressed.” Major depres-
sion among older adults with symptoms of
dysphoria was calculated using the CIDI-SF
(Short Form Composite International Diag-
nostic Interview), with a cut-point of 3 on a
scale of 0-10.16 This scale estimates a probable
psychiatric diagnosis of major depression and
has been validated in eld settings and widely
used in population-based health surveys.
• Self-rated health was coded as good, average,
and poor.
• Chronic morbidity was coded as: no condition,
single condition, or multiple conditions. LASI
collected information on whether an older
adult was ever diagnosed with hypertension
or high blood pressure, diabetes or high blood
pressure, cancer or malignant tumor, chronic
lung diseases, chronic heart diseases, stroke,
bone, or joint diseases, any neurological or
psychological problems, or high cholesterol.
Individuals having no diseases, any one of
the diseases and two or more diseases were
categorized into “no condition”, “single
condition”, and “multiple conditions,”
respectively.
• Physical activity was coded as: physically
inactive or physically active. Physical activity
was assessed based on WHO guidelines for
persons aged 18 and above.17 Older adults
who performed at least 75 minutes of
vigorous-intensity physical activity or at
least 150 minutes of moderate-intensity
physical activity in a day or a combination
of both were classied as “physically active.”
Otherwise, they were categorized as
“physically inactive”.
• Difculty in Activities of Daily Living (ADL)
included items on whether older adults
experienced any difculty with the following
six activities: (a) walking across a room, (b)
dressing, (c) bathing, (d) eating, (e) getting in
and out of bed, and (f) toileting. Responses
for the six items (1 = yes; 0 = no) were
summed, with higher scores indicating more
activity limitations (range: 0–6). Older individ-
uals who struggled with activities for more
than three months were labeled “faces dif-
culties.” The “no difculty” group comprised
those with no trouble with any of the ADLs.
We included ADLs given that difculty in
everyday functioning and independence can
be crucial for one’s life satisfaction.
• Difculty in Instrumental Activities of Daily
Living (IADL) included items on whether older
adults experienced any difculty when per-
forming the following seven activities: grocery
shopping, preparing meals, making phone
calls, taking medication, doing household
chores, managing nances, and getting
oneself to an otherwise unfamiliar location.
Each item response was coded as 0 = no
difculty or 1 = any difculty. Those who
reported trouble with any of these activities
for more than three months were labeled
“faces difculties.” Otherwise, they were
categorized as having “no difculty.” Even
though IADLs may not require hands-on-per-
sonal assistance, difculty in executing IADLs
may compromise independent living, which
could adversely affect life satisfaction.
• Covered by any health insurance was coded
as yes, no.
Further, we considered the following house-
hold-related characteristics –
• Based on recommendations for “better”
indicators of SES in LMICs18older adults’ SES
was assessed using the monthly per-capita
consumption expenditure (MPCE) quintile.
Sets of 11 and 29 questions on the expendi-
tures on food and non-food items, respectively,
were used to canvass the sample households.
Food expenditure was collected based on a
reference period of seven days, while the
non-food expenditure was collected using
reference periods of 30 days and 365 days.19
Food and non-food expenditures have been
standardized to the 30-day reference period.
The income quintile variable was divided into
ve quintiles i.e., from poorest to richest.
• Religious afliation was coded as Hinduism,
Islam, and Others.

World Happiness Report 2024
135
Photo Jeet Dhanoa on Unsplash
World Happiness Report 2024
136
• Given the documented link between poorer
health and lower SES among certain castes,20
we also included respondent’s self-reported
social group, and categories were Scheduled
Tribe (ST), Scheduled Caste (SC), Other
Backward Class (OBC) and Others.
• The place of residence was coded as rural
or urban.
• The region of residence (south, north, central,
western, eastern, and north-eastern) was also
included as a covariate in the analyses to
assess regional disparities. This variable was
constructed by including the 29 states and
six union territories of India during 2017-1821
into six categories based on administrative
similarity.
Statistical Methods
We began by showing older adults’ absolute
and percentage distributions based on their
background characteristics. Bivariate analysis
examined variations in older adults’ average
life satisfaction score by their background
characteristics. Additionally, one-way ANOVA
tests were used to discern the difference in
average life satisfaction scores across the
independent variables. Further, multivariable
linear regression analysis was used to examine
the associations between the life satisfaction
score and the independent variables. The partial
correlation coefcients in regression models
showed the difference in the life satisfaction
score of older adults belonging to a specic
category compared to older adults from the
reference category, given that the effect of all the
other independent variables remains constant.22
Next, dominance analysis (DA)23 was used to
determine the relative importance of independent
variables in explaining the variation in the out-
come variable.24 Here, we used the DA method
developed by Budescu with the older adults’ life
satisfaction score as the outcome variable.25
The DA computed sub-regression models with
the same outcome variable and different sets
of independent variables to determine the
contribution of each predictor to the overall
model prediction power denoted by the
coefcient of determination statistic (R2). The
DA gives the dominance statistic that denotes
the prediction power of each predictor, the
percentage variation in older adults’ life
satisfaction explained by each predictor and
ranks showing the relative importance of each
predictor variable.26
Our background checks showed that the regression
models did not violate the multicollinearity and
heteroscedasticity assumptions. Standard errors
were corrected for weighting and clustering in all
estimations, given that LASI utilized a multistage
sampling strategy.
Results
Table 5.1 presents an overview of the socio-
economic and demographic characteristics of
the study participants. The distribution reveals
that 11% of the older adults fell into the oldest-old
age group, with 59% categorized as young-old
and 30% as old-old. Approximately 53% of the
participants were women. Notably, 56% had not
pursued formal education, while 21% had attained
secondary or higher education levels. In terms of
employment status, 7% were retired, while nearly
31% were currently working. Furthermore, 38%
were not currently married, and for 21% of the
participants, religion held no importance.
Concerningly, 6% expressed dissatisfaction with
their current living arrangements. Instances of ill
treatment were reported by 5% of respondents,
while 18% reported experiencing discrimination
at some point. Social inactivity affected almost
9% of participants, with a similar proportion
experiencing depression. Moreover, 23% rated
their health as poor, and 24% reported having
multiple health conditions. Physical inactivity was
prevalent among 72% of older adults, and 23%
faced difculty with Activities of Daily Living
(ADL), while 48% encountered challenges with
Instrumental Activities of Daily Living (IADL).
Alarmingly, only 18% had health insurance coverage.

World Happiness Report 2024
137
Table 5.1: Distribution of older adults by socio-demographic, health-related,
and household characteristics in India 2017–19
Note: (a) N: Unweighted sample size, %: Unweighted percentage;
(b) ADL: Activities of daily living, IADL: Instrumental activities of daily living.
Characteristics All older adults
N %
Age group
Young-old 18,755 60.9
Old-old 8,898 28.9
Oldest-old 3,142 10.2
Gender
Male 14,785 48.0
Female 16,010 52.0
Level of education
No formal education 16,514 53.6
Up to primary 7,417 24.1
Secondary and above 6,864 22.3
Working status
Currently working 8,861 28.8
Currently not working 10,558 34.3
Never worked 8,751 28.4
Retired 2,625 8.5
Current marital status
Currently not married 11,146 36.2
Currently married 19,649 63.8
Importance of religion
Not important 5,979 19.4
Very important 24,816 80.6
Living arrangement satisfaction
Not satised 1,421 4.6
Neutral 5,248 17.0
Satised 24,126 78.3
Received ill-treatment
Yes 1,267 4.1
No 29,528 95.9
Faces discrimination in life
Yes 4,750 15.4
No 26,045 84.6
Social participation
Socially inactive 2,474 8.0
Socially active 28,321 92.0
Depression symptoms
Depressed 2,104 6.8
Not depressed 28,691 93.2
Self-rated health
Poor 6,686 21.7
Average 19,624 63.7
Good 4,485 14.6
Characteristics All older adults
N %
Chronic morbidity status
No condition 14,079 45.7
Single condition 9,134 29.7
Multiple conditions 7,582 24.6
Physical activity status
Physically active 7,984 25.9
Physically inactive 22,811 74.1
Difculty in ADL
Faces difculty 6,295 20.4
No difculty 24,500 79.6
Difculty in IADL
Faces difculty 13,359 43.4
No difculty 17,436 56.6
Covered by health insurance
No 24,355 79.1
Yes 6,440 20.9
Household income quintile
Poor 12,656 41.1
Not poor 18,139 58.9
Religion of household
Hinduism 22,528 73.2
Islam 3,582 11.6
Others 4,685 15.2
Caste of household
SC-ST group 10,111 32.8
Non-SC-ST group 20,684 67.2
Place of residence
Rural 20,383 66.2
Urban 10,412 33.8
Country Region
Southern 7,291 23.7
Northern 7,726 25.1
Central 2,017 6.5
Western 4,133 13.4
Eastern 5,601 18.2
North-eastern 4,027 13.1
Aggregate number 30,795 100.0

World Happiness Report 2024
138
Figure 5.1 represents the bar plot for life satisfac-
tion score by gender and marital status among
older adults. In all age groups, unmarried women
reported the lowest levels of life satisfaction.
Fig. 5.1: Represents the bar plot for life satisfaction score by gender and marital status
among older adults. In all age groups, unmarried women reported the lowest levels of
life satisfaction.
Male and married
Male and not married
Female and married
Female and not married
Gender Marital Status
Mean LS score with 95% CI
Youngest-old
6.4 6.1
6.4
6
Old-old
6.5 6.2 6.4
6
Oldest-old
6.4 6.4 6.4 6.2
In Table 5.2, we delve into the life satisfaction of
older adults based on their backgrounds. Notably,
women consistently reported lower life satisfaction
than men, while those without formal education
tended to show signicantly lower satisfaction
compared to their educated peers. Retirement
seemed to correlate with lower satisfaction levels,
contrasting with those still in the workforce.
Interestingly, unmarried individuals, those less
concerned with religion, and those discontent
with their living situations displayed notably
lower satisfaction scores. Moreover, experiences
of ill-treatment or discrimination, social inactivity,
depression, poor self-rated health, and difculties
with daily activities were all linked to diminished
life satisfaction among older adults. Financial
status, caste, and rural residence also emerged as
inuential factors, with those from the western
region of India reporting the highest satisfaction
levels, followed by counterparts in the central,
north-eastern, and northern regions.

World Happiness Report 2024
139
Table 5.2: Life satisfaction score summary of older adults by socio-demographic,
health-related, and household characteristics in India 2017-18
Note: (a) Mean: Average life satisfaction score, SD: Standard deviation;
(b) ADL: Activities of daily living, IADL: Instrumental activities of daily living.
Characteristics Life satisfaction score of older adults
Mean SD ANOVA statistic
(p-value)
Age group
Young-old 6.3 2.4 1.17 (0.3111)
Old-old 6.3 2.4
Oldest-old 6.3 2.4
Gender
Male 6.4 2.4 43.60 (<0.001)
Female 6.2 2.4
Level of education
No formal education 6.0 2.4 438.18 (<0.001)
Up to primary 6.4 2.3
Secondary and above 7.0 2.3
Working status
Currently working 6.2 2.4 139.50 (<0.001)
Currently not working 6.1 2.5
Never worked 6.3 2.4
Retired 7.2 2.2
Current marital status
Currently not married 6.1 2.5 162.34 (<0.001)
Currently married 6.4 2.4
Importance of religion
Not important 5.7 2.5 511.95 (<0.001)
Very important 6.5 2.4
Living arrangement satisfaction
Not satised 3.8 2.6 1836.82 (<0.001)
Neutral 5.2 2.4
Satised 6.7 2.2
Received ill-treatment
Yes 5.0 2.7 373.07 (<0.001)
No 6.4 2.4
Faces discrimination in life
Yes 5.5 2.5 740.61 (<0.001)
No 6.5 2.4
Social participation
Socially inactive 5.9 2.8 94.96 (<0.001)
Socially active 6.4 2.4
Depression symptoms
Depressed 5.2 2.7 492.64 (<0.001)
Not depressed 6.4 2.4
Self-rated health
Poor 5.6 2.6 465.96 (<0.001)
Average 6.4 2.3
Good 6.9 2.3
Characteristics Life satisfaction score of older adults
Mean SD ANOVA statistic
(p-value)
Chronic morbidity status
No condition 6.3 2.4 4.08 (0.0169)
Single condition 6.3 2.4
Multiple conditions 6.4 2.5
Physical activity status
Physically active 6.3 2.3 4.67 (0.0306)
Physically inactive 6.3 2.4
Difculty in ADL
Faces difculty 6.0 2.5 98.13 (<0.001)
No difculty 6.4 2.4
Difculty in IADL
Faces difculty 6.0 2.4 411.81 (<0.001)
No difculty 6.6 2.4
Covered by health insurance
No 6.4 2.4 43.08 (<0.001)
Yes 6.1 2.5
Household income quintile
Poor 6.1 2.4 163.82 (<0.001)
Not poor 6.5 2.4
Religion of household
Hinduism 6.3 2.5 25.38 (<0.001)
Islam 6.2 2.3
Others 6.5 2.2
Caste of household
SC-ST group 6.1 2.3 109.18 (<0.001)
Non-SC-ST group 6.4 2.4
Place of residence
Rural 6.1 2.4 307.40 (<0.001)
Urban 6.7 2.4
Country Region
Southern 6.0 2.6 214.00 (<0.001)
Northern 6.3 2.3
Central 6.3 2.6
Western 7.3 2.2
Eastern 5.9 2.3
North-eastern 6.5 2.0
Overall life satisfaction score 6.3 2.4

World Happiness Report 2024
140
Table 5.3: Multivariable association between life satisfaction and socio-demographic,
health-related and household characteristics of older adults in India 2017-18 from linear
regression models
Note: (a) Coef: Partial correlation coefcients, CI: Condence Interval, (ref): Reference category;
(b) ADL: Activities of daily living, IADL: Instrumental activities of daily living.
Characteristics Life satisfaction of older adults
Coef 95% CI p-value
Age group
Young-old (ref)
Old-old 0.090 (0.031, 0.149) 0.003
Oldest-old 0.241 (0.150, 0.332) <0.001
Gender
Male (ref)
Female 0.085 (0.017, 0.153) 0.014
Level of education
No formal education (ref)
Up to primary 0.214 (0.146, 0.283) <0.001
Secondary and above 0.697 (0.616, 0.778) <0.001
Working status
Currently working (ref)
Currently not working -0.023 (-0.093, 0.047) 0.525
Never worked 0.138 (0.054, 0.222) 0.001
Retired 0.255 (0.140, 0.370) <0.001
Current marital status
Currently not married (ref)
Currently married 0.126 (0.067, 0.185) <0.001
Importance of religion
Not important (ref)
Very important 0.218 (0.153, 0.283) <0.001
Living arrangement satisfaction
Not satised (ref)
Neutral 1.107 (0.984, 1.229) <0.001
Satised 2.270 (2.154, 2.385) <0.001
Received ill-treatment
Yes (ref)
No 0.368 (0.248, 0.488) <0.001
Faces discrimination in life
Yes (ref)
No 0.511 (0.440, 0.582) <0.001
Social participation
Socially inactive (ref)
Socially active 0.086 (-0.007, 0.178) 0.071
Depression symptoms
Depressed (ref)
Not depressed 0.647 (0.553, 0.741) <0.001
Self-rated health
Poor (ref)
Average 0.388 (0.322, 0.454) <0.001
Good 0.521 (0.427, 0.616) <0.001
Chronic morbidity status
Characteristics Life satisfaction of older adults
Coef 95% CI p-value
No condition (ref)
Single condition -0.034 (-0.095, 0.027) 0.274
Multiple conditions 0.107 (0.037, 0.177) 0.003
Physical activity status
Physically active (ref)
Physically inactive 0.016 (-0.046, 0.079) 0.614
Difculty in ADL
Faces difculty (ref)
No difculty 0.278 (0.209, 0.346) <0.001
Difculty in IADL
Faces difculty (ref)
No difculty -0.038 (-0.096, 0.021) 0.209
Covered by health insurance
No (ref)
Yes -0.217 (-0.284, -0.149) <0.001
Household income quintile
Poor (ref)
Not poor 0.190 (0.137, 0.243) <0.001
Religion of household
Hinduism (ref)
Islam 0.023 (-0.062, 0.107) 0.601
Others 0.012 (-0.093, 0.117) 0.821
Caste of household
SC-ST group (ref)
Non-SC-ST group 0.196 (0.134, 0.258) <0.001
Place of residence
Rural (ref)
Urban 0.047 (-0.017, 0.111) 0.150
Country Region
Southern (ref)
Northern 0.266 (0.187, 0.345) <0.001
Central 0.647 (0.540, 0.754) <0.001
Western 1.327 (1.241, 1.413) <0.001
Eastern 0.277 (0.197, 0.357) <0.001
North-eastern 0.485 (0.327, 0.644) <0.001
Adjusted R-squared 0.209
Analytical sample size 30,795

World Happiness Report 2024
141
In Table 5.3, we present the multivariable regres-
sion estimates adjusting for various socioeconomic
and demographic characteristics to determine
their associations with life satisfaction among
older adults. Our ndings indicate that certain
demographic and socioeconomic factors are
signicantly associated with higher life satisfaction
scores. Specically, older adults categorized as
‘oldest-old’ exhibited a signicantly greater
likelihood of higher life satisfaction compared to
those classied as ‘young-old’ (Coefcient: 0.241).
Additionally, older women, individuals with
secondary education or higher, currently married
respondents, and those who considered religion
as very important demonstrated a signicantly
higher likelihood of reporting higher life satisfaction
scores compared to their respective counterparts.
Moreover, individuals who reported satisfaction
with their current living arrangements
(Coefcient: 2.218), those who did not experience
ill treatment (Coefcient: 0.368) or discrimination
(Coefcient: 0.511), those who were not depressed
(Coefcient: 0.647), and those who rated their
health as good (Coefcient: 0.521) all exhibited
signicantly higher likelihoods of having higher
life satisfaction scores. Furthermore, older adults
from non-poor households (Coefcient: 0.190),
Non-Scheduled Caste/Tribe backgrounds
(Coefcient: 0.196), and those residing in western
regions of India (Coefcient: 1.327) also
demonstrated signicantly higher likelihoods of
reporting higher life satisfaction scores compared
to their respective counterparts from other
demographic and socioeconomic backgrounds.
Photo Ashwini Chaudhary Monty on Unsplash

World Happiness Report 2024
142
Figure 5.2 shows the relative importance of
independent variables in predicting the life
satisfaction score of older adults. The independent
variables collectively explained away 15.8% of
the variation in life satisfaction. We observed
that satisfaction with living arrangements (rank 1),
self-rated health (rank 2) and perceived discrimi-
nation (rank 3) were the top 3 predictors of life
satisfaction among older adults. These three
variables accounted for 65% of the variation in
older adults’ life satisfaction scores. On the
contrary, the dominance analysis output showed
that gender, age, morbidity status, physical
activity and religion ranked 18th, 19th, 20th, 21st,
and 22nd (of the 22 independent variables) in
“their inuence on life satisfaction among
older Indians. These relatively non-signicant
life satisfaction score predictors accounted
for 0.9% of the predicted variance.
Discussion
Subjective well-being (SWB) can be characterized
as a favorable assessment of one’s life coupled
with positive affect. In the eld of gerontology,
Fig. 5.2: Contribution (%) of independent variable to overall variation in Life Satisfaction
among older adults in India during 2017–18
Contribution to Life satisfaction score (%)
Living arrangement satisfaction
Self-rated health
Faces discrimination in life
Levels of education
Importance of religion
Depression symptoms
Received ill-treatment
Difficulty in IADL
Urban
Working status
Household income quintile
Country region
Current marital status
Caste of household
Covered by health insurance
Social participation
Difficulty in ADL
Gender
Age group
Chronic morbidity status
Physical activity status
Religion of household
48.2
7.6
5.4
2.9
2.3
9.1
7.5
5.0
2.6
0.2
0.2
0.1
0.1
0.3
0.4
0.5
1.0
1.1
1.2
1.2
1.3
1.7

World Happiness Report 2024
143
overall SWB is commonly assessed using
evaluations of happiness, self-esteem, and life
satisfaction. While happiness usually reects the
emotional facet of SWB, self-esteem and life
satisfaction capture the cognitive appraisal of
one’s sense of self and life overall.27
Gender and Life Satisfaction
Empirical research on gender and life satisfaction
in later life has yielded mixed ndings.28 Some
studies have found older women to report higher
life satisfaction than older men,29 others have
found older women to report lower life
satisfaction than their male peers,30 and yet
others observed no signicant gender difference
in life satisfaction.31 In the present study, we nd
that older women in India have higher levels of
life satisfaction than older men.
This is somewhat surprising given that women
are exposed to more everyday life stressors
(e.g., workplace discrimination; secondary social
status within families and society at large) and
are considered to be more susceptible to them.32
Some studies33 have found women’s disadvantages
in health contribute towards their lower life
satisfaction compared to older men.34 For
instance, although women outlive men, they have
lower levels of mental and physical health and a
greater burden of later life sickness and disability,
possibly lowering their satisfaction with life.35
Previous research has identied different factors
that impact life satisfaction disparately for women
and men. One study36 found monthly income to
affect life satisfaction only among older women
while others found that having adequate income
affected the life satisfaction among both women
and men.37 Likewise, research has reported on the
role’s education, marital status, religion, depression,
and physical activity and exercise play in gender
differentials in life satisfaction.38
One factor that may contribute to older women’s
greater life satisfaction relative to older men is
social resources, namely social support. Women,
in general, possess wider and more diverse social
networks, including a greater number of friends
and condants,39 which likely translates into not
only more social support but diverse forms of it.
Men, alternatively, report fewer intimate social
relationships and mostly rely on their spouses for
support with far fewer people they deem to be
their condants.40 Older women in India, especially
of older cohorts, also may have invested more in
building and maintaining family ties (e.g., organizing
gatherings, writing holiday and birthday cards,
doing physical and emotional care work) while
older Indian men may have shouldered the
responsibility of building family nances.41
Gendered division of labor of this nature may
explain differences in support later in life, which
may reect gender differences in life satisfaction
with older women reporting to be more satised
with life than their older male peers.
Age and Life Satisfaction
Given the social, functional, and cognitive losses
tied to aging, the general public, including older
adults themselves believe that life satisfaction
decreases with advancing age.42 Yet, a number of
empirical studies — both cross-sectional and
longitudinal — have shown that life satisfaction
either rises or stays constant as one ages.43 For
instance, a meta-analysis of data from 145 countries
reports a U-shaped linkage between age and life
satisfaction in most countries, including 109
developing nations.44
In the present study, we nd some interesting
patterns. In the bivariate analysis, we nd that
life satisfaction was not associated with age of
older adults. Other studies45 have found similar
patterns, where over 6 years, the overall level
of life satisfaction declined among those aged
80 and above. Likewise, other authors have
found that life satisfaction decreased among
participants in their late 70s and 80s.46 This
may be because with increasing age, individuals
experience increasing rates of disease and
functional decits,47 declining social and physical
activity,48 increasing sensory limitations49 and
In the present study, we nd
that older women in India have
higher levels of life satisfaction
than older men.
World Happiness Report 2024
144
problems with memory, attention, and other
cognitive functions.50 Moreover, aging also is
accompanied by loss of social roles, friends, and
family. Such experiences can erode an individual’s
sense of self-efcacy and self-worth. Reduced
psychological resources of such nature, in turn,
can lead to disengagement, depression, and
apathy, all likely manifested in lowered satisfaction
with one’s life.51
That said, at the multivariate level, upon controlling
several conceptually relevant covariates, we
found that increased age was accompanied
by higher levels of life satisfaction. Several
explanations have been offered to explain this
nding, where despite the functional, physical,
social, and cognitive losses, increasing age is
accompanied by increasing life satisfaction.
Mirowsky’s “age as maturity” hypothesis52 suggests
that with age, people become experienced,
accomplished, and mature, which translates into
lower frustration, fewer negative emotions, less
emptiness, and more life satisfaction. Based on
Baltes and Baltes’ (1990) selective optimization
with compensation theory,53 some have argued
that life satisfaction increases with age because
older adults adopt accommodative strategies to
maximize the gains and minimize the decits,
which help sustain or even improve satisfaction
with life. Similarly, Carstensen’s (1999; 2006)
socioemotional selectivity theory postulates that
as people become more aware that time is
limited, they learn to regulate their emotions,
savor the most valuable moments in everyday life,
and surround themselves with close friends and
family, all of which may help sustain high levels of
subjective well-being.54 Relatedly, it is possible
that, as found in one previous study,55 individuals
in this age group have acclimated to major life
transitions, such as retirement, and are investing
in personally and socially fullling activities, which
may improve life satisfaction.
We also nd that a greater proportion of older
adults in our sample report being married and
socially active, which may mean greater social
and emotional support and reduced risk for
loneliness, which remains a major risk factor for
diminishing health and well-being.56 Similarly,
good mental and physical health also mean
higher life satisfaction57 and a greater proportion
of older Indians in our study report not being
depressed, having no difculty in carrying out
daily living activities, and either have no chronic
illnesses or a single condition. Most also reported
facing no discrimination or ill-treatment and
being satised with their living situations. Recent
studies have found older Indians to express a
strong desire to “age in place,” as this may reect
the human urge to preserve autonomy, indepen-
dence, and social bonds.58 Unsurprisingly then,
satisfaction with living arrangement emerges to
be the highest contributory factor to life
satisfaction in this study and this matches recent
Indian studies, which nd that living conditions
and being satised with those conditions are
consequential for later-life health.59
Taken together, the pattern found in this study
surrounding age and life satisfaction refutes some
claims that the positive association between age
and life satisfaction only exists in high-income
nations while life satisfaction declines with
advancing age in countries that are socio-
economically constrained.60 Our nding on age
and life satisfaction also corroborates the ndings
in Chapter 2 of this report, which reveals an
overall improvement in the levels of life satisfaction
at higher ages in the global sample of older adults
and among those living in South Asian countries.
One way of extending the present research is to
consider additional dimensions of subjective
well-being. Although unlike several prior studies
that are limited to single-item measurement of life
Taken together, the pattern
found in this study surrounding
age and life satisfaction refutes
some claims that the positive
association between age and
life satisfaction only exists in
high-income nations while
life satisfaction declines with
advancing age in countries that are
socioeconomically constrained.

World Happiness Report 2024
145
satisfaction, we were able to measure this important
marker of SWB using a multiple-item scale, future
research replicating this work should consider
employing multiple measures of subjective
well-being, including happiness.61 62
Educational Differences in Life Satisfaction
We found a signicant association between
educational status and life satisfaction among
older adults in India. Older Indians with higher
levels of education were signicantly more
satised with life compared to their peers without
any formal education. Several social, health,
and demographic factors could explain the
educational differences in life satisfaction among
older Indians.
For instance, while education may have an
appreciable impact on quality of life, at least
partly, through its link to material assets, such as
employment and income, it also “develops habits,
skills, resources, and abilities that enable people
to achieve a better life,”63 ultimately impacting life
satisfaction. That education is positively associated
with life satisfaction, in fact, is found in previous
studies as well.64
Recent research in India also highlights that lack
of education can decrease health care utilization
and increase the likelihood of mental and physical
illnesses,65 which can negatively affect satisfaction
with life in older ages. The educational differences
in life satisfaction among older Indians in our
study also could be interpreted in the light of
recent research ndings in India and other
low- and middle-income countries that older
adults with lower education endure a higher
risk of depression than their peers with higher
education.66
Future studies should consider mechanisms
connecting educational attainment and life
satisfaction among older Indians. One potential
mechanism could be that those with more
education have a more diverse social network,67
which may translate into more diverse forms of
support. Diversity in social networks also may
mean interactions with different types of individuals
and more diverse social activities, both of which
could promote higher order processing leading to
better cognitive health.68 Diverse sources of social
support and strong cognitive function may be
consequential for older adults’ life satisfaction.
Though grounded in prior research, these
suppositions remain to be empirically tested
within the context of aging in India.
Caste and Life Satisfaction
Like in the case of social class, caste can
determine access to multiple exible resources,
including knowledge, power, prestige, and
mainstream social connections.69 These exible
resources, often available to higher social caste
individuals, are consequential throughout the life
course and particularly in later life because they
can be mobilized to avoid risks, deploy protective
strategies, and preserve and promote health and
well-being.70
In the present study, we nd a signicant difference
between the SC/ST and non-SC/ST groups.
Compared to the SC/ST group, older Indians who
belong to the non-SC/ST group were more
satised with their life. At the multivariate level
as well, those in the non-SC/ST group reported
higher life satisfaction than their SC-ST peers,
Photo Ashwini Chaudhary Monty on Unsplash

World Happiness Report 2024
146
Photo Kalai Venthan Gopal on Unsplash

World Happiness Report 2024
147
though the overall size of difference diminished
after controlling for several social structural
factors, including education, perceived
discrimination, and experiences of ill-treatment.
Corroborating previous studies, we nd that the
variations in life satisfaction between castes were
strongly related to education. Satisfaction with
one’s life often is the result of the cumulative
advantages, which are inuenced by education,
both directly and indirectly through its linkage
with social and economic resources of income,
power, wealth, and mainstream social
connections. In addition to education, we also
nd that older Indians who never experience
discrimination or ill-treatment are more satised
with their lives and that experiences of discrimi-
nation and ill-treatment contribute signicantly to
the caste-based discrepancies in life satisfaction.
These ndings are not surprising given the
enduring hold caste has on the lives of people in
India.71 There is ample research on caste-based
discrepancies in nancial distress, lack of access
to quality health care and social services.72 Given
the stigma attached to lower social caste, studies
also have found that SC/ST groups are signi-
cantly less likely to seek treatment for health
conditions than their non-SC/ST counterparts.73
One recent study found that various factors such
as education, perceived social standing, and
satisfaction with one’s living arrangements and
place of residence contributed to the caste
disparities in life satisfaction among older
Indians.74 Aside from this, research points out the
psychological toll that stigma takes on those of
lower social caste groups. Those socially deprived
may experience reduced sense of self-worth and
self-efcacy, increased feelings of anger, anxiety,
depression, and envy, and withdrawal from social
interactions and activities.75 This ultimately can
negatively affect satisfaction with life.76
Corroborating previous studies,
we nd that the variations in life
satisfaction between castes were
strongly related to education.
Conclusion
The present study substantially contributes to
the literature on later-life subjective well-being
in India. And we do so by employing a sizable,
heterogenous, nationally representative sample
of older Indians. We found that older men, those
in the higher age groups, currently married,
and those who were educated report higher life
satisfaction compared to their respective peers.
Lower satisfaction with living arrangements,
perceived discrimination, and poor self-rated
health were important factors associated with
low life satisfaction among older Indians. Findings
of this study indicate that strengthening family
networks to ensure a comfortable living
arrangement for older adults, men, widowed,
and those without formal education in particular,
and bolstering social networks to reduce
discrimination may enhance well-being in older age.
World Happiness Report 2024
148
Endnotes
1 See United Nations (2020)
2 The average growth rate for Indians aged 60 and above is
300% higher than the overall population growth rate in
India. See Agarwal et al. (2016) and Arokiasamy (2016)
3 See Papi & Cheraghi (2021)
4 See Diener et al. (1999), Mroczek & Spiro III (2005) and
Park & Kang (2022)
5 See Vijayakumar et al. (2016)
6 See Chia et al. (2023), Selivanova & Cramm (2014) and Wu
et al. (2016)
7 See Papi et al. (2019)
8 See Mroczek & Spiro III (2005), Park & Kang (2022) and
Srivastava et al. (2022)
9 See Khodabakhsh (2022)
10 See Muhammad & Joy (2022), Nagargoje et al. (2022),
Muhammad et al. (2023) and Pai et al. (2023).
11 The University of Southern California (USC), the Harvard
School of Public Health, and the International Institute for
Population Sciences (IIPS) collaborated to conduct this
nationally representative survey.
12 See The Longitudinal Ageing Study in India 2017-18
- National Report (2020)
13 In rural areas, the survey used a three-stage sample
strategy, whereas in urban areas, a four-stage sampling
design was used. The rst stage in each state/UT required
choosing Primary Sampling Units (PSUs), which are
sub-districts (Tehsils/Talukas), and the second stage
involved choosing villages in rural regions and wards in
urban areas within the chosen PSUs. In the third step,
households were chosen from various settlements in rural
areas. Sampling in metropolitan areas required an addition-
al measure. Specically, one Census Enumeration Block
(CEB) was chosen at random in each urban area in the
third stage. Households from this CEB were chosen in the
fourth stage. In the survey report, the detailed methodolo-
gy was released, together with complete information on
the survey design and data collection (30). Additional
information about the survey instruments, eldwork, data
collecting and processing, response rates, and sample
design is accessible to the public elsewhere.15
14 See Diener et al. (1985, 1999, 2009)
15 This scale showed a high degree of internal consistency.
Cronbach’s alpha value: 0.90
16 See Kessler et al. (1998) and Trainor et al. (2013)
17 See WHO (2020)
18 See Hu et al. (2017)
19 See The Longitudinal Ageing Study in India 2017-18
- National Report (2020)
20 See Borooah (2018) and Nayar (2007)
21 Since then, the Indian state of Jammu and Kashmir has
been divided to form two union territories of J&K and
Ladakh.
22 See Cameron & Trivedi (2005)
23 The partial correlation coefcient (PCC) from the regres-
sion model and the General Dominance analysis estimates
are two different measures. In simple terms, the PCC
displays the strength of association between the life
satisfaction score and independent variable(s). However,
the DA reveals which independent variable is more
important than others in explaining the life satisfaction
score of older adults.
24 See Budescu (1993) and Grömping (2007)
25 See Budescu (1993) and Luchman (2021)
26 See Luchman (2021)
27 See Plouffe (2010) and Rosenberg (1979).
28 See Kim et al. (2021)
29 See Camacho et al. (2019), Kim et al. (2021), Macia et al.
(2015) and Muhammad & Joy (2022)
30 See Chen et al. (2022a, 2022b), Cheng & Chan (2006) and
Okabayashi et al. (2019)
31 See Meggiolaro & Ongaro (2015)
32 See Bird & Rieker (2008), McDonough & Walters (2001)
and McLeod & Kessler (1990)
33 See Chen et al. (2022), Cheng & Chan (2006) and Tobi-
asz-Adamczyk et al. (2017)
34 See Bramhankar et al. (2023), Camacho et al. (2019), Lee &
Williams (2023), Mandi & Bansod (2023), Mekonnen et al.
(2022) and Pai et al. (2023)
35 See Freedman et al. (2016), J. Lee et al. (2021) and Whitson
et al. (2010)
36 See Kim et al. (2021)
37 See S.-H. Lee et al. (2020)
38 See Kim et al. (2021) and S.-H. Lee et al. (2020)
39 See Paskulin & Vianna (2007) and Shye et al. (1995)
40 See Antonucci & Akiyama (1987)
41 See Sharma et al. (2016), Silverstein et al. (2006) and
Ugargol & Bailey (2018)
42 See Lacey et al. (2006)
43 See Berg et al. (2009), Carstensen et al. (2011), Diener &
Ryan (2009), Hansen & Blekesaune (2022), Schilling
(2006), Siedlecki et al. (2008) and Wettstein et al. (2016,
2022)
44 See Blanchower (2021), Blanchower & Oswald (2008),
Hansen & Blekesaune (2022)
45 See Berg et al. (2009)
46 See Enkvist et al. (2012) and Mroczek & Spiro III (2005)
47 See Freedman & Martin (1998) and Maresova et al. (2019)
48 See Milanović et al. (2013)
49 See Cavazzana et al. (2018)
50 See Murman (2015)

World Happiness Report 2024
149
51 See Borg et al. (2008)
52 See Mirowsky & Ross (1992)
53 See Baltes & Baltes (1990)
54 See Carstensen et al. (2003)
55 See de Grip et al. (2012)
56 See National Institute on Aging (2019)
57 See Puvill et al. (2016)
58 See Muhammad et al. (2021) and Puvill et al. (2016)
59 See Kandapan et al. (2023) and Srivastava & Shaw, et al.
(2021)
60 See Deaton, (2008), Hansen & Blekesaune (2022), Morgan
et al. (2015) and Swift et al. (2014)
61 Though used interchangeably, happiness and life satisfac-
tion are distinct with the former gauging transient experi-
ences and the latter used to appraise whether one’s life has
been successful overall
62 Some also have argued in favor of assessing multiple
domains of life satisfaction, including satisfaction with
economic status, housing, health, neighborhood, social
networks, and family relationships
63 See Ross & Mirowsky (2010)
64 See Berg et al. (2009), Cho et al. (2015), Kim et al. (2021)
and Ngoo et al. (2015)
65 See Roy et al. (2020), Srivastava & Purkayastha, et al.
(2021)
66 See Brinda et al. (2016) and Saravanakumar et al. (2022)
67 See Fischer & Beresford (2015)
68 See Bishop (2013), Henderson et al. (2022), Prior et al.
(2022) and Rhee et al. (2021)
69 See Hatzenbuehler et al. (2013) and Link & Phelan (1995)
70 See Hatzenbuehler et al. (2013) and Link & Phelan (1995)
71 See Borooah (2018), Chalam (2007) and Nayar (2007)
72 See Li et al. (2009) and Zhang (2015)
73 See Dey et al. (2012)
74 See Muhammad et al. (2022)
75 See Johri & Anand (2022)
76 Given that LASI only collected data from community-dwell-
ing adults, factors affecting life satisfaction among those
residing in formal care institutions, including assisted living
facilities and nursing homes remain to be determined. In
addition to social group status, such as social caste, future
work should consider the additional stressors faced by
those older adults not being able to “age in place.”
World Happiness Report 2024
150
References
Agarwal, A., Lubet, A., Mitgang, E., Mohanty, S., & Bloom, D. E.
(2016). Population Aging in India: Facts, Issues, and Options
(SSRN Scholarly Paper 2834212). https://doi.org/10.2139/
ssrn.2834212
Antonucci, T. C., & Akiyama, H. (1987). An examination of
sex differences in social support among older men and
women. Sex Roles: A Journal of Research, 17(11–12), 737–749.
https://doi.org/10.1007/BF00287685
Arokiasamy, P. (2016). G. Giridhar, K. M. Sathyanarayana,
Sanjay Kumar, K. S. James and Moneer Alam (eds), Population
Ageing in India, Cambridge University Press, Cambridge, 2014,
Hardback, 250 pp., ISBN 13: 9781107073326. Ageing & Society,
36(2), 445–447. https://doi.org/10.1017/S0144686X15001300
Baltes, P. B., & Baltes, M. M. (1990). Psychological perspectives
on successful aging: The model of selective optimization with
compensation. In Successful aging: Perspectives from the
behavioral sciences (pp. 1–34). Cambridge University Press.
https://doi.org/10.1017/CBO9780511665684.003
Berg, A. I., Hoffman, L., Hassing, L. B., McClearn, G. E., &
Johansson, B. (2009). What matters, and what matters most,
for change in life satisfaction in the oldest-old? A study over
6 years among individuals 80+. Aging & Mental Health, 13(2),
191–201. https://doi.org/10.1080/13607860802342227
Bird, C. E., & Rieker, P. P. (2008). Gender and health: The
effects of constrained choices and social policies (pp. xv, 256).
Cambridge University Press.
Bishop, J. (2013). Networked: The New Social Operating
System. International Journal of E-Politics, 4, 64–66.
https://doi.org/10.4018/jep.2013040106
Blanchower, D. G. (2021). Is happiness U-shaped
everywhere? Age and subjective well-being in 145 countries.
Journal of Population Economics, 34(2), 575–624.
https://doi.org/10.1007/s00148-020-00797-z
Blanchower, D. G., & Oswald, A. J. (2008). Is well-being
U-shaped over the life cycle? Social Science & Medicine (1982),
66(8), 1733–1749. https://doi.org/10.1016/j.socscimed.
2008.01.030
Borg, C., Fagerström, C., Balducci, C., Burholt, V., Ferring, D.,
Weber, G., Wenger, C., Holst, G., & Hallberg, I. R. (2008). Life
satisfaction in 6 European countries: The relationship to
health, self-esteem, and social and nancial resources among
people (Aged 65-89) with reduced functional capacity.
Geriatric Nursing (New York, N.Y.), 29(1), 48–57.
https://doi.org/10.1016/j.gerinurse.2007.05.002
Borooah, V. (2018). Caste, religion, and health outcomes in
India, 2004-14. Economic and Political Weekly, 53, 65–73.
Brinda, E. M., Rajkumar, A. P., Attermann, J., Gerdtham, U. G.,
Enemark, U., & Jacob, K. S. (2016). Health, Social, and Economic
Variables Associated with Depression Among Older People in
Low and Middle Income Countries: World Health Organization
Study on Global AGEing and Adult Health. The American
Journal of Geriatric Psychiatry, 24(12), 1196–1208.
https://doi.org/10.1016/j.jagp.2016.07.016
Budescu, D. V. (1993). Dominance analysis: A new approach
to the problem of relative importance of predictors in
multiple regression. Psychological Bulletin, 114(3), 542–551.
https://doi.org/10.1037/0033-2909.114.3.542
Camacho, D., Lee, Y., Bhattacharya, A., Vargas, L. X., Kimberly,
L., & Lukens, E. (2019). High Life Satisfaction: Exploring the
Role of Health, Social Integration and Perceived Safety among
Mexican Midlife and Older Adults. Journal of Gerontological
Social Work, 62(5), 521–542. https://doi.org/10.1080/01634372.
2019.1621975
Cameron, A., & Trivedi, P. (2005). Microeconometrics: Methods
and Applications. https://doi.org/10.1017/CBO9780511811241
Carstensen, L. L., Fung, H. H., & Charles, S. T. (2003). Socio-
emotional Selectivity Theory and the Regulation of Emotion in
the Second Half of Life. Motivation and Emotion, 27(2), 103–123.
https://doi.org/10.1023/A:1024569803230
Carstensen, L. L., Turan, B., Scheibe, S., Ram, N., Ersner-Hersheld,
H., Samanez-Larkin, G. R., Brooks, K. P., & Nesselroade, J. R.
(2011). Emotional Experience Improves With Age: Evidence
Based on Over 10 Years of Experience Sampling. Psychology
and Aging, 26(1), 21–33. https://doi.org/10.1037/a0021285
Cavazzana, A., Röhrborn, A., Garthus-Niegel, S., Larsson, M.,
Hummel, T., & Croy, I. (2018). Sensory-specic impairment
among older people. An investigation using both sensory
thresholds and subjective measures across the ve senses.
PloS One, 13(8), e0202969. https://doi.org/10.1371/journal.
pone.0202969
Chalam, K. S. (2007). Caste—Based Reservations and Human
Development in India (First Edition). Sage India.
Chen, M., Fu, Y., & Chang, Q. (2022). Life satisfaction among
older adults in urban China: Does gender interact with
pensions, social support and self-care ability? Ageing & Society,
42(9), 2026–2045. https://doi.org/10.1017/
S0144686X20001877
Cheng, S.-T., & Chan, A. C. M. (2006). Relationship with others
and life satisfaction in later life: Do gender and widowhood
make a difference? The Journals of Gerontology. Series B,
Psychological Sciences and Social Sciences, 61(1), P46-53.
https://doi.org/10.1093/geronb/61.1.p46
Chia, F., Huang, W.-Y., Huang, H., & Wu, C.-E. (2023). Promoting
Healthy Behaviors in Older Adults to Optimize Health-Promoting
Lifestyle: An Intervention Study. International Journal of
Environmental Research and Public Health, 20(2), 1628.
https://doi.org/10.3390/ijerph20021628
Cho, J., Martin, P., Poon, L. W., & Georgia Centenarian Study.
(2015). Successful aging and subjective well-being among
oldest-old adults. The Gerontologist, 55(1), 132–143.
https://doi.org/10.1093/geront/gnu074
de Grip, A., Dupuy, A., Jolles, J., & van Boxtel, M. (2012).
Retirement and Cognitive Development: Are the Retired
Really Inactive? (SSRN Scholarly Paper 2149479).
https://doi.org/10.2139/ssrn.2149479

World Happiness Report 2024
151
Deaton, A. (2008). Income, Health, and Well-Being around
the World: Evidence from the Gallup World Poll. Journal of
Economic Perspectives, 22(2), 53–72. https://doi.org/10.1257/
jep.22.2.53
Dey, S., Nambiar, D., Lakshmi, J. K., Sheikh, K., & Reddy, K. S.
(2012). Health of the Elderly in India: Challenges of Access and
Affordability. In Aging in Asia: Findings From New and
Emerging Data Initiatives. National Academies Press (US).
https://www.ncbi.nlm.nih.gov/books/NBK109208/
Diener, E., Emmons, R. A., Larsen, R. J., & Grifn, S. (1985). The
Satisfaction With Life Scale. Journal of Personality Assessment,
49(1), 71–75. https://doi.org/10.1207/s15327752jpa4901_13
Diener, E., Oishi, S., & Lucas, R. E. (2009). Subjective
Well-Being: The Science of Happiness and Life Satisfaction.
In S. J. Lopez & C. R. Snyder (Eds.), The Oxford Handbook of
Positive Psychology (pp. 186–194). Oxford University Press.
https://doi.org/10.1093/oxfordhb/9780195187243.013.0017
Diener, E., & Ryan, K. (2009). Subjective well-being: A general
overview. South African Journal of Psychology, 39(4), 391–406.
https://doi.org/10.1177/008124630903900402
Diener, E., Suh, E. M., Lucas, R. E., & Smith, H. L. (1999).
Subjective well-being: Three decades of progress. Psychological
Bulletin, 125(2), 276–302. https://doi.org/10.1037/0033-
2909.125.2.276
Enkvist, A., Ekström, H., & Elmståhl, S. (2012). What factors
affect life satisfaction (LS) among the oldest-old? Archives
of Gerontology and Geriatrics, 54(1), 140–145.
https://doi.org/10.1016/j.archger.2011.03.013
Fischer, C. S., & Beresford, L. (2015). Changes in Support
Networks in Late Middle Age: The Extension of Gender and
Educational Differences. The Journals of Gerontology Series B:
Psychological Sciences and Social Sciences, 70(1), 123–131.
https://doi.org/10.1093/geronb/gbu057
Freedman, V. A., & Martin, L. G. (1998). Understanding trends
in functional limitations among older Americans. American
Journal of Public Health, 88(10), 1457–1462.
Freedman, V. A., Wolf, D. A., & Spillman, B. C. (2016).
Disability-Free Life Expectancy Over 30 Years: A Growing
Female Disadvantage in the US Population. American Journal
of Public Health, 106(6), 1079–1085. https://doi.org/10.2105/
AJPH.2016.303089
Grömping, U. (2007). Estimators of Relative Importance
in Linear Regression Based on Variance Decomposition.
The American Statistician, 61(2), 139–147.
https://doi.org/10.1198/000313007X188252
Hansen, T., & Blekesaune, M. (2022). The age and well-being
“paradox”: A longitudinal and multidimensional reconsideration.
European Journal of Ageing, 19(4), 1277–1286.
https://doi.org/10.1007/s10433-022-00709-y
Hatzenbuehler, M. L., Phelan, J. C., & Link, B. G. (2013). Stigma
as a Fundamental Cause of Population Health Inequalities.
American Journal of Public Health, 103(5), 813–821.
https://doi.org/10.2105/AJPH.2012.301069
Henderson, A. K., Walsemann, K. M., & Ailshire, J. A. (2022).
Religious Involvement and Cognitive Functioning at the
Intersection of Race-Ethnicity and Gender Among Midlife
and Older Adults. The Journals of Gerontology. Series B,
Psychological Sciences and Social Sciences, 77(1), 237–248.
https://doi.org/10.1093/geronb/gbab034
Hu, P., Wang, S., & Lee, J. (2017). Socioeconomic Gradients of
Cardiovascular Risk Factors in China and India: Results from
the China Health and Retirement Longitudinal Study and
Longitudinal Aging Study in India. International Journal of
Public Health, 62(7), 763–773. https://doi.org/10.1007/
s00038-017-0968-3
Johri, A., & Anand, P. V. (2022). Life Satisfaction and
Well-Being at the Intersections of Caste and Gender in India.
Psychological Studies, 67(3), 317–331. https://doi.org/10.1007/
s12646-022-00667-6
Kandapan, B., Pradhan, J., & Pradhan, I. (2023). Living
arrangement of Indian elderly: A predominant predictor
of their level of life satisfaction. BMC Geriatrics, 23(1), 88.
https://doi.org/10.1186/s12877-023-03791-8
Kessler, R. C., Andrews, G., Mroczek, D., Ustun, B., & Wittchen,
H.-U. (1998). The World Health Organization Composite
International Diagnostic Interview short-form (CIDI-SF).
International Journal of Methods in Psychiatric Research, 7(4),
171–185. https://doi.org/10.1002/mpr.47
Khodabakhsh, S. (2022). Factors Affecting Life Satisfaction
of Older Adults in Asia: A Systematic Review. Journal of
Happiness Studies, 23(3), 1289–1304. https://doi.org/10.1007/
s10902-021-00433-x
Kim, J., Lee, M., & Dan, H. (2021). Gender Differences in Factors
Affecting Life Satisfaction of the Elderly with Multimorbidity in
Korea. Nursing Reports, 11(1), 54–63. https://doi.org/10.3390/
nursrep11010006
Lacey, H. P., Smith, D. M., & Ubel, P. A. (2006). Hope I Die
before I Get Old: Mispredicting Happiness Across the Adult
Lifespan. Journal of Happiness Studies, 7(2), 167–182.
https://doi.org/10.1007/s10902-005-2748-7
Lee, J., Meijer, E., Phillips, D., & Hu, P. (2021). Disability Incidence
Rates for Men and Women in 23 Countries: Evidence on Health
Effects of Gender Inequality. The Journals of Gerontology.
Series A, Biological Sciences and Medical Sciences, 76(2),
328–338. https://doi.org/10.1093/gerona/glaa288
Lee, S.-H., Lee, J., & Choi, I. (2020). Life Satisfaction in
Later Life: The Interplay of Marital Condition and Income
among Elderly Koreans. Sustainability, 12(8), Article 8.
https://doi.org/10.3390/su12083483
Li, L. W., Zhang, J., & Liang, J. (2009). Health among the
Oldest-Old in China: Which Living Arrangements Make a
Difference? Social Science & Medicine (1982), 68(2), 220–227.
https://doi.org/10.1016/j.socscimed.2008.10.013
Link, B. G., & Phelan, J. (1995). Social conditions as fundamental
causes of disease. Journal of Health and Social Behavior,
Spec No, 80–94.
Luchman, J. N. (2021). Determining relative importance
in Stata using dominance analysis: Domin and domme.
The Stata Journal, 21(2), 510–538. https://doi.
org/10.1177/1536867X211025837
World Happiness Report 2024
152
Macia, E., Duboz, P., Montepare, J. M., & Gueye, L. (2015).
Exploring Life Satisfaction Among Older Adults in Dakar.
Journal of Cross-Cultural Gerontology, 30(4), 377–391.
https://doi.org/10.1007/s10823-015-9275-8
Maresova, P., Javanmardi, E., Barakovic, S., Barakovic Husic, J.,
Tomsone, S., Krejcar, O., & Kuca, K. (2019). Consequences of
chronic diseases and other limitations associated with old age
– a scoping review. BMC Public Health, 19(1), 1431.
https://doi.org/10.1186/s12889-019-7762-5
McDonough, P., & Walters, V. (2001). Gender and health:
Reassessing patterns and explanations. Social Science &
Medicine (1982), 52(4), 547–559. https://doi.org/10.1016/
s0277-9536(00)00159-3
McLeod, J. D., & Kessler, R. C. (1990). Socioeconomic status
differences in vulnerability to undesirable life events. Journal
of Health and Social Behavior, 31(2), 162–172.
Meggiolaro, S., & Ongaro, F. (2015). Life satisfaction among
older people in Italy in a gender approach. Ageing & Society,
35(7), 1481–1504. https://doi.org/10.1017/S0144686X14000646
Milanovi´c, Z., Panteli´c, S., Trajkovi´c, N., Sporiš, G., Kosti´c, R., &
James, N. (2013). Age-related decrease in physical activity and
functional tness among elderly men and women. Clinical
Interventions in Aging, 8, 549–556. https://doi.org/10.2147/
CIA.S44112
Mirowsky, J., & Ross, C. E. (1992). Age and depression.
Journal of Health and Social Behavior, 33(3), 187–205.
https://doi.org/10.2307/2137349
Morgan, J., Robinson, O., & Thompson, T. (2015). Happiness and
age in European adults: The moderating role of gross domestic
product per capita. Psychology and Aging, 30(3), 544–551.
https://doi.org/10.1037/pag0000034
Mroczek, D. K., & Spiro III, A. (2005). Change in Life Satisfaction
During Adulthood: Findings From the Veterans Affairs
Normative Aging Study. Journal of Personality and Social
Psychology, 88(1), 189–202. https://doi.org/10.1037/0022-
3514.88.1.189
Muhammad, T., Balachandran, A., & Srivastava, S. (2021).
Socio-economic and health determinants of preference for
separate living among older adults: A cross-sectional study in
India. PLoS ONE, 16(4), e0249828. https://doi.org/10.1371/
journal.pone.0249828
Muhammad, T., & Joy, A. M. (2022). Does childhood nancial
status relate to satisfaction in late life: Findings from the
longitudinal aging study in India. Aging and Health Research,
2(1), 100054. https://doi.org/10.1016/j.ahr.2022.100054
Muhammad, T., Pai, M., Afsal, K., Saravanakumar, P., & Irshad, C. V.
(2023). The association between loneliness and life satisfaction:
examining spirituality, religiosity, and religious participation as
moderators. BMC geriatrics, 23(1), 1-17.
Muhammad, T., Paul, R., Meher, T., Rashmi, R., & Srivastava, S.
(2022). Decomposition of caste differential in life satisfaction
among older adults in India. BMC Geriatrics, 22(1), 832.
https://doi.org/10.1186/s12877-022-03526-1
Murman, D. L. (2015). The Impact of Age on Cognition.
Seminars in Hearing, 36(3), 111–121.
https://doi.org/10.1055/s-0035-1555115
Nagargoje, V. P., James, K. S., & Muhammad, T. (2022).
Moderation of marital status and living arrangements in the
relationship between social participation and life satisfaction
among older Indian adults. Scientic Reports, 12(1), 20604
Nayar, K. R. (2007). Social exclusion, caste & health: A review
based on the social determinants framework. The Indian
Journal of Medical Research, 126(4), 355–363.
Ngoo, Y. T., Tey, N. P., & Tan, E. C. (2015). Determinants of Life
Satisfaction in Asia. Social Indicators Research, 124(1), 141–156.
Okabayashi, S., Kawamura, T., Wakai, K., Ando, M., Tsushita, K.,
Ohira, H., Ukawa, S., & Tamakoshi, A. (2019). Lifestyle and
psychosocial factors and a decline in competence in daily
living among Japanese early elderly people: From an
age-specied community-based cohort study (NISSIN project).
Environmental Health and Preventive Medicine, 24, 28.
https://doi.org/10.1186/s12199-019-0787-7
Pai, M., Muhammad, T., Das, S., Chaudhary, M., & Srivastava, S.
(2023). Gender differences in the association between physical
frailty and life satisfaction among older adults in India.
Psychogeriatrics, 23(6), 930-943.
Papi, S., & Cheraghi, M. (2021). Multiple factors associated with
life satisfaction in older adults. Przeglad Menopauzalny =
Menopause Review, 20(2), 65–71. https://doi.org/10.5114/
pm.2021.107025
Papi, S., Karimi, Z., Zilaee, M., & Shahry, P. (2019). Malnutrition
and Its Relation to General Health and Multimorbidity in the
Older People. Journal of Holistic Nursing And Midwifery, 29(4),
228–235. https://doi.org/10.32598/JHNM.29.4.228
Park, J.-H., & Kang, S.-W. (2022). Factors Related to
Life Satisfaction of Older Adults at Home: A Focus on
Residential Conditions. Healthcare, 10(7), Article 7.
https://doi.org/10.3390/healthcare10071279
Paskulin, L. M. G., & Vianna, L. A. C. (2007). [Sociodemographic
prole and self-referred health conditions of the elderly in a
city of Southern Brazil]. Revista De Saude Publica, 41(5),
757–768. https://doi.org/10.1590/s0034-89102007000500010
Plouffe, L. (2010). M.J. Stones, Albert Kozma, and J.K.
McNeil. Psychological Weil-Being in Later Life. Toronto:
Butterworths, 1991, pp. 160. Canadian Journal on Aging /
La Revue Canadienne Du Vieillissement, 11, 202–204.
https://doi.org/10.1017/S0714980800011740
Prior, N. H., Bentz, E. J., & Ophir, A. G. (2022). Reciprocal
processes of sensory perception and social bonding: An
integrated social-sensory framework of social behavior. Genes,
Brain and Behavior, 21(3), e12781. https://doi.org/10.1111/
gbb.12781
Puvill, T., Lindenberg, J., de Craen, A. J. M., Slaets, J. P. J., &
Westendorp, R. G. J. (2016). Impact of physical and mental
health on life satisfaction in old age: A population based
observational study. BMC Geriatrics, 16(1), 194.
https://doi.org/10.1186/s12877-016-0365-4
Rhee, T. G., Marottoli, R. A., & Monin, J. K. (2021). Diversity of
social networks versus quality of social support: Which is more
protective for health-related quality of life among older adults?
Preventive Medicine, 145, 106440. https://doi.org/10.1016/j.
ypmed.2021.106440

World Happiness Report 2024
153
Rosenberg, C. E. (1979). Conceiving The Self. Basic Books.
Ross, C. E., & Mirowsky, J. (2010). Why education is the key
to socioeconomic differentials in health. Handbook of Medical
Sociology, Sixth Edition, 33–51.
Roy, M., Bhatta, T., & Burnette, J. D. (2020). Intersectional
Effects of Gender, Education, and Geographic Region on
Functional Health Disparities Among Older Adults in India.
Journal of Aging and Health, 32(9), 1188–1197.
https://doi.org/10.1177/0898264319899246
Saravanakumar, P., Muhammad, T., & Srivastava, S. (2022).
Cross-sectional associations of personal efforts and beliefs
and depressive symptoms among older adults in India.
Scientic Reports, 12(1), Article 1. https://doi.org/10.1038/
s41598-022-17578-1
Schilling, O. (2006). Development of Life Satisfaction in
Old Age: Another View on the “Paradox’’. Social Indicators
Research, 75(2), 241–271. https://doi.org/10.1007/s11205-004-
5297-2
Selivanova, A., & Cramm, J. M. (2014). The relationship
between healthy behaviors and health outcomes among
older adults in Russia. BMC Public Health, 14(1), 1183.
https://doi.org/10.1186/1471-2458-14-1183
Sharma, N., Chakrabarti, S., & Grover, S. (2016). Gender
differences in caregiving among family—Caregivers of people
with mental illnesses. World Journal of Psychiatry, 6(1), 7–17.
https://doi.org/10.5498/wjp.v6.i1.7
Shye, D., Mullooly, J. P., Freeborn, D. K., & Pope, C. R. (1995).
Gender differences in the relationship between social network
support and mortality: A longitudinal study of an elderly
cohort. Social Science & Medicine (1982), 41(7), 935–947.
https://doi.org/10.1016/0277-9536(94)00404-h
Siedlecki, K. L., Tucker-Drob, E. M., Oishi, S., & Salthouse, T. A.
(2008). Life satisfaction across adulthood: Different determinants
at different ages? The Journal of Positive Psychology, 3(3),
153–164. https://doi.org/10.1080/17439760701834602
Silverstein, M., Cong, Z., & Li, S. (2006). Intergenerational
transfers and living arrangements of older people in rural
China: Consequences for psychological well-being. The
Journals of Gerontology. Series B, Psychological Sciences and
Social Sciences, 61(5), S256-266. https://doi.org/10.1093/
geronb/61.5.s256
Social isolation, loneliness in older people pose health risks.
(2019, April 23). National Institute on Aging. https://www.nia.
nih.gov/news/social-isolation-loneliness-older-people-pose-
health-risks
Srivastava, S., Muhammad, T., Sulaiman, K. M., Kumar, M., &
Singh, S. K. (2022). Types of household headship and
associated life satisfaction among older adults in India:
Findings from LASI survey, 2017-18. BMC Geriatrics, 22(1), 78.
https://doi.org/10.1186/s12877-022-02772-7
Srivastava, S., Purkayastha, N., Chaurasia, H., & Muhammad, T.
(2021). Socioeconomic inequality in psychological distress
among older adults in India: A decomposition analysis. BMC
Psychiatry, 21(1), 179. https://doi.org/10.1186/s12888-021-03192-4
Srivastava, S., Shaw, S., Chaurasia, H., Purkayastha, N., &
Muhammad, T. (2021). Feeling about living arrangements
and associated health outcomes among older adults in India:
A cross-sectional study. BMC Public Health, 21(1), 1322.
https://doi.org/10.1186/s12889-021-11342-2
Swift, H. J., Vauclair, C.-M., Abrams, D., Bratt, C., Marques, S., &
Lima, M.-L. (2014). Revisiting the Paradox of Well-being: The
Importance of National Context. The Journals of Gerontology:
Series B, 69(6), 920–929. https://doi.org/10.1093/geronb/
gbu011
Trainor, K., Mallett, J., & Rushe, T. (2013). Age related differences
in mental health scale scores and depression diagnosis: Adult
responses to the CIDI-SF and MHI-5. Journal of Affective
Disorders, 151(2), 639–645. https://doi.org/10.1016/j.
jad.2013.07.011
The Longitudinal Ageing Study in India 2017-18—National
report. (2020). International Institute for Population Sciences,
National Programme for Health Care of Elderly, Ministry of
Health and Family Welfare, Harvard T. H. Chan School of Public
Health, and the University of Southern California.
Tobiasz-Adamczyk, B., Galas, A., Zawisza, K., Chatterji, S., Haro,
J. M., Ayuso-Mateos, J. L., Koskinen, S., & Leonardi, M. (2017).
Gender-related differences in the multi-pathway effect of social
determinants on quality of life in older age—The COURAGE in
Europe project. Quality of Life Research, 26(7), 1865–1878.
https://doi.org/10.1007/s11136-017-1530-8
Ugargol, A. P., & Bailey, A. (2018). Family caregiving for older
adults: Gendered roles and caregiver burden in emigrant
households of Kerala, India. Asian Population Studies, 14(2),
194–210. https://doi.org/10.1080/17441730.2017.1412593
United Nations. (2020). Department of Economic and Social
Affairs, Population Division. World Population Ageing 2019
((ST/ESA/SER.A/444).).
Vijayakumar, G., Devi, E. S., & Jawahar, P. (2016). Life Satisfaction
of Elderly in Families and Old Age Homes: A Comparative
Study. International Journal of Nursing Education, 8(1), 94.
https://doi.org/10.5958/0974-9357.2016.00017.9
Wettstein, M., Schilling, O. K., & Wahl, H.-W. (2016). “Still feeling
healthy after all these years”: The paradox of subjective
stability versus objective decline in very old adults’ health and
functioning across ve years. Psychology and Aging, 31(8),
815–830. https://doi.org/10.1037/pag0000137
Wettstein, M., Wahl, H.-W., & Schlomann, A. (2022). The Impact
of the COVID-19 Pandemic on Trajectories of Well-Being of
Middle-Aged and older Adults: A Multidimensional and
Multidirectional Perspective. Journal of Happiness Studies,
23(7), 3577–3604. https://doi.org/10.1007/s10902-022-
00552-z
Whitson, H. E., Landerman, L. R., Newman, A. B., Fried, L. P.,
Pieper, C. F., & Cohen, H. J. (2010). Chronic Medical Conditions
and the Sex-based Disparity in Disability: The Cardiovascular
Health Study. The Journals of Gerontology: Series A, 65A(12),
1325–1331. https://doi.org/10.1093/gerona/glq139
WHO. (2020). WHO guidelines on physical activity and
sedentary behaviour: At a glance. https://www.who.int/
publications-detail-redirect/9789240014886
World Happiness Report 2024
154
Wu, T.-T., Chen, I.-J., Cho, S.-L., & Chiou, A.-F. (2016). The
Relationship Between Health-Promoting Behaviors and
Metabolic Syndrome in Community-Dwelling Older Adults.
Biological Research for Nursing, 18(5), 549–557.
https://doi.org/10.1177/1099800416655882
Zhang, L. (2015). Living Arrangements and Subjective
Well-Being among the Chinese Elderly. Open Journal of
Social Sciences, 3(3), Article 3. https://doi.org/10.4236/
jss.2015.33024
This publication may be reproduced using the
following reference: Helliwell, J. F., Layard, R., Sachs,
J. D., De Neve, J.-E., Aknin, L. B., & Wang, S. (Eds.). (2024).
World Happiness Report 2024.
University of Oxford: Wellbeing Research Centre.
Full text and supporting documentation
can be downloaded from the website:
worldhappiness.report
ISBN 978-1-7348080-7-0
The World Happiness Report is a partnership of Gallup, the Oxford Wellbeing
Research Centre, the UN Sustainable Development Solutions Network, and
the WHR’s Editorial Board. The report is produced under the editorial control
of the WHR Editorial Board.
From 2024, the World Happiness Report is a publication of the Wellbeing
Research Centre at the University of Oxford, UK.
Any views expressed in this report do not necessarily reect the views
of any organization, agency or program of the United Nations.
John F. Helliwell, Richard Layard, Jeffrey D. Sachs,
Jan-Emmanuel De Neve, Lara B. Aknin, and Shun Wang

2024