Candlestick Charting Explained: Timeless Techniques for Trading Stocks and Futures PDF Free Download
1 / 155/155
100%

McGraw-Hill
New York San Francisco Washington, D.C. Auckland BogoU
Caracas Lisbon London Madrid Mexico City Milan
Montreal New Delhi San Juan Singapore
Sydney Tokyo Toronto


I am a collector of first editions of books. My specialties include astron-
omy texts written before 1900, such as Percival Lowell's classic Mars, the
first published speculations about the possibility of life on the red planet
(which inspired Jules Verne to write The War of the Worlds), and a strange
little tome from 1852 that claims astronomer William Hershel spotted
sheep on the Moon with his telescope.
My collection also includes about 200 business books written by au-
thors I have interviewed through the years. My inscribed copy of Ivan
Boesky's Merger Mania, for example, was appraised a few years ago at
$200.
But my sentimental favorite is a beat-up old chart book of the Dow
Jones Industrials and Transportations Averages going back to December
18, 1896, the day the modern Dow Jones averages were born. (Trivia
question: Where did the Dow Industrials close after its very first day of
trading? Answer: 38.59.) Back then, the Industrials only had 12 compo-
nents, and the Transports, with 20 issues, were known as the Rails.
A 90-year-old FNN viewer from Virginia offered it to me in the fall of
1985.
"I have been interested in, but not too active in, the market since the
early '20's," he wrote, "and lived through the '29 'break' and the great

Foreword
depression which was a 'tempering' influence against excessive enthusi-
asm.
"At age 90 my activities are confined to 'growth' stocks and safe
investments. I am no longer interested in 'speculation.'" So he wondered if
I would be interested in his chart book.
Indeed, I was. I gladly accepted in exchange for a signed copy of one
of Joe Granville's books.
The book was published in 1931 by Robert Rhea, the famed disciple of
Charles Dow and of the oldest form of technical analysis, the Dow Theory.
It covers the years 1896-1948, with each page devoted to one year's
trading of both averages.
It is one big faded green rectangle, measuring 11 inches high and 18
inches across. Its heavy cardboard covers are held together by a couple of
rusty screws.
I browse through it once in awhile, marveling at its simplicity. Each
day's closing value is designated by a single horizontal hash mark meticu-
lously notched on the graph paper. Nothing fancy. No intra-day highs and
lows, no trendlines, no points or figures; just a simple daily record of the
debits and credits of civilization.
There is the market panic in December of 1899, when the Industrials
plunged from 76 to 58 in just 13 trading days.
There is the period from July to December of 1914, when, incredibly,
the market was closed on account of World War I. Eerily, half the page
devoted to that year is blank.
And, of course, there is 1929, when the Industrials peaked on Septem-
ber 3 at 381.17 and hit bottom, three pages later, in July of 1932 at 41.22.
The book means a lot to me. Between its covers there is a bit of
history, some mathematics, a dose of economics, and a dash of psychol-
ogy. It has taught me much about a discipline that I once considered
voodoo.
Good journalists are supposed to maintain an open mind about the
stories they cover. Political reporters, for example, should be neither Re-
publican nor Democrat. And successful financial reporters should avoid
being either bullish or bearish. And they should also be familiar with both
fundamental and technical analysis.
Foreword
I remember the first time I interviewed a technical market analyst in
the fall of 1981, when I was still cutting my teeth on business news. This
analyst spoke of 34-day and 54-week market cycles and head-and-shoulder
bottoms and wedge formations. I thought it was so much mumbo-jumbo
until the summer of '82 when the bull market was launched, and the
fundamental analysts were still bemoaning the depths of the recession that
gripped the economy at the time. That was when I realized the technicians
may have something there.
He doesn't know it, but Greg Morris taught me a lot about technical
analysis. Or, more accurately, his N-Squared software did. For a couple
years during the mid-80's, I hand-entered the daily NYSE advance/decline
readings and the closing figures of a few market indices into my computer.
I used N-Squared to build charts and draw trendlines. (I hadn't yet learned
about modems and down-loading from databanks.)
The slow, painstaking process gave me a hands on, almost organic, feel
for the markets. And watching various repetitive chart patterns unfold on
the computer screen was a great lesson about supply and demand and
about market psychology.
I think I understand how technical analysis works. It's the why that
still puzzles me. I understand the supply and demand implications of
support and resistance levels, for example, and I appreciate the theories
behind pennant formations and rising bottoms.
But I still marvel at what ultimately makes technical analysis work:
that intangible something that causes technicians to anthropomorphize the
markets without even realizing it. The market is tired, they say. Or the
market is trying to tell us this or that. Or the market always knows the
news before the newspapers do.
That something, in my mind, is simply the human side of the market,
which I suggest American technicians tend to ignore. Technical analysis
is, after all, as much art as it is science. But too many analysts have a
mathematical blind spot, and I blame that on computers. Yes, charts rep-
resent numerical relationships. But they also depict human perceptions
and behavior.
Enter Sakata's Candlesticks, which combine the highly quantitative
ratiocination of American technical analysis with the intuitive elegance of

Foreword
Japanese philosophy. Greg Morris has more than ably turned his attention
to this fascinating charting style with this book.
It occurs to me that Japanese Candlesticks are the perfect form of
technical analysis for the '90's. I happen to agree with authors John
Naisbett and Patricia Aburdene. In their bestseller Megatrends 2000, they
write that we're headed for the age of spirituality. It won't necessarily be
an overtly religious period, mind you, but rather one subtle, intuitive
power we may all develop that allows us to sense things before they
actually happen. It will be a period that embraces a kind of hybrid Eastern
philosophy and Western practicality without all the New Age hocus-pocus.
Just right for Candlestick analysis. The system is precise and exacting,
but it charms with its haiku-like names for chart patterns: "paper um-
brella," or "spinning tops," for example.
But I'll let Greg Morris tell the story from here. I just hope my
90-year old friend is still around to read it. I think he would like it.
Japanese candlestick charting and analysis is definitely a viable and effec-
tive tool for stock and commodity market timing and analysis. That is a
bold statement, especially when you consider the universe of analysis
techniques that are being promoted, offered, sold, used, abused, and
touted. Other than Nison's work, the only problem has been the lack of
detailed information on how to use and identify them. Not only will this
book solve this problem, but it will also provoke an intellectual curiosity
in candlesticks that will not easily disappear.
Japanese candlesticks provide visual insight into current market psy-
chology. There is no ancient mystery behind Japanese candlesticks, as
some promoters would have you believe. They are, however, a powerful
method for analyzing and timing the stock and futures markets. That they
have been used for hundreds of years only supports that fact. When
candlesticks are combined with other technical indicators, market timing
and trading results can be enhanced considerably.
It is almost regretful that this sound analysis technique was introduced
to the West using the word "candlesticks" instead of some more appealing
or appropriate terminology, such as Sakata's Methods or Sakata's Five
Methods. If candlesticks' Western debut had focused on the uncovering of
an ancient Japanese analysis technique called Sakata's Methods, I believe
their acceptance would have been quicker and more widespread. None of

Preface
this, however, changes the contribution that candlesticks make to technical
analysis, only fewer misleading claims would have been made.
In January 1992, I completed a week of study in Japan with Mr.
Takehiro Hikita, an independent and active futures trader. While staying in
his home, we thoroughly discussed the entire realm of Japanese culture
related to candlestick analysis. His extensive knowledge and dedication to
the subject made my learning experience not only enjoyable, but quite
thorough. His insistence that I try to understand the psychology at the
same time was instrumental in learning many of the pattern concepts. I
hope that I have transposed that priceless information into this book.
This is a book that not only covers the basics, but offers more detail
into exactly how to identify and use the patterns. A comprehensive analy-
sis and recognition methodology will be presented so that you will have no
doubt in your mind when you see a candlestick pattern. In addition to a
thorough coverage of the candlestick patterns, the philosophy of their use
will be discussed so that you will have a complete understanding of Japan-
ese candle pattern analysis and its usefulness to market timing and strate-
gies. Candle patterns need to be defined within parameters that people can
understand and use in their everyday analysis. This can still involve flexi-
bility as long as the limits of that flexibility are defined, or at least ex-
plained.
An attempt to take the subjectivity out of Japanese candlesticks analy-
sis will be a primary thrust of this book. Most sources that deal with
candlesticks admit that patterns should be taken into the context of the
market. This is true, but is often an excuse to avoid the complicated meth-
odology of pattern recognition.
Chapters on statistical testing and evaluation will reveal, totally, all
assumptions used and all details of the testing results. Rigorous testing has
been done on stocks, futures, and indices. Some of the results were surpris-
ing and some were predictable. All results are shown for your use and
perusal.
There is nothing more tiring, useless, and inefficient than reading page
after page of detailed analysis on chart patterns about how the market was
or what you should have done. The seemingly endless verbiage about how
you would have done if you had only recognized this or that when this or
Preface
that occurred is totally worthless. Charting examples will be shown in this
book only as learning examples of the candle patterns being discussed. It
definitely helps to see the actual candle patterns using real data.
I could not have allowed myself even to start a project as involved as
this if I had even the slightest doubt as to the viability and credibility of
using Japanese candlesticks as an additional tool for market analysis and
timing. Over the last fifteen years, I have read almost every book on
technical analysis, used every type of indicator, followed numerous ana-
lysts, and developed technical and economic analysis software in associa-
tion with N-Squared Computing. Believe me, if candlesticks were just a
passing fancy, this book would not have been considered — certainly not by
me.
I felt that a straightforward approach in writing the book would be the
most accepted, and certainly the most believable. When I buy a book to
learn about a new technique, a textbook-like approach is appreciated.
Hence, this style has played a vital part in the structure and organization of
this book.
This book will not only introduce and explain all of the inner workings
of Japanese candlesticks, but will also serve as a reference manual for later
use. Each candle pattern has been defined and explained in a standard
format so that quick and easy referral is possible. I will introduce a new
method of analysis called "candlestick filtering," which, based upon my
research, is essential for better recognition. You will see it gain in popular-
ity because it can provide such a sound basis for future analysis and
research.
Japanese candlestick analysis used with other technical/market indica-
tors will improve your performance and understanding of the markets.
Even if you use candlesticks solely as a method of displaying data, you
will find them indispensable. Candlestick charting, candle pattern analysis,
and candlestick filtering will give you an edge, a tool if you will, that will
enhance your understanding of the markets and trading performance.
Learn CandlePower, use it, enjoy its rewards.
Greg Morris
Dallas, Texas

There are people without whom this book could not have been possible.
Where do I start? Who do I mention first? This, quite possibly, is more
difficult than the book itself.
One must never forget one's roots. There is no doubt in my mind that
my parents, Dwight and Mary Morris, are mostly responsible for all the
good that I have ever accomplished. Any of the bad surely had to come
from being a jet fighter pilot in the U.S. Navy for six years.
I am blessed with a wonderful wife and children. Their support during
this effort was unwavering and fully appreciated.
Norman North (Mr. N-Squared Computing) has gone from a business
associate to a valued friend. His insight and opinions are always sought
and usually relied upon. The bottom line is this: without Norm, this book
would not have been written.
I am forever grateful to Takehiro Hikita for his gracious offer to visit
Japan, stay in his home, and help with the many Japanese interpretations.
My trip to Japan in January 1992 to study Japanese candlestick analysis
was invaluable. His knowledge of candle pattern analysis is filtered
throughout this book.
I cannot forget the fact that John Bollinger, while at a Market Techni-
cians Association meeting in Phoenix in 1988, said that I should look into
candlesticks. I have; thanks, John.

Acknowledgments
Ron Salter, of Salter Asset Management, has always offered an un-
usual but insightful opinion on the economy and the markets; one that
usually seems to be more right than wrong. I am grateful for his permis-
sion to quote some of his comments from his client letter.
Steve Nison must be given full credit and acknowledgment for pio-
neering "candlesticks" into Western analysis. His book Japanese Candle-
stick Charting Techniques, published by New York Institute of Finance /
Simon & Schuster is a classic and provides the reader with a rich history
of candlesticks and candlestick analysis. Nison coined many of the English
names for the various patterns used in the West today.
Many of the concepts used in the West today originated from Nison's
work and have been widely accepted as commonplace among candlestick
enthusiasts. This book does not try to change that.
The first book translated into English about Japanese candlesticks was
The Japanese Chart of Charts, by Seiki Shimizu. This book provided an
immense wealth of information about all of the popular candle patterns
along with their many interpretations. It was translated by Greg Nicholson.
Another valuable source of information on candlesticks was published
by Nippon Technical Analysts Association, called Analysis of Stock Prices
in Japan, 1988.
My thanks also go to Commodity Systems, Inc. and Track Data Corp.
for the use of their stock and commodity databases.
As is the accepted standard, and certainly in this case the fact, what-
ever factual errors and omissions are sadly, but most certainly, my own.
Japanese candlestick analysis is a valid form of technical analysis and
should be treated as such. Promoters of instant wealth will always misdi-
rect and abuse their rights, but in the end, they are not around long enough
to cause any substantial damage. One should always look into any new
technique with a healthy amount of skepticism. Hopefully, this book will
keep that skepticism under control and unnecessary.
Technical Analysis
When considering technical analysis, one should remember that things are
quite often not always what they seem. Many facts that we learned are not
actually true; and what seems to be the obvious, sometimes is not. Many
people believe water runs out of a bathtub faster as it gets to the end. Some
people may drink like a fish, but fish don't drink. George Washington
neither cut down a cherry tree, nor threw a dollar across the Potomac.
Dogs don't sweat through their tongues, Audi automobiles never mysteri-
ously accelerated, and the Battle of Bunker Hill was not fought at Bunker
Hill.
A good detective will tell you that some of the least reliable informa-
tion comes from eye witnesses. When people observe an event, it seems

Chapter 1
their background, education, and other influences, color their perception of
what occurred. A most important thing that detectives try to do at a crime
scene, is to prevent the observers from talking to each other, because most
will be influenced by what others say they saw.
Another curious human failing becomes a factor when we observe
facts. The human mind does not handle large numbers or macro ideas well.
That thousands of people die each year from automobile accidents raises
scarcely an eyebrow, but one airplane crash killing only a few people,
grabs the nation. We are only modestly concerned that tens of thousands of
people are infected with AIDS, but we are touched deeply when presented
with an innocent child that has been indirectly infected. If a situation is
personalized, we can focus on it. We can become deluded by our emo-
tions, and these emotions can effect our perceptions. When our portfolios
are plunging, all of the fears that we can imagine are dragged out: reces-
sion, debt, war, budget, bank failures, etc. Something is needed to keep us
from falling victim to everyday emotion and delusion; that something is
technical analysis.
Almost all methods of technical analysis generate useful information,
which if used for nothing more than uncovering and organizing facts about
market behavior, will increase the investor's understanding of the markets.
The investor is made painfully aware that technical competence does not
ensure competent trading. Speculators who lose money do so not only
because of bad analysis, but because of their inability to transform their
analysis into sound practice. Bridging the vital gap between analysis and
action requires overcoming the threats of fear, greed and hope. It means
controlling impatience and the desire to stray away from a sound method
to something new during times of temporary adversity. It means having the
discipline to believe what you see and to follow the indications from sound
methods, even though they contradict what everyone else is saying or what
seems to be the correct course of action.
Japanese candlestick Analysis
As a new and exciting dimension of technical analysis, Japanese candle-
stick charting and candle pattern analysis will help anyone who wishes to
introduction
have another tool at their disposal; a tool that will help sort and control the
constant disruptions and continued outside influences to sound stock and
futures market analysis.
What does candlestick charting offer that typical Western high-low bar
charts do not? As far as actual data displayed —nothing. However, when
it comes to visual appeal and the ability to see data relationships easier,
candlesticks are exceptional. A quick insight to the recent trading psychol-
ogy is there before you. After a minimal amount of practice and familiar-
ization, candlesticks will become part of your analysis arsenal. You may
never return to standard bar charts.
Japanese candlesticks offer a quick picture into the psychology of
short-term trading, studying the effect, not the cause. This places candle-
sticks squarely into the category of technical analysis. One cannot ignore
the fact that prices are influenced by investor's psychologically driven
emotions of fear, greed, and hope. The overall psychology of the market-
place cannot be measured by statistics; some form of technical analysis
must be used to analyze the changes in these psychological factors. Japan-
ese candlesticks read the changes in the makeup of investor's interpreta-
tions of value. This is then reflected in price movement. More than just a
method of pattern recognition, candlesticks show the interaction between
buyers and sellers. Japanese candlestick charting provides insight into the
financial markets that is not readily available with other charting methods.
It works well with either stocks or commodities. Related analysis tech-
niques, such as candlestick filtering and CandlePower charting, will add to
your analysis and timing capabilities.
This book not only will serve as an introduction to Japanese candle-
stick charting and analysis, but will also provide conclusive evidence of
the usefulness of candlestick patterns as an analysis tool. All methods of
analysis and all assumptions will be open and unobstructed. You will, after
reading this book, either begin to use candlesticks to assist in your market
analysis and timing or be confident enough in them to further your own
research into candlestick analysis.

Chapter 1
Japanese Candlesticks and You
Once you become accustomed to using candlestick charts, you will find it
disconcerting to be limited to a standard bar chart. Without candlesticks,
you will feel that you are not seeing the complete picture — that something
is missing. Besides providing the quick and easy pattern recognition, can-
dlesticks have great visual appeal. The data relationships almost jump off
the page (or computer screen), hardly the case with bar charts.
Candlestick Charts versus Bar Charts
Throughout this book, the assumed time period, will be a single day of
trading. It should be understood that a bar or candle line can represent any
trading period, not always just a day. However, daily analysis is probably
the most common and will thus represent the period of trading for this
book. Additionally, the mention of investors, speculators, and traders will
be used throughout with no attempt to classify or define them.
Standard Bar Charts
The data required to produce a standard bar chart consists of the open,
high, low, and close prices for the time period under study. A bar chart
consists of vertical lines representing the high to low range in prices for
that day. The high price refers to the highest price that the issue traded
during that day. Likewise, the low price refers to the lowest price traded
that day.
Figure 1-1
introduction
For years, the only other price element used in bar charting was the
close price. The close was represented on the high-low bar as a small tick
mark extending from the bar out to the right. Recently, bar charting has
incorporated the open price by another small tick on the left side of the
high-low bar. This stands true for almost all stock charts and stock data
vendors. Most futures and commodity charts have always used the open
price because it was more readily available.
LAST:
99.3*3
Most bar charts are displayed with a volume histogram at the bottom.
Charting services also offer a number of popular indicators along with the
bar chart. Technical analysis software vendors gave the user a great deal of
flexibility in displaying the bar charts. The standard bar chart could be
displayed with indicators, volume, open interest, and a large assortment of
other technical tools appropriate for that software.

Chapter 1
Candlestick Charts
Japanese candlestick charts do not require anything new or different as far
as data are concerned. Open, high, low, and close are all that is needed to
do candlestick charting. Many data vendors do not have open prices on
stocks. This problem can be addressed by using the previous day's close
for today's open price. This, however, presents a somewhat controversial
situation and is thoroughly discussed in Chapter 6.
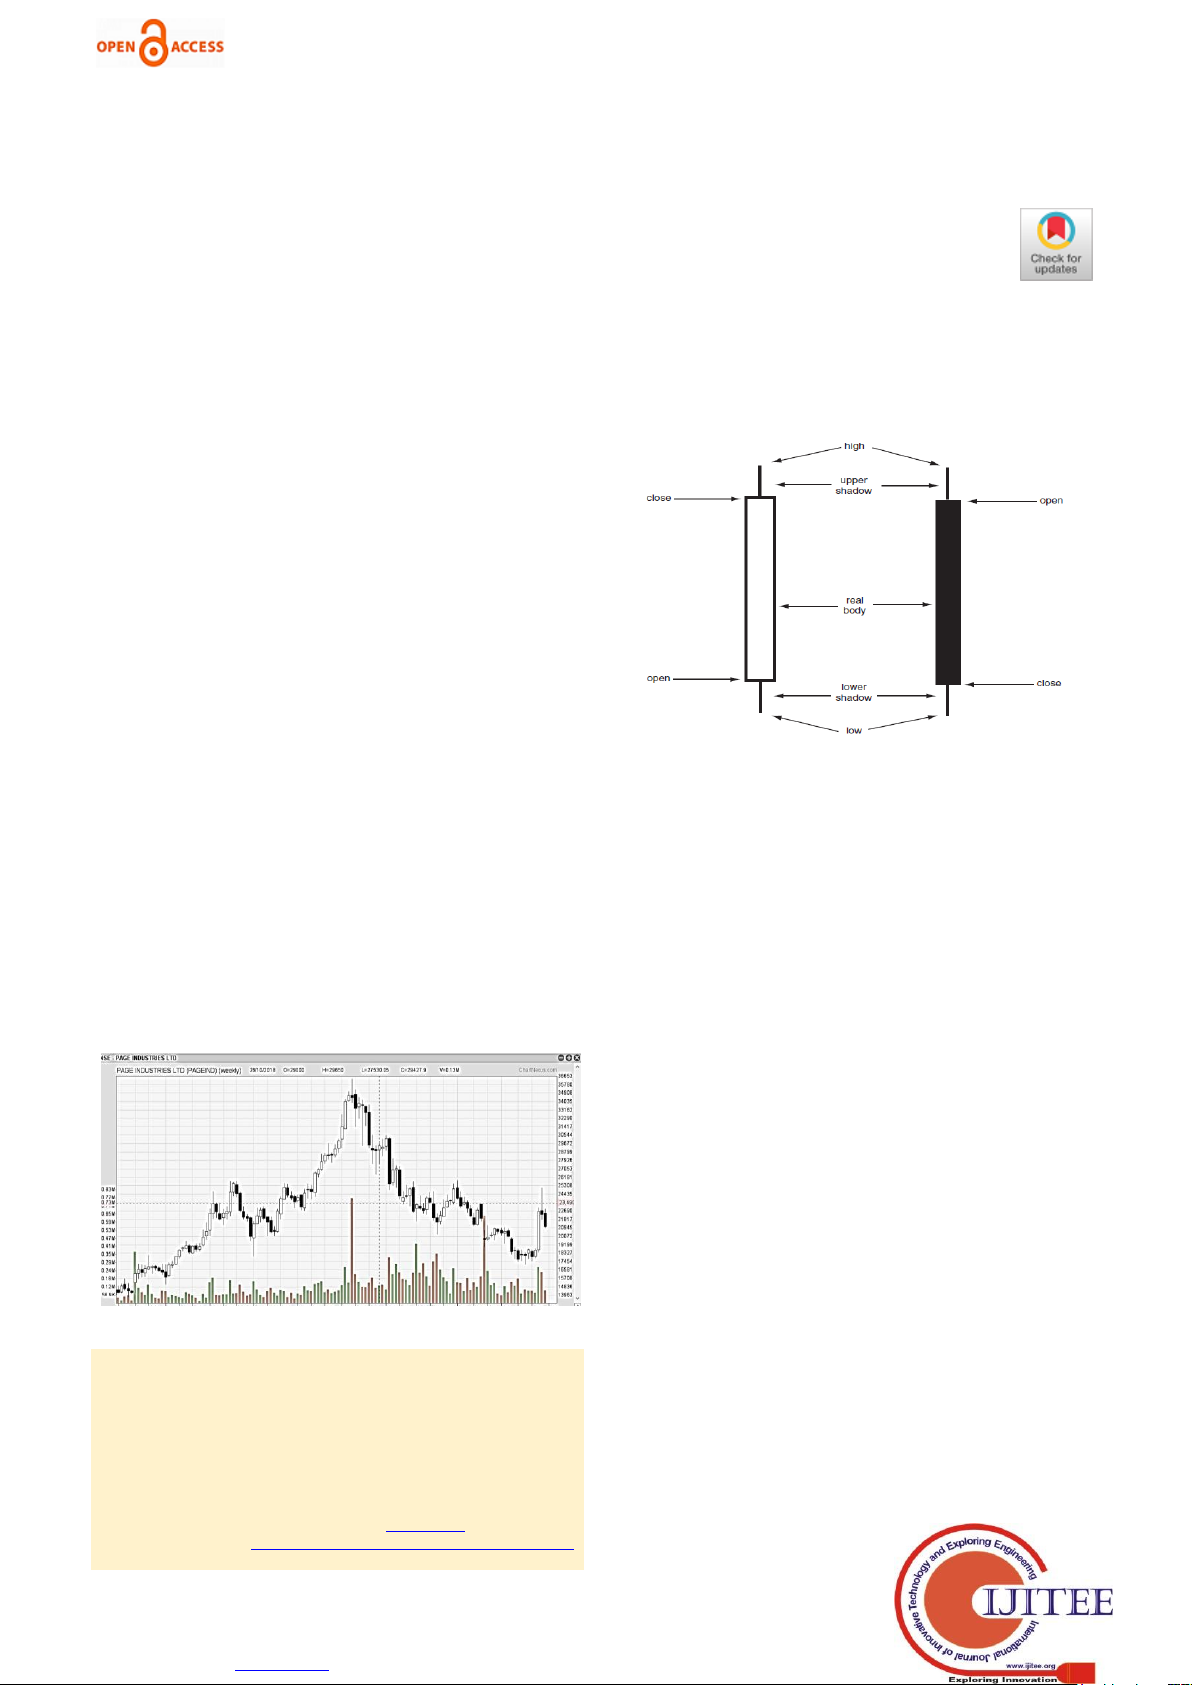
The Body (jittal)
The box that makes up the difference between the open and close is called
the real body of the candlestick. The height of the body is the range
between the day's open price and the day's close price. When this body is
black, it means that the closing price was lower than the opening price.
When the closing price is higher than the opening, the body is white.
The Shadows (/cage)
The candlestick line may have small thin lines above and/or below the
body. These lines are called shadows and represent the high and low prices
reached during the trading day. The upper shadow (uwakage) represents
the high price and the lower shadow (shitakage) represents the low price.
Some Japanese traders refer to the upper shadow as the hair and the lower
shadow as the tail. It is these shadows that give the appearance of a candle
and its wick(s).
Introduction
When drawing candlestick charts by hand, the Japanese use red instead
of white to represent the up days (close higher than open). With the use of
computers, this is not feasible because red would be printed as black on
most printers and you could not tell the up days from the down days. This
also applies to photocopying..
Figure 1-4
E? 110030 "'
If you compare Figures 1-4 and 1-5, you can see that the Japanese
candlestick chart really does not display anything different from the stand-
ard bar chart. However, once you become accustomed to seeing Japanese
candlestick charts, you will prefer them because their clarity is superior
and allows a quick and accurate interpretation of the data. This matter of
interpretation is also what this book is about. Japanese candlestick charting
and analysis will continue to grow and gain in popularity. For as. long as it
is used as intended, only a profit of doom would suggest its demise.

A day of trading in any stock or futures market is represented in traditional
charts by a single line or price bar; Japanese candlestick charting is no
different, except that the information is so much more easily interpreted.
There is much information provided in a single candle line. This will
help in understanding the psychology behind the many candle patterns
described in later chapters. There are a few candle patterns that consist of
only a single candlestick and also qualify as reversal patterns. They will be
covered thoroughly in the chapter on reversal patterns.
Each type of candle line has a unique name and represents a possible
trading scenario for that day. Some candle lines have Japanese names and
some have English names. Whenever possible, if the name is in English,
the Japanese name will also be given. The Japanese name will be written
in a form called Romanji. This is a method of writing Japanese so that it
can be pronounced properly by non-Japanese-speaking people. Single can-
dle lines are often referred to as yin and yang lines. The terms yin and
yang are Chinese, but have been used by Western analysts to account for
polar terms, such as in/out, on/off, up/down, and over/under. (The Japan-
ese equivalents are inn and yoh.) Yin relates to bearish and yang relates to
bullish. There are nine basic yin and yang lines in candlestick analysis.
These can be expanded to fifteen different candle lines for a clearer expla-
nation of the various possibilities. It will be shown in later chapters how

Chapter 2
most candle patterns can be reduced to single candle lines and maintain the
same bullish or bearish connotations.
Reading the single daily lines is the beginning of Japanese candlestick
analysis. A few definitions should be given first. Remember, these terms
and descriptions all refer to only a single day of trading. Depictions of
candle lines and candle patterns will use a shaded day to show when body
color, black or white, is not important.
Reference to long days is prevalent in most literature dealing with Japan-
ese candlesticks. Long describes the length of the candlestick body, the
difference between the open price and the close price, as shown in Figure
2-1. A long day represents a large price movement for the day. In other
words, the open price and close price were considerably different.
How much must the open and close prices differ to qualify as a long
day? Like most forms of analysis, context must be considered. Long com-
pared to what? It is best to consider only the most recent price action to
determine what is long and what is not. Japanese candlestick analysis is
based solely upon the short term price movement so the determination of
long days should be also. Anywhere from the previous five to ten days
should be more than adequate to produce the proper results. Other accept-
able methods of determining long days may also be used. These will be
thoroughly discussed in the chapter on pattern identification and recogni-
tion.
10
Candlestick Lines
Short days, shown in Figure 2-2, may also be based on the same method-
ology as long days, with comparable results. There are also numerous days
that do not fall into any of these two categories.
Marubozu
Marubozu means close-cropped or close-cut in Japanese. Other interpreta-
tions refer to it as Bald or Shaven Head. In either case, the meaning
reflects the fact that there is no shadow extending from the body at either
the open or the close, or at both.
A Black Marubozu is a long black body with no shadows on either end
(Figure 2-3). This is considered an extremely weak line. It often becomes
part of a bearish continuation or bullish reversal candle pattern, especially
if it occurs during a downtrend. This line, being black, shows the weakness
of the continuing downtrend. A long black line could be a final sell off;
this is why it is often the first day of many bullish reversal patterns. It is
;also called a Major Yin or Marubozu of Yin.
11

A White Marubozu is a long white body with no shadows on either end.
This is an extremely strong line when considered on its own merits. Oppo-
site of the Black Marubozu, it often is the first part of a bullish continua-
tion or bearish reversal candle pattern. It is sometimes called a Major Yang
or Marubozu of Yang.
A Closing Marubozu has no shadow extending from the close end of the
body, whether the body is white or black (Figure 2-5). If the body is white,
there is no upper shadow because the close is at the top of the body.
Likewise, if the body is black, there is no lower shadow because the close
is at the bottom of the body. The Black Closing Marubozu (yasunebike) is
considered a weak line and the White Closing Marubozu is a strong line.
Opening Marubozu
The Opening Marubozu has no shadow extending from the open price end
of the body (Figure 2-6). If the body is white, there would be no lower
Candlestick Lines
shadow, making it a strong bullish line. The Black Opening Marubozu
(yoritsuki takane), with no upper shadow, is a weak and therefore bearish
line. The Opening Marubozu is not as strong as the Closing Marubozu.
Spinning Tops are candlestick lines that have small real bodies with upper
and lower shadows that are of greater length than the body's length. This
represents indecision between the bulls and the bears. The color of the
body of a spinning top, along with the actual size of the shadows is not
important. The small body relative to the shadows is what makes the
spinning top.
Doji
When the body of a candle line is so small that the open and closing prices
are equal, they are called Doji (simultaneous or concurrent) lines. A Doji
occurs when the open and close for that day are the same, or certainly very
close to being the same. The lengths of the shadows can vary. The perfect
Doji day has the same opening and closing price, however, there is some

Chapter 2
interpretation that must be considered. Requiring that the open and close
be exactly equal would put too much of a constraint on the data and there
would not be many Doji. If the difference between the open and close
prices is within a few ticks (minimum trading increments), it is more than
satisfactory.
Determining a Doji day is similar to the method used for identification
of a long day; there are no rigid rules, only guidelines. Just like the long
day, it depends upon previous prices. If the previous days were mostly
Doji, then the Doji day is not important. If the Doji occurs alone, it's a
signal that there is indecision and must not be ignored. In almost all cases,
a Doji by itself would not be significant enough to forecast a change in the
trend of prices, only a warning of impending trend change. A Doji pro-
ceeded by a long white day in an uptrend would be meaningful. This
particular combination of days is referred to as a bearish Doji Star (Chap-
ter 3). An uptrend that, all of a sudden, ceases to continue, would be cause
for concern. A Doji means that there is uncertainty and indecision.
According to Nison, Doji tend to be better at indicating a change of
trend when they occur at tops instead of at bottoms. This is related to the
fact that for an uptrend to continue, new buying must be present. A down-
trend can continue unabated. It is interesting to note that Doji also means
"goof or "bungle."
Long-Legged Doji (jujn
Figure
2-8
The Long-Legged Doji has long upper and lower shadows in the middle of
the day's trading range, clearly reflecting the indecision of buyers and
sellers (Figure 2-8). Throughout the day, the market moved higher and
then sharply lower, or vice versa. It then closed at or very near the opening
Candlestick Lines
price. If the opening and closing are in the center of the day's range, the
line is referred to as a Long-Legged Doji. Juji means "cross."
Gravestone Doji (tohba)
The Gravestone Doji (hakaishi), shown in figure 2-9, is another form of a
Doji day. It develops when the Doji is at, or very near, the low of the day.
Figure 2-9
The Gravestone Doji, like many of the Japanese terms, is based on various
analogies. In this case, the Gravestone Doji represents the graves of those
who have died in battle.
If the upper shadow is quite long, it means that the Gravestone Doji is
much more bearish. Prices open and trade higher all day only to close
where they opened, which is also the low price for the day. This cannot
possibly be interpreted as anything but a failure to rally. The Gravestone
Doji at a market top is a specific version of a Shooting Star (Chapter 3).
The only difference is that the Shooting Star has a small body and the
Gravestone Doji, being a Doji, has no body. Some Japanese sources claim
that the Gravestone Doji can occur only on the ground, not in the air. This
means it can be a bullish indication on the ground or at a market low, not
as good as a bearish one. It certainly portrays a sense of indecision and a
possible change in trend.

Chapter 2
The Dragonfly Doji, or Tonbo (pronounced tombo), occurs when the open
and close are at the high of the day (Figure 2-10). Like other Doji days, this
one normally appears at market turning points. You will see in later chapters
that this Doji is a special case of the Hanging Man and Hammer lines. A tonbo
line with a very long lower shadow (tail) (shitahige) is also called a Takuri
line. A Takuri line at the end of a downtrend is extremely bullish.
Four Price Doji
Figure 2-11
This rare Doji line occurs when all four price components are equal. That
is, the open, high, low, and close are the same (Figure 2-11). This line
could occur when a stock is very illiquid or the data source did not have
any prices other than the close. Futures traders should not confuse this with
a limit move. It is so rare that one should suspect data errors. However, it
does represent complete and total uncertainty by traders in market direc-
tion.
A Star appears whenever a small body gaps above or below the? previous
day's long body (Figure 2-12). Ideally, the gap should encdrnpass the
shadows, but this is not always necessary. A Star indicates some uncer-
Candlestick Lines
tainty in the marketplace. Stars are part of many candle patterns, primarily
reversal patterns.
Paper umbrella (karakasa)
Many of these lines are also included in the next chapter on candle pat-
terns. Like the previously mentioned candle lines, the Umbrella lines have
strong reversal implications. There is strong similarity between the Drag-
onfly Doji and this candle line. Two of the Umbrella lines are called
Hammer and Hanging Man, depending upon their location in the trend of
the market.
Conclusion
The single candle lines are essential to Japanese candlestick analysis.
When they are used by themselves, and then in combinations with other
candle lines, a complete psyche of the market unfolds. Much of the analy-
sis of these lines and patterns is part of Sakata's Method (Chapter 5).
However, this book will go beyond the Sakata Method with additional
patterns and methods. Some of these patterns are new; some are variations
of the originals.

A candle pattern can be a single candlestick line or multiple candlestick
lines, seldom more than five or six. In Japanese literature, there is occa-
sional reference to patterns that use even more candlesticks, but they will
be included in the chapter on candle formations. The order in which the
candle patterns are discussed does not reflect their importance or predictive
ability. They are listed in order of their frequency of occurrence, with
related patterns following.
Most of the candle patterns are inversely related. That is, for each
bullish pattern, there is a similar bearish pattern. The primary difference is
their position relative to the short-term trend of the market. The names of
the bullish and bearish patterns may or may not be different. So that this
chapter can serve as a reference, each pattern set will be covered using the
same basic format. Some patterns retain their Japanese names while others
have been given English interpretations. A few are identical in construc-
tion, but have different names. Any differences will be dealt with in the
discussion.
Three small vertical lines will precede the pattern drawing. These lines
only show the previous trend of the market and should not be used as
immediate reference to pattern relationships.

Chapter 3
Reversal Candle Patterns
i ii
Reversal versus Continuation Patterns
Reversal and continuation patterns have been separated into different chap-
ters. This chapter covers the reversal patterns and Chapter 4 covers the
continuation patterns. This separation was done to add convenience and
simplify future reference. This is mentioned here because the determina-
tion of bullish or bearish implications has to do only with continued price
action and not with previous action. Previous price movement helps to
determine only the pattern, not its ability to foresee or anticipate future
price movement. Whether a reversal pattern or a continuation pattern,
investment and trading decisions still need to be made, even if it is the fact
that you decide to do nothing. Chapter 6 deals with this concept at length.
There is a normal expectancy to have a bullish pattern or situation prior
to a bearish counterpart. That tendency will continue here, except when
one counterpart tends to exhibit greater prevalence; then it will be covered
first.
Chapter Format
Most of the candle patterns will be explained using a standard format that
should ensure easy reference at a later date. Some candle patterns will not
be covered as thoroughly as others because of their simplicity or similarity
to other patterns. Some patterns are only modified versions of another
pattern, and will be noted as such. Since many patterns have a counterpart
reflecting the other side of the market, some of the scenarios will contain
only one example. Additionally, some repetition may seem to occur. This
too is done so that later reference will be both easy and thorough. The
usual format will be:
Pattern name
Japanese name and Interpretation
The romanized Japanese name and meaning, if known
Comment on whether confirmation is required or suggested
Commentary
Description of pattern(s)
Western (traditional) counterpart(s)
Graphic of classic pattern(s)
Detailed drawing of the classic pattern (days that can be either black or
white are shown with shading)
Rules of recognition
Simplistic rules for quick identification
Criteria for pattern recognition
Scenarios / psychology behind the pattern
Possible trading scenarios that could have developed
General discussion of the psychology of each day
Pattern flexibility
Situations that change the pattern's effectiveness
Allowable deviations from the classic pattern
Information for the numerically oriented and computer programmer
Pattern breakdown
Reducing the pattern to a single candle line
Related Patterns
Patterns that have similar formations
Patterns that are a part of this pattern
Examples

Chapter 3
Reversal Candle Patterns
Hammer and Hanging Man
(kanazuchi/tonkachi and kubitsuri)
Confirmation is definitely required.
Commentary
The Hammer and Hanging Man are each made of single candlestick lines
(Figures 3-1 and 3-2). They have long lower shadows and small real
bodies that are at or very near the top of their daily trading range. These
were first introduced as paper umbrellas in Chapter 2. They are also spe-
cial versions of the Tonbo/Takuri lines.
The Hammer occurs in a downtrend and is so named because it is
hammering out a bottom. The Japanese word for Hammer (tonkachi) also
means the ground or the soil.
A Hanging Man occurs at the top of a trend or during an uptrend. The
name Hanging Man (kubitsuri) comes from the fact that this candle line
looks somewhat like a man hanging.
Another candle line similar to the Hammer is the Takuri (pronounced
taguri) line. This Japanese word equates with climbing a rope or hauling
up. The motion is not smooth and could be related to pulling up an anchor
with your hands: as you change hands, the upward movement is inter-
rupted momentarily. A Takuri line has a lower shadow at least three times
the length of the body, whereas the lower shadow of a Hammer is a
minimum of only twice the length of the body.

Chapter 3
Reversal Candle Patterns
Rules of Recognition
1. The small real body is at the upper end of the trading range.
2. The color of the body is not important.
3. The long lower shadow should be much longer than the length of
the real body, usually two to three times.
4. There should be no upper shadow, or if there is, it should be very
small.
Scenarios and Psychology Behind the Pattern
Hammer
The market has been in a downtrend, so there is an air of bearishness. The
market opens and then sells off sharply. However, the sell-off is abated
and the market returns to, or near, its high for the day. The failure of the
market to continue the selling reduces the bearish sentiment, and most
_, traders will be uneasy with any bearish positions they might have. If the
close is above the open, causing a white body, the situation is even better
for the bulls. Confirmation would be a higher open with yet a still higher
close on the next trading day.
Hanging Man
For the Hanging Man, the market is considered bullish because of the
uptrend. In order for the Hanging Man to appear, the price action for the
day must trade much lower than where it opened, then rally to close near
the high. This is what causes the long lower shadow which shows how the
market just might begin a sell-off. If the market opens lower the next day,
there would be many participants with long positions that would want to
look for an opportunity to sell. Steve Nison claims that a confirmation that
the Hanging Man is bearish might be that the body is black and the next
day opens lower.
Pattern Flexibility
Features that will enhance the signal of a Hammer or Hanging Man pattern
are an extra long lower shadow, no upper shadow, very small real body
(almost Doji), the preceding sharp trend and a body color that reflects the
opposite sentiment (previous trend). This trait, when used on the Hammer,
will change its name to a Takuri line. Takuri lines are, generally, more
bullish than Hammers.
The body color of the Hanging Man and the Hammer can add to the
significance of the pattern's predictive ability. A Hanging Man with a
black body is more bearish than one with a white body. Likewise, a Ham-
mer with a white body would be more bullish than one with a black body.
As with most single candlestick patterns like the Hammer and the
Hanging Man, it is important to wait for confirmation. This confirmation
may merely be the action on the open of the next day. Many times, though,
it is best to wait for a confirming close on the following day. That is, if a
Hammer is shown, the following day should close even higher before
bullish positions are taken.
The lower shadow should be, at a minimum, twice as long as the body,
but not more than three times. The upper shadow should be no more than
5 to 10 percent of the high-low range. The low of the body should be
below the trend for a Hammer and above the trend for a Hanging Man.
Pattern Breakdown
The Hammer and Hanging Man patterns, being single candle lines, cannot
be reduced further. See Paper Umbrella in Chapter 2.
Related Patterns
The Hammer and Hanging Man are special cases of the Dragonfly Doji
discussed in the previous chapter. In most instances, the Dragonfly Doji
would be more bearish than the Hanging Man.

Reversal candle Patterns

Chapter 3
Commentary
The Engulfing pattern consists of two real bodies of opposite color (Fig-
ures 3-4 and 3-5). The second day's body completely engulfs the prior
day's body. The shadows are not considered in this pattern. It is also called
the Embracing (daki) line because it embraces the previous day's line.
When this occurs near a market top, or in an uptrend, it indicates a shifting
of the sentiment to selling. A Yin Tsutsumi after an uptrend is called the
Final Daki line and is one of the Sakata techniques discussed in a later
chapter.
The first day of the Engulfing pattern has a small body and the second
day has a long real body. Because the second day's move is so much more
dramatic, it reflects a possible end to the previous trend. If the bearish
Engulfing pattern appears after a sustained move, it increases the chance
that most bulls are already long. In this case, there may not be enough new
money (bulls) to keep the market uptrend intact.
An Engulfing pattern is similar to the traditional outside day. Just like
the Engulfing pattern, an outside day will close with prices higher and
lower than the previous range with the close in the direction of the new
trend.
Rules of Recognition
1. A definite trend must be underway.
2. The second day's body must completely engulf the prior day's
body. This does not mean, however, that either the top or the
bottom of the two bodies cannot be equal; it just means that both
tops and both bottoms cannot be equal.
3. The first day's color should reflect the trend: black for a downtrend
and white for an uptrend.
4. The second real body of the engulfing pattern should be the oppo-
site color of the first real body.
Reversal Candle Patterns
Scenarios and Psychology Behind the Pattern
Bearish Engulfing Pattern
An uptrend is in place when a small white body day occurs with not much
volume. The next day, prices open at new highs and then quickly sell off.
The sell-off is sustained by high volume and finally closes below the open
of the previous day. Emotionally, the uptrend has been damaged. If the
next (third) day's prices remain lower, a major reversal of the uptrend has
occurred.
A similar, but opposite, scenario would exist for the bullish Engulfing
pattern.
Pattern Flexibility
The second day of the engulfing pattern engulfs more than the real body;
in other words, if the second day engulfs the shadows of the first day, the
success of the pattern will be much greater.
The color of the first day should reflect the trend of the market. In an
uptrend, the first day should be white, and vice versa. The color of the
second, or the engulfing day, should be the opposite of the first day.
Engulfing means that no part of the first day's real body is equal to or
outside of the second day's real body. If the first day's real body was
engulfed by at least 30 percent, a much stronger pattern exists.

Chapter 3
The bullish Engulfing pattern reduces to a Paper Umbrella or Hammer,
which reflects a market turning point (Figure 3-6). The bearish Engulfing
pattern reduces to a pattern similar to the Shooting Star or possibly a
Gravestone Doji, if the body is very small (Figure 3-7). Both the bullish
and bearish Engulfing patterns reduce to single lines that fully support
their interpretation.
Related Patterns
The Engulfing pattern is also the first two days of the Three Outside
patterns. The bullish Engulfing pattern would become the Three Outside
Up pattern if the third day closed higher. Likewise, the bearish Engulfing
pattern would make up the Three Outside Down pattern if the third day
closed lower.
The Engulfing pattern is also a follow-through, or more advanced
stage, of the Piercing Line and the Dark Cloud Cover. Because of this, the
Engulfing pattern is considered more important.
Reversal candle Patterns
Examples
Figure
3-8A
**«•!
I13B1

Chapter 3
Figure
3-8B
Harami
(haramt)
Confirmation is strongly suggested.
Figure
3-9
Figure 3-10
Reversal Candle Patterns
Commentary
The Harami pattern is made up of the opposite arrangement of days as the
Engulfing pattern (Figures 3-9 and 3-10). Harami is a Japanese word for
pregnant or body within. You will find that in most instances the real
bodies in the Harami are opposite in color, also like the Engulfing pattern.
You will probably note that the Harami is quite similar to the tradi-
tional inside day. The difference, of course, is that the traditional inside
day uses the highs and lows, whereas the Harami is concerned only with
the body (open and close). This requirement to use the open and close
prices instead of the high and low prices is common in Japanese candle-
stick analysis and philosophy. The Harami requires that the body of the
second day be completely engulfed by the body of the first day.
Rules of Recognition
1. A long day is preceded by a reasonable trend.
2. The color of the long first day is not as important, but it is best if it
reflects the trend of the market.
3. A short day follows the long day, with its body completely inside
the body range of the long day. Just like the Engulfing day, the
tops or bottoms of the bodies can be equal, but both tops and both
bottoms cannot be equal.
4. The short day should be the opposite color of the long day.
Scenarios and Psychology Behind the Pattern
pdwntrend has been in place for some time. A long black day with
erage volume has occurred which helps to perpetuate the bearishness.

Chapter 3
Reversal candle Patterns
The next day, prices open higher, which shocks many complacent bears,
and many shorts are quickly covered, causing the price to rise further. The
price rise is tempered by the usual late comers seeing this as an opportu-
nity to short the trend they missed the first time. Volume on this day has
exceeded the previous day, which suggests strong short covering. A con-
firmation of the reversal on the third day would provide the needed proof
that the trend has reversed.,
f — r s: / * s .,'-/>
Bearish Harami
An uptrend is in place and is perpetuated with a long white day and high
volume. The next day, prices open lower and stay in a small range
throughout the day, closing even lower, but still within the previous day's
body. In view of this sudden deterioration of trend, traders should become
concerned about the strength of this market, especially if volume is light.
It certainly appears that the trend is about to change. Confirmation on the
third day would be a lower close.
Pattern Flexibility
The long day should reflect the trend; in an uptrend the long day should be
white and a downtrend should produce a black long day. The amount of
engulfing of the second day by the first day should be significant. The long
day should engulf the short day by at least 30 percent. Remember that long
days are based upon the data preceding them.
The bullish Harami reduces to a Paper Umbrella or a Hammer line which
indicates a market turning point (Figure 3-11). The bearish Harami reduces
to a Shooting Star line, which also is a bearish line (Figure 3-12). Both the
bullish and the bearish Harami are supported by their single-line break-
downs.
Related Patterns
The Harami pattern is the first two days of the Three Inside Up and Three
Inside Down patterns. A bullish Harami would be part of the Three Inside
Up and a bearish Harami would be part of the Three Inside Down.
Examples
Figure
3-13A
»*«!•
11781

Reversal Candle Patterns
Commentary
The Harami pattern consists of a long body followed by a smaller body. It
is the relative size of these two bodies that make the Harami important.
Remember that Doji days, where the open and close price are equal, repre-
sent days of indecision. Therefore, small body days that occur after longer
body days can also represent a day of indecision. The more the indecision
and uncertainty, the more likelihood of a trend change. When the body of
the second day becomes a Doji, the pattern is referred to as a Harami Cross
(Figures 3-14 and 3-15), with the cross being the Doji. The Harami Cross
is a better reversal pattern than the regular Harami.
J Rules of Recognition
1. A long day occurs within a trending market.
2. The second day is a Doji (open and close are equal).
3. The second-day Doji is within the range of the previous long day.
Harami Cross
(harami yose sen)
Confirmation is not required, but is recommended.
Fl9ures-14
Figure
3-15
Scenarios and Psychology Behind the Pattern
The psychology behind the Harami Cross starts out the same as that for the
basic Harami pattern. A trend has been in place when, all of a sudden, the
market gyrates throughout a day without exceeding the body range of the
previous day. What's worse, the market closes at the same price as it
opened. Volume of this Doji day also drys up, reflecting the complete lack
of decision of traders. A significant reversal of trend has occurred.
Pattern Flexibility
The color of the long day should reflect the trend. The Doji can have an
open and a close price that are within 2 to 3 percent of each other if, and
only if, there are not many Doji days in the preceding data.

Reversal Candle Patterns
The bullish and bearish Harami Crosses reduce to single lines that support
their interpretation in most instances (Figures 3-16 and 3-17). The body of
the single-day reduction can be considerably longer than what is allowed
for a Paper Umbrella or Hammer line. The fact that the breakdown is not
contrary to the pattern is supportive.
Related Patterns
The Harami Cross could possibly be the beginning of a Rising or a Falling
Three Methods, depending on the next few days' price action. The Rising
and Falling Three Methods patterns are continuation patterns, which are in
conflict with the signal given by the Harami Cross.

Chapter 3
Reversal Candle Patterns
Figure 3-1 SB
Commentary
inverted Hammer
The Inverted Hammer is a bottom reversal line (Figure 3-19). Similar to its
cousin the Hammer, it occurs in a downtrend and represents a possible
reversal of trend. Common with most single and double candlestick pat-
terns, it is important to wait for verification, in this case bullish verifica-
tion. This could be in the form of the next day's opening above the
Inverted Hammer's body. Since the closing price is near the low for the
day and the market actually traded much higher, verification is most im-
portant. Additionally, there is little reference to this pattern in Japanese
literature.
Shooting star
The Shooting Star (Figure 3-20) is a single-line pattern that indicates an
end to the upward move. It is not a major reversal signal. The Shooting
Star line looks exactly the same as the Inverted Hammer. The difference,
of course, is that the Shooting Star occurs at market tops. A rally attempt
was completely aborted when the close occurred near the low of the day.
The body of the Shooting Star does gap above the previous day's body.
This fact actually means that the Shooting Star could be referred to as a
two-line pattern since the previous day's body must be considered.
inverted Hammer
1. A small real body is formed near the lower part of the price range.
2. No gap down is required, as long as the pattern falls after a down-
trend.
Rules of Recognition

Chapters
3. The upper shadow is usually no more than two times as long as the
body.
4. The lower shadow is virtually nonexistent.
Shooting Star
1. Prices gap open after an uptrend.
2. A small real body is formed near the lower part of the price range.
3. The upper shadow is at least three times as long as the body.
4. The lower shadow is virtually nonexistent.
Scenario and Psychology Behind the Pattern
inverted Hammer
A downtrend has been in place when the market opens with a down gap.
A rally throughout the day fails to hold and the market closes near its low.
Similar to the scenario of the Hammer and the Hanging Man, the opening
of the following day is critical to the success or failure of this pattern to
call a reversal of trend. If the next day opens above the Inverted Hammer's
body, a potential trend reversal will cause shorts to be covered which
would also perpetuate the rally. Similarly, an Inverted Hammer could eas-
ily become the middle day of a more bullish Morning Star pattern (page
56).
Shooting Star
During an uptrend, the market gaps open, rallies to a new high, and then
closes near its low. This action, following a gap up, can only be considered
as bearish. Certainly, it would cause some concern to any bulls who have
profits.
Reversal candle Patterns
Pattern Flexibility
Single-day candlesticks allow little flexibility. The length of the shadow
will help in determining its strength. The upper shadow should be at least
twice the length of the body. There should be no lower shadow, or at least
not more than 5 to 10 percent of the high-low range. Like most situations,
the color of the body can help, if it reflects the sentiment of the pattern.
Even though the Inverted Hammer and the Shooting Star are considered as
single-day patterns, the previous day must be used to add to the patterns'
successfulness. The Inverted Hammer pattern reduces to a long black can-
dle line, which is always viewed as a bearish indication when considered
alone (Figure 3-21). The Shooting Star pattern reduces to a long white
candle line, which almost always is considered a bullish line (Figure 3-22).
Both of these patterns are in direct conflict with their breakdowns. This
indicates that further confirmation should always be required before acting
oa them.
Related Patterns
As the Hammer and Hanging Man were related to the Dragonfly Doji, the
Shooting Star and Inverted Hammer are cousins to the Gravestone Doji.

Reversal candle Patterns
(kirikomi)
Bullish reversal pattern.
Confirmation is suggested, but not required

commentary
The Piercing Line pattern, shown in Figure 3-24, is essentially the opposite
of the Dark Cloud Cover (see next pattern). This pattern occurs in a down-
trending market and is a two line or two day pattern. The first day is black
which supports the downtrend and the second day is a long white day
which opens at a new low and then closes above the midpoint of the
preceding black day. Kirikomi means a cutback or a switchback.
Rules of Recognition
1. The first day is a long black body continuing the downtrend.
2. The second day is a white body which opens below the low of the
previous day (that's low, not close).
3. The second day closes within but above the midpoint of the pre-
vious day's body.
Scenarios and Psychology Behind the Pattern
A long black body forms in a downtrend which maintains the bearishness.
A gap to the downside on the next day's open further perpetuates the
bearishness. However, the market rallies all day and closes much higher.
In fact the close is above the midpoint of the body of the long black day.
This action causes concern to the bears and a potential bottom has been
made. Candlestick charting shows this action quite well, where standard
bar charting would hardly discern it.
Pattern Flexibility
The white real body should close more than halfway into the prior black
candlestick's body. If it didn't, you probably should wait for more bullish
confirmation. There is no flexibility to this rule with the Piercing pattern.
The Piercing pattern's white candlestick must rise more than halfway into
Reversal Candle Patterns
the black candlestick's body. There are three additional candle patterns
called On Neck Line, In Neck Line, and Thrusting Line (covered in Chap-
ter 4), which make the definition of the Piercing Line so stringent. These
three patterns are similar to the Piercing Line but are classified as bearish
continuation patterns since the second day doesn't rally nearly as much.
The more penetration into the prior day's black body, the more likely
it will be a successful reversal pattern. Remember that if it closes above
the body of the previous day, it is not a Piercing pattern, but a bullish
Engulfing day.
Both days of the Piercing pattern should be long days. The second day
must close above the midpoint and below the open of the first day, with no
exceptions.
The Piercing Line pattern reduces to a Paper Umbrella or Hammer line,
which is indicative of a market reversal or turning point (Figure 3-25). The
single candle line reduction fully supports the bullishness of the Piercing
Line.
Related Patterns
Three patterns begin in the same way as the Piercing Line. However, they
do not quite give the reversal signal that the Piercing Line does and are
considered continuation patterns. These are the On Neck Line, In Neck

Chapter 3
Reversal candle Patterns
Line, and Thrusting Line (see Chapter 4). The bullish Engulfing pattern is
also an extension, or more mature situation, of the Piercing Line.
Commentary
The Dark Cloud Cover (Figure 3-27) is a bearish reversal pattern and the
counterpart of the Piercing pattern (Figure 3-24). Since this pattern only
occurs in an uptrend, the first day is a long white day which supports the
trend. The second day opens above the high of the white day. This is one
of the few times that the high or low is used in candle pattern definitions.
Trading lower throughout the day results in the close being below the
midpoint of the long white day.
This reversal pattern, like the opposite Piercing Line, has a marked
affect on the attitude of traders because of the higher open followed by the
much lower close. There are no exceptions to this pattern. Kabuse means
to get covered or to hang over.
Rules of Recognition
1. The first day is a long white body which is continuing the uptrend.
2. The second day is a black body day with the open above the
previous day's high (that's the high, not the close).

3. The second (black) day closes within and below the midpoint of
the previous white body.
Scenarios and Psychology Behind the Pattern
The market is in an uptrend. Typical in an uptrend, a long white candle-
stick is formed. The next day the market gaps higher on the opening,
however, that is all that is remaining to the uptrend. The market drops to
close well into the body of the white day, in fact, below its midpoint.
Anyone who was bullish would certainly have to rethink their strategy
with this type of action. Like the Piercing Line, a significant reversal of
trend has occurred.
Pattern Flexibility
The more penetration of the black body's close into the prior white body,
the greater the chance for a top reversal. The first day should be a long
day, with the second day opening significantly higher. This merely accen-
tuates the reversal of sentiment in the market.
The Dark Cloud Cover pattern reduces to a Shooting Star line, which
supports the bearishness of the pattern (Figure 3-28). If the second day's
Reversal Candle Patterns
black body closes deeply into the first day, the breakdown would be a
Gravestone Doji, which also fully supports the bearishness.
Related Patterns
The Dark Cloud Cover is also the beginning of a bearish Engulfing pat-
tern. Because of this, it would make the bearish Engulfing pattern a more
bearish reversal signal than the Dark Cloud Cover.
Example
Figure
3-29

Chapter 3
Reversal candle Patterns
Commentary
A Doji Star is a warning that a trend is about to change. It is a long real
body which should reflect the previous trend. A downtrend should produce
a black body, an uptrend, a white body (Figures 3-30 and 3-31). The next
day, prices gap in the direction of trend, then close at the opening. This
deterioration of the previous trend is immediate cause for concern. The
clear message of the Doji Star is an excellent example of the value of the
candlestick method of charting. If you were using close only or standard
bar charts, the deterioration of the trend would not quite yet be apparent.
Candlesticks, however, show that the trend is abating because of the gap in
real bodies by the Doji Star.
4. The shadows on the Doji day should not be excessively long, espe-
cially in the bullish case.
Scenarios and Psychology Behind the Pattern
Considering the bearish Doji Star, the market is in an uptrend and is
further confirmed by a strong white day. The next day gaps even higher,
trades in a small range, and then closes at or near its open. This will erode
almost all confidence from the previous rally. Many positions have been
changed, which caused the Doji in the first place. The next day's open, if
lower, would set the stage for a reversal of trend.
Pattern Flexibility
If the gap can also contain the shadows, the significance of the trend
change is greater. The first day should also reflect the trend with its body
color.
Rules of Recognition
1. The first day is a long day.
2. The second day gaps in the direction of the previous trend.
3. The second day is a Doji.
The bullish Doji Star reduces to a long black candlestick, which does not
support the bullishness of the pattern (Figure 3-32). The bearish Doji Star
reduces to a long white candle line, which puts it in direct conflict with the
pattern (Figure 3-33). These breakdown conflicts should not be ignored.

Chapter 3
Reversal Candle Patterns
Related Patterns F|9ure 5'34B
The Doji Star is the first two days of either the Morning or Evening Doji
Qtar

Chapter 3
Reversal Candle Patterns
Morning Star and Evening Star
(sankawa ake no myojyo and sankawa yoi no myojyo)
No confirmation is required.
Figure
3-35
Figure
3-36
Rules of Recognition
1. The first day is always the color that was established by the ensu-
ing trend. That is, an uptrend will yield a long white day for the
first day of the Evening Star and a downtrend will yield a black
first day of the Morning Star.
2. The second day, the star, is always gapped from the body of the
first day. It's color is not important.
3. The third day is always the opposite color of the first day.
4. The first day, and most likely the third day, are considered long
days.
Commentary
Morning Star
The Morning Star is a bullish reversal pattern. Its name indicates that it
foresees higher prices. It is made of a long black body followed by a small
body which gaps lower (Figure 3-35). The third day is a white body that
moves into the first day's black body. An ideal Morning Star would have
a gap before and after the middle (star) day's body.
Evening star
The bearish counterpart of the Morning Star is the Evening Star. Since the
Evening Star is a bearish pattern, it appears after, or during, an uptrend.
The first day is a long white body followed by a star (Figure 3-36). Re-
member that a star's body gaps away from the previous day's body. The
star's smaller body is the first sign of indecision. The third day gaps down
and closes even lower completing this pattern. Like the Morning Star, the
Evening Star should have a gap between the first and second bodies and
then another gap between the second and third bodies. Some literature
does not refer to the second gap.
Scenarios and Psychology Behind the Pattern
Morning Star
A downtrend has been in place which is assisted by a long black candle-
stick. There is little doubt about the downtrend continuing with this type of
action. The next day prices gap lower on the open, trade within a small
range and close near their open. This small body shows the beginning of
indecision. The next day prices gap higher on the open and then close
much higher. A significant reversal of trend has occurred.
Evening Star
The scenario of the Evening Star is the exact opposite of the Morning Star.
Pattern Flexibility
Ideally there is one gap between the bodies of the first candlestick and the
star, and a second gap between the bodies of the star and the third candle-
stick. Some flexibility is possible in the gap between the star and the third
day.

Chapter 3 Reversal candle Patterns
If the third candlestick closes deeply into the first candlestick's real
body, a much stronger move should ensue, especially if heavy volume
occurs on the third day. Some literature likes to see the third day close
more than halfway into the body of the first day.
Examples
Figure 3-39A
The Morning Star reduces to a Paper Umbrella or Hammer line, which
fully supports the Morning Star's bullish indication (Figure 3-37). The
Evening Star pattern reduces to a Shooting Star line, which is also a
bearish line and in full support (Figure 3-38).
Related Patterns
The next few patterns are all specific versions of the Morning and Evening
Stars. They are the Morning and Evening Doji Stars, the Abandoned Baby,
and the Tri Star.

Chapter 3
Figure 3-39B
The Morning and Evening Doji stars
(ake no myojyo doji bike and yoi no myojyo doji bike minamijyuji set)
No confirmation is required.
Figure 3-41
1. Like many reversal patterns, the first day's color should represent
the trend of the market.
2. The second day must be a Doji Star (a Doji that gaps).
3. The third day is the opposite color of the first day.
Reversal Candle Patterns
Commentary
Remember from the discussion of the Doji Star that a possible reversal of
trend is occurring because of the indecision associated with the Doji. Doji
Stars are warnings that the prior trend is probably going to at least change.
The day after the Doji should confirm the impending trend reversal. The
Morning and Evening Doji Star patterns do exactly this.
Morning Doji Star
A downtrending market is in place with a long black candlestick which is
followed by a Doji Star. Just like the regular Morning Star, confirmation
on the third day fully supports the reversal of trend. This type of Morning
Star, the Morning Doji Star (Figure 3-40), can represent a significant re-
versal. It is therefore considered more significant than the regular Morning
Star pattern.
Evening Doji star
A Doji Star in an uptrend followed by a long black body that closed well
into the first day's white body would confirm a top reversal (Figure 3-41).
The regular Evening Star pattern has a small body as its star, whereas the
Evening Doji Star has a Doji as its star. The Evening Doji Star is more
important because of this Doji. The Evening Doji Star has also been re-
ferred to as the Southern Cross.

Chapter 3
Reversal candle Patterns
Scenarios and Psychology Behind the Pattern Examples
The psychology behind these patterns is similar to those of the regular Figure 3-44A
Morning and Evening Star patterns, except that the Doji Star is more of a
shock to the previous trend and, therefore, more significant.
Pattern Flexibility
Flexibility may occur in the amount of penetration into the first day's body
by the third day. If penetration is greater than 50 percent, this pattern has
a better chance to be successful.
The Morning Doji Star reduces to a Hammer pattern (Figure 3-42) and on
occasion will reduce to a Dragonfly Doji line. The Evening Doji Star
reduces to a Shooting Star line (Figure 3-43) and occasionally to a Grave-
stone Doji line. The closer the breakdown is to the single Doji lines, the
greater the support for the pattern, because the third day closes further into
the body of the first day.
Related Patterns
You should be aware that this pattern starts with the Doji Star. It is the
confirmation that is needed with the Doji Star and should not be ignored.

Chapter 3
Abandoned Baby
(sute go)
No confirmation is required.
Figure
3-45
Figure
3-46
Reversal Candle Patterns
Commentary
Another major reversal pattern that is similar in format to the family of
Morning and Evening Star patterns is the Abandoned Baby pattern. This
pattern is almost exactly the same as the Morning and Evening Doji Star
pattern with one important exception. Here, the shadows on the Doji must
also gap below the shadows of the first and third days for the Abandoned
Baby bottom (Figure 3-45). The opposite is true for the Abandoned Baby
top (Figure 3-46), the Doji must completely (including shadows) gap
above the surrounding days. The Abandoned Baby is quite rare.
Rules of Recognition
I 1. The first day should reflect the prior trend.
2. The second day is a Doji whose shadows gap above or below the
previous day's upper or lower shadow.
3. The third day is the opposite color of the first day.
4. The third day gaps in the opposite direction with nQ-Shad£BKS-Over-
lapping.
Scenarios and Psychology Behind the Pattern
Like most of the three day star patterns, the scenarios are similar. The
primary difference is that the star (second day) can reflect greater deterio-
ration in the prior trend, depending on whether it gaps, is Doji, and so on.
Pattern Flexibility
\
Because of the specific parameters used to define this pattern, there is not
much room for flexibility. This is a special case of the Morning and
Evening Doji Stars in which the second day is similar to a traditional
island reversal day.
65

Reversal Candle Patterns
The breakdown of the Abandoned Baby patterns, both bullish and bearish,
are extensions of the Morning and Evening Doji Stars (Figures 3-47 and
3-48). The bullishness or bearishness is further amplified because the long
shadow is usually longer than in the previous cases. As before, the more
that the third day closes into the first day's body, the closer these break-
downs are to the Dragonfly and Gravestone Doji lines.
Related Patterns
This is a special case of the Doji Star in that the Doji day gaps from the
previous day. This gap includes all shadows, not just the body. The third
day gaps also, but in the opposite direction.


Chapter 3
The Tri Star patterns break down into Spinning Tops which are indicative Figure 3-54B
of market indecision (Figures 3-52 and 3-53). This is somewhat of a con-
flict with the Tri Star pattern and supports the notion that because this
pattern is so rare, it should be viewed with some skepticism.
Reversal candle Patterns
Related Patterns
Based on the previous discussions, you can see what a rare pattern this is.

Chapter 3
Commentary
This pattern only occurs in an uptrend. As with most bearish reversal
patterns, it begins with a white body candlestick. The gap referred to in the
name of this pattern is the gap between, not only the first and second days,
but also the first and third days. The second and third days are black which
is where the two crows originate.
The third day (second black day) should open higher and then close
lower than the close of the second day. The third day, even though closing
lower than the second day, still is gapped above the first day. Simply said,
the second black day engulfs the first black day.
Reversal Candle Patterns
3. A second black day opens above the first black day and closes
below the body of the first black day. Its body engulfs the first
black day.
4. The close of the second black day is still above the close of the
long white day.
Scenarios and Psychology Behind the Pattern
Oke the beginning of most bearish reversal patterns a white body day
occurs in an uptrend. The next day opens with a higher gap, fails to rally
and closes lower forming a black day. This is not too worrisome because
it still did not get lower than the first day's close. On the third day prices
again gap to a higher open and then drop to close lower than the previous
day's close. This closing price, however, is still above the close of the
white first day. The bullishness is bound to subside. How can you have
two successively lower closes and still be a raging bull?
Pattern Flexibility
The Upside Gap Two Crows pattern is fairly rigid. If the third day (second
black day) were to close into the white day's body, the pattern would
become a Two Crows pattern (discussed later in this chapter).
Rules of Recognition
1. An uptrend continues with a long white day.
2. An upward gapping black day is formed after the white day.

Chapter 3
The Upside Gap Two Crows pattern reduces to a candle line whose white
body is slightly longer than the first day's white body and has a long upper
shadow (Figure 3-56). The fact that this is not exactly a bearish candle line
suggests that some further confirmation is required before acting on this
pattern.
Related Patterns
A failure of the third day's black body to open slightly below the second
day's open and remain above the first day's body could lead to this
pattern's becoming a Mat Hold continuation pattern. The Mat Hold is a
bullish continuation pattern discussed in the next chapter. Also, the first
two days of this pattern could become an Evening Star, depending upon
what happens the third day.
Reversal Candle Patterns
Example
Figure
3-57

Chapter 3
Commentary
Meeting Lines are formed when opposite-colored candlesticks have the
same closing price. Some literature refers to Meeting Lines as Counterat-
tack Lines. Deaisen means lines that meet and gyakushusen means coun-
teroffensive lines.
Bullish Meeting Line
This pattern normally occurs during a decline. The first day of this pattern
is a long black candlestick (Figure 3-58). The next day opens sharply
lower and puts the downtrend into a promising position. The bullish Meet-
ing Line is somewhat similar in concept to the bullish Piercing Line, with
the difference being the amount the second day rebounds. The Meeting
Line only rises up to the first day's close while the Piercing Line's second
day goes above the midpoint of the first day's body. The bullish Meeting
Line is not as significant at the Piercing Line. Also, do not confuse this
with the On Neck Line covered in Chapter 4.
Reversal Candle Patterns
Bearish Meeting Line
An almost opposite relationship exists for the bearish Meeting Line rela-
tive to the Dark Cloud Cover. The bearish Meeting Line (Figure 3-59)
opens at a new high and then closes at the same close of the previous day,
while the Dark Cloud cover drops to below the midpoint.
Rules of Recognition
1. Two lines have bodies that extend the current trend.
2. The first body's color always reflects the trend: black for down-
trends and white for uptrends.
3. The second body is the opposite color.
4. The close of each day is the same.
5. Both days should be long days.
Scenarios and Psychology Behind the Pattern
Bullish Meeting Line
The market has been in a downtrend when a long black day forms, which
further perpetuates the trend. The next day opens with a gap down, then
rallies throughout the day to close at the same close as the previous day.
This fact shows how previous price benchmarks are used by traders: the
odds are very good that a reversal has taken place. If the third day opens
higher, confirmation has been given.
Pattern Flexibility
The Meeting Line pattern should consist of two long lines. However, many
times the second day is not nearly as long as the first day. This doesn't

Chapter 3
seem to affect the pattern's ability; confirmation is still suggested. It is also EX3fflPleS
best if each day is a Closing Marubozu.
Figure 3-62A
Reversal candle Patterns
The Meeting Lines break down into single candle lines that offer no sup- jj
port for their case (Figure 3-60 and 3-61). The single lines are similar to
the first line in the pattern, with a shadow that extends in the direction of
the second day. Again, the breakdown neither confirms the pattern nor
indicates lack of support.
Related Patterns
Somewhat opposite in appearance are the Separating Lines, which are
continuation patterns. One can also see the potential for these lines to
become a Dark Cloud Cover or a Piercing Line, if there is any penetration
of the first body by the second.

Reversal candle Patterns
Belt Hold
(yorikirf)
Confirmation is required.
Rules of Recognition
1. The Belt Hold line is identified by the lack of a shadow on one end.
Belt Hold lines are also opening marubozu lines (Chapter 2). Remember
that the opening marubozu does not have a shadow extending from the
open end of the body. The bullish Belt Hold (Figure 3-63) is a white
opening marubozu that occurs in a downtrend. It opens on the low of the
day, rallies significantly against the previous trend, and then closes near its
high but not necessarily at its high. The bearish Belt Hold (Figure 3-64) is
a black opening marubozu that occurs in an uptrend. Similarly, it opens on
its high, trades against the trend of the market, and then closes near its low.
Longer bodies for Belt Hold lines will offer more resistance to the trend
that they are countering.
Belt Hold lines, like most of the single day patterns lose their impor-
tance if there are many of them in close proximity. The Japanese name of
yorUdri means to push out. Steve Nison coined the name of Belt Hold.

Chapter 3
Reversal candle Patterns
2. The bullish white Belt Hold opens on its low and has no lower
shadow.
3. The bearish black Belt Hold opens on its high and has no upper
shadow.
Scenarios and Psychology Behind the Pattern
The market is trending when a significant gap in the direction of trend
occurs on the open. From that point, the market never looks back: all
further price action that day is the opposite of the previous trend. This
causes much concern and many positions will be covered or sold, which
will help accentuate the reversal.
Pattern Flexibility
Since this is single candle line pattern, there is not much room for any
flexibility. It should be a long day. Remember, a day is considered long in
relation to the previous few days only.
Pattern Breakdown
Single candle line patterns cannot be reduced further.
Related Patterns
The Belt Hold pattern is the same as the Opening Marubozu, discussed in
Chapter 2. Like the Marubozu, the Belt Hold will form the first day of
many more advanced candle patterns.
Examples
Figure 3-65A

chapter 3
Figure 3-65B
Reversal Candle Patterns
I unique Three River Bottom
s
(sankawa soko zukae)
Bullish reversal pattern.
Confirmation is not required, but is suggested.
%
Figure
3-66
Commentary
As demonstrated by Figure 3-66, the Unique Three River Bottom is a
pattern somewhat like a Morning Star. The trend is down and a long black
real body is formed. The next day opens higher, trades at a new low, then
closes near the high, producing a small black body. The third day opens
lower, but not lower than the low that was made on the second day. A
small white body is formed on the third day, which closes below the close
of the second day. The Unique Three River Bottom is extremely rare.
Rules of Recognition
1. The first day is a long black day.
v 2. The second day is a Harami day, but the body is also black.
3. The second day has a lower shadow that sets a new low.
4. The third day is a short white day which is below the middle day.

Chapter 3
Scenarios and Psychology Behind the Pattern
A falling market produces a long black day. The next day opens higher,
but the bearish strength causes a new low to be set. A substantial rally
ensues in which the strength of the bears is in question. This indecision
and lack of stability is enforced when the third day opens lower. Stability
arrives with a small white body on the third day. If, on the fourth day,
price rises to new highs, a reversal of trend has been confirmed.
Pattern Flexibility
Because this is such an unusual and precise pattern, there is not much
flexibility. If the lower shadow on the second day were quite long, the
greater potential for reversal would be more likely. In some literature, the
second day resembles a Hammer line. Like many reversal patterns, if
volume supports the reversal, the success is likely to be greater.
The Unique Three River Bottom pattern reduces to a single line that most
likely is a Hammer line (Figure 3-67). The lower shadow must be at least
twice as long as the body to be a Hammer, which, in this case, is quite
possible because of the long lower shadow on the second day. The Ham-
mer fully supports the bullishness of the Unique Three River Bottom pat-
tern.
Reversal Candle Patterns
Related Patterns
This pattern is a take-off of the Morning Star, but doesn't look anything
like it. Its appearance in Japanese literature is part of the Sakata Method
(see Chapter 5).
Example
Figure
3-68
911013 (1901

Chapter 3
Reversal Candle Patterns
Commentary
The Three White Soldiers pattern is a vital part of the Sakata Method
described in Chapter 5. It shows a series of long white candlesticks which
progressively close at higher prices. It is also best if prices open in the
middle of the previous day's range (body). This stair-step action is quite
bullish and shows the downtrend has abruptly ended.
Rules of Recognition
1. Three consecutive long white lines occur, each with a higher close.
2. Each should open within the previous body.
3. Each should close at or near the high for the day.
Scenarios and Psychology Behind the Pattern
The Three White Soldiers pattern occurs in a downtrend and is repre-
sentative of a strong reversal in the market. Each day opens lower but then
closes to a new short term high. This type of price action is very bullish
and should never be ignored.
Pattern Flexibility
The opening prices of the second and third days can be anywhere within
the previous body. However, it is better to see the open above the midpoint
of the previous day's body. Keep in mind that when a day opens for
trading, some selling has to exist to open below the previous close. This
suggests that a healthy rise is always accompanied by some selling.
The Three White Soldiers pattern reduces to a very bullish long white
candle line (Figure 3-70). This breakdown is in full support of the pattern,
which makes confirmation unnecessary.

Chapter 3
Related Patterns
See the next two patterns, Advance Block and Deliberation.
Examples
Figure 3-71
Reversal candle Patterns
Commentary
As shown in Figure 3-72, this pattern is a derivation of the Three White
Soldiers pattern. However, it must occur in an uptrend, whereas the Three
White Soldiers must occur in a downtrend. Unlike the Three White Sol-
diers pattern, the second and third days of the Advance Block pattern show
weakness. The long upper shadows show that the price extremes reached
during the day cannot hold. This type of action after an uptrend and then
for two days in a row should make any bullish market participants nerv-
ous, especially if the uptrend was getting overextended.
Remember, that this pattern occurs in an uptrend. Most multiple-day
patterns begin with a long day, which helps support the existing trend. The
two days with long upper shadows show that there is profit taking because
the rise is losing its power.

Chapter 3
Rules of Recognition
1. Three white days occur with consecutively higher closes.
2. Each day opens within the previous day's body.
3. A definite deterioration in the upward strength is evidenced by long
upper shadows on the second and third days.
Scenarios and Psychology Behind the Pattern
The scenario of the Advance Block pattern closely resembles the events
that could take place with the Three White Soldiers pattern. This situation,
however, does not materialize into a strong advance. Rather, it weakens
after the first day because the close is significantly lower than the high.
The third day is as weak as the second day. Remember, weakness in this
context is relative to the Three White Soldiers pattern.
Pattern Flexibility
Defining deterioration is difficult. Although this pattern starts out like the
Three White Soldiers, it doesn't produce the upward strength and each day
shows smaller body length and longer shadows. The second and third day
need to trade higher than their closes.
Pattern Breakdown
Figure
3-73
Reversal candle Patterns
The Advance Block pattern reduces to a long white candle line that is not
quite as long as the Three White Soldiers breakdown (Figure 3-73). This
long white candlestick also has a long upper shadow, which shows that the
prices did not close nearly as high as they got during the trading days.
Because of this, the Advance Block is viewed as a bearish pattern. In most
cases, this could only mean that long positions should be protected.
Related Patterns
This is a variation of the Three White Soldiers (discussed previously) and
the Deliberation pattern (explored next).
Examples
Figure
3-74

Chapter 3
Deliberation
(oka sansei shian boshi)
Bearish reversal pattern.
Confirmation is suggested.
Figure 3-75
Commentary
As illustrated in Figure 3-75, the Deliberation pattern is also a derivative
of the Three White Soldiers pattern. The first two long white candlesticks
make a new high and are followed by a small white candlestick or a star.
This pattern is also called a Stalled pattern in some literature. It is best if
the last day gaps above the second day. Being a small body, this shows the
indecision necessary to arrest the upmove. This indecision is the time of
deliberation. A further confirmation could easily turn this pattern into an
Evening Star pattern.
Rules of Recognition
1. The first and second day have long white bodies.
2. The third day opens near the second day's close.
Reversal candle Patterns
3. The third day is a Spinning Top and most probably a star.
Scenarios and Psychology Behind the Pattern
This pattern exhibits a weakness similar to the Advance Block pattern in
that it gets weak in a short period of time. The difference is that the
weakness occurs all at once on the third day. The Deliberation pattern
occurs after a sustained upward move and shows that trends cannot last
forever. As with the Advance Block, defining the deterioration of the trend
can be difficult.
Pattern Flexibility
If the third white body is also a star, watch for the next day to generate a
possible Evening Star pattern.
Pattern Breakdown
Figure 3-76
The Deliberation pattern reduces to a long white candlestick (Figure 3-76).
This is in direct conflict with the pattern itself which suggest the need for
further confirmation. A gap down on the following day would produce an
Evening Star and therefore support this pattern's bearishness.

Chapter 3
Related
Patterns
.
Three
Black
Crows
See the
previous
two
patterns,
the
Three
White
Soldiers
and
Advance
1 / i.
mram\
Block.
I
\smba
8arasu)
Reversal Candle Patterns
Example
Figure
3-77
•1O3O3 [2IB1
Commentary
The Three Black Crows is the counterpart of the Three White Soldiers
pattern. Occurring during an uptrend, three long black days are stairstep-
ping downward. "Bad news has wings," an old Japanese expression, easily
fits this pattern. Each day opens slightly higher than the previous day's
close, but then drops to a new closing low. When this occurs three times,
a clear message of trend reversal has been sent. Be careful that this down-
ward progression does not get overextended, that would surely cause some
bottom picking from the eternal bulls.
Rules of Recognition
1. Three consecutive long black days occur.
^ 2. Each day closes at a new low.
3. Each day opens within the body of the previous day.
4. Each day closes at or near its lows.

Chapter 3
Scenarios and Psychology Behind the Pattern
The market is either approaching a top or has been at a high level for some
time. A decisive trend move to the downside is made with a long black
day. The next two days are accompanied by further erosion in prices
caused by much selling and profit taking. This type of price action has to
take its toll on the bullish mentality.
Pattern Flexibility
It would be good to see the real body of the first candlestick of the Three
Black Crows under the prior white day's high. This would accelerate the
bearishness of this pattern.
Reversal Candle Patterns
Related Patterns
A more rigid version of this pattern is the Identical Three Crows (see the
following pattern).
The Three Black Crows pattern reduces to a long black candlestick, which
fully supports this pattern's bearishness (Figure 3-79).

Chapter 3
Identical Three Crows
(doji sanba garasu)
Bearish reversal pattern.
No confirmation is required.
Commentary
This is a special case of the Three Black Crows pattern discussed earlier.
The difference is that the second and third black days open at or near the
previous day's close (Figure 3-81).
Rules of Recognition
1. Three long black days are stair-stepping downward.
2. Each day starts at the previous day's close.
Reversal Candle Patterns
Scenarios and Psychology Behind the Pattern
This pattern resembles a panic selling that should cause additional down-
side action. Each day's close sets a benchmark for opening prices the next
trading day. There is a total absence of buying power in this pattern.
pattern Flexibility
Because this pattern is a special version of the Three Black Crows pattern,
flexibility is almost nonexistent.
Pattern Breakdown
Figure
3-82
Like the Three Black Crows pattern, the Identical Three Crows reduces to
a long black candlestick (Figure 3-82). This fully supports the pattern's
bearish implications.
Related Patterns
This is a variation of the Three Black Crows pattern.

Chapter 3
Example
Figure 3-83
Reversal candle Patterns
Breakaway
(hanare sante no shinte zukae)
Confirmation is recommended, especially for the bearish Breakaway pat-
tern.
Figure 3-84 Figure 3-85
D
Commentary
Bullish Breakaway
The bullish Breakaway pattern comes during a downtrend and represents
an acceleration of selling to a possible oversold position. The pattern starts
a long black day followed by another black day whose body gaps
down (Figure 3-84). After the down gap, the next three days set consecu-
tively lower prices. All days in this pattern are black, with the exception of
•the third day, which may be either black or white. The three days after the
.gap are similar to the Three Black Crows in that their highs and lows are
each consecutively lower. The last day completely erases the small black
days and closes inside the gap between the first and second days.
The bearish Breakaway pattern involves a gap in the direction of the trend
followed by three consecutively higher price days (Figure 3-85). In an

Chapter 3
uptrend, a long white day is formed. Then the next day, prices gap upward
to form another white day. This is followed by two more days which set
higher prices. The color of the days should be white with only one excep-
tion: the third day of the pattern, or the second day after the gap, may be
either black or white as long as a new high price has been made. The low
prices set in the three days after the gap should also be higher than each
previous day's low price. The idea of this pattern is that prices have
accelerated in the direction of trend and an overbought situation is devel-
oping. The last day sets up the trend reversal by closing inside the gap of
the first and second days.
Japanese literature does not discuss a bearish version of the Breakaway
pattern. I decided to test such a pattern and have found that it works quite
well. See Chapter 6 for results.
Rules of Recognition
1. The first day is a long day with color representing the current trend.
2. The second day is the same color and the body gaps in the direction
of the trend.
3. The third and fourth days continue the trend direction, with closes
consecutively greater in the direction of trend.
4. The fifth day is a long opposite-color day that closes inside the gap
caused by the first and second days.
Scenarios and Psychology Behind the Pattern
It is important to realize what is being accomplished here: the trend has
accelerated with a big gap and then starts to fizzle, but it still moves in the
same direction. The slow deterioration of the trend is quite evident from
this pattern. Finally, a burst in the opposite direction completely recovers
the previous three days' price action. What causes the reversal implication
is that the gap has not been filled. A short-term reversal has taken place.
Reversal candle Patterns
pattern Flexibility
Because this is a complex pattern, it is difficult to discuss flexibility. As
long as the basic premise is maintained, this pattern can offer some flexi-
bility. There could be more than three days after the gap as long as the last
day of the pattern closes inside the initial gap. It is also possible to have at
least two days after the gap.
The bullish Breakaway pattern reduces into a possible Hammer line (Fig-
ure 3-86). The lower shadow must be twice the length of the body for it to
qualify as a Hammer. This is quite possible if the gap on the second day is
large and followed by significantly lower prices on days three and four.
This, of course, supports the pattern.
The bearish Breakaway pattern reduces to a long candle line with a
white body at the lower end of its range (Figure 3-87). Chances are that
this would not be a Shooting Star because of the large gap on the second
day and the higher prices that followed. It seems that the bearish Break-
away would require further confirmation before selling.
\
Related Patterns
Because of this pattern's complexity, there are no related patterns.

Reversal candle Patterns

Chapter 3
Two Crows
(niwa garasu)
Bearish reversal pattern.
Confirmation is suggested.
Figure
3-89
Commentary
This pattern is good only as a topping reversal or bearish pattern. The
uptrend is supported by a long white day. The next day gaps much higher,
but closes near its low which is still above the body of the first day. The
next (third) day opens inside the body of the second black day, then sells
off into the body of the first day. This has closed the gap and given us the
same pattern as a Dark Cloud Cover if the last two days of the Two Crows
pattern were combined into a single candle line. The fact that this gap was
filled so quickly somewhat eliminates the traditional gap analysis, which
would indicate a continuation of the trend.
Rules of Recognition
1. The trend continues with a long white day.
2. The second day is a gap up and a black day.
3. The third day is also a black day.
4. The third day opens inside the body of the second day and closes
inside the body of the first day.
Scenarios and Psychology Behind the Pattern
The market has had an extended up move. A gap higher followed by a
lower close for the second day shows that there is some weakness in the
rally. The third day opens higher, but not above the open of the previous
day, and then sells off. This sell-off closes well into the body of the first
day. This action fills the gap after only the second day. The bullishness has
to be eroding quickly.
Pattern Flexibility
The Two Crows pattern is slightly more bearish than the Upside Gap Two
Crows pattern. The third day is a long black day which needs to close only
inside the body of the first day. The longer this black day is and the lower
it closes into the first day, the more bearish it is.
Pattern Breakdown
Figure 3-90
The Two Crows pattern reduces to a possible Shooting Star line (Figure
3-90). This would support the bearishness of the Two Crows pattern.

Chapter 3
Related Patterns
The Two Crows pattern is similar to the Dark Cloud Cover in that it
represents a short-term top in the market. If the second and third days were
combined into one, the pattern would become a Dark Cloud Cover. The
Upside Gap Two Crows is slightly different in that the third day does not
close into the body of the first day. It also is a weak version of the Evening
Star, except that there is no gap between the second and third bodies.
Example
Figure 3-91
Reversal Candle Patterns
Three inside Up and Three inside Down
(harami age and harami sage)
No confirmation is required.
Figure 3-92 Figure 3-93
sdl
Commentary
The Three Inside Up and Three Inside Down patterns are confirmations for
the Harami pattern. As shown in Figures 3-92 and 3-93, the first two days
are exactly the same as the Harami. The third day is a confirming close day
with respect to the bullish or bearish case. A bullish Harami followed by a
third day that closes higher would be a Three Inside Up pattern. Similarly,
a bearish Harami with a lower close on the third day would be a Three
Inside Down pattern.
, The Three Inside Up and Three Inside Down patterns are not found in
any Japanese literature. I developed them to assist in improving the overall
results of the Harami pattern, which they have done quite well.
Rules of Recognition
1. A Harami pattern is first identified using all previously set rules.
2. The third day shows a higher close for a Three Inside Up and a
lower close for a Three Inside Down.

Chapter 3
Scenarios and Psychology Behind the Pattern
This pattern, being a confirmation for the Harami, can represent the suc-
cess of the Harami pattern only by moving in the forecast direction.
Pattern Flexibility
Because this pattern is a confirmation of the Harami pattern, the flexibility
would be the same as that of the Harami. The amount of engulfment and
size of the second day helps to strengthen or weaken this pattern, as the
case may be.
Reversal Candle Patterns
Examples
Figure S-96A
The bullish Three Inside Up pattern reduces to a bullish Hammer which
supports the pattern (Figure 3-94). The bearish Three Inside Down reduces
to a bearish Shooting Star line, which also supports it (Figure 3-95).
Related Patterns
The Harami pattern and Harami Cross pattern are part of these patterns.

Reversal candle Patterns
Three Outside up and Three Outside Down
(tsutsumi age and tsutsumi sage)
No confirmation is required.
Figure
3-97
Figure 3-98
Commentary
The Three Outside Up and Three Outside Down patterns (Figures 3-97 and
3-98) are confirmations for the Engulfing patterns. The concept is identical
to the Three Inside Up and Three Inside Down patterns and how they
worked with the Harami. Here, the Engulfing pattern is followed by either
a higher or a lower close on the third day, depending on whether the
pattern is up or down.
The Three Outside Up and Three Outside Down patterns are not found
in any Japanese literature. I developed them to assist in improving the
overall results of the Engulfing pattern, which they have done quite well.
Pattern Recognition
1. An Engulfing pattern is formed using all of the previously set rules.
2. The third day has a higher close for the Three Outside Up pattern
and a lower close for a Three Outside Down pattern.

Chapter 3
Reversal candle Patterns
Scenarios and Psychology Behind the Pattern
These patterns, representing the confirmation of the Engulfing pattern, can
only show the success of the forecast of the appropriate Engulfing pattern.
Pattern Flexibility
Confirmation patterns do not have any more flexibility than the underlying
pattern. The amount of confirmation made on the last day can influence
the magnitude of this pattern's forecast.
Examples
Figure 3-101
A
Pattern Breakdown
Figure
3-99
Figure 3-100
The bullish Three Outside Up pattern reduces to a possible Hammer line
(Figure 3-99), and the bearish Three Outside Down reduces to a possible
Shooting Star line (Figure 3-100). The word possible is used here because
the difference between the first day's open and the third day's close can be
significant, which would negate the Hammer and Shooting Star lines. The
supporting point is that the body will be the color of the sentiment.
Related Patterns
The Engulfing pattern is a subpart of this pattern.

Chapter 3
Figure 3-101B
•*1SS> CISSl
Reversal candle Patterns
Three Stars in the South
(kyoku no santen boshi)
Bullish reversal pattern.
Confirmation is suggested.
Figure
3-102
This pattern shows a downtrend slowly deteriorating with less and less
daily price movement and consecutively higher lows (Figure 3-102). The
long lower shadow on the first day is critical to this pattern because it is
the first sign of buying enthusiasm. The next day opens higher, trades
lower, but does not go lower than the previous day's low. This second day
also closes off of its low. The third day is a Black Marubozu and is
engulfed by the previous day's range.
Rules of Recognition
1. The first day is a long black day with a long lower shadow (Ham-
mer-like).
'. The second day has the same basic shape as the first day, only
smaller. The low is above the previous day's low.

Chapter 3
3. The third day is a small Black Marubozu that opens and closes
inside the previous day's range.
Scenarios and Psychology Behind the Pattern
A downtrend has continued when, after a new low has been made, a rally
closes well above the low. This will cause some concern among the shorts
because it represents buying, something that has not been happening until
now. The second day opens higher, which lets some longs get out of their
positions. However, that is the high for the day. Trading is lower, but not
lower than the previous day, which causes a rally to close above the low.
The bears are certainly concerned now because of the higher low. The last
day is a day of indecision, with hardly any price movement. Anyone who
is still short will not want to see anything more to the up side.
Pattern Flexibility
The last day of this pattern could have small shadows that probably would
not greatly affect the outcome. Basically, each consecutive day is engulfed
by the previous day's range.
Pattern Breakdown
Figure 3-103
Reversal candle Patterns
This pattern reduces to a long black line, which normally is quite bearish
(Figure 3-103). Because of this conflict, definite confirmation should be
required.
Related Patterns
This is somewhat like the Three Black Crows, except that the lows are not
lower and the last day is not a long body. Of course, this pattern has a
bullish implication, whereas the Three Black Crows pattern is bearish.
Example
Figure 3-104

Chapter 3
Concealing Baby Swallow
(kotsubame tsutsumi)
Bullish reversal pattern.
No confirmation is required.
Figure 3-105
Commentary
Two Black Marubozu days support the strength of the downtrend (Figure
3-105). On the third day, the downtrend begins to deteriorate, with a
period of trading above the open price. This is especially important be-
cause the open was gapped down from the previous day's close. The
fourth day completely engulfs the third day, including the upper shadow.
Even though the close is at a new low, the velocity of the previous down-
trend has eroded significantly and shorts should be protected.
Rules of Recognition
1. Two Black Marubozu days make up the first two days of this
pattern.
Reversal Candle Patterns
2. The third day is black with a down gap open. However, this day
trades into the body of the previous day, producing a long upper
shadow.
3. The fourth black day completely engulfs the third day, including
the shadow.
scenarios and Psychology Behind the Pattern
Any time a downtrend can continue with two Black Marubozu days, the
bears must be excited. Then on the third day, the open is gapped down,
which also adds to the excitement. However, trading during this day goes
above the close of the previous day and causes some real concern about the
downtrend, even though the day closes at or near its low. The next day
opens significantly higher with a gap. After the opening, however, the
market sells off and closes at a new low. This last day has given the shorts
an excellent opportunity to cover their short positions.
Pattern Flexibility
This is a very strict pattern and does not allow much in the way of flexibil-
ity. The gap between the second and third day is necessary, and the upper
shadow of the third day must extend into the previous day's body. In
addition the fourth day must completely engulf the previous day's range.
To meet all of these requirements, only a few changes in relative size can
be allowed.
This pattern reduces to a long black day which is almost always considered
a bearish day (Figure 3-106). Because of this direct conflict, confirmation
is required.

Reversal candle Patterns
Related Patterns
Concealing Baby Swallow resembles the Three Black Crows here, as did
the Three Stars in the South pattern. However, the Three Black Crows is a
bearish pattern and must be in an uptrend to be valid, whereas this pattern
occurs in a downtrend. This pattern starts out much like the Ladder Bottom
pattern.

Chapter 3
Stick Sandwich
(gyakusashi niten zoko)
Bullish reversal pattern.
Confirmation is suggested.
Figure
3-108
Commentary
In the Stick Sandwich pattern two black bodies have a white body between
them (Figure 3-108). The closing prices of the two black bodies must be
equal. A support price has been found and the opportunity for prices to
reverse is quite good.
Rules of Recognition
1. A black body in a downtrend is followed by a white body that
trades above the close of the black body.
2. The third day is a black day with a close equal to the first day.
Scenarios and Psychology Behind the Pattern
Reversal candle Patterns
suggests that the previous downtrend has probably reversed and that shorts
should be protected, if not covered. The next day, prices open even higher,
which should cause some covering initially, but then prices drift lower to
close at the same price as two days ago. Anyone who does not note
support and resistance points in the market is taking exceptional risk.
Another day of trading should tell the story.
Pattern Flexibility
Some Japanese references use the low prices as the support point for the
two black days. Using the close price presents a more memorable support
point and therefore a better chance of reversal.
Pattern Breakdown
Figure 3-109
The Stick Sandwich breaks down to an Inverted Hammer line as long as
the body of the first day is considerable smaller than the range of the third
day (Figure 3-109). If the first day is a small body and the third day's price
fange (high to low) is two or three times that of the first day, this pattern
Reduces to the bullish Inverted Hammer. However, if this does not occur,
the Stick Sandwich reduces to a black line, which is usually bearish. As a
result, confirmation is suggested.
A good downtrend is under way. Prices open higher on the next trading
day and then trade higher all day, closing at or near the high. This action

Chapter 3
Related Patterns
The last two days of this pattern are similar to a bearish Engulfing pattern
in most instances. It would have to be seen if the support point is better
than the bearish candle pattern, assuming no consideration is made to the
previous trend.
Reversal Candle Patterns
Kicking
(keri ashi)
No confirmation is required.
Figure 3-111
Figure 3-112
Rules of Recognition
Commentary
The Kicking pattern is similar to the Separating Lines pattern, except that
instead of the open prices being equal, a gap occurs. The bullish Kicking
pattern is a Black Marubozu followed by a White Marubozu (Figure 3-
111). The bearish Kicking pattern is a White Marubozu followed by a
Black Marubozu (Figure 3-112). Some Japanese theory says that future
movement will be in the direction of the longer side of the two candles,
regardless of the price trend. The market direction is not as important with
this pattern as it is with most other candle patterns.
1. A Marubozu of one color is followed by a Marubozu of the oppo-
site color.
2. A gap must occur between the two lines.

Chapter 3
Scenarios and Psychology Behind the Pattern
The market has been in a trend when prices gap the next day. The prices
never enter into the previous day's range and then close with another gap.
Pattern Flexibility
This allows no flexibility. If the gap does not exist, a Separating Lines
(continuation) pattern will be formed.
Reversal Candle Patterns
The bullish Kicking pattern reduces to a long white candle line, which
usually is bullish (Figure 3-113). The bearish Kicking pattern reduces to a
long black candle line, which is usually bearish (Figure 3-114).
Related Patterns
Homing Pigeon
(shita banare kobato gaeshi)
Bullish reversal pattern.
Confirmation is suggested.
v ie Homing Pigeon closely resembles the Harami pattern, except that both
ps; bodies are black rather than opposite in color.
Commentary
The Separating Lines pattern is almost the same, except for the gap and the
fact that the Separating Lines is a continuation pattern.

Chapter 3
Figure 3-116
Reversal candle Patterns
Figure 3-117
Related Patterns
Rules of Recognition
1. A long black body occurs in a downtrend.
2. A short black body is completely inside the previous day's body.
Scenarios and Psychology Behind the Pattern
The market is in a downtrend, evidenced by a long black day. The next
day, prices open higher, trade completely within the prior day's body, and
then close slightly lower. Depending upon the severity of the previous
trend, this shows a deterioration and offers an opportunity to get out of the
market.
The Harami is similar in its candle line relationship, but both of its days
must be black.
Pattern Flexibility
Two-day patterns do not offer much flexibility.
Pattern Breakdown
The Homing Pigeon pattern reduces to a long black candle line with a
lower shadow, which certainly is not a bullish line (Figure 3-117). Confir-
mation would definitely be suggested.

Chapter s
Ladder Bottom
(hashigo gaeshi)
Bullish reversal pattern.
Confirmation is suggested.
Figure 3-119
Reversal candle Patterns
Scenarios and Psychology Behind the Pattern
A downtrend has been in place for some time and the bears are sure to be
complacent. After a good move to the downside, prices trade above the
open price and almost reach the high price of the previous day, but then
they close at another new low. This action certainly will get the attention
of the shorts and shows that the market will not go down forever. The
shorts will rethink their positions and, if profits are good, the next day they
will sell. This action causes a gap up on the last day of the pattern and the
close is considerably higher. If volume is high on the last day, a trend
reversal has probably occurred.
Pattern Flexibility
The four black days of the Ladder Bottom pattern may or may not be long
but consecutively lower closes must occur. The last day must be white and
may be either long or short, as long as the close is above the previous
day's high.
Commentary
After a reasonable downtrend with four consecutive lower closes and black
days, the market trades higher than the open (Figure 3-119). This action is
the first indication of buying even though the market still closes at a new
low. On the next day, prices gap higher and never look back. The last day
closes much higher than the previous day or two.
Rules of Recognition
1. Three long black days with consecutive lower opens and closes
occur much like the Three Black Crows pattern.
Pattern Breakdown
Figure 3-120
2. The fourth day is black with an upper shadow.
3. The last day is white with an open above the body of the previous
day.
e Ladder Bottom reduces to a Hammer pattern, which supports its bull
implications (Figure 3-120).

Chapter 3
Related Patterns
The Ladder Bottom starts out just like the Concealing Baby Swallow
pattern. The first three days also resemble the Three Black Crows pattern
except that a downtrend is in place.
Example
Figure 3-121
Reversal candle Patterns
Matching Low
(niten zoko/kenuki)
Bullish reversal pattern.
Confirmation is suggested.
Figure 3-122
Commentary
The Matching Low pattern follows a concept similar to that used in the
Stick Sandwich pattern. In fact, by removing the middle day in the Stick
Sandwich pattern, you will get a Matching Low pattern. A long black day
continues the downtrend, the next day opens higher, but then closes at the
same close of the previous day. This yields two black days together with
their lower bodies (closes) equal. This pattern indicates a bottom has been
aade, even though the new low was tested and there was no follow
||hjrough, which is indicative of a good support price.
1. A long black day occurs.
2. The second day is also a black day with its close equal to the close
of the first day.

Chapter 3
Scenarios and Psychology Behind the Pattern
The market has been trading lower, as evidenced by another long black
day. The next day, prices open higher, trade still higher, and then close at
the same price as before. This is a classic indication of short-term support
and will cause much concern from any apathetic bears who ignore it.
Apathetic bears are short the market, and quite comfortable with their short
position. If they ignore the Matching Low as a possible trend reversal, it
will cause them much concern.
An interesting concept is presented with this pattern. The psychology
of the market is not necessarily with the action behind the daily trading,
but with the fact that the trading closes at the same price on both days.
Reversal candle Patterns
Related Patterns
The Matching Low closely resembles the Homing Pigeon pattern, but,
because the closes are equal, the second day does not quite fit the defini-
tion of being engulfed.
Examples
Figure 3-124
Pattern Flexibility
The length of the bodies of the two days may be either long or short
without affecting on the meaning of the pattern.
Pattern Breakdown
Figure
3-123
The Matching Low pattern reduces to a long black line, which is usually
bearish (Figure 3-123). Confirmation would be highly recommended.

Continuation patterns are included in a separate chapter from reversal pat-
terns only to make later reference easier. Keep in mind that once a pattern
has been identified, it is suggesting a direction for future price movement.
It really doesn't matter if that future price movement is the same as before
or a reversal. Continuation patterns, according to the Sakata Method, are a
time of rest in the market. Whatever the pattern, you must make a decision
your current position, even if that decision is to stay where you are.
The format of discussion for this chapter is identical to that of the
previous chapter on reversal candle patterns. In condensed form, that for-
mat is
Pattern name
Japanese name and interpretation
Commentary
raphic of classic pattern(s)
uies of recognition
cenarios / psychology behind the pattern
attern flexibility

Continuation Patterns
Upside Tasuki cap
and Downside Tasuki Gap
(uwa banare tasuki and shita banare tasuki)
Confirmation is recommended.
Figure 4-2
e typical Tasuki line occurs when the price opens lower from a white
,and then closes lower than the previous day's low. When the price
is higher from a black day's close and then closes higher than its high
ie opposite case. Tasuki lines are mentioned in a number of sources of
estick literature, but they do not contribute enough to be considered
dividual patterns. A Tasuki is a sash for holding up sleeves. The
i Gaps involve the Tasuki line after a gap in the direction of the
nt market trend.
Upside Tasuki Gap (Figure 4-1) is a white candlestick which has
d above the previous white candlestick, then followed by a black
icstick that closes inside that gap. This last day must also open inside

Chapter 4
the second white day's body. An important point is that the gap made
between the first two days is not filled. The philosophy is that one should
go long on the close of the last day. The same concept would be true in
reverse for a Downside Tasuki Gap (Figure 4-2).
Rules of Recognition
1. A trend is under way, with a gap between two candlesticks of the
same color.
2. The color of the first two candlesticks represents the prevailing
trend.
3. The third day, an opposite-color candlestick opens within the body
of the second day.
4. The third day closes into the gap but does not fully close the gap.
Scenarios and Psychology Behind the Pattern
The psychology behind a Tasuki Gap is quite simple: Go with the trend of
the gap. The correction day (the third day) did not fill the gap and the
previous trend should continue. This is looked upon as temporary profit
taking. The Japanese widely follow gaps (windows). Therefore, the fact
that the gap does not get filled or closed means that the previous trend
should resume.
The literature is sometimes contradictory on gaps. One normally ex-
pects a gap to provide support and/or resistance. The fact that the gap is
tested so quickly is reason to believe that the gap may not provide its usual
analytic ability.
continuation Patterns
Pattern Flexibility
The first day's color is not as important as the color of the second and third
days. It is best that it be the same color as the second day, which would
fully support the ongoing trend.
The Upside Tasuki Gap pattern reduces into a long line with a white body
at the lower end (Figure 4-3). The only support here can be in the fact that
the breakdown is a long white line which is normally considered bullish.
The Downside Tasuki Gap reduces to a long black line which is usually
bearish. Because of the lack of strong support, further confirmation is
recommended.
Related Patterns
The Tasuki lines by themselves are somewhat opposite of the Piercing
Line and the Dark Cloud Cover, which are reversal patterns. The Upside
and Downside Tasuki Gap patterns are very similar to the Upside and
Downside Gap Three Methods patterns discussed later in this chapter. You

Chapter 4
Continuation Patterns
will see that they are also in direct conflict with each other. It might be
best to see the statistical results of the pattern testing in later chapters.
Figure
4-5B

Commentary
w nhi means "in a row" and narabiaka means "whites in a row." The
CmeJTlklture
refers
to
Side-by-Side
Lines,
both
black
and
white,
but
Japanese literature r themselves. The
nnlv indicates a pause or a staiemaie wncu uicy <uc uj
only
maiwic
y ^ ^^
lfaes
^^
haye
d m the
pattern of importance ncic
direction of the current trend.
Continuation Patterns
Bullish Side-by-Side White Lines
Two white candlesticks of similar size are side-by-side after gapping
above another white candlestick. Not only are they of similar size, but the
opening price should be very close. The Bullish Side-by Side White Lines
(Figure 4-6) is also referred to as an Upside Gap Side-by-Side White Lines
(uwappanare narabiaka).
Bearish Side-by-Side White Lines
Side-by-Side White Lines which gap to the downside are very rare. These
are also called Downside Gap Side-by-Side White Lines (Figure 4-7).
Despite what appears to be obvious, these two white lines are looked upon
as short covering. This action, like many continuation patterns, represents
the market taking a rest or buying time.
It would be a normal expectation to have two Side-by-Side Black Lines
for this continuation pattern. A downside gap to Side-by-Side Black Lines
would certainly indicate a continuation of the downtrend. This pattern,
however, is not of much use because it portrays the obvious. Another
derivation of these lines would be Side-by-Side White Lines which do not
gap, but are in an uptrending market. These are called Side-by-Side White
Lines in Stalemate (Hdzumari narabiaka). These indicate that the market is
approaching its top and with limited support.
Rules of Recognition
1. A gap is made in the direction of the trend.
2. The second day is a white candle line.
3. The third day is also a white candle line of about the same size and
opens at about the same price.

Chapter 4
Scenarios and Psychology Behind the Pattern
Bullish Side-by-Side white Lines
The market is in a uptrend. A long white candlestick is formed, which
further perpetuates the bullishness. The next day, the market gaps up on
the open and closes still higher. However, on the third day, the market
opens much lower, in fact, as low as the previous day's open. The initial
selling that caused the lower open ends quickly and the market climbs to
yet another high. This demonstrates the force behind the buyers, and the
rally should continue.
Bearish Side-by-Side White Lines
A downtrend is further enhanced with a long black candle line followed by
a large downward gap open on the next day. The market trades higher all
day, but not high enough to close the gap. The third day opens lower, at
about the same open as the second day. Because of the resistance to further
downside action, shorts are covered, causing the third day also to rally and
close higher, but again not high enough to close the gap. If enough short
covering was accomplished and the rally attempt was not very convincing,
the downtrend should continue.
Pattern Flexibility
Because Side-by-Side White Lines are used only after gapping, there is not
much flexibility in this pattern. The two white lines should be of similar
body length, but this length is not as important as the fact that they gapped
in the direction of the trend. Their open prices should be close to the same,
though.
Continuation Patterns
The Upside Gap Side-by-Side White Lines reduce to a long white candle-
stick which fully supports the bullish continuation (Figure 4-8). The
Downside Gap Side-by-Side White Lines reduce to a black candlestick
with a long lower shadow (Figure 4-9). This single candle line does not
fully support the bearish continuation and suggests further confirmation.
Related Patterns
There are no patterns comparable to the Side-by-Side White Lines. The
Breakaway pattern has some similarities in that the second and third days
gap in the direction of trend.

continuation Patterns

Chapter 4
Rising Three Methods
and Falling Three Methods
(uwa banare sanpoo ohdatekomi and shita banare sanpoo ohdatekomi)
No confirmation is required.
Figure 4-12
Commentary
The Three Methods (Chapter 5) include the bullish Rising Three Methods
and the bearish Falling Three Methods. Both are continuation patterns that
represent breaks in the trend of prices without causing a reversal. They are
days of rest in the market action and can be used to add to positions, if
already in the market.
Rising Three Methods
A long white candlestick is formed in an uptrend (Figure 4-11). After this
long day, a group of small-bodied candlesticks occur which show some
resistance to the previous trend. These reaction days are generally black,
but most importantly, their bodies all fall within the high-low range of the
first long white day. Remember that the high-low range includes the shad-
ows. The final candlestick (normally the fifth day) opens above the close
of the previous reaction day and then closes at a new high.
Continuation Patterns
Falling Three Methods
The Falling Three Methods pattern is the bearish counterpart of the Rising
Three Methods pattern. A downtrend is underway, when it is further per-
petuated with a long black candlestick (Figure 4-12). The next three days
produce small-body days that move against the trend. It is best if the
bodies of these reactionary days are white. It is noted that the bodies all
remain within the high-low range of the first black candlestick. The next
and last days should open near the previous day's close and then close at
a new low. The market's rest is over.
Rules of Recognition
1. A long candlestick is formed representing the current trend.
2. This candlestick is followed by a group of small real body candle-
sticks. It is best if they are opposite in color.
3. The small candlesticks rise or fall opposite to the trend and remain
within the high-low range of the first day.
4. The final day should be a strong day, with a close outside of the
first day's close and in the direction of the original trend.
Scenarios and Psychology Behind the Pattern
The concept behind the Rising Three Methods comes from early Japanese
futures trading history and is a vital part of the Sakata Method. The Three
Methods pattern is considered a rest from trading or a rest from battle. In
modern terminology, the market is just taking a break. The psychology
behind a move like this is that some doubt creeps in about the ability of the
trend to continue. This doubt increases as the small-range reaction days
take place. However, once the bulls see that a new low cannot be made,
the bullishness is resumed and new highs are set quickly. The Falling
Three Methods pattern is just the opposite.

Chapter 4
Continuation Patterns
Pattern Flexibility
Because this pattern normally consists of five candle lines, it is somewhat
rare to find in its classic form. Some leeway can be allowed in the range of
the reaction days. They may go slightly above or below the range of the
first day. It is best, if this is allowed, that they cover the range of the first
day completely. If they do not and tend in one direction, the pattern can
become a Mat Hold pattern, if it occurs in an uptrend.
The Rising Three Methods pattern reduces to a long white candlestick,
which fully supports the bullish continuation (Figure 4-13). The Falling
Three Methods pattern reduces to a long black candlestick, which fully
supports the bearish continuation (Figure 4-14).
Examples
Figure
4-15A
Related Patterns
A pattern similar to the bullish Rising Three Methods is the Mat Hold
pattern. It is also a bullish continuation pattern but allows greater flexibil-
ity in the reaction days. That is, the small black days that are between the
two long white days do not have to be within the range of the first white
day. These reaction days are generally higher relative to the first candle-
stick. Seeing the two patterns side-by-side will show that the uptrend was,
and is, much stronger for the Mat Hold pattern.

Chapter 4
Figure
4-158
Continuation Patterns
Separating Lines
(iki chigai sen)
Confirmation is required, especially for the bullish case.
Commentary
The Separating Lines have the same open and are opposite in color. They
are similar, but opposite of the Meeting Lines. The second day of these
patterns is a Belt Hold candlestick. The bullish pattern (Figure 4-16) has a
white bullish Belt Hold and the bearish pattern (Figure 4-17) has a black
bearish Belt Hold. Ikichigaisen means lines that move in opposite direc-
tions. Sometimes these are called Dividing (furiwake) Lines.
Rules of Recognition
1. The first day is the opposite color of the current trend.
2. The second day is the opposite color of the first.

Chapter 4
3. The two bodies meet in the middle, at the open price.
Scenarios and Psychology Behind the Pattern
An uptrend is in place when a long black day occurs. This is not normal
for a strong market and will produce some skepticism. However, the next
day opens much higher, in fact, it opens at the previous black day's open-
ing price. Prices then move higher for the rest of the day and close higher,
which suggests that the prior uptrend should now continue. This scenario
is for the bullish Separating Line; the bearish scenario is quite similar, but
opposite.
Pattern Flexibility
Separating Lines should each be long lines: however, there is no require-
ment that this be so. Strong furiwake lines would be two long bodies
without any shadows (marubozu) at the points where they meet.
Continuation Patterns
indecision in the market and therefore does not fully support the bullish
continuation of this pattern. The bearish Separating Lines pattern reduces
to a candle line with a black body near the lower portion of the range
(Figure 4-19). This line can be considered bearish and therefore supports
the bearish continuation pattern.
Related Patterns
The Meeting Lines, which are not continuation, but reversal patterns, are
similar in concept.
Examples
Figure 4-20A
The bullish Separating Lines pattern reduces to a Long-Legged Doji line
(Figure 4-18). A Doji, and especially the Long-Legged Doji, represents

Chapter 4
Figure 4-20B
Continuation Patterns
Mat Hold
(uwa banare sante oshf)
Bullish continuation pattern.
No confirmation is required.
Figure 4-21
Commentary
The Mat Hold pattern is a modified version of the Rising Three Methods.
The first three days start out like the Upside Gap Two Crows, with the
exception that the second black body (third day) dips into the body of the
first long white day (Figure 4-21). This is followed by another small black
body that closes even lower, but still within the range of the first white
body. The fifth day sees a large gap opening, with a strong rise to a close
above the high of the highest of the three black days. This suggests that the
trend will continue upward and that new positions can be taken here.
The Mat Hold Pattern shows greater strength as a continuation signal
than the Rising Three Methods. The reaction days are basically higher than
the ones in the Rising Three Methods. In other words, the Mat Hold does
not take quite the rest, or break from trend, that the Rising Three Methods
does.

Chapter 4
Rules of Recognition
1. A long white day is formed in an uptrending market.
2. A gap up with a lower close on the second day forms almost a
star-like day.
3. The following two days are reaction days similar to the Rising
Three Methods.
4. The fifth day is a white day with a new closing high.
Scenarios and Psychology Behind the Pattern
The market is continuing its rise, with a long white day confirming the
bullish action. The next day prices gap open and trade in a small range,
only to close slightly lower. This lower close (lower than the open) is still
a new closing high for the move. The bulls have only rested, even though
the price action surely brings out the bears. The next couple of days cause
some concern that the upward move may be in jeopardy. These days open
about where the market closed on the previous day and then close slightly
lower. Even by the third such day, the market is still higher than the open
of the first day (a long white day). An attitude that a reversal has failed
develops and prices rise again to close at a new closing high. This fully
supports the bulls' case that this was just a pause in a strong upward trend.
Pattern Flexibility
The arrangement of the three small black days should show consecutive
declines, much like the Rising Three Methods. The reaction days are alto-
gether higher than those in the Rising Three Methods.
Continuation Patterns
Pattern Breakdown
The bullish Mat Hold pattern reduces to a long white candlestick, which
fully supports its bullish continuation (Figure 4-22).
Figure
4-22
Related Patterns
Rising Three Methods is a more rigid pattern. Even though this pattern
begins somewhat like the Upside Gap Two Crows, the closing of the third
day into the body of the first day eliminates that possibility. One must also
be on guard for a possible Three Black Crows pattern starting with the
second day, especially if it is a long day.

Continuation Patterns
Three-Line Strike
(sante uchi karasu no bake sen)
Confirmation is definitely required.
commentary
Bullish Three-Line Strike
This is a four-line pattern that appears in a defined trend. It can be looked
upon as an extended version of either the Three Black Crows pattern
(bearish) or the Three White Soldiers pattern (bullish). This pattern is a
resting or pausing pattern; the rest is accomplished in only one day. Breaks
in trend are almost always healthy for the trend. Some Japanese literature
refers to this pattern as the Fooling Three Crows for the bearish version.
The bullish case could also be called Fooling Three Soldiers.
Three white days with consecutively higher highs are followed by a long
black day (Figure 4-24). This long black day opens at a new high and then
plummets to a lower low than the first white day of the pattern. This type
of action completely erases the previous three-day upward march. If the
previous trend was strong, this should be looked upon as just a setback

Chapter 4
with some profit taking. This last day is considered a liquidating day,
which will give the upward trend needed strength.
Bearish Three-Line Strike
A downtrend is accentuated by three black days that each have consecu-
tively lower lows (Figure 4-25). The fourth day opens at a new low, then
rallies to close above the high of the first black day. This last long white
day completely negated the previous three black days. This day should be
looked upon as a day when shorts were being covered and the down move
should continue.
Rules of Recognition
Bullish Three-Line Strike
1. Three days resembling Three White Soldiers are continuing an
uptrend.
2. A higher open on the fourth day drops to close below the open of
the first white day.
Bearish Three-Line Strike
1. Three days resembling Three Black Crows are continuing a down-
trend.
2. A lower open on the fourth day rallies to close above the open of
the first black day.
Scenarios and Psychology Behind the Pattern
The market has continued in its trend, aided by the recent Three Black
Crows or Three White Soldiers pattern, as the case may be. The fourth day
opens in the direction of the trend, but profit taking or short covering
Continuation Patterns
causes the market to move strongly in the opposite direction. This action
causes considerable soul searching, but remember that this move com-
pletely eradicated the previous three days. This surely dried up the short-
term reversal sentiment and the trend should continue in its previous
direction.
Pattern Flexibility
The amount of the initial gap in the direction of trend and the amount the
fourth day moved would be strong indication's of the success of this
pattern as a continuation pattern.
The bullish Three-Line Strike pattern reduces to a Shooting Star line and
is in direct conflict with the bullishness of this pattern (Figure 4-26). The
bearish Three-Line Strike pattern reduces to a Hammer and is also in direct
conflict with this pattern's bearishness (Figure 4-27).
Related Patterns
There is a hint of Three White Soldiers and Three Black Crows in these
patterns, but their influence is quickly negated with the strong reaction day
that follows.


Chapter 4
Upside Gap Three Methods and Downside
Gap Three Methods
(uwa banare sanpoo hatsu oshi and shita banare sanpoo ippon dachi)
Confirmation is suggested.
Commentary
This is a simplistic pattern, quite similar to the Upside and Downside
Tasuki Gaps, that occurs in a strong trending market. A gap appears be-
tween two candlesticks of the same color (Figures 4-29 and 4-30). This
color should reflect the trend of the market. The third day opens within the
body of the second candlestick and then closes within the body of first
candlestick (bridging the first and second candles), which would also make
it the opposite color of the first two days. This would, in traditional termi-
nology, close the gap.
Continuation Patterns
Rules of Recognition
1. A trend continues, with two long days that have a gap between
them.
2. The third day fills the gap and is the opposite color of the first two
days.
Scenarios and Psychology Behind the Pattern
The market is moving strongly in one direction. This move is extended
further by another day that gaps even more in the direction of the trend.
The third day opens well into the body of the second day, then completely
fills the gap. This gap-closing move should be looked upon as supporting
for the current trend. Gaps normally provide excellent support and/or resis-
tance points when considered after a reasonable period of time. Because
this gap is filled within one day, some other considerations should be
made. If this is the first gap of a move, then the reaction (third day) can be
considered as profit taking.
Pattern Flexibility
No significant flexibility is suggested, as this is a fairly simple concept and
pattern. The first day could be opposite in color to the second day without
much change in the pattern's interpretation.
Pattern Breakdown
The bullish Upside Gap Three Methods pattern reduces to a Shooting Star
line (Figure 4-31) and the bearish Downside Gap Three Methods pattern
reduces to a Hammer line (Figure 4-32). These are two patterns (when all
are considered) that do not reduce to the single line that supports the
bullish or bearish nature of the pattern.

continuation Patterns
Related Patterns
These are somewhat similar to the Tasuki Gap, except that the gap is filled

continuation Patterns
(ate kubi)
Bearish continuation pattern.
Confirmation is suggested.
Commentary
Rules of Recognition
1. A long black line is formed in a downtrend.
2. The second day is white and opens below the low of the previous
day. This day does not need to be a long day or it might resemble
the bullish Meeting Line.
3. The second day closes at the low of the first day.
The On Neck Line is an undeveloped version of the Piercing Line dis-
cussed in Chapter 3. A similar pattern is formed, except that the second
day's white body only gets up to the previous day's low (Figure 4-34). Do
not confuse this pattern with the Meeting Lines, covered in Chapter 3.

Chapter 4
Scenarios and Psychology Behind the Pattern
The On Neck Line usually appears during a decline. Bearishness is in-
creased with the long black first day. The market gaps down on the second
day, but cannot continue the downtrend. As the market rallies, it is stopped
at the previous day's low price. This must be uncomfortable for the bottom
fishers who go into the market that day. The downtrend should continue
shortly.
Pattern Flexibility
If the trading volume on the second day is high, the chance of the down-
ward trend's continuing is good.
Continuation Patterns
Pattern Breakdown
Figure 4-35
The On Neck Line pattern reduces to a fairly bearish black candlestick
with a long lower shadow (Figure 4-35). This single candle line supports
the bearishness of this continuation pattern.
Related Pattern
The On Neck Line pattern is a weak beginning to a Piercing Line. See also
the In Neck Line and the Thrusting Line.

Chapter 4
Commentary
This is also a modified or undeveloped version of the Piercing Line. The
second day's white body closes near the close of the previous black day; at
the lower part of the body (Figure 4-37). The actual definition requires that
it close just inside the previous day's body, that is, slightly above the close.
It is a higher close than the On Neck Line, but not much. If the first day's
close is also at its low (Closing Marubozu), the In Neck and On Neck
Lines are most probably the same.
Rules of Recognition
1. A black line develops in a downtrend.
2. The second day is a white day with an opening below the first
day's low.
Continuation Patterns
3. The close of the second day is just barely into the body of the first
day. For all practical purposes, the closes are equal.
Scenarios and Psychology Behind the Pattern
The scenario is almost identical to the On Neck Line, except that the
downtrend may not continue quite as abruptly because of the somewhat
higher close.
Pattern Flexibility
If the volume on the white day (second day) is heavy, the chance of the
trend's continuing is good.
The In Neck Line pattern reduces to a black candlestick with a long lower
shadow (Figure 4-38). The fact that this single line is not at all bullish
lends support for the bearish continuation of this pattern.
Related Patterns
The In Neck Line, like the On Neck Line, is a weak beginning to a
Piercing Line. It, however, is a little stronger, but not nearly enough to

Chapter 4
cause a reversal of trend. You should also note that this pattern, if both
days are near Marubozu, would be like the Meeting Lines pattern.
Thrusting
(sashikomi)
Bearish continuation pattern.
Confirmation is required.
Figure 4-40
Commentary
This is the third derivative of the Piercing Line. The Thrusting Line is
stronger than either the On Neck Line or the In Neck Line, but fails to
close above the midpoint of the previous day's body (Figure 4-40). The
second day is normally a much larger gap down than the In Neck or On
Neck patterns. This makes it a long white day and confirmation definitely
is needed before adding to short positions.
Rules of Recognition
1. A black day is formed in a downtrend.
2. The second day is white and opens considerably lower than the low
of the first day.

Chapter 4
3. The second day closes well into the body of the first day, but not
above the midpoint.
Scenarios and Psychology Behind the Pattern
Much like the On Neck and In Neck Lines, the Thrusting Line represents
a failure to rally in a down market. Because of this failure, the bulls will be
discouraged and a lack of buying will let the downtrend continue.
Pattern Flexibility
Because the Thrusting pattern is approaching the bullish Piercing Line
pattern and is slightly better than the On Neck Line, there is little room for
flexibility.
Pattern Breakdown
Figure
4-41
The Thrusting pattern reduces to a Hammer line which is somewhat in
conflict with the bearishness of this pattern (Figure 4-41). Because the
Thrusting pattern is so close to being a Piercing Line pattern, it is easy to
see the possibility of no breakdown support.
Continuation Patterns
Related Patterns
The Thrusting pattern is the strongest of the three lines that fail to make a
Piercing Line. It is stronger than the On Neck and In Neck Lines, but
weaker than the Piercing Line.
Example
Figure
4-42

Chapter 4
Additional Note
You may wonder why there are three continuation patterns that are derived
from a failure to complete a Piercing Line. The On Neck Line, In Neck
Line, and Thrusting patterns all represent failed attempts to reverse the
downward trend.
Why, then, are there not similar patterns that represent failed Dark
Cloud Cover patterns? This can be answered by most students of the
market who are familiar with normal topping and bottoming tendencies.
Bottoms (market lows) tend to be sharp and with more emotion. Tops
usually take longer to play out, and cannot be as easily identified.
Japanese history, and Japanese financial trading history, in particular, is
rich with accounts of success, usually dominated by only a few individu-
als. One such success was a man named Munehisa (Sohkyu) Honma.
Some references use Sohkyu and some use Munehisa.
Honma stepped into Japanese futures trading history in the mid-eigh-
teenth century. When Honma was given control of the wealthy family
business in 1750, he began trading at the local rice exchange in the port
city of Sakata in Dewa Province, now Yamagata Prefecture, on the west
coast of northern Honshu (about 220 miles north of Tokyo). Sakata was a
collection and distribution port for rice and today is still one of the most
important ports on the Sea of Japan.
Stories have it that Honma established a personal communications net-
work that consisted of men on rooftops spaced every four kilometers from
Osaka to Sakata. The distance between Osaka and Sakata is about 380
miles, which would have required well over 100 men. This allowed
Honma the edge he needed to accumulate great wealth in rice trading.
Honma kept many records in order to learn about the psychology of
investors. His studies helped him understand that the initial entry into a
trade must not be rushed. According to Honma, if you feel compelled to
rush into a trade because you believe that you just can't lose, wait three

Chapter 5
Sakata's Method and candle Formations
days to see if you still feel the same way. If you do, you can enter the
trade, probably quite successfully.
The Honma family owned a great rice field near Sakata and they were
considered extremely wealthy in both fact and song. One folk song said
that no man can be as wealthy as a Honma: one can merely hope to be as
rich as a daimyo. A daimyo is the early Japanese term for a feudal lord.
Honma died in 1803. During this period of time a book was published.
"If all other people are bullish, be foolish and sell rice" is some of the
advice contained in San-en Kinsen Horoku. This book was published in
1755 and is known today as the basis of Japan's market philosophy.
Today, in Sakata, a house which once belonged to the Honma family, is
the Honma Museum of Art.
All of the patterns and formations based upon Sakata's Method are
taken from 160 rules that Honma wrote when he was 51 years old.
Sakata's Method, in turn, is what is now considered as the beginnings of
candle pattern recognition. Candlestick charting was not actually devel-
oped by Honma, only the pattern philosophy that goes with it. His ap-
proach has been credited as the origin of current candlestick analysis.
Since Honma came from Sakata, you may see reference to: Sakata's
Law, the Sakata Method, Sakata's Five Methods, Honma Constitution, and
similar names. While the labels may differ, the analysis technique remains
the same. This book will refer to this approach as Sakata's Method.
Sakata's Method
Sakata's Method, as originated and used by Honma for basic chart analy-
sis, deals with the basic yin (inn) and yang (yon) candle lines along with
two additional lines. The concept is centered around the number 3. The
number 3 appears often in traditional analysis as well as in Japanese chart-
ing techniques. Sakata's Method is a technique of chart analysis using the
number 3 at different points and times in the market. Sakata's Method can
be summarized as:
San-zan (three mountains)
San-sen (three rivers)
San-ku (three gaps)
San-pei (three soldiers)
San-poh (three methods)
From this list it is should be obvious that san refers to the ubiquitous
number 3.
San-zan (three mountains)
Three Mountains forms a line that makes a major top in the market. This
is similar to the traditional Western triple top formation in which the price
Figure
5-1A

rises and falls three times, forming a top. This formation is also similar to
the Three Buddha Top (san-son) formation which is the equivalent of the
traditional head and shoulders formation. It comes from the positioning of
three Buddhist images lined up, with a large Buddha in the center and a
smaller one on each side. San-zan also includes the typical Western triple
top where three upmoves are made with comparable corrections that fol-
low. The three tops may be the same height or may be trending in one
direction, most probably down.
San-sen (three rivers)
Three Rivers is the opposite of Three Mountains. It is often used like the
traditional triple bottom or inverted head and shoulders bottom, but this is
sakata's Method and candle Formations
Figure
5-2A
^ MV7OT Cll
not necessarily correct. The Three Rivers method is based on the theory of
using three lines to forecast the turning point of the market. This can be
seen in a number of bullish candle patterns using three lines, such as the
Morning Star and Three White Soldiers. In Japanese literature, the Morn-
ing Star is often called the Three Rivers Morning Star in reference to this
Sakata Method.
There is some confusion about whether Sakata's Method uses Three
Rivers for a bottom formation technique or whether it refers to the use of
three lines for identifying tops and bottoms. There is considerable refer-
ence in Japanese literature to Three Rivers Evening Stars (a bearish pat-
tern) and the Three Rivers Upside Gap Two Crows (also a bearish pattern).
Also recall from Chapter 3 that there was a bullish reversal pattern called
the Unique Three Rivers Bottom.

Chapter 5
Figure 5-2B
San-ku (three gaps)
This method uses gaps in price action as a means to time entry and exit
points in the market. The saying goes that after a market bottom, sell on
the third gap. The first gap (ku) demonstrates the appearance of new buy-
ing with great force. The second gap represents additional buying and
possibly some covering by the sophisticated bears. The third gap is the
result of short covering by the reluctant bears and any delayed market
Sakata's Method and Candle Formations
orders for buying. Here, on the third gap, Sakata's Method recommends
selling because of the conflict of orders and the possibility of reaching
overbought conditions too soon. This same technique works in reverse for
downward gaps in the market after a top. The Japanese term for filling a
gap is anaume. Gaps (ku) are also called windows (madd) by the Japanese.

San-pei (three soldiers)
San-pei means "three soldiers who are marching in the same direction."
This is typified by the bullish Three White Soldiers candle pattern, which
indicates a steady rise in the market. This steady type of price rise shows
promise as a major move to the upside. Sakata's Method also shows how
this pattern deteriorates and shows weakness in the market rise. These
bearish variations to the bullish Three White Soldiers pattern are discussed
next. The first variation of the Three White Soldiers pattern is the Advance
Block pattern, which is quite similar, except that the second and third
Sakata's Method and Candle Formations
white days have long upper shadows. The second variation of the Three
White Soldiers pattern is the Deliberation (stalled) pattern, which also has
a long upper shadow on the second day. However, the third day is a
Spinning Top, and most likely a star. This suggests that a turnaround in the
market is near.
Other patterns that make up the san-pei method are the Three Black
Crows and the Identical Three Crows patterns. Each of these candle pat-
terns is bearish and indicates a weak market (Chapter 3).

Sakata's Method and candle Formations
San-poh (three methods)
San-poh means "a rest or cease-fire in market action." A popular Japanese
saying is "Buy, sell, and rest." Most traditional books on market psychol-
ogy and trading suggest taking a break from the markets. This is necessary
for many reasons, not the least of which is to get a perspective on the
market while not having any money involved. San-poh involves the con-
tinuation patterns called the Rising Three Methods and the Falling Three
Methods (Chapter 4). Some sources also refer to two other patterns, the
Upside Gap Three Methods and Downside Gap Three Methods, all dis-
cussed in Chapter 4.
The Rising and Falling Three Methods continuation patterns are rest-
ing patterns. The trend of the market is not broken, only pausing while
preparing for another advance or decline.
Sakata's Method is intended to present a clear and confident way of
looking at charts. Often Sakata's Method is presented along with the fol-
lowing simple philosophy:
1. In an up or a down market, prices will continue to move in the
established direction. This fact was instrumental in the develop-
ment of candle pattern identification with a computer (Chapter 6).
2. It takes more force to cause a market to rise than to cause it to fall.
This is related directly to the traditional saying that a market can
fall due to its own weight.
3. A market that has risen will eventually fall, and a market that has
fallen will eventually rise. As an article in the September 1991 /
issue of Forbes observed, in bear markets, it's smart to remind
Figure 5-7

Chapter 5
Figure 5-8
yourself that the world isn't coming to an end, and in bull markets,
it's smart to remind yourself that trees don't grow to the sky. A
similar and more common analogy is that all good things must
come to an end.
4. Market prices sometimes just stop moving completely. This refers
to lateral trading, a time for all but the most nimble traders to stand
aside.
Sakata's Method, while focusing on the number 3, also involves the
use of broader formations in which numerous candle patterns may exist.
Sakata's Method and candle Formations
Candle Formations
There are many Japanese candle formations that resemble price formations
used in traditional technical analysis. Steve Nison coined many of the
names commonly used in the West today. These formations can consist of
many days of data. These formations are used as general market indicators
and lack the precise timing that many investors and traders require. When
a formation does evolve, look for additional evidence of price reversal,
such as a reversal candle pattern. Some interference may occur when a
formation takes shape over a long period of time. Remember that most
candle patterns, and certainly almost all reversal candle patterns, require
that they have a relationship with the current or previous trend. These
trends are greatly influenced by the following candle formations.
Eight New Price Lines (shinne hatte)
Figure
5-9

Chapter 5
This is a formation of continually rising prices in the market. After eight
new price highs are set, one should take profits, or at least protect positions
with stops. Action based on ten new price highs, twelve new price highs,
and thirteen new price highs is also mentioned in some literature, but not
recommended here. The previous market action should be taken into con-
sideration before using this technique.
Tweezers (kenukl)
Tweezers is a relatively simple formation using the components of two or
more daily candle lines to determine tops and bottoms. If the high of two
days is equal, the formation is called a Tweezer Top (kenukitenjo). Like-
wise, if the low of two days is equal, it is called a Tweezer Bottom
(kenukizoko). The high or low of these days may also coincide with the
open or close. This means that one day could have a long upper shadow
and the next day could be an Opening Marubozu with the open (also the
high) equal to the high of the previous day. The Tweezer Top or Tweezer
Bottom is not limited to just two days. Days of erratic movement could
occur between the two days that make up the tweezer formation.
Tweezer Tops and Tweezer Bottoms are formations that will give short
term support and resistance. The terms support and resistance refer to
prices that have previously turned the market. Support is a price base that
stops market declines, and resistance is a level of prices that usually halts
market rises. A good indication that tweezer tops and bottoms have suc-
ceeded occurs when they are also part of a reversal pattern. An example of
this would be a Harami Cross in which the two highs (or lows) are equal.
sakata's Method and candle Formations
Figure 5-10
Similar in concept to the Tweezers is the Matching Low and Stick
Sandwich patterns discussed in Chapter 3. These two bullish reversal pat-
terns are derivatives of the tweezer concept, except that the close price is
used exclusively, whereas the Tweezer may use any data component, such
as high or low.

Chapter 5
High waves (takane nochlal)
The High Waves formation can be seen in the upper shadows on a series
of candle lines. After an uptrend, a series of days such as a Shooting Star,
Spinning Tops, or Gravestone Doji can produce topping tendencies. This
failure to close higher shows a loss of direction and can indicate a reversal
in market direction. An Advance Block pattern could also be the beginning
of a High Waves formation.
sakata's Method and candle Formations
Tower Top and Tower Bottom (ohtenjyou}
Tower Tops and Tower Bottoms are made of many long days which
slowly change color and indicate a possible reversal. Tower Bottoms occur
when the market is in a downtrend, along with many long black days, but
not necessarily setting significantly lower prices as in the Three Black
Crows pattern. These long black days eventually become white days, and
even though a turnaround isn't obvious, new closing highs are eventually
made. There is nothing to say that an occasional short day cannot be part
of this reversal pattern. These short days usually happen during the transi-
tion from black to white days. Of course, the Tower Top is the exact
opposite. The term Tower refers to the long days which help define this
pattern. Some Japanese literature refers to this type of formation as a
Turret Top when it occurs at peaks.
Figure 5-12

sakata's Method and Candle Formations
Fry Pan Bottom (nabezoko)
The Fry Pan Bottom is similar to the Tower Bottom, except that the days
are all small or short body days. The bottom formation is rounded and the
colors are not as important. After a number of days of slowly rounding out
the bottom, a gap is made with a white day. This confirms the reversal and
an uptrend should begin. The name is derived from the scooping bottom of
a frying pan with a long handle.

Chapter 5
Dumpling Top
The Dumpling Top is the counterpart of the Fry Pan Bottom formation. It
is a rounded top similar to the rounded top in traditional technical jargon.
The downtrend is confirmed by a gap to a black body. If the black day
after the gap is a Belt Hold Line, the ability of this formation to predict
future price movement is even better.
Figure
5-15
sakata's Method and Candle Formations
High Price Gapping Play and Low Price Capping Play
(bohtoh and bohraku)
High and Low Price Gapping Plays are the Japanese equivalents of break
outs. As prices begin to consolidate near a support or resistance level, the
indecision in the market becomes greater as time goes by. Once this range
is broken, market direction is quickly resumed. If the break out is caused
by a gap in the same direction as the prices were trending before the
consolidation, a further move in that direction is certain. Because of the
subjective nature of these formations, the textbook cases will rarely be
seen. Basically, they are the same as the Rising and Falling Three Methods
and the Mat Hold, except that no clear arrangement of candlesticks can be
used to define them.

Chapter 5
Figure 5-17
Data Requirements, caps, and Rules
Only daily price data, which consists of open, high, low, and close prices
on a stock or commodity, is being used when explaining these concepts.
Many times, the open price is not available on stocks. In such cases the
previous day's closing price has been substituted. The exception to this is
when the previous day's close is higher than today's high, today's high is
used for the open. Similarly, when the previous day's close is lower than
today's low, today's low is used as the open price. This allows the visibil-
ity of gaps from one day's close to the next day's range.
Gaps are an important part of candlestick analysis. To demonstrate that
there is not much difference, the S&P 100 stocks with and without open
price were tested and analyzed. Comprehensive testing was also accom-
plished on vast amounts of data that contained the open price to see if there
was any statistical information about gaps that could be used when the
open price was not available. Whenever a day's high and low prices were
greater than the high price of the preceding day, a gap-up analysis was
performed. Likewise, whenever a day's high and low price were less than
the previous day's low price, a gap-down analysis was done. Once a "gap
day" was identified, the following formula was used to determine the
location of the open price relative to the day's range:

• Inverted Hammer
• Dark Cloud Cover
• Piercing Line
• Meeting Lines
• Upside Gap Two Crows
• Two Crows
• Unique Three River Bottom
• Kicking
• Matching Low
• Side-by-Side White Lines
• Three Line Strike
• in Neck Line
There are techniques that can be used in computerized candle pattern
identification that will still allow these patterns to be used. For example,
one could set some parameters that relate the data components from
"greater than" to "greater than or equal to." As a result a requirement that
the open of one day to be less than the close of the previous day could be
modified so that the open could also be equal. Although this may stretch
the philosophy of candle pattern recognition too far, it at least permits the
use of data that do not contain the open price.
Today's electronic capabilities let traders watch intraday price move-
ments from single trade ticks, one minute bars, and almost any other
conceivable increment in between. It is not the purpose here to decide
which type is better, but sometimes the trees do get in the way of the
forest. One must also keep in mind that candle patterns reflect the short
term psychology of trading, including the decision process that occurs after
a market is closed. This is why open and close prices are so important.

Chapter 6
Using intraday day data without the benefit of a break is questionable at
the very least.
The Idea
Pattern recognition has been around for many years. A computer can check
and scan vast amounts of data and compile unlimited statistics on patterns
and their ability to forecast prices. This approach never remains popular
for very long because it is based solely on statistics and overlooks an
important explanation of why some patterns are more successful than oth-
ers—human psychology.
Enter Human Psychology
In the first few minutes of the trading day, a great deal of overnight
emotion is captured. Sometimes special events will even cause chaos. For
example, on the New York Exchange, it may take several minutes for the
specialists to open a stock for trading because of a large order imbalance.
However, once a stock or commodity does open, a point of reference has
been established. From this reference point, trading decisions are made
throughout the day.
As the trading day progresses, extremes are reached as speculator emo-
tion is tossed around. These extremes of emotion are recorded as the high
and low of the trading day. Finally, the trading day ends and the last trade
is recorded as the closing price. This is the price that many will use to help
make decisions about their positions and the tactics they will use at the
open of the next trading day.
Aside from intraday data, four prices are normally available for the
trader to analyze. One certainly knows the exact open and close prices for
any trading day, but at what times during the day the high and low were
reached, and in what order, are not known.
How does one determine the existence of a candlestick pattern?
The Philosophy Behind candle Pattern Identification
Most candle patterns require the identification of, not only the data
relationship making the pattern, but also the trend immediately preceding
the pattern. The trend is what sets up the psychology of traders for the
candle pattern to develop. Most of the current literature somehow evades
this essential ingredient to candle pattern recognition.
It must also be stated here that Japanese candlestick analysis is short
term (one to ten days) analysis. Any patterns that give longer term results
are surely just coincidental.
Trend Determination
What is a trend? This question, if it could be answered in depth, could
reveal the secrets of the marketplace and maybe even the universe. For this
discussion, only a simple and highly reliable short term answer is sought.
Trend analysis is a primary part of technical analysis. To some, trend
identification is as important as the timing of reversal points in the market.
Technical analysis books deal with the subject of trend quite thoroughly
and define it in numerous ways. One of the most common approaches is
the moving average.
Moving Averages and Smoothing
One of the simplest market systems created, the moving average, works
almost as well as the best of the complicated smoothing techniques. A
moving average is exactly the same as a regular average except that it
"moves" because it is continuously updated as new data become available.
Each data point in a moving average is given equal weight in the compu-
tation, hence the term arithmetic or simple is sometimes used when refer-
ring to a moving average.
A moving average smooths a sequence of numbers so that the effects
of short term fluctuations are reduced, while those of longer term fluctua-
tions remain relatively unchanged. Obviously, the time span of the moving
average will alter its characteristics.

Chapter 6
J. M. Hurst in The Profit Magic of Stock Transaction Timing (1970)
explained these alterations with three general rules:
1. A moving average of any given time span exactly reduces the
magnitude of the fluctuations of duration equal to that time span to
zero.
2. The same moving average also greatly reduces (but does not elim-
inate) the magnitude of all fluctuations of duration less than the
time span of the moving average.
3. All fluctuations are greater than the time span of the average "come
through," or are also present in the resulting moving average line.
Those with durations just a little greater than the span of the aver-
age are greatly reduced in magnitude, but the effect lessens as
periodicity duration increases. Very long duration periodicities
come through nearly unscathed.
A somewhat more advanced smoothing technique is the exponential
moving average. In principle, it accomplishes the same thing as the simple
(arithmetic) moving average. Exponential smoothing was developed to
assist in radar tracking and flight path projection. A quicker projection of
trend was needed with more influence from the most recent data. The
formula for exponential smoothing appears complex, but it is only another
way of weighting the data components so that the most recent data receive
the greatest weight. Even though only two data points are required to get
an exponentially smoothed value, the more data used the better. All of the
data are used and are a part of the new result.
A simple explanation of exponential smoothing is therefore given here.
An exponential average utilizes a smoothing constant that approximates
the number of days for a simple moving average. This constant is multi-
plied by the difference between today's closing price and the previous
day's moving average value. This new value is then added to the previous
day's moving average value. The smoothing constant is equivalent to
2/(n+l) where n is the number of days used for a simple moving average.
The Philosophy Behind Candle Pattern identification
The Trend Method used
After conducting numerous tests, a short term exponential smoothing of
the data was determined to best identify the short term trend. It gives the
best, easiest, and quickest determination of the short term trend and is
certainly a concept which one can understand. Simple concepts are usually
more reliable and certainly more creditable.
Numerous tests were performed on vast amounts of data with the find-
ing that a exponential period of ten days seemed to work as well as any,
especially when you recall that candlesticks have a short term orientation.
Identifying the Candle Patterns
Previous chapters presented detailed descriptions of the exact relationships
among the open, high, low, and close. Those chapters also dealt with the
concept of trend use, while this chapter focused on trend determination. In
addition, a method of determining long days, short days, doji days, etc. is
needed, including the relationship between the body and the shadows. The
latter is essential for proper identification of patterns such as the Hanging
Man and Hammer. The following sections will show the multitude of
methods used to accomplish these and similar tasks.
Long Days
Any of three different methods are available, where each, or any combina-
tion, of the three can be used to determine long days. The term minimum
in these formulas refers to the minimum acceptable percentage for a long
day. Any day whose body is greater than this minimum value will be
considered a long day.
1. Long Body / Price - Minimum (0 to 100%)
This method will relate the day in question with the actual value of
the prices for a stock or commodity. If the value is set at 5% and
the price is at 100, then a long day will be any day whose range


Chapter 6
patterns. Patterns such as the Shooting Star and Inverted Hammer use just
the inverse of these settings.
Doji Days
Doji occurs when the open and close prices are equal. This is an exception-
ally restrictive rule for most types of data and should have some leeway
when identifying candle patterns. The formula lets you set a percentage
difference between the two prices that will be acceptable.
Doji Body / High to Low Range - Maximum (0 to 100%)
This value is a percentage maximum of the prices relative to the range
of prices on the Doji day. A value in the neighborhood of 1 to 3% seems
to work quite well.
Equal Values
Equal values occur when prices are required to be equal. This is used for
patterns like Meeting Lines and Separating Lines. Meeting Lines require
that the close price of each day be equal; while Separating Lines require
the open prices to be equal. The same concept used in determining a Doji
day can be used here as well. There are a few instances when setting the
parameters to the literal definition will restrict, rather than enhance, the
pattern concept.
Computerized Analysis and Anomalies
The candle pattern statistics in Table 6-1 shows the amount of data used in
this analysis, the type of data used, and various other pertinent statistics.
Data were obtained from stocks with and without open price, CSI's perpet-
ual futures contracts, and leading market indexes.
A total pattern frequency of slightly less than 11% equates to one
candle pattern about every nine trading days. This represents a good fre-
quency for daily analysis of stocks and futures. Reversal patterns occur
The Philosophy Behind candle Pattern identification
Table 6-1

about 30 times more often than continuation patterns. This too is impor-
tant, as it indicates the reversal of a trend caused by changed positions in
trading. In this analysis, there were 48 reversal patterns and 14 continua-
tion patterns, which makes reversal patterns account for about 77% of all
patterns.
It is also interesting to note that 6 patterns account for almost 9% of all
patterns. Of this, the Harami pattern accounts for 32% of those 6 patterns
and almost 3% of all patterns. Finally, please note that some patterns
occurred quite infrequently. To assess whether or not they have any value,
you should refer to the scoring statistics in Chapter 7. When a pattern
occurs, you must understand that, statistically, the success or failure does
not mean much. Success and/or failure of candle patterns is dealt with
extensively in Chapter 7.
When a particular pattern appears only a few times in a large amount
of data, you should realize that its success and/or failure is subject to the
time period under study. Do not let statistics interfere with common sense,
and certainly be alert for inaccuracies in the data.
The Philosophy Behind Candle Pattern Identification
Remember, candle patterns were used as a visual charting technique
for hundreds of years. With computers there is no way to handle the
subjectivity that classic chart reading offers. Another factor to consider
when using computers is the quality of the graphics screen: its resolution.
The screen consists of small dots of light known as pixel elements. If too
much data is used, or if the range of the data is too great, then what might
appear as equal on the screen would not be so numerically. The smallest
size (width) horizontal line could have a price range within itself, not
visible to the eye. Not only computer screens, but also computer generated
chart books could have this problem. This is why some flexibility must be
built into the identification of, and definition of, the classic patterns.
Another computer anomaly arises in handling candle patterns that are
within, or part of, another candle pattern. A computer will look at the data
in chronological order, that is, old data first. As each day is added, a candle
pattern may or may not be noted. When a pattern is identified, the results
are stored and the process continues. If a bullish Engulfing Day is identi-
fied and the next day has a white body with a close greater than the first
day of the Engulfing Day, a Three Outside Up pattern is noted and re-
corded. The data for statistics and testing has been acquired for both pat-
terns. However, only the Three Outside Up pattern will be identified as a
candle pattern if it is given higher priority.

Using the identification philosophy developed in the previous chapter, one
can now adapt a method of determining just how successful candle pat-
terns are.
Measures of Success
The following three assumptions were used in measuring the success
and/or failure of the many different candle patterns:
1. The pattern must, of course, be identified based upon its open,
high, low, and close relationships..
2. For the pattern to be identified, the trend must be determined. This
is interchangeable with the previous assumption; each must exist in
the methodology.
3. Some basis of measurement must be established to determine the
success or failure of the candle pattern.
To make a creditable prediction, you either know the current trend or
you do not. Both assumptions and possibilities have been used here.

Chapter 7
The Trend is Known
Candle patterns fall into two general categories: those that indicate a
reversal of the current trend and those that indicate trend continuation.
Each day (for each tradeable), a prediction is made about whether the
known trend will continue or reverse for each prediction interval. In other
words, if today's close is above the exponential average (trend), then we
assume that we are in an uptrend. The success or failure is measured by the
change in this trend over the prediction interval. The prediction interval is
the number of days into the future the success or failure was based upon.
Prediction intervals refer to the time periods between the actual candle
pattern and some point in the future.
When a candle pattern occurs, it is offering a short-term forecast on the
direction of the underlying market. The prediction interval is the number
of days after the candle pattern that a determination is made as to whether
or not the candle pattern was successful. A prediction interval is a time in
the future that measures the candle pattern's forecasting ability.
Once a trend starts, the odds are that it will continue. Every student of
science or engineering will recognize that this is nothing more than
Newton's First Law of Motion, which says, Every body continues in a
state of rest or of uniform motion in a straight line unless it is compelled
to change that state by forces applied to it. Simply said, it is easier for a
market to continue its direction than to reverse its direction.
Therefore, the continuation of a trend is more common than the rever-
sal of a trend. Remember, we are talking about the short-term future here.
If, at the prediction interval, the price is still above the trend, then the
candle pattern was successful. Simply said: If, during the prediction inter-
val, we are still in an uptrend, then it was deemed successful (Figure 7-1).
If not, it was a failure. Figure 7-1 graphically shows the relationship of
reversal and continuation patterns with the prediction interval. The rela-
tionship of pattern type with prediction interval is based upon the fact that
the trend is known.
Reliability of Pattern Recognition
Figure 7-1
The Trend is Not Known
Sometimes you do not know what the trend is before making the predic-
tion. In such cases, a coin-toss type of prediction is made about whether
the price will go up or down. If you do not know the trend, the odds of its
continuing or reversing would fall into the area of 50%. The difference
above or below 50% would reflect the directional bias of the data used in
the analysis. Again, the success or failure is based upon the price at the
prediction interval relative to the change in trend. This fact is also shown
in Figure 7-1. Remember, most candle patterns require that the trend be
identified.

Chapter 7
Reverse Current Trend
and Continue Current Trend
From the computer calculations, two primary parameters are determined:
Reverse Current Trend and Continue Current Trend. These are further
broken down into Up and Down trends (i.e., Reverse Current Trend Up
and Reverse Current Trend Down).
The sum of Reverse Current Trend success and Continue Current
Trend success will be equal to the number of days of data used in the
testing process. Since a prediction is made each day, Reverse Current
Trend success and Continue Current Trend failure would be equal. In other
words, the success of Reverse Current Trend, is also the failure of Con-
tinue Current Trend.
Reversal candle patterns (which most are) are compared to Reverse
Current Trend and further broken down into upturns and downturns. Since
reversal candle patterns must go against the very trend that defines them,
their measure of success would not be as rigid as that of a continuation
candle pattern. In fact, their measure of success could actually be less than
that of a coin toss, since they are predicting a change in the current trend,
a trend which is supposedly known.
Likewise, continuation candle patterns are compared to Continue Cur-
rent Trend. Continuation candle patterns say that the trend that helped
define them is going to continue. Therefore, for a continuation candle
pattern to be considered successful, it must do better than the success of
knowing the trend in the first place. Because we know the current trend
and we know that the odds are that the current trend will continue; to be
useful, continuation patterns must be exceptionally good, or are no better
than the trend-identification process.
Candle Pattern Statistical Ranking
Candle patterns are predictable psychological trading pictures (windows)
that produce reasonable forecasting results when used in the proper man-
ner. This section will explain the technique used to determine the various
statistics developed to show the success of candle patterns. Note that no
Reliability of Pattern Recognition
magnitude of success is used, only relative success and failure. Keep in
mind, though, that success still means that the pattern correctly predicted
the market move and failure means that it did not.
Using all of the information about pattern recognition (including trend
determination) developed in the previous chapters, we will now set out to
see just how good candle patterns are. Because a simple approach is usu-
ally best, no elaborate assumptions were used, only the price change over
various time intervals into the future.
Once the relative success or failure of a particular candle pattern was
determined, its relationship to the appropriate pattern standard of measure
was calculated. This standard of measure is the Reverse Current Trend and
Continue Current Trend, discussed earlier. Recall that continuation pat-
terns must outperform reversal patterns because of their trend relationship.
That is why you will see many continuation patterns with a negative rank-
ing, even though their success percentage was high.
Candle Patterns and Stocks
Data for this analysis were the stocks contained in the Standard and Poor's
100 Index and 41 futures contracts. The S&P 100 Index is a capitalization-
weighted index of 100 stocks from a broad range of industries. These 100
stocks present an excellent representation of the U.S. stock market. The
futures contracts used were perpetual contracts from CSI (Commodity
Systems, Inc). These contracts were used so that long-term continuous data
could be analyzed.
The results, presented in Tables 7-1 through 7-3, use prediction inter-
vals of three, five, and seven days. This should adequately cover the time
interval used when doing candle pattern analysis. When prediction inter-
vals from one to ten days are analyzed the results from all ten fall within
the expected range represented with these tables.
Table 7-1 presents the results of the candle pattern ranking system for
a prediction interval of three days, using over 82,000 days of data. Notice
that 55 of the 62 possible patterns occurred in the 100 stocks used in this
test, but that a few were somewhat sparse. About 65% (36 out of 55) of the

Ranumty of Pattern Recogn.tlon

Reliability of Pattern Recognition
candle patterns were deemed successful using the established ranking cri-
teria.
The data offer a good example of the difference in importance between
reversal patterns and continuation patterns. The reversal pattern Identical
Three Crows had a 100% success and a ranking score of 230.03%. The
continuation pattern Falling Three Methods also had a 100% success, but
its ranking score was only 49.48%. The difference in ranking scores occurs
because continuation patterns only suggest that the known trend will con-
tinue, which, of course, is favored by the odds. In contrast, reversal pat-
terns indicate that the trend will reverse, which is less likely to occur.
As Table 7-2 shows, using a prediction interval of five days decreased
the number of successful patterns somewhat. Only 28 out of 55 patterns
were ranked as successful, or just a little over 50%. Notice also that the
Identical Three Crows pattern dropped to the number 5 position. Falling
Three Methods, reflecting its name, dropped to the number 46 position
with a ranking of -33%.
Using a prediction interval of seven days reversed the decline in suc-
cessful patterns with 35 out of the 55, or 63%, ranked successful, as
illustrated in Table 7-3. Notice also that the top two patterns were pre-
viously near the bottom in the previous tables.
Summary of the Three Stock Tables
What can be gleaned from the data in Tables 7-1, 7-2, and 7-3? Remember
that the exact same data were used in each table and that only the predic-
tion intervals were changed. As a result, we can make the following obser-
vations:
If a pattern rises and falls in the rankings when the prediction interval
is changed, its usefulness is suspect for the data being used. For exam-
ple, Downside Gap Three Methods moved from 39 when the predic-
tion interval was at three days, to number 20 with the prediction
interval at five, and then to 37 as the prediction interval increased to
seven. Even though the jump up to 20 was not exceptional, it did show

Chapter?
that this pattern's predictive ability wasn't steady, which is what we
are looking for in these tables.
2. Steady movement in a single direction in the rankings can be telling.
Matching Low is a good example. In Table 7-1 it ranked at 44 with a
negative 35.35% ranking score. As the prediction interval increased
from three to five days, Matching Low moved up the rankings to 31.
And at seven days, Matching Low was up to 24th place and a 8.71%
ranking score. This says that the Matching Low reversal pattern tends
to get better, relatively, with an increase in prediction interval. Said
differently, Matching Low has staying power and tends to be longer
term in its trend-reversal prediction capability.
Meeting Lines+ is another good example of a pattern that moves up
the list as the prediction interval is increased. Meeting Lines* moved
from 50 to 14, and then to the number 2 position. This indicates that
Meeting Lines-i- tends to be better at slightly longer term predictions of
trend change. The only problem is that Meeting Lines+ occurred only
twice, which makes the conclusion somewhat suspect.
Identical Three Crows, while number 1 with the prediction interval at
three, moved to number 5, and then down to number 50 when the
prediction interval increased to seven days. This shows that it tends to
be much better as a short term reversal indicator than as a longer term
one.
3. Patterns that continue to remain in the same relative position are the
most stable predictors of trend changes. Out of the first 15 patterns for
a prediction interval of three days, 6 patterns remained in the top 15
for all three rankings. They were Three Black Crows, Three White
Soldiers, Three Inside Up, Three Outside Down, Dark Cloud Cover,
and Three Outside Up. These 6 reversal patterns consistently showed
good performance over all prediction intervals tested.
At the other end of the spectrum, 6 patterns remained in the bottom 15
ranking for all three prediction intervals. They were Three Line Strike-,
Doji Star+, Doji Star-, Three Stars in the South, Side-by-Side White Lines-,
Reliability of Pattern Recognition
and Breakaway*. Three of these patterns, Three Stars in the South, Side-
by-Side White Lines-, and Breakaway+, occurred only once in all of the
data, so not much significance should be put on them.
It is also interesting to note that when the prediction interval was
increased to nine days, only Three Black Crows, Three Inside Up, and
Dark Cloud Cover remained in the top 15 ranking. Three Line Strike- and
Side-by-Side White Lines- were the only patterns to remain in the bottom
15 ranking. The surprise came when the consistently poor performers,
Three Stars in the South and Breakaway*, were in the number 1 and 3
positions, respectively.
Obviously, one could get overly analytical with the results. One should
always strive to make observations that have at least a chance at being
successful when additional data and/or intervals are used.
The candle pattern ranking for 41 different futures contracts was per-
formed on over 49,000 days of data. Table 7-4 shows the results for a
prediction interval of three days. Out of 62 possible candle patterns, 57
patterns were identified in this data. It is important to note that 7 patterns
occurred only one or two times. Slightly more than half (32 out of 57)
were deemed successful using the ranking system previously discussed.
Here, just as with the stocks, two patterns had a 100% success rate. Kick-
ing-, a reversal pattern, had only a single occurrence and should not be
given much significance. Side-by-Side White. Lines*, a continuation pat-
tern, had a 100% success rate and a ranking score of 40.65%. Remember
that continuation patterns have the trend working in their favor and there-
fore must perform exceptionally well to receive a high ranking score.
With the prediction interval at five days, 30 out of 57 patterns had
positive ranking scores, as shown in Table 7-5. Note, however, that 4
patterns had 100% success. Because the number of occurrences of each of
these patterns was small, their significance should be based upon how they
performed over varying prediction intervals.

2.
3.
Reliability of Pattern Recognition
Setting the prediction interval at seven days gave 38 successful pat-
terns, or over 66%. Again, 4 patterns had successes of 100%, but also
notice that it wasn't the same 4 patterns as in Table 7-5.
Summary of the Three Futures Tables
1. As when analyzing stocks, patterns that jump around in the rankings
should be noted. Shooting Star started out with a rank of 45 when the
prediction interval was three days. When the prediction interval was
moved up to five days, Shooting Star improved to a ranking of 23.
Finally, with the prediction interval at seven days, Shooting Star
dropped to a low of 53. This type of volatility shows that the Shooting
Star should not be relied upon when used with this data.
Steady movement, whether up the list or down, will help identify
patterns that may be used for shorter or longer predictions. The first
pattern to demonstrate this trait is Morning Doji Star. It starts out with
a ranking of 3, then moves down slightly to a ranking of 7, and finally
drops to a ranking of 34. This says that Morning Doji Star is best
when used for short prediction intervals.
In contrast, Side-by-Side White Lines- starts out with a ranking of 44,
moves up to a ranking of 21, and then continues up to a ranking of 7.
These significant moves strongly suggest that Side-by-Side White
Lines- is best at making longer term predictions. As you may remem-
ber from Chapter 4, Side-by-Side White Lines- would normally show
a somewhat bullish pattern in that there are two normally bullish white
lines in a row. This probably accounts for its longer term perspective
on the trend. Even though it appears as a bullish set of days, it is
correctly calling the downtrend to continue.
Patterns that were stable in their rankings are the best overall perform-
ers. Only 7 of the top 15 patterns when the prediction interval was
three days remained that high for all three tests. They were Kicking-,
Three Black Crows, Breakaway*, Three Outside Up, Three Inside Up,
Engulfing Pattern-, and Three Outside Down. Of these 7 patterns,

Reliability of Pattern Recognition

Candlestick filtering offers a method of trading with candlesticks that is
supported by other popular technical tools for analysis. Filtering is a con-
cept that has been used in many other forms of technical analysis and is
now a proven method with candlesticks.
If there is any fault with using a single method for market timing and
analysis, it most certainly will also be a fault with candlesticks. Just like
any price-based technical indicator based upon a singular concept, candle-
sticks will not work all of the time. When indicators are combined or used
in conjunction with one another, the results can only improve. Again,
candlesticks are no different: when used with another indicator, the results
are superb.
The Filtering Concept
The filtering concept was developed to assist the analyst in removing
premature candle patterns, or for that matter, eliminate most of the early
patterns. Because candle patterns are intensely dependent upon the under-
lying trend of the market, lengthy trends in price will usually cause early

Chapter 8
pattern signals, just like most technical indicators. Something else had to
be used to assist in the qualification of the candle pattern signals. Most
technical analysts use more that one indicator to confirm their signals, so
why not do the same with candle patterns? The answer is the use of
technical indicators. While appearing obvious, technical indicators did not
provide the "how" answer to the problem, only the "what."
The following discussion will try to explain the answer to the "how"
question. Most indicators have a buy and sell definition to help in their
interpretation and use. There is a point prior to a buy or sell signal that is
normally a better place for a signal to fire, but it is difficult to define.
Most, if not all, indicators lag the market somewhat. This is because the
components of indicator construction are the underlying data itself. If an
indicator's parameters are set too tight, the result will be too many bad
signals, or whipsaws. Therefore, a pre-signal area was calculated based
upon thresholds and/or indicator values, whether positive or negative.
Once an indicator reaches its defined pre-signal area, it has been
primed to await its firing signal. The amount of time an indicator will be
in the pre-signal area cannot be determined. The only certainty is that once
an indicator reaches its pre-signal area, it will eventually produce a trading
signal (buy or sell). Statistically, it has been found that the longer an
indicator is in its pre-signal area, the better the actual buy or sell signal will
be.
The pre-signal area is the filtering area for each individual indicator; its
fingerprint. Each indicator has a different fingerprint. If the indicator is in
the buying pre-signal area, only bullish candle patterns will be filtered.
Likewise, if an indicator is in the selling pre-signal area, only bearish
candle patterns are filtered.
Candlestick Filtering
Figure 8-1
Pre-Signal Areas
For threshold-based indicators, the pre-signal area is the area between the
indicator and the thresholds, both above and below (Figure 8-1).
For oscillators, the pre-signal area is defined as the area after the indi-
cator crosses the zero line until it crosses the moving average or smoothing
used to define the trading signals (Figure 8-2).

indicators
The indicators used to filter candle patterns should be easily available and
simple to define. They must perform in a manner that enables one to
determine areas of buying and areas of selling. These are often referred to
as overbought and oversold areas. Indicators such as Welles Wilder's RSI
(Relative Strength Index) and George Lane's %K and %D (stochastics) are
exceptionally good for candlestick filtering because they both remain be-
tween 0 and 100. At the end of this chapter, many other indicators will be
shown to demonstrate the filtering concept. Because RSI and stochastics
are so widely known and used, more detail will be provided on their
construction and use in filtering.
Wilder's
RSI
J. Welles Wilder developed the Relative Strength Index (RSI) in the late
1970s. It has been a popular indicator, with many different interpretations.
It is a simple measurement that expresses the relative strength of the cur-
rent price movement as increasing from 0 to 100. Basically, it averages the
up days and the down days. Up and down days are determined by the
day's close relative to the previous day's close.
Wilder favored the use of the 14-period measurement because it repre-
sents one-half of a natural cycle in the market. He also set the significant
levels of the indicator at 30 and 70. The lower level indicates an imminent
upturn and the upper level, a downturn.
A plot of RSI can be interpreted using many of the classic bar chart
formations, such as head and shoulders. Divergence with price within the
Figure 8-3

Chapter 8
period used to calculate the RSI works well, if the divergence takes place
near the upper or lower regions of the indicator.
Many stock-charting services show RSI calculations based on 14 peri-
ods. Some commodity chart services prefer to use 9 periods. If you can
determine the dominant cycle of the data, that value would be a good
period to use for RSI. The levels (thresholds) for determining market turn-
ing points can also be moved. Using levels of 35 and 65 seem to work
better for stocks, whereas the original levels of 30 and 70 are better for
futures.
In the chart of Philip Morris (MO), presented in Figure 8-3, the diver-
gence of the 14-day RSI with the general price trends is quite obvious.
Whenever the RSI gets into or near the thresholds, a change in the trend of
prices is soon to follow.
Lane's Stochastic Oscillator: %D
George Lane developed stochastics many years ago. A stochastic, in this
sense, is an oscillator that measures the relative position of the closing
price within the daily range. In simple terms, where is the close relative to
the range of prices over the last x periods? Just like RSI, 14 periods seems
to be a popular choice.
Stochastics is based on the commonly accepted observation that clos-
ing prices tend to cluster near the day's high prices as an upwards move
gains strength and near the day's lows during a decline. For instance, when
a market is about to turn from up to down, highs are often higher, but the
closing price settles near the low. This makes the stochastic oscillator
different from most oscillators, which are normalized representations of
the relative strength, the difference between the close and a selected trend.
The calculation of %D is simply the three period simple moving aver-
age of %K. It is customarily displayed directly over %K, making both of
them almost impossible to see. Interpreting stochastics requires familiarity
with the way it reacts in particular markets. The usual initial trading signal
occurs when %D crosses the extreme bands (75 to 85 on the upside and 15
to 25 on the downside). The actual trading signal is not made until %K
Candlestick Filtering
"813B C23BJ
crosses %D. Even though the extreme zones help assure an adverse reac-
tion of minimum size, the crossing of the two lines acts in a way similar to
dual moving averages.
In Figure 8-4, the same chart of Philip Morris (MO) used in the RSI
example, we can see how good Lane's %D is at oscillating with the prices
to areas of overbought and oversold.
Filtering Parameters
Many powerful trading and back-testing software packages are available
today. Some optimize indicators by curve-fitting the data, while others
utilize money-management techniques. A few have advanced methods that
concentrate on all possibilities. It is not going to be the purpose here to

Chapters
amplify the faults or hail the innovations of this type of analysis. The
method used will be simple and straightforward in concept.
Three trading systems will be utilized in these tests: candle patterns,
indicators, and filtered candlesticks. Each will use the same methodology
of buying, selling, selling short, and then covering so that a system is in
the market at all times. While this is not always a good way to trade, it is
used here to show how filtered candlesticks will usually outperform the
other two systems. Also, the trading results are shown as if there were a
closing trade on the last day of the data to give you a feel for the complete
trading history.
Additionally, a signal is generated whenever the appropriate reference
indicator reaches the prescribed parameters. That is, the indicator must
have gone above (or below) the threshold and then cross it again in the
opposite direction. For example, when %D goes above 80, it has entered
the pre-signal area and the sell filter is turned on for the candle patterns.
Any candle pattern that gives a sell signal when %D is above 80 will be
registered as a filtered signal. Similarly, whenever %D goes below 20, it
has entered the pre-signal area and the buy filter is turned on. Any bullish
candle patterns that appear will be considered filtered patterns. The thresholds
of 20 and 80 were used here only for purposes of explanation.
Each of the indicators requires a setting for the number of days (peri-
ods) to be used in their calculation. As mentioned earlier, this value should
reflect the basic cycle of the market being analyzed. Two additional values
need to be set: the upper and lower thresholds just mentioned. These are
the settings that determine the values that the indicator must reach or
exceed before it will filter a candle pattern.
Initially, commonly accepted values will be used: a 14-day %D, first
with thresholds of 20 and 80 and then with thresholds of 65 and 35 on
different data. The data used will be the stocks of the S&P 100 Index and
the 30 stocks of the Dow Industrial Average. The S&P 100 database
started at the beginning of 1989 and ended on March 31, 1992. The Dow
Industrials database began on April 24, 1990, and ended on March 31,
1992.
Candlestick Filtering
Filtering Examples
From Table 8-1 you can see that trading each stock using candle patterns
for the advice resulted in 67 stocks with positive percentage gains and 33
losers. These numbers came simply from counting the positive and nega-
tive results in the first column. Trading strictly on the candle pattern sig-
nals resulted in an average of 37.1 trades, with an average gain per trade of
0.40%.
Trading the same 100 stocks using only %D for the trading signals
resulted in only 53 stocks that were winners and 47 losers. The number of
average trades was reduced to 30.1, with an average gain of 0.02% per
trade.
Using the filtering concept for'the trading signals resulted in 62 win-
ners and 38 losers. This was not as good as using the candle patterns by
themselves, but was much better than using signals generated strictly from
the stochastic indicator %D. The average number of trades was 13.7,
which is better than candle patterns or %D by over 50%. The average gain
per trade was 0.60% which, again, is significantly better than the average
gain from the other two trading methods.
What does all of this really tell you? First, by filtering the candle
patterns with an indicator, such as %D, the number of trades is signifi-
cantly reduced. Compared to candle patterns alone, the reduction was over
63%, and compared to trades using the indicator %D alone, the reduction
was over 54%. Second, filtering increased the average gain per trade. The
increase over candle patterns alone was 50% and the increase over the %D
was over 30 times as great.
You should not ignore or forget what is known about using statistics to
make a point; they can be manipulated to show whatever results the author
is trying to make. We all know that an average gain of 0.6% would quickly
disappear when we included commissions, slippage, and the like. The
simplicity of these calculations, though, shows one very important point:
It is the relationship of the numbers with each other that is important, not
the actual numbers. This relationship, taken as an average of the values
derived from 100 different stocks, is the proof needed to support the filter-
ing concept.


Chapters
In Figures 8-6 through 8-18, thirteen different indicators are displayed
above the candlestick chart of AA. The chart displays only the latest 140
trading days, but the trading analysis still covers the data beginning Janu-
ary 1, 1989, and ending March 31, 1992 (3-1/4 years). The up and down
arrows at the top of the chart (above the indicator) show the signals given
by the indicator itself. The up and down arrows below the indicator are the
automatic candle pattern identification arrows showing each candle pattern
and whether it is bullish (up arrow) or bearish (down arrow). If the candle
pattern arrow is shown with a double head, it represents a filtered candle
pattern. The box in the lower right corner of the chart displays the trading
information for the three trading methods. The information in the box
shows the effective dates, the total percentage gain or loss, the number of
trading signals, and the average percentage gain or loss per trade. You will
note that the trading results of the candle patterns by themselves will be the
same for all examples. The data did not change, therefore the candle pat-
terns are the same. Only the indicator and, therefore, the filtered candle
patterns will change with each example. For all indicator examples, the
total gain using candle patterns alone for trading Alcoa (AA) was 45.8%
over the period from January 3, 1989, to March 31, 1992. There were 40
trades, which made the average gain per trade equal to 1.14%.
The price of Alcoa on the first day, January 3, 1989, was 55.875 and
on the last day, March 31, 1992, was 70.5. So that you will have a basis
for judgment, a buy and hold strategy would have yielded slightly more
than 26%. Again, neither calculations for commissions nor execution slip-
page have been figured, nor have the figures been annualized. Because the
trading strategy has been kept so simple, one must consider only the rela-
tive values when viewing these concepts.
One more thing might not be obvious: all trading is figured up to the
value of the closing price on the last day of the data. This does not neces-
sarily mean that a trading signal occurred on that day, only that the per-
centage gain or loss was calculated as if a valid signal had been given.
Candlestick Filtering
Chart 8-7 shows the faster %K indicator fnr 14 A
values
of 20 and 80.
TT,e
difference
beteen
%K
andtn
reacts s.ighUy s,Ower than %K. Remember %D ,s 1° a Th"
mov,ng average of %K. In this example, the filtered caldfc
-Tee
,1D1eS
better
than
»K
when
,00^
t the . ,<
«™-er

Candlestick Filtering
Since %K reacts quicker than %D, one could lower the upper threshold
and raise the lower threshold to give a larger filtering area. This would
normally generate more trades. For example, by changing the thresholds to
25 and 75, the filtered candles gained 71.6%, with 21 trades for an average
gain per trade of 3.41%. Using a larger filtering area was not quite as good
as the original example, however, because although it did, in fact, increase
the number of trades it did not increase the overall gain. The results of the
indicator %K were only slightly improved to 51.9%. Opening up the
thresholds to 30 and 70 increased the filtered candle trades to 27 with a
gain of only 31.5%. The indicator actually decreased in performance to
45.6%. This shows that the tighter thresholds of 20 and 80 tend to produce
Figure 8-8
better results for filtering without changing the indicator results apprecia-
bly.
Figure 8-8 shows Wilder's RSI for 14 days, with threshold values of
35 and 65. The average gain for the filtered candles was over twice as
good as the average gain from RSI. When you consider that there were
also fewer trades, the average gain per trade for the filtered candles was
exceptionally better than RSI.
Figure 8-9 shows the money flow index. Money flow is calculated
similarly to RSI, but the days when the price closes higher are averaged
separately from the days when the price closes lower. In this case a period
of 21 days was used for the smoothing of both the up closes and the down

Chapters
closes. Prior to smoothing, the change in price each day is multiplied by
the volume for that day. This way an up day with large volume would
cause a larger move in the indicator than would a similar up day with little
volume. Once the two averages are calculated, they are further operated
upon to produce an indicator that moves between 0 and 100.
As you can see from the trading box in Figure 8-9, the filtering concept
once again performs much better than the indicator itself, even though the
indicator did quite well.
candlestick Filtering
Figure 8-10 shows an indicator knows as the rate of change. Rate of
change is a fairly simple concept that is widely used by many analysts.
Here a ten-day rate of change is used by taking the percentage difference
between the closing price today and the closing price ten days ago. For
example, if the value of the rate of change indicator were 7.5, one could
deduce that the price on that day was 7.5% greater than the price ten days
ago.
The trading signals for this indicator cannot be given by thresholds
because the up and down values are theoretically unlimited. Therefore, the
trading signals are generated by the crossing of the indicator with its own
ten period smoothing. Ten periods for the smoothing value is used for
most indicators that work this way. Better values may exist for certain
stocks or commodities, but ten seems to be consistently good.

Chapters
The rate of change indicator did better than the candle patterns and
much better than the filtered patterns when looking at total gain. Because
the filtered candles almost always result in fewer trades, the average gain
was better with the indicator, but not significantly so. The filtering area
occurs after the indicator crosses the zero line and before the indicator
crosses its own smoothing.
Figure 8-11 shows Arms' Ease of Movement Indicator for 13 periods.
The signal is generated when it crosses its own ten period smoothing. Ease
of Movement is a numerical method used to quantify the shape of a box
used in Equivolume charting. Arms takes a ratio of the box width to the
box height, called the box ratio, which is a ratio of the volume to the price
range. Heavy volume days with the same price range result in a higher box
ratio and, therefore, difficult movement.
Figure 8-11
Candlestick Filtering
Based upon total gain, this indicator did not do better than candles
alone or filtered candles. Likewise, when the number of trades is consid-
ered, filtered candles did much better.
Figure 8-12 shows the double momentum oscillator for 18 periods.
Like most oscillators, a signal is generated when it crosses its own 10-day
smoothing. The double momentum oscillator is a combination of two rate
of change calculations which are 20% above and below the value set for
the indicator. In this example, the indicator value is set at 18, so the two
rate of change calculations are 14 and 22.
In this example, the filtered candles greatly outperformed the indicator.

Chapter 8
Figure 8-13
920331 £821J
S4.379 „_______ ,.
Too
Patterns: H«i*anit
Figure 8-13 shows the linear trend indicator for 15 periods. The linear
trend indicator is based upon the slope of a least squares fit over the
chosen period, in this case 15 days. Because the LTI is such a smooth line,
a shorter 5-day crossover smoothing was used.
From the trading box in Figure 8-13, the indicator generated good
results, but the filtering concept failed to do better than the indicator or the
candles. Filtered candlesticks obviously does not work every time.
Candlestick Filtering
Figure 8-14
Figure 8-14 shows Wilder's Directional Index for 14 periods. Again,
signals are generated when it crosses its own 10-day smoothing. Wilder
developed the directional index along with the RSI in 1978 (see bibliogra-
phy). Using signals from a simple crossover smoothing is not the method
Wilder suggested for its use. However, that was the only method that
would generate a filtering area.
The filtering concept did quite well here also. Notice that even though
the indicator did not do very well, the filtered candles did almost three
times better.

Chapter 8
Figure 8-15
Figure 8-15 shows the price detrend oscillator for 21 periods. This
indicator is the difference between the closing price and a smoothing of the
closing price, in this case 21 days. Signals are generated when PDO
crosses its own 10-period smoothing.
Here is an example where the indicator was exceptional and the filtered
candles were a failure. The suspected problem is in defining the filtering
area used on the indicator.
Figure 8-16 shows Appel's Moving Average Convergence Divergence
Indicator, known as MACD. MACD is an extension of the price detrend
Candlestick Filtering
Figure 8-16
oscillator, in that another smoothed value is used instead of the closing
price. MACD uses the difference between a 12-day smoothing and a 25-
day smoothing. Signals are generated when this difference crosses its own
9-day smoothing. Nine days were used here because that is the popular
setting used by most analysts. Incidentally, in keeping with the previous
use of 10 days for the smoothing value, it actually improved the indicator
trading results by over 7%.
MACD did not perform well in this example. However, filtered can-
dles yielded an average of 4.29% per trade.

Chapter 8
Figure 8-17 shows Lambert's Commodity Channel Index for 14 peri-
ods. Signals are given whenever CCI crosses the thresholds of 100 and
-100. The Commodity Channel Index was designed for use with commod-
ities that exhibit cyclical and/or seasonal characteristics. It consists of the
mean deviation over the number of periods selected, in this case, 14.
Filtered candles, again, did exceptionally well when compared to the
indicator or candle patterns.
Candlestick Filtering
Figure 8-18 shows Bollinger's Oscillator, %B, for 20 periods. %B is
another method of displaying the Bollinger Bands developed by John
Bollinger. Bollinger Bands used two standard deviations over a period of
20 days to encase about 95% of the price action. It is an excellent way to
show the volatility of the market. %B looks merely at the closing price
relative to the upper and lower Bollinger Bands, much in the same way as
stochastics are calculated. %B is a measure of where the closing price is
relative to the Bollinger Bands. Signals are generated whenever %B ex-
ceeds 100% and 0%
From the trading box in Figure 8-18, you can see that %B by itself
gives excellent trading results, but when used as a filter for candle patterns,
the results for average gain are even better.

Chapter 8
Conclusion
It should be obvious that filtering candle patterns with popular indicators
is an almost certain method of improving your trading results. Not only
does it provide better overall gains from a simple trading system, it will
almost always reduce the number of trades. Reducing the amount of trad-
ing will also reduce transaction costs and produce a much higher average
gain per trade. Filtering works!
Candlestick charting has produced a number of derivative charting and
analysis methods. The appeal of candlestick charts, as a method of plotting
market data, is that they visually help to interpret the market. Your brain
can quickly assimilate the information because it is displayed so consis-
tently well. A new charting method, called CandlePower charting, adds a
new dimension to candlestick charts: volume. CandlePower is a trademark
of N-Squared Computing, the originator of the concept.
CandlePower Charting
CandlePower Charting is another visually appealing charting technique
that combines the power of Japanese candlesticks and volume.
Typical charting (whether bar or candlestick) shows the price action on
the vertical scale and time on the horizontal scale (see Chapter 1). Volume
is usually depicted as a histogram plot under the prices. Two significant
pieces of information are generated each time a transaction occurs between
a buyer and a seller. One of these, price change, we tend to react to
emotionally, and the other, volume, we largely ignore. Volume is certainly
a more valuable tool to market analysis than is usually acknowledged.
Richard Arms claims that price tells us what is happening and volume tells

Chapters
us how it is happening. Joseph Granville filled an entire career analyzing
and writing about volume. . /
f/l^t-tt .'«p.;'>'«>*<
Volume, during most phases of the market, will precede prices. This is
a hotly contested remark, but watching both price and volume can only
enhance your timing and decision making. Simply said, when price and
volume are increasing, it is considered bullish. Likewise, when prices and
volume are decreasing, it is considered bearish.
Figure 9-1
As shown in Figure 9-1, the body of a CandlePower day, just like a
candlestick, is made up of the difference between the open and close. The
color of the body and the shadows also follow the same conventions used
in Japanese candlestick charting. The difference is that the width of the
body is a reflection of the volume for that day. A day with large volume
will be a wider candlestick body than a day with less volume. On a chart,
it is easy to pick out the largest volume day by finding the widest body.
Likewise, the day with the smallest volume will be the thinnest body.
Many candle patterns can have added importance when volume is
introduced. For instance, a bullish Engulfing Day will be even more bullish if
the second day also is accompanied by larger volume. A Morning Star
pattern can be judged more successful if there is excessive volume on the
last day.
Examples
Figure 9-2
In Figure 9-2, the CandlePower chart of Avon Products (AVP), notice how
the upmove contains large white candle lines. These wide lines show that
the upmove is fully supported by volume. Once the large white days dry
up, the move has probably run its course.
The large black day in the chart of Bell South (BEL) shows a classic
volume blow-off day (Figure 9-3). After a good upmove, the volume starts
to dry up. Then, in one day, prices explode to the upside, but close near
their lows on very large volume. A few days into the decline, a three-day
rally is terminated with a gap down. Then the decline continues.

Chapter 9
Figure 9-3
In Figure 9-4, the chart of Citicorp (CCI), notice how each turning
point in the market is accompanied by large volume. The market bottomed
with a large black day, then rallied. The rally stopped with a large white
day, then went sideways until the next large white day. From there it
gapped up twice, followed by two days of indecision (Spinning Tops),
each with large volume. Here again, Spinning Tops with large volume
support the indecision of the marketplace. Large amounts of stock changed
hands, but no side took the leadership.
Derivative Charting Methods
Figure 9-4
The bottom reversal toward the end of December on the chart of Litton
(LIT) shows continually larger-volume days (Figure 9-5). In fact, if it were
not for the small white Spinning Top day, a Morning Star bullish reversal
pattern would have represented the bottom. Here is another example where
volume increasing throughout a pattern will add to its significance.
Figure 9-6, the last example of CandlePower charting, shows more
data (volume maximum has been reduced), so the richness of the charting
method can be fully appreciated.

Chapter 9
Figure 9-5
Derivative Charting Methods
Figure 9-6

Chapter 9
Areas of volume congestion can be easily spotted using condensed
CandlePower Charting. Trendlines used on this type of chart would also
reflect the volume component.
Example
Figure 9-7
The data used for the Condensed CandlePower chart in Figure 9-7 is the
same as in the last example of CandlePower Charting. This was done
intentionally, so you could easily see the difference in charting methods.
Successful analysis of the stock and futures markets is not an easy task.
Most participants prepare themselves no better than they would for a game
of cards. One must first learn how these markets work, then learn about the
many different kinds of analysis that are available, such as, fundamental
and technical analysis. On a smaller scale, the field of technical analysis
offers a host of varying techniques; Japanese candlestick analysis is one of
these.
Throughout this book, it was emphasized that candlestick analysis
should be used with other analysis methods. At the risk of sounding con-
tradictory, I would like to warn that too many methods can only confuse
and hinder. It reminds me of the saying that the person with a watch
always knows what time it is, but the person with two watches is never
sure.
It has been shown that candle pattern analysis can enhance the use and
timing of popular technical indicators. Filtered candlesticks consistently
outperform a host of technical indicators and usually candle patterns by
themselves. The combination of technical indicators and techniques is not
new; in fact, it is the method of analysis most successful traders use.
Adding candle patterns to that arsenal will surely further improve trading
results.

Chapterio
I'm sure that with the passing of time, new and different analysis
techniques will surface. Some will gain in popularity, some will go by the
wayside. Any analysis technique that has a substantial basis for its method
will usually survive. I am convinced that candlestick charting and candle
pattern analysis will be a survivor.
CandlePower Software
All of the charts, the candle pattern ranking, and filter testing was accom-
plished with a software program called CandlePower by N-Squared Sys-
tems. CandlePower software will automatically identify all 62 of the
patterns mentioned in this book. Complete filtering capability on the fol-
lowing listed indicators is quickly and easily accomplished:
• Arms' Ease of Movement
• price Detrend Oscillator
• Wilder's RSl
• Lambert's Commodity Channel index
• Bolllnger's Oscillator
• Wilder's Directional indicator
• Lane's Stochastics
• Double Momentum Oscillator
• Price Rate of Change
• Appel's MACD
• Linear Trend indicator
• Money Flow index
• Plus, Expert Signal Predictor
N-Squared Systems
6821 Lemongrass Loop SE
Salem, OR 97306

An interview with Japanese trader,
Mr. Takehiro Hikita
Mr. Takehiro Hikita has graciously provided me with a large amount of
insight into the candle pattern philosophy. I have never met anyone so
devoted to the detailed study of a concept as he. He started using candle-
stick analysis many years ago, in fact, all of his charting was done by hand
until personal computers became available.
During a trip to Japan in January, 1992, I studied the candle philoso-
phy and interpretation with Mr. Hikita. I also maintained a log of our
conversations, from which I have selected appropriate questions for this
interview.
Occasional editing was done to assist in clarifying his answers, defi-
nitely not to change the meaning. It became quite obvious to me, that using
English as a second language resulted in a completely honest and direct
response; with no effort to be clever or entertaining. I found this to be
quite refreshing and decided that you might also.
1. How and when did you first become interested in investing and
trading?
7 believe it was when I was around 31 years of age, that is over 25
years ago. It was, however, once terminated and I stayed out of the
market for about 2 years after losing money, more than enough at that
time.

Appendix
2. When did you realize that a form of technical analysis was better
than fundamental analysis?
It was when I started trading again and I was around 41 years of age,
after leaving the company for some reason. Beginning with the candle-
stick pattern analysis, I studied and researched all different kinds of
Japanese analysis techniques with real trading, and was extended later
on to the method available in the States. My starting to trade again
was with the policy to do so based on the technical analysis and no
more guesses and fundamental analysis to make a living. I am fortu-
nately still in the business of trading.
Speaking of this story a little further I started subscribing Commodities
(now called Futures) and purchased many publications such as Com-
modity Trading Systems and Methods written by Kaufman and
Wilder''s publications. My first use of a calculator was the programma-
ble Texas Instruments product on Wilder's method. Then the Casio's
programmable calculator for me to build in my own method, as I
became serious. Then to make the daily analysis much easier, I pur-
chased the IBM-5100 with 32K memory; it was in 1977.
In 1979, I learned the Apple II came out on the market which has a
graphic capability. I then immediately purchased it by importing direct
from the States. In 1980, I joined CompuTrac and attended their first
TAG Conference in New Orleans. My Stock & Commodities magazine
subscription started since then.
3. Did you always use candle charting for your analysis? If not, when
did you start using candle charts?
It was from the very beginning, as far as taking a look at the market in
general, to know how the market is acting. Since the candlestick chart-
ing method is the only one available in Japan to record the history of
the price activity in graphic form. It is just like the bar chart in the
States. Regardless whether I liked it or not, it was what was used then.
But, the candlestick pattern analysis is another subject, rather than the
charting itself. My interest on how to read the pattern better was
6.
An Interview with Japanese trader, Mr. Takehfro Hikfta
probably few years later. I first started trading after reading the first
issue ofShimuzu's book in 1965, the original of The Japanese Chart of
Charts translated by Nicholson.
4. Are candles used in Japan today as widely as bar charts are used
in the USA?
As already mentioned in the above, there is no other method than
candlestick charting to show a market record and activity in Japan.
Yes, it is being used just like the bar chart in the States. The pattern
recognition is another subject within the chart analysis.
5. Is the word candlestick a Western term? If so, what is candle
charting and analysis called in Japan?
There is generally nothing but the candlestick charting to show the
trend and market activity, and any others are classified as the analysis
since they are rather clear to know the pinpoint to take an action, like
the Point & Figure chart. Speaking of the chart, we generally call it Hi
Ashi I Daily Chart, ShuAshi/ Weekly Chart, and Tsuki Ashi / Monthly
Chart. The Japanese word for candle is roshoku.
For your information, Ashi means Leg or better say Foot, and the foot
has an inside meaning of the past record, that is probably from the foot
stamp that shows the past movement and activities, not only as a
market term but in general. I then feel the Candlefoots is better to be
called in English. It is, however, alright as long as understandable and
sounds smooth to you people's ears.
Do you trade stocks, futures, or both?
Yes, I trade both. I trade actively the futures but not the stocks. My
trading stock is a long term basis, never sale, that is in order to hedge
from inflation, while trading the future is to make money in the short
term.
There is other reason, it is easier to find a pivot in the futures, espe-
cially to find out a pinpoint to short and I like to sell, rather than long,
283

Appendix
which has a false start often, compared to going short. Not only that,
it will be only one third of time needed for movement to gain the same
price difference in case of short, against in case of long.
7. Have you found that candles work better with stocks, futures, or
does it matter?
Again, the candles chart and candles pattern analysis should be sepa-
rated. The candlestick is only the chart itself, but the candlestick pat-
terns are the analysis based generally on the Sakata's Five Law, or
somehow originating from it. There are two applications in the law,
one for daily and the other is for weekly chart which has a different
definition. The daily candlesticks pattern works better on the futures. It
is again because of speed, the futures has a short trend cycle while the
stocks is longer.
8. Which candle patterns seem to work best for you? Can you list
your ten favorite patterns?
Your question is too straightforward even though it might be scientific
approach to research, so it is awfully difficult to answer it. You have to
understand that the candle patterns analysis is originating from man's
experience in trading, and that is a mix of market tendency with the
human psychology expressed in the pattern. There is no scientific logic
at all
Approaching from a statistic viewpoint and supposing there were
100% perfect patterns, if it comes once a year, or about one every
three years, nobody can keep watching to see it and catch it. It must be
based on such a daily analysis, repeating tedious business. There is,
also, no guarantee that a pattern showed 100% successful in the past,
will work well repeatedly in future. In statistical speaking, the number
of the sample is the important factor and so it can not be compared
with other in a different number of sampling.
I would like to see a research report that will be able to do by your
software,
or
will
be
done
by
somebody
else.
Again,
it
will
be all
differ-
An Interview with Japanese trader. Mr. Takehlro Hlklta
ent results by each software even though using exactly the same data
because of the definition used by every software program. They will
each be a little bit different in defining the patterns, along with defini-
tion of filtering to define it. So any such research report should be with
a note within this program and within that program, not as a candle
pattern itself. It is the matter of the pattern quality inside software
other than the system quality.
In conclusion, I should say it always depends on how used, in conjunc-
tion with others and market condition such as how many counts in new
high or new low included, but not by candlestick pattern itself. Again,
the candle pattern is one of the analysis tools.
9. Which candle patterns do you think are not very good? How about
a list?
Again, my answer will be the same as the above explained. It depends
upon the market condition and the price level and so on.
10. Do you trade or make timing decisions based solely on candle
patterns or do you use them in conjunction with other technical
indicators?
Of course I use the candles pattern in conjunction with other technical
indicators. As you know there is no perfect technical analysis method
by itself, and again the candlestick pattern is also one of them covering
some part of the 360 degrees that must be defended. The daily candle-
stick pattern analysis is, however, good with futures as one of the
timing tools. Again, there is nothing that covers all the degrees needed
for technical analysis.
It is my intention to make an accent in trading by number of contracts
in opening a position, depending upon the market condition, that re-
quires the guts, too, which is another of the factors required. One
contract each time without the accent will never let you make money.
This is one reason why I am not interested in any of the valuable
factors of optimized automated trading systems. They seem to be only

Appendix
An interview with Japanese trader, Mr. Takehiro Hlklta
playing the game for fun, so I don't like it. Everybody who wants to
make money should be aware of no easy money anywhere in the world,
unless you are lucky or originated from a son of a king.
Author's Note: Mr. Hikita is referring to trading multiple contracts
when the candle signals are supported. Also, he stressed the impor-
tance of using the candle pattern signals to assist in opening and clos-
ing of positions, not necessarily for reversing positions only.
11. Which indicators have you found that work well with candle pat-
terns?
/ have to emphasize, this time, that it depends upon the market condi-
tion and the price level which indicator is good to use with the candle
patterns. I feel, however, that stochastic %D works fairly good in
general, if you can correctly count the cycles and confluence/conver-
gence on different cycle generated by %D. And, pinpointing tops and
bottoms using a combination of the stochastic oscillator seems good.
12. Candlestick analysis is growing rapidly in the United States. Do
you think that it is just a fad or do you think candle analysis is
here to stay?
/ suppose it is a not fad and will stay long in the States. Because this
way of expression of the market has much advantage in comparing it
to the bar chart, so that it is easier to understand the daily price
change. There is also another good point, for instance it has a open
price mark, that we understand important factor to read the market.
Also, it is easy to know by one quick look at candle which way the
market moved during the day. Since each pattern has a deep meaning
similar to Gann analysis, it will last a long time within traders who are
interested in the philosophy behind the patterns.
13. What advice would you offer to Western traders about candlestick
analysis?
To understand the candle patterns you should understand the philoso-
phy inside and behind each pattern. Since it is not a perfect technique,
as is the same case with others, it is also important not to depend
solely on the patterns itself, but use it in conjunction with others based
on a logically established method. The candle pattern analysis is one
of the analysis methods that was built up by human impression and
expressed by image from the combination of the pattern based on
history. Beyond a maximum possible technical analysis there is an-
other world of discipline of the mental power, that is to establish your
philosophy.
The candle patterns must be believed in if you get signal, you must
execute or follow the market very closely. Stay in touch with each
candle signal. If you become disconnected, the psychology behind the
candle pattern will not work well.
Once you establish your trading policy, whatever you can believe
based on the above explanations, you will not make a big mistake. You
will be aware of mistakes in advance within an acceptable level of
damage, as long as employing a proper trend analysis. If you had this
policy you will be then not disappointed by any accident, and will be
able to understand this way the market is wrong, instead of you and
your policy, in the case of the market being against you.
Final Note
As you can see from this interview, Mr. Hikita thinks that the separation of
candlestick charting and candle pattern analysis is important. Also, one
cannot forget the underlying psychology behind each candle pattern. These
are insights into the minds of the traders and speculators that move the
market every day.
Mr. Hikita always referenced his trading analysis to dancing with the
trend. This concept is not new to technical analysts, however, many traders
must graduate from the school of bitter experience before they realize its
importance.

Analysis of Stock Price in Japan. Tokyo: Nippon Technical Analysts As-
sociation, 1988.
Hikita, Takehiro. Shin Shuu-Ashi Tohshi Hoh~Tohkei to Kakuritsu de
Toraeru (New weekly chart method — based on statistics and probabil-
ity). IOM Research Publications, 1977.
Hikita, Takehiro. Daizu no Sekai—Yunyu Daizu no Semekata Mohhekata
(The world of Soybeans —attacking methods on imported soybeans
and how to profit from it). IOM Research Publications, 1978.
Kaburagi, Shigeru. Sakimono Keisen — Sohba Okuno Hosomichi (Futures
charts — explained in a detailed way to be an expert in trading). Tohshi
Nipoh Sha, 1991.
Kisamori, Kichitaro. Kabushiki Keisen no Mikata Tsukaikata — Tohshika
no Tameno Senryakuzu (How to read and apply charts on stocks —
Strategies for the investor). Toyo Keizai Shinpoh Sha, 1978.
Lane, George C. Using Stochastics, Cycles, and RSL Des Plaines, IL,
1986.

Bibliography
Murphy, John J. Technical Analysis of the Futures Markets. New York:
New York Institute of Finance, 1986.
N-Squared Computing. CandlePower 3 Software Manual. Silverton, OR,
1992.
Nison, Steve. Japanese Candlestick Charting Techniques. New York:
New York Institute of Finance, 1991.
Obunsha's Essential Japanese-English Dictionary. Japan, 1990.
Ohyama, Kenji. Inn-Yoh Rohsoku-Ashi no Mikata—Jissenfu ni Yoru (How
to read a black and white / negative and positive candlefoot —In view
of the actual record). Japan Chart Co., Ltd., 1986.
Sakata Goho wa Fuurin Kazan—Sohba Keisen no Gokui (The Sakata
Rules are wind, forest, fire, and mountain): 2nd updated 3rd ed. Nihon
Shohken Shimbun Sha, 1991.
Author's note: The above reference was an excellent source for
many of the candle patterns. The name Fuurin Kazan may be trans-
lated as Fu — the speed like wind, Rin — that quietness like forest,
Ka — that battle like fire, and Zan — that immobile position like
mountain. This idiom originated from the Chinese battle strategy
that Honma was said to have read.
Shimizu, Seiki. The Japanese Chart of Charts. Tokyo: Toyko Futures
Trading Publishing Co., 1986.
Wilder, J. Welles, Jr. New Concepts in Technical Trading Systems.
Greensboro, NC: Trend Research, 1978.
Yasui, Taichi. Kabushiki Keisen no Shinzui—Nichi Bei Keisen Bunseki no
Subete (A picture of the stock chart). Tokyo: Toyo Keizai Shinpoh
Sha,
1981.
Bibliography
Yatsu,
Toshikazu.
Tensai
Shohbashi
"Honma
Shohkyu
Hiden»-Kah
msshohJyutsu
(A
genius
trader
Sohkyu
Honma
into
his
sec'et-TcS
confident of victory on stock investments). Diamond Sha, W0.
Yoshimi, Toshihihko. Toshihiko Yoshimi no Chato Kyoshitsu (A class
room on charting). Japan Chart Co., Ltd., 1991. l

index