Comparison Analysis of Construction Costs according to LEED and non-LEED Certified Educational Buildings PDF Free Download
1 / 12/12
100%

International Journal of Advanced Research and Interdisciplinary Scientific Endeavours, Vol. 1(5), 2024
DOI: 10.61359/11.2206-2423
Article Timeline: Received: Oct 01, 2024; Revised: Oct 29, 2024; Published: Oct 30, 2024
263 263
Comparison Analysis of Construction Costs according to LEED and
non-LEED Certified Educational Buildings
Ruchit Parekh
*
Email Correspondence*: ruchit.parekh@pride.hofstra.edu
1 Researcher, Department of Engineering and Management, Hofstra University, Uniondale, New York, US
Abstract:
The efforts for sustainable development in building construction are widely applied by global organizations,
governments, etc. However, according to the researchers, if the green rating systems on the building, it is
reported that construction costs and durations are increased compared to conventional buildings. In this
respect, the objective of this study is to identify the construction costs between LEED and non-LEED
buildings. The scope of this study is limited in 21 university buildings of Canada. The methodology is as
follows: First, the data of LEED and non-LEED buildings are collected in every university building. Second,
the average construction costs per square meter are collected and a normality check is conducted. Third,
to identify statistical significance, the difference of average construction costs is analyzed by using a T-test.
As a result, it is concluded that the construction costs of LEED buildings are increased by approximately
3.8% more than non-LEED buildings. In the future, the results of this study can be applied to analyzing
the additional costs according to the LEED grade in educational buildings.
Keywords: Sustainable Building Certification, LEED Certification Costs, Green Building In Education, LEED
Certified Schools, Construction Cost Analysis LEED, Green Building Benefits, Educational Facility
Sustainability, LEED Vs Non-LEED Construction Costs, Energy Efficient School Buildings, Green Building
Certification Systems.
1. Introduction
Background and Purpose of Research
Currently, both domestically and internationally, efforts are being made to enhance building efficiency from
a sustainability perspective by evaluating factors such as energy, raw materials, and pollutant emissions
throughout the entire life cycle (design, construction, maintenance, and demolition) to improve
environmental preservation, occupant comfort, and health. Representative examples include the UK's
Building Research Establishment Environmental Assessment Method (BREEAM) initiated in 1991, and the
USA's Leadership in Energy and Environmental Design (LEED) that started in 1998. In South Korea, the
Green Building Certification Criteria (GBCC) has been implemented since 2002. These certification systems
not only promote the spread of green buildings but also enhance public awareness of environmental
conservation and foster the development of green technologies. For educational facilities, Shendell (2004)
found that increased CO2 levels in classrooms correlate with higher student absenteeism. The United States
Environmental Protection Agency (USEPA) reported in 2000 that indoor air quality, affected by pollutants,
temperature, and humidity, significantly influences students' health and academic performance,
underscoring the importance of green buildings in educational settings. Research on green buildings is
*
Researcher, Department of Engineering and Management, Hofstra University, Uniondale, New York, US.

E-ISSN: 3048-7021 (Online)
264
being conducted across various fields, particularly regarding changes in construction costs compared to
existing buildings. In South Korea, active research includes studies on cost variations according to LEED
certification levels for office facilities (Kim Jaemun et al., 2012) and additional construction costs for new
buildings seeking LEED certification (Lee Won-ki, 2013). Internationally, studies include research on LEED
costs for office buildings (GSA, 2004) and cost analysis of LEED certification for bank buildings (Chad Mapp
et al., 2011). However, these studies predominantly focus on commercial and residential buildings rather
than educational facilities. Therefore, this study aims to conduct a comparative analysis of construction
cost changes due to LEED certification for educational facilities. The results of this study will be used for
future research on cost prediction models based on LEED grades for educational facilities.
Scope and Methods of Research
The Canada Green Building Council (CaGBC) modified the contents of LEED-NC2.1 developed by the US
Green Building Council (USGBC) to suit Canadian conditions and implemented its own green building
certification system called LEED Canada in 2003. However, as of June 2017, it discontinued this and adopted
USGBC's LEED. Accordingly, this study focuses on buildings certified with LEED, not LEED Canada, in the
Canadian region.
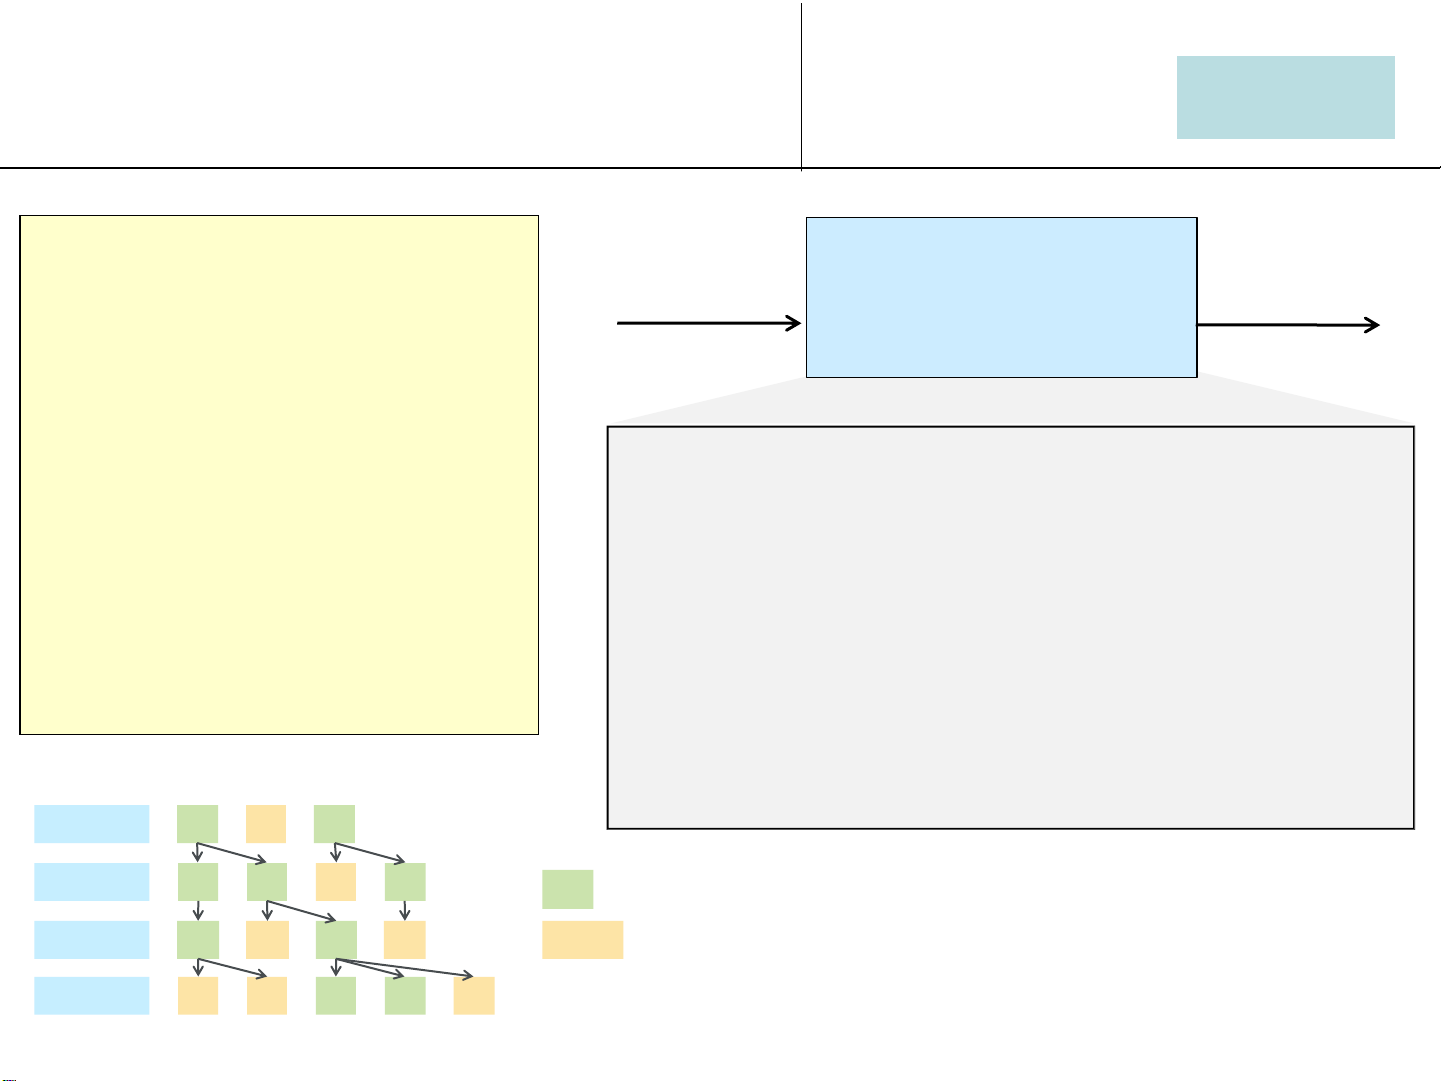
To analyze the construction cost changes for educational facilities due to LEED certification compared to
existing costs, the study follows the methodology illustrated in Figure 1. First, out of 352 universities in
Canada with LEED-certified buildings, 21 universities were selected as samples where the certification
criteria align with those in Korea. Second, data on the construction costs of LEED-certified and non-certified
buildings at the selected universities were collected. Third, to conduct statistical analysis, the collected data
were first subjected to a normality test to ensure they were suitable for statistical analysis. Then, a T-test
was performed to analyze whether the differences in construction costs per square meter were statistically
significant. Finally, based on the analysis, the results comparing the construction costs with and without
LEED certification were derived.
Figure-1 Methodology
2. Literature Review
Overview of LEED for Schools
In the United States, the US Green Building Council (USGBC) has been implementing LEED green building
certification evaluations since 1998, with revisions made over time. As a result of these efforts, the number
of LEED-certified buildings grew from just 60 in 2000 to over 50,000 by 2017.

Parekh.et.al.2024
265
Figure-2 Guideline
Figure 2 illustrates the revision process of LEED since 2009. In 2009, LEED Ver 3, which comprised 10
independent evaluation systems, was revised to LEED Ver 4 in 2013, consolidating the systems into five.
The types of revised evaluation systems include LEED for BD+C (Building Design and Construction), LEED
for ID+C (Interior Design and Construction), LEED for O+M (Building Operations and Maintenance), LEED
for ND (Neighborhood Development), and LEED for Homes. Newly added subcategories include Healthcare,
Data Centers, Hospitality, Warehouses and Distribution Centers, Retail, Schools, Plan, and Built Project.
The LEED Ver 4 BD+C (School) rating system currently categorizes certification as Certified (40-49 points),
Silver (50-59 points), Gold (60-79 points), and Platinum (80-110 points).
Table 1 shows the changes in the scoring criteria for the LEED for BD+C (School) system. The revised
version reflects the following updates: the total score increased from 79 points in Ver 2 to 110 points in
Ver 3, with the addition of a new Regional category allowing for extra points based on regional
environmental characteristics. The Sustainable Sites category now includes items related to alternative
transportation methods, such as access to public transport and bicycle storage, to reduce pollutant
emissions.
The most significant increase was observed in the Energy & Atmosphere category, while the Indoor
Environmental Quality category experienced the largest decrease. Other categories showed changes of 1-
3 points, reflecting adjustments based on the evolving importance of each category.
Table-1 Changes in school points and section
Section
Application and Credits
Ver 2
Ver 3
Ver 4
Total
%
Total
%
Total
%
Integrative Process
-
-
-
-
1
1
Location and
Transportation
-
-
-
-
15
13.6
Sustainable Sites
16
20.3
24
21.8
12
10.9
Water Efficiency
7
8.9
11
10
12
10.9

E-ISSN: 3048-7021 (Online)
266
Energy & Atmosphere
17
21.5
33
30
31
28.2
Materials & Resources
13
16.5
13
11.8
13
11.8
Indoor Environmental
Quality
20
25.3
19
17.3
16
14.5
Innovation
6
7.6
6
5.5
6
5.5
Regional Priority
-
-
4
3.6
4
3.6
Total
79
100
110
100
110
100
In transitioning from Ver 3 to Ver 4, the Integrative Process category was added, and the Sustainable Sites
category was split into Sustainable Sites and Location and Transportation. The 7 points assigned to
Transportation in Ver 4 are similar to the 4 points in Ver 3, suggesting that this is more of a reclassification
rather than a change in weighting, with a new emphasis on Location. Other categories also saw changes
of 1-3 points, indicating partial adjustments over time.
Review of Previous Studies
Zhonghua Gou et al. (2010) composed questions regarding market readiness and policies for green
buildings, focusing on benefits, motivations, obstacles, and policies. They conducted interviews with 11
local green building researchers, who largely agreed that initial costs for green buildings are higher than
those for conventional buildings. The reasons included increased design costs, the purchase of green
materials, and the introduction of energy-saving systems.
In the residential sector, Kim Young-Man (2010) conducted a feasibility analysis for green building
certification of apartment complexes. The study targeted five apartment complexes in Seoul that received
excellent grades (pre-certification) under the domestic green building certification system in 2008. The
additional costs per category, particularly in the energy sector, aimed at achieving 25-30% energy savings.
This analysis used the Korea Institute of Construction Technology (KICT) report's standard of energy
savings of 25-30%. The total additional costs were calculated by multiplying the project area by the unit
cost of energy savings.
The analysis revealed an average additional cost of 5.32%, with increases in Indoor Environmental Quality
(2.8%), Water Efficiency (1.18%), Energy (0.56%), Materials (0.32%), Ecological Environment (0.12%),
and Traffic (0.08%). The high additional costs for Indoor Environmental Quality and Water Efficiency were
attributed to the large quantities of materials such as windows and water-saving installations, as well as
high-cost items like rainwater utilization systems. Additionally, as the floor area increased, the unit cost of
additional construction decreased due to bulk material orders and economies of scale for special facilities
and high- efficiency boilers.
For office buildings, Kim Jae-Moon (2010) estimated additional construction costs for LEED certification
based on the certification levels. The study selected a total construction cost of 36.977 billion won for an
office building completed in June 2011. Scenarios were set for Certified (43 points), Silver (53 points), Gold
(64 points), and Platinum (82 points), with the building applying LEED Ver 2. Additional construction costs
were calculated for each of the six categories and 54 prerequisite and credit items. The lowest additional
costs per item were applied to achieve each certification level, and design changes for LEED certification
were also implemented.

Parekh.et.al.2024
267
As a result, the cost changes for each certification level were as follows: Certified -0.08%, Silver 0.40%,
Gold 2.57%, and Platinum 5.79%. The most influential items for each level are as follows: For the Certified
level, the additional construction cost was reduced by optimizing the capacity of mechanical equipment,
resulting in savings of -297,970,000 KRW, or 0.08%. For the Silver level, the most significant cost impact
was from the Energy & Atmosphere (EA) category, accounting for 43% of the additional costs, primarily
due to energy-saving measures. Similarly, for the Gold level, the EA category accounted for 65% of the
additional costs, and for the Platinum level, it accounted for 77%, indicating that the EA category had the
most significant cost impact for all LEED certification levels.
In the case of educational facilities, a study by US Green Building (2006) analyzed the cost-benefit of 30
LEED-certified schools in 10 states over six years (2001-2006). The study found that while implementing
efficient systems, design, and modeling for green certification could increase construction costs, it also
resulted in savings of $71 per square foot due to energy and water savings, productivity improvements,
and health benefits from improved indoor air quality. The savings could offset the additional construction
costs or even result in a net gain.
However, in South Korea, research on green building certification for school facilities has mainly focused
on case analysis and certification criteria, rather than construction costs. Studies include the analysis of
green building certification evaluation items and cases for school facilities (Kim Chang-sung, 2013),
research on selecting mandatory items for green building certification criteria for schools (Kim Yong-seok
et al., 2009), and comparative analysis of evaluation results for green-certified schools (Jung Ji-na et al.,
2009).
T-Test
A T-test is a parametric statistical test used to determine if there is a significant difference between the
means of two populations. In this study, a one-sample T-test will be used to test whether the observed
meaning differs from a specified value. This method requires the dependent variable to follow a normal
distribution. If the sample size for each category is generally 30 or more, the data can be assumed to be
approximate normality according to the central limit theorem.
The null hypothesis () and the alternative hypothesis () for this test are as follows
Where:
= sample mean
= population mean
Figure-3 T Distribution graph

E-ISSN: 3048-7021 (Online)
268
3. Statistical Analysis
Selection of Subjects
According to the Canada Green Building Council (CaGBC), there are a total of 3,038 LEED-certified buildings,
of which 336 are educational facilities, accounting for 11%. Additionally, as shown in Figure 4, the number
of LEED-certified buildings in universities across Canada has been increasing since 2005. This trend is
attributed to the Canadian government's implementation of the Green Energy and Green Economy policy
in 2009 and the growing interest in the impact of green buildings on educational environments.
Figure-4 LEED certification numbers in universities of Canada
Figure-5 University Location
For this study, data were collected from the Canadian Universities Reciprocal Insurance Exchange (CURIE)
insurance company, focusing on 21 universities with LEED-certified buildings in Canada, as shown in Figure
5. CURIE is a nonprofit organization established to manage insurance and risk management for universities
across Canada. The data were obtained directly from CURIE and included detailed information such as
university names, locations, construction years of auxiliary buildings, number of floors, total floor area,
construction costs, and LEED certification status as of the end of 2016.
Data Collection
Data Collection Procedures: The purpose of this study is to compare the construction costs of LEED-
certified and non-LEED buildings. However, as the size of a building increases, so does the total construction
cost. Therefore, the cost per unit area (C$/m²) is used to conduct the analysis. The following steps were
taken:

Parekh.et.al.2024
269
First, the unit cost per square meter for LEED-certified buildings at each university was selected as the
experimental group and defined as . Second, for each LEED-certified building sample, three samples of
non-LEED buildings' unit costs per square meter were collected and defined as . Since the unit cost per
square meter is influenced by various factors such as size, design, structure, and finishes, it is necessary
to minimize these variables. Therefore, when selecting the control group (non-LEED vs. LEED buildings),
buildings with the same use, construction year ±3 years, and floor area ±20% were chosen. Data meeting
these conditions were available for three or more buildings at each university, and three were selected to
ensure data homogeneity, defining them as . Third, the and values for each university were
analyzed to determine whether there were significant differences in construction costs based on LEED
certification.
Table-2 Data Analysis
S. No
Content
N
Ave.
BVIij
S.NO
Content
N
Ave.
BVIij
1
LEED
1
570
1.06
12
LEED
5
416.26
1.025
Non-LEED
3
537.57
Non-LEED
15
406.09
2
LEED
1
356.06
1.049
13
LEED
9
422.3
1.03
Non-LEED
3
339.27
Non-LEED
27
410.09
3
LEED
1
300.85
1.029
14
LEED
2
411.51
1.018
Non-LEED
3
292.26
Non-LEED
6
404.17
4
LEED
2
289.39
1.031
15
LEED
3
448.57
1.063
Non-LEED
6
280.72
Non-LEED
9
421.82
5
LEED
6
324.92
1.043
16
LEED
1
377.03
1.021
Non-LEED
18
311.57
Non-LEED
3
370.25
6
LEED
1
465.02
1.012
17
LEED
2
348.12
1.058
Non-LEED
3
459.7
Non-LEED
6
328.98
7
LEED
9
311.11
1.035
18
LEED
1
363.3
1.02
Non-LEED
27
300.53
Non-LEED
3
356.25
8
LEED
3
322.39
1.063
19
LEED
3
427.05
1.033
Non-LEED
9
303.7
Non-LEED
9
413.29
9
LEED
4
485.39
1.021
20
LEED
6
325.23
1.051
Non-LEED
12
475.28
Non-LEED
9
309.51
10
LEED
1
552.6
1.053
21
LEED
4
562.27
1.049
Non-LEED
3
524.68
Non-LEED
12
536.06
11
LEED
1
422.43
1.058
Non-LEED
3
399.23

E-ISSN: 3048-7021 (Online)
270
= university
= the number of samples
= average sample
Data Collection Results: To analyze the differences in construction costs between the two groups, the
Building Value Index (BVI) was defined. BVI is the ratio of to , indicating the relative value of LEED-
certified buildings compared to non-LEED buildings. The formula for BVI is as follows:
Where:
= university ID
= LEED-certified building ID
= non-LEED building ID
= Average LEED-certified building value
= Average non-LEED building value
= Average ( ) / Average ( )
The analysis results according to the formula are shown in Table-2.
Normality Test
In this study, a T-Test was used to determine whether there is a difference in construction costs between
the two groups. For the T-Test to be valid, the dependent variable must satisfy the assumption of normal
distribution. Therefore, the collected data were subjected to a normality test to analyze whether they
followed a normal distribution. As shown in Figure 6, the data exhibited characteristics of a normal
distribution. Additionally, the Kolmogorov-Smirnov test was performed to statistically confirm normality.
Assuming a confidence interval of 95%, the p-value was found to be 0.200, which is greater than 0.05,
indicating that the collected data followed a normal distribution.
Figure-6 Normal

Parekh.et.al.2024
271
Next, descriptive statistics were used to further verify normality by analyzing the skewness and kurtosis,
as shown in Table 3. The mean was 1.038, the median was slightly lower at 1.035, the skewness was
0.039, and the kurtosis was -1.339. According to Kline's criteria, skewness less than an absolute value of 3
and kurtosis less than 10 do not pose significant problems, indicating that the data satisfied the normality
assumption (Kline, 2005).
Table-3 Descriptive Statistics
Class Collected Data
Value
N
21
Mean
1.038
Std. Dev.
0.015
1st Decile
1.012
Median
1.035
21st Decile
1.063
Skewness
0.039
Kurtosis
-1.339
Analysis Results
To statistically determine whether there is a significant difference in construction costs between LEED-
certified and non- LEED buildings, a one-sample T-Test was conducted. The null hypothesis (H₀) and the
alternative hypothesis (H₁) were established as follows:
: LCB = NLB
: LCB ≠ NLB
Where:
LCB: Construction cost per unit area of LEED-certified buildings
NLB: Construction cost per unit area of non-LEED buildings
Under the null hypothesis, the test statistic value T(X) was found to be 11.103. With a sample size of n=21,
the degrees of freedom were 20. At a 95% confidence level, the T-distribution table indicates a critical
value range of -2.086 ≤ t ≤ 2.086. As shown in Figure 7, the rejection region is the shaded area, and the
test statistic value T(X) = 11.103 falls within this region, leading to the rejection of the null hypothesis (H₀)
and the acceptance of the alternative hypothesis (H₁). This indicates that the results of the T-Test are
significant. Consequently, it was found that the construction cost per unit area of LEED-certified buildings
is statistically significantly different from that of non-LEED buildings. The average BVI value was 1.038,
indicating that LEED- certified buildings had a 3.8% higher construction cost compared to non-LEED
buildings.

E-ISSN: 3048-7021 (Online)
272
Figure-7 T Distribution curve for a degree of freedom of 21
Although the variables affecting construction costs were minimized in this study, future research should
collect more detailed data on various factors (materials, construction methods, scale, etc.) to analyze their
correlations. According to the results of this study, the 3.8% increase in construction costs is attributed to
increased initial design costs, the use of relatively expensive green materials, and material supply.
However, according to US Green Building (2006), LEED-certified school buildings, compared to non-certified
school buildings, provide long-term benefits that can offset additional construction costs in four aspects:
• Energy usage
• Pollutant emissions
• Water usage
• Reduced incidence of asthma and respiratory diseases.
First, in terms of energy usage, green facilities show higher energy efficiency compared to existing
buildings, and reduced energy demand can indirectly lower energy prices. Second, in terms of pollutant
emissions, reduced energy demand leads to decreased fossil fuel consumption. Third, green buildings
utilizing rainwater and greywater systems show reduced water usage compared to existing buildings,
leading to savings in direct pollution control costs and the infrastructure required for wastewater
transportation and treatment. Fourth, improved indoor air quality from green facilities is expected to reduce
the incidence of asthma and respiratory diseases compared to existing buildings
4. Conclusion
Efforts to achieve sustainable development in building construction are being widely implemented by
international organizations, governments, and green building certification bodies. However, according to
several researchers, applying green building certification systems increases construction costs and
durations, making them less economical compared to conventional buildings. Therefore, this study aimed
to compare the construction costs of educational facilities based on the presence or absence of LEED
certification.
Data were collected from 21 universities in Canada, selecting three non-LEED buildings for each LEED-
certified building. The average construction cost per unit area was calculated based on LEED certification
status, and the normality of the data was verified through a normality test, which confirmed that the data
followed a normal distribution. Additionally, descriptive statistics and T-Test results indicated that the
construction costs of LEED-certified buildings were 3.8% higher than those of non-LEED buildings. The
increase in construction costs for educational facilities can be attributed to additional costs incurred from
the implementation of efficient systems, design, and modeling, as indicated by the study by US Green
Building (2006).

Parekh.et.al.2024
273
According to the analysis method in the report, the 3.8% increase in construction costs for green building
certification can result in savings of $71 per square foot through energy and water savings, productivity
improvements, and health benefits from improved indoor air quality.
This study's results were based on buildings that applied the LEED certification system, so there might be
some differences when applying domestic green building certification systems. Therefore, further research
on the construction costs of domestic, green-certified buildings and additional studies to verify this study's
results are needed. However, since each certification system shares the ultimate goal of promoting
sustainability and has similar evaluation items, it is expected that applying domestic green building
certification systems will yield similar results.
Therefore, this study serves as a foundational study for establishing an analysis model for additional
construction costs according to LEED certification levels for educational facilities. The results of this study
will be utilized for future research on predicting construction costs by LEED certification levels for
educational facilities.
5. References
[1] Gou, Z., Lau, S. S. Y., & Prasad, D. (2013). Market readiness and policy implications for green buildings: Case
study from Hong Kong. Journal of Green Building, 8(2), 162-173.
[2] Gou, Z., & Lau, S. S. Y. (2014). Contextualizing green building rating systems: Case study of Hong Kong.
Habitat International, 44, 282-289.
[3] Jung, J. N., Kim, Y. S., Suck, H. T., & Park, S. D. (2009). Study on comparison and analysis of the obtained
scores in the assessed green schools. Journal of the Regional Association of Architectural Institute of Korea,
25(4), 279-286.
[4] Kim, C. S. (2013). The analysis of the assessment categories of Korea green building certification criteria by
the case studies of educational facilities. The Journal of Korean Institute of Educational Facilities, 20(2), 15-
24.
[5] Kim, J. M., Yang, W. Y., & Min, J. K. (2012). A study on the variation of construction costs graded LEED
certification of office building. Journal of the Regional Association of Architectural Institute of Korea, 28(8),
161-168.
[6] Kim, J. M., Yang, W. Y., Kang, H. S., & Min, J. K. (2012). A study on estimate of additional construction cost
as certifying LEED of office building in Korea. Journal of the Regional Association of Architectural Institute of
Korea, 28(8), 161-168.
[7] Kim, Y. M. (2010). Analysis on multi-residential housing project feasibility study based on eco-friendly building
certification (master’s thesis). Kyunghee University.
[8] Kim, Y. S., Jung, J. N., Lee, S. H., & Park, S. D. (2009). Study on selecting the prerequisite items in the green
building certification criteria for schools. Journal of the Regional Association of Architectural Institute of Korea,
25(5), 59-66.
[9] Kline, R. B. (2005). Principles and practice of structural equation modeling (2nd ed.). New York: Guilford
Press.
[10] Lee, W. K. (2013). A study on additional construction cost for LEED certification on new construction (master’s
thesis). Seoul National University of Science and Technology.
[11] Shendell, D. G., Prill, R., Fisk, W. J., Apte, M. G., Blake, D., & Faulkner, D. (2004). Association between CO2
concentrations and student attendance in Washington Idaho. Indoor Air, 14(5), 333-341.
[12] US Green Building. (2006). Greening America’s schools: Costs and benefits.
[13] United States Environmental Protection Agency. (2000). Indoor air quality tools for schools (pp. 1-3). EPA.
[14] What is Project Delivery Partners, How to Implement it. R. Parekh. & Hofstra University. (2023). ResearchGate
https://doi.org/10.13140/RG.2.2.10185.11360

E-ISSN: 3048-7021 (Online)
274
6.Conflict of Interest
The authors declare that there are no conflicts of interest regarding the publication of this article.
7.Funding
No external funding was received to support or conduct this study.