First Light of Dawn Appears, but Challenges Still Remain PDF Free Download
1 / 10/10
100%

See the last page for disclaimer Page 1 of 10
Equity Research
Equity Research Report
证 券 研 究 报 告
Company Report
股
票
研
究
公
司
报
告
证
券
研
究
报
告
[Tab
le_I
nfo1
]
互
联
网
行
业
Internet Sector
[Tab
le_I
nfo2
]
百
度
Baidu (BIDU US)
[Table_Title]
Company Report:
Baidu (BIDU US)
Jason Zhou
周桓葳
(852) 2509 5347
公司报告:
百度 (BIDU US)
jason.zhou@gtjas.com.hk
31 December 2019
[Table_Summary]
First Light of Dawn Appears, but Challenges Still Remain
曙光初现,挑战犹存
3Q2019 Non-GAAP shareholders' profit was better than the market and
our expectation, if excluding the impairment of long-term investment. Gross
margin improved 2.9 ppt qoq due to the decelerating expense on TAC.
We revised up FY19-FY21 online marketing services revenue estimates
by 1.3%/2.2%/3.1%, respectively, due to expected 1) self-build mobile
ecosystem development; 2) enhanced user experience. We believe
Baidu's online marketing services will further improve.
We revise up FY19-FY21 operating margin estimates by 0.2ppt/ 1.6ppt/
0.1ppt, respectively, due to expected efficient spend on SG&A.
Furthermore, we believe the gross margin will improve due to the expected 1)
decreasing spend on traffic acquisition; 2) controllable spend on content
costs.
We maintain the investment rating as "Neutral" and revise up TP to
US$134.00. In view of expected positive impact from online marketing
services revenue growth and efficient spending on SG&A, we revise up
FY19-FY21 non-GAAP EPADS by 19.2%/0.6%/1.1%, respectively. The new
TP represents 22.6x/19.4x/13.6x non-GAAP PER from FY19-FY21,
respectively.
假如排除长期投资的减值,2019 年第三季度非 GAAP 股东利润好于市场和我们的预期。
由于 TAC 支出的减少,毛利率环比增长 2.9 个百分点。
基于预计 1)自建移动生态发展;2)增强的用户体验,我们分别上调 2019-2021 财年的
在线营销服务收入预测 1.3%/2.2%/3.1%。我们认为百度的在线营销服务预期将进一步得
到改善。
基于对一般营销及行政费用的高效支出,我们分别上调 2019-2021 财年经营利润率 0.2 个
百分点/1.6 个百分点/0.1 个百分点。此外,我们认为毛利率将得到改善,由于预计 1)减
少流量获取成本的支出; 2)控制内容成本的支出。
我们维持投资评级为“中性”和上调目标价至 134.00美元。由于预计在线营销服务收入的
增长和有效的一般营销及行政支出将带来正面影响,我们分别上调 2019-2021 财年的非
GAAP 每份 ADS 盈利预测 19.2%/0.6%/1.1%。新目标价分别相当于 22.6 倍/19.4 倍/13.6
倍2019财年至 2021 财年非 GAAP 市盈率。
[Table_Rank]
Rating:
Neutral
Maintained
评级:
中性 (维持)
[Table_Price]
6-18m TP 目标价:
US$134.00
Revised from 原目标价:
US$118.00
ADS price ADS价格:
US$126.290
Stock performance
股价表现
[Table_QuotePic]
[Table_PriceChange]
Change in ADS Price
股价变动
1 M
1个月
3 M
3个月
1 Y
1年
Abs. %
绝对变动 %
6.5
22.9
(20.4)
Rel. % to NASDAQ Index
相对纳指变动 %
3.3
11.1
(55.2)
Avg. ADS price(US$)
平均 ADS 价(美元)
106.5
104.6
139.4
Source: Bloomberg, Guotai Junan International.
[Table_
Profit]
Year End
Turnover
Net Profit
Earnings/ADS
Earnings/ADS
PER
BV/ADS
PBR
DP ADS
Yield
ROE
年结
收入
股东净利
每份 ADS 净利
每份 ADS净利变
动
市盈率
每份 ADS
净资产
市净率
每份 ADS
股息
股息率
净资产收益率
12/31
(RMB m)
(RMB m)
(RMB)
(△%)
(x)
(RMB)
(x)
(RMB)
(%)
(%)
2017A
84,809
18,301
52.751
65.1
15.6
332.169
2.5
0.000
0.0
17.6
2018A
102,277
27,573
78.636
49.1
11.0
466.772
1.9
0.000
0.0
19.8
2019F
106,948
2,035
5.848
(92.6)
152.5
492.660
1.8
0.000
0.0
1.2
2020F
120,394
17,740
50.905
770.5
17.5
532.787
1.7
0.000
0.0
9.9
2021F
142,274
24,054
68.828
35.2
13.0
597.184
1.5
0.000
0.0
12.2
[Table_BaseData]
ADS in issue (m) 总ADS 数 (m)
349.0
Major shareholder 大股东
Robin Li 16.1%
Market cap. (US$ m) 市值 (US$ m)
44,075.2
Free float (%) 自由流通比率 (%)
80.0
3 month average vol. 3 个月平均成交股数 (‘000)
3,422.0
FY19 Net gearing (%) FY19 净负债/股东资金 (%)
15.4
52 Weeks high/low (US$) 52 周高/低 (US$)
186.220 / 93.390
FY19 Non-GAAP PER
20.4
Source: the Company, Guotai Junan International.
(50.0)
(40.0)
(30.0)
(20.0)
(10.0)
0.0
10.0
20.0
30.0
40.0
Dec-18 Mar-19 Jun-19 Sep-19 Dec-19
% of return
CCMP Index BIDU US Equity

Company Report
See the last page for disclaimer Page 2 of 10
[
T
a
b
l
e
_
R
i
g
h
t
M
a
r
1
]
31 December 2019
[
T
a
b
l
e
_
R
i
g
h
t
M
a
r
2
]
Baidu
百度
(BIDU US)
[Table_PageHeader]
Baidu (BIDU US)
Internet Industry Update
4Q19 China internet advertising environment is expected to be improved with the stimulation of double 11 shopping
festival. According to QuestMoblie, China internet advertising market scale increased by 12.9% yoy in 3Q19, compared to an
increase of 18.8% for the preceding same period. We believe the yoy decelerating growth was mainly due to 1) increasing
competition in internet advertising market; 2) advertisers reallocated their resource due to the macro headwinds. However, we
forecast the internet advertising market growth will slightly recover in 4Q19 due to the support of National holidays and double11
shopping festival. In addition, the market share of search advertising dropped from 17.3% in 1Q19 to 15.1% in 3Q19, while the
market share of information feed advertising increased from 28.2% in 1Q19 to 30.7% in 3Q19. We believe the drop of search
advertising is because search companies such as Baidu has shifted part of its search ads to information feed ads.
Figure-1: 1Q18-3Q19 China internet advertising market
scale
Figure-2: Advertising market share from 4Q17 to 3Q19
Source: CTR, Guotai Junan International.
Source: iResearch, Guotai Junan International.
Baidu smart speaker kept its domestic market share in 3Q19. According to AVC data, Baidu smart speaker ranked second in
3Q19 in China, with 33.1% market share. Alibaba continued its momentum and ranked first domestically, with 33.3% market share.
In addition, in terms of accumulated market share in 1Q-3Q19, Baidu accounted 30.7%, ranking No.2 and Alibaba ranked No.1
with 34.2% market share.
Table-1: 1Q-3Q19 domestic smart speaker market share in terms of revenue
1Q19
2Q19
3Q19
1Q-3Q19
TMALL Genie
34.7%
34.9%
33.3%
34.2%
Xiaomi
32.0%
24.9%
26.9%
27.7%
Baidu
23.5%
34.4%
33.1%
30.7%
Others
9.8%
5.8%
6.7%
7.4%
Total
100.0%
100.0%
100.0%
100.0%
Source: AVC, Guotai Junan International.
94
96
101
119
111
109
114
26.5%
21.6%
18.8%
29.8%
18.3%
13.7%
12.9%
0%
10%
20%
30%
40%
0
20
40
60
80
100
120
140
1Q18
2Q18
3Q18
4Q18
1Q19
2Q19
3Q19
Domestic internet market scale
yoy
(Miliion)
19.4%
21.5%
20.4%
21.1%
17.1%
17.3%
15.4%
15.1%
36.8%
30.3%
34.0%
30.6%
37.9%
33.4%
36.7%
34.4%
12.1%
12.1%
11.2%
11.7%
11.5%
10.0%
8.8%
9.7%
19.2%
21.2%
21.1%
24.2%
23.0%
28.2%
28.6%
30.7%
4.7%
5.7%
4.6%
4.3%
3.3%
3.3%
3.0%
2.9%
7.8%
9.2%
8.7%
8.1%
7.2%
7.8%
7.5%
7.2%
0%
10%
20%
30%
40%
50%
60%
70%
80%
90%
100%
4Q17
1Q18
2Q18
3Q18
4Q18
1Q19
2Q19
3Q19
Searching Advertising
E-commerce Advertising
Brand Advertising
Information Feed Advertising
Video Advertising
Other type of Advertising

Company Report
See the last page for disclaimer Page 3 of 10
[
T
a
b
l
e
_
R
i
g
h
t
M
a
r
1
]
31 December 2019
[
T
a
b
l
e
_
R
i
g
h
t
M
a
r
2
]
Baidu
百度
(BIDU US)
[Table_PageHeader]
Baidu (BIDU US)
3Q19 Results Review
Baidu’s 3Q19 Non-GAAP shareholders’ profit was better than the market’s and our expectation if excluding the
impairment of long-term investments. Content cost increased 4.4% yoy, mainly due to increased investment in iQIYI content.
Traffic acquisition cost, which was lower than our expectation by 8.5%, increased 4.8% yoy as a result of increasing TAC prices
and expansion into connected offline screens and other areas. In addition, bandwidth costs were lower than our expectation by
8.2%, with 19.7% yoy growth, mainly due to increasing demand from newsfeed, videos and cloud services. Gross margin
improved 2.9ppt qoq but decreased 7.9ppt yoy. The qoq improvement of gross profit margin was mainly due to the decelerating
spending on TAC. On the other hand, selling, general and administrative expenses were in line with our expectation due to
expected cost control. Selling, general and administrative expenses declined 17.4% yoy, primarily due to decreased investment in
channel and promotional marketing. With the disciplined spending, Non-GAAP operating margin increased 5.7ppt qoq to 13.1%.
The Company announced 4Q19 revenue guidance to be between RMB27.1 billion and RMB28.7 billion, yoy growth from -1% to
6%, reflecting the relatively weak business environment and increasing competition for Baidu’s advertising business.
Table-2: Baidu’s Income Statement Analysis
RMB
(Million)
3Q19
3Q18
YoY
1-3Q19
1-3Q18
YoY
Comments
Total revenue
28,080
28,203
(0.4%)
78,529
78,082
4.6%
Driven by robust growth in iQIYI
membership services, cloud services
and smart devices.
Gross profit
11,702
13,985
(16.3%)
31,196
38,949
(19.9%)
SG&A
(4,657)
(5,641)
(17.4%)
(15,954)
(13,288)
20.1%
Primarily due to decreased investment
in channel and promotion marketing.
R&D
(4,690)
(3,916)
19.8%
(13,590)
(11,243)
20.9%
Primarily due to the increase in
personnel related expenses.
Operating profit
2,355
4,428
(46.8%)
1,652
14,418
(88.5%)
Non-GAAP
operating profit
3,691
5,744
(35.7%)
6,047
17,601
(65.6%)
Other gain/loss
(9,484)
9,021
n.a.
(7,346)
11,855
n.a.
Mainly due to loss from equity
investments that have experienced an
other-than-temporary decline in
valuation.
Net profit to
Shareholders
(6,373)
12,396
n.a.
(4,288)
25,492
n.a.
Non-GAAP net
profit to
shareholders
4,387
6,751
(35.0%)
8,989
19,207
(53.2%)
EPADS (RMB)
(18.37)
35.53
n.a.
40.53
73.27
80.8%
Gross profit
margin
41.7%
49.6%
(7.9ppt)
39.7%
51.9%
(12.2ppt)
Non-GAAP
operating profit
margin
13.1%
20.4%
(7.3ppt)
7.7%
23.4%
(15.7ppt)
Non-GAAP net
margin
15.6%
24.0%
(8.4ppt)
11.4%
25.6%
(14.2ppt)
Source: the Company, Guotai Junan International.

Company Report
See the last page for disclaimer Page 4 of 10
[
T
a
b
l
e
_
R
i
g
h
t
M
a
r
1
]
31 December 2019
[
T
a
b
l
e
_
R
i
g
h
t
M
a
r
2
]
Baidu
百度
(BIDU US)
[Table_PageHeader]
Baidu (BIDU US)
We revise up FY19-FY21 online marketing services revenue estimates by 1.3%/ 2.2%/ 3.1%, respectively. We believe
Baidu's online marketing services would face two major challenges in near future: 1) on the mobile side, other large mobile apps
such of Wechat and TikTok has its own closed ecosystem and it would be not easy for Baidu to include every piece of content as it
did during the PC era; 2) advertisers are expected to be more cautious towards marketing spend during the macro headwinds.
However, we believe the following factors are expected to partially offset the negative impact: 1) Baidu's self-build mobile
ecosystem is expected to further alleviate the stress of information island in mobile era, 2) Mini-app is expected to continue to
strengthen Baidu app's content ecosystem, which help advertisers to enhance their conversion rate and ROI; 3) Healthcare
advertising structure data reform is expected to be accomplished. The Company started to introduce Managed Page last
December. In March this year, the Company required its healthcare marketing services customers to switch over from their H5 to
Baidu managed page for the landing pages of their mobile app. In addition, we believe in 4Q19, e-commerce and retail are
expected to be another online marketing revenue momentum of Baidu due to Double 11 celebration. Therefore, we believe the
expected increasing user time consumption and experience, and Baidu's online marketing services are expected to further rally in
following quarters.
Figure-3: Baidu’s Online Marketing Services Revenue
Estimations and YoY Growth
Figure-4: Baidu’s Revenue Estimations and YoY Growth
Source: the Company, Guotai Junan International.
Notes *: FY19A – FY21F figures are estimated in adjusted Online Marketing
Revenue.
Source: the Company, Guotai Junan International.
Notes * : FY19A – FY21F figures are estimated in adjusted revenue
We believe Baidu's monetization capabilities will be strengthened due to 1) expected further improvement in Baidu
mobile ecosystem, and 2) the expansion of its monetization products such as oCPX for search. Baidu has broadened its
mobile ecosystem centering around information and knowledge and improved user experience with mobile pillars, including BJH
accounts, Smart Mini Program and Managed Page. BJH hosted 2.4 million publisher accounts in 3Q19, up 57% yoy. BJH allows
publishers to get the optimal exposure in Baidu search. The Company is expected to improve content quality and emphasize the
social aspect of BJH in order to enhance traffic and user engagement. Baidu Smart Mini Program is expected to become another
traffic momentum with MAUs reaching 290 million in September, up 157% yoy. In addition, in the last three months, the number of
Smart Mini Programs more than doubled while user time spent on Baidu Smart Mini Program grew 32%. In addition, the Company
has expanded its oCPX for newsfeed to oCPX for Phoenix Nest, which is Baidu's search monetization platform, to allow SMEs to
purchase P4P marketing services based on a cost per action basis most suitable for their industry, such as cost per lead, cost per
download or cost per purchase basis. By knowing the return in advance, we believe the change of oCPX would further improve
advertisers' marketing ROI certainly. In addition, we see the good sign for the content development on Baidu App with DAU surge
to 189 million in September, up 25% yoy. However, we believe the competition of user time consumption still fierce. Super app
such as Weixin, Douyin, Toutiao, Alibaba are all increasing its content amplification by increase its mini program and amplify its
content ecosystem. Bytedance, with its Douyin, a short video app, occupied the percentage of user time spending from 10.6% in
September 2018 to 12.5% in the same period this year while Baidu's percentage of time spending decreased from 8.8% last year
September to 7.8% this September.
73.1
81.9
77.9*
85.2*
96.9*
13.4%
12.0%
-4.9%
9.4%
13.7%
-10%
0%
10%
20%
0
20
40
60
80
100
120
FY17A
FY18A
FY19F
FY20F
FY21F
Online marketing revenue (LHS)
YoY growth (RHS)
RMB (Billion)
84.8
102.3
106.9*
120.4*
142.3*
20.2%
20.6%
4.6%
12.6%
18.2%
0%
10%
20%
30%
0
20
40
60
80
100
120
140
160
FY17A
FY18A
FY19F
FY20F
FY21F
Net Revenues
YoY growth (RHS)
RMB (Billion)

Company Report
See the last page for disclaimer Page 5 of 10
[
T
a
b
l
e
_
R
i
g
h
t
M
a
r
1
]
31 December 2019
[
T
a
b
l
e
_
R
i
g
h
t
M
a
r
2
]
Baidu
百度
(BIDU US)
[Table_PageHeader]
Baidu (BIDU US)
Figure-5: Mini Program and BaiJiaHao on Baidu App
Figure-6: Baidu’s DAU
Source: Questmoble, Guotai Junan International.
Source: the Company, Guotai Junan International.
Figure-7: Percentage of Time Spending on Different Top Apps in Sep. 2019
Source: Questmobile, Guotai Junan International.
We believe gross profit margin will further increase. With the increase in TAC prices and expansion into connected offline
screens and other areas, traffic acquisition cost increased 4.8% yoy to RMB 3.2 billion. However, the traffic acquisition cost as a
percentage of revenue reached 11.5% in 3Q19, dropped 1.5 ppt qoq. The decrease was mainly due to the enhancement of
Baidu's in-app traffic. The yoy growth of content costs dropped from 72.9% in 3Q18 to 4.5% in 3Q19, down 68.4 ppt. We believe
the slowdown growth of content costs was due to the controllable content investment on iQIYI. We expect Baidu's gross margin
would be further alleviated due to the following reasons: 1) spending on traffic acquisition is expected to be not as much as before
due to the expected strong in-app traffic and enhancing user experience; 2) spending growth on content development is expected
to further slowdown due to the cost management. Therefore, we revised up FY19-FY21 gross profit margin by 0.6ppt/ 1.0ppt/
0.5ppt, respectively. For the marketing side, we believe the Company is expected to spend more efficient in the following quarters
this year. SG&A expense declined 17.4% yoy in 3Q19. As the Company is expected to screen out the marketing costs and much
focus on the marketing investment return, we believe the percentage of SG&A to net revenue would be controlled within the range
of 16.0% to 17.0% in near futures. Hence, we revised up FY19 to FY21 operating margin by 0.2ppt/ 1.6ppt/ 0.1ppt, respectively.
148
151
161
174
188
189
17%
19%
24%
28%
27%
25%
0%
10%
20%
30%
0
20
40
60
80
100
120
140
160
180
200
Jun.18
Sep.18
Dec.18
Mar.19
Jun.19
Sep.19
DAU
YoY
(Miliion)
42.0%
46.2%
12.5%
10.6%
10.3%
10.4%
7.8%
8.8%
27.5%
24.1%
0% 10% 20% 30% 40% 50% 60% 70% 80% 90% 100%
Sep.19
Sep.18
Tencent
Bytedance
Alibaba
Baidu
Others

Company Report
See the last page for disclaimer Page 6 of 10
[
T
a
b
l
e
_
R
i
g
h
t
M
a
r
1
]
31 December 2019
[
T
a
b
l
e
_
R
i
g
h
t
M
a
r
2
]
Baidu
百度
(BIDU US)
[Table_PageHeader]
Baidu (BIDU US)
Figure-8: Baidu’s Operating Costs Analysis
Figure-9: Baidu’s Gross Margin and Operating Margin
Source: the Company, Guotai Junan International.
Source: the Company, Guotai Junan International.
Baidu has returned USD397 million to its shareholders under the 2019 Share Repurchase Program and USD778 million
under the 2018 Share Repurchase Program, which expired in June 2019, for a total return to shareholders of
approximately USD1.2 billion as of October 31, 2019. In May 2019, the Company's Board approved an additional USD1 billion
repurchase under the 2019 Share Repurchase Program, which is expected to be effective until July 1st 2020. We estimate the
repurchase accounted for around 2.4% of its total market capitalization. We believe the repurchase could stable the share price in
some circumstance but we expect the share price would still under pressure due to the impact on its online marketing services.
Profit Revision
We revised up FY19-21 non-GAAP EPADS by 19.2%/ 0.6%/ 1.1%, respectively. With the further content ecosystem
development, we revise up the FY19-FY21 online marketing services revenue by 1.3%/ 2.2%/ 3.1%, respectively. Therefore, we
revise up FY19-21 Non-GAAP net profit by 19.2%/ 0.6%/ 1.1%, respectively.
Table-3: Financial Estimations Revisions
RMB (Million)
OLD
NEW
CHANGE
2019F
2020F
2021F
2019F
2020F
2021F
2019F
2020F
2021F
Total revenue
105,609
118,156
138,863
106,948
120,394
142,274
1.3%
1.9%
2.5%
- Online marketing
76,898
83,402
93,974
77,923
85,216
96,893
1.3%
2.2%
3.1%
- Other services
28,712
34,754
44,890
29,025
35,178
45,381
1.1%
1.2%
1.1%
Non-GAAP Net
profit
12,226
16,863
24,137
15,367
16,956
24,398
19.2%
0.6%
1.1%
Non-GAAP EPADS
(RMB)
35.1
48.4
69.1
44.2
48.7
69.8
19.2%
0.6%
1.1%
Source: Guotai Junan International.
Valuation
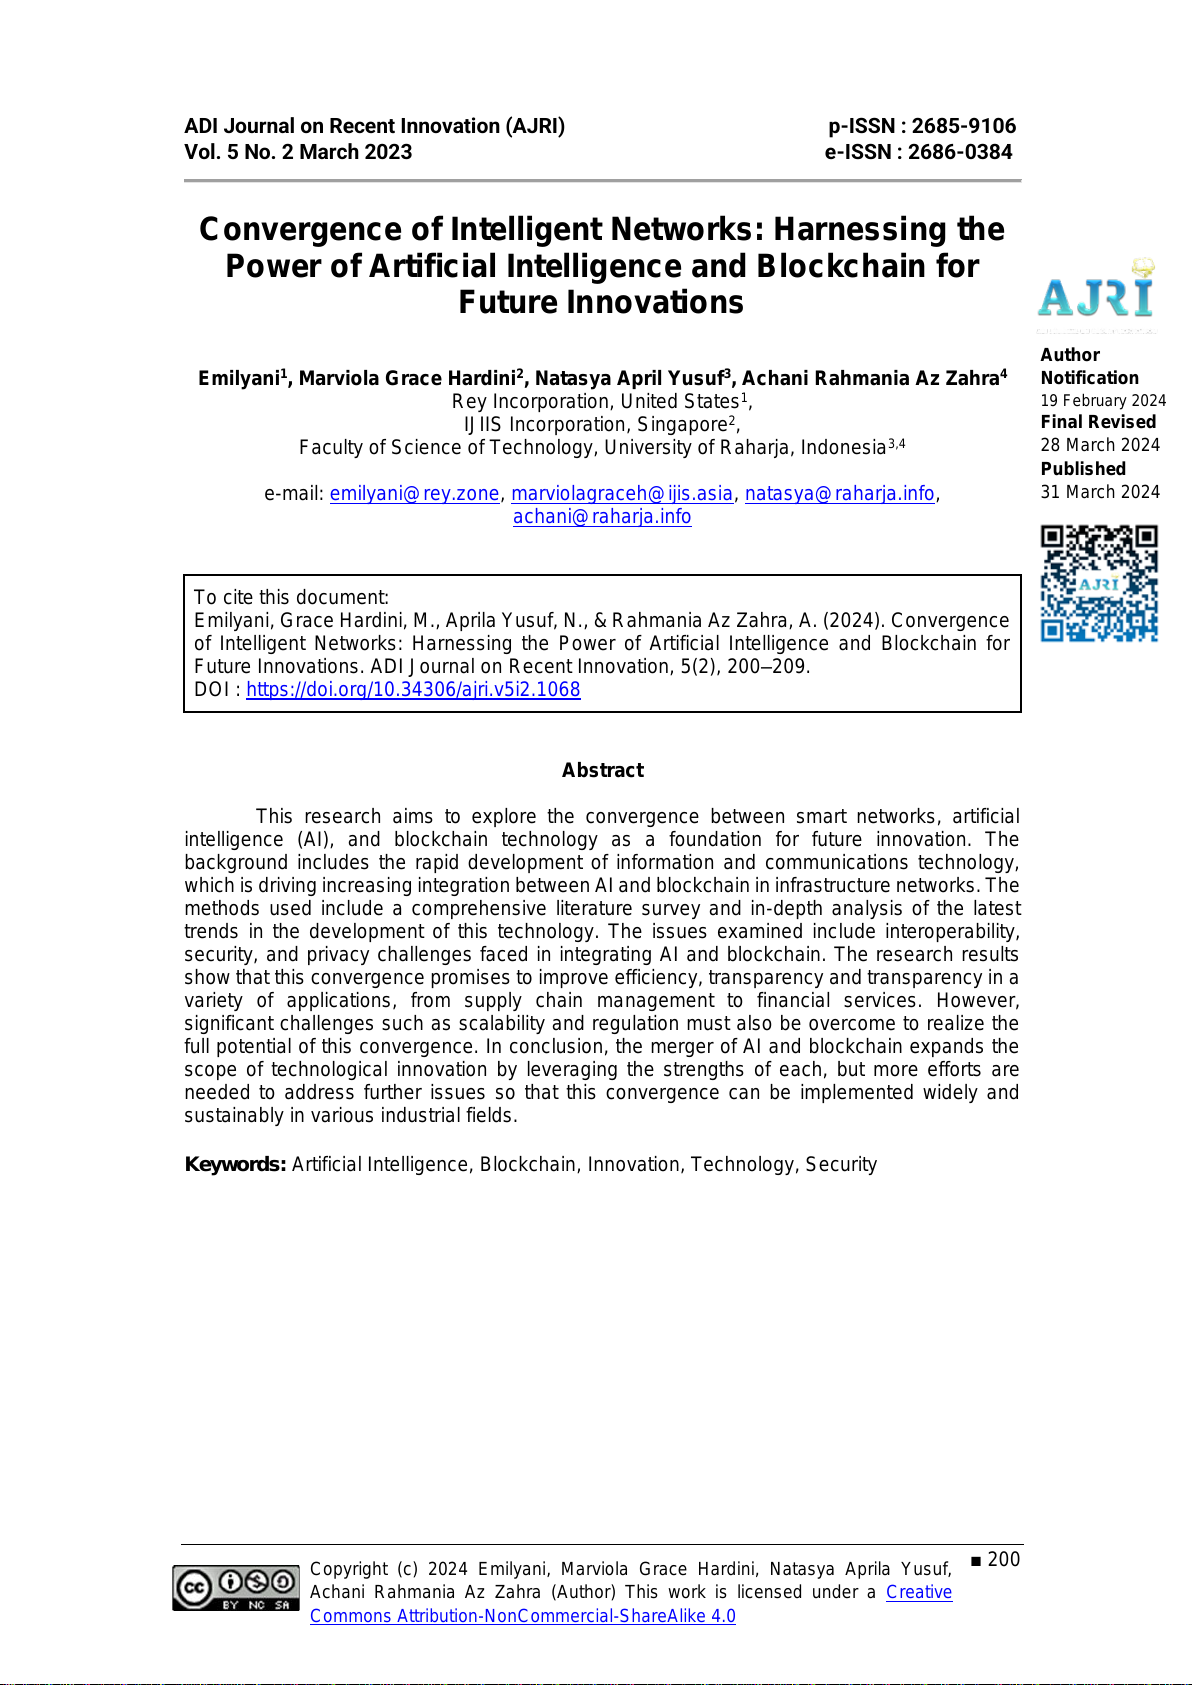
We maintain the investment rating as "Neutral" and revise up TP to US$ 134.00. Baidu traded at 22.9x forward (next four
quarter) PE on average over the past five years. Our new target price is 7.3% premium to 22.9x average forward PE, reflecting the
expected improving user adherence and time consumption on Baidu app. The new TP represents 22.6x/ 19.4x/ 13.6x FY19/
FY20/ FY21 non-GAAP PER.
15.5%
18.8%
19.2%
16.4%
16.0%
15.2%
15.4%
17.1%
16.2%
15.0%
5%
7%
9%
11%
13%
15%
17%
19%
21%
FY17A
FY18A
FY19F
FY20F
FY21F
SG&A/Revenue
R&D/Revenue
49.2%
49.4%
39.5%
40.9%
41.8%
18.5%
15.2%
3.3%
8.3%
10.9%
0%
10%
20%
30%
40%
50%
60%
FY17A
FY18A
FY19F
FY20F
FY21F
Gross profit margin
Operating profit margin

Company Report
See the last page for disclaimer Page 7 of 10
[
T
a
b
l
e
_
R
i
g
h
t
M
a
r
1
]
31 December 2019
[
T
a
b
l
e
_
R
i
g
h
t
M
a
r
2
]
Baidu
百度
(BIDU US)
[Table_PageHeader]
Baidu (BIDU US)
Figure-10: Baidu’s Non-GAAP Forward PE Graph
Figure-11: Baidu’s Historical PE Range
Source: Bloomberg.
Source: Bloomberg.
28.05
0.0
5.0
10.0
15.0
20.0
25.0
30.0
35.0
40.0
45.0
Jan-
14
Jan-
15
Jan-1
6
Jan-
17
Jan-1
8
Jan-
19
(x)
Forward P/E
Avg
+1 S.D.
-1 S.D.
+2 S.D.
-2 S.D.
37.99 39.28 42.03
38.28
28.11 28.54
22.73 23.61 20.80
25.93
16.26 14.52
31.97
28.34
31.64 31.40
23.20 21.76
0.00
5.00
10.00
15.00
20.00
25.00
30.00
35.00
40.00
45.00
2014 2015 2016 2017 2018 2019 YTD
(x) max min avg

Company Report
See the last page for disclaimer Page 8 of 10
[
T
a
b
l
e
_
R
i
g
h
t
M
a
r
1
]
31 December 2019
[
T
a
b
l
e
_
R
i
g
h
t
M
a
r
2
]
Baidu
百度
(BIDU US)
[Table_PageHeader]
Baidu (BIDU US)
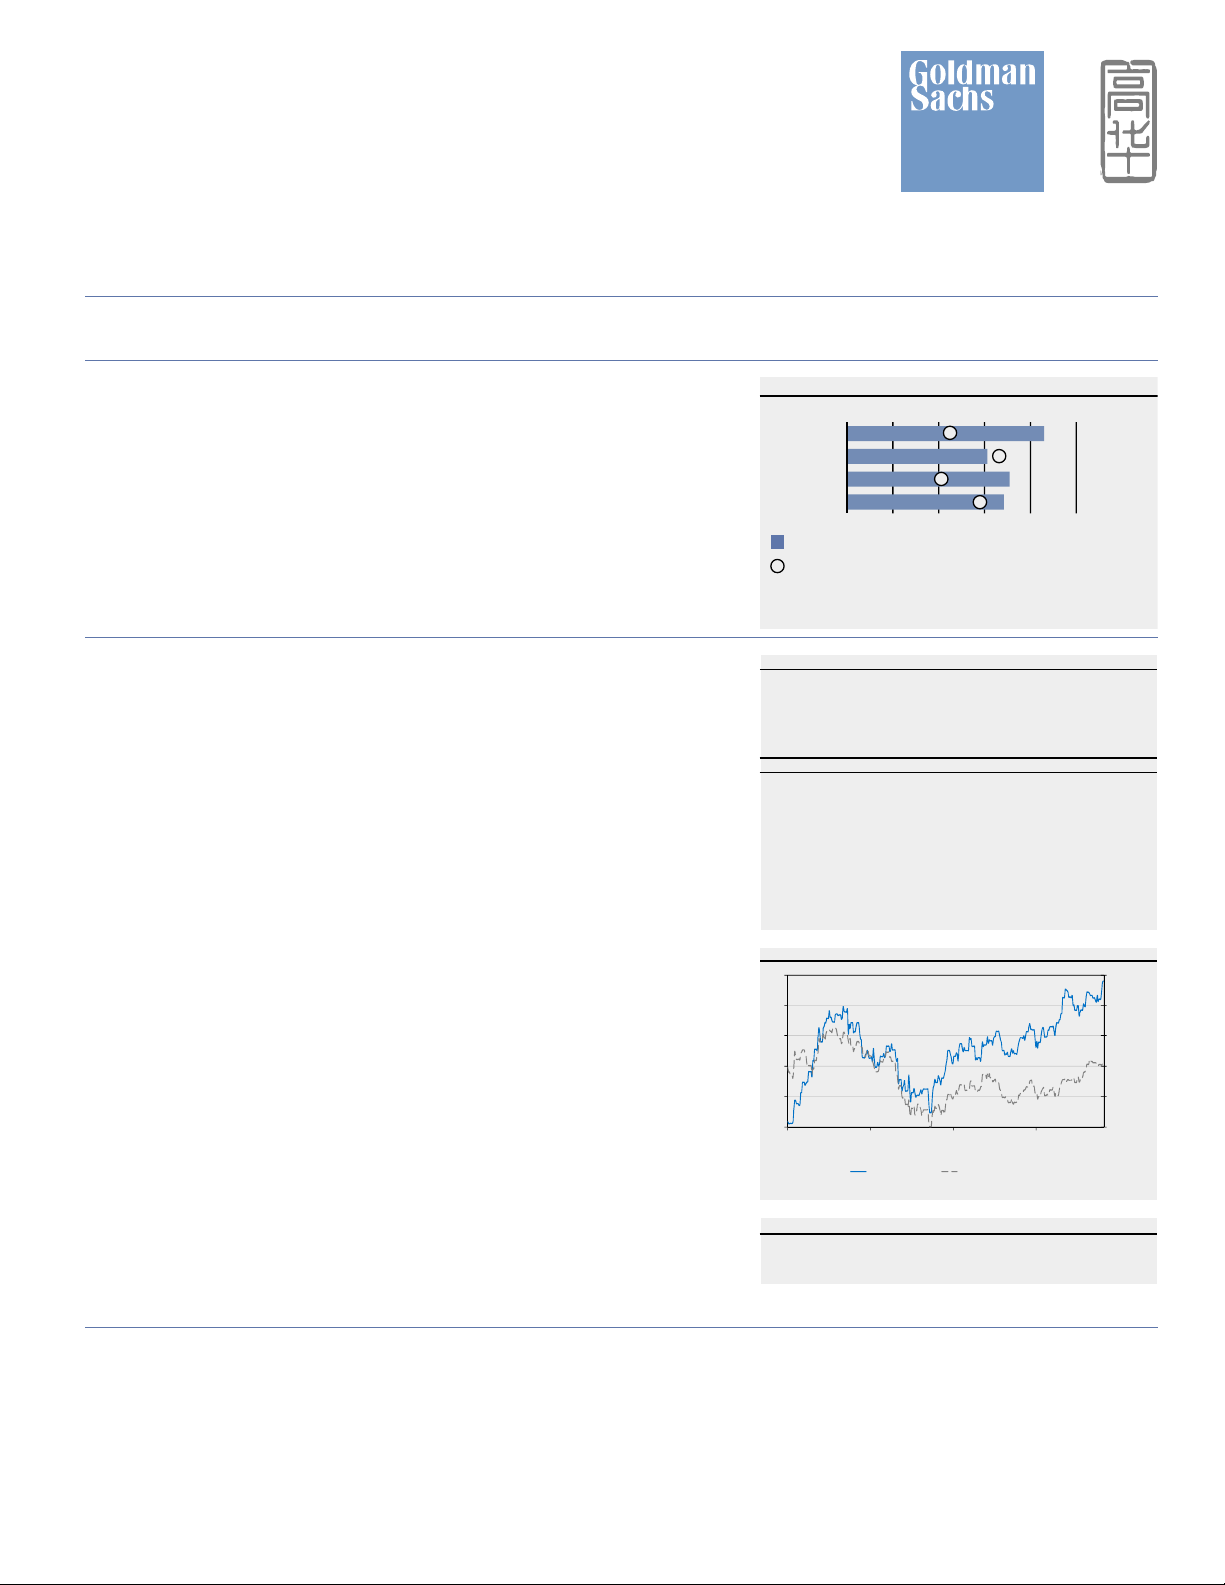
Table-4: Peers Comparison
PER (x)
PBR (x)
P/S
PEG
Market Cap
Company
Ticker
Currency
Price
19F
20F
21F
19F
20F
21F
19F
19F-21F
Local currency
(million)
US Online Game Companies
Changyou
CYOU US
USD
9.750
4.2
4.8
5.1
1.1
0.9
0.8
1.1
(0.4)
519
Electronic Arts Inc
EA US
USD
106.930
31.8
22.9
22.0
6.0
4.6
3.9
6.2
2.6
31,221
Activision Blizzard Inc
ATVI US
USD
58.880
26.7
23.6
20.6
3.5
3.2
2.9
7.1
1.9
45,235
Netease
NTES US
USD
303.590
19.1
18.7
17.1
4.4
4.0
3.4
4.2
3.4
38,848
Simple Average
20.4
17.5
16.2
3.7
3.2
2.8
4.7
1.9
Weighted Average
25.4
21.7
19.7
4.5
3.8
3.3
5.9
2.6
HK Online Game Companies
China Literature Ltd
772 HK
HKD
32.500
29.1
23.9
20.5
1.5
1.5
1.4
4.2
1.5
32,901
Kingsoft Corp Ltd
3888 HK
HKD
20.200
n.a.
73.2
42.1
2.0
1.9
1.8
3.2
n.a.
27,729
Forgame Holdings Ltd
484 HK
HKD
3.500
n.a.
n.a.
n.a.
n.a.
n.a.
n.a.
n.a.
n.a.
558
Linekong Interactive Group C
8267 HK
HKD
0.700
n.a.
n.a.
n.a.
n.a.
n.a.
n.a.
n.a.
n.a.
258
Idreamsky Technology Holding
1119 HK
HKD
4.480
9.6
7.2
6.4
1.6
1.3
n.a.
1.6
0.4
5,688
Tencent
700 HK
HKD
375.600
34.0
28.3
23.4
7.7
6.1
4.9
8.6
1.7
3,587,873
Boyaa Interactive Int.
434 HK
HKD
1.090
n.a.
n.a.
n.a.
n.a.
n.a.
n.a.
n.a.
n.a.
787
Fingertango Inc
6860 HK
HKD
0.640
n.a.
n.a.
n.a.
n.a.
n.a.
n.a.
n.a.
n.a.
1,236
Leyou Technologies Holdings
1089 HK
HKD
2.330
n.a.
n.a.
n.a.
n.a.
n.a.
n.a.
n.a.
n.a.
7,180
Fire Rock Holdings Ltd
8345 HK
HKD
4.300
n.a.
n.a.
n.a.
n.a.
n.a.
n.a.
n.a.
n.a.
1,376
Digital Hollywood Interactiv
2022 HK
HKD
0.125
n.a.
n.a.
n.a.
n.a.
n.a.
n.a.
n.a.
n.a.
250
Ourgame International Holdin
6899 HK
HKD
0.380
n.a.
n.a.
n.a.
n.a.
n.a.
n.a.
n.a.
n.a.
415
Baioo Family Interactive Ltd
2100 HK
HKD
0.790
11.1
3.7
3.6
1.2
1.0
0.9
2.7
0.1
2,189
Feiyu Technology Internation
1022 HK
HKD
0.175
n.a.
n.a.
n.a.
n.a.
n.a.
n.a.
n.a.
n.a.
271
Friendtimes Inc
6820 HK
HKD
0.990
n.a.
n.a.
n.a.
n.a.
n.a.
n.a.
n.a.
n.a.
2,172
IGG
799 HK
HKD
5.750
6.3
5.9
5.4
2.5
2.0
1.6
1.3
0.8
7,176
Zengame Technology Holding
2660 HK
HKD
0.730
n.a.
n.a.
n.a.
n.a.
n.a.
n.a.
n.a.
n.a.
746
Cmge Technology Group Ltd
302 HK
HKD
3.110
n.a.
8.0
7.2
1.9
1.6
1.4
1.9
n.a.
7,247
Netdragon
777 HK
HKD
18.320
11.0
9.2
8.4
1.6
1.4
1.2
1.5
0.8
9,720
Simple Average
16.9
19.9
14.6
2.5
2.1
1.9
3.0
0.8
Weighted Average
33.8
28.4
23.4
7.5
6.0
4.8
8.5
1.7
Advertising Companies
Momo Inc-Spon Adr
MOMO US
USD
34.040
12.1
10.1
8.8
4.1
1.9
1.4
2.9
0.7
7,058
Bilibili Inc-Sponsored Adr
BILI US
USD
18.450
n.a.
n.a.
107.9
5.7
6.5
6.5
6.2
n.a.
6,017
Sohu.Com Inc
SOHU US
USD
10.620
n.a.
n.a.
n.a.
0.9
1.2
1.7
0.2
n.a.
417
Weibo
WB US
USD
46.340
16.9
16.0
14.1
4.4
3.6
2.9
5.9
1.8
10,428
Bitauto
BITA US
USD
14.740
14.8
8.1
7.8
0.6
0.6
0.5
0.7
0.4
1,034
Cheetah Mobile
CMCM US
USD
3.700
6.5
17.8
8.6
0.6
0.6
0.6
0.9
(0.5)
530
58.com
WUBA US
USD
65.770
17.3
19.9
18.3
2.4
2.5
2.3
4.4
(6.2)
9,834
Soufun
SFUN US
USD
2.830
n.a.
2.7
n.a.
n.a.
n.a.
n.a.
n.a.
n.a.
254
Phoenix New Media
FENG US
USD
1.970
n.a.
n.a.
109.4
0.3
0.2
0.2
0.6
n.a.
143
Twitter Inc
TWTR US
USD
32.030
37.0
34.3
28.7
3.0
2.8
2.6
7.2
2.7
24,867
Sina
SINA US
USD
37.190
13.2
13.3
10.7
0.9
0.7
0.6
1.2
1.2
2,580
Facebook
FB US
USD
204.410
22.9
20.0
17.2
5.8
4.6
3.7
8.3
1.5
582,926
Simple Average
17.6
15.8
33.2
2.6
2.3
2.1
3.5
0.2
Weighted Average
23.0
20.4
18.4
5.6
4.5
3.6
8.0
1.4
E-commerce Companies
Pinduoduo Inc-Adr
PDD US
USD
38.150
n.a.
561.0
52.5
21.8
21.8
16.0
10.2
n.a.
44,344
Alibaba*
BABA US
USD
212.910
39.9
29.2
24.3
7.5
5.9
4.9
8.4
1.4
571,179
VIPSHOP
VIPS US
USD
14.470
15.5
12.4
11.5
3.1
2.5
2.1
0.7
1.0
9,680
EBay
EBAY US
USD
35.795
12.9
12.3
11.0
10.5
10.3
8.6
2.7
1.6
29,120
JD.com
JD US
USD
35.400
35.9
25.9
19.5
4.8
4.0
3.3
0.6
1.0
51,690
AMAZON
MZN US
USD
1846.890
57.3
47.4
32.6
14.3
11.0
8.3
3.3
1.8
915,683
Simple Average
32.3
114.7
25.2
10.3
9.2
7.2
4.3
1.3
Weighted Average
49.2
53.5
29.3
11.7
9.2
7.1
5.2
1.6
Search Engine Companies
Sogou Inc-Adr
SOGO US
USD
4.610
19.7
16.2
13.0
1.7
1.5
1.4
1.6
0.9
1,831
Alphabet Inc-ClA
GOOGL US
USD
1339.710
25.2
22.2
19.2
4.6
3.8
3.2
6.9
1.7
922,672
Baidu Inc - Spon Adr
BIDU US
USD
126.290
22.9
18.4
14.1
2.0
1.8
1.6
2.9
0.8
43,759
Simple Average
22.6
18.9
15.4
2.7
2.4
2.0
3.8
1.1
Weighted Average
25.1
22.0
19.0
4.4
3.7
3.1
6.7
1.7
Overall Average
22.0
37.4
21.0
4.4
3.8
3.2
3.8
1.1
Overall Weighted Average
31.5
29.3
22.0
6.8
5.5
4.4
6.8
1.8
Source: Bloomberg.
Notes: * represents figures of FY19/FY20/FY21

Company Report
See the last page for disclaimer Page 9 of 10
[
T
a
b
l
e
_
R
i
g
h
t
M
a
r
1
]
31 December 2019
[
T
a
b
l
e
_
R
i
g
h
t
M
a
r
2
]
Baidu
百度
(BIDU US)
[Table_PageHeader]
Baidu (BIDU US)
Financial Statements and Ratios
[Table_IncomeStatement]
Income Statement
Year end 31 Dec (RMB m)
2017A
2018A
2019F
2020F
2021F
Online marketing services
73,146
81,912
77,923
85,216
96,893
Other services
11,663
20,365
29,025
35,178
45,381
Total Revenue
84,809
102,277
106,948
120,394
142,274
Cost of revenue
(43,062)
(51,744)
(64,685)
(71,202)
(82,792)
Gross profit
41,747
50,533
42,263
49,192
59,481
SG&A
(13,128)
(19,231)
(20,501)
(19,729)
(22,719)
R&D
(12,928)
(15,772)
(18,251)
(19,509)
(21,288)
Operating profit
15,691
15,530
3,511
9,954
15,475
Interest income, net
1,539
2,568
2,775
3,146
3,652
FX loss, net
(482)
(122)
(207)
(224)
(242)
Other income, net
5,592
11,795
(5,989)
7,943
9,486
Loss from investment
(63)
(79)
(960)
(998)
(1,038)
Profit Before Tax
21,283
27,325
(2,478)
17,897
24,960
Income Tax
(2,995)
(4,743)
(396)
(2,864)
(4,044)
Profit After Tax
18,288
22,582
(2,874)
15,034
20,917
Non-controlling Interest
13
4,991
4,909
2,706
3,138
Shareholders' Profit / Loss
18,301
27,573
2,035
17,740
24,054
Basic EPS
52.751
78.636
5.848
50.905
68.828
Non-GAAP Shareholder's Profit
17,244
23,324
14,574
16,956
24,398
Non-GAAP EPADS
49.659
66.834
41.881
48.656
69.812
[Table_CashFlowStatement]
Cash Flow Statement
Year end 31 Dec (RMB m)
2017A
2018A
2019F
2020F
2021F
Profit After Tax
18,288
22,582
(2,874)
15,034
20,917
D&A
11,748
16,187
17,527
19,323
21,424
Deferred income tax, net
(756)
(761)
185
(269)
(438)
Share-based compensation
3,244
4,676
5,323
4,935
5,039
Gain on investments
(3,244)
(7,648)
6,162
(4,883)
(5,771)
Changes of working capital
6,271
1,344
7,086
2,962
8,464
Others
(2,975)
(2,350)
2,883
3,116
3,329
Cash from Operating Activities
32,576
34,030
36,292
40,218
52,966
Investing activities
CAPEX
(4,779)
(8,772)
(10,267)
(11,558)
(13,658)
Changes of short-term investments
(17,681)
(22,888)
(16,401)
(18,723)
(16,663)
Changes of long-term investments
(12,467)
(7,320)
8,045
(3,620)
(3,801)
Changes of micro loans
(23,522)
2,239
0
0
0
Changes of other investments
(10,250)
8,587
0
0
0
Acquisition of intangible assets
(9,122)
(13,501)
(19,765)
(12,237)
(23,138)
Others
872
7,195
(844)
(1,114)
(1,284)
Cash from Investing Activities
(76,949)
(34,460)
(39,231)
(47,252)
(58,544)
Financing activities
Changes of loans
(3,106)
3,802
1,735
2,004
2,571
Change of financial products
31,480
(21,279)
0
0
0
Change of debts
13,415
16,239
10,688
5,382
9,572
Proceeds of exercise of share options
453
676
710
745
783
Issurance of a subsidiary's Shares
4,046
15,689
4,231
4,763
5,628
Others
(1,731)
(45)
(6,205)
0
0
Cash from Financing Activities
44,557
15,082
11,159
12,894
18,554
Net Changes in Cash
184
14,652
8,220
5,860
12,975
Cash at Beg of Year
11,216
11,084
27,638
37,189
43,981
FX change
(316)
1,902
1,331
932
652
Cash at End of Year
11,084
27,638
37,189
43,981
57,608
Restricted cash
252
2,189
2,747
3,092
3,398
Cash and restricted cash end of the year
11,336
29,827
39,936
47,073
61,006
Source: the Company, Guotai Junan International.
[Table_BalanceSheet]
Balance Sheet
Year end 31 Dec (RMB m)
2017A
2018A
2019F
2020F
2021F
Fixed assets, net
12,475
17,903
20,735
23,947
27,543
Intangible assets, net
5,467
9,181
8,880
9,344
9,877
Investments, net
56,283
80,454
72,409
76,029
79,830
Deferred tax assets, net
1,532
2,324
2,139
2,408
2,845
Other non-current assets
24,802
32,610
39,998
42,969
47,568
Total Non-current Assets
100,559
142,472
144,161
154,697
167,663
Short-term investments
89,381
111,626
122,560
131,070
139,402
Account Receivable
4,571
6,015
6,684
7,344
7,825
Prepaid expenses
3,425
6,841
10,160
11,437
13,089
Cash & Cash Equivalents
11,084
27,638
37,189
43,981
57,608
Others
42,708
2,974
4,351
5,259
6,101
Total Current Assets
151,169
155,094
180,944
199,092
224,026
Total Assets
251,728
297,566
325,105
353,789
391,689
Accrued expenses & other liabilities
66,009
35,381
41,375
44,176
50,720
Customers' advances & deposits
6,785
7,338
10,695
12,039
14,227
Short-term loans payable
1,254
3,130
4,102
4,618
5,457
Notes payable, current proportion
6,500
6,871
7,730
8,509
9,894
Others
1,509
4,133
6,263
5,363
4,755
Total Current Liabilities
82,057
56,853
70,165
74,706
85,053
Notes payable
29,111
42,735
53,423
58,805
68,378
Long-term loans
6,701
7,456
8,574
10,118
11,939
Deferred tax liability, non-current
3,375
4,099
4,222
4,349
4,479
Others
11,134
11,387
1,237
1,218
326
Total Non-current Liabilities
50,321
65,677
67,457
74,490
85,122
Total Liabilities
132,378
122,530
137,621
149,196
170,175
Total Shareholders' Equity
115,346
162,897
171,439
185,669
208,707
Minority Interest
4,004
12,139
16,045
18,924
12,806
Total Equity
119,350
175,036
187,484
204,593
221,514
[Table_FinancialRatio]
Financial Ratios
2017A
2018A
2019F
2020F
2021F
Gross margin (%)
49.2
49.4
39.5
40.9
41.8
Operating margin (%)
18.5
15.2
3.3
8.3
10.9
Net margin (%)
21.6
27.0
1.9
14.7
16.9
ROE (%)
17.6
19.8
1.2
9.9
12.2
ROA (%)
7.5
6.8
2.7
4.2
5.2
Net gearing (%)
21.8
14.7
15.4
14.4
12.7
Debt/equity ratio (%)
32.1
32.7
38.6
39.6
41.1

Company Report
See the last page for disclaimer Page 10 of 10
[
T
a
b
l
e
_
R
i
g
h
t
M
a
r
1
]
31 December 2019
[
T
a
b
l
e
_
R
i
g
h
t
M
a
r
2
]
Baidu
百度
(BIDU US)
[Table_PageHeader]
Baidu (BIDU US)
[Table_CompanyRatingDefinition]
Company Rating Definition
The Benchmark:
NASDAQ Composite Index
Time Horizon: 6 to 18 months
Rating
Definition
Buy
买入
Relative Performance>15%;
or the fundamental outlook of the company or sector is favorable.
Accumulate
收集
Relative Performance is 5% to 15%;
or the fundamental outlook of the company or sector is favorable.
Neutral
中性
Relative Performance is -5% to 5%;
or the fundamental outlook of the company or sector is neutral.
Reduce
减持
Relative Performance is -5% to -15%;
or the fundamental outlook of the company or sector is unfavorable.
Sell
卖出
Relative Performance <-15%;
or the fundamental outlook of the company or sector is unfavorable.
[Table_IndustryRatingDefinition]
Sector Rating Definition
The Benchmark:
NASDAQ Composite Index
Time Horizon: 6 to 18 months
Rating
Definition
Outperform
跑赢大市
Relative Performance>5%;
or the fundamental outlook of the sector is favorable.
Neutral
中性
Relative Performance is -5% to 5%;
or the fundamental outlook of the sector is neutral.
Underperform
跑输大市
Relative Performance<-5%;
Or the fundamental outlook of the sector is unfavorable.
[Table_DISCLOSUREOFINTERESTS]
DISCLOSURE OF INTERESTS
(1) The Analysts and their associates do not serve as an officer of the issuer mentioned in this Research Report.
(2) The Analysts and their associates do not have any financial interests in relation to the issuer mentioned in this Research Report.
(3) Except for KAISA GROUP (01638 HK),GUOTAI JUNAN I (01788 HK),JXR (01951 HK),CHINA MINSHENG BANKING CORP.- H
SHARES (01988 HK),BANK OF GANSU (02139 HK),JINSHANG BANK (02558 HK),ZHONGLIANG HLDG (02772 HK),BINHAI
INVESTMENT (02886 HK),HAITIAN ANTENNA (08227 HK),Guotai Junan and its group companies do not hold equal to or more than 1%
of the market capitalization of the issuer mentioned in this Research Report.
(4) Guotai Junan and its group companies have not had investment banking relationships with the issuer mentioned in this Research Report
within the preceding 12 months.
(5) Guotai Junan and its group companies are not making a market in the securities in respect of the issuer mentioned in this Research
Report.
(6) Guotai Junan and its group companies have not employed an individual serving as an officer of the issuer mentioned in this Research
Report. There is no officer of the issuer mentioned in this Research Report associated with Guotai Junan and its group companies.
DISCLAIMER
This Research Report does not constitute an invitation or offer to acquire, purchase or subscribe for securities by Guotai Junan Securities
(Hong Kong) Limited ("Guotai Junan"). Guotai Junan and its group companies may do business that relates to companies covered in research
reports, including investment banking, investment services, etc. (for example, the placing agent, lead manager, sponsor, underwriter or invest
proprietarily).
Any opinions expressed in this report may differ or be contrary to opinions or investment strategies expressed orally or in written form by sales
persons, dealers and other professional executives of Guotai Junan group of companies. Any opinions expressed in this report may differ or be
contrary to opinions or investment decisions made by the asset management and investment banking groups of Guotai Junan.
Though best effort has been made to ensure the accuracy of the information and data contained in this Research Report, Guotai Junan does
not guarantee the accuracy and completeness of the information and data herein. This Research Report may contain some forward-looking
estimates and forecasts derived from the assumptions of the future political and economic conditions with inherently unpredictable and
mutable situation, so uncertainty may contain. Investors should understand and comprehend the investment objectives and its related risks,
and where necessary consult their own financial advisers prior to any investment decision.
This Research Report is not directed at, or intended for distribution to or use by, any person or entity who is a citizen or resident of or located in
any jurisdiction where such distribution, publication, availability or use would be contrary to applicable law or regulation or which would subject
Guotai Junan and its group companies to any registration or licensing requirement within such jurisdiction.
© 2019 Guotai Junan Securities (Hong Kong) Limited. All Rights Reserved.
27/F., Low Block, Grand Millennium Plaza, 181 Queen’s Road Central, Hong Kong.
Tel.: (852) 2509-9118 Fax: (852) 2509-7793
Website: www.gtja.com.hk