Global Energy Transition Trends PDF Free Download
1 / 24/24
100%

Global Energy
Transition Trends
Green Energy Export Day 2025,
Copenhagen
Oliver Metcalfe
August 27, 2025

1Global Trends in Clean Power
BNEF coverage

2Global Trends in Clean Power
Source: Getty Images.

3Global Trends in Clean Power
1. Investment and deployment
“Different directions”

4Global Trends in Clean Power
Source: BloombergNEF. Note: Start years differ by sector but all sectors are present from 2020 onward. Most notably, nuclear figures start in 2015 and power grids in
2020. CCS refers to carbon capture and storage.
Global investment in energy transition, by sector
Global energy transition investment
exceeded $2 trillion for the first time
33 51 80 108 135 152 231 285 260 238 341 383 426 456 518 576
929
1,177
1,517
1,881
2,083
0
200
400
600
800
1,000
1,200
1,400
1,600
1,800
2,000
2,200
2004
2005
2006
2007
2008
2009
2010
2011
2012
2013
2014
2015
2016
2017
2018
2019
2020
2021
2022
2023
2024
$ billion
Power grids
Clean industry
Electrified heat
Clean shipping
Electrified transport
Hydrogen
CCS
Nuclear
Energy storage
Renewable energy
Clean
energy
Transport
Buildings
Industry
Grids
AMER +7%
EMEA -1.7%
APAC +21%
Global Change +10.7%

5Global Trends in Clean Power
Source: BloombergNEF. Note: CCS refers to carbon capture and storage.
Energy transition investment trends: “mature” sectors Energy transition investment trends: “emerging” sectors
Energy transition investment trends
diverged by sector maturity
815
1,043
1,357
1,683
1,929
0
200
400
600
800
1,000
1,200
1,400
1,600
1,800
2,000
2,200
2020 2021 2022 2023 2024
$ billion
Power
grids
Electrified
transport
Energy
storage
Renewable
energy
+14.7%
93% of total investment
114
134
160
199
154
0
100
200
300
2020 2021 2022 2023 2024
$ billion
Clean
industry
Electrified
heat
Clean
shipping
Hydrogen
CCS
Nuclear
-23%
7% of total investment

6Global Trends in Clean Power
Source: BloombergNEF
Global cumulative renewable energy capacity, historic and forecast to 2035
…but still falls short of what’s needed
for a net-zero pathway
Net Zero Scenario
0
5
10
15
20
25
2010
2011
2012
2013
2014
2015
2016
2017
2018
2019
2020
2021
2022
2023
2024
2025
2026
2027
2028
2029
2030
2031
2032
2033
2034
2035
Terawatts
Other renewables Onshore wind Offshore wind Utility-scale solar Residential solar
Commercial solar Solar buffer Energy storage Pumped hydro

7Global Trends in Clean Power
Source: BloombergNEF. Note: 'Others' includes biomass and waste, small hydro and marine.
Global biannual investment in renewable energy
Onshore wind and utility-scale solar
shrink as small-scale solar grows
0
100
200
300
400
500
1H 2004
2H 2004
1H 2005
2H 2005
1H 2006
2H 2006
1H 2007
2H 2007
1H 2008
2H 2008
1H 2009
2H 2009
1H 2010
2H 2010
1H 2011
2H 2011
1H 2012
2H 2012
1H 2013
2H 2013
1H 2014
2H 2014
1H 2015
2H 2015
1H 2016
2H 2016
1H 2017
2H 2017
1H 2018
2H 2018
1H 2019
2H 2019
1H 2020
2H 2020
1H 2021
2H 2021
1H 2022
2H 2022
1H 2023
2H 2023
1H 2024
2H 2024
1H 2025
$ billion
Solar Wind Co-located Biofuels Geothermal Others

8Global Trends in Clean Power
Source: BloombergNEF. Note: 'Others' includes biomass and waste, small hydro and marine.
Global biannual investment in renewable energy
Onshore wind and utility-scale solar
shrink as small-scale solar grows
0
100
200
300
400
500
1H 2004
2H 2004
1H 2005
2H 2005
1H 2006
2H 2006
1H 2007
2H 2007
1H 2008
2H 2008
1H 2009
2H 2009
1H 2010
2H 2010
1H 2011
2H 2011
1H 2012
2H 2012
1H 2013
2H 2013
1H 2014
2H 2014
1H 2015
2H 2015
1H 2016
2H 2016
1H 2017
2H 2017
1H 2018
2H 2018
1H 2019
2H 2019
1H 2020
2H 2020
1H 2021
2H 2021
1H 2022
2H 2022
1H 2023
2H 2023
1H 2024
2H 2024
1H 2025
$ billion
Small-scale solar Utility-scale solar Onshore wind Offshore wind Co-located Biofuels Geothermal Others

9Global Trends in Clean Power
Source: BloombergNEF, PV Infolink. Note: Values shown for a market without major trade barriers, such as Europe, mainland China and Latin America. Modules are
bifacial TOPCon modules. W(DC) is watts (direct current).
Capex benchmark for medium-sized fixed-axis utility-scale PV projects, historical and forecast
Solar module prices fall to record-low
of 9.2 US cents per watt
2.44 1.85
1.22 1.00 0.88 0.84 0.55 0.48 0.34 0.30 0.28 0.28 0.20 0.16 0.10 0.09
4.34
3.57
2.33 2.10 1.91 1.85
1.44 1.31 1.09 1.03 0.81 0.73 0.64 0.62 0.52 0.50
2010 2011 2012 2013 2014 2015 2016 2017 2018 2019 2020 2021 2022 2023 2024 2025
Module Balance of plant and inverter Engineering, procurement and construction Other
2023 $/W(DC)

10 Global Trends in Clean Power
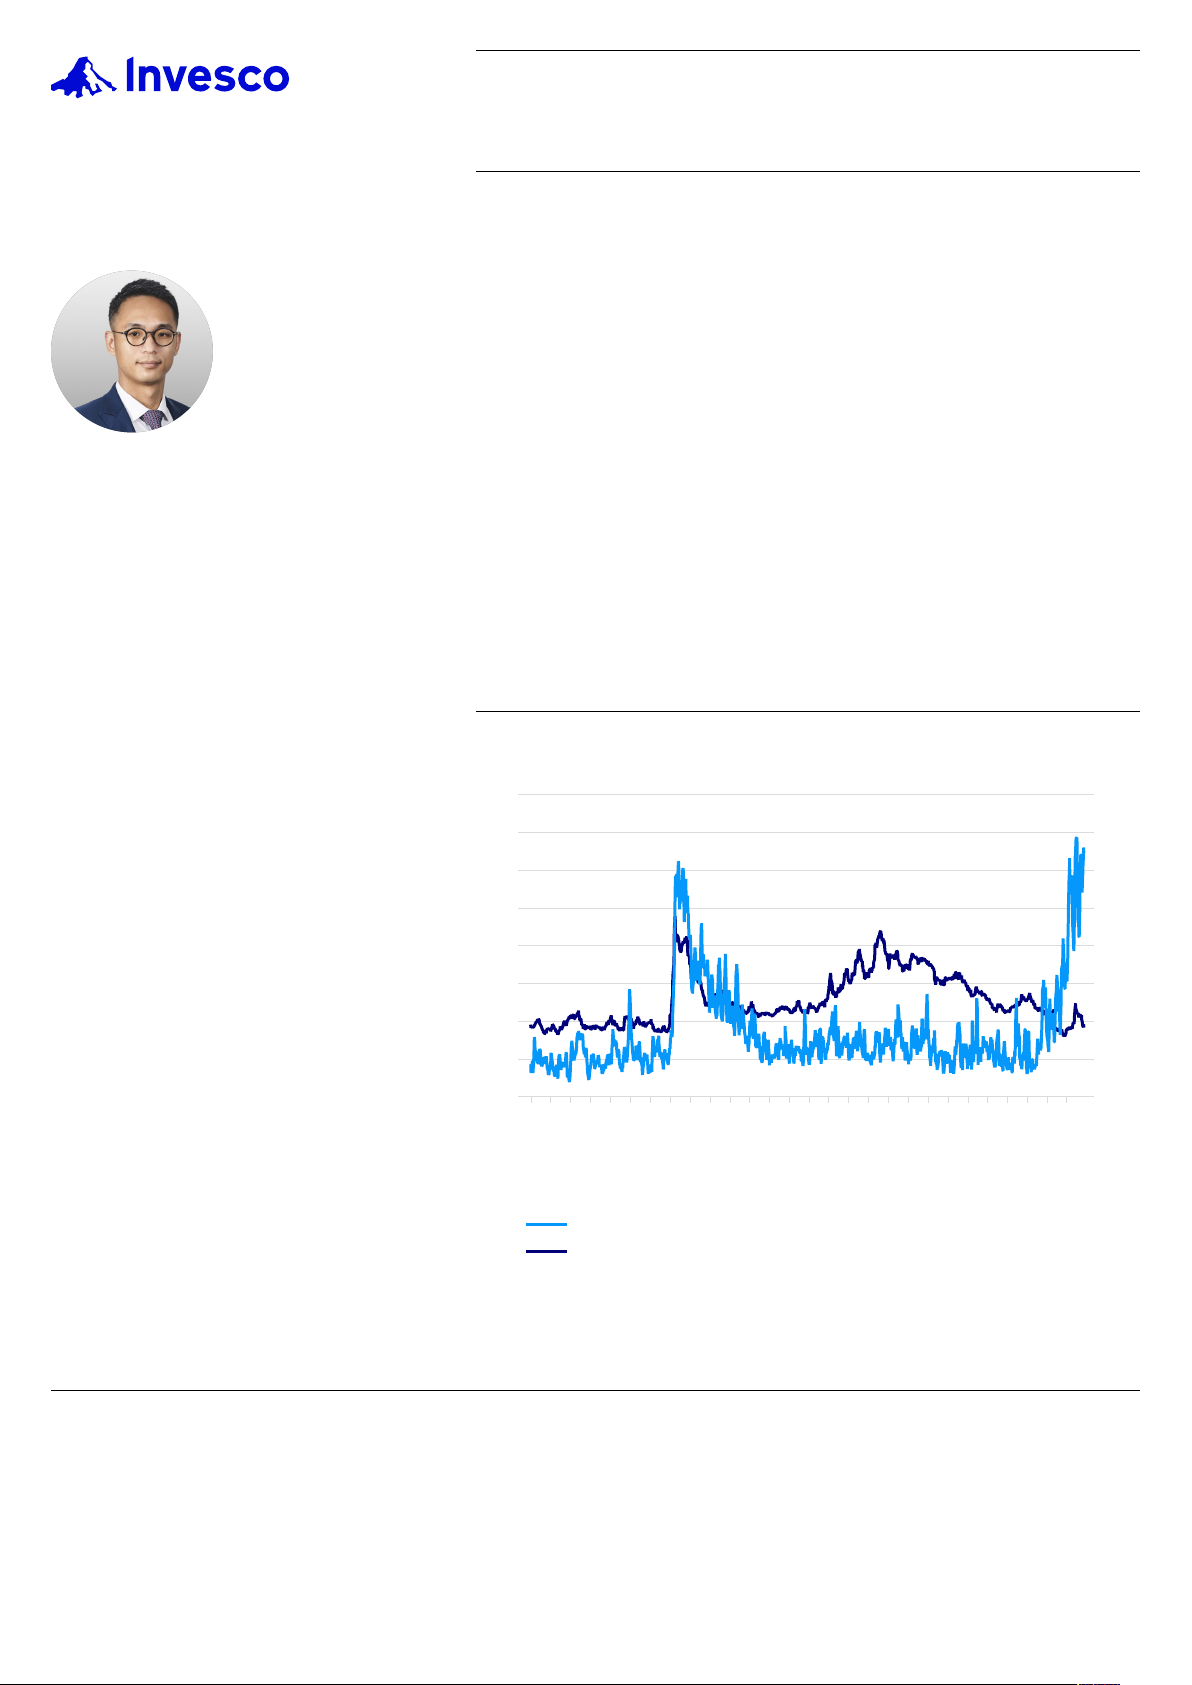
Source: BloombergNEF. Note: LCOE is levelized cost of electricity. Offshore wind includes offshore transmission costs. The global benchmarks are capacity-
weighted averages. LCOEs do not include subsidies or tax-credits. MWh is megawatt-hour.
Impact of mainland China on global wind LCOE benchmarks
Wind cost divide has widened between
mainland China market and rest of world
38
87 87
57
89
121
44
30
86
59
2021 2022 2023 2024
$/MWh (nominal)
Global benchmark Rest of World China benchmark
Mainland China benchmark

11 Global Trends in Clean Power
Source: BloombergNEF. Note: CCS refers to carbon capture and storage.
Energy transition investment trends: “mature” sectors Energy transition investment trends: “emerging” sectors
Energy transition investment trends
diverged by sector maturity
815
1,043
1,357
1,683
1,929
0
200
400
600
800
1,000
1,200
1,400
1,600
1,800
2,000
2,200
2020 2021 2022 2023 2024
$ billion
Power
grids
Electrified
transport
Energy
storage
Renewable
energy
+14.7%
93% of total investment
114
134
160
199
154
0
100
200
300
2020 2021 2022 2023 2024
$ billion
Clean
industry
Electrified
heat
Clean
shipping
Hydrogen
CCS
Nuclear
-23%
7% of total investment

12 Global Trends in Clean Power
Finding a buyer willing to sign a binding
offtake agreement is even harder
Source: BloombergNEF. Note: Data as of October 31, 2024. BNEF’s Hydrogen Offtake Agreement Database only includes projects of over 20 megawatts or 2,800
metric tons/year of capacity. Pre-contractual agreements include term sheets, letters of intent (LOI), and heads of agreements.
Clean H2 offtake by agreement type
Offtaker identified, 6%
Offtaker not identified, 94%
12%
21%
16%
30%
21%
0%
20%
40%
60%
80%
100%
All announced supply Capacity with offtaker identified
Share of total capacity, share of offtake capacity
Unspecified
Memorandum of understanding
Pre-contractual agreement
Self consumption
Binding offtake
13 Global Trends in Clean Power
2. Data centers
“Ramping up
demand”

14 Global Trends in Clean Power
Source: BloombergNEF. Note: Data-center demand refers to total energy demand. BNEF’s Economic Transition Scenario combines near-term market analysis, least-
cost modeling, consumer adoption trends, and historical patterns to project how commercially available technologies are likely to scale. It assumes no new policy
interventions and is designed to reveal the economic fundamentals driving the energy transition.
Data centers will add as much power
demand as EVs in the coming decade
Average hourly US data-center electricity demand
0
50
100
150
200
250
300
350
400
2024 2025 2026 2027 2028 2029 2030 2031 2032 2033 2034 2035
Terawatt-hours
Data centers
Electric vehicles
Industry

15 Global Trends in Clean Power
Source: BloombergNEF, Lawrence Berkeley National Lab (LBNL) , International Energy Agency (IEA) 2024 , Boston Consulting Group (BCG) , Electric Power
Research Institute (EPRI) , Jefferies, Goldman Sachs, McKinsey, S&P, IEA 2025. Note: The data underlying the above forecasts include both published figures and
BloombergNEF estimates, derived from visuals in third-party reports using chart extraction software and data interpolation methods. All sources are cited and linked
in the report. Derived estimates represent the independent interpretation of BloombergNEF and do not imply endorsement by the original data providers.
BNEF’s estimates are less bullish than
some others
Comparison of US data-center energy demand forecasts
0
100
200
300
400
500
600
700
800
900
1,000
1,100
2014 2016 2018 2020 2022 2024 2026 2028 2030
TWh BCG
S&P
McKinsey
Jeffries
IEA 2025
LBNL historical
LBNL high
LBNL low
IEA
Goldman Sachs
EPRI historical
EPRI higher
EPRI high
EPRI moderate
EPRI low
BNEF
16 Global Trends in Clean Power
3. Tariffs
“Reshoring, rewiring,
and bewildering”

17 Global Trends in Clean Power
Source: BloombergNEF, Bloomberg, The Wall Street Journal, The New York Times, The Economist, The Guardian
Tariff uncertainty

18 Global Trends in Clean Power
Source: BloombergNEF. Note: Includes factory investment across the manufacture of solar (polysilicon, wafers, cells and modules), batteries (separators,
electrolytes, cathodes, anodes and cells), wind turbines (nacelles only), and hydrogen electrolyzer manufacturing (stack assembly only). Manufacturing capacity has
been risk-adjusted to account for the likelihood of completion and factory ramp up according to such factors as factory location, manufacturer experience, and
capacity of the plant. ‘Other’ refers to rest of world, and ‘Other East Asia’ comprises Taiwan, Japan and South Korea.
Clean-tech factory investment growing
outside mainland China
Clean-tech factory investment by geography
12
21 25
43
59
125
102
126
108
95
0
20
40
60
80
100
120
140
2018 2019 2020 2021 2022 2023 2024 2025e 2026e 2027e
$ billion
Mainland China
US
Europe
India
Southeast Asia
Other East Asia
Other
Risk-adjusted outlook

19 Global Trends in Clean Power
Source: BloombergNEF. Note: Includes factory investment across the manufacture of solar (polysilicon, wafers, cells and modules), batteries (separators,
electrolytes, cathodes, anodes and cells), wind turbines (nacelles only), and hydrogen electrolyzer manufacturing (stack assembly only). Manufacturing capacity has
been risk-adjusted to account for the likelihood of completion and factory ramp-up according to such factors as factory location, manufacturer experience, and
capacity of the plant.
Batteries dominate factory investment
Global clean-tech factory investment by technology
12
21 25
43
59
125
102
126
108
95
0
20
40
60
80
100
120
140
2018 2019 2020 2021 2022 2023 2024 2025e 2026e 2027e
$ billion
Hydrogen
Wind
Solar
Batteries
Risk-adjusted outlook

20 Global Trends in Clean Power
China’s clean-tech exports increasingly
heading to low-to-mid income countries
Source: BloombergNEF, Sinoimex. Note: Income country group classification by the World Bank according to gross national income per capita for 2024.
Chinese clean-tech exports by value, technology and income group of destination country
0% 10% 20% 30% 40% 50% 60% 70% 80% 90% 100%
2024
2022
2024
2022
2024
2022
2024
2022
2024
2022
Wind
turbines
Solar
modules
Plug-in
hybrids
Electric
vehicles
Lithium-
ion
batteries
Low-to-upper-middle income High income
Lithium-ion batteries
Electric vehicles
Plug-in hybrid vehicles
Solar modules
Wind turbines
21 Global Trends in Clean Power
Source: Getty Images.
22 Global Trends in Clean Power
Copyright
© Bloomberg Finance L.P. 2025. This publication is the copyright of Bloomberg Finance L.P. in connection with BloombergNEF. No portion of this document may be
photocopied, reproduced, scanned into an electronic system or transmitted, forwarded or distributed in any way without prior consent of BloombergNEF.
Disclaimer
The BloombergNEF ("BNEF"), service/information is derived from selected public sources. Bloomberg Finance L.P. and its affiliates, in providing the
service/information, believe that the information it uses comes from reliable sources, but do not guarantee the accuracy or completeness of this information, which is
subject to change without notice, and nothing in this document shall be construed as such a guarantee. The statements in this service/document reflect the current
judgement of the authors of the relevant articles or features, and do not necessarily reflect the opinion of Bloomberg Finance L.P., Bloomberg L.P. or any of their
affiliates (“Bloomberg”). Bloomberg disclaims any liability arising from use of this document, its contents and/or this service. Nothing herein shall constitute or be
construed as an offering of financial instruments or as investment advice or recommendations by Bloomberg of an investment or other strategy (e.g., whether or not
to “buy”, “sell”, or “hold” an investment). The information available through this service is not based on consideration of a subscriber's individual circumstances and
should not be considered as information sufficient upon which to base an investment decision. You should determine on your own whether you agree with the
content. This service should not be construed as tax or accounting advice or as a service designed to facilitate any subscriber's compliance with its tax, accounting or
other legal obligations. Employees involved in this service may hold positions in the companies mentioned in the services/information.
The data included in these materials are for illustrative purposes only. The BLOOMBERG TERMINAL service and Bloomberg data products (the “Services”) are
owned and distributed by Bloomberg Finance L.P. (“BFLP”) except (i) in Argentina, Australia and certain jurisdictions in the Pacific islands, Bermuda, China, India,
Japan, Korea and New Zealand, where Bloomberg L.P. and its subsidiaries (“BLP”) distribute these products, and (ii) in Singapore and the jurisdictions serviced by
Bloomberg's Singapore office, where a subsidiary of BFLP distributes these products. BLP provides BFLP and its subsidiaries with global marketing and operational
support and service. Certain features, functions, products and services are available only to sophisticated investors and only where permitted. BFLP, BLP and their
affiliates do not guarantee the accuracy of prices or other information in the Services. Nothing in the Services shall constitute or be construed as an offering of
financial instruments by BFLP, BLP or their affiliates, or as investment advice or recommendations by BFLP, BLP or their affiliates of an investment strategy or
whether or not to “buy”, “sell” or “hold” an investment. Information available via the Services should not be considered as information sufficient upon which to base an
investment decision. Bloomberg makes no claims or representations, or provides any assurances, about the sustainability characteristics, profile or data points of any
underlying issuers, products or services, and users should make their own determination on such issues. The following are trademarks and service marks of BFLP, a
Delaware limited partnership, or its subsidiaries: BLOOMBERG, BLOOMBERG ANYWHERE, BLOOMBERG MARKETS, BLOOMBERG NEWS, BLOOMBERG
PROFESSIONAL, BLOOMBERG TERMINAL and BLOOMBERG.COM. Absence of any trademark or service mark from this list does not waive Bloomberg's
intellectual property rights in that name, mark or logo. All rights reserved. © 2025 Bloomberg.
Copyright and disclaimer

BloombergNEF (BNEF) is a strategic
research provider covering global commodity
markets and the disruptive technologies
driving the transition to a low-carbon
economy.
Our expert coverage assesses pathways for
the power, transport, industry, buildings and
agriculture sectors to adapt to the energy
transition.
We help commodity trading, corporate
strategy, finance and policy professionals
navigate change and generate opportunities.
<Help>
support.bnef@bloomberg.net
Client enquiries:
Bloomberg Terminal: press <Help> key twice
Email: support.bnef@bloomberg.net
Learn more:
about.bnef.com | @BloombergNEF
Oliver Metcalfe
ometcalfe@bloomberg.net