Have you tried this? Designing a smartphone application to support sustainable food purchasing PDF Free Download
1 / 219
/219
100%

/
Have you tried this?
Designing a smartphone application to support sustainable food
purchasing
Student: Arnav Mundkur
Student number: s1552236
Committee:
dr. R. Klaassen (Chair),
dr. R. A. J. De Vries,
prof.dr. D. K. J. Heylen,
dr.ir W. Eggink,
dr.ir J. A. M. Haarman
Study: Master Interaction Technology
Faculty: Electrical Engineering, Mathematics and Computer Science (EEMCS)
February 2021

/
Abstract
This thesis covers the design of a smartphone application which supports its users in making
sustainable choices while preparing their grocery lists. The Persuasive System Design model
(PSD) by Oinas-Kukkonen & Harjumaa (2009) is used as a framework to analyze 25 behavior
change systems from the domains of sustainable food consumption, food consumption and
eco-feedback applications for energy & water consumption. The PSD model is used to
categorize the system features in each of the 25 systems to identify usage trends of system
features. It was found that the effects of Normative Influence and Personal Goal-Setting were
not studied very much in the context of sustainable food consumption.
A smartphone application was designed around these two novel system features, along with
several other popular system features. The system was prototyped and tested for usability, and
then a high-fidelity prototype was developed for a field study with 11 participants. The
participants answered two questionnaires, one before the field study and one afterwards; while
a subset of 8 participants were interviewed regarding their experiences with the application. A
thematic analysis was conducted on the interview transcripts, while a statistical analysis was
conducted on the questionnaire responses. Due to the low number of participants, the findings
from the thematic analysis form the main findings of this work. Three main themes of motivation,
effort and community emerged from the thematic analysis.
The findings from the field study highlight the uniqueness of users, how a one-size-fits-all
approach to behavior change may not prove most effective, and the complications of using
Normative Influence and personal goal setting features to support behavior change. It also
highlights the importance of Personalization and Tailoring in behavior change systems, reducing
effort for and supporting agency in behavior change, and the individuality of motivation.
1
/
Table of Contents
Abstract 1
Table of Contents 2
1. Introduction 6
2. Background 9
2.1 RQ1: What are sustainable food consumption habits? 9
2.2 RQ2: How are systems - that support decision making for habit change - designed? 11
2.2.1 Sustainable Food Consumption 12
2.2.2 Food Consumption 19
2.2.3 Eco-feedback in other domains 25
2.3 Analysis of Existing Behavior Change Systems 30
2.3.1 Primary Task Support 32
2.3.2 Dialogue Support 33
2.3.3 System Credibility Support 34
2.3.3 Social Support 35
2.4 Discussion of Design of Existing Behavior Change Systems 36
2.5 Conclusion 39
3. Methodology 41
3.1 Functional Design of the System 41
3.2 Low-fidelity Prototype Development and Testing 41
3.3 Hi-Fi Prototype Development and Testing 42
4. Functional Design of the System 43
4.1 Introduction 43
4.2 Designing the System using the PSD model 44
4.2.1 Intent of the System Designer 44
4.2.2 Event of Persuasion 44
Personas 45
4.2.3 The Strategy 46
System Goals 47
Relevance of System Features to the Proposed System 48
4.3 Functional Requirements of the System 50
4.4 Individual Brainstorm 51
4.5 Evaluation of Ideated System Features 54
4.6 Scenarios 62
2
/
4.7 Preliminary System Description 63
4.7.1 Walkthrough 63
5. Low-Fidelity Prototype 65
5.1 Designing the Prototype 65
5.1.1 The Item List 68
5.1.2 Item Input Method 68
5.1.3 Progress Overview 69
Self-monitoring Metrics 70
5.1.3 Presenting Sustainable Alternatives 70
5.1.4 Goal-setting 72
5.1.5 Displaying Social Norms 73
5.2 Layout 74
5.3 Designing the Test 75
5.4 Test Protocol 77
5.5 Interview Questions 77
5.6 Test Results 78
5.6.1 Answers to Interview Questions 78
5.6.2 Observations 81
5.7 Discussion 82
5.8 Moving to the Hi-Fi Prototype 84
6. High-Fidelity Prototype 85
6.1 Developing the prototype 85
6.1.1 Design Decisions 85
6.1.2 Determining Whether a Product is Sustainable 87
6.1.3 Score 87
6.1.4 Goal-setting 88
6.1.5 Normative Influence 90
6.1.6 Making the List 93
6.1.7 The Alternatives Page 94
6.1.8 Pilot Testing 95
6.2 High-Fidelity Prototype Test 96
6.2.1 Methodology 97
6.2.2 Field Test Design 98
6.3 Data Processing Method 103
6.3.1 Statistical Methods 103
6.3.2 Thematic Analysis 104
6.4 Results 106
6.4.1 The Participants 106
3
/
6.4.2 Statistical Analysis of Questionnaire responses 108
6.4.3 Thematic Analysis of Interviews 115
Motivation 115
Self-Motivation 115
Social Comparison 116
Group Motivation 116
Feature Based Motivation 117
Ownership of Progress 118
Effort 118
Goal Setting 119
Measurement & Context 120
Community 121
Identity within Group 121
Disconnect with Group 122
Social Movement 123
6.5 Discussion 125
6.5.1 Discussion of Results from the Statistical Analysis 125
6.5.2 Discussion of the Thematic Analysis 128
6.5.3 Discussion of the General Experience with the Application 133
6.6 Answering the Research Questions 136
7. General Discussion 139
7.1 Answering the Main Research Question 139
7.2 Limitations of the Study 142
7.3 Changing Behavior Versus Changing Attitudes 146
7.4 Personalization & Tailoring 148
7.5 Meat & Culture 150
7.6 Recommendations for Future Work 154
8. Conclusion 156
9. References 158
Appendix A: List of Search Terms 168
Appendix B: Individual Brainstorm Mind-map 169
Appendix C: Lo-Fi Prototype Test Tasks 170
Appendix D: Lo-Fi Prototype Test Protocol 171
Appendix E: Lo-Fi Prototype Interview Questions 172
Appendix F: Hi-Fi Prototype Questionnaires 173
4
/
Appendix G: Hi-Fi Prototype Interview Questions 176
Appendix H: Recruitment Post 178
Appendix I: Instructions for Installation and Usage of Application 180
I.1 Instructions to Install the Application 180
I.2 Explanation of the Application 180
Appendix J: Statistical Analysis 185
Appendix K: Thematic Analysis coding 215
5
/
1. Introduction
Global Warming is no longer an unfamiliar term and the topic, as well as its effects on the
environment and ecosystems this planet hosts, has been subject to much study. The United
Nations’ International Panel on Climate Change (IPCC) publishes reports on the state of the
environment and how this affects humanity’s wellbeing. It reported in 2019 that an increase in
the average global temperature of 1.5 degrees Celsius will upset weather patterns across the
world, causing an increase in precipitation in some areas, and droughts in others (First 2019).
The report also predicted the complete and irreversible loss of certain ecosystems, an increase
in the frequency and occurence of heatwaves in the tropics, challenging the wellbeing of small
island states, and putting economically disadvantaged populations at risk. Furthermore the
oceans’ chemistry has been changing due to an increase in the amount of carbon dioxide they
have been absorbing, causing acidification which puts marine ecosystems at risk, as well as the
livelihoods of populations that depend on the oceans as their primary source of income. The
report stresses that reducing the output of carbon dioxide into the atmosphere should be an
absolute priority to nations and people across the world. Carbon dioxide that was previously
stored in so called carbon-sinks is being released back into the atmosphere due to “projected
increases in the intensity of storms, wildfires, land degradation and pest outbreaks” (Settele et
al. 2014; Seidl et al. 2017; as cited by First 2019).
The actions of an individual make a difference, and there are several actions that citizens can
undertake to reduce their carbon footprint. A “carbon footprint” is a measure for one’s impact on
the environment, and although many different definitions exist (Pandey, Agrawal & Pandey,
2010), the metrics all measure carbon dioxide that was released as part of producing a good or
consuming a service. A study by Berners-Lee et al. (2012) found that food related greenhouse
gas (GHG) emissions accounted for nearly a third (27%) of total GHG emission in the UK. They
looked at how various diet changes could impact emissions and found that a reduction of 22%
could be made if the population switched to a vegetarian diet and 26% if they switched to a
vegan diet. The findings by Berners-Lee and colleagues agree with a report by Steinfeld et al.
(2006) and are summarized by Tuomisto & Teixeira de Mattos (2011), who report that meat
production contributes to 18% of global GHG emissions. There is evidence to suggest that the
consumption of meat products is contributing to increased greenhouse gas emissions and
environmental degradation.
Mundkur (2020) conducted research into the question: “How can people be trained to develop
more sustainable consumption habits with respect to their food?” in the context of food
purchasing, by finding existing literature relating to topics of methods of behavior change,
barriers to sustainable consumption and attempts to cultivate sustainable habits. Mundkur also
conducted a survey among young adults in the Netherlands to investigate whether findings
regarding barriers to sustainable consumption found in literature were experienced by the target
population. He found in literature that barriers to sustainable consumption were Perceived
6
/
Consumer Effectiveness (PCE), Environmental Concern, and the Awareness of Alternatives.
The responses to the survey showed that young adults in the Netherlands have high levels of
PCE, Environmental Concern and Awareness of Alternative products. The main reason for not
embracing the available sustainable alternatives, specifically for meat and dairy products, was
the factor of price.
A design challenge is therefore to design a system that helps users make sustainable decisions
when planning their groceries in order to help reduce their impact on the environment, while
bearing in mind the practical constraints of a budget. Here, a system is defined as a smartphone
or web application.
The main research question of this thesis is:
“How can a context-based system, that considers the price of alternatives, be designed to help
its users practice sustainable food consumption habits?”
Sub-questions to help answer this main question are:
RQ1. “What are sustainable food consumption habits?”
RQ2. “How are systems - that support decision making for habit change - designed?”
a. “ Which features do such systems make use of? ”
RQ3. “How can relevant features be implemented in the proposed system?”
RQ4. “Is the proposed system intuitive to use?”
RQ5. “Did the application have an effect on the following:
a. The participant’s perceived affordability of sustainable alternatives
b. The participant’s awareness of sustainable alternatives
c. The participant’s intention to purchase sustainable alternatives”
RQ6. “What was the participants experience with the following:
a. The application in general
b. The personal goal-setting feature
c. Being exposed to social norms of group purchasing behavior
d. Being repeatedly exposed to the price of sustainable alternatives
This thesis will propose, design, test and evaluate a context-based system that helps its users
make more sustainable choices regarding food consumption. The following chapter will help
answer the first two research sub-questions. This is followed by the Methodology chapter which
describes the approach taken to design the system and its features, assess its usability and
7
/
finally test and evaluate the system. This is followed by a chapter which describes the functional
design of the system and how the features of the system are selected. The following chapter
describes the features in more detail, and tests the usability of the system with a low-fidelity
prototype test. The results from this test are then used to inform the high-fidelity prototype which
is then tested with participants in a field test, the details and result of which are described in
Chapter 6. This is followed by a general discussion of the findings of the thesis, its limitations,
and recommendations for future work in Chapter 7, with the thesis ending with a conclusion in
Chapter 8.
8
/
2. Background
This chapter will help answer the first two research sub-questions (RQ1 and RQ2) and provide a
context for the system. The definition of sustainable food consumption habits is established to
direct the design of the system. Systems that were designed for behavior change with respect to
sustainable food consumption, food consumption and the sustainable consumption of energy
and water, are evaluated with regards to system features using the Persuasive System Design
Model introduced by Oinas-Kukkonen & Harjumaa (2009) and summarized in Section 2.3.
Section 2.4 discusses the findings from the previous section and the chapter ends with a
conclusion in Section 2.5.
2.1 RQ1: What are sustainable food consumption habits?
Current methods of food production and distribution have a number of negative attributes as
described by Reisch, Eberle & Lorek (2013) in their overview on issues and policies regarding
sustainable food consumption, such as contributing to water pollution, water scarcity, soil
degradation, loss of habitats and biodiversities, large amounts of fresh-water usage and the
production of greenhouse gases (GHG). In their report they discuss how the demand for food
and water will only increase in the future due to growing populations as a result of increasing
prosperity. The Sustainable Development Commission in the UK defines sustainable food and
drink as those which reduce food miles, support rural economies, reduce energy consumption
and respect environmental limitations in production ( HM Government, 2005).
In an attempt to make the Australian diet more sustainable, Friel, Barosh & Lawrence (2014)
built their diet on three principles: reducing food above a person’s daily energy requirement,
reducing the consumption of energy-dense, highly processed foods and a diet comprising less
animal-products and more plant-derived foods. A similar study was done by Macdiarmid et al.
(2012) found that a healthy diet could be constructed that reduces GHG emissions by reducing
the number of meat and dairy products consumed. Ranganthan et al. (2016) discussed
necessary dietary changes for a sustainable food future, and outlined three major dietary shifts:
reducing the overconsumption of calories, reducing the overconsumption of protein by reducing
consumption of animal-based products and specifically reducing consumption of beef. The
report discussed how protein overconsumption was especially prominent in wealthy countries.
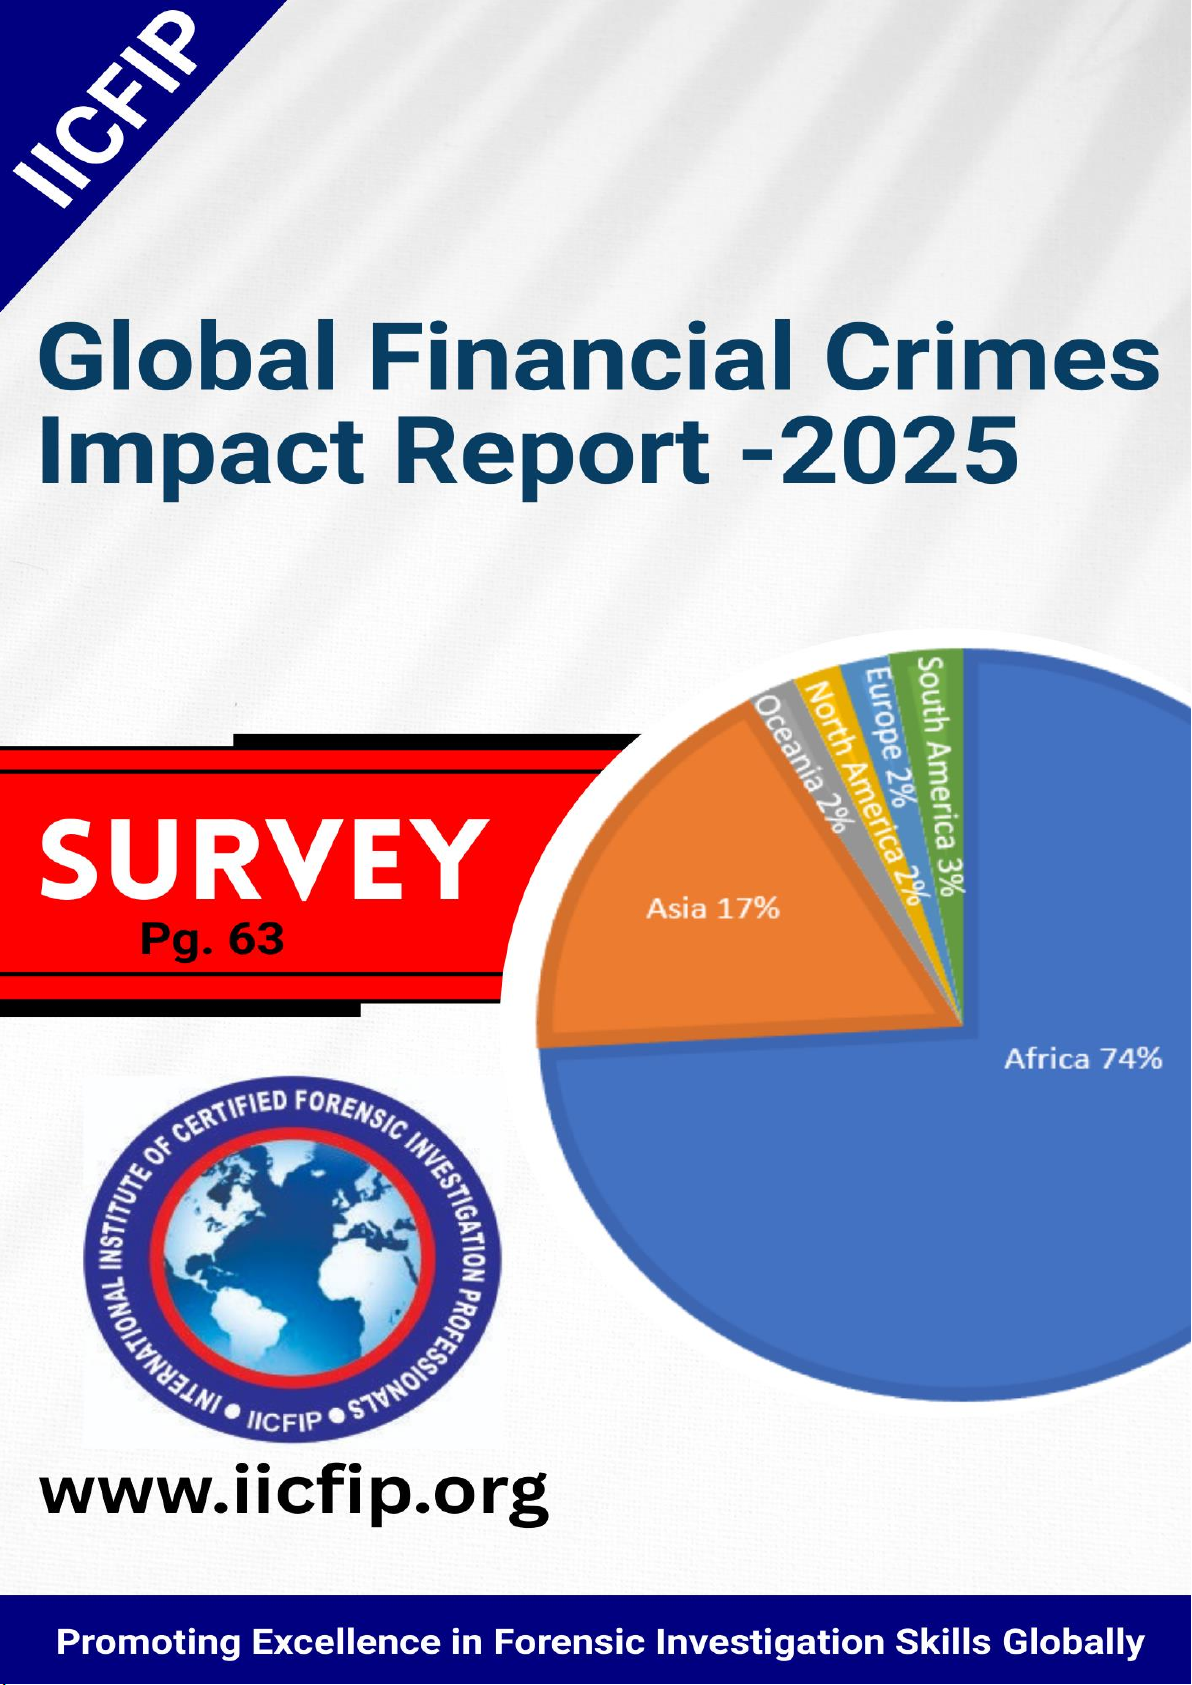
The data in Figure 1 shows the global mean resources used to produce each food type on the
horizontal axis. The data was compiled by Ranganthan et al. (2016) from the GlobAgri Model
( Dumas & Guyomard, 2014), and calculations done by Mekonnen & Hoekstra (2011, 2012) and
Waite et al. (2014). These findings are further reflected by Nijdam, Rood & Westhoek (2012)
9

/
that found a significant difference in carbon footprints of production methods of pork and
chicken versus beef and fish.
Figure 1. Global mean resource usage per ton of protein consumed (Ranganthan et al. 2016)
The findings from the survey conducted by Mundkur (2020) saw that “eating local food” and
supporting local farmers was among the methods the respondents acted sustainably. However
this is a more nuanced subject. Coley, Howard & Winter (2009) conclude in their paper on local
10

/
food miles and carbon emissions, that the topic is complex. An individual may produce more
emissions (based on fuel and energy) by driving a certain distance to a supermarket to buy a
locally produced product, than driving to a closer one that sells products that are imported in
bulk. Similarly, Edward-Jones (2010) found that it cannot be claimed that universally, local food
is superior to non-local food items. Making the decision to only supply a product through local
channels is not possible for every country, due in part to a lack of quantitative evidence on
overall emissions in countries like the UK. A study regarding New Zealand by Saunders, Barber
& Taylor (2006) stress that a generic measure such as food miles, should be less of the focus,
and the real metric should be total energy used in production and transport. Doing an analysis in
New Zealand, they found that it produced fewer emissions and cost less energy to transport
some products produced in New Zealand to the UK than producing those same products in the
UK using local sources.
These findings suggest that sustainable consumption habits are reducing meat and dairy
products, especially beef. This is a big step towards reducing the environmental footprint of a
consumer. In some cases, buying locally produced products instead of imported products can
reduce the total footprint of the consumer, however this can be more nuanced and depends on
factors such as production efficiency.
2.2 RQ2: How are systems - that support decision making for
habit change - designed?
This section will investigate existing behavior change applications from the domains of
sustainable food consumption, food consumption and energy consumption, to find common
design traits and summarize their effectiveness. To do so, these applications need to be
compared using a common background or model. The model that is chosen to compare these
applications is the Persuasive System Design model (PSD model) introduced by
Oinas-Kukkonen & Harjumaa (2009). This model separates system features into four
categories: Primary Task Support (PTS), Dialogue Support (DS), System Credibility Support
(SCS) and Social Support (SS). These categories and their features are given below in Table 1.
11
Primary Task Support
System Credibility
Support
Dialogue Support
Social Support
Reduction
Trustworthiness
Praise
Social learning
Tunneling
Expertise
Rewards
Social comparison
Tailoring
Surface credibility
Reminders
Normative influence

/
Table 1. Four categories of system features from the PSD model (Oinas-Kukkonen & Harjumaa, 2009).
A search was conducted for literature on systems designed for behavior change in the domain
of sustainable food consumption. The literature search began on the 1st of May 2020, and
lasted until the 8th of June 2020. The search was conducted using the databases Springer, and
Association for Computing Machinery (ACM) as well as the search engine Google Scholar. No
restrictions on publication dates were used during the search. A list of the search terms used
can be found in Appendix A.
During this search, the concept of “eco-feedback” emerged in numerous papers with the subject
of sustainable consumption. Eco-feedback is defined by Froehlich, Findlater & Landay (2010,
April) as “...technology that provides feedback on individual or group behaviors with a goal of
reducing environmental impact.” The term eco-feedback was therefore included in the search
terms found in Appendix A. Eco-feedback can consist of technologies that use an information
driven approach to drive behavior change, as well as a design-based approach that integrates
information and visualizes it, or otherwise presents it, in a meaningful way.
2.2.1 Sustainable Food Consumption
The search was conducted in the domain of interventions which featured a digital interface
designed towards supporting or promoting sustainable food consumption. During the search for
systems that aid in sustainable food consumption, studies were found that addressed different
aspects of food consumption such as: purchasing, food waste, sharing and tracking. Through
the course of the literature search, it was found that there is much more work done in the field of
sustainable consumption on reducing food waste, than there is on aiding food purchasing.
Hans & Bohm (2013) studied promoting sustainable grocery consumption, and provided
information regarding the state of the environment and in developing countries, and how
consumption affects this. Hans & Bohm wished to test whether sustainable development
self-efficacy predicted purchases of sustainable groceries. They provided information on the
state of the environment, socio-economic conditions in developing countries and how
consumption was linked to the problems they face and used an informational strategy to
12
Personalization
Real-world feel
Suggestions
Social facilitation
Self-monitoring
Authority
Similarity
Cooperation
Simulation
Third party
endorsements
Liking
Competition
Rehearsal
Verifiability
Social role
Recognition

/
strengthen sustainable development self-efficacy. They gave participants the task of spending
90 US dollars worth of money on groceries in an online platform. The participants were told they
would be given the groceries and the remainder of the money after completing the study. The
online platform offered a sustainable alternative for a variety of food items, and the number of
sustainable choices the participants made was tallied. The online platform (application) was
itself not designed to single-handedly change behavior as it did not feature the information
provision, and just served to test the effect of the information provision on the consumption
habits of the participants. Nonetheless, the system provided a sustainable alternative to a given
product, which falls under the PSD model system feature of reduction as it made the task of
finding ecological alternatives easier. The study itself featured simulation through information
provision (showing the effect of consumption on the environment and developing countries) and
social comparison (compared performance to two fictitious consumers at either ends of the
scale). Figure 2 below shows the chosen product in their interface and its ecological counterpart
presented to the user.
Figure 2. Comparison of normal product and its eco variant (Hans & Bohm, 2013)
Zapico et al. (2016) investigated how to reduce the attitude behavior gap, proposed by Vermeir
& Verbeke (2006), regarding the purchase of organic products in the supermarket. They
collected purchase data of loyalty card holders from a Swedish supermarket to process their
participants grocery purchase history. They developed an online dashboard, EcoPanel, which
used data visualization to provide the participants with an overview of their performance. They
found that the overview helped participants resolve cognitive dissonance between the belief
they purchase organic food products and the reality. In all cases, there was an increase in the
number of organic food items purchased, with a change inversely proportional to how close the
participants actions were to their belief. Zapico and colleagues report that the visualization was
most useful the first time it was viewed, as it gave the participants information they had never
seen visualized before. The motivation behind this data visualization approach was to make
invisible behavior visible, to allow participants to observe the results of actions they take. In
terms of the PSD model, EcoPanel makes primary use of the self-monitoring system feature.
Figure 3 below shows the eco-feedback presented to the user in Eco-Panel.
13

/
Figure 3. Monthly overview of expenditure with visualization of how much was spent on organic products (left),
Detailed overview of expenditure on different food categories and proportion spent on organic products per category
(right) from Eco-Panel by Zapico et al. (2016)
Clear & Friday (2012) designed a smartphone application that “tracks and informs user choice”
to calculate the impact of their habits in terms of carbon externality to raise awareness about
their carbon profile. The smartphone application took the form of a shopping assistant, and
items that the user placed on their shopping list were color coded (red, yellow and green)
indicating environmental impact. Their design provided participants with the opportunity to
understand an item’s carbon footprint if they so choose. This color coding falls under the PSD
model system feature of reducing, as it reduces the difficulty of understanding the impact of the
food item using three basic colors.
Thieme et al. (2012) developed a system called BinCam to help users reflect on their waste
disposal. The system consists of a camera placed on the inside of the disposal bin lid and logs
items that are disposed of by taking a picture and sending it to a facebook application where it is
processed. The application interface on facebook has features such as tagging the “owners” of
the waste, and listing people who viewed the contents as “bin-spies”; an approach that uses
normative social influences. The items were tagged based on recyclability and whether it was
food. The users are given a score that is based on recycling achievements and preventing food
waste. This score helps visualize the user’s contribution to the environment. The BinLeague
summarized the daily results from all bins in the system and the scores were visualized as
shown in Figure 4 below. Applying the PSD model, this application uses self-monitoring,
normative influence, social comparison and rewards to encourage its users to change their
behavior.
14

/
Figure 4. Group level visualization of recycling and money saved on food in the BinCam’s interface (Thieme et al.
2012)
Farr-Wharton, Foth & Choi (2013) address another facet of sustainable food consumption:
reducing food waste, with their application EatChaFood. The application was designed to
increase the awareness and knowledge of users about the food they had purchased. Data was
collected on their food using a camera positioned inside the fridge which was developed in
previous work (Farr-Wharton, Foth & Choi, 2012). The application uses color-coding systems to
help the user distinguish between food types, locate the food in different parts of the fridge, as
well as how soon food will expire. The application supports users discovering recipes that
incorporate the items in their fridge in order to prevent waste. Analyzing these features using the
PSD model, the application uses reduction by way of the color codes shown below in Figure 5,
as well as suggestion by offering recipes.
15

/
FIgure 5. Color coded food expiry (Farr-Wharton, Foth & Choi 2013)
Rouillard (2012, February) designed a smartphone application called “the Pervasive Fridge” in
order to combat food waste in households. The smartphone application helps its user maintain a
list of groceries they purchase, and sends them reminders when the food is close to expiring,
using phone vibration and a popup on the screen. The application also connects to the user’s
Google calendar and can post reminders to consume food on the user’s calendar. The
application is also capable of sending reminders via email and SMS. The application was
designed with a multi-channel approach for reminder delivery. To put this application in the
context of the PDSM, it uses many forms of reminders as dialogue support.
Aydin et al. (2017) conceptualized a smartphone application to provide real-time information on
groceries purchased by the user, as this a lack of real-time information was a cause for food
waste, outlined by Farr-Wharton, Foth & Choi (2013). Their application was designed to work
with a digital food inventory system that would catalogue food purchases and share this with the
application. The application uses icons instead of long texts, where each icon is a caricature of
the food item it represents. This caricature includes eyes which allow it to make facial
expressions which they used to encode the proximity of the food to its expiry date. The
application provides users with an overview of the foods wasted before, purchasing history and
monetary costs over time. The user is awarded points when food is consumed on time, awards
for challenges accomplished, and the user is given a “heroic” profile character. Furthermore, the
16

/
application uses persistent notifications when food is rapidly approaching its expiry date,
emotional texts such as the user is “killing” the food shown below in Figure 6, as well as tallies
the monetary cost incurred by wasting the food. The application penalizes wasting food by
removing previously earned points, a villainous character profile, and displaying sad faces on
the food items. It also hinders progress, as it becomes harder to achieve awards (increasing the
amount of food use per challenge). The effectiveness of the interface of the application was
tested with a small sample of participants, and in interviews participants said they would like to
use the application and felt motivated by it. One participant found the gamification of the awards
and scores a fun challenge to keep up, and the participants reported that the monetary loss of
waste was a motivating incentive. The participants experienced statistically significant emotional
responses to their progress. With regards to the PSD model, the application features
self-monitoring, personalization, reduction, praise, rewards and reminders.
Figure 6. Notification for when a food is close to expiring (Aydin et al. 2017)
Lim et al. (2015) designed a food waste tracker named E-COmate shown below in Figure 7 that
visualizes wasted potential food servings on a smartphone application. The choice was made to
visualize wasted potential food servings over other visualizations such as bottled water, landfills
or calories, as the servings lost was a metric directly linked to the consumer. This translates to
monetary loss, which is important to the consumer and hence a means of persuasion. The
application makes use of social comparison as the authors reflect that social comparison makes
use of social approval and norm activation which are principles that humans use to influence
others. The application uses social comparison to compare a user’s wasted servings with the
group average wasted servings. The application uses concentric circles to visualize the data so
that it is easily understood by users, a visualization technique used for “earth overshoot day”:
the concept of a calculated calendar day each year, where the human demand for earth’s
resources overshoots the resources the earth can regenerate in the same year (Day, 2017).
Color coding is used for positive and negative feedback based on the user’s performance in
17

/
relation to the group. With regards to the PSD model, the application uses social comparison
and self-monitoring.
Figure 7. Food waste overview (Lim et al. 2015)
Lim et al. (2014, March) designed a mobile application, named EUPHORIA, to combat food
waste by detecting food near its expiry date and suggesting recipes to make use of the food.
The system also uses a novel “group recipe” system where users are recommended recipes
based on the ingredients in other user’s possession, which elicits social interaction in the form of
planning and cooking. The researchers developed different versions of the application, one
where ingredients are suggested based on what others in the group have, another where
recipes are suggested as well as personal eco-feedback on user’s personal consumption is
provided, and finally one where recipes are suggested and eco-feedback on the group’s
consumption is provided. With regards to the PSD model, the system relies on social
comparison, self-monitoring, social facilitation, cooperation and provides a social role.
Harder et al. (2014) developed FoodWatch, a web application that helps track “..purchase,
consumption and disposal of food products..” It consists of a barcode scanner to enter products
into its system, as well as a method to enter the details of the item if no barcode is present. The
interface was designed to support the latter case. With regards to the PSD model, the
application makes use of reduction as its primary system feature.
Beyond these studies, no other systems that feature a digital interface and address sustainable
food consumption were found in literature, and therefore the search space was expanded to
systems with a digital interface that aid in food consumption. This expansion includes systems
designed to aid healthy eating, and weight management.
18

/
2.2.2 Food Consumption
Noom is an application designed to help with weight loss, that uses methods from behavioral
1
psychology to achieve its goals. A personal human coach is assigned to each user to help
understand their individual needs and situation. In addition to this, the application makes use of
something called the “big picture”, temptation bundling, rewards, community, relevant
reminders, habit bundling and provides an overview of the user’s performance. The “big picture”
translates to defining the user’s end goal and thereby asking the user to put in writing what their
goal is. Temptation bundling is a technique where a fun or rewarding behavior is paired with the
behavior that is being trained. This reward based learning is linked to the carrot-stick method,
which has been the subject of much research in a variety of applications ( Van der Klaauw & Van
Ours, 2013; Cahenzli, 2020; Liang, Xue & Wu, 2013 ). The carrot-stick method is used in
behavior psychology to either reward good behavior or punish bad behavior; such as adherence
and non-adherence to a new habit. The rewards that the application makes use of are gamified
streaks or praise from their coach. The use of rewards is to make the act of learning the habit
more tolerable until the motivation becomes intrinsic. The rest of the Noom community, as well
as the user’s social circles are used as motivation to share experiences and progress,
brainstorm ways to tackle goals and to give the user a feeling of community. The user is asked
to set up relevant, environmental reminders that act as a cue to perform the behavior. The last
method the application uses is called habit bundling, where the performance of a new habit, is
paired with the performance of an existing intrinsically motivated habit, such as eating breakfast.
To put Noom’s features in the context of the PSD model and the categories from Table 1, the
application makes use of recognition and social comparison, reminders, praise, rewards,
expertise and self-monitoring.
Siawsolit et al. (2017) designed a personal assistant for health-conscious grocery shoppers
shown below in Figure 8, with the goal to improve a consumer’s ability to make healthier food
choices. They used an 8-step persuasive system design process introduced by Fogg (2009).
Their system was a web-based smartphone application that provided quantitative information,
reduced complex nutritional information and tailored suggestions according to usage. In the
context of the PSD model, the system features were reduction, tailoring and trustworthiness.
1 https://www.noom.com/
19

/
Figure 8. Product selection page from the system designed by Siawsolit et al. (2017)
Bomfim et al. (2020, April) designed “Pirate Bri’s Grocery Adventure”, a gameful application with
the purpose of helping players ”...learn, internalize and maintain healthy shopping behaviors.”
The authors describe how the application is designed based on the concept of “slow
technology”, where the user is given time to process and reflect on new information, apply this
understanding and learn the consequences of their actions. The gameful application asks the
player to create a character based on their personal information such as age, gender and food
preference (personalization). The application has an avatar that serves as a guide through the
experience of the application named Brigitte. The avatar helps its users plan and create a
grocery list before going to the store, and provides users with challenges per shopping trip. An
example given for a user with a preference for sweet foods to find products with low amounts of
sugar. In the supermarket, the application provided a top-down view of the market, so the player
can select which areas they want to visit, and the avatar Bridgitte provides relevant tips related
to the foods found in the chosen areas. (tunneling, reduction, tailoring) As the user enters the
chosen zone, Bridgitte provides relevant information such as “misconceptions about the
nutritional value of fruit juice”. When the user wishes to add an item to their basket, they use a
screen on the application that allows for barcode scanning, or manual product entry, which also
shows the user’s progress with the challenges issued, so they can see how their decisions bring
them closer to their goals. When an item is scanned the application uses color-coding (green,
orange and red) to visualize the chosen product’s nutrient content. The concentration of the
content is encoded into the length of colored lines that use the color-coding. Before the item can
be added to the basket, the user is asked to indicate how many servings the item will provide, to
nudge them to consider selecting products that contribute to a balanced diet. The application
asks users how many days they plan to shop for, to help them understand how many products
of each category are needed to have a balanced diet, and visualize the deficiencies between
the current basket and the goal. Before checking out, the application provides an overview of
20

/
their basket and whether they have achieved their challenges, and provides opportunities to
complete them. If the user completes all the challenges, they are awarded a member of their
“crew” which serves as an achievement/reward and incentive for the next trip. In terms of the
PSD model, this application uses many primary task support features such as personalization,
tunneling, reduction, simulation, tailoring and self-monitoring, as well as rewards and praise.
Screenshots from the application are shown below in Figure 9.
Figure 9. Overview of progress towards challenge (left), color coded nutrient content in food item (right) (Bomfim et
al. 2020 April)
Chang, Danie & Farrell (2014) investigated the combined use of public displays and mobile
devices to encourage healthy eating in an organization. In their setup, a public display was
located at the cafeteria entrance, which visualized the relative consumption at the various food
stations in the cafeteria. The more popular a food station, the bigger its picture on the screen
was. Percentages were also shown in the pictures on the bottom right corners. After making a
choice for a particular food, the users anonymously add their choice to the database for that day
which is then reflected in the visualization on the public display. (social comparison) Daily
challenges were also broadcasted on the public display such as including a piece of fruit in their
lunch. The challenges included instructions on how to successfully complete them, as well as
the number of people that had completed the challenge that day. The user that completes the
challenge most recently can choose to have their names shown on the display. The
21
/
accompanying mobile application was designed to give users an overview of their nutrition. The
application allowed the user to take a picture of their food, select the food station their meal
came from, estimate the proportions of four food groups (grains, vegetables, proteins, fruits) and
to report completion of the daily challenges. When reporting the completion of a challenge, if the
user answered they did not, the application asks them to choose a reason from a dropdown
menu as to why they did not complete the daily challenge. On the final page, the user can
choose to compare their food group proportions to “expert recommendations”, other employees,
or employees in the user’s age range or gender group. With regards to the PSD model, the
system employs social comparison, self-monitoring, tunneling, expertise, social learning,
authority and optional recognition.
Schaefbauer et al. (2015, February) developed the smartphone application “Snack buddy” in
order to promote healthy snacking. The system was designed specifically for families with a low
socioeconomic status. The application allows its users to track the snacks they consume,
provides a healthiness rating on the snacks, suggests alternative healthier snacks to those
entered, provides an overview of snack consumption, facilitates messaging other users, and
compares the performance of a user to other family members. The application had two distinct
designs shown in Figure 10, a gaming design for secondary caregivers and an information
design for primary caregivers. The gaming design featured elements such as a human avatar,
whose progress through life-goals (such as education, getting a job) depends on snacking
healthiness. Every snack is awarded a certain number of healthiness points that contribute to
the avatar accomplishing life-goals. For the information design, snacks were given an abstract
rating in stars for each snack, where the maximum rating was a 5; to help users learn how a
particular snack would affect their health. The design of the gaming version was inspired by
transportation theory, where the user develops a long-term relationship with their virtual avatar,
who has a relatable life and goals. This application uses self-monitoring, tailoring, suggestion,
rewards, social comparison, competition and social learning.
22

/
Figure 10. Game versions home screen (A) and snack history screen (B) (Schaefbauer et al. 2015, February)
Kim et al (2010, January) developed “Grocery Hunter”, a mobile game for children to combat
obesity. The application was developed for the Pocket PC, with the purpose of helping children
make informed nutritional choices. Grocery Hunter features a cartoon character from a popular
kid’s television show that presents the user with challenges that they must complete. For
example, one such challenge was “Go and find the orange vegetable that is good for your
eyes”. Regarding the PSD model the system uses reduction and tailoring.
Epstein et al. (2016, May) approached promoting healthy eating using so-called crumbs,
lightweight food-based daily challenges, delivered to the user in a smartphone application called
“Food4Thought”. The principles of daily challenges and photo-based food journaling inspired
Food4Thought. The application is linked to a private facebook page, where users can post
photos of their meals. This was done to connect users to a community of other users, where
they can encourage each other, like, comment and message each other about their
performance. A crumb is posted in the application at 9 am, and the user is asked to take a
picture of one meal that satisfies the crumb, and indicate whether or not it satisfies the crumb.
At the end of the day all photos that satisfy the crumb are posted to the facebook group as well
the number of people that completed the crumb. Analyzing this application using the PSD
model, the application relies significantly on social support in the form of social learning, social
comparison, social facilitation, as well as suggestion.
23

/
Wayman & Madhvanath (2015, September) developed “Foodle” a web interface that nudges
users to make healthier food-related decisions. Food uses the user’s grocery list to provide an
overview of their current nutritional state, set dietary goals and provide recommendations. The
web interface displays “score cards” which are nutrient content barcharts of the user’s grocery
list, with a comparison to the recommended nutrient levels. If the user hovers over a bar, the
system provides information on the particular nutrient as well as foods rich in it. The application
also features foods that will help the user address nutrient deficiencies, with a recommendation
of servings per week and a button to conveniently add the food to their grocery list shown below
in Figure 11. The application also features a nutrition history chart, based on the previous 60
days worth of data that plots the nutritional content of the groceries as percentages of their
recommendations. With regards to the PSD model, the application uses reduction,
self-monitoring, tunneling and trustworthiness.
Figure 11. Foodle UI (Wayman & Madhvanath, 2015 September)
Pollack et al. (2010) developed a mobile game to promote healthy eating to fight rising
child-obesity rates. The demographic the researchers were designing the game for were
children in the seventh and eighth grade, and decided to make the application a game, in order
to create motivation which is necessary for behavior change. The researchers chose the
intervention to be based on pet care as part of the user’s daily routine, as this is a method
commonly used in behavior change, where the user forms an emotional bond to the avatar they
are caring for. At the beginning of the interaction, the user is asked to pick a pet or item to care
for and name them. The creatures send the user health related messages, and the system was
set up to do this at planned times when the children were most likely to have a meal i.e. in the
24

/
morning and after school. The pet then asks the user to photograph their meal, a form of
photo-journalism, and the meal is awarded points from -2 to 2 based on whether something was
eaten, and the healthiness of the food. The photos were sent to the researchers who were
trained by a nutritionist to score the meals. Feedback was delivered with the score, so if the
user had no food in their submission, the pet would complain that they were hungry and the
meal’s content determines the pet’s emotional state, so a low score would result in an unhappy
pet. Figure 12 below shows the pet’s state and comments on the child’s meal. With regards to
the PSD model, the system uses personalization and tailoring, as well as many dialogue
support features such as praise, rewards, reminders and suggestions.
Figure 12. Example of pet in a happy mood (left) and picture submitted by the user together with feedback (right)
from the paper by Pollack et al. (2010)
While conducting the search for systems that incorporate eco-feedback with regards to food,
many papers were found concerning eco-feedback with regards to energy consumption.
2.2.3 Eco-feedback in other domains
Kuo & Horn (2014, September) designed a bathroom weighing scale with a digital interface,
shown below in Figure 13, in order to help conflate the ideas of physical health, measured in
body weight, and environmental health, measured using a metric they created called “carbon
weight”. Energy monitoring devices were installed around the participants’ houses that gathered
usage data which was wirelessly transmitted to the weighing scale. Carbon weight was then
25

/
estimated based on the collected energy usage data. The weighing scale uses self-monitoring
from the PSD model.
Figure 13. Snapshot of the UI of the weighing scale (Kuo & Horn, 2014 September)
Froehlich et al. (2012, May) present users with water usage data aggregated over various water
outlets in the house. The researchers collected data at different levels of granularity in order to
provide granular data, for more detailed eco-feedback. The researchers created multiple
designs of interfaces providing eco-feedback in a number of representations, two of which are
shown in Figure 14 below. Their findings were that there was a preference for detailed usage
information at the individual fixture level in terms of volume of water and associated monetary
cost, as well as a preference for changing the window of time the measurements were taken to
get a more detailed understanding of previous usage of water. With regards to the PSD model,
the system uses self-monitoring, trustworthiness and social comparison.
Figure 14. Examples of eco-feedback interfaces designed by Froehlich et al. (2012, May)
26

/
Petkov et al. (2012, October) aimed to reduce the gap between environmental psychology and
the design of persuasive technology by personalizing eco-feedback in order to promote energy
saving in households. They split the type of feedback they would give into three styles based on
the three different values from the Value Belief Norm theory (Stern, 2000): egoistic (selfish),
altruistic (selfless) and biospheric (concerned for the environment). In addition they also created
eco-feedback based on social norms. The egoistic eco-feedback was centered around the
concepts of “my health” and “my lifestyle”, while the approach for altruistic eco-feedback was to
use the metaphor of the “newspaper from the future”, centering around the concepts of “all
people”, “my community” and “children”, and highlights the future negative impacts of current
consumption. For the biospheric eco-feedback, the feedback was put in the context of the
effects of current consumption on animals, on plants and the world ecosystem. For the users
with altruistic and biospheric motivations, the researchers designed the eco-feedback to convey
the feeling that they were not alone in their efforts. The four designs are shown below in Figure
15. For the social-norm based eco-feedback, the researchers designed the interface to compare
the energy usage of the household to neighborhood and displayed values for the efficient and
inefficient neighbors, as well as which category the household fell into. With regards to the PSD
model, the researchers made use of tailoring, self-monitoring, social comparison, normative
influence, and simulation when designing the four types of eco-feedback.
Figure 15. Screenshots of different styles of eco-feedback (from left): egoistic eco-feedback, altruistic eco-feedback,
biospheric eco-feedback, social norm based eco-feedback (Petkov et al, 2012 September)
Kjeldskov et al. (2015, April) designed E-forecasting, an interface that informs users on recent
electricity usage, predicted usage, electricity price, availability of wind power as well as
expected peaks in demand. The goal of the researchers was to inform users in order for them to
respond to external factors that influence sustainable electricity use. The overview of energy
usage was only for the current day, with predictions shown for the remainder of the day, for the
three types of energy sources, green, good capacity or cheap, where cheap was the “worst”.
The researchers used color coding to distinguish the different energy types, for the prediction
charts and for the clock that showed the user what were the best times to consume electricity in
the day. E-forecasting helped its users understand that they could contribute to sustainable
consumption not just by reducing the amount of energy they consume, but changing the times
at which they consume it. Figure 16 below shows how the system informs the user on when to
27

/
consume electricity and how they have been performing. With regards to the PSD model,
E-forecasting uses simulation, self-monitoring and reduction.
Figure 16. Chart of previous energy usage in the day and forecasted energy usage (left), visualization of the time in
the day where each electricity source was most dominant (right) (Kjeldskov et al. 2015, April)
Paay et al. (2014, December) designed an always-on eco-feedback display that provided an
overview of domestic energy usage, called PowerViz, shown below in Figure 17. The
researcher’s goal was to increase the user’s awareness of their energy usage at an appliance
level. They designed a detailed overview using barcharts on an appliance level as well as per
area of the house. The researchers made sure to include time granularity in their design by
allowing the user to reframe the window of time they viewed the data in. In addition they also
wanted to design a visualization that gave users an instinctive, quick understanding of their
usage without requiring graphs and came to the design of hanging light bulbs. When
consumption of energy in the house increases, the number of light up light bulbs increases; and
when it reduces, the bulbs are switched off and then fade away slowly to show the user that an
appliance was previously on but has recently been switched off. In the context of the PSD
model, PowerVIz makes use of self-monitoring, simulation and reduction.
Figure 17. Energy usage of individual appliance (left), current usage displayed abstractly as screen saver (right) from
the work of Paay et al. (2014, December)
28

/
Quintal et al. (2013, September) investigated personalized eco-feedback for motivating energy
saving behavior in households and created a prototype: Wattsburning. The system provided
real-time as well as previous usage data and was designed with two display modes: idle and
detail. The idle design made use of a digital landscape that had alterations made to it
proportional to the energy usage (usage ranged from 1 to 5), shown below in Figure 18.
Pressing the back button on the android device the interface is displayed on triggers the detail
mode, and the user is presented with a summary of current usage as well as an overview of
previous usage. With regards to the PSD model, Wattsburning makes use of simulation,
self-monitoring and reduction.
Figure 18. Novel overview of energy usage using digital scenery and changing elements in it reflecting usage
(ranging from 1 to 5) (top), Detailed overview of usage (bottom) from the work by Quintal et al. (2013, September)
The choice was made to stop after covering these systems, as other papers that were found on
the topic of eco-feedback were not using any significantly novel features in their systems i.e.
features that had not been seen in related work already. This and the fact that papers were
beginning to refer to work that was already covered indicated that the search space had been
saturated in terms of novel solutions.
29

/
The PSD model system features used by the 25 systems found in literature designed for
behavior change with regards to sustainable consumption of food, consumption of food in
general and that use eco-feedback in different domains, will be discussed in the following
section.
2.3 Analysis of Existing Behavior Change Systems
In order to provide a better understanding of popular system features from the PSD model used
while designing systems for behavior change, a table was drawn up listing the work and the
respective usage of system features. This can be found below in Table 2. The popular system
features for each category of support (primary task, dialogue, system credibility, social) will be
discussed below.
30
Paper or System
Primary Task
Support
Features
Dialogue
Support
Features
System
Credibility
Support
Features
Social Support
Features
Hans & Bohm
(2013)
Reduction,
Simulation
Social Role
Surface
Credibility
Social
Comparison
Zapico et al.
(2016)
Self-monitoring
-
Surface
Credibility,
Trustworthiness
-
Clear & Friday
(2012)
Reduction
-
-
-
Thieme et al.
(2012)
Self-monitoring
Rewards,
Social Role
-
Social
Comparison,
Normative
Influence
Farr-Wharton,
Foth & Choi
(2013)
Reduction,
Suggestion
-
-
Rouillard (2012,
February)
-
Reminders
-
-
Aydin et al.
(2017)
Self-monitoring,
Personalization,
Praise,
Rewards,
Surface
Credibility,
-

/
31
Reduction
Reminders
Trustworthiness
Lim et al. (2015)
Self-monitoring
Social Role
Surface
Credibility,
Trustworthiness
Social
Comparison
Lim et al. (2014,
March)
Self-monitoring
Social Role
Trustworthiness
Social
Comparison,
Social
Facilitation,
Cooperation
Harder et al.
(2014)
Reduction
-
-
-
Noom
Self-monitoring
Reminders,
Praise,
Rewards, Social
Role
Expertise,
Surface
Credibility,
Trustworthiness
Recognition,
Social
Comparison,
Siawsolit et al.
(2017)
Reduction,
Tailoring
-
Trustworthiness,
Surface
Credibility
-
Bomfim et al.
(2020, April)
Personalization,
Tunneling,
Reduction,
Simulation,
Tailoring,
Self-monitoring
Rewards, Praise
Surface
Credibility,
Trustworthiness,
Expertise
-
Chang, Danie &
Farrell (2014,
September)
Self-monitoring,
Tunneling
Social Role
Expertise,
Authority,
Trustworthiness
Social
Comparison,
Social Learning,
Recognition
Schaefbauer et
al. (2015,
February)
Self-monitoring,
Tailoring
Suggestion,
Rewards, Social
Role
Surface
Credibility,
Trustworthiness
Social
Comparison,
Competition,
Social Learning
Kim et al (2010,
January)
Reduction,
Tailoring
-
-
-
Epstein et al.
(2016, May)
-
Suggestion,
Social Role
-
Social Learning,
Social
Comparison,
Social

/
Table 2. Overview of PSD model system feature usage in the existing work on sustainable consumption and
eco-feedback
2.3.1 Primary Task Support
A table with the relative usage of each primary task support feature in the 25 systems from
literature can be found below in Table 3.
32
Facilitation
Wayman &
Madhvanath
(2015,
September)
Reduction,
Self-monitoring,
Tunneling
-
Trustworthiness,
Surface
Credibility
-
Pollack et al.
(2010)
Personalization,
Tailoring
Praise,
Rewards,
Reminders,
Suggestion
Surface
Credibility
-
Kuo & Horn
(2014,
September)
Self-monitoring
-
Surface
Credibility,
Trustworthiness
-
Froehlich et al.
(2012, May)
Self-monitoring
Social Role
Trustworthiness
Social
Comparison
Petkov et al.
(2012, October)
Self-monitoring,
Tailoring,
Simulation
Social Role
Surface
Credibility,
Trustworthiness
Social
Comparison,
Normative
Influence
Kjeldskov et al.
(2015, April)
Self-monitoring,
Simulation,
Reduction
Suggestion
Trustworthiness,
Expertise
-
Paay et al.
(2014,
December)
Self-monitoring,
Simulation,
Reduction
-
Trustworthiness
-
Quintal et al.
(2013,
September)
Self-monitoring,
Simulation,
Reduction
-
Trustworthiness,
Surface
Credibility
-

/
Table 3. Primary task support system features and their usage in the behavior change systems found
Self-monitoring is an almost obvious system feature to include in a system that provides
feedback on behavior using historical behavior data. 60% of the systems found in literature
employ self-monitoring, which also means that 60% of the systems use a data-driven or
information driven approach to persuasion. Reduction is the second most used feature to be
used in related systems with Simulation and Tailoring sharing the spot for third most used
feature. Tunneling and Personalization were used the least out of all the Primary Task Support
features that were used. Additionally, 12% of the systems found featured no Primary Task
Support features.
2.3.2 Dialogue Support
A table with the relative usage of each dialogue support feature in the 25 systems from literature
can be found below in Table 4.
33
Primary Task Support Feature
Usage
Reduction
48%
Simulation
24%
Self-monitoring
64%
Personalization
12%
Tailoring
24%
Tunneling
12%
None
12%
Dialogue Support Feature
Usage
Rewards
22%
Social Role
40%
Suggestion
20%
Reminders
15%

/
Table 4. Dialogue support system features and their usage in the behavior change systems found
From all the dialogue support features used in the 25 systems found in literature, Social Role is
the most popular feature. This is due to many systems linking users, either by comparing their
performances or comparing the user’s performance to a group average. Rewards and
Suggestion are tied in terms of usage and are the second most popular dialogue support
features. Reminders and Praise are used the least in literature.
2.3.3 System Credibility Support
A table with the relative usage of each system credibility support feature in the 25 systems from
literature can be found below in Table 5.
Table 5. System Credibility support system features and their usage in the behavior change systems found
Trustworthiness is by far the most used System credibility support feature. This is because it
goes hand in hand with the Self-monitoring feature. The definition of Trustworthiness in the PSD
model is to provide information that is truthful, fair and unbiased. Many of the systems gathered
user data from either appliances that monitored energy usage, grocery receipts or pictures of
the items in their fridge. When providing an overview of previous behavior, the information
shown was fair and truthful as it was based on metrics of previous behavior. The second most
popular feature was Surface Credibility, which involves the visual appearance of the system.
These two features were the most popular by a large margin; the other two features used,
Expertise and Authority, were used in 4 papers in the case of the former and only 1 paper in the
case of the latter. Authority was the least utilized system credibility support feature.
34
Praise
15%
None
36%
System Credibility Support Feature
Usage
Trustworthiness
60%
Surface Credibility
52%
Expertise
16%
Authority
4%
None
32%

/
2.3.3 Social Support
A table with the relative usage of each social support feature in the 25 systems from literature
can be found below in Table 6.
Table 6. Social support system features and their usage in the behavior change systems found
Social Comparison was the most popular feature used for social support in the systems found
with Social Learning being the second. Normative Influence and Social Facilitation both were
used in two papers each, while Cooperation and Competition were used in one paper each
respectively. Social Support features are the least popular category of system features, being
utilized in less than half of the systems.
These findings show that a majority of the systems designed to support behavior change in the
domains of sustainable food consumption, food consumption and energy consumption include
PTS features, particularly Self-monitoring and Reduction, and due to the use of Self-monitoring
from the PTS category, Trustworthiness from the SCS category is also used. DS features were
used in a few applications, particularly those that targeted a younger audience or used a more
gamified approach to behavior change. Finally SS category features were used the least in the
behavior change systems.
35
Social Support Feature
Usage
Social Comparison
39%
Normative Influence
8%
Social Facilitation
8%
Cooperation
4%
Recognition
8%
Social Learning
12%
Competition
4%
None
58%

/
2.4 Discussion of Design of Existing Behavior Change Systems
Table 7 below was constructed with the use context, the technology, the environment and the
persuasion strategy for the papers discussed in Section 2.2 in order to provide a brief overview
of the existing work. The domain, technology that the systems were implemented in, the
environment they were designed to be used in, and the strategy used for persuasion are used to
provide the overview. Mundkur (2020) found in literature that there are two strategies in
persuasion: direct and indirect. The indirect strategy uses nudges and design-hints to persuade
users to perform certain behaviors, while the direct strategy provides the user with information
to persuade them to perform a new behavior. The direct approach is based on the school of
thought that humans are rational creatures that make logical decisions based on information
provided to them. The indirect approach is based on a school of thought that opposes this.
36
Paper or System
Use Context
Technology
Environment
Strategy
Hans & Bohm
(2013)
Sustainable
Grocery
Consumption
Web application
Household
Nudge
Zapico et al.
(2016)
Sustainable
Grocery
Consumption
Web application
Household
Information
driven
Clear & Friday
(2012)
Carbon
Footprint
Reduction
Smartphone
application
Household
Nudge
Thieme et al.
(2012)
Waste Disposal
Web application
Household
Information
driven
Farr-Wharton,
Foth & Choi
(2013)
Food Waste
Smartphone
application
Household
Mix of both
Rouillard (2012,
February)
Food Waste
Smartphone
application
Household
Mix of both
Aydin et al.
(2017)
Food Waste
Smartphone
application
Household
Mix of both
Lim et al. (2015)
Food Waste
Smartphone
application
Household
Information
driven

/
37
Lim et al. (2014,
March)
Food Waste
Smartphone
application
Household
Mix of both
Harder et al.
(2014)
Food Waste
Web application
Household
Nudge
Noom
Weight Loss
Smartphone
application
Household /
Restaurant
Mix of both
Siawsolit et al.
(2017)
Healthy Grocery
Shopping
Web application
Household /
Shop
Mix of both
Bomfim et al.
(2020, April)
Healthy Grocery
Shopping
Smartphone
application
Shop
Mix of both
Chang, Danie &
Farrell (2014,
September)
Healthy Eating
Public display &
web application
Office canteen
Mix of both
Schaefbauer et
al. (2015,
February)
Healthy Eating
(Snacking)
Smartphone
application
Household
Mix of both
Kim et al (2010,
January)
Healthy Eating
Pocket PC
Shop
Nudge
Epstein et al.
(2016, May)
Healthy Eating
Smartphone
application
Household /
Restaurant
Nudge
Wayman &
Madhvanath
(2015,
September)
Healthy Eating
Web application
Household
Mix of both
Pollack et al.
(2010)
Healthy Eating
Smartphone
application
Household
Nudge
Kuo & Horn
(2014,
September)
Understanding
Carbon
Footprint
Weighing scale
Household
Information
driven
Froehlich et al.
(2012, May)
Understanding
Water
Consumption
Tablet
application
Household
Information
driven

/
Table 7. Overview of use context, domain, technology and persuasion strategy of the papers covered in Section 2.2
From Table 7, it can be seen that a vast majority of the existing work makes use of smartphones
to implement their interventions, which speaks to the ubiquity of smartphones in our current
lives. Interventions that used a direct approach of persuasion i.e. eco-feedback in the context of
energy or water consumption, were designed for an always-on public display that took the form
of a tablet on the wall. A lot of the interventions were designed for use in a household, and while
this is appropriate for some of the behaviors, others such as shopping which is done outside the
house, could have benefitted from being designed to support the user during the action itself, for
example shopping. Many of the interventions use a mix of system features for both a direct and
indirect persuasion strategy, and in a majority of the systems, the direct strategy is employed in
some shape or form, either as the sole persuasive strategy or in combination with an indirect
approach.
PTS features were the most popular category of system features utilized in the systems found in
Section 2.2. In contrast, SS features were the least popular category, with DS features following
closely behind. SCS features were the second most popular category due to one of its system
features going hand in hand with a feature from the PTS category: Trustworthiness with
Self-monitoring.
The popularity of Reduction as a PTS system feature is understandable seeing as reducing the
complexity of new behavior is a key way of persuading and helping a user to adopt it.
Self-monitoring is the obvious choice of system feature in systems that use eco-feedback, and
therefore the most popular feature in the existing work. Tailoring and Simulation were both the
third most popular PTS features, and Tailoring was primarily used where the system was
targeted towards a younger audience. Tunneling was used very little, due to its effectiveness in
systems that guide the user through an activity, and not just report about it afterwards.
38
Petkov et al.
(2012, October)
Energy Saving
Smartphone
application
Household
Mix of both
Kjeldskov et al.
(2015, April)
Energy Usage
and Saving
Tablet
application
Household
Information
driven
Paay et al.
(2014,
December)
Energy Usage
and Saving
Tablet
application
Household
Mix of both
Quintal et al.
(2013,
September)
Energy Saving
Tablet
application
Household
Mix of both
/
DS system features were used relatively sparsely in the systems found in existing work. Out of
the features, Rewards and Praise often featured in gamified applications with the former being
utilized more often. Suggestion was the second most popular feature, which is understandable
given that suggestions act as small nudges for the user to perform a behavior.
SCS was the second most popular category only due to a system feature going hand in hand
with another from PTS: Trustworthiness with Self-monitoring. In systems where this wasn’t the
case, the most common SCS feature was Surface Credibility i.e. making the interface look and
feel competent, which is something that system designers strive for. Certain features of this
category such as Third Party Endorsements, Real-world Feel and Verifiability, were not used at
all.
The most popular use of SS system features was Social Comparison. A surprising outcome of
the analysis of usage of SS features was that Normative Influence was rarely used as a system
feature, despite the existence of a large body of work on normative influence and norm
activation and their role in persuasion.
Another observation that was made during the analysis of the systems found in literature was
that none of the interventions supported custom goal-setting, while many interventions provided
goals set by the researchers themselves. Oinas-Kukkonen & Harjumaa (2009) refer to Goal
Setting Theory introduced by Locke & Lotham (2002), which posits that goal setting can
influence self-efficacy, and when users are allowed to set goals themselves, they will use their
own knowledge and experience to set realistic, achievable goals.
2.5 Conclusion
This chapter served to answer two research sub-questions, and the answers can be found to
each question below.
“What are sustainable food consumption habits?”
From the findings in Section 2.1, reducing the consumption of meat and dairy products is one of
the biggest ways to reduce one’s environmental footprint when it comes to food consumption.
Studies defined sustainable foods and drinks are those whose production is respectful of the
limits of the environment. Studies done on - and suggestions for - reducing the impact of food
on the environment was minimizing animal proteins and dairy products in the diet. It was found
that specifically animal proteins comprise a significant portion of resource usage and GFG
emissions compared to plant based alternatives in terms of production. None of the systems
found in literature were designed with the particular goal of reducing consumption of animal
proteins and dairy products in mind, or supported this in a concrete way. A few systems
39
/
suggested biological or ecological products, which can have a range of different meanings and
cause confusion, and include animal proteins and dairy products. Hans & Bohm (2013)
specifically briefed their participants on the different sustainable labels and their meaning in
order to avoid confusion. This introduces a space for further research: designing digital
interfaces that help users to reduce consumption of animal protein and dairy products.
“How are systems - that support decision making for habit change - designed?”
- “ Which features do such systems make use of? ”
Twenty five systems that were designed for the purpose of behavior change were analyzed in
Section 2.2. The systems found were designed for the purpose of sustainable food
consumption, food consumption and the sustainable consumption of water and energy. The
design of the systems was analyzed using the Persuasive System Design Model by
Oinas-Kukkonen & Harjumaa (2009). Systems were found to be designed to give users an
overview of their performance towards the target behavior, difficult or complex behaviors or
actions were made simpler and a social aspect was often included. Certain features from the
SCS and DS categories were popular as they were tied to features from the PTS and SS
categories such as Self-monitoring and Trustworthiness. Features from the PTS and SS
categories are most popularly used in literature and will be explored further during the ideation
phase to derive system features for the proposed system. System features that were commonly
used in literature were Reduction, Simulation, Tailoring, Self-Monitoring, Social Comparison,
Social Role, Trustworthiness and Surface Credibility.
From Table 7, it can be seen that little research has been done on the topic of digital
intervention design in the context of sustainable grocery purchasing, which makes it a relatively
unexplored space, for further research to be conducted in. In addition, none of the systems
supported custom goal-setting, which allows users to design achievable goals for themselves.
Including this in the design of a system would add to its novelty and allow for the observation of
the effect of personal goal-setting on sustainable grocery purchasing. In addition, the Normative
Influence feature from the SS category is a seldom used feature despite it being a well
researched topic (Wooten & Reed, 2004; Batra, Homer & Kahle, 2001; Martin, Wentzel &
Tomczak, 2008), whereas the most feature from the same category was Social Comparison.
Therefore, investigating the effects of Normative Influence on sustainable grocery purchasing by
including it in the design of a system would be novel.
From the conclusions above and moving into the Ideation Phase, the functionality of the system
will be designed with the goal of helping users transition away from animal protein and dairy
products towards more sustainable alternatives, in the context of sustainable grocery
purchasing. The related work found in this chapter will serve as inspiration for the system’s
features.
40
/
3. Methodology
This chapter describes the methodology that will be used to design the functionality of, and
evaluate, the proposed system. This chapter is split up into 3 parts, Functional Design of the
System, Lo-Fi Prototype Development and Testing, and High-fidelity Prototype Development
and Testing.
3.1 Functional Design of the System
Functional design will be formed by performing a few steps. The PSD model is used to analyze
the intent, event and strategy of the system. As part of defining the strategy, system goals are
defined in order to guide it. System Features from the PSD model are then analyzed in brief, in
order to determine their relevance to the proposed system. Following this, functional
requirements are created that help accomplish the system goals. An individual brainstorm is
then conducted to generate ideas for aspects of the system such as location of the system, as
well as how to implement the selected system features. The ideas for system features are
evaluated against certain criteria that are determined further in this report, to determine which
shall be chosen for the proposed system. Usage scenarios are then drawn up to further decide
between similar features. Finally, a preliminary system description using a walkthrough is
provided to describe the functionality of the system that is mocked-up and tested in the next
phase.
3.2 Low-fidelity Prototype Development and Testing
The preliminary system from the previous phase is implemented into a low-fidelity prototype
using software which allows for interface mock-up and supports basic interaction. The front-end
design of the interface will be informed by usability heuristics introduced by Nielsen (1995). A
lo-fi prototype test is planned using guidelines from the book by Nielsen (1994) on usability
engineering. A test protocol is defined and interview questions are designed to obtain feedback
on the prototype.
Participants are asked to conduct fundamental tasks using the application and asked to employ
a Think-Aloud approach while doing so. The researcher records their interactions with the
prototype using screen recording software, and the participant’s faces to observe reactions to
the interface. Once the participant has completed their tasks, they are asked to answer a few
questions in the form of an interview. The interview discusses their experiences with the
prototype and provides an opportunity to get feedback on the design. During the interview, the
41
/
participant is also presented with alternate implementations of the system features Reduction,
Tunneling and Suggestion, to investigate preference between implementations. The results from
the test are used to inform the high-fidelity prototype.
3.3 Hi-Fi Prototype Development and Testing
A high-fidelity prototype of the application is created using the Flutter framework developed by
Google for the Dart programming language. The design is informed by the findings from the
low-fidelity prototype test. A field test is then conducted to help answer RQ 5 and 6. Participants
for the test are screened against certain criteria which are determined later. The field test will
take the form of a longitudinal study where participants repeatedly interact with the system over
a period of time. The test is preceded by a briefing on the goals of the experiment and
instructions on how to use the application. Before the first interaction with the system, the users
are asked to fill out a questionnaire, and are asked to fill in a second questionnaire after their
last interaction with the system. Both questionnaires have common statements which users
respond to on the Likert scale (1 = strongly disagree, 7 = strongly agree). A statistical analysis
consisting of descriptive statistics and hypothesis testing using non-parametric tests is
conducted on the responses to statements common to both questionnaires in order to help
answer RQ 5. RQ 6 is answered with the help of an inductive thematic analysis of interviews
conducted with a subset of the participants. More details about the experiment can be found in
Section 6.2 and Appendix F, G, H and I.
42
/
4. Functional Design of the System
This chapter will describe the functional design of the system and begins with an introduction,
followed by a section on using the PSD model to define aspects of the system such as the
intent, event and strategy. System goals are defined based on the fundamental tasks that need
to be conducted with the application, and system features are discussed in terms of relevance
to the context of this application. Functional requirements are drawn up based on the system
goals in Section 4.3. An individual brainstorm is conducted in order to generate ideas for system
features and the location of the system in Section 4.4. The ideated system features are
evaluated against three criteria described in Section 4.5 and scenarios are drawn up in Section
4.6 to further select system features. Finally the preliminary system is described with the help of
a walkthrough of the system in Section 4.7.
4.1 Introduction
The conclusions from Chapter 2 found that the space of designing interventions aiding in the
sustainable consumption of food merits further research particularly in the area of purchasing of
food. Another conclusion was that one of the most effective ways to reduce one’s ecological
footprint is to consume less animal protein and dairy products. The functionality of the system in
this report will therefore be designed with the aim of helping people purchase fewer animal
proteins and dairy products by supporting a transition to sustainable alternatives. A survey
conducted by Mundkur (2020) found that young adults blamed their unsustainable consumption
habits on the price of the alternatives. Therefore, the functionality of the system will be designed
to reflect this barrier to sustainable consumption experienced by the target demographic.
This chapter will focus on designing the functionality of the system, which will be designed using
the PSD model framework. This involves defining the intent, event and strategy of persuasion;
which translates to the goals of the system designer, the problem domain, and the message and
route. The designed system is also prototyped and evaluated and this is described further in
Chapter 6. This chapter answers RQ3: “ How can relevant features be implemented in the
proposed system? ” by ideating system features using an individual brainstorm in Section 4.4
and then evaluating them against a set of criteria in Section 4.5.
43
/
4.2 Designing the System using the PSD model
As mentioned in the previous section, the PSD model breaks down the process of designing a
behavior change system into three aspects: the intent, the event and the strategy. The Intent,
Event and Strategy are defined in sections below, and an Individual Brainstorm is used to define
certain aspects of the Event and Strategy such as the technology context, and route.
4.2.1 Intent of the System Designer
Oinas-Kukkonen & Harjumaa (2009) list two ways of analyzing the intent of a system:
determining the persuader of the system and defining the change type. The persuader of the
system could be the creators of the system (endogenous), the people who distribute the system
(exogenous), or the people who are driven to change a certain behavior and acquire the
technology out of their own volition (exogenous). The proposed system falls under the category
of exogenous, as the functionality of the system will be designed for a scenario where a
prospective user would like to reduce their environmental footprint or simply consume less
animal proteins and/or dairy products and acquire the system to help them with this. The system
will attempt to change behaviors instead of attitudes, as attitudes are harder to change than
behaviors, and a change in behavior can more easily lead to a change in attitude (Miller, 1973).
The system is designed to be used as the user is planning their grocery list, so that the system
takes a context-based approach, where the user is persuaded to perform a target behavior as
they perform the unwanted behavior, which in this context is planning to buy unsustainable meat
and dairy products.
4.2.2 Event of Persuasion
Oinas-Kukkonen & Harjumaa (2009) state that to analyze the event of persuasion, one must
understand the use context, the user context and the technology context. The use context of the
proposed system is to reduce the consumption of animal proteins and dairy products, due to
their widespread, negative impact on the environment. The user context is young adults in the
Netherlands, particularly students or recent graduates who have a lower budget to spend on
groceries than adults, who typically earn more. Mundkur (2020) identified that the price of
alternatives was a significant concern for this demographic. Below, two personas are drawn up
to represent potential users of the system and the target demographic that the system is aiming
to address.
44

/
Personas
Beth
Image 1. Beth
2
Beth studies microbiology and is in the first year of her master’s program. She is an active
student who is on the varsity rowing team and university debate team. Beth has a busy week
where she leaves the house at 8:15 am and returns home at 6:00 pm to do her groceries and
eat dinner with her housemates before she leaves for her extracurricular activities. Beth has
little time to plan her meals and shop for herself, and is part of a student house where every
housemate cooks dinner for themselves and their housemates on one day of the week.
2 https://unsplash.com/photos/6RTM8EsD1T8
45

/
Jerry
Image 2. Jerry
3
Jerry has recently graduated university and is working his first job. He is a laid back worker, who
works from 9:00 am to 5:00 pm, and enjoys the rest of his days watching tv-serials and grabbing
a drink with his friends. Jerry gets home from work around 5:30 pm and shops for his food a few
days at a time. He has a mild interest in cooking and looks up new recipes on the internet to try
out on his own.
These personas illustrate that there can be very different users within a demographic. They help
illustrate the possible differences and how this may affect the style of their usage of the system.
This will be explored further in the two scenarios in Section 4.6. The technology context is
another aspect of defining the event of a system, and this will be covered in the Individual
Brainstorm in Section 4.4.
4.2.3 The Strategy
Determining the strategy of the system depends on the route that will be taken: persuasion,
conviction or a combination of the two. Oinas-Kukkonen & Harjumaa (2009) state that
persuasion makes use of “symbolic strategy” that trigger emotions, and conviction uses
strategies “rooted in logical proof”. This is analogous to the nudge based and information-driven
approaches to persuasion. The route used for the proposed system will depend upon the way in
which the system features are manifested. The appropriateness of system features can be
determined once the goals of the researcher, and indirectly the system, are more clearly
defined.
3 https://unsplash.com/photos/Kyoshy7BJIQ
46
/
System Goals
Based on the findings of Mundkur (2020), the young adult population in the Netherlands have
high levels of perceived consumer effectiveness, environmental concern and awareness of
existing alternatives. The primary barrier to sustainable food consumption most commonly cited
by respondents to a survey published by Mundkur was the higher price of alternatives for meat
and dairy products. This begs the question, will meat and dairy alternatives remain more
expensive than their traditional counterparts?
Market Situation
The New York Times published an article on the increasing popularity of replacement meats and
meat analogues, finding that large meat companies in the United States such as Tyson and
Smithfield are investing in the meat replacements as they see potential in the industry and want
to be part of the change (Yaffe-bellany, 2019). In the Netherlands, local news agencies have
reported a dramatic increase in demand for meat replacement products (Melis, 2019; Nos,
2020). Jeske, Zannini, & Arendt (2018) describe the market for plant based dairy substitutes as
growing due to an increase in consumer awareness of the environmental impact of traditional
dairy products and the health benefits of a plant based diet.
By increasing the awareness of the consumer regarding the current state of the price of
alternatives, as well as their understanding of general availability of alternatives, the consumer
is confronted with the possibility of switching to the alternative more often. With this in mind, a
system that recommends alternatives that are priced at the same level, or lower, than a
considered product can show users that there are affordable possibilities. As stated in the
conclusion of Chapter 2, an effective way of reducing one’s impact on the environment is to
consume less animal proteins and dairy products. Therefore the main goal of this system is to
help consumers consume less animal proteins and dairy products. A subgoal of this is to
address the costs of alternatives in the system, as this was the barrier to sustainable
consumption of the target demographic.
The second goal is to observe the social aspect of behavior change by implementing a social
support feature into the functional design of the system, as little research has been done on it in
the space of sustainable grocery purchasing. A third goal is to observe the effect of personal or
custom goal-setting in the context of behavior change with regards to sustainable grocery
purchasing. This goal was added because little work has been done in observing its
effectiveness in aiding behavior change.
With these goals, the system keeps users constantly informed on the price of alternatives
specific to their food choices, allows the user to compare their performance to the group,
persuades the user using social norms, and allows the user to set achievable goals.
47
/
In summary, the goals are:
1. To help users consume less animal proteins and dairy products through using the
context-based system.
a. Address the costs of alternatives in the system.
2. Help investigate whether normative influence affects sustainable alternative purchasing
behavior.
3. Help investigate whether personal goal setting affects sustainable alternative purchasing
behavior.
Relevance of System Features to the Proposed System
With regards to the main research question of designing a context-based system that helps
consumers to practice more sustainable consumption habits i.e. reducing the consumption of
animal proteins and dairy products, the system features found in literature were considered in
terms of their applicability and relevance to the goal. The findings from a survey of young adults
in the Netherlands by Mundkur (2020) show that price was the most significant factor in deciding
how sustainably young adults acted while choosing their groceries. Therefore the system that
will be designed, will take into account the price of alternative, more sustainable products, while
persuading consumers to purchase them.
Social Credibility Support (SCS)
With regards to this context, features from the SCS category such as Authority, Real-World feel,
Verifiability and Third Party Endorsements are less relevant because the point of persuasion
comes down to a more practical matter of cost. In the survey conducted by Mundkur (2020),
young adults were aware of the impacts of meat and dairy products on the environment, and
blamed the cost of the alternatives to be the reason they didn’t adopt more sustainable habits.
This work will build on the work by Mundkur (2020), and so in the case of young adults in the
Netherlands, referring them to an authority, informing them of the motives of the designers of
the system, showing expertise, verifying its sources or including third party endorsements will
not change the practical fact of the cost of alternatives. The other features from this category
that were used in literature, Trustworthiness and System Credibility, are more applicable to this
task. Providing honest, unbiased information about the price of alternative products and
designing the system to have a competent look and feel are relevant features of a system that
aims to help consumers reduce consumption of certain products by making them aware of the
price of alternatives and putting that price in context.
Social Support (SS)
48
/
Concerning the SS category, Social Comparison and Social Learning were the most popular
features. From the results of the survey done by Mundkur (2020), many respondents used the
reason that they were students to justify their unsustainable behavior. By introducing features
from the SS category, it would allow the users to compare their decisions to those made by
others who are in the same boat i.e. students and young adults. This could have a motivating
effect where users find that members of the same group they are part of i.e. students are
making more sustainable choices despite being in a similar financial situation. A study by Jain et
al. (2013) that investigated the social comparison effect of group energy usage on an individual
user’s energy usage, found that social influence helped reduce energy consumption of
individuals due to social norms and an element of competition. To the author’s knowledge, no
existing work has been found to employ normative influence in the domain of sustainable food
purchasing, which would make its application in this domain novel.
Primary Task Support (PTS)
Certain features from the PTS category are well suited for the context of this application.
Reduction, Self-monitoring, and Simulation are popular features that are used in eco-feedback
applications as seen from Table 3. Reduction is a relevant feature for the purpose of exposing
users to sustainable alternatives of products, by making the difficult task of finding sustainable
alternatives easier. Self-monitoring is the most common feature from this category and is
important as it gives users an overview of their performance, which can be used to persuade
them to maintain “good behavior” or motivate them to perform better. Simulation is an important
feature as the link between cause and effect of behavior can be quite abstract to an individual,
especially in the context of environmental damage, where the problems are often geographically
distant from the consumer and harder to empathize with. Simulation can be used to make the
link between behavior and impact more clear as a form of persuasion. This can be useful when
applied to relationships where the impact on something is distant and intangible. Personalization
and Tailoring are features often seen being used for a younger demographic in research, such
as children in schools, and therefore may not be appropriate for the target demographic of this
system: young adults. Tunneling is a feature that can be woven into an existing feature such as
Reduction or Simulation, and provide a means for action that can bring the user closer to a goal,
such as performing better with regards to Self-monitoring.
Dialogue Support (DS)
Finally the DS category, one of the least used categories of system features, is considered.
Certain features in this category, such as Rewards and Praise, are used in gamified
applications, like in the work of Bomfim et al. (2020, April). Social Role is the most popular
feature due to many applications including some form of social comparison and competition.
Suggestion is a feature from this category that is particularly relevant for introducing a user to an
alternative product and suggesting they choose it over their original choice. A table below was
created to provide an overview of the potential system features for the proposed system.
49

/
Table 8. Candidate system features from the PSD model for the proposed system
Out of the candidates in Table 8, Trustworthiness and Social Role will be inherently
implemented if the decision is made to include Self-monitoring and either feature from the Social
Support category. This would mean that unbiased, honest information is shown to the user
(Trustworthiness) while implementing Self-monitoring and that the system would play a social
role in connecting users to others through comparative elements. Surface Credibility is the
competent look and feel of a system, and will be included in the system as the design of the
user interface will be informed by usability heuristics introduced by Nielsen (1995).
4.3 Functional Requirements of the System
Now that the system goals have been established, the functional requirements of the system
can be determined to help guide the system feature evaluation in the next section. To reiterate,
the goals of the system are:
1. To help users consume less animal proteins and dairy products.
a. Address the costs of alternatives in the system.
2. Help investigate whether normative influence affects purchasing behavior.
3. Help investigate whether personal goal setting affects sustainable alternative purchasing
behavior.
Based on these goals, the system must have the following functional requirements:
FR1. Find sustainable alternatives to a product the user chooses.
FR2. Present the user with alternatives to the products they choose.
FR3. Show the user the difference between the cost of the product they choose and the
available alternatives.
FR4. Keep track of metrics affected by making sustainable decisions to use as persuasion.
FR5. Present the user with a comparison of their performance to other users or a group.
50
Primary Task Support
Dialogue Support
System Credibility
Support
Social Support
Reduction
Suggestion
Trustworthiness
Social Comparison
Tunneling
Social Role
Surface Credibility
Normative Influence
Self-monitoring
/
FR6. Present the user with information on group behavior regarding sustainable alternative
purchasing behavior, which serve as social norms.
FR 7. Allow users to set their own goals for improving Self-monitoring metrics.
The functional requirements listed above were designed to help achieve the main goals of the
system. The Self-monitoring metrics mentioned in the list above will be ideated in the brainstorm
in the following section. Functional requirements FR1 and 2 are essential to increasing users’
awareness of the general availability of sustainable alternatives and keeping them informed on
their prices. They will allow for the user to be informed if there is a new low-budget alternative
introduced into the selection, which they would have otherwise not been aware of if they hadn’t
been consciously looking for one. These requirements also help offload the search from the
user onto the system, thereby making a complex task of finding alternatives, easier. The
requirements FR3 and 4 were defined to address a significant barrier to sustainable
consumption experienced by the target demographic reported by Mundkur (2020), which is the
cost of alternatives. The requirements FR5 and 6 stem from the unexplored role of social
influence on persuasion with regards to sustainable grocery purchasing. Finally FR7 stems from
including a personal goal-setting feature to allow the user to set achievable, realistic goals.
4.4 Individual Brainstorm
Currently there is one aspect from the Event that hasn’t been defined, which is the technology
context. A decision needs to be made on where in the shopping experience the system will be
designed to be used. In addition, the implementations of the system features for the context of
grocery shopping need to be ideated to further define the Strategy. An individual brainstorm
was conducted by the author in order to generate ideas for what the system can be designed
for, as well as ways in which relevant system features from Table 8 can be worked into the
design of the system. Ideas were generated based on what was found in literature regarding
technology and features while putting them in the context of grocery shopping. The result of the
brainstorm can be found in Appendix B, where the brainstorm is visualized using a mind-map.
Brainstorms were conducted on each system feature, on how to implement variations of
features seen in literature. During the brainstorm, the author compiled a list of implementations
of system features from related work and thought of ways to apply it to the context of purchasing
sustainable alternatives. An example of this is taking the color-coding approach to Reduction
from the application by Farr-Wharton, Foth & Choi (2013) and thinking of how this could be
applied to a system where users are alerted to products with sustainable alternatives available.
System Location
51
/
Three relevant places emerged that the system could be designed for resulted from the
brainstorm. In order to do this, a mental walkthrough of the supermarket shopping procedure
was conducted where the author thought of the different things that a consumer interacts with
while shopping. Things that a user interacts with while shopping that the system can be
designed for are: a shopping basket, a shopping cart, and a smartphone. Out of these three, a
smartphone is the best choice for a number of reasons. The first of which being that software to
develop a prototype for the smartphone is free and easily available. The system requires a user
interface, and so if the shopping cart or basket were going to be the location of the system, they
would require some sort of mobile computer that can process input data. A smartphone serves
as said mobile computer, and can be mounted in or on shopping baskets or carts and serve the
same purpose as a standalone application designed solely for use on a smartphone. The
addition of the smartphone to the basket or cart would make them ‘smart’. The smartphone has
become ubiquitous in our lives and is a common technology for interfaces for behavior change
to be developed for as can be seen in Table 7. For these reasons, the decision was made to
design the system for use on a smartphone. In addition, the system will be referred to as the
“application” or “app” from hereon. This decision is backed by the conclusions of Mundkur
(2020), who found that researchers recommend designing interventions for behavior change
while the target behavior is being conducted to guide the user through the new behavior, as
opposed to just reminding them to perform the new behavior at an unrelated time. Designing the
system for a smartphone would mean that the system can be used while in the grocery store as
well as outside it, or in other words that the environment they use the intervention in is flexible
and not tied to a particular place.
System Features
During the brainstorm, each system feature from Table 8 was considered in the context of an
application that helps people make more sustainable decisions in the supermarket. Inspiration
for system features was drawn from the work covered in Chapter 2.
Simulation
When brainstorming ideas of how simulation could be integrated into the application, ideas were
formulated around making the user aware of their impact of their decisions on the environment
in an abstract way. One idea was that the user could maintain a garden or plant through their
purchasing decisions, where “good” choices benefit the plant/garden whereas “bad” choices
cause damage to it. Another version of this is a combination of the previous two ideas, where a
cartoon earth is used as a feedback device without interacting with the user directly. The
cartoon earth will have various versions that reflect the user’s performance in an abstract way. If
the user is making unsustainable choices, then greenery is replaced with brown deserts and the
oceans’ color changes from blue to grey and vice versa for good behavior.
Reduction
52
/
When coming up with ways to use Reduction in the application, the central idea was to make
complex tasks easier, which in this case is finding sustainable alternatives to a chosen product.
One idea is for an icon to appear next to a product that indicates that the product has a large
negative impact on the environment. Alternatively, an icon could indicate that there are more
sustainable alternatives to an item chosen by the user. Another idea is that instead of an icon,
color coding could also be used to indicate to the user that alternatives exist for a given product.
Text could be used to alert the user that sustainable alternatives are available for a product they
have chosen. If a concept from simulation would be integrated with this, the avatar could remind
the user how their choice here will impact the environment.
Suggestion
If an item has sustainable alternatives available and the user is made aware of this using one of
the methods of Reduction listed above, the user can be provided with a single best alternative
chosen from a list that is available for the user to go through if they wish. An alternative to this is
showing the user the list of available alternatives from which they can choose from. The ideas
from the suggestion category are also forms of Reduction as they simplify the complex task of
finding alternatives by presenting the user with a selection.
Self-monitoring
Self-monitoring is used to provide users with an overview of their performance, usually with the
help of certain performance metrics that are tracked over time. In this context, an idea is to
create an “environment score” that increases every time a user chooses one of the alternatives
presented to them, or directly chooses a sustainable product without it having to be suggested
to the user. This score will decrease if unsustainable choices are made by the user, and the
user can track this over time. Another metric is to display to the user the number of sustainable
alternatives chosen in a certain window of time. This could be per day, or per week and is
similar to the environmental score but less abstract. This metric can be split into two metrics,
one for the number of meat replacements chosen, and one for the number of dairy
replacements chosen.
Tunneling
Tunneling is where users are guided through an activity while being persuaded along the way.
This category ties into previous ideas of Simulation as well as Self-monitoring, where in addition
to the suggestions of alternatives, the user can be shown their previous performance and how
choosing an alternative would help that. Alternatively, if the user decides not to choose any
alternatives, a popup could be used to ask them to verify this choice while showing an image of
a deteriorating forest or coral-reef. The user can be shown how each alternative brings them
closer or further away from their personal goals that they set.
53
/
Social Comparison
This can take the form of a leaderboard where the users with the best self-monitoring metrics
are displayed, so that a user can compare their performance to those on the leaderboard and
be motivated to improve their performance. This also shows users that change is possible and
that they are not alone in making sustainable choices which provides a feeling of community.
Another idea is to compare the performance metrics of the individual to the group average of
those metrics. This will give the user an idea of how they are performing relative to the group in
a direct way.
Normative Influence
An idea is to display to users the sustainable choices that others are making in a sort of social
media-like feed. This can allow the user to reflect on choices they are making and strive to
improve when they see others making better, more sustainable choices. Another avenue is to
display group statistics to the user without directly comparing their own. By not directly
comparing the users statistics, they may be driven to seek out how they are doing compared to
the group and reflect on this. This can be done by showing the user a statistic of the number of
times other users have chosen a sustainable alternative in a certain window of time. Another
example is for a given product, show the user that a certain percentage of other users choose a
sustainable alternative for the product that the user is considering. Another normative influence
could be statistics on other group members meeting their goals.
Goal Setting
With regards to goal-setting the idea was to simply allow for users to set their own goals with
regards to the eventual Self-monitoring metrics that the system bases their performance on.
This feature can be included on the overview of the metrics along with the comparison to the
group’s performance. This allows the user to have an overview of their performance, how it
compares to the group, and to set goals in order to improve their performance.
These ideated system features are evaluated in the next Section to arrive at a selection of
system features that are relevant to the functional requirements of the system, that are novel
and that are feasible to implement given the scope of this thesis.
4.5 Evaluation of Ideated System Features
As mentioned in the Methodology Chapter in Section 3.1, following the individual brainstorm to
generate ideas, the generated ideas would be evaluated using criteria to determine which are
chosen to be implemented in the application. The criteria that the ideas will be evaluated against
are given below and the evaluation is conducted by the author.
54

/
Criteria
- Novelty
- Feasibility
- Relevance to Functional Requirements
The Novelty criteria was chosen to evaluate the ideas to different new system features to those
that have been used in literature and has two levels: previously employed and novel. Here
novelty is considered in the contexts of food consumption and sustainable food consumption.
Features are considered “previously employed” if similar implementations have been found in
related work of the two contexts mentioned. A feature is considered “novel” if the feature has not
been used in a similar way in related work from the contexts of sustainable food consumption
and food consumption. The Feasibility criteria was chosen to judge whether the feature is
feasible to implement in a high fidelity prototype within the scope of the thesis, and depends on
complexity of the feature, development skill of the researcher and time required to implement it
in the application. This criteria has two levels: feasible and infeasible. Finally, an important
criteria to judge ideas with is their relevance to the Functional Requirements of the application
i.e. whether they support functionality that helps achieve the goals of the application. The levels
for this criteria are related and unrelated. The criteria are not weighted evenly, with the
Relevance to Functional Requirements having the highest weight, followed by Novelty and
finally Feasibility.
The system features described above in Section 4.4 and shown in Appendix B in Figure B1
were compiled into Table 9 below and judged against the criteria above. For the criteria of
novelty, the core of the generated feature idea was generalized to help compare it with related
work.
55
Number
System
Feature
Category
System
Feature Idea
Similar use in
Literature
Feasibility
Relevance to
Functional
Requirement
s
1
Simulation
A cartoon
character
symbolizing
the effect of
the product
on the
environment.
Novel
Feasible
Irrelevant

/
56
2
Simulation
Users
maintain a
plant/garden
and its
health/growth
are affected
by the user’s
decisions
regarding
groceries.
Novel
Feasible
Irrelevant
3
Simulation
An avatar
providing
feedback.
Previously
Employed by
Schaefbauer
et al. (2015,
February)
and Pollack
et al. (2010)
Infeasible
due to time
Irrelevant
4
Suggestion
Provide a
user with a
list of
alternatives
to a certain
item.
Previously
Employed by
Bomfim et al.
(2020, April)
Feasible
Relevant to
FR 1, 2 and 3
5
Suggestion
Provide the
user with a
sustainable
alternative for
a single item.
Previously
Employed by
Wayman &
Madhvanath
(2015,
September)
Feasible
Relevant to
FR 1, 2 and 3
6
Reduction
Icon showing
that a chosen
product is
bad for the
environment.
Novel
Feasible
Irrelevant
7
Reduction
Icon to show
that
sustainable
alternatives
are available
for a given
item.
Novel
Feasible
Relevant to
FR 1 and 2
8
Reduction
Color coding
Previously
Feasible
Relevant to

/
57
to show
availability of
alternatives
for a certain
item.
Employed by
Bomfim et al.
(2020, April)
and
Farr-Wharton
, Foth & Choi
(2013)
FR 1 and 2
9
Reduction
Use text to
alert the user
that an
alternative is
available.
Previously
Employed by
Bomfim et al.
(2020, April)
Feasible
Relevant to
FR 1 and 2
10
Tunneling
Indicate how
alternatives
affect metrics
of
self-monitorin
g.
Previously
Employed by
Bomfim et al.
(2020, April)
Feasible
Relevant to
FR 6 and 7
11
Tunneling
Show image
of
environment
impacted by
chosen
product after
suggesting
alternative.
Novel
Feasible
Irrelevant
12
Tunneling
Show
whether an
alternative
helps
accomplish
any of their
set goal(s).
Previously
Employed by
Bomfim et al.
(2020, April)
Feasible
Relevant to
FR 7
13
Self-monitori
ng
Giving the
user a score.
Previously
Employed by
Aydin et al.
(2017)
Feasible
Relevant to
FR 4, 5 and 6
14
Self-monitori
ng
Counting the
number of
meat
alternatives
the user
Novel
Feasible
Relevant to
FR 4, 5 and 6

/
58
chooses.
15
Self-monitori
ng
Counting the
number of
dairy
alternatives
the user
chooses.
Novel
Feasible
Relevant to
FR 4, 5 and 6
16
Social
Comparison
Compare
metrics of the
user to the
group
average.
Previously
Employed by
Lim et al.
(2015)
Feasible
Relevant to
FR 5
17
Social
Comparison
Leaderboard
of users with
highest
metrics from
the group.
Previously
Employed by
Chang, Danie
& Farrell
(2014,
September)
Unfeasible
due to
developer
skill and time
Irrelevant
18
Normative
Influence
Show the
user statistics
of how many
other users
have chosen
sustainable
alternatives
for a given
product.
Novel
Feasible
Relevant to
FR 6
19
Normative
Influence
Show the
user social
norms
regarding the
number of
sustainable
alternatives
the group is
purchasing.
Novel
Feasible
Relevant to
FR 6
20
Normative
Influence
Showing the
user the
average goal
completion
rate of the
group.
Novel
Feasible
Relevant to
FR 7

/
Table 9. Evaluation of ideated implementations of system features against criteria
Many of the ideated features were found to be feasible from a standpoint of time, development
skill required and complexity. 12 novel ideas were generated during the brainstorm, and others
were close variants of features seen in related work. 15 of the ideated features were relevant to
the goals of the application. Many of the features however were ideated around one central
system feature, for example, the ideas of highlighting an item, using an icon or text, were all
methods to alert the user to the availability of alternatives to a product for the purpose of
Reduction. Therefore only one of them will be implemented as they are all designed for the
same purpose. During the low-fidelity prototype tests that are described in the following chapter,
the user is asked for their preference between each of these implementations of the system
feature, to investigate preference. In some cases, although ideas were previously used in a
similar capacity by related work, they must be implemented due to their relevance to the
functional requirements of the application. As long as there are a few novel features in the
application, the novelty factor of the application as a whole is maintained.
Table 10 below contains the system features that are novel, feasible and relevant to functional
requirements, or because they are relevant to the functional requirements of the application and
their justification for inclusion.
59
21
Goal-setting
Support and
prompt the
user to set
their own
goals for
Self-monitori
ng metrics.
Novel
Feasible
Relevant to
FR 7
System Feature Category
System Feature Idea
Justification
Suggestion
Provide a user with a list of
alternatives to a certain item.
The core of the application
revolves around making the
users aware of the
sustainable alternatives
available for products,
therefore providing a list of
alternatives is fundamental.
Suggestion
Provide the user with a
sustainable alternative for a
single item.
This is a variant of the feature
above and follows the same
argumentation.
Reduction
Icon to show that sustainable
This is a variant of the feature

/
60
alternatives are available for
a given item.
above and follows the same
argumentation.
Reduction
Color coding to show
availability of alternatives for
a certain item.
This is a variant of the feature
above and follows the same
argumentation.
Reduction
Using text to show the user
availability of alternatives for
a certain item.
This is a variant of the feature
above and follows the same
argumentation. This variant
of the feature however is
novel and can be combined
with one of the related ideas
to create a novel feature for
Reduction.
Tunneling
Indicate how alternatives
affect metrics of
self-monitoring.
This has been previously
employed, however this
feature ties into the
self-monitoring and social
support features and is
therefore necessary. It is
relevant because it provides
a way to convince users if
they are aware of social
norms or wish to perform well
with regards to
self-monitoring.
Tunneling
Show whether an alternative
helps accomplish any of their
set goal(s).
This feature has been
previously employed,
however it is tied to the
concept of Goal-setting and
is therefore necessary. By
informing the user about how
their actions affect their own
goal(s), they are convinced to
make certain decisions in
order to meet their own set
goal(s).
Self-monitoring
Counting the number of meat
replacements a user
chooses.
This is a more
context-relevant and novel
metric, and can be used for
the purpose of normative
influence.
Self-monitoring
Counting the number of dairy
Same argumentation as the

/
Table 10. Features that resulted from evaluation of ideated features.
The Reduction and Suggestion features will serve to make the complex task of finding
sustainable alternatives easier. The Tunneling feature will provide persuasion as they are
guided through the alternatives. The Self-monitoring features will allow a user to track their
performance to give them an understanding of how well they are doing. The Normative
Influence features use statistics of Self-monitoring features of the group to use social norms to
persuade the user to change their habits. The application also features Tailoring as a whole, as
it addresses the barrier to sustainable consumption experienced by young adults in the
Netherlands i.e. price of alternatives as found by Mundkur (2020).
61
replacements a user
chooses.
feature above.
Self-monitoring
Score that increases when a
user chooses an alternative
and falls when a user ignores
an alternative.
This is a more
context-relevant and novel
metric, and can be used for
the purpose of normative
influence.
Normative Influence
Show the user statistics of
how many other users have
chosen sustainable
alternatives for a given
product.
This feature is relevant to the
goal of observing the effects
of normative influence in the
context of sustainable
grocery purchasing.
Normative Influence
Show the user social norms
regarding the number of
sustainable alternatives the
group is purchasing.
Same argumentation as the
feature above.
Normative Influence
Showing the user the
average goal completion rate
of the group.
Observe the effect of
normative influence of group
goal meeting success rate on
individual’s motivation to
complete goals.
Goal-setting
Support and prompt the user
to set their own goals for
Self-monitoring metrics.
This feature is included in
order to help users set
realistic, achievable goals
/
4.6 Scenarios
In order to help decide between certain similar features such as those for Reduction and
Suggestion, two scenarios were drawn up for potential use cases of the application.
Scenario 1
Beth has finished her last lecture for the day and quickly bikes home. Before she leaves
university, she messages her housemates to ask how many of them will be joining for dinner
that night. When she arrives home, she hurriedly thinks of a simple dish and uses the
application to create a grocery list. Beth bikes to the grocery store and as she enters the store,
pulls out her phone and loads the application on her smartphone. The application analyzes the
list and presents the items for which a sustainable alternative exists. Beth then views the
suggested alternatives to her original product, and how the product affects her self-monitoring
metrics, as well some facts about the group purchasing habits. Beth makes a decision to
choose the alternative suggested to her and continues with the other items on her list. The
system stores the information for the alternative she chose for her metrics. She quickly finishes
her shopping and races home to cook a meal for her roommates and eat a small portion, before
heading out for her evening activities. Later that evening, Beth views her performance with
regards to the metrics and sets the goal of purchasing two sustainable alternatives, as she sees
the rest of the group doing better than her.
Scenario 2
Jerry finishes work at the office and catches the bus home. While on the bus, he browses the
internet for a new recipe to try for dinner that night. He finds one, and uses the application to
make a grocery list for the ingredients. He arrives home and leaves for the grocery store by foot.
Jerry gets to the store and opens the application as he grabs a shopping basket. The
application highlights certain items on the list with sustainable alternatives available and Jerry is
presented a list of alternatives and how each of them affects his metrics. Information on the
group’s behavior is also presented to Jerry as he scrolls through the list. He then navigates to a
page in the application which shows him his progress with his metrics. Jerry sees that he hasn’t
been performing too well in the past weeks, and goes back to the list of alternatives and
chooses one that suits the recipe he is planning to make. After dinner, Jerry sets himself the
goal to purchase more meat replacements as he sees that the group is successful at achieving
their goals 84% of the time.
From these scenarios of two different use cases, it can be seen that there are at least two types
of users of the system: those that use it in a rush, and those that have more time to use it.
62
/
Therefore for Suggestion, the system feature should be tailored to suit users who want to use
the application quickly, while also allowing for users with more time to get more information.
With regards to Reduction, the application should make it as obvious as possible that there is an
alternative available for a certain product, and the way in which it does so will be decided by the
results of the low-fidelity prototype test in the next chapter.
4.7 Preliminary System Description
Using the PSD model, the intent, event and strategy of the application were defined in this
section. The goals of the application were identified, and functional requirements were drawn up
based around these goals. System features were narrowed down by discussing their relevance
to the context of grocery purchasing. Implementations of these relevant system features were
then ideated using an individual brainstorm. These ideated features were then evaluated
against the criteria of novelty, feasibility and relevance to functional requirements of the system.
The result of this evaluation was a list of system features which are novel, feasible and relevant
to functional requirements, and in some cases only relevant to functional requirements.
Scenarios were then drawn up to express different use cases of the application. The resulting
application is described below with the use of a walkthrough of the system, which describes the
usage of the application.
4.7.1 Walkthrough
The application will be designed for use on a smartphone, and will allow users to enter products
they wish to purchase to form a list. The application will then analyze these products in order to
find sustainable alternatives for them. The user will be alerted to the products with sustainable
alternatives available using color-coding, text or an icon, so that the user is provided with an
easy-to-understand overview of which products in the list have available alternatives. These
alternatives will be compiled into a list, and the user will be presented with an overview of them
and how they affect their Self-monitoring metrics and self-set goals if any.
The application will provide information about group purchasing behavior with regards to
purchasing of sustainable alternatives in order to apply normative influence to the user. The
user can choose to select the presented alternative or browse through the other alternatives
available. The user can also choose to ignore the suggested alternative, which will in turn affect
their metrics. At any point during the interaction, the user is able to navigate to a page in the
application that displays an overview of the tracked metrics, and a comparison with the group
performance, to give them an understanding of their performance.
63
/
The user is presented with social norms while viewing the alternatives in order to apply
persuasion in the moment of decision making rather than later, as this is the most effective way
to persuade someone to perform a new action as was found by Mundkur (2020). Likewise, the
user is provided with sustainable alternatives as they are deciding what to purchase instead of
at another time when they are planning their meals. The novelty of this system is that it uses
Normative Influence as a method for driving behavior change that has been explored little in the
space of sustainable grocery purchasing, and that it allows users to set their own goals and
work towards them, another novel feature that has not been seen implemented in the systems
reviewed in Chapter 2.
This chapter aimed to answer RQ3: “ How can relevant features be implemented in the proposed
system? ”. In order to do this, system goals were established and system features from the PSD
model were looked at in terms of relevance to the proposed system based on findings from
Mundkur (2020) and the answer to RQ1: “ What are sustainable food consumption habits?”.
Implementations of system features that were deemed relevant were ideated in an individual
brainstorm, and evaluated against the criteria of novelty, feasibility and relevance to functional
requirements of the system. The resulting table of system features in Table 10 is an answer to
the RQ3.
64

/
5. Low-Fidelity Prototype
This chapter describes the design of the low-fidelity prototype, the low-fidelity prototype test and
its results. The chapter starts with Section 5.1 that details design decisions made for various
user interface components of the application. Following this, Section 5.2 describes the general
layout of the application. Section 5.3 discusses the goals of the low-fidelity prototype test,
recruiting method, materials required and other aspects of the user test, followed by Section 5.4
which details the test protocol. The method behind the design of the post test interview
questions is discussed in Section 5.5 with Section 5.6 detailing the results of the low-fidelity
prototype test, consisting of answers to interview questions and observations made by the
researcher during the participants’ interactions with the prototype while performing assigned
tasks. The results are further discussed in Section 5.7 in order to answer RQ4: “ Is the proposed
system intuitive to use? ”, with the chapter ending in Section 5.8 with findings that will be taken
into consideration while developing the high-fidelity prototype.
5.1 Designing the Prototype
Based on the preliminary system description from Section 4.7 a number of aspects of the
application need to be designed: the item list, the item input method, the overview of progress,
the goal setting feature, the way an alternative is presented, and presenting social norms to the
user. The technology company Google has developed design guidelines and standards for their
mobile applications and put them under the title of Material Design . Google uses Material
4
Design to inform the user interfaces of their applications and has become an industry standard.
The basic interface elements of the prototype will be designed using Google’s Material Design.
Below in Table 11, the features that will be implemented in the system can be found.
4 https://material.io/design/introduction
65
Feature
Number
System Feature
Category
System Feature Idea
Justification

/
66
1
Suggestion
Provide the user with
a fitting sustainable
alternative for a
single item with the
option to view others.
The core of the application
revolves around making the
users aware of the sustainable
alternatives available for
products, therefore providing a
list of alternatives is
fundamental.
2
Reduction
Indicate that a
product has available
sustainable
alternatives.
Indicating which products have
available alternatives is
necessary when showing users
that alternatives exist to
products they typically
consume.
3
Tunneling
Indicate how each
alternative affects
their Self-monitoring
metrics.
This has been previously
employed, however this feature
ties into the self-monitoring and
social support features and is
therefore necessary. It is
relevant because it provides a
way to convince users if they
are aware of social norms or
wish to perform well with
regards to self-monitoring.
4
Tunneling
Show the user
whether each
alternative affects
their accomplishment
of their set goal(s).
This feature has been
previously employed, however
it is tied to the concept of
Goal-setting and is therefore
necessary. By informing the
user about how their actions
affect their own goal(s), they
are convinced to make certain
decisions in order to meet their
own set goal(s).
5
Self-monitoring
Counting the number
of meat replacements
a user chooses.
This is a more context-relevant
and novel metric, and can be
used for the purpose of
normative influence.
6
Self-monitoring
Counting the number
of dairy replacements
Same argumentation as the
feature above.

/
Table 11. Table of numbered features that will be included in the application
The design of the features in this application are based off and influenced by related work and
their implementations of similar system features. For the Reduction, Suggestion and Tunneling
features, three implementations of each are designed, and one of each is included in the
low-fidelity prototype while the others are presented to the user after the test during an interview
in order to find a preference between the different implementations.
67
a user chooses.
7
Self-monitoring
Score that increases
when a user chooses
an alternative and
falls when a user
ignores alternatives.
This is a more context-relevant
and novel metric, and can be
used for the purpose of
normative influence.
8
Normative Influence
Show the user
statistics of how
many other users
have chosen
sustainable
alternatives for a
given product.
This feature is relevant to the
goal of observing the effects of
normative influence in the
context of sustainable grocery
purchasing.
9
Normative Influence
Show the user social
norms regarding the
number of
sustainable
alternatives the group
is purchasing.
Same argumentation as the
feature above.
10
Normative Influence
Show the user the
goal success rate of
the group to motivate
the user to set and
accomplish their own
goals
This feature is novel to this
system and will help observe
the effect of normative
influence on goal setting in the
context of grocery shopping.
11
Goal-setting
Support and prompt
the user to set their
own goals for
Self-monitoring
metrics.
This feature is included in
order to help users set realistic,
achievable goals

/
5.1.1 The Item List
The item list has the function of giving users an overview of what they have added and need to
buy. This page plays a similar role to that of the page in Figure 5, where users are shown items
in their fridge and how close they are to expiring using color coding. As such, it will be designed
with a similar aesthetic, where products are shown one under the other, with an indication of the
availability of sustainable alternatives (Feature 2). The three different implementations for
Reduction are shown below in Figure 19, using color-coding, an icon, and text to indicate to the
user that an item has sustainable alternatives available.
FIgure 19. Different implementations of the Reduction feature, the implementation on the left is used in the prototype.
Color-coding (left), Icon indicating alternatives available (middle), Text indicating alternatives available (right)
5.1.2 Item Input Method
The user needs to be able to add products to their item list which they wish to purchase in order
to find alternatives. This can be done in a variety of ways, a straightforward way of doing so is
68

/
typing in a product directly into the list. However, the application will need to look up alternatives
from a database based on what the user has entered. So a search engine like design is used,
where the user types a product into a search bar, and results are displayed below it.
FIgure 20. Example of search results displayed under search bar in GSMArena (left) and implementation in
5
prototype (right)
The design in Figure 20 gives users an idea of the products available from a catalogue and
allows the user to pick from one of these. This choice is then used to find alternatives from the
database.
5.1.3 Progress Overview
This is used to give the user an overview of their performance regarding the metrics being
tracked by the application. The design of this is inspired by related work in the field of
eco-feedback. Figures 14 and 16 from Section 2.2.3 are good examples of this. The relevant
designs were compiled to give a better understanding below in Figure 21. Bar, line or scatter
plots can be used to plot metrics over time, giving the user an overview of their performance.
5 gsmarena.com
69

/
Placing related metrics on the same graph has been done by Kjeldskov et al. (2015, April) and
Froehlich et al. (2012, May) and is a way of presenting a concise, clear overview to the user.
FIgure 21. Examples of progress overviews from related work in the field of eco-feedback (left Kjeldskov et al. 2015,
April and right Froehlich et al. 2012, May)
Employing eco-feedback for energy usage, Pektov et al. (2012, September) compared the users
consumption to the group’s performance in a simple way by showing the two groups, those that
perform well and those that don’t, and placing the user in one of those groups based on their
metrics. Features 8, 9 and 10, involving Normative Influence, will be implemented in a similar
way, by numerically comparing the user’s performance to the group performance.
Self-monitoring Metrics
The metrics that are used to measure the user’s performance are a score (Feature 7), the
number of meat alternatives they have purchased (Feature 5), and the number of dairy
alternatives they have purchased (Feature 6). The latter two are moving averages of the
number of instances where an alternative is chosen over the initial choice.
A score is assigned to each shopping list, where the score for the list is increased by one if the
user purchased a cheaper alternative and by two if a more expensive alternative is chosen. The
score is lowered by one if the user decides not to choose alternatives presented to them when
they are more expensive, and two if the user rejects alternatives that are cheaper than their
chosen product. It is therefore possible that a user receives a negative score.
5.1.3 Presenting Sustainable Alternatives
70

/
Presenting the user with sustainable alternatives to a chosen product is an essential part of the
application (Feature 1, Suggestion). Using the scenarios in Section 4.6, the option of presenting
the user with a single sustainable alternative with the option to view others was chosen to
appeal to the users that use the system in a rush, thereby reducing the complexity of the task of
finding alternatives even further; while allowing those with more time to browse through the
other options. Figure 22 below shows three different implementations of displaying alternatives
to the user. Each item indicates whether it helps the user achieve a goal they had previously
set, its price and how it affects their score. By selecting an option, it will be added to the basket
in place of the original item. Figure 22A is the implementation used in the prototype, while
Figure 22B and C are presented to the user during the interview. The implementation in the
middle numbers the options while the implementation on the right simply shows one with the
option to view the others.
Figure 22. Different implementations of displaying alternatives to the user, with the design on the left included in the
prototype (A, B, C from left to right)
Feature 3 and 4 which are forms of Tunneling also are found on this page of the application.
Similarly, three implementations were drawn up where Figure 23A was included in the
low-fidelity prototype, while Figure 23B and C were shown to the user during the interview.
Figure 23A is an implementation that makes use of text and icons for Tunneling, while Figure
23B uses just icons and Figure 23C uses just text.
71

/
Figure 23. Different implementations of Tunneling, (left) using both icons and text (middle) using just icons, (right)
using just text (A, B, C from left to right)
5.1.4 Goal-setting
The goal-setting feature (Feature 11) will be part of the progress overview, where a user can set
their own goals related to two measures: the number of dairy replacements purchased, and the
number of meat replacements purchased. The user is able to set a timeframe within which they
will try to achieve the goal, instead of an open-ended timeframe to motivate them to make
sustainable choices sooner rather than later. The user is given two options for the timeframe:
the next time they shop, or within a week. These two timeframes were chosen based on the
length of the field study that is described further in Chapter 6. The goal-setting feature is
implemented on the progress overview page, so that users are able to view their existing goals
while setting a new one. This allows them to consider previously set goals and reflect on how
achievable they are and their progress towards them before setting a new goal. Figure 24 below
shows how the goal-setting feature is implemented on the progress overview page. For each of
the goals, the user is shown how close they are to achieving them using a percentage and a
progressing green line.
72

/
Figure 24. Goal setting feature located on the progress overview page.
5.1.5 Displaying Social Norms
Displaying social norms to the user wasn’t done in any of the related work found in the context
of food consumption. Important things to consider here are when and where to display the social
norms to the user during their interaction with application. There are several opportunities, when
they are viewing their progress, when they launch the application, and when they are looking at
alternatives. Displaying social norms to the user as part of their progress overview puts their
progress in the context of the group’s performance which allows for reflection. Displaying social
norms while the user is browsing a list of alternatives is an extremely relevant time to inform
them of the norms, as that is when the decision to buy a product is being made.
Displaying the social norms to the user as a report when the application is opened, informs
users of the group’s performance and may influence decisions made by the user directly after
that. Displaying the social norms in a report when the application is first launched should be
done long enough to ensure the user reads and absorbs the information and shouldn’t be
immediately dismissable, similar to a pop-up. Bahr & Ford (2011) discuss how pop-ups have
been used in interface design for decision making and that the tool is widely used by advertisers
and phishing campaigns; such that the average user responds with frustration or annoyance
when presented with one. For this reason, the decision was made to avoid presenting the norms
as a report, and to present them in the progress overview and while the user browses through
73

/
alternatives. This was not designed for the low-fidelity prototype and the implementations can
be seen in the high-fidelity prototype in Chapter 6.
5.2 Layout
The main page of the application will host the main functionality of the application: adding items
to a list, viewing the existing list and removing items from a list. Items with sustainable
alternatives available are color-coded, use text or an icon to communicate this to the user. The
implementation that will be included in the high-fidelity prototype will be determined by the
results of the low-fidelity prototype test. As is common in application design, navigation is done
using a menu that pops in from the left of the application on the press of a “hamburger icon” as
shown in Figure 25 below. The second page in the application is the progress overview page.
This page can be navigated to by using the navigation menu. This page features an overview of
the user’s metrics in order to give them an understanding of their performance. The user can
also set a new custom goal on this page. The third page of the application shows users
alternatives to a product they pressed on in the main page of the application. An overview of the
interface is given in Figure 26, where the flow of the application is visualized.
Figure 25. Using a hamburger menu for navigation in the Google Play Store application. On the left, the hamburger
icon is circled in blue; on the right, the resulting menu that opens up is displayed.
74

/
Figure 26. Flow of the application
5.3 Designing the Test
In order to design a usability test, Nielsen (1994) discusses the necessity of defining certain
parameters, such as the goal of the experiment, method of recruiting participants, materials
required for the test, the tasks that the user will be asked to perform, whether and how the
researcher will provide assistance if the participant requires any, and the type of data that is
collected and how it will be analyzed. The results of this test will help answer RQ4: “Is the
proposed system intuitive to use?” The test will consist of a participant conducting a set of tasks
with the low-fidelity prototype, and then participating in a semi-structured interview to gain
insight into their experiences with the prototype. This test was approved by the Ethics
Committee of the EEMCS group at the University of Twente with the approval designation
2020-123.
Goal
The first thing that needs to be defined when designing a test, is the goal of the test. The first
goal of this usability test is to determine whether participants are able to accomplish
fundamental tasks in the mock-up application that aid in achieving the system goals. The
second goal is to find preference between different implementations of system features. These
goals are accomplished by setting the participant a list of tasks that are fundamental to using
the application such as adding items to the grocery list, finding items with alternatives and
choosing a suggested alternative.
75
/
Recruitment
Participants of this test should be representative of the target demographic of the proposed
application i.e. young adults in the Netherlands between the ages of 18 and 30. This was the
same age group that was surveyed in earlier work (Mundkur, 2020). Participants are included if
they are interested in consuming less animal protein and dairy products. For the purpose of this
test involving task analysis and observation, 3 to 5 participants will be recruited.
Materials
The materials that are required for the test are a laptop, on which the participant will be
interacting with the lo-fi prototype. In addition the researcher will be taking notes on a notepad.
A task sheet with the tasks printed on them provides the participants with their tasks, the
contents of which is described below. The low-fidelity prototype was in the form of a PDF that
was shared with the participants digitally. Besides this, the consent form that the participant
signed before the test began and questions that were prepared for the post-test interview were
gathered for the test.
COVID-19 Proofing
Due to an outbreak of the Covid-19 virus, the University of Twente has instructed that research
be adapted so that it can be conducted remotely where possible. In accordance with this, the
participants are asked to perform the tasks on their own device, the prototype will be sent to
them digitally. The test is conducted using the video conferencing software Google Meet. The
test protocol has been adapted such that the participants inform the researcher when they have
completed the task so that the times can be accurately recorded. During the call, the participant
is asked to share their screen with the researcher, so that observations can be made. While the
call is being conducted, the participant is asked to record their screen in case additional notes
need to be made on the interaction. The participant’s face will be recorded to analyze together
with the screen recordings.
Briefing
Participants are told they are testing a lo-fi prototype of an application that helps them make
more sustainable decisions regarding purchasing groceries. The protocol of the test is explained
to the participant before the test begins.
Tasks
The tasks that the participant is asked to perform can be found in Appendix C and are based on
functional requirements of the application relating to entering items into the application,
76
/
identifying which have available alternatives, accessing and choosing an alternative, finding the
overview to their self-monitoring performance metrics, and setting a personal goal for one of the
performance metrics. The activities encompass the actions that the user can take with regards
to the application. The tasks are chosen to highlight the system feature implementations as
much as possible. This explains the tasks of adding the items “broccoli” and “minced beef” to
the shopping cart, as the latter has sustainable alternatives whereas the former does not.
Assistance Protocol
Should the participant require assistance at any point during the test, the researcher will ask the
participant to voice their need for assistance, and provide as little assistance as possible, while
simultaneously helping the participant. This can be in the form of one-word hints or short
phrases.
Data Collection and Processing
Data is collected with regards to the time it takes participants to complete each task as well as
how the user interacts with the prototype by recording the screen of the laptop, and video
recordings of the participants’ faces. The responses to the interview after the test are collected
and analyzed for feedback. The screen recordings, the times, and the answers to the interview
questions are used to inform the design of the high-fidelity prototype. The screen recordings are
reviewed in the context of the participant’s responses to the interview questions.
5.4 Test Protocol
The test protocol for the low-fidelity prototype test has been designed in accordance with
methods described by Nielsen (1994) in his book on Usability Engineering. The protocol can be
found in Appendix D.
5.5 Interview Questions
These questions are prepared for after the participant has completed the tasks given to them.
The questions revolve around the implementations of the system features and the participants’
experience with them and how they can be improved. Nielsen (1994) recommends designing
open ended questions in an interview so that the participant can explain themselves with as little
coaxing from the interviewer as possible. Questions were also designed to ask the user to
reflect on their experiences of completing tasks. During the interview, the participant will be
presented with alternative implementations of the system feature to find if there is a preference
for a particular implementation. The interview questions can be found in Appendix E.
77
/
5.6 Test Results
The test was conducted with 5 participants (P1-5) that were recruited from the age group of
18-30 and screened on whether they wished to consume less animal and dairy products, where
people were included if they wished to consume less animal and dairy products. Four
participants were male and one was female and the average age of the participants was 23.6
years old. The results are described in terms of the answers to interview questions and
observations of the participants.
5.6.1 Answers to Interview Questions
Impressions of the application
Participants described the application as an interesting concept and felt that that application was
intuitive and that things were visible. Two participants mentioned that they liked the goal-feature
where one participant appreciated the fact that you could specify a time-frame for the goal, while
the other said it adds an extra dimension of accountability and they thought people would
commit more to it if they set their own goals. Regarding the user interface, comments were:
P4: “user friendly” and “easy to perform the tasks”
P2: “clear” and “intuitive”
P4 commented on the ease of navigation and that the icons were recognizable and familiar. P3
mentioned that they didn’t feel the application was cluttered and that they were not paralyzed by
choice on the page of the sustainable alternatives.
Experience performing the tasks
There was some variation between the participants’ experiences with performing all the tasks.
Four of the participants commented that it was straightforward and quick because the
application was designed in a way they are used to, and that it was clear for them when they
could press a product. Comments made were:
P3: “very easy to handle”, “I don’t feel like I have to think a lot about anything”
P5: “straightforward application”.
78
/
P2 mentioned that it wasn’t immediately clear which product had alternatives, however later
reflecting that it would be clear when they had more time with the application.
Suggested improvements for application
When asked for suggestions for the applications, the aesthetics of the application were brought
up by two participants, where they found the application to look “blocky”. P2 mentioned that it
would be nice to delete or “swipe off products” when you have bought them, as well as an
explanation as to why the suggested alternatives are more sustainable than the original product.
There were some useful suggestions made regarding the design, where in the case that a goal
was set to consume less meat, each alternative for a meat product would help meet that goal,
therefore it was repetitive to mention that in the product’s tile, and maybe it could be mentioned
in a banner on top of the list, that all the options below help contribute to a personal goal. Other
useful feedback was that the application could include an explanation page, where the role of
the features such as the color-coding, and the icons can be explained so that the user can
refresh their memory if they forget.
Usability rating
Participants were asked to rate the system on a scale from 1 (unusable) to 5 (usable) based on
their experience with performing the given tasks and their overall experience with the interface.
The average score from the five participants’ scoring was a 4.6 with a standard deviation of
0.55, and justifications for the score were “the system was pretty usable”, “when you get used to
it, it is easy and intuitive”, “easy to use and clear”, “because I was able to complete the tasks”.
Issues with interface or application
When asked whether they found anything unclear about the application, or whether something
about the interface was confusing, three of the participants reported that they didn’t find
anything unclear about the application, and nothing about the application confused them. From
the remaining two participants, P2 reported that they wanted to compare the alternatives to
each other, and it wasn’t clear from the interface whether this was a possibility. P4 found the
green color used for color-coding confusing as they thought it implied that the product was
already sustainable, and suggested using a sort of animation that showed it was clickable and
could be further explored. They also made a suggestion regarding goal-setting where setting a
certain goal would put you on a scale of performance, which is a clear indication of
performance.
Opinions on alternative implementations of Reduction
Regarding preference for the different implementations of the Reduction feature, shown in
Figure 19, the opinions were mixed. Two participants preferred the design with the icon
indicating that alternatives were available for a product. Another two participants preferred the
79
/
design where color-coding was used to inform users that alternatives are available. The last
participant admitted that the text was the clearest, and that people needed it to be shown to
them in an obvious way. Reasons given for preference for the usage of text were that it was a
clear and obvious way of indicating that there are alternatives available, while a reason given
against the use of text is that it would make it look cluttered once the lists got larger. Reasons
given for preference for the usage of color-coding was that it gave a good overview at a glance,
and made it obvious that those options were clickable, while reasons against color-coding was
the confusing meaning of the color chosen (green indicating alternatives available). Reasons
given for the preference of the use of an icon were purely aesthetic.
Experience with color-coding implementation of Reduction
When asked about their experience with the color-coding implementation of the Reduction
feature in the application, participants reported mixed experiences. Some participants found the
highlighting option clear as it suggested that the tile was clickable, and that it was different from
the other products without alternatives available. P5 mentioned that the color-coding wasn’t
immediately clear to them. Two participants found that it made it easy to register that other
options were available for the highlighted item, and that it's a good way of quickly showing the
user that a certain product has options available. P4 participant commented on the fact that the
green color used was confusing, as green usually indicates that something is already
sustainable, and that it might be a better idea to use a color such as red or orange.
Opinions on alternative implementations of Suggestion of alternatives
Participants were asked which of the different implementations for displaying alternatives, in
Figure 22, they preferred. Four of the participants reported a preference for the implementation
that was included in the low-fidelity prototype i.e. the implementation with all options displayed
on the page. P2 mentioned a preference for the design where one option was displayed and
there was a button to view the others. None of the participants preferred the implementation
where the options were numbered. The four participants gave reasons such as: “shows you the
best recommendation and gives you an overview of the other possibilities”, “doesn’t require
unnecessary clicking”, “good to see all the choices” for choosing the implementation where all
the options are displayed to the user. P2 favored the implementation that gave the option to
view more alternatives, as they found they were slightly overwhelmed with all the options.
Opinions on alternative implementations of Tunneling
When participants were asked to indicate their preference between different implementations for
the Tunneling feature, shown in Figure 23, the majority of the participants chose the option
where both text and icons were used to indicate whether a presented alternative was a good
choice. P4 chose the implementation where only icons were used to indicate whether an
alternative was a good choice. The participants all found the implementation that simply used
text not to be aesthetically pleasing.
80
/
Reasons given for preference for the design using both icons and text was that it was clear to
users what the icons represented, and if you didn’t use the application for a while, the text
served as a reminder. P3 commented on how the icons gave it a game-like feeling, which they
liked and that they thought most people skim over explanations of how things work, so it was
good that the text served as a reminder.
Experience of goal-setting feature
Participants were happy with the goal-setting feature overall. Some comments made about it
were “simple”, “clear and direct”, “I could set the goals I wanted with the parameters I wanted to
use”. P5 reflected that the goal-setting feature was useful because users could make their list,
see how sustainable it is, and make goals for next time based on that. They did think it would be
nice for the system to also suggest goals after an extended period of use. P4 commented on
how including goal-setting adds a dimension of accountability, and that it is an interesting
feature as they haven’t seen it in other applications.
5.6.2 Observations
Users displayed little confusion when completing the tasks they were given. The Think-Aloud
methodology slowed down their times because they were not used to the process and waited to
finish an explanation as to why they were performing a certain action, before finishing the
action. The users were able to complete each task within 3 interactions (clicks) with the
interface. The users were quick to recover from clicks that didn’t result in their desired outcome
and already had an idea for another interaction that would be successful based on the fact that
their previous interaction was unsuccessful in accomplishing a task.
81
/
5.7 Discussion
Five participants were chosen for the low-fidelity prototype test, as recommended by Nielsen
(1994). The reason behind this is that for a low-fidelity test, there are very few major problems
that are found after testing with five participants and Nieslen recommends that testing with five
users is sufficient when employing the Think-Aloud methodology.
The results from the interviews and observations of the interactions with the prototype show that
the participants were able to carry out the assigned fundamental tasks with ease. Reasons
given were the familiar structure of the application, for example the menu button, and that the
application was designed in a straightforward manner, with a logical flow.
Regarding the system features, the color-coding feature was found to be confusing to some
participants due to the color used, and because the participants were not entirely sure what they
were supposed to take away from the fact that it was highlighted other than the fact that it was
clickable. In this sense the feature does work as the users click on the color-coded options to
then be led to a page showing sustainable alternatives. Due to the mixed preferences for the
options, the color-coding will be kept, however the color will be changed to orange, a suggestion
made by one of the participants. Orange is chosen over the color red as it is less aggressive.
Something else to reflect upon is the fact that during the test, the participants were asked to
enter two products, one which happened to have sustainable alternatives. If they were asked to
add more products that had alternatives, the meaning of the color-coding could have become
more apparent.
For the different implementations of Tunneling, the choice was to use both icons and text to
inform the user about whether a product contributes to their goals and how it affects their score.
This was a popular choice due to the participants not finding the purely text approach appealing,
and found that using just icons on their own might be confusing, and they may forget the
meaning of the icons if they use the application irregularly. For the different implementations for
suggestions of alternatives, participants expressed preference for all options displayed on the
page with the first item expanded. The goal-setting feature was appreciated, deemed useful and
even necessary by the participants. It should be mentioned that by using one of the
implementations of the Tunneling, Suggestion of Alternatives and Reduction features in the
prototype, the user may possess a bias towards said implementations as it was the first they
encountered and experienced using it in the application. An alteration will be made to the design
of the Tunneling feature regarding the indication of a product contributing to a goal, as
suggested by a participant. If the user has set a goal to consume less animal proteins, then
when they are led to the page of suggestions for meat replacements, each option will help them
meet their goal, so the repetition of the icon in the tile of each product is superfluous. A better
solution would be to indicate in a banner at the top of the alternatives explaining that all the
options below help meet their goal.
82
/
As a suggestion, a participant mentioned how when being shown the alternatives, it would be
nice to understand why the particular alternative is better than the original product they chose.
Bonny et al., (2015) discuss that meat replacements based on soy require fewer resources to
produce than counterparts like beef and are more sustainable. The exact numbers per product
and production methods vary, however in general meat replacements have a lower emissions,
land and water footprint than their traditional meat counterparts. This fact will be presented to
the participants before they are given the high-fidelity prototype, so that they are aware that all
alternatives they are presented with in the application are more sustainable than their traditional
meat/dairy counterparts.
Something that should be kept in mind is to manage expectations of what the application is
capable of before the user interacts with it. For this reason, and to avoid confusion about system
features, the participants shall be briefed on the application’s purpose, and given an explanation
of the various features, such as color-coding and how they work, before the users interact with it
for a longer period. This will help avoid confusion while using the application and
disappointment regarding functionality.
A general observation made during the low-fidelity prototype test was that although not every
interaction (click) the user had with the interface was successful, the users were able to recover
quickly and they still rated the system usable and commented that it was easy to use. This
indicates that the participants have a certain threshold for the number of errors they do not hold
against the system’s design.
While the participants were completing the tasks and interacting with the application, written
observations were made on their interactions, and their time for each task was recorded. While
analyzing the screen recordings to record the time for each task, it was observed that the users
were not interacting with the interface while they were explaining their thoughts out loud, and
completing actions more slowly as they waited to finish explaining why they were doing
something, before doing it completely. This affected the time it took for them to complete each
task. Despite this, none of the participants took more than 10 seconds to accomplish any of the
given tasks. In addition, the participants’ faces were recorded while they were interacting with
the application for analysis. However it was found to be difficult to exactly link facial reactions to
interactions with the application. Furthermore, many participants did not express their reactions
with their expressions, making it hard to discern any discontent. The interviews posed to be
much more useful in understanding their thoughts on the application. In addition, a few of the
tests were done over video conferencing, and due to latencies in the connection, the recordings
were lagging, and certain frames were skipped due to the connection. Recommendations for
using this method in the future, would be to request that participants record their faces with their
devices locally.
Based on this, and the feedback from the interviews, where the users found that the application
was easy to use and that they could finish the tasks easily, and their ratings of the application’s
83
/
usability, it can be concluded that the application has been designed such that it is
straightforward, easy to use and the participants are able to complete fundamental tasks with
the application with ease. Therefore, the answer to RQ4: “Is the proposed system intuitive to
use?” is that the tested low-fidelity prototype is intuitive to use, straightforward, and enables
users to complete fundamental tasks in a clear and easy way.
5.8 Moving to the Hi-Fi Prototype
The high-fidelity version of the application will be prototyped while taking into account the
findings of the low-fidelity test. Before introducing the prototype to the user, the user should be
briefed on the functions of the application, how they work and their purpose, in order to manage
expectations from the user, and so that the features aren’t misinterpreted. Preferences between
implementations of system features were investigated and it was found that the goal-setting
feature was appreciated by users, and that they were able to conduct fundamental tasks using
the application with ease.
The color-coding implementation will be used for the Reduction feature, where items with
sustainable alternatives will be colored orange. Sustainable alternatives will be displayed to the
user in a list form, with the first option expanded. Tunneling will be done using icons and text
describing how each product affects the user’s score and whether the products contribute to a
pre-set goal.
84

/
6. High-Fidelity Prototype
This chapter discusses the development of the high-fidelity prototype, the design of the field
study, and analyses the results from the study and discusses the results. Chapter begins with
Section 6.1 which discusses certain aspects of the application in more detail, describes
deviations from the design in Chapter 5 and justifies these changes. Section 6.2 details aspects
of the field study such as the methodology, recruitment process, tasks that are carried out
during the study and other related information. Section 6.3 covers how the results of the field
study will be analyzed, while Section 6.4 contains the results of the experiment, where the
participants are described in short to give the reader some context for the results, after which it
presents the findings from an inductive thematic analysis conducted on interviews with
participants from the field study, and reports the results of a statistical analysis conducted on the
questionnaire responses. Section 6.5 discusses the results by contextualizing the findings from
the statistical analysis, relating the findings from the thematic analysis to relevant literature, and
discusses the general experience of the participants with the application. Finally, the chapter
ends with Section 6.6 where RQ 5 and 6 are answered with the help of the discussion in Section
6.5.
6.1 Developing the prototype
The high-fidelity prototype was developed using the Flutter framework developed by Google.
6
The framework allows for the rapid development of applications and has a low barrier of entry
compared to other languages like Java for Android. The framework was also chosen because it
makes use of Widgets, which are premade, customizable building blocks, that allow one to
quickly build an application. The application was given the name “Sustainable Shopper”.
6.1.1 Design Decisions
Certain design decisions were made while developing the application in order to improve the
user experience. One such decision was to move the personal goal setting feature to a different
page within the application. In the low-fidelity prototype that was tested with users, one of the
tasks they were given was to set themselves a purchasing goal. They did this on the “Progress
Overview Page”, however when developing the application, bar charts were used to display
certain statistics to the user, making the page quite long and required scrolling to get through. In
the low-fidelity prototype design the goal setting button was positioned at the bottom of the
6 https://flutter.dev/
85
/
page. While developing the high fidelity prototype prototype, the researcher reflected that it
would be useful to give the user an overview of the goals they set themselves in the past and
whether they achieved them or not. Therefore, with the goal setting button, progress on current
goals and the history of previously set goals, the decision was made to move functionality
relating to goal setting to a new page. This was justifiable as the method of setting a goal
remained the same, and now the functionality was compartmentalized in the menu, and
therefore more easily found.
Another decision that was made was to include an Explanation page for the application. This
page contains information on the various functionality of the application and explains how some
of its more obscure features works. The choice was made based on feedback in an interview
from the low-fidelity prototype test. The justification was that some users may misinterpret, or
misunderstand the features and their functionality, even if it is explained to them in an
experiment briefing. The page includes pictures and information explaining things like the goal
setting page, the highlighting of products to indicate their sustainability, and the alternatives
page, to name a few examples.
Another change was made to the way in which alternative products are displayed to the user on
the “Alternatives” page, based on feedback in the low-fidelity prototype test. A user had
commented on how it would be nice, in order to speed things up, to list the items in ascending
order by price. This further reduces the task of finding the cheapest alternative to a conventional
product and was therefore implemented.
In order to improve the user experience, popups and messages were displayed to the user to
help their understanding of what the application is doing and to help them handle errors. Popups
were used to inform the user of certain actions they needed to take, such as a popup asking
them to fill out questionnaires before and after starting the experiment (explained later in
Section 6.2), and asking them to confirm an action such as confirming a shopping list. Popups
were also used to inform the user that they accomplished or failed a certain goal they set
themselves. Messages were displayed to the user at the bottom of the screen to help them
handle errors or keeping them up to date with what is happening in the application. For
example, a message is displayed to the user every time they confirm a shopping list, informing
them of how many lists they have confirmed (explained later in Section 6.2), or when they do
not fill out all the fields on the page when setting themself a new goal.
In addition to this, pages such as the “Alternatives”, “Goals” page and the main page of the
application have an information button in the banner of the page. On pressing the information
banner, the user is shown a dismissible popup where the functionality of the page is explained,
to refresh their memory in case they forget. The information is also available on the
“Explanation” page, however for quick reference, information buttons were included on key
pages to show the same information.
86
/
When selecting stores to include in the catalogue of products that the user could add to their list,
the researcher looked into using APIs to get product information. Unfortunately, this was not
successful and the researcher had to resort to web-scraping to finding items and getting their
information. The websites of Albert Heijn and Jumbo, popular supermarkets in the Netherlands,
were possible to scrape as they list all their products on their website as they both offer online
shopping. Other stores like Lidl and Aldi were investigated, however their websites were not
possible to scrape in the case of Lidl as they do not list their catalogue online, and difficult for
Aldi due to the way they have structured their website. Therefore, the choice was made to
design the application to offer products from the stores Albert Heijn and Jumbo.
Based on the feedback from the low-fidelity prototype test, the color coding used to indicate to
the user which products are sustainable, was tweaked slightly. Previously the application used a
green color to indicate a product was sustainable and a red color to indicate the opposite. The
feedback was that the red was slightly too aggressive, and was therefore switched out with a
more mellow orange color.
6.1.2 Determining Whether a Product is Sustainable
One of the main functions of the application is to inform the user about which of the products
they consume are sustainable, and what the alternatives are to those that are not sustainable.
In order to do this, the application needs to make a decision on whether an item is sustainable
or not. The application uses web-scraping to get information on products from the websites of
the stores Albert Heijn and Jumbo, depending on which store the user selected. The item was
judged based on its title, and matched against a list of terms that determined whether the
product was sustainable or not. For example, if the title contained the term “kip” which translates
to chicken, and did not include the terms “veggie”, “vega” or “vegetarische” and wasn’t produced
by a company that specializes in alternatives, then it was marked as unsustainable.
Unfortunately it isn’t possible to tell whether a product is an animal product from the information
provided on the page of the product on both Albert Heijn and Jumbo’s websites. That’s why the
decision was made to use term matching. A list of terms was created by manually going through
the catalogues of both Albert Heijn and Jumbo to add terms to the list that would allow the app
to determine whether a product was sustainable or not.
6.1.3 Score
The score functionality was included in the application to serve as Normative Influence. The
score works as follows: every time a user adds a product to their shopping list, the application
determines whether the product is sustainable or not. If a product is determined to be
unsustainable, then the item is highlighted in orange on the user’s list. It also adds -1 to the
score of their basket. So for each item marked in orange on the user’s list, a -1 is tallied to the
87
/
score for the basket. When a user selects an alternative, that score changes to a +1 if the
product is cheaper or costs the same as the original product, or +2 if the alternative is more
expensive. The decision was made to reward the user with an additional point if they purchased
a more expensive alternative as there are some products for which all the alternatives are more
expensive, and in order to incentivize the user, a higher score is awarded.
When the user confirms their list, the score is tallied and added to the Performance Overview
page. The score feature was created to give the user something to use to reflect on their
consumption. This is explained further in the subsection below on Normative Influence.
6.1.4 Goal-setting
The novelty of the design of this application as mentioned earlier is including functionality to
allow users to set their own personal goals. Locke & Lotham (2002) introduced Goal Setting
Theory and discussed how allowing the user to set their own goals influences self-efficacy, and
allows them to set achievable goals based on their own knowledge and experience. However,
the analysis of twenty five different systems in Section 2.3 found that none of the systems
supported custom goal setting.
The subject of Personal Goals was addressed in three different ways in the application. An
entire page in the application is dedicated to the matter of Goals, where the user can set
themselves a new goal, view their progress on existing goals, and view the history of previous
goals they set themselves, shown below in Figure 27. The history of previous goals was
included as a design choice, as Locke & Lotham (2002) mention that users set goals based on
their knowledge and experience, and in order for them to set realistic goals for themselves, it is
important for them to be able to see how they performed with previous goals. Figure 28 below
shows how users can set themselves a goal.
88

/
Figure 27. Overview of Active goals and Goals that have expired
Figure 28. Goal setting menu triggered when the user wishes to set a new personal goal
The user is given the option to choose between meat or dairy products to substitute, the number
of products to substitute and the number of shopping trips within which they would like to
accomplish the goal.
The decision was made to limit the choice of shopping trips to just three as the aim was to
encourage the user to set themselves more than just the one mandatory goal (explained later in
Section 6.2). Therefore by reducing the time within which they could achieve the goals, it forces
89
/
users to set goals that expire within a “short” term. When users accomplish short-term goals, it
not only adds to their experience and knowledge of their own consumption, but allows them to
set yet more achievable goals. By doing this in a short period of time, it allows the user to
quickly learn their ability to achieve goals they set themselves and adjust as needed. The word
“short” is also relative and is based on how often a user shops, so even if two users set the goal
to expire within 2 shopping trips, that could mean a 7 days for one user and 11 days for another
based on how much shopping they do within that trip. This decision was also made so that
users could realistically either accomplish or fail a goal within the time span of the experiment so
that they could experience the feature in its entirety.
In order to simplify the process, users are offered a choice to substitute either meat or dairy
products. The decision was made to end the resolution at just the type of product, as the target
demographic of this application is people who consume meat and dairy products, who are
interested in reducing that. This means they consume a variety of different products such as
different types of meats, different cuts of a type of meat, and different types of dairy products. If
these different products weren’t grouped, users would need to set themselves a separate goal
for each type of product they are interested in substituting. The design was inspired by the
system feature Reduction from the PSD model which simplifies a complicated process. In this
case, the complicated process is to set a goal for substituting a food. Applying the principle of
Reduction to this results in different products being grouped together under common
characteristics i.e. whether they are meat or dairy products.
6.1.5 Normative Influence
Part of the novelty of this smartphone application addressing sustainable grocery purchasing is
the inclusion of Normative Influence in its design. As mentioned earlier, there has been little use
of Normative Influence in the field of sustainable grocery purchasing, as it is a relatively niche
field with little research done on the topic.
In the application Normative Influence is included in two ways. The first is on the “Alternatives”
page of the application, where the user is shown sustainable alternatives to an existing product
on their list that was highlighted as unsustainable. Figure 29 below shows how Normative
Influence was worked into the design. An icon indicates to the user that one of the sustainable
alternatives is the “Most Popular Choice”. This shows the user that other users of the application
choose this alternative to the conventional product most often, implying that it is a good
alternative.
90

/
Figure 29. Popular choice tag on an item on the Alternatives page of the application
The second way that Normative Influence is included in the design of the application is on the
“Performance Overview Page”. On this page, the user is shown data about their purchases,
such as their meat substitution rate, and their score. Figure 30 below shows how this is shown
to the user using bar charts.
91

/
Figure 30. Bar charts showing a user their Score and Meat and Dairy Substitution Rates
As shown in Figure 30, the user is given an overview of their performance in terms of their meat
and dairy substitution rates and their score for each of their baskets. In each bar chart, the
user’s performance is paired with the group’s performance in that metric for each confirmed
shopping list. This allows the user to reflect on their own purchasing behavior when looking at
how the group behaves, a similar approach that Petkov et al, (2012) took when showing users
their performance compared to a group’s for energy consumption. This comparison of the
group’s behavior to the individual is used to incite reflection on the user’s behavior.
Faking of social norms
The social norms were faked for the purpose of field study; for each participant, the experience
was set so that for shopping lists where they substituted meat and dairy products, out of the five
lists, they substituted more than the group twice, and less than the group twice, and one they
substituted the same amount. This would allow the participant to experience doing better than
the group, doing worse than the group and doing equally as well as the group. This is then
leveraged in the interviews to understand how they experienced this. Similarly, the popular
choice feature was set as the cheapest alternative on the list, as this was the largest option on
the page of alternatives, and the list was sorted by price based on feedback from the low-fidelity
prototype test. Showing the cheapest available alternative first also reinforces the fact that there
are cheap alternatives available. The social norms were faked as the complexity of the
92

/
application would increase drastically in terms of development if actual data from other users
had to be collected, analyzed and sent back to each participant. It also provides an opportunity
to understand the influence of social norms despite them being fake.
6.1.6 Making the List
Figure 31 below shows the process of finding and adding an item to the user’s shopping list.
The user first enters a search phrase, such as “kip” which translates to chicken in English, and
then presses the search button to the right of the search bar. The application fetches results
from the chosen store’s website, in this case Albert Heijn, and displays the results in a container
below the search bar. When the user presses one of the items it is immediately added to their
list. Before this is done, the application determines whether the selected item is sustainable,
explained earlier in Section 6.1.1. If this is the case, the item is given a green highlight, and if
the item is deemed unsustainable, an orange highlight is given to the item’s entry. The color of
orange was adopted from the feedback given in an interview from the low-fidelity prototype test.
Figure 31. (Left) The main page of the application, (center) entering a search term in the search bar and hitting the
search button to show search results, (right) pressing on the first result adds it to the list
93

/
6.1.7 The Alternatives Page
In the process of making a shopping list, the user is bound to enter an animal product, which will
be highlighted with orange, as shown in the previous section in Figure 31. This is a visual cue to
communicate to them that the product they have selected is unsustainable, and has sustainable
alternatives available. When the user taps on an item on their list that is highlighted in orange,
they are taken to the “Alternatives” page where they can view sustainable alternatives to the
chosen product. The Alternatives page serves a number of functions and is shown below in
Figure 32.
Figure 32. The Alternatives page for chicken filet from the application.
The Alternative page’s main functionality is to display sustainable alternatives to the user for a
product on their shopping list. This includes the names, images, and prices of the alternatives.
In addition the page informs the user of how each alternative affects their score, and whether or
not these alternatives help contribute to a goal the user has set themselves. The page also
displays the original item, for the user to compare the price and weight of, in order to make an
94
/
informed decision. Another thing the Alternatives page does is inform the user of which
alternative is the “Most Popular Choice” for the Normative Influence covered before in Section
6.1.5.
6.1.8 Pilot Testing
Pilot testing of the application to test functionality was done throughout the development
process by the researcher and informally by acquaintances of the researcher. This was done to
find interface errors, and errors in functionality of the application such as assigning the score
correctly, displaying the barcharts properly and saving the lists properly so that if the user is
working on a shopping list and closes the application, the list isn’t lost. The acquaintances that
helped with the testing were outside the demographic of the experiment so that they were
ineligible to participate in the experiment.
95
/
6.2 High-Fidelity Prototype Test
The high-fidelity prototype has been designed with the purpose of making it easier for users to
find sustainable alternatives to conventional products, exposing the user repeatedly to the price
of alternative products, and to help investigate the effect of personal goal-setting and normative
influence on purchasing behavior. The results of the field test will help provide an indication on a
number of matters:
1. The participants’ overall experience of the application
2. Whether the application affects the participants’ perception of affordability of sustainable
alternatives
3. Whether there was any effect of being repeatedly exposed to the prices of sustainable
alternatives
4. Whether the application affects the participants’ awareness of sustainable alternatives
5. Whether the application affects the participants’ intention to purchase sustainable
alternatives
6. Their experience of normative influence
7. Their experience with the personal goal-setting feature
These matters are relevant to answering RQ5 and RQ6. The first matter is of interest in general
to understand how the participants experienced the application. Mundkur (2020) found that the
price of sustainable alternatives was a barrier to sustainable consumption of young adults in the
Netherlands, therefore understanding whether the application has an effect on the perceived
affordability (matter 2) and intention to purchase sustainable alternatives (matter 5) is important.
It is also interesting to understand what the effects of exposing the participant repeatedly to
sustainable alternatives and their prices are in general (matter 3) and on awareness of
alternatives (matter 4). The novelty of this application is the inclusion normative influence and
personal goal-setting features. Therefore it is of interest to understand the impact of these on
the user (matters 6 and 7).
Matters 1, 3, 6 and 7 will be investigated using a semi-structured interview, whereas matters 2,
4 and 5 are investigated using a questionnaire that is taken before and after using the
application. This test was approved by the Ethics Committee of the EEMCS group at the
University of Twente with the approval designation 2020-142.
96
/
6.2.1 Methodology
Questionnaire
Participants are asked to fill out a questionnaire before and after the test. The questionnaires
contain statements that the participants respond to using likert scales. The questionnaire
statements are responded to using a level of agreement on a seven level likert scale, where 1 is
strongly disagree and 7 is strongly disagree with 4 being neither agree nor disagree. The
questionnaires can be found in Appendix F. Questions that are in both the pre and post test
questionnaires were designed to measure the effect of the application on awareness of
alternatives (questions 5 and 6), perceived affordability (3 and 4), and intention to purchase
alternatives (questions 7 to 14). There are more questions to measure intention to purchase
alternatives, as there are different scenarios for which the participant would prepare food: for
themselves, or for themselves and others. The questions ask whether they would entirely switch
to meat alternatives and entirely switch to dairy alternatives for each food preparation scenario,
as well as partially switch to meat alternatives and partially switch to dairy alternatives for each
food preparation scenario.
The responses before the test will set a baseline for each participant, to which the post-test
questionnaire responses will be compared. Analyzing the before and after responses will help
provide an indication of whether the application affected the participants’ perceived affordability
of sustainable alternatives, awareness of alternatives, and the participants’ intention to purchase
sustainable alternatives has been affected. The post test questionnaire also contains questions
that may help to explain the differences or lack of difference in the before and after questions. If
for example, the statistical analysis shows there was no significant difference between the
before and after levels of agreement with a statement regarding intention to switch to meat
alternatives when preparing food for themselves and others, and a majority of the participants
indicate that they only prepared food for themselves, then this would help explain the outcome.
Interview
In order to understand the overall experience of the application, the effect on perceived
affordability of alternatives, awareness of alternatives, intention to purchase alternatives, the
effect of repeatedly exposing participants to the prices of sustainable alternatives, as well as
their experiences of normative influence and personal goal-setting, a semi-structured interview
is conducted after the field test. Similar to the questions from the semi-structured interview
conducted in the low-fidelity prototype test, the questions are structured in an open ended
manner, with follow up questions designed to make the interviewee reflect on why they felt a
certain way, or held a certain opinion. This open ended structure of questions is more beneficial
for gathering information, than a question that can be replied with a yes or no answer. During
the interview, the researcher also asks the participant to open the application on their phone and
97
/
walk through the various pages to understand their positive and/or negative experience with
them. The interview questions can be found in Appendix G.
6.2.2 Field Test Design
Goal
The goal of this field test is to investigate a number of matters listed in Section 6.2, which were
the application’s effect on participants’ perceived affordability of sustainable alternatives; the
effect on awareness of alternatives; the effect of being repeatedly being exposed to the price of
alternatives; the application’s effect on participants’ likelihood of purchasing sustainable
alternatives; and their experience of normative influence and personal goal-setting.
Hypotheses
For RQ5, the hypothesis is that the application will have a positive effect on the user’s
awareness of, perceived affordability of, and intention to purchase sustainable alternatives. For
RQ6, the hypothesis is that users will have a positive experience with the application, that being
exposed to the prices of alternatives will improve their perceived affordability, that normative
influence will be a driver for behavior change, and finally that the agency provided by personal
goal setting will be conducive to behavior change.
Recruiting
In order to be eligible to participate in the field test, participants must be between the ages of 18
and 30, consume meat and dairy products, purchase meat and dairy products at the dutch
supermarket chains Albert Heijn and/or Jumbo, currently live in the Netherlands, and possess a
smartphone that runs an Android based operating system (OS). Participants are only included in
the field study if they meet the above criteria, therefore they serve as inclusion criteria. The age
limit is required so that the participants fit the target demographic which the application has
been designed for (young adults in the Netherlands). This study is interested in the effect of the
application on people that consume meat and or dairy products, therefore participants should be
consuming those products when taking part in the study. The study has a location-restriction
which is that of the country of the Netherlands where the supermarket chains Albert Heijn and
Jumbo are present. These supermarkets are also present in Belgium, however this study
focused on young adults in the Netherlands and therefore only those that currently reside in the
Netherlands are included in the study. The inclusion criteria regarding the participant needing a
smartphone running an Android operating system is due to the fact that despite Flutter, the
framework being used to develop the app, makes it possible export the smartphone application
for Apple’s iOS and Google’s Android OS, iPhone users are only able to install applications
through Apple’s App store, which has strict quality control procedures. It is outside the scope of
98
/
this thesis to apply for the approval of the application for the Apple’s app store, and therefore
only Android OS users are included in the study. In addition, the Android version should be
higher than 4.1 (Jellybean), or more simply, the phone should be released in or after 2015. This
shouldn’t particularly affect the results of the study as there has no research been done linking
preference for smartphone type and food purchasing behavior. Due to COVID-19, an additional
inclusion criteria is set, where participants are only included in the study if they do not work in
the care sector.
Recruitment Strategy
In order to reach potential participants for the field study, the researcher posted information
regarding the study on their social media channels such as Facebook, Instagram, Whatsapp
Groups they were part of, the online platform Reddit, and printing out flyers and hanging them
on public notice boards in the Albert Heijn supermarket. Reddit was chosen as its forums are
thematically organized, and so it is possible to find forums with a high likelihood of containing
people that meet the inclusion criteria, such as r/thenetherlands, r/dutchsustainability, and other
more general forums such as r/healthyeating and r/sustainability. In addition, subreddits
pertaining to student cities such as r/rotterdam, r/thehague, r/enschede, r/wageningen, r/utrecht,
r/amsterdam, r/leiden, r/nijmegen, and r/arnhem were used to advertise the experiment. The
public notice boards in the Albert Heijn and Jumbo supermarkets are useful places to exchange
information and advertise services, and would allow the researcher to reach the young adult
Dutch population that they are not affiliated to. The recruitment post includes links to the app
and instructions, as well as QR codes for the same links, for those that are viewing the message
on the notice board in the supermarket.
The recruitment involves convenience sampling to a certain degree, where contacts of the
researcher on social media are reached out to. Convenience sampling is when participants are
selected from a set of available, or easily reachable people, and may not represent the
population at large ( Baxter, Courage & Caine, 2015) . This may introduce a selection bias, due to
the contacts of the researcher not being representative of the population. However the usage of
Reddit channels and local Albert Heijn and Jumbo notice boards as sources for participants
reduces the likelihood of affiliation with the researcher. The recruitment post can be found in
Appendix H.
Materials
Participants will be required to have a smartphone running an Android based OS (with Android
version 4.1 or higher), in order to install and use the application. The participants are also
provided with a document that explains the functionality of the application, its intended purpose
and how it works. Furthermore, the questionnaires that they answer before beginning to use the
application as well as after, each have consent statements in the introduction to the
questionnaire, such that if the participant does not wish to participate in the experiment, they do
99
/
not proceed with the questionnaires. Before participating in the interview after the study, the
participant will need to sign an additional consent form that gives the researcher permission to
record the audio of the interview to transcribe the responses. Now that the process has been
described, the materials are a smartphone running an Android based OS that the participant
has, the explanatory document for the application, the questionnaire questions, the smartphone
application, the consent form for the interview, the interview questions, and a teleconferencing
software such as Google Meet to conduct the interview over.
COVID-19 Proofing
The field test is conducted by the participants on their own, while the interview is conducted
over conference call and the questionnaires are filled out digitally. No part of the field test
requires face to face interaction.
Briefing
The participants are given a PDF document, found in Appendix I, containing instructions on how
to install and use the application. The various features of the application such as the
color-coding and the personal goal-setting features are explained to them so that there is no
confusion about their functionality. The purpose of the application is also explained to the
participants in detail, so as to manage expectations about the application’s capability. The
participants will be asked to make their list with the intention of buying every product on the list,
not just for the sake of the study.
Duration
The participants are asked to interact with the application for a duration of two weeks. This time
period was chosen to ensure that the participants have a sufficient number of interactions with
the application. In the instance of shopping frequency, Veenstra et al. (2011) found that the
average dutch consumer shops on average 2.7 times per week. Therefore, in a duration of two
weeks, the average dutch consumer will make a grocery shopping trip approximately five times.
This means that participants are likely to prepare a shopping list 4-5 times during the field test
with a possibility of more if they wished to view their progress or set a goal for themselves at a
later time. However, due to the study being conducted during the month of August, where many
young adults and students are spending time with their families, it could be the case that they do
not shop as frequently. For this reason, the participants are asked to fill out the post study
questionnaire after having used the application five times to prepare a shopping list and setting
a goal for themselves using the goal-setting feature at least once. Here, the usage of the
100
/
application in the store to refer to the prepare list is not counted, as they are not exposed to the
social norms when referring to a prepared list.
Tasks
The participants are asked to prepare their grocery lists using the application and use the
application in the grocery store to refer to the list they prepared. They are also asked to set
themselves at least one goal with the goal-setting feature during the field study, so that the
effect of the goal-setting feature can be investigated. In addition, they are instructed to fill out
the pre-test questionnaire before beginning to use the application to prepare their shopping lists
and to fill out the post-test questionnaire after preparing five shopping lists using the application
and setting a goal for themselves. They are instructed not to count using the application to refer
to the shopping list as an interaction, as they are not exposed to the social norms while simply
looking at the list.
Assistance Protocol
At any point during the study, the participants are allowed to contact the researcher digitally with
questions regarding usage of the application. The researcher will provide help remotely as best
they can. The participants are provided with the contact details of the researcher at the
beginning of the study.
Data Collection and Processing
The questionnaire responses of all the participants are collected, and an interview is conducted
with a random subset of participants from the group. The audio from the interview is recorded
for the purpose of transcribing the responses. Statistical analysis is conducted on the pre and
post test questionnaires to provide an indication as to whether the application affected the
likelihood of purchasing sustainable alternatives, awareness of alternatives, and the perceived
affordability of sustainable alternatives.
The type of statistical analysis that will be done is determined after the results are obtained, due
to assumptions that each statistical test uses, such as a normal distribution of the data. For data
where the sample size is large (greater than or equal to 30), a parametric statistical test, such
as the t-test, could be utilized which have a greater statistical power than non-parametric
statistical tests that use smaller sample sizes, or if the data violates other assumptions of the
parametric tests. The eventual statistical test will be discussed and justified in Section 6.4 on
Data Processing. The research question that the questionnaire results will help answer is:
RQ5. “Did the application have a measurable effect on the following:
1. The participant’s perceived affordability of sustainable alternatives
2. The participant’s awareness of sustainable alternatives
3. The participant’s intention to purchase sustainable alternatives”
101
/
Responses to the interviews are analyzed using a thematic analysis. This consists of
transcribing the responses to the questions, familiarizing oneself with the answers, coding the
responses, observing emerging themes from the responses and then discussing these themes
and their implications in general, and for particular research questions. In this case, the
research question that the interview will help answer is:
RQ6. “What was the participants experience with the following:
a. The application in general
b. The personal goal-setting feature
c. Being exposed to social norms of group purchasing behavior
d. Being repeatedly exposed to the price of sustainable alternatives
Locally on the application, metrics such as how many meat products were purchased and how
many goals were met, are stored on the device itself and used for the feedback, and are not
collected or processed centrally.
Debriefing
As the participants are shown falsified group statistics for the purpose of Normative Influence,
they require debriefing at the conclusion of the study. This is done by placing a pop-up in the
application informing the participant that the group statistics they were viewing in the Progress
Overview page were faked for the purpose of research. This pop-up is triggered by the
application after the user navigates to the after questionnaire, in order not to affect their answers
to the questions.
102
/
6.3 Data Processing Method
The field study involved collecting two different types of data, interview and questionnaire
responses. This section describes the methods used to analyze the data that was collected in
the field study.
6.3.1 Statistical Methods
There are various statistical tests that one can run on data. In order to find a relevant test to run
on data, the data has to have certain characteristics. For example, there are certain kinds of
statistical tests that can be run on data from two different samples, whereas others are run on
data from the same sample but measured twice. The data in question is the questionnaire
responses, where the two samples come from the same participant, one from before they
interact with the application, and the second from afterwards. This is referred to as paired data,
and therefore, only certain statistical tests apply, such as the paired samples t-test. However,
the data has to meet further criteria in order for a test to be applied.
Looking at the test relevant to the data in question, the paired sample t-test has certain
assumptions that need to be met in order for the test to qualify as applicable. The conditions are
that the data is normally distributed, the observations are made independently, the variable is
measured on an incremental scale, and the variables must consist of two, related or matched
pairs ( Tempelaar, Kerckhoffs, Velleman & Sharpe 2016 ). In statistics, a general assumption is
made that samples where n>=30 are normally distributed. In such cases, parametric tests, such
as the paired sample t-test are applied. However in cases where the number of samples isn’t
high enough to assume a normal distribution, non-parametric tests are used, which have less
statistical power but apply to a broader range of situations and are therefore more robust.
In the case of the questionnaire responses, n = 11, the samples were taken independently from
each other, and the participants were recruited using personal channels, through other
participants in the experiment and notice boards. Due to the low number of samples, the
non-parametric alternative to the paired-sample t-test was adopted, the Wilcoxon Signed Rank
Test was used.
To test whether the answers to statements in the “after” questionnaire are statistically significant,
due to there only being one data set and a low sample size, the Sign Test, a non-parametric
test, is used. The aim with this test is to find out whether the median of the data in question is
greater than a certain relevant cut-off point. In this case, the relevant cut-off point would be 4
(neither disagree nor agree) on the likert scale, as the hope is that the application had a positive
effect on the agreement with statements. In terms of the Sign Test, this translates to a null
hypothesis that 50% of the responses lie under the cut-off point and 50% lie above it.
103

/
6.3.2 Thematic Analysis
Besides questionnaire responses, interviews were conducted with participants from the field
study, and the data collected was transcribed responses. A thematic analysis can be done in
two ways, using an inductive approach or a deductive approach. The latter analyzes the data
while looking for certain, predetermined themes, while the former approach is a more ground
up, organic approach. An inductive thematic analysis was conducted in order to analyze the
interview responses. This method was chosen as this work acts as a first step to designing an
intervention, and as such is intended to explore the experience, rather than support a
pre-existing narrative. The process had several steps: first the researcher familiarizes
themselves with the data. This involved the researcher reading over the transcripts multiple
times. The next step is to perform open coding on the data, where phrases from the responses
are represented using “codes”. The codes to each theme can be found in Appendix K. After this,
the codes are grouped according to similarity into categories. The final step is to merge these
categories into themes which are discussed in the following section. This was the process used
to conduct a thematic analysis on the interview responses from the field study. Below Figures 33
and 34 show how the interviews were coded, and codes were categorized into sub-themes that
make up a theme. In Figure 33 and 34, the color corresponds to an individual participant, and
codes were organized in this manner to be able to easily refer back to the original quote.
FIgure 33. Example of coding process from the interviews
104

/
Figure 34. Categorizing the codes into sub-themes that fit into the theme of Community
105

/
6.4 Results
This section presents the results of the field test and begins with a description of the participants
that completed the experiment and whose data was analyzed, then follows with a statistical
analysis of the questionnaire responses and finally ends with a thematic analysis of the
interviews.
6.4.1 The Participants
A total of 20 participants started the experiment, with only 11 successfully completing the entire
experiment. The statistics was only conducted with the responses to both questionnaires,
therefore n = 11. The average age of the participants was 24.1 with a 72.7% male population (8
men), 18.1% female population (2 women) and a 9.2% population that identified as other (1
person). 36.4% shopped at Albert Heijn, 27.3% shopped at Jumbo, and 36.4% of the
participants shopped at both Albert Heijn and Jumbo. 45.5% of the population found out about
the experiment through social media, 45.5.% through friends doing the experiment and 9.1%
from a notice board hung in the supermarket. This data is summarized in Figures 35, 36, 37 and
38 below.
106

/
Figure 35. Gender of the participants
Figure 36. Age of the participants, with age in years and counts of participants on the vertical axis
Figure 37. Preference for supermarket
107

/
Figure 38. Method of recruitment to study
6.4.2 Statistical Analysis of Questionnaire responses
The questionnaires were made to get an insight into the effect the application may have had on
three concepts:
1. The participant’s perceived affordability of sustainable alternatives
2. The participant’s awareness of sustainable alternatives
3. The participant’s intention to purchase sustainable alternatives
The application was designed with the aim of improving the user’s perceived affordability of,
awareness of, and intention to purchase sustainable alternatives. The expectation is that the
application improved the user’s agreements with the statements corresponding to these three
concepts. In more specific terms the specific hypotheses given below and related directly to RQ
5:
- The application will improve the perceived affordability of sustainable alternatives
- The application will improve the awareness of sustainable alternatives
- The application will improve the intention to purchase sustainable alternatives
108
/
Descriptive statistics were done on the statements common to the “before” and “after”
questionnaire, as well as the statements from the “after” questionnaire which were all rated on
the Likert scale in terms of agreement (where 1 is strongly disagree and 7 is strongly agree)
with the statement and this can be found in Tables J1 and J2 in Appendix J.
Descriptive statistics in Tables J1 and J2, provide illustrative information about the data set.
Given that these questions were rated on a Likert scale, it is important to note that 4 is neutral.
Beginning with affordability, an increase in the mean score was noted for both meat (mean =
4.00 → 4.36, std = 1.26 → 1.21) and dairy products (mean = 4.09 → 4.42, std = 1.22 → 1.27),
hinting that there is greater perceived affordability of replacements. Moving on to awareness, it
can be seen that there is a greater increase in mean in dairy replacements (mean = 3.64 →
5.55, std = 1.57 → 1.21) , compared to meat replacements (mean = 4.73 → 5.45, std = 1.68 →
1.13). Scores rating awareness of meat replacement after using the application had a lower
range, and a smaller standard deviation (std = 1.68 → 1.13), showing less disagreement
between the scores. Similarly, the standard deviation of scores rating awareness of dairy
replacement reduced after using the application (std = 1.57 → 1.21). Regarding the intention to
purchase dairy alternatives, there was a greater mean change of score in the context of cooking
alone (mean = 2.19 → 4.68, std = 1.89 → 1.83) as opposed to with a group of friends (mean =
3.23 → 4.09, std = 1.77 → 1.83). For meat alternatives, this trend was less pronounced for both
individual (mean = 3.96 → 4.28, std = 1.96 → 2.04) and group consumption (mean = 3.82 →
4.14, std = 2.06 → 1.95). These interpretations should be interpreted with caution due to the low
sample size, and hypothesis testing is required to extract more meaningful information.
Recalling from Section 6.3.1 that the statistical tests that can be used on a dataset depend on
the characteristics of the data. The Wilcoxon Signed Rank test was conducted on the following
hypotheses for the 12 statements common to both the “before” and “after questionnaires”:
H0: The median difference is zero.
H1: The median difference is not zero p = 0.05.
The median is measured due to the Wilcoxon Signed Rank test. Therefore, the following 12 sets
of hypotheses were tested:
Affordability
H0: The median difference in meat affordability is zero.
H1: The median difference in meat affordability is not zero p = 0.05.
H0: The median difference in dairy affordability is zero.
H1: The median difference in dairy affordability is not zero p = 0.05.
109
/
Awareness
H0: The median difference in awareness of meat alternatives is zero.
H1: The median difference in awareness of meat alternatives is not zero p = 0.05.
H0: The median difference in awareness of dairy alternatives is zero.
H1: The median difference in awareness of dairy alternatives is not zero p = 0.05.
Intention to purchase (for individual consumption)
H0: The median difference in intent to substitute some meat products is zero.
H1: The median difference in intent to substitute some meat products is not zero p = 0.05.
H0: The median difference in intent to substitute some dairy products is zero.
H1: The median difference in intent to substitute some dairy products is not zero p = 0.05.
H0: The median difference in intent to substitute all meat products is zero.
H1: The median difference in intent to substitute all meat products is not zero p = 0.05.
H0: The median difference in intent to substitute all dairy products is zero.
H1: The median difference in intent to substitute all dairy products is not zero p = 0.05.
Intention to purchase (in a group setting)
H0: The median difference in intent to substitute some meat products in the company of a group
is zero.
H1: The median difference in intent to substitute some meat products in the company of a group
is not zero p = 0.05.
H0: The median difference in intent to substitute some dairy products in the company of a group
is zero.
H1: The median difference in intent to substitute some dairy products in the company of a group
is not zero p = 0.05.
H0: The median difference in intent to substitute all meat products in the company of a group is
zero.
H1: The median difference in intent to substitute all meat products in the company of a group is
not zero p = 0.05.
H0: The median difference in intent to substitute all dairy products in the company of a group is
zero.
H1: The median difference in intent to substitute all dairy products in the company of a group is
not zero p = 0.05.
110

/
The results of the tests are given below in Table 12, where the median difference is calculated
by subtracting the Likert value from the “before” questionnaire from the corresponding “after”
value (where 1 is strongly disagree and 7 is strongly agree). The null hypothesis is rejected if
the p value of the test is less than 0.05, and a positive median difference indicates an
improvement in median score.
111
Statement
Median
Difference
z score
p value
Rejected Null
Hypothesis
In general, I find the prices of meat
replacements (e.g. soya chunks,
vega-burgers, veggie schnitzel,
etc.) to be affordable.
+1
-0.711
0.477
No
In general, I find the prices of dairy
replacements (e.g. vegan
margarine, soya milk, almond milk
etc.) to be affordable.
+1
-1.612
0.107
No
In general, I am aware of the
different kinds of meat
replacements available.
+1
-1.150
0.250
No
In general, I am aware of the
different kinds of dairy
replacements available.
+2
-2.246
0.025
Yes
I have the intention to buy some
meat replacements, instead of
conventional meat products, when
preparing food for myself.
0
-0.254
0.799
No
I have the intention to buy some
dairy replacements, instead of
conventional dairy products, when
preparing food for myself.
+2
-1.723
0.085
No
I have the intention to buy some
meat replacements, instead of
conventional meat products, when
preparing food for myself and
others.
+1
-0.583
0.560
No
I have the intention to buy some
dairy replacements, instead of
conventional dairy products, when
preparing food for myself and
others.
+1
-0.773
0.440
No
I have the intention to buy only
meat replacements, instead of
conventional meat products, when
preparing food for myself.
+1
-0.357
0.721
No
I have the intention to buy only
+2
-1.489
0.137
No

/
Table 12. Results of Wilcoxon Signed Rank Test tests
From Table 12, it can be seen that it was not possible to reject the null hypothesis for 11 out of
the 12 statements (that participants were asked to agree with on scale from 1-7) at a 5%
significance level. The only statement where the application made a significant difference with,
was that of the awareness of dairy alternatives (z = -2.246, p = 0.025).
In addition to this, in the “after” questionnaire, there were several statements that were not
present in the “before” questionnaire that participants were asked to score on a Likert scale from
1 to 7 (where 1 is strongly disagree and 7 is strongly agree). Descriptive statistics were also
done on the answers to these statements, and can be found in Table J3 in Appendix J. Below in
Table 13 you can find a short summary of these descriptive statistics, including the mean and
standard deviation, along with the results of the Sign Test.
The statements in the “after” questionnaire fall under four concepts: Use of Application,
Normative Influence, Goal Setting, and Perception of Affordability, and are measured on a Likert
scale from 1 to 7 (1 = strongly disagree, 7 = strongly agree). The Cronbach’s alpha was
calculated for the responses to statements falling under each category, to verify whether
something could be concluded from the responses, with the cutoff point being set at 0.7.
Unfortunately, for none of the categories could the statements falling under the category be
used to describe the application’s effect due to low Cronbach’s alpha values. Unfortunately this
means that the responses to these statements cannot be used as evidence of the effect of the
application on these broad concepts. The thematic analysis in the next section is used to get
deeper insights on these concepts.
Recalling in Section 6.3.1, the significance of the responses to the statements in the “after”
questionnaire is tested using a Sign Test.
The hypotheses for these statements below in Table 13 are:
H0: M = 4
112
dairy replacements, instead of
conventional dairy products, when
preparing food for myself.
I have the intention to buy only
meat replacements, instead of
conventional meat products, when
preparing food for myself and
others.
+1
-0.358
0.720
No
I have the intention to buy only
dairy replacements, instead of
conventional dairy products, when
preparing food for myself and
others.
+2
-1.254
0.210
No

/
H1: M > 4 p = 0.05.
Where M is the median value, a significance value of p = 0.05 is used and the results are shown
below in Table 13. The null hypothesis is rejected if the p value is below 0.05.
113
Grouping
Statement
Mean
Standard
Deviation
p value
Rejected Null
Hypothesis
Use of
application
I found the application useful
for finding out about
sustainable alternatives to
the products I normally
consume.
6.09
0.83
0.012
Yes
Use of
application
I see myself using this
application in the long term.
4.46
1.29
1.000
No
Normative
Influence
Viewing the group’s scores
and substitution rates made
me reflect on my own
purchasing behavior.
3.81
1.25
0.065
No
Normative
Influence
I felt motivated when my
score and/or substitution
rates were better than the
group’s to continue
substituting products.
4.09
1.70
0.549
No
Normative
Influence
I felt driven to purchase more
sustainable alternatives when
my score and substitution
rates were worse than the
group’s.
3.45
1.37
0.227
No
Normative
Influence
I felt motivated to accomplish
my goals or set a goal when I
saw the group’s goal
completion rate.
3.64
1.57
0.549
No
Normative
Influence
I considered an alternative
more seriously because it
was popular among the
group (on the Alternatives
page).
5.18
1.08
0.065
No
Goal Setting
I liked the ability to be able to
set my own goals.
5.82
1.17
0.065
No
Goal Setting
I prefer setting my own goals
versus being set goals by a
system.
5.73
1.27
0.065
No
Goal Setting
I think because I set my own
goals, it is more realistic for
me to achieve them.
6.36
0.67
0.001
Yes

/
Table 13. Results of Sign Test
Table 13 above shows that there were two statistically significant outcomes (p <= 0.05) from the
Sign Test, where participants found the application useful to discover sustainable alternatives to
conventional products (p = 0.012, mean = 6.09, std = 0.83) and that participants thought that it
was more realistic to achieve goals they set themselves (p = 0.01, mean = 6.36, std = 0.67).
The low standard deviations on responses on both these statements may explain why they
passed the Sign Test, as this indicates there was the most agreement between participants on
these statements.
114
Perception of
Affordability
My opinion on the price of
sustainable alternatives was
unaffected by using the
application.
3.91
1.87
1.000
No
Perception of
Affordability
Using the application
changed my opinion on the
price of sustainable
alternatives in a positive way.
5.09
1.14
0.227
No
Perception of
Affordability
Being exposed to the prices
of sustainable alternatives
helped change my opinion of
their general cost.
5.27
1.35
0.065
No
Perception of
Affordability
I liked the overview of
sustainable alternatives to a
certain product I was
considering.
5.64
1.21
0.065
No
/
6.4.3 Thematic Analysis of Interviews
An inductive thematic analysis was conducted on the interviews and the findings are presented
below. Three main themes emerged from the results of the analysis: Motivation, Community and
Effort. These themes each comprise sub-themes consisting of findings that are emboldened,
and which are explored using quotes from the interviews that are italicized.
Motivation
This theme was the largest theme, in terms of number of sub-themes, that emerged from the
interviews, and comprises five sub-themes: Self-Motivation, Group Comparison, Group
Motivation, Feature Based Motivation and Ownership of Progress.
Self-Motivation
The first sub-theme is that of Self-Motivation, which was broadly defined as reasons that users
engaged with the application, or continued to engage with the application. There seemed to be
three main findings regarding self-motivation. The first, and more obvious one, was that
achieving one’s personal goals motivates them to do better . “What motivated me was
completing the goals I set for myself.” (P2). “I like my goal completion rate…. like how many of
the goals that you set, you completed.” (P6). Participants found a certain momentum from
achieving goals they set for themself. This can be explained by a certain ownership over their
progress, which is discussed in more detail below. “..otherwise it feels like it's not your own
progress. I feel like it's kinda your own thingy, and if you can set your own goals, you feel more
motivated.” (P3). “I want to succeed in a goal I set myself” (P5).
Due to the personal aspect of goal setting, participants seemed to feel a certain responsibility
towards completing the goals they set themselves. This responsibility towards personal
goals leads to feelings of guilt and demotivation when goals are not completed. “I would
set a new goal to get rid of that 0%. (Does the 0 bother you?) Yeah it kinda does.” (P3). “It didn’t
feel good when I failed a goal, then I just made another one.” (P6). Another participant was
demotivated because they failed a personal goal. “I want to succeed in a goal I set myself, ….
but if I don’t succeed in that, I am discouraged.” (P5). This personal guilt resulted in participants
setting themselves a new goal immediately, in one of the participants' case, to get rid of the 0%
goal completion rate, which was a statistic the user was shown on the Performance Overview
page.
An additional finding is that motivation to perform good behavior can be selfish in nature.
This was illustrated by one participant who substituted products simply because the alternative
tasted better. “ I didn't do this because it's the right thing to do, it's because I genuinely like soya
milk now. ” (P4) . This was in response to a question about the participant reflecting on their
purchasing habits after being exposed to the group’s purchasing behaviors.
115
/
Social Comparison
The second sub-theme is that of Social Comparison and how it paradoxically can have a
motivating and demotivating effect on participants. Comparing an individual’s performance to
the group’s can have a motivational effect. Participants wanted to maintain good
performance when doing well and were motivated by doing better than the group. “If I am
winning, I want to keep this streak up, I wanna keep my number one place, I still want to be king
that’s it.” (P4). “It’s nice to be able to see how well they are doing, and how well you are doing.”
(P3). “.... if i am not doing better it is also nice to see this, so I am motivated to do better than
them again ” (P2).
However, demotivation and negative feelings can arise from comparing one’s
performance to the group’s. “ There is never this sense if I am losing I want to try harder. It's
just ah man. ” (P4). “(How did you experience being informed about the groups’ purchasing
habits) It did make me feel a bit miserable” (P8). Comparison did cause reflection about one’s
own purchasing habits, however this did demotivate some users. An interesting finding is that
though doing better than the group can motivate a user to continue “good behavior”, that same
user can be demotivated if they find that they aren’t performing better than the group, to the
point where they aren’t motivated to change that. One participant also reflected that they would
be more demotivated if their performance was directly compared to people they knew, such as
friends. “[it] would be more annoying if you knew the person directly, and could see they are
doing better than you …. because you would see your friends, and you would have a face with
who is doing better than you, and that could be very annoying.” (P3)
Group Motivation
The third sub-theme is the motivational effect of an anonymous group. Observing the
performance of an anonymous group can have various motivational effects on
individuals. This was in three main ways: to set themselves harder goals, to increase their
substitution rates, and to feel like they were working toward a common goal. “I saw there are
some other people that are purchasing some good alternatives. So I am not alone in this.” (P5).
“..if we are like doing it as a group or a family, then I am more inclined to care” (P4). This feeling
of community and a common goal is explored more in the theme of Community, however it
shows that participants are motivated as they feel as they are not alone in making changes to
their lifestyles. “I thought to myself I should try the soya subs because you see the people
choosing those alternatives and I thought maybe I should also do that” (P8). “Moments yeah,
like I thought like oh wow, everyone is substituting products” (P6). “Otherwise it’s just in general
people are doing better, I should too.” (P3). Observing the group performance, triggered
reflection in participants causing them to reevaluate their own choices.
116
/
During the interviews, it emerged that a group can serve as a source for inspiration. This
was mainly in terms of the goals that others were setting themselves. “ Sometimes it’s better that
the application also tells me some goals. LIke these are some of the goals that people do. That
might give [me] a challenge. ” (P5). “It’s fun for the system to give recommended goals based on
your demographic or people in your neighborhood or very basic goals.” (P8). Users reflected
that they would like assistance in setting themselves goals, based on what other users set as
goals, in terms of recommendations of difficulty from the application, or more specifically, people
in their vicinity.
Feature Based Motivation
The fourth sub-theme was motivation that arose from a particular feature, or wishes for
affirmation from the application. Individuals can ascribe their own meaning and use for
features. This was the case with the color-coding feature which ,as explained in Section 6.1.1,
was designed to indicate to users which products were sustainable by use of the colors orange
and green. In addition to this, participants used the orange color coding as a goal to strive
towards reducing. Transversely, participants made it a goal to increase the amount of green
they saw in their shopping list. “ Orange was the main motivation [to reduce unsustainable
products]. ” (P1). For one participant, the goal-setting feature seemed superfluous to them
because they were motivated by the color-coding to substitute products and made that a goal
for themself. “ It felt like not even worth setting [personal goals]. Again, I just like seeing the
green bars ” (P4). For this participant, the green color coded products were something to strive
to increase and a visual reward, or recognition, of good behavior, from which the participant
derived a pleasant feeling from. This was also the case for another participant who felt the
green color coded items were a visual validation of a good choice. “ ... for example margarine is
something I use instead of butter, and I didn't know it was actually an alternative. That felt nice
[green color coding] ” (P1) . This was in the context of the participant adding a product to their list
that they regularly consume, however they were unaware that it was a sustainable alternative.
The green color code that the product got when added to the list informed them that it was a
good choice, and they felt good because of it.
Another finding from the interviews is that a lack of recognition of good behavior can result
in negative emotions such as confusion, and demotivation. During the course of the
interviews, it turned out that two of the participants were not particularly fond of fake-meat
replacements, and for this reason did not set themselves a goal to substitute meat products with
fake meat replacements. Instead, they normally substituted meat with other foods like
mushrooms, or beans. However the application did not recognize this as good behavior and this
discouraged them from using the application and setting themselves a goal. “[How did the
comparison of your shopping habits to the group’s make you feel?] It wasn't close, because I
had zero in everything, because I didn't buy any replacements. I felt it was unfair, because I felt
like I was doing quite a good job. Then I saw that others buy more replacements or substitutes. I
don't really like those meat replacements so I don't buy them. ” (P3). “I felt confused because I
was buying veggies instead of replacements” (P7). The participant did not appreciate that their
117
/
objectively good behavior, as it was in line with what the application was promoting, was not
recognized as good behavior, which resulted in them feeling dejected. Upon being asked why a
participant didn’t want to set themselves a goal they responded that the feature was too limiting.
“ It’s only limited to meat and dairy …. for example, when you're making hamburgers at home,
you could substitute [hamburger] meat for a portobello mushroom ” (P8). Despite the application
displaying a pop-up when the user successfully achieved their goal, one participant desired
further recognition from the application if they outperformed their goal. “ If you did better than
your goal, it would also be nice for this to be acknowledged in the app ” (P3). This desire for
recognition for good behavior ties into the desire to be rewarded or validated for good behavior,
and if this is lacking, participants are left unfulfilled. This was also echoed by another participant
who commented on the goal setting feature as a whole. “There should probably be more
reminders, encouragement and motivation” (P7).
Ownership of Progress
The fifth sub-theme regarded how participants displayed an ownership of their progress
because of the personal effort put into setting and achieving the goals. Ownership of Progress
was shown in two ways: appreciation for agency and maintaining momentum when missing a
goal. Agency in handling their one’s progress is appreciated. “ .... I feel like it's kinda your
own thingy, and if you can set your own goals, you feel more motivated ” (P3). “I do prefer an
open goal rather than a goal set by the machine” (P4). “I think that is almost essential for this to
work right, you can't force people, they have to learn by themselves” (P7). “.... it gives you the
freedom to set goals yourself.” (P8). The agency over their progress that the application
provided made participants more personally invested in the process and gave them the feeling
that they were in control and not that a system was telling them what to do.
Another finding was that compensatory behavior can be a reaction to failure . In the context
of this application, participants did this by setting themselves a new goal as soon as they failed
a previous one. “ I was also motivated to set a new goal when I didn't achieve a previous goal. ”
(P2). “.... I just made another one .... to try to stay on track. At least not waste time or space in
between” (P6). “When i failed the goal, even though it wasn't my fault, I still wanna try the
replacement the next time. So I set a new goal.” (P3). Participants displayed an awareness of
the importance of moving forward with the next goal and not getting hung up on failures, and
were in some cases motivated by their failures. “ It (personal goal setting) was like a gamification
feature to see how you would do. And if you kind of win against yourself ” (P2).
Effort
This theme emerged from the questions regarding the goal-setting feature and comprises two
subthemes: Goal Setting, and Measurement & Context.
118
/
Goal Setting
The first sub-theme has to do with the effort that it took participants to change their behavior, the
ways in which they did this and their difficulties in doing so. Individuals experience a learning
curve when practicing a new behavior. This finding is predictable, considering that users had
to gain an understanding of their purchasing habits to gauge appropriate, realistic values (such
as number of substitutes and time frame) for the goal. This learning curve took time to get used
to as one participant explained. “So the very first time I set a goal, it was a really easy goal, and
I didn't realize it would be that easy. It first asks you how many substitutes you want to have,
and I put 2 and then it asks for how long, so I thought that if I put 2 shopping trips, it would add 2
substitutes per list, but then I realized it's not the case. So this was just the learning curve of the
app.” (P2). “ [I was] unsure of how much I [should] set so that it’s challenging enough. ” (P1).
While offering agency to a user can be a good thing, it can also be a little overwhelming. One
participant reflected on the steepness of the learning curves of setting themselves a goal versus
choosing from a list of suggestions. “I think it’s way steeper with more customization for sure”
(P6).
One finding from providing users with complete agency regarding their goal setting was that
complete agency can be overwhelming without assistance. This was due to a feeling of
being confronted by complete control, getting used to the learning curve, and the desire to
reduce the effort put into a new behavior. “[There was] too much freedom ” (P1). Participants
were hoping for suggestions from the system based on the fact that they were new to the
process, such as a difficulty setting they could choose from. “ Like one way could be to have it
monthly, and set difficulty (easy, medium, difficult) with pre-arranged points or substitutions. ”
(P1). “I would like to have a precomposed list of options for me. And then afterwards I can tweak
it for me to manage better.” (P6). The same participant reflected on how changing behavior
requires effort and that would like to put in as little effort as possible when making a change that
would already inconvenience them. “ If I have to plan it out myself and have a layout where I
need to choose the time and the number of trips, that would feel like so much effort already ”
(P6). If an individual is required to put more effort into a new behavior than they think it's worth,
they might not engage with the intervention i.e. personal goal setting.
This lack of support from the system’s side, particularly with goal setting, had negative
consequences. Every individual has an ambiguous threshold for effort, that if crossed,
does not motivate the individual to continue with the new behavior. This resulted from the
goals that participants set themselves being too easy and not wanting to put more effort into
discovering more challenging goals. “ Not enough of a challenge, so I am not sure. ” (P1). “It felt
like not even worth setting” (P4). This was in response to being asked if they would set
themselves another goal after achieving the previous goal they set themselves. Due to the lack
of help from the system, one participant preferred to set themselves goals mentally instead of
using the application to do so. “ I prefer setting the goal in my head. ” (P5).
119
/
The last finding had to do with the deadline that users wished to set themselves goals for, where
it seemed that participants preferred setting themselves goals in the long term. Working goals
into a familiar time frame is more comfortable. “ Although for me, the deadline, I would have
considered something more like a month. Like a monthly goal but for this use case it has to be
trips ” (P7) . “ Like one way could be to have it monthly ” (P1). Based on interviews with other
participants, when P6 was asked whether they would prefer weekly or monthly goals as
opposed to the number of shopping trips, they replied with “ If it could account for time then
definitely ”. This reason was followed up with one of the participants and they reasoned that “[it’s]
like a structured way of setting goals” (P1) . It would seem that when it comes to planning
behavior, it’s easier for participants to think in terms of months or weeks instead of individual
shopping trips. In contrast, one participant took a different approach to setting goals where they
only ever set themselves a goal for the next shopping trip. “ Because then I would forget what
my goal is, like if i set it for multiple goings, I would forget what my goal is and how much of the
goal I have achieved already ” (P2). This ties in with the amount of effort it took them to change
their behavior, in this case to attempt a goal they set themselves. This participant in particular
found it easier to take their goals one shopping trip at a time, as opposed to others who
preferred to set it over a longer period of time.
Measurement & Context
When setting themselves a goal, participants desired a concrete metric or reference to gauge
their progress. Relevant quantification of progress helps with solidifying new behaviors.
Examples for relevant quantities in the context of sustainability and consumption are the carbon
and water footprints [insert sources for these]. Although the application had a quantification of
progress, which was the average number of sustainable alternatives for dairy and meat
products that the user was consuming, participants desired metrics that gave them an
understanding of their impact of their consumption. “ .... yeah variables are missing. Price is a
major factor for me, then sustainability, like a sustainability score, that you can get off multiple
things ” (P1). “I think it would be more interesting to see my general footprint.” (P3). Some
participants were more health conscious than others, and discussed other statistics. One
participant compared using this application to using a fitness application, where he was shown
the number of calories he burned. “This sounds selfish but in the gym app you see yourself
improve, in the shopping app you see the environment improve, which is nice, but selfishness.”
(P4). The participant reflected on their selfish motivations and when given a suggestion by the
researcher, which was grams of sustainable protein consumed, the participant responded with
“ yeah because at the end of the day you make people eat more sustainable foods, so yeah that
is fair. ” (P4). This illustrates that participants can be motivated to perform a desired behavior
(consume sustainable products) if the impact of that consumption is put in a metric they are
personally motivated by.
One way that the application could provide assistance in the goal setting process is ranking the
difficulty of a goal. Quantizing effort necessary for a new behavior is important. This
quantization of effort was commonly referred to by participants as a rank, or level, for the
difficulty of a goal. “ .... it could also be nice to have some kinds of levels, for example if you
120
/
completed a certain number of goals [at one difficulty], you go to the next level. ” (P2). “I would
like to choose a difficulty [for the goals].” (P1). This quantization of the difficulty of a goal gave
participants a more concrete understanding of how much effort they would need to complete the
goal they set themselves, as well differentiate between kinds of goals they set themselves. In
addition, participants felt more satisfaction when completing goals of a higher difficulty, and
thought they deserved special recognition for it. “ .... if you do hard ones then you get more
points and so on. ” (P5). “If you did better than your goal, it would also be nice for this to be
acknowledged in the app” (P2). This observation was made based on the comments of one of
the first participants interviewed, and the idea was posed to other participants in subsequent
interviews. Participants were in favor of this concept: “yeah that kind of stuff” (P8) . “Yeah,
something like that” (P6). “Yeah it would be cool” (P3).
Community
This is the final theme that emerged from the interviews and consists of four sub-themes:
Identity within Group, Disconnect from group, Social Movement and Effect of Group.
Identity within Group
Before the experiment, it was explained that the group was composed of anonymous users of
the application from the participants’ age group (18-30). Participants were comparing their
performance to the group’s substitution and goal completion rates, and being exposed to the
group’s purchasing habits. The purchasing behavior, substitution rates and goal completion
rates were faked for the experiment and the participants were informed of this after they filled
out the second questionnaire, thereby finishing the experiment.
One finding was that participants wanted to understand more about the group they were being
compared to, and choose this themselves. Individuals may desire to specify the
constituents of the group of comparison. “[I am not motivated by the group] when I am not
sure who those people are and how many there are” (P2). “I think it would be nicer to compare it
(performance) with people in your city, your vicinity, or university. Something like that. Like
different ways of defining that group would be nice” (P1). When a participant was asked about
whether they would like more say about the group they were being compared to, they replied
with: “ Yeah that would help. So split the people between meat, dairy and both. ” (P8). There
were a number of reasons given for this, one participant reasoned that they wanted to compare
themselves with those that set similar goals, another said that they wished to compare
substitution rates with only those that substituted meat instead of both meat and dairy. This ties
in with the following sub-theme of Disconnect with the Group, and is elaborated on further
below.
121
/
A similar finding was that participants wished to make the group their own. Individuals may
want to personalize the group of comparison. “ I think it would be nice to just add my friends
to the group, like people I know or my family as well ” (P2). “It's always better if you know the
people you are comparing yourself with.” (P1). Understanding who the participant is comparing
themselves to helps them judge their own performance, as they would have a better
understanding of their group’s goals. An anonymous group doesn’t provide this information, and
therefore it is harder for participants to understand if their performance is even meaningful. This
was illustrated by one participant who commented: “ Yeah maybe there are 10 people who did
better than you but 30 that didn't, so the whole graph is lower ” (P2). Their suggestion was to
have levels or rankings for users’ performances, similar to those of goal difficulty. “ Maybe you
could have ranks like beginner, medium and advanced. So then you compare yourself to your
target group. ” (P2). This also ties back to the theme of Effort, where the participant is interested
in how much effort the group they are being compared to is putting in, so as to evaluate and
validate the amount of effort the participant themself has put into their progress. For some
participants this meant adding people with similar goals, or consumption habits, while for others
this meant forming a group of people they knew, such as friends and family.
The application did not allow the participants to specify and personalize the group they were
being compared to, which led to an interesting finding. Being unable to find a comparable
sub-group within a group can lead to demotivation. The main reason that participants were
demotivated was that they felt the comparisons being made were unfair. When asked how a
participant felt when they compared their performance to the group’s they replied with: “.... it
was more demotivating than motivating. Then again, I already had the whole meat thing I wasn't
doing. If I was a normal person that eats meat 6 times a week, then I can change so much. But I
am already eating only beans. (So you feel it's an unfair comparison?) Yeah exactly ” (P8). The
fact that they knew that they were performing good behavior, and that they weren’t able to
specify who they were being compared with, such that they saw zeros at their meat substitution
rate, while the group had higher values, demotivated them. Two other participants had a similar
experience “I feel it was too general, and I only wanted to be compared to dairy people” (P7), “ I
felt it was unfair, because I felt like I was doing quite a good job. Then I saw that others buy
more replacements or substitutes (for meat). ” (P3).
Disconnect with Group
As discussed above, some participants were particular about the makeup of the group they
were being compared to. Since they were unable to do so in the application this led to the
finding that not finding one’s place within a group can lead to a disconnect with the group.
“No, I really couldn't care less what people are doing” (P7). “.... honestly, it’s their life. They can
do them.” (P4). One participant reflected that they were not concerned with the group’s
performance because he didn’t feel like they were working toward a common goal. “For me, I
don't really care that much about other people's performance, unless we are in a collective
group” (P4). This disconnect from the group is detrimental to behavior change, as it means that
122
/
participants are not motivated by group performance or social norms, and require different
approaches instead.
Another finding relating to the disconnect with the group is that the anonymity of a group can
be a reason for a disconnect between an individual and the group. “ .... because now I don't
know who I am comparing with. It could be people who are entirely vegans ” (P1). “.... it is also
important to which group you are comparing yourself. I could compare my math with a group of
3rd graders, so then I am good.” (P2). “(Do you think you and the group have different goals and
use cases?) It’s very different yeah.” (P8). One participant reflected that they don’t feel a
connection to the group as they could be comparing their performance to vegans, who would
always perform better than someone who is slowly transitioning to alternatives. Another
participant reflected that it's worthless to compare themselves to an anonymous group because
they could be falsely patting themselves on the back when they see they are doing better than
the group, when in fact the group sets themselves goals of a different difficulty ranking. The lack
of information about the group means that participants are unable to gauge the difficulty of goals
that others set themselves, and are unable to put the groups purchasing habits into context,
which then makes comparison difficult. This was evident when one participant said: “ but then I
started questioning the types of goals I was being compared to” (P6).
Social Movement
An interesting finding was that some participants felt a sense of community with the other users
of the application, despite their anonymity. Feelings of belonging, of community can arise
towards a group. “.... it's more like a global and community thing not a one person thing.” (P7).
“I saw there are some other people that are purchasing some good alternatives. So I am not
alone in this.” (P5). The knowledge of the existence of a group, despite its anonymity, provided
some participants with a feeling of belonging, and reassurance. It was comforting for them to
know that they were not the only ones making these changes in their consumption. This feeling
of belonging stems from the fact that participants are working towards something, or changing
their behavior to affect something, that they feel is important. Seeing others work (by making
changes in their purchasing behavior) towards the same thing brings a feeling of community and
unity.
Despite some participants having a disconnect with the group, a few participants felt that they
were part of a movement. There can be a personal investment in the group’s progress. “it
made me feel good when I saw them ahead. I was like people are catching up” (P7). “ .... it
would be cool if you can see a certain improvement overall of all the users of the app ” (P3). “[I
would be interested to see] what is my city's average, how is my city's average compared to the
country's average” (P7). Participants wanted to know how the group was performing and it
made a participant feel good to know that the group was improving their performance. This
investment in the group is a source of motivation, as they see the group improving and are
spurred on to do the same. This is covered more in the next sub-theme of Effect of Group. This
investment in the group’s progress may also originate from the community feeling, where
123
/
participants wish to see other people progress towards an important goal that they themselves
are working towards.
Effect of Group
There were some intriguing effects that the group had on the participants which led to some
interesting findings. One finding was that participants expressed an interest in what others in the
group were purchasing. There is a trust in, and reliance on, the group’s experiences. This
manifested in a number of ways, where participants felt their choice for an alternative was
validated if it also happened to be the most popular choice, where they would choose the
product because it was a popular choice, or at least be more inclined to doing so, and rely on
the group’s experience to find the tastiest alternative without having to look through the entire
list. “Yeah definitely, I would choose that one (popular choice), if it's the most popular choice
then that would be, yeah I would choose that one if I had to choose out of the replacements.”
(P3). “I guess if I was seeing an alternative I was going to go for, it (the popular choice badge)
would validate my choice ” (P6). “if I see it recommended, then I assume a lot of people liked it,
and if a lot of people liked it, I assume it is good.” (P4). “It’s quite inviting to try it out, because it's
like your peers saying hey this is very good” (P7). “ It was nice because many times in the end I
was choosing the most popular one. It made my choice a little bit easier. ” (P2). Despite not
knowing the makeup of the group, general opinion on products seems to be easily accepted or
at least taken into consideration.
Another finding was that viewing the group’s purchasing behavior such as substitution rate
caused them to think about their own habits. Exposure to group behavior may cause
reflection on the individual’s behavior. “It did make me realize that they were reaching their
goals more than mine.” (P8). “Moments yeah, like i thought like oh wow, look at how they’re
doing and look at how I am doing.” (P6). “I felt like oh wow others do, so maybe next time I will
definitely try.” (P3). “If they are able to make better choices, that might motivate you to make
better choices. It may encourage you to look again and take a second look at the alternatives.”
(P6). Participants reflected on their goal completion, on how much the group was substituting
compared to themselves, and in some cases were motivated to try harder to substitute
products.
The final finding that arose from the analysis was that participants used the group to judge their
own performance, despite it being an anonymous, unfamiliar group. Groups can be used as a
baseline to judge the individual’s performance. Many participants used the group as a
comparison for their performance. “You can compare with the group and see how well you are
doing.” (P3). “I would just see that I was doing better than the others ” (P2). “I felt bad that they
were achieving their goals, and I wasn’t.” (P7). Participants used the behavior of the group to
derive a reaction for their own progress, be it positive or negative. “ It made me happy when I
was doing better ” (P2). “It was nice to see that i was on par”. (P6). The group gave the
participant a context with which to evaluate their performance within.
124
/
6.5 Discussion
This section will discuss the results of the statistical and thematic analyses conducted in the
previous section, which were conducted to help answer RQ5 and RQ6. The hypothesis for RQ5
was that the application would have a positive effect on participants' awareness of, perceived
affordability of and intention to purchase sustainable alternatives. In addition, the hypothesis for
RQ6, the hypotheses were that the participants would be motivated by normative influence to
change their behavior, that the agency that personal goal setting affords is conducive to
behavior change, that repeated exposure to the price of alternatives would improve their
perception of their general price, and that they had a positive experience with the application.
6.5.1 Discussion of Results from the Statistical Analysis
The result of the statistical analysis of the responses to the statements in the questionnaires
was that the application only had a significant effect on the participant’s awareness of dairy
substitutes. In the case of dairy alternatives, some found that they liked the alternative more
than the conventional dairy product, as was the case for two participants. “ I didn't do it because
it's the right thing to do, it’s because I genuinely like soya milk now ” ( P4). “Thanks to the
application, I have started using soya milk.” (P5). For dairy products, particularly milk, it seems
that participants are more willing to substitute this, especially since the alternative is similarly
priced. “ Soya milk was an outcome of that (most popular choice feature). [This was due] mostly
[to] price, rather than popularity. ” (P5). “The cheapest is what I would go for which is soya” (P6).
“I'd say I think the Haver milk is doable as I know the taste is pretty good and the price isn't too
high” (P8). This issue of price, agrees with the findings of Mundkur (2020), where a major
barrier to sustainable consumption was price of the alternatives. This explains the findings of the
statistical analysis where the application only had a significant effect on the participants’
awareness of dairy alternatives. The descriptive statistics in Tables J1 and J2 also support this,
as the mean score for awareness of dairy alternatives increased, with a decrease in standard
deviation, indicating agreement between participants.
The finding that this increase in awareness was not similar for meat alternatives could be
explained by the interviews. “I don’t really like those meat replacements, so I don’t buy them”
(P3). “I like the meat part so much I wouldn’t want to switch. It’s not just that it's chewy, it lets out
these juices and stuff which I really like, so I wouldn’t want to change that for an alternative that
doesn’t have these traits.” (P1). It seems that certain participants were too fond of conventional
meat products, and did not want to substitute them as they didn’t think the substitutes matched
up to the original flavor, or were just not fond of the alternatives in general. This lack of
willingness to replace conventional meat products may explain why there was no significant
statistical evidence to suggest that the awareness of meat replacements was affected by the
application, as it is possible that some participants did not want to consider meat substitutes.
The descriptive statistics also support this, where there was a larger, significant, positive
125
/
difference in agreement on the topic of dairy awareness as opposed meat awareness, which
while positive, was insignificant.
It was particularly difficult to measure the impact on the participants' cooking practices in a
group due to the COVID-19 viral outbreak and resulting lockdown of citizens. This meant that
the participants were less involved in situations where their friend group had an influence on the
contents of the dishes they prepared together. “Just myself, more because of Covid 19 I guess.”
(P4). “Not directly, I haven't been in touch with my friends.” (P5). That being said, participants at
different points mentioned they observed a general acceptance of substitutes amongst their
peers. “From what I can see, [in] the last few years, there are a lot more vegetarian students.”
(P8). “Now it is more popular and people find it more acceptable to have a beyond meat burger.
And now some restaurants serve it in their burgers. So it’s like hey I am bringing a burger that is
sold in that place for 12 euros [to a barbecue].” (P7). “My roommate became vegetarian and we
(the other roommates) didn’t know how to do this, and I was skeptical because I only knew how
to cook with meat. But in a few months, I found it easy …. We found it easy, healthy and tasty.”
(P8). This indicates that some participants are aware of a general change happening around
them, and in certain cases, changes in the attitudes of people close to them. However,
participants also recounted the times that a certain group of friends would cause them to
reconsider substituting alternatives. “.... the rest are all very very against the substitutes. They
love meat, they won't go for veggie burgers.” (P6). “Friends and I wanted to make a meal a
while ago, but my friend didn't want to [substitute] because he hated substitution meat. If you
want meat, just put meat. Group opinions like that kinda makes me not want to buy this.
Purchasing this kind of food is a risk because even though you might like it, they might not and
they might not be open to experimentation.” (P4). This may be an explanation for the lack of
significant results that the application had on participants' willingness to substitute meat and
dairy products when cooking for themselves and others, as some participants reflected on the
clear effect a certain friend group had on their willingness to substitute meat/dairy products
when dining with them.
On the matter of affordability of alternatives, despite the lack of significant statistical evidence to
suggest the application affected this, the interviews with participants provided anecdotal
evidence to suggest that it did to a certain extent. “ For dairy [products], yes that there are
cheaper alternatives. ” (P1). “I could see that there are certain products that the plant-based
substitutes were cheaper, so that is nice.” (P2). “Yeah it changed. It improved, I feel like I would
buy them more easily.” (P3). “I found out they are a lot more affordable if you know what you are
buying” (P4). “For dairy it was a good experience, I had a good change. Dairy is probably butter
and milk, those are the things I changed.” (P5). “It did, the lesser well known ones are cheaper,
like more huismerk (own brand) ones. ….With that kind of stuff there is a definite noticeable
price difference, they are quite affordable on a daily basis” (P6). A possible reason for the lack
of sufficient statistical evidence for this, is that while some participants did find some dairy
substitutes to be cheaper for certain products, for other products, like quark or cheese, there
were no alternatives available, or the price was much higher for the alternatives. This may have
126
/
prompted them to lower the level of agreement they gave on the likert scale to statements
addressing the partial or complete switch to dairy substitutes when cooking for themselves.
This is similar for meat replacements, where participants either did not search for meat
replacements or did, and found them to be more expensive as was the case for a few
participants. “.... you have Impossible Burger and Vegetarische Slager (Vegetarian Butcher),
that are more premium, which actually taste really good. But it's just too expensive to buy as a
student.” (P8). “So for the meat, it did not change much. I still saw it was a bit on the expensive
side.” (P5). “With meat it is definitely noticeable because meat is so cheap. The alternative is
more expensive, you get 2 patties for the price of 4 with real meat.” (P6). This may be an
explanation as to the lack of sufficient statistical evidence to suggest the application had an
impact on opinion of affordability of meat substitutes. These results regarding affordability agree
with the descriptive statistics, where there is only a slight, positive difference in agreement on
the matter of affordability, with the standard deviations only reducing slightly.
The results of the Sign Test in Table 13 show that after using the application, participants were
able to say, with significant statistical evidence (p = 0.05), that the application helped them
discover sustainable alternatives to conventional meat/dairy products they consumed (p =
0.012), and that it was more realistic to achieve goals that they set themselves (p = 0.001). For
the statements from Table 13 which failed to reject the null hypothesis due to insufficient
significant evidence, it is difficult to explain these results due to the low number of participants.
Descriptive statistics from Table 3 shows that the statements which failed to reject the null
hypothesis correspond with a standard deviation of more than 1, which may provide an
explanation as to the lack of significance of the results. The findings regarding statements that
fall under the Goal Setting and Use of Application categories are discussed in the following
sections.
127
/
6.5.2 Discussion of the Thematic Analysis
Below, the main themes of motivation, community and effort are introduced with an emboldened
summary of the findings.
Motivation is personal and nuanced
A significant finding from the thematic analysis was that motivation is extremely nuanced and
personal. The same source of motivation for one participant can be a source of demotivation for
another. Some users may rely on competition with others to do better, while others prefer being
driven by the social norms of an anonymous group. “[I] Wouldn't like to know the people,
because a leaderboard might show I am not winning and then there is less motivation.” (P3). “....
it (competition) kind of becomes a game, gamification of a process is something I like.” (P5).
This suggests that a personalized approach to motivation is necessary in such behavior change
applications. An intervention should not demotivate a user to the point where they do not want
to invest any more effort to improve their performance. Looking back, the Personalization
feature from the Primary Task Support category from the PSD model is perfectly suited for
motivation. Tailoring is important in behavior change, as effective motivational strategies depend
on the user in question, a finding echoed by Masthoff et al (2014) in their preface to
personalization and behavior change. Similarly Berkovsky et al (2012) discuss how introducing
tailoring into persuasion has the potential to increase the impact of behavior change technology.
Busch et al (2015) reflect on how tailoring in serious gaming has become more popular and that
personalization can better support behavior change than a one-size-fits-all design. Literature
suggests that Personalization is an important system feature that should be considered a
priority when designing a system for behavior change. This however can be difficult for smaller
research projects, which may have to focus on a smaller set of features in their system because
of this. There is therefore a tradeoff between how tailored systems can be made to the
individual user, and the number of features a system can include, on a given budget or time
frame.
A possible future approach to personalized motivation would be to determine what motivates
and demotivates the user at the beginning of their interaction with the application. This could be
done by asking how they would respond to hypothetical scenarios, such as having their
performance compared to others they know. Another way would be the application learning
what motivates the user by tracking their activity and linking the inclusion of certain features to
changes in progress, and using a process of elimination to determine which features work best
for the individual. The user could also start with all the features present and then rate their
motivational effect, to then progressively personalize their experience. These are examples of
how the experience of the user can be personalized such that they are motivated with methods
that work best for them, to afford them the best chance to change their behavior.
128
/
The anonymity of the user in the study came with a certain lack of accountability for
performance, where if a participant ended a good streak, or wasn’t performing well, it was
comforting that they weren’t held in the spotlight because of this. This lack of accountability
allowed some users to fall behind on their progress without social consequence, and make
progress at their own pace, without having their progress tracked by others. This safe space
that anonymity affords a user may be beneficial to some, and should be considered as an
argument for anonymizing users in a group when designing a behavior change intervention that
includes Social Comparison or Competition as Social Support features. “ [It is] annoying to have
a face with who is doing better, versus in general people are doing better ” (P3). Chang, Danie &
Farrell (2014) adopted a similar approach in the design of public displays to promote healthy
eating, where users were given the option to either anonymously share their data with the
database, or attach a name to their performance to be displayed on a leaderboard. Giving the
user the option to remain anonymous with their data creates this safe space for users to
progress at their own rate while being influenced by the group’s performance, as well as
individuals’ performances if a leaderboard is introduced, while allowing them to publicize their
data at time when they feel their data reflects their behavior in a suitable manner, or when they
find a similar subgroup of users with whom comparing their progress against is appropriate.
Despite the group being anonymous, participants were still able to derive a positive feeling and
even motivation when they were performing either better than the anonymous group, or in some
worse than them. “ When I would see that I am doing better than them I was like yeahhh …. if i
am not doing better it is also nice to see this so I am motivated to do better than them again.”
(P2). “.... it’s just in general people are doing better, I should too” (P3). This suggests that even
though the group is anonymous, it can still be a motivational factor, as the anonymous group’s
behavior may represent social norms. Normative Influence is an important motivator for
behavior change and predictor of behavior, a finding consistent with literature on the topic
(Nolan et al, 2008; Cardenas, 2011) The Theory of Planned Behavior introduced by Ajzen
(1991) posits that norms along with an attitude towards the behavior, and perceived behavioral
control, directly contribute to a certain behavior. The combination of social normative influence
and anonymity within a group may be the right design choice for users that are not comfortable
with competition or are demotivated by it, while still supporting behavior change.
Another result regarding normative influence is that a user may use the group as inspiration. In
the context of this application it was in the form of inspiration for the level of difficulty of goals to
set, and substitutes to try. This agrees with findings from a similar study by Chang, Danie &
Farrell (2014) where users of a public display to promote healthy eating in the workspace saw
what other users were eating on the display and were inspired to do the same. This also shows
a level of trust in the choices that their coworkers were making, similar to what participants
using the application experienced where there was a trust in the choices and experiences of the
group when it came to choosing a sustainable alternative. This is understandable as humans
are social creatures, and learn from, and observe, one another. A reason this may happen is
because viewing social norms incites reflection on the individual’s behavior, and how that
individual’s behavior aligns with the group’s behavior. This is consistent with the findings from
129
/
the thematic analysis, and literature shows that self-reflection is important for behavior change
(Rothman, Sheeran & Wood, 2009; Ratelle et al, 2017; Consolvo et al, 2009).
Regarding Self-Monitoring, participants desired more information on their performance. A
finding from the thematic analysis was that participants wished for quantifications of their
progress. Participants were interested in metrics such as their carbon footprint, and
representing progress in metrics that the user can appreciate, could aid in their motivation. “I
think it would be more interesting [to know] about the general footprint” (P3). “.... like a
sustainability score, that you can get off multiple things.” (P1). This doesn’t necessarily have to
be related to sustainability, but can also be something that the participant is interested in
personally. Such as the grams of healthy fats they have consumed, or grams of protein they
have consumed from sustainable sources versus animal sources, if a user is interested in
nutrition, as discussed with one participant. This agrees with the findings of Chen (2009) who
found that consumers were more motivated by the selfish factor of personal health, than
something more altruistic like the environment. Measuring the user’s progress in ways that are
relevant to their motivations, interests or goals is more likely to motivate them. This design
approach was taken by Petkov et al (2012), where they designed different displays of energy
consumption based on different motivators: egoistic, altruistic, biospheric and social norms. This
allowed them to contextualize the feedback they were giving users in a way that the users
appreciated and were more motivated by. Looking at the PSD model, this can be seen as
Tailoring, a Primary Task Support feature.
Community is important
A sense of community is another theme that emerged from the thematic analysis, where
participants appreciated being part of a movement, that they didn’t feel alone in the changes
they were making to their behavior, and that they were working towards something as a group.
This shared common goal and feeling of togetherness is something that was motivational for
participants. One participant reflected that they were not motivated by the group’s actions
unless they were striving towards some common goal. “.... if we are like doing it as a group or a
family, then I am more inclined to care” (P4). Making the user aware of the progress they are
making as an individual, and the group they are part of is making, may be the motivational push
that some users require in order to change their behavior. “Then again, it's also fun to see how
many goals the other people are completing ” (P7). “.... it would be cool if you can see a certain
improvement overall of all the users of the app” (P3). Looking at the PSD model, the Social
Support category has the Cooperation feature, which provides the user the means for
evaluation at a group level, which would be appropriate for this. Designing community related
features is popular in behavior change technologies (Purpura et al, 2011; Dixon et al al, 2015)
and creating a sense of community has been linked with behavior change (Heinrich et al, 2017).
While an individual connecting with a community is important, it is almost equally important for
them to find their place within the community, for their sense of identity. Not doing so may
negate some of the benefits as individuals cannot relate to others within the community due to
130
/
differing motivations or goals. A finding from the thematic analysis was that participants wanted
to identify with a sub-group within the group and were demotivated when they found they
couldn’t identify with the group. This finding is echoed by Fritz et al (2014) who, through
interviews, found that their participants expressed a need to find users with similar goals and
performance in a fitness tracking application. Not only this, but not finding a similar sub-group of
users had a demotivational effect on the participants of the study. Therefore when including a
social aspect in the design of a behavior change intervention, it is important to also consider
how members of the community will be able to distinguish one another based on performance,
metrics etc. so that they may find a clique, or relatable sub-group, in order to fully benefit from
the presence of a community.
Explicitly setting group goals and informing the user of their contribution towards the group goal
may be an interesting way of engaging the individual, and providing them a sense of a common
goal, which was found to be a motivational factor in the analysis. A system could look at
common metrics that users find most important and form group goals out of those, whereby a
user is more likely to care about the group goal as it is relevant to them. As discussed above,
competition can paradoxically be a motivator as well as demotivator, and in order to motivate an
individual to contribute towards the common goal, one way to do this would be display to the
user the percentile of contribution they reside in. This is less confrontational and personal than a
leaderboard and may leave more space for self-reflection instead of demotivation.
The less effort the better
Other desires for features from the PSD model that came in the interviews were Praise,
Suggestions and Rewards. This was mainly in relation to goal setting, where participants
expressed the need for more motivation and encouragement from the application’s side when it
came to making shopping lists, either by suggesting they substitute certain products to meet
goals they set themselves that would expire soon, or by suggesting recipes that would give
them inspiration to substitute conventional products. “.... you can have the shopping list, and
then you can have a gamification thing, like icons like back there in zelda like little hearts or
something. ” (P7). “Maybe also it would be nice to see some recipes” (P2). In addition to that,
participants also expressed a desire for accomplishing their goals to be recognized more within
the application, especially so when they outperformed their own goals. “If you did better than
your goal, it would also be nice for this to be acknowledged in the app” (P2). Rewarding good
behavior ties into Reinforcement theory, and is an important tool in behavior change as
discussed by Orji et al (2012) in their work on designing a casual game that helps with dietary
behavior change. Rewards are also a popular system feature in gamified systems for behavior
change (Eugenio & Ocampo, 2019; Patel et al, 2015).
An interesting concept that one user came up with was earning a “cheat day” through good
behavior, where they were allowed to purchase unsustainable items without affecting their
progress because they had earned it through good behavior. “ We were thinking of buying the
131
/
substitute, but yeah I mean I was already fulfilling all my goals beforehand, so I can have one
cheat day if I can put it that way. ” (P2). The analysis found that when the application did not
satisfactorily recognize “good behavior” through praise and recognition, this could be
demotivating to the user. The appropriate amount of praise and types of rewards is something
that the user could specify when they begin using the application, just like their methods for
motivation, or something that could be co-designed with a focus group from the target
population.
Something interesting to note is that a finding from the thematic analysis was that some
participants attributed different meaning and functionality to a feature in the application,
specifically color coding. This was interesting as they reduced their overall effort for behavior
change by using a feature that was designed for one purpose, to visually represent the
sustainability of a product, as a way to motivate themselves, and as a goal to increase the
number of products highlighted with green in their shopping list. In order to design a system in
line with reducing the overall effort that a user would put into changing their behavior, perhaps
one way to do this would be to design a system feature that can be used in multiple ways, or to
help the user achieve multiple things. Features could be designed and then augmented to
support additional functionality, without the need for a separate feature. Taking the example of
the participants using color coding as a goal, instead of having a separate goal setting page
which was ignored or found to be superfluous by a few participants, the color coding feature
could be augmented to show the user progress with their consumption. The feature could also
be augmented to give the user an understanding of their performance with substitution. For
example if a user added chicken filet to their list, then the application could assign it a shade of
orange relative to how often they substitute that product, such that a lighter shade of orange
would imply that they substitute the product very often, and vice versa. This would give the user
a better understanding of their previous substitution behavior with regards to the product and
allow them to make a more informed decision. This reduces the effort of the user having to open
the Performance Overview page in the application to see their past behavior.
A finding from the analysis was that participants have a certain individual threshold for effort,
when if crossed, motivation to continue the new behavior drops. Reducing the effort that the
participant needs to invest in order to understand their own consumption and performance may
be a method to increase motivation to use the application and commit to a change in behavior.
This is consistent with findings from other behavior change studies, where a high level of effort
and perceived effort, is a barrier to behavior change as shown by Sparks et al. (1997), who
report this in the context of diet change, and by DuCharme & Brawley (1995) in the context of
fitness and exercise.
Part of the novelty of this application was its inclusion of a personal goal setting feature, a
functionality found to be lacking in behavior change systems reviewed in Section 2. A finding
from the statistical analysis of statements falling under the category of Goal Setting was that
participants agreed that setting their own goals made them more realistic to achieve (p = 0.05).
This is supported by findings from the interviews, where participants showed an appreciation for
132
/
being given the ability to set themselves their own goals, were motivated by achieving goals
they set themselves and displayed compensatory behavior when failing to meet a personal goal
by setting another one as a response. This finding is further supported by the descriptive
statistics in Table J3 where the statement regarding realism of a goal depending on the user had
a mean score of 6.36 with a standard deviation of 0.674. Achieving one’s personal goals has a
positive effect on their self-efficacy, an important aspect of behavior change. A finding was that
participants displayed an ownership of progress, which may be linked to self-efficacy. They were
motivated by achieving their own goals, and by doing so, increased their self-efficacy. The goal
setting feature encouraged self-reflection on purchasing behavior, and self-reaction to correct
goal difficulties for future goals. Feeling able to complete goals, and attaining self-set goals
improves self-efficacy for goal setting and progress (Schunk, 1990). Literature shows that an
individual’s self-efficacy is linked to their motivation for behavior change, and increasing this can
have an effect on behavior (Strecher et al, 1986; Parschau et al, 2014; Linde et al, 2006).
Behavior change systems should be designed to increase the user’s self-efficacy, and one way
to do this is to allow them to set their own goals and provide support to help achieve them. This
support also turns out to be quite important, as participants found the freedom of setting their
own goals to be slightly overwhelming, as they had to deal with a learning curve. “It first asks
you how many substitutes you want to have, and I put 2 and then it asks for how long, so I
thought that if I put 2 shopping trips, it would add 2 substitutes per list, but then I realized it's not
the case. So this was just the learning curve of the app.” (P2). In response to this learning
curve, participants looked to the group for inspiration for goals, as they required a frame of
reference to be able to judge the difficulty of the goal. Therefore simply providing a user the
means to set themselves a goal is not enough, providing support for personal goal setting
(suggestions of goals at their level for example, or suggesting a goal which they can adjust
based on common consumption habits) is necessary for the greatest chance for self-efficacy to
be increased.
6.5.3 Discussion of the General Experience with the Application
The interviews revealed that overall, the participants had a good experience with the
application. There were a few bugs experienced, such as the app crashing if it was left open in
the background for hours at a time and then reopened, deleting of items causing the item above
it to be deleted as well in the shopping list, and certain explanations on the Explanations page
not loading properly. However when asked whether these bugs affected the experience of the
application, the participants responded that they didn’t, as the shopping lists were never lost, so
no work that they had done was undone.
There was a general appreciation expressed for the manner in which alternatives were shown to
the user. This was reflected in the findings of the statistical analysis where the mean score for
the applications utility for finding new alternatives was 6.09 with a standard deviation of 0.831.
133
/
Participants were appreciative of the fact that it was so quick and easy to find alternatives and
mentioned that because it was made so easy, it encouraged them to explore the alternatives.
“ (How did you experience finding alternatives?) Also quite easy, like if I was adding dairy or
meat product to my list, it would turn orange and then I just clicked on it and I could see the
most popular one and I could also see other substitutes. So it was quite easy. ” (P2). “Changing
the groceries is actually very nice, the way you implemented it right now. Because all I need to
do is press on the thing, and it just automatically gives me a list of all the available alternatives
and I just need to press buttons. I don't even need to do anything else. Just press the item,
badabing badaboom and you are already in the thing. I have no issues with it, it's kinda very
intuitive.” (P4). “It was pretty efficient and I liked it.” (P5). As mentioned in the previous section,
reducing the effort needed for a new behavior is important, and reducing the effort it took
participants to discover new alternatives, using the system feature Suggestion, was positively
reflected upon in the interviews.
Due to the way color coding worked in reducing the effort it took participants to understand
which products they consumed were sustainable, and to get a quick understanding of how
sustainable their basket was, participants were appreciative of the feature. “Also quite easy, like
if I was adding dairy or meat product to my list, it would turn orange and then I just clicked on it
and I could see the most popular one and I could also see other substitutes. So it was quite
easy.” (P2). “it was very fast to see that something has an alternative because of the color
coding. It was very clear, just click on the chosen product and you have all the alternatives, I
don't think it can be easier than that.” (P7). “I especially liked the color coding, it was really
effective. LIke scrolling through my list at the end just to see I could do a bit better on meat if I
dropped product x and replaced it with this. So that was nice." (P6).
In addition to this, a couple interesting use cases emerged where the application was used as a
look-up table for alternatives, and a sustainable meal generator. “I went on the application to
look up certain products and see if there were alternatives for them.” (P8). “I'd use it as a
gambling machine for dinner. Like oh what will I eat tonight, badabing badaboom its veggie
fish-sticks.” (P4). This is another example of participants ascribing their own meaning or uses to
system features, as discussed in the thematic analysis.
It also seemed that the Performance Overview page was not utilized a lot by participants in
general, who tended to ignore this. “I would say I was not paying that much attention to this.”
(P2). “I didn't feel it was necessary to see my performance” (P1). “I rarely looked at the
performance measures” (P5) Reasons for this were because participants found comparisons of
their behavior to the group unfair, as they found they stood out from the general consumer due
to their purchasing habits and therefore had not found a comparable sub-group as group
filtering and personalization were not supported by the application. “I already had the whole
meat thing I wasn't doing. If I was a normal person that eats meat 6 times a week, then I can
change so much. But i am already eating only beans. (Was the comparison unfair?) Yeah
exactly, so the people who have a worse diet can improve so much more and set goals that I
have already surpassed.” (P8). “.... it is also important to which group you are comparing
134
/
yourself. I could compare my math with a group of 3rd graders so then I am good.” (P2).
Another reason was some participants disliked having their performance compared. “For me, I
don't really care that much about other people's performance, unless we are in a collective
group. Because I don't really like comparing myself to other people.” (P4). “.... because then I
know I won't be winning and then I would be less motivated.” (P3). Some participants also had
difficulty understanding the graphs, while others found it not to be an issue and were used to
being presented with information in graphs. “Didn't understand what the bar graphs were
showing me.” (P5). “(Did you have any difficulties understanding the graphs?) No, not at all.”
(P3). This shows how different kinds of users may benefit from being shown information or
feedback in different ways, where some may be more familiar with viewing a graph or chart
while others do better with numerical summaries.
The findings from the thematic analysis can be summarized as guidelines and
recommendations for the future design of behavior change interventions that target sustainable
food purchasing, and behavior change interventions in general. The design of the intervention
should strive to reduce its cognitive load on the user as much as possible, and endeavor to
reduce the amount of effort the user needs to invest in the intervention. Functionality designed
around the PSD model feature Reduction was appreciated due to its effort reducing nature. In
addition, when providing total agency to a user, this agency may be overwhelming to some, and
the intervention should strive to support the user in managing this agency. Furthermore,
designers of interventions should attempt to personalize and tailor the user experience as much
as possible as motivation for behavior change is very personal and can vary greatly between
individuals. If an intervention has a community aspect, the design should allow users to
customize who is in their group, to allow users to identify with a specific sub-group of users
within the larger community, in order to be appropriately motivated by similarly performing
individuals, either through direct competition, or normative influence of those they identify with.
135
/
6.6 Answering the Research Questions
This chapter aimed to answer RQ 5 and 6 by means of a field study of the application designed
in Chapter 4 and 5.
RQ5. Did the application have an effect on the following:
a. The participant’s perceived affordability of sustainable alternatives
b. The participant’s awareness of sustainable alternatives
c. The participant’s intention to purchase sustainable alternatives
The findings from the statistical analysis was that there were few conclusions that could be
drawn with significance. Starting with affordability, findings from the field study showed that
there was a slight improvement in overall perceived affordability, with a more pronounced
increase with regards to certain items, something which is discussed more in the general
discussion in the following chapter. There were certain meat and dairy products for which
participants found cheaper alternatives to, for example milks and meatballs, however in general
participants still reflected on some alternatives being more expensive due to the source of the
substitute. Therefore the participant’s perceived affordability of sustainable alternatives was
affected to a certain extent by the application, as it made them aware of the fact that for certain
products, affordable alternatives existed.
This is also tied into awareness of alternatives, which was found to be improved in the
descriptive statistics for both meat and dairy alternatives, and significantly so in the case of the
dairy alternatives. Interviews found that participants discovered alternatives to dairy products
that they ended up liking more than the conventional product. Therefore, the participant’s
awareness of alternatives was positively affected by the application for dairy alternatives and
increased, and not significantly for meat alternatives. This means the application had an effect
on the awareness of sustainable alternatives to a certain extent.
The participants intention to purchase alternatives was not significantly increased according to
findings from the statistical analysis, however anecdotally, through interviews, it was found that
a number of participants were happy with switching to certain dairy alternatives and that another
would consider doing so when they began to earn more. The context of the purchase also
matters, whether done alone or in a group of friends, as it was found that in some cases, the
opinions of friends was quite influential on substituting animal products. In the personal context,
substitution for dairy products was more apparent than for meat, and for the group contexts,
there was little evidence, both statistical and anecdotal to suggest the application had an effect.
136
/
RQ6. What was the participants experience with the following:
a. The application in general
b. The personal goal-setting feature
c. Being exposed to social norms of group purchasing behavior
d. Being repeatedly exposed to the price of sustainable alternatives
RQ6 was formulated to help understand how users experienced the application, especially the
novel PSD model feature of Normative Influence, and personal goal-setting. Addressing the
general experience with the application, participants overall had a positive experience with the
application. One reason for this was that it reduced the effort required for them to make their
behavior more sustainable, particularly with the color-coding feature, which gave them a quick
understanding of which products they were consuming were unsustainable and a brief summary
of how sustainable their shopping lists were. Another thing that participants were appreciative of
was the ease with which they could discover sustainable alternatives, specifically for the
products they regularly consumed. A couple interesting use cases emerged where participants
used the application as a sustainable alternative look-up table, as well as a meal generator,
where they would try a new item on the list of alternatives. This appreciation for ease - or low
effort - ties back to the theme of Effort uncovered in the thematic analysis, and how perceived
effort can negatively impact behavior change. Therefore using the Reduction and Suggestion
system features form the PSD model to guide the design of these system features was a
justified decision.
There was a mixed reaction to the personal goal setting feature, where participants appreciated
the level of agency they were given with their progress, however some participants found the
learning curve associated with the agency they were given to set their own goals as a stumbling
block. This discouraged a few participants from setting their own goals, and instead resorting to
setting mental goals, or using color-coding as motivation or practice sustainable behavior.
Participants reflected on how setting and achieving their own goals allowed for more realistic
goals to be set, and a feeling of motivation when they were achieved. Personal goal setting
seemed to influence the self-efficacy of some of the participants, which is an important factor in
behavior change. However many participants desired assistance to support the agency they
were given in the form of suggestions for goals from the system, or inspiration from other users
of the application. Therefore complete agency regarding goal setting without support can be
harmful and may prevent or reduce any effect of personal goal setting on self-efficacy.
Regarding the influence of the group (exposure to social norms), the opinions of participants
were nuanced. Certain participants were not able to relate to the group they were being
compared to as they felt they stood out in terms of purchasing behavior, in some cases because
they didn’t purchase meat. The thematic analysis found that there was a certain trust and
reliance on the group’s experience with sustainable alternatives, which was incorporated into
the feature on the Alternatives page which showed the user which alternative was the most
popular choice. Another finding was that participants derived motivation from situations where
they were doing “worse” than the group in terms of goal completion and substitution rates.
137
/
Comparing their performance also triggered reflection on behavior, an integral part of affecting
self-efficacy. However comparing performance also caused demovation for some participants. In
summary, being exposed to social norms of group purchasing behavior had varying motivational
effects on the participants, triggered reflection of behavior and built a degree of trust in the
experiences of other members in the group.
Finally, being exposed to the price of sustainable alternatives had varying effects on the
participants, depending on what they were viewing. There was an improvement of awareness of
alternatives, statistically significantly so for dairy alternatives. A few participants found dairy
alternatives they preferred to the conventional product. This was less the case with meat
alternatives, where although there were some discoveries of cheap alternatives, in general
participants reflected on the price to quantity disparity between substitutes and conventional
products. Participants were able to say that for certain products, being exposed to the price of
alternatives helped change their perception of the price of alternatives, however as a whole for
meat and dairy products, their opinion wasn’t swayed due to not every animal and dairy product
having an equally cheap sustainable alternative.
The limitations of the study are discussed in the next section.
138
/
7. General Discussion
This chapter presents a general discussion of all the research presented in this thesis, with
Section 7.1 reiterating the answers to the research sub-questions before the main research
question is answered, followed by Section 7.2 which looks at the limitations of the field study.
Section 7.3 presents a reflective discussion on using technology to change behavior, and
changing behaviors versus changing attitudes. Section 7.4 discusses the importance of
Personalization and Tailoring in light of the results from the previous chapter, as well as their
barriers. Section 7.5 looks at humanity’s relationship with meat as a possible explanation to the
results of the field study, where participants were more open to changing dairy products than
meat. The chapter ends with Section 7.6 with recommendations for future work.
7.1 Answering the Main Research Question
This section will begin by briefly answering each research sub question, which were formulated
to help answer the main research question of the thesis.
RQ1. “What are sustainable food consumption habits?”
Literature shows that sustainable food consumption habits mainly consist of reducing the
consumption of meat and dairy products, specifically beef which has the largest environmental
impact of all the meat products. In some cases, purchasing locally grown or sourced products
means a lower environmental footprint, however there are certain instances where this isn’t the
case due to advanced processing methods practiced by farms in other countries.
RQ2. “How are systems - that support decision making for habit change - designed?”
a. “ Which features do such systems make use of? ”
The Persuasive System Design (PSD) model by Oinas-Kukkonen & Harjumaa (2009) was used
as a lens to analyse 25 behavior change systems designed for the domains of sustainable food
consumption, food consumption, and eco-feedback in a variety of domains. It was found that
these systems primarily used a mix of information driven and nudge-based approaches in their
persuasion. Popular system feature categories were Primary Task Support and Social Support
system features. Reduction, Tailoring, Self-Monitoring, Social-Comparison, Social Role,
Trustworthiness and Social Credibility were the most popular system features from the 25
observed behavior change systems.
139
/
RQ3. “How can relevant features be implemented in the proposed system?”
This research question was answered by developing a list of relevant system features by means
of the design process of the PSD model by Oinas-Kukkonen & Harjumaa (2009). To begin with,
the Intent, Event and Strategy of the system were defined, and by doing so, the system goals
were enumerated, which were informed by RQ5 and RQ6. Following this, functional
requirements were drawn up based on the system goals, and an individual brainstorm was
conducted in order to generate features in line with the functional requirements for the most
popular system features from the PSD model in the 25 behavior change systems analyzed.
These ideas were then evaluated against the criteria of novelty in literature, feasibility and
relevance to functional requirements. The resulting subset of ideas for implementations of
system features served as an answer to this research question.
RQ4. “Is the proposed system intuitive to use?”
A low-fidelity prototype test was conducted in order to answer this research question. The test
was designed to understand whether people from the target demographic (young adults in the
Netherlands) were able to perform fundamental tasks using a mock-up of the application, and to
find a preference between different designs of certain system elements. The results of the test
showed that the system was intuitive to use and the participants were able to carry out the
fundamental tasks with ease, due to the familiar structure of the application and logical flow
between pages.
RQ5. “Did the application have an effect on the following:
a. The participant’s perceived affordability of sustainable alternatives
b. The participant’s awareness of sustainable alternatives
c. The participant’s intention to purchase sustainable alternatives”
From the results of the field study conducted with the application, it was found that although the
application only had a statistically significant effect on the awareness of dairy alternatives, there
was anecdotal evidence from the interviews to suggest an improvement across awareness,
perceived affordability and intention to purchase dairy alternatives, however this was less the
case for meat alternatives. An explanation for the disagreement between the results of the
statistical analysis and the findings from the interviews was that the questionnaire statements
were too broad and not specific enough when addressing dairy and meat alternatives. The
Limitations section of the previous chapter discusses how if the statements were more precise
and targeted sub-categories within the main category of alternatives, such as milk, yoghurt,
cheese etc. for dairy alternatives, the results may have varied and better reflected the findings
from the interviews.
RQ6. “What was the participants experience with the following:
a. The application in general
b. The personal goal-setting feature
140
/
c. Being exposed to social norms of group purchasing behavior
d. Being repeatedly exposed to the price of sustainable alternatives
The interviews with participants from the field study showed that participants were positive
about the application and appreciated how it reduced the effort needed from them to be more
sustainable. A general theme of appreciation of reduction of effort emerged from the interviews
and the Reduction and Suggestion system features were in line with this which was noticed by
participants. The personal goal-setting feature was a more nuanced experience, as participants
were appreciative of the agency they were offered by the application, however this agency on its
own was slightly overwhelming for some without support from the system in terms of
suggestions for goals or a ranking of difficulty, and combined with the learning curve associated
with personal goal-setting, was ignored by some participants after a single use. Those that did
make use of the feature, found motivation in achieving their own personal goals and reflected
that allowing them to set their own goals resulted in more realistic goals. Similarly, the social
norm exposure had a mixed impact on the participants. Comparison of one’s performance to the
group norms was paradoxical in that it motivated some participants to work harder to
accomplish their own goals or consider substituting more conventional products with
alternatives, while at the same time discouraging and demotivating other participants from doing
so. Viewing the social norms did trigger reflection on purchasing behavior in participants, and a
certain reliance or trust was developed in the group’s experiences with the alternatives. Finally,
the findings showed that participants were able to find products that they previously thought
were too expensive, or were unaware of because of the application and either switched to them
permanently or considered them more seriously.
The main research question of this study is:
“ How can a context-based system, that considers the price of alternatives, be designed
to help its users practice sustainable food consumption habits? ”
A smartphone application was developed that helped users plan their grocery lists, informed
them on which products were sustainable, suggested alternatives, allowed them to set their own
goals, exposed them to social norms and gave them an overview of the performance in terms of
substitution and goal completion rates. The application made use of the system features
Reduction, Suggestion, Normative Influence, Tunneling and Self-Monitoring from the PSD
model by Oinas-Kukkonen & Harjumaa (2009). In addition the application was Tailored to young
adults in the Netherlands by involving the price of products in its design, a barrier to sustainable
consumption for young adults in the Netherlands found by Mundkur (2020). The system also
featured personal-goal setting, a feature not included in the PSD model.
By answering the research sub questions, it was found that system features such as Reduction
and Suggestion , when designed to reduce the effort needed to perform a new behavior, are
appreciated by the user and the application was effective in raising awareness of sustainable
alternatives for dairy products. For sustainable meat alternatives, it seems there are deeper
141
/
seeded factors to consider such as a higher attention paid to flavors, and the existence of
cultural and historical traditions, resulting in an overall stronger connection to conventional meat
products. Literature indicates that making a personal connection through the health effects of
meat consumption and providing educational information may be a promising method to help
transition to meat alternatives. Motivation for behavior change is nuanced and personal, and a
one size fits all approach may be enough to help transition to dairy alternatives but not strong
enough for a transition to meat alternatives. More attention needs to be paid to how the design
of system features may benefit the motivation of some, but hurt that of others. Facilitating
personal goal setting is important and appreciated by users as it increases self-efficacy and
motivation when users achieve their own goals, and allows for more realistic goals to be set,
however the agency may be overwhelming to some due to a learning curve and designers
should strive to support users with this agency. Normative Influence is a good tool for reflection
and motivation, however the individual needs to feel a connection to the group whose norms
they are viewing for the greatest effect to occur. Tailoring and personalization can be powerful
motivators for behavior change when information is made personal, and users are driven by
feedback that matters to them. Tailoring also allows for nudges to work more effectively, as
users are more likely to agree with the motive behind nudges when they can sympathize with
the need for behavior change, because it is put in terms that they understand, or consider
important.
7.2 Limitations of the Study
The field study carried out in Chapter 6 had a few limitations in its design. The field study was
meant to help understand the participants’ experiences with the application, and the effect being
exposed to group purchasing behavior and making use of a goal setting feature. The original
experiment was proposed to take approximately two weeks to complete, based on research by
Veenstra et al. (2011) who showed that the average dutch consumer did groceries around 2.7
times a week. The study asked that participants made five lists with the application, therefore
two weeks was thought to be the amount of time it would take to complete. However due to the
Covid-19 pandemic, people changed their shopping habits due to government regulations,
which advised them to limit trips to places like the supermarket as much as possible. As a
result, people shopped far less frequently and purchased more groceries in a single trip. Some
participants took three weeks to complete the study, while others took up to five weeks.
Although the length of duration of the study was extended by Covid-19, this did not translate to
more interactions with the application. In general, five interactions with a behavior change
intervention is comparatively low to other studies, which may be similar or lower in study
duration, however have a higher number of interactions. Studies with shorter durations were
designed for near-daily use of the intervention, whereas studies with longer durations, such as
three months, were designed for less frequent interactions (Toscos et al, 2006; Consolvo et al,
2008). Something to note is that the findings of the field study may vary with more interactions
142
/
with the intervention, in that new themes or sub-themes may emerge from a thematic analysis of
interviews with more participants.
The low number of interactions with the intervention may have also had an effect on the findings
regarding the personal goal setting feature. Studies that investigate the effect of personal goal
setting vary in duration and can range between four weeks and eighteen months (Jeffrey et al,
2003; VanWormer et al, 2009; Schneider et al, 2006; Booth, Nowson & Matters, 2008). A reason
that these studies are longer in duration is that there is a learning curve associated with
personal goal setting that needs to be overcome. From the findings of the thematic analysis,
some participants found that this learning curve was too much of an effort to overcome,
resulting in them not making use of the feature. One suggestion from participants was that the
goal setting could be supported by the system in the form of suggestions of goals, or a difficulty
ranking being assigned to goals by the system. Perhaps a follow up study which implements
this feedback can still investigate the effects of personal goal setting on sustainable food
consumption behavior within the same number of interactions, however it would benefit from
extending the duration of the study to allow for more interactions.
There were also certain limitations of the study in terms of sampling. The intervention was a
smartphone application developed for devices running Android OS. The framework used to
develop the application was capable of exporting the application to Apple smartphones,
however a barrier was that Apple has strict guidelines and standards for the applications it
allows on its app store. Distribution of the intervention among Apple users was a major obstacle
to reaching a wider audience, limiting the study to only participants that used an Android
compatible smartphone. It may be that iPhone users experience the app in a completely
different way. Botos, Almadi & Szilagyi (2017) explore what motivates young adults to purchase
Apple products and concluded that iPhone users find iPhones to be expensive, but purchase
them nonetheless and reasons for this are brand quality, uniqueness, functionality of the
operating system and lifespan. This hints at the possibility of iPhone users being comfortable
with paying slightly higher prices, if they feel these prices are justified, and this behavior may
manifest in the context of purchasing sustainable alternatives, which could affect the results of a
follow up study which includes Apple users.
The findings from this study are difficult to generalize due to a low number of participants, which
can be explained by a number of factors. The first was that the field study was expected to last
approximately two weeks, and this may have been seen as too large a commitment to some
people. In addition to this, the study required effort on their part to download and install an
application onto their smartphone. It also asked them to fill out two separate questionnaires. The
study did not include any fiscal compensation, or compensation of any sort, which may have
also explained the lack of willingness to participate in the study. Taris & Kompier (2003) reflect
on how longitudinal studies have a selective attrition effect, where only the most committed
participants end up finishing the study, making it harder to generalize findings from the study.
Similarly, the findings from this study should be viewed in the context of a first step into
designing an intervention that supports sustainable food consumption behavior. A follow up
143
/
study with more participants over a longer period of time is needed before the findings can be
generalized.
The results of the statistical analysis and the thematic analysis, as well as the interviews show
that the questionnaire design may have caused a disagreement between the findings of the two
analyses on some points. For example, participants in the interviews reflected on finding new
alternatives that they were willing to permanently switch to for dairy alternatives, due to taste
and price. However this was not reflected in the statistical findings regarding dairy alternatives,
where the only significant measure affected was awareness. This was because the
questionnaires were too broad in addressing the alternatives, and instead should have asked for
sub-groups within each category of alternative. For example the questionnaire could have asked
about willingness to purchase, awareness of, and perceived affordability of milk products,
yoghurts, cheeses, creams and butter, all within the category of dairy alternatives. This would
have allowed for more detailed insights from the statistical analysis. Similarly for meats, the
questionnaire could have addressed red meats, cold cuts, poultry and fish.
Interestingly, on the topic of compensation for participation in a study, Bentley & Thacker (2004)
discuss the influence of monetary payment on research participation. They raise the issue of
people concealing or falsifying information in order to participate in the study and claim the
compensation, and may blind them to certain risks of participating in a study, for example to test
an unapproved drug. In general the matter of monetary compensation is debated among the
scientific community at large, with the argument for monetary compensation being that it is not
the sole motivation for participation in a study. However the effect of monetary compensation on
integrity of study may not be observed in every field. For example, organizers of a medical study
wishing to study the relation between a certain range of resting heart rate and some other
marker for health may offer monetary compensation for participation in the study. Should the
potential participants come across an advertisement for the experiment, changing one’s resting
heart rate is no trivial matter, and therefore it is hard for participants to conceal or misreport their
resting heart rate, especially if this is measured as part of the recruitment process. However for
a study relating to behavior change or consumer behavior for example, where responses on a
Likert scale form the basis of statistical analyses that tests hypotheses that form the basis of the
study, it is very important for participants to accurately and diligently answer questions. In this
case, researchers may run the risk of inviting people to participate in the study by quickly filling
out the questionnaire in order to claim the compensation. It should however be noted that this
can be remedied through questionnaire design, however the outcome of this is having to sort
through responses to find those that contradict themselves and exclude them from the research,
which costs further analysis of the responses and time. Therefore it could be argued that by not
offering monetary compensation, or compensation of any kind in the field study, it increased the
chance that participants were interested in the goal of the research, and were not motivated by
other ulterior motives, and therefore conducted the tasks diligently. However, the downside is
that the findings are less easily generalized because of the low number of people that were
interested in participating in the experiment without the promise of compensation.
144
/
The Covid-19 pandemic affected the social behavior of the participants, where they were more
isolated and cooking less frequently with their friends, which made it difficult to observe the
effect the application had on their willingness to substitute in a group setting. A few participants
reflected on the change of their behavior towards substitution in a group setting and how the
opinions of their friends strongly influenced the group’s choice for substitution, however
reflected on a general trend of acceptance for animal product replacements. A recommendation
would be to repeat the field study after the pandemic ends, to allow the application to be used in
a regular setting, such that the participant can reflect on the dynamics of replacing animal
products in a group setting.
In light of the results of the field study and considering the limitations of the study, this work
serves as a first step to designing a system to support sustainable food purchasing, a rather
niche field in terms of existing literature on the matter, and a topic sensitive to culture, habit and
personal preference. The recommendation is for the field study to be repeated after the
pandemic has ended, so that the application will be used in a more “normal” scenario where
users make smaller lists more frequently, and cook together with friends more often. In addition,
a larger number of participants would be ideal, so as to conduct parametric statistical tests on
questionnaire responses to make statistically significant conclusions. The themes uncovered in
the thematic analysis provide an interesting insight into the user experience with the application,
and the effects of normative influence and personal goal setting on motivation for behavior
change. Most importantly the findings from the field study outlined the importance of a tailored
and personalized experience on motivation for behavior change, that total agency with regards
to personal goal setting without support from the system can be detrimental to some, and that
normative influence does not work as well when the participant cannot relate to the group they
are being shown the norms of.
145
/
7.3 Changing Behavior Versus Changing Attitudes
The application was designed to help users prepare grocery shopping lists, and while the user
engaged with the application, it made them aware of the sustainability of their consumption
using color coding, and by providing insight into the purchasing habits of an anonymous group,
which was faked for the purpose of the experiment. The application was designed in a way that
aided and supported the user while they carried out the behavior that needed changing, instead
of before or after the behavior, as this type of intervention was found to be more effective than
reminder-based interventions as Mundkur (2020) found. Designing an intervention that supports
users during the behavior, instead of afterwards, causes the formation of a certain reliance on
the intervention. Renfree et al. (2016) actually disagree with this form of design, and argue that
this reliance is counterproductive to the behavior change process, as it introduces a fragility in
the behavior change effort. They posit that when the intervention is removed, people are likely
to fall back into old habits, as demonstrated by their own research.
This argument illustrates an interesting topic in the design of behavior change systems.
Mundkur (2020) discussed how there are currently two different approaches to designing
behavior change interventions regarding the timing of the intervention, either the intervention is
to be used while the target behavior is being carried out, or the intervention is to be used as a
reminder to change the target behavior, using a reminder or prompt, or providing the user with
information or feedback on their behavior. In addition there are also three different purposes the
intervention can have; either a new behavior is cultivated and supported by the intervention, an
‘old’ behavior can be unlearned, or the intervention serves to change an attitude that will then
result in a change in behavior. The argument is that by introducing an intervention into the
user’s routine, they associate the new behavior with the intervention, and the intervention is
then the cause of the behavior change, and not a change in implicit motivation or attitude on the
user’s end. This is especially the case for interventions that make use of gamified features such
as streaks, scores, leaderboards and rewards.
However this reliance on the intervention may indeed be needed for the continuation of a new
behavior, as a change in attitude does not necessarily translate to a change in behavior. Vermeir
& Verbeke (2006) discuss the existence of an “Attitude - Behavioral Intention” gap, particularly in
the area of sustainability, where despite a consumer having an attitude that is in line with
sustainability, their behavior can suggest otherwise. They discuss how practical barriers
interfere with attitudes, and result in a lack of change in behavior. Therefore the reliance on an
intervention might result in more behavior change than targeting a change in attitude.
Furthermore, Oinas-Kukkonen & Harjumaa (2009) discuss that an attitude change that leads to
a behavior change is perhaps the hardest to achieve, and that attitudes do not always predict or
determine behavior, which is in line with what Vermeir & Verbeke (2006) posit. Oinas-Kukkonen
& Harjumaa (2009) also describe interventions that target attitudes to be of a higher cognitive
load to use and are therefore less seamlessly integrated into the user’s routine.
146
/
Oinas-Kukkonen (2010) discusses how behavior change can be split into three groups: A, B, C
in descending order of difficulty to achieve. C-change is to make the user comply with the
requests from a system, B-change is a larger change than just compliance once or twice, and
A-change is to affect a user’s attitude(s). Looking at the design of the current application, with
triggers such as color coding and social norm exposure, due to the reflective nature of social
norms, it can be argued that the application is attempting to elicit a B-change in the users. This
is because the application contains elements that invite self-reflection on behavior and
exploration of new alternatives, and not just reactionary triggers to comply with a request.
Oinas-Kukkonen (2010) describes an Outcome/Design matrix where a behavior change system
can form, alter or reinforce an act of compliance, behavior or attitude. Looking at the application
through that lens, the F outcome is most appropriate, as the application formed a behavior of
replacing and actively looking for sustainable alternatives for conventional products; or an F-B
outcome-change.
Perhaps there can be a change in the way behavior change interventions are designed, where
there is a two step process. The first step is to introduce the user to the new behavior by means
of an intervention that they build a reliance on. This intervention may use gamified elements to
motivate the user to perform the behavior. This intervention may also be designed in a way that
slowly changes the attitude of the user, possibly by providing them with relevant information, or
information that they find important related to their behavior. In the second step, the user is
weaned off the first intervention and transitions to another similar system which helps the user
keep track of their performance to support the established behavior in the long term. The user
would be less reliant on the second system, as the new behavior would be part of their routine,
and the second system would support them in terms of providing information on their
performance. It can be argued that the user would have a lower chance to form a dependence
on the second system, as they would already be performing the target behavior and use it for
feedback instead of motivation as that has become implicit, not necessarily because of a
change of attitude but because of it being woven into their routine.
In addition, there is also something to be said about designing an intervention for a behavior
where technology is already involved in some form. Taking grocery shopping as an example,
many people use their smartphones to prepare grocery lists by using a notepad or list making
application. Therefore, there is already a reliance on technology in some form, and an
intervention could be designed around this, such that it provides the functionality the user was
dependent on and introduces new functionality in terms of system features that facilitate
behavior change. In this way, the argument of Renfree et al. (2016) is somewhat circumvented
as despite the user being introduced to a new technology, it replaces the reliance on the
previous technology (notepad application), therefore the total reliance has not increased. Indeed
a reliance may form on the intervention for the new behavior, however the reliance on the
previous technology would have also continued had the intervention not been introduced, and
the total reliance on technology has not been increased.
147
/
7.4 Personalization & Tailoring
Significant findings from the field study were that there is no silver bullet for motivation; different
users have different motivations, and that what serves as motivation for one group of users may
be ineffective, and more importantly demotivational, for another group of users. The PSD model
lists the system features Personalization and Tailoring as a Primary Task Support feature, and
these seem to be very significant features to consider in behavior change interventions.
Aligning the behavior change with the target’s goals, and framing the information in terms of the
target’s interest seem to be the best way to get the target on board with the behavior change.
Lehner et al. (2016) discuss how a nudge is more effective when the target agrees with the
underlying motivation behind the nudge. In the context of this application, the popular choice
feature and color-coding can be seen as nudges, where they encourage a certain reaction such
as reflection, or even direct action, such as replacement of a product. During the interviews, it
was found that some participants were particularly interested in metrics such as their carbon
footprint. They found the application didn’t motivate them enough in this way as it didn’t
enumerate their progress in a satisfactory manner. A user is more likely to agree with the
motivation behind a nudge when they are shown information that is tailored to them.
Knijnenburg (2015) and Almuhimedi et al. (2015) both discuss this in the context of digital
privacy. Kreuter, Stretcher & Glassman (1999) discuss how health education materials should
be tailored to be more effective, with the reason being that it is more compatible with an
individual’s needs, interests and concerns. Kreuter (2000) posits that segmentation is central to
tailoring, and that optimal segmentation can be difficult given the many dimensions that people
can be segmented over. Indeed these dimensions depend on the behavior being changed. For
example, if the behavior change is food related, then perhaps segmenting the population based
on cultural eating habits may be more appropriate than segmenting them on age or gender.
Kreuter also introduces the ultimate tailored experience, where it is tailored to each individual.
The success of a tailored intervention may also lie with the user and how much information they
are willing to, or are comfortable with sharing.
Putting this in the context of the application, the user’s experience could be tailored by
understanding what they find important, or what their specific goals are. So for example if a user
is very interested in their personal health and fitness, then for a given product on that user’s list,
the application could find sustainable alternatives that are nutritionally better than or equal to
that product. The user could be shown that the suggested alternatives are not only better for the
environment, but also have lower amounts of sugar, higher amounts of protein etc. Making the
argument that this choice would be a win-win scenario where the environment benefits, and the
user personally benefits as the product helps bring them closer to a personal goal, such as
eating less sugar if fitness is their interest.
148
/
A drawback of Tailoring and Personalization, especially for data-driven interventions, is that
every conceivable data that a user may be interested in would need to be collected. Additionally,
arguments for a change in behavior would need to be framed in terms of what is important to
users. Although this can be automated, it still adds an additional layer of complexity to the
development of such interventions. This is time consuming, and may not be possible in every
case, where for some areas centralized databases of information are lacking. Sadasivam et al.
(2016) reflect on study designers having to balance the factors of cost and time when
developing a tailored system. One relevant example of this is with food, where information
regarding the carbon footprint of production and transportation is not readily available for each
product. Tailoring and Personalization therefore come with their own set of challenges, which
holds them back from being adopted into behavior change systems. Perhaps reducing the
number of features in an intervention, and instead focusing on how to tailor them and facilitate
personalization of the intervention is a potentially promising method for designing behavior
change.
149
/
7.5 Meat & Culture
Something that was discovered in the field study was that participants were more willing to
switch to dairy alternatives than meat alternatives. Reasons given by participants were that the
meat replacements do not taste the same, and that the juices and flavors from conventional
meat products are simply not matched by the alternatives. As found in Chapter 2, reducing and
cutting out meat from one’s diet is an effective way to reduce their ecological footprint. This is
due to meat’s large impact in terms of land use, due to large swathes of land being reserved for
crops grown to feed cattle and other livestock, and water use arising from the animals water
requirements. For dairy alternatives, it would seem that the alternatives more closely emulate
the flavors and consumption experience of conventional dairy products, however the same
cannot be said for meat products.
Literature also shows that meat is an integral part of many cultures across the world. Nam, Jo &
Lee (2010) discuss how meat consumption is increasing in the eastern countries due to an
increase in prosperity among citizens. Swatland (2010) discusses how meat consumption in the
west dates back a few thousand years and was involved in the development of language,
religion and social grouping. Leroy & Praet (2015) reflect on how meat consumption and human
development are intertwined, and that there is a human legacy of meat consumption.
Particularly for the Netherlands, Vermunt, Stegeman & Herstel (1990) and de Bakker &
Dagevos (2012) reflect on how meat is an integral part of the dutch diet. This literature indicates
that changing meat consumption habits may pose to be a bigger challenge than that of dairy
consumption. Mäkelä & Niva (2015) suggest that an entirely new culture needs to be cultivated
where people are introduced to vegetarian alternatives, not just meat replacements but
vegetable substitutes. Public opinion also has to change on meat replacements and vegetable
replacements to be seen as tasty and desirable, and not something that is forced for the sake of
the environment or animal welfare. This literature and the responses from the interviews
indicate that for behavior change interventions involving sustainable food habits, particularly for
meat consumption and its reduction, it is possible that there are deep seated factors that
oppose change. This suggests that future interventions designed for the purpose of reducing
meat consumption should take cultural traditions and religious habits into consideration, and
perhaps be informed by them. This deeper connection to meat consumption is hinted at by the
findings of the field study, where color coding and social norms, that served as nudges, affected
the dairy consumption, however for meat this was less the case.
Although in recent years there have been initiatives to reduce meat consumption such as the
Meatless Monday campaign (Meatless Monday, 2020) and Veganuary (What We Do, n.d.),
looking at literature, there is little work done on digital behavior change interventions designed
with the purpose of reducing meat consumption. Casas, Mugellini & Khaled (2018) designed a
chatbot, Rupert, which asked its users to set themselves goals, either to reduce meat
consumption or increase fruit and vegetable consumption, and then followed up and asked them
150
/
what they consumed that day and information about the quantities. Interestingly, they also found
that users wished for more support and motivation from the system regarding the personal goal
setting feature, a finding from the interviews, which suggests complete agency without support
isn’t always beneficial to a system. Casas and colleagues also found that they had mixed results
due to some participants setting a goal which was too hard to accomplish, or were not motivated
to stick to their goals. This points to the learning curve associated with personal goal setting and
their findings, like the findings of this study, show that complete agency with goal setting may
not be beneficial to the user.
One possible way of combating the legacy of meat consumption is making a personal link to the
effects of its consumption. Daniel et al. (2011) reflect on the amount of literature to support the
link between consumption of meat and cancer and chronic disease. Snowdown, Phillips &
Fraser (1984) found a positive association between meat consumption and ischemic heart
disease, which was echoed by findings by Thorogood et al. (1994) who identified a link between
ischemic heart disease and cancer, and meat consumption. In line with the existence of selfish
motivations, found to exist by Chen (2009) and the findings from the field study, a potential
solution to the difficulty of changing meat consumption habits could be to illustrate its negative
impact on human health.
Amiot et al. (2018) developed a multicomponent (non-digital) intervention which used social
norms, personal goal-setting, educational information and an element of fear to reduce meat
consumption in young males in Canada. The intervention involved an intake interview,
participants keeping a food journal for two weekdays and one weekend day, watching a
powerpoint on social norms regarding meat consumption, as well information about the negative
health and environmental effects of meat consumption. Following this, participants were sent
motivational text messages including the benefits of reducing meat consumption, and were
asked to keep a second food journal. These journals were then compared to the
pre-intervention journals. Amiot and colleagues observed significant reductions in meat
consumption as well as reduced positive emotions towards eating meat. Participants reported
that the most important factor they perceived as influential to their change in meat consumption
was the informational component. The authors noted how they used fear to motivate a change
in behavior; more specifically they made apparent the link between the consumption of meat
and major health problems. They appealed to the selfish, self-preservation instinct of the
participant and elicited a behavior change in that manner. By providing two sorts of arguments,
effects on the individual’s health and effects on the environment, the participant was shown how
reducing meat consumption was a win-win scenario. This is a good example of how a change in
meat consumption may be facilitated, and a recommendation for further research for this study
would be to investigate how including educational information in the application might affect the
intention to purchase an alternative.
Perhaps a one-size fits all approach to sustainable food consumption is appropriate to help
young adults in the Netherlands transition to dairy products, however there seems to be a
151
/
deeper connection to conventional meat products that the one-size fits all approach does not
address.
152
/
153
/
7.6 Recommendations for Future Work
Reflecting on the field study, the situation it was carried out under and the findings, a
recommendation is to repeat the field study when the Covid-19 pandemic has ended. This
would mean that participants’ shopping habits aren’t affected by the pandemic, and it would
allow more instances of them to prepare food with groups of friends. The experiment would
therefore be able to observe their behavior in these settings, and allow them to reflect on their
behavior in these settings. In addition, the low number of participants makes the findings of the
field study hard to generalize, and a recommendation is for the study to be carried out with more
participants, including Apple users. It would be interesting to see whether the same themes
emerge when more participants are interviewed, and it would also be possible to make more
concrete statistical conclusions with higher numbers of questionnaire responses, as the sample
size for the tests would be larger, allowing for a parametric approach to hypothesis testing. The
questionnaires should also be improved such that they target specific sub-categories within the
general animal and dairy product groups. This would give a more precise understanding of the
effects of the application on the awareness of, perceived affordability of, and intention to
purchase sustainable alternatives.
In terms of changes to the application, it would be interesting to observe the effects of supplying
participants with educational information regarding meat consumption and the long term
personal health risks involved. As mentioned in the discussion, Amiot et al. (2018) found that
their participants reflected that the educational information was most influential in changing their
meat consumption. Doing so would include another system feature from the PSD model,
namely Verifiability from the System Credibility Support category, where information is provided
to the user that is verified by outside sources. Perhaps doing so might increase the application’s
effect on awareness, perceived affordability and intention to purchase meat alternatives as
participants might be prompted to explore other options, and by doing so be exposed to the
alternatives and their prices.
A change that is motivated by the findings from the interviews was that the personal goal setting
feature of the application would benefit from being redesigned to help support the decision
making process. In the interviews, participants suggested ways this could be done by
suggesting a range of values that correspond with a certain difficulty of goal based on the
consumption of the individual. For example, if a participant normally consumes 7 animal
products in a week, then the application could suggest replacing 1-3 three items and giving this
an “easy” rating of difficulty. If the participant wished to challenge themselves, they could look at
a more difficult goal which would be to replace 3-5 animal products. In this manner, the
participant understands how much they are challenging themselves, and it gives them an idea
of how much effort they can associate with the goal they are setting themselves. This may help
them overcome the learning curve associated with personal goal setting and cause them to
make more use of the feature, thereby increasing their motivation when they achieve their own
154
/
goals, and in turn, their self-efficacy. Observing the effects of support for personal goal setting is
another interesting future direction this research could take.
An interesting finding from the field study was that one participant was not motivated so much
by the social norms, but said they would be more motivated if they felt they were working
towards a common goal with the group. Perhaps something future research could investigate is
how setting users a group goal to achieve with a group of users from the total pool of users
affects motivation for behavior change. These groups could be formed based on a user’s
baseline performance established from the first few uses of the application. Should a user’s
group accomplish a goal it was set, based on that user’s relative contribution to the goal and
change in purchasing behavior, they may be transferred to a group with a relatively harder goal
or vice versa if they performed relatively poorly compared to their group.
155
/
8. Conclusion
This thesis investigated how a behavior change system that supported sustainable grocery
purchasing could be designed, while keeping in mind the budget constraints of the target
demographic, young adults in the Netherlands. The Persuasive System Design model (PSD) by
Oinas-Kukkonen & Harjumaa (2009) was used as a framework to analyze 25 behavior change
systems from the domains of sustainable food consumption, food consumption and
eco-feedback applications for energy & water consumption. Trends of design were identified
and popular system features were shortlisted, as well as novel ones that were seldom used in
the 25 systems analyzed.
A novel smartphone application, which exposed the user to social norms of grocery purchasing
and included a personal goal setting feature as novel features, was prototyped, tested for
usability and developed for the purpose of a field test. The field test involved participants filling
out questionnaires and a subset of them being interviewed; a statistical analysis was conducted
on the questionnaire responses while a thematic analysis was conducted on the interviews. Due
to the low number of participants, the thematic analysis formed the basis of the findings of this
thesis, from which three main themes emerged: motivation, community and effort. These are
summarized below.
It was found that participants were more open to substituting dairy products with sustainable
alternatives than they were to meat products. In addition, motivation is personal and nuanced,
and therefore a one size fits all approach was effective to a certain extent when it comes to
sustainable grocery purchasing as participants were more willing to substitute dairy over meat
products. When participants are exposed to the norms of a group, the effects of normative
influence are most pronounced when the individual feels a certain connection to the group, and
are able to identify with them in some way. If this doesn’t occur, then the individual may feel a
dissociation with the group and the effects of normative influence are less pronounced.
Participants were appreciative of a feature that gave them control over their own progress
(personal goal setting), however the lack of assistance from the system’s side in managing this
newfound agency proved detrimental to some participants. Due to the learning curve associated
with personal goal setting, some participants perceived a high amount of effort associated with
the feature’s use and therefore neglected it.
The findings from this research provide an interesting view into the effect of popular system
features from behavior change systems in the context of food purchasing, and this thesis serves
as a first step into designing a behavior change system for the food purchasing domain. The
findings of this field study also highlight the importance of Personalization and Tailoring in
behavior change systems, supporting agency in and minimizing effort required for behavior
change, and the individuality of motivation. Future work could look at how the features
156
/
introduced in this application could be improved to be more effective, and expanded to include
other features.
157
/
9. References
1. Ajzen, I. (1991). The theory of planned behavior. Organizational behavior and human decision
processes , 50 (2), 179-211.
2. Almuhimedi, H., Schaub, F., Sadeh, N., Adjerid, I., Acquisti, A., Gluck, J., … Agarwal, Y. (2015).
Your Location has been Shared 5,398 Times! Proceedings of the 33rd Annual ACM Conference
on Human Factors in Computing Systems - CHI ’15. doi:10.1145/2702123.2702210
3. Amiot, C. E., El Hajj Boutros, G., Sukhanova, K., & Karelis, A. D. (2018). Testing a novel
multicomponent intervention to reduce meat consumption in young men. PLOS ONE , 13(10),
e0204590. doi:10.1371/journal.pone.0204590
4. Aydin, A., Micallef, A., Lovelace, S., Li, X., Cheung, V., & Girouard, A. (2017, May). Save the Kiwi:
Encouraging better food management through behaviour change and persuasive design theories
in a mobile app. In Proceedings of the 2017 CHI Conference Extended Abstracts on Human
Factors in Computing Systems (pp. 2366-2372).
5. Bahr, G. S., & Ford, R. A. (2011). How and why pop-ups don’t work: Pop-up prompted eye
movements, user affect and decision making. Computers in Human Behavior , 27 (2), 776-783.
6. Baxter, K., Courage, C., & Caine, K. (2015). Understanding your users: A practical guide to user
research methods (p. 496). Amsterdam: Morgan Kaufmann.
7. Batra, R., Homer, P. M., & Kahle, L. R. (2001). Values, susceptibility to normative influence, and
attribute importance weights: A nomological analysis. Journal of consumer psychology , 11 (2),
115-128.
8. Bentley, J. P., & Thacker, P. G. (2004). The influence of risk and monetary payment on the
research participation decision making process. Journal of medical ethics , 30 (3), 293-298.
9. Berners-Lee, M., Hoolohan, C., Cammack, H., & Hewitt, C. N. (2012). The relative greenhouse
gas impacts of realistic dietary choices. Energy policy , 43 , 184-190.
10. Berkovsky, S., Freyne, J., & Oinas-Kukkonen, H. (Eds.). (2012). Influencing Individually. ACM
Transactions on Interactive Intelligent Systems, 2(2), 1–8. doi:10.1145/2209310.2209312
11. Booth, A. O., Nowson, C. A., & Matters, H. (2008). Evaluation of an interactive, Internet-based
weight loss program: a pilot study. Health Education Research , 23 (3), 371-381.
12. Bomfim, M. C., Kirkpatrick, S. I., Nacke, L. E., & Wallace, J. R. (2020, April). Food Literacy while
Shopping: Motivating Informed Food Purchasing Behaviour with a Situated Gameful App. In
Proceedings of the 2020 CHI Conference on Human Factors in Computing Systems (pp. 1-13).
158
/
13. Bonny, S. P., Gardner, G. E., Pethick, D. W., & Hocquette, J. F. (2015). What is artificial meat and
what does it mean for the future of the meat industry?. Journal of Integrative Agriculture , 14 (2),
255-263.
14. Botos, B., Almadi, B., & Szilagyi, T. P. (2017). Why apple? The z generation’s preferences and
choices of communication device in light of apple products. FIKUSZ'17 Proceedings , 35.
15. Busch, M., Mattheiss, E., Orji, R., Marczewski, A., Hochleitner, W., Lankes, M., … Tscheligi, M.
(2015). Personalization in Serious and Persuasive Games and Gamified Interactions.
Proceedings of the 2015 Annual Symposium on Computer-Human Interaction in Play - CHI PLAY
’15. doi:10.1145/2793107.2810260
16. Cahenzli, M. (2020). Carrot or Stick: Overcoming Silos in Enterprise Architectures. Proceedings
der 15. Internationalen Tagung Wirtschaftsinformatik 2020 .
17. Casas, J., Mugellini, E., & Khaled, O. A. (2018). Food Diary Coaching Chatbot. Proceedings of
the 2018 ACM International Joint Conference and 2018 International Symposium on Pervasive
and Ubiquitous Computing and Wearable Computers - UbiComp ’18.
doi:10.1145/3267305.3274191
18. Chang, K. S. P., Danis, C. M., & Farrell, R. G. (2014). Lunch line: using public displays and
mobile devices to encourage healthy eating in an organization. In Proceedings of the 2014 ACM
International Joint Conference on Pervasive and Ubiquitous Computing (pp. 823-834).
19. Cardenas, J. C. (2011). Social Norms and Behavior in the Local Commons as Seen Through the
Lens of Field Experiments. Environmental and Resource Economics, 48(3), 451–485.
doi:10.1007/s10640-010-9452-8
20. Chen, M. (2009). Attitude toward organic foods among Taiwanese as related to health
consciousness, environmental attitudes, and the mediating effects of a healthy lifestyle. British
Food Journal , 111(2), 165–178. doi:10.1108/00070700910931986
21. Clear, A., & Friday, A. (2012, June). Designing a Food 'Qualculator'. In DIS 2012 workshop on
Food for Thought: Designing for Critical Reflection on Food Practices. Newcastle, UK .
22. Coley, D., Howard, M., & Winter, M. (2009). Local food, food miles and carbon emissions: A
comparison of farm shop and mass distribution approaches. Food policy , 34 (2), 150-155.
23. Consolvo, S., McDonald, D. W., & Landay, J. A. (2009). Theory-driven design strategies for
technologies that support behavior change in everyday life . Proceedings of the 27th International
Conference on Human Factors in Computing Systems - CHI 09. doi:10.1145/1518701.1518766
24. Daniel, C. R., Cross, A. J., Koebnick, C., & Sinha, R. (2011). Trends in meat consumption in the
USA. Public health nutrition , 14 (4), 575-583.
25. de Bakker, E., & Dagevos, H. (2012). Reducing meat consumption in today’s consumer society:
questioning the citizen-consumer gap. Journal of Agricultural and Environmental Ethics , 25 (6),
159

/
877-894.
26. Dixon, G. N., Deline, M. B., McComas, K., Chambliss, L., & Hoffmann, M. (2015). Saving energy
at the workplace: The salience of behavioral antecedents and sense of community. Energy
Research & Social Science, 6, 121–127.
27. DuCharme, K.A., & Brawley, L.R. (1995). Predicting the intentions and behaviors of exercise
initiates using two forms of self-efficacy. Journal of Behavioral Medicine, 18, 479–497.
28. Dumas, P., & Guyomard, H. (2014). The GlobAgri model . Working paper for the Agrimonde-Terra
foresight.
29. Day, E. O. (2017). Earth overshoot day. Hentet fra https://www.overshootday.org
30. Edwards-Jones, G. (2010). Does eating local food reduce the environmental impact of food
production and enhance consumer health?. Proceedings of the Nutrition Society , 69 (4), 582-591.
31. Epstein, D. A., Cordeiro, F., Fogarty, J., Hsieh, G., & Munson, S. A. (2016, May). Crumbs:
lightweight daily food challenges to promote engagement and mindfulness. In Proceedings of the
2016 CHI Conference on Human Factors in Computing Systems (pp. 5632-5644).
32. Eugenio, F. C., & Ocampo, A. J. T. (2019). Assessing Classcraft as an Effective Gamification App
based on Behaviorism Learning Theory. Proceedings of the 2019 8th International Conference on
Software and Computer Applications - ICSCA ’19. doi:10.1145/3316615.3316669
33. Farr-Wharton, G., Foth, M., & Choi, J. H. J. (2013, September). EatChaFood: challenging
technology design to slice food waste production. In Proceedings of the 2013 ACM conference on
Pervasive and ubiquitous computing adjunct publication (pp. 559-562).
34. Farr-Wharton, G., Foth, M., & Choi, J. H. J. (2012, November). Colour coding the fridge to reduce
food waste. In Proceedings of the 24th Australian Computer-Human Interaction Conference (pp.
119-122).
35. First, P. J. (2019). Global Warming of 1.5 C An IPCC Special Report on the Impacts of Global
Warming of 1.5 C Above Pre-Industrial Levels and Related Global Greenhouse Gas Emission
Pathways, in the Context of Strengthening the Global Response to the Threat of Climate Change.
Sustainable Development, and Efforts to Eradicate Poverty. https://www. ipcc. ch/sr15/.
36. Fogg, B. (2009). A behavior model for persuasive design. Proceedings of the 4th International
Conference on Persuasive Technology - Persuasive ’09. doi:10.1145/1541948.1541999
37. Friel, S., Barosh, L. J., & Lawrence, M. (2014). Towards healthy and sustainable food
consumption: an Australian case study. Public health nutrition , 17 (5), 1156-1166.
38. Fritz, T., Huang, E. M., Murphy, G. C., & Zimmermann, T. (2014, April). Persuasive technology in
the real world: a study of long-term use of activity sensing devices for fitness. In Proceedings of
the SIGCHI conference on human factors in computing systems (pp. 487-496).
160
/
39. Froehlich, J., Findlater, L., & Landay, J. (2010, April). The design of eco-feedback technology. In
Proceedings of the SIGCHI conference on human factors in computing systems (pp. 1999-2008).
40. Froehlich, J., Findlater, L., Ostergren, M., Ramanathan, S., Peterson, J., Wragg, I., ... & Landay,
J. A. (2012, May). The design and evaluation of prototype eco-feedback displays for fixture-level
water usage data. In Proceedings of the SIGCHI conference on human factors in computing
systems (pp. 2367-2376).
41. Jain, R. K., Gulbinas, R., Taylor, J. E., & Culligan, P. J. (2013). Can social influence drive energy
savings? Detecting the impact of social influence on the energy consumption behavior of
networked users exposed to normative eco-feedback. Energy and Buildings , 66 , 119-127.
42. Jeffery, R. W., Wing, R. R., Sherwood, N. E., & Tate, D. F. (2003). Physical activity and weight
loss: does prescribing higher physical activity goals improve outcome?. The American journal of
clinical nutrition , 78 (4), 684-689.
43. Jeske, S., Zannini, E., & Arendt, E. K. (2018). Past, present and future: The strength of
plant-based dairy substitutes based on gluten-free raw materials. Food Research International ,
110, 42–51. doi:10.1016/j.foodres.2017.03.045
44. Heinrich, K. M., Carlisle, T., Kehler, A., & Cosgrove, S. J. (2017). Mapping coaches’ views of
participation in CrossFit to the integrated theory of health behavior change and sense of
community. Family & community health , 40 (1), 24.
45. Kjeldskov, J., Skov, M. B., Paay, J., Lund, D., Madsen, T., & Nielsen, M. (2015, April).
Eco-forecasting for domestic electricity use. In Proceedings of the 33rd Annual ACM Conference
on Human Factors in Computing Systems (pp. 1985-1988).
46. Knijnenburg, B. P. (2015). A user-tailored approach to privacy decision support (Doctoral
dissertation, UC Irvine).
47. Kreuter, M. W. (2000). Tailoring: what’s in a name? Health Education Research, 15(1), 1–4.
doi:10.1093/her/15.1.1
48. Kreuter, M. W., Strecher, V. J., & Glassman, B. (1999). One size does not fit all: The case for
tailoring print materials . Annals of Behavioral Medicine, 21(4), 276–283. doi:10.1007/bf02895958
49. Mekonnen, M., & Hoekstra, A. Y. (2011). National water footprint accounts: the green, blue and
grey water footprint of production and consumption.
50. Hanss, D., & Böhm, G. (2013). Promoting purchases of sustainable groceries: An intervention
study. Journal of Environmental Psychology , 33 , 53-67.
51. Harder, R., Kalmykova, Y., Morrison, G. M., Feng, F., Mangold, M., & Dahlén, L. (2014).
Quantification of goods purchases and waste generation at the level of individual households.
Journal of Industrial Ecology , 18 (2), 227-241.
161
/
52. Hoekstra, A. Y., & Mekonnen, M. M. (2012). The water footprint of humanity. Proceedings of the
national academy of sciences , 109 (9), 3232-3237.
53. Hm Government. (2005). Securing the future: delivering UK sustainable development strategy.
The UK Government sustainable development strategy .
54. Kim, H., Kogan, A., Dasgupta, C., Novitzky, M. M., & Do, E. Y. L. (2010, January). Grocery
hunter: a fun mobile game for children to combat obesity. In Proceedings of the fifth international
conference on Tangible, embedded, and embodied interaction (pp. 317-320).
55. Kuo, P. Y., & Horn, M. S. (2014, September). Energy diet: energy feedback on a bathroom scale.
In Proceedings of the 2014 ACM International Joint Conference on Pervasive and Ubiquitous
Computing (pp. 435-446).
56. Lehner, M., Mont, O., & Heiskanen, E. (2016). Nudging – A promising tool for sustainable
consumption behaviour? Journal of Cleaner Production, 134, 166–177.
doi:10.1016/j.jclepro.2015.11.086
57. Leroy, F., & Praet, I. (2015). Meat traditions. The co-evolution of humans and meat. Appetite , 90 ,
200-211.
58. Liang, H., Xue, Y., & Wu, L. (2013). Ensuring employees' IT compliance: Carrot or stick?.
Information Systems Research , 24 (2), 279-294.
59. Lim, V., Yalvaç, F., Funk, M., Hu, J., & Rauterberg, M. (2014, March). Can we reduce waste and
waist together through EUPHORIA?. In 2014 IEEE International Conference on Pervasive
Computing and Communication Workshops (PERCOM WORKSHOPS) (pp. 382-387). IEEE.
60. Lim, V., Funk, M., Rauterberg, M., Marcenaro, L., & Regazzoni, C. (2015, June). E-COmate:
what’s your non-consumption?. In International Work-Conference on Artificial Neural Networks
(pp. 486-499). Springer, Cham.
61. Linde, J. A., Rothman, A. J., Baldwin, A. S., & Jeffery, R. W. (2006). The impact of self-efficacy on
behavior change and weight change among overweight participants in a weight loss trial. Health
Psychology , 25 (3), 282.
62. Locke, E. A., & Latham, G. P. (2002). Building a practically useful theory of goal setting and task
motivation: A 35-year odyssey. American psychologist , 57 (9), 705.
63. Nielsen, J. (1994). Usability engineering . Morgan Kaufmann.
64. Nielsen, J. (1995). 10 usability heuristics for user interface design. Nielsen Norman Group , 1 (1).
65. Nolan, J. M., Schultz, P. W., Cialdini, R. B., Goldstein, N. J., & Griskevicius, V. (2008). Normative
social influence is underdetected. Personality and social psychology bulletin , 34 (7), 913-923.
66. Macdiarmid, J. I., Kyle, J., Horgan, G. W., Loe, J., Fyfe, C., Johnstone, A., & McNeill, G. (2012).
Sustainable diets for the future: can we contribute to reducing greenhouse gas emissions by
162

/
eating a healthy diet?. The American journal of clinical nutrition , 96 (3), 632-639.
67. Mäkelä, J., & Niva, M. (2015). Sustainable culinary culture. In A. Paloviita, & M. Järvelä (Eds.),
Climate change adaptation and food supply chain management (pp. 172–182).London:
Routledge.
68. Martin, B. A., Wentzel, D., & Tomczak, T. (2008). Effects of susceptibility to normative influence
and type of testimonial on attitudes toward print advertising. Journal of advertising , 37 (1), 29-43.
69. Masthoff, J., Grasso, F., & Ham, J. (2014). Preface to the special issue on personalization and
behavior change . User Modeling and User-Adapted Interaction, 24(5), 345–350.
doi:10.1007/s11257-014-9151-1
70. Meatless Monday - Meatless Monday. (2020, October 23). Retrieved December 21, 2020, from
https://www.mondaycampaigns.org/meatless-monday
71. Melis, Meraud. “Markt Groeit Explosief: Volop Vleesvervangers.” Ad.nl , 1 May 2019, 12:59,
www.ad.nl/koken-en-eten/markt-groeit-explosief-volop-vleesvervangers~a370d16c/
72. Miller, George A. Communication, Language, and Meaning: Psychological Perspectives . Basic
Books, 1973..
73. Mundkur, A. (2020). Why Aren't They Greener? doi: 10.13140/RG.2.2.30979.73765
74. Nam, K. C., Jo, C., & Lee, M. (2010). Meat products and consumption culture in the East. Meat
Science , 86 (1), 95-102.
75. Nijdam, D., Rood, T., & Westhoek, H. (2012). The price of protein: Review of land use and carbon
footprints from life cycle assessments of animal food products and their substitutes. Food policy ,
37 (6), 760-770.
76. Nos, “'Populariteit Vleesvervangers Leidt Tot Tekorten Grondstoffen'.” NOS , 4 Jan. 2020, 17:46,
nos.nl/artikel/2317270-populariteit-vleesvervangers-leidt-tot-tekorten-grondstoffen.html.
77. Oinas-Kukkonen, H. (2010). Behavior change support systems: A research model and agenda. In
International Conference on persuasive technology (pp. 4-14). Springer, Berlin, Heidelberg.
78. Oinas-Kukkonen, H., & Harjumaa, M. (2009). Persuasive systems design: Key issues, process
model, and system features. Communications of the Association for Information Systems , 24 (1),
28.
79. Orji, R., Vassileva, J., & Mandryk, R. L. (2012). LunchTime: a slow-casual game for long-term
dietary behavior change. Personal and Ubiquitous Computing, 17(6), 1211–1221.
doi:10.1007/s00779-012-0590-6
80. Paay, J., Kjeldskov, J., Skov, M. B., Lund, D., Madsen, T., & Nielsen, M. (2014, December).
Design of an appliance level eco-feedback display for domestic electricity consumption. In
163
/
Proceedings of the 26th Australian Computer-Human Interaction Conference on Designing
Futures: the Future of Design (pp. 332-341).
81. Patel, M. S., Asch, D. A., & Volpp, K. G. (2015). Wearable Devices as Facilitators, Not Drivers, of
Health Behavior Change. JAMA, 313(5), 459. doi:10.1001/jama.2014.14781
82. Parschau, L., Fleig, L., Warner, L. M., Pomp, S., Barz, M., Knoll, N., ... & Lippke, S. (2014).
Positive exercise experience facilitates behavior change via self-efficacy. Health Education &
Behavior , 41 (4), 414-422.
83. Petkov, P., Goswami, S., Köbler, F., & Krcmar, H. (2012, October). Personalised eco-feedback as
a design technique for motivating energy saving behaviour at home. In Proceedings of the 7th
Nordic Conference on Human-Computer Interaction: Making Sense Through Design (pp.
587-596).
84. Pollak, J., Gay, G., Byrne, S., Wagner, E., Retelny, D., & Humphreys, L. (2010). It's time to eat!
Using mobile games to promote healthy eating. IEEE Pervasive Computing , 9 (3), 21-27.
85. Purpura, S., Schwanda, V., Williams, K., Stubler, W., & Sengers, P. (2011). Fit4life. Proceedings
of the 2011 Annual Conference on Human Factors in Computing Systems - CHI ’11.
doi:10.1145/1978942.1979003
86. Quintal, F., Pereira, L., Nunes, N., Nisi, V., & Barreto, M. (2013, September). WATTSBurning:
Design and evaluation of an innovative eco-feedback system. In IFIP Conference on
Human-Computer Interaction (pp. 453-470). Springer, Berlin, Heidelberg.
87. Ranganathan, J., Vennard, D., Waite, R., Dumas, P., Lipinski, B., Searchinger, T. I. M., &
GLOBAGRI-WRR, M. A. (2016). Shifting diets for a sustainable food future. World Resources
Institute .
88. Ratelle, J. T., Wittich, C. M., Roger, C. Y., Newman, J. S., Jenkins, S. M., & Beckman, T. J.
(2017). Relationships between reflection and behavior change in CME. Journal of Continuing
Education in the Health Professions , 37 (3), 161-167.
89. Reisch, L., Eberle, U., & Lorek, S. (2013). Sustainable food consumption: an overview of
contemporary issues and policies . Sustainability: Science, Practice and Policy , 9(2), 7–25.
doi:10.1080/15487733.2013.11908111
90. Renfree, I., Harrison, D., Marshall, P., Stawarz, K., & Cox, A. (2016). Don’t Kick the Habit.
Proceedings of the 2016 CHI Conference Extended Abstracts on Human Factors in Computing
Systems - CHI EA ’16. doi:10.1145/2851581.2892495
91. Rothman, A. J., Sheeran, P., & Wood, W. (2009). Reflective and Automatic Processes in the
Initiation and Maintenance of Dietary Change. Annals of Behavioral Medicine, 38(S1), 4–17.
doi:10.1007/s12160-009-9118-3
164
/
92. Rouillard, J. (2012, February). The Pervasive Fridge. A smart computer system against uneaten
food loss.
93. Sadasivam, R. S., Cutrona, S. L., Kinney, R. L., Marlin, B. M., Mazor, K. M., Lemon, S. C., &
Houston, T. K. (2016). Collective-intelligence recommender systems: advancing computer
tailoring for health behavior change into the 21st century. Journal of medical Internet research ,
18 (3), e42.
94. Saunders, C. M., Barber, A., & Taylor, G. J. (2006). Food miles-comparative energy/emissions
performance of New Zealand's agriculture industry.
95. Schaefbauer, C. L., Khan, D. U., Le, A., Sczechowski, G., & Siek, K. A. (2015, February). Snack
buddy: supporting healthy snacking in low socioeconomic status families. In Proceedings of the
18th ACM Conference on Computer Supported Cooperative Work & Social Computing (pp.
1045-1057).
96. Schneider, P. L., Bassett Jr, D. R., Thompson, D. L., Pronk, N. P., & Bielak, K. M. (2006). Effects
of a 10,000 steps per day goal in overweight adults. American Journal of Health Promotion , 21 (2),
85-89.
97. Schunk, D. H. (1990). Goal Setting and Self-Efficacy During Self-Regulated Learning.
Educational Psychologist, 25(1), 71–86. doi:10.1207/s15326985ep2501_6
98. Schyver, T., & Smith, C. (2005). Reported attitudes and beliefs toward soy food consumption of
soy consumers versus nonconsumers in natural foods or mainstream grocery stores. Journal of
Nutrition Education and Behavior , 37 (6), 292-299.
99. Seidl, R., Thom, D., Kautz, M., Martin-Benito, D., Peltoniemi, M., Vacchiano, G., … Reyer, C. P.
O. (2017). Forest disturbances under climate change. Nature Climate Change , 7(6), 395–402.
doi:10.1038/nclimate3303
100. Settele, J., Scholes, R., Betts, R. A., Bunn, S., Leadley, P., Nepstad, D., ... & Root, T. (2015).
Terrestrial and inland water systems. In Climate change 2014 impacts, adaptation and
vulnerability: Part A: Global and sectoral aspects (pp. 271-360). Cambridge University Press.
101. Siawsolit, C., Seepun, S., Choi, J., Do, A., & Kao, Y. (2017). Personalized assistant for
health-conscious grocery shoppers. In International Conference on Persuasive Technology (pp.
95-106). Springer, Cham.
102. Snowdon, D. A., Phillips, R. L., & Fraser, G. E. (1984). Meat consumption and fatal ischemic
heart disease. Preventive medicine , 13 (5), 490-500.
103. Sparks, P., Guthrie, C. A., & Shepherd, R. (1997). The Dimensional Structure of the Perceived
Behavioral Control Construct. Journal of Applied Social Psychology, 27(5), 418–438.
doi:10.1111/j.1559-1816.1997.tb00639.x
165
/
104. Steinfeld, H., Gerber, P., Wassenaar, T., Castel, V., Rosales, M., De Haan, C., & Shadow, L. S. L.
(2006). Environmental issues and options. Food and Agriculture Organization, Rome, Italy .
105. Stern, P. C. (2000). New environmental theories: toward a coherent theory of environmentally
significant behavior. Journal of social issues , 56 (3), 407-424.
106. Strecher, V. J., McEvoy DeVellis, B., Becker, M. H., & Rosenstock, I. M. (1986). The role of
self-efficacy in achieving health behavior change. Health education quarterly , 13 (1), 73-92.
107. Swatland, H. J. (2010). Meat products and consumption culture in the West. Meat science , 86 (1),
80-85.
108. Taris, T. W., & Kompier, M. (2003). Challenges in longitudinal designs in occupational health
psychology. Scandinavian journal of work, environment & health , 1-4.
109. Tempelaar, D., Kerckhoffs, C., Velleman, P. F., D, D. V., & Sharpe, N. R. (2016). Comparing Two
Means. In Sharpe, business statistics & extra texts: Compiled from: Business statistics, Third
edition, Norean R. Sharpe, Richard D. De Veaux, Paul F. Velleman (3rd ed., pp. 411-412).
Harlow, England: Pearson Educational Limited.
110. Thieme, A., Comber, R., Miebach, J., Weeden, J., Kraemer, N., Lawson, S., & Olivier, P. (2012,
May). " We've bin watching you" designing for reflection and social persuasion to promote
sustainable lifestyles. In Proceedings of the SIGCHI Conference on Human Factors in Computing
Systems (pp. 2337-2346).
111. Toscos, T., Faber, A., An, S., & Gandhi, M. P. (2006, April). Chick clique: persuasive technology to
motivate teenage girls to exercise. In CHI'06 extended abstracts on Human factors in computing
systems (pp. 1873-1878).
112. Thorogood, M., Mann, J., Appleby, P., & McPherson, K. (1994). Risk of death from cancer and
ischaemic heart disease in meat and non-meat eaters. Bmj , 308 (6945), 1667-1670.
113. Tuomisto, H. L., & Teixeira de Mattos, M. J. (2011). Environmental impacts of cultured meat
production. Environmental science & technology , 45 (14), 6117-6123.
114. Van der Klaauw, B., & Van Ours, J. C. (2013). Carrot and stick: How reemployment bonuses and
benefit sanctions affect exit rates from welfare. Journal of Applied Econometrics , 28 (2), 275-296.
115. VanWormer, J. J., Martinez, A. M., Benson, G. A., Crain, A. L., Martinson, B. C., Cosentino, D. L.,
& Pronk, N. P. (2009). Telephone counseling and home telemonitoring: the weigh by day trial.
American journal of health behavior , 33 (4), 445-454.
116. Veenstra, S., Tutert, B., & Thomas, T. (2011). Voorbij de winkelwagen.
117. Vermeir, I., & Verbeke, W. (2006). Sustainable food consumption: Exploring the consumer
“attitude–behavioral intention” gap. Journal of Agricultural and Environmental ethics , 19 (2),
169-194.
166

/
118. Vermunt, A. E. M., Stegeman, H., & Herstel, H. (1990). Onderzoek naar de samenstelling en
microbiologische kwaliteit van gekoelde kant en klaar maaltijden (No. 90.41). RIKILT.
119. Waite, R., M. Beveridge, R. Brummett, S. Castine, N. Chaiyawannakarn, S. Kaushik, R.
Mungkung, S. Nawapakpilai, and M. Phillips. (2014). Improving Productivity and Environmental
Performance of Aquaculture. Working Paper, Installment 5 of Creating a Sustainable Food
Future . Washington, DC: World Resources Institute.
120. Wayman, E., & Madhvanath, S. (2015, September). Nudging grocery shoppers to make healthier
choices. In Proceedings of the 9th ACM Conference on Recommender Systems (pp. 289-292).
121. Wooten, D. B., & Reed, A. (2004). Playing it safe: Susceptibility to normative influence and
protective self-presentation. Journal of consumer research , 31 (3), 551-556.
122. What We Do. (n.d). Veganuary.com. Retrieved December 21, 2020, from
https://www.veganuary.com/about/about-us/
123. Yaffe-bellany, David. “The New Makers of Plant-Based Meat? Big Meat Companies.” The New
York Times , The New York Times, 14 Oct. 2019,
www.nytimes.com/2019/10/14/business/the-new-makers-of-plant-based-meat-big-meat-companie
s.html
124. Zapico, J. L., Katzeff, C., Bohné, U., & Milestad, R. (2016, October). Eco-feedback visualization
for closing the gap of organic food consumption. In Proceedings of the 9th Nordic Conference on
Human-Computer Interaction (pp. 1-9).
167
/
Appendix A: List of Search Terms
Search terms used to find studies that designed systems for the purpose of sustainable food
consumption, food consumption and eco-feedback in various domains.
1. Sustainable food consumption
2. Sustainable food consumption intervention
3. Sustainable grocery
4. Grocery assistant
5. Sustainable grocery assistant
6. Eco-feedback grocery
7. Healthy food assistant
8. Healthy eating
9. Healthy eating assistant
10. Weight management assistant
11. Eating disorder HCI
12. Eco-feedback food
13. Eco-feedback
14. Eco-feedback energy
15. Eco-feedback water
168

/
Appendix B: Individual Brainstorm Mind-map
Figure B1. Visualization of individual brainstorm
169
/
Appendix C: Lo-Fi Prototype Test Tasks
1. Add “broccoli” to your grocery list.
2. Add “minced beef” to your grocery list.
3. Identify which products have sustainable alternatives available by saying “this one”.
4. Find the suggestions for alternatives to the product.
5. Choose a suggested alternative.
6. Find the overview of your performance.
7. Set a goal for yourself to consume less animal proteins the next time you go shopping.
170
/
Appendix D: Lo-Fi Prototype Test Protocol
1. The participant is briefed before the test is conducted.
2. The participant is given a list of tasks for them to accomplish, and asked to read them
out loud.
3. Before starting the first task, the participant is asked to share their screen and the
researcher begins recording their screen using Google Meet’s built in function for this.
4. A recording of the participant’s face is begun.
5. The participant is asked to conduct each of the tasks and while doing so, employ a
Think-Aloud method.
6. The researcher makes written observations of the participant’s actions and performance.
7. Once the participant has completed a given task to their satisfaction, they are asked to
convey this to the researcher.
8. Once all the tasks are completed, the participant is asked a series of questions
regarding their experience with the application while completing the tasks. The recording
is stopped when the participant has completed all the tasks.
171
/
Appendix E: Lo-Fi Prototype Interview Questions
Q1. Overall, what are your impressions of the application and why?
Q2. How did you experience performing the tasks with the application? Why?
Q3. What do you think can be improved regarding the application?
Q4. On a scale from 1 to 5, where 1 is unusable and 5 is usable, how would you rate this
system and why?
Q5. Were there things you found confusing about the application and if so, why?
Q6. Was there anything unclear about the user interface and why?
Q7. Which of these designs do you prefer and why? (Reduction)
Q8. How did you experience the color-coding used in the application in the list section?
Q9. Which of these designs do you prefer and why? (Suggestion of alternatives)
Q10. Which of these designs do you prefer and why? (Tunneling)
Q11. How did you experience the goal-setting feature?
172
/
Appendix F: Hi-Fi Prototype Questionnaires
Questions in the First Questionnaire
1. How old are you? (Numerical values only)
2. With which gender do you identify? (Female, Male, Other)
3. Are you currently living in the Netherlands? (Yes, No)
4. Do you do some of your shopping for meat/dairy products at either Jumbo or Albert
Heijn? (Yes, No)
5. How did you find out about this study? (Social media, Reddit, Albert Heijn notice board)
Questions that are in both the First and Second Questionnaires
6. What is your unique ID? (find it in the application on the Progress Overview page or on
the Questionnaire Links page)
Perceived affordability of alternatives:
7. In general, I find the prices of meat replacements (e.g. soya chunks, vega-burgers,
veggie schnitzel, etc.) to be affordable. (Level of Agreement 1-7)
8. In general, I find the prices of dairy replacements (e.g. vegan margarine, soya milk,
almond milk etc.) to be affordable. (Level of Agreement 1-7)
Awareness of alternatives:
9. In general, I am aware of the different kinds of meat replacements available. (Level of
agreement 1-7 where 1 is strongly disagree and 7 is strongly agree)
10. In general, I am aware of the different kinds of dairy replacements available. (Level of
Agreement 1-7)
Intention to purchase alternatives:
11. I have the intention to buy some meat replacements, instead of conventional meat
products, when preparing food for myself. (Level of agreement 1-7)
12. I have the intention to buy some dairy replacements, instead of conventional dairy
products, when preparing food for myself. (Level of agreement 1-7)
13. I have the intention to buy some meat replacements, instead of conventional meat
products, when preparing food for myself and others. (Level of agreement 1-7)
173
/
14. I have the intention to buy some dairy replacements, instead of conventional dairy
products, when preparing food for myself and others. (Level of agreement 1-7)
15. I have the intention to buy only meat replacements, instead of conventional meat
products, when preparing food for myself. (Level of agreement 1-7)
16. I have the intention to buy only dairy replacements, instead of conventional dairy
products, when preparing food for myself. (Level of agreement 1-7)
17. I have the intention to buy only meat replacements, instead of conventional meat
products, when preparing food for myself and others. (Level of agreement 1-7)
18. I have the intention to buy only dairy replacements, instead of conventional dairy
products, when preparing food for myself and others. (Level of agreement 1-7)
Questions that are in the Second Questionnaire
19. How often did you buy meat replacements to prepare food for just yourself? (Frequency
1-5)
20. How often did you buy dairy replacements to prepare food for just yourself? (Frequency
1-5)
21. How often did you buy meat replacements to prepare food for yourself and others?
(Frequency 1-5)
22. How often did you buy dairy replacements to prepare food for yourself and others?
(Frequency 1-5)
23. Were you more likely to buy meat/dairy replacements when preparing a meal just for
yourself than if others were also eating the same meal? (Yes, no, not sure)
Experience with application:
24. I found the application useful for finding out about sustainable alternatives to the
products I normally consume. (Agreement 1-7)
25. I used the application proactively to view my progress. (Frequency 1-5)
26. I used the application proactively to set myself goal/s. (Frequency 1-5)
27. I see myself using an application like this in the long term. (Agreement 1-7)
28. I see myself using this application in the long term. (Agreement 1-7)
29. Did you discuss or recommend the application with any of your friends? (Yes, No)
Normative Influence:
30. Viewing the group’s scores and substitution rates made me reflect on my own
purchasing behavior. (Agreement 1-7)
31. I felt motivated when my score and substitution rates were better than the group’s to
continue substituting products. (Agreement 1-7)
32. I felt driven to purchase more sustainable alternatives when my score and substitution
rates were worse than the group’s. (Agreement 1-7)
174
/
33. I felt motivated to accomplish my goals or set a goal when I saw the group’s goal
completion rate. (Agreement 1-7)
34. I considered an alternative more seriously because it was popular among the group.
(Agreement 1-7)
Goal-setting:
35. I liked the ability to be able to set my own goals. (Agreement 1-7)
36. I prefer setting my own goals versus being set goals by a system. (Agreement 1-7)
37. I think because I set my own goals, it is more realistic for me to achieve them.
(Agreement 1-7)
Exposure to Price of Alternatives:
38. My opinion on the price of sustainable alternatives was unaffected by using the
application. (Agreement 1-7)
39. Using the application changed my opinion on the price of sustainable alternatives in a
positive way. (Agreement 1-7)
40. I liked the overview of sustainable alternatives to a certain product I was considering.
(Agreement 1-7)
41. Constantly seeing the price of sustainable alternatives helped change my opinion of their
general cost. (Agreement 1-7)
175
/
Appendix G: Hi-Fi Prototype Interview Questions
Overall experience
1. What was your experience with the application overall?
2. What were ways that you found the application useful? How?
3. What did you like about the application? Why?
4. What didn’t you like about the application? Why?
5. Were there any bugs or problems you faced when using the application? How did it
affect your experience with the application?
6. How did you experience the following tasks and why (walkthrough of the application):
a. Adding and removing items to your grocery list
b. Finding and viewing the alternatives
c. Viewing your overview metrics
7. How many times did you use the application?
8. Did you find yourself wanting to use the application proactively to view your progress or
set yourself a goal? Why?
9. Did you think of additional features that you would have liked included in the application
while using it? Why would you like those features?
10. Do you see yourself using this application in the long term? Why?
11. Do you see yourself using an application like this in the long term? Why?
12. Do you think this application would help you change your behavior in the long term?
Why?
13. Did you already notice a difference in your behavior by the end of the two weeks?
14. Did you discuss the application or recommend it to any of your friends?
Normative Influence
15. How did you experience being informed about the group’s purchasing habits in general?
16. How did you experience being informed about the group’s performance regarding how
many sustainable alternatives they were buying?
17. Were there moments when you reflected on your purchasing habits after being exposed
to the group’s purchasing behaviors?
a. What did you reflect on?
18. What are your opinions about the group whose behavior you were shown? Why?
19. How did you experience the feature that showed you which alternative was popular
among the group?
20. How did you feel when your performance was comparable to the group’s performance?
Why did you feel this?
176
/
21. Did you prepare food for yourself and others during the field study, and did you find that
this had an effect on your likelihood to buy meat/dairy replacements?
Goal-setting
22. What was your experience with the goal-setting feature? What did you like/not like about
it?
23. How did you experience being shown the group’s personal goal completion rates?
24. Were you able to meet the goal/s that you set?
a. How did that make you feel? Why?
b. Did it motivate you to set more goals in the future? Why or why not?
25. Did you find it useful to be able to set goals for yourself? Why or why not?
26. Did you like having the possibility of setting yourself a goal? Why or why not?
27. Would you like the possibility of setting yourself a goal, and the system recommending
goals for you? Why or why not?
Exposure to Price of Alternatives
28. What was your opinion on the prices of sustainable alternatives before you used the
application?
a. Has your opinion changed since using the application? In what way?
29. How did you experience being given an overview of all the alternatives and their prices
for a particular product you usually buy?
30. How did you experience being shown the prices of the replacements to the meat/dairy
product you were considering?
177

/
Appendix H: Recruitment Post
Are you interested in sustainable eating? Would you like to test an application that helps you
make sustainable choices in the grocery store? I am conducting research into how to design an
application that makes this possible and I need your help to test the app.
Requirements:
- Between the ages of 18-30
- Currently live in the Netherlands
- Have a phone running an Android based operating system that was released after 2015
(for compatibility with application)
- You currently consume meat and/or dairy products
- Conduct some of your shopping for meat and/or dairy products at either Jumbo or Albert
Heijn
- Do not work in the care sector
What you will do:
The study will take approximately two weeks of your time, where the aim is for you to prepare a
grocery shopping list at least 5 times and refer to the list when doing your groceries. In addition
you are asked to set yourself a purchasing goal within the application (more information in the
link). There are questionnaires for you to fill out before you start using the application, and after
you have finished the above task of preparing and using 5 grocery lists.
If you would like to be interviewed about your experience with the application for the research
please send me an email! (details below)
If you are interested, please click the link below for the instructions about the experiment
and how to use the application:
178

/
Appendix I: Instructions for Installation and Usage of
Application
I.1 Instructions to Install the Application
In order to install the application simply navigate to the link provided below and click on the .apk
file and select “Open with Package Installer”. If you get a notification that you cannot install the
application from an untrusted source, simply follow the instructions on your phone screen on
how to add Google Drive as a trusted source.
Application Link:
https://drive.google.com/drive/folders/1F1zuGizIKmSJw1awCORh1LDddIF0wWFp?usp=sharing
I.2 Explanation of the Application
The Sustainable Shopper application was designed to help users make more sustainable
decisions in the supermarket. The application allows users to make a grocery list by adding
items from Albert Heijn and Jumbo’s selection of products. Below you can find instructions and
explanations of the various features of the application.
180
Search Function
This allows you to add items to your list.
Choose a store, and search for an item in the
search bar and then hit the search icon to find
products from the chosen store. When
searching for an item, use the Dutch word for
best results.
To add an item to your list, simply tap on the
desired item from the search results.
Color Coding
Orange: a product with sustainable

/
181
alternatives available. If no action is taken,
the user’s score for the list is decreased by 1.
No Color: this product has no sustainable
alternatives.
Green: this product is a sustainable
alternative and increases your score.
Confirming Shopping List
Confirming your shopping list allows the
score to be calculated for the basket, updates
your Performance Overview, and updates
your progress on any goals you set.
In order to confirm your shopping list, simply
press the green check-mark button at the
bottom of the “My List” page. This will not
change the list in any way.
Alternatives
The Alternatives page for a given product is
found by tapping on an item in your shopping
list that is highlighted in orange or green. This
page shows you sustainable alternatives for
the item you selected.
This page shows you which of the
alternatives are popular among other users,
and allows you to replace the selected item
with a chosen alternative simply by tapping
on the alternative.
In addition, a banner on top of the page will
appear if the alternatives on the page help
contribute to a certain goal you set yourself.
Score
The score for your shopping list is determined
by the number of unsustainable products on
your list (highlighted in orange) that you

/
182
substitute with sustainable alternatives.
If an alternative is chosen that is equal to or
less than the cost of the original product, the
score for the shopping list increases by 1. If
you choose an alternative that is more
expensive than your original product, then
your score increases by 2.
Goals
The Goal Setting feature can be located on
the “Goals” page and allows you to set your
own purchasing goal to guide your
purchases.
The feature allows you to set the type of item
you would like to substitute (meat or dairy),
how many products you aim to substitute,
and the number of shopping trips within which
you would like to accomplish the goal.
Goal Overview
The Goals page gives you an overview of
current and previous goals you set. You can
keep track of your progress with the progress
bar under each active goal, as well as see
how many shopping trips you have left until
the deadline for the goal is reached, and see
how many substitutes you need to purchase
to meet your goal.
In the “Expired Goals” block, you can see the
old goals you set and whether or not you
completed them (green or red).

/
183
Performance Overview
The “Performance Overview” page allows you
to view your performance with regards to your
score for each shopping trip, as well as the
meat and dairy alternative substitution rates
of each of your baskets.
You can also see the group’s average score,
and meat and dairy substitution rates so that
you can compare your performance with
them.
It also keeps you up to date with your goal
completion rate, as well as the group’s goal
completion rate.
Questionnaire Links
This page has links to the two questionnaires
that you are asked to fill out as part of this
experiment. In order to get to the
questionnaire, simply tap the respective
button.
Your Unique ID is provided with the option to
copy it to your clipboard, as you need it for
the questionnaires.
/
184

/
Appendix J: Statistical Analysis
185
Statistic
Std. Error
Q1A
Mean
4.3636
.36364
95% Confidence Interval for
Mean
Lower Bound
3.5534
Upper Bound
5.1739
5% Trimmed Mean
4.4040
Median
4.0000
Variance
1.455
Std. Deviation
1.20605
Minimum
2.00
Maximum
6.00
Range
4.00
Interquartile Range
1.00
Skewness
-.446
.661
Kurtosis
.129
1.279
Q2A
Mean
5.2727
.38355

/
186
95% Confidence Interval for
Mean
Lower Bound
4.4181
Upper Bound
6.1273
5% Trimmed Mean
5.3586
Median
5.0000
Variance
1.618
Std. Deviation
1.27208
Minimum
2.00
Maximum
7.00
Range
5.00
Interquartile Range
1.00
Skewness
-1.690
.661
Kurtosis
4.569
1.279
Q3A
Mean
5.4545
.34015
95% Confidence Interval for
Mean
Lower Bound
4.6966
Upper Bound
6.2124
5% Trimmed Mean
5.5051
Median
6.0000

/
187
Variance
1.273
Std. Deviation
1.12815
Minimum
3.00
Maximum
7.00
Range
4.00
Interquartile Range
1.00
Skewness
-1.140
.661
Kurtosis
1.164
1.279
Q4A
Mean
5.5455
.36590
95% Confidence Interval for
Mean
Lower Bound
4.7302
Upper Bound
6.3607
5% Trimmed Mean
5.6061
Median
6.0000
Variance
1.473
Std. Deviation
1.21356
Minimum
3.00
Maximum
7.00

/
188
Range
4.00
Interquartile Range
1.00
Skewness
-.949
.661
Kurtosis
.654
1.279
Q5A
Mean
4.8182
.55298
95% Confidence Interval for
Mean
Lower Bound
3.5861
Upper Bound
6.0503
5% Trimmed Mean
4.8535
Median
5.0000
Variance
3.364
Std. Deviation
1.83402
Minimum
2.00
Maximum
7.00
Range
5.00
Interquartile Range
3.00
Skewness
-.507
.661
Kurtosis
-1.109
1.279
Q6A
Mean
5.1818
.51906
/
189
95% Confidence Interval for
Mean
Lower Bound
4.0253
Upper Bound
6.3384
5% Trimmed Mean
5.2576
Median
6.0000
Variance
2.964
Std. Deviation
1.72152
Minimum
2.00
Maximum
7.00
Range
5.00
Interquartile Range
1.00
Skewness
-1.203
.661
Kurtosis
.606
1.279
Q7A
Mean
4.7273
.60439
95% Confidence Interval for
Mean
Lower Bound
3.3806
Upper Bound
6.0739
5% Trimmed Mean
4.8081
Median
5.0000
/
190
Variance
4.018
Std. Deviation
2.00454
Minimum
1.00
Maximum
7.00
Range
6.00
Interquartile Range
3.00
Skewness
-.727
.661
Kurtosis
-.547
1.279
Q8A
Mean
4.4545
.52853
95% Confidence Interval for
Mean
Lower Bound
3.2769
Upper Bound
5.6322
5% Trimmed Mean
4.5051
Median
4.0000
Variance
3.073
Std. Deviation
1.75292
Minimum
1.00
Maximum
7.00
/
191
Range
6.00
Interquartile Range
3.00
Skewness
-.452
.661
Kurtosis
-.076
1.279
Q9A
Mean
3.7273
.67542
95% Confidence Interval for
Mean
Lower Bound
2.2223
Upper Bound
5.2322
5% Trimmed Mean
3.6970
Median
3.0000
Variance
5.018
Std. Deviation
2.24013
Minimum
1.00
Maximum
7.00
Range
6.00
Interquartile Range
4.00
Skewness
.351
.661
Kurtosis
-1.344
1.279
Q10A
Mean
4.1818
.58493
/
192
95% Confidence Interval for
Mean
Lower Bound
2.8785
Upper Bound
5.4851
5% Trimmed Mean
4.2576
Median
5.0000
Variance
3.764
Std. Deviation
1.94001
Minimum
1.00
Maximum
6.00
Range
5.00
Interquartile Range
4.00
Skewness
-.914
.661
Kurtosis
-.773
1.279
Q11A
Mean
3.5455
.56187
95% Confidence Interval for
Mean
Lower Bound
2.2935
Upper Bound
4.7974
5% Trimmed Mean
3.4949
Median
3.0000

/
193
Variance
3.473
Std. Deviation
1.86353
Minimum
1.00
Maximum
7.00
Range
6.00
Interquartile Range
3.00
Skewness
.593
.661
Kurtosis
-.479
1.279
Q12A
Mean
3.7273
.57352
95% Confidence Interval for
Mean
Lower Bound
2.4494
Upper Bound
5.0052
5% Trimmed Mean
3.7525
Median
4.0000
Variance
3.618
Std. Deviation
1.90215
Minimum
1.00
Maximum
6.00

/
Table J1. Descriptive Statistics of the common questions in the “after” questionnaire
194
Range
5.00
Interquartile Range
3.00
Skewness
-.376
.661
Kurtosis
-1.510
1.279
Statistic
Std. Error
Q1B
Mean
4.0000
.38139
95% Confidence Interval for
Mean
Lower Bound
3.1502
Upper Bound
4.8498
5% Trimmed Mean
4.0000
Median
4.0000
Variance
1.600
Std. Deviation
1.26491
Minimum
2.00
Maximum
6.00
Range
4.00

/
195
Interquartile Range
2.00
Skewness
.000
.661
Kurtosis
-1.302
1.279
Q2B
Mean
4.0909
.36815
95% Confidence Interval for
Mean
Lower Bound
3.2706
Upper Bound
4.9112
5% Trimmed Mean
4.1010
Median
4.0000
Variance
1.491
Std. Deviation
1.22103
Minimum
2.00
Maximum
6.00
Range
4.00
Interquartile Range
2.00
Skewness
-.206
.661
Kurtosis
-.919
1.279
Q3B
Mean
4.7273
.50616
95% Confidence Interval for
Mean
Lower Bound
3.5995

/
196
Upper Bound
5.8551
5% Trimmed Mean
4.7525
Median
5.0000
Variance
2.818
Std. Deviation
1.67874
Minimum
2.00
Maximum
7.00
Range
5.00
Interquartile Range
3.00
Skewness
-.406
.661
Kurtosis
-1.415
1.279
Q4B
Mean
3.6364
.47238
95% Confidence Interval for
Mean
Lower Bound
2.5838
Upper Bound
4.6889
5% Trimmed Mean
3.5960
Median
3.0000
Variance
2.455

/
197
Std. Deviation
1.56670
Minimum
2.00
Maximum
6.00
Range
4.00
Interquartile Range
3.00
Skewness
.550
.661
Kurtosis
-1.382
1.279
Q5B
Mean
4.5455
.56187
95% Confidence Interval for
Mean
Lower Bound
3.2935
Upper Bound
5.7974
5% Trimmed Mean
4.5505
Median
5.0000
Variance
3.473
Std. Deviation
1.86353
Minimum
2.00
Maximum
7.00
Range
5.00

/
198
Interquartile Range
4.00
Skewness
-.314
.661
Kurtosis
-1.076
1.279
Q6B
Mean
3.5455
.63766
95% Confidence Interval for
Mean
Lower Bound
2.1247
Upper Bound
4.9663
5% Trimmed Mean
3.4949
Median
3.0000
Variance
4.473
Std. Deviation
2.11488
Minimum
1.00
Maximum
7.00
Range
6.00
Interquartile Range
3.00
Skewness
.272
.661
Kurtosis
-1.479
1.279
Q7B
Mean
4.3636
.60712
95% Confidence Interval for
Mean
Lower Bound
3.0109
/
199
Upper Bound
5.7164
5% Trimmed Mean
4.3485
Median
4.0000
Variance
4.055
Std. Deviation
2.01359
Minimum
2.00
Maximum
7.00
Range
5.00
Interquartile Range
5.00
Skewness
.198
.661
Kurtosis
-1.464
1.279
Q8B
Mean
3.7273
.54089
95% Confidence Interval for
Mean
Lower Bound
2.5221
Upper Bound
4.9325
5% Trimmed Mean
3.6414
Median
3.0000
Variance
3.218
/
200
Std. Deviation
1.79393
Minimum
2.00
Maximum
7.00
Range
5.00
Interquartile Range
3.00
Skewness
.626
.661
Kurtosis
-.930
1.279
Q9B
Mean
3.3636
.62191
95% Confidence Interval for
Mean
Lower Bound
1.9779
Upper Bound
4.7493
5% Trimmed Mean
3.2929
Median
3.0000
Variance
4.255
Std. Deviation
2.06265
Minimum
1.00
Maximum
7.00
Range
6.00
/
201
Interquartile Range
2.00
Skewness
.906
.661
Kurtosis
.081
1.279
Q10B
Mean
2.8182
.50124
95% Confidence Interval for
Mean
Lower Bound
1.7014
Upper Bound
3.9350
5% Trimmed Mean
2.7980
Median
2.0000
Variance
2.764
Std. Deviation
1.66242
Minimum
1.00
Maximum
5.00
Range
4.00
Interquartile Range
4.00
Skewness
.350
.661
Kurtosis
-1.669
1.279
Q11B
Mean
3.2727
.63376
95% Confidence Interval for
Mean
Lower Bound
1.8606

/
202
Upper Bound
4.6848
5% Trimmed Mean
3.1919
Median
3.0000
Variance
4.418
Std. Deviation
2.10195
Minimum
1.00
Maximum
7.00
Range
6.00
Interquartile Range
4.00
Skewness
.508
.661
Kurtosis
-.944
1.279
Q12B
Mean
2.7273
.52381
95% Confidence Interval for
Mean
Lower Bound
1.5601
Upper Bound
3.8944
5% Trimmed Mean
2.6414
Median
2.0000
Variance
3.018

/
Table J2. Descriptive Statistics of the common questions in the “before” questionnaire
203
Std. Deviation
1.73729
Minimum
1.00
Maximum
6.00
Range
5.00
Interquartile Range
3.00
Skewness
.791
.661
Kurtosis
-.655
1.279
Descriptives
Statisti
c
Std.
Error
Q1
3
Mean
6.0909
.25062
95% Confidence Interval
for Mean
Lower
Bound
5.5325
Upper
Bound
6.6493
5% Trimmed Mean
6.1566
Median
6.0000
Variance
.691

/
204
Std. Deviation
.83121
Minimum
4.00
Maximum
7.00
Range
3.00
Interquartile Range
1.00
Skewness
-1.467
.661
Kurtosis
3.961
1.279
Q1
4
Mean
4.4545
.38996
95% Confidence Interval
for Mean
Lower
Bound
3.5857
Upper
Bound
5.3234
5% Trimmed Mean
4.3939
Median
4.0000
Variance
1.673
Std. Deviation
1.2933
4
Minimum
3.00
Maximum
7.00
Range
4.00

/
205
Interquartile Range
2.00
Skewness
.630
.661
Kurtosis
-.136
1.279
Q1
5
Mean
3.8182
.37703
95% Confidence Interval
for Mean
Lower
Bound
2.9781
Upper
Bound
4.6582
5% Trimmed Mean
3.8535
Median
4.0000
Variance
1.564
Std. Deviation
1.2504
5
Minimum
1.00
Maximum
6.00
Range
5.00
Interquartile Range
1.00
Skewness
-.713
.661
Kurtosis
2.476
1.279
Q1
6
Mean
4.0909
.51265

/
206
95% Confidence Interval
for Mean
Lower
Bound
2.9487
Upper
Bound
5.2332
5% Trimmed Mean
4.1010
Median
4.0000
Variance
2.891
Std. Deviation
1.7002
7
Minimum
1.00
Maximum
7.00
Range
6.00
Interquartile Range
2.00
Skewness
-.171
.661
Kurtosis
.178
1.279
Q1
7
Mean
3.4545
.41261
95% Confidence Interval
for Mean
Lower
Bound
2.5352
Upper
Bound
4.3739
5% Trimmed Mean
3.5051

/
207
Median
4.0000
Variance
1.873
Std. Deviation
1.3684
8
Minimum
1.00
Maximum
5.00
Range
4.00
Interquartile Range
3.00
Skewness
-.456
.661
Kurtosis
-.888
1.279
Q1
8
Mean
3.6364
.47238
95% Confidence Interval
for Mean
Lower
Bound
2.5838
Upper
Bound
4.6889
5% Trimmed Mean
3.6515
Median
4.0000
Variance
2.455
Std. Deviation
1.5667
0

/
208
Minimum
1.00
Maximum
6.00
Range
5.00
Interquartile Range
3.00
Skewness
-.213
.661
Kurtosis
-.984
1.279
Q1
9
Mean
5.1818
.32525
95% Confidence Interval
for Mean
Lower
Bound
4.4571
Upper
Bound
5.9065
5% Trimmed Mean
5.2020
Median
5.0000
Variance
1.164
Std. Deviation
1.0787
2
Minimum
3.00
Maximum
7.00
Range
4.00
Interquartile Range
1.00

/
209
Skewness
-.430
.661
Kurtosis
.828
1.279
Q2
0
Mean
5.8182
.35209
95% Confidence Interval
for Mean
Lower
Bound
5.0337
Upper
Bound
6.6027
5% Trimmed Mean
5.8535
Median
6.0000
Variance
1.364
Std. Deviation
1.1677
5
Minimum
4.00
Maximum
7.00
Range
3.00
Interquartile Range
2.00
Skewness
-.499
.661
Kurtosis
-1.154
1.279
Q2
1
Mean
5.7273
.38355
95% Confidence Interval
for Mean
Lower
Bound
4.8727

/
210
Upper
Bound
6.5819
5% Trimmed Mean
5.8081
Median
6.0000
Variance
1.618
Std. Deviation
1.2720
8
Minimum
3.00
Maximum
7.00
Range
4.00
Interquartile Range
2.00
Skewness
-1.160
.661
Kurtosis
.903
1.279
Q2
2
Mean
6.3636
.20328
95% Confidence Interval
for Mean
Lower
Bound
5.9107
Upper
Bound
6.8166
5% Trimmed Mean
6.4040
Median
6.0000

/
211
Variance
.455
Std. Deviation
.67420
Minimum
5.00
Maximum
7.00
Range
2.00
Interquartile Range
1.00
Skewness
-.593
.661
Kurtosis
-.293
1.279
Q2
3
Mean
3.9091
.56334
95% Confidence Interval
for Mean
Lower
Bound
2.6539
Upper
Bound
5.1643
5% Trimmed Mean
3.9545
Median
5.0000
Variance
3.491
Std. Deviation
1.8684
0
Minimum
1.00
Maximum
6.00

/
212
Range
5.00
Interquartile Range
3.00
Skewness
-.627
.661
Kurtosis
-1.141
1.279
Q2
4
Mean
5.0909
.34257
95% Confidence Interval
for Mean
Lower
Bound
4.3276
Upper
Bound
5.8542
5% Trimmed Mean
5.1010
Median
5.0000
Variance
1.291
Std. Deviation
1.1361
8
Minimum
3.00
Maximum
7.00
Range
4.00
Interquartile Range
2.00
Skewness
-.211
.661
Kurtosis
-.065
1.279

/
213
Q2
5
Mean
5.2727
.40656
95% Confidence Interval
for Mean
Lower
Bound
4.3669
Upper
Bound
6.1786
5% Trimmed Mean
5.3586
Median
6.0000
Variance
1.818
Std. Deviation
1.3484
0
Minimum
2.00
Maximum
7.00
Range
5.00
Interquartile Range
1.00
Skewness
-1.501
.661
Kurtosis
2.913
1.279
Q2
6
Mean
5.6364
.36364
95% Confidence Interval
for Mean
Lower
Bound
4.8261
Upper
Bound
6.4466
5% Trimmed Mean
5.7071

/
Table J3. Descriptive Statistics of agreement on statements unique to the “after” questionnaire
214
Median
6.0000
Variance
1.455
Std. Deviation
1.2060
5
Minimum
3.00
Maximum
7.00
Range
4.00
Interquartile Range
1.00
Skewness
-1.226
.661
Kurtosis
1.263
1.279

/
Appendix K: Thematic Analysis coding
The colors in the table refer to individual participants that were interviewed, and color coding
was done to keep track of which participant contributed to the codes, and to find meaningful
quotes to support the findings of the thematic analysis.
215
Community Theme
Finding Comparable
Sub-group
Disconnect with
group
Social Movement
Group Influence
[Define group being
compared to]
[Not concerned with
group]
[Group improvement
brought happiness]
[Trust in group choice]
[desire to filter group].
[Not concerned with
the group]
[Desire to see group
improving]
[Reliance on group
choice]
[Refine the group for
accurate comparison]
[Disconnect from
group]
[Interest in the group’s
performance]
[Validation of choice if
group chose for it]
[Interest in group
information]
[Lack of connection to
group if not working to
something]
[Desire to see group
improve]
[Trust/Reliance in
group taste]
[Unfair comparison to
different group]
[Anonymous group
isn’t motivating, has to
be more personal]
[Community
movement]
[trust in group taste]
[Demotivated by
comparison to wrong
group]
[Disconnection to
anonymous group]
[Feeling of community]
[Interest in group
choice]
[Felt bad with different
use case comparison]
[Doesn’t identify with
group]
[Community feeling]
[Reliance on group
opinion]
[Unfair comparison
because of
diet/preference]
[Suspicious/scrutinous
of group if unaware of
makeup]
[Reliance on group
taste]
[Interest in comparison
to group performance]
[Suspicious or
scrutinous if unaware
of makeup of group]
[Interest in what group
is consuming]
[Desire to familiarize
group]
[Reflecting on
performance when
viewing group’s
performance]
[Desire to personalize
[Reflection on seeing

/
Table K1. Codes used for the Community theme along with its sub-themes
216
the anonymous group]
group behavior]
[Compare with familiar
people]
[Influenced by group
substitution, caused
reflection]
[Comparison of
difficulty of goals to the
group]
[Local users doing
better is inspiring]
[Compare
performance to group]
[Compare
performance to group]
[Felt bad when
performing worse than
group]
[Positive feeling when
comparable to group]
[Felt bad when
compared to group
goal completion]
[Felt good when ahead
of group]
Effort Theme
Goal Setting
Measurement & Context
[Wary of learning curve]
[Desire for ranking of difficulty of goal]
[Getting used to learning curve]
[Desire recognition for achieving harder goals]
[Uncomfortable with full control]
[Desire to rank goals]
[Desire for suggested goals]
[Seeking acknowledgement of going beyond
set goal in app]
[System suggesting goals for beginners]
[Desire for more information like footprint]
[Reduce effort to set personal goal]
[More information about footprint/impact]
[Putting effort into behavior change isn’t good]
[Desire for more product information]

/
Table K2. Codes used for the Effort theme along with its sub-themes
217
[Desire for more motivation from system (goal)]
[Desire for more personal statistics]
[Not interested if personal goal was easily met]
[Comparison of difficulty of goals to the group]
[Lost interest due to easily achieved goal]
[Preference for long term goals]
[Desire for long term goals]
[Preference for long term goals]
[Focus on very short term goals]
[Easier to stick to and remember short term
goals]
Motivation Theme
Self-Motivation
Group
Comparison
Group
Motivation
Feature Based
Motivation
Ownership of
Progress
[Motivated by
completion rate]
[Dislikes
comparing
performance]
[Motivated by
group
substitution]
[Color coding
served as
motivation]
[Personal
progress felt
good]
[Motivated by
completing goals]
[Compare with
top performers]
[Motivated by
group substitution
choices]
[Color coding felt
like a reward for
good behavior]
[Didn’t want to
lose momentum]
[Motivated by bad
personal
performance]
[Motivated if
better than group]
[Motivated by
squad/family/com
munity feeling]
[Green color
elicited positive
feeling]
[Recover
momentum lost
from failing goal]
[Bothered by very
low goal
completion rate]
[Compare
performance to
group]
[Motivated by
people with
similar goals]
[Color coding was
a goal to reduce]
[Failing a goal
motivated him to
try again]
[Motivated to
achieve goal]
[Compare
performance to
group]
[Motivated by
competition to set
harder goals]
[Color coding felt
good]
[Motivation to
maintain good
streak]
[More motivation
to achieve
personal goals]
[Motivated to do
better if doing
worse than group
despite not
[Demotivated if
people they know
do better]
[Color coding was
a goal to strive
towards]
[Preference for
personal goal
setting]

/
Table K3. Codes used for the Motivation theme along with its sub-themes
218
identifying with
group]
[Felt bad when
failing personal
goal]
[Compare with
familiar people]
[Group motivates
to set harder
goals]
[Demotivation
due to lack of
recognition]
[Ownership of
progress when
completing
personal goals]
[Selfish
motivation to
substitute]
[Demotivated if
doing worse than
group]
[Losing to
someone you
know hurts more
than to an
anonymous
group]
[Seeking
acknowledgemen
t of going beyond
set goal in app]
[Preference for
personal goals]
[Bothered by very
low goal
completion rate]
[Comparison
brings
demotivation if
not performing
well]
[Interest in goals
other set for
themselves]
Lack of
motivation for
goal setting
because good
behavior not
recognized]
[Appreciates
personal goal
setting]
[Motivated by
doing better]
[Interest in
group’s goals]
[Appreciates
choice to set
personal goals]
[desire to
compare]
[Importance of
personal goal
setting]
[Leaderboards
provide different
motivation than
personal goal
setting]
[Realizes
importance of
personal goal
setting]
[Motivated by
group to do better
(more social
norm)]