Hormonal milieu influences whole-brain structural dynamics across the menstrual cycle using dense sampling in multiple individuals PDF Free Download
1 / 27/27
100%

Nature Neuroscience | Volume 28 | December 2025 | 2588–2600 2588
nature neuroscience
Article https://doi.org/10.1038/s41593-025-02066-2
Hormonal milieu influences whole-brain
structural dynamics across the menstrual
cycle using dense sampling in multiple
individuals
Carina Heller 1,2,3,4,5,6,24 , Daniel Güllmar7,24, Lejla Colic 1,5,6,
Laura Pritschet 8, Martin Gell2,9,10, Nooshin Javaheripour1,
Feliberto de la Cruz 11, Philine Rojczyk12,13, Carina J. Koeppel 5,14,
Bart Larsen 2,3,15, Habib Ganjgahi16,17, Frederik J. Lange18, Ann-Christine Buck19,
Tim L. Jesgarzewsky19, Robert Dahnke20, Michael Kiehntopf21,
Emily G. Jacobs 4,22, Zora Kikinis13, Martin Walter1,5,6, Ilona Croy5,6,19,23 &
Christian Gaser 1,5,6,20
Gonadal hormone receptors are widely distributed across the brain, yet their
inuence on brain structure remains understudied. Here, using precision
imaging, we examined four females, including one with endometriosis and
one using oral contraceptives (OC), across a monthly period. Whole-brain
analyses revealed spatiotemporal patterns of brain volume changes,
with substantial variations across the monthly period. In typical cycles,
spatiotemporal patterns were associated with serum progesterone levels,
while in cycles with endometriosis and during OC intake, patterns were
associated with serum estradiol levels. The volume changes were widely
distributed rather than region-specic, suggesting a widespread but
coordinated inuence of hormonal uctuations. These ndings underscore
the importance of considering diverse hormonal milieus beyond typical
menstrual cycles in understanding structural brain dynamics and suggest
that hormonal rhythms may drive widespread structural brain changes.
Physiological fluctuations in levels of gonadal hormones, such as
endogenous estradiol and progesterone, orchestrate the rhythm of
the female menstrual cycle throughout the reproductive years1,2. The
typical menstrual cycle spans 25–32 days, beginning with the follicular
phase characterized by menses, followed by a rise in estradiol levels
alongside low progesterone concentrations; around cycle day 14, ovula-
tion marks the transition into the luteal phase, marked by rising pro-
gesterone levels and a second peak in estradiol, and then followed by a
decline in both hormones toward the end of the cycle3. Ex vivo animal
data have shown a widespread distribution of both progesterone and
estradiol receptors throughout the brain, with varying expression levels
depending on the specific brain region. While brain structures typically
associated with the limbic system (for example, thalamus, hippocam-
pus, amygdala and hypothalamus) are richer in estrogen and proges-
terone receptors, these receptors are also expressed, albeit to a lesser
extent, in the cerebral and cerebellar cortex
4,5
. Estradiol and progester-
one have pivotal roles in synaptogenesis, myelination processes and the
modulation of spine density
6–11
. As such, these hormones have potential
to modulate brain structure, function, chemistry
12–14
and, by extension,
to influence behavior11. This is further demonstrated by hormonal
Received: 13 December 2023
Accepted: 19 August 2025
Published online: 26 September 2025
Check for updates
A full list of afiliations appears at the end of the paper. e-mail: carina.heller@uni-jena.de

Nature Neuroscience | Volume 28 | December 2025 | 2588–2600 2589
Article https://doi.org/10.1038/s41593-025-02066-2
this hormone, referred to as estrogen dependency
42,43,48–50
. In paral-
lel, the endometriotic lesions can become resistant to the inhibitory
actions of endogenous progesterone, known as progesterone resist-
ance44; consequently, even in the presence of progesterone, these
tissues may continue to grow, bleed and cause inflammation rather
than responding with the typical growth suppression seen in healthy
endometrial tissue51–53.
The current study used four densely sampled females who under-
went extensive and standardized brain imaging and venipuncture
throughout their entire menstrual cycle. Using a whole-brain approach,
we aimed to delineate individualized trajectories of structural brain
patterns and to investigate the impact of endogenous day-to-day hor-
mone fluctuations on these trajectories. Similar to the principles of
whole-brain functional connectivity analyses, which probe the inter-
actions and communication between different regions, we aim to
understand how the brain changes as a whole across the menstrual
cycle. Through this approach, we seek to elucidate the influence of
hormonal fluctuations on the entire brain, offering nuanced insights
into the dynamic processes of hormone-induced neuroplasticity.
To investigate neurostructural dynamics across hormonal states,
we conducted a dense-sampling study involving multiple participants.
First, we densely sampled a healthy female with a typical menstrual
cycle, referred to as ‘typical cycle’ (Extended Data Fig. 1a). We then
leveraged the densely sampled open-access 28andMe dataset of
another female33–38,40. This dataset will be referred to as ‘28andMe
(typical) cycle’ (Extended Data Fig. 1b). To extend the relevance of
our findings and to probe the neural effects of hormonal dysregula
-
tion, we repeated these procedures in a female participant diagnosed
with endometriosis. This dataset will be referred to as ‘endometriosis
cycle’ (Extended Data Fig. 1c). Additionally, we included one female
using oral contraceptives (OC), characterized by substantially sup-
pressed endogenous serum progesterone levels, and estradiol levels
comparable to a natural cycle. This dataset will be referred to as ‘OC
cycle’ (Extended Data Fig. 1d). We first compared endogenous gonadal
hormones—serum estradiol levels, serum progesterone levels and their
ratio—among the four individuals to evaluate the presence of hormonal
dysregulation in the female with endometriosis. Then, using singular
value decomposition (SVD) analyses, we generated whole-brain volu-
metric (VSTPs) and cortical thickness spatiotemporal patterns (CSTPs)
across the monthly period. After this, we investigated the potential
association between these patterns and gonadal hormones within
each individual. Subsequently, voxel-wise and vertex-wise analyses
were used to directly link the hormonal fluctuations to structural brain
measures. To further contextualize our results, we repeated the study
procedure and acquired an additional dense-sampling dataset from
one male over a comparable monthly period, during which no specific
gonadal hormone patterns were expected.
In this study, we use the term ‘females’ instead of ‘women’ to
emphasize the biological aspect, focusing on biological sex rather
than gender. It is worth noting that language regarding these terms
is constantly evolving. We emphasize that sex hormones represent
crucial biological factors in the human experience, transcending any
perceived binaries.
Results
Endocrine assessments and menstrual cycle patterns
Gonadal hormones were assessed throughout the full menstrual cycle
(Fig. 1a). Analyses of hormone serum concentrations in the typical cycle
and the 28andMe (typical) cycle confirmed the expected rhythmic
changes of a natural menstrual cycle. In the typical cycle, the 25 test
sessions covered 15 days of the follicular phase and 10 days of the luteal
phase. In the 28andMe (typical) cycle, the 30 test sessions covered
14 days of the follicular phase and 16 days of the luteal phase. The ratios
between progesterone and estradiol concentrations suggested a typical
hormonal balance during the luteal phase.
influences on cognition, memory
15–18
, stress responsiveness
19–21
and
mood regulation
22–25
. While animal studies have provided valuable
insights into the role of gonadal hormones on the brain, they often focus
on a limited number of regions (for example, hippocampus). However,
given that estradiol and progesterone receptors are expressed across
the entire brain, a whole-brain approach is essential to better under-
stand the broader impact of these hormones. Because these hormones
can modulate brain structure, examining the entire brain would offer
a deeper understanding of their effects on neural dynamics.
Studies investigating the effect of endogenous hormones on brain
neuroplasticity in vivo in human neuroscience often involve collect-
ing data from multiple individuals at a single time point to establish
mean comparisons and average hormone–brain associations. This
cross-sectional method, such as comparing females in the follicu-
lar versus the luteal phase, has identified differences in global gray
matter volume
26
as well as region-specific differences (for example,
hippocampus27,28, parahippocampal gyrus28,29, middle frontal gyrus27,30
and cerebellum28). However, this method overlooks the rhythmic
nature of hormone production within the body. Furthermore, averag-
ing across participants may obscure individual differences, warranting
a personalized (within-participant) analysis.
Recent years have witnessed a paradigm shift in neuroimaging
studies, with an alternative approach that involves the longitudinal
tracking of individual participants over extended periods of weeks
and months, increasing the sensitivity to detect associations among
fluctuations in gonadal hormones and brain structure
31,32
. An emerging
trend has centered on the comprehensive monitoring of the female
menstrual cycle over time periods ranging from days to weeks and
months, aiming to enhance our understanding of hormone-induced
effects within the human brain
33–40
. This approach has enriched our
insights into the multifaceted impact of hormones on human brain
function and structure by detecting subtle changes that could be
overlooked in less frequent sampling. Densely sampled neuroimag-
ing studies tracking a single individual across a complete menstrual
cycle have primarily focused on investigating functional networks and
connectivity
33,35–38
. Only two densely sampled neuroimaging studies
have examined structural changes, exclusively within regions of inter-
est (hippocampus and medial temporal lobe39,40). In the most recent
investigation, 27 female participants underwent six scans throughout
their menstrual cycle. Here the authors reported associations among
plasma estradiol levels, progesterone levels and subfield volumes
within the hippocampus41. While region-specific analyses reveal how
particular brain areas differ across the menstrual cycle, they do not
provide insights into the dynamic changes that occur throughout
the brain. Adopting a whole-brain approach would provide a broader
perspective on the range of brain structures that change across the
full menstrual cycle in response to day-to-day hormonal fluctuations.
To expand our understanding of the impact of estradiol and pro-
gesterone on the brain’s structure, it is essential to expand the scope of
our research beyond individuals with typical menstrual cycle patterns.
Including participants with endocrine disorders such as endome-
triosis, a condition characterized by a unique hormonal profile
42–44
,
will provide a more nuanced understanding of the complex interplay
between gonadal hormones and their influence on brain structure.
Endometriosis, a chronic and inflammatory gynecological disorder,
affects approximately 10–15% of females in their reproductive years
45
.
It is defined by the presence and growth of ectopic endometrial stroma
and glands outside the uterine cavity, typically within the peritoneal
cavity. This pathological phenomenon can have various clinical mani-
festations, including chronic pelvic pain, dysmenorrhea, dyspareunia
and infertility
46,47
. The condition is accompanied by hormonal dys-
regulations—the development, growth and maintenance of endome-
triotic lesions are driven and sustained by endogenous estrogen, and
endometriosis is associated with an increased estradiol synthesis and
decreased inactivation, resulting in elevated local concentrations of

Nature Neuroscience | Volume 28 | December 2025 | 2588–2600 2590
Article https://doi.org/10.1038/s41593-025-02066-2
In the endometriosis cycle, gonadal hormone concentrations
also followed the rhythmic changes of a menstrual cycle. The 25 test
sessions covered 17 days of the follicular phase and 8 days of the luteal
phase. As predicted, the progesterone-to-estradiol ratio suggested
an estradiol dominance during the luteal phase. The menstrual cycles
covered in the participant with endometriosis lasted 23 and 24 days
Endometriosis cycle Typical cycle
OC cycle 28andMe (typical) cycle
Progesterone (nmol l−1)
Estradiol (pmol l−1) Progesterone-to-estradiol ratio
aHormone concentrations across cycles
bDierences in hormone concentrations
1 (16)
5 (20)
10 (27)
15 (7)
20 (13)
25 (18)
0
500
1,000
1,500
2,000
2,400
Test day (cycle day)
Estradiol (pmol l−1)
Inactive
1 (21)
5 (25)
10 (30)
15 (4)
20 (9)
25 (14)
30 (19)
0
50
100
150
200
Test day (cycle day)
Progesterone (nmol l−1)
Progesterone-to-estradiol ratio
OvulationMenses
1 (15)
5 (19)
10 (26)
15 (4)
20 (15)
25 (20)
0
50
100
150
200
Progesterone (nmol l−1)
Progesterone-to-estradiol ratio
Ovulation Menses Ovulation
1 (2)
5 (6)
10 (13)
15 (21)
20 (3)
25 (10)
0
500
1,000
1,500
2,000
2,400
Estradiol (pmol l−1)
OvulationMenses Menses
Endometriosis cycle
OC cycle
Typical cycle
28andMe (typical) cycle
0
1,000
2,000
3,000
Estradiol (pmol l−1)
NS
NS
NS
NS
NS
Endometriosis cycle
OC cycle
Typical cycle
28andMe (typical) cycle
0
20
40
60
80
Progesterone (nmol l
−1
)
NS
NS
NS
NS
Endometriosis cycle
OC cycle
Typical cycle
28andMe (typical) cycle
0
50
100
150
200
250
Ratio
NS
NS
NS
**
*
***
**
**
**
Fig. 1 | Hormone concentrations of estradiol, progesterone and the
progesterone-to-estradiol ratio for female participants (n = 4). a, Hormones
concentrations across the test sessions for female participants (n = 4). Solid lines
and colored shaded areas represent hormonal levels; gray shading indicates
menses in typical cycles and the endometriosis cycle, and inactive pill phase in
the oral contraceptives (OC) cycle; dashed lines indicate ovulation. Hormone
levels indicate a typical hormonal balance in the typical and 28andMe (typical)
cycles, while hormone levels in the endometriosis and OC cycles suggest
estradiol dominance. b, To test whether hormonal profiles differed among the
four individuals, a one-way MANOVA was conducted, followed by a post hoc
ANOVAs, and two-sided post hoc t-tests. The box-and-whisker plots show the
median (centerline), upper and lower quartiles (box), minimum and maximum
values (whiskers); individual points are shown. Asterisks indicate significance
level (***P < 0.001, **P < 0.01, *P < 0.05) based on two-sided post hoc t-tests with
Bonferroni correction for multiple comparisons. For exact P values, see Main.
Graphs were created with GraphPad Prism (version 10). NS, nonsignificant;
MANOVA, multivariate analysis of variance; ANOVAs, analyses of variance.
Nature Neuroscience | Volume 28 | December 2025 | 2588–2600 2591
Article https://doi.org/10.1038/s41593-025-02066-2
respectively during the experiment, representing shorter menstrual
cycles (≤24 days)—a typical feature of endometriosis. In the OC cycle,
circulating progesterone levels were selectively suppressed. The con-
centration and dynamic range of estradiol during the oral contracep-
tion intake were similar to those observed in a typical menstrual cycle.
Progesterone-to-estradiol ratios suggested an estradiol dominance,
providing an additional dataset with a hormonal milieu similar to that
of the endometriosis cycle.
Progesterone concentrations surpassed 15.9 nmol l−1 in the
typical, 28andMe (typical) and endometriosis cycle, suggesting an
ovulatory cycle54.
To test whether hormonal profiles differed between participants,
a one-way multivariate analysis of variance was conducted with serum
estradiol levels, progesterone levels and the progesterone-to-estradiol
ratio as dependent variables, and the four individuals (typical cycle,
28andMe (typical) cycle, endometriosis cycle and OC cycle) as fixed
factors. The analysis revealed a significant main effect among the
four individuals (Pillai’s trace, F
(9,300)
= 4.52, P < 0.001 η
2
= 0.12; Roy’s
largest root, F
(3,100)
= 10.14, P < 0.001, η
2
= 0.23). Post hoc analyses of
variance indicated significant differences among the four individuals
in estradiol levels (F
(3,100)
= 4.70, P = 0.004, η
2
= 0.12), progesterone
(F
(3,100)
= 5.94, P < 0.001, η
2
= 0.15) and the progesterone-to-estradiol
ratio (F(3,100) = 7.83, P < 0.001, η2 = 0.19). Post hoc two-tailed t-tests,
corrected using the Bonferroni method, further revealed that the
endometriosis cycle had significantly higher estradiol levels compared
to the 28andMe (typical) cycle (P = 0.002), and that progesterone levels
were significantly lower in the OC cycle compared to the typical cycle
(P = 0.005) and the 28andMe (typical) cycle (P = 0.003). The endometri-
osis cycle also showed a significantly lower progesterone-to-estradiol
ratio compared to the 28andMe (typical) cycle (P = 0.002), and the OC
showed lower progesterone-to-estradiol ratios compared to both the
typical cycle (P = 0.045) and the 28andMe (typical) cycle (P < 0.001).
Differences in hormonal values are displayed in Fig. 1b.
Whole-brain structural dynamics
T
1
-weighted (T1w) images were acquired from each participant across
the full menstrual cycle—five consecutive weeks for the typical cycle,
the endometriosis cycle and the OC cycle, and four consecutive weeks
for the 28andMe (typical) cycle. Preprocessing was performed using
SPM12 (http://www.fil.ion.ucl.ac.uk/spm) and CAT12 toolbox (https://
neuro-jena.github.io/cat)
55
with the longitudinal pipeline approach.
Each processed T1w image represents a snapshot of brain structure on
each test day. Next, SVD analysis was used to extract VSTPs and CSTPs.
SVD decomposed the images into spatiotemporal components, reflect-
ing patterns of brain structure over time. To capture shared spatial
patterns across individuals, data from all cycles (typical, 28andMe
(typical), endometriosis and OC cycle) were concatenated.
In SVD, eigenvalues represent the variance explained by each prin-
cipal component, while eigenvectors represent the temporal patterns.
Warm colors in the spatial components denote positive associations
with the eigenvectors of the temporal component, indicating that these
regions increase as the corresponding temporal pattern increases. Cool
colors signify negative associations, meaning these regions decrease
as the temporal pattern increases. These patterns are referred to as
‘spatiotemporal patterns’. It is important to note that the values derived
from the SVD (eigenvalues and eigenvectors) are arbitrary in mag-
nitude, meaning they lack an inherent unit of measurement but are
used to identify patterns of association. A schematic illustration of the
workflow is shown in Fig. 2.
Volumetric dynamics. In the volumetric analysis (Fig. 3a), VSTP1
explained 47.7% of the variance, with the most substantial clusters
spanning the gray matter of the cerebellum, precuneus, middle fron-
tal gyrus, lingual gyrus, angular gyrus and temporal gyrus. VSTP2
explained 20.4% of the variance, with the most substantial clusters
overlapping with the gray matter of the cerebellum, thalamus, tem-
poral gyrus, precentral gyrus and gyrus rectus. VSTP3 explained 9.7%
of the variance, with the most substantial clusters located in the gray
matter of the cerebellum, superior and middle frontal gyrus, sup-
plementary motor cortex, precuneus, precentral gyrus and thalamus
(Supplementary Table 1). All other VSTPs explained less than 10% of
the variance and were excluded from further analyses.
Generalized additive models (GAMs) were used to analyze changes
in the extracted spatiotemporal patterns across the monthly period.
This choice was motivated by its ability to capture potential nonlinear
trends, including curvature and variations in change rates, that are
often present in the longitudinal data. VSTP1, VSTP2 and VSTP3 were
found to significantly fluctuate across all four participants (Fig. 4 and
Supplementary Table 2).
Hormonal associations with volumetric dynamics. To assess whether
the short-term VSTPs were driven by fluctuations in gonadal hormones,
time-series regression analyses were used. Serum estradiol levels,
progesterone levels and the progesterone-to-estradiol ratio were
separately specified as independent variables for each individual and
spatiotemporal pattern. Because not all variables were normally dis-
tributed, relationships were further modeled using nonparametric
functional Spearman rank correlation. Results were highly consistent
across both approaches.
In the typical cycle, both progesterone levels (β = 0.021,
PFDR = 0.010) and the progesterone-to-estradiol ratio (β = 0.015,
PFDR = 0.007) were significantly associated with VSTP1, with cor-
responding significant Spearman correlations (progesterone,
ρ = 0.642, PFDR = 0.005; progesterone-to-estradiol ratio, ρ = 0.587,
P
FDR
= 0.011). Similarly, for the 28andMe (typical) cycle, progester-
one levels (β = 0.017, P
FDR
< 0.001) and the progesterone-to-estradiol
ratio (β = 0.011, P
FDR
< 0.001) showed positive associations with VSTP1,
again with corresponding significant Spearman correlations (pro-
gesterone, ρ = 0.586, P
FDR
= 0.002; progesterone-to-estradiol ratio,
ρ = 0.693, P
FDR
< 0.001). Additionally, progesterone levels (β = −0.044,
PFDR < 0.001) and the progesterone-to-estradiol ratio (β = −0.025,
PFDR < 0.001) were significantly negatively associated with VSTP2
(PFDR < 0.001), supported by corresponding negative Spearman correla-
tions (progesterone, ρ = −0.631, PFDR < 0.001; progesterone-to-estradiol
ratio, ρ = −0.592, PFDR = 0.002). Estradiol levels were significantly
associated with VSTP3 only in the 28andMe (typical) cycle (β = 0.003,
P
FDR
< 0.044), supported by a corresponding Spearman correlation
(ρ = 0.571, PFDR = 0.002).
In the endometriosis cycle, estradiol levels were significantly
associated with VSTP1 (β = 0.006, PFDR = 0.010), with a corresponding
significant Spearman correlation (ρ = 0.571, P
FDR
= 0.037). No signifi-
cant relationships were observed for VSTP2 or VSTP3. Similarly, in the
OC cycle, estradiol levels showed a significant association with VSTP1
(β = 0.006, PFDR = 0.023). Additionally, the progesterone-to-estradiol
ratio was significantly negatively associated with VSTP1 (β = −0.037,
P
FDR
= 0.046) and VSTP2 (β = −0.021, P
FDR
= 0.046). However, Spearman
correlations in the OC cycle did not remain significant after false discov-
ery rate (FDR) correction. No significant associations were observed
for VSTP3. Progesterone levels did not exhibit significant associations
in either the endometriosis or the OC cycle (Fig. 4). All results are dis-
played in Supplementary Table 3.
Cortical thickness dynamics. In the cortical thickness analysis
(Fig. 3b), CSTP1 explained 39.0% of the variance, with the largest
clusters spanning the insula, precentral gyrus and superior tem-
poral gyrus. CSTP2 explained 9.8% of the variance, with the largest
clusters spanning the insula, lingual gyrus, lateral occipital lobe,
pericalcarine gyrus, parahippocampal gyrus and fusiform gyrus
(Supplementary Table 4). All other CSTPs explained less than 10% of
the variance and were excluded from further analyses. GAMs revealed

Nature Neuroscience | Volume 28 | December 2025 | 2588–2600 2592
Article https://doi.org/10.1038/s41593-025-02066-2
Test day 1
Test day 2
Test day ...
Test day 25
Data assessment
SVD
Volumetric spatial component
Cortical thickness spatial component Cortical thickness temporal component
Volumetric temporal component
5
10
15
20
25
1
–4
–2
0
2
4
Test day
Standardized eigenvectors
5
10
15
20
25
1
–4
–2
0
2
4
Test day
Standardized eigenvectors
Preprocessing with CAT12
Individual
T1w
scan
Tissue
segmen
tation
-Spatial
registration
Surface
creation
Surface
registration
Spatially
registered
surface
maps
Surface
templates
Spatially
registered
volumetric
maps
TPM Volume
templates
Volume
atlases
Mean
volume for
each region
of interest
Fig. 2 | Schematic illustration of data assessment, processing workflow and
data reduction. T1w images were assessed over a 4–5-week period for each
participant. Images were then preprocessed using the longitudinal pipeline
approach in CAT12. Next, SVD was applied to decompose the preprocessed
images into spatial and temporal components. Spatial components represent
changes in brain volumes and cortical thickness across different regions, while
temporal components reflect how these spatial components evolve over time.
Warm and cool colors in the spatial component represent positive (warm
colors) and negative (cool colors) associations between spatial components and
temporal patterns. This suggests that regions marked in warm colors increase as
the associated temporal pattern increases, while those in cool colors decrease.
Note that the spatial and temporal components shown are examples and do not
represent actual results. Graphs were created with GraphPad Prism (version 10).
SVD, singular value decomposition; TPM, tissue probability maps.

Nature Neuroscience | Volume 28 | December 2025 | 2588–2600 2593
Article https://doi.org/10.1038/s41593-025-02066-2
that CSTP2 exhibited substantial fluctuations only in the 28andMe
(typical) cycle (Supplementary Table 5), and no significant fluctuations
were observed in CSTP1 in any participant.
Hormonal associations with cortical thickness dynamics. Proges-
terone levels and the progesterone-to-estradiol ratio were significantly
associated with CSPT2 in the 28andMe (typical) cycle only (progester-
one, β = 0.042, P
FDR
< 0.001; progesterone-to-estradiol ratio, β = 0.023,
P
FDR
< 0.001), supported by corresponding Spearman correlations
(progesterone, ρ = 0.593, PFDR = 0.002; progesterone-to-estradiol ratio,
ρ = 0.612, P
FDR
= 0.002). No significant associations were observed
between other predictors and CSTP1 or CSTP2 in any of the remaining
cycles. All results are displayed in Fig. 5 and Supplementary Table 6.
Complementary voxel-wise and vertex-wise analyses
To directly link hormonal fluctuations to structural brain measures,
complementary voxel-wise and vertex-wise analyses were conducted
as a sensitivity check. To confirm the hormone–SVD associations, we
repeated the analyses at the voxel level (for volume) and the vertex
level (for thickness) to assess whether similar spatial patterns of asso-
ciations emerged.
Voxel-wise analyses revealed widespread positive associations
between brain volume and hormonal concentrations of estradiol, pro-
gesterone and the progesterone-to-estradiol ratio across all individuals
(Fig. 6a). These associations overlapped to some extent with the spatial
patterns observed in the SVD analyses. Contrasted analyses indicated
that the endometriosis and OC cycles predominantly drove the associa-
tions with estradiol levels, while associations with progesterone levels
were primarily influenced by the typical and 28andMe (typical) cycles
(Fig. 6b). Estradiol levels were mainly positively associated with the
cingulate gyrus, frontal gyrus, orbital gyrus, precentral gyrus, superior
temporal gyrus and supramarginal gyrus. Progesterone levels and the
progesterone-to-estradiol ratio were positively associated with the
cerebellum, cuneus, inferior temporal, postcentral and superior pari-
etal gyrus. Regions that were positively associated with both estradiol
levels and progesterone levels, as well as the progesterone-to-estradiol
ratio, were the precuneus and angular gyrus (Supplementary Table 7).
Negative associations were primarily observed in the OC cycle for the
progesterone-to-estradiol ratio (Supplementary Table 8).
Vertex-wise analyses revealed only a few associations between
cortical thickness and hormone concentrations. Significant positive
associations were observed between the progesterone-to-estradiol
ratio and cortical thickness of the parahippocampal and lateral occipi-
tal gyrus across all individuals (Fig. 7a). No significant associations were
found with estradiol and progesterone levels. Contrasted analyses
revealed significant positive associations between estradiol levels
and cortical thickness of the postcentral, superior parietal, precen-
tral and superior frontal gyrus in the endometriosis cycle only. The
progesterone-to-estradiol ratio was associated with cortical thickness
of the parahippocampal, lingual, lateral occipital, pericalcarine gyrus
and cuneus only in the 28andMe (typical) cycle (Fig. 7b). No other sig-
nificant associations were observed (Supplementary Table 9).
Comparison to a male participant
We repeated all analyses in a male participant where no specific
gonadal hormone patterns were expected. The male participant was
scanned over a comparable 5-week period, resulting in 25 test sessions
(Extended Data Fig. 2a). Hormone concentrations were generally low
(estradiol—M = 128.7 pmol l
−1
, s.d. = 17.3 pmol l
−1
, range = 98.0–161.0
pmol l−1; progesterone—M = 0.863 nmol l−1, s.d. = 0.582 nmol l−1,
range = 0.329–3.420 nmol l−1; ratio—M = 6.921, s.d. = 5.049, range =
2.35–28.74; Extended Data Fig. 2b).
VSTP analyses revealed that VSTP1 explained 58.0% of the variance,
VSTP2 explained 19.3% of the variance and VSTP3 explained 12.9% of
the variance (Extended Data Fig. 3). CSTP analyses revealed that CSTP1
explained 40.2% of the variance, CSTP2 explained 14.2% of the variance
and CSTP3 explained 11.3% of the variance (Extended Data Fig. 4). All
other volumetric and CSTPs explained less than 10% of the variance
and were excluded from further analyses.
While VSTP1–VSTP3 significantly changed across the 5-week period
(Supplementary Table 10), no associations were found with either
estradiol levels, progesterone levels or the progesterone-to-estradiol
aVolumetric spatial pattern 1
(n = 4)
Volumetric spatial pattern 2
(n = 4)
47.7% explained variance 20.4% explained variance 9.7% explained variance
Volumetric spatial pattern 3
(n = 4)
bCortical thickness spatial pattern 1
(n = 4)
Cortical thickness spatial pattern 2
(n = 4)
0.1
–0.1 39.0% explained variance 9.8% explained variance
0.1
–0.1
Fig. 3 | Volumetric and cortical thickness spatial patterns that explained
at least 10% of the variance across the female participants (n = 4). a, The
spatial patterns illustrate the volumetric patterns of involved brain regions that
change over time across the female participants (n = 4; the endometriosis, oral
contraceptives (OC), typical and 28andMe (typical) cycle). b, The spatial patterns
illustrate the cortical thickness patterns of involved brain regions that change
over time across the female participants (n = 4; the endometriosis, OC, typical
and 28andMe (typical) cycle). For a and b, volumetric and cortical thickness
spatial patterns were derived using SVD. Spatial weights were thresholded,
retaining only values within the ranges of −0.1 to −0.01 and 0.01 to 0.1, while
excluding values between −0.01 and 0.01 that indicate minimal contribution to
the respective spatial pattern (color bar).

Nature Neuroscience | Volume 28 | December 2025 | 2588–2600 2594
Article https://doi.org/10.1038/s41593-025-02066-2
ratio (Supplementary Table 11). CSTP1–CSTP3 did not show signifi-
cant changes across the 5-week period and were not associated with
hormone concentrations (Supplementary Tables 10–11). Likewise, the
voxel-wise and vertex-wise analyses revealed no significant associations
with hormone concentrations (Extended Data Fig. 5).
Discussion
Despite growing interest in the associations between gonadal hor-
mones and fluctuations in brain structure, whole-brain approaches
with broader spatiotemporal resolution are scarce. Such analyses
provide insights into how the brain operates synchronously over
time. Moreover, investigations into hormone–brain interactions in
nontypical cycles—such as those in endometriosis or hormonal contra-
ceptive use—remain understudied. In the present study, we leveraged
data from four densely sampled females—two with typical cycles, one
with endometriosis and one using OC—and one male, each of whom
underwent routine neuroimaging and venipuncture over a monthly
period. Using a whole-brain SVD analytical approach, we explored
brain structural dynamics across these diverse hormonal conditions.
The corresponding datasets are openly available, providing a resource
for future investigations into brain plasticity across menstrual cycles
and beyond.
While previous precision imaging studies have focused on
region-specific analyses
40,41
, here we extend this work by examining
whole-brain structural dynamics across the menstrual cycle. Results
revealed VSTPs that exhibited substantial variations in all four female
individuals across the monthly period. These fluctuations were wide-
spread and distributed across the entire brain. Notably, while these
patterns were observed in all four female individuals, the nature
and dynamics of how these widespread patterns fluctuated over the
0.1
–0.1
0.1
–0.1
0.1
–0.1
aVSTP1
bVSTP2
cVSTP3
Endometriosis cycle (n = 1) OC cycle (n = 1) Typical cycle (n = 1) 28andMe (typical) cycle (n = 1)
*
*
*
1 (15)
5 (19)
10 (26)
15 (4)
20 (15)
25 (20)
0
2
4
OvulationMensesOvulation
*
*
1 (21)
5 (25)
10 (30)
15 (4)
20 (9)
25 (14)
30 (19)
OvulationMenses
OvulationMensesOvulationOvulationMenses
*
*
*
OvulationMensesOvulationOvulationMenses
*
Standardized estradiol levels
Standardized progesterone levels
Standardized progesterone-to-estradiol ratio
*
*
*
Significant regression with estradiol
Significant regression with progesterone
Significant regression with progesterone-to-estradiol ratio
Standardized eigenvectors (temporal pattern)
1 (16)
5 (20)
10 (27)
15 (7)
20 (13)
25 (18)
Inactive
Inactive
Inactive
1 (2)
5 (6)
10 (13)
15 (21)
20 (3)
25 (10)
–4
–2
0
2
4
Standardized eigenvectors
Standardized hormones
OvulationMensesMenses
Test day (cycle day) Test day (cycle day) Test day (cycle day) Test day (cycle day)
1 (15)
5 (19)
10 (26)
15 (4)
20 (15)
25 (20)
1 (21)
5 (25)
10 (30)
15 (4)
20 (9)
25 (14)
30 (19)
1 (16)
5 (20)
10 (27)
15 (7)
20 (13)
25 (18)
1 (2)
5 (6)
10 (13)
15 (21)
20 (3)
25 (10)
Test day (cycle day) Test day (cycle day) Test day (cycle day) Test day (cycle day)
1 (15)
5 (19)
10 (26)
15 (4)
20 (15)
25 (20)
1 (21)
5 (25)
10 (30)
15 (4)
20 (9)
25 (14)
30 (19)
1 (16)
5 (20)
10 (27)
15 (7)
20 (13)
25 (18)
1 (2)
5 (6)
10 (13)
15 (21)
20 (3)
25 (10)
Test day (cycle day) Test day (cycle day) Test day (cycle day) Test day (cycle day)
–4
–2
0
2
4
Standardized eigenvectors
Standardized hormones
OvulationMensesMenses
–4
–2
0
2
4
*
*
Standardized eigenvectors
Standardized hormones
OvulationMensesMenses
Fig. 4 | VSTPs across the different female cycles (n = 4). This figure depicts
VSTPs across the endometriosis cycle, the oral contraceptives (OC) cycle, the
typical cycle and the 28andMe (typical) cycle. a, VSTP1 shows spatial distribution
of brain regions involved in component 1 (left) and the associated temporal
dynamics (right). Warm colors in the spatial map indicate regions with positive
associations to the temporal pattern (indicating regional volume increases as
the temporal pattern increases). Cool colors in the spatial map indicate negative
associations to the temporal pattern (reflecting regional volume decreases as
the temporal pattern increases). b, VSTP2 shows spatial distribution of brain
regions involved in component 2 (left) and the associated temporal dynamics
(right). Warm colors in the spatial map indicate regions with positive associations
to the temporal pattern (indicating regional volume increases as the temporal
pattern increases). Cool colors in the spatial map indicate negative associations
to the temporal pattern (reflecting regional volume decreases as the temporal
pattern increases). c, VSTP3 shows spatial distribution of brain regions involved
in component 3 (left) and the associated temporal dynamics (right). Warm colors
in the spatial map indicate regions with positive associations to the temporal
pattern (indicating regional volume increases as the temporal pattern increases).
Cool colors in the spatial map indicate negative associations to the temporal
pattern (reflecting regional volume decreases as the temporal pattern increases).
For a–c, volumetric and cortical thickness spatial patterns were derived using
SVD. Spatial weights were thresholded, retaining only values within the ranges of
−0.1 to −0.01 and 0.01 to 0.1, while excluding values between −0.01 and 0.01 that
indicate minimal contribution to the respective spatial pattern (color bar). Solid
black lines represent standardized eigenvectors (temporal pattern); dashed
colored lines represent square-rooted and standardized hormonal values; gray
shading indicates menses in typical cycles and the endometriosis cycle, and
inactive pill phase in the OC cycle; dashed lines indicate ovulation. Asterisks
indicate significant time-series regressions between hormone levels and the
spatiotemporal patterns after FDR correction for multiple comparisons was
performed. For exact P values, see main text. Plots were created with GraphPad
Prism (version 10). VSTPs, volumetric spatiotemporal patterns.

Nature Neuroscience | Volume 28 | December 2025 | 2588–2600 2595
Article https://doi.org/10.1038/s41593-025-02066-2
monthly period were unique to each individual. Interestingly, the tem-
poral dynamics of the volumetric spatial pattern explaining the most
variance were most similar in the endometriosis and OC cycle, which
are both characterized by a hormonal milieu dominated by estradiol.
In contrast, individuals with typical cycles exhibited more similar
temporal dynamics of the volumetric spatial pattern, which explained
the most variance, reflecting the cyclical interplay between progester-
one and estradiol. Notably, the hormonal correlates of this dominant
pattern differed by cycle type—estradiol in the endometriosis and OC
cycle, and progesterone in the typical cycles. The association of this
pattern with gonadal hormones across all cycles supports the notion
that while hormones do have a role in shaping cyclical brain dynam-
ics, not all structural variation across the cycle is hormone-driven and
acknowledges the multidimensional nature of brain plasticity.
CSTPs, however, did not fluctuate across individuals, with the
exception of the 28andMe (typical) cycle. Cortical thickness analyses
inherently exclude the cerebellum and subcortical structures, which
have been shown to substantially contribute to the whole-brain SVD
patterns observed in volumetric analyses. The cerebellum, as well as
subcortical structures, are known to contain sex steroid receptors4,5,
which may make them particularly sensitive to hormonal fluctuations.
The exclusion of these structures in cortical thickness analyses may
partly explain why, at the whole-brain level, CSTPs did not exhibit
fluctuations across the cycle or show associations with sex steroid
hormones. Another explanation for the absence of fluctuations and
associations in the cortical thickness measures may lie in the underlying
biophysical properties that drive both volumetric and cortical thick-
ness signals. For example, the presence of greater changes observable
in gray matter volume could reflect a contribution of changes in water
content across the menstrual cycle rather than changes in neuronal and
glial structures within the gray matter. While volumetric and cortical
thickness estimates are both derived from T1w magnetic resonance
imaging (MRI) data, water content variations are more likely to affect
volumetric measures due to shifts in extracellular fluid dynamics, which
may be influenced by hormonal changes
56–58
, than cortical thickness
measures, which are less sensitive to such transient changes59.
Preclinical literature indicates that progesterone exerts an inhibi-
tory effect on proliferative actions of estradiol5. For example, ani-
mal studies have shown that estradiol enhances the excitability of
fast-spiking interneurons in deep cortical layers60 and increases syn-
apse formation in the prefrontal cortex8. However, concurrent cyclic
administration of progesterone attenuates this increase in spine den-
sity when paired with estradiol61. Additionally, progesterone exhibits
a similar inhibitory effect on dendritic spines in the hippocampus10. In
line with these findings, our study suggests that individuals with typi-
cal menstrual cycles exhibit a heightened sensitivity to progesterone.
We observed fluctuations in brain volumes over the monthly period
in both typical cycles and in the case of hormonal dysregulation, with
progesterone exerting a more pronounced influence on structural
brain dynamics in typical cycles. These findings are consistent with
previous research using the 28andMe dataset, revealing substantial
associations between progesterone and the medial temporal lobe.
aCSTP1
bCSTP2
Endometriosis cycle (n = 1) OC cycle (n = 1) Typical cycle (n = 1) 28andme (typical) cycle (n = 1)
-4
-2
0
2
4
Ovulation Menses Ovulation
-4
-2
0
2
4
Ovulation Menses Ovulation
-4
-2
0
2
4
OvulationMenses
-4
-2
0
2
4
OvulationMenses
*
*
Standardized estradiol levels
Standardized progesterone levels
Standardized progesterone-to-estradiol ratio *
*
Significant regression with progesterone
Significant regression with progesterone-to-estradiol ratio
Standardized eigenvectors (temporal pattern)
-2
0
2
4Inactive
-4
-2
0
2
4
Inactive
–4
–2
0
2
4
Standardized eigenvectors
Standardized hormones
OvulationMenses Menses
–4
–2
0
2
4
Standardized eigenvectors
Standardized hormones
OvulationMenses Menses
1 (15)
5 (19)
10 (26)
15 (4)
20 (15)
25 (20)
1 (21)
5 (25)
10 (30)
15 (4)
20 (9)
25 (14)
30 (19)
1 (16)
5 (20)
10 (27)
15 (7)
20 (13)
25 (18)
1 (2)
5 (6)
10 (13)
15 (21)
20 (3)
25 (10)
Test day (cycle day) Test day (cycle day) Test day (cycle day) Test day (cycle day)
1 (15)
5 (19)
10 (26)
15 (4)
20 (15)
25 (20)
1 (21)
5 (25)
10 (30)
15 (4)
20 (9)
25 (14)
30 (19)
1 (16)
5 (20)
10 (27)
15 (7)
20 (13)
25 (18)
1 (2)
5 (6)
10 (13)
15 (21)
20 (3)
25 (10)
Test day (cycle day) Test day (cycle day) Test day (cycle day) Test day (cycle day)
0.1
–0.1
0.1
–0.1
Fig. 5 | CSTPs across the different female cycles (n = 4). This figure depicts
CSTPs across the endometriosis cycle, the OC cycle, the typical cycle and the
28andMe (typical) cycle. a, CSTP1 shows spatial distribution of brain regions
involved in component 1 (left) and the associated temporal dynamics (right).
Warm colors in the spatial map indicate regions with positive associations to
the temporal pattern (indicating regional cortical thickness increases as the
temporal pattern increases). Cool colors in the spatial map indicate negative
associations to the temporal pattern (reflecting regional cortical thickness
decreases as the temporal pattern increases). b, CSTP2 shows spatial distribution
of brain regions involved in component 2 (left) and the associated temporal
dynamics (right). Warm colors in the spatial map indicate regions with positive
associations to the temporal pattern (indicating regional cortical thickness
increases as the temporal pattern increases). Cool colors in the spatial map
indicate negative associations to the temporal pattern (reflecting regional
cortical thickness decreases as the temporal pattern increases). For a and b,
volumetric and cortical thickness spatial patterns were derived using SVD.
Spatial weights were thresholded, retaining only values within the ranges of
−0.1 to −0.01 and 0.01 to 0.1, while excluding values between −0.01 and 0.01 that
indicate minimal contribution to the respective spatial pattern (color bar). Solid
black lines represent standardized eigenvectors (temporal pattern); dashed
colored lines represent square-rooted and standardized hormonal values; gray
shading indicates menses in typical cycles and the endometriosis cycle, and
inactive pill phase in the OC cycle; dashed lines indicate ovulation. Asterisks
indicate significant time-series regressions between hormone levels and the
spatiotemporal patterns after FDR correction for multiple comparisons was
performed. For exact P values, see main text. Plots were created with GraphPad
Prism (version 10). CSTPs, cortical thickness spatiotemporal patterns.

Nature Neuroscience | Volume 28 | December 2025 | 2588–2600 2596
Article https://doi.org/10.1038/s41593-025-02066-2
These associations were abolished when progesterone was selectively
suppressed and estradiol dominated40. In contrast, when estradiol is
the dominating hormone throughout the cycle, as observed in endome-
triosis, it appears to exert a greater impact on structural brain dynam-
ics, potentially exerting its proliferative actions. Our findings align
with previous literature48–50,52, indicating elevated estradiol levels
and estradiol dominance in the luteal phase of the menstrual cycle
in endometriosis, suggesting a greater exposure of estradiol on the
brain. Additionally, our results in the female using OC, providing an
additional dataset with a hormonal milieu similar to the endometrio-
sis cycle, further underscore the influence of estradiol dominance on
brain structure. Voxel-wise analyses further supported these associa-
tions. While implicated regions varied between individuals, the most
consistent finding, across both voxel-wise and SVD analyses, was that
progesterone was the primary correlate of brain volume changes in
the typical cycles, whereas estradiol was the primary correlate in the
endometriosis and OC cycle.
Estrogen is believed to have a neuroprotective role, promoting
brain health and protecting against cognitive decline
62–64
. However,
while estradiol levels within the physiological range stimulate brain
activity, especially in the hippocampus, supraphysiological levels of
estradiol (equivalent to those during early pregnancy) exhibit opposite
effects
65
. Interestingly, unopposed estrogen during hormone replace-
ment therapy in menopause enhances activation of fronto-cingulate
regions during cognitive functioning tasks66. This highlights the spe-
cific impact of elevated estrogen levels, unbalanced by other hor-
mones, on brain activity and cognition. Little is known about the impact
of prolonged high estradiol exposure during the reproductive years
on long-term health outcomes. This underscores the importance of
further research to elucidate the longitudinal relationships among
Estradiol
28andMe (typical) cycle (n = 1)Typical cycle (n = 1)Endometriosis cycle (n = 1) OC cycle (n = 1)
Progesterone
Ratio
RatioEstradiol Progesterone
a
b
0.0001
P value
0.01 0.0001
0.01
(n = 4) (n = 4) (n = 4)
Fig. 6 | Significant voxels associated with hormone concentrations in the
female participants (n = 4). a, The significant voxel-wise associations across all
four cycles (n = 4; endometriosis cycle, oral contraceptives (OC) cycle, typical
cycle and 28andMe (typical) cycle). b, The presentation of the significant voxels
for each cycle separately (endometriosis cycle, n = 1; OC cycle, n = 1; typical
cycle, n = 1; and 28andMe (typical) cycle, n = 1). For a and b, GLMs were used
for vertex-wise analysis with the TFCE method that controls for multiple
comparisons by applying an FWE correction. Hormone concentrations were
square-rooted. Positive associations are displayed in red, negative associations
are displayed in blue, with P values ranging from 0.01 to 0.0001 (color bar).
GLMs, general linear models; TFCE, threshold-free cluster enhancement;
FWE, family-wise error; Ratio, progesterone-to-estradiol ratio.

Nature Neuroscience | Volume 28 | December 2025 | 2588–2600 2597
Article https://doi.org/10.1038/s41593-025-02066-2
gonadal hormones, reproductive health and long-term well-being in
individuals with hormonal dysregulations.
To further contextualize our findings, we expanded the scope of
our study by including additional analyses of one male over a densely
sampled 5-week period. While VSTPs fluctuated over the 5-week period,
these changes were not associated with hormone concentrations.
This is not surprising given that the substantially reduced magnitude
of hormonal fluctuations in the male participant compared to what is
observed and characteristic of a menstrual cycle. It also suggests that
the observed spatiotemporal fluctuations may not be detectably driven
by those hormones but could be influenced by factors not accounted
for in this investigation, such as intake of water, or cerebral blood flow.
Furthermore, these results may indicate the presence of different
regulatory mechanisms or hormonal thresholds in males compared to
females. However, this requires further investigation in future studies
that explore diurnal changes or manipulate hormones in males. Such
studies can provide clearer insights into sex and sex-hormone differ-
ences as most recently demonstrated67. Furthermore, the absence of
substantial hormone–brain associations in the male participant sug-
gests that the associations observed in female participants are likely
driven by cyclical variations in gonadal hormones rather than general
intersession variability and underscores the importance of studying
female-specific endocrinological influences on brain structure. This
area of research has historically been underrepresented in the field
of neuroscience.
The study has several limitations. First, because these are
dense-sampling datasets with a limited sample size, caution is advised
when generalizing the findings to the broader population. By focusing
on individual participants, we aimed to mitigate the intra-individual
variability of hormonal and brain structural fluctuations, thereby pro-
viding clearer insight into personalized spatiotemporal patterns that
are often obscured in studies with larger samples. Our approach pro-
vides a more precise examination of the specific patterns of brain struc-
ture and hormonal fluctuations at an individual level, offering a higher
level of sensitivity and temporal resolution toward precision imaging.
Second, this study applied a model-free whole-brain approach. Using
SVD represents a new method for exploring short-term structural brain
changes across the menstrual cycle. This approach helps to identify
unique spatiotemporal profiles, thereby potentially mechanistic prin-
ciples underlying structural brain changes throughout the menstrual
cycle. The data-driven nature of our approach contrasts with the more
common hypothesis-driven studies that focus on predefined regions
of interest. While our model-free strategy allows for the discovery of
hormone–brain associations in less commonly studied areas, it did not
identify particular regions consistently across individuals to target in
future research. Instead, it highlights that the entire brain undergoes
EstradiolProgesteroneRatio
28andMe (typical) cycle (n = 1)Typical cycle (n = 1)Endometriosis cycle (n = 1) OC cycle (n = 1)
RatioEstradiol Progesterone
a
b
0.01
P value
0.001 0.0001
(n = 4) (n = 4)(n = 4)
Fig. 7 | Significant vertices associated with hormone concentrations in the
female participants (n = 4). a, The significant vertex-wise associations across
all four cycles (n = 4; endometriosis cycle, oral contraceptives (OC) cycle, typical
cycle and 28andMe (typical) cycle). b, The presentation of the significant vertices
for each cycle separately (endometriosis cycle, n = 1; OC cycle, n = 1; typical cycle,
n = 1; and 28andMe (typical) cycle, n = 1). For a and b, GLMs were used for vertex-
wise analysis with the TFCE method that controls for multiple comparisons by
applying an FWE correction. Hormone concentrations were square-rooted. Only
positive associations were observed, with P values ranging from 0.01 to 0.0001
(color bar). Ratio, progesterone-to-estradiol ratio.
Nature Neuroscience | Volume 28 | December 2025 | 2588–2600 2598
Article https://doi.org/10.1038/s41593-025-02066-2
individual structural changes across menstrual cycles, changes that are
partly driven by gonadal hormones. However, all imaging data used in
these analyses will be made openly available upon publication, allowing
for targeted follow-up analyses using regions of interest or established
network templates. Third, we identified unique temporal patterns
in each participant, precluding direct comparisons between them.
Moreover, variations in sampling strategies were observed among par-
ticipants. While the 28andMe (typical) cycle was sampled daily for four
consecutive weeks, scanning in the typical, the endometriosis and the
OC cycle occurred primarily on weekdays for five consecutive weeks.
For instance, the longest scanning gap in the typical cycle spanned 4
days. These differences might explain why weaker associations were
observed in the typical cycle and stronger associations in the 28andMe
(typical) cycle. Variations in scanning schedules and differences in par-
ticipants’ age and factors such as nicotine use in one participant may
contribute to divergent temporal patterns that should not be directly
compared. For instance, nicotine acutely inhibits aromatase in the
thalamus in healthy females, thereby it blocks the local synthesis of
estrogen from androgen precursors68. Notably, the finding that estra-
diol levels were associated with brain volume in estradiol-dominant
cycles and progesterone levels in progesterone-dominant cycles was
more consistent than the specific regions implicated, suggesting robust
yet individualized brain–hormone coupling. These results underscore
the need to focus on personalized spatiotemporal patterns in both
brain structure and hormonal levels. Menstrual cycle dynamics and
other intra-individual factors that influence our measures of interest
are inherently variable within-person69. Thus, while there is some con-
sistency across individuals and cycles in the dominant spatiotemporal
pattern and the voxel-wise analysis (precision), hormone–brain associa-
tions remain noisy and difficult to replicate across individuals. Fourth,
our study revealed dynamic brain changes not only in females but also
in a male participant. In females, these changes were associated with
fluctuations in estradiol and progesterone levels, but the mechanisms
driving similar changes in males remain unclear. Finally, we compared
gonadal hormone levels among the four participants, but different
steroid analyses were used in the typical, the endometriosis and the OC
cycle compared to the 28andMe (typical) cycle. Hormones were identi-
fied through immunoassay (IAs) in the typical, endometriosis and the
OC cycle, while, in the 28andMe (typical) cycle, hormones were iden-
tified through liquid chromatography–mass spectrometry (LC–MS).
While IAs offer a higher sample turnover, they are limited in trueness,
precision and sensitivity. In contrast, LC–MS has been demonstrated
to deliver better sensitivity and specificity. However, good overall
method agreement was found for estradiol and progesterone70,71. Future
studies should consider using consistent steroid analyses to ensure
comparability, or harmonization methods should be developed to
enable the integration of hormone assessments, allowing the pooling
of data from multiple research sites to increase power, reproducibility
and generalizability72.
Further research using whole-brain approaches and spatiotem-
poral patterns with larger and more diverse samples is necessary to
validate and expand these initial findings. Future research should
address potential interindividual variations and strive to enhance the
generalizability of the observed associations. Despite the small sample
size, our findings provide valuable initial insights into the dynamic
impact of hormonal fluctuations on whole-brain structural plasticity
throughout the menstrual cycle and under conditions of nontypical
hormonal regulation. While specific regional changes were not the
focus of this study, the consistent spatial maps and unique temporal
patterns emphasize a widespread, coordinated influence of hormonal
changes on brain structure. From a translational perspective, our
findings hold important implications for the interpretation of animal
studies on hormone–brain interactions. While animal models pro-
vide valuable insights into cellular and molecular mechanisms, our
results emphasize that hormone-driven volumetric changes in humans
are not confined to limbic structures, such as the hippocampus, but
extend to widespread cortical and cerebellar regions. Future studies
should aim to integrate methodologies that allow for cross-species
comparisons, ensuring that findings from animal models align with
the distributed brain networks implicated in human neuroendocrine
dynamics. Furthermore, animal models of hormone–brain interactions
often focus on acute manipulations of estradiol or progesterone. Yet,
our data emphasize the importance of naturally occurring hormone
fluctuations and their interaction over time. Given the distinct patterns
observed in cycles with estradiol dominance versus typical cycles,
future animal studies should consider the broader hormonal milieu
rather than focusing on individual hormones in isolation.
In summary, our study lays the groundwork for a future in per-
sonalized and precision medicine, offering initial insights into how
distinct hormonal milieus—such as the interplay between estradiol
and progesterone levels in typical cycles or estradiol dominance in
endometriosis—affect brain structure. Rather than identifying brain
regions universally linked to specific hormones, our results under
-
score that hormone–brain associations vary across individuals and are
milieu-dependent. These associations appear to be influenced by the
presence or the absence of natural hormonal fluctuations, emphasiz-
ing the importance of within-person designs to capture the dynamic
nature of hormone-related brain plasticity.
Online content
Any methods, additional references, Nature Portfolio reporting sum-
maries, source data, extended data, supplementary information,
acknowledgements, peer review information; details of author contri-
butions and competing interests; and statements of data and code avail-
ability are available at https://doi.org/10.1038/s41593-025-02066-2.
References
1. Fehring, R. J., Schneider, M. & Raviele, K. Variability in the phases
of the menstrual cycle. J. Obstet. Gynecol. Neonatal Nurs. 35,
376–384 (2006).
2. Roos, J. et al. Monitoring the menstrual cycle: comparison of
urinary and serum reproductive hormones referenced to true
ovulation. Eur. J. Contracept. Reprod. Health Care 20, 438–450
(2015).
3. Abraham, G. E., Odell, W. D., Swerdlo, R. S. & Hopper, K.
Simultaneous radioimmunoassay of plasma FSH, LH,
progesterone, 17-hydroxyprogesterone, and estradiol-17β during
the menstrual cycle. J. Clin. Endocrinol. Metab. 34, 312–318 (1972).
4. Österlund, M. K., Gustafsson, J. Å., Keller, E. & Hurd, Y. L. Estrogen
receptor β (ERβ) messenger ribonucleic acid (mRNA) expression
within the human forebrain: distinct distribution pattern to ERα
mRNA. J. Clin. Endocrinol. Metab. 85, 3840–3846 (2000).
5. Brinton, R. D. et al. Progesterone receptors: form and function in
brain. Front. Neuroendocrinol. 29, 313 (2008).
6. Woolley, C. S., Gould, E., Frankfurt, M. & McEwen, B. S. Naturally
occurring luctuation in dendritic spine density on adult
hippocampal pyramidal neurons. J. Neurosci. 10, 4035–4039
(1990).
7. Haraguchi, S. et al. Estradiol promotes Purkinje dendritic growth,
spinogenesis, and synaptogenesis during neonatal life by
inducing the expression of BDNF. Cerebellum 11, 416–417 (2012).
8. Hara, Y., Waters, E. M., McEwen, B. S. & Morrison, J. H. Estrogen
eects on cognitive and synaptic health over the lifecourse.
Physiol. Rev. 95, 785–807 (2015).
9. Tsutsui, K. Progesterone biosynthesis and action in the
developing neuron. Endocrinology 149, 2757–2761 (2008).
10. Woolley, C. S. & McEwen, B. S. Roles of estradiol and
progesterone in regulation of hippocampal dendritic spine
density during the estrous cycle in the rat. J. Comp. Neurol. 336,
293–306 (1993).
Nature Neuroscience | Volume 28 | December 2025 | 2588–2600 2599
Article https://doi.org/10.1038/s41593-025-02066-2
11. Galea, L. A. M., Frick, K. M., Hampson, E., Sohrabji, F. & Choleris, E.
Why estrogens matter for behavior and brain health. Neurosci.
Biobehav. Rev. 76, 363–379 (2017).
12. Juraska, J. M., Sisk, C. L. & DonCarlos, L. L. Sexual dierentiation
of the adolescent rodent brain: hormonal inluences and
developmental mechanisms. Horm. Behav. 64, 203–210 (2013).
13. Rehbein, E., Hornung, J., Sundström Poromaa, I. & Derntl, B.
Shaping of the female human brain by sex hormones: a review.
Neuroendocrinology 111, 183–206 (2021).
14. Dubol, M. et al. Neuroimaging the menstrual cycle: a multimodal
systematic review. Front. Neuroendocrinol. 60, 100878 (2021).
15. Jacobs, E. & D’Esposito, M. Estrogen shapes dopamine-dependent
cognitive processes: implications for women’s health. J. Neurosci.
31, 5286–5293 (2011).
16. Kim, J. & Frick, K. M. Distinct eects of estrogen receptor
antagonism on object recognition and spatial memory
consolidation in ovariectomized mice. Psychoneuroendocrinology
85, 110–114 (2017).
17. Frick, K. M., Kim, J., Tuscher, J. J. & Fortress, A. M. Sex steroid
hormones matter for learning and memory: estrogenic regulation
of hippocampal function in male and female rodents. Learn. Mem.
22, 472–493 (2015).
18. Berman, K. F. et al. Modulation of cognition-speciic cortical
activity by gonadal steroids: a positron-emission tomography
study in women. Proc. Natl Acad. Sci. USA 94, 8836–8841 (1997).
19. Oyola, M. G. & Handa, R. J. Hypothalamic–pituitary–adrenal
and hypothalamic–pituitary–gonadal axes: sex dierences in
regulation of stress responsivity. Stress 20, 476–494 (2017).
20. Heck, A. L. & Handa, R. J. Sex dierences in the hypothalamic–
pituitary–adrenal axis’ response to stress: an important role for
gonadal hormones. Neuropsychopharmacology 44, 45–58 (2018).
21. Jacobs, E. G. et al. 17β-estradiol dierentially regulates
stress circuitry activity in healthy and depressed women.
Neuropsychopharmacology 40, 566–576 (2014).
22. Andersen, E. et al. Methods for characterizing ovarian and adrenal
hormone variability and mood relationships in peripubertal
females. Psychoneuroendocrinology 141, 105747 (2022).
23. Gordon, J. L., Sander, B., Eisenlohr-Moul, T. A. & Sykes Tottenham, L.
Mood sensitivity to estradiol predicts depressive symptoms in the
menopause transition. Psychol. Med. 51, 1733–1741 (2021).
24. Münster, K., Schmidt, L. & Helm, P. Length and variation in the
menstrual cycle—a cross-sectional study from a Danish county.
Br. J. Obstet. Gynaecol. 99, 422–429 (1992).
25. Dubol, M., Epperson, C. N., Lanzenberger, R.,
Sundström-Poromaa, I. & Comasco, E. Neuroimaging
premenstrual dysphoric disorder: a systematic and critical review.
Front. Neuroendocrinol. 57, 100838 (2020).
26. Hagemann, G. et al. Changes in brain size during the menstrual
cycle. PLoS ONE 6, e14655 (2011).
27. Pletzer, B., Harris, T. & Hidalgo-Lopez, E. Subcortical structural
changes along the menstrual cycle: beyond the hippocampus.
Sci. Rep. 8, 16042 (2018).
28. Lisofsky, N. et al. Hippocampal volume and functional
connectivity changes during the female menstrual cycle.
Neuroimage 118, 154–162 (2015).
29. Pletzer, B. et al. Menstrual cycle and hormonal contraceptive use
modulate human brain structure. Brain Res. 1348, 55–62 (2010).
30. De Bondt, T. et al. Regional gray matter volume dierences and
sex-hormone correlations as a function of menstrual cycle phase
and hormonal contraceptives use. Brain Res. 1530, 22–31
(2013).
31. Poldrack, R. A. et al. Long-term neural and physiological
phenotyping of a single human. Nat. Commun. 6, 8885 (2015).
32. Gordon, E. M. et al. Precision functional mapping of individual
human brains. Neuron 95, 791–807 (2017).
33. Greenwell, S. et al. High-amplitude network co-luctuations linked
to variation in hormone concentrations over the menstrual cycle.
Netw. Neurosci. 7, 1181–1205 (2023).
34. Pritschet, L., Taylor, C. M., Santander, T. & Jacobs, E. G. Applying
dense-sampling methods to reveal dynamic endocrine
modulation of the nervous system. Curr. Opin. Behav. Sci. 40,
72–78 (2021).
35. De Filippi, E. et al. The menstrual cycle modulates whole-brain
turbulent dynamics. Front. Neurosci. 15, 753820 (2021).
36. Mueller, J. M. et al. Dynamic community detection reveals
transient reorganization of functional brain networks across a
female menstrual cycle. Netw. Neurosci. 5, 125–144 (2021).
37. Pritschet, L. et al. Functional reorganization of brain networks
across the human menstrual cycle. Neuroimage 220, 117091
(2020).
38. Fitzgerald, M., Pritschet, L., Santander, T., Grafton, S. T. &
Jacobs, E. G. Cerebellar network organization across the human
menstrual cycle. Sci. Rep. 10, 20732 (2020).
39. Barth, C. et al. In-vivo dynamics of the human hippocampus
across the menstrual cycle. Sci. Rep. 6, 32833 (2016).
40. Taylor, C. M. et al. Progesterone shapes medial temporal lobe
volume across the human menstrual cycle. Neuroimage 220,
117125 (2020).
41. Zsido, R. G. et al. Ultra-high-ield 7T MRI reveals changes in human
medial temporal lobe volume in female adults during menstrual
cycle. Nat. Ment. Health 1, 761–771 (2023).
42. Vercellini, P., Viganò, P., Somigliana, E. & Fedele, L. Endometriosis:
pathogenesis and treatment. Nat. Rev. Endocrinol. 10, 261–275
(2014).
43. Zondervan, K. T. et al. Endometriosis. Nat. Rev. Dis. Prim. 4, 9 (2018).
44. Burney, R. O. et al. Gene expression analysis of endometrium
reveals progesterone resistance and candidate susceptibility
genes in women with endometriosis. Endocrinology 148, 3814–
3826 (2007).
45. Shafrir, A. L. et al. Risk for and consequences of endometriosis:
a critical epidemiologic review. Best Pract. Res. Clin. Obstet.
Gynaecol. 51, 1–15 (2018).
46. Giudice, L. C. & Kao, L. C. Endometriosis. Lancet 364, 1789–1799
(2004).
47. Zondervan, K. T., Becker, C. M. & Missmer, S. A. Endometriosis.
N. Engl. J. Med. 382, 56 (2020).
48. Zeitoun, K. M. & Bulun, S. E. Aromatase: a key molecule in the
pathophysiology of endometriosis and a therapeutic target. Fertil.
Steril. 72, 961–969 (1999).
49. Zeitoun, K., Takayama, K., Michael, M. D. & Bulun, S. E. Stimulation
of aromatase P450 promoter (II) activity in endometriosis and its
inhibition in endometrium are regulated by competitive binding
of steroidogenic factor-1 and chicken ovalbumin upstream
promoter transcription factor to the same cis-acting element.
Mol. Endocrinol. 13, 239–253 (1999).
50. Zeitoun, K. et al. Deicient 17β-hydroxysteroid dehydrogenase
type 2 expression in endometriosis: failure to metabolize
17β-estradiol. J. Clin. Endocrinol. Metab. 83, 4474–4480 (1998).
51. Attia, G. R. et al. Progesterone receptor isoform A but not B
is expressed in endometriosis. J. Clin. Endocrinol. Metab. 85,
2897–2902 (2000).
52. Lessey, B. A., Metzger, D. A., Haney, A. F. & McCarty, K. S.
Immunohistochemical analysis of estrogen and progesterone
receptors in endometriosis: comparison with normal
endometrium during the menstrual cycle and the eect of
medical therapy. Fertil. Steril. 51, 409–415 (1989).
53. Bergqvist, A. & Fernö, M. Endometriosis: oestrogen and
progesterone receptors in endometriotic tissue and
endometrium: comparison of dierent cycle phases and ages.
Hum. Reprod. 8, 2211–2217 (1993).

Nature Neuroscience | Volume 28 | December 2025 | 2588–2600 2600
Article https://doi.org/10.1038/s41593-025-02066-2
54. Leiva, R., Bouchard, T., Boehringer, H., Abulla, S. & Ecochard, R.
Random serum progesterone threshold to conirm ovulation.
Steroids 101, 125–129 (2015).
55. Gaser, C. et al. CAT: a computational anatomy toolbox for the
analysis of structural MRI data. GigaScience https://doi.org/
10.1093/gigascience/giae049 (2024).
56. Wenner, M. M., Stachenfeld, N. S., Wenner, M. M. & Stachenfeld, N. S.
Blood pressure and water regulation: understanding sex hormone
eects within and between men and women. J. Physiol. 590,
5949–5961 (2012).
57. Hampl, R., Bičíková, M. & Sosvorová, L. Hormones and the blood-
brain barrier. Horm. Mol. Biol. Clin. Investig. 21, 159–164 (2015).
58. Stachenfeld, N. S. Sex hormone eects on body luid regulation.
Exerc. Sport Sci. Rev. 36, 152–159 (2008).
59. Streitbürger, D. P. et al. Investigating structural brain changes
of dehydration using voxel-based morphometry. PLoS ONE 7,
e44195 (2012).
60. Clemens, A. M. et al. Estrus-cycle regulation of cortical inhibition.
Curr. Biol. 29, 605–615 (2019).
61. Ohm, D. T. et al. Clinically relevant hormone treatments fail to
induce spinogenesis in prefrontal cortex of aged female rhesus
monkeys. J. Neurosci. 32, 11700–11705 (2012).
62. Dubal, D. B. et al. Estrogen receptor α, not β, is a critical link in
estradiol-mediated protection against brain injury. Proc. Natl
Acad. Sci. USA 98, 1952–1957 (2001).
63. Roof, R. L. & Hall, E. D. Gender dierences in acute CNS
trauma and stroke: neuroprotective eects of estrogen and
progesterone. J. Neurotrauma 17, 367–388 (2000).
64. Luine, V. N. Estradiol and cognitive function: past, present and
future. Horm. Behav. 66, 602–618 (2014).
65. Bayer, J., Gläscher, J., Finsterbusch, J., Schulte, L. H. & Sommer, T.
Linear and inverted U-shaped dose-response functions describe
estrogen eects on hippocampal activity in young women. Nat.
Commun. 9, 1220 (2018).
66. Comasco, E., Frokjaer, V. G. & Sundström-Poromaa, I. Functional
and molecular neuroimaging of menopause and hormone
replacement therapy. Front. Neurosci. 8, 388 (2014).
67. Grotzinger, H. et al. Diurnal luctuations in steroid hormones
tied to variation in intrinsic functional connectivity in a densely
sampled male. J. Neurosci. 44, e1856232024 (2024).
68. Dubol, M. et al. Acute nicotine exposure blocks aromatase in the
limbic brain of healthy women: a [11C]cetrozole PET study. Compr.
Psychiatry 123, 152381 (2023).
69. Schmalenberger, K. M. et al. How to study the menstrual cycle:
practical tools and recommendations. Psychoneuroendocrinology
123, 104895 (2021).
70. Bilić-Zulle, L. Comparison of methods: passing and Bablok
regression. Biochem. Med. (Zagreb) 21, 49–52 (2011).
71. Braun, V., Stuppner, H., Risch, L. & Seger, C. Design and validation
of a sensitive multisteroid LC–MS/MS assay for the routine clinical
use: one-step sample preparation with phospholipid removal and
comparison to immunoassays. Int. J. Mol. Sci. 23, 14691 (2022).
72. Heller, C. et al. The ENIGMA-neuroendocrinology working group
to bridge gaps in female mental health research. Nat. Ment.
Health 2, 348–350 (2024).
Publisher’s note Springer Nature remains neutral with regard to
jurisdictional claims in published maps and institutional ailiations.
Open Access This article is licensed under a Creative Commons
Attribution 4.0 International License, which permits use, sharing,
adaptation, distribution and reproduction in any medium or format,
as long as you give appropriate credit to the original author(s) and the
source, provide a link to the Creative Commons licence, and indicate
if changes were made. The images or other third party material in this
article are included in the article’s Creative Commons licence, unless
indicated otherwise in a credit line to the material. If material is not
included in the article’s Creative Commons licence and your intended
use is not permitted by statutory regulation or exceeds the permitted
use, you will need to obtain permission directly from the copyright
holder. To view a copy of this licence, visit http://creativecommons.
org/licenses/by/4.0/.
© The Author(s) 2025, modiied publication 2025
1Department of Psychiatry and Psychotherapy, Jena University Hospital, Jena, Germany. 2Masonic Institute for the Developing Brain, University of
Minnesota, Minneapolis, MN, USA. 3Department of Pediatrics, University of Minnesota, Minneapolis, MN, USA. 4Department of Psychological and Brain
Sciences, University of California, Santa Barbara, Santa Barbara, CA, USA. 5German Center for Mental Health (DZPG), Jena–Magdeburg–Halle, Germany.
6Center for Intervention and Research on Adaptive and Maladaptive Brain Circuits Underlying Mental Health (C-I-R-C), Jena–Magdeburg–Halle, Germany.
7Medical Physics Group, Institute of Diagnostic and Interventional Radiology, Jena University Hospital, Jena, Germany. 8Department of Psychiatry,
University of Pennsylvania, Philadelphia, PA, USA. 9Department of Psychiatry and Behavioral Sciences, University of Minnesota, Minneapolis, MN, USA.
10Institute of Neuroscience and Medicine (INM-7: Brain & Behaviour), Research Centre Jülich, Jülich, Germany. 11Lab for Autonomic Neuroscience, Imaging
and Cognition (LANIC), Department of Psychosomatic Medicine and Psychotherapy, Jena University Hospital, Jena, Germany. 12cBRAIN, Department of
Child and Adolescent Psychiatry, Psychosomatics, and Psychotherapy, Ludwig-Maximilians-University, Munich, Germany. 13Psychiatry Neuroimaging
Laboratory, Department of Psychiatry, Brigham and Women’s Hospital, Harvard Medical School, Boston, MA, USA. 14Department of Psychiatry and
Neurosciences, Charité – Universitätsmedizin Berlin, corporate member of Freie Universität Berlin and Humboldt-Universität zu Berlin, Berlin, Germany.
15Institute of Child Development, Univeristy of Minnesota, Minneapolis, MN, USA. 16Big Data Institute, Li Ka Shing Centre for Health Information and
Discovery, Nufield Department of Population Health, University of Oxford, Oxford, UK. 17Department of Statistics, University of Oxford, Oxford, UK.
18Oxford University Centre for Integrative Neuroimaging, FMRIB, Nufield Department of Clinical Neurosciences, University of Oxford, Oxford, UK.
19Department of Clinical Psychology, Friedrich Schiller University Jena, Jena, Germany. 20Department of Neurology, Jena University Hospital, Jena,
Germany. 21Institute of Clinical Chemistry and Laboratory Diagnostics, Jena University Hospital, Jena, Germany. 22Neuroscience Research Institute,
University of California, Santa Barbara, Santa Barbara, CA, USA. 23Department of Psychotherapy and Psychosomatic Medicine, University Hospital
Carl Gustav Carus, Technische Universität Dresden, Dresden, Germany. 24These authors contributed equally: Carina Heller, Daniel Güllmar.
e-mail: carina.heller@uni-jena.de
Nature Neuroscience
Article https://doi.org/10.1038/s41593-025-02066-2
Methods
Dense sampling, longitudinal datasets were acquired from three female
participants in Jena, Germany. These datasets are referred to as the
‘endometriosis cycle’, ‘typical cycle’ and the ‘OC cycle’. To extend our
findings, we also leveraged the open-access 28andMe dataset of one
female, which probes the extent to which endogenous fluctuations
in sex hormones across a complete reproductive cycle influence the
brain33–38,40. The data were acquired in Santa Barbara, California, and
are referred to as ‘28andMe (typical) cycle’.
For the purposes of control analyses and to probe comparability
of our findings, an additional dense sampling, longitudinal dataset of
one male was acquired over the time course of 5 weeks in Jena, Germany.
All participants (n = 5) gave written informed consent. The Frie-
drich Schiller University Jena Ethics Committee (for participants
acquired in Jena) and the University of California, Santa Barbara Human
Subjects Committee (for participants acquired in Santa Barbara)
approved the study. Participants were not compensated. All imaging
data are openly available.
Participants
Primary analyses. The study procedures for the participants in Jena,
Germany, were as follows: the first healthy female (37 years of age,
Caucasian) underwent most weekday testing for five consecutive
weeks (9 January–12 February 2023) while freely cycling, resulting in
25 test sessions. The female participant (‘typical cycle’) had a history
of regular menstrual cycles (last half-year mean length = 27.1 days,
s.d. = 0.64, range = 26–28 days), no history of psychiatric, neurological
and endocrine diagnoses, breastfeeding or pregnancy, and no history
of alcohol or drug abuse, but the current use of nicotine. The second
female participant (30 years of age, Caucasian) diagnosed with endo-
metriosis (‘endometriosis cycle’) participated in this dense sampling,
longitudinal study. She received the diagnosis 7 months before the
assessments (28 October 2022) after a cyst surgery in the pelvic area.
The participant was tracking her menstrual cycle length and reported
a mean menstrual cycle length of 24.4 days (s.d. = 1.67, range = 23–27
days) during that time. Otherwise, the female participant had no history
of psychiatric or neurological disorders, breastfeeding or pregnancy,
and no history of smoking, alcohol or drug abuse. The participant
underwent testing from Monday to Friday for five consecutive weeks
(12 June–14 July 2023) while freely cycling, resulting in 25 test sessions.
The third healthy female (31 years of age, Caucasian) underwent most
weekday testing for five consecutive weeks (27 March–28 April 2023),
resulting in 25 test sessions. Before the assessments, the participant
had been prescribed a combined OC pill (0.03-mg ethinyl-estradiol,
2-mg dienogest, Maxim, Jenapharm) approximately 3 months before
study initiation. The female participant (‘OC cycle’) had no history of
psychiatric, neurological or endocrine diagnoses, nor had she experi-
enced breastfeeding or pregnancy. Furthermore, she had no history
of alcohol or drug abuse and did not use nicotine.
The study procedure for the fourth participant was as follows:
a healthy female participant (23 years of age, Caucasian, ‘28andMe
(typical) cycle’) underwent testing for 30 consecutive days (9 July–7
August 2018) while freely cycling. She had a history of regular menstrual
cycles (no missed periods, cycle occurring every 26–28 days) and had
not taken hormone-based medication in the 12 months before the first
study. The participant had no history of psychiatric or neurological
disorders, breastfeeding or pregnancy, and no history of smoking,
alcohol or drug abuse.
Additional analyses (male participant). The fifth participant, a
healthy male (36 years of age, Caucasian), underwent most weekday
testing for five consecutive weeks (4 May–7 June 2023), resulting in 25
test sessions. The male participant (‘male’) had no history of psychiat-
ric, neurological or endocrine diagnoses, and reported no instances of
alcohol, drug or nicotine abuse.
Image acquisition. For datasets collected in Jena (typical cycle, endo-
metriosis cycle, OC, male), scans were collected at 7.30 a.m. (±30 min)
local time. The imaging dataset for the typical cycle was acquired on
a 3 T MRI scanner (Prisma, Siemens Medical Solutions; software ver-
sion MR E11) with a 64-channel head coil. The imaging datasets for the
endometriosis cycle, male and female on OC, were acquired on a 3T
MRI scanner (Prisma, Siemens Medical Solutions; software version
MR XA30) with a 64-channel head coil. Structural MRI for the data-
sets was acquired with T1w magnetization prepared–rapid gradient
echo sequence with the generalized autocalibrating partially paral-
lel acquisitions acceleration. Scan parameters were as follows: echo
time = 2.22 ms, repetition time = 2,400 ms, inversion time = 1,000 ms,
flip angle = 8°, matrix size = 320 × 320 pixels, field of view = 256 mm,
band width = 220 Hz pixel−1 and slice thickness = 0.80 mm.
For the 28andMe (typical) cycle dataset, scans were collected
on a 3 T MRI scanner (Prisma, Siemens Medical Solutions; software
version MR D13D) equipped with a 64-channel head coil. Structural
scans were acquired using a T1w magnetization prepared–rapid gra-
dient echo sequence with the generalized autocalibrating partially
parallel acquisitions acceleration with the following parameters: echo
time = 2.31 ms, repetition time = 2,500 ms, inversion time = 934 ms, flip
angle = 7°, matrix size = 320 × 320 pixels, field of view = 255 mm, band
width = 210 Hz pixel−1 and slice thickness = 0.80 mm.
Image preprocessing. The parameters used to acquire the images
(for example, sizes, space directions and space origin) and the quality
of the images (for example, motion artifacts, ringing, ghosting of the
skull or eyeballs, cutoffs, signal drops and other artifacts) were visually
inspected. One scan from the endometriosis cycle (test day 8) had to be
removed due to artifacts in subcortical structures, corpus callosum and
cingulate gyrus (measurements from this test day were excluded for
all statistical analyses). The final datasets consisted of 24 T1w images
for the endometriosis cycle, 25 T1w images for the typical cycle, 25 T1w
images for the OC cycle, 30 T1w images for the 28andMe (typical) cycle
and 25 T1w images for the male.
The T1w images were converted from DICOM to NIfTI files using
dcm2niix (version v1.0.20170724, https://www.nitrc.org/projects/
mricrogl/) and then preprocessed in SPM12 (version r7771, http://
www.fil.ion.ucl.ac.uk/spm) and the CAT12 (version 12.9, https://
neuro-jena.github.io/cat)
55
toolbox using the (plasticity) longitudi-
nal pipeline approach in Matlab (The MathWorks, version R2021b).
All T1w images were corrected for bias-field inhomogeneities and
initially tissue-classified into gray matter, white matter and cer-
ebrospinal fluid73, followed by an adaptive maximum a posteriori
segmentation74, which also accounts for partial volume effects75. The
resulting gray and white matter partitions were spatially normalized
to MNI space, Geodesic Shooting Registration
76
. Subsequently, the
normalized tissue segments were smoothed using a 6-mm full-width
at half-maximum Gaussian Kernel. The extraction of cortical surfaces
uses a projection-based thickness method
77
to estimate initial cortical
thickness and central surface simultaneously. Topological defects are
corrected using spherical harmonics
78
, followed by surface refinement
to produce final central, pial and white surface meshes. These surfaces
refine the initial thickness measurement using the FreeSurfer metric79.
Subsequently, the individual central surfaces are aligned to the Free-
Surfer FsAverage template hemisphere, spherically inflated to mini-
mize distortions80 and spherically registered using a two-dimensional
DARTEL approach81,82.
Image quality and motion assessment. We conducted a quality
assessment of all T1w images using the Image Quality Rating tool
(https://neuro-jena.github.io/cat12-help/). Image quality was evalu-
ated based on assigned values, with ratings of 1 and 2 indicating (very)
good image quality (grades A and B), while values around 5 and higher
suggest problematic image quality (grades E and above). Notably, all
Nature Neuroscience
Article https://doi.org/10.1038/s41593-025-02066-2
assessed images exhibited excellent to good quality (endometriosis
cycle—M = 1.407, s.d. = 0.002; typical cycle—M = 1.471, s.d. = 0.002;
28andMe (typical) cycle—M = 1.480, s.d. = 0.002; OC cycle—M = 1.503,
s.d. = 0.003; male—M = 1.469, s.d. < 0.001).
Furthermore, mean framewise displacement (FWD), derived
from a 12-min resting-state functional scan acquired before the T1w
scans, was extracted to indicate motion across the entire scan duration
(approximately 55 min). The MRI protocol included a resting-state
functional scan for all participants, except for the typical cycle (here
the functional scan was replaced with a magnetic resonance spectros
-
copy scan). Mean FWD was extremely minimal across all participants
(endometriosis cycle—M = 0.121 mm, s.d. = 0.009 mm; OC cycle—
M = 0.098 mm, s.d. = 0.009 mm; male—M = 0.137 mm, s.d. = 0.011 mm;
Supplementary Fig. 1). Mean FWD for the 28andMe (typical) cycle is
found elsewhere40 and did not exceed 0.150 mm.
Endocrine procedure. For the datasets acquired in Jena, Germany, a
blood draw was immediately followed by the MRI session at 8:30 a.m.
(±30 min). One 4.9-ml blood sample was collected in an S-Monovette
Serum-GEL (Sarstedt) with a clotting activator/gel at each test ses-
sion. The sample was clotted at room temperature and centrifuged
(2,500g for 10 min) within 2 h. Estradiol (pmol l
−1
), luteinizing hormone
(LH; IU l
−1
), follicle-stimulating hormone (FSH; IU l
−1
) and progester-
one serum concentrations (nmol l−1) were determined at the Institute
of Clinical Chemistry and Laboratory Diagnostics, Jena University
Hospital. Estradiol was assessed with the electrochemiluminescence
immunoassay (ECLIA) Elecsys Estradiol III Assay. Assay antibodies,
measuring ranges (defined by the limit of detection and the maximum
of the master curve) and intra-assay precision coefficients of variation
for estradiol were as follows: antibodies, two biotinylated monoclonal
anti-estradiol antibodies (rabbit), 2.5 ng ml
−1
and 4.5 ng ml
−1
; measuring
range, 18.4–11,010 pmol l
−1
(5–3,000 pg ml
−1
); intra-assay precision,
≤8.4% variation coefficient. LH was assessed with the ECLIA Elecsys LH
Assay. Assay antibodies, measuring ranges and intra-assay coefficients
of variation for LH were as follows: antibodies, biotinylated monoclonal
anti-LH antibody (mice), 2.0 mg l
−1
; measuring range, 0.3–200 mIU ml
−1
(0.3–200 IU l−1); intra-assay precision, ≤2.2% variation coefficient.
FSH was assessed with the ECLIA Elecsys FSH Assay. Assay antibodies,
measuring ranges and intra-assay coefficients of variation for FSH
were as follows: antibodies, biotinylated monoclonal anti-FSH anti-
body (mice), 0.5 mg l−1; measuring range, 0.3–200 mIU ml−1 (0.3–200
IU l
−1
); intra-assay precision, ≤2.1% variation coefficient. Progesterone
was assessed with the ECLIA Elecsys Progesterone III Assay. Assay anti-
bodies, measuring ranges and intra-assay coefficients of variation for
progesterone were as follows: antibodies, biotinylated monoclonal
antiprogesterone antibody (recombinant sheep), 30 ng ml
−1
; measur-
ing range, 0.159–191 nmol l−1 (0.05–60 ng ml−1); intra-assay precision,
≤20.7% variation coefficient. All assays were determined on the cobas e
402/801 analyzer (Roche Diagnostics GmbH) and were used according
to the manufacturer’s instructions. The reported intra-assay precision
and coefficient of variation values are taken from the manufacturer’s
package inserts and reflect the analytical performance of the assays.
These values are based on Roche’s validation studies and do not repre-
sent quality control data generated at the Institute of Clinical Chemistry
and Laboratory Diagnostics, Jena University Hospital, Jena, Germany.
For the 28andMe (typical) cycle dataset acquired in Santa Barbara,
CA, USA, a licensed phlebotomist inserted a saline-lock intravenous
line into the dominant or nondominant hand or forearm. One 10-ml
blood sample was collected in a vacutainer SST (BD Diagnostic Sys-
tems) each session. The sample was clotted at room temperature for
45 min until centrifugation (2,000g for 10 min) and then aliquoted
into three 1-ml microtubes. Serum samples were stored at −20 °C until
assayed. Serum concentrations were determined at the Brigham and
Women’s Hospital Research Assay Core. Estradiol and progesterone
were assessed through LC–MS. Assay sensitivities, dynamic range
and intra-assay coefficients of variation (respectively) were as fol-
lows: estradiol—1 pg ml
−1
, 1–500 pg ml
−1
, <5% relative s.d.; progester-
one—0.05 ng ml
−1
, 0.05–10 ng ml
−1
, 9.33% relative s.d. FSH and LH levels
were determined using chemiluminescent assay (Beckman Coulter).
The assay sensitivity, dynamic range and intra-assay coefficient of vari-
ation were as follows: FSH—0.2 mIU ml−1, 0.2–200 mIU ml−1, 3.1–4.3%;
LH—0.2 mIU ml−1, 0.2–250 mIU ml−1, 4.3–6.4%.
Analysis approach. Please note that measurements from test day 8
of the endometriosis cycle were excluded from all statistical analyses
to ensure consistency in the number of test days across all analyses.
Hormone concentrations. Statistical analyses of hormone con-
centrations were performed using Statistical Package for Social Sci-
ences (SPSS; version 27). First, a one-way multivariate analysis of
variance was conducted with estradiol levels, progesterone levels
and progesterone-to-estradiol ratio as dependent variables. The fixed
factors were the four individuals (endometriosis cycle, OC cycle, typical
cycle and 28andMe (typical) cycle). Post hoc analyses of variance and
two-tailed t-tests were performed and Bonferroni-corrected.
Structural brain measures. First, SVD was used to extract spatiotem-
poral patterns from the preprocessed images by decomposing the
three-dimensional image sets into spatial patterns (spatial component)
and their associated temporal dynamics (time course and temporal
component). The spatial patterns represent the brain regions that share
similar spatial changes, while the temporal component reflects these
changes evolve over time. To ensure consistency in spatial patterns
while allowing for distinct temporal patterns, the typical cycle, the
28andMe (typical) cycle, the endometriosis cycle and the OC cycle were
modeled together by concatenating the data from these participants.
For the male participants, who do not have a menstrual cycle, the SVD
was performed separately to account for the unique dynamics.
By using SVD, we can identify and analyze these patterns, revealing
coherent time courses across the brain rather than being restricted to
an expected change over time. This approach is analogous to applying
independent component analysis to resting-state functional MRI data.
However, while the motivation here is to identify underlying independ-
ent processes or networks, the objective of our study was to decompose
the structural data into orthogonal (nonoverlapping) components.
Furthermore, SVD provides consistent and repeatable patterns, which
are crucial for reproducibility of the results across different datasets.
Using a flexible modeling approach, we assessed the variations in
whole-brain volumetric and CSTPs across the monthly period. Specifi-
cally, we used a GAM using the ‘mgcv’ package (version 1.9–1) in RStudio
(version 2024.04.1 + 748), which allows the independent variable (test
days) to influence the outcome through smooth, nonlinear functions,
to address potential nonlinear effects in volumetric and cortical thick-
ness brain dynamics. The default value of k = 10 was used to determine
the smoothness of the functions. This approach acknowledges the
anticipated complexity and nonlinearity of the relationship between
the menstrual cycle and brain structure, enabling a more adaptable
modeling of menstrual cycle-dependent trajectories in structural brain
dynamics. Initially, we also considered models with autoregressive
terms to account for potential temporal dependencies in the data.
However, model checks indicated that including autoregressive terms
led to overfitting. There, we opted for the simpler GAM model, which
provided a more reliable and interpretable fit. The following GAMs
were fitted for the VSTPs for each individual separately:
VSTP1 =β0+f1(test day)
VSTP2 =β0+f1(test day)
VSTP3 =β0+f1(test day)
Nature Neuroscience
Article https://doi.org/10.1038/s41593-025-02066-2
The following GAMs were fitted for the CSTPs for each individual sepa
-
rately (CSTP3 in the male only):
CSTP1 =β0+f1(test day)
CSTP2 =β0+f1(test day)
CSTP3 =β0+f1(test day)
GAMs were adjusted for multiple comparisons using the FDR method
83
.
Next, we assessed the relationship between the dynamics of volu-
metric and cortical thickness and gonadal hormones. To stabilize vari-
ances, gonadal hormone levels were transformed using the square root.
We then used time-series regression models with VSTPs and CSTPs as
dependent variables and the gonadal hormones as predictors in SPSS
(version 27). These models captured the relationship between current
structural dynamics and current gonadal hormone concentrations. The
following time-series regression models were fitted for the VSTP1 for
each individual separately:
VSTP1 =β0+β1×estradiol +ε
VSTP1 =β0+β1×progesterone +ε
VSTP1 =β0+β1×ratio +ε
The same time-series regression models were fitted for VSTP2 and
VSTP3, as well as CSTP1 and CSTP2 for each individual separately
(CSTP3 in the male only). Additionally, we explored functional regres-
sion analyses incorporating autoregressive terms to account for poten-
tial dependencies in the data. However, model checks indicated that
including autoregressive terms resulted in overfitting. As a result, we
decided to use the initial simpler model without these terms. Finally,
because not all variables were normally distributed, relationships were
further investigated using nonparametric Spearman rank correla-
tion, as implemented in the ‘stats’ package (version 4.4.0) in RStudio
(version 2024.04.1 + 748). Results were highly consistent across both
approaches. All models were adjusted for multiple comparisons using
the FDR method83.
Finally, to investigate the association between hormonal con-
centrations and structural brain measures at each voxel or vertex, we
performed a statistical analysis using a general linear model in CAT12.
Hormonal concentrations were included as the dependent variable
in a regression framework. To identify statistically significant effects,
we used the threshold-free cluster enhancement method (https://
neuro-jena.github.io/software.html#tfce)
84
, which integrates both
the magnitude and spatial extent of effects and controls for multiple
comparisons by applying a family-wise error correction with a sig-
nificance threshold of P < 0.01. For voxel-wise analyses, voxels with
an absolute threshold below 0.1 were excluded to focus exclusively
on gray matter regions.
Reporting summary
Further information on research design is available in the Nature
Portfolio Reporting Summary linked to this article.
Data availability
The datasets generated in Jena, Germany, are available at https://open-
neuro.org/datasets/ds006491. The dataset generated in Santa Barbara,
CA, USA, is available at https://openneuro.org/datasets/ds002674.
Source data are provided with this paper.
Code availability
Code is available in a public repository and can be found online at https://
github.com/ChristianGaser/menstrual-brain-structural-dynamics.
References
73. Ashburner, J. & Friston, K. J. Uniied segmentation. Neuroimage
26, 839–851 (2005).
74. Rajapakse, J. C., Giedd, J. N. & Rapoport, J. L. Statistical approach
to segmentation of single-channel cerebral MR images. IEEE
Trans. Med. Imaging 16, 176–186 (1997).
75. Tohka, J., Zijdenbos, A. & Evans, A. Fast and robust parameter
estimation for statistical partial volume models in brain MRI.
Neuroimage 23, 84–97 (2004).
76. Ashburner, J. & Friston, K. J. Dieomorphic registration using
geodesic shooting and Gauss–Newton optimisation. Neuroimage
55, 954–967 (2011).
77. Dahnke, R., Yotter, R. A. & Gaser, C. Cortical thickness and central
surface estimation. Neuroimage 65, 336–348 (2013).
78. Yotter, R. A., Dahnke, R., Thompson, P. M. & Gaser, C. Topological
correction of brain surface meshes using spherical harmonics.
Hum. Brain Mapp. 32, 1109–1124 (2011).
79. Masouleh, S. K. et al. Inluence of processing pipeline on cortical
thickness measurement. Cereb. Cortex 30, 5014–5027 (2020).
80. Yotter, R. A., Thompson, P. M. & Gaser, C. Algorithms to improve
the reparameterization of spherical mappings of brain surface
meshes. J. Neuroimaging 21, e134–e147 (2011).
81. Ashburner, J. A fast dieomorphic image registration algorithm.
Neuroimage 38, 95–113 (2007).
82. Yotter, R. A., Ziegler, G., Thompson, P. M. & Gaser, C. Dieometric
anatomical registration on the surface. Poster presented at the
17th annual meeting of the organization of human brain mapping,
Quebec, Canada, 26–30 June 2011.
83. Benjamini, Y. & Hochberg, Y. Controlling the false discovery rate:
a practical and powerful approach to multiple testing. J. R. Stat.
Soc. Series B Methodol. 57, 289–300 (1995).
84. Smith, S. M. & Nichols, T. E. Threshold-free cluster enhancement:
addressing problems of smoothing, threshold dependence and
localisation in cluster inference. Neuroimage 44, 83–98 (2009).
Acknowledgements
This work was supported by the German Research Foundation (grant
544183227 to C.H.), the Interdisciplinary Center of Clinical Research
of the Medical Faculty Jena (to L.C.), the National Institutes of Health
(R00MH127293 to B.L.), the Wellcome Trust Collaborative Award
(215573/Z/19/Z to F.J.L.) and the Marie Skłodowska-Curie Innovative
Training Network (SmartAge 859890 H2020-MSCA-ITN2019 to C.G.).
The present work is endorsed by the German Center for Mental Health.
The funders had no role in the study design, data collection, analysis
and interpretation of data, or the writing of this manuscript.
Author contributions
C.H. was responsible for conceptualization, methodology, formal
analysis, investigation, visualization, project administration, funding
acquisition and writing the original draft of the manuscript. D.G.
contributed to investigation, resources, data curation and writing
(review and editing). L.C. contributed to investigation and writing
(review and editing). L.P. contributed to investigation and writing
(review and editing). M.G. contributed to formal analysis and writing
(review and editing). N.J., F.d.l.C. and P.R. contributed to writing
(review and editing). C.J.K. contributed to investigation and writing
(review and editing). B.L. contributed to methodology and writing
(review and editing). H.G. and F.J.L. contributed to formal analysis
and writing (review and editing). A.-C.B. and T.L.J. contributed to
investigation and writing (review and editing). R.D. contributed to
formal analysis and writing (review and editing). M.K. contributed
to resources, formal analysis and writing (review and editing). E.G.J.
contributed to supervision and writing (review and editing). Z.K.
contributed to conceptualization and writing (review and editing).
M.W. and I.C. contributed to conceptualization, methodology,
Nature Neuroscience
Article https://doi.org/10.1038/s41593-025-02066-2
resources, supervision and writing (review and editing). C.G.
contributed to formal analysis, resources, data curation, visualization,
supervision and writing (review and editing).
Funding
Open access funding provided by Friedrich-Schiller-Universität Jena.
Competing interests
The authors declare no competing interests.
Additional information
Extended data is available for this paper at
https://doi.org/10.1038/s41593-025-02066-2.
Supplementary information The online version
contains supplementary material available at
https://doi.org/10.1038/s41593-025-02066-2.
Correspondence and requests for materials should be addressed to
Carina Heller.
Peer review information Nature Neuroscience thanks Jessica
Bernard, Evan Gordon and the other, anonymous, reviewer(s) for their
contribution to the peer review of this work
Reprints and permissions information is available at
www.nature.com/reprints.

Nature Neuroscience
Article https://doi.org/10.1038/s41593-025-02066-2
Extended Data Fig. 1 | Timeline of the data collection for the female
participants (n = 4). (a) The timeline of data collection for the typical cycle
(n = 1). (b) The timeline of data collection for the 28andMe (typical) cycle (n = 1).
(c) The timeline of data collection for the endometriosis cycle (n = 1). (d) The
timeline of data collection for the oral contraceptives cycle (n = 1). For (a–d) MRI
(MRI symbol), blood draw for hormonal assessments (syringe symbol), and mood
questionnaires (paper symbol) were acquired simultaneously on each test day.
Purple timeline bars represent the endometriosis cycle, the oral contraceptives
cycle, and the typical cycle acquired in Jena, Germany. The turquoise timeline bar
represents the 28andMe (typical) cycle acquired in Santa Barbara, California, USA.

Nature Neuroscience
Article https://doi.org/10.1038/s41593-025-02066-2
Extended Data Fig. 2 | Timeline of data collection and hormonal levels for
the male participant (n = 1). (a) The timeline of data collection for the male
participant (n = 1). MRI (MRI symbol), blood draw for hormonal assessments
(syringe symbol), and mood questionnaires (paper symbol) were acquired
simultaneously on each test day. Data was acquired in Jena, Germany. (b) The
hormonal levels of estradiol, progesterone, and the progesterone-to-estradiol
ratio for the male participant across the five-week period. Solid lines and colored
shaded areas represent hormonal levels. The male participant presented with
anticipated low hormonal concentrations of estradiol, progesterone, and a low
progesterone-to-estradiol ratio.

Nature Neuroscience
Article https://doi.org/10.1038/s41593-025-02066-2
Extended Data Fig. 3 | Volumetric spatiotemporal patterns that significantly
fluctuated in the male participant (n = 1) across the five-week period. This
figure depicts volumetric spatiotemporal patterns in the male participant that
explained at least 10% of the variance. Spatial distribution of brain regions (top)
and the associated temporal dynamics (bottom) of volumetric spatiotemporal
pattern 1 (VSTP1), volumetric spatiotemporal pattern 2 (VSTP2) and volumetric
spatiotemporal pattern 3 (VSTP3) are shown. Warm colors in the spatial maps
indicate regions with positive associations to the temporal pattern (indicating
regional volume increases as the temporal pattern increases). Cool colors in the
spatial maps indicate negative associations to the temporal pattern (reflecting
regional volume decreases as the temporal pattern increases). Spatial weights
were thresholded, retaining only values within the ranges of −0.05 to −0.01
and 0.01 to 0.05, while excluding values between −0.01 and 0.01 that indicate
minimal contribution to the respective spatial pattern (color bar). Solid black
lines represent standardized eigenvectors (temporal pattern); dashed colored
lines represent square-rooted and standardized hormonal values. Generalized
additive models (GAMs) revealed that the volumetric spatiotemporal patterns
fluctuated significantly across time. Time-series regressions revealed that the
volumetric temporal patterns were not associated with hormonal levels in the
male. For exact p-values, see Supplementary Table 10 and 11. Graphs were created
using GraphPad Prism (version 10).

Nature Neuroscience
Article https://doi.org/10.1038/s41593-025-02066-2
Extended Data Fig. 4 | Cortical thickness spatiotemporal patterns in the male
participant (n = 1) across the five-week period. This figure depicts cortical
thickness spatiotemporal patterns in the male participant that explained at
least 10% of the variance. Spatial distribution of brain regions (top) and the
associated temporal dynamics (bottom) of cortical thickness spatiotemporal
pattern 1 (CSTP1), cortical thickness spatiotemporal pattern 2 (CSTP2) and
cortical thickness spatiotemporal pattern 3 (CSTP3) are shown. Warm colors
in the spatial maps indicate regions with positive associations to the temporal
pattern (indicating regional cortical thickness increases as the temporal pattern
increases). Cool colors in the spatial maps indicate negative associations to
the temporal pattern (reflecting regional cortical thickness decreases as the
temporal pattern increases). Spatial weights were thresholded, retaining only
those within the ranges of -0.02 to -0.01 and 0.01 to 0.02, while excluding values
between -0.01 and 0.01 that indicate minimal contribution to the respective
spatial pattern (color bar). Solid black lines represent standardized eigenvectors
(temporal pattern); dashed colored lines represent square-rooted and
standardized hormonal values. Generalized additive models (GAMs) revealed
that the cortical thickness temporal patterns did not significantly fluctuate
across the five-week period and time-series regressions revealed that they
were not associated with hormonal levels in the male. For exact p-values, see
Supplementary Table 10 and 11. Graphs were created using GraphPad Prism
(version 10).

Nature Neuroscience
Article https://doi.org/10.1038/s41593-025-02066-2
Extended Data Fig. 5 | Results from the voxel- and vertex-wise analyses in the
male participant (n = 1) across the five-week period. To directly link hormonal
fluctuations to structural brain measures, complementary voxel- and vertex-wise
analyses were also conducted using general linear models (GLMs) in the male
participant as a sensitivity check with the Threshold-Free Cluster Enhancement
(TFCE) method which controls for multiple comparisons by applying a family-
wise error (FWE) correction. No significant associations were found in the voxel-
and vertex-wise analysis between structural brain measures (volume, cortical
thickness) and hormone levels in males. Estradiol, square-rooted estradiol
levels; progesterone, square-rooted progesterone levels; ratio, square-rooted
progesterone-to-estradiol ratio.

1
nature portfolio | reporting summary
April 2023
Corresponding author(s):
Carina Heller, Friedrich Schiller University
Jena, Jena, Germany
Last updated by author(s):
Aug 3, 2025
Reporting Summary
Nature Portfolio wishes to improve the reproducibility of the work that we publish. This form provides structure for consistency and transparency
in reporting. For further information on Nature Portfolio policies, see our Editorial Policies and the Editorial Policy Checklist.
Statistics
For all statistical analyses, confirm that the following items are present in the figure legend, table legend, main text, or Methods section.
n/a
Confirmed
The exact sample size (n) for each experimental group/condition, given as a discrete number and unit of measurement
A statement on whether measurements were taken from distinct samples or whether the same sample was measured repeatedly
The statistical test(s) used AND whether they are one- or two-sided
Only common tests should be described solely by name; describe more complex techniques in the Methods section.
A description of all covariates tested
A description of any assumptions or corrections, such as tests of normality and adjustment for multiple comparisons
A full description of the statistical parameters including central tendency (e.g. means) or other basic estimates (e.g. regression coefficient)
AND variation (e.g. standard deviation) or associated estimates of uncertainty (e.g. confidence intervals)
For null hypothesis testing, the test statistic (e.g. F, t, r) with confidence intervals, effect sizes, degrees of freedom and P value noted
Give P values as exact values whenever suitable.
For Bayesian analysis, information on the choice of priors and Markov chain Monte Carlo settings
For hierarchical and complex designs, identification of the appropriate level for tests and full reporting of outcomes
Estimates of effect sizes (e.g. Cohen's d, Pearson's r), indicating how they were calculated
Our web collection on statistics for biologists contains articles on many of the points above.
Software and code
Policy information about availability of computer code
Data collection
The imaging dataset for the typical cycle was acquired on a 3T MRI scanner (Prisma, Siemens Medical Solutions, Erlangen, Germany) with
software version MR E11.
The imaging datasets for the endometriosis cycle, male, and female on oral contraceptives were acquired on a 3T MRI scanner (Prisma,
Siemens Medical Solutions, Erlangen, Germany) with software version MR XA30.
For the 28andMe (typical) cycle dataset, scans were collected on a 3T MRI scanner (Prisma, Siemens Medical Solutions, Erlangen, Germany)
with software version MR D13D.
All protocols were standard Siemens protocols. No other custom software was used for data collection.
Data analysis
- RStudio (version 2024.04.1+748)
- 'mgcv' package (version 1.9-1)
- 'stats' package (version 4.4.0)
- Statistical Package for Social Sciences (SPSS) version 27
- dcm2niix (version v1.0.20170724)
- Matlab (The MathWorks Inc., Natick, MA, USA, version R2921b)
- SPM12 (http://www.fil.ion.ucl.ac.uk/spm, version r7771)
- CAT12 (https://neuro-jena.github.io/cat, version 12.9)
For manuscripts utilizing custom algorithms or software that are central to the research but not yet described in published literature, software must be made available to editors and
reviewers. We strongly encourage code deposition in a community repository (e.g. GitHub). See the Nature Portfolio guidelines for submitting code & software for further information.

2
nature portfolio | reporting summary
April 2023
Data
Policy information about availability of data
All manuscripts must include a data availability statement. This statement should provide the following information, where applicable:
- Accession codes, unique identifiers, or web links for publicly available datasets
- A description of any restrictions on data availability
- For clinical datasets or third party data, please ensure that the statement adheres to our policy
Data availability: Datasets acquired in Jena, Germany, are available at https://openneuro.org/datasets/ds006491. The dataset acquired in Santa Barbara, CA, USA, is
available at https://openneuro.org/datasets/ds002674.
Research involving human participants, their data, or biological material
Policy information about studies with human participants or human data. See also policy information about sex, gender (identity/presentation),
and sexual orientation and race, ethnicity and racism.
Reporting on sex and gender
In our manuscript we consistently use the terms "sex" and "female" and "male" to refer to our study population, as our
central focus was on gonadal hormones as a biological varibale and how these hormones (estradiol and progesterone) impact
brain structure. Sex of all participants was reported (4 females, 1 male).
Reporting on race, ethnicity, or
other socially relevant
groupings
In the method's section of our manuscript we report about the ethnicity of our participants, which was self reported by all
participants. All subjects were white.
Population characteristics
All participants were of reproductive age (range: 23 - 37 years of age). Females recruited with a typical natural menstrual
cycle (authors L.C. and L.P.) reported a regular menstrual cycle lengths (around approximately 28 days). The female
diagnosed with endometriosis received the diagnosis seven months prior to the assessments (October 28, 2022) after a cyst
surgery in the pelvic area. The participant was tracking her menstrual cycle length and reported a mean menstrual cycle
length of 24.4 days (SD = 1.67, range = 23 – 27 days). The female on oral contraceptives (author C.H.) was using the regimen
for at least three months prior to the assessment. Hormonal values for the male (author T.L.J.) were within the usual range
for males. All participants reported no history of psychiatric and neurological disorders, breastfeeding or pregnancy, alcohol
or drug abuse.
Recruitment
The female with endometriosis was recruited as a voluntary participant from the general population with the use of
advertisements. The females with the natural menstrual cycles (authors L.C. and L.P.), the female on oral contraceptives
(author C.H.), and the male (author T.L.J.) were recruited as volunteers from the Departement of Clinical Psychology,
Friedrich Schiller University Jena, Jena, Germany, and the Department of Psychiatry and Psychotherapy, Jena University
Hospital, Jena, Germany, as well as the Department of Psycholoical and Brain Sciences, University of California Santa Barbara,
Santa Barbara, CA, USA. The project was conceived by the authors to use themselves as participants, as has been done in
previous "dense-sampling" studies (cf. Poldrack et al., 2015; Pritschet et al., 2020; Heller et al., 2024). Because the authors
served as participants, there is a potential for self-selection bias, as they may not represent the general population. This
limits generalizability but does not affect the internal validity of the dense-sampling, within-subject design.
Ethics oversight
All participants gave written informed consent. The Friedrich Schiller University Jena Ethics Committee (for participants
acquired in Jena, Germany) and the University of California, Santa Barbara Human Subjects Committee (for participant
acquired in Santa Barbara, USA) approved the study. Participants were not compensated.
Note that full information on the approval of the study protocol must also be provided in the manuscript.
Field-specific reporting
Please select the one below that is the best fit for your research. If you are not sure, read the appropriate sections before making your selection.
Life sciences
Behavioural & social sciences
Ecological, evolutionary & environmental sciences
For a reference copy of the document with all sections, see nature.com/documents/nr-reporting-summary-flat.pdf
Life sciences study design
All studies must disclose on these points even when the disclosure is negative.
Sample size
Sample size was N=5. No formal sample-size calculation was performed due to the single-subject design. Instead of collecting data from
multiple individuals and then pooling the data to establish mean comparisons across groups, statistical power is achieved by following the
same individual across a densely sampled time-scale (in our case four to five weeks). The number of test days was selected based on
previously published dense-sampling studies investigating hormone-brain associations (cf Pritschet et al., 2020; Pritschet et al., 2024; Heller et
al, 2024).
Endomtriosis cycle: n=1, 25 test days
Typical cycle: n=1, 25 test days

3
nature portfolio | reporting summary
April 2023
28andMe (typical) cycle: n=1, 30 test days
Oral contraceptives cycle: n=1, 25 test days
Male: n=1, 25 test days
Data exclusions
One structural MRI scan from one day needed to be excluded due to artifacts in the scan. This particular scan was the 8th scan within the
dataset of the female with endometriosis. Measurements from that day were excluded for all statistical analyses. The final number of test
days for analyses for the endometriosis cycle was 24 test days.
Replication
This is the first study of its kind, and as such, no direct replications currently exist. However, to assess the reproducibility of our findings—
specifically, the associations between hormones and spatiotemporal brain patterns—we conducted voxel-wise and vertex-wise sensitivity
analyses. Voxel-wise analyses revealed positive associations between brain volume and hormone concentrations that spatially overlapped
with the patterns identified in the SVD analyses. Consistent with the SVD results, estradiol-related associations were most prominent in the
endometriosis cycle, whereas progesterone-related associations were more evident in the typical cycles. Vertex-wise analyses similarly
showed few associations between cortical thickness and hormone concentrations, in line with the SVD findings. As an additional sensitivity
check, we repeated the SVD, voxel-wise, and vertex-wise analyses in a male participant; none of the analyses showed meaningful associations
with hormone levels.
Randomization
Since this study consists of a single-subject design where participants were scanned repeatedly over the time course of five weeks and were
not grouped for analyses, randomization and covariate analyses were not necessary.
Blinding
Blinding was not possible in this study because the authors also served as participants and were fully aware of the experimental conditions,
cycle phases, and test days.
Reporting for specific materials, systems and methods
We require information from authors about some types of materials, experimental systems and methods used in many studies. Here, indicate whether each material,
system or method listed is relevant to your study. If you are not sure if a list item applies to your research, read the appropriate section before selecting a response.
Materials & experimental systems
n/a
Involved in the study
Antibodies
Eukaryotic cell lines
Palaeontology and archaeology
Animals and other organisms
Clinical data
Dual use research of concern
Plants
Methods
n/a
Involved in the study
ChIP-seq
Flow cytometry
MRI-based neuroimaging
Antibodies
Antibodies used
Anti-Estradiol-Ak~Biotin, 19.7 mL: Two biotinylated monoclonal anti-Estradiol antibodies (rabbit), 2.5 ng/mL and 4.5 ng/mL;
Mesterolone, 130 ng/mL; MESb buffer, 50 mmol/L, pH 6.0; Preservative.
Anti-Progesterone-Ak~Biotin, 21.0 mL: Biotinylated monoclonal anti-Progesterone antibody (recombinant, sheep), 30 ng/mL;
Phosphate buffer, 25 mmol/L, pH 7.0; Preservative.
Anti-FSH-Ab~biotin, 10 mL: Biotinylated monoclonal antiFSH antibody (mouse) 0.5 mg/L, MES
buffer 50 mmol/L, pH 6.0; preservative.
Anti-FSH-Ab~Ru(bpy), 10 mL: Monoclonal antiFSH antibody (mouse) labeled with ruthenium complex 0.8 mg/L, MES buffer 50
mmol/L, pH 6.0; preservative.
Anti-LH-Ab~biotin, 10 mL: Biotinylated monoclonal antiLH antibody (mouse) 2.0 mg/L; TRIS buffer 50 mmol/L, pH 8.0; preservative.
Anti-LH-Ab~Ru(bpy), 10 mL: Monoclonal antiLH antibody (mouse) labeled with ruthenium complex 0.3 mg/L; TRIS buffer 50 mmol/L,
pH 8.0; preservative.
Validation
Hormone concentrations were measured using standardized electrochemiluminescence immunoassays (ECLIA) on the Roche cobas e
platform:
- Electrochemiluminescence immunoassay (ECLIA) Elecsys® Estradiol III Assay (https://diagnostics.roche.com/global/en/products/lab/
elecsys-estradiol-iii-cps-000466.html): measuring range, 18.4 – 11,010 pmol/l (5 – 3000 pg/ml); intra-assay precision, ≤ 8.4%
variation coefficient.
- Electrochemiluminescence immunoassay (ECLIA) Elecsys® Progesterone III Assay (https://diagnostics.roche.com/global/en/
products/lab/elecsys-progesterone-iii-cps-000501.html): measuring range, 0.159 – 191 nmol/l (0.05 – 60 ng/ml); intra-assay
precision, ≤ 20.7% variation coefficient.
- Electrochemiluminescence immunoassay (ECLIA) Elecsys® FSH Assay (https://diagnostics.roche.com/global/en/products/lab/
elecsys-fsh-cps-000472.html): measuring range, 0.3 – 200 mIU/ml (0.3 – 200 IU/l); intra-assay precision, ≤ 2.1% variation coefficient.
- Electrochemiluminescence immunoassay (ECLIA) Elecsys® LH Assay (https://diagnostics.roche.com/global/en/products/lab/elecsys-
lh-cps-000492.html): measuring range, 0.3 – 200 mIU/ml (0.3 – 200 IU/l); intra-assay precision, ≤ 2.2% variation coefficient.

4
nature portfolio | reporting summary
April 2023
All assays were determined on the cobas® e 402/801 analyzer (Roche Diagnostics GmbH, Mannheim, Germany) and were used
according to the manufacturer's instructions. The reported intra-assay precision and coefficient of variation values are taken from
the manufacturer’s package inserts and reflect the analytical performance of the assays. These values are based on Roche’s
validation studies and do not represent quality control data generated at the Institute of Clinical Chemistry and Laboratory
Diagnostics, Jena University Hospital, Jena, Germany.
Novel plant genotypes
Describe the methods by which all novel plant genotypes were produced. This includes those generated by transgenic approaches,
gene editing, chemical/radiation-based mutagenesis and hybridization. For transgenic lines, describe the transformation method, the
number of independent lines analyzed and the generation upon which experiments were performed. For gene-edited lines, describe
the editor used, the endogenous sequence targeted for editing, the targeting guide RNA sequence (if applicable) and how the editor
was applied.
Seed stocks
Report on the source of all seed stocks or other plant material used. If applicable, state the seed stock centre and catalogue number. If
plant specimens were collected from the field, describe the collection location, date and sampling procedures.
Authentication
Describe any authentication procedures for each seed stock used or novel genotype generated. Describe any experiments used to
assess the effect of a mutation and, where applicable, how potential secondary effects (e.g. second site T-DNA insertions, mosiacism,
off-target gene editing) were examined.
Plants
Magnetic resonance imaging
Experimental design
Design type
No task or resting-state MRI acquired
Design specifications
No task or resting-state MRI acquired
Behavioral performance measures
No task or resting-state MRI acquired
Acquisition
Imaging type(s)
Structural MRI: T1-weighted (T1w) magnetization prepared - rapid gradient echo (MPRAGE) sequence with the
generalized autocalibrating partially parallel acquisitions (GRAPPA) acceleration.
Field strength
3T
Sequence & imaging parameters
Data from Jena: echo time (TE) = 2.22 ms, repetition time (TR) = 2400 ms, inversion time (TI) = 1000 ms, flip angle = 8°,
matrix size = 320 x 320 pixels, field of view (FOV) = 256 mm, band width = 220 Hz/pixel, and slice thickness = 0.80 mm.
Data from Santa Barbara: TE = 2.31 ms, TR = 2500 ms, TI = 934 ms, flip angle = 7°, matrix size = 320 x 320 pixels, FOV =
255 mm, band width = 210 Hz/pixel, and slice thickness = 0.80 mm.
Area of acquisition
Whole brain scan
Diffusion MRI
Used
Not used
Preprocessing
Preprocessing software
The T1w images were converted from Dicom to Nifti files using dcm2niix (Chris Rorden, version v1.0.20170724, https://
www.nitrc.org/projects/mricrogl/) and then preprocessed in SPM12 (http://www.fil.ion.ucl.ac.uk/spm) and the CAT12
(https://neuro-jena.github.io/cat) toolbox using the longitudinal pipeline approach in Matlab R2021b (The MathWorks Inc.,
Natick, MA, USA). All T1w images were corrected for bias-field inhomogeneities and initially tissue-classified into gray matter,
white matter, and cerebrospinal fluid, followed by an adaptive maximum a posteriori segmentation, which also accounts for
partial volume effects
Normalization
The resulting gray and white matter partitions were spatially normalized to MNI space Geodesic Shooting Registration.
Normalization template
MNI space Geodesic Shooting Registration
Noise and artifact removal
Please see above: One scan from the female with endometriosis had to be excluded due to artefacts within the corpus
callosum and subcortical structures. All other T1-weighted images were corrected for bias-field inhomogeneities and tissue-
classified into gray matter, white matter, and cerebrospinal fluid, which also included an approach accounting for partial
volume effects by applying adaptive maximum a posteriori estimations and a hidden Markov Random Field Model.
Volume censoring
N/A
Statistical modeling & inference
Model type and settings
Singular Value Decomposition (SVD) was used to extract spatiotemporal patterns from the preprocessed images by
decomposing the three-dimensional image sets into spatial patterns (maps) and their associated temporal dynamics (time

5
nature portfolio | reporting summary
April 2023
course) for each participant separately. The spatial patterns represent the regions of the brain that share a similar temporal
pattern, while the temporal dynamics describe how the local volume of these regions changes over time. SVD analysis was
performed for all female individuals combined (group-level). SVD analysis for the male was performed separately. The SVD
analyses yielded more than one spatiotemporal patterns exceeding a threshold of 1.
Effect(s) tested
We assessed the variations in whole-brain volumetric and cortical thickness spatiotemporal patterns across the monthly
period using general additive modeling (GAM). This approach acknowledges the anticipated complexity and nonlinearity of
the relationship between the menstrual cycle and brain structure, allowing for a more adaptable modeling of menstrual
cycle-dependent trajectories in structural brain dynamics. We then employed linear regression models with volumetric and
cortical thickness spatiotemporal patterns as dependent variables and the gonadal hormones as predictors. Since not all
variables were normally distributed, relationships were further modeled using non-parametric functional Spearman rank
correlation. Results were highly consistent across both approaches. Furthermore, to account for possible autocorrelation,
GAMs with an autogressive term and functional linear regressionswith an autoregressive terms were calculated. Results were
highly consistent across approaches with and without autoregressive terms. However, autoregressive terms led to overfitting
of the model which supported our decision to use the simpler models.
To investigate the association between hormonal concentrations and structural brain measures at each voxel or vertex,
statistical analysis using a general linear model (GLM) was performed. Hormonal concentrations were included as the
dependent variable in a regression framework. To identify statistically significant effects, the Threshold-Free Cluster
Enhancement (TFCE) method was used.
Specify type of analysis:
Whole brain
ROI-based
Both
Statistic type for inference
(See Eklund et al. 2016)
Voxel-wise, vertex-wise
Correction
Corrected for multiple comparisons using False Discovery Rate (FDR) and Family-Wise Error (FWE).
Models & analysis
n/a
Involved in the study
Functional and/or effective connectivity
Graph analysis
Multivariate modeling or predictive analysis

![[Rezension von] Romans, Thielman, Frank, Zondervan, 2018 (ISBN 978‐0‐310‐10403‐2), 814 pp.](https://s3.us-east-1.amazonaws.com/outstation.idea/pdf-mt/2044566515549003776/pdf/719f7bac-7ed9-41a3-a7fb-c6bacd5092da/imgs/page1.png)


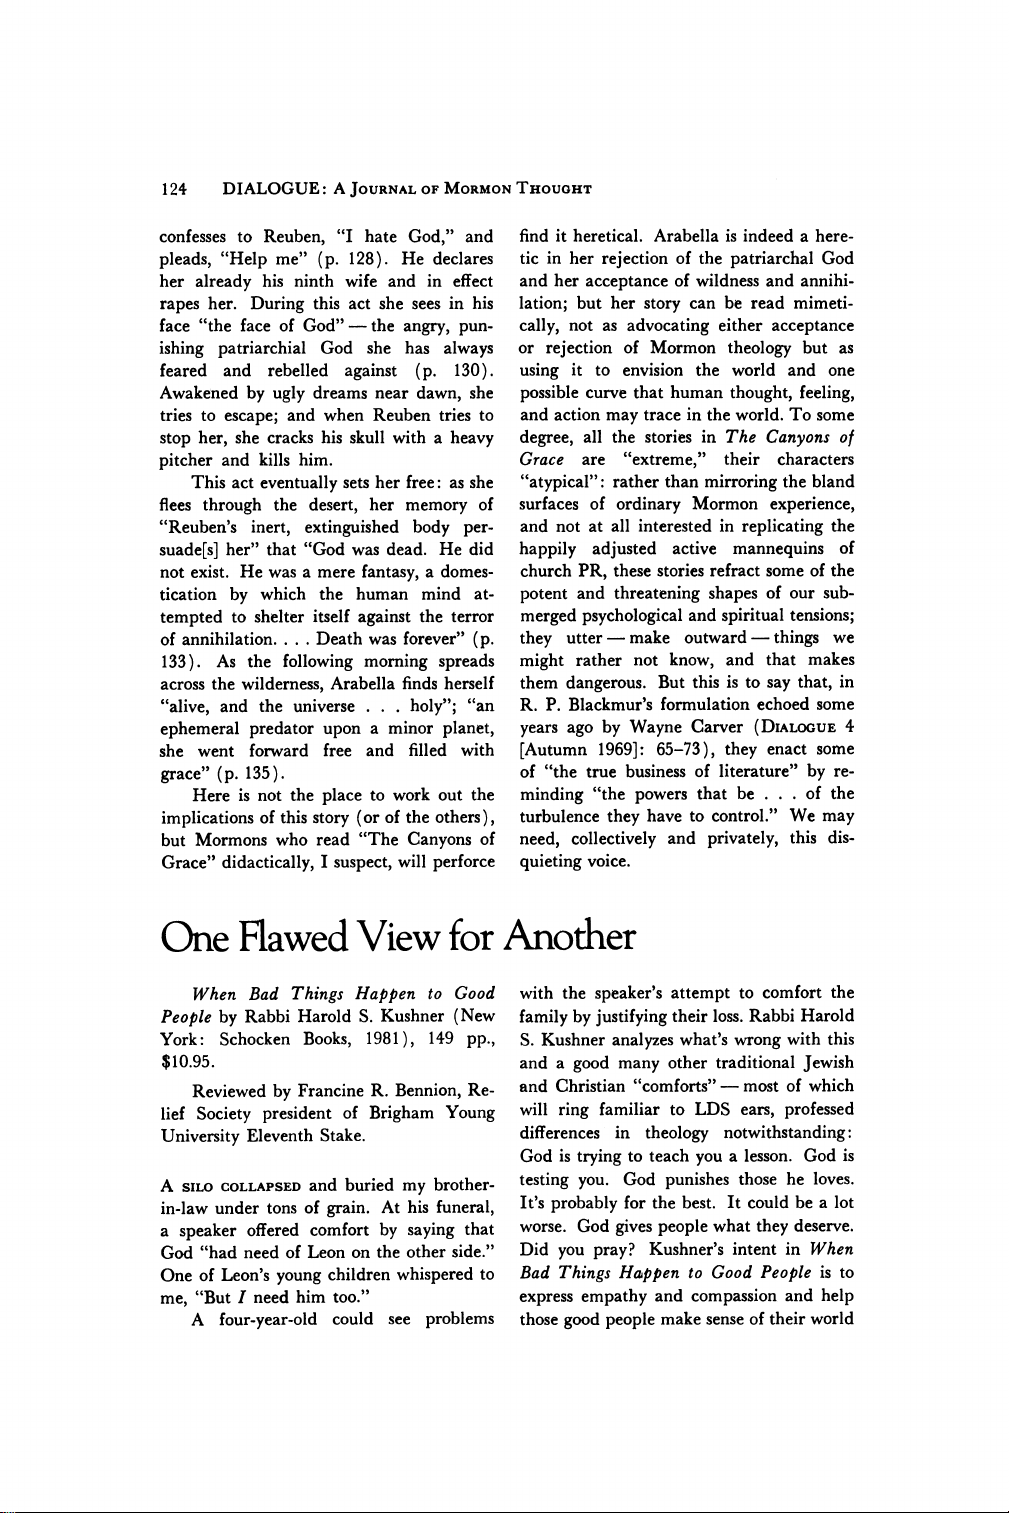


![Get Tiktok Free Followers in 2025: Top Strategies and Tips [5T=A5]](https://s3.us-east-1.amazonaws.com/outstation.idea/pdf-mt/8709740811137548288/pdf/ebe001e9-84e1-4b10-92d0-cc943b1ec5ab/imgs/page1.png)