Meituan Dianping Crunch time in 2019; Initiate At Sell PDF Free Download
1 / 26/26
100%

1
China Tonghai Securities | Meituan Dianping (3690 HK) initiation
19 March 2019
Meituan Dianping
Crunch time in 2019; Initiate At Sell
Initiation of Coverage
We initiate coverage of Meituan Dianping (MTDP) with a non-consensus Sell rating,
as the market does not appear to be fully discounting the negative knock-on effects
from the escalating competitive pressures across its segments and dependence on
subsidies which result in a longer-than-expected turnaround. Near term competitive
pressures for its core food delivery segment, continuing losses of bicycle-sharing
through to 2021 and risk of cost overruns compressing margins keep us on the
sidelines. Our SOTP-based PT of HK$34.33 implies a 37% downside potential.
More losses to come: Fiercer competition, cost inflation and continuing losses for its
new initiatives should cause near to medium term earnings to fall short of market
expectations and we expect net losses of RMB8.7bn in 2019E. Consensus has
revised down 2020E profit forecasts by 60% following its 3Q and 4Q18 results which
showed sequentially widening operating losses. Our 2020E operating profit of
RMB1.2bn is 45% below consensus, primarily attributable to decelerating growth of
China’s on-demand food delivery industry revenue to 35% CAGR (2018-21E) vs.
168% CAGR (2016-18) and continuing losses of bicycle-sharing segment.
Fiercer competition between Tencent’s MTDP and Alibaba’s ele.me : 2019 will be a
crucial year for the core food delivery segment on the back of ele.me’s plans to
increase its market share to over 50% and the need to pay to retain users. A more
competitive food delivery sector should limit upside of MTDP’s monetization rate
and reduce riders’ cost inflation, which are the biggest swing factors to food delivery
segment EBIT according to our sensitivity analysis. 4Q18 results serve as a reminder
of the hyper competitive nature of China’s food delivery market, with food delivery
revenue -1.5% q/q, monetization rate -0.3ppt and GTV flat q/q.
New initiatives to remain in losses through to 2021: The company has yet to conceive
a sustainable revenue model for its capital-intensive bicycle sharing and car-hailing
operations, in our view. We expect new initiatives should continue to drag on
overall profitability and struggle to push our numbers higher than our base case for
operating losses of RMB8.3bn in 2020E and losses of RMB5.9bn in 2021E.
Initiate at Sell on unattractive risk reward proposition: Shares look unattractive at the
current stage, trading at 82.4x 2020E P/E and in the absence of obvious upside
catalysts, significant near-term growth prospects and lack of visibility for its new
initiatives. Our SOTP-based PT of HK$34.33 implies 51.5x 2020E P/E.
Upside risks: 1) Acceleration in food delivery GTV growth and higher monetization
rate driving faster-than-expected turnaround; 2) Faster penetration of merchants;
3) Better-than-expected performance of new initiatives.
Meituan Dianping (3690 HK) Key financials
(RMB’mn)
FY17
FY18
FY19E
FY20E
FY21E
Revenue
33,928
65,227
91,494
127,756
165,650
Growth
161.2%
92.3%
40.3%
39.6%
29.7%
Operating profit
(3,826)
(11,086)
(9,035)
1,228
9,325
Growth
(38.8%)
189.7%
(18.5%)
(113.6%)
659.4%
Adjusted net profit
(2,853)
(8,517)
(7,138)
3,414
11,679
Growth
(46.7%)
198.6%
(16.2%)
(147.8%)
242.1%
Adjusted EPS (RMB)
(1.866)
(3.127)
(1.191)
0.569
1.948
P/E (x)
N/A
N/A
N/A
82.4
24.1
Source: Company data, China Tonghai estimate
China Internet
Esme Pau, CFA
Deputy Head of Institutional Research
(852) 2971 5417
esme.pau@tonghaifinancial.com
LI Yiming, Eric
Research Analyst
(852) 2971 5433
eric.li@tonghaifinancial.com
Equity Research
China Internet
19 March 2019
SELL
Industry View
NEUTRAL
Price Target
HKD34.33
Initial Coverage
Price (18-Mar-2019)
Potential
Upside/Downside
Ticker
HKD54.90
-37%
3690 HK
Market Cap (USD mn)
Shares Outstanding (mn)
Free Float (%)
3M ADVT (USD mn)
Dividend Yield (%)
39,908
4,924
48.0
51
N/A
52 Week range
HKD 40.25-74.00
Source: Bloomberg
Stock Rating

2
China Tonghai Securities | Meituan Dianping (3690 HK) initiation
19 March 2019
INVESTMENT SUMMARY
This is not a near-term turnaround story.
We initiate on Meituan Dianping (MTDP) with a non-consensus Sell
rating. We believe the market has priced in its dominant position in
China’s local services market and expectation for the company’s
operating losses to narrow sequentially. Instead, we expect intensifying
competition faced by its core food delivery business and continuing
losses from new initiatives should weigh on profitability.
We list the five major reasons underpinning our negative view.
More losses to come: Following 4Q18 results which showed greater
competitive pressures and widening underlying losses, we expect
turnaround will be a 2020 story and forecast underlying losses in 2019
and below-consensus earnings through to 2021.
Negative sentiment and lock-up expiry as an overhang: We expect near
term consensus EPS cuts/downgrades and expiry of lock-up on 19 Mar
2019 to weigh on share price performance. Consensus has revised down
2020E net profit forecasts by 60% since Nov 2018.
Intensifying competition is understated: We expect the company’s
market share growth and monetization rate to stall in 2019 due to
escalating competition from Alibaba-backed ele.me. Ele.me targets to
increase its market share to over 50% from (35% at YE18) through
increasing user subsidy and marketing activities. Our sensitivity analysis
indicate that the biggest swing factor to food delivery segment EBIT is
monetization rate (every 1ppt increase will add 31% to 2020E segment
EBIT), followed by riders’ cost inflation (every 1% increase will chip 12%
from 2020E segment EBIT).
New initiatives result in more losses: We struggle to turn more positive
on bicycle-sharing and car-hailing segments and expect underlying losses
to continue through to 2021.
Initiate at Sell on unattractive risk reward proposition: We expect share
price sentiment to remain negative in the near term and see the share’s
82.4x 2020E P/E as expensive in the absence of significant near-term
growth and turnaround prospects.
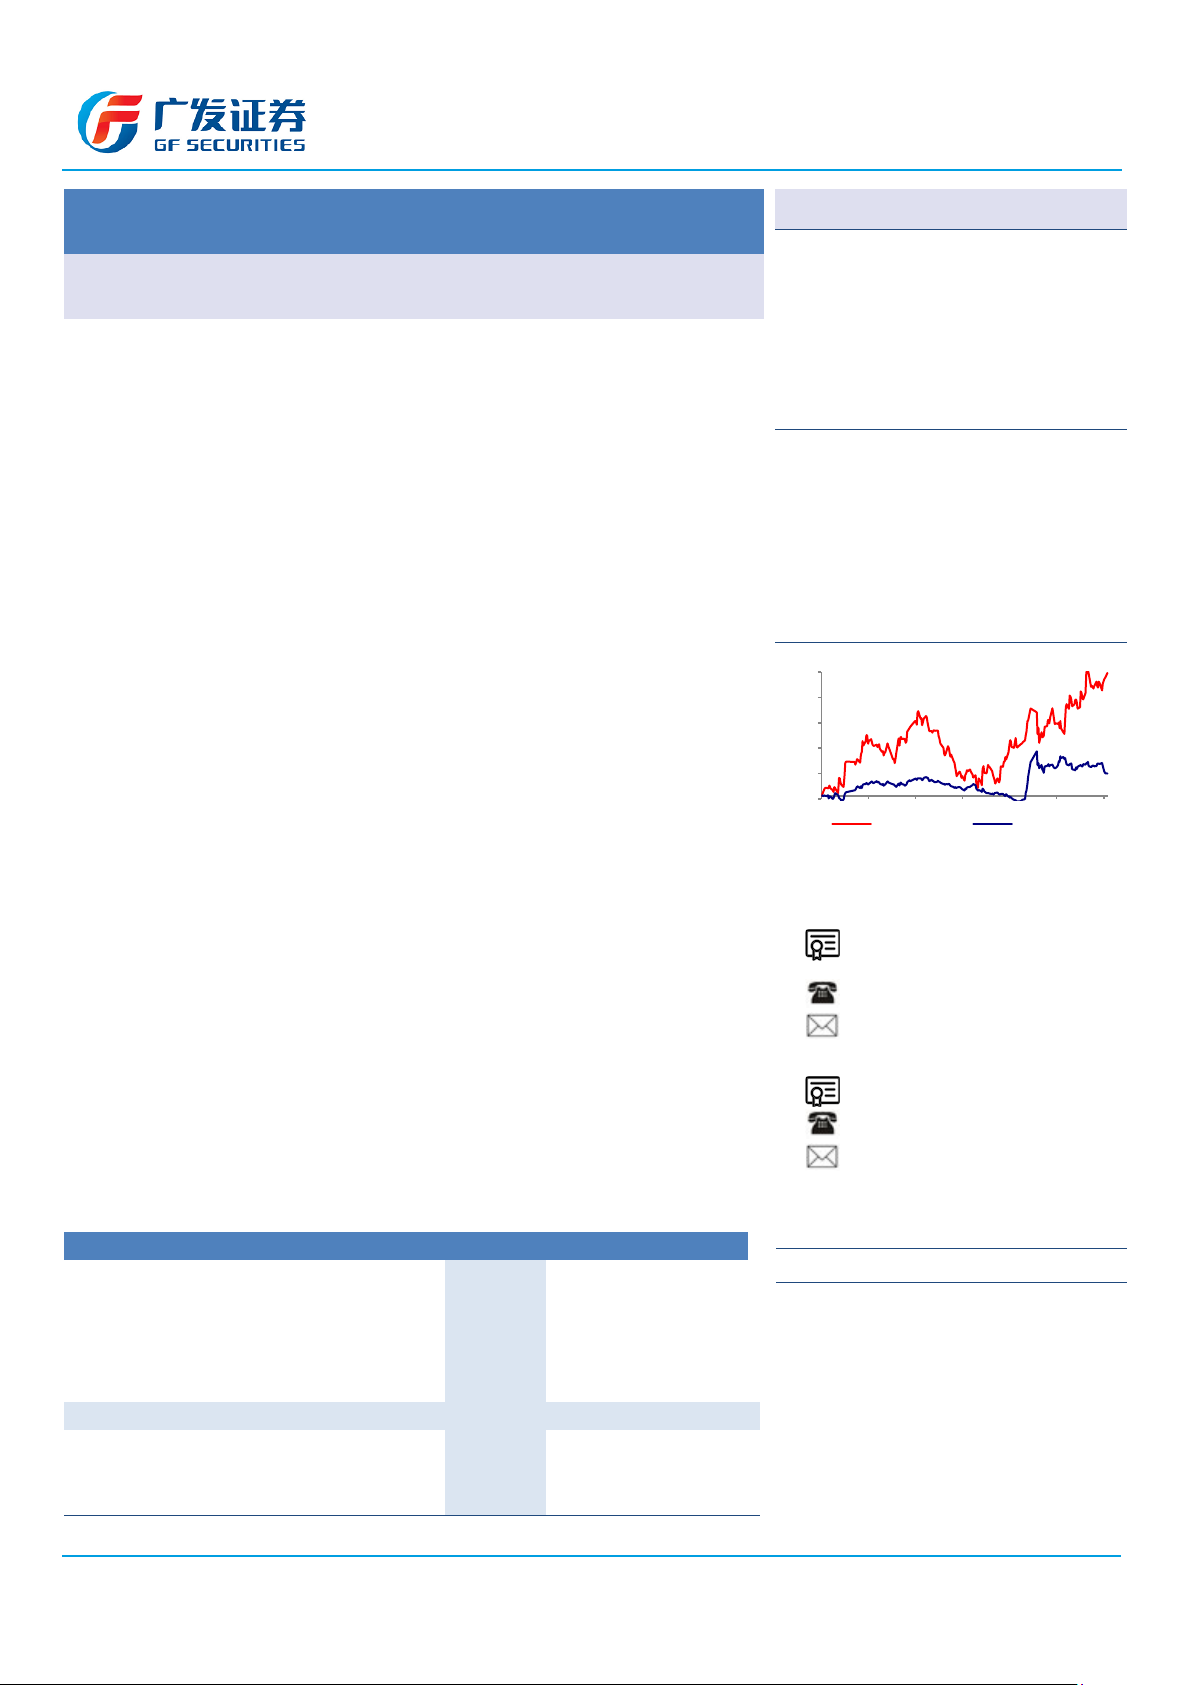
Fig 1. MTDP – Share price performance (HK$)
Fig 2. MTDP – Consensus net profit/loss revision history
Source: Company data, China Tonghai estimates.
Source: Bloomberg consensus estimates.
2
3
4
5
6
7
8
9
10
(6)
(5)
(4)
(3)
(2)
(1)
0
Nov-2018 Jan-2019 Mar-2019
RMB bn
RMB'bn
2019 (LHS) 2020 (RHS)
4Q18 net loss widened
to RMB3.4bn
2020E net profit
revised down by 60%
in the past 5 months
Our TP of HK$34.33
$20
$30
$40
$50
$60
$70
$80
Sep-18 Nov-18 Jan-19 Mar-19
Intensifying competition
with Ele.me
Restructuring to focus
on Food+ Platform
strategy
Expiry of lock-up
period on Mar 19
4Q18 losses widened
IPO at issue price of HK$69
3Q18 losses
MSCI
inclusion
Ofo liquidity
issue

3
China Tonghai Securities | Meituan Dianping (3690 HK) initiation
19 March 2019
1. More losses to come
We do not share consensus’ positive view and expect MTDP to
turnaround to a 2020E operating profit of RMB1.2bn, 45% below
consensus estimates. Our forecast for 2020E operating profit of
RMB1.2bn (RMB3.6bn for food delivery, RMB5.9bn for in-store dining
and OTA, operating loss of RMB8.3bn for new initiatives) factors in cost
overruns due to fiercer competition across its segments, and a
continuation of underlying losses for its car-hailing and bicycle-sharing
operations through to 2021.
Our cautious view is underpinned by:
The need to invest for growth: MTDP will need to keep investing
in subsidies and customer incentives in order to grow its user
base and GTV, on the back of intensifying competition for its
core food delivery and other segments. Between 2016 and
2018, food delivery cost of revenues increased at a CAGR of
140%, outpacing segment GTV CAGR of 120%. We expect food
delivery cost of revenues to increase at a CAGR of 26.8% in
2018-21E, slightly above segment GTV CAGR of 26.1% over the
same period, mainly due to rising user acquisition cost.
Management noted that slower growth will be the norm for
China’s food delivery industry in the longer term following prior
years’ expansion into new cities and onboarding of new users.
In 2019, we expect competition from ele.me to intensify, and
for GTV growth to moderate to 30.6% y/y from 65.3% y/y in
2018.
New business initiatives will remain loss-making through to 2021:
Recent industry events – including the liquidation of ofo,
bicycle-sharing segment losses in 2018 and management’s
decision to shut international bicycle-sharing operations –
indicated that structural headwinds for the segment are
materializing faster than expected. We expect its new business
initiatives will remain loss-making through to 2021 and struggle
to turn more positive as its bicycle-sharing segment has yet to
find a sustainable monetization model. We expect car hailing
operations to remain challenging given the dominance of Didi,
which accounts for 91% market share in Sep 2018.
4Q18 disappointment highlight risks
We see increasing risks to earnings power of MTDP following the
company’s disappointing 4Q18 earnings. 4Q results serve as a reminder
of the hyper competitive nature of China’s food delivery market and the
need to pay to expand (and defend) market share. We highlight the
following drivers:
Decelerating quarterly growth trend: 4Q overall GTV declined
6% q/q to RMB138bn and 4Q revenue growth slowed to +4%
q/q. 4Q18 operating loss of RMB3.7bn widened from -
RMB1.5bn In 4Q17 and -RMB3.4bn In 3Q18. 4Q18 net loss of
RMB3.4bn widened from a loss of RMB2.2bn in 4Q17, due to
bigger losses from new initiatives.
We view consensus earnings
forecast as overly optimistic and
expect near-term cuts
Our 2020E operating profit of
RMB1.2bn is 45% below consensus
The company’s 2018 results fall
short of market expectations, with
losses widening.

4
China Tonghai Securities | Meituan Dianping (3690 HK) initiation
19 March 2019
Structurally slower growth trend for food delivery: Food delivery
operating and financial metrics all signaled decelerating growth
in 4Q. 4Q food delivery revenue of RMB11.0bn declined by
1.5% q/q and GTV of RMB80.2bn was flat q/q. 4Q gross margin
declined to 13.4% from 16.6% in 3Q18 as the company
increased subsidies to retain users. Monetization rate declined
to 13.7% from 14.0% in 3Q18.
Bicycle-sharing dragged on performance: Bicycle sharing
segment, which the company acquired for RMB18.1 bn
(USD2.7bn) in Apr 2018, contributed a loss of RMB4.6bn, over
half of 2018 adjusted net losses, excluding changes in fair value.
As a result, 2018 operating margin worsened to -17.0% from -
11.3% in 2017 (or -10.3% after stripping out bicycle-sharing
segment performance).
In-store, hotel and travel booking EBIT also deteriorated. 4Q
segment gross margin declined to 86.8% from 90.6% in 3Q18
and 87.7% in 4Q17. 4Q segment GTV of RMB44.1bn was -10.5%
q/q. The fall in 4Q GTV was offset by an improvement in
monetization rate to 10.4% from 9.0% in 3Q18, resulting in a
+4% q/q increase in revenue to RMB4.6bn. We expect the in-
store, hotel and travel booking segment to be most profitable
and contribute 484% of 2020E operating profit.
Rider delivery cost overrun in 2019-22E
We expect labor cost per order to increase to RMB5.1 in 2021E from
RMB4.8 in 2018, due to driver cost inflation and higher social insurance
contribution, which should more than offset logistics efficiency gains.
Inelastic rider supply: The elasticity of rider supply varies by the
city. In top tier cities such as Beijing where there is a scarcity of
riders, the agency fee for rider referral has increased to
RMB600-1,000 in 2H18, compared to RMB200-300 previously,
according to media reports.
Nonlinear pay structure to incentivize riders: The typical pay
structure rewards the rider for each delivery completed and the
payout increases at a nonlinear rate in order to incentivize
riders. For example, a rider is paid RMB8 per order for 500
orders or below, RMB9 per order for 500-900 orders, and
RMB10 per order for 900 and above.
Policy change in social insurance: The policy change that came
into effect in Jan 2019 will also increase MTDP’s tax bill for social
insurance for its full time employees. 65% of MTDP’s 2.7mn
riders are full time in 2018.
Escalating competition will limit pass-through to users: There is
minimal switching cost for online food delivery users who are
typically price sensitive. (Please see the section titled
“Intensifying competition is understated” on p.6 of the report
for details.)
The high variable cost nature which
consist of 93% riders’ cost suggests
that there is very little room to cut
expenses. .

5
China Tonghai Securities | Meituan Dianping (3690 HK) initiation
19 March 2019
Fig 3. MTDP – Food delivery cost of revenue, 2018
Fig 4. MTDP – Labour cost per food delivery order, 2017-2021E
Source: Company data
Source: Company data, China Tonghai estimates
2. Negative sentiment and lock-up
expiry as an overhang
Consensus downgrades and EPS cuts should weigh on the stock’s near
term performance, as the market factors in fiercer competition faced by
its core food delivery, in-store dining and OTA segments and longer-
than-expected time for its new initiatives to breakeven.
Selling pressure is coming
The expiry of MTDP’s six-month lock-up period on 19 March 2019 serves
as an overhang on the stock. It is estimated that 2.64 bn shares
(representing 55% of outstanding class B shares or 48% of total
outstanding class A and class B shares) held by pre-IPO and cornerstones
investors.
Figure 5. MTDP – share price and ADTV
Source: Bloomberg.
93%
7%
Riders' costs Others
0
100
200
300
400
500
600
20
30
40
50
60
70
80
Sep-18 Nov-18 Jan-19
US$mn
HK$
Value Traded (RHS) MTDP closing price (LHS)
Delay in breakeven of underlying
losses and consensus downgrades
should drive multiple de-rating
4.5
4.8
4.9
5.0
5.1
7%
2% 2% 2%
0%
1%
2%
3%
4%
5%
6%
7%
4.0
4.2
4.4
4.6
4.8
5.0
5.2
2017 2018 2019E 2020E 2021E
RMB
Riders' costs per order y/y growth

6
China Tonghai Securities | Meituan Dianping (3690 HK) initiation
19 March 2019
3. Intensifying competition is
understated
We expect fierce competition across all of MTDP’s segments and the
company’s reliance on marketing and user acquisition spend to drag on
top-line growth and weigh on margins. MTDP competes with Alibaba-
backed ele.me for its core food delivery segment, with Ctrip and Fliggy
for its OTA segment, with Didi for its car-hailing segment.
Food delivery should be hit the hardest
We expect MTDP’s competition with ele.me to intensify in 2019 and
delay the segment’s operating breakeven to 2020. In July 2018, Ele.me
announced the launch of a RMB3bn plan for subsidies and marketing as
it targets to increase market share to 50% (from 35% in 2018), which
highlights its determination to gain market share. We view ele.me’s
determination to gain market share as a threat to MDTP for the following
reasons:
1. China on-demand food delivery users are highly price sensitive.
When deciding which food delivery mobile app to use, users
consider price as the most important factor, followed by speed,
number of merchants and habit, according to a 2018 survey. 85%
of food delivery users have a habit of comparing price on different
platforms before placing an order.
2. Merchants may choose to leave MTDP platform and turn to their
own food-delivery channels such as WeChat public account in the
event of commission hikes.
3. MDTP will need to further step up their marketing spend in order
to maintain their market share which would erode their food
delivery segment profitability.
Fig 6. MTDP – GTV growth and monetization rate, 2017-2021E
Fig 7. Market share trend of China’s food delivery sector. 2015-22E
Source: Company data, China Tonghai estimates.
Source: analysys, China Tonghai estimates.
0%
50%
100%
150%
200%
250%
300%
350%
2017 2018 2019E 2020E 2021E
Food delivery GTV growth Food delivery revenue growth
29%
47% 57% 60% 60% 60% 61% 62%
37%
35%
36% 35% 35% 35% 35% 34%
34%
18% 7% 5% 5% 5% 5% 4%
0%
20%
40%
60%
80%
100%
2015 2016 2017 2018 2019E 2020E 2021E 2022E
Meituan Ele.me Other's
Head on competition across all
segments point to margin erosion
and slower GTV growth
Ele.me’s determination to gain
market share poses a real threat to
MDTP, in our view

7
China Tonghai Securities | Meituan Dianping (3690 HK) initiation
19 March 2019
Operating results are most sensitive to monetization
rate and inflation of riders’ cost
We present a sensitivity analysis to show that a marginal change in food
delivery segment monetization rate, followed by riders cost inflation, has
the largest impact on MTDP’s food delivery operating results among
other key inputs.
Relative to our base case for a 2020E operating profit of RMB1.2bn, our
sensitivity analysis shows that:
Every 1ppt increase in monetization rate results in a 31% increase in
2020E food delivery segment operating profit. Fiercer competition would
likely drives down monetization rate and result in lower food delivery
segment operating results.
Every 1% increase in riders’ cost inflation results in a 12% decrease in
2020E food delivery segment operating profit. Riders’ cost inflation has
the second largest impact on food delivery segment operating profits.
Intensifying competitive pressure likely drives up riders’ cost and is
detrimental to food delivery segment operating profit.
Figure 8. MTDP – Sensitivity of changes of key inputs to 2020E operating profit
Sensitivity Tests
Operating Metrics
Food delivery GTV growth
1% slower
Base case (25.5%)
1% faster
Food delivery operating income
3,450
3,587
3,724
% change
-3.8%
3.8%
Food delivery monetization rate
1ppt lower
Base case (15.5%)
1ppt higher
Food delivery operating income
2,475
3,587
4,699
% change
-31.0%
31.0%
In-store dining/OTA GTV growth
1% slower
Base case (36.0%)
1% faster
In-store dining/OTA operating income
5,747
5,944
6,141
% change
-3.3%
3.3%
In-store dining/OTA monetization rate
1ppt lower
Base case (9.1%)
1ppt higher
In-store dining/OTA operating income
2,996
5,944
8,892
% change
-49.6%
49.6%
Riders' costs of inflation
1% slower
Base case (25.7%)
1% faster
Food delivery operating income
4,021
3,587
3,153
% change
12.1%
-12.1%
Source: China Tonghai estimates.
Head-on competition with Alibaba on all fronts
We expect competition for market share between MTDP and Alibaba to
intensify in 2019 on the back of Alibaba’s commitment to compete in
China’s local services segment as part of its New Retail strategy. Based
on its successful execution track record in the past, we expect Alibaba to
follow through its commitment into competition for market share.
Food delivery: Alibaba is unequivocal about its determination to compete
for higher share in the food delivery segment, as demonstrated by (1) its
Our sensitivity analysis indicates
that segment monetization rate is
the largest swing factor to MTDP’s
food delivery operating results,
followed by riders’ cost inflation.
2019 marks the year of fiercer
competition between MTDP and
Alibaba across its core segments

8
China Tonghai Securities | Meituan Dianping (3690 HK) initiation
19 March 2019
acquisition of full control of Ele.me in April 2018; (2) the launch of a
RMB3bn user subsidy and marketing plan in July 2018; (3) its restructure
of ele.me and Koubei in Aug 2018; and (4) its target to increase its market
share to 50%.
MTDP was able to overtake ele.me in 2016 to claim a market leading
position in China’s online food delivery market. However, after Alibaba’s
acquisition of full ownership of ele.me in April 2018, we expect
intensifying competition on price as ele.me would likely step up
marketing and promotional initiatives to compete for users.
Fig 9. Overlapping segments between MTDP and Alibaba
MTDP
Alibaba
Vertical
Presence
Market share % (2018)
Presence
Market share % (2018)
Food delivery
Meituan Waimai
61.3%
Ele.me
28.6%
In-store dining
Meituan, Dianping
35.9% (2017)
Koubei
55.5% (2017)
Travel
Meituan travel
12% (2017)
Fliggy
8% (2017)
Grocery delivery
Meituan Paotui
N/A
N/A
O2O grocery
Ella Supermarket
2.7%
Hema
42%
Car hailing
Meituan Dache
~2%
Didi*
90%
Bicycle sharing
Meituan Danche
(formerly mobike)
49.1%
Hellobike*
5.6%
Online movie ticketing
Maoyan*
60.9%(1H18)
Taopiaopiao,
Damai
33.9%(1H18, Taopiaopiao)
Payments
Meituan
N/A
Alipay
52%
2C lending
Meituan Jieqian
N/A
Huabei, Jiebei
N/A
2B lending
Meituan Xiaodai
N/A
Xiaodai
N/A
Cloud
Cloud-based ERP
N/A
AliCloud
43% (1H18)
Source: Analysys, BDR, CHNIC, IDC, iResearch, Tencent news, Trustdata, Winshang, China Tonghai estimates
Note: Entities marked with asterisk denotes investment backing or affiliation from MTDP or Alibaba.
Online hotel and travel: MTDP will see near term earnings erosion for its
profitable online hotel and travel booking business due to the company’s
pursh into higher-end hotels and international travel in 2019 which will
drive expenses higher, in our view. MTDP leads with 33.6% share of
domestic room nights booked, ahead of 33% for Ctrip in 1Q18 , primarily
driven by volume as the majority of its hotel room inventories are in
lower star hotels. However, MTDP’s international exposure share share
of 4 to 5 star hotels pales in comparison relative to Ctrip and Alibaba-
backed Fliggy.
Car-hailing: MTDP has 2% of China’s car-hailing industry, below Didi’s 91%
market share (Sept 2018). Alibaba owns 5% stake in Didi as of 2018.
We expect MTDP to maintain its
industry leading position with 61%
market share in 2021E, though at
the expense of margin
compression.

9
China Tonghai Securities | Meituan Dianping (3690 HK) initiation
19 March 2019
Fig 10. China food delivery market share by GTV
Fig 11. China online hotel booking by share of domestic room nights
Source: iResearch
Source: iResearch
Fig 12. China food delivery – strategy and milestones of MTDP and ele.me
Source: Company data, media
32%
47% 56% 59%
37%
35%
36% 36%
17%
10%
5% 4%
15% 8% 3% 1%
0%
20%
40%
60%
80%
100%
2015 2016 2017 1Q18
Meituan Ele.me Baidu Delivery Others
20% 25% 31% 34%
40% 38% 34% 33%
12% 11% 12% 12%
4% 6% 6% 6%
25% 21% 17% 16%
0%
20%
40%
60%
80%
100%
2015 2016 2017 1Q18
Meituan Ctrip Tongcheng eLong Fliggy Others
MTDP launched a merchant subsidy plan and will invest
RMB11bn to support merchants in areas of marketing,
digitalization, supply chain enhancement and incentives in
2019. It would also increase its focus on 2B solutions in 2019.
Ele.me and Koubei targets to hire over 800k riders and 5k new
employees in 2019.
Ele.me announced it would launch a merchant support plan in
2019, focusing on digitalization and reducing commission rate.
Meituan gains an entry point in WeChat Wallet.
MTDP increased commission rate charged to certain
merchants from 18% to 20%.
Alibaba announced the establishment of a local service
company and merge its food delivery platform Ele.me with its
food & lifestyle service platform Koubei.
Ele.me will invest RMB3bn on subsidy and marketing in the
coming quarter to capture at least 50% of China food delivery
market.
MTDP announced a restructuring to focus on Food + Platform
strategy.
MTDP opened its first offline supermarket Ella Supermarket,
which is similar to Hema, offering 30 min delivery within a
radius of 3km.
Alibaba acquired the remaining stake in Ele.me that it and Ant
Financial did not already own, at an enterprise valuation of
US$9.5bn.
Alibaba invested US$1bn in Ele.me, bringing its combined
stake with Ant Financial to ~44%.
Ele.me merged with Baidu Deliveries (#3 player, with a focus
on Beijing and tier-1cities) for US$0.8bn, with Ele.me paying
US$0.2bn in cash and US$0.3bn in shares, while Baidu will
contribute US$0.3bn worth of traffic and resources.
Alibaba and Ant Financial invested US$0.9bn and US$0.35bn
respectively in Ele.me for a combined 27.7% stake.
Establishment of Koubei, a 50/50 joint venture between
Alibaba and Ant Financial, with a combined initial investment
of US$1bn.
Meituan provided subsidies for riders during Chinese New
Year and stepped up hiring after the holiday to maintain
delivery capacity.
Meituan merged with Dianping to form an O2O giant.
Food delivery market share of Meituan reached 41% in 1H15,
surpassing Ele.me and ranking first.
1Q19
2018
2017
2016
2015

10
China Tonghai Securities | Meituan Dianping (3690 HK) initiation
19 March 2019
4. New initiatives result in more losses
We struggle to turn more positive on new initiatives and would need to
see more evidence of narrowing underlying losses despite encouraging
comments from management that it would pare back on loss-making
bicycle-sharing and ride-hailing operations.
We remain cautious on bicycle sharing and ride
hailing
Management commented at 4Q18 results that it would significantly
narrow the operating losses of both the car-hailing and bike-sharing
businesses. MTDP also confirmed that it is shutting down its
international bicycle-sharing operations. However, we struggle to push
our numbers higher than our base case for segment operating loss of
RMB8.3bn in 2020E and loss of RMB5.9bn in 2021E, as we expect MTDP
will struggle to find a sustainable monetization model and synergies for
its bicycle-sharing and its core food delivery segment.
5. Unattractive risk reward proposition
Following YTD share price appreciation by 26% (outperforming the HSI
which was up 14% over the same period), MTDP’s shares currently
trades at 82.4x on our 2020E EPS estimates and is the most expensive
stock in the China internet space. The shares are trading close to the
historical peak forward P/E of 90x.
The market does not appear to have fully priced in the investment
negatives of MTDP, namely the escalating competition in food delivery
that will erode profitability, and the continued losses of its bicycle-
sharing and ride-hailing segments.
Fig 13. MTDP – Share price performance and key events (HK$)
Source: Bloomberg, company data, China Tonghai estimates.
Overall, we expect MTDP to have to
defer to a subsidy model to build
scale for its new business initiatives.
We expect multiples to come down
as we see increasing risk in higher
competition compressing margins
of its food delivery segment and
continuing losses of new initiatives.
Our TP of HK$34.33
$20
$30
$40
$50
$60
$70
$80
Sep-18 Nov-18 Jan-19 Mar-19
Intensifying competition with
Ele.me
Restructuring to focus on
Food+ Platform strategy
Expiry of lock-up period
on Mar 19
4Q18 losses widened
IPO at issue price of HK$69
3Q18 losses
MSCI inclusion
ofo liquidity issue

11
China Tonghai Securities | Meituan Dianping (3690 HK) initiation
19 March 2019
Sell rating with a TP of HK$34.33
We arrive at a 12-month TP of HK$34.33 based on SOTP valuation, which
we believe best reflects the intrinsic value of its multiple business
segments. Our SOTP valuation of RMB176bn is based on following 2020E
target multiples applied to the respective financial metrics: 1) 30.0x
EV/EBIT for food delivery; 2) 9.0x EV/EBIT for in-store/OTA; and 3) net
cash. We ascribe no value to its bike sharing and other new business
initiatives as we expect these segments to remain loss-making through
to 2021. We believe it is challenging for MTDP to turnaround its new
business initiatives and thus take a conservative view on the valuation of
this segment.
MTDP’s core food delivery accounted for 61% of the total valuation and
in-store/OTA accounted for 30%.
We value MTDP’s food delivery services at 30.0x 2020E EV/EBIT multiple,
in line with the global food delivery peers that are generating positive
operating profit with average ROE of c5% in 2020E. We value the in-
store/OTA segment at 9.0x 2020E target EV/EBIT, the lower end of the
range for its global peers, as it is facing strong competition from Ctrip
and Fliggy in China OTA market.
Fig 14. Meituan’s SOTP valuation
RMB'mn
Valuation basis
Metrics
Assigned
multiple
Segment as % of
total
Valuation
Food delivery
2020E EV/EBIT
2020E EBIT RMB 3,587mn
30.0
61%
107,615
In-store/OTA
2020E EV/EBIT
2020E EBIT RMB 5,944mn
9.0
30%
53,495
New initiatives
Bike sharing
2020E EBIT -RMB 1,028mn
0.0
0%
0
Other new business
initiatives
2020E EBIT -RMB 7,275mn
0.0
0%
0
Net cash
8%
14,774
Total valuation
175,883
2020E adjusted net profit
3,414
2020E implied P/E
multiple
51.5
Total diluted shares (mn)
5,995
2020E adjusted diluted
EPS (RMB)
0.57
Target price (HKD)
34.33
Source: Company data, China Tonghai estimates

12
China Tonghai Securities | Meituan Dianping (3690 HK) initiation
19 March 2019
Potential catalyst and risks
To the upside:
- Increasing market share and higher monetization rate of food
delivery driving faster-than-expected turnaround;
- Better-than-expected performance of new initiatives such as 2B
merchant services;
- Faster penetration of merchants for hotel booking segment
driving margins higher;
-
To the downside:
- Heightened competition eroding market share and profitability;
- Tightened regulations on food delivery leading to higher
compliance costs;
- Worsening performance on new initiatives continue to weigh
on margins.

13
19 March 2019
China Tonghai Securities | Meituan Dianping (3690 HK) initiation
Fig 15. Peer comparison table
MktCap
3m Vol
EPS Growth (%)
P/E (x)
P/S (x)
PEG (x)
ROE (%)
Ev/Ebit (x)
Net D/E
(%)
Company Name
Ticker
Lcy
Price
US$bn
US$m
2020
2021
2020
2021
2020
2021
2020
2021
2020
2021
2020
2021
18
MEITUAN DIANPING
3690 HK
HKD
54.90
39.9
51
-
242.1
82.4
24.1
2.2
1.7
-
0.3
1.2
6.8
52.9
17.0
(17)
Global food delivery
DELIVERY HERO SE
DHER GR
EUR
35.54
7.6
13
61.6
219.0
-
45.1
4.3
3.2
-
-
(11.9)
13.7
-
48.6
(36)
JUST EAT PLC
JE/ LN
GBp
748.60
6.8
23
84.9
56.6
38.2
24.4
3.9
3.3
0.8
0.7
12.5
18.7
28.8
21.6
(10)
GRUBHUB INC
GRUB US
USD
74.98
6.8
205
54.9
36.3
34.1
25.0
3.9
3.3
1.0
0.9
11.7
17.9
31.4
16.5
8
TAKEAWAY.COM
TKWY NA
EUR
67.20
3.9
7
659.1
96.2
80.7
41.1
7.0
5.7
-
0.8
9.2
19.0
58.6
31.3
43
Average
215.1
102.0
44.2
31.4
4.5
3.6
0.9
0.8
5.4
17.3
35.8
25.1
1
Global In-store dining
YELP INC
YELP US
USD
35.10
2.9
99
22.1
17.6
16.6
14.1
2.5
2.2
0.9
0.9
11.8
13.7
25.9
-
(70)
GROUPON INC
GRPN US
USD
3.53
2.0
24
18.9
13.0
14.8
13.1
0.8
0.8
0.9
1.1
25.6
19.4
8.9
6.8
(159)
Average
20.5
15.3
15.6
13.6
1.2
1.2
0.9
1.0
18.7
16.6
13.3
6.8
(115)
China related peers
ALIBABA GRP-ADR
BABA US
USD
180.97
469.1
2,483
23.8
29.2
27.3
21.2
6.1
4.7
1.4
0.9
17.0
17.9
34.1
27.3
(28)
58.COM-ADR
WUBA US
USD
61.76
9.2
60
29.9
15.8
16.0
13.8
3.4
2.9
0.7
1.0
12.7
14.7
14.3
11.7
(25)
CTRIP.COM-ADR
CTRP US
USD
41.67
23.1
182
37.6
30.4
23.9
18.3
3.6
3.0
0.9
0.8
6.6
8.3
25.2
20.3
2
Average
30.4
25.2
21.3
17.2
4.0
3.4
0.9
0.9
12.1
13.6
21.6
17.5
(17)
OTA
BOOKING HOLDINGS
BKNG US
USD
1,752
78.9
870
12.0
10.8
15.5
14.0
4.6
4.1
1.5
1.4
52.3
45.9
12.0
11.8
(69)
CTRIP.COM-ADR
CTRP US
USD
41.67
23.1
182
37.6
30.4
23.9
18.3
3.6
3.0
0.9
0.8
6.6
8.3
25.2
20.3
2
EXPEDIA GROUP IN
EXPE US
USD
121.56
17.9
192
15.8
16.4
15.0
12.9
1.3
1.2
1.1
0.9
23.2
26.7
13.5
11.2
22
TRIPADVISOR INC
TRIP US
USD
51.59
7.1
143
13.7
16.2
23.5
20.2
3.8
3.4
2.0
1.5
14.3
12.5
17.4
17.5
(46)
Average
19.8
18.5
18.6
15.8
2.6
2.3
1.2
1.1
24.1
23.3
15.7
14.3
(23)
Global Average
82.5
45.2
21.7
18.5
2.7
2.4
1.0
0.9
14.7
18.2
19.1
15.8
(28)
Source: Bloomberg consensus estimates, company data, China Tonghai estimates.
Note: Priced as of 18 Mar 2019 close.

14
19 March 2019
China Tonghai Securities | Meituan Dianping (3690 HK) initiation
APPENDIX 1
Company background
MTDP is China’s leading online platform for local services and on-
demand food delivery market. The company also expanded its service
coverage to various local services including in-store dining, online hotel
and travel booking, car hailing and bicycle-sharing services. The company
was founded by Wang Xing and Mu Rongjin as a group-purchase
platform in 2010 and acquired Dianping in 2015. The company was listed
on the HKSE in Sep 2018.
Use of IPO proceeds
MTDP will apply the net proceeds of HK$31.1bn from its 20 Sept 2018
IPO on the following:
- 35% (HK$10.9 bn) to upgrade technology and enhance R&D;
- 35% (HK$10.9 bn) to develop new services and products (such
as merchant enabling solutions, cloud-based ERP systems;
restaurant supply chain);
- 20% (HK$6.2 bn) to pursue investments;
- 10% (HK$3.1 bn) for working capital and general corporate
purposes.
Fig 16. MTDP – Key milestones
Source: Company data.
Year
Event
2003
Dianping.com founded
2010
Meituan.com founded
2011
Launched Meituan App
2012
Launched movie-ticketing services
2013
Launched hotel booking and food delivery service
2014
Launched travel booking service
2015
Merger of Meituan and Dianping
2016
Spin-off of Maoyan
Acquired Qiandai and launch merchant payment services
2017
Launched grocery delivery services
Launched Zhenguo Homes, a home-sharing platform
Launched Xiaoxiang Shengxian (Ella Supermarket), an O2O grocery store
2018
Launched car-hailing service
Acquired Mobike
Listing on HKSE

15
19 March 2019
China Tonghai Securities | Meituan Dianping (3690 HK) initiation
Key shareholders
Fig 17. MTDP – Shareholding structure
Fig 18. MTDP – Percentage of voting rights
Source: Company data, Bloomberg, China Tonghai estimates.
Source: Company data, Bloomberg, China Tonghai estimates.
Financial performance and forecasts
Overall
Financial forecasts
Revenue: We expect MTDP’s revenue to increase to
RMB165.7bn in 2021E, implying a CAGR of 36.4% (2019E-21E),
driven by revenue contribution from the core food delivery
services and new business initiatives.
User base: Total annual transacting user base will reach 879mn
in 2021E, from 400mn in 2018on our estimates.
Operating profit: We expect to the company to breakeven on an
operating level to RMB 1.2bn in 2020.
Monetization rate: We expect monetization rate to increase
from 9.5% in 2017 to 14.8% in 2021.
GTV: Total GTV will reach RMB 1,119bn by 2021, from RMB
515bn in 2018. GTV mix in 2021E will comprise 51% core food
delivery, 38% in-store, hotel & travel, 12% new initiatives (from
55%: 34%: 11% in 2018).
Tencent 18%
Other pre-IPO
investors 17%
WANG Xing
10%
Sequoia 10%
MU Rongjun
2%
WANG Huiwen
1%
Public float
42%
WANG Xing
47%
MU
Rongjun
10%
Tencent
8%
WANG
Huiwen 3%
Other pre-IPO
investors 8%
Sequoia 5%
Public float 19%

16
19 March 2019
China Tonghai Securities | Meituan Dianping (3690 HK) initiation
Fig 19. MDTP – Segment GTV, 2015-2022E (RMB bn)
Fig 20. MDTP – Segment monetization rate, 2015-2022E (%)
Source: Company data, China Tonghai estimates
Source: Company data, China Tonghai estimates
Food delivery (56% of 2019E revenue)
Financial forecasts
Revenue: Food delivery will remain the largest revenue
contributor, accounting for 56% of 2021E revenue. We expect
food delivery revenue to grow at 34.8% CAGR (2018-21E) to
RMB93.5bn in 2021E.
Operating profit: We expect food delivery segment to
turnaround to an operating profit of RMB3.6bn in 2020E, from
segment operating loss of RMB3.9bn in 2019E.
Monetization rate: We expect monetization rate to increase
from 12.3% in 2017 to 16.5% in 2021.
GTV: We expect food delivery GTV to grow at 26.1% CAGR
(2018-21E) to reach RMB567bn in 2021E, driven by increasing
number of transacting users and transacting frequency.
In-store dining, online hotel & travel booking (23%
of 2019E revenue)
Financial forecasts
Revenue: In-store dining, online hotel & travel booking will
account for 23% of 2021E revenue (same as 2019E). We expect
segment revenue to grow at 34.6% CAGR (2018-21E), driven by
an increase in merchant base and market share in domestic
hotels.
Operating profit: We expect segment operating profit to
increase to RMB5.9bn in 2020E from RMB5.3bn in 2019E.
Monetization rate: We expect monetization rate to increase to
9.2 % in 2021E from 6.9% in 2017.
GTV: We expect In-store dining, online hotel & travel booking
GTV to grow at 33.7% CAGR (2018-21E) to reach RMB421bn in
2021E, driven by the increasing number of transacting users
with traffic directed from its food delivery services.
New initiatives (20% of 2019E revenue)
16 59 171 283 369 463 567
127 158
158
176
241
328
421
18 20
28
56
84
109
131
0
200
400
600
800
1,000
1,200
2015 2016 2017 2018 2019E 2020E 2021E
RMB'bn
Food delivery In-store/hotel New Initiatives
0%
5%
10%
15%
20%
25%
30%
2015 2016 2017 2018 2019E 2020E 2021E
Food delivery In-store/hotel
New Initiatives Total

17
19 March 2019
China Tonghai Securities | Meituan Dianping (3690 HK) initiation
We expect revenue contribution from new initiatives (which comprise
bicycle-sharing, car-hailing, 2B merchant services and others) will
increase to RMB33.5bn in 2021E from RMB11.2bn in 2018. We estimate
new initiatives will continue to incur substantial losses through to 2021
of RMB5.9bn.
.

18
19 March 2019
China Tonghai Securities | Meituan Dianping (3690 HK) initiation
Sensitivity analysis
Food delivery operating results
For every 1% increase in food delivery GTV growth to our base
assumption of 25.5% for 2020E, food delivery operating income
increases 3.8%.
For every 1ppt increase in food delivery monetization rate to
our base assumption of 15.5% for 2020E, food delivery
operating income increases 31.0%.
Fig 21. MTDP – Sensitivity of food delivery operating profit/loss to food delivery GTV growth and monetization rate
Food delivery monetization rate
Food delivery GTV growth
20.5%
21.5%
22.5%
23.5%
24.5%
25.5%
26.5%
27.5%
28.5%
29.5%
30.5%
3,587
445
448
452
456
460
463
467
471
474
478
482
+5ppt
20.5%
8,238
8,420
8,601
8,783
8,964
9,146
9,327
9,509
9,691
9,872
10,054
+4ppt
19.5%
7,171
7,343
7,516
7,689
7,861
8,034
8,207
8,380
8,552
8,725
8,898
+3ppt
18.5%
6,103
6,267
6,431
6,595
6,759
6,922
7,086
7,250
7,414
7,578
7,742
+2ppt
17.5%
5,036
5,191
5,346
5,501
5,656
5,811
5,966
6,121
6,276
6,431
6,585
+1ppt
16.5%
3,968
4,114
4,261
4,407
4,553
4,699
4,845
4,991
5,137
5,283
5,429
Base
15.5%
2,901
3,038
3,175
3,313
3,450
3,587
3,724
3,862
3,999
4,136
4,273
-1ppt
14.5%
1,834
1,962
2,090
2,219
2,347
2,475
2,604
2,732
2,861
2,989
3,117
-2ppt
13.5%
766
886
1,005
1,125
1,244
1,364
1,483
1,603
1,722
1,842
1,961
-3ppt
12.5%
(301)
(191)
(80)
31
141
252
363
473
584
695
805
-4ppt
11.5%
(1,369)
(1,267)
(1,165)
(1,063)
(962)
(860)
(758)
(656)
(554)
(453)
(351)
-5ppt
10.5%
(2,436)
(2,343)
(2,250)
(2,157)
(2,065)
(1,972)
(1,879)
(1,786)
(1,693)
(1,600)
(1,507)
Source: China Tonghai estimates.

19
19 March 2019
China Tonghai Securities | Meituan Dianping (3690 HK) initiation
In-store dining/OTA operating results
For every 1% increase in in-store dining/OTA GTV growth to our
base assumption of 36.0% for 2020E, food delivery operating
income increases 3.3%.
For every 1ppt increase in in-store dining/OTA monetization
rate to our base assumption of 9.1% for 2020E, food delivery
operating income increases 49.6%.
Fig 22. MTDP – Sensitivity of in-store dining/OTA operating profit/loss to segment GTV growth and monetization rate
In-store dining/OTA monetization rate
In-store dining/OTA GTV growth
31.0%
32.0%
33.0%
34.0%
35.0%
36.0%
37.0%
38.0%
39.0%
40.0%
41.0%
8,91
6
316
318
320
323
325
328
330
332
335
337
340
+5ppt
14.1%
19,159
19,464
19,769
20,074
20,379
20,684
20,990
21,295
21,600
21,905
22,210
+4ppt
13.1%
16,319
16,602
16,886
17,169
17,453
17,736
18,020
18,303
18,587
18,870
19,154
+3ppt
12.1%
13,479
13,741
14,003
14,265
14,526
14,788
15,050
15,312
15,574
15,835
16,097
+2ppt
11.1%
10,640
10,880
11,120
11,360
11,600
11,840
12,080
12,320
12,560
12,800
13,041
+1ppt
10.1%
7,800
8,018
8,237
8,455
8,674
8,892
9,110
9,329
9,547
9,766
9,984
Base
9.1%
4,960
5,157
5,354
5,550
5,747
5,944
6,141
6,337
6,534
6,731
6,927
-1ppt
8.1%
2,121
2,296
2,471
2,646
2,821
2,996
3,171
3,346
3,521
3,696
3,871
-2ppt
7.1%
(719)
(566)
(412)
(259)
(106)
48
201
354
508
661
814
-3ppt
6.1%
(3,559)
(3,427)
(3,296)
(3,164)
(3,032)
(2,901)
(2,769)
(2,637)
(2,505)
(2,374)
(2,242)
-4ppt
5.1%
(6,399)
(6,289)
(6,179)
(6,069)
(5,959)
(5,849)
(5,739)
(5,629)
(5,519)
(5,409)
(5,299)
-5ppt
4.1%
(9,238)
(9,150)
(9,062)
(8,973)
(8,885)
(8,797)
(8,708)
(8,620)
(8,532)
(8,443)
(8,355)
Source: China Tonghai estimates.

20
19 March 2019
China Tonghai Securities | Meituan Dianping (3690 HK) initiation
APPENDIX 2
Scenario analysis
Base case
Key drivers: Intensifying competition between MTDP and its peers
eroding profitability; cost inflation (in particular for riders’ cost);
turnaround in 2020; new initiatives weighing on operating results and
segment losses to sustain through to 2020.
Valuation methodology: Our 12-month PT of HK$34.33 is based on SOTP
valuation. Our SOTP valuation of RMB176bn is based on following 2020E
target multiples applied to the respective financial metrics: 1) 30.0x
EV/EBIT for food delivery; 2) 9.0x EV/EBIT for in-store/OTA; and 3) net
cash.
Bull case
Key drivers: Higher-than-expected monetization, better cost control
across the board, faster-than-expected turnaround of food delivery
segment, success in new initiatives
Valuation methodology: Our upside case of HK$66.60 is based on SOTP
valuation, cross checked with target P/E valuation. The target P/E of
100x FY2020 P/E, defined by the peak P/E multiple plus 10% premium
since the company’s IPO. Faster-than-expected turnaround should drive
multiples higher, in our view.
Bear case
Key drivers: Deteriorating competitive landscape leading to larger-than-
expected food delivery segment losses; new initiatives such as bicycle-
sharing and car-hailing sinking into larger losses; cost overrun due to
driver cost inflation; negative sentiment on the back of consensus EPS
cuts and downgrades driving share price lower.
Valuation methodology: Our bear case of HK$13.30 is based on SOTP
valuation, cross checked with target P/E valuation. The target P/E of 20x
FY 2020E P/E is in line with the average forward P/E of its China internet
peer group.

21
19 March 2019
China Tonghai Securities | Meituan Dianping (3690 HK) initiation
Fig 23. MDTP – share price performance, bull and bear case (HK$)
Source: Bloomberg, China Tonghai estimates.
0
10
20
30
40
50
60
70
80
Sep-18 Dec-18 Mar-19 Jun-19 Sep-19 Dec-19
HK$34.33 (-37%)
HK$13.30 (-76%)
HK$66.60 (+21%)

22
19 March 2019
China Tonghai Securities | Meituan Dianping (3690 HK) initiation
APPENDIX 3
Fig 24. China food delivery – industry forecasts
RMB mn
2015
2016
2017
2018
2019E
2020E
2021E
2022E
Food delivery
Number of users (mn)
209
256
305
355
391
430
464
496
YoY
29%
22%
19%
16%
10%
10%
8%
7%
Meituan's users
229
256
282
313
344
375
YoY
12%
10%
11%
10%
9%
Eleme's user
137
164
178
194
209
224
YoY
20%
8%
9%
8%
7%
Annual transactions per user
10.4
12.9
18.8
22.9
25.2
27.2
29.2
30.9
YoY
24%
46%
22%
10%
8%
7%
6%
ASP (RMB)
25
38
52
58
62
66
69
72
YoY
51%
39%
10%
8%
6%
5%
4%
Industry GTV (RMB'bn)
54
124
300
469
612
771
936
1,104
YoY
130%
142%
56%
31%
26%
21%
18%
Meituan's GTV
16
59
171
283
369
463
567
680
YoY
277%
191%
65%
31%
25%
22%
20%
Ele.me's GTV
20
43
108
162
214
267
326
375
YoY
115%
151%
50%
32%
25%
22%
15%
Market share
Meituan
29%
47%
57%
60%
60%
60%
61%
62%
Ele.me
37%
35%
36%
35%
35%
35%
35%
34%
Source: iReserach, Trustdata, Company data, China Tonghai estimates.

23
19 March 2019
China Tonghai Securities | Meituan Dianping (3690 HK) initiation
COMPANY CHARTS
Fig 25. MTDP – Revenue by segment, 2016-2021E
Fig 26. MTDP – Revenue by segment, 2019E
Source: Company data, China Tonghai estimates.
Source: Company data, China Tonghai estimates.
Fig 27. MTDP – Cost of revenue, 2016-2021E
Fig 28. MTDP – Cost of revenue, 2019E
Source: Company data, China Tonghai estimates.
Source: Company data, China Tonghai estimates.
Fig 29. MTDP – R&D and Marketing as % of revenue, 2015-2021E
Fig 30. MTDP – Food delivery GTV and revenue growth rate, 2017-
2021E
Source: Company data, China Tonghai estimates.
Source: Company data, China Tonghai estimates.
5 21 38 52 72 93
7 11
16
21
30
39
1 2
11
19
26
34
0
20
40
60
80
100
120
140
160
180
2016 2017 2018 2019E 2020E 2021E
RMB'bn
Food delivery Instore dining, hotel and travel New initiatives and others
57%
23%
20%
Food delivery Instore dining, hotel and travel New initiatives and others
6 19
33 43 55 67
1
1
2
2
3
4
1
16
19
25
25
0
20
40
60
80
100
120
2016 2017 2018 2019E 2020E 2021E
RMB'bn
Food delivery Instore dining, hotel and travel New initiatives and others
0%
40%
80%
120%
160%
200%
2015 2016 2017 2018 2019E 2020E 2021E
Marketing expenses R&D expenses
0%
50%
100%
150%
200%
250%
300%
350%
2017 2018 2019E 2020E 2021E
Food delivery GTV growth Food delivery revenue growth
67%
4%
29%
Food delivery Instore dining, hotel and travel New initiatives and others

24
19 March 2019
China Tonghai Securities | Meituan Dianping (3690 HK) initiation
Fig 31. MTDP – Revenue breakdown by segment, 2015-2021E
Fig 32. MTDP – Revenue breakdown of in-store & travel and hotel,
2015-2021E
Source: Company data, China Tonghai estimates.
Source: Company data, China Tonghai estimates.
Fig 33. MTDP – Revenue breakdown of New initiatives, 2017-
2021E
Fig 34. MTDP – Gross, operating and net margin, 2015-2021E
Source: Company data, China Tonghai estimates.
Source: Company data, China Tonghai estimates.
4%
41%
62% 58% 56% 56% 56%
94%
54%
32%
24% 23% 23% 23%
2% 5% 6% 17% 20% 21% 20%
0%
20%
40%
60%
80%
100%
2015 2016 2017 2018 2019E 2020E 2021E
New initiatives and others Instore dining, hotel and travel
Food delivery
80% 80% 75% 72% 73%
74%
76%
20%
20% 25%
28%
27%
26%
24%
0
5,000
10,000
15,000
20,000
25,000
30,000
35,000
40,000
45,000
2015 2016 2017 2018 2019E 2020E 2021E
RMB'mn
In-store and travel revenue Hotel booking revenue
0% 13% 9% 8% 7%
100% 87%
91%
92%
93%
-
5,000
10,000
15,000
20,000
25,000
30,000
35,000
40,000
2017 2018 2019E 2020E 2021E
RMB'mn
Mobike Others
-180%
-130%
-80%
-30%
20%
70%
2015 2016 2017 2018 2019E 2020E 2021E
Gross margin Adjusted EBIT margin
Adjusted net margin

25
19 March 2019
China Tonghai Securities | Meituan Dianping (3690 HK) initiation
Meituan Dianping (3690 HK)
Stock Rating: SELL
Income statement
(RMB'mn)
2017
2018
2019E
2020E
2021E
Per Share Items (RMB)
2017
2018
2019E
2020E
2021E
Revenue
33,928
65,227
91,494
127,756
165,650
Adjusted diluted EPS
(1.87)
(3.13)
(1.19)
0.57
1.95
Food delivery
21,032
38,143
51,646
71,743
93,484
DPS
0.00
0.00
0.00
0.00
0.00
In-store, hotel and travel
10,853
15,840
21,302
29,719
38,648
BVPS
(26.49)
31.76
12.99
13.25
14.75
New initiatives
2,043
11,244
18,546
26,293
33,518
Cost of revenue
(21,708)
(50,122)
(64,457)
(82,213)
(96,366)
Ratio Analysis
2017
2018
2019E
2020E
2021E
Gross profit
12,220
15,105
27,037
45,543
69,284
Growth (YoY%)
Operating expenses
(16,727)
(28,775)
(37,238)
(45,481)
(61,125)
Revenue
161.2%
92.3%
40.3%
39.6%
29.7%
Other income, net
681
2,585
1,166
1,166
1,166
Gross profit
105.7%
23.6%
79.0%
68.4%
52.1%
EBIT
(3,826)
(11,086)
(9,035)
1,228
9,325
Adjusted net profit
(46.7%)
198.6%
(16.2%)
(147.8%)
242.1%
Finance costs
(19)
(45)
(45)
(56)
(17)
Adjusted diluted EPS
(49.4%)
67.6%
(61.9%)
(147.8%)
242.1%
Pre-tax profit
(18,934)
(115,491)
(8,762)
1,440
9,476
Margins
Tax
(54)
(2)
0
0
(758)
Gross profit margin
36.0%
23.2%
29.6%
35.6%
41.8%
Minority Interest
(71)
(16)
(35)
6
35
EBIT margin
(11.3%)
(17.0%)
(9.9%)
1.0%
5.6%
Attributable profits
(18,917)
(115,477)
(8,727)
1,434
8,683
Adjusted net margin
(8.4%)
(13.1%)
(7.8%)
2.7%
7.1%
Adjusted EBIT
(3,536)
(10,101)
(7,511)
3,052
12,035
Other ratios
Adjusted net profit/loss
(2,853)
(8,517)
(7,138)
3,414
11,679
Return on assets
(36.6%)
(138.1%)
(7.2%)
1.2%
6.8%
Return on equity
N/A
N/A
(10.1%)
1.8%
10.9%
Balance sheet (RMB'mn)
2017
2018
2019E
2020E
2021E
ROIC
N/A
N/A
(9.8%)
1.8%
10.5%
PPE
916
3,979
4,195
5,849
8,047
Dividend payout ratio
0.0%
0.0%
0.0%
0.0%
0.0%
Intangible assets
19,853
33,876
34,552
35,120
36,754
Net debt to equity
N/A
(17.1%)
(11.0%)
(14.1%)
(21.0%)
Other non-current assets
8,427
9,657
9,657
9,657
9,657
Interest coverage (X)
N/A
N/A
N/A
54.5
729.4
Inventories
88
400
824
1,060
1,351
Valuation measures
ratios
Trade receivables
432
466
894
1,253
1,750
PER (X)
N/A
N/A
N/A
82.4
24.1
Cash and equivalents
19,409
17,044
11,394
14,527
22,390
PBR (x)
N/A
1.5
3.6
3.5
3.2
Other current assets
34,508
55,239
57,915
59,898
61,505
FCF yield (%)
(1.3%)
(7.6%)
(2.0%)
0.7%
2.1%
Total assets
83,634
120,662
119,430
127,364
141,454
Dividend yield (%)
0.0%
0.0%
0.0%
0.0%
0.0%
Long-term Borrowings
0
470
1,000
1,500
2,000
Other non-current liabilities
103,618
1,857
1,857
1,857
1,857
Key Operating Metrics
2017
2018
2019E
2020E
2021E
Accounts payable
2,667
5,341
6,866
7,947
9,010
Revenue mix (%)
Short-term borrowings
162
1,800
1,800
1,800
1,800
Food delivery
62.0%
58.5%
56.4%
56.2%
56.4%
Other current liabilities
17,689
24,684
30,060
34,823
38,382
In-store dining / OTA
32.0%
24.3%
23.3%
23.3%
23.3%
Total liabilities
124,136
34,152
41,583
47,927
53,048
New initiatives
6.0%
17.2%
20.3%
20.6%
20.2%
Total shareholders’ Equity
(40,559)
86,504
77,837
79,412
88,366
Gross margin (%)
Minority interests
58
5
10
25
40
Food delivery
8.1%
13.8%
16.0%
24.0%
28.3%
Total equity
(40,501)
86,510
77,847
79,437
88,406
In-store dining / OTA
88.3%
89.0%
89.0%
90.0%
90.0%
New initiatives
46.0%
(37.9%)
(1.0%)
6.0%
24.0%
Cash flow statement
(RMB'mn)
2017
2018
2019E
2020E
2021E
Non-IFRS EBIT margin
(%)
EBITDA
(2,982)
(5,719)
(5,035)
5,410
14,180
Food delivery
(21.0%)
(7.0%)
(7.5%)
5.0%
8.0%
Other gains, net
178
4,141
0
0
0
In-store dining / OTA
15.0%
28.0%
25.0%
20.0%
20.0%
Change in working capital
2,512
(7,600)
3,374
3,265
2,227
New initiatives
(50.8%)
(114.3%)
(56.5%)
(31.6%)
(17.6%)
Tax Paid
(19)
(2)
0
0
(758)
Food delivery
Operating cash flow
(310)
(9,180)
(1,661)
8,676
15,648
GTV (RMB'bn)
171
283
369
463
567
Capex
(742)
(2,200)
(4,892)
(6,405)
(8,687)
Monetization rate (%)
12.3%
13.5%
14.0%
15.5%
16.5%
Others
(14,415)
(21,239)
418
418
418
In-store dining / OTA
Investing cash flow
(15,157)
(23,439)
(4,474)
(5,986)
(8,269)
GTV (RMB'bn)
158
176
241
328
421
Change in borrowings
161
2,108
530
500
500
Monetization rate (%)
6.9%
9.0%
8.8%
9.1%
9.2%
Interest paid
(10)
(45)
(45)
(56)
(17)
New initiatives
Others
25,357
27,232
0
0
0
GTV (RMB'bn)
28
56
84
109
131
Financing cash flow
25,508
29,295
485
444
484
Monetization rate (%)
7.3%
20.1%
22.1%
24.1%
25.6%
Net change in cash
10,040
(3,323)
(5,650)
3,133
7,863
Free cash flow
(1,052)
(11,380)
(6,553)
2,271
6,961
Source: Company data, China Tonghai estimates
Note: FY End Dec

26
19 March 2019
China Tonghai Securities | Meituan Dianping (3690 HK) initiation
Rating Definitions
Disclaimer and Risk Statement
BUY We expect the stock to have a total return of > 15% over the
next 12 months
This document is published by China Tonghai Securities Limited (“Tonghai Securities”), a licensed corporation
(central entity number AAC577) regulated by the Securities and Futures Commission in Hong Kong. This
document is for distribution in Hong Kong only to persons who are “Professional Investors” as defined in Part 1
of Schedule 1 of Securities and Futures Ordinance (Cap 571) of Hong Kong and any rules made thereunder. This
document is not intended for distribution to or use by, any person or entity who is a citizen or resident of any
jurisdiction where such distribution or use would be contrary to applicable law or regulation within such
jurisdiction. This document does not constitute an offer or a solicitation of an offer to buy or sell any securities.
This document is circulated to addresses solely and may not be reproduced or redistributed to any other person
or published, in whole or in part, for any purpose. The research is based on information obtained from sources
believed to be reliable, but Tonghai Securities does not make any representation or warranty as to its accuracy,
completeness or correctness. Opinions expressed are subject to change without prior notice. Any
recommendation does not have regard to specific investment objectives, financial situation and particular needs
of any specific addressee. Tonghai Securities accepts no liability whatsoever for any direct or consequential loss
arising from any use of this document. Tonghai Securities and its affiliates as well as persons associated with any
of them from time to time may or may not have interests in the securities mentioned in this document. The
prices of securities may move up or down, and past performance is not an indication of future performance.
Investors shall consider seeking separate legal or financial advice before making investment decisions.
HOLD We expect the stock to have a total return of < 15% and >-
15% over the next 12 months
SELL We expect the stock to have a total return of < -15% over the
next 12 months
Disclosures
Analyst Certification: The following analysts hereby certify that their views about the companies and their
securities discussed in this report are accurately expressed and that they have not received and will not receive
direct or indirect compensation in exchange for expressing specific recommendations or views in this report:
Esme Pau (CE No. ATP176), Li Yiming (CE No. BIE646), the authors of this document and their associates declare
that as of the date of the publication of this report, they do not hold any financial interest in the company.