SOAC STATE-OF-THE-ART CAR DEVELOPMENT PROGRAM, Vol 1. Design, Fabrication and Test PDF Free Download
1 / 196/196
100%

S.
C.R.
T.D.
l!BRliRY
Report
No.
UMTA-IT-06-0026-74-1
SOAC
STATE-OF-THE-ART
CAR
DEVELOPMENT
PROGRAM
VOLUME
1:
DESIGN,
FABRICATION
AND
TEST
Boeing
Vertol
Company
IA
division
of
The
Boeing Company)
Surface
Transportation
Systems
Branch
Philadelphia,
Pa.
19142
APRIL
1974
FINAL REPORT
Availability
is
unlimited.
Document
may
be
released
to
the
National Technical
Information
Service, Springfield, Virginia
22151,
for
sale
to
the
public.
Prepared
for
URBAN
MASS
TRANSPORTATION
ADMINISTRATION
Office of
Research
and
Development
Washington,
D.C.
20590

NOTICE
Th
is
doc
ument
is
disseminated
under
th
e
sponsorship
of
th
e
Department
of
Transportation
in
the
int
erest
of
information
exc
h
ange.
Th
e
Cn
itc
d
States
Government
ass
u
mes
no
liability
for
its
co
nt
en
ts
or
u
se
thereof.

Technica
l Report D
ocumentat
io
n
Page
1.
Repo,1
No.
2 .
Government
Accession
No.
3.
Rec
i
pient's
Coto
lo
g No .
UMTA-IT-06-0026-74-1
4.
Ti
lle
and
Subtit
le 5.
Repo
n
Dote
SOAC
STATE-OF-THE
-A
RT
CAR
Aoril
1974
DEVELOPMENT
PROGRAM,
6.
Performi
ng Or
gon
i
zotion
Code
Vol
1.
Design,
Fabrication
and
Test
8.
Performi
ng
Or
g
oniz
o
t,
on
Rep
o
rt
No
.
7.
Author
1s)
Dl74-10031-l
9.
Perform
i
ng
Organization
Name
and
Address
10.
Wo,k
Uni,
No
.
(T
RA
IS)
Boe
ing
Verto
l
Company
IT
-06-002
6
(A
Division
of
The
Boeing
Company)
11
.
Contract
or
Grant
No.
Surface
Tr
ansportation
Systems
Branch
DOT-
-
UT
·-10 0 0 7
P
hilad
elph
ia,
Pa
.
19142
13.
Type
of
R
ep
or
!
and
Pe,iod
Cove
re
d
12.
Spon
sori
ng
Agency
No
me
and
Address
F
inal
Report
Department
of
Trr-
~
sportation
(J
un
e
1971
t o
Urban
Ma
ss
T
ran
i
rtation
Administration
A
ua11
cc;
t.
19
71)
Office
o f
Rese
a/
l
and
Deve
lopment
14.
Spons-;,ri
ng
Agency
Code
Washingto
n,
D.C.
20590
15. S
up
p
lemen
ta
ry
N
ot
es
16.
Ab
s T
ra
c i
As
systems
manager
for
the
Urban
Mass
Transportation
Administration
's
Urban
Rapid
Rail
Vehicle
and
Systems
Program,
the
Boeing
Vertol
Col'l.pany
is
su
pervising
the
design,
fabrication
and
test
of
two
new
State-of-the
-Ar
t
Cars
(SOAC)
whos
e
objectiv
e
is
to
demonstrate
the
current
state
-of
-
-the-
art
in
rail
rapi
d
transit
vehicle
technology
.
P
asseng
e r
convenience
and
operating
efficiency
ar
e
prir1ary
go
als
for
the
cars.
nuilt
by
the
St.
Louis
Car
Division
of
General
Stee
l
I
ndustries
,
the
SOAC
f
ea
tur
es
a DC-DC
chopper
in
the
p
ro
p
ulsion
system
,
separate
l y
exc
ited
DC
traction
motors,
all-st
ee
l
construe-
tion
{with
molded
fiberglass
ends),
and
vandal-resistant
and
fi
r e -
retardant
materials
in
th
e
interior.
This
volume,
Vo
lum
e 1
of
a
two-volume
report,
covers
the
dev
e
lo
pment
prog
ram
through
e
ngin
ee
ri
ng
testing;
inclu
d
ing
da
ta
on
design
and
performance,
pr
o
pu
lsion
and
braking,
subsystems,
test
program,
mockup
and
dem
o
nstrat
ion
programs,
and
eco
nomic
ana
lysis.
Volume
2
will
report
on
op
e
rational
t e
sts
and
e
valuation
s
to
be
performed
in
revenue
se
rvi
ce
in
New
York,
Bos
ton,
Cleveland,
Ch
ica
go
and
Phi
l
adelphia
.
1
7.
Key
Word
s 18. D
ist
r
ibut
i
on
Sta
t
emen
t
SOAC
Report
A
vailab
i
lity
is
unlimi
t
ed
. D
ocur.1ent
State-of-t
h
e-Ar
t
Car
may
be r e
leased
to
the
National
UMTA
URRV
Program
Technical
Information
Service
,
Modern
Rapid
Transit
Sp
rin
gf
iel
d ,
Virginia
2215
1,
for
sale
to
the
public.
19.
Secur
i
ty
Clossif.
(of
th
is
re?or
t)
20.
Security
Cl
o
ssif.
(o
f
th
is
page
) 21. N
o.
of
Pages
22
. P
ric
e
UNCLASSIFIED 1
82
Form
DOT
F
1700.7
(8 -
72)
Reprod
u
ction
of
comp
le te d
page
authoriz
ed

01742
TF
455
•
S61.
v.1
c.1

Contents
Section
1.
2.
3 .
4 .
5.
INTRODUCTION
........
.
...
.
...
...........
.
..
..
......
. .
1.
1
Urban
Rapid
Rail
Vehicle
and
System
s
Program.
1.2
State
-
of-the
-Art
Car
(SOAC)
Program
. .
..
.
...
. .
SOAC
2
.1
2.2
DEVELOPMENT
.....
.
Scope
.
.....
.....
.
Program
H
ist
o
ry
..
.
DESIGN
AND
PERFORMAN
CE.
3.1
3. 2
3.3
3.4
Genera
l
.•.
Exterior
.••
Structure
..
Interior
...
PROPUL
SION
AND
BRAKING SYSTEMS.
4.1
4 . 2
4.3
4.4
4 . 5
4.6
4.7
Basic
Propu
lsion
System
.•
Propulsion
Equipment
.....
Equipment
Descriptions
.•.
Propulsion
System
Operation
..
Traction
and
Brak
i
ng
Cha
r
acter
isti
cs
..
Detailed
Choppe
r
Operatio
n
••.
Brake
Sys
terns
•............•..........
SUBSYSTEMS
............
.
5.1
5 . 2
5 . 3
5 . 4
5.5
5.6
5
.7
5.8
5 . 9
5
.10
5.
11
5
.12
5
.1
3
Trucks
..•..•
•
.•.•
Resi
l
ient
Wheels
.
Heating,
Venti
l
ating
,
and
Air
Cond
i
tion
i
ng
..
Coupler
and
D
ra
ft
Gear
...
.
....
.
Doors
and
Door
Operators.
...
.
...
.
Conunun
ic
a t
ions
. • . . . . . . . . . . . . . . . • . .
.••.
Automatic
Power
Ch
angeover.
. .
•...•.••
Power
Co
ll
ectors.
. .
.....
Lighting..
.
....
Hostler
....•.
..
\i
i
ndows.
. . . . . . .
.....
Monitor
Panel....
....
.
..
•.
Motorman
' s
Control
Panel
.
V
1
1
2
4
4
5
18
18
21
21
22
28
28
29
29
50
57
60
67
79
79
81
81
84
86
90
91
91
93
95
95
97
97

Section
6.
TEST
6.1
6
.2
6.3
6.4
6.5
PROGRAr
-1 •
•••••••••.••••••••••••••••••
•
•••••••••••
Component
and
Subsystem
Tests
•.•...
..
••.....•••
Acceptance
and
Engineering
Tests
at
HSGTC
.•..
•.
Acceptance
Test
Resu
l
ts
.
.•.•...
•••••.
.
....•....
Engineering
Test
Results
.
...•.•....
...•.•••....
Simulation
D
emonstrat
ion
Test
Results
.
....•
....
101
101
108
110
114
149
7.
ENGi
i.
rnERING
DES IGN CHANGES
AND
CORRECTIVE
ACTIONS....
154
7
.1
Design
Changes.
......
...
.............
..
......
..
154
7.2
Corrective
Actions
...
•.
.
••••••••••
•
•••
•
•••••...
156
8.
MOCKUP
AND
TEST
AND
EVALUATION
PROGRAr-1S
.
•.••.•...
....
158
8 • 1 SOAC
Mock
up • • • • • • • • • . • • • • . • . • . . . . . . . . . . • . . . . . . .
15
8
8
.2
Operational
Test
and
Evaluation
.....•.......•..
161
9.
ECONOMIC ANALYSIS
.....
....
..
.
......
....
.
.........
....
164
9 . 1
Introduction
and
Summary
•
.............
.....
••..
164
9.2
Production
Cost
Estimate
••••••••••••••••••••..•
165
9.3
Propulsion
Controls
Tradeoff
Study
••••••••••...
169
REFERENCES......
.........
..
. . . .
......
........
..
......
182
vi

Figure
1-1
2-1
2-2
2-3
2-4
2-5
2-6
3-1
3-2
3
-3
3
-4
3- 5
3-6
3
-7
3- 8
4-1
4-2
4-3
4-4
4-5
4-6
4-7
4- 8
Illustrations
Major
SOAC
Milestones
.......••...................
State-of-the-Art
Car
Develo
pment
Team
...........
.
SOAC
Construction,
March
through
May
1972
.......
.
SOAC
Construction,
July
1972
.•..•................
SOAC
Rollout,
August
1972
..•.....•••.....•......•
SOAC
Acceptance
Ceremony,
October
1972
..........
.
USDOT
High
Speed
Ground
Test
Center,
Pueblo
,
Colorado
................••...............
Performance
and
Design
Characteristics
....•......
SOAC
Vehicle
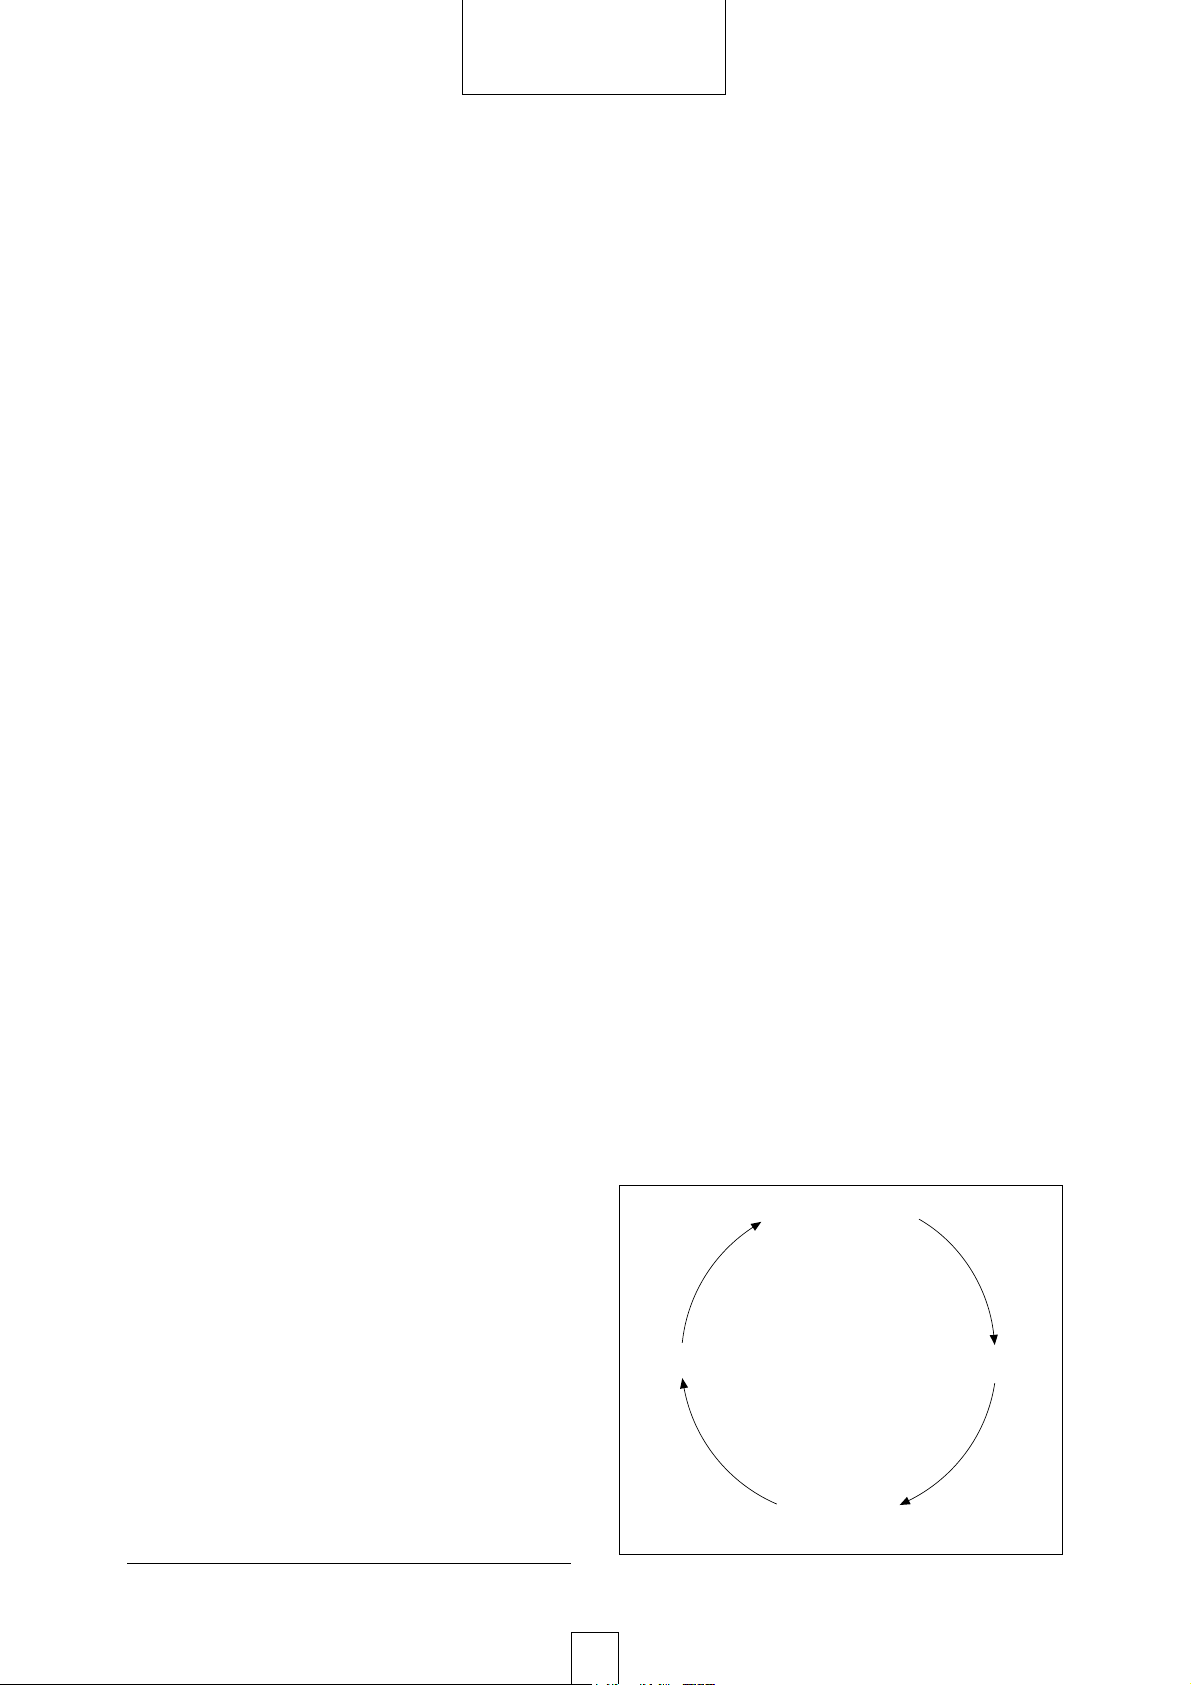
Operating
Profile
•.••.•.......••••••
Noise
Control
Features
...........•...............
Exterior
.
..
.............................
......
..
.
Frame
Construction
....•.......••..•....
.
....
.
....
Roof
Construction
...........•.....•••..........•.
Seating
Plans
..............•.....•......
.
......
•.
Interior
........................................
.
Propulsion
and
Braking
System
Bl
ock
Diagram
..•.•.
Propulsion
Eq
uipment
Location
••.••...............
Traction
1-1otor .
.................................
.
Motor
and
Drive
System
..........................
.
Prop
u
lsion
System
Functional
Schematic
.......•...
DC
Chopper
.
.......................•..............
Chopper
Schemat
ic
..........•.....................
Tr
a
ns
ie
nt
Voltag
e
vs
Trans
i
ent
Durati
o n
...••••...
vii
3
6
13
14
15
15
1 7
19
20
20
21
23
24
25
26
30
31
33
34
35
38
39
40

Figure
Page
4-9
Propulsion
Power
Control
Unit
Plug-In
Card
4-10
4
-11
4-12
4-13
4-14
4-15
4-16
4-17
4-18
4-19
4-20
4-21
4-22
4-23
4-24
4-25
4-26
4-27
4-28
4-29
4-30
Loe
a
tions.
. . . . . . . . . . . . . . . . . . . . . . . . . . . . . . . . . . . . . . . 4 2
I1otor
Alternator
.
...............................
.
Auxiliary
Power
Subsystem
Block
Diagram
.........
.
Cooling
System
-
Fan
Inlet
......................
.
Master
Controller
Panel
.........................
.
Speed
Maintaining
Buttons
.......................
.
Tractive
Effort
Control
Block
Diagram
...........
.
Time
History
of
Typical
Initial
Acceleration
....
.
Time
History
of
Typical
Blended
Braking
.........
.
Traction
and
Braking
Characteristics
(Single-Car,
600
volts)
.........................
.
Chopper
Operation:
Main
-Ql
"O
ff
"
•............
...
Chopper
Operation:
Main
-Ql
"
Fired
On''
..........
.
Chopper
Operation:
Main-Ql
"On",
Commutator-Q2,
"Fir
ed
On"
.......................
.
Chopper
Operation:
Main
Ql
"On",
44
46
47
49
51
53
55
58
59
61
62
63
Commutator-Q2
"Off"..............................
64
Chopper
Operation
:
Main
-Ql
Commutated
"O
ff
"
.....
Chopper
Operation:
Main-Ql
"
Off
",
Load
Free
Whee l
..................
.....
.......
....
....
.
Brake
System
Schematic
............
..
......
.....•.
Air
Compressor
....
..............................
.
Type
"A"
Analog
El
ectro
-Pn
eumatic
Unit
..........
.
Brake
Actuator
(Non-Handbrake
Unit)
.............
.
Air
Brake
Control
....................•........•..
Friction
Br
ake
Pressure
and
Application
Characteristics
.................................
.
viii
65
66
69
69
70
73
74
76

Figure
4-31
5-1
5-2
5-3
Emergency
Brake
Control
..•.......................
Truck
.
..........................................
.
Truck
and
Suspension
Unit
....••..................
Acousta-Flex
Wheel
..............................
.
Page
78
80
80
82
5-4
Heating,
Ventilating
and
Air-Conditioning
5-5
5-6
5-7
5-8
5-9
5-10
5-11
5-12
6-1
6-
2
6-3
6
-4
6- 5
6-6
System...........................................
82
Overhead
Heating,
Ventilating,
and
Air-
Conditioning
Installation
........•.....•.........
Coupler
and
Draft
Gear
..................•....••..
Electric
Coupler
Boxes
..•........................
Door
Operator
.
........
..
........................
.
Pantograph
(Partially
Extended)
.................
.
Third
Rail
Power
Pickup
....
-
....••..............•.
83
85
87
89
92
94
Hostler
.....................................
..
...
96
Monitor
Panel....................................
98
Propu
lsion
and
Drive
Systen
Test
Cell.~··········
103
Typical
Truck
Frame
Test
Setup
...................
105
Interior
Noise
Levels
...........................
.
113
Wayside
Noise
Levels
...............•.............
11
3
Ride
Quality....
. . . . . . . . . . . . . . . . . . . . . . . . . . . . . . . . .
11
5
Electromagnetic
Fi
e
ld
Test
Data
..................
11
6
6-7
Acceleration
and
Speed
Response
to
Tracti
ve
Effort
Respons
e
...............................
...
11
8
6-8
Control
Linearity
("P"
Signal)
..................
.
119
6-9
Effect
of
Car
Weight
on
Acceleration
and
Braking..........................................
120
6
-10
Effect
of
Car
Weight
on
Time
and
D
is
tance
to
Speed.........................................
1
22
lX

Figure
6-11
6-12
6-
13
6-14
6-15
6-16
6-17
6-18
6-
19
6
-20
6-21
6-22
6
-2
3
6-24
6
-2
5
6-26
6-27
6-28
6
-29
8
-1
9-1
Effect
of
Third
Rail
Voltage
on
Acceleration
and
Braking.
. . . . . . . . . . . . . . . . . . . . . . . .
12
3
Ef
fec
t
of
Third
Rail
Voltage
on
Time
and
Distance
to
Speed
................................
124
Tra
ction
Resist
ance
..............................
125
Wheel
Tem
ep
rature................................
127
ACT-1
Synthetic
Transit
Route
............•.......
128
Wheel
Adhes
io
n
...................................
131
Ride
Quality
Test
Base
lin
e
Data
................••
135
Ride
Quality
Baseline
Comparison:
Effect
of
Speed.
. . . . . . . . . . . . . . . . . . . . . . . . . . . . . . . . . . . . . . . . . . .
13
7
Ride
Quality
Baseline
Comparison:
Effect
of
Speed............................................
13
8
Ride
Quality
Base
li
ne
Comparison:
Eff
ect
of
Speed............................................
1
39
Compar
is
on
of
Interior
Noise
L
evels
With
Goals
...
142
Effect
of
Wh
eel
Configuration
on
Interior
Noise
..
.
....
......
...............................
143
Compar
ison
of
Ra
il
Surface
Roug
hn
ess
on
Noise
•
.•.
144
Comparison
of
Wheel
Surface
Roughness
on
Noise
•..
146
Effect
of
Speed
on
Waysi
de
Noise
.................
147
Comparison
of
Wayside
Noise
Levels
with
Goals
•...
14
8
S
imulat
ed
D
emonstration
Rou
te
at
HSGTC
...........
150
M
il
eage
Accumulation
During
Simulated
Demonstration
(23
July
to
11
Aug
ust
1973)
......••
152
Daily
Mil
es
Per
Car
Dur
in
g
Simulated
Demonstration
(23
July
to
11
Augu
st
1973)
....••..
153
SOAC
Mockup
on
Display.
....
. . . . . . . . . . . . . . . . . . . . . . 1
59
Maximum
Tractiv
e
Effort
vs
Speed
....
..
.......•..•
174
X

Figure
Page
9-2
Electric
Current
Usage
(at
Maximum
Tractive
Effort)
vs
Speed
•....•.•.•.•.••..•...............
175
9-3
Electric
Current
Usage
(at
Maximum
Tracti
ve
Effort)
vs
Time
from
Start
.......................
177
xi

Tables
Table
4-1
Propulsion
System
Components.....................
29
6
-1
Truck
Frame
S
tress
Resu
lts
...
.
.....
.
.............
104
6- 2
Truck
Bol
ster
Maximum
Recorded
Stresses
..........
106
6- 3
Performance
Requirements.......
. . . . . . . . . . . . . . . . . .
110
6- 4
Acceptance
Test
Results
(105,000-Pound
Car)
......
112
6- 5 Summary
of
Frict
i
on
Brake
Dut
y
Cycle
Tests
..•....
129
6- 6 Summary
of
SOAC
Energy
Co
nsum
pt
i
on
on
ACT-1
Synthe
ti
c
Transit
Rout
e
.....................•....
132
6
-7
Summary
of
Undercar
Equipment
Temperatures
for
Synthet
i c T
ra
n
sit
Route
(105,000-Pound
Car)
....
..
133
6-8
Summary
of
Wh
ee
l
Sp
i
n-Slide
System
Efficiencies
(90
,
000-Pound
Car)..................
134
8-1
Mockup
Dis
play
Act
i
vit
i
es
........................
160
9-1
Estimated
Pric
es
for
Pu
rchas
ed
Ha
rd
w
are
(300
Cars)....
....
....
.......
..
..
...
....
...
......
166
9- 2
Recurring
Manuf
acturing
Manhour
Summary
(
300
Cars
).......................................
167
9-3
Est
imat
e d
Pro
du
c
tion
Price
(300
Cars)
............
1
68
9
-4
High
-
Density
Rout
e
Propert
i
es
....................
171
9-
5
Motor
a
nd
Control
Combinat
ions
..................
171
9-6
Compilation
of
SOAC
We i g
hts
with
Various
Propulsion
and
Cont
rol
Comb
inations
....
.
......
..
.
173
9- 7
Weigh
t
and
Power
Consumption
of
th
e F
ive
Combin
ations
. . . . . . . . . . . . . . . . . . . . . . . . . . . . . . . . . • . . . l 7 8
9- 8
El
ec
tri
c
Power
Costs
(in
Four
Ci
ti
es)
..
....
......
179
9-9
Av
erage
Annual
Mileage
pe
r
Car
.
..
...
.
............
1
80
xii

1. INTRODUCTION
In
June
1971,
the
Boeing
Vertol
Company
was
awarded
a
contract
(DOT-UT-10007)
for
systems
managenent
of
the
Urban
Rapid
Rail
Vehicle
and
Systems
Program
(URRVS),
whose
overall
objective
is
to
enhance
the
attractiveness
of
urban
rail
transportation.
Sponsored
by
the
U
.S.
Department
of
Trans
-
portation's
Urban
Mass
Transportation
Administration
(UMTA),
the
program
builds
upon
and
accelerates
the
technical
evolu-
tion
of
rail
rapid
transit
so
that
new
urban
rail
s
ystems
and
system
extensions
can
benefit
from
improved
operating
econom-
ics
and
enhanced
passenger
appeal.
1.1
URBAN
RAPID RAIL VEHICLE
AND
SYSTEMS
PROGRAM
Boeing
is
performing
eight
tasks
under
th
e
Urban
Rapid
Rail
Vehicle
and
Systems
Program:
1.
Provide
program
management
in
implementin
g
UMTA
efforts
tow
ard
improving
high-speed,
frequent-stop
urban
rail
systems.
2.
Monitor
the
testing
of
the
BART
prototype
cars
for
input
to
the
program.
3.
Using
BART
as
a
baseline,
and
using
current
(1971-
72)
technology
in
car
building,
direct
the
design
and
construction
of
two
new
St
ate
-of
-the-Art
Cars
(SOAC),
representativ
e
of
the
best
available
tech-
nology;
demonstrate
these
cars
to
the
transit
authorities
and
the
riding
pub
lic
in
five
major
cities.
1

4.
Conduct
an
industry-
w
ide
design
competition
and
award
contracts
to
produce
a
two-car
Advanced
Concept
Train
(A
CT-1),
representative
of
the
next
generation
of
rail
transit
cars;
demonstrate
these
cars
to
the
transit
authorities
and
the
riding
public
in
five
major
cities.
5.
Concurrently,
conduct
an
industry-w
i
de
design
competition
and
award
contracts
for
alternative
advanced
subsystems
under
the
Advanced
Subsystem
Development
Program
(ASDP).
6.
Pla
n
for
an
operational
de
mons
tration
of
the
ACT
train
in
revenue
service.
7.
Perform
an
economic
analysis
of
the
SOAC
and
ACT
cars
l e
ading
to
estimates
of
life
cycle
costs
in
production
quantities.
8.
Pe
rform
a
human
factors
e
val
uati
on
of
the
SOAC,
and
ACT
cars.
1.2
STATE-OF-THE-ART
CAR
(SOAC)
PROGRAM
The
objective
of
the
SOAC
task
is
to
demonstrate
the
c
urrent
state-o
f-
the-art
in
rail
rapid
transit
vehicle
tech-
nology.
This
objective
is
being
fulfilled
by"
the
development,
test,
and
demonstration
of
two
rail
rapi
d
transit
car
s
embody-
ing
the
best
availabl
e
in
current
(1971-72)
t
ec
hnology.
Pa
ssenge
r
convenience
and
op
e r a
tin
g
efficiency
are
primary
goals
for
the
car
s
which
are
des
i gne d
to
be
capable
of
op
e
r-
at
i
on on
at
l
eas
t
on
e
line
of
the
rapid
t
ra
n
si
t
sy
s t e ms
in
New
York
,
Bos
ton,
Cleveland,
C
hic
ago
an
d
Philadelphia.
The
two
SOAC
cars
were
designed,
fabricat
e
d,
functionally
t
es
ted
and
delivered
to
the
U.S
.
Department
of
Transportation's
High
Speed
Ground
Tes
t C
enter
(HSGTC)
in
Pueblo,
Colorado,
11-1/2
months
a
fter
contract
go
- ah
ead
by
the
St.
Louis
Car
Division
of
General
Steel
Industries.
I n A
ugust
1
972
,
the
cars
were
shipped
to
the
HSGTC
at
Pueblo;
on
September
26,
th
e
fi
r
st
day
on
the
UMTA
Rail
Transi
t
Test
Track,
on
e
SOAC
a
chi
eved
a
speed
of
65
mph.
On
Oct
ober
12,
SOAC
wa
s
unv
e
il
ed
an
d
de
m
onstrat
ed
to
the
pub
lic,
to
the
Secretary
of
Transp
o
r-
tation,
John
Volpe,
and
to
other
officials.
Durin
g
19
73
,
the
SOAC
vehicles
underw
e
nt
an
extended
period
of
e
ngin
ee
ring
t
es
tin
g.
A de
lay
i n
operational
t
est
in
g
and
eval
uat
ion
was
caused
by
a swi
tc
hin
g
accident
in
Aug
ust,
1973
necessitating
major
repairs
to
one
of
th
e
two
car
s.
These
repairs
were
comp
let
ed
in
December,
1973
.
Sys
t
ems
te
st
-
in
g
on
UMTA's
9.1-mile
Rail
Transit
Test
Tr
ack
w
as
resumed
in
2

January
1
974
and
completed
on
April
10,
1974.
Operationa
l
test
and
evaluation
wi
ll
be
conducted
in
New
York,
Boston,
Cleveland,
Chicago
and
P
hil
adelphia.
During
the
operational
test
and
evaluation
phase
(to
be
reported
in
Vo
lu
me
2),
the
contributions
of
current
rail
rapid
transit
technology
to th
e
goals
of
i
ncreased
passenger
conven
-
ience
and
operating
efficiency
will
be
demonstrated
to
the
transit
industry,
p
ublic
officia
l
s,
and
the
riding
public.
Major
m
il
estones
of
the
SOAC
prog
ram
are
shown
in
Fig
u
re
1-1;
a
detailed
program
history
i s pr
esented
in
Section
2.
SO
AC
ACTIV
I
TY
19
7 1
1972 1973
A S 0 N D J F M A M J J A s 0 N D J F M A M J J
ST.
LOU
IS C
AR
CONTRACT
AWARD
i.
Al
RESE
ARCH
PROPULSION
S
YS
SUBCONTRAC
T
AWARD
•
UND
ERFRAMELAYDOWN
•
CAR SHE
LL
CO
MPLETED
•
PROPULSION
SYSTEM
COMPL
ETED
..
TR
UCK
COMPLETED
"
CARS
ASSEMBLED
r..-
CARS
SHIPP
ED
TO
HSGTC
l't"
PUBLIC
DEMONSTRATION
RUN
...
COMPL
ET
IO
N OF SYSTEMS
TESTING
•
ACCEP
TA
NCE TEST CO
MPL
ETED •
E'
NGINEERING
TEST COMPLETED
1'1
ACC
IDEN
T
Figure 1- 1.
Major
SOAC Milestones
3
A
•

2. SOAC DEVELOPMENT
2.1
SCOPE
The
efforts
of
the
UMTA,
Boeing
and
industry
team
during
the
two
years
of
the
SOAC
program
have
included:
•
Evaluation
of
the
BART
prototype
car
and
incorporation
of
selected
technical
and
human
factors
findings
in
tw
o
totally
new
State-of-the-Art
Cars.
• D
es
ign,
construction
and
de
liv
e
ry
of
the
SOAC
cars
in
less
than
one
yea
r .
• Ac
cepta
n ce
testing
to
the
guarantee
points
listed
in
the
SOAC
specification.
•
Engineering
t
es
ting
to
completely
evaluate
the
SOAC
in
all
normal
and
failur
e m
odes.
•
Establishment
of
b
ase
lin
e t e
chnical
data
which,
in
the
future,
will
be
u
sed
f or
comparison
with
new
tr
ansi
t
vehic
l
es
to
measure
growth.
• S
imulat
ed
demonstration
testing
to
ensure
vehic
l e
reliability
prior
to
the
opera
t
ional
t
es
t
and
evalu-
ation
t o
ur.
•
Eva
lu
ation
of t he hum
an
factors
invo
l
ved
wi
th
the
SOAC
cars
in
passe
nger
appeal,
cras
h
wort
hin
ess
and
main
t
enance
.
4

•
Design,
construction,
and
display
of
a
mockup
of
the
SOAC
vehicle.
•
Preparation
of
an
"as
built"
specification
format
which
may
be
used
by
all
transit
properties
in
ordering
new
cars.
•
Analysis
of
the
SOAC
accident
of
August
1973,
and
determination
of:
a.
Vehicle
crashworthiness
of
the
SOAC.
b.
Human
factors
involved
(i.e.,
safety
of
passengers)
.
•
Performance
of
an
economic
analysis
of
the
SOAC,
using
the
cost
information
developed
during
the
program.
2.2
PROGRAM
HISTORY
The
challenge
of
building
two
totally
new
cars
incorpo-
rating
new
and
relatively
untried
s
yste~s,
and
delivering
the
same
within
one
year
was
one
which
had
never
been
faced
in
the
rail
transit
car
industry.
In
addition
to
the
physical
and
technical
constraints
of
such
a
program,
the
problens
of
"marr
ying"
an
old
line
car
builder
with
a
company
l
ong
exper
-
ienced
in
aerospace
management
techniques
had
to
be
faced
and
solved.
(The
industry
team
which
participated
in
the
develop-
ment
of
the
SOAC
vehicle
is
shown
in
Figure
2-1.)
Prior
to
releasing
the
RFP
(Request
for
Proposal)
for
SOAC
car
construction,
Boe
in
g
Vertol,
as
Systems
Manager
for
UMTA,
was
obligated
to
determine
the
feasibility
and
desir-
ability
of
incorporating
the
fol
l
owing
types
of
systems
repr
e
senting
the
latest
state
of
the
art.
•
DC
chopper
control
•
AC
propulsion
•
Air
suspension
•
Light
weight
trucks
•
Improved
air
conditioning
•
Regenerative
braking
•
Vandal-resistant
mater
i a
ls
5

O"I
I
u.
s.
DEPARTMENT
OF
TRANSPORTATION
I
I
I
URBAN
MASS
TRANSPORTATION
ADMINISTRATION
I
I
BOEING
VERTOL
COMPANY
-
COVERDALE
&
COLPITTS
SYSTEMS
MANAGER
ENGINEERING
CONSU
LTANTS
I
ST.
LOUIS
CAR
PRINCI
PAL
SUBCONTRACTOR
I
I I
GARRETT,
AiRESEARCH
GSI, CASTINGS
SUNDBERG-FERAR
SAFET
Y ELEC. EQUIP.
PROPULSION,
BRAKING,
TRUCKS
CONTROL,
AUXILIARIES
OTHER
SUPPLIERS:
ADAMS
&
WESTLAKE
-SASH
AMERICAN
SEATING
-SEATS
0.
M.
EDWARDS
-DOORS
EILCON
-
NATIONAL
-
STANCHIONS
ESB,
EXIDE
-
BATTERIES
GRIMES
MFG
-
LIGHTING
LIBBEY
-OWENS-FORD -WINDOWS
MOTOROLA
-
RADIO,
INTERCOM
OHIO
BRASS -
MECHANICAL
COUPLER
-I
NDUSTRIAL
DESIGN
HEAT
ING
AIR
CONDITIONING
REPUBLIC
STEEL
-
STAINLESS
STEEL
RINGSDORF
-
PANTOGRAPH
SALLEE
CARPET
-
CARPET
ING
SOUND
SYSTEMS -
PUBLIC
ADDRESS
SYSTEM
STANDARD
STEEL
, B-L-H - WHEELS,
AXLES
SWED LOW -
WINDSHIELD
VAPOR
-DOOR
OPERATORS
WAL
TON
PRODUCTS -
ELECTRIC
COUPLER
Figure 2-
1.
State-of-the-Art
Car
Development
Team

•
Diagnostic
status
and
maintenance
concepts
•
Advanced
styling
Test
and
evaluation
of
the
SOAC
on
at
least
one
lin
e
in
five
major
cities
a l
so
had
to
be
considered.
Boeing
first
evaluated
the
problems
of
program
scheduling,
technical
achieve-
ment,
and
demonstration
in
th
e
five
cities
to
determine
where
prob
l
ems
mig
ht
occur.
At
the
time
of
contract
award,
two
new
75-foot
rapid
transit
cars
were
being
produced
in
the
United
States.
Thes
e
cars
we
re
the
BART
car
being
manufactured
by
Rohr
Industries
for
the
Bay
Ar
ea
Rapid
Transit
District
(San
Francisco),
and
the
R-
44
cars
being
man
uf
actured
for
the
New
York
City
Transit
Authority
(NYCTA).
Pre
l
iminary
data
showed
that
the
BART
car
which
inc
o r
po
rated
many
technical
achievements
would
re
quire
extensive
modification
for
the
SOAC
operationa
l
test
and
eva
l-
uation
phase,
because
of
its
nonstandard
ga
ug
e
and
wide
car
body
.
The
R-44
car
was
standard
gauge,
but
the
production
version
had
few
of
the
new
systems
considered
to
be
repre-
sentative
of
the
best
in
currently
available
technology.
The
Boein
g/UMTA
team
fe
lt
t
hat
the
se
two
companies
(and
others)
sho~ld
be
given
the
opportunity
to
bid
for
th
e
SOAC
contract,
the
wi
nn
er
to
be
chosen
on
the
basi
s
of
r
esponse
to
an
RFP
in
the
areas
of
tech
nical
content,
schedule
and
cost.
Consideration
was
also
g
iv
e n
to
th
e
five
properties
where
the
SOAC
was
to
be
ope
rat
ed
,
which
varied
widely
in
the
areas
of
:
1.
Station
height:
floor
height
from
top
of
rail
2.
Power
col
lection:
pa
nto
graph
or
third
rail
3.
Acceptab
l e
car
length
(40
to
75
feet)
and
car
width
4.
Fare
collection
5.
Opera
tin
g
speeds
6 .
Automatic
train
operation
Preliminary
data
i
ndicated
that
differences
in
these
areas
cou
l d
be
resolved
.
Source
Selection
Phase
The
procurement
cycle
for
the
State
-o
f-the
-
Art
Car
was
initiated
on
J
une
18
,
1971
with
a
surv
ey
of
the
rai
l
car
indus-
try
to
obtain
an
expression
of
interest
in
the
project
.
7

Based
on
the
results
of
this
survey,
Boeing
issued
an
RFP
on
July
6,
1971
to
the
Budd
Company,
Pullman-Standard,
Rohr
Industries,
St.
Louis
Car,
and
Vought
Aeronautics.
On
July
14,
1971
a
Bidders
Conference
was
held
in
Philadelphia.
Prospective
bidders
and
potential
propulsion
suppliers
attended.
Questions
we
re
solicited,
and
written
answers
were
forwarded
to
all
bidders.
Proposals
were
re-
ceived
on
August
8,
1971
from
Pullman-Standard,
Rohr
Indus-
tries,
and
St.
Louis
Car.
Resulting
evaluation
and
negotiation
resulted
in
th
e
award
of
the
subcontract
for
the
State-of-the-Art
Cars
to
the
St.
Louis
Car
Division
of
General
Steel
Industries.
The
a
ward
was
made
on
September
14,
1971.
Prop
ulsi
on
In
compliance
with
specification
r
eq
uir
emen
ts,
St.
Louis
Car's
bid
incorporated
two
competitive
advanced
s
olid
state
propulsion
systems,
the
Garrett
AiResearch
and
Westinghouse
Electric
chopper
systems.
A
chopper
contr
olled
system
provides
stepless
and
essen-
tially
infinite
control
of
traction
(drive)
or
bra
ki
ng
effort
f
rom
zero
to
full
capability,
which
results
in
smoother
and
mor
e
efficient
operation
than
the
conventional
DC-operated
step
cam
controlled
sys
tems
currently
in
wide
us
e
throughout
the
world.
Based
on
tec
hn
ical,
schedule,
and
financia
l
considera-
tions
(and
with
Boeing
approval),
St.
Louis
Car
selected
the
Garrett
AiResearch
system.
Contract
award
was
made
in
Sep
-
tember,
1971.
(See
Section
9
for
the
t
rade-off
analysis
between
chopper
and
cam
control.)
Trucks
During
the
proposal
stage,
General
Stee
l
Casti
ngs
h
ad
propo
sed
a
cast-steel,
four
-
whee
l,
insid
e-rol
l
er
-bearin
g ,
ligh
tweight
(14,
5
00-
pound)
truck.
The
t r
uck
asserilily
as
de-
signed
wou
ld
have
been
capable
of
supporting
either
of
the
prop
ulsion
system
motors
a
nd
gear
cases
under
consideration.
Based
on
test
data
taken
on
simi
l
ar
trucks
for
rid
e
quality,
and
realizing
the
weight
advantages,
St.
Louis
Car
awarded
the
tr
uck
contract
to
General
Stee
l
in
Nove
mb
er
1971.
Car
Interior/Exterior
The
industrial
design
firm
of
Sundberg
Ferar
was
retained
by
St.
Louis
Car
ear
l y
in
the
proposal
stage.
Sundberg
had
8

prime
responsibility
for
designing
a
car
interior
more
com-
fortable
and
appealing
than
any
previous
car.
Formal
contract
award
to
Sundberg
Ferar
was
made
in
November
1971
for
the
de-
sign
and
installation
of
the
interior
furnishings.
In
addi-
tion
Sundberg
was
responsible
for
the
exterior
styling.
AC
Air
Conditioning
It
was
desir
able
to
take
advantage
of
higher
r e
liabili
ty
and
reduced
weight
available
in
an
AC-powered
air
conditioning
system.
St.
Louis
Car
undertook
a
survey
of
the
available
equipment
and
determined
that
a
Safety
Electric
Company
system
of
four
8-ton
units
for
the
two
cars
should
be
selected.
The
contract
was
awarded
in
October
1971.
Summary
of
Features
Major
features
of
the
SOAC
car
proposed
by
St.
Louis
Car
were:
•
Stainless
steel
body
construction
•
Impact-resistant
windshield
•
Human-engineered
motorman's
console
•
Separately
excited
field
DC
motors
•
Forced
air
constant
flow
motor
ventilation
with
inertial
separators
•
Li
ghtweight
air
suspens
ion
truck
with
chevron
primary
springs
•
Solid-state
DC
chopper
control
•
Carpeted
floors
•
AC
auxi
li
ar
ies
•
High-flow-capacity
AC
air-conditioning
system
•
Tinted
tempered
safety
gl
ass
windows
•
Human-engineered
passenger-oriented
interiors
•
Reduced
noise
levels
(interior
and
exterior
)
St.
Louis
Car
Project
Management
Office
I n
order
to
achieve
th
e
extremely
short
fa
bricat
ion
schedu
le,
St.
Louis
Car
established
a
separate
project
office
9

to
m
anag
e
and
coord
in
ate
th
e
SOAC
program
entirely
apart
from
two
pr
oductio
n
con
trac
ts
then
in-hous
e,
and
sp
e
ci
al
procedures
for
the
handling
of
material,
cost
accoun
ti
ng
,
manpower
,
etc.
wer e
ins
tituted
by
the
project
team.
Membe
rs
of
each
operat-
ing
depa
rtment
were
assigned
to
the
SOAC
project
with
"on-tiMe,
within-budg
e
t"
comple
t i
on
as
their
major
goal.
The
project
manage
r's
authority
stemmed
di
rectly
from
the
p
residen
t
of
St.
Loui
s
Car
making
it
possible
t o
cut
th
rough
functional
li
nes
when
necessary.
The
advantage
of
ha
vi
ng a
single
con
-
tact
point
with
the
power
to
respond
quickly
was
a
key
reason
for
the
overa
l l
succes
s
of
the
p
rogram.
Design
Phase
Upon
contract
award
and
majo
r
propulsion
system
award,
it
became
obvious
that
major
design
changes
to
the
basic
des
i
gn
of
an
avai
la
ble
car
body
and
shel
l
would
have
to
be
acc
om-
p
lish
ed
within
a
very
short
time.
With
th
e
cooperation
of
Ai
Resea
r
ch
and
the
use
of
full
-s
ca
l e
wooden
mockups,
St.
Louis
Car
was
able
to
rele
a
se
the
underframe
for
production
as
scheduled
in
November
1
971
.
With
the
underframe
in
production
,
the
next
major
area
of
concern
was
the
roof
assembly.
Th
e
entire
r
oo
f
structure
re
-
q
uir
ed
special
attention
because
of
t
he
use
of
the
new
air
condit
ion
ing
and
the
r
equiremen
t
for
insta
lla
tion
of
a
pa
nt
o-
graph,
the
newly
designed
nose
bo
nn
e
t,
and
the
addi
ti
onal
fresh
air
r
eq
uirements
.
In
paral
l e l wi
th
these
efforts,
major
a
ttention
was
paid
to
th
e
gauge
of
material
used
in
the
sides,
and
many
eng
i
neering
hours
were
spent
in
this
de
t
ailing.
From
October
4,
1971
through
delivery,
Boe
ing
conducted
twenty
formal
de
sign
reviews
with
St
.
Lo
u
is
Car
and
other
sup
-
pliers
concerning
various
SOAC
subsystems.
These
re
vi
ews
were
initi
a
ted
with
the
es
tablishm
e
nt
of
design
requireMents
,
pro-
gr
essed
t
hrough
indiv
id
u
al
subsystem
design
revi
ews
,
and
culminate
d
in
a
complete
vehic
l e
system
critical
design
r
eview
on
May 9
and
10,
1972.
Significan
t t
ec
hnical
co
nt
ributions
to
the
SOAC
design
were
made
through
these
reviews
,
including:
•
Ventilating
air
fo
r
SOAC
is
4000
cfm
at
40 t o
50
percent
fresh
air
at
75
fpm
and
produces
a
desirable
interior
comfort
l
evel
.
•
Traction
motor
cooling
and
filt
e
rin
g
on
SOAC
i s
accompl
ished
with
blowe
r s
dr
i
ven
by
separate
motors
and
provides
a
con
tinu
ous
supply
of
cooling
air
for
the
traction
motors
as
we
ll
as
the
p
ropulsion
con
-
trols.
Addi
ti
ona
l
benefi
t s
of
a
constant
air
f
low
are
self
- c l e
aning
i
nertial
(
swirl
type)
filters
and
an
optimiz
e d
blower
system
for
efficiency
and
red
u
ced
n
oise
.
10

•
The
SOAC
air
conditioning
system
incorporates
two
independent
compressor-condenser
blower
units,
each
serving
as
an
evaporator-blower
unit,
thereby
pro-
viding
redundancy
in
case
of
failure
of
one
unit.
•
SOAC
equipment
tray
removal
has
been
i
mproved
by
providing
tray
slides
equipped
with
rollers
to
facilitate
removal
by
one
man.
Tray
weigh
t
has
also
been
reduced
to
a
maximum
of
90
pounds.
Production
Plan
Construct
i
on
of
the
SOAC
cars
started
with
release
of
the
underframe
in
November,
1971.
Be
tween
November
1,
1971
and
January
3,
1972
(when
car
shells
were
completed)
the
following
areas
were
designed,
redesigned,
or
re-evaluated
to
verify
the
configuration:
1.
Roof
Evaluations
were
made
of
the
possible
use
of
thicker
materials
than
the
.0
22-inch
stainless
st
ee
l
from
which
the
SOAC
roof
is
constructed;
howev
er
,
sch
e
dul
e
and
tooling
constraints
prevented
use
of
thicker
material.
2.
Sides
The
SOAC
sides
are
constructed
of
.0745-inch
stain-
less
steel
material
.
The
sides
are
spot-
and
seam-welded
to
the
Cor-Ten
frames.
3 .
Underframe
The
SOAC
underfrarne
required
considerable
wo
rk
because
of
the
many
dif
fe
r e
nt
types
of
equipment
whic
h
must
be
mounted
to
it.
4.
More
than
3500
detailed
parts
were
manufactured
and
put
into
the
ca
r
shells
when
they
were
mov
ed
from
th
e
e r
ec
tio
n
area
to
the
first
of
two
water
tests.
The
second
phase
of
production
was
accomplished
in
a
se
cure
area
within
the
St.
Louis
car
shops.
Be
cau
se
of
the
special
nature
of
the
cars,
the
area
had
be
e n
fenced
in
and
only
those
e
mployees
directly
a
ssoci
ated
with
the
program
were
permitted
inside.
As
SOAC
materials
were
received,
they
were
trans
fer
red
directly
into
the
are
a .
Because
of
the
limited
quantity
of
this
ma
terial,
its
control
was
thereby
great
l y
simplified.
11

Program
team
meetings
were
held
by
the
program
manager
on
a
weekly
basis
through
June
1972;
thereafter
they
were
held
almost
daily
to
ensure
on-time
delivery
of
the
SOAC
vehicles.
(Figures
2-2
and
2-3
show
the
SOAC
cars
during
construction.)
Functional
testing
(described
in
detail
in
Section
6)
was
accomplished
concurrently
with
fabrication.
These
tests
cul-
minated
on
August
20,
1972
when
SOAC
No.
1
was
moved
under
its
own
power;
SOAC
No.
2
was
powered
the
following
week.
The
two-car
train
was
then
made
up,
and
detailed
system
testing
was
conducted.
The
period
August
28
through
31,
1972
was
used
primarily
to
"sell-off"
the
cars
to
Boeing
and
UMTA
officials.
Minor
rework
was
required
and
several
tests
were
rerun.
Some
equip-
ment
changes
were
also
requested,
and
this
work
was
scheduled
for
completion
at
the
High
Speed
Ground
Test
Center
in
Pueblo,
Colorado.
The
two
SOAC
cars
were
pulled
from
the
St.
Louis
Car
Shops
at
3:30
p.m.
on
August
31,
1972
(Figure
2-4),
coupled
between
two
Norfolk
and
Western
Railway
transition
cars,
and
prepared
for
pickup
by
th
e
Santa
Fe
Railroad.
Shortly
before
midnight,
The
Santa
Fe
p
icked
up
the
cars
for
the
run
to
Pueblo
- a
record-breaking
11-1/2
months
after
program
go-
ahead.
Test
Phase
The
SOAC
cars
ar
rived
in
Pueblo
on
Sunday,
September
3,
1972.
They
were
trans
fe
rr
e d
to
the
Pueblo
Army
Depot
(PAD)
on
Monday,
where
they
were
stored
awaiting
the
arrival
of
test
crews.
Test
crews
arrived
at
PAD
on
September
11,
and,
after
conducting
an
inspection
which
revealed
broken
shear
pins
in
the
coupler,
started
setting
up
the
cars
for
test.
Pit
space
was
available
for
only
one
car
at
a
tim
e.
Ca
r
No.
1
was
pow-
ered
on
September
14
and
Car
No.
2
on
Septembe
r
19.
Modifica
-
tion
work,
and
minor
electronic
problems
prevented
movement
of
Car
No.
1
to
the
UMTA
Rail
Transit
Test
Track
oval
until
9:30
a.m.,
Sep
tember
26.
At
11:30
a.m.
on
Sep
t
ember
26
the
first
third-rail
power
application
was
made
using
power
from
DOT
Diese
l
locomotive
DOT
001.
This
resulted
in
smoke
a
nd
flame
from
an
insulation
breakdown
on
truck
No.
1.
Repairs
were
minor
and
were
accom-
plished
by
1:30
p.m.
At
2:36
p.m.
on
September
26 ,
SOAC
No.
1 s
tart
ed
ro
llin
g
on
i
ts
system
checkout
test.
Its
first
run
around
the
oval
was
made
at 4
mph.
All
systems
on
board
appeare
d
to
be
12

Fig
ur
e 2- 2. SOAC
Con
s
tru
c
tion,
March through May 1
972
1 3

Figure 2- 3.
SOAC
Construction,
Julv
1972
14

Figure
2-2
.
SOAC
Construction, March through May 79
72
1 3

Figure 2- 3.
SOAC
Construction,
July
1972
14

Figure
2-4.
SOAC
Ro/lout,
August
1972
Figure
2-5.
SOAC Dedication Ceremony, October 1972
15

working
normally
(at
4
:00
p.m.).
October
5
and
6,
7,
1972.
and
speeds
were
slowly
increased
to
65
mph
SOAC
No.
2
was
checked
out
under
power
on
and
two-car
operations
were
begun
on
October
On
October
12,
SOAC
was
unveiled
by
Secre
tar
y
of
Trans-
portation
John
Volpe
and
was
demonstrated
to
th
e
public
and
to
other
Government
and
industry
officials
(Figure
2-5).
Speeds
of
80
mph
were
attained
and
more
than
ten
round
trips
were
made
around
the
transit
oval
to
accommodate
the
1400
people
at
the
dedication.
Throughout
1972
and
1973,
SOAC
acceptance
and
engineering
testing
continued
at
the
High
Speed
Ground
Test
Center
(Figure
2-6)
•
The
SOAC
cars
were
within
two
days
of
completing
the
t
est
program
(described
in
Section
6)
when
they
were
involved
in
a
serious
switching
accident
on
August
11,
1
973.
This
accident,
which
resulted
in
the
death
of
the
motorman,
caused
major
dam-
age
to
the
forward
portion
of
Car
No.
2
and
necessitated
re-
turning
the
two-car
train
to
the
Boeing
Vertol
plant
in
Philadelphia
for
repairs.
Car
No.
1,
the
second
car
in
th
e
two-car
train
at
the
time
of
the
accident,
received
only
superficial
damage
to
its
anticlimber.
Repairs
were
complete
on
December
21,
1973
and
the
two-
car
SOAC
tain
was
returned
to
the
HSGTC
for
an
accelerated
pos
t r
epa
ir
test
program.
It
is
anticipated
that
the
SOAC
cars
will
begin
th
e
operational
test
and
eval
uation
program
(described
in
Section
8)
in
Spri
ng,
1974.
Results
of
this
operational
program
will
be
presented
in
Volume
2
of
this
report.
16

L£
0£""C
-·
Co-11•vc
•-
,•v
• •• •c~ ,
u.
..
o,.•o • •
"-
--
,.,
,..
,_
o,os
=
$t
•"'
>C[
-C
•
Ot
!
$It
• "
(~
I
.
6 ,
11111
&
11
' (;OAll
ll
OL -<)INTI
0
t(
COO,IM•~
COollT.01.
f'()ltf
l:J
,<;;I
1)11'(
11-..,U
I I
I
I
I
l
'
I
I
I
\
,,_
Figure 2- 6.
USDOT
High Speed
Ground
Te
st Center, Pueblo,
Co
lor
a
do
17

3. DESIGN AND PERFORMANCE
3.1
GENERAL
The
90,000-pound
SOAC
cars
are
designed
for
use
in
f
requent-stop,
high-s
peed
,
intra-city
mass
transporta
tio
n.
They
are
both
configur
ed
as
"A"
cars,
(i.e.,
may
be
operated
independently
or
as
a
two-car
unit),
and
are
powered
by
600
v
olts
de
which
may
be
picked
up
with
either
third
rail
collec
-
tors
or
a
pantograph.
Passenger
comfort
and
operating
eff
i -
ciency
are
featured
in
the
car
design.
Figure
3-1
details
t
he
SOAC
performance
and
design
characteristics
.
Th
e
car's
75-
foot
length
and
9.75-foot
width
are
the
maximum
outside
dimensions
compatible
with
p
reva
iling
subway
clearances
(tunn
e
ls,
p
latf
orms
).
Th
e
cars
are
capab
l e
of
80 mph
speeds
with
an
init
ial
acceleration
rate
of
3.0
mph/
sec
. (As
shown
in
Figure
3-2,
the
SOAC
can
achieve
80
mph
in
60
to
65
sec
onds.)
Braking
from
80
mph
may
be
accomplished
with
either
dynamic
or
fric
tion
brakin
g
(or
a
blended
com-
bina
tion)
and
is
accomplished
in
under
1700
feet.
A
uni
q
ue
feature
of
the
SOAC
is
it
s
ability
to
brake
from
80
mph
using
dy
namic
braking
only.
In
high-speed,
frequent-stop
service
this
would
save
brake
shoe
wear,
and
reduce
maintenance
costs.
Normal
conv
ersat
ion
between
passengers
is
possible
due
to
the
car's
quiet
int
erior
.
Figure
3-3
illustrates
some
of
the
features
contributing
to
SOAC
' s
qu
iet
rid
e.
Dat a
taken
to
date
have
shown
that
the
SOAC
has
an
interior
noi
se
l e v
el
of
as
low
as
63
dBA
at
a
speed
of
50
mph
(outside
of
a
tunnel,
with
all
e
qui
pm
ent
,
air-conditioning,
et
c.
on
l i ne
).
In
addi-
tion,
ext
erior
nois
e
is
min
im
a
l,
since
littl
e
noise
is
gener-
ated
by
the
onboard
equipment.
18

f-'
'°
PANTOGRAPH
(R
EMO
VABLE)
FR
ESH
AIR
INTAKE
r\
- 8'
7¼"
18'2
¼"
--
- ~ 18'
2¼
" - ··· -18" 2
¼"
-I
'
i
I I
'14
LV
V
~C:U
UVY
"
'"'
I )s i , ,
17
¼"
Lo
cKED
DowN
I I
...
. K
I'
--
·-
--·-
. D .
10101
. D . 1
0101
. D .
1r
ir±
3 ··
VARIABLE
TOP
OF
RAIL
~
10'
4¼"
_1
_ _
-1-
TRUCK 54'0" 4
TRUC
K
~ -
--
~ 7'
6"
~
. -
-·
---·
. ---
74'8½"
- - - - L · 7'6"
'""
Length
Width
75 Feet
9.75 Feet
Minimum
Track Curve Radius 145 Feet
80
MPH
3.0 MPH/
Sec.
2.5 MPH/
Sec.
2
600
VDC
Nom
inal
spec
75
dBA
@ 50 M
PH
actual 63
dBA
@ 50 MPH
Speed
Acceleration,
initia
l
Jerk Rate
Po
wer
Noise
Le
vel, i
nte
rio
r.
Noise Level,
50
ft
wayside 78 d
BA
@
50
MP
H
actual 73
dBA
@ 50 M
PH
Passe
nger Capacity (No. 1 car)
Seated
Nominal
Maximum
Passe
nger Capacity (
No
. 2 car)
Seated
Nominal .
Maximum
Figure 3-
1.
Performance
and
Design Characteristics
TOP
;--
OF
RAl~ " D:AB
~
NUMBE
R 2
END
OF
CAR
~
--
9'9"
TOP
OF
F.!:_
O_Qfii_
62
100
220
72
100
300
liJ
~
4
'8½
"-j
N
UMB
ER 1
END
OF
CAR

5----------------------------
TIME
TO
4 (SERVICE)
-------=
......
-MAXIMUM
SPEED
(BETWEEN STATIONS)
3
MAXIMUM
ACCELERATION
-~.,c;....
-
----
-
4------
---------4
G
w 2
tt---..Y'--------------.---
-
+--------+-f
'
IQ
:I:
c..
:E
z
0
'-
...._
~CC£
LE
RA
ilQ••
_____
_
.)..__~~';30-;"S;;E:;-;:C:;-O~N;;;DT,'"~
- _
-••
STATION DWELL
-,
~
or-
---_.
___
_
_._
_
__
......_..._
__
_
_._,.._
__
_._
___
_
a:
TIME
20
40
160
80
100
~
(SECONDS) I
~
- 1
------
-------
-
---
- -
-----------+--t
~
'
~
- 2
11----
---
- -
--------'''-----------''---------
u (SERVICE) \ /
.,.._
__
__
MAXIMUM
\ f
- J DECELERATION ---
►
- - - -
DECELERATION
- 4
--------
-------------
-
--
----+--t
TOTAL
TIME (1 CYCLE)
-
5----------------------------
Figure 3- 2. SOAC
Vehi
cle Operating Profile
100
80
:I:
c..
60
:e
0
w
w
40
c..
CJ)
a:
ct
(.)
20
0
"SOUND
TR
APS' IN AIR
C
OMFORT
SYSTEM
INCREASED ABSOR
PT
ION
(CARPET ON FLOOR
AN
D
WINDSCREENS
BY
DOORWAY
S)
CARPET UNDER L
AYMENT
:
H
EAVY
VIN
YL
LA
MINATE
D
ON
FOAM
ALUM
I
NUM
FACED
F
IB
ERGLASS B
LA
NKETS
FLO
OR
D
ES
IGNED TO REDU
CE
SO
U
ND
TR
A
NS
MIS
SI
ON OF
UN
DERCAR EQUIPME
NT
TR
UCK/BODY IS
OL
A
TI
ON
BY
--.:C=:::D"-=-------:::~~-=:;r
A
IR
SUS
PEN
SI
ON
SYSTEM
RES
I
LIEN
T
WHEEL
S
~
UNDERCAR
EQUIPMENT
ISOLATED
FROM
FLOO
R
Figure 3- 3. Noi
se
Control
Features
20

Figure
3-4.
Exterior
The
cars
are
adaptable
to
test
and
operation
in
New
York,
Boston,
Cleveland,
Chicago
and
Philadelphia
by
raising
or
low-
ering
the
car
body
up
to
5
inches
from
the
top
of
the
truc
k ,
by
the
use
of
shims.
In
addition,
the
third-rai
l
collectors
may
be
raised
or
lowered
to
suit
various
third
rail
heights.
When
necessary,
the
SOAC
is
equipped
with
a
pantograp
h ,
and
an
automatic
power
changeover
device
to
chang
e
power
sources
between
overhead
and
third
rail
"on
the
fly".
3.2
EXTERIOR
The
styl
ed
exterior
(Figure
3
-4)
features
smoot
h ,
brush-
finished
stainless
steel
materials
and
molded
fiberglass
ends.
Th
e
car
structu
r e
features
all-steel
construction.
Four
pairs
of
biparting
50-inch
sliding
doo
rs
per
car
sid
e
are
designed
to
safely
handle
maximum
passeng
e r
inter-
change
within
th
e
desired
20-second
station
stop
dw
e
ll
tim
e .
Safety
featur
es
of
th
e
door
system
inclu
de
propulsion
s
ystem
interlock,
restr
ic
ted
push-back
leave
s ,
soft
door
edges
, and
a 3
-s
econd
warning
chime
prior
to
door
closing.
3. 3 S
TRUCTURE
Th
e
underframe
is
f a
bricated
of
high-strength,
low-alloy
steel
with
f
ull-l
e
ngth
side
sill
rolled
channels
a
nd
f
ormed
cross
bearers
be
tween
bolsters.
The
cross
bearers
(floor
support
beams)
used
for
undercar
equipm
ent
mounting
are
locally
reinforc
e d
and
s
ta
bilized
to
resist
the
prim
ary
and
secondary
loads
i
mposed
by
the
heavier
it
ems
. Some
of
the
or
iginal
mounting
p
ro
v
isi
o
ns
were
rein
fo
rce
d
after
the
cars
were
deli
ve
red,
primaril
y
based
on
fi
e
ld
experience
with
t he
NYC
TA
R-44
cars.
A f
urther
local
modificati
on
made
during
testing
at
Pueblo
inv
olved
substanti
al
stiff
en
i
ng
of
t hr
ee
cross
bearers
and
a
longitudinal
in
terconn
e ct i
ng
beam,
plus
the
addition
of
two
diagonal
horiz
on
tal
support
members
.
Th
e
purpose
was
t o
rais
e
th
e
natural
v
ib
ra
ti
on
frequency
of
t he
moto
r-alt
e
rnator
in
sta
lla
tion
t o a
frequency
above
that
ex-
perienced
within
th
e
car's
operating
speed
range.
21

The
underframe
ends
incorporate
the
body
bolster,
which
transfers
vertical
and
lateral
loads
between
the
car
body
and
the
truck
bolster,
and
the
draft
sill
structure,
which
mounts
the
draft
gear
and
anticlimber.
Two
heavy
I-section
trans-
verse
beams
joined
by
shear
plates
and
rolled
channels
make
up
the
body
bolster.
The
draft
sill
structure
consists
of
two
rolled
channels
joined
by
the
anticlimber,
the
center
portion
of
three
cross
bearers,
shear
plates,
and
the
draft
gear
mounting
members.
This
structure
terminates
at
the
body
bol-
ster
and
is
joined
to
the
side
sills
by
sh
ea
r
panel
assemblies
and
the
cross
bearers.
The
underframe
end
construction
is
shown
in
Figure
3-5.
The
sides
and
roof
of
the
car
are
constructed
of
formed
low-alloy,
high-strength
framing
members,
welded
together,
and
spot-welded
stainless-steel
skins.
(This
construction
is
shown
in
Figure
3-6.)
Side
frames
ar
e
joined
to
the
side
sills
through
angl
e
clips
while
the side
sill
cover
is
fusion-
welded
to
the
sill
bottom
flange
and
spot-welded
to
the side
skin.
The
junctions
betw
een
the
sid
es
and
the
roof
are
made
through
the
formed
side
plate
channel
and
the
formed
cove
(as
shown
in
Figure
3-6).
Increased
car
bo
dy
torsional
str
e
ngth,
primarily
requir
e d
to
withstand
cross-corner
jacking
loads,
is
provided
by
struc-
tural
bulkheads
located
just
inboard
of
the
end
side
doors.
As
shown
in
Figure
3-6,
these
bulkheads
are
built
up
of
low-
alloy,
high-strength
steel
tubin
g;
vertical
portions
are
con-
cea
led
within
th
e
windscreens.
The
car
body
end
closures
are
fiberglass-reinforced
polyester-resin
mol
dings
rein
fo
rced
with
steel
framing
around
the
openings
for
the
windshi
e
ld
(No.
1
end)
and
door
(No.
2
end)
.
3
.4
INTERIOR
The
design
of
the
SOAC
interior
is
oriented
towards
passenger
comfort
and
appeal.
Tw
o
differ
e
nt
car
interiors
have
been
developed
(Figure
3
-7)
.
Car
No.
1,
the
"low-den
s
ity"
car,
has
62
cushioned,
upholstered
s e
ats
designed
for
m
ax
imum
comfort
(Figure
3-8).
A
lounge
area
complete
with
tables
is
located
near
the
cab,
a
conversational
type
area
is
located
near
the
No.
2
end,
and
a
no
rm
al
seating
arrangement
i s r
epre
-
sented
by
the
middle
section.
Maximum
capacity
of
this
low-
de
nsity
car
is
220
passen
g
ers.
The
No.
2
car
interior
i s
represen
t
ative
of
a
mqre
standard
subway
car
configuration
with
seats
for
72
and
in-
creased
spac
e
for
standees
(s
ee
Figur
e
3-8).
One-piece
molded
fibe
rglass
seats
are
fitted
wit
h
padded
replaceabl
e
cushions.
Maximum
capacity
of
this
"h
i
gh-density"
car
is
300
passeng
e
rs.
22

Figur
e 3-
5.
Fr
ame Construction
23

.
Roof
Construction Figure
3-6
24

No. 1
CAR-SEATING
PLAN
SEATED PASSENGERS
62
NOMINAL CAPACITY
100
MAXIMUM
CAPACITY
220
Figure 3-
7.
Seating Plans
25
No. 2
CAR-SEATING
PLAN
SEATEDPASSENGERS72
NOMINAL
CAPACITY
100
MAXIMUM CAPACITY
300

"LOW
DENSIT
Y"
(62 SEATS)
"H
IGH DENSI
TY"
(72 SEATS)
Figure 3- 8. I
nterior
.
26

Seat
materials
of
both
cars
can
be
readily
cleaned
and
are
resistant
to
vandalism.
Floors
and
windsc
re
ens
are
com-
pletely
covered
with
carpet
of
dense
(81
ounces
per
square
yard)
velvet
weave,
level-loop
pile
wool
with
synthetic
rubber
latex
back
coating.
Special
emphasis
has
been
placed
on
making
the
car
inte-
riors
as
colorful,
quiet,
and
safe
as
possible.
The
usual
advertising
space
along
both
sides
of
the
cars
has
been
re-
placed
by
lighting
fixtures
to
provide
greater
illumination
at
passenger
level.
Wall
panels
are
formica
417
with
a
honey
tone
teak
suede
finish
.
Safety
of
the
SOAC
interior
has
been
improved
by
a
process
termed
"delethalization,"
to
reduce
the
consequences
of
acci-
dents,
particularly
collisions.
A
delethalized
interior
tends
to
have
a
softer,
more
rounded,
more
yielding,
and
less
brit-
tle
quality.
Instead
of
fatal
injuries,
either
survivable
injuries
or
mere
discomfort
may
result,
depending
on
the
seri
ousness
of
the
accident.
Padded
stanchions
and
handholds
are
installed
to
enable
standees
to
prevent
falls
caused
by
car
accelerations
during
both
normal
operating
and
accident
conditions.
Stanchion
pad-
ding
reduces
the
probability
of
injury
in
th
e
event
that
a
passenger
accidentally
strikes
a
stanchion.
Similarly,
the
padded
seats
and
cushioned
floor
carpet
will
reduce
the
conse-
quences
of
accidental
falls.
The
stanchion
and
handhold
spac-
ing
of
the
SOAC
is
close
enough
so
that
even
a
small
woman
can
span
adjacent
stanchions
or
handholds
through
the
length
of
the
car.
Protection
against
thrown
missiles
(stones,
etc.)
coming
through
the
large
side
windows
is
provided
by
laminated
safety
glass
with
a
tough
plast
ic
core.
In
the
event
of
a
mis
s
ile
strike
sufficient
to
break
the
glass
on
the
passenger
side
of
the
plastic
core,
tempering
of
the
inner
lamina
results
in
a
glass
failure
mode
characterized
by
small
granu
la
r
pieces
rather
than
sharp
splinters
or
larg
e
jagged
pieces.
The
motorman's
windshield
is
designed
to
withstand
the
impact,
without
penetration,
of
a
5-pound
stone
at
50
mph
and
a
1-pound
stone
at
80
mph.
During
design,
emphasis
was
placed
on
the
use
of
fire-
retardant
materials
throughout
th
e
car,
meeting
FRA
203
specification
as
a
minimum.
27

4. PROPULSION AND BRAKING
SYSTEMS
The
SOAC
propulsion
system
consists
of
the
traction
mo
tors,
gearboxes,
and
associated
high
and
low
voltage
power
supply
and
control
systems
necessary
to
allow
controlled
oper-
ation
in
both
drive
and
brake
conditions.
The
following
para-
graphs
detail
the
var
i
ous
components
and
functions
of
the
SOAC
propulsion
system
as
supplied
by
the
AiResearch
Manufacturing
Co . ,
Division
of
the
Garrett
Corporation,
Torrance,
California.
The
friction
air
brake
subsystem
(also
supplied
by
AiResearch)
is
described
in
Sect
i
on
4.7.
4 . 1 BASIC PROPULSION
SYSTEM
The
SOAC
is
powered
by
four
axle-mounted
separately
excited
field
DC
traction
motors.
The
motors
are
fully
com-
pensated
and
are
connected
two
in
series
on
e
ach
truck
with
the
two
trucks
in
paralle
l . T
he
motors
also
provide
most
of
the
braking
force
during
deceleration;
they
are
reconnected
as
separately
excited
DC
generators
with
the
dynamic
brake
re-
sistor
grids
as
electrical
loads.
Co
ntrol
of
the
traction
motors
is
by
a
force
commutated
DC-DC
chopper
in
th
e
armature
circuit
and
by
AC-DC
phase-delay
rectifiers
(thyristors)
in
the
separate
field
c
ircuits
.
AC
power
is
sup
plied
by
th
e
auxiliary
power
motor
alternator
set.
DC
power
to th
e
armature
is
supplied
by
the
third
rail
sho
es
(or
pantograph)
through
the
inpu
t
inductor
-f
ilter
capacitor.
This
type
of
motor
control
syst
em
provides
stepless
and
essen
-
tially
infinite
control
of
tractive
(driv
e )
or
braking
effort
from
zero
to
full
l
oad
capability.
Control
subsystems
p
rovide
for
load
weight,
jerk
rate,
and
wheel
spin-
s
lide
comp
e
nsation,
28

as
well
as
for
dynamic-friction
brake
blending.
A
block
dia-
gram
of
the
SOAC
propulsion
and
braking
systems
illustrating
the
various
interfaces
is
shown
in
Figure
4-1.
4.2
PROPULSION EQUIPMENT
A
list
of
major
propulsion
system
components
is
presented
in
Table
4-1.
Each
of
the
several
control
units
contains
var-
ious
functions
which
will
be
described
in
later
paragraphs.
TABLE
4-1.
PROPULSION SYSTEM
COMPONENTS
Estimated
Item
Weight
(lb)
Traction
motors
(4)
Gearbox;
coupling;
suspension
(4)
Chopper
Power
control
unit
(PCU)
Propulsion
power
control
unit
(PPCU)
Auxiliary
power
control
unit
(APCU)
field
power
Input
reactor
Motor
smoothing
reactor
Braking
resistor
grids
(2)
Line
switch
(main)
Blowers
and
cooling
equipment
(2)
Total
6,240
4,560
975
800
200
*
440
940
650
100
280
15,185
*Weight
of
APCU
is
included
in
the
3800-pound
weight
estimated
for
the
auxiliary
power,
motor-alternator
set.
Figure
4-2
shows
the
location
of
the
above
propulsion
equipment
as
well
as
other
major
car
subsystems.
4.3
EQUIPMENT DESCRIPTIONS
The
traction
equipm
e
nt
listed
in
Table
4-1
is
as
follows:
Traction
Motor
The
traction
motors
are
designed
for
op
e
ration
with
the
undulating
currents
supp
lie
d
by
the
chopper.
The
motors
ar
e
force-ventilated
by
separate
blowers
and
are
fully
compensated
with
interpoles.
The
armature,
yoke,
and
field
pol
e s
are
29

THIRD-RAIL
SHOES
-
•
-
__
SURGE
~------~
ARRESTOR
--
SPEED
CONTROL
MASTER
~----~-~
CONTROLLER
.
-
600
VOLTS
DC
._
..
, I f
PANTOGRAPH
TRANSFER
AND
KNIFE
SWITCH
, ,
PROPULS
ION
CONTROL
UNIT
(PCU)
PROPULSION POWER
CONTROL
UNIT
(CHOPPER) {PPCU)
PANTOGRAPH
-
BRAKE
RESISTOR
GR IDS
(2)
_ SPEED SENSORS
(4)
TRACTION
GEAR
--
--MOTORS BOXES
(4)
(4)
·,►
I~
HOSTLER
AIR
------
-------
£~I~
MA
START
RESISTOR
--
ELEC
TRIC
---•
AIR
-
,,
,
MOTOR
ALTERNATOR
S
ET
(APCU)
220
VOLTS
AC
37
VOLTS
DC
C]HCJ
HYDRAULI
C
j I
-
A COOL,
_
...
_-_-_-_-_-_-_--1..,.
ING
MECHANI
CAL
(CHOPPER)
FAN
,,
AIR
B
RAKE
SUBSYSTEM
AIR.._
(2)
I f
AXLES
{ 4)
do
___
.,,:
BRAKE
,...
CYLINDERS,.....
(8)
D
rt
AIR
AIR
COMPRESSOR
{!,
A IR
C
OUPLER
S
Al
R S
USP
ENS
ION
-
-
a
HYDRAULIC
.--------,,
HA
ND-
BRAKE
(2)
CYLINDERS
Fi
gur
e
4-1.
Propulsion a
nd
Br
ak
ing S
yst
em
Bl
ock
Di
a
gr
am
30

w
f-'
I
\
{'
.;
l I I
.:i'
~
o!""
I
\
'i.
AIR
SPRING
SOSPENSION
~
,('
ii"',{)b~~
...
.I!
.I!
,;
I I I I
>\/
I
.AI
R CONDITIONING
DUCTS
( INCEILlr-.Gl
R'
$ :!
.I!
I
...
...
.I!
I I
I I I I
l
ff
,;
.I!
C>EVSON
f
,
,!
?
:f
f
..r
,f
,?
I
:,'
,; ,;
,; ,;
I I I I
-\
\
,p{'.('\
4'
:!
~,.,.l\
.t>
.Pl14
~
J
..,ti
,;
.I!
,?
.I!
... .i! .i! .i! .-t
.:i'
I 1 \
l!
L I
l
~
-·~=
~~
-
~;~::
~~~
;p
~~~
~l.....::>...
--
--{
Figure 4- 2. Propulsion Equipment Locati
on
POINER
cou.ECTOR
TRUCK
VIEW
(gr,(arg~
tor
c1
.ar
1
ty)
'i.
·
COUPLER

laminated.
The
motors
are
permanently
connected
in
series
on
each
truck
with
the
trucks
in
parallel.
Motor
ratings
are
as
follows:
Continuous
power
One-hour
power
Maximum
drive
power
Maximum
braking
power
Maximum
braking
v
oltage
Maximum
braking
curren
t
175
hp
at
1560
rpm
(460
amps)
230
hp
at
15
60
rp
m
(600
amps)
283
hp
from
1560
to
4300
rpm
(
750
amps)
575
hp
600
volts
915
amps
The
motor
is
designed
to
a
duty
cycle
of
repetitive
Oto
80
to
0 mph
operation
at
the
105,000-pound
design
weight.
Each
motor
has
12
sets
of
Grade
2755
p
ure
carbon
split
brushes
with
pigtails.
The
brushes
are
1
.25
inches
long
when
new
and
have
a
15-degree
top
angle.
Brushes
are
mounted
in
Ringsdorff-supplied
holders
having
negator
springs
which
pro
-
vide
constant
steady
brush
pressure
over
the
range
of
brush
wear.
The
traction
motor
is
shown
in
Figure
4-
3.
Gearbox
and
Coupling
A q
uillsha
ft
coupling
connects
th
e
motor
to
the
gearbox.
The
gearbox
is
parallel-drive
with
a f l
exible
rubber
coupling
between
the
output
bull
gear
and
the
axle.
Th
e
gearbox
con-
ta
ins
double-reduction
helical
g
ea
rs
designed
for
minimum
noise.
All
bearings
are
the
tapered-roller
typ
e .
Gears
are
partially
immersed
with
supplemental
directed
flow
l
ubrication.
The
gear
ra
tio
has
been
se
lected
to
produce
a
maximum
speed
of
80
mph
with
30
-i
nch
-di
ameter
wheels
and
a
motor
shaft
speed
of
4300
rpm.
This
corresponds
t o a
gear
ratio
of
4.78.
A f
lexi
ble
rubber
couplin
g
is
provid
ed be
tween
t
he
output
gear
and
the
axle.
A
reac
ti
on
torque
arm,
r
esi
li
e
ntly
lin
ked
to
the
truck
frame,
stabilizes
the
gearbox.
Magne
tic
pickups
are
provided
on
the
in
p
ut
gear
for
inpu
t
into
the
car
speedom-
eter
and
spin-slide
detection
syste
ms,
on
e
per
axle.
Figure
4-4
shows
the
SOAC
motor
and
drive
system.
System
Schematic
The
func
tional
schematic
shown
in
Figur
e
4-5
illustrates
th
e
circuit
locations
of
the
various
compon
e
nts
(the
key
32

Figure 4
-3
. Traction Motor
33

TOP V I
EW
BOTTOM V I
EW
Figure 4-
4.
Motor and Drive System
34

w
u,
0 0
@
0 0
I © CHOPPER
@
@)
@
®
©
-~
~®r-1®±~
~~@
-t~~,
~
® 0 @
@
Figure 4- 5. Propulsion System Fun
ctio
nal
Schematic (Sheet 1
of
2)
FIELD
POWER
SUPPLIES
(
2)

1.
2.
3.
4.
5.
6.
7.
8.
9.
10.
11.
12.
13.
14.
15
.
16.
17.
18
.
19.
20.
21.
22.
23.
24.
25.
26.
27.
28.
29.
NOMENCLATURE KEY AND VALUES
Main Fuse
Main Contactor
Overcurrent Sensor
Differ
en
tial Current Sensor
Input
Inductor
Filter
Capacitor
Fuses
( 11)
Filt
er Capacitors (55)
Diode
for
Voltage Suppression
Motor
Alternator
Fuse
Overcurrent Sensor
Drive Contactor
Main
Thyri
stors (12)
Free-Wheel Diodes (4)
Smoothing Reactor
No. 2
Truck
Overcurrent
Re
lay
No
. 1
Truck
Overcurrent
Re
lay
No
. 2 Truck Armature Current Sensor
No. 1
Truck
Armature
Curr
e
nt
Sensor
No. 2
Truck
Armatures and Fields
No
. 1
Truck
Armatures and Fields
Field Power Supplies (2)
Dynamic Brake Resistor Grids (2) , · ·
Brake Contactor ( 1)
Contactor (Open in "Driv
e",
Closed
in Brake")
Contactor (Open
in
"Brake·
•,
Cl
osed
in
"Drive")
600
VDC Power and Return
for
Motor
Alternator
Set
Car Body Ground (2)
Axle
Ground Brushes
(4
axles)
Diod
es
to
prevent Armature Current
"Swapping"
during Series-Parallel
Dynamic Braking
1500 amps
1
000
VDC
, 1000 amps
(two
in para
ll
el)
Set
at
3000
amps
125 amps nominal
0.3 millihenrys, air core, 1
230
am
ps
DC RMS
700
VDC,
50
amps, fast
blow
current l
imiting
6000 MFD,
300
VDC e
lectrolytic
(11
parallel strings
of
5
in
se
r
ies
per string)
2000 VDC, 1000 amps
avg
700
V,
400
amps
Set
at
3000
amps
1000 VDC,
1000
amps
(two
in
para
ll
el)
1200
V,
1000
amps
avg
(6 parallei strings
of
2
in
series
per
string)
2000
V,
1000 amps
avg
(2 parallel strings
of
2
in
series
per
string)
1.0 millihenrys air core,
1360
amps RMS,
bifi
lar wound,
"V"
connected
Set
at
1200
amps
Same
as
Tr
uck
No. 1
Hall effect
type
se
nsor: 0-1500 amps DC i
nput
, analog 0-10 VDC
output
Same
as
Tru
ck
No.
2
Armature:
600
amps RMS
at
312
VDC
(1
hr
rating),
900
amps
at
600
VDC (p
ea
k rating)
Fields: 0-43 amps
DC
Same
as
Truck
No. 2
230 V 3-phase
60
Hz
input,
0-50 amps DC ou
tp
ut (phase delay
rectifi
er
type
w
ith
reversing contactor)
1.5 oh!l)s, 1.2 megawatts peak power dissipation per l
eg
(co
nn
ected
in parallel) .
1000 VDC,
1000
amps DC (DPDT, center-off, non-interr
upting
type)
One
throw
of
brake contactor
Opposite
throw
of
brake contactor
N
o.
4/0 wire
(85°C
rating)
373 MCM wire (85
°C
rating)
2000
V,
1000 amps
avg
Figure 4-
5.
Propulsion System Functional Schema
tic
(Sheet 2
of
2)
36

identifies
each
component).
The
circuit
components
are
de-
scribed
in
the
following
paragraphs.
Chopper
The
DC
chopper
provides
smooth
control
of
armature
cur-
rent
and
tractive/braking
effort
when
the
system
is
operating
below
motor
base
speed.
This
control
is
achieved
by
varying
the
motor
terminal
voltage
(and
armature
current)
using
a
var-
iable
relation
between
the
on
and
off
times
of
the
chopper
semiconductor
devices.
Once
base
speed
has
been
attained,
the
chopper
is
"full-on"
and
motor
control
is
passed
to
the
motor
field
control
(field
weakening).
Chopper
operation
is
de-
scribed
later
in
this
section.
The
chopper
box
shown
in
Figure
4-6
consists
of
four
pullout
drawers
of
semiconductors
and
load-sharing
resistor-
capacitor
networks,
commutating
reactor
and
capacitors,
and
thy
~istor
gate
drives.
Figure
4-7
illustrates
the
basic
chopper
circuit
and
load-sharing
networks.
There
are
12
main
thyristors
(2
series,
6
parallel),
6
commutator
thyristors
(2
series,
3
parallel),
2
commutator
diodes
(2
series),
4
free
-
wheeling
diodes
(2
series,
2
parallel),
and
38
commutator
capacitors
(all
in
series).
The
chopper
box
is
approximately
51
inch
es
long,
36.8
inches
deep,
and
23.5
inches
high.
It
is
force-ventilated
by
the
traction
motor
blower
for
the
forward
truck
at
a
fl
ow
rate
of
approximately
2000
cfm,
and
is
designed
for
an
inlet
ambi-
ent
air
temperature
of
125°F.
A
temp
era
tur
e
sensor
is
located
in
a
critical
portion
of
the
chopper.
The
chopper
is
designed
for
a
normal
voltage
of
600
volts
de
and
transients
of
2400
volts
de.
The
combination
of
input
inductor
and
filter
capacitors
(descri
bed
in
later
paragraphs)
provides
a
transient
energy
absorption
of
20,000
joules
(watt
-
seconds).
The
normal
capacitor
charge
at
600
volts
de
is
approximatley
2000
joules.
The
SOAC
input
filter
provides
two
times
the
energy
absorption
provided
for
a
similar
chopper
operated
successfully
on
the
Long
Island
Rail
Road.
Figure
4-8
illustrates
the
range
of
transient
vo
lta
ge-time
durations
for
which
the
SOAC
input
filter
was
designed.
Power
Control
Unit
The
Power
Control
Unit
(PCU)
is
a
two-section
box
80
inches
long,
26
inches
wide,
and
19
inches
high.
It
contains
the
600-volt
input
power
conditioned
eq
ui
pment
and
provides
conditioned
power
to
both
the
propulsion
and
auxiliary
equip-
ment
(motor-alternator
set).
The
functions
it
provides
are
listed
below
(and
shown
in
Figure
4-5).
37

~,-
5§ w.
Figure 4- 6. DC Chopper
38

BASIC
POWER
NETWORK
--
OPPER
BOX
MAIN
-:7
INPUT
INDUCTOR,
CAPACITORS
AWE RS: A 1;
A2;A3;
A4
THYRISTORS:
(A
1;
A2)
I
ARMATURE
C1
I
I
I
I
L
4
TO
CAPACITORS
AND
GROUND
CIRCUIT
~------4---
□
•
COMMUTATOR
CAPACITORS
Ll
COMMUTATOR
_..
D1
REACTOR
COMMUTATOR
\
DIODES:
(A4)
COMMUTATOR
THYRISTORS
I
I
I
I
FREE-
D2
WHEELING
""'-..I_
DIODES:
(A4)
•
ARMATURE
CIRCUIT
SEMICONDUCTOR
VOLTAGE
AND
CURRENT
SHARING
NETWORKS
THYRISTORS
(OR DIODES)
IN
SERIES
RESISTOR
FOR
CURRENT
SHARING
WITH
OTHER
SIMILAR
PARALLEL
UNITS
t
RESISTORS FOR
LONG
-TERM
VOLTAGE
SHAR
ING
Figure 4-
7.
Chopper Schematic
39
RESISTOR
CAPACITOR
NETWORKS,
DYNAMIC
VOLTAGE
SHAR
IN
G

100,000
LU
0
::::>
I-
z 10,
000
c.,
<(
- I
DURATION
Ill,..
~
. I I
"'
TRANSIENT
~
600
voe
NOMINAL
VOLTAGE
"'
MAGNITUDE
~
"-
~
LU
c.,
<(
I-
_J
0
>
I-
z
LU
Cf)
z
"'
"~
'--
' ' ' "'--
<(
1000
a:
I-
100µ
S
1MS
10MS 100MS
TRAN
SIE
NT
DURATION
Figure
4-8.
Transient Voltage
vs
Tr
ansient Duration
40

The
right-hand
section
contains
the
following
functions:
•
Traction
power
switch
gear
(i.e.,
drive,
brake
·,
and
main
contactors)
•
Overcurrent
relays
(3)
The
left-hand
section
consists
of
the
input
filter
capac-
itor
bank
(6000-microfarad,
300-volt
capacitors:
5
in
series,
11
in
parallel)
consisting
of:
•
Capacitor-bank
fuses
(22)
•
Capacitor-bank
fuse
trip
sensor
•
Primary
traction
motor
armatur
e
current
sensors
•
Capacitor-bank
and
motor-armature
voltage
sensors
•
Traction
motor
series
(sharing)
diodes
and
cooling
fans
(2)
•
Capacitor-bank
cooling
fans
(3)
•
Overcurrent
relay
(1)
•
Motor-Alternator
and
dead-battery-start
600-volt
fuses
•
Dead-battery~start
series
regulator
resistors
Propulsion
Power
Control
Unit
The
Propulsion
Power
Control
Unit
(PPCU)
measures
40
by
20
by
19.5
inches.
It
contains
solid-state
plug-in
circuit
cards
which
provide
the
analog
and
log
ic
control
functions
fo
r
the
propulsion
and
friction
brake
syst
ems
.
Th
e
various
card
functions
are
summarized
below
and
illustrated
in
Figure
4-9.
(Also
see
Figure
4-5.)
•
Propulsion
and
brake
P-signal
transducers
•
Jerk
limiting
•
Armature
current
program,
regulation
and
balance
•
Tractiv
e
effort
program
and
regulation
•
Load
weight
compensation
• Ax
le
speed
cards
(4)
•
Spin-slide
cards
(2)
41

POWER
SUPPLY TRA
IN
LINE (PROPULSION) (SPAR
E)
PO
W
ER
SUPP
LY
PRE
REGULATOR LOGIC NO. 1 P-TRANSDUCER
PRE
REGULATOR
2002633 2015221 2015219 2002633
J11
J
21
J31
J41
J51
REGULATOR
TRAIN
LINE
P-W
JERK
(SPARE) REGULATOR
±15V LOGIC
NO
. 2
±15V
2002635 2015223 2015209 2002635
J12 J22 J32 J42 J52
POWER
SUPPLY
IA
PRO
GRAM
TE PROGRAM (SPARE)
TRU
CK 1
MONITOR BLENDER
2002665 2002667 2015207 2002661
J13 J23 J33 J43 J53
OS
D LOGIC (SIMULATOR TE REGULATOR (SPAR
E)
TRUCK
2
INPUT) BLENDER
2002673 2002643 20026
61
J1
4 J24 J34 J44 J54
(SPARE)
TE
PAUSE
IA
REGULATOR
(BRAKE)
LOAD
LOGIC P-
TR
ANSDUCER COMPENSATOR
2015235 2002645
20
15219 2002651
J15 J25 J35 J45 J55
DETECTION
CHOPPER & FU
SE
CONTROL IA
BALANCING
(AXLE
1)
(AX
LE 1)
FAULT
DETECTOR
SP
IN-SLIDE SPEED DETECTOR SLIP-SLIDE
2015213 2015211 2015205 258-501-9001 2002653
J16 J26 J36 J46 J56
CONT ACTOR
ANALOG
SIG
NAL
CHOPPER
(AXLE
2)
(AX
LE
2)
M
ONITORING
CONDITIONER CONTROL LOGIC SPEED DETECTOR SLIP-SLIDE
2015231 2002669 2015201 258-501-9001 2002653
J17 J27 J37 J47 J57
CONT ACTOR CHOPPER
GATE
OPERATION SI
GNAL
PULSE
(AXLE
3)
(SPARE)
ANNUNCIATOR
COND
ITI
ONER GENERATOR SPEED DETECTOR
2
01
5233 2002669 2015203 258-501-9001
J18 J28 J38 J48 J58
FAULT
CONT
AC
T
OR
DR/
BK
CON
TR
OL
(AXLE
4)
(SPARE)
INDIC
ATOR CONTROL
LO
GIC SPEED DETECTOR
2015217 2002663 2002671 258-501-9001
J19 J29 J39 J49 J59
BOTTOM FRONT VIEW
Figure 4- 9. Propulsion Power
Control
Unit
Plug-In Card L
ocat
ions
42

•
Dynamic/friction
blending
per
truck
•
Various
monitor,
detection,
and
system-shutdown
logic
Auxiliary
System
Power
Motor
Alternator
Set
- A
125-kw
motor
alternator
(Figure
4-10)
supplies
230-volt
3-phase
60-cycle
power
to
all
auxil-
iary
motors
on
board
each
car
as
well
as
power
for
the
traction-motor
field
control.
The
auxiliaries
include
air
conditioning,
recirculation
fans,
traction
cooling
fans,
low
voltag
e
power
supply,
battery
charger,
and
th
e
car
air
com-
pressor.
All
of
these
auxiliary
sys
tems
use
AC
motors,
which
results
in
lighter
weight
and
improv
ed
reliability
over
con-
ventional
DC
machines.
The
125-kw
rated
performance
is
obtained
when
line
volt-
age
is
550
volts
de
or
greater.
At
the
450-volt
minimum
con-
tinuous
operating
voltage
of
th
e SOAC,
th
e
motor
alternator
set
provides
approximately
82
percent
of
its
rated
output,
which
is
sufficient
to
power
the
normal
running
load
of
the
SOAC
(35
to
40
kw).
This
derated
condition
is
due
to
the
fact
that
the
125-kw
motor
alternator
set
was
designed
to
provide
power
for
two
cars,
but
was
installed
on
each
SOAC
to
allow
for
single-car
operations.
The
auxiliary
power
system
is
pro-
vided
with
a
priority
load-shedding
capability:
the
air
con-
ditioners
are
shed
first
with
brak
e
air
compressor,
motor
blowers,
and
traction
motor
field
supplies
last.
Restart
is
in
reverse
priority.
The
motor
alt
ernat
or
set
was
designed
for
shutdown
at
400
to
425
volts
and
normal
restart
at
line
voltages
above
550
volts.
A
separate
starting
sys
tem
using
600-volt
line
power
instead
of
32-volt
battery
power
is
pro-
vided
for
dead-battery
starting.
The
DC
motor
receives
conditioned
power
from
the
P
CU
and
has
both
a
series
field
and
a
separate
shunt
·
field
powered
by
th
e
output
of
th
e
alternator.
A
solid-state
thyristor
control
on
the
shunt
fi
e
ld
regulates
t he
DC
motor
speed
to
1800
rpm
±9
0.
The
o
utput
voltage
is
r
egulated
to
±0 . 5
percent
from
no
load
t o
full
load
within
th
e
above
speed
range
(60
Hz
±
3).
The
AC
alternator
is
a
thr
ee
-wir
e
wy
e -
connec
t
ed
system
with
un
grou
nded
neutral.
Rotating
rectifiers
(di
odes)
are
used
in
place
of
sli
pri
ngs
and
brushes
for
rotor
excitat
ion.
Solid-state
vo
lt
age
regulation
is
use
d
along
with
load
c u
rrent
sensing
for
load
shedding
and
overc
urr
ent
protection
.
The
motor
alternator
set
is
self-ventilated
by
an
int
egr
al
fan
through
an
inlet
filt
e
r,
as
shown
in
Figure
4-10
.
43

Figure
4-
10.
Motor Alternator
44

Auxiliary
Power
Control
Unit
-
Th
e
Auxiliary
Powe
r
Control
Unit
(APCU)
is
an
81
by
25
by
19-inch
box
having
two
access
panels.
Figure
4-11
is
a
block
diagram
of
the
auxil-
iary
power
subsystem.
The
right-hand
section
contains
the
following
functi
on
s :
•
Motor
alternator
set
starting
and
control
logic
• T
ransformer
rectifier
• L
oad-shed
contactor
(s)
•
EMBC
164
battery
charger
•
Dead
-
batte
ry
start
regulator
The
l
eft-ha
nd
section
contai
ns
th
e
following
functions:
•
Motor
alternator
set
field
po
wer
sup
p
ly
•
I-1o
tor
alt
er
nator
set
voltage
regulator
and
speed
cont
rol
•
Traction
motor
f
ield
power
sup
p
li
es
(2)
•
Motor
alternator
set
swi
tch
gea
r
and
ti
me
-d
e
la
y
relays
Each
of
the
two
t
racti
on
motor
fi
e l d
power
supp
li
es
provides
fiel
d
current
to
one
series
pair
(truck
set)
of
sep
-
arately
exc
it
ed
motors.
The
power
supplies
provide
DC
current
up
to
43
amps
at
approximately
155
v
olts
DC
usin
g 3-
phase
AC
-
DC
conversion
by
solid-state
phase-delay
r
eci
t
ifiers
.
Re
act
o r s
Two
larg
e
reactors
ar
e
us
e d
to
prot
e
ct
th
e
chopper
and
to
smooth
its
o
ut
put
current.
Th
e
undercar
and
c
ircuit
lo
cations
of
these
reactors
are
sh
own
in
Figures
4-2
and
4-5,
respec
-
tively.
Bot
h
reactors
are
ai
r-core
,
self-coo
l e d d
ev
i
ces
of
primarily
aluminum
construction.
The
inp
ut r e
actor,
of
a
pprox
ima
tely
0.3
-
millihenry
ind
uc
tance,
operates
in
conjunction
wit
h
th
e
input
filte
r
capacitors
to
li
mi
t
vo
l
tage
and
current
transients
into
the
chopper
and
auxiliary
power
su
pply
and
from
t
he
chopper
back
to
the
lin
e .
This
reactor
is
r
ated
at
1230
amps
RM
S w
ith
rip-
ple
cu
rr
ent
of
10
0
amps
RMS
at
th
e
400-Hz
chopper
frequency
.
The
motor
smoot
hin
g
reactor
limits
the
magnitud
e
of
the
traction
motor
ripple
current
due
to
opera
tio
n
of
the
chopper
45

--PROTECTION
-LOGIC
--START
UP
-
-LOGIC
S
PEE
D
CONTROL -
!
-
600V
FROM CAP
BANK
( -
-
t
.....
Kl
CONT ACTOR
K2
:~
MA
STA
RT
CONT ACTOR
►
RESISTOR
t
BATTERY
C
HA
RGER
:~
--
---
BATT
l
-
50VAC
115V
.,.__
{TO M
UFFIN
FAN
S)
220V
MOTOR
----
AL
TERNA
TOR -
3~
•
LV
LV
DC DC
F
IEL
D VO
LTA
GE
SUPPLY REGULATOR
!
--
200A
--A
LL
37
voe
OAD
S -
3 PHA
SE
R
ECTIFI
ER
TRANSFORMER
LOAD
SHED
i •
T
RACTION
MOTOR
FIELD
SUPP
LIE
S
-L
...
-
1 -
-
2 -
-
TRACK
_...
TRAC
K
_..
EXTERNAL
220
V. 3 PHA
SE
AC LOADS
F
IEL
D t FROM
COMM f
PP
CU
2 } MOTOR
FLDS
Figure
4-11
.
Auxiliary
Power Subsystem
Block
Diagram
during
powe
r
and
brake
mo
des.
The
reactor
has
an
in
d
uctance
of
approximately
1
mill
ih
enry
and
i s r at
ed
at
1360
amps
RMS
with
a
400
-
Hz
ripple
current
of
190
amps
RMS
.
Br
ake
Resistor
Grids
Two
brake
resist
or
grids
in
para
l
lel
and
one
motor
a
lter-
nator
set
starting
r
esistor
grid
ar
e
mo
u
nted
on
the
SOAC
. E
ach
b
rake
resistor
grid
provides
an
electrical
load
of
1.5
ohms
for
the
tr
a
ction
generators
dur
i
ng
dynamic
b
ra
king
.
The
arma-
ture
circuit
chopper
is
reconnected
in
parallel
with
the
brake
resistors
and
in
te
r
mittently
shorts
the
tra
ction
mo
tors
through
th
e
smoothing
re
act
or,
which
bypasse
s
th
e
brake
r e -
sistors
and
provides
the
commanded
deceleration
ra
t e
(brakin
g
effo
rt
) .
The
brake
circuit
is
s
ho
wn
in
Figure
4-5.
The
brake
resistors,
manufactur
ed
(for
AiResearch)
by
the
Guyan
Ma
ch
ine
r y
Company,
are
a
coil
configura
tion
with
each
grid
rated
for
an
average
power
dissipation
of
110
kw .
Each
grid
contains
10
coils
approximately
58
inc
hes
l o
ng
wi
th
84
turns
ea
ch .
The
wir
e
size
is
approximately
0.36
inch,
co
il
diameter
is
1.6
inches,
an
d
the
resistor
mate
rial
is
nichrom
e.
46

During
tests
of
a
repetitive
0-to-60-to-0
mph
duty
cycle,
the
peak
coil
temperature
determined
from
measured
theromcouple
data
was
1250°F,
which
is
well
within
the
1830°F
allowable
temperature.
Use
of
these
high
temperature
resistor
coils
on
the
SOAC
allows
a
weight
saving
of
more
than
1400
pounds
over
the
more
conventional
edge-wound
dynamic
rake
resistors.
The
four
traction
motors
and
the
DC
chopper
are
forced-
air
cooled
by
two
motor-driven
two-stage
vane
axial
fans
with
inertial
filters
and
dirt
separators.
Figure
4-2
shows
the
location
of
each
fan
unit;
the
cab-end
unit
cools
both
chopper
and
front
truck
traction
motors,
while
the
non-cab-end
unit
cools
the
rear
truck
motors
only.
The
ducting
from
both
fan
units
contains
differential
pressure
airflow
sensors
which
assure
normal
cooling
flow
(6 P = 6
inches
of
water
above
ambient)
prior
to
allowing
op-
eration
of
the
traction
system.
Loss
of
airflow
during
car
operation
results
in
a
shutdown
of
th
e
traction
system
until
flow
is
restored.
The
airflow
sensor
switch
was
used
as
the
means
of
failing
the
traction
system
during
dynamic/friction
braking
tests;
an
open
switch
inhibits
propulsion
operation.
The
fan
motors
are
3-phase
230-volt
60-Hz
AC
units
with
input
power
requirements
of
6.3
kw
each.
The
vane
axial
fan
supplies
a
total
pressure
rise
of
14
inches
of
wat
e r
at
2140
scfm.
Fan
inlet
air
contamination
particles
are
filtered
to
5-micron
nominal
through
inertial
air
cleaners
mounted
on
the
side
of
the
cars
just
below
the
floor
line
(see
Figure
4-12).
Figure
4-12
. Cooling System -Fan
Inlet
47

These
air
cleaners
are
active-nature
fi
l
ters
ra
t
her
th
an
barrier
type.
Heavier-than-air
particles
are
concen
tr
ated
in
the
outer
layer
of
air
through
centrifugal
energy
caused
by
spinning
the
air
as
it
passes
through
static
vanes
.
The
oute
r
layer
of
contaminated
air
is
removed
through
an
annul
us
by
the
pumping
action
of
a
jet
pump.
The
us
e
of
thes
e
dynamic
filters
is
required
by
the
loca-
tion
of
the
cooling
air
source
underneath
the
car.
These
filters
are
a
si
gnificant
improvement
over
previous
traction
systems
which
have
experienced
severe
problems
in
powder
-
snow
conditions.
The
SOAC
cars
have
been
operated
i n
Pueb
l o
throughout
the
winter
and
in
all
types
of
snow
conditions
without
malfunction
.
Cab
Master
Controll
er
The
master
controller
pa
n
el
(shown
in
Figure
4-13),
located
on
the
right
half
of
the
lower
control
console
panel
,
contains
three
controls
:
the
mas
ter
con
troller
(tract
i
ve
effort)
handle,
the
direction
control
switch,
and
t he
emer
-
gency
brake
pushbutton.
The
direction
control
switch
is
key
-
operated
and
turns
its
master
controller
on.
The
tu
r
n-on
operation
is
interlock
ed
with
the
master
controller
handle
position
and,
via
the
trainlines,
with
the
master
contro
l
le
r
in
the
other
SOAC
car.
The
int
e
rlocks
prevent
more
than
one
controller
from
being
turned
on
at
one
time
and
req
u
ire
tha
t
the
controller
handl
e
be
in
the
emergency
brake
de
t
ent
in
order
to
be
turn
ed
on
.
Th
e
dir
e
ction
con
trol
switch
se
l
ects
the
direction
of
ope
ration
and,
in
the
OFF
position,
allows
the
brake
pipe
to
be
charged.
The
master
controller
handle
is
the
primary
control
for
operation
of
the
car.
Its
function
is
analogous
to
the
throttle
and
brake
pedal
s
on
an
automobil
e .
In
the
full
for-
ward
position,
maximum
acceleration
is
commanded
and
the
car
wi
ll
accelerate
at
maximum
rate
to
the
maximum
speed
allowed
by
the
speed
li
miting
control.
In
the
mi
ddle
position,
the
car
is
in
the
coast
mode
with
the
propulsion
system
configured
for
braking
but
without
any
braking
effort
applied.
In
the
full
aft
position
(without
passing
through
the
emergency
brake
detent),
maximum
service
braking
effort
is
commanded.
Moving
the
handle
throu
gh
the
emergency
brake
de t e
nt
applies
the
emergency
brakes
and
results
in
an
irretrievable
stop.
The
handle
of
the
master
control
l e r
also
has
a
deadman
control
featur
e .
This
hand
l e
must
be
held
against
a
light
spring,
in
a
horizontal
position,
or
the
full-service
brakes
wil
l
be
commanded.
Once
the
handle
is
r
eturne
d
to th
e
hori-
zontal
posit
ion,
the
deadman
f
ea
tur
e
is
turned
off,
and
the
master
controller
command
once
again
correspon
ds
to
the
fore
and
aft
position
of
the
handle.
On
the
right
side
of
the
48

Figure
4-13.
Master
Controller
Panel
49

master
control
panel
is
a
red
mushroom-shaped
emergency-stop
button.
Depressing
this
pushbutton
a
pp
lies
the
emergency
brakes
and
resu
lts
in
an
irretrievabl
e
stop.
In
addition
to
the
emergency-stop
pushbutton
and
the
emergency
-s
top
detent
on
the
controller,
a
pull
cord
is
lo-
cated
along
the
forward
corner
post
of
the
cab
directly
above
the
emergency-stop
pushbutton.
This
pull
cord
directly
oper-
ates
an
air
valve
that
vents
the
brake
pipe.
Speed
Maintaining
The
speed-maintaining
pushbuttons
(
Fi
gure
4-14)
located
immediately
below
the
speedometer
readout
allow
th
e
motorman
to
select
a maximum
car
speed
to
which
he
can
accelerate,
and
wh
ich,
when
reached,
may
not
be
exceeded
unless
the
system
is
turned
off
or
a
higher
speed
is
selected.
As
lon
g
as
the
con-
troller
handle
is
far
enough
forward
for
the
car
to
reach
the
maximum
speed,
that
speed
will
be
maintained.
Speed
maintain-
ing
buttons
ar
e
provided
for
the
following
speeds:
3,
15,
25,
35,
50,
70,
80
mph,
and
OFF.
These
li
g
hted
buttons
stay
de-
pressed
until
another
button
is
depressed.
The
speed
associ-
ated
with
each
button
may
be
changed
by
changing
the
value
of
a
resistor
on
the
controlling
circuit
card.
Additionally,
there
is
an
overspeed
correction
mechanism
which
is
independent
of
the
speed
maintaining
system.
\vheneve
r
the
car
reaches
83
mph,
three
events
o
ccur:
1.
A
warning
buzzer
sounds,
2.
The
spee
d
fau
lt
indicator
lights,
and
3.
Full-service
brakes
are
applied.
The
brake
rate
is
jerk-limited
during
application.
The
brakes
remain
on
and
cannot
be
overriden.
When
the
car
reaches
77
mph,
control
is
returned
to
the
motorman.
4.4
PROPULSION
SYSTEM
OPERATION
The
operation
of
the
DC
chopper,
its
control
subsystems,
and
the
resulting
SOAC
propulsion
and
se
rvice
braking
charac-
teristics
are
as
follows:
Basic
Control
The
cont
rol
of
tractive
and
braking
effort
w
it
h
the
master
controller
is
achieved
us
ing
a
tra
ctiv
e
effort
program
which
accepts
input
commands,
car
weight,
etc
.,
and
controls
the
motor
tor
q ue
developed
to
the
desired
values
.
Closed-loop
50
Figure 4- 14. Speed Maintaining Buttons
51

control
of
motor
armature
current
is
the
primary
method
uti-
liz
ed.
Figure
4-15
illustrates
the
control
system.
Perform-
ance
testing
(described
in
Section
6)
was
designed
to
fully
test
the
characteristics
of
this
control
system
throughout
the
allowable
range
of
inpu
t
paramete
r
values.
Input
Commands
As
noted
in
Figu
re
4-15,
the
P-
gene
rator
receives
input
commands
from
three
sources:
master
cont
r
oller
,
speedometer
(speed
limiter
syste
m
),
or
car
hostler.
When
activated,
the
speed
limit
subsyste
m
and
master
controller
are
used
together
as
control
inputs,
that
is,
the
P
-si
gnal
ge
nerated
corresponds
to
the
less
e r
command
of
the
maste
r
controller
or
speed
li
mit
-
ing
system.
The
P-generator
produces
an
analog
signal
from
0
to
1.0
amps
which
is
trainlin
e
d.
Each
car
of
the
train
will
interpret
the
P-signal
and
convert
it
to
a
voltage
level;
the
sense
of
the
P-signal
is
interpreted
for
e
ither
propulsion
or
brake
modes.
The
pro-
pulsion
and
·
brake
systems
operate
usin
g
independent
circuits
for
corrauanding
tractiv
e/b
raking
effort.
The
command
to th
e
control
system
is
in
t
erms
of
tractiv
e
effo
rt
per
ton
of
car
we
ight
(TET) .
Load
Weigh
Compensati
on
The
above
propulsion
command
is
modified
by
actual
car
weight
as
sensed
by
a
ir
suspension
pressure.
The
TET
command
is
modified
by
car
weight
so
that
acceleration
or
braking
rates
are
essentially
constant
at
varying
car
weight.
The
design
logic
of
the
load-weighing
system
is
such
th
at
failure
of
load-weigh
signal
will
result
in
a
tractiv
e/b
raking
effort
command
for
an
empty
car
weight.
T
he
emergency
brake
system
contains
a
separate
pneumatic
load-weigh
capability.
Once
the
weight
factor
is
factored
into
the
TET
input,
th
e
tracti
ve
effor
t
inpu
t
enters
the
tractive
effort
program.
Tractive
Effort
Pr
ogram
This
analog
program
uses
a
variety
of
inputs
from
con
-
tro
ll
e
r,
car
parameters,
and
c
alculat
ed
operational
limits.
The
program
equates
100
percent
tractive
effort
(d
ri
ve)
to
full-forward
position
of
the
master
controlle
r
independent
of
actual
car
sp
eed
.
Tracti
ve
effor
t
is
reduced
above
mot
or
base
speed
along
a
constan
t
horsepower
characteristic;
100-percent
tractive
effort
corresponds
to
maximum powe
r.
The
input
com-
mand
is
modified
f or
lin
e
voltage
,
current
limits,
car
speed,
etc.
,
by
th
e
tractive
effort
program
and
the
result
in
g
trac-
tive
effort
command
(TEC)
is
sent
to
a
limiting
subsystem.
52

u,
w
SPEED SENSORS
AXLE
AXLE
2 4
0 )
~~;~~LLER1-
~
1
CAR
WEI
GHT
SENSOR
)
~
WT
ARMATURE
CURRENT
LIMIT
)
SPIN-
SLIDE
JERK
) )
'
DYNA
MIC
BRAK
IN
G
FEEDBAC
K
TO
AIRBRAKE
CONTROL
COMPUTED
1
E9
I
TRACTIVE
ETE
EFFORT
p
SPEED- .
GEN-
I
OMETER
1.
:1
ERATOR
WEIGHT
FACTOR
TRACTIVE
I I I
TEC
EFFORT
~
LIMITING
'
~
~
HOSTLER
TOAIR
BRAKE
CONTROL
I-
P-SENSE
PROPULSION
P-SENSE
BRAKE
l
~
TET
IF
FIELD
COMMAND
PROGRAM
..
J
INPUT
1
VOLTAGE
)
VELOCITY
6
DRIVE
6
BRAKE
TRUCK
1
~
ARMATURE
I
◄
I
TRUCK
2
~
BALANCE
TRAINLINE
P-SIGNAL
TO
OTHER
CARS
ARMATURES
:
KEY
TET
WT
TEC
TRACTIVE
EFFORT
Pf
A
TQ
-..,
Of
C
AR
W
EIG
HT
CA R
..,_
"(IG
1-
-q
!
LOAD
W
EIGH
SYSTEM \
TR
A
CI
IVE
EHQR
T
C0
M\4
ANO
EYE
ELECTRICAL 1CA
LC
ULATE01 TRACT1VE EF"FO~T
FROM
fEEOBACI(
V A
LUES
TH TRACT1
ve
EFFORT ERROR !
CO
MMA
ND
TO
AA
M
ATUAE
AJ'J
O F
IHO
C0
"1
TROLS1
0
C0
\4MA
NQ
CHOP
PE
R
FIR
l
"-'
G AI\IGLE CO
MM
AND
la T
RUC
K AAM
Al
UHE CURRE"-T , 1 &
21
I F
FIELDCU
RR
E
'i
TSil
& 2'
@ I
..__
la1
O.
-
la2
0-------
-
~
ARMATURE
la
CURRENT
-+--
CHOPPER 0
COMMAND
Figure 4-
15.
Tractive
Effort
Control
Bloc
k Diagram
IF
FEEDBACK
......------1-
•
FIELD
CONTROL+.
la
1 + la2
FEEDBACK
~
CHOPPER
CONTROL
i..-

Jerk
Rate
Li
m
iting
and
Spin
- S
li
de
Protection
The
time
r at e
of
chang
e
of
tractive
effort
command
is
controlled
to
a
maximum
value
to
l
imit
th
e
rat
e
of
change
of
car
acceleration
to
±
2.5
mph/
sec2.
Th
us
a s t
ep
in
put
at
the
master
controller
results
in
a
ramp
o
ut
p
ut
of
the
limitin
g
system
(TEC).
This
subsyst
em
also
controls
r e
lea
se
and
re-
application
of
tractive/dynamic
br
aking
effort
in
response
to
wheel
spins
and
slides
detected
by
the
four
axle
speedometer
systems.
The
TEC
output
of
the
jerk
limiter
forms
th
e pr
o-
pulsion
command
sent
to
the
chopper
an
d
field
current
control
systems
(Figure
4-15).
This
command
i s
passed
through
a
sum-
ming
point
where
"
command"
and
"computed"
tractive
effort
are
compared.
Computed
tractive
effor
t i s a
result
of
armature
and
field
current
feedback
discussed
in
l at e r
paragraphs.
Chopper
a
nd
Fi
eld
Control
The
chopper
control
determine
s
the
thyristor
gate
firing
commands
sent
to
the
chopper
semiconductors.
This
firing
angle
(0)
determines
the
average
voltage
o
ut
of
the
chopper
and
the
load
(or
motor
armature)
current
. Du
rin
g
acceleration
or
dynamic
braking
below
th
e
motor
base
or
ful
l-
field
speed,
th
e ch
opper
is
the
controlling
device.
Above
base
speed
the
chopper
is
gated
full
on,
and
trac-
t
ive
effort
co
ntr
ol
is
passed
to
the
motor
fie
ld
control.
Based
on
speed
and
tractive
effort
command,
the
fie
lds
are
varied
such
that
constan
t
armature
curre
nt i s
mainta
in
ed.
The
current
feedback
values
provi
de a
closed
-lo
op
contro
l.
The
seque
n
ce
of
control
operations
is
outlined
in
the
following
paragraphs.
Opera
ti
on
in
Drive
Mode
Figure
4
-1
6
illustrates
a
ty
p
ical
initial
acceleration
from
a
stop.
The
data
is
a
time
history
of
data
t
aken
during
t
he
SOAC
test
program.
The
following
sequence
of
eve
nts
t ak
es
place
during
the
acceleration
(as
mark
ed
by
locations
on
the
figure)
:
Eve
nt
1.
Vehicle
stopped,
tract
i
on
system
ready,
line
breaker
closed,
chopper
and
field
power
supplies
off.
Event
2.
Step
in
p
ut
from
master
cont
roll
e r ; f
ull
acceleration
command,
P = 1
.0
amp .
Event
3 .
Chopp
e r
turned
on
to
its
minimum
valu
e
at
40-Hz
frequency
.
54

Vl
Vl
EVENT
er
ST
EP
INPUT
EVEN
T
MASTER CONTROLL
ER
P -1
.0
AMP ( 100% T. E. COMMANO)
CHO
PP
ER
I FULL "ON~
5
)...____
_ 400 Hz
1 ~
111111
11111
11
1111111111111111111
111
11111
1
111
11111111111
11111111111111111111111
1111111111111
1111
1
11111
11
1111
11111111
11111111111111
11
1111
111
1
111
11
111
11111
1
11
11
1
11
1111111
1
111111
1
111
11
1111111111111
1111
1111111111111
1111
1111
1
11111111111111
111
1111111111111
1111
11
1111
111111111
1
1111111
1
1111111111111111111
11
111
... /
l
illlll
11
11
111111111111111111111111111
111
11111
1
11111111111
1111
e,i
11
11
111111111111111
11
1111
111111
11111111111111111
111
111111111111
11111111111
11
111
111111111111
11111
1
11111
1111111
1111111111
1
11111
111111
11111111
11
111111111
11
11111
1
111
11
11
111
11
11111
111
1111111111111
11
111111
11
1
11111111
11111
1
1111
111
111
111
1
1111
1
111
11111
11
4
00
Hz
AFT
TRUCK
i
ll
111111
SIGN
AL
CONTINUES AT
w
11
TH
ESE
UPPER
AND
L
OW
ER LIMITS
LINE
cuRREN1
-
ARMATURE CURRENTS: FORWARD TRUCK
---
-
--
-Mo
rn
, mco
'"""
"
"o
'" mum ,
~
CAR ACCELERA
TI
ON RATE
EVENT
FORWARD
1R
UCK
AR
MA1
URE
VO
L1AGE
~
111111
11111'
1111
11
11
111111111111111
11
111
1
1111111111
11111111111
111111111111
1
1111
1111111111
1111111111111111
1m1111
1
11
11111111111
111
111111
'@~
11
111111
1111
1
111111111111111111111
1111
11111111
11
11111111
11
11
111
111111111
1
11111
111111
11111
1
11
11111111
11
1111
11111111111
111
11111111
1
11
111
1
ll
llllll
lllll
l
lllll
ll
llll
ll
lll
lllllll
lllll
l
llll
lll
l
lllll
ll
ll
llll
lll
ll
lllllllllll
llll
lll
ll
lll
llll
ll
llll
lll\\\
\\\
l\\l
llll
l
llll
ll
llllll
ll
llilll"".
lllllllll
ll
ll
llll
ll
llll
lll
ll
llll
ll
lll
llll
l
ll
ll
llll
llll
l
llli
llll
llll
ll
llllillll"'
;--
- - -
___.J
I
1111111111111
1
AFT TRUCK CAR SPEED
0 2 4 6 8
T IME (SECONDS)
10
12
14
Fi
gure
4-16.
Time History
of
Typical Initial Acceleration

Event
4.
Tracti
on
motor
fields
are
ramped
from
Oto
full
field
(approximately
38
amps)
in
response
to
the
jerk
-li
mited
tractive
effort
command.
Event
5.
Traction
motor
fields
increasing
to
ful
l
field
current;
control
passes
to
the
chopper
which
feeds
controlled
current
to
the
moto
r
arma-
tures.
This
rise
in
armature
current
is
jerk
limited
.
Chopper
frequency
is
qu
ic
k
ly
in-
creased
from
40
Hz
to
400
Hz
dur
i
ng
this
time.
A
rm
ature
current
is
then
controlled
at
the
value
which
corresponds
to
tractive
effort
com-
mand.
Motor
torque
is
the
product
of
armature
current
and
field
flux.
The
low
initial
chopper
frequency
(40
Hz)
is
dictated
by
th
e
low
power
required
when
ramping
the
fields
on
smoothly.
Since
the
chopper
has
a
finite
minimum
output
cur
r
ent
characteristic
at
its
400-Hz
normal
frequency,
the
current
to
the
motors
du
ring
initial
startup
would
not
be
of
low
eno
ugh
magnitude
to
prevent
an
initial
jerking
start
when
the
motor
fields
ar
e br
ought
up
to
full.
To
alleviate
this
problem
the
chopper
fr
eq
u
ency
is
lowered
to
40
Hz
initia
ll
y
on
a
transient
basis,
and
qu
ickl
y
phases
up
to
400
Hz
as
th
e
car
accele
rat
es.
Ev
ent
6 .
Motoring
base
speed:
With
traction
motor
fields
at
maximum
va
lu
e,
motoring
base
speed
corresponds
to
the
vehicle
speed
at
which
the
terminal
voltage
of
the
parallel
motor
branches
and
the
smoothing
reactor
is
equa
l
to
the
vo
lt-
age
measured
across
the
line
filter.
This
speed
is
28
or
30
mph ,
depending
on
line
volt-
age
and
tractive
effort
command.
When
motoring
base
speed
is
reached,
the
chopper
i s
fu
ll
on
and
can
no
longer
serve
as
a
control
on
arma
-
ture
current.
Event
7.
Motoring
above
base
speed:
Chopp
e r
ful
l
on
,
armature
current
controlled
by
field
current
as
supplied
by
variable
field
power
supp
li
es.
Field
power
is
much
l
ess
than
armature
power
at
this
point
,
and
infinite
low-power
control
of
a r
mature
current
is
available
up
to
the
maximum
speed
of
th
e
car.
To
maintain
constant
arma-
t
ur
e
current
above
base
speed,
the
field
current
must
be
reduced
(field
weakening)
due
to
the
increasing
back
emf
generated
by
the
motor
as
speed
inc
reases.
Motor
torque
is
reduced
in
in
ve
rs
e
proportion
to
increasing
speed.
56

Operation
in
Dynamic
Brake
Mode
Figure
4-17
illustrates
a
typical
transition
from
drive
to
full-service
braking.
This
time
history
is
from
SOAC
test
data.
The
following
sequence
of
events
takes
place:
Event
1.
Car
is
in
drive
mode
at
80-mph
constant
speed.
Event
2.
Master
controller
deadman
is
released
callin
g
for
full-service
blended
braking
in
a
ste
p
input.
Event
3.
Traction
motor
current
is
reduced
to
zero
at
jerk
limited
rate.
Event
4.
The
armature
current
is
zero;
drive
contactor
is
opened
and
brake
contactors
are
closed/
opened
opposite
to
drive
positions
(see
Figure
4-5,
locations
11,
23,
24,
and
25).
Motor
fields
are
reversed
(in
current
sense)
by
the
field
power
regulators.
Event
5.
Motor
fields
are
increas
ed
up
to
the
value
requir
ed
to
control
the
armature
current
at
the
command
level.
The
chopper
is
full
on.
Braking
effort
is
increased
at
a
jerk
li
mited
rate.
Event
6.
As
speed
is
reduced,
motor
field
current
is
increased
to
maintain
th
e
braking
command.
Event
7.
Base
speed
i n
brake
is
reached
when
full
motor
field
current
(approximatley
40
amps)
is
being
supplied
to
the
motors.
The
chopper
turns
on
and
varies
the
effective
value
of
the
brake
resistors
while
maintaining
constant
armature
current.
I2R
decreases
lin
ea
rly
with
speed
for
constant
braking
effort.
Event
8.
Chopp
er
maintains
constant
armature
current
down
to
dynamic
brake
fadeo
ut
speed
of
approximately
3
mph.
4.5
TRACTION
AND
BRAKING
CHARACTERISTICS
Figure
4-18
shows
th
e
car
tractive
and
braking
effort
characteristics
associated
with
the
SOAC
control
system
over
the
complet
e
operating
rang
e .
This
figure
is
based
on
data
recorded
during
the
SOAC
E
ngineering
Test
Program
at
Pu
e
blo,
Colorado.
As
noted,
the
figure
illustrates
the
various
combi-
nations
of
controller
input,
armatur
e
and
fie
ld
currents,
an d
resulting
tractive
or
braking
effort.
57

U1
00
STEP
INPUT
EVENT
r MASTER CONTROLLER P = 0 AMP (
NOTE: I
NITIA
L SPEED
APPROXI
MATELY
CAR
CAR DECELERATION
RATE
()
I
~I
)
-
---
-
--
0 1.
FWD
TRUCK
l1
11
111111
111
1
1111
111
1
111
111111111
1
111111111111
111
ef
I
)
/11
1/ll/llllll
llll
lll
llll
l
ltltll
ll
lU
IIII
II
IIIIIIIIIIU
ll
"
'"
"'"
""
"I
---
0 AMPS
EVENT
0 2
ARMATURE
CURRENTS:
__J
AFT
TRUCK
11
111
11111
1
11
1
111
11
1
11
1
11
1
1111
11111
1111
111
1
11
11
ef
CAR SPEED
CHOPPER
FUL
L
"ON"
EVENT
)1
11
1
1/
I
IIIIII
III
IIII
II
IIIIIIIII
I
IIIIII
II
IIIIIIIII
II
III
II
II
I
II
IIIU
"""
'
~
OAM~
I
-------
0 AMPS
Jr;c~v~
C
~NrfT
-------
---
----
~
-----
-0 SPEED
( I
) J J
111111
1111111111
111
1111
1
11111111111
111
1
11
1
111111
11
1111
1111
~ I
FULL
OVOLTS
1 / FI
ELD
-+-
FWD
TRUCK
VOLTAGE 1
1111
111
1111111
111
111111
11
1111
11
111
1111
1
1111
1
11111
11
~
I_
AFT
TRUCK
FIELD
CURREN
~ I f
-7
1
111JII
IIJ
ll
llll
l
llllllll
/ll
l
lll
ll
llll
l
lll
ll
\l
l
llllllll
H
IIII
II
U
l1illil
ll
lll"
"""
t--
AFT
TR
U
CK
VOLTAGE
111
1111
11\\llll
lll
\ll
\l\ll
\l
llll
lllll\l
lll
l
lll
\l\~
4 6 8 - 4 - 2
TIME (
SECO
NDS)
Figure 4- 17. Time History
of
Typical Blended Braking
0
FULL
FIELD
OVO
LTS

FIELD
CURRENT
(AMPS)
16
36-38 (FU
LL)
30
NOTE
25
12 P = P-
WIRE
en
.....I
(CON
TROL
0
0
SIGNAL)
0
...-
I-
a::
0 8
LL
LL
UJ
ARMATURE
UJ
>
CURRENT
I-
u
690
<(
a::
4
620
I-
330
110
TRACTION
0 -RESISTANCE
0
20
40
60
80
I I
ARMATURE
CAR SPEED (MPH)
P = 0.375 AMP
CURRENT
320
en
4
.....I
0
0
0
I-
0.25 AMP
a::
500
0 8
LL
LL
UJ
c.::i
z
~
<(
0.125AMP
a::
630
en
12
0.0
AMP 750
16
._
___
__
...___
____
_._ _
___
_,_
__
__
__,
Figure 4- 1
8.
Traction
and
Braking Characteristics (Single
-Car
,
600
Volts)
59

4.6
DETAILED CHOPPER OPERATION
In
t
he
motoring
mode,
the
chopper
provides
an
efficient
switching
capability
for
control
of
the
current
in
the
mo
tor
armature
circuits
below
motoring
base
speed.
In
the
braking
mode,
the
chopper
provides
an
e
ffective
variable
resistanc
e
as
a
load
on
the
tracti
on
generators.
The
basic
chopper
sch
ema
tic
and
the
associated
voltage
and
current
sharing
networks
are
shown
in
Figure
4-7.
The
following
paragraphs
and
figures
illustrate
the
step-by-step
operating
conditions.
Interval
1.
(Figure
4-19)
Prior
to
initiation
of
any
switching
sequence
;
main
thyr
istors
(Ql)
are
off,
commutator
capacitors
(Cl)
are
charged
to
input
voltage
through
resistor
to
ground,
no
lo
ad
current
in
free
-wh
eel
in
g
path
(D2).
Interval
2.
(Figure
4
-20
)
Main
thyristors
(Ql)
gated
on
by
chopper
cont
rol
system
;
load
current
flows
through
the
smoothing
reactor
and
armature
circuits
to
g
round.
Interval
3.
(Figure
4-21)
Comm
u
tator
thyristors
(Q2)
are
gated
on
creating
a
resonant
LC
cir
cuit
(Ll-Cl)
which
discharges
through
th
e
main
thyri
sto
rs
(Ql),
the
commuta
t
or
reactor
(Ll)
an
d t
he
commutator
thyristors
(Q2)
to
the
other
side
of
the
commutator
capacitors
(Cl).
The
polarity
on
Cl
has
been
reversed,
an
d
it
is
charged
in
the
oppos
ite
potential.
Inter
va
l
4.
(Figur
e
4-22)
The
commutator
capacitors
(Cl)
now
dischar
ge
i n
the
opposite
direction
through
the
commutator
diodes
(Dl)
and
re-
actor
(Ll)
to
the
load
(motors).
The
com
-
mutator
thyristors
(Q2)
are
back
biased
by
the
voltage
reversal
and
turn
off
.
Interval
5.
(Figure
4-23)
The
main
thyristors
(Ql)
are
also
back
biased
by
the
voltage
reve
r
sa
l
and
turn
off.
The
commutator
capac
it
o
rs
(Cl)
continue
to
discharge
through
the
commutator
diode
(Dl)
to
the
loa
d
un
ti
l
it
is
recharg
e d
up
to
its
original
value
and
polari
t y
by
the
in
p
ut
vo
lt
age.
Interval
6.
(Figur
e
4-24)
Wh
en
the
commutator
capacitors
(Cl)
hav
e
fully
recharged,
the
current
flow
will
be
back
t
hr
ough
the
free
-wheeling
diode
(D2)
and
recirc
ulat
ed
thro
ugh
the
load
.
The
60

+
C1
INPUT l
VOLTAGE
Q1
-
MAIN
TH
YR
ISTOR
01
VOLTAGE
&
CURRENT
L 1 -
COMMUTATION
REACTOR
C1
-
COMMUTATION
CAPACITOR
C1
VOLTAGE
&
CURRENT
Q2 -
COMMUTATION
THYRISTOR
D1
-
COMMUTATION
DIODE
D1
&
02
VOLTAGE
&
CURRENT
D2
-
FREE-WHEELING
D
IOD
E
D2
VOLTAGE
&
CURRENT
SMOOTHING
IN
DUCTOR
Q1
L1
NO.
2 NO. 1
D2
TRUCK TRUCK
FIELD
PO
WER SUPPLI
ES
(APCU)
LO
AD
CURRENT
MAIN
FIRED
IN
PUT I
VOLTAGE
,----
--~...--
MA
IN
OFF
MAIN
ON
RESONANT
VOLTAGE
REVERSAL
LOAD
CURRENT
LOAD
FREE
-
WHEEL
Cl
CURRENT
DISCHARGE
COMMUTATOR
FIRED
MAIN
OFF
D1CURRENT
LOAD
CURR
ENT
LOAD
FREE-WHEE
L
Figur
e 4-
19.
Chopper Operation: Main-Of
"Off"
61

+
C1
INPUT
l
VO
L
TAG
E
01
-
MA
IN TH
YR
IST
OR
0 1
VO
LT
AGE
&
CURRENT
L 1 -
COMMUTAT
ION
REACTOR
Cl -
COMMUTAT
I
ON
CAPAC
IT
OR
Cl
VO
L
TAGE
&
CURRENT
02
-
COMMUTATION
THYR
I
STOR
D1 -
COMMUTAT
ION DI
ODE
Dl
&
02
VO
LT
AGE
& CU
RRENT
D2
-
FREE
-
WHEE
LI
NG DIODE
D2
VOLTAGE
&
CURRE
NT
SM
OOT
HI
NG
IN
DU
C
TO
R
0 1
L1
NO. 2 NO. 1
TRUCK
TRUCK
D2
FIE
LD
POWER SUPPLI
ES
(A
PCU)
MAIN
F
IRED
MA
IN
OFF
MAIN
ON
RESONANT
VOLTAG
E
REVERSAL
COMMU
T
ATOR
FI
RED
LOAD
CU
RRENT
LOAD
FREE-WHEEL
Cl
CUR
RENT
DI
SC
HAR
GE
MAIN
OFF
..,..----02
CURR
E
NT
I
D1 C
URRENT
LOA
D
CURRENT
I L
OAD
FREE-
WHEEL
Figure 4-
20
. Chopper Operation: Main-O1
"Fired
On"
62

+
INPUT 1
VO
LT
AGE
t
01
-
MAIN
THYRISTOR
01
VOL
T
AGE
&
CURRENT
L 1 -
COMMUTAT
ION REACTOR
C1
-
COMMUTATION
CAPACITOR
C1
VOLTAGE
&
CURRENT
02
-
COMMUTATION
THYRISTOR
01
-
COMMU
T
AT
ION
DIODE
D1
&
02
VOLTAGE
&
CURRENT
D2
-FREE-WHEELING
DIODE
D2
VOLTAGE
&
CURRENT
SMOOTHING
INDUCTOR
01
L1
.,
NO. 2 NO. 1
..
TRUCK
TRUCK
D2
Fl
ELD
POWER SUPPLIES (APCU)
MAIN
FIRED
MAIN
OFF
MA
IN ON
RESONANT
VOLTAGE
REVERSAL
COMMUTATOR
FIRED
LO
AD
CURRENT
INPUT
VOLTAG
E
LOAD
FREE-
WHEEL
Cl
CURRENT
DI
SC
HARGE
M
AI
N
OFF
_..-0
2 C
URRENT
I
D1CURRE
NT
i'.
LO
AD
CURREN
T
I
LOAD
FREE-WHE
EL
Figure
4-21.
Chopper Operation:
Main
-
O1
"On", Commutator-O2 "Fired
On"
63

MA
I
N-0
1 +
"ON"
0 1
Cl
..
SMOOTHING
INDUCTOR
l L1
INPUT T
Dl
VO
L
TAG
E ,
......
t
0 1 - MA IN T
HYR
I
STOR
01
VOL
T
AG
E &
CURRENT
L 1 -
COMMUTA
TI
ON
REAC
TOR
C1
-COM
MU
TAT
ION
CAPAC
I
TOR
C1
VOLTAGE
& CU
RRENT
02
-
COMMU
TA
TI
ON
THYR
I
STOR
D1 -
COMMUTA
T
ION
DI
ODE
D1 &
02
VO
LT
AGE
&
CURRENT
D2
-
FREE-W
H
EELING
DI
ODE
D2
VO
L
TAGE
& CU
RRENT
D2
NO. 2
TRUCK
NO.
1
TRUCK
FI
ELD
POWER SUPPLIES (APCU)
MAIN
FI
RED
INPU
T
MAIN
OFF
LOAD
MAIN
ON
RESONANT
VOLTAGE
REVERSAL
L
OAD
C
UR
REN
T
L
OAD
FREE-WHEEL
Cl
CURRENT
DISCH
ARG
E
MA
IN
OFF
__..-
02
CUR
RENT
I
D l CU
RRENT
LOAD
CURRENT
~
LOAD
FREE-WHEEL
Figure 4- 22. Chopper Oper
ation:
Main-O1
"On"
, Comm
ut
a
tor-O2
"Off"
64

SMOOTHING
INDUCTOR
01
fl/J
CB--
..
r-~
►~~~••••••••
-
..
~
INPUT 1
VOL
TAGE
01
-
MAIN
THYRI
STOR
0 1 VOLTAGE &
CURRENT
L 1 -
COMMUTATION
REACT
OR
Cl
-
COMMUTA
TION
CAPACI
TOR
C1
VOLTAGE
& CURRENT
Q2 -
COMMUTA
TI
ON
THYRI
STOR
01 -COMMUT
AT
ION
DIODE
0 1 &
02
VOLTAGE
&
CURRENT
02
-FRE
EW
HEELING DIODE
02
VOLTAGE
& CURRENT
L1
t
02
NO. 2
TRUCK
NO. 1
TRUCK
FIELD
PO
WER SUPPLI
ES
(APCU)
MAI
N FIRED
INPUT I
VO
LTAGE
MA
IN
OFF
LOAD
CURRENT
MA
IN ON
RESONANT /
VOLTAGE RE
VERSAL
COMMUTATOR
FIRED
LOAD
CURRENT
LO
AD
FREE-
WH
EEL
Cl
CURRENT
DISCHARGE
COMMUTATOR
FIRED
MAIN
OFF
-D1
CURRENT
LOAD
CU
RRENT
LOAD
FREE-WHEEL
Figure 4-
23
. Chopper Operation: Main-
O1
Commutated
"Off"
65

1
INPUT
VO
LTA
GE
0 1 - MA IN
TH
YR
IST
OR
0 1
VO
LT
AGE
&
CURR
ENT
L 1 -
COM
MUTATIO
N
REAC
TOR
Cl -
COMMU
TA
TI
ON
CAPAC
IT
OR
Cl
VOLTAGE
&
CURRENT
02
-
COMMU
TA
TI
ON
TH
Y
RI
ST
OR
D l -
COM
MU
TA
TI
ON DI
OD
E
Dl
&
02
VO
L
TAG
E &
CURRENT
02
-
FREE-W
HEE
LI
NG DI
OD
E
D2
VOL
T
AGE
&
CURREN
T
01
..
L l
...
02
..
MA
IN
FIR
ED
..
SMOO
THIN
G
IN
DU
CTOR
NO. 2
TR
UCK
..
NO. 1
TR
UCK
FIELD POWER
SUPPLIES
(A
PCU)
LOAD
CURRENT
,,__
_
__
_ _.
Cl
CURRE
NT
DI
SCHARGE
J-
COMMUTATOR FIRED
M
AIN
OFF
MAIN
ON
MA
IN
OFF
• • • • I I I
I 1!
~
l i
~
,
-----------
·"1r
a
RESO
NAN
T
VOLTAGE
RE
VER
SA
L
....----
02
CURRENT
I
D1
CURREN
T
COM
M
UTA
T
OR
FI
RED
Figure
4-24.
Chopper
Op
eration:
Main
-O1
"Off",
Load
Free
Wh
eel
66

input
side
of
the
chopper
is
now
in
a
state
similar
to
Interval
1 .
with
the
exception
of
the
load
current.
The
relationship
of
the
Ql
on
gate,
Q2
on
gate,
and
the
time
when
both
Ql
and
Q2
are
off
determine
the
chopper
on/off
ratio
and
the
average
current
delivered
to
the
load.
(Ql-on
to
Q2-on
equals
chopper
on
time.)
4.7
BRAKE
SYSTEMS
The
SOAC
vehicle
has
four
essentially
separate
braking
systems
(see
Figure
11):
• Dynam
ic
(electrical)
brake
system
•
Service
friction
air
brake
system
•
Emergency
friction
air
brake
system
•
Hydraulic
parking
brake
Dynamic
Brake
System
The
dynamic
brake
system
provides
most
of
the
braking
effort
fro
m 80 mph down
to
3
mph.
This
system
consists
of
the
traction
motors
connected
as
generators
producing
controlled
power,
which
is
absorbed
in
the
brake
resistor
grids
under
the
car.
Data
taken
during
test
programs
has
indicated
that
the
SOAC
dynamic
brake
system
alone
(without
friction
brake
blending)
is
capabl
e
of
bringing
the
car
to
a
complet
e
stop.
Incorporated
in
the
SOAC
dynamic
brake
design
is
a
slip-slide
system
with
an
ext
remely
rapid
response
that
r e
sults
in
an
efficiency
of
over
77
percent
in
achieving
availab
l e
adhesion
on
wet
rails.
This
system
also
functions
during
car
accelera-
tion
with
an
efficiency
of
over
80
percen
t . (A
discussion
of
the
sequence
of
events
during
dynamic
braking
was
previously
presented
in
"Operat
i
on
in
Dynamic
Brake
Mode"
under
PROPUL-
SION
SYSTEM
OPERATION,
Section
4.4.)
The
dynamic
brake
circuit
is
made
up
by
op
e
nin
g
th
e
drive
contactor
DK
(item
11
in
Figure
15)
and
opening
contac
tor
BK
(item
25)
while
closing
contactor
BK
(item
24).
Th
e
ch
opper
then
shunts
the
brake
resistor
grid
as
necessary
to
control
armature
current
(braking
effort).
Figure
4-
18
illustrat
es
the
braking
effor
t
characteristics
of
th
e e
lectrical
brake
system.
Air
Brak
e
System
Equipment
The
friction
brake
consists
of
an
e l
ectronically
con
-
trolled
air
brake
system,
with
contro
l
on
a p
er
-truck
basis,
67

which
actuates
truck-mounted
brake
cylinders
that
apply
Cobra
composition
shoes
to
all
8
wheels
(1
shoe
per
wheel).
Wheel
slide
protection
is
provided
in
service
friction
braking.
Figure
4-25
illustr
ates
the
air
brake
subsystem;
brake
equip-
ment
is
as
follows.
Air
Compressor
-
The
air
compressor
supplies
conditioned
air
to
the
main
reservoir
and
brake
supply
reservoirs.
This
pneumatic
system
provides
air
for
air
suspension,
trainlin
ed
and
main
reservoir
brake
pipes,
pneumatic
couplers,
and
the
air
brake
system.
The
air
compressor
is
a
2-stage
reciprocati
ng
unit
driven
by
a
230-volt
3-phase
60-Hz
motor
mounted
on
the
compressor
crankshaft.
The
motor
is
rated
at
7.5
hors
epower
nominal
at
1170
rpm
operating
speed.
The
compressor
is
oil
cooled
and
has
its
own
oil
filters.
The
intake
air
is
conditioned
by
a
combined
silencer-filter;
both
intercooler
and
aftercooler
units
have
safety
valves.
The
compresso
r
supplies
air
to
the
main
reservoir
at
a
rate
of
30
cfm
at
150
psi.
The
estimated
weight
of
the
compressor
unit
(shown
in
Figure
4-26)
is
680
pounds.
Air
Reservoirs
-
Three
air
reservoirs
are
mounted
on
the
SOAC,
one
main
and
two
for
brak
e
suppl
y.
The
main
reservoir,
of
4.8
cubic
feet
capacity,
is
charged
by
the
air
compressor
to
a
pressure
between
130
psi
(compresso
r
cut-in)
and
150
psi.
The
reservoir
contains
an
automatic
dra
in
valve
a
nd
a
release
valve.
The
two
brake
supply
reservoirs,
of
2.0
cubic
feet
capacity
each,
are
charged
by
the
main
reservoir
through
a
check
valve
in
each
analog
brake
unit.
Analo~
Brake
Units
-
The
SOAC
is
equ
ip
ped
with
two
elec-
tropneumatic
analog
brake
units,
one
per
truck.
An A
and
a B
unit
are
provided
for
each
car,
with
the
A
unit
equipped
with
a
charging
and
emergency
magnet
valve.
Figure
4-27
shows
an
A
unit
with
its
various
va
lv
e
and
contro
l
components:
•
Electropneumatic
Control
Valv
e -
This
valve
provides
air
pressure
inversely
proportional
to
the
e l
ectrica
l
control
current:
full
r e
leas
e of
brakes
for
f
ull
current.
The
output
of
the
built-in
pilot
valve
is
used
to
control
the
relay
valve.
•
Relay
Valve
-
This
valve
acc
epts
low-volume
press
ur
e
signals
from
th
e e
lectropneumatic
control
va
l
ve
(service)
or
the
emergency
vari
able
load
valv
e
(emergency)
and
r e
lays
the
required
high-volume
pres-
sure
to
the
four
brake
cy
li
nders
on
one
truck.
A
control-to
-
output
p
ressure
ratio
of
1.1
i s
maintained.
68

MASTER
CONTROLLER
WHEEL
,-
VELOCITY
BRAKE
ELECTRONIC
CONTROL
L..
______
_
I•
• • • • • • • •
~
'--
- -----
-:
---
.,
___
,
LEGEND
----
SUPPLY
AIR
MAIN
RESERVOIR COMPRESSOR
BRAKE
PIPE
/EMERGENCY PIPE
----~
ANALOG
BRAKE
"A"
UNIT
--L--
MA
IN RESERVOIR PIPE
BRAKE
RESERV
OIR
....
..
. -,
I
ANALOG
BRAKE
"
B"
UNIT
. -
.J
··-
---
--
•· PNEUMA
TIC
PRESSURE SIGNAL
- -
--
ELECTRICAL
SIGNAL
Q
LEVELING
VALVE
0
BRAKE
CYLINDER
<;'.]
CHECK
VALVE
'
I·
•
◊
TWIN
CH
ECK
VALVES
/CHOKED BYPASS
Figure 4- 25. Brake System Schematic
,- .
' '
l.
1
---1
• I
Figure
4-26
.
Air
Compressor
69
BRAKE
RESERVOIR

MAIN
FRONT
EMERGENCY
PRESSURE SWITCH
BRAKE
SUPPLY
CHARGING
AND
EMERGENCY
BRAKE
RESERVOIR
0
MAGNET
VALVE
PIPE
( )
SELECTOR
COCK
EMERGENCY
VARIABLE
LOAD
VALVE
EMERGENCY
VALVE
BRAKE
CYLINDER
EXHAUST
VENT
PRESSURE
TRANSDUCER
0
0
CHECK
VALVE
E LEC
TRO
-PNE
UMATI
C
CONTROL
VALVE
Figure 4- 27.
Ty
pe
"A"
An
alog Elec
tr
o-Pneumatic Unit
70

Two
diaphragms
are
provided,
operating
in
seri
e s
since
the
relay
valve
functions
in
both
service
and
emer-
gency
braking.
•
Emergency
Valve
-
This
valve
detects
a
predetermined
rate
of
pressure
drop
and
upon
operation
causes
the
emergency
brake
pipe
to
vent.
Air
from
the
supply
reservoir
then
passes
through
the
emergency
variable
load
valve
to
t
he
relay
valve
and
the
brake
cylinders.
A
timing
reservoir
is
provided
which
provides
an
irre-
.
trievable
stop
feature:
the
brake
pipe
cannot
be
re-
charged
until
the
30-second
delay
time
is
fullfilled.
•
Emergency
Variable
L
oad
Valve
-
This
valve
func
tions
during
emergency
brake
applications
to
limit
the
pilot
air
pressure
to
the
relay
va
lve
in
proportion
to
car
weight
as
sensed
by
air
suspension
pressure.
The
valve
does
not
affect
the
electronically
load-weighted
service
brake
pilot
pressure.
•
Charging
and
Emergency
Ma
c;rnet
Valve
-
This
valve
connects
the
main
reservoir
to
the
eme
rgency
pressure
(knockout)
switch,
the
emergency
valves
,
and
the
emer-
gency
brake
pipe.
It
is
normally
energized
open
and
when
deenergized
(closed)
causes
rapid
venting
of
the
brake
pipe.
The
va
lve
then
isolates
the
main
reservoir
line.
When
reenergized,
the
valve
allows
the
brake
pipe
to
charge
from
the
main
reservoir.
•
Emergency
Pressure
Switch
-
This
switch
is
maintained
energized
by
the
emergency
pipe
p
ressure
and
inter-
rupts
either
propulsion
or
dynamic
braking
in
the
event
of
emergency
pipe
venting.
Emergency
braking
is
then
accomplished
using
friction
air
brakes
alone.
•
Pressure
Tranducer-Load
Weight
-
This
tranducer
pro-
duces
an
electrical
output
proportional
to
it
s
input
air
suspension
pressure.
The
lin
ea
r
electrical
output
is
proportional
to
car
weight,
and
is
sent
t o
an
e
lec-
tronic
unit
(PPCU)
where
it
modulat
es
the
control
P-signal
in
both
propulsion
and
service
braking.
•
Check
Valve
with
Filter
-
This
valve
supplies
main
reservoir
air
to
the
r e l
ay
valve,
the
emergency
valve
and
the
electropneurnatic
control
va
lv
e
(by
the
selec-
tor
cock).
•
Selector
Cock
-
This
control
allows
isolation
of
the
service
brake
components
while
retaining
the
emergency
brak
e
function.
The
electropneurnatic
control
valve
is
vented
through
thi
s
cock.
71

Tread
Brake
Units
-
The
high
volume
air
pressure
from
the
relay
valve
on
th
e
analog
unit
is
sent
to
the
brake
cylinder
mounted
on
each
of
the
four
brake
actuator
units.
Figure
4-28
shows
a
brake
unit
and
its
various
components.
The
brake
actuators
are
mounted
between
the
wheels
on
the
trucks
and
apply
the
controlled
air
pressure
to
each
wheel
through
COBRA
composition
brake
shoes.
Automat
ic
slack
adjustment
for
shoe
wear
is
provided
using
a
helical
ratch
et
and
combination
push-
rod
and
adjusting
screw
w
ithin
the
actuator
housing.
A
reset-
ting
handwheel
and
latch
are
also
provided
for
manual
slack
adjustment
following
sho
e
replacement.
The
two
actuator
units
on
the
motorman's
side
of
the
cab
end
of
the
cars
are
provided
with
a
hydraulically
applied
and
released
handbrake.
The
selector
valve,
ha
n
dp
ump,
fluid
res-
ervoir,
ON
-OFF
indicator,
and
r
elief
and
check
valves
are
con-
tained
in
a
cab-mounted
unit
supplying
th
e
two
brake
actuator
hydraulic
uni
ts
.
The
hydraulic
unit
applies
braking
force
to
lever
A
in
F
igu
re
4-28
at
a
point
betw
ee
n
the
brake
cylinder
rod
and
the
fulcrum
pin.
Add
itional
Air
Brake
Equipment
-
In
addition
to
the
items
discussed
above,
the
following
indication
and
control
equip-
ment
is
provided:
•
Control
lo
gic
(PPCU
box)
•
Cab
duplex
ai
r
gauge
(brake
pi
pe
and
brake
cylinder)
•
Cab
brake
panel
(ON-OFF)
indicator
lights
for
air
brake,
snow
brake,
and
handbrake
and
snowbrake
switch
•
Conductor's
valve
(vents
brak
e
pipe;
applies
emergency
brakes)
•
Tr
i p
cocks
on
trucks
(vent
brak
e
pipe
and
apply
emergency
brakes
when
activated
by
track
trip;
resets
automatically)
Air
Brake
System
Control
The
air
brak
e
system
derives
its
input
command
from
the
master
controller.
During
service
braking,
t he
air
brake
pro-
v
ides
i
nshot
pressur
e
as
wel
l as
any
braking
effort
in
excess
of
the
dynamic
brake
effort
required
to
meet
the
input
braking
command.
During
emergency
braking,
the
traction
system
dy-
namic
braking
is
disabled
and
all-friction
air
braking
is
utiliz
ed.
Service
Friction
Braking
- A
block
diagram
of
th
e
service
air
brake
control
sys
tem
is
shown
in
Figure
4-29
.
During
nor-
mal
servi
ce
stops
using
blended
braking,
the
air
brake
is
held
72

PISTON
PACKING
HANGER
PIN
BRAKE
HEAD
BRAKE
CYLINDER
PISTON
AND
ROD
SPRING
BRAKE
HEAD-
-:=
--:-
~~
~
PIN
STRIKE
PLATE
HANDBRAKE
LEVER
(OPTIONAL)
FULCRUM
PIN
SLACK
ADJUSTER
MECHANISM
Figure 4
-2
8. Brake
Actuator
(
Non
-Handbrake
Unit)
73

NO MOTION
SPEED
A~
DIGI
TAL-
LJ
(3) TO i
ANALOG
. V
EL
OCITY
4 I
FEEDBACK ·
SPEED
AXLE
2
DIGITAL
(4)
TO
BRAKE
ANALOG
h
SUPPLY
RESERVOIR
NO
MOTION~-
ELECT
RO
-
-..J
.i,.
RELAY
PNEUMAT-
VALVE
IC
V
ALVE
AIR
BRAKE
AIR
SUPPLY
ACTUATORS (BRAKE
RES
ERVOIR)
RATE
SPI
N/SLI
DE
i
-CHANGE - DETECT
SENSOR I
I
RATE I
:.
CHANGE SPIN/SLIDE
SE
N
SOR
DETECT
VALVE
AIR
BRAKE
CURRENT COMMAND
G.
EN
-ERATOR
AIR
BRA
KE
FEEDBACK
SPIN/
SLIDE
SIGNAL
TO
PRO
PULSION
CONTROL
DELAY
LEVEL
CHANGE
DYNAMIC
r-
--
-----
----
--uBRAKE
I / JERK WEIGHT SENSOR SIGNAL
)•
+ 1 I
LIMIT
ING WEIGHT
FACT
OR
+ TRACT
IVE
EFFORT
COMMAND
FI
XED
LEVELS INSHOT
AN
D
COAST
DETECT
P SIGNAL
i-.---o
SENSE
(BRAKE)
SNOW
BRAKE
Figure 4- 29.
Air
Brake
Control
System (on Each Tank)

off
by
the
dynamic
brake
feedback
signal
(DB
signal
in
Figure
4-30).
At
high
car
weights
where
the
dynamic
brake
effort
cannot
meet
the
full-service
brake
command,
the
air
brake
will
rece
ive
a
command
from
the
blender,
and
friction
brakes
will
be
applied
so
that
the
commanded
rate
is
achieved.
If
the
dy-
namic
brake
is
disabled,
the
air
brake
will
receive
the
full
brake
effort
command,
and
the
stop
will
be
completed
on
air
brakes
alone
under
control
from
the
master
controller.
The
friction
brake
is
applied
to
inshot
pressure
(6
to
8
psi)
under
all
conditions
where
dynamic
braking
can
achieve
·
the
desired
rate.
This
reduces
the
response
time
required
to
perform
any
brake
blending.
Loss
of
third-rail
power
during
blended
braking
(e.g.,
rail
gaps
or
sudden
loss
of
dynamic
braking)
will
result
in
automatic
transfer
to
service
friction
braking
with
full-
service
deceleration
reestablished
within
approximately
1.3
seconds.
When
third-rail
power
is
established
following
a
gap,
the
control
system
will
revert
to
dynam
i c
braking.
This
tra
n
s-
fer
to
Service
friction
braking
occu
rs
because
third-rail
power
is
required
for
the
two
traction
motor
field
power
sup-
plies,
and
the
energy
stored
in
the
capacitor
bank
and
motor
alternator
inertia
may
not
be
sufficient
to
power
the
fields
in
a
lon
g
track
gap.
Figure
4-30
illustrates
the
r e
sponse
to
a
step
controller
input
of
the
service
friction
brake
without
dynamic
braking
for
a
90,000-pound
car.
The
nominal
brake
cylinder
pressures
associated
with
the
various
car
weights
are
also
shown
in
this
figure
(based
on
engineering
test
program
data).
The
step
command
for
full-service
brake
from
th
e
master
controller
is
translated
into
a
jerk-limited
current
command
at
the
elec-
tropneumatic
analog
valve
after
a
time
delay
associated
with
mode
switching.
Application
of
brake
cylinder
pressure
and
incre
ase
of
deceleration
rate
retard
the
analog
valve
current
due
to
the
volume
of
air
required
to
fill
the
brake
cylinders.
A
nominal
rate
of
3.0
mphps
±
10
percent
is
achieved
following
a
jerk
rate
of
2.4
mphpsps.
Brake
cylinder
pressure
remains
constant
at
57
to
58
psi
throughout
the
completion
of
the
stop.
Spin-Slide
Control
-Bo
th
service
friction
and
dynamic
brake
systems
are
provided
with
spin-slide
protection
systems
which
operate
to
reduce
braking
effort
and
correct
wheel
slides.
The
spin-slide
detection
sys
tem
is
illustrated
in
the
upper
portion
of
Figure
4-29.
The
spin-slide
signal
output
is
sent
to
the
tractive-braking
effort
control
loop
(Figure
4-15)
and
acts
to
reduce
the
P-signal
or
brake
command,
which
enters
from
the
right
in
Figure
4-30.
The
brak
e
system
t
hen
cycles
between
high
and
low
brake
effort
according
to
wheel
slip
con-
dition
with
a
resulting
frequ
e
ncy
of
1.8
Hz
for
the
dynamic
brake
or
0.6
Hz
for
friction
brakes
alone,
as
required
during
75

SERVICE
BRAKING
a: 80
w
o:=-
zU'l
-Cl. 70
_J
-
_J
>-
w
<{ u a:
z w
::::,
60
-
~~
~
<{
w
0 a: a: 50
z
co
Cl. 90,
000
100,000 110,000 120,000 130,000
INPUT CAR WEIGHT (LB)
i RUN 151 1.0
RE
C 18
17
.8
_J
MASTER
VINIT
40MPH
.6
<{
-
z
(/')
CONTROLLER .4
(.!)
Cl.
w
90
,
000
LB
-~
<,:>
<{
.2 Cl. -
P = 0.0 AMPS 0
(/')
0
"FULL
SERVICE
BRAKE"
Cl.
~
A
NALOG
<{
VALVE
I-
FWD TRUCK
(.!) z
oww
2
60
a:
...J
> a: w
<{
_J
a:
o:=-
z
<{::::,
z
(/')
3
40
-Cl.
<{ > u
_J
-
>-
w
u a:
BCP 20 w
::::,
~
(/')
FWD TRUCK <{
t3
a: a:
0
co
Cl.
JERK
RATE: 2.4 M
PH
/
SEC
2
'
~ECE
L
ERAT
ION
Zu 0
O w
-
(J')
I-
-...
<{ I
a:
Cl.
w ~
_J
-2
UJ
L!J
u
I-
UJ
<{
3 0 a: 2 3 4
0
TI
ME (SECONDS)
Figure 4
-3
0. Fri
ct
ion Brake Pressure and Application
Cha
racteristics
76

a
continuo
us
sequence
of
slides.
T
he
service
friction
brake
achieves
an
effic
i e n
cy
of
approximately
63
percent
of
avail-
able
adhesion
or
dece
l
eration
rate.
This
compares
to
an
effi-
ciency
of
over
77
percent
for
the
faster
responding
dynamic
brake
system
alone.
Emergency
Fr
i
ction
Braking
-
The
emergency
air
brake
uses
the
same
brake
cylinders,
piping
to
the
electropneumatic
valve
unit,
and
relay
valve
as
the
service
brake.
However,
the
e l
ectropneumatic
control
valve
and
its
control
loop
are
by-
passed,
and
the
ven
ti
ng
of
the
brake
pipe
by
the
emergency
magnet
valve
(followed
by
emergency
load-weigh
valve)
causes
the
relay
valve
to
provide
the
desired
brake
cylinder
pressure.
Figure
4-
31
illustrates
the
br
ake
control.
An
irretrievable
stop
is
obtained
using
a
30-second
timing
reservoir
to
prevent
rapid
brake
pipe
recha
r
ge.
The
wheel
spin-slide
system
is
locked
out
in
emergency
braking.
The
brake
rate
of
3.2
mphps
nominal
is
achieved
within
1.4
seconds
from
brake
command.
Emergency
braking
is
commanded
in
several
ways:
power
l
ever,
emergency
stop
pushbutton,
cab
and
conductors'
pull
cords,
loss
of
brake
pi
pe
pressure
(broken
pipe,
decoupled
cars,
etc.)
and
tota
l
power
loss
(third
rail
or
battery).
All
these
conditions
result
in
dumping
pressure
from
the
brake
pipe,
sealing
reservoirs
from
brake
pipe
venting,
cutting
all
traction
power,
and
applying
emergency
brake
pressure
to
the
.
cylinders
and
brake
shoes.
Remote
Brake
Cutout
-
Provisions
for
disconnecting
and
venting
the
brake
cy
l
inder
air
lines
from
inside
the
car
were
incorporated
after
t
he
cars
were
delivered.
Since
the
SOAC
has
a
brake
cutout
cock
for
each
truck,
a
separate
inside-th
e -
car
control
was
installed
for
each
truck,
thus
providing
addi-
tional
flexibility
and
avoiding
excessive
control
run
length.
Each
control
consists
of
a
pull-to-release
handle
accessible
through
a
swing
panel
(No.
2
for
the
forward
truck;
No.
10
for
the
aft
truck)
connected
to
a
push-pull
control
cabl
e
passing
through
the
edge
of
the
floor
and
undercar
insulation
cover.
A
sliding
link
attached
to
the
low
er
movable
end
of
the
contro
l
cable
connects
(at
an
appropriate
distance
from
the
cutout
cock)
to
a
pinned
link
which
connects
to
a
handl
e
adapter
on
the
cock.
77

-._J
co
CAB
CONTROLS
EMERGENCY
SWITCH
MASTER
CONTROLLER
EMERGENCY ,__
BRAKE
KEY
POSITION
"OFF/CHARGE"
AIR
SUPPLY
(MAIN
RESERVOIR)
11
MAGNET
KNOCK-OUT
.
VALVE
--
PRESSURE SWITCH
,!)
VENT
CHARGING
VALVE
..
,
BRAKE
PIPE
AIR
~
EMERGENCY
DELAY
VALVE
Figure
4-3
1. Emergency
Bra
ke
C
on
trol
-
~
'::
f--...
..
EMERGENCY
RELAY
BRAKE
RESERVOIR
{}
REL
AY
VALVE
A
IR
B
RAKE
C
YL
INDER
PR
ESSURE
I-+-
◄
OPENS
ALL
TRAINLINED
EMERGENCY
RELAYS
OPENS
TRAIN-
LINED
P-SI
GNAL
COMMANDS
PROPULSION
TO STOP
-
~-

5. SUBSYSTEMS
5.1
TRUCKS
The
SOAC
truck
and
suspension
system,
(Figures
5-1
and
5-2)
provides
improved
ride
quality
and
reduced
noise.
The
trucks
are
of
the
inside
-
bearing-equalized
"Gen
era
l
70"
type
with
full
air
suspension.
Assembled
weight
of
the
cast
alloy
nickel
steel
truck
is
14,500
pounds.
It
has
a
7-foot
.
6-inch
wheel-base
for
standard
ga
u
ge
track
and
is
designed
for
a
m«x-
imum
load
on
top
of
the
bo
l
ster
spring
of
41,500
pounds.
The
truck
frame
supports
a
cast
steel
truck
bolster
by
means
of
side
bearings.
The
frame
and
bolster
are
protected
against
separation
at
the
center
pivot
by
a
2-inch
diameter
locking
center
pin.
An
air
spring
is
mounted
at
each
end
of
the
truck
bolster
to
support
the
car
body.
The
truck
bolster
is
connected
to
the
car
body
through
two
longitudinal
anchors,
one
at
each
side
of
the
car.
Truck
bolster
and
car
body
can
move
ver
tically
and
transversely
relative
to
each
other
but
cannot
swivel
or
move
longitudinally.
Two
safety
straps
sus-
pended
from
the
car
body
pass
beneath
the
truck
bolster
to
protect
against
accidental
separation
of
tr
uck
and
car
body.
The
air
suspension
system
consists
of
one
Firestone
Airide
spring
at
each
corner
of
the
car~
When
passenger
load
is
added
to
or
removed
from
the
car,
the
air
pressure
in
the
springs
is
adjusted
automatically
by
th
e
action
of
leve
l
ing
va
lves
at
each
end
of
the
car,
thereby
maintaining
a
constant
floor
height.
Truck
bolsters
ar
e
seal
ed
to
form
reservoirs
for
the
air
springs.
79

Figure
5-1.
Truck
Figure
5-2.
Tr
uck
and
Suspension
80

Vertical
vibration
damping
is
accomplished
with
removable
orifices
inside
the
air
springs,
supplemented
by
external
hy-
draulic
shock
absorbers.
Resilient
stops
mounted
on
th
e
car
body
contact
the
bolster
to
limit
excessive
lateral
movements
of
the
car
body.
Additional
resilient
stops
are
mounted
in-
side
the
air
spring
to
limit
vertical
movement
of
the
car.
The
total
range
of
adjustment
to
accommodate
various
plat-
form
heights
in
service
is
5
inches.
Adjustme
nt
is
made
through
the
use
of
shims.
5.2
RESILIENT
WHEELS
Resilient,
retreadable
Acousta
Flex
wheels
(Figure
5
-3
),
manufactured
by
the
Standard
Ste
e l
Di
v
ision
of
Baldwin-Lima-
Hamilton
Corporation,
were
installed
prior
to
completion
of
the
engineering
tests.
These
wheels
have
an
aluminum
hub,
a
steel
rim,
and
a
steel
(tread-flange)
tire.
A
layer
of
sili
-
cone
rubber
separates
the
rim
and
the
hub
sections.
Wheel
sections
are
connected
by
a
multipoint
shunt
for
electrical
continuity.
The
wheel
is
30
inches
in
diameter,
weighs
462
pounds,
and
has
a
1:20
tread
contour.
Th
e
hub
has
porting
for
the
use
of
hydraulic
assist
when
it
must
be
removed
from
the
axle.
When
the
condemning
limit
diameter
.
of
2 8
inches
has
been
reached,
the
steel
(tread
-fl
ange)
tire
can
be
remov
e d
from
the
rim
and
a
replac
eme
nt
installed
by
shrink-fitting.
The
primary
benefit
of
th
e
resili
ent
wheels
is
a
si
gnif
-
icant
reduction
in
squeal,
especially
when
the
cars
negotiate
low
radius
curves.
Other
anticipated
benefits
are
reductions
in
the
higher
frequency
vibrations
and
roar
and
impact
noises
induce
d
by
the
wheel/rail
interface.
The
weight
of
th
e
wheels
is
also
considerably
less
than
conventional
steel
wheels.
Braking
tests
described
in
Section
6
were
made
with
these
resilient
wheels.
5.3
HEATING, VENTILATING,
AND
AIR
CONDITIONING
The
SOAC
heating,
ventilating,
and
air
conditioning
system
is
illustrated
in
Figure
5-4.
The
sys
tem,
prov
id
ed
by
the
Safety
Electric
Company,
consists
of
two
independent
8-ton
AC
systems
per
car
,
each
s
epa
rat
e
ly
controll
e d
by
its
own
temper-
ature
control
panel
and
thermostat.
Each
8-
ton
system
consists
of
a
compressor
-
condenser
unit
mounted
under
the
car,
and
an
evaporator
and
blower
unit
mounted
overhead
at
the
end
of
the
car
(Figure
5-5).
Motor
81
Figure 5- 3. Acousta-Flex Wheel
COMPRESSOR
MOTOR
AMBIENT
AIR
(HEAT SINK)
oB--
BLowER
EVAPORATOR
1-----~
/4ATER
BLOWER
D-8
.....
RETURN
AND
CONDITIONED AIR
TO PASSENGER
COMPARTMENT
FRESH AIR
rv,.-
-EXPANSION
VALVE
RECEIVER
Figure
5-4.
Heating, Ventilating and Air-Conditioning System
82
Figure 5-
5.
Overhead
He
at
ing, Ventilating,
and
Air-Conditioning
In
stallation
83

co
nt
ro
ls
and
protective
devices
are
mounted
on
a
single
pan
e l
to
conserve
space.
The
i
nd
i
vidua
l
syst
ems
use
R-12
refriger-
ant
and
are
rated
at
96,000
Btu/hr.
A
centerline
air
duct
has
a
diagona
l
splitt
er
for
mixing
the
two
airstreams
from
the
two
air
condit
i
oners
with
i n
the
car
body.
Within
a
total
of
4000
cfm
(per
car)
air
circula
-
tion,
1800
cfm
of
fr
esh
air
is
mixed
in
during
warm
weather
opera
tion.
The
system
i s
designed
to
ma.
intain
a
75°F
max
imum
interior
temperature
over
an
outside
tempe
rature
rang
e
of
-15
to
1
05°F.
The
overhead
electric
he
at
assemb
l y
is
mounted
downstream
of
the
evaporator
coil.
It
is
an
open
design
,
employing
corrosion-proof
bare
wi
re
elements
wi
t h
cer
amic
insulators.
The
heat
e r i s
arranged
for
two-stage
operation
of
9
and
16
kw
at
600-
vdc
power
supply.
Each
stage
of
h
ea
t
is
distributed
over
the
entire
heat
er
face.
The
9-kw
or
firs
t
st
age
of
over-
head
heat
is
us
ed
to
provide
a
sensible
heat
load
for
the
reheat
cycle
during
summer
operatio
n
an
d
to
temp
e r
the
outside
air
during
winter
operation.
At
35°F
(o
utsid
e t
empera
ture)
25
kw
of
e l
ectric
heat
is
used.
To
provide
protec
tion
against
excessive
heat
buildup,
a
sing
le-pole
doub
le
thermoswitch
with
silicone
rubber
overmold
is
set
to
open
at
150°F;
an
automat
ic
res
e t
to
c
los
e
contacts
at
1
35°
F
is
mounted
at
the
top
of
th
e
heater
casing.
5.4
COUPLER
AND
DRAFT
GEAR
Mechanical
Coupling
The
SOAC
coupler
and
draft
gear
system
(see
Figure
5-6)
as
supplied
by
th
e
Ohio
Brass
Company,
provides
a
ut
omatic
,
tight-lock
,
hook-type
coupling.
S
id
e-
mounted
e
lec
tri
c
cou
-
plers
are
provided
on
the
No.
2
ends
only.
The
coup
l
er
has
a
lateral
lineup
or
gathering
range
at
th
e
face
of
th
e
coupl
er
to
permit
automat
ic
coup
lin
g
if
it
i s
3-3/8
i
nch
es
to
the
l
ef
t
or
to
the
right
of
the
centerline
of
th
e
opposi
n g
co
up
ler.
The
coupler
has
a
vertical
lineup
or
gathering
range
at
the
fac
e
of
th
e
coupler
of 6 i
nches
(3
i
nches
up
or
down)
from
stand
ard
height.
The
coupler,
drawbar
and
anchorage
have
a
minimum
strength
of
225,000
pounds
in
pu
ll
and
400,000
pounds
in
buff.
Th
e
drawbars
at
both
the
No
. 1
and
2
ends
ar
e
pro-
vided
with
an
automatic
air
action
cente
ring
device
whic
h
maintains
th
e
coupler
in
its
center
posi
tion.
Electric
Coupling
Electrical
coupling
equipment
sup
p
lied
by
Walton
Products
provides
electrica
l
coup
ling
between
t
he
cars.
Th
e e
lectric
coupler
box
assemb
li
es
consist
of
two
carbon
steel
box
es
84
Figure 5- 6. Coupler
and
Dr
a
ft
Gear
85

(Figure
5-7)
mounted
one
on
each
side
of
the
mechanical
coupler.
Each
electric
head
contains
59
springloaded
con-
tacts:
15
fixed
in
the
projected
position,
and
44
retractable.
If
proper
air
pressure
of
125
pounds
is
not
available,
electric
coupling
may
be
made
manually
by
using
a
hand
crank.
Key
e
lectrica
l
trainline
functions
which
go
through
the
coupler
are:
1.
Public
address
2.
Intercom
3.
Radio
4.
Coupler
5.
Side
doors
6.
Lights
7.
Emergency
valve
loop
8.
P-wire
9.
Propulsion
control
10.
End
doo
rs
11.
Side
signs
12
.
Brake
contro
l
13.
Handbrake
indicator
14.
Air
comfort
15.
Battery
power
(Bl+
and
B2+)
5.5
DOORS
AND
DOOR
OPERATORS
Side
Doors
The
6-foot
high,
50-inch
wide
side
doors
are
of
hollow
construction
with
honeycomb
filler;
stainless-steel
exterior
surfaces
have
No.
4
brushed
finish
.
The
doors
are
fully
in-
sulated
with
fiberglass
insulation;
interior
surfaces
are
treated
with
sound-
and
vibration
-d
ampi
ng
material.
The
door
s
are
hung
on
steel
ball-bearing
hangers
so
designed
that
the
eccentric
loading
of
the
doo
r
does
not
spread
th
e
track
or
misalign
the
door.
86
Figure 5-
7.
Electric Coupler Boxes
87

Door
Operators
The
door
operator,
control,
and
sy
s
tem
signaling
circuits
provided
by
the
Vapor
Corporation
are
designed
for
operation
from
the
car's
36-vdc
battery.
The
complete
system
is
de-
signed
to
function
within
each
car
or
via
trainlines
in
the
two-car
train.
Each
of
the
four
double
-l
eaf
doors
is
activated
by
its
own
operator
(16
per
car).
In
normal
system
operation,
the
door
operators
(see
Figure
5-8)
are
activated
to
open
or
close
upon
receipt
of
the
proper
command
from
th
e
door
control
unit
mounted
in
the
cab.
The
door
control
unit
cannot
be
activated
unless
the
train
has
stopped
and
the
speed
sensor
contacts
have
closed
in
a
series-connected
zero-speed
r e
lay
contact.
Each
door
operator
motor
is
protected
against
thermal
ove
rlo
ad
by
means
of
a
tempera
tur
e
-activated
cutout
switch
which
automatically
opens
and
causes
a
high
wattage
resistor
to
be
connected
in
series
with
the
motor
DC
1
line.
The
motor
is
designed
to
withstand
a
stalled
cond
i
tion
with
the
opening
of
the
thermal
cutout
.
The
mechanical
design
of
the
door
operator
linkage
is
such
that
it
provides
an
overcenter
locking
feature
when
the
door
panel
is
moved
to
the
closed
position.
This
prevents
the
door
panel
fro
m
being
opened
manually
unless
the
overcenter-
lock
is
released
either
electrically,
through
rotation
of
the
operator
motor,
or
manua
ll
y
through
action
of
the
emergency
operating
lever.
The
emergency
operating
lev
er,
an
integral
part
of
each
door
operator,
permi
ts
manual
opening
of
the
door
panel,
if
required.
Actuating
the
emerqency
lever
also
opens
an
emergency
switch
which
removes
e l
ectrica
l
power
and
pre-
vents
an
electrical
closing.
Each
door
operator
circuit
inc
lud
es
a
four-pole,
toggle-
type
switch,
whose
center
OFF/CUTOUT
position
provides
a
means
of
e
le
ctrically
disconnecting
the
operator
function
when
it
is
desired
to
perform
maintenance
or
cut
the
ope
rator
from
ser-
vice
in
the
event
of
a
malfunction.
For
normal
system
opera-
tion,
the
operator
is
connected
in
the
N
ORMAL
position.
To
test
door
operation,
a
spring-return
TEST
position
will
close
an
open
door
(if
the
open
signal
is
applied
in
the
door
con-
trol
unit
mounted
in
the
cab).
The
door
will
open
again
when
the
switch
lever
returns
to
NORMAL.
Components
of
the
door
control
and
signaling
system
are
wired
to
various
system
relays
mounted
on
the
door
control
re-
lay
panel
for
the
corresponding
car
side.
One
panel
per
car
side
is
locat
e d
at
the
No . 1
end
of
the
car;
t he
relay
panel
is
l
ocated
in
an
area
n
ear
its
respective
door
contro
l
unit.
The
door
control
units
include
a
ma
s
ter
key
switch
asse
mbly,
88
Figure
5-8.
Door
Operator
89

tw
o
OPEN
and
two
CLOSE
pushbuttons,
and
two
red
zone
signal
lights
.
A
signal
light
assembly
with
a
red
lens
is
l
ocated
out-
side
the
car
,
adjacent
t o
ea
ch
door
pan
e
l.
Two
parallel-
connected
6-watt
40-volt
la
mps
are
l
it
as
t
he
adjacent
door
panel
moves
to
an
open
position.
"Hun
g"
doors
are
therefore
easy
for
the
crew
to
l
ocate.
D
oor
operators
are
des
igned
t o pr
eve
nt
slamming
at
the
co
mpletion
of
travel
in
eit
he r
direct
i
on.
Pressu
re
buildup
on
the
door
edge
measured
at
mi
d
tra
ve
l w
ill
not
exceed
22
po
unds
when
energized
by 36
vo
lts.
Oper
atin
g
tim
e
for
opening
the
do
ors
(incl
udin
g
cushion-
ing)
is
1.2
sec
on
ds
maximum;
clo
s i
ng
speeds
are
adjustable
from
1.5
to
3
sec
onds.
An
audib
l
e,
solid-state
electronic
chime,
int
e
rco
nnected
with
the
public
address
s
ystem
,
is
prov
i
ded
for
ea
ch
car.
It
is
ac
ti
vated
to
sound
a
doo
r
closing
signal
approximately
one
second
before
the
door
cl
os
i
ng
cycle
is
sta
rt
ed
.
In
the
event
of
an
eme
rgency
in
volving
th
e
lo
ss
of
power,
each
door
operator
is
equipped
wi
th
hand
l
es
which
pe
rmit
t
he
mechanical
opening
of
the side
doo
rs.
In
additi
o
n,
each
door
operator
contains
an
e l
ectrical
cutout
feature
which
permits
is
o
la
t
ion
of
a
troub
l
esome
l
eaf
and
cont
inu
ed
train
operation.
5 . 6
COMMUNICATIONS
The
fo
ll
owing
communicat
i
on
and
pub
li
c
address
sy
s t
ems
are
installed
on
each
SOAC
c
ar.
Pub
li
c
Address
System
The
pub
li
c
addre
ss
system
on
each
ca
r
consists
o f a
telephone
handset
mounted
on
t
he
mo
t o r man ' s
console
, t wo
wa
ll
mounted
microphones,
one
trans
istor
amplif
i
er
unit
and
e i
ght
loud
speakers.
The
system
is
designed
t o
permit
t
he
crew
to
conduct
pr
i
va
t e
comm
unicati
ons
using
t he h
andsets,
or
make
pub
li
c
announcements
through
either
the
handset
or
the
wa
ll
microphones.
Train
to
Wayside
Radio
communications
between
the
train
and
wayside
are
conducted
using
a
two-way
radio
s
pecif
ically
designed
for
heavy-duty
rai
lr
oad
application
. Two
antenna
systems
are
provided:
one
mounted
on
the
ro
of
(for
greater
range
where
clearance
permits),
the
o
ther
mounted
in
the
cab
.
Freq
uency
changes
can
be
made
by
changing
crystals
.
90

The
motorman
can
communicate
directly
with
the
command
center;
and,
by
use
of
a
mode
selector
switch,
can
permit
the
command
center
to
make
announcements
to
the
passengers.
Power
for
radio
communications
is
provided
directly
from
the
battery.
5.7
AUTOMATIC
POWER
CHANGEOVER
Since
power
will
be
provided
from
either
an
overhead
or
third-rail
source
during
the
SOAC
operational
demonstration,
a
special
unit
was
designed
to
accomplish
this
changeover
"on
the
fly".
The
changeover
unit,
which
weighs
450
pounds
consists
of
two
specially
designed
NEHA
size
8
DC
contactors
rated
at
1500
amperes
continuous
duty.
The
contactors
are
mounted
in
an
en-
closure
which
in
turn
mounts
directly
to
the
underside
of
the
car.
Whenever
one
of
the
power
sources
(third
rail
or
panto-
graph)
is
energized,
a
contactor
automatically
connects
this
power
source
to
the
knife
switch
input
terminal
and
excludes
the
opposite
power
source.
If
this
power
source
t e
rminates
and
the
opposite
source
becomes
energized,
the
unit
auto-
matically
trans
fe
rs
to
the
new
source
and
excludes
the
other.
5.8
POWER
COLL
EC
TORS
Pantograph
A
light
weigh
t
pantograph
installation
has
been
designed
to
allow
the
SOAC
vehicle
to
op
e r a
te
on
selected
transit
lines
in
Cle
v
eland
and
Chicago.
Structural
modifications
to
the
No.
2
end
of
each
car
provide
for
the
weight
of
the
pantograph,
as
well
as
a
wooden
walkway
on
both
sides
of
the
car
to
support
three
or
four
workmen.
The
pantograph
(Fi
gur
e
5-9)
may
be
raised
or
low
ered
in
4
to
6 s e
conds
using
a
DC
series
motor
in
conjunct
i
on
with
a
drivin
g
spring
fo
rce
which
maintai
ns
contact
pressure
against
the
catenary.
Prov
ision
is
a
lso
made
for
manually
raising
or
lowering
th
e
pantograph.
After
the
master
controller
has
been
made
operative,
th
e
pantograph
is
controlled
thr
o
ugh
trainlines
from
the
operating
cab.
Both
pantographs
may
be
raised
or
l
owered
f
rom
the
oper-
ating
cab
; a
re
d
warning
light
illuminat
es
when
th
ey
are
in
the
elevated
position.
91
• . .
11
~·
C I
,-
- - l ' . I :I j . @
~
L -
l.
...........
L
······
·
···
..
!•'
.......
..
.....
~
.
:;",1,
-::1tt·
/ :.
~,~-
,,
--
-
__
-~-
--
~
0
_
••
-
Figure 5- 9. Pantograph (Partially Extended)
92

The
weight
of
each
pantograph
is
775
pounds.
They
are
capable
of
operation
through
a
span
of
11
feet,
from
maximum
elevation
down
to
within
3
inches
of
the
locked-down
position.
Insulation
has
been
provided
to
insure
that
when
the
panto-
graph
is
in
the
locked-down
position,
inadvertent
application
of
1000
volts
to
the
pantograph
will
not
result
in
arc-over
to
the
car
frame.
Third-
Rail
Collector
The
third-rail
power
collector
shown
in
Figure
5-10
was
designed
and
supplied
by
the
Ohio
Brass
Company.
We
i
ghing
less
than
40
pounds,
it
has
a
rub
ber
torsional
unit
which
eliminates
most
of
the
bouncing
and
provides
additional
spring
forces
to
aid
the
natural
shoe
weight
in
response
to
rail
height
variations.
The
collector
paddle
is
adjustable
for
height
and
contact
rail
pressure
by
loosening
fasteners
and
rotating
the
torsion
shaft
to
the
desired
level.
Two
col
l
ec-
tor
mounting
brackets
weighing
approximately
7
pounds
each
are
requir
ed
for
each
collector.
The
collector
will
operate
on
systems
using
600
to
1000
vdc
at
speeds
up
to
80
to
100
mph.
The
malleable
iron
shoe
i s
readily
replaceable
if
damaged.
5.9
LIGHTING
Interior
Lighting
The
passenger
area
of
each
car
is
illuminated
by
a
fluo-
rescent
lamp
system
consisting
of
37
fixtures.
Light
levels
in
the
car
vary
from
a
peak
of
50
foot-candles,
measured
20
inches
laterally
from
the
centerline
of
each
door
on
the
A
side
of
the
car
36
inches
above
the
floor,
to
a
minimum
of
35
foot-candles
measured
at
the
s
ea
ted
reading
plane.
Togeth
e r
with
the
attractiv
e
colorful
interior,
th
e
lighting
gives
the
interior
a
general
appearance
of
comfort.
Lamps
are
protected
by
lenses
designed
to
prevent
the
accumulation
of
moisture
or
dust,
and
are
easily
removable
for
.
service.
Cab
Lighting
Two
fluorescen
t
fixtures
in
the
operating
cab
area
provide
a
well
illuminated,
glare-free
area
for
the
operator
.
Cab
lights
and
ma
in
lights
are
controlled
by
separate
circuit
breakers.
Headlights
and
Tail
Lights
Two
sealed-beam,
60-watt
headlights
and
two
taillights
in
recessed,
weathertight
housings
are
provided
in
the
No.
lend
93
Figure
5-10.
Third
Rail
Power Pickup
94

of
each
car.
In
addi
t
ion,
two
15-wa
t t
red
lens
taillights
are
mounted
on
the
No.
2
end.
Hostling
and
Marker
Lights
Two
15-watt
hostling
lights
are
provided
on
the
No.
2
end
of
each
car.
They
have
clear
lenses
and
are
activated
by
a
separate
circuit
breaker.
Emergency
Lights
Each
SOAC
car
has
eight
incandescent
emergency
l
amps
powered
by
the
car
battery.
Emergency
lights
are
automat
i
cally
energized
if
the
mai n
light
circuits
are
interrupted
when
the
main
light
switches
are
on.
Six
emergency
lamps
are
located
in
the
overhead
center
l
ine
of
the
lighting
fixtures:
two
in
each
end
fixture,
two
in
the
center
fixture,
and
the
remaining
two
emergency
lamps
in
a
fixture
in
the
dropped
ceiling
area
of
each
car
end.
If
primary
power
is
interrupted,
headlights
and
taillights
remain
lighted
by
emergency
power.
Main
Lighting
Power
Main
lighting
power
is
provided
by
an
inverter
unit
mounted
under
the
car.
The
inverter
takes
the
battery
voltage
and
converts
it
to
500
volts
at
1500
cps.
5.10
HOSTLER
A
hand-held
hostling
control
box
(Figur
e
5-11)
is
pro-
vided
for
each
SOAC
car.
The
unit
is
stored
at
the
No.
2
end
of
the
car
behind
a
locked
panel.
The
three-position
switch
permits
selection
of
DRIVE, COAST,
or
OFF,
and
enables
the
operator
to
move
the
car
in
either
dir
e
ction
at
2
mph.
The
hostler
also
provides
an
emergency
stop
control.
5.11
WINDOWS
The
windshi
eld
,
supplied
by
Swedlow
Corporation,
is
formed
from
laminated
stretched-acrylic
safety
glass.
It
has
been
tested
to
withstand
a
pressure
loading
equivalent
to
a
car
speed
of
17
5 mph
and
will
withstand
the
impact
of
a
5-
pound
stone
at
50
mph
or
a
1-pound
stone
at
80
mph.
The
sid
e
windows
are
of
two
types.
The
low-density
car
features
1/4-inch
thick
dual-laminated
safety
glass
supplied
under
the
original
car
contract
by
Libby-Owens-Ford.
The
high-
density
car
sid
e
windows
are
3/8-inch
thick
tinted
plexiglass
acrylic
supplied
by
Rohm
and
Haas
for
demonst
r
ation.
95
C()
A
SY
EM
ERG
STO
P
Figure
5-
11
. Hostler
96

5.12
MONITOR
PANEL
The
SOAC
cars
have
a
"built-in"
troubl
eshoot
ing
capabil-
ity
for
the
important
propulsion
and
braking
system
parameters.
This
monitoring
unit
is
housed
in
a
metallic
case
and
contains
the
display
console
board,
the
solid-state
circuitry
necessary
to
drive
the
display
monitors,
and
a
50-foot
interconnection
cable
to
couple
the
unit
to
the
Propulsion
Power
Control
Unit
(PPCU) .
The
display
board
(Figure
5-12)
is
divided
into
four
sections:
1.
Operation
Annunicator
Section
This
section
displays
the
digital
logic
functions
of
the
drive
and
brake
system.
Each
of
the
display
functions
is
equipped
with
an
amber
lamp,
and
a
plug
jack
for
external
instrumentati
o
n.
2.
Parameter
Monitor
Section
This
section
functions
in
conjunction
with
the
channel
selection
knobs
and
the
meters
at
the
top
of
the
display
board.
The
green
parameter
lamps
indi-
cate
the
parameter
selected
by
the
channel
selector
knob
for
display
on
the
appropriate
meter.
Each
parameter
is
also
equipped
with
a
plug
jack
for
ex
-
ternal
instrumentation.
3.
Shutdown
Monitor
Section
This
section
of
red
lamps
indicates
the
initial
event
in
a
series
shutdown
caused
by
a
system
fault.
A
logic
monitor
card
located
in
the
propulsion
control
unit
contains
first
event
memory
circuitry
which
latches
on
to
the
first
event
and
clamps
out
all
of
the
secondary
ev
ents,
preventing
their
display.
4.
Power
Supply
Monitor
This
section
provides
a
self-contained
+15
or
-15
volt
calibration
power
supply
to
monitor
external
instrumentation
or
check
scale
deflect
ion
on
the
display.
5
.13
MOTORMAN'S
CONTROL
PANEL
The
motorman's
control
panel
contains
the
following
control
switches
,
buttons
and
indicator
s .
97
Figure 5-
12.
Monitor Panel
98

Pantograph
A
switch
on
the
console
controls
the
position
and
opera-
tion
of
the
pantographs,
through
trainlines,
on
both
cars.
The
control
positions
are
OOWN,
OFF
and
UP.
If
both
the
pan-
tographs
and
the
third-rail
shoes
are
installed
and
the
panto-
graph
is
in
the
UP
position,
power
collection
is
automatically
switched
to
the
source
that
has
power
or
the
source
that
first
supplied
power
if
power
is
available
from
both
sources.
Horn
The
horn
push
bar
l
ocated
at
the
bottom
of
the
lower
control
panel
operates
the
pneumatic
horn
at
the
operating
cab
end.
Reset
The
reset
pushbutton
is
used
to
reset
propulsion
system
and
motor-alternator
trips
from
the
cab.
Brake
Lights
The
brake
panel
consists
of
three
indicator
lights
and
a
two-position
knob
to
turn
the
snow
brakes
on
or
off.
The
lights
indicate
when
the
snow
brakes
and
air
brakes
are
on
(air
pressure
in
the
brake
cylinder)
and
the
handbrake
is
applied.
Coupler
Control
The
coupler
control
is
unlocked
by
its
key
switch.
The
air
lin
e
blowout
is
used
to
blow
out
dirt
from
the
end
of
the
pneumatic
lines
prior
to
coupling.
Mechanical
coupling
is
automatically
achieved
by
buffing
the
two
cars
togeth
e
r.
Electrical
coupling
is
accomplished
by
depressing
the
ADVANCE
button,
holding
it
down
for
20
to
30
seconds,
and
then
re-
le
asing
it;
a
procedure
which
advances
th
e
electrical
pins
in
the
electrical
coupler.
Uncoupling
is
effected
by
retrieving
the
pins
in
a
manner
similar
to
advancing,
but
using
t h e
RETRIEVE
button,
depressing
and
holdin
g
th
e
UNCOUPLE
button,
buffing
the
cars
together,
and
then
pulling
them
apart.
Th
e
ADVANC
E
and
RETRIEVE
buttons
also
operate
the
drum
switch
at
the
coupler
that
switches
the
trainlin
e
circuits
into
an
end-of-consist
or
middle-of-consist
confi
gu
ration.
The
coupler
control
in
th
e
cab
operates
only
th
e
coupl
er
at
that
end
of
the
car.
An
identi
c a l
control,
locat
ed
at
the
Bend
(behind
a
locked
swin
g
panel),
controls
the
B-end
cou-
pler
. On
the
SOAC
car
s
on
l y
th
e
B-
en
d
couplers
have
elec-
trical
couplers.
99

Communications
This
panel
allows
the
motorman
to
control
the
mode
of
operation
of
the
car's
communications
system.
The
motorman
can
select
radio,
intercom
or
public
address
modes;
the
hand-
set
is
used
in
all
three
modes
of
operation
.
The
b
uzzer
p
ush-
button
signals
to
the
pe
rson
in
the
o
ther
cab
to
answer
the
intercom.
The
radio
transmitter
light
indicates
when
the
transmitter
is
on.
The
cab/train
switch
allows
radio
messages
to
be
broadcast
directly
over
the
public
address
system,
or
only
over
the
cab
speaker.
End
Doors
The
B-end
door
can
be
either
locked
or
unlocked
from
the
cab
by
use
of
the
key
switch.
This
function
i s
trainlined;
the
indicator
light
is
on
when
the
doors
are
unlocked.
Side
Doors
The
Side
Door
Closed
li
ght
is
on
w
he
n
all
side
doors
are
closed;
un
ti
l
the
li
ght
i s
on
the
train
cannot
start.
The
Side
Door
Bypass
pushbutton
provides
a
means
to
move
the
train
if
one
of
the
doors
does
not
g
ive
a
proper
closed
signal
.
After
verifying
that
the
door
is
saf
e
ly
closed
the
motor
man
may
use
this
button
to
override
th
e
Door
-
Open
in
ter
l
ock.
The
bypass
button
must
be
pushed
ea
ch
time
the
controller
handle
is
moved
back
into
coast
or
brake
to
re
estab
lish
the
bypass
.
De
froster
A
two-speed
el
ectrica
ll
y
operated
de
frost
e r
mounted
behind
the
motorman
's
console
suppli
es
warm
air
to
t
he
w
ind-
shield.
Window
Washe
r
and
Wiper
A
two-position
rotary
console
switch
mounted
near
the
t
op
of
the
motorma
n's
control
panel
operates
the
electrically
op-
erated
window
washer
and
wiper.
Stops
are
provided
to
limit
the
wiper
blade
in
both
directions.
Speed
Indicator
The
SOAC
cars
are
equipped
with
a
digital
r e
adout
±1 mph
speed
indicator.
Th
e
speed
indica
t
or
panel
also
contains
the
spin-slide
and
speed-
fa
ul
t
indications.
100

6.
TEST
PROGRAM
The
SOAC
Test
Program
was
designed
to
assure
that
SOAC
systems
function
as
r
equi
red
and
that
specified
performance
is
achieved.
These
tests
consisted
of
component
and
subsystem
tests
and
vehicle
performance
tests.
The
component
and
sub-
system
tests
were
completed
at
S
t.
Louis
Car
prior
to
delivery
of
the
vehicles
to
the
High
Speed
Ground
Test
Ce
nter
in
Sep-
tember
1972;
acceptance
tests
were
completed
in
Apr
il
1973.
An
additional
Engineering
Test
Program
was
conduc
ted
(under
Transpor
tation
Systems
Center
(TSC)
Contract
DOT-T
SC-
580)
to
p
rovid
e
an
engineering
data
gathering
system
and
to
conduct
additional
tests
using
the
SOAC
vehicle.
These
tests
provided
an
opportunity
t o
acquire
a common
baseline
of
data
at
HSGTC
and
in
each
of
the
five
cities
where
the
car
will
operate.
Parameters
such
as
noise
l
evels,
ride
quality,
truck
loads,
and
vehicle
performance
charac
t
eristics
were
measured
and
will
be
used
to
compare
or
estab
li
sh
criteria
for
future
systems
such
as
the
Adv
anced
Concept
Train.
An
endu
ranc
e
test,
called
Simu
l
ated
Demonstration,
was
initiat
ed
at
~he
completion
of
the
Engineering
test
program
(Project
No.
I T
-06-00
26,
Contract
DOT-UT-10007).
The
accident
which
occurred
during
th
is
phase
of
testing
on
August
11,
1973,
prevented
completion
of
the
Simulated
Demonstration
until
April
1974.
6.1
COMPONENT
AND
SUBSYSTEM TESTS
Component
tests
perform
e d
and/or
analytically
substan
ti-
ated
prior
to
the
factory
rollout
are
as
fol
l
ows:
101

Component
Tests
Component
tests
performed
prior
to
factory
rollout
(AiResearch
Report
No.
73-9363,
Referen
ce
1)
included:
1.
Propu
l s i
on
and
Drive
System
Traction
motors
Smoothing
reactor
Input
reactor
DC-DC
chopper
Resistor
Bl
ower
cooling
Hos
tl
ing
control
Tru
ck
connector
Kn
if
e
switch
Speed
indicator
Jet
pump
Power
control
un
i t
Gearbox
and
coupling
P-signal
generator
Filters
and
ducts
Master
controller
Propu
l
sion
control
Auxiliary
power
control
System
testin
g
Motor
alternator
Upon
compl
etion
of
the
above
component
t
es
ting
the
entire
system
was
in
sta
ll
ed
in
a
laboratory
test
cell
and
tested
as
a
system
(s
ee
Fi
gu
r e 6
-1).
2.
Truck
and
Bolster
SOAC
truck
frame
GSI 3
4701
S/lJ
l,
which
had
been
cast
in
March
19
72,
was
selected
for
d
eterm
in
ation
of
the
structural
adequacy
of
t h e t
ruck
frame.
Testing
was
conducted
during
the
period
from
May 19
to
June
9,
1972.
During
the
stress
coat
test
a
port
io
n
of
the
truck
frame
wheel
piece
adjacent
to
the
side
beari
ng
dis-
played
a
marginal
stress
level
.
This
section
of
t he
truck
frame
was
reinforced
on
one
side
of
the
truck
frame,
and
on
the
center
portion
of
the
other
si
d
e.
Also
,
the
radius
of
the
side
bearer
adjacent
to
the
top
sur
f
ace
of
the
truck
frame
was
d
ete
rmin
ed
to
be
too
sharp,
and
was
chipped
and
ground
to
obtain
a
better
blending
of
th
e
sid
e
bearer
into
t
he
top
sur
-
face
of
the
casting
prior
to
the
strain
gage
t
est
.
102
k_
.
Figure
6-1.
Propulsion
and
Drive System Test Cell
10
3

Strain
gages
were
then
mounted,
and
loads
were
applied
with
hydraulic
rams
and
read
out
on
cali-
brated
hydraulic
gauges
and
load
cells
(see
Figure
6-2).
Table
6-1
shows
the
maxiMum
stress
levels
recorded
at
various
applied
loads.
TABLE
6-1.
TRUCK
FRA
ME
STRESS RESULTS
Loading
Condition
Vertical
load
• W
ith
tie
bars
•
Loose
tie
bars
Lateral
load
applied
to
non-serial
side
•
With
tie
bars
•
Loose
tie
bars
Lateral
load
applied
to
non-ser
ial
side
•
Nith
tie
bars
•
Loose
tie
bars
Outward
longitudinal
load
•
With
tie
bars
•
Loose
ti
e
bars
Downward
ver
tical
load
on
motor
mount
Upward
vertical
load
on
motor
mount
Lateral
load
on
motor
mount
toward
non-s
erial
side
Lateral
load
on
motor
mount
toward
seri
al
side
Applied
Load
(lb)
47,760
47,760
7,164
7,164
7,164
7,164
24,500
24,500
10,
351
17,811
24,137
10,351
17,811
24,137
6,720
11,600
6,720
1
1,600
104
Maximum
Recorded
Stress
(1000
psi)
Tension
Compression
+14.l
+15.0
+
2.7
+
2.7
+
2.1
+
2.1
+
4.8
+
9.3
+
4.8
+
8.
4
+11.
3
+18.6
+32.l
+43.8
-12
.0
-20.8
-13.
5
-23.
4
-16.1
-16.1
-
1.8
-
1.8
-
2.7
-
2.7
0
0
-1
5.9
-27.3
-37
.2
-
5.4
-
9.6
-
12.9
+14.7
+25.5
+12.3
+21.
3
Figure 6- 2. Typical Truck Frame Test
Setup
10
5

3.
Truck
Bolster
A
static
test
was
conducted
on
the
SOAC
bolster
(GSI
34702,
serial
2,
cast
date
April
1972)
to
determine
its
structural
adequacy.
The
recorded
stresse
s
were
concluded
to
be
satisfactory;
maximum
recorded
stresses
for
the
test
under
the
agreed
upon
loading
conditions
are
shown
in
Table
6-2.
TABLE
6-2.
TRUCK
BOLSTER
MAXIMUM
RECORDED
STRESSES
Applied
Maximum
Recorded
Stress
Loading
Load
(1000
psi)
Condition
(lb)
Tension
Compression
Vertical
load
42,600
+16.8
-
7.2
Lateral
load
6,225
+14.l
-
8.1
normal
car
height
Latera
l
loa
d
6,225
+
7.5
-13.5
shimmed
car
height
Longitudinal
6,390
+
4.8
-
5.7
Note:
Detailed
information
may
be
found
in
Volume
1
of
the
Component
Test
Report
(Reference
2).
4.
Windshield
The
SOAC
windshield,
similar
to
that
on
the
BART
Cars,
was
qualified
by
Sweddlow
Incorpora
t
ed
in
1970.
Qua
lificati
on
testing
consisted
of:
a.
Dropping
a
bag
of
lead
shot
weighing
11
pounds
from
a
height
of
16
feet
on
five
windshie
ld
·
panels.
Some
delamination
occurred
upon
impact
but
the
panels
remained
completely
in
tact
.
b.
Firing
aluminum
balls
(simulating
stones)
at
two
panels
at
speeds
of
50
and
80 mph . No
fract
ures
or
ejected
spalling
of
the
acrylic
structural
ply
occurred.
Vision
through
t
he
windshield
was
not
impaired
by
the
impact
.
106

Based
on
the
successful
testing
of
these
panels,
Boeing
and
St.
Louis
Car
waived
a
dd
itional
test-
ing.
(Additional
inf
or
mat
ion
may
be
obtained
fro
m
Sweddlow
Report
No . ETR
-010,
Reference
3.)
5.
Seats
SOAC
s
eats
in
the
low-
densi
ty
car
were
ma
nufactured
by
th
e
Ame
rican
Sea
ting
Company.
These
seats
are
similar
in
design
to
those
in
the
BAR
T
car.
Conse
-
quently,
no
addito
nal
testing
was
performed.
Test
data
on
s
eat
s
representa
t
ive
of
the
SOAC
configura
-
tions
r
eported
no
failure
or
deformation
when
40-pound
weights
were
d
ro
pped
on
the
seats
from
he i g
hts
of
6,
8,
10
and
12
i
nch
es
.
6.
Fire
Re
sis
tanc
e
of
Materia
ls
All
maj
or
interior
materia
ls
were
tested
for
fire
resista
nce.
The
sea
t
upholstery
met
t
he
r
equ
ir
eme
nts
of
Federal
Highway
Administration
Standard
No.
302,
Flammability
of
Vehicle
Interior
Materials
,
as
test
ed
by
t he
Am
erican
Seating
Company.
Remaining
i
nter
ior
items
wer e
tested
by
the
Boe
i
ng
Verto
l
Qua
lit
y A
ssur-
ance
Labo
rat
ory
to
a
more
stri
n
gent
specification,
Federal
Standard
No.
901.
The
thr
ee
items
which
failed
to
meet
F
edera
l
Standard
No.
191
were
n
ot
con
si
dered
to
be
potential
fire
haz-
ards
because
of
their
l
imited
usage
(i.e.,
My
lar
side
signs
and
window
g l
az
in
g
rubb
er
)
or
method
of
ins
ta
l-
lati
on
(i.e.,
l
eaded
viny
l
sheathing,
al
though
com-
bustible,
was
sandwiched
betw
een
the
floor
panels
a
nd
the
carpeting,
neit
h
er
of
which
support
combustion).
Subsystem
Functi
ona
l
Tests
Subsystem
Fun
ctional
Tests
performed
prior
to
facto
r y
ro
ll
out
a
re
as
fo
ll
ows:
1.
Car
body:
I
nc
ludin
g
jacking,
car
he
ight
adjustme
nt,
w
ater
test,
cu
r
ve
clearance,
and
cambe
r.
The
under-
frame
although
modifie
d
considerably
for
SOA
C w
as
shown
analytically
to
be
sim
il
ar
to
the
R-44
under-
f
ram
e
which
had
b
ee
n
successfully
t
ested
at a
com-
pr
ession
of
250,000
pounds
with
l
ess
than
SO-
percen
t
yield
and
at
400,000
pounds
with
less
t h
an
80-percent
yi
e l d .
2.
Li
ght
i
ng
3 .
Wiring:
C
onti
nuity
and
hypot
107

4.
Main
propulsion
control
5.
Weight
6.
Pantograph
7.
Air
systen
8.
Communications
including
public
address
system
9.
Door
operators
1
0.
Air
comfort
(hot
and
co
ld
room
tests):
When
the
tes
ti
ng
of
each
system
on
each
car
was
completed,
the
two
-car
train
was
made
up
and
retested
as
a
system.
6.
2
ACCEPTANCE
AND
ENGI:rnERING TES'l'S
AT
HSG
TC
The
UMTA
Rail
Transit
'.i'est
Track
A
ll
of
the
systems
tests
described
in
this
section
were
performed
on
UMTA'
s
Ra
il
Transit
Test
Track
at
the
DOT
High
Speed
Ground
Test
Center
in
Pueblo,
Colorado.
The
primary
ob-
jective
of
this
Track
is
to
facilitate
the
eva
luation
of
rapid
rail
veh
icles
.
The
Test
Track
is
an
electrified
9.1
-
mile
oval
of
six
different
track
construction
types.
For
performance
testing,
a
4000-foot
strai
g
ht
and
level
section
was
marked
and
used
to
facilitate
the
repeatability
of
t
est
points
as
required
.
Ride
quality,
truck
loadin
g ,
and
noise
tests
were
per
for
med
at
var
-
ious
locati
ons
on
the
track
in
order
to
ascertain
track
con
-
struction
e
ffects
(i
f
any)
on
test
results.
The
simulated
demonstration
tests
used
the
entire
oval.
Power
was
supplied
to
th
e
test
v
ehic
l e
from
the
third
rail
distribution
system
powered
by
a
modified
GE
U30C
loco-
motive.
The
temp
orary
power
source
was
barely
adequate
for
a
ll
singl
e-
car
tests;
consequently
,
no
two
-
car
train
maximum
per-
formance
test
s
could
be
com
pleted
.
The
Rail
Transit
Test
Track
is
almost
a
laboratory
testing
facility
for
transit
vehicles.
The
key
to
laboratory
testing
is
environmental
control
and
this
was
th
e
"modus
operandi"
for
the
acceptance
and
engineering
test
procedures
.
As
far
as
possible,
all
test
conditions
such
as
track
location,
power
settings,
and
ancillary
system
operations
were
co
nsist
en
tly
maintained;
and
only
t he
pa
ram
ete
r
und
e r
inv
e
sti
ga
tion
was
varied
. Ope
rati
onal
test
and
e
valuation,
on
the
oth
e r
hand,
will
take
p
lac
e
in
the
"r
ea
l
world",
where
many
conditions
will
be
varied
simultaneously.
As a r
es
ult,
operational
test
108

and
evaluation
test
procedures
and
reporting
systems
will
be
different.
Systems
Testing
The
systems
test
program
was
divided
into
four
phases:
vehicle
systems
testing,
vehicle
acceptance
testing,
engineer-
ing
testing,
and
simulated
demonstration.
The
purposes
and
methods
for
each
of
the
test
phases
were
as
follows:
1.
Vehicle
Systems
Tests
These
were
the
initial
tests
at
the
HSGTC
designed
to
functionally
check
and
evaluate
each
subsystem
as
it
was
integrated
into
the
overall
vehicle
operation.
To
perform
these
evaluations
it
was
necessary
to
set
up
each
car
to
its
specified
limits
(e.g.,
accelera-
tion,
deceleration,
braking
speeds).
During
this
process
numerous
design
and
fabrication
discrepancies
were
identified
and
subsequently
corrected.
This
period
or
phase
of
the
program
was
completed
in
February
1973.
2.
Vehicle
Acceptance
Tests
Having
set
up
both
cars
to
their
correct
operating
limits
and/or
specifications,
it
was
then
necessary
to
formally
compare
the
vehicle
performance
to
speci-
fication
and
guarantee
parameters.
The
evaluation
was
performed
on
ride
quality,
noise,
accel
e
ration,
deceleration,
braking,
speed
limiting,
service
duty
cycle,
and
radio
frequ
e
ncy
int
er
ference.
These
eval-
uations
were
based
on
a
single-car
criteria
at
an
operating
weight
of
105,000
poun
ds pe r
car.
The
SOAC
met
or
exceeded
all
speci
f
ication
guarant
e
es.
Tests
were
completed
in
April
1973.
3.
Engineering
Test
Program
Irranediately
following
th
e
acc
e
ptance
tests
a
compre-
hensive
engineering
t e
st
program
was
initiated
to
develop
a
data
base
for
understanding
ve
hicle
perform-
ance
and
operation
when
subjected
to
the
e
nvironment
and
characteristics
of
the
o
pe
ratin
g
properties.
This
data
base
was
also
to
be
dev
e
lop
ed
to
measure
improve-
ments
achiev
e d
during
t
he
ACT
pro
g
ram.
Th
e
program
was
designed
to
obtain
a
good
technical
understanding
of
the
SOAC
operating
limits
and
extreme
s ,
in
various
operational
conditions
such
as
supply
voltag
e
varia
-
tion
from
450
to
650
vdc
and
ve
hicle
weight
ranges
from
90,000
to
130,000
pounds.
Vehicle
acceleration,
deceleration,
spe
e
d,
braking,
rid
e
quality
and
noise
109

level
data
were
obtained
in
all
operating
conditions.
In
addition
to
a
variety
of
operating
limitations
im-
posed
by
facilities
and
env
iron
men
tal
conditions,
the
vehicles
were
evaluated
in
num
erous
failure
modes
(e.g.,
propulsion
and
b
rak
e
failures
were
tested
at
each
test
weight).
The
engineering
test
phase
was
completed
in
July
1973
.
4.
Simula
t
ed
Demonstration
Testing
This
phase
of
the
test
program
started
in
July,
1973
immediately
following
the
engineering
test
program.
The
objective
of
the
program
was
to
ensure
(to
th
e
extent
practical
at
HSGTC)
that
the
cars,
equipment
and
procedures
will
provide
trouble-free
operation
at
the
proposed
demonstration
sites.
Whereas
previous
testing
had
been
mainly
experimental,
this
test
was
intended
as
a
rehearsal
of
the
proced-
ures
and
proof
test
of
the
hardware
as
configured
for
the
five
demonstration
properties
.
Testing
was
halted
before
completion
by
an
acc
id
ent
in
August
1973
.
6.3
ACCEPTANCE
TEST RESULTS
The
SOAC
was
designed
to
meet
the
performance
require-
ments
of
the
specification
shown
in
Table
6-3.
Des
ign
car
weight
(empty)
is
90,000
pounds,
l
oaded
weigh
t
with
100
passengers
is
105,000
pounds.
TABLE
6-3.
PERFORMANCE
REQUIREHENTS
Max
im
um
speed
(l
evel
tangent)
Initial
acceleration
(nominal)
Nominal
deceleration
:
Blended
braking
(80
to
60
mp
h)
Bl
ended
braking
(60
to
6 mph)
Service
friction
braking
(40
to
O mph)
Emergency
friction
braking
(40
to
O mph)
Maximum
combined
dynamic
friction
braking,
l i
mit
e d
to
Jerk
rate,
normal
acceleration
and
braking
Balancing
speed
on
6000
feet,
3%
adv
e
rs
e
grade
Distance
travelled
in
20
secon
ds f
rom
standing
start
on
l e
vel
tan
ge
nt
track
110
80 mph
3.
O
mphps
-
2.7
mphps
-3.
0
mphps
-3
. 0
mphps
(
avg)
-3.
2
mphps
(
avg)
-3.
3
mphps
2.5
mphps
70 mph
700
feet

Compliance
with
the
specified
requirements
was
demon-
strated
during
the
acceptance
tests
on
both
high-
and
low-
density
cars.
A
brief
description
of
each
test
follows:
Acceleration
Acceleration
from
a
standing
start
to
700
feet
ranged
from
18.6
to
20.0
seconds
and
reached
acceleration
peaks
to
3.16
mphps.
Both
cars
wer e
checked
individually
and
in
a
train
con-
figuration.
The
test
data
(Table
6-4)
indicate
that
both
cars
have
essentially
th
e
same
acceleration
characteristics
within
the
accuracies
of
the
instrumentation.
Testing
of
the
train
configuration
during
acceleration
tests
was
inhibited
by
the
HSGTC
temporary
locomotive
generator
power
source
which
could
not
maintain
a
minimum
600-vdc
line
voltage
during
two-
car
train
acceleration
tests.
However,
testing
showed
that
acceleration
could
be
as
high
as
(or
higher
than)
3.0
mphps.
Braking
Braking
tests
were
conducted
on
the
l
eve
l
tangent
portion
of
th
e
HSGTC
test
oval.
All
brake
systems
(i.e
. ,
dynamic,
friction,
blended
and
emerge
ncy)
were
tested
in
both
single-
car
and
train
configuration.
Cars
were
also
tested
in
both
directions
to
conform
to
the
symmetry
of
the
configuration.
Test
data
are
summarized
and
compared
to
the
specification
in
Table
6-4.
Service
Duty
Cycle
A
severe
service
duty
cycle
t
es
t
performed
on
th
e
trac-
tion
system
and
friction
brake
systems
consisted
of
24
cycles
of
alternate
maximum
acceleration
to
80 mph
and
dec
eleration,
with
a
30-second
dwell
tine
between
cycles.
Brake
tread
tem-
peratures
were
monitored
t
hroughout
the
test
program,
and,
although
there
was
evidence
(smoke)
of
hot
brake
shoes
because
of
the
severity
of
the
test,
th
e
maximum
observed
wheel
tread
temperature
was
not
over
280°F.
Tests
were
performed
on
both
SOAC
cars.
Tests
were
also
planned
for
the
two-car
train,
but
beca
u
se
of
the
limitations
of
the
HSGTC
600-vdc
power
source,
two-car
train
testing
was
not
performed.
Noise
Interior
nois
e
levels
were
obtained
for
both
a
single-car
and
a
two-
ca
r
train.
Figure
6-3
summarizes
test
data
and
com-
pares
the
t
es
t
data
to
SOAC
specifications.
11
1

f-J
f-J
N
TABL
E 6- 4.
ACCEPTANCE
TEST RESULTS (1
05
,
000
-POUlm
CAR)
Speci
f
ication
Test
Parameter
Requirement
1.
Peak
(initial)
acceleration
rate
2 .
7-3.3
mph/sec
2.
Time
to
trav
e l
700
fe
et
from
a
standing
start,
level
tan
gent
track,
600V
20
sec
3.
Speed
on
a 3%
adverse
grade
70 mph
4.
Max i
mum
speed*
80 m
ph
5.
Dece
l
era
tion
rates
(p
ea
k)
• Bl
ended
service
2.7-3.3
mp
h/
sec
• Dynam
ic
only
2.7-3
. 3
mph/sec
•
Se
r
vice
friction
2.7-3.3
mph/sec
6.
Jer
k
rate
•
Acceleration
2.5
mph/sec
2
•
Braking
2.5
mph/sec
2
7.
Stopping
d
istance
(
fr
om
40 mph)
•
Blended
service
450
ft
•
Service
frict
i
on
450
ft
8.
Stopping
distance
(
from
80
mp
h)
•
Blended
service
2250
f t
•
Service
friction
2250
ft
9.
Emergency
braking
•
Stop
from
40 mph
425
ft
•
Stop
from
80 mph
2200
ft
•
Deceleration
rate
2.8
8-
3.52
mph/
sec
*
Maxim
um
speed
reached
d
uri
ng
testinq
was
92
mph .
**Ca
r
acce
l
erat
i
on
rates
were
adjusted
to
this
l
eve
l .
Results
Car
No.
1
Car
No . 2
3.0**
3
.1
6**
19.4
19.
0
>
75
>75
80
80
3
.2
3.2
3.0
3 . 0
3.1 3.2
1.
9 2
.3
2.9 2.6
430
44
5
440
425
1
650
1660
196
0
2000
365
350
16
30 1
600
3.
5 3
.4
2-Car
Train
3.0**
20.0
N/A
80
3
.2
3.1
3.2
1.8
')
. 6
430
420
1660
1925
335
1
635
3
.5

<{
CD
""Cl
..J
UJ
NOTES:
1.
TANGENT,
WELDED
RAIL
;
WOODEN TIES
2.
STEEL WHEELS
~
80
t---
~~~~~~~~~,:__--+--------1
3. MICROPHONE
AT
EAR
LEVEL
OF
SEATED
PASSENGERS
..J
Cl
z
:::,
0
(/)
Cl
END
SEAT
~
70
~~~~~~-----------t.,,,'-++-----1
I
l'.)
UJ
~
<{
CD
~
..J
UJ
>
UJ
..J
Cl
z
:::,
0 .
(/)
Cl
UJ
f--
I
S2
UJ
~
20
90
SOAC
80
._
90
,
000-LB
70
60
0
SI
NGLE
CAR
DATA
,
20
40
SPEED (MPH)
60
CENTER
SEAT
80
Figure 6- 3. Interior Noise Levels
I
EXISTING
CA
RS
-
f,t
IJ,J,o
NOTE
S:
1.
TANGE
NT,
WELDED
RAIL
;
WOODEN
TIE
S
2. STEE L WHEELS (PRIOR TO
RES
ILI
ENT
WHEEL
INSTALLATION)
3. MICROPHONE
50
FEET
FROM
TRACK
CENTERLINE
I I
40
60
80
100
SP
EED
jMPH)
Figure
6-4.
Wayside Noise Levels
11
3

The
SOAC
noise
l
evels
were
below
the
noise
goals
estab-
lished
during
the
design
phase.
Thes
e
levels,
shown
in
Figure
6-3,
were
attained
wi
th
little
or
no
direct
penalty
in
cost
or
weight.
Wayside
nois
e
produced
by
the
car
was
also
controlled
in
the
design
in
order
to
minimize
the
effect
on
the
environ~ent
(Figure
6-4).
Noise
levels
measured
during
test
confirm
that
this
objective
was
met.
Ride
Quali
ty
R
ide
quality
values
were
based
on
measurements
taken
on
the
HSGTC
t
est
oval
which
consists
of
variations
of
welded
and
jo
inte
d
rails,
concrete
as
well
as
wooden
ties,
and
different
ballast
configurations.
Th
ese
va
lu
es
are
defined
in
terms
of
accelera
tion
versus
frequency
and
are
compared
to
a
constant
comfort
design
goal.
The
values
shown
in
Figure
6- 5
were
ob-
tain
ed
through
impr
oved
truck
and
suspension
system
design.
Radio
Frequency
Interference
T
es
ting
to
determin
e
the
electromagnetic
field
strength
inside
the
SOAC
as
well
as
at
the
wayside
was
performed
at
the
HSGTC
on
Apr
il
2
and
3,
1973.
ns
shown
in
Fi
gur
e 6-
6,
test
data
i
ndicate
the
SOAC
is
within
field
lim
i
ts
from
a
frequency
range
of
150
KHz
to
40
0 MHz.
Since
there
was
no
substantial
noise
peak
within
the
car
body,
it
was
not
necessary
to
t
rack
down
corresponding
sources.
6.4
ENGINEERING TEST RESULTS
A
series
of
Engineering
T
es
ts
was
initiated
at
the
HSGTC
in
April
1973
and
completed
in
July
1973.
D
uring
this
period
the
SOAC
was
operated
throughout
the
range
of
it
s
capabilities
and
vehicle
responses
were
measured
in
the
fo
llo
w
ing
technical
areas:
•
Performanc
e
•
Rid
e
quality
•
Noise
l
evels
•
Truck
lo
ading
•
Voltage
transients
and
spikes
Details
of
the
tests
and
results
may
be
found
in
the
State-of
-
the-Art
Car
Engine
eri
ng
Test
Report
(Refe
ren
ce
4).
A
series
of
test
s
will
also
be
con
d
ucted
on
the
transit
properties.
11
4

.10
0
z .08
0
f-
.06
<(
.05
a:
w .04
...J
w
C..)
C..)
.03
<(
...J
<(
.02
C..)
~
a:
w
>
.01
0 .10
z .08
0
~
.
06
<(
.
05
a:
w .
04
_,
w
C..)
C..)
.03
<(
...J
<(
.02
a:
w
....
<(
...J
.01
" A
I I I /
SOAC
GOAL
V
6~
(VERTICAL)
r---.___.
/
A A "
6
6
1
'
\.
-'\.
I'.. 6 /
"
iv
2
!\..
"
~
-
~
6
"
I/
3
456
810
FREQUENCY (Hz)
I I I
SOAC GOAL
(LATERAL)
..
.........
/
"'
/
-
'\
70
-
1
001
~-
Lt 0
-
-\ V -
000
LI
I
mo
2
I\.
,..
-
3 4 5. 6 8
10
FREQUENCY (Hz)
Figure 6-
5.
Rid
e Qua
lity
11
5
20
30
/
/ V
20
30

120
110
100
90
....
80
I
~
e 70
---
>
::a.
a)
"O
60
50
40
30
0.1
=-------
' '
1.0
I SOAC
RADIATED
EMISSION
GOA
LS
---------
--
.--.,- -'
~
SOAC
RADIATED
EMI
SSION'
TEST RESULTS
10
FREQUENCY (MHz)
\ -
~
100
Figure 6-
6.
Electromagnetic Field Test Data
116
"'-
-
1
000

Performance
Test
Results
The
SOAC
car
was
tested
thr
o
ugh
out
its
operating
range
of
weight,
line
voltage,
controller
level
and
brake
subsystem,
as
well
as
in
sample
service
tests
to
define
power
consumption,
friction
brake
temperatures,
and
undercar
equipment
tempera-
tures.
Adhesion
levels
and
performance
of
spin-slide
control
systems
were
also
tested.
Summaries
of
the
performance
testing
follow
:
•
Acceleration
and
Service
Braking
Control
Characteristics
Fi
gure
6-7
illustrates
the
r
esu
lt
s
of
control
linearity
tests
fo
r
acceleratio
n
and
blended
braking
at
a
car
weight
of
105,000
pounds.
The
control
logic
of
the
SOAC
provides
ess
entially
proportional
control
of
tractive
effort
(acceleration)
throughout
th
e
speed
range
in
both
drive
and
brake.
In
the
drive
mode
the
tractive
effort
above
about
28
mph
is
proportional
to
the
maximum
capability
of
the
system
as
represented
by
the
P
-signal
of
1.0
amperes.
Braking
rate
is
essentially
constant
th
ro
ughout
the
speed
range.
The
curved
trend
is
due
to
the
tractive
resistance
of
th
e
car
at
speed.
The
maxi
m
um
capabil
-
ities
of
the
car
as
repres
en
ted
by
P =
1.0
and
0.0
amperes
are
within
the
specification
requirements.
Figure
6-8,
a
cross-plot
of
Figure
6-7
to
illustra
te
the
control
lineari
ty
,
shows
weights
from
90,000
to
113,000
pounds
as
well
as
b
oth
blended
and
friction
brake
data.
The
linearity
of
control
is
within
th
e
±10
percent
(full-scal
e)
band
de
sired
for
the
105,000-
pound
car
(and
generally
consid
ere
d
desirable
fo
r
all
weights).
The
tes
t
points
illus
trate
the
accuracy
of
the
closed-loop
tracti
ve
effort
control
lo
g
ic
of
the
Garrett
traction
system.
•
Acceleration
and
Service
Braking
Load-W
e
igh
Compensation
The
results
of
accelera
t
ion
and
braking
tests
at
car
weights
fro
m
90,000
t o
130,000
po
und
s
are
shown
in
Figu
re
6- 9
for
full
service
acce
l
eration
and
brakin
g .
Figure
6-8
shows
the
accuracy
of
the
l
oad
-w
eigh
system
for
weights
from
90
,000
to
113,000
pounds
at
both
full
and
one-half
input
commands.
When
not
limited
by
tracti
ve
power
(acc
e
lera
t i
on),
the
system
maintains
car
performance
within
the
desired
10-p
erce
nt
toler-
ance
band.
Th
e
fu
ll
acceleration
power
capability
of
11
7

u
UJ
U)
----
I
c..
NOTES
1.
CAR WEIGHT:
AW1
105,000
LB
(SINGLE CAR)
2.
LEVEL
TANGENT
TRACK
3.
30
-INCH WHEELS
4.
SOAC HSGTC ENGINEERING TESTS: RUNS 102, 142
"P"
SIGNAL
-AMP
~
2.0
t--
---
-+--~~~
+----
--+------+-
-----i
z
0
I-
<(
a:
UJ
__J
w 1.0
t---
---+---
--..3o,.+----/
.....
"""""'--
----
-+-------I
u
u
<(
u
w
U)
20
40
60
CAR SPEED (MPH)
80
0.375 AMP
I - 1.0
--
---
+----
---+-----
-+-
----=-
--+-
-
---1
c..
~
z
0
I-
0.25 AMP
<(
--
~
-2.0
t-t--
---
+----
---+-------
--
---
----1
__J
w
u
UJ
0
0.125 AMP
P = 0.0 AMP
(FULL
SERVICE)
Figure 6-
7.
Ac
celeration
and
Speed Response
to
Tractive
Effort
Response
118

u
w
(/)
---
I
Q..
~
z
0
I-
<(
a:
w
_J
w
u
u
<(
NOTES
1.
CAR SPEED 10
MPH
2.
LEVEL
TANGENT
TRACK
3. 30-INCH WHEELS
4.
SOAC HSGTC ENGINEERING TESTS:
RUNS 96, 102, 126, 142, 144, 146, 148,
151
CAR WEIGHT
3.0 90,000
LB
105,000
113,000
OPEN
SYMBOLS:
SOLID SYMBOLS:
SYMBOL
A
0
D
BLENDED
BRAKING
FRICTION
ONLY
BRAKING
I
ll'l
t--
-
--l---+---+-
--
+--
---+---
+---"-+-+-
1
__
±
100/o
1.0 (FU
LL
SCALE)
TOLERANCE
I
PROPULSION
1
0 I
l ....I
BRAKING
G -1.0
1------+
--+-
-
---#---
+-----1----1-----+----+
--
-+-
---+---1
w
~
I
Q..
~
z
0
j::
-2.0
1----+--
-+++-.,...,._-+--
-
t----+---~
--+----t---+----t
-l
<(
a:
w
_J
w
u
~
FULL
-3.0
lrlt---+-
_,_
-
1--1-SE
RV I
CE
-
--+
--
-+--
-
--+-
-+--
--+
--
~
0
0.1
BRAKING
0.2 0.3. 0.4 0.5 0.6 0.7 0.8
CONTROLLER INPUT,
"P"
S
IGNAL
(AMP
S)
Figure
6-8.
Control
Linearity
("P
" Signal)
11
9
0.9 1.0

NOTES
1.
CAR WEIGHT AS NOTED (SINGLE CAR)
2.
LEVEL
TANGENT
TRACK
3.
30
-INCH WHEELS
4. SOAC HSGTC ENGINEERING TESTS:
RUNS 96, 102, 126, 142, 146, 148,
151
5.
"P"
SIGNAL=
1.0 AMP
3.0
u
UJ
C/)
...._
105,000 I
0..
~
z 2.0 113,000
0 I
I-
<l::
130,000
a:
UJ
_J
UJ
u 1.0
u
<l::
0i-------+------..------+------+-----1
20
40
60
80
I I
CAR SPEED (MPH)
u
~
-1.0
-
----+---
- -
-+-------+------+----I
...._
I
0..
~
z
0
I-
"P
" = 0.0 AMP
(FULL
SERVICE)
~
- 2.0 ~ -
---
+--
-
--......-----
-r-
-----+---1
UJ
_J
UJ
u
UJ
0
- 3.0
130,000
LB
-----ir-----t---.;/L_
105,000
==-=-=-=-~=-=-=-=-=-~;r-:_~=_=_:==_:=r~i~
-113,~00 _
---
90,000
Figure 6- 9. Effect of
Ca
r
We
ight on Accelera
ti
on a
nd
Braking
1
20

the
SOAC
is
represented
by
the
105,000-pound
curve
of
Figure
6-9;
above
this
weight
acceleration
capability
is
reduced
in
proportion
to
car
weight
for
P =
1.0-
ampere
commands.
For
one-half
acceleration
command
(P =
0.75)
the
acceleration
rate
for
all
tested
weights
is
essentially
equal
as
shown
in
Figure
6-8.
Figure
6-10
illustrates
the
resulting
time-speed-
distance
characteristics
recorded
during
acceleration
tests;
the
data
shown
are
for
full-service
accelera-
tion
capability.
•
Acceleration
and
Service
Braking
Line
Voltage
Sensitivity
The
SOAC
was
tested
at
line
voltages
of
475,
600
and
650
volts.
Figure
6-
11
illustrates
the
acceleration
and
braking
test
results.
Figure
6-12
presents
the
associated
time-speed-distance
data.
The
SOAC
traction
control
system
uses
line
voltage,
as
measured
across
the
input
filter
capacitors,
to
deter-
mine
the
traction
motor
current
(torque)
limit.
The
system
was
designed
for
600
-
volt
op
e
ration,
and
arma-
t
ure
currents
are
limited
at
that
voltage.
Unlike
the
existing
series-wound
traction
motors,
the
SOAC's
separately
excited
motors
(and
control
system)
will
not
increase
their
output
at
higher
than
600-volt
line
input.
As
a
result,
the
600-
and
650-volt
accelera-
tion
rates
are
similar.
Below
600
volts
the
armature
curr
e
nt
limit
is
recali-
brated
by
the
control
system
in
pr
o
portion
to
the
voltage.
This
results
in
the
reduced
performance
shown
in
Figure
6-11
at
475
volts.
However,
the
top
speed
of
the
car
will
not
be
reduc
e d
below
80
mph.
The
blended
braking
ra
te
is
unaf
fe
cted
by
line
voltage,
as
noted
in
Figure
6-11.
•
Traction
Resistance
-
Drift
Test
Drift
tests
we
re
performed
to
de t e
rmine
the
traction
resistance
(force
versus
speed)
charact
e
ristic
for
use
in
the
analysis
of
wheel-rail
adhesion
test
data
and
to
develop
the
traction
f
orc
e s
associated
with
meas-
ured
acceleration
and
decel
e
rati
on
rat
es
.
Figure
6-13
presents
the
final
f a
ir
ed
curv
es
of
single-car
and
two
-
car
t e
st
da
ta.
Th
e
single-car
data
i s
the
primary
requirement
for
adh
e
sion
and
perform-
ance
data
analysis.
Th
e e
xistence
of
considerable
scatter
in
the
basic
data
may
be
due
to
data
reduction
12
1

I-
u..
0
0
0
...
LU
u
z
<!
I-
Cl)
0
NOTES
1. CAR WEIGHT AS NOTED (SINGLE CAR)
2.
LEVEL
TANGENT
TRACK
3. 30-INCH WHEELS
4. SOAC
HS
GTC ENGINEERING TESTS:
RUNS 96, 102, 126, 142, 146, 148,
151
5.
"P"SIGNAL=1
.
0AMP
5
SPEED
90
,000
LB
4 80
105,000
I
113,000
I
130,000 DISTA
NCE
3 60
90,000 LB
I
105,000
I
2 113,000
40
130,000
1 20
o-;._----'----
---+-------------- 0
80
0
20
40
60
TIME
(SECOND
S)
Figur
e 6-
10.
Eff
ect
of
Ca
r Weight
on
Time
and
Dist
ance
to
Speed
1
22
I
Cl..
~
0
w
w
Cl..
Cl)
a:
<!
u

NOTES
1.
CAR WEIGHT
AW1
105,000
LB
(SINGLE CAR)
2.
LEVEL
TANGENT
TRACK
3. 30-INCH WHEELS
4.
SOAC HSGTC ENGINEERING TESTS:
RUNS 102, 103, 104, 142, 143
5.
"P"WIRE=1.0AMP
6.
NOMINAL
THIRD
RAIL
VOLTAGE
3.0
u
UJ
(/)
-----
I
a..
2 2.0
z
0
I-
<(
a:
UJ
...I
UJ 1.0
u
u
<(
0 .....
-----+------+------+------+----1
u
UJ
(/)
-----
20
40
60
80
I
CAR SPEED (MPH)
~
.- 1.0
.,__-
---
-+-----
-+-
-
---
-+------+--
----i
2
z
0
1-
·
FU
LL
SER
VICE
~
COMMAND
~
-2.0
.,__---
-+-
--
-
--+---
---+----
-
-+-
- -
-I
w I 650
VOL
TS
~
600
VOL
TS
o 475 VOLTS
-3
.0
'----==:t:::::::::::::=:::::t:====:==--L_,.......--
+-
------,
Figure 6-
11.
E
ff
ect
of
Third
Rail Voltage
on
Acceleration and
Br
ak
ing
1
23

NOTES
1.
CAR WEIGHT
AW1
105,000
LB
(SINGLE
CAR)
2.
LEVEL
TANGENT
TRACK
3. 30-INCH WHEELS
4. SOAC HSGTC
ENGINEERING
TESTS:
RUNS 102, 103, 104, 142, 143
5.
NOMINAL
THIRD
RAIL
VOLTAGE
16 SPEED
80
~I
475 VOLTS
f 600 VOLTS
i= 12
LL
60
0
0
0 I
.-
0...
w
~
u
Cl
z DISTANCE w
<(
8 ·
40
w
I-
0...
Cl) Cl)
Cl
0:
<(
u
475VOLTS
4 20
600
VOLTS
0 0
0
40
80
120
TIME
(SECONDS)
Figure 6-
12.
Effect
of
Third
Ra;/ Voltage
on
Time
and
Distance
to
Speed
124

NOTES
1. CAR WEIGHT 105,000 LB
2.
AVERAGE
OF
Bl-DIRECTIONAL
RUNS
3. LEVEL
TANGENT
TRACK
4. 30-INCH WHEELS
5. SOAC H
SGTC
ENGINEERING TESTS:
RUNS 102,
121
6.
ZE
RO WIND
2000.------
-r------.---
---
-,-
--
----,.-
---,
1600
SINGLE CAR
(TEST
FAIR
ING)
en
...J
cc
1200
<(
u
cc
w
a..
LU
u
z
<(
800
f-
TWO-CAR
(jJ
(jJ
TRAIN
LU
cc
(TEST
FAIRING)
400
o
___
___
..._
__
__
.__
___
__.
_____
_ _ _
0
20
40
60
80
CAR SPEED (MPH)
Figure
6- 13. Traction Resistance
125

details
of
the
tape
recorded
time-speed
data.
The
test
fairin
g
is
considered
sufficiently
accurate
for
use
with
adhesion
data.
The
1890
pounds
of
resistance
at
80
mp
h
represents
a
coasting
deceleration
rate
of
0.37
mphps
for
the
105,000-pound
car.
•
Friction
Brake
System
-
Duty
Cycles
Thes
e
tests
consisted
of
decelerations
at
various
controll
er
i
nputs
and
car
weights
and
simulated
sched-
ule
servic
e
using
duty
cycles
similar
in
severity
to
those
found
on
the
SOAC
test
and
evaluation
routes
in
New
York
and
Cleveland.
A
summary
of
service
brake
control
lin
earity
was
shown
in
Figure
6-8
for
three
car
weights
and
se
ve
ral
controller
inp
uts.
The
system
accuracy
is
within
the
desired
10-percent
band.
The
two
duty
cycles
tested
are
summarized
in
Table
6-5,
along
with
t
he
two
rout
es
simulated
.
Results
of
tests
with
Duty
Cycles
I
and
II
with
solid
steel
and
resilient
aluminum-c
ente
r
wheels
are
shown
in
Figure
6-14.
As
noted,
the
maximum
temperature
difference
between
wheel
types
occurs
ea
rly
in
the
simulated
service
route
and
is
between
30
to
40°F.
Final
tem-
perature
diff
erences
are
less
than
20°F
at
th
e
end
of
the
cycles.
For
the
two
routes
simulated,
the
resil-
ient
wheels
ha
ve
sufficient
therma
l
capacity
for
normal
service
opera
ti
on
w
ith
disabled
dynamic
brakes.
Energy
consumption
w
as
record
ed
during
both
duty
cycles
and
i s
presented
in
Table
6-5.
• Powe r
Consumption
-
Synthetic
Transit
Rout
e
Schedule
s
ervi
ce
performance
in
terms
of
powe
r
con-
sumption,
schedu
l e
spe
ed
,
and
undercar
equipment
tempe
ratures
were
evaluated
during
sample
service
runs
on
a 9 .
25-mile,
15
-stat
ion
transit
route
at
HSGTC.
(Figur
e
6-15
shows
the
struc
tur
e
of
the
syn-
thetic
route.)
Station
spacings
va
ry
from
0.25
to
1.5
miles;
top
speeds
from
40
to
80
mph.
The
rout
e
was
run
from
Station
A
to
Station
O
and
return
for
each
round
trip.
Table
6-6
presents
t he
results
for
each
station
sp
ac
in
g
and
for
each
round
trip.
SOAC
power
consum
ption
averages
1
2.
43
kw-hr
per
car
mile
for
the
route,
including
approximate
ly
34 kw
of
aux-
iliary
power.
This
sam
e
route
wi
ll
be
used
during
testin
g
of
the
ACT-1
vehic
l
es
which
are
expec
t
ed
to
reduc
e
th
e
power
consumption
by
as
much
as
40
percent
at
an
equal
performance
level.
126

NOTES
1.
30-INCH WHEELS
2. SOAC HSGTC
ENGINEERING
TESTS:
RUNS 117,141
u.
DUTY
CYCLE I
~
300
...---...---.....-----.----,---r----r--.------i
UJ
0:
:J
I-
<(
0:
UJ
c..
RESILIENT
WHEELS
\
~
200
~----h,~
-
t--7,,£--+--
--,1----t-
--1---t---
UJ
I-
~
_J
:J
co
WHEELS
~
100
~--+--t----t-
----,
- -
-+-
----t
--
i-
-
--,
UJ
0:
1-
_J
UJ
UJ
I
~
0 5
10
DUTY
CYCLE
11
15 20
25
30
35
40
STATION
STOPS
DUTY
CYCLE
1.
ACCEL
TO
35
MPH
AT
SERVICE
RATE
2.
MAINTAIN
35
MPH
FOR 45 SECONDS
3.
APPLY
FU
LL
SERVICE
FRICTION
BRAKING
4.
STATION
DWELL
30SECONDS
5.
REPEAT
TO
STABILIZE
TEMP
OR
MAXIMUM
38
STOPS
400...--
-.---
;----c-----,--~
-
-.
---,---
-.
-
--,
DUTY
CYCLE
u.
0
UJ
0:
:J
I-
<(
RESILIENT
WHEELS
~
300~
-
-+-
--
i---'-1\,-+--
--,
f-,,,"£:.._
-t-
~~
-
--+-
----t-
-"'1
0....
~
UJ
I-
~
_J
:J
fO
200~
- ~ - 2fl'C--i----~-
----li----+---
--+
--
+-
-
-----t
-
-"1
0
<(
UJ
0:
1-
_J
UJ
UJ
I
~
0 2 4 6 8
10
12 14 16
18
STATION
STOPS
Figure 6-
14.
Wheel Temperature
1 27
1.
ACCEL
TO
50
MPH
AT
SERVI
CE
RATE
2.
MAINTAIN
50
MPH FOR 55
SECONDS
3.
APPLY
FULL
SERVICE
FRICTION
BRAKING
4.
STATION
DWELL
30SECONDS
5.
REPEATTO
STABILIZE
TEMP OR
MAXIMUM
17
STOPS

---
NOTE:
DISTANCE
IS
9.25
MILES
FROM
A
TO
0
KEY
0
STATIONS
380
370
IV
320
310
0 SPEED
LIMIT
BETWEEN
STATIONS
280
TRACK
SECTION
NUMBER
11
TRACK
SECTION
Ill
Figure 6- 15. ACT-1
Synthe
ti
c Transit
Route
12
8
100
110
·
120
160
170
G

TABLE
6-5.
SUMMARY
OF
FRICTION
BRAKE
DUTY
CYCLE
TESTS
Test
Parameter
Distance
(miles)
Schedu
led
time
(minutes)
No.
of
start-stop
cycles
New
York
(NYCTA)
8th
Ave.
22.5
68
38
1.69
Pueblo
Duty
Cycle
I
21.8
65
38
1.
74
Route
cieveland
(CTS)
A
irp
ort
19.0
36
17
0.9
Pueblo
Duty
Cycle
II
17.9
38
17
0.
95
Stops
per
mile
Maximum
speed
(mph)
35
(est
avg)
35
(actual)
52
(est
avg)
50
(actual)
Schedule
speed
(mph)
Measured
maximum
tread
bulk
temperatures
(°F)
•
Solid
•
Resilient
Energy
consumption
(kw-hr/car-mile)
19.
8
(est)
N/A
N/A
20.1
264
282
6.70
129
31.
6
(est)
N/A
N/A
28.2
350
350
6.60

Equipment
temperatures
within
undercar
enclosures
were
measured
during
the
power
consumptio
n
test
cycles.
Peak
recorded
temperatures
are
shown
in
Table
6-7
corrected
to
a
125°F
ambient
air
tempera-
tur
e
(SOAC
design
specification).
The
reduced
power
consumption
recorded
during
friction
brake
duty
cycles
(see
Tabl
e
6-5)
can
be
expected
dur-
ing
the
SOAC
demonstration
on
existing
properties.
•
Spin-Slide
Protection
System
Performance
Tests
of
spin-slide
system
characteristics
were
con-
ducted
in
drive
and
brake
modes
on
wetted
rails
us
ing
blended
brakin
g ,
dynamic
only,
and
service
friction
brakes.
Table
6-8
summarizes
the
efficiencies
of
the
spin-
slide
systems
in
various
modes,
covering
averages
of
many
test
runs
initiated
at
sp
eeds
from
80
to
20
mph
in
braking.
From
an
initial
spe
ed
of
40 mph
the
aver-
age
efficiency
of
the
blended
braking
system
is
greater
than
82
perc
e
nt,
which
exceeds
the
80
percent
goal
of
the
desi
gn
sp
e
cification.
As
noted
the
effi
-
ciency
is
also
greater
than
80
percent
in
the
acceler
-
ation
mode.
The
lo
wer
efficiency
of
the
service
friction
air
brake
subsystem
is
primarily
due
to
the
slower
response
of
the
air-operated
tr
e
ad
brak
e
units.
•
Wheel-Rail
Adhesion
The
level
of
adhesi
on
associated
with
the
SOAC
on
t
he
HSGTC
test
oval
was
measured
during
single-truck
fric
-
ti
on
braking
tests
on
we
tted
jointed
rails.
The
wet-
ting
agent
used
was
similar
to
that
used
during
spin-slide
tests.
(Deta
i
ls
are
contained
in
Part
8.)
The
two
levels
o f
adh
e
sion
noted
on
Figure
6-16
are
due
to
different
mixing
criter
i a
with
the
same
wetting
agent.
These
results
suggest
the
level
of
caution
to
be
exercised
during
any
future
wetted
rail
adhesion
or
spin-s
lide
testing.
Since
spin-slide
performance
cal-
culations
are
relativ
e
to
the
actual
adhesion
obtained,
the
efficiency
values
o f
Table
6-8
are
considered
valid
as
averages.
The
design
acceleration
and
decel
e
ration
rates
of
the
SOAC
(±
3.0
mphps)
represent
an
adhesion
demand
of
0.1367.
This
level
is
not
obtainable
on
an
oiled-
wetted
rail
as
r e
pres
e
nt
e d by
"complete
mixing"
(Figure
6-16)
but
is
avai
l ab
le
up
to
about
38
mph
on
an
essentially
clean,
we t
rail
as
represented
by
"Incomplete
Mixin
g
of
We
tting
A
gent."
130

NOTES
1.
CAR
WEIGHT
AWO
90,000
LB
2. WET
RAILS
3.
LEVEL
TANGENT
TRACK
4.
30
-INCH WHEELS
5. SOAC HSGTC
ENGINEERING
TESTS:
RUNS 100, 151
6.
ENTRY
SPEED
SYMBOL
20
MPH 6
40
MPH 0
60
MPH 0
80
MPH
◊
OPEN SYMBOLS:
RESILIENT
WHEELS
SOLID
SYMBOLS:
SOLID
WHEELS
0.3
~---~----~----~------,
(.'.)
z 0.2
t--
-
-----1-------r-
INCOMPLETE
MIXING
; OF
WETTING
AGENT
w
1-
w
...J
0...
~
o 0. 1 ~ ~
-..a.:i..'nr-+--
--------t--
------ir---
---'\F'"'"-1
(.)
COEFFICIENT
OF
ADHESION(µ)
0
.__
___
___.
____
__.._
____
__,_
___
_
.....,
0
20
40
60
80
CAR
SPEED (MPH)
Figure
6-16.
Wheel Adhesion
131

TABLE
6-6.
SUMMARY
OF
SOAC
ENERGY
CONSUMPTION
ON
ACT-1
SYNTHETIC TRANSIT
ROUTE
Data
From
Test
Run
153
Two-Way
Energy
Maximum
(kw-hr*)
Station
(Two
Speed
Distance
Directions)
(mph)
(Miles)
To
t a l
Per
Car-Mile
A
to
B
60
.75
9.35
12.47
B
to
C
70
1.00
11.55
11.
55
C
to
D
50
.5
0
6.25
12.50
D
to
E
60
.75
9.15
12.20
E
to
F
50
.50
6.25
12.50
F
to
G
40
. 2 5
4.00
16.00
G
to
H
40
.25
4.00
16.00
H t o I
50
.50
6.20
12.40
I
to
J
80
1.
50
1
6.20
10.
80
J
to
K 80
1.
25
14.70 11.76
K
to
L
40
.
25
4.10
16.40
L
to
M
50
.50
6.55
1
3.
10
M
to
N
40
. 2 5
4.40
17.60
N
to
0
70
1.00
12.25
12.25
18.5
Mile
Total
229.9
12.43
(x2)
Schedule
Speed:
27.8
mph
Data
From
Test
Run 1
49
18.5
Mile
Total
235.
1
12.71
Schedule
Speed:
27
. 3 mph
(Numerous
spin-slides
on
wet
rails)
*Includes
34
kw
auxiliary
power.
132

TABLE
6-7.
SUMMARY
OF
UNDERCAR
EQUIPMENT
TEMPERATURES
FOR
SYNTHETIC TRANSIT
ROUTE
(105,000-POUND
CAR)
Parameter
Propulsion
Blower,
Outlet
Air
Chopper
Box,
Interior
Air
Chopper
Box,
Outlet
Air
Traction
Motor,
Outlet
Air
Traction
Motor,
No.
3
Frame
PCU,
Interior
Air
PPCU,
Interior
Air
APCU,
Interior
Air
Motor
Smoothing
Reactor
Brake
Grid
Air
Motor-Alternator,
Out
l
et
Air
Air
Conditioner,
Condenser,
Input
Air
Test
Ambient
Air
NOTES
Peak
Temperature
(OF)
No.
Run
149
Run
153
4
135
146
8
141 150
3
142
148
12
183 182
1
151
151
6
147
156
9
178
177
10
155 165
7
167
166
5
820
(2)
850
(2)
11
1
69
168
2
162
157
75 79
(1)
Adjusted
to
125°F
ambient
SOAC
design
g
oal.
(2)
Peak
recorded
temperature
during
brake
applications.
(3)
Performance
level
-
Duty
Cycle:
approx
1-hour
rating
PCU
=
Power
control
unit
PPCU
=
Propulsion
power
contro
l
unit
APCU
= Au
xi
liary
power
control
unit
13
3

TABLE
6-8.
SUMMARY
OF
WHEEL
SPIN-SLIDE
SYSTEM
EFFICIENCIES*
(90,000-POUND
CAR)
Braking
Mode
(Speed
Range
80
to
10
mph)
•
Blended
Braking
•
Service
F
riction
Braking
•
Dynamic
Braking
Only
78.5%
63.4
%
77.4
%
Accelerating
Mode
(Speed
Range
Oto
35
mph)
•
Full
Power
Acceleration
(soli
d
wheels)
Efficiency
=
Actual
Deceleration
Rate
Av
e
rage
Available
Decele
rati
on
Rate
*Based
on
soli
d
and
resilient
whe
el
data.
Ride
Quality
Test
Res
ults
82
%
The
ri
de
quality
vibrat
ion
data
were
recorded
on
analog
tapes
and
lat
e r
digitized
to
obtain
spectrum
analysis
and
pow-
er
spectral
density
curves.
The
purpose
for
this
series
of
tests
was
to
provide
an
understanding
of
th
e
car
body
motions
during
operations.
Spectrum
analysis
and
a
power
spectral
densi
ty
permits
identification
of
vibration
contribution
from
known
modal
cha
racteristics
of
the
car
body
structure.
Th
e
spectrum
analysis
and
power
spec
t
ral
density
curves
for
the
midcar
centerline
vertical
l
ocation
are
shown
in
Figure
6-17.
Both
curves
indicate
that
p
ea
k amp
litud
es
occur
at
the
follow-
ing
frequencies
:
•
Response
from
a
rigid
body
suspension
mode
•
First
car
body
vertical
bending
mode
• Se
cond
car
body
vertical
bending
mode
•
Component
indu
ced
vibration
134
1.5
Hz
7.5
Hz
15.0
Hz
30.
0
Hz

.....
I
0
><
(.!)
w
0
::,
I-
0.
30
0.20
...J
a..
0.10
~
<(
~
NOTES
1. SPEED
80
MPH
2.
TRACK
SECTION I
3. GROSS
WEIGHT
105,
000
LB
4.
HIGH-DENSITY
CAR
5.
RESILIENT
WHEELS
SOAC REQ
69
REC 1704
MID
C/ L VER
<(
w
a..
0.
00
[.!_:.:..L___LL__L_C::::::::::t::=:.JL..::..-L__J-=:...L..:=::::i:..._i
N
I
0
...
~
0.30
I
......_
N
(.!)
-
~
0.
20
(/)
z
w
0
....1
0.
10
<(
a:
I-
0 10 20
30
40
50
FREQUENC
Y (Hz)
S
OA
C REQ
69
REC 1704
M
ID
C/ L
VER
CJ
w
a..
C/l 0.00
LL!
.....
L..I
.........
Ll.,
_____
..t..J..._
......
_.,..
___
...._.......J
a: 0
w
=s:
0
a..
10
20
30
40
FREQUENCY (Hz)
Figure 6- 1
7.
Rid
e Quality T
est
Baseline Data
1
35
50

The
filter
bandwidths
for
the
spectral
density
and
spectrum
analysis
were
0.20
Hz
in
the
Oto
10-Hz
range
and
1.0
Hz
for
frequencies
above
10
Hz.
These
comparison
plots
show
the
effect
on
vehicle
vibra
-
tion
levels
of
sp
eed
,
track
section,
car
weight,
and
train
consist.
Results
of
the
SOAC
testing
show
that
for
the
HSGTC
test
track,
the
car
body
vertical
g
levels
provide
the
best
indica-
tors
for
evaluating
the
effects
of
speed,
weight,
and
other
variables
on
passenger
ride
qua
lity.
Car
body
lateral
accel-
erations
are
low
and
general
ly
insignificant,
as
are
the
lon-
gitudinal
accelerations.
This
situation
is
reversed
for
the
truck
where
the
lateral
acceleration
s
are
much
larger
than
the
vertical.
The
car
body
underframe
is
very
rigid
laterally,
however,
and
shows
very
little
response
to
lat
e
ral
inputs
from
the
trucks.
•
Speed
Effects
Figure
6
-18
is
representative
of
th
e
SOAC
midcar
vibration
characteristics
at
various
speeds.
The
vertical
vibration
resulting
from
the
15-Hz
second
ver
tical
bending
mode
increases
signif
icantly
at
80
mph
while
the
response
from
the
first
vertical
bending
mode
is
predominant
at
45
mph.
Forward
car
vibration
characteristi
cs
are
shown
in
Figure
6-19.
Response
to
the
rigid
body
suspension
f
requency
(1.5
Hz)
increases
significantly
at
55
mph.
Although
the
rigid
body
suspension
mode
is
predominant
here,
responses
from
the
first
(8
Hz)
and
second
(15
Hz)
vertical
bending
modes
which
dominate
the
midcar
characteristics
are
evide
nt
at
45
and
80
mph,
r
espectively.
Vert
ical
journal
box
accelerations
are
not
affected
by
speed.
Lateral
acceleration
levels,
h
oweve
r,
are
significantly
higher
than
ver
tical
l
evels
and
reach
their
peak
amplitudes
at
80
mph.
Figure
6-20
shows
the
effect
of
speed
on
journal
box
accelerations.
• W
eig
ht
Effects
Midcar
vertical
accelerations
are
significantly
reduced
with
increased
car
weight
.
The
effect
of
increased
car
weight
on
the
predominant
forward
car
(rigid
body)
frequency
(1.0
to
1.5
Hz)
is
opposite
to
the
effect
on
the
predominant
midcar
frequencies.
136

.12
-------
-----
~---
--r-
-------,
NOTES
1.
MID
CAR
CENTERLINE
VERT
2.
RESILIENT
WHEELS
3.
HIGH-DENSITY
CAR
4. GROSS
WEIGHT
90,000 LB
w .08 5.
TRACK
SECTION 1
§ 6.
KEY
I-
-1.5 Hz
~
---
8.0
Hz I
I
~
- ·- 15.0 Hz
~
.04
.____
- _
--
_
30
.0 Hz -
----+-''---
~
--
+-~/
__
----l
~
\ I
a..
----;
--~---7---
_..J
0
.,__
___
--1,
____
__,L.
____
....i....
___
____.
0
20
40
60
80
CAR SPEED (MPH)
.
008
~
---~
----~
----.......----
~
N
I
....._
N<:J
.
006
I \
>-
I-
I \
(J)
z I \
LU
0 I \
~
.004
\
c::
I-
\
u
LU \
a..
(J)
\
c::
/
LU \
~
.002 \ .
a..
\ /
.
0
---------1=.:..=..:..::.:..::=:..==-:..:=~....i.......;;..=-,__,.=--,j
0 20
40
60
80
CAR
S
PE
ED (MPH)
Figure 6- 18. Ride
Quality
Baseline Comparison:
Eff
ect
of
Speed
137

.12
----------.-----..----
-
----------,
NOTES
1.
FWD
CAR CENTERLINE
VERT
2. RESILIENT WHEELS
3.
HIGH DENSITY CAR
4. GROSS WEIGHT 90,000
LB
LU
.08 5.
TRACK
SECTION 1
0
::>
6.
KEY
t-
-1.5 Hz
.....J
a..
---
8.0
Hz
~
-·
-15.0
Hz
~
-·-30.0
Hz
<(
.
04--+----
-
-+-------+----
-
-+
-
-------i
LU
0.
N
I
-
N
{!)
-
>-
t-
Cf)
z
LU
0
.....J
<(
er:
t-
u
LU
0.
f./)
cc
LU
~
0
0.
0 20
40
60
80
CAR
SPEED
(MPH)
.006
.004
.002
'
0 0
20
40
60
80
CAR SPEED (MPH)
Figure 6-
19.
Ride
Quality
Baseline Comparison:
Effect
of
Speed
13
8
15.0 Hz

1.00
-
_vi
c.,
.80
UJ
Cl
::,
f--
_J
.60
a..
~
<(
:::.::'.
<(
.40
UJ
a..
.20
NOTES
1.
FWD
AXLE
R/H JB
FRONT
TRK.
LAT.
2.
RESILIENT
WHEELS
3. HIGH
DENSITY
CAR
4. GROSS WEIGHT 90,000 LB
5.
TRACK
SECTION I
6.
KEY
-35MPH
·
········
45
MPH
.
--
--80MPH
,1
fl
~
I I
/ I
/ I
I I
t
,,
II
) I
I I
, \
I I
I
'v"
I I
,1
~
'I
I I I / \
I
,,
I I \
I I \ / I
I I
I I I
I/
I
"
' I
I I
/ I
I I
II
J I
I I I I I \
\ ,
I
1•
\ I
I t
,,
1,
I I/
FREQUENCY (Hz)
~
/ I
I \
I I
I I
,"J
I
,
Figur
e 6- 20.
Ride
Quality
Baseline Comparison:
Effect
of
Speed
1
39

Journal
box
accelerations
showed
little
change
with
car
weight
variation
excep
t
for
lateral
acceleration
at
45
mph
wh
ich
increase
d
at
a
weight
of
105,000
pounds
compared
to
90,000
pounds.
•
Track
Effects
The
UMTA
test
oval
at
HSGTC
employs
six
different
trac
k,
tie,
fastener,
and
ballast
combinations.
Com-
parative
vibration
data
wa
s
taken
for
each
track
section.
No
identifiable
trend
in
ride
quality
was
attributable
to
the
type
of
track,
ties,
fasteners
or
ballast
.
Track
Section
I
gave
the
lowest
midcar
ver-
tical
vibration
and
the
highest
forward
car
ver
tical
v
ibration
.
•
Train
Consist
Ef
fects
Comparative
vibration
da
ta
was
taken
for
the
single
(high-d
ensity)
car
and
for
the
two-car
train.
In
examining
the
car
body
vertical
accelerations
and
looking
at
the
predominant
frequency
or
frequencies
for
six
cases,
three
show
lower
vib
ration
levels
for
the
two-car
train,
one
shows
a
lo
we
r
level
for
the
high-density
car
and
two
show
no
differ
ence:
Sensor
Location
(in
Car)
Forward
Middle
Middle
Forward
Middle
Middle
Predominant
Frequency
(Hz)
1.5
7.5
15.0
1.5
7.5
15.0
Lower
V
ibration
Same
Train
Same
Train
Train
High
density
car
As
previously
noted,
the
l
atera
l
accel
e
rations
on
th
e
truck
are
much
larger
than
the
vertical
accelerations.
Comparing
lateral
acceleration
data
on
the
front
truck
journal
b
ea
ring
for
th
e
single
high
-d
ens
ity
car
and
th
e
two-ca
r
train
at
35,
45,
and
80
mph,
the
35
and
80-mph
conditi
ons
show
significantly
lower
truck
lateral
vibration
for
the
two
-ca
r
train
across
the
fr
equency
spectrum.
The
45-mph
condition
shows
e
sse
n-
tially
the
sam
e v
ibratio
n
level
for
the
tw
o
consists
from
Oto
25
Hz,
with
the
sing
l e
high
-de
nsity
car
lower
at
frequenc
ies
from
25
to
50
Hz.
In
general,
running
with
tw
o
cars
coupled
together
appears
to
reduc
e
vibrat
i
on
l
eve
ls
and
to
improve
ride
quality.
140

Interior
Noise
Levels
Interior
noise
level
measurements
of
the
SOAC
were
made
to
define
its
acoustical
characteristics.
These
tests
resulted
in
the
accumulation
of
over
500
data
points
showing
the
con-
tribution
of
speed,
track
construction,
wheel
configuration
and
equipment
on
noise
levels
at
various
interior
locations.
Some
of
the
data
points
were
subjected
to
one-third
octave
band
and
narrow
band
analysis
in
order
to
determine
the
com-
position
of
the
associated
noise
levels.
The
analyses
showed
that
the
interior
noise
levels
are
a
function
of
undercar
equipment,
the
air
comfort
system
blowers,
and
the
wheel/rail
interaction.
When
the
car
is
at
rest
or
below
25
mph,
the
undercar
equipment
and
blowers
are
the
pre-
dominant
contributors
in
the
"A"
weighted
noise
spectra.
Above
25
mph
the
wheel/rail
interaction
becomes
significant
and
is
a
function
of
wheel
construction
and
tir
e
surfac
e
quality.
The
effect
of
speed
on
noise
lev
e
ls
for
four
different
car
interior
locations
is
shown
in
Figure
6-21.
It
is
significant
that
the
SOAC
vehicle
falls
5
to
7 dBA
below
the
design
goals.
The
effect
of
wheel
configuration
on
noise
levels
is
shown
in
Figur
e
6-22.
Below
25
mph,
all
th
e
wheel
configura-
tions
are
within
1
to
2 dBA
of
each
other.
As
speed
increases,
the
flats
on
the
steel
wheels
become
a
major
noise
source.
The
full
advantage
of
th
e
Acousta
Fl
ex
wheels
is
not
evident
in
this
figure:
the
data
shown
was
obtained
at
steady
speeds
on
tangent
track,
and
the
Acousta
Flex
whe
el
is
designed
to
damp
high
freq
uency
noi
se
,
such
as
generated
in
tigh
t
turns.
The
full
effect
of
the
resilient
wheels
will
be
measured
in
the
cities.
Wayside
Noise
L
evels
As
with
the
interior
noise,
the
wayside
n
oise
measure-
ments
were
made
to
de
termine
the
SOAC
characteri
stics
and
to
identify
the
primary
noise
contributors.
The
"A"
weighted
noise
levels
were
recorded
for
ove
r
100
data
points.
S
ince
the
major
nois
e
contribution
in
wayside
noise
comes
from
the
wh
ee
l
/rai
l
interaction,
an
effo
rt
was
mad
e
to
under-
stand
this
contribution.
Figure
6-23
shows
the
effect
of
rail
surface
roughness.
Since
February
19
73
when
the
HSGTC
transit
track
was
ground
smooth,
track
Sections
II
through
VI
had
qen-
erally
carried
only
test
vehic
l e
traffic;
while
Section
I
carried
all
th
e
ra
il
t
raffic
to
Test
Center.
Since
the
data
in
Figure
6-23
was
obtained
in
May
and
June
1973,
th
e e
ff
ect
of
this
traffic
on
ra
il
roughness
and
noise
l
evels
was
readily
determ
ine
d.
141

90
<(
a)
"O
_J
LU
>
80
LU
_J
a
z
::::>
0
(,/')
a
LU
I-
I
t!:J
w
~
60
0
NOTES
1.
INTERIOR
OF CAR 1
2.
GROSS
WEIGHT 90,000
LB
3.
CAR LOCATION
GOAL
20
40
KEY
0 CAB
C OVER FRONT
TRUCK
◊
MID
CAR
~
OVER REAR
TRUCK
60
80
SPEE
D (MPH)
Figure 6-
21
. Comparison
of
Interior
Noise Levels
with
Goals
142
100

<{
CX)
"CJ
_J
w
>
w
_J
0
z
:::>
0
(/)
0
w
I-
I
(.'.J
LU
~
NOTES
1.
INTERIOR
OF
CAR 1
2. GROSS
WEIGHT
90,000 LB
3.
TRACK
SECTION I
KEY
0
STEEL
FLATS
~
STEEL
TRUED
0
ACOUSTA
FLEX
80
...--
---.--
--
-,-----
-,---
-
-~--;----::--~
70
60
50
0
20
40
60
SPEED (MPH)
-
80
Figure
6-22.
Effect
of
Wheel
Configuration
on
Interior
Noise
14
3
BLOWERS ON
100

~
en
"C
NOTES
1.
INTERIOR OF CAR 1
2.
GROSS WEIGHT 90,000
LB
3.
50
FT FROM
TRACK
CENTER
LINE
4.
TRUED
STEEL WHEELS
90,,--
----....-
- - - -
-r-
-
------r----
-
-.-
- - - -
--,
TRACK
SECTION
I
~
801-----+-
---
---1--------:
=--f'"'~~~~
-
"'.'C:::::=:--
.
l--------4
> m -
1ZI
w
...J
0
z
::::)
0
(/)
70
1------;;i;...-=
=-----
--+-
--
--
-t-----
-----t--
---
---1
0
w
~
I
(.'.J
w
s:
60L----
--'---
---.....,__
_
___
_._
____
__.__
____
___.
O 20
40
60
80
100
SPEED (MPH)
Figurt:
6-23.
Comparison
of
Rail
Surfa
ce
Roughness
on
Noise
144

Figure
6-24
shows
the
effect
of
wheel
roughness
on
noise
levels.
Since
Car
No . l
has
a
larger
number
of
wheel
flats
than
Car
No.
2,
it
has
a
slightly
higher
noise
level
for
this
condition.
Figure
6-25
compares
the
speed
effect
of
two-car
and
single-car
operations.
The
predicted
3
dBA
spread
for
doubling
the
number
of
cars
is
verified
over
most
of
the
speed
range;
the
divergence
at
the
70
mph
points
is
probably
attributable
to
wheel
flats
on
Car
No.
2
(the
single
car
data
was
taken
on
Car
No.
1).
Figure
6-26
compares
the
wayside
noise
level
of
the
SOAC
vehicle
with
the
design
goal
which
was
met
or
bettered
at
all
speeds
above
35
mph.
Subsequent
noise
analyses
showed
the
traction
motor
blowers
to
be
the
major
noise
contributor
below
35
mph.
Radio
Frequency
Interference
(RFI)
A
series
of
measurements
was
made
to
determine
the
broad-
band
radiated
electromagnetic
emissions
of
the
SOAC
vehicles
.
(This
program
was
identical
to
one
performed
on
the
BART
ve-
hicles
and
was
completed
during
SOAC
acceptance
testing.)
The
maximum
measured
RFI
emissions
under
different
operating
con-
ditions
are
compared
with
the
SOAC
goals
in
Figure
6-6.
SOAC
measurements
were
in
compliance
with
the
accepted
accuracy
of
±3 dBA
for
this
type
of
emission.
Structures
Review
of
the
structural
test
data
reveals
that
the
instrume
ntation
produced
data
that
can
be
used
to
determine
magnitude,
phasing
and
frequency
of
truck
loads.
The
data
shows
that
the
truck
fram
e
stress
levels
measured
at
th
e
HSGTC
test
ova
l
are
low
in
magnitud
e .
Comparative
data
to
be
ob-
tain
ed
on
the
five
transit
properties
will
show
whether
the
low
loads
are
peculiar
to
the
HSGTC
track
conditions
or
are
also
representative
of
revenue
service
on
older
transit
systems.
Although
th
e
SOAC
Detail
Specifica
tion
does
not
address
the
specific
qu
estio
n
of
truck
fatigue
allowable
stresses,
the
levels
apparently
existing
during
testing
are
conside
red
non-
damaging
to
the
truck
structure.
The
data
clearly
show
the
levels
of
loads
that
are
experienced
in
equipment
items
such
as
the
dampers
and
the
suspension
elements.
Data
from
these
tests
have
b
een
reviewed
on
a
preliminary
basi
s
only.
For
definitive
test
results,
considerable
effo
rt
remains
to
develop
the
m
et
hodologies
for
145

<(
Cl)
"O
_j
LU
>
LU
_j
Cl
z
::)
0
U)
Cl
LU
t-
I
(!)
LU
~
NOTES
1. GROSS
WEIGHT
90,000
LB
WHEEL
SURFACE
KEY
0 CAR 1
FLATS
2.
50
FT
FROM
TRACK
CENTERLINE
0
CAR
2
FLATS
3.
TRACK
SECTION
IV
6.
CAR 1 SMOOTH
70
60
0
20
40
60
80
SPEED (MPH)
Figure
6-24.
Comparison
of
Wheel Surface Roughness
on
Noise
146
100

-
<i
co
"O
_J
NOTES
1.
ACOUSTA
FLEX
WHEELS
2.
GROSS WEIGHT 105,000 LB
3.
TRACK
SECTION I
4. 50
FT
FROM
TRACK
CENTERLINE
5.
LEVELS
NORMALIZED
TO
STANDARD
CONDITIONS
90
...-----....------
---r--
---
-
-,---
----..--
----,
2 CAR
TRAIN
~
80
!------+------+-----~--
--
-+----~
UJ
_J
0
z
:::>
0
VJ
SINGLE CAR
~
7ok::;;;;:;;:;;;..---~o--
--i
----
---t--
-
--t------i
I-
I
(!)
UJ
?;
60'------..l..-----....,__
____
.....L......
____
_.J._
____
_,J
0 20
40
60
80
100
SPEED (MPH)
Figure
6-25.
Effect
of
Sp
ee
d on Wayside Noise
1
47

<i
co
-0
...J
UJ
>
UJ
...J
Cl
z
:::)
0
(/)
Cl
UJ
I-
I
CJ
UJ
~
NOTES
1.
ACOUSTA
FLEX
WHEELS
2. GROSS
WEIGHT
105,000 LB
3. 50 FT FROM
TRACK
CENTERLINE
4.
LEVELS
NORMALIZED
TO
STANDARD
CONDITIONS
5.
DATA
POINTS
0 2-CAR
TRAIN
6SINGLE
CAR
90.-----
-r------r------,-------,---
--
--,
80
60
0
.,,,,
0
20
40
60
SPEED (MPH)
GOA
LS
2-
CAR
T
RAIN
--
SINGLE
CAR
.9--
80 100
Figure 6
-2
6.
Comparison
of
Wayside Noise Levels
wi
th
Goals
148

reducing,
displaying,
analyzing,
and
interpreting
the
test
data.
Once
this
has
been
accomplished,
data
of
the
type
ob-
tained
on
this
program
can
provide
useful
information
for
improved
truck
design.
Voltage
Transients
and
Spikes
A
test
program
was
conducted
to
obtain
voltage
transient
and
spike
data
on
the
SOAC
veh
icle.
This
program
was
similar
to
that
accomplished
during
the
summer
of
1972
by
the
Univer-
sity
of
Missouri
on
the
five
demonstration
properties.
The
results
of
the
property
tests
may
be
found
in
Investigation
of
Voltage
Transients
and
Spikes
in
Direct
Current
Rapid
Transit
Systems
(Reference
5).
Unfortunatel
y
the
power
source
at
the
HSGTC
was
not
representative
of
the
sources
at
the
various
properties
which
exhibited
a
range
of
vo
ltage
spikes
from
-2700
to
+2500
volts.
At
the
HSGTC,
positive
spikes
never
exceeded
+1600
volts
and
there
were
no
negative
spikes.
The
HSGTC
locomotive
also
generated
short
transients
in
the
+800
to
+1600
volt
range,
not
typical
of
the
properties.
Some
long
duration
transients
below
+520
volts
were
also
experienced
during
the
performance
tests.
These
can
be
a
function
of
the
SOAC
acceleration
and
th
e
response
characte
ristic
of
the
locomotive
power
source.
6.5
SIMULATION
DEMONSTRATION
TEST RESULTS
Test
Program
A
total
of
6000
miles
(3000
per
car)
was
established
as
a
goal
of
the
simulated
demonstration
test
program.
Testing
was
conducted
with
each
car
ballasted
to
105,000
pounds
(repre-
senting
a
load
of
100
passengers).
Train
configuration
for
most
of
the
t
es
ting
was
a
two-car
train
running
8
hours
a
day,
6
days
a wee
k.
The
simulated
transit
route
(see
Figure
6-27)
is
a
composite
of
routes
in
the
five
cities
and
consists
of
16
stations
at
an
average
dis-
tance
of
approximately
1/2
mile
(from
a
range
of
1/4
mile
to
1-1/4
miles)
with
various
run
speeds
between
stations.
In
order
to
simulate
actual
operation
on
the
transit
properties,
the
SOAC
was
operated
on
simulated
trips
consisting
of:
1.
Two
laps
of
the
oval
stopping
at
each
station
for
door
opening
and
closing
on
eac
h
side
of
the
car
sequentially.
The
pr
escribe
d
run
speeds
between
stations
were
achieved
with
the
SOAC
speed
limiting
system,
using
maximum
acceleration
and
ful
l-servic
e
brak
e
rates.
149

345
340
335
330
325
320
55MPH
110
120
130
140
150
160
170
50MPH
55 MPH
PSC
189
Figure
6-27.
Simulated Demonstration Route
at
HSGTC
1 50

2.
Two
no~-stop
laps
of
the
oval
at
80
mph.
After
a 5-
minute
layover
the
same
run
profile
was
made
in
the
opposite
direction.
The
first
test
run
was
conducted
on
July
23,
1973
and
the
last
on
August
11,
1
973
when
the
accident
occurred.
Thirty-
f i
ve
test
runs
were
made
and
a
total
of
4,197
car
miles
were
accumulated
(see
Figure
6-28),
1,573
in
single-car
operation.
On
five
occasions
the
test
objective
of
operating
the
SOAC
as
a
two-car
train
co
ul
d
no
t
be
met
because
of
malfunctions
which
forced
a
car
out
of
service
(see
Figure
6~29).
Test
Results
The
most
significant
car
problem
uncovered
during
testing
was
that
excessive
oil
leaking
was
occurring
from
the
gear-
boxes.
The
problem
was
discovered
because
of
the
frequent
i
ns
pections
performed
dur
i
ng
and
after
daily
testing.
The
leakage
rate
during
500
miles
of
testing
varied
widely
among
the
8
gearboxes
in
the
two
-
car
train,
the
lowest
was
0.1
quart
and
t
he
highest
was
1.2
quarts.
A
laboratory
test
conducted
by
Garrett-AiResearch
traced
the
oil
leakage
problem
to
the
omission
of
oil
drain
holes
between
the
labyrinth
seal
and
the
tapered
roller
bearing
adjacent
to
it.
The
effectiveness
of
the
labyrinth
seal
de-
creases
with
decreasing
shaft
speed.
When
this
gearbox
was
operated
under
repetitive
stop-start
conditions,
oil
lea~ed
out
through
the
labyrinth
seal.
The
gearbox
was
modified
by
addin
g
two
3/4-
inch
drain
holes
at
the
labyrinth
seal
and
at
the
seal
cavi
ty
on
the
co
v
er
side
of
the
gearbox.
The
holes
permit
oil
accumulatin
g
in
the
seal
cavity
during
operation
to
drain
back
into
the
sump
when
the
car
stops.
When
tested
the
modified
gearbox
ha
d
an
oi
l
leakage
rate
of
only
0.88
ounce
per
600
stops,
an
acceptable
oil
leakage
rate.
Details
of
the
simulated
demonstration
t
es
ting
may
be
found
in
the
SOAC
Simulated
Dem
ons
t
ration
Test
Report
(Reference
6).
1
51

(/)
w
...J
~
er:
<(
u
4,250
4,000
3,500
3,000
2,500
2,000
1,500
1,
000
500
>-
<(
C)
z
::>
(/)
~I
□•
z
::::,
(/)
4,198
CAR
MILES
0 .....,_....t.,__,j,_
........
_,__.._..,_.....,....1,,--1i...-..i...._,_.....1_
....
_,____,1,,_..._
___
...... _.....__.___
23
24
25
26 27 28 29 30
31
1 2 3 4 5 6 7 8 9 10
11
12
JULY
AUGUST
Fig
ur
e
6-28.
Mileage
Accumulation
During Simulated Demonstration
(23
July
to
11
August 1973)
152

C/)
w
.....I
300
250
200
15
0
100
50
0
,--
---
0--
---
-
-
KEY
• CAR NO. 1 I
X--
CAR
NO.2
•
,x
l
·1
·1
)(
·t
•){
x
•
~
>.(
)(
I
I
r I
I ¥
I I
)..(
I
>- >-
I I I
I
<(
<(
I I I
0 0
• I z z I I I
::,
::,
I
C/) C/)
I I I
I I I I I I I i I I I I I I
23 24 25 26 27 28 29 30 31 1 2 3 4 5 6 7 8 9 10
11
JULY
AUGU
ST
Figure 6- 29.
Dai
ly
Mi
les Per Car
Durin
g Simulated Demon
st
ra
tion
(23
Jul
y to
11
Augu
st
1973)
1
53

7. ENGINEERING DESIGN CHANGES
AND CORRECTIVE ACTIONS
During
the
SOAC
Engin
ee
ring
Test
Program,
problem-solving
activities
were
initiated
for
problems
requiring
design
changes
or
corrective
act
i
ons.
As
the
testing
phase
progressed
, a
number
of
subsystem
malfunctions
occurred
:
some
necessitating
design
changes;
others,
isolated
events,
requiring
only
cor-
rective
action.
Both
types
are
reported
in
this
section
-
as
a
sample
of
the
problems
encountered,
and
a
description
of
the
manner
iri
which
these
problems
were
solved.
7.1
DESIGN
CHANGES
Propulsion
System
Altho
ugh
the
highest
risk
element
of
the
propulsion
and
control
system
was
thought
to
be
the
chopper,
only
one
chopper
malfunction
occurred
on
the
SOAC
program
.
This
was
caused
by
an
op
en
ci
r
cuit
in
a
contro
l
logic
connector
a s a
result
of
a
maintenance
error.
For
the
modi
fica
tion
described
in
the
following
para-
graphs,
the
motors
w
ere
rem
oved
from
the
cars
th
e
week
o f
December
4,
1972
and
returned
to
AiResearch.
By
Feb
ruary
12,
197
3 ,
all
modifications
were
confirmed
,
all
rework
was
com-
pleted
,
mot
ors
were
reinstalled
in
both
cars,
and
systems
t
es
ting
was
continued.
•
Current
Instability
During
Drive-to-Brake
Transi
tion
Consid
erable
current
swapping
occurred
between
the
two
parallel
truck
systems
after
transit
i
on
to
brak
e
from
the
154

drive
mo
de,
when
the
separately
excited
fields
were
zero.
This
was
apparently
a
series
g
eneration
mechanism.
The
effect
of
the
swapping
during
transition
was
eliminat
ed
by
inser
ting
diodes
in
series
with
each
pa
ir
of
tracti
on
motors.
•
Current
Instability
During
N
orm
al
Motoring
This
problem
was
caused
by a
rising
motor
speed
charac
t
er
-
istic
(an
i
nc
rease
rather
than
a
de
crease
in
motor
s
peed
with
an
increase
in
motor
loa
d)
.
This
incr
ease
i n
speed
with
load
was
caused
by
interpo
le
overcompensation.
The
prob
lem
was
corrected
by
increasing
the
effective
interpole
air
gap
by
mac
hinin
g ma
teri
a l
from
the
interpole
fac
es.
Non-
magnetic
bolts
we
re
also
in
co
r
pora
t
ed
to
reduce
the
flux
leakage
from
the
interpole
to
the
fram
e . A
motor
with
increased
air
gap
was
tested
on
January
16,
1973.
The
tests
indicat
ed
that
wi
th
proper
brush
and
brush
holder
des
ign,
a
drooping
s
peed
char
-
acter
is
t i c
with
lo
ad
was
r
epe
titi
ve
ly
ob
t a
inabl
e . A
ll
motors
h
ave
been
modi
fi
ed
and
are
performing
satisfactorily.
•
Current
Instability
Immed
iate
ly
After
Reversal
of
Car
Direction
This
problem
was
caused
by
mecha
ni
cal
instability
of
the
brush
in
the
holder
as
the
direction
of
rotation
of
the
motor
was
reversed.
Bru
sh
f
riction
at
the
commutator
surfac
e
caused
the
brush
to
tilt
and
its
mechanical
and
electrical
ne
u
tral
,
with
respect
to
th
e
poles
in
t he
stator,
t o
change
.
The
di
-
rection
of
the
change
was
such
that
as
lo
ad
was
increased
,
the
l
oad
current
caused
a
decreas
e
in
the
ma
in
field
flux
which
in
turn
increased
the
s
peed
of
the
motor.
The
brushes
and
brush
holders
were
redesigned
t o
co
rr
ect
this
mechanical
in-
stabi
li
ty.
All
brush
hol
ders
were
reworked
and
installed
with
negator
s
prings
.
Carbon
brushes
with
p i
gta
il
shunts
and
a
top
angle
of
15
degrees
were
te
s
ted
in
the
motors
and
performed
satisfactor
ily
.
•
Motor
Arcing
to
Gro
und
This
problem
was
caused
by
exces
siv
e
brus
h d
usting
(wear)
combined
wi
th
i o
niza
t i
on
of
the
carbon
partic
l
es
in
the
a
ir
by
e l
ec
t
rica
l "
streamers
"
from
the
brushe
s , bo
th
caused
by
poor
commutation
.
The
original
brushes
and
brush
hold
er
co
nfigura-
tion
did
not
use
p i
gta
il
s
to
conduct
curr
ent
from
t he
brush
to
the
box,
but
re
l
ied
on
th
e
contact
between
the
f i
nger
and
the
top
of
th
e
carbon
brush
.
After
new
brushes
wi
th
p i
gtails
were
instal
l
ed
and
brush
grade
was
changed,
ther
e
was
a
vast
im
provement
in
commutation
,
brush
dusting
and
streamers
were
e
li
mina
t
ed
,
and
brush
spark-
i
ng
was
drasticall
y
reduced.
This
e
li
minated
the
arcing
-
to
-
ground
prob
l
em.
155

To
reduce
the
damage
from
any
future
arcing
to
ground,
the
inside
ends
of
the
motor
external
terminals
were
covered
with
insu
la
ting
material;
al
l
grounded
metal
parts
were
coated
with
an
ins
ulat
i
ng
material
;
all
sharp
corners
of
grounded
and
live
metal
parts
were
removed;
and
the
clearance
between
the
commutator
insulating
band
and
the
arcing
studs
was
increased.
Car
Body
Vibration
In
Apr
il,
1973
a
ride
quality
survey
indicated
a
degra-
dation
of
the
SOAC
car
vibration
levels
at
speeds
over
55
mph.
These
v
ibrat
ions
at
high
speeds
were
not
observed
in
early
phases
of
the
test
program.
An
investigation
revealed
that
two
characteristics
of
the
car
had
changed.
These
changes,
which
could
have
altered
the
response
of
the
vehicle,
were:
•
Wheel
flats
had
developed
dur
ing
performance
testing.
•
There
was
insufficient
cleara
nce
between
the
mounting
brackets
and
the
motor
alternator
hard
points
to
allow
the
elastomer
mounts
to
function
correctly.
It
was
determined
by
a
vehic
l e
shake
test
and
analysis
that
the
undercar
motor
alternator
support
beams
had
a
reso-
nance
frequency
at
the
80-
m
ph
wheel
-r
otationa
l
one-per-revolu-
tion
frequency.
The
car
underframe
was
locally
rein
fo
rced
on
June
20,
and
tested
Jun
e
29,
verifying
acceptab
ility
of
the
chang
e .
7. 2 CORRECTIVE ACTIONS
Other
attributed
practice.
corrective
problems
encountered
during
the
program
were
to
quality
,
infant
mortality
,
and
maintenance
The
followin
g
four
problems
of
that
nature
r
equ
ir
ed
action
but
no
design
changes.
Motor
Armature
Short
A
motor
failure
occurred
on
SOAC
No.
2
during
the
eng
i-
neering
test
program
in
May
1973.
The
failu
r e
was
not
attrib-
uted
to
any
unusual
test
being
performed.
Subsequent
teardown
insp
e
ction
at
AiResearch
indicat
ed
a
short
circu
i t
ha
d
occurred
between
two
adjace
nt
armature
coils.
This
failure
was
classi-
fied
as
random,
due
probably
to
e
ither
random
insulation
br
ea
kdown
or
insulation
damage
dur
ing
a
ss
emb
ly
of
the
motor
.
Geabox
Bearing
A
failure
of
the
input
pi
n
io
n
bearing
in
the
No.
2
gear-
box
of
th
e
No
. 1
SOAC
occurred
du
r i
ng
a
routine
test
in
May
156

1973
.
Subsequent
investigation
of
the
failed
gearbox
indi
-
ca
t
ed
the
input
pinion
bearing
failed
from
oil
starvation
.
Be
n
ch
testing
on
another
gearbox
indicated
that
if
a
low
oil
state
exists
below
recommended
levels,
the
input
pinion
bear
-
in
g
will
overheat
and
ultimately
fail.
This
failure
was
at
-
tr
i
buted
to
insufficient
oil
in
the
gearbox
prior
to
running.
An i
nd
i
cating
dip
stick
has
been
installed
in
each
gearbox.
Ch
opper
Sharing
Resistor
During
the
final
stages
of
the
Acceptance
Test
Program
in
April
1973,
a
failure
occurr
ed
with
the
sharing
resistors
in
one
of
two
main
thyristor
draw
e r
assemblies
in
SOAC
No.
2.
T
hi
s
was
caused
by
lack
of
proper
thyristor
gate
drive
to
the
failed
thyristor
drawer
and
resulted
in
removal
of
50
percent
of
available
chopper
capability;
the
remaining
main
thyristor
assembly
experiencing
an
ef
f
ective
100-percent
overload.
This
cu
r
rent
overload
produced
excessiv
e
heating
in
each
of
the
three
current
sharing
resistors,
which
then
fused
open.
The
control
cards
which
perform
the
g
ate
drive
function
were
carefully
inspected
and
found
to
be
functional;
there-
fore
,
the
conclusion
was
that
the
connector
which
transmits
the
drive
pulse
to
the
main
thyristors
contained
film
barriers
or
misa
li
gnment
which
prohibit
e d
proper
signal
propagation.
I
mproper
alignment
could
have
been
caused
by
vi
b
ration
of
the
control
cards
which
had
been
operat
ed w
ithout
th
e
benef
i t
of
t he
hold-down
bar
specifically
desi
gne d
to
hold
the
control
cards
firmly
in
the
proper
connector
alignment
position.
The
chopper
system
demonst
r
at
ed c
omplet
e ,
proper
opera-
tion
when
the
thyristor
drawers
we
re
r e
placed
and
the
control
card
connector
was
cleaned;
th
e
refore,
no
f
urther
actions
were
taken
except
to
make
cert
a
in
th
e
tiedown
bars
wer
e
installed
prior
to
any
operations.
Motor
Commutator
High
Bar
After
systems
testing
was
re
sumed
in
Fe
bruary
1973,
it
was
noted
there
was
excessive
brush
w
ea
r
on
the
No.
4
motor
of
SOAC
No.
1 .
Inspection
of
th
e
commuta
t
or
indicated
that
a
high
bar
existed
and
the
commutator
segments
wer
e
not
cham-
fered.
An
AiResearch
factory
modification
t eam a
ccomplished
the
ston
i
ng
and
chamfering
of
the
commutator
while
the
motor
was
installed
on
the
car.
This
corr
e
cted
the
excessiv
e
we
a r
prob
lem
and
no
further
action
wa
s r
eq
uired.
157

8.
MOCKUP
AND TEST AND EVALUATION
PROGRAMS
8.1
SOAC
MOCKUP
In
order
to
demonstrate
the
SOAC
ex
terior
and
interior
design
to
a
larg
er
segment
of
the
public
than
wi
ll
see
the
cars
during
op
e
rati
ona
l t e
sting
in
the
cities,
a
full
-s
cale
mo
ckup
of
the
SOAC
ve
hi
c l e
was
design
ed
and
built
by
Sundberg
Ferrar
.
Th
e
two-section
mockup
has
been
designed
to
be
transpor-
table
over
regular
highways
w
ith
eac
h
section
separately
built
onto
a
complete
flatb
ed
trail
er.
The
mockup
is
air
condi-
tioned
and
equipped
with
heating,
lighting
and
public
address
systems.
Co
mm
erc
ial
60
Hz
e l
ectric
power
must
be
provided
at
each
display
site
. . -
The
first
p
ubl
ic
display
of
th
e
SOAC
mockup
w
as
at
the
U.S.
Intern
a
ti
onal
Transportatio
n
Exposition
(TRANSPO
72)
at
Dulles
Int
e
rnation
al
Airport
,
Wash
in
gton
, D
.C
.
from
May 26
through
J
un
e
4,
1972.
Since
TRANSPO
the
mockup
has
been
dis-
p
lay
ed
in
Washington,
D. C. ;
Pueblo,
Co
l o
rado;
and
Rochester,
B
uf
fa
lo
and
Syracuse,
New
York.
More
than
400,000
peop
l e
hav
e
visi
t e d
th
e m
ockup
.
(Figure
8-1
shows
th
e
mocku
p
on
dis-
play;
Tabl
e
8-1
summarizes
the
disp
l
ay
activities.
)
At
eac
h
display
s i
te
Boeing
Vertol
personnel
staffed
t he
mockup
and
p
rovi
ded
technical
data
describ
in
g
th
e
projec
t
to
members
of
the
pu
blic
. A
questionnaire-type
opini
on
survey
has
been
and
w
ill
continue
t o
be
t
aken
at e
ach
di
sp
la
y
site
to
obtain
public
reaction
to
the
SOAC
.
158
ROCHESTE
R,
N.Y.
COLORA
DO STATE
FAIR,
PUEBLO,
COLORADO
WASHINGTON, D.C.
Figure
8-1.
SOAC
Mo
ckup
on
Di
splay
159
BU
FFALO,
N.Y.

TABLE
8
-1.
MOCKUP
D
IS
PLAY
ACTIVITIES
Dat
es
Di
sp
l
ay
Site
Days
At
tend
ance
1972
May 26
to
Wa
sh
ington,
D.
C.
, 9
145,00
0
June
4
Transpo
72,
Dulles
In
ternation
al
Airport
June
19
to
Washington,
D.
C.,
14
2,500
J
uly
5
Dow
n
town
August
25
to
Pueblo
, Col o r
ado,
10
120,000
September
4 Col
orado
Sta
t e
Fa
ir
1973
May
3-12
Roc
he
ster,
N .
y.
, 9
20,000
Downtown
Hay
18-27
B
uff
a
lo,
H.
y.
, 10
35,000
Downtown
A
ugust
28
t o
Sy
racus
e ,
N.
y.,
6
82,000
September
3 New
York
State
Fair
160

Current
plans
are
that
the
mockup
will
be
displayed
in
Boston,
Cleveland,
Chicago,
and
Philadelphia
in
conjunction
with
the
SOAC
operational
test
and
e
valuation.
8.2
OPERATIONAL TEST
AND
EVALUATION
An
operational
test
and
evaluation
plan
has
been
devel-
oped
and
coordinated
with
each
of
the
five
selected
cities.
Details
of
this
phase
will
be
presented
in
Volume
2
of
this
report.
The
public
relations
aspects
of
the
overall
plan
are
being
discussed
in
detail
with
each
city.
In
conjunction
with
this,
a Human
Factors
Task
is
being
performed
by
interviewing
SOAC
passengers
to
establish
crit
e
ria
for
comfort
and
safety.
A
questionnaire
has
been
develop
ed ·
by
Chilton
Company
(under
a
Boeing
Subcontract)
for
use
in
the
conduct
of
these
inter-
views;
the
questionnaire
has
been
coordinat
e d
with
all
con-
cerned
parties.
Additional
details
of
the
plannin
g
with
each
city
are
as
follows:
Hew
York
Upon
completion
of
the
e ng
ineering
test
program
at
th
e
HSGTC,
the
SOAC
will
be
shipped
to
New
York
where,
upon
arriv-
al,
it
will
be
taken
to
the
207th
Street
maintena
nc
e
shop
and
will
be
set
up
fo
r
running
on
th
e
lin
es
of
the
NYCTA
(New
York
City
Transity
Authority).
When
setup
i s
completed
the
SOAC
will
be
tested
on
the
NYCTA
test
track
at
207th
Street.
After
completion
of
qualification
tests,
instrumentation
will
be
in-
stalled
on
the
SOAC
and
tests
will
be
cond
uct
ed
over
the
lines
on
which
SOAC
will
run
in
revenu
e s
erv
ice.
In
addition
to
basic
performance
measurements,
this
testing
will
include
ride
quality,
noise
and
structural
tests.
During
th
e t
es
t
program
NYCTA
motormen
will
be
trained
to
operat
e
the
SOAC.
"Very
important
person"
(VIP)
runs
will
be
conducted
at
the
conclusion
of
the
testing
and
th
e
SOAC
will
then
be
placed
in
a
two-week
period
of
revenue
service
on
the
A
Line
from
207th
Street
to
Lefferts
Boulevard
and
Far
Rockaway,
the
E
Line
from
179th
Street
to
Hudson
Terminal,
the
D
Line
from
205th
Street
to
Coney
Island,
and
th
e N
Line
from
57th
Street
to
Coney
Isl
and.
Thes
e
runs
will
give
the
SOAC
exposure
in
Manhattan,
Queens,
Brooklyn
and
the
Bronx.
This
same
genera
l
procedure
of
qualification
tests,
engineering
tests,
VIP
runs
and
revenue
runs
will
be
followed
in
each
of
the
f
ive
demonstration
cities
.
161

Boston
From
New
York,
the
SOAC
will
travel
to
Boston
where
the
cars
will
be
set
up
at
the
MBTA
(Massachusetts
Bay
Transporta-
tion
Authority)
Cambridge
shops;
with
testing,
VIP
runs,
and
revenue
service
to
be
conducted
over
the
Harvard-Quincy,
Harvard-Ashmont,
and
new
South
Shore
Lines.
A
clearance
car
has
been
run
over
these
lines
to
assure
clearance
for
the
SOAC.
An
automatic
train
operation
(ATO)
cab
signaling
system
is
in
use
on
the
Harvard-Quincy
Line.
In
order
to
run
on
this
line,
it
is
planned
that
the
SOAC
will
use
a
portion
of
the
MBTA
cab
signaling
system
and
its
own
speed
maintaining
system
to
provide
ATO.
The
marriage
of
these
two
systems
is
being
accomplished
with
the
assistance
of
the
MBTA
Signal
and
Com-
munications
Department
and
will
permit
the
SOAC
to
operate
like
any
other
MBTA
car.
Cleveland
From
Boston,
the
SOAC
will
travel
to
Cleveland,
where
the
cars
will
be
set
up
at
the
CTS
(Cleveland
Transit
System)
Windermere
shops.
Testing,
VIP
runs,
and
revenue
service
will
be
conducted
over
the
Airport-Windermere
Line.
No
special
problems
are
anticipated
in
Cl
e
veland.
An
analysis
was
made
of
a
recent
clearance
car
run
which
determined
that
minor
relocations
of
equipment
are
required
along
the
line
to
assure
SOAC
clearance.
The
SOAC
will
be
equipped
with
a
gap
filler
at
the
door
thresholds
to
narrow
the
gap
betwe
en
the
SOAC
and
the
CTS
platforms.
For
CTS
rev
e
nue
op
e
ration
the
SOAC
side
door
cir-
cuitry
will
be
modified
to
pe
rmit
selection
of
either
single-
or
three-door
set
op
e
ration.
Single-door
operation
will
permit
the
motorman
to
collect
fares
in
low
traffic
areas
and
durin
g
off-peak
hours
when
there
are
no
platform
attendants.
Three-door
operation
is
required
during
peak
hours
when
station
fare
collection
is
used.
Chicago
From
Cleveland
th
e
SOAC
will
be
shipp
ed
to
Chicago
where
the
cars
will
be
set
up
at
th
e C
TA
(Chicago
Transit
Authority)
Skokie
shops.
Testing,
VIP
runs,
and
revenu
e
service
will
be
conducted
on
the
Skokie
Swift
Line
which
runs
from
Dempster
to
Howard
Street.
A
maj
o r
pr
o
blem
in
Chicag
o
is
that
th
e
SOAC
is
wider
than
the
CTA
cars.
Since
this
woul
d
cause
interference
problems
at
the
platforms,
v
ar
ious
soluti
ons
hav
e
be
en
off
e
red
to
permit
the
SOAC
t o
op
e
rate
on
t
he
sam
e
lin
e
as
th
e C
TA
cars.
Discus-
sions
and
evaluations
a r e
stil
l be
in
g
conducted
to
determine
the
best
meth
od
to
accommodat
e SOAC.
1
62

Philadelphia
From
Chicago
the
SOAC
will
travel
to
Philadelphia.
The
set-up
will
be
accomplished
in
the
SEPTA
(Southeastern
Penn-
sylvania
Transportation
Authority)
Fern
Rock
shops.
Te
sting,
VIP
runs,
and
revenue
service
will
be
conducted
on
the
Broad
Street
Line
from
Fern
Rock
to
Pattison.
163

9. ECONOMIC ANALYSIS
9
.1
INTRODUCTION
AND
SUM
M
ARY
O
ne
of
the
eig
ht
separate
tasks
to
be
performed
under
the
Ur
ban
Rapid
Ra
il
Vehicle
and
Systems
Program
is
the
eco
nom
ic
analysis
task
re
lating
to
the
SOAC
and
ACT
cars.
The
s
tudy
dea
ls
wi
th
a p
roduc
tion
vers
i
on
of
th
e
SOAC
and
covers
two
major
top
i
cs:
• An
estimate
of
t he
product
i
on
cost
• A
tradeoff
analysis
dealing
with
t he
selection
of
the
propulsio
n
control
system
The
production
cost
estimate
includ
es
the
cost
of
pur-
chas
ed
equipmen
t
and
in
-h
ouse
assembly.
P
lannin
g
prices
f
or
production
quantities
of
the
purchased
eq
ui
p
ment
were
requested
from
th
e
SOAC
prototype
sup
plie
rs.
Assembly
costs
are
based
on
an
indust
ri
a l
engineer
i
ng
es
ti
m
ate.
The
tradeoff
analysis
i
dent
i f i
es
th
e
benefit
resulting
from
use
of
chopper
con
tr
ol
rather
than
switched-resistor
for
the
propu
l s i
on
control
system
.
Since
the
ana
ly
sis
considers
life
cycle
costs
, a
ll
th
e
costs
and
ben
ef
i
ts
expected
over
t
he
en
tir
e
lif
e
of
the
veh
i
cle
are
co
m
pared
,
not
o
nl
y
the
init
i a l
inv
es
tm
e
nt
co
st.
Pr
od
u
ct
i
on
Cost
Estim
ates
Production
cos
t
estimates
have
been
der
i
ved
for
the
SOA
C
vehicle
i n
both
married
pair
and
self-sufficie
nt s i
ng
l e-
car
co
nfi
gurations
(an
d a
300-car
prod
uc
t i
on
quantity)
.
For
the
164

self-sufficient
car
,
$220,245
of
purchased
equipment
are
identi
f i
ed;
whi
l e
for
the
married
pair,
$203,705
of
purchased
it
ems
are
identified
per
car.
Non-recurring
costs
,
adminis-
trati
ve
overhead,
and
prof
it
bring
the
total
price
in
1973
dollars
to
$351,673
for
a
self
-su
fficient
car
and
$333,115
for
each
car
of
a
married
pair.
Tradeoff
Analysis
-
Chopper
vs
. Cam
Control
The
tradeoff
analysis
evaluating
the
use
of
solid
state
chopper
control
rath
er
than
switched
resistors
for
the
propul-
sion
control
system
concludes
that
0.857
kilowatt-hours
of
electrical
energy
per
ve
hicle
mile
can
be
saved.
This
trans-
lates
into
an
annual
saving
of
$800
per
car.
Additional
sav-
ings
in
maintenance
may
also
r
es
ult;
however,
insufficient
data
make
this
uncertain
and
difficult
to
quantify.
Since
it
appears
that
transit
vehicles
with
solid-state
control
systems
will
cos
t
no
more
to
purc
hase
t
han
the
switched-resistor
type,
the
critical
energy
saving
benefits
of
chopper
control
make
that
choice
even
more
effect
i
ve.
9.2
PRODUC
TION
COST
ESTIMATE
Two
configurations
of
the
SOAC
are
considered
in
est
im
at-
ing
th
e
costs
of
a
pro
duction
run
of
300
SOAC
vehic
l
es:
the
married
pair
and
the
self-s
uf
ficie
nt
car.
With
the
married-
pa
ir
configuration,
cars
must
always
operat
e
in
pairs
sinc
e
an
individual
car
does
not
contain
a
compl
e
te
set
of
equipment.
Production
cost
and
weight
may
be
r e
duc
ed
if
equipment
placed
on
one
car
alone
serves
both
mem-
bers
of
the
pair,
but
som
e
of
the
shar
ed
item
s
must
be
plac
ed
on
each
car
to
maintain
the
weight
dist
r
ibution
and
to
ke
ep
space
utilization
from
being
too
far
out
of
balanc
e
between
cars.
It
is
not
possible
to
operate
single-car
t
rains
or
an
odd
number
of
cars
with
the
marri
ed
-
pair
configuration.
The
self-sufficient
car
configuration,
contains
all
necessary
operating
equipment.
Consequently,
a
single-car
train
or
any
odd
(or
even)
number
of
self-suf
f
ici
ent
cars
may
be
opera
t e
d.
Self-suffici
e
nt
ca
rs
cost
mor
e
than
married-pair
cars
,
but
o
ffe
r
greater
f l
exibility
in
tailoring
train
l en
gth
to
vari
e d
passenger
loa
d
s.
A
mix
of
th
e
two
configurations
may
be
desirabl
e
for
certain
circumstances.
·
I n
recognition
of
the
adv
an
tages
of
b
ei
ng
abl
e
to
separate
the
cars
during
th
e
testing
and
evaluati
on
programs,
the
two
SOAC
p
rot
o
ty
pes
wer
e
built
as
se
lf-suffi
ci e nt
cars
.
Table
9- 1
contains
t he
prices
of
the
p
ur
ch
ased
it
ems
for
the
SOAC,
based
on
planning
estima
t
es
requested
f
rom
protot
y
pe
165

suppliers.
While
not
firm
quotes,
realistic
prices
were
re-
quested
for
this
study.
For
the
married
pair
configuration,
the
pantograph,
auxiliary
power,
batteries,
and
brake-system
air
compressor
are
shared
between
the
two
cars.
The
production
manhour
estimate
developed
by
Boeing's
industrial
engineers
is
presented
in
Table
9-2.
Table
9-3
is
a
compilation
of
the
complete
pr
ice,
includin
g
engineering,
overhead,
and
administrative
costs.
The
price
estimate
for
a
self-sufficient
car
is
$351,673;
the
per-car
price
for
the
married
pair
configuration
is
$333,115.
TABLE
9-1.
ESTIMATED PRICES
FOR
PURCHASED
HARDWARE
(300
CARS)
Item
Motors,
gearbox
,
chopper
control
Auxiliary
power
Bra
ke
system
Batteries
Pantograph
Truck
-
frame
,
suspension
and
bearings
Wheels
and
axles
Couplers
Windshield
Windows
Sash
Doors
Door
operators
Lighting
Seats
Temp
erature
contro
l
equipment
and
air
conditioning
Stanchions,
straps,
and
windscreens
Carp
e t
Radi
o ,
int
ercom
and
public
a
ddre
ss
system
Raw
material
M
isc
el
laneous
Total
of
P
urcha
sed
Items
per
Car
166
Self-Sufficient
Car
(dollars)
80,000
20,000
15,000
1,090
3,650
17,000
7,500
10,000
3
,10
5
620
4,250
4,405
10,520
3
,1
80
5 ,
650
13,075
3,500
700
4,000
12,000
1,000
220,245
Married
Pair
(dollars)
80,000
10,000
12,500
700
2,000
17,000
7,500
8,000
3
,105
620
4,250
4,405
10,520
3
,180
5
,6
50
13,075
3,500
700
4,000
12,000
1,000
203
,70
5

I-'
CT\
-...J
TABLE
9-2.
RECURRING
MANUFACTURING
MANHOUR
SUMMARY
(30
0 CARS)
Activity
Activity
Assembly
Installation
Tooling
Tool
Service
Planning
and
Liaison
Production
Services
Totals
(300
cars)
Side
Super-
Structure
62,862
44,119
--
2,139
3,491
2,728
7,916
123,255
Under-
Roof
Frame
32,115
40,328
39,274
95,293
--
--
1,427
2,712
2,330
4,426
1,820
3,458
5,282
10,035
82,248
156,252
No.
lan
d
Passenger
Final
No.
2
Ends
Section
Assembly
35,590
149,732
--
68,863
70,021
178,056
49,173
364,011
287,114
3,072
11,675
9,304
5,014
19,054
15
,
184
3,917
14,885
11
,862
11,368
43,198
34,424
176,997
672,576
535,974
Totals
320,627
495,626
700,328
30,329
49,499
38
,
670
112,223
1
,74
7
,302

TABLE
9-3.
ESTIMATED PRODUCTION
PRICE
(300
CARS)
Item
Cost
of
purchased
i t
ems
Recurring
cost:
manufacturing,
labor
fringe
be
nefits,
ov
e
r-
head
($16
x
1,747,302
manu
f
ac-
turing
manhours
+
300)
E
ngineering,
mockup,
tooling
planning
and
liaison
(2
%)
Administrative
overhead
and
pr
o
fit
(10
%)
Total
Price
per
Car
168
Self-Sufficient
Car
(dollars)
220,245
93,189
313,434
6,269
319,703
31,970
351,673
Married
Pair
(dollars)
203,705
93,189
296,894
5,938
302,832
30,283
333,115

9.3
PROPULSION
CONTROLS
TRADEOFF
STUDY
Background:
Life-Cycle
Costs
A
cost-effectiveness
tradeoff
analysis
was
conducted
of
the
life-cycl
e
costs
of
a
major
subcomponent
in
the
propulsion
control
system:
the
DC-DC
chopper
control
unit
using
thyristors.
When
the
net
benefit
or
cost
of
a
particular
component
is
evaluated,
all
identifiable
costs
and
benefits
affected
by
th
e
component
during
the
entire
life
cycle
of
the
vehicle
m
ust
be
considered,
since
a
savings
in
investment
cost
is
not
worth-
while
if
it
results
in
a
much
greater
increase
in
operating
costs.
Some
qualifications
must
be
noted.
It
is
desirable
to
defer
expenses
so
long
as
deferral
does
not
increase
them.
Furthermor
e , a
slight
increase
in
costs
may
be
acceptable
if
it
facilitates
postponement
of
expenses.
Therefore,
it
may
or
may
not
be
preferable
to
spend
an
extra
$25,000
now,
rather
than
incu
r
an
expense
of
$1000
per
year
for
30
years.
In
order
to
compar
e
major
capital
expenditures
with
annual
oper-
ating
costs,
the
capital
investment
can
be
expressed
as
an
equivalent
annual
cost
by
multiplying
it
by
a
capital
recov-
ery
factor.
Th
e
equ
ivalent
cost
equa
ls
the
amount
of
interest
and
principal
that
would
hav
e
to
be
paid
each
year
if
the
capital
funds
were
borrowed.
The
interest
rate
to
be
used
is
th
e
rate
at
which
the
transit
authority
can
borrow
money.
Once
all
costs
and
ben
ef
its
are
exp
ressed
annually,
the
net
annual
cost
or
benefit
can
be
determined
as
the
overall
result
of
using
the
component
under
analysis
.
In
an
alternative
approach
future
costs
and
benefits
can
be
multiplied
by
present
worth
factors
to
obtain
eq
uivalent
present
values.
These
are
com
-
pared
wi
t h
the
initial
investment
cost.
(For
a
detailed
ex-
pl
anation
of
equivalent
a
nnual
cost
and
present
val
ue
calcula-
tions,
see
Grant
and
Ireson,
Principles
of
Engineering
Eco
nomy,
Reference
7.)
For
comparative
purposes
it
is
genera
lly
necessary
to
estima
t e
or
assign
dollar
valu
e s
fo
r
costs
or
ben
ef
its
not
initially
expressed
in
dollars
(otherwise
the
comparison
of
dissimilar
nonmonetary
items
may
no
t
be
readily
understood).
Conversely,
if
it
seems
unr
ea
sonable
to
at
tach
a
monetary
value
to
a
particular
item
,
its
importanc
e
must
be
otherwise
determined.
Life-cycle
cost
analysis
using
e
quivalent
annua
l
costs
is
a l
ogical
method
for
d
ea
lin
g
with
cost
analysis
prob
l
ems
in
th
e
transit
industry
.
1
69

Propulsion
Control
Systems
The
tradeoff
analysis
evaluated
the
use
of
chopper
con-
trol,
rather
than
switched-resistor
(or
cam)
control
for
the
SOAC
propulsion
system.
Heretofore,
most
transit
vehicles
have
employed
cam
controllers
t o
vary
motor
torque
and
speed
ou
tp
ut.
As
resistors
are
switched
in
and
out,
motor
speed
and
power
output
vary
with
the
voltage.
However,
electr
ical
en
-
ergy
is
wasted
because
power
is
consumed
by
t
he
resistors.
Furthermore,
frequent
failure
of
the
switches
causes
a
significant
portion
of
maintenance
costs.
Chopper
control
uses
electronic
circuitry
to
pulsate
the
current
input
to
th
e
motors.
By
varying
th
e
duration
of
the
on
-
pulse,
the
average
current
is
varied
.
Compared
to
switched
resistors,
the
e
lectronic
circuits
provide
better
use
of
elec-
t
rical
energy
and
do
not
require
as
much
maintenance
.
The
energy
waste
from
the
resistors
of
a
cam
system
occurs
when
the
train
is
leaving
a
statio
n . .
The
resistors
are
not
used
above
a
base
speed
which
is
often
about
20
or
25
mph;
therefor
e ,
the
power
loss
does
not
occur
when
the
train
is
at
normal
cruise
speeds.
Consequently,
the
amount
of
energy
wasted
per
mile
is
a
function
of
the
number
of
stops
per
mile.
Additional
differences
in
power
consumption
would
also
arise
from
differences
in
weight
between
a
cam
and
chopper,
since
power
consumption
is
a
function
of
t h e
total
weight
of
the
vehicle.
Energy
Consumpti
on
The
difference
in
energy
consumpt
i
on
between
chopper
and
cam
control
systems
was
evaluated
by
means
of
computer-
s
imul
ated
test
runs.
The
s
imulation
model
was
developed
to
eva
luate
the
proposals
for
the
Advanced
Conc
ep
t
Train
(ACT-I).
Durin
g
the
simul
ated
run,
a
train
travels
along
a
20-mile
route
with
grades
and
curves
,
stopping
at
stations,
and
carry-
i
ng
various
passe
ng
er
loads.
The
ACT
-I
high-density
route
has
the
properties
shown
in
Table
9
-4.
To
identify
properly
the
energy
consumption
differences,
f
ive
control
systems
and
two
motors
were
eva
luat
ed
. Th e
vari
-
ous
combinations
of
motors
and
cont
r
ols
are
listed
in
Table
9-
5.
Two
motors
were
cons
ide
red
because
a
cam
control
is
not
normally
us
ed
on
a
motor
with
separately
exc
i
ted
fields
such
as
the
Garrett
motor
on
the
SOAC
.
It
is
normally
used
with
a
series
motor
where
it
serves
both
the
armature
and
the
field.
With
a
separately
excited
field
motor,
two
separate
cam
con-
trols
would
be
needed:
on
e
for
th
e
armature
and
one
for
the
170

TABLE
9-4.
HI GH-DENSITY
ROUTE
PROPERTIES
Length
20
miles
Stations
32
Station
dwell
t i me
20
seconds
Number
of
peak-hour
pa:ssengers
Train
length
Minimum
headway
Statio
n
spacings
Maximum
speed
l
imits
Maximum
grade
Substation
total
capacity
Nomi
nal
vo
ltage
Maximum
poten
t
ial
schedule
speed
60,000
(one
way)
8
cars
maximum
(188
passengers
per
car
maximum)
90
seconds
0.25-mile
minimum,
1.50-mile
max
i
mum
50
mph
minimum,
75
mph
maximum
2
percent
202,500
kw
(2-hour
peak)
,
405,000
kw
(5-minute
peak)
600
volts
29.6
mph
(for
+3
mphps
acceleration
and
deceleration)
TABLE
9-5.
MOTOR
AND
CONTROL
COMBINATIONS
Combinat
i
on
No.
Mo
t
or
Fi e
ld
Control
Comments
1
Garrett
Sepa
r
ate
C
hopp
er
Actual
SOAC
system
2
WE-1462
Series
Ch
opper
BART
chopper,
motor
s i
milar
to
BART
3
WE-1462
Ser
i
es
Advanced
Carn
similar
to
cam
PATCO
4
WE
-
1462
Series
Chopper
Red
uc
ed
weight
5
Garrett
Separate
Chopper
Reduc
ed
weight
171

field.
This
would
increase
the
complexity,
unnecessari
ly
pena
li
zing
cam
control
i n
comparison.
Combination
No.
l
(in
Table
9-5)
is
the
actual
SOAC
sys-
tem.
Combination
No.
2
includes
an
off-the
-shelf
series
motor
(Westinghouse
1462)
and
the
same
chopper
contro
l
used
on
BAR
T.
The
WE-1462
has
current
consumption
and
torque-versus-speed
characteristics
similar
to
those
of
the
Garret
t
motor
and
also
resembles
the
WE
-1463
which
is
used
on
the
Bar
t
vehic
les
.
Combination
Ho.
2
was
proposed
by
Westinghouse
for
the
SOAC
program.
Combination
No.
3
used
the
same
series
motor
with
an
advanced
cam-control
system,
similar
to
that
used
on
the
PATCO
(Lindenwold)
vehicles.
The
term
"advanced"
refers
to
the
larg
e
number
of
steps
or
gradations
of
resistance
and
voltage
applied
to
the
motor.
A
cam
with
fewer
steps
would
be
lighter
and
would
probab
ly
save
some
energy,
but
would
not
produce
the
smooth
acceleration
provided
by
the
chopper
and
required
by
the
performance
specifica
t
ions
of
the
newest
transit
systems.
Comparison
of
Combinations
No
. 2
and
3
provides
a
reason-
able
estimate
of
the
energy
saved
using
chopper
control
instead
of
switched
resistors.
Additional
energy
can
be
saved,
however.
The
chopper
controls
of
Combinations
No
.
land
2
are
heavier
than
necessary.
An
eva
luation
of
the
two
sy
stem
s
identified
significant
weight
savings
that
could
be
made
on
production
versions
using
some
components
of
each
chopper.
Comb
ination
No.
4
was
a
hypothetical,
lightweight
chopper
used
with
t
he
WE-1462
series
motor,
while
Combination
No
. 5
was
a
hypothetical
version
us
ed
with
the
Garrett
separate
field
motor.
Both
of
th
ese
are
r
ealis
ti
c
targets
that
can
be
readily
achieved
i n a
production
design.
Table
9-6
presents
a
compilation
of
the
weights
for
each
comb
i
nat
i
on.
Figure
9- 1
shows
maximum
tractive
effort
as
a
function
of
speed,
and
Figure
9
-2
shows
current
consumption
(for
maximum
tractive
effort)
as
a
function
of
speed
for
the
two
motors.
The
weights
and
perfo
rmanc
e
characteristics
w
ere
taken
f
rom
the
manu
facturers
'
specifications.
With
the
weights
and
tractive
effort
curves,
the
simulation
model
determ
in
ed
the
ratio
of
max
imu
m
acceleration
capability
to
speed
for
each
com-
bination
and
th
en
developed
the
speed
profiles
f
or
the
complete
hypothetical
route
.
Once
the
speed
profiles
were
dete
rmined,
the
schedule
speed
(or
average
speed
including
stops)
for
a
20-mile
run
was
determined
for
each
combination.
On
the
basis
of
maximum
short
-
duration
power
capab
iliti
es
,
any
one
of
th
e
com
binations
could
reach
a
28
. 8
-m
ph
schedule
s
peed
;
but
the
175-hp,
one
-
hour
RMS
pow
er
rating
at
motor
output
shaft
was
exceeded
for
172

TABLE
9-
6.
COM
PI LA
TIO
N
OF
SOAC
WEIGHTS
WI
TH
VARIOUS
P
RO
PULSI
ON
AND
CO
NT
ROL
COMBI
NATIONS
COMBINATION
NO
. 1:
ACTUAL
SOAC
VEHICLE
WITH
SEP
ARAT
E F
IE
LD
MOTOR
AND
CHOPPER
CONTROL
•
Assumed
veh
i
cle
weight
:
89,
0
00
l b
(approx
weight
of
SOAC
car)
COMBINATION
NO
. 2 :
WESTL,GHOUSE
1462
SERIES
FIELD
MOTOR
AND
BART
CHOPPER
Vehic
l e wei
ght
determined
by
comparison
of
differing
No . 2
and
No . 1
propulsio
n s y
stem
weights
,
as
follows
:
Item
No . 2
Tr
action
mot
ors
(4)
No. 1
6 ,
240
lb
5,600
lb
Field
po
w
er
supply
(portion
of
auxiliary
power
15
kw/
125
kw x 3
100
lb)
Gear
box
;
coupling,
suspen
-
s i
on,
stabi
l
ization
(4)
Motor
group
subto
t
al
Choppe
rs
/ s
emi-cond
uc
to
rs
Motor
con
t
rol
(
po
wer)
Propulsion
control
(logic)
Input/
l
ine
react
or
Line
switch
(ma
in)
Blowers
and
coolin
g
fa
ns
Control
group
sub
t
otal
3
72
~
11
,
172
975
800
200
4
40
100
280
3,
735
650
3 ,
880
9 , 480
1 ,
575
1,100
90
420
330
505
4 , 825
2 ,
120
Brak
i
ng
r
esistors
(2)
Propulsion
total
(motor,
controls
and
braking
groups)
i
fo.
2
minus
,-Jo
. 1:
16
,
425
-
15,557
=
16,425
868
lb
• W
eig
ht
of
No
.2:
89
,
000
+ 868 =
89
,
868
lb
COMBINATION NO. 3:
WESTINGHO
USE
1462
SERIES
FIEL
D
MOTOR
AND
ADVANCED
CAM
CONTROL
Veh
i
cle
w
eig
ht
determined
by
comparison
of
items
differi
ng
between
No . 3 a nd No . 2 :
No . 3 -
GE
PATCO
C
ar
Eq
uipm
en
t:
Inductive
shunt
395
l b
Ma
i n
co
n
trol
group
logic
1,2
50
Cam c
ontro
l l
er
g
ro
up 1 , 7
00
Aux
iliary
control
gro
up
(field)
525
---
Cam
gro
up
subtot
al 3 ,
870
No
. 2
controls
group
subto
t a l 4 ,
825
,
-J
o . 3 m
inus
i
,o
. 2 : 3 ,
87
0 - 4 ,
825
=
-9
55
• W
ei
ght
of
No . 3 :
89
,
868
-
955
=
88
,
913
lb
1
73
COMBINATION
NO
. 4 :
WESTIN
GHOUSE
14
62
SERIES
FIELD
l-lOTOR
AND
LIG
HTWEIGHT
CHOPPER
Vehicle
weight
de
t
ermined
by
compa
rison
of
items
dif
fer
ing
between
No . 4 a nd
No.
l :
No. 4 :
Motors
,
gearbo
x
es,
sus
pe
ns
ion
,
etc
suspension
,
etc
. 9 ,
480
lb
Cont
rols
group
(weight
optimized
)
Chop
per
(Garrett)
975
Motor
control
(Garrett)
800
Pro
pul
s
io
n
con
t
rol
(Westin
ghou
se
)
90
Fi e l d
contro
l
(est
GE
cam)
500
I
nput/line
filter
(Westinghouse)
420
Motor
reactor
(Westingh
ou
se
)
805
Line
swit
ch
(Garrett)
100
C
ool
in
g
blowers
(
Gar
r e
tt)
280
Control
g
rou
p
sub
t o t
al
B
ra
ke
res
istors
(
Garre
tt)
Total
No. 1
prop
uls
io
n
total
3,970
650
1
4,10
0
15,557
No. 4
minus
No
.
l;
14
,1
00
-
15
,
557
=
-1
,
457
lb
• We i g
ht
of
No .
4:
89
,000
- 1
,4
57
= 8
7,543
lb
COMBINATION
NO
. 5 :
SOAC
SEPARATE FIELD
MOT
OR
AN
D LI
GHTWEIGHT
CHO
PP
ER
Vehicle
wei
g
ht
determined
by
compa
r
ison
of
items
differing
between
No.
5
and
No .
1:
No.
5:
Motors
(Ga
rrett)
Field
po
wer
su
pp
ly
(G
arr
ett)
Gearbox,
etc
.
(Westinghouse)
Motor
gro
up
subtota
l
Con
tr
ol
g
rou
p
(above)
less
field
c
ont
rol
Brake
resistors
(above
)
Total
No.
1
pr
opulsion
total
6,
240
372
3,88
0
10,492
3,970
-
500
650
14,612
15,5
57
No . 5
minus
No . l ; 1
4,612
-
15,557
= -
945
lb
•
Weight
of
No.
5:
89 ,
00
0 - 945 =
88
,0
55
lb
NO
TE : We i
ghts
a
re
from
manufact
u
::ers
'
specs
.

BASE SPEED -
WE
1462
16
14
co
...J
8 12
0
....
cc
10
<(
u
cc
/GARRETT
w
a..
8
I-
cc
0
LL
LL
6
w
w
>
I-
4
WE
1462
u
<(
cc
WEAK
I-
2
FIELD
0 0
20
40
60
80
SPEED (MPH)
Figure 9- 1. Maximum Tractive
Effort
vs
Speed
174

CfJ
LU
a:
LU
0..
~
<(
0
0
~
a:
<(
u
a:
LU
0..
I-
z
LU
a:
a:
=>
u
_J
<(
a:
0
a:
-
:r:
I-
NOTE
THIRD
RAIL
CURRENT
IS
600
VOLTS
16
14
12
10
8
6
4
2
0 0
20
BASE
SPEED
(GARRETT
ENERGY
LOSSES
DUE
TO
SWITCHED RESISTORS
40
SPEED {MPH)
60
WE
1462
80
Figure 9- 2. Electric Current
Usage
(at
Maximum
Tractive
Effort)
vs
Speed
175

the
series
motor
in
Combinations
No.
2,
3,
and
4.
Th e
230-
hp ,
one-hour
rating
of
the
separate
field
motor
was
not
exceeded.
To
make
a
relevant
comparison,
all
combinations
must
be
eval
u-
ated
at
a
schedule
speed
at
which
any
of
them
cou
l d
operate
in
revenue
service.
The
highest
speed
for
the
WE-14
62
was
27.5
mph.
Operating
the
Garret
t
motor
at
27.5
mph
instead
of
28.8
mph
reduced
i
ts
energy
consumption.
By
comparing
all
combinations
at
27.5
mph,
the
motors
were
subject
to
the
same
demands.
The
higher
sp
eed
capability
of
the
separa
t e
fie
l d
mot
or
constitutes
an
additional
net
benefi
t,
if
the
resu
l t i
ng
t i
me
saving
is
more
valuable
than
the
cost
of
the
addit
i
ona
l
energy
consumption.
Revised
speed
profiles
were
developed
for
the
27
.
5-mph
schedule
speed
and,
using
the
current
consumptio
n
characteristics,
the
energy
consumption
per
mi
le
was
deter
-
mined
for
each
combination.
The
energy
losses
from
the
resistors
in
the
cam
system
are
represent
ed
by
the
two
triangles
shown
in
Figure
9-
2.
I n
Fi
g
ure
9-3,
the
same
curve
is
p
lotted
as
a
function
of
time
inst
e
ad
of
speed.
The
time
is
the
number
of
seconds
of
acce
l-
eration
from
zero
mph
at
maximum
tractive
effort
. On
this
graph,
th
e
starting
energy
loss
is
precisely
the
area
of
t he
two
triangles,
0.
502
kw-hr
per
start.
With
32
stations
or
31
starts
on
the
20-mile
route,
there
was
an
average
of
1.
55
starts
per
mile;
1.55
x
0.502
kw-hr=
0.778
kw-hr
per
mile
,
the
aver
age
starting
energy
losses.
Tabl
e
9-7,
summarizing
the
r
esu
lts
of
the
energy
compa
r i -
son,
shows
that
Combinations
No.
1
and
2
had
the
same
energy
consumption,
8.264
kw-hr
per
car-mile.
This
indicates
tha
t,
conincidentally,
the
differences
in
weight
and
power
charac
-
teristics
compensate
for
each
other.
The
energy
consumpt
i
on
for
Combination
No
. 3
(the
cam)
was
0.729
kw
-
hr
per
car
m
il
e
higher
than
Combination
No
. 2
and
0.857
kw-hr
per
car-mile
higher
than
Combination
No
. 4
(the
lightweight
chopper
with
series
motor).
A
car-mile
figure
of
0.857
kw
-
hr
most
accu
-
rate
l y
isolat
es
the
energy
saving
from
us
e
of
chopper
con
t
ro
l
in
place
of
switched
resistor.
Thi
s
resulted
from
the
com
-
parison
of
existing
or
readily
achievable
versions
of
both
control
syster,1s
used
with
the
same
motor
on
the
same
route
.
Combination
No.
5
appears
to
be
in
ferio
r
to
No.
4,
but
this
may
not
actually
be
the
case
.
The
weight
saving
evalua
-
t i
on
for
lightweight
chopper
systems
was
cursory.
A
produc-
tion
design
program
would
save
additional
weight
and
further
reduce
power
consumption.
Also,
the
hi
g
her
schedule
speed
capability
of
No. 5
(f
rom
the
higher
one-hour
power
rating
)
may
outweigh
the
cost
of
the
extra
energy.
It
can
be
co
n-
cluded
that
the
advantage
of
chopper
over
cam
must
be
greater
than
or
equal
to
the
advantage
of
No . 4
over
No .
3;
therefore
,
176

U)
UJ
c:::
UJ
Q.
~
<!
0
0
...
c:::
<!
u
c:::
LU
Q.
I-
z
LU
c:::
c:::
::::>
u
...J
<!
c:::
Cl
c:::
-
I
I-
16
14
12
10
8
6
4
2
0 0
NOTES
1.
THIRD
RAIL
CURRENT
IS600VOLTS
2. VEHICLE HAS 100 PASSENGERS
3. LEVEL
TRACK
,~w---
1
ENERGY
LOSSES
DU
E
TO
SWITCH
ED
RESISTORS:
0.502
KW-HR
PER
START
10
20
30
TIME
FROM
START
(SECONDS)
GARRETT
40
SPEED=
72
MPH
DISTANCE=
3500
FT
WE
1
462
/
SP
EED =
62
MP
H
D
ISTANCE=
3300
FT
50
Figure 9-
3.
Electric Current
Usage
(at Maximum Tractive
Effort)
vs
Time
from
Start
177

f-J
-..J
CX)
TABLE
9-
7.
WEIGH
T
AND
POWER
CONSUMPTION
OF
THE
FIV
E COMBINATIONS
No
. 2
No
. 3
No
. 4
No
. 5
Propulsion!
No.
1
Configurationt-------
.
----------
-----
--------------------
Ac
tu
al
SOAC
system
choppe
r
control
and
separately
ex
-
cited
field
Parameter
""
I
motor
Total
weight
of
vehicle
(
lb)
I
89,000
Energy
consumption
of
motor
and
con-
t
rol
system,
not
including
starting
l
osses
(kw-
hr/ca
r-
m
il
e)
Start
i
ng
resistance
l
osses
,
cam
only
(kw-hr/car-mile)
Auxi
li
ary
power
(kw-hr/car-mile)
Total
energy
con
-
su
mpt
i
on
(kw-hr/
ca
r-
mile)
Saving
in
compari-
son
with
No.
3
(kw-hr/car-mile)
6.809
l.
4
55
8.
264
0.
729
BART
chopper
and
series
motor
89 ,
868
6 .
809
l.
455
8 .
264
0.729
Advanced
ca
m
and
series
mo
tor
88
,9
13
6
.7
60
0.778
1.
4
55
8 .
993
Li
ghtwe
i
ght
ch
opper
a
nd
series
moto
r
8
7,543
6 .
68
1
1.
455
8 .
136
0
.857
Lightweig
ht
chopper
and
separately
exc
ited
f i
eld
88
, 0
55
6.
757
1.
455
8.
212
0.
781

0.857
kw-hr
per
car-mile
was
used
for
the
p
ur
po
se
of
this
study.
Energy
Cost
Saving
Electrical
power
costs
obtained
from
the
American
Transit
Association
' s
1972
Transit
Operating
Report
(Reference
8)
are
shown
in
Table
9-8.
TABLE
9-8.
ELECTRIC
POWER
COSTS
(IN
FOUR
CITIES)
City
(and
System)
New
York
Chicago
Philadelphia
Cleveland
Item
(NYCTA)
(CTA) (PATCO) (CTS)
Kilowatt
hours
1898.3
240.4
39.35 32.09
consumed
(in
mil
lions)
Cost
of
power
43,165
4,322
731
551
purchased
and
generated
(in
thousands
of
dollars)
Cost
per
kw-hr
$0.0228 $0.0180 $0.0186
$0.072
Using
a
cost
of
1.9¢
per
kilowatt-hour,
the
electrical
e n
ergy
cost
for
the
cam
system
(Combination
No.
3)
is
17.1¢
per
car-mile,
while
the
cost
for
the
li
ghtweight
chopp~.r
(Combination
No.
4)
is
15.5¢.
This
is
a
saving
of
1.6¢
per
car-mile
.
Ma
i
ntenance
Cost
Saving
The
SOAC
t
es
ting
program
has
not
progressed
far
enough
to
obtain
s
ignificant
da
ta
on
the
maintenance
savings
of
chopper
contro
l .
Estimates
based
on
European
data
have
indicat
e d
that
maintenance
of
control
switches
would
be
reduced
by
0.3¢
per
car
-mil
e .
Additional
savings
would
be
associated
with
other
components;
howev
e r ,
the
avai
l
ab
l e
data
is
not
co
n
sidered
suf-
ficient
for
predicting
savings
on
the
SOAC
vehicle.
An
additional
problem
in
predicting
maintenance
cost
savings
is
that
reductions
in
actua
l
maintenance
may
not
be
translated
into
cash
savings.
Most
exis
t
ing
systems
h
ave
union
contracts
that
guarantee
a
fixed
number
of
manhours
of
179

maintenance
per
vehicle
mile.
Reducing
the
amount
of
mainte-
nance
written
into
the
contract
would
be
difficult.
Due
to
the
se
uncertainties,
savings
in
maintenance
costs
are
not
included
among
the
quantified
benefits
of
chopper
con
-
trol;
consideration
of
the
energy
savin
g
alone
constitutes
a
conservative
approach
to
the
prob
lem.
Annual
Operating
Cost
Saving
Average
annual
mileage
per
car
i s
show
n
in
Table
9-9.
~ABLE
9-9.
AVERAGE
ANNUAL
MILEAGE PER
CAR
City
(and
System)
New
York
(NYCTA)
Chicago
(CTA)
Philadelphia
(PATCO)
Cleveland
(CTS)
Average
Annual
Mileage
per
Car
51,386
43,146
54,882
32,627
Using
an
annual
mileage
of
50,000
miles,
the
energy
saving
of
1.6¢
per
vehicle
mile
becomes
an
annual
saving
of
$800
per
car.
I
niti
al
Investment
Cost
American
manufacturers
have
believed
that
chopper
control
sys
t e ms
were
more
expensive
to
produce
t
han
switched
resistor
systems.
For
example
,
in
February
1973,
LTV
Aerospace
Corpo-
ration's
bid
for
a
Light
Rail
Ve
hi
cle
with
chopper
control
was
$
18,158
higher
than
with
cam;
Rohr's
differential
was
$47,913.
Bids
on
other
vehic
les
in
recent
years
have
exhibited
comp
ar
-
able
premiums
for
chopper
con
trol.
These
differentials
were
genera
lly
considered
too
larg
e
to
be
justifi
ed
by
an
annual
e
nergy
saving
in
the
neighb
o
rh
ood
of
$800
per
car.
For
example
,
the
present
val
ue
of
an
$800
pe
r
year
saving
during
a
20-ye
~r
vehicle
li
fe
is
$8440
,
usin
g
a 7
percent
interest
rate.
I n
cr
easing
the
initial
investment
cost
by
more
than
$8440
do
es
no t
appear
to
be
worthwhil
e .
Con-
verse
l
y,
du
e
to
inflatio
n
and
the
increasing
cost
of
new
e l e
ctric
po
wer
sources,
the
(per
kilowatt
-
hour)
cost
of
power
is
li
ke
ly
to
ris
e ,
resulting
in
an
i
nc
rease
in
the
value
of
any
savings
.
For
ex
amp
le,
if
the
cost
of
energy
r
ises
by
6
18
0

percent
per
year,
the
present
value
of
the
increased
20-year
savings
would
be
$20,700,
using
the
same
increasing
cost
of
energy
and
interest
rate.
This
indicates
that
paying
up
to
$20,000
extra
for
chopper
control
may
actually
be
worthwhile,
since
it
could
result
in
an
overall
saving
during
the
total
life
of
the
vehicle.
Net
Benefit
of
Chopper
Control
The
annual
benefit
in
energy
saving
due
to
the
use
of
solid
-state
chopper
control
rather
than
switched
resistors
is
about
$800
per
vehicle.
This
figure
can
be
expected
to
rise
as
energy
becomes
more
costly.
Additional
savings
may
also
be
experienced
in
maintenance.
Given
an
equal
purchase
price
for
each
system,
chopper
control
offers
a
net
benefit
during
the
total
life
of
the
vehic
le.
181

References
1.
Compo
nent
Test
Report,
Document
Dl
7 4-
-10024-1,
V
olume
1,
Appendix
I,
Boeing
Ve
rtol
Company,
Philadelphia,
Pa.,
October
1973.
2.
Ib
i
d.,
Appendix
II
.
3.
Ibid
.,
Appendix
III.
4 .
State-o
f
-th
e
-Art
Ca
r
Engineeri
ng
Test
Report,
Docume
nt
Dl74-10026-l,
Boei
ng
Vertol
Com
pany
, P
hi
l
ade
l
phia,
Pa
.,
March
19
7
4.
5.
Inv
es
ti
gatio
n
of
Voltage
Transie
nt
s
and
Spi
kes
in
Direct
Current
Rapid
Transit
Systems
,
DOT
Report
No.
IT
- 06
-0026-
73
-
3,
Urba
n
Mass
Tra
n
sportatio
n
Admin
istrati
on
, Was
hing-
ton,
D.C.,
J
un
e
197
3 .
6.
SOAC
Simu
l
ated
Demonstration
T
est
Report,
Document
Dl74-10028-l,
Boeing
Vertol
Company,
Ph
ila
de
l
phia,
Pa.,
Octo
ber
19
73
.
7.
Grant
, E.
L.
and
W.
G.
Ireson,
Pr
in
cip
l
es
of
Engineering
Economy
,
Fourth
Edition,
The
Rona
l d
Press
Compa
ny,
New
York,
1
964
,
pp
3
5-157.
8 . 1
972
Trans
it
Operating
Report
,
American
Transit
Associ-
ation,
Statistical
Department,
465
L'Enfant
Plaza
West,
Washington
,
D.C.
1
82