Practical Metrics and Models for Return on Investment PDF Free Download
1 / 9/9
100%

Page - 1 -
Practical Metrics and Models for Return on Investment
by David F. Rico
Abstract
Return on investment or ROI is a widely used approach for measuring the value of a new and
improved process or product technology. ROI is also used for measuring the economic value of
popular approaches to software process improvement or SPI. However, ROI still remains a
mystery to some practitioners, along with appropriate techniques for determining the ROI of SPI.
This article explains the ROI of SPI, and introduces practical metrics and models for the ROI of
SPI. Additionally, this article includes practical examples for estimating the ROI of Inspections,
PSPsm, TSPsm, SW-CMM®, ISO 9001, and CMMI®. More importantly, this article helps sort
through the seldom and often confusing literature by identifying a small set of practical metrics,
models, and examples for the ROI of SPI.
Introduction
ROI is a simple arithmetic ratio of benefits to costs, less the costs of course, expressed as a
percentage. That is, benefits less costs are the numerator, and costs are the denominator. ROI
measures magnitude of benefits to costs, benefits returned above costs, profits achieved after
expenses, value of an investment, actual benefits, cost savings, and efficiencies obtained. ROI is
a simple and powerful tool for analyzing costs and benefits. Costs and benefits are most often
expressed in economic or monetary terms. ROI is a measure of value in dollars and cents. First,
benefits are identified and expressed in monetary terms. Then, detailed costs are counted. After
the costs and benefits are identified and counted, ROI is calculated by dividing the benefits less
costs by the costs, and multiplying the result by 100%. A large ROI indicates money well spent.
2,542%
114%
158%
661%
2,192%
3,217%
%
500%
1,000%
1,500%
2,000%
2,500%
3,000%
3,500%
Inspections PSPsm TSPsm SW-CMM® ISO 9001 CMMI®
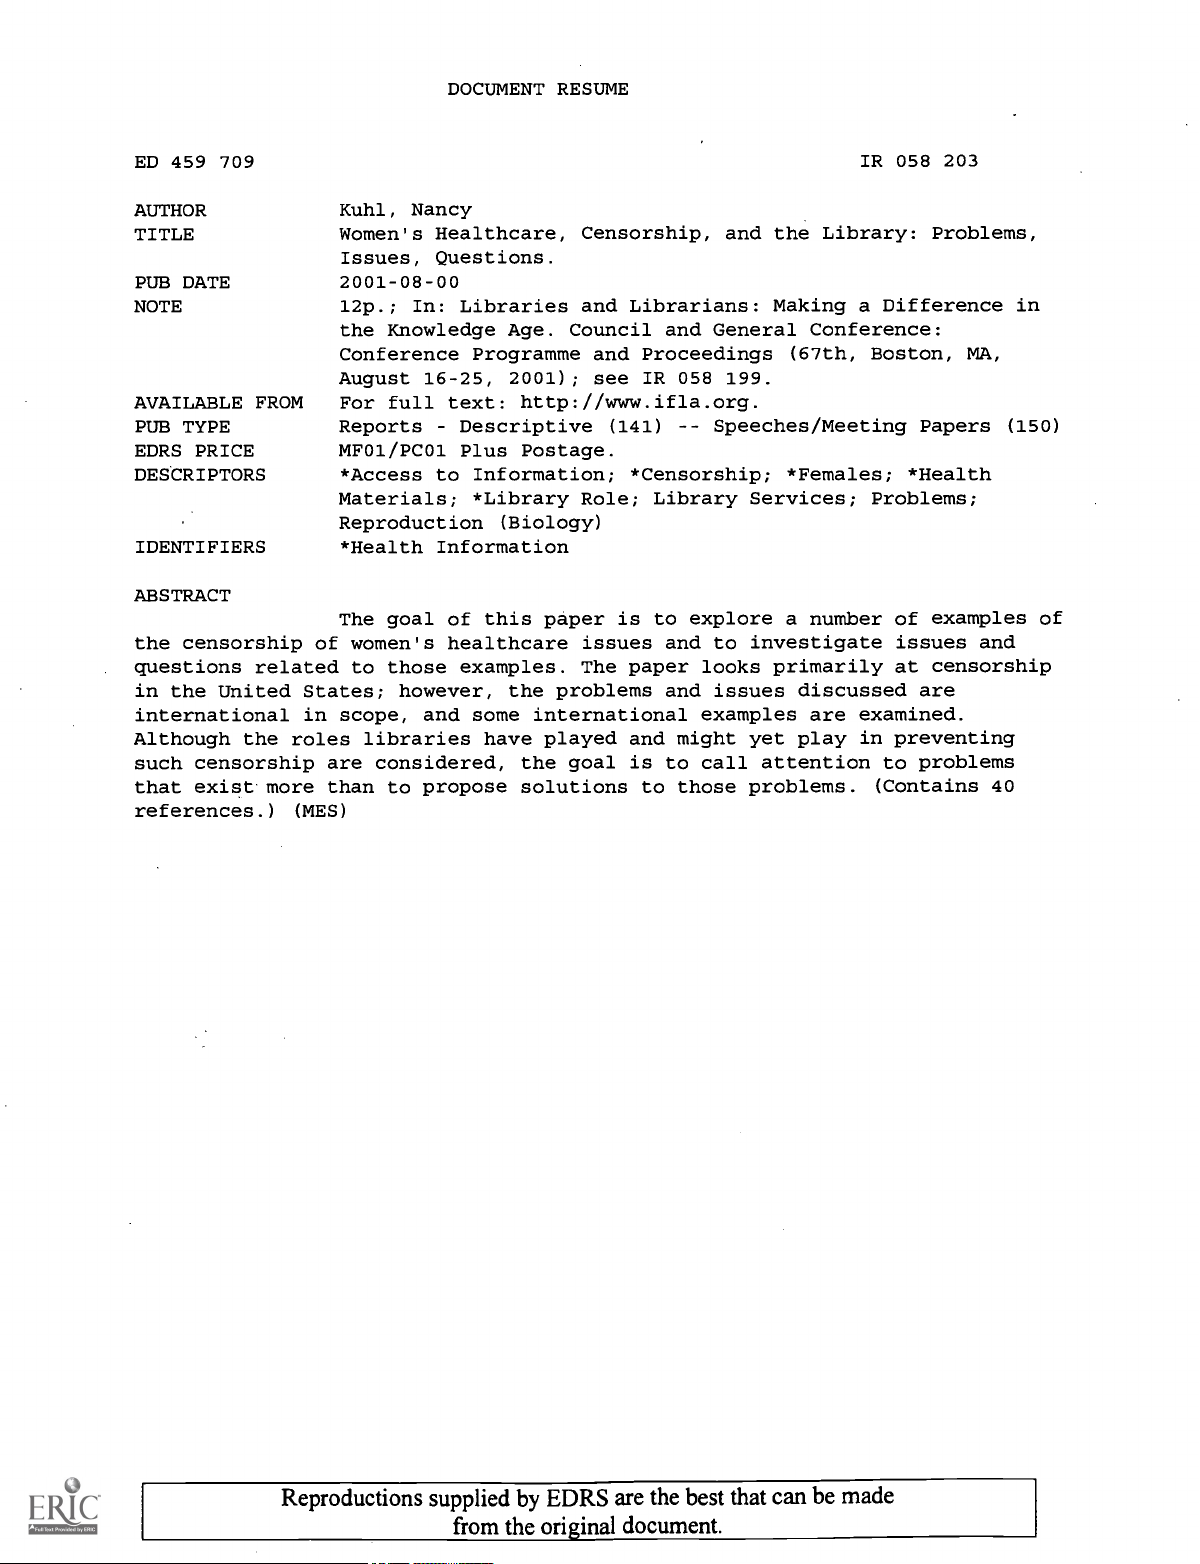
Figure 1, ROI of various SPI methods showing decreasing return on investment from left to right.
sm PSP and TSP are service marks of Carnegie Mellon University.
® SW-CMM and CMMI are registered in the U.S. Patent and Trademark Office by Carnegie Mellon University.

Page - 2 -
There are a variety of SPI methods for support processes, training programs, management, and
supplier selection. Examples include Inspections, PSPsm, TSPsm, SW-CMM®, ISO 9001, and
CMMI®. Inspections are meetings held to identify defects in software work products. PSPsm is a
curriculum for teaching software engineers basic project and quality management principles.
TSPsm is a project, quality, and life cycle management method for large teams of software
engineers. SW-CMM® and CMMI® are guidelines for selecting U.S. DoD suppliers. And, ISO
9001 is a set of quality management system requirements for selecting European suppliers. The
next step is to identify metrics and models to determine the ROI of these SPI methods.
ROI Metrics
ROI metrics are designed to measure the economic value of a new and improved software
process. Each ROI metric is a relevant indicator of how much a new and improved software
process is worth. There are only six basic metrics related to ROI, as shown in Table 1. They are
costs, benefits, net present value or NPV, benefit/cost ratio or B/CR, return on investment or
ROI, and break even point or BEP.1 Each ROI metric builds upon its predecessor and refines the
accuracy of the economic value of a new software process. ROI metrics are not independent or
mutually exclusive. Each ROI metric must be considered individually. For example, costs may
be astronomical or benefits may be negligible, marginalizing the relevance of the other metrics.
Table 1, ROI metrics showing simplicity of return on investment formulas and their order of application.
Metric Definition Formula
Costs Total amount of money spent on a new
and improved software process ∑
=
n
ii
Cost
1
Benefits Total amount of money gained from a
new and improved software process ∑
=
n
ii
Benefit
1
NPV Discounted benefits based on inflation Years
RateInflation
Benefits )_1( +
B/CR Ratio of benefits to costs Costs
Benefits
ROI Ratio of adjusted benefits to costs %100×
−
CostsCostsBenefits
BEP Point when benefits meet or exceed cost 1__ −CostsNewCostsOld Costs
Costs consist of the amount of money an organization has to pay in order to implement a SPI
method. Benefits generally consist of the amount of money saved by implementing a SPI
method. NPV is a method of adjusting or reducing the estimated benefits of a SPI method based
on projected or future inflation over time. B/CR is a simple ratio of the amount of money saved
implementing a new SPI method to the amount of money consumed.2 ROI is also a ratio of
money saved to money consumed by a new SPI method expressed as a percentage. However, the
ROI metric demands that the costs of implementing the SPI method must first be subtracted from
the benefits.3 Break even point is a measure of the amount of money that must be spent on a new
SPI method before it begins yielding its benefits.

Page - 3 -
Cost Models
Cost models are simple equations, formulas, or functions that are used to measure, quantify, and
estimate the effort, time, and economic consequences of implementing a new SPI method. A
single cost model may be all that is necessary to estimate the cost of implementing a simple SPI
method such as PSPsm and TSPsm.1 It may be necessary to combine the results of multiple cost
models together in order estimate the costs of implementing SPI methods such as Inspections.1,4
The results of multiple cost models must be combined with other empirical data to estimate the
complete costs of implementing complex SPI methods such as SW-CMM® and CMMI®.1 There
are eight basic cost models which are useful for estimating key cost elements of the six major
SPI methods as shown in Table 2. There are cost models for Inspections effort and training,
PSPsm and TSPsm training, and SW-CMM®, ISO 9001, and CMMI® processes and products.1
Table 2, Cost models of various SPI methods with worked examples for a four person team implementing
10,000 lines of code.
Method Cost Models and Worked Examples Hours Costs
LOC / (Review_Rate × 2) × (Team_Size × 4 + 1)
Inspections
(effort) 10,000 / (120 × 2) × (4 × 4 + 1) 708 a $70,833
Team_Size × (Fee / Rate + Hours)
Inspections
(training) 4 × (410 / 100 + 24) 112.4 b $11,240
Team_Size × ((Fee + Expenses) / Rate + Hours)
PSPsm
(training) 4 × ((5,000 + 5,400) / 100 + 160) 1,056 c $105,600
Team_Size × ((Fee + Expenses) / Rate + Hours) + PSP
TSPsm
(training) 4 × ((4,000 + 2,700) / 100 + 40) + 1,056 1,484 d $148,400
561 + 1,176 × Number_of_Projects
SW-CMM®
(process) 561 + 1,176 × 1 1,737 e $173,700
546 + 560 × Number_of_Projects
ISO 9001
(process) 546 + 560 × 1 1,106 f $110,600
(10,826 + 8,008 × Number_of_Projects) / 2
CMMI®
(process) (10,826 + 8,008 × 1) / 2 9,417 g $941,700
While a discussion of the eight cost models is beyond the scope of this article, the major inputs,
terms, and cost drivers will be explained. LOC refers to lines of code implemented, Review_Rate
refers to how fast a product is inspected, and Team_Size refers to the number of inspectors and
PSPsm and TSPsm trainees. Fee refers to the cost per person for Inspections, PSPsm, and TSPsm
training and Rate refers to the fully burdened cost of an Inspections, PSPsm, and TSPsm trainee.
Hours refer to the length of time a trainee spends in Inspections, PSPsm, and TSPsm training and
Expenses refers to cost of airlines, meals, hotels, and other incidentals. PSP in the TSPsm training
cost model simply indicates that individual TSPsm costs and must be combined with PSPsm costs.
Number_of_Projects refer to the number of software projects that will be appraised or audited.
The constants 561, 546, and 10,826 refer to the effort required to define software processes for
SW-CMM® and CMMI® Levels 3, as well as ISO 9001 Registration. And, the constants 1,176,
560, and 8,008 simply refer to the effort required to meet the documentation requirements for
SW-CMM® and CMMI® Levels 3, as well as ISO 9001 Registration.

Page - 4 -
Benefit Models
Benefit models are simple equations, formulas, or functions that are used to measure, quantify,
and estimate the economic value, profit, savings, or reward of implementing a new SPI method.
SPI methods are designed and implemented in order to yield economic or monetary benefits such
as increased customer satisfaction, productivity, quality, cost savings, and cycle time reduction.
A long used, classical, and authoritative approach to quantifying the benefits of SPI methods is
to measure total life cycle costs before and after the introduction of a new SPI method.1 There
are seven benefit models or total life cycle cost models which are very useful for estimating the
economic value of the six major SPI methods as shown in Table 3. There are benefit models for
old costs, Inspections, PSPsm, TSPsm, SW-CMM®, ISO 9001, and CMMI®.1
Table 3, Benefit models of various SPI methods with worked examples for a four person team implementing
10,000 lines of code.
Method Benefit Models and Worked Examples Hours Costs
LOC × 10.51 - Test_Hours × 9
Old Costs 10,000 × 10.51 - 6,666.67 × 9 45,100 h $4,509,997
LOC × 10.51 - Inspection_Hours × 99 - Test_Hours × 9
Inspections 10,000 × 10.51 - 708.33 × 99 - 1,950 × 9 17,425 i $1,742,533
LOC / 25
PSPsm 10,000 / 25 400 j $40,000
LOC / 5.9347
TSPsm 10,000 / 5.9347 1,685 k $168,501
LOC × 10.2544 - Inspection_Hours × 99 - Test_Hours × 9
SW-CMM® 10,000 × 10.2544 - 708.33 × 99 - 1,950 × 9 14,869 l $1,486,933
LOC × 10.442656 - Test_Hours × 9 - Rework_Savings
ISO 9001 10,000 × 10.442656 - 6,670 × 9 - 4,995 39,402 m $3,940,156
LOC × 10.2544 - Inspection_Hours × 99 - Test_Hours × 9
CMMI® 10,000 × 10.2544 - 708.33 × 99 - 1,950 × 9 14,869 n $1,486,933
Total life cycle cost is an estimate of complete software development and maintenance costs.1
The basic form of the total life cycle cost model is LOC × (Defect_Rate × 100 + Software_Effort
/ 10,000) – Inspection_Hours × 99 – Test_Hours × 9.1 LOC refers to lines of code, Defect_Rate
refers to the defect injection rate, and Software_Effort refers to analysis, design, and coding
hours. Inspection_Hours and Test_Hours are self explanatory. With a Defect_Rate of 10% or 0.1
and a Software_Effort of 5,100, the basic total life cycle cost model simplifies to LOC × 10.51 –
Inspection_Hours × 99 – Test_Hours × 9. This total life cycle cost model signifies complete
software development and maintenance costs, less the benefits of Inspections and testing. If no
Inspections or testing are performed, then the total life cycle cost is LOC × 10.51 or 105,100
hours for a 10,000 line of code application. If we perform 708.33 hours of Inspections and 1,950
hours of testing, then the total life cycle cost is LOC × 10.51 – 708.33 × 99 – 1,950 × 9 or 17,425
hours, a savings of 87,675 hours. (This is an extensible model which can be calibrated for
varying defect rates, software effort, and Inspections and testing efficiencies. Furthermore, it can
be augmented to model the economics of automatic static source code analysis and analyzers.1)

Page - 5 -
The Old Cost benefit model represents a reliance on 6,667 testing hours to remove 667 defects,
or 45,100 total life cycle hours for 10,000 lines of code. The Inspections benefit model represents
a balance of 708.33 Inspections hours and 1,950 testing hours, or 17,425 total life cycle hours for
10,000 lines of code. The PSPsm and TSPsm benefit models signify a productivity of 25 and
5.9347 lines of code per hour, or 400 and 1,685 total life cycle hours for 10,000 lines of code.
(The PSPsm and TSPsm benefit models don’t use the total life cycle cost model because they
result in zero defects, and therefore exhibit little or no post-delivery economic activity.) The SW-
CMM® benefit model results in 2,544 development hours at Level 3, 708.33 Inspections hours,
and 1,950 testing hours, or 14,869 total life cycle hours for 10,000 lines of code. The ISO 9001
benefit model results in 4,426.56 development hours, 6,670 testing hours, and Rework_Savings
of 4,995 hours, or 39,402 total life cycle hours for 10,000 lines of code. The CMMI® benefit
model results in 2,544 development hours at Level 3, 708.33 Inspections hours, and 1,950 testing
hours, or 14,869 total life cycle hours for 10,000 lines of code.
Cost and Benefit Summary
The cost and benefit summary helps organize the results of the cost and benefit models. The
eight major cost and benefit factors are placed against the six major SPI methods as shown in
Table 4. The eight major cost and benefit factors are Inspections, training, process (includes
products), preparation (for appraisals), appraisal, audit, old costs, and new costs. The values for
the first six cost factors are derived from Table 2, with the exception of preparation, appraisal,
and audit costs. Preparation costs consist of indoctrination courses, response conditioning
exercises, and mock appraisals. Appraisal costs consist of the costs for the planning, preparation,
and appraisal stages, as well as the appraisal fees. The preparation, appraisal, and audit costs
were based on bottom up estimates, and no cost models were created to aid in their estimation.
The total costs are a simple summation of the values from cost factors one through six. (The
letters A through G correspond to the cost model values from Table 2.) The values for old costs
and new costs are derived from Table 3. The total benefits are the difference of old costs and
new costs. (The letters H through N correspond to the benefit model values from Table 3.)
Table 4, Cost and benefit summary of various SPI methods for a four person team implementing 10,000 lines
of code.
Factor Inspections PSPsm TSPsm SW-CMM® ISO 9001 CMMI®
1. Inspections a $70,833 n/a n/a a $70,833 n/a a $70,833
2. Training b $11,240 c $105,600 d $148,400 n/a n/a n/a
3. Process n/a n/a n/a e $173,700 f $110,600 g $941,700
4. Preparation n/a n/a n/a ∗ $36,800 ∗ $26,400 ∗ $48,000
5. Appraisal n/a n/a n/a ∗ $30,100 n/a ∗ $47,700
6. Audit n/a n/a n/a n/a ∗ $36,000 n/a
Costs $82,073 $105,600 $148,400 $311,433 $173,000 $1,108,233
7. Old Costs h $4,509,997 h $4,509,997 h $4,509,997 h $4,509,997 h $4,509,997 h $4,509,997
8. (New Costs) i ($1,742,533) j ($40,000) k ($168,501) l ($1,486,933) m ($3,940,156) n ($1,486,933)
Benefits $2,767,464 $4,469,997 $4,341,496 $3,023,064 $569,841 $3,023,064
(
∗
Preparation, appraisal, and audit costs determined without the aid of a cost model.)

Page - 6 -
ROI Summary
The ROI summary illustrates total costs and benefits and the calculation of net present value,
benefit/cost ratio, return on investment, and break even point for each of the six SPI methods.
Table 5 shows the values of NPV, B/CR, ROI, and BEP using the metrics from Table 1. NPV is
used to discount the benefits using the formula Benefits / (1 + Inflation_Rate) Years or Benefits / (1
+ 0.05) 5. B/CR is used to determine the magnitude of benefits to costs using the formula
Benefits / Costs. ROI is used to determine the magnitude of benefits to costs based on adjusted
benefits using the formula (Benefits – Costs) / Costs × 100%. BEP is used to determine when the
SPI method begins yielding its benefits using the formula Costs / (Old_Costs / New_Costs – 1).
Table 5, Net present value, benefit/cost ratio, return on investment, and breakeven point examples of various
SPI methods for a four person team implementing 10,000 lines of code.
Method Costs Benefits NPV B/CR ROI BEP
Inspections $82,073 $2,767,464 $2,168,380 26:1 2,542% $51,677
PSPsm $105,600 $4,469,997 $3,502,360 33:1 3,217% $945
TSPsm $148,400 $4,341,496 $3,401,676 23:1 2,192% $5,760
SW-CMM® $311,433 $3,023,064 $2,368,650 8:1 661% $153,182
ISO 9001 $173,000 $569,841 $446,485 3:1 158% $1,196,206
CMMI® $1,108,233 $3,023,064 $2,368,650 2:1 114% $545,099
The BEP values represent total costs spent on a new SPI method before the benefits are
realized.5 The BEP values should be divided by 400 to account for Team_Size and Rate. The
BEP for Inspections is 129 hours or three weeks, PSPsm is two hours, and TSPsm is 14 hours or
two days. The BEP for SW-CMM® is 383 hours or 2.2 months, ISO 9001 is 2,991 hours or 1.4
years, and CMMI® is 1,363 hours or eight months. Figure 2 is a graphical representation of the
costs, benefits, and ROI values from Table 5. Notice that the costs dramatically increase from
left to right as illustrated by the red bar in Figure 2. Also notice that the benefits and ROI sharply
decrease from left to right as illustrated by the green and blue bars in Figure 2.
0.00
0.20
0.40
0.60
0.80
1.00
1.20
Inspections PSPsm TSPsm SW-CMM® ISO 9001 CMMI®
Costs
Benefits
ROI
Figure 2, ROI examples (normalized) showing increasing costs, decreasing benefits, and decreasing return on
investment from left to right.

Page - 7 -
Recommendations
The goal of this article was to introduce practical metrics and models for return on investment.
The goals also included introducing basic concepts in ROI, simple metrics for ROI, useful
models for costs and benefits, and extensive examples using mainstream methods for SPI. Six
simple ROI metrics were introduced for costs, benefits, net present value, benefit/cost ratio,
return on investment, and break even point. And, fourteen cost and benefit models were
introduced for Inspections, PSPsm, TSPsm, SW-CMM®, ISO 9001, and CMMI®. More
importantly, each of the ROI metrics and models were thoroughly exercised to demonstrate how
return on investment is estimated for software process improvement. (As an aside, important
concepts in total life cycle costs were introduced to estimate the benefits of SPI. The estimation
of benefits is perhaps the most elusive concept in the fields of ROI and SPI.)
$43,250
$77,858
$37,100
$20,518
$277,058
$26,400
$0
$50,000
$100,000
$150,000
$200,000
$250,000
$300,000
Inspections PSPsm TSPsm SW-CMM® ISO 9001 CMMI®
Figure 3, Cost per person showing increasing costs for various SPI methods from left to right.
As mentioned near the beginning of this article, ROI metrics are not mutually exclusive. The
result or value of one ROI metric should not overshadow the value of another. For instance,
Figure 1 illustrates impressive ROI values of 2,542%, 3,217%, 2,192%, 661%, 158%, and 114%
for Inspections, PSPsm, TSPsm, SW-CMM®, ISO 9001, and CMMI®. Before you run out and
immediately implement one of these methods, you must consider the costs. The cost per person
for these SPI methods is $20,518, $26,400, $37,100, $77,858, $43,250, and $277,058 as shown
in Figure 3. These figures may not seem daunting for monolithic well endowed non-profit
organizations. However, you can rest assured knowing that the average commercial firm could
not afford the least expensive of these SPI methods. The probability of sustained commitment
and execution of expensive and manually-intensive software processes is nearly zero.
• Choose a simple set of metrics and models for ROI: Use the ROI metrics recommended in
this article. They’re simple, classical, authoritative, and well established. You can’t go wrong
using these metrics. There are hundreds of confusing metrics littered throughout literature.
• Don’t spend a lot of money to achieve a high ROI: Don’t implement SPI methods with a
high ROI and high costs. It’s not necessary to spend a lot of money to achieve a good ROI.
There are methods with even higher ROI and lower costs than those mentioned here.

Page - 8 -
• Don’t go bankrupt using expensive SPI methods with a low ROI: Don’t implement
expensive SPI methods with a low ROI. The goal of SPI is to improve the economic
performance of your organization. The goal of SPI is not to confound your economic posture.
• Seek low cost automated SPI methods with a high ROI: There are many SPI methods
from which to choose. Don’t feel obligated to implement one of the SPI methods mentioned
here. The best SPI methods are automated solutions, such as automatic static analyzers.
• Don’t wait until you’re SW-CMM®/ CMMI® Level 5 to use ROI: The field of ROI is all
about metrics and models. Some people still believe software measurement is only for Level
4 and 5 organizations. Balancing your budget is for everyone, not just mathematicians.
• Don’t spend too much money measuring ROI: Estimating the ROI of SPI can be quickly
performed by everyone. Some ROI methodologies recommend hiring scientists to estimate
ROI over a period of months and years. Don’t consume your benefits looking for ROI.
• Proactively plan for ROI, don’t wish for ROI after-the-fact: Identify SPI methods with
proven ROI values, implement them, and then measure the results yourself. Don’t implement
expensive SPI initiatives with little ROI, and then hire teams of consultants to hunt for ROI.
• Use ROI to right size a SPI program for your organization and overhead budget: Study
the ROI concepts in this article, identify SPI methods with known ROI characteristics, and
then design a SPI program that’s right for your organization’s economic posture.
• Apply metrics and models for ROI before it’s too late: ROI metrics and models are for
everyone. Use ROI to give yourself a strategic advantage. If you don’t use ROI, your
competitors will. The technological revolution is all about ROI, or being better, faster, and
cheaper. Ride the technology wave driven by ROI, instead of getting swept away by change.
Everyone should manage a SPI program like they are personally paying for the costs. Use ROI
metrics and models to manage your SPI program like this is coming out of your personal
paycheck. The ROI metrics and models exhibited in this article are simple, but are not perfect.1
However, the process for estimating ROI is extensible, improvable, and highly useful.2-4 Use the
ROI framework in this article with great care, especially when you are committing the priceless
economic resources which form the foundation of your organization’s future success.5
References
1. D.F. Rico, ROI of Software Process Improvement: Metrics for Project Managers and
Software Engineers, J. Ross Publishing, Boca Raton, FL, 2004.
2. D.F. Rico, “How to Estimate ROI for Inspections, PSPsm, TSPsm, SW-CMM®, ISO 9001, and
CMMI®,” DoD Software Tech News, Vol. 5, No. 4, Nov. 2002, pp. 23-31.
3. D.F. Rico, “The Return on Investment in Quality, TickIT International,” Vol. 4, No. 4, Oct.
2002, pp.13-18.
4. D.F. Rico, “Software Process Improvement: Modeling Return on Investment (ROI).” Proc.
2002 National SEPG Conf., Software Engineering Inst., Pittsburg, 2002.
5. D.F. Rico, “Using Cost Benefit Analyses to Develop Software Process Improvement (SPI)
Strategies,” Contract Number SP0700-98-D-4000, AFRL/IF, DACS, Rome, NY, 2000.

Page - 9 -
About the Author
David F. Rico is a software process improvement consultant specializing in cost, benefit, and return on
investment analysis. He helped capture a $250M NASA software engineering modernization contract, design
software for NASA's $20B space station, spearhead SW-CMM® and ISO 9001 initiatives for Fujitsu in Tokyo,
Japan, modernize a family U.S. Air Force static radar ranges, reengineer 36 military logistics depots in Cairo,
Egypt, design a $30B constellation of U.S. Air Force satellites, conduct a $42M U.S. Navy source selection,
design a $70M cost model for U.S. Navy aircraft, and participate in over 15 SW-CMM® initiatives. He’s been an
international keynote speaker, published numerous articles, holds a B.S. in Computer Science and an M.S.A. in
Software Engineering, and has been in the field of computer programming since 1983. (http://davidfrico.com)