The Daft.ie House Price Report PDF Free Download
1 / 14/14
100%

Introduction by Ronan Lyons, Economist, Daft.ie
The Daft.ie House Price Report
An analysis of recent trends in the Irish residential sales market
2012 Q4

Introduction
Ronan Lyons, Economist, Daft.ie
Ireland is emerging from one of the worst property market downturns in the post-war
developed world. Economists typically focus on what are termed “real house prices”,
i.e. comparing house prices with prices elsewhere in the economy. Studies show that
severe housing busts are typically long and brought about in large part by higher prices
elsewhere in the economy, and perhaps also a weakening currency.
In contrast, however, Ireland’s housing bust has been remarkably rapid and has occurred
entirely without ination elsewhere in the economy. And, by necessity, there has been no
devaluation of the currency used in Ireland – which is now continental, not national. In
this sense, the Irish crash looks more like a US city or state – such as Detroit or Nevada –
than other national housing crashes.
End of the downturn?
How can we say that Ireland is actually emerging from the downturn? In one sense, we
can’t. In large parts of the country, particularly in Munster, Connacht and Ulster outside
the cities, there are still the same symptoms as we enter 2013 – rapidly falling prices
(up to 20% in the last year, in some places), a large overhang of houses on the market
and only a small proportion of properties selling in four months, a reasonable time in a
healthy market, for any property to nd a buyer.
2 | The Daft.ie House Price Report – 2012 Q4 Continued on next page >
2013: After six years,
time to build again?
Ronan Lyons is an
economic researcher
based at Balliol College,
Oxford, where he lectures
and is undertaking
his doctorate in urban
economics. He is also
Economist with Daft.ie

3 | The Daft.ie House Price Report – 2012 Q4
Nonetheless, in Dublin in particular, but also in its hinterland and in the other cities, there are a
growing number of indications – many of them contained in this report – that the market in late
2012 is by far the closest to stable in a long time.
For example, this time last year, asking prices in South County Dublin were falling at an annual rate of
22%. In the nal quarter of 2012, they were actually 3% higher than a year previously. In Dublin city
centre, prices fell by 25% during 2011 – but rose marginally over the course of 2012. In contrast, asking
prices are still falling rapidly in Munster, Connacht and Ulster. Indeed, for the rst time since prices
started to fall, the fall from the peak is greater in Connacht-Ulster (55.9%) than in Dublin (55.4%).
There are some who doubt the relevance of asking prices. And yet, these encouraging signals from
asking prices are repeated across a range of other indicators. For example, this is the rst Daft.ie
Report which also includes an analysis of transactions prices, based on the new Residential Property
Price Register.
A major limitation of the Price Register is the lack of information on the property sold, for example
type or size. For roughly 5,000 transactions in 2012, it has been possible to match back to the
original listing on Daft.ie. This enables the like-for-like analysis required to say denitively whether
and how fast prices are rising or falling. And the picture is remarkably similar to what is emerging
from asking prices. For example, in South County Dublin, the annual fall in prices went from 20% a
year ago to just 1% now.
Supply-side issues
Ultimately, prices are the symptom – the outcome of the market process – rather than the cause. To see
what will happen next, we must look to what is happening underlying supply and demand. In relation to
supply, the total number of properties on the market nationwide is at its lowest in ve years.
This is being driven by Dublin, where there are fewer properties for sale than at any point since
February 2007. The number of properties sitting on the market has fallen by 50% in the last couple
of years. There is now no backlog of Celtic Tiger housing in the capital. Even in Munster and
Connacht-Ulster, stock for sale is back at mid-2008 levels, although this represents a fall of 20%,
rather than 50%, in the numbers sitting on the market.
Introduction
Ronan Lyons, Economist, Daft.ie
2013: After six years,
time to build again?
Continued on next page >

Similarly, the Dublin market is showing very healthy gures for the time taken to sell a property.
Nationwide, it is now the case that 4 in 10 properties are selling within 4 months, compared to 3 in
10 a year ago. Once again, this improvement is being driven by Dublin, where almost two thirds of
properties sell within 4 months currently. There has also been an improvement in time-to-sell in the
other cities and in Leinster. In Munster and Connacht-Ulster (excluding the cities), there has been
very little improvement in conditions.
Looking to 2013
Looking ahead to 2013, it is clear that the end of mortgage interest relief may have an adverse
impact on the market in the rst half of the year. Eectively, some of the demand from 2013 was
stolen and crammed into 2012 instead. Nonetheless, levelling the playing eld between buying
and renting long-term is an important step in creating a healthy property market. As is an annual
property tax, which is eectively replacing Celtic Tiger-era stamp duty.
Nonetheless, all the indications are that a balance has been reached in Dublin – and possibly in
the other cities – between supply and demand. With the pull of the cities stronger in the crash, the
Government needs to start planning now for building the new homes the cities will need over the
coming decade. This may sound odd, as property oversupply still blights much of the country, but
the mistakes of the past should not mean avoiding making more mistakes in the future.
4 | The Daft.ie House Price Report – 2012 Q4
Introduction
Ronan Lyons, Economist, Daft.ie
2013: After six years,
time to build again?

Year-on-year change in asking
prices, Q4 2012
5 | The Daft.ie House Price Report – 2012 Q4
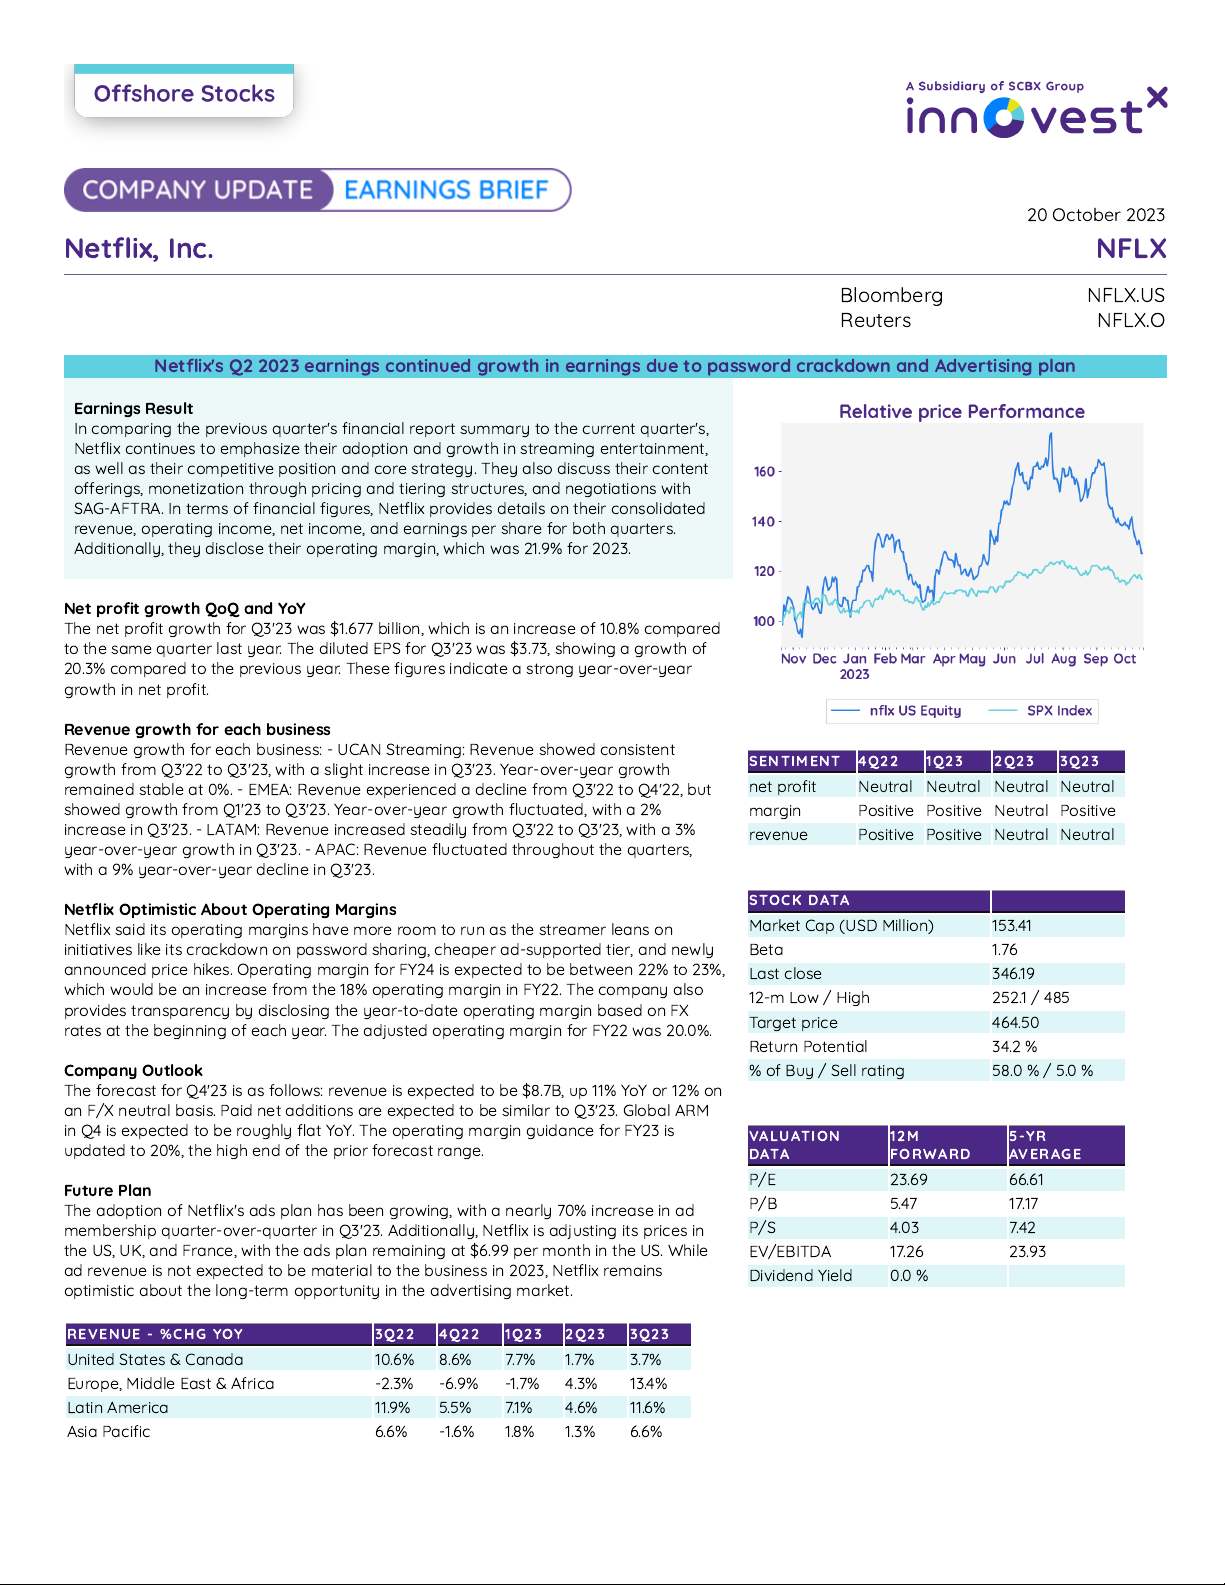
€177,642 | Change: -8.9%
€138,245 | Change:-9.4%
Galway
€137,659 | Change:-19.2%
Sligo
€125,808 | Change:-17.3%
€98,754 | Change:-19.9%
€134,122 | Change:-20.9%
€119,649 | Change:-21.0%
€114,692 | Change:-8.4%
Kerry
€156,205 | Change:-13.7%
€142,536 | Change:-12.1%
Cork
€161,617 | Change:-13.2%
Waterford
Meath
€167,995 | Change: -10.6%
Cork City
€172,750 | Change: -8.7%
Laois
€102,521 | Change:-13.0%
Offaly
€129,147 | Change:-12.7%
Limerick
€154,391 | Change:-12.1%
Kilkenny
€141,933 | Change:-9.4%
Waterford City
€112,864 | Change: -16.7%
Galway City
€163,230 | Change: -10.1%
Mayo
€125,773 | Change:-20.5%
Donegal
€122,797 | Change:-18.2%
Roscommon
€102,005 | Change:-22.5%
Limerick City
€144,562 | Change: -9.3%
Clare
€144,043 | Change:-15.5%
Wicklow
€224,705 | Change: -6.7%
Louth
€156,132 | Change:-11.4%
Dublin City Centre
€181,220 | Change: 0.1%
West Dublin County
€163,156 | Change: -6.9%
North Dublin County
Dublin
Close-up €204,548 | Change: -4.8%
South Dublin County
€333,828 | Change: 3.1%
North Dublin City
€214,597 | Change:- 3.1%
South Dublin City
€232,622 | Change: -2.5%
Wexford
€133,457 | Change:-10.0%
Carlow
€136,376 | Change:-13.9%
Kildare
Westmeath
Leitrim
Monaghan
Cavan
Longford
Tipperary
€163,512 | Change:-15.8%

The Daft.ie Asking Price Index is based on asking prices for properties
posted for sale on Daft.ie. An index based on asking price, as opposed
to closing price, is a measure of sellers’ expectations. Figures are
calculated from econometric regressions, which calculate changes
in price that are independent of changes in observable measures of
quality, such as location, or bedroom number.
Daft.ie Asking Price Index
-9.2%
Asking prices in the nal quarter of 2012 were 9.2% lower than a year
previously. The average asking price nationwide is now €171,000,
down 54.8% from the peak.
6 | The Daft.ie House Price Report – 2012 Q4
2012 average = 100
Falls in asking prices
slow considerably
As with asking prices, there was a marked decline in
house prices during 2012. While prices in late 2011
were 18.7% lower than a year previously, by late 2012,
the rate of prices falls had eased to 8%.
Prices outside the cities
and Leinster continue to fall
While prices in the ve main cities and in Leinster look
to be stabilising, prices in Munster were 13% lower in
late 2012 than a year previously and in Connacht-Ulster
were 18% lower.
Flow of properties on to
the market falls 18%
The total number of properties put up for sale in 2012
(33,600) is 18% lower than in 2011, itself more than
60% below the 112,000 posted for sale in 2007.
Two in ve properties sells
within four months
The proportion of propreties nding a buyer within
four months nationwide has risen from 30% a year ago
to 39% in December 2012.
Stock of properties on Daft.ie
Stock of properties on Daft.ie (start of month) and ow of properties, 2007-2012
0
10000
20000
30000
40000
50000
60000
70000
2007 II III IV 2008 II III IV 2009 II III IV 2010 II III IV 2011 II III IV 2012 II III IV
0
2000
4000
6000
8000
10000
12000
14000
■Stock ■Flow
Asking Prices, Residential Sales
(2007 average = 100)
January
February
March
April
May
June
July
August
September
October
November
December
2006
183.7
198.6
196.5
201.8
204.1
205.3
207.6
208.7
212.1
212.9
211.2
213.4
2007
212.7
214.6
212.9
213.5
214.8
214.2
214.4
213.1
211.3
210.6
208.9
209.7
2008
209.0
208.1
205.6
204.2
202.1
199.3
197.6
194.8
193.1
189.5
183.5
182.3
2009
180.2
176.6
172.8
171.4
167.9
164.6
162.4
158.5
156.5
154.2
150.5
148.6
2010
149.3
148.0
144.7
144.4
142.7
139.9
136.7
136.6
135.2
132.2
129.2
128.4
2011
127.2
127.1
124.5
121.4
119.9
115.8
115.4
113.6
113.5
108.3
106.0
105.4
2012
105.3
104.2
102.4
101.8
102.3
99.6
98.0
99.0
97.1
98.4
96.0
95.9

The Daft.ie Price Register Index is based on prices for residential
properties recorded on propertypriceregister.ie, for which matches were
found in the daft.ie archives. Because these are entered with a lag by
solicitors, figures for previous quarters are subject to revision. Figures
are calculated from econometric regressions, which calculate changes
in price that are independent of changes in observable measures of
quality, such as location, type, or size.
Daft.ie Price Register Index
-8.0%
Prices recorded with the Residential Property Price Register
in the nal quarter of 2012 were 8.0% lower than a year previously.
The average price registered nationwide is now €151,000, 0.9%
lower than in the third quarter.
7 | The Daft.ie House Price Report – 2012 Q4
Transaction Prices, Residential Sales
(2012 average = 100)
January
February
March
April
May
June
July
August
September
October
November
December
2010
150.4
145.7
145.0
146.2
137.5
142.2
138.8
137.8
133.6
130.5
134.3
132.8
2011
132.0
127.8
120.4
122.5
116.8
116.3
119.8
113.7
112.7
106.7
108.4
107.9
Number of residential property
transactions, by quarter
Source: propertypriceregister.ie
0
1,000
2,000
3,000
4,000
5,000
6,000
2010 II III IV 2011 II III IV 2012 II III IV
2012 average = 100
Falls in asking prices
slow considerably
As with asking prices, there was a marked decline in
house prices during 2012. While prices in late 2011 were
18.7% lower than a year previously, by late 2012, the rate
of prices falls had eased to 8%
Prices in outside the cities
and Leinster continue to fall
While prices in the ve main cities and in Leinster look to
be stabilising, prices in Munster were 13% lower in late
2012 than a year previously and in Connacht-Ulster were
18% lower.
Number of transactions
recovers slightly
The total number of transactions registered in the rst
nine months of 2012 was 14,000, compared to 12,000 in
2011 and 15,000 in 2010.

Daft.ie Snapshot of
Asking Prices Nationwide
What can I ask for?
Can I aord it?
Average house prices across Ireland, by county and
bedroom number, Quarter 4 2012
7 | The Daft.ie House Price Report – 2012 Q4
Daft.ie Snapshot of Asking Prices Nationwide
Dublin
City Centre
North City
South City
North County
South County
West County
Meath
Kildare
Wicklow
Longford
Oaly
Westmeath
Laois
Louth
Carlow
Kilkenny
Wexford
Co. Waterford
Waterford City
Kerry
Co. Cork
Cork City
Clare
Co. Limerick
Limerick City
Tipperary
Co. Galway
Galway City
Mayo
Roscommon
Sligo
Leitrim
Donegal
Cavan
Monaghan
€140,020
€127,500
€141,378
€116,531
€185,939
€94,123
€70,646
€77,958
€97,359
€50,627
€56,412
€58,198
€43,381
€64,633
€58,325
€59,587
€55,041
€68,063
€61,513
€65,020
€68,206
€95,185
€59,904
€62,490
€79,151
€60,438
€58,374
€84,690
€57,162
€45,026
€58,673
€45,388
€54,245
€51,044
€57,949
€201,409
€183,400
€203,362
€167,622
€267,461
€135,390
€92,474
€102,045
€127,441
€66,269
€73,843
€76,180
€56,785
€84,603
€76,346
€77,998
€72,047
€87,066
€75,049
€83,173
€87,249
€116,131
€76,629
€79,936
€96,569
€77,312
€66,227
€103,327
€64,852
€51,083
€66,566
€51,494
€61,542
€57,911
€65,745
€250,521
€228,120
€252,950
€208,495
€332,678
€168,403
€112,371
€124,001
€154,861
€80,528
€89,731
€92,571
€69,003
€102,806
€92,773
€94,780
€87,549
€108,735
€95,918
€103,873
€108,964
€148,424
€95,701
€99,831
€123,422
€96,554
€86,333
€132,060
€84,540
€66,591
€86,775
€67,127
€80,226
€75,492
€85,705
€345,239
€314,370
€348,587
€287,324
€458,459
€232,074
€167,046
€184,334
€230,210
€119,709
€133,390
€137,613
€102,576
€152,827
€137,913
€140,895
€130,146
€162,429
€126,698
€155,166
€162,770
€196,053
€142,958
€149,128
€163,028
€144,232
€120,059
€174,438
€117,565
€92,605
€120,673
€93,350
€111,566
€104,983
€119,185
€443,387
€403,742
€447,687
€369,007
€588,795
€298,051
€203,110
€224,131
€279,910
€145,553
€162,187
€167,322
€124,722
€185,821
€167,687
€171,313
€158,243
€183,992
€151,694
€175,765
€184,379
€234,732
€161,936
€168,925
€195,192
€163,380
€129,058
€208,851
€126,377
€99,546
€129,718
€100,348
€119,928
€112,852
€128,119
Leinster
Munster
Connaught
Ulster

North County Dublin
Average price: €204,548
Year on year change: -4.8%
From peak: -53.3%
Dublin City Centre
Average price: €181,220
Year on year change: 0.1%
From peak: -57.8%
North Dublin City
Average price: €214,597
Year on year change: -3.1%
From peak: -56.0%
South Dublin City
Average price: €232,622
Year on year change: -2.5%
From peak: -56.4%
South County Dublin
Average price: €333,828
Year on year change: 3.1%
From peak: -53.1%
West County Dublin
Average price: €163,156
Year on year change: -6.9%
From peak: -57.2%
8 | The Daft.ie House Price Report – 2011 in review
Dublin Trends
An analysis of recent trends in the Dublin residential sales market
■ Dublin City Centre ■ North Dublin City ■ South Dublin City ■ North County Dublin ■ South County Dublin ■ West County Dublin
€100,000
€200,000
€300,000
€400,000
€500,000
€600,000
€700,000
€800,000
How have house prices changed?
Average house price by area, 2006-2012
2007 II III IV 2008 II III IV 2009 II III IV 2010 II III IV 2011 II III IV 2012 II III
■ One year ago ■Previous quarter ■ Current quarter
How fast are properties selling?
Proportion of properties marked as sale agreed and withdrawn, 2011 - 2012
How many properties are on the market?
Number of properties on the market and newly advertised, 2007-2012
2007 II III IV 2008 II III IV 2009 II III IV 2010 II III IV 2011 II III IV 2012 II III IV
0
1000
2000
3000
4000
5000
6000
7000
8000
10%
20%
30%
40%
50%
60%
70%
■Stock (LHS) ■Inow (RHS)
0%
% of properties sold or sale agreed
Within 2 mths Within 4 mths Within 6 mths Within 12 mths
nAsking prices in Dublin city were just
2.0% lower in the nal quarter of 2012
than a year previously. In late 2011,
the year-on-year fall was 22.1%.
nSimilarly, transactions recorded on
propertypriceregister.ie in Dublin
indicate prices fell 6.8% in the year to
2012Q4, compared to a fall of 19.2%
in 2011Q4.
nThe proportion of properties in Dublin
selling within four months has risen
substantially from 42% a year ago to
63% now, and is far above the national
average (39%).
nThe total number of Dublin properties
on the market in December was just
3,500, less than half the gure from
four years ago and similar to levels last
seen in February 2007.

9 | The Daft.ie House Price Report – 2012 Q4
Kildare
Average price: €177,642
Year on year change: -8.9%
From peak: -55.2%
Carlow
Average price: €136,376
Year on year change: -13.9%
From peak: -50.1%
Louth
Average price: €156,132
Year on year change: -11.4%
From peak: -59.2%
Meath
Average price: €167,995
Year on year change: -10.6%
From peak: -54.0%
Wicklow
Average price: €224,705
Year on year change: -6.7%
From peak: -54.1%
Wexford
Average price: €133,457
Year on year change: -10.0%
From peak: -58.8%
Longford
Average price: €114,692
Year on year change: -8.4%
From peak: -59.5%
Westmeath
Average price: €138,245
Year on year change: -9.4%
From peak: -56.1%
Offaly
Average price: €129,147
Year on year change: -12.7%
From peak: -56.4%
Laois
Average price: €102,521
Year on year change: -13.0%
From peak: -57.9%
Kilkenny
Average price: €141,933
Year on year change: -9.4%
From peak: -55.8%
Leinster Trends
An analysis of recent trends in the Leinster residential sales market
■ Meath ■ Kildare ■ Wicklow ■ Louth ■ Laois ■ Westmeath ■ Oaly ■ Longford ■ Carlow ■ Kilkenny ■ Wexford
How have house prices changed?
Average house price by area, 2006-2012
2007 II III IV 2008 II III IV 2009 II III IV 2010 II III IV 2011 II III IV 2012 II III
How many properties are on the market?
Number of properties on the market and newly advertised, 2007-2012
2007 II III IV 2008 II III IV 2009 II III IV 2010 II III IV 2011 II III IV 2012 II III
€100,000
€150,000
€200,000
€250,000
€300,000
€350,000
€400,000
€450,000
■Stock (LHS) ■Inow (RHS)
€500,000
€550,000
0
2000
4000
6000
8000
10000
12000
14000
16000
18000
20000
0
400
800
1200
1600
2000
2400
2800
3200
3600
4000
■ One year ago ■Previous quarter ■ Current quarter
How fast are properties selling?
Proportion of properties marked as sale agreed and withdrawn, 2011 - 2012
10%
20%
30%
40%
50%
60%
70%
0%
% of properties sold or sale agreed
Within 2 mths Within 4 mths Within 6 mths Within 12 mths
nAsking prices in Leinster were 9.7%
lower in the nal quarter of 2012 than
a year previously. In late 2011, the
year-on-year fall was 17.6%.
nSimilarly, transactions recorded on
propertypriceregister.ie in Leinster
indicate prices fell by just 1% in the
year to 2012 Q4, compared to a fall of
21% in 2011 Q4.
nThe proportion of properties in
Leinster selling within four months has
risen from 30% a year ago to 40% now,
in line with the national average.
nThe total number of Leinster
properties on the market in December
was 11,700, down one third from the
level four years ago and similar to
levels last seen in mid-2007.

10 | The Daft.ie House Price Report – 2012 Q4
Tipperary
Average price:€142,536
Year on year change: -12.1%
From peak: -48.7%
Limerick City
Average price: €144,562
Year on year change: -9.3%
From peak: -45.6%
Waterford County
Average price: €163,51
Year on year change: -15.8%
From peak: -52.9%
Clare
Average price: €144,043
Year on year change: -15.5%
From peak: -53.4%
Limerick County
Average price: €154,391
Year on year change: -12.1%
From peak: -45.8%
Kerry
Average price: €156,205
Year on year change: -13.7%
From peak: -49.4%
Cork County
Average price: €161,617
Year on year change: -13.2%
From peak: -55.0% Cork City
Average price: €172,750
Year on year change: -8.7%
From peak: -54.0%
Waterford City
Average price: €112,864
Year on year change: -16.7%
From peak: -59.7%
Munster Trends
An analysis of recent trends in the Leinster residential sales market
How have house prices changed?
Average house price by area, 2006-2012
2007 II III IV 2008 II III IV 2009 II III IV 2010 II III IV 2011 II III IV 2012 II III
How fast are properties selling?
Proportion of properties marked as sale agreed and withdrawn, 2011 - 2012
How many properties are on the market?
Number of properties on the market and newly advertised, 2007-2012
2007 II III IV 2008 II III IV 2009 II III IV 2010 II III IV 2011 II III IV 2012 II III IV
0%
10%
20%
30%
40%
50%
60%
€50,000
€100,000
€150,000
€200,000
€250,000
€300,000
€350,000
€400,000
■Stock (LHS) ■Inow (RHS)
% of properties sold or sale agreed
■One year ago ■Previous quarter ■Current quarter
0
2000
12000
14000
16000
18000
4000
6000
8000
10000
500
1000
1500
2000
2500
3000
3500
0
20000
■ Waterford County ■ Kerry ■ Cork County ■ Clare ■ Limerick County ■ Tipperary ■ Cork City ■ Limerick City
Within 2 mths Within 4 mths Within 6 mths Within 12 mths
nAsking prices in Munster were 13.4%
lower in the nal quarter of 2012
than a year previously. This is largely
unchanged from late 2011, when the
year-on-year fall was 12.9%.
nSimilarly, transactions recorded on
propertypriceregister.ie in Munster
indicate prices fell 12.8% in the year to
2012 Q4, compared to a fall of 17.5%
in 2011 Q4.
nThe proportion of properties in
Munster selling within four months
has risen only slightly from 28% a year
ago to 32% now.
nThe total number of Munster
properties on the market in December
was 14,400, down 10% from the level
four years ago and similar to levels last
seen in mid-2008.

11 | The Daft.ie House Price Report – 2012 Q4
Leitrim
Average price: €98,754
Year on year change: -19.9%
From peak: -60.7%
Cavan
Average price: €119,649
Year on year change: -21.0%
From peak: -58.7%
Monaghan
Average price: €134,122
Year on year change: -20.9%
From peak: -58.2%
Roscommon
Average price: €102,005
Year on year change: -22.5%
From peak: -59.4%
Mayo
Average price: €125,773
Year on year change: -20.5%
From peak: -52.4%
Donegal
Average price: €122,797
Year on year change: -18.2%
From peak: -54.4%
Galway City
Galway
Average price: €137,659
Year on year change: -19.2%
From peak: -57.4%
Sligo
Average price: €125,808
Year on year change: -17.3%
From peak: -55.6%
How have house prices changed?
Average house price by area, 2006-2012
2007 II III IV 2008 II III IV 2009 II III IV 2010 II III IV 2011 II III IV 2012 II III
How fast are properties selling?
Proportion of properties marked as sale agreed and withdrawn, 2011 - 2012
How many properties are on the market?
Number of properties on the market and newly advertised, 2007-2012
2007 II III IV 2008 II III IV 2009 II III IV 2010 II III IV 2011 II III IV 2012 II III IV
€50,000
€100,000
€150,000
€200,000
€250,000
€300,000
€350,000
€400,000
■Stock (LHS) ■Inow (RHS)
0
10%
20%
30%
40%
50%
60%
70%
0
2000
4000
6000
8000
10000
12000
14000
16000
18000
20000
500
1000
1500
2000
2500
3000
3500
0
■ Galway County ■ Mayo ■ Roscommon ■ Sligo ■ Leitrim ■ Donegal ■ Cavan ■ Monaghan
■ One year ago ■Previous quarter ■ Current quarter
Within 2 mths Within 4 mths Within 6 mths Within 12 mths
Connacht & Ulster Trends
An analysis of recent trends in the Leinster residential sales market
nAsking prices in Connacht & Ulster
were 19.6% lower in the nal quarter
of 2012 than a year previously. In
contrast, in late 2011, the year-on-year
fall in prices was 13.6%.
nSimilarly, transactions recorded on
propertypriceregister.ie in Connacht-
Ulster indicate prices fell 18.4% in the
year to 2012Q4, compared to a fall of
17.5% in 2011Q4.
nThe proportion of properties in
Connacht-Ulster selling within four
months has risen only slightly from
23% a year ago to 25% now, well
below the national average (39%).
nThe total number of Connacht-Ulster
properties on the market in December
was 14,200, down 17% from four years
ago and similar to levels last seen in
early 2008.

About the Report
Over the last 10 years, Daft.ie has collected a vast
amount of data on the Irish property market.
In 2011 alone, over 100,000 properties for sale
were advertised on the site.
About the Report
The goal of the Daft Report is to use this information to help all actors in the property
market make informed decisions about buying and selling. In addition, because it is
freely available, the Daft Report can help inform the media, the general public and
policymakers about the latest developments in the property market.
This is the Daft.ie House Price Report, the partner to the Daft.ie Rental Report, which will be
issued next month. Together, they give house-hunters and investors more information to help
them make their decisions. These twin reports mean that Daft is the only objective monitor
of trends in both rental and sales markets on a quarterly basis, making the report an
essential barometer for anyone with an interest in the Irish property market.
The Daft Report is now almost seven years old and has become the denitive barometer
of the Irish residential property market. It is being used by the Central Bank, mortgage
institutions, and by nancial analysts at home and abroad, as well as by the general public.
Methodology and Sample Size
The statistics are based on properties advertised on Daft.ie for a given period.
The regressions used are hedonic price regressions, accounting for all available and
measurable attributes of properties and only coecients with a very high degree of
statistical signicance (p < 0.001) are used.
The average quarterly sample size for sales over the period 2006-2011 was over 34,000. Indices
are based on standard methods, holding the mix of characteristics constant, with the annual
average of 2007 used as the base. A working paper on the methodologies employed in
both rental and sales markets will be published on the Daft.ie website soon.
Stock and ow statistics are calculated using consistent series for the period covered.
About Daft.ie
Daft.ie is Ireland’s largest property
website. The latest audited report
from ABC (Sep 2011) shows
monthly trac of 130 million page
impressions (pages of information
received) and 1.976 million unique
users per month across Daft
Media’s property websites (daft.ie,
rent.ie, let.ie, property.ie).
This makes Daft.ie the biggest
property website in Ireland across
all demographics.
12 | The Daft.ie House Price Report – 2012 Q4

Disclaimer
The Daft.ie Report is prepared
from information that we believe
is collated with care, but we do not
make any statement as to its accuracy
or completeness. We reserve the right
to vary our methodology and to edit
or discontinue the indices, snapshots
or analysis at any time for regulatory
or other reasons. Persons seeking to
place reliance on any information
contained in this report for their own
or third party commercial purposes
do so at their own risk.
Credits
Economic Analysis:
Ronan Lyons
Layout and Design:
Ciara Mulvany, Derek Jones,
Flavour 9 Design
Data Compilation:
Paul Conroy,
Deirdre Ni Chuilleaneain
Marketing:
Kieran Harte
All data is Copyright © Daft Media
Limited. The information contained in
this report may only be reproduced if
the source is clearly credited.
Please contact Daft.ie on 01-4218700
for further information.
Coming Next…
The Daft.ie Rental Report
2013 Q1, in ??????? 2013
The Daft.ie Rental Report will be published in July and will include a review
of the performance of Ireland’s rental market in mid-2012, plus all the usual
indices, snapshots, trends and rental yield analysis, providing analysts,
tenants, landlords and the public with the most up-to-date information
on Ireland’s rental market.