2024-2025 Academic Performance Report PDF Free Download
1 / 9/9
100%

Cole Academy
Last Updated On:December 2025

Enrollment Where Students Come From
Assigned District Students
Lansing Public School District 245
East Lansing School District 16
Waverly Community Schools 15
Grand Ledge Public Schools 9
Holt Public Schools 8
Haslett Public Schools 4
Bath Community Schools 2
DeWitt Public Schools 1
Eaton Rapids Public Schools 1
Other 2
Cole Academy
SPRING 2024-2025 ACADEMIC PERFORMANCE REPORT
Overview
2020-21 2021-22 2022-23 2023-24 2024-25
English Language Learner
4.1% 3.9% 4.0% 3.9% 6.3%
Special Education
8.2% 11.7% 12.1% 13.2% 15.8%
Free/Reduced Lunch
56.3% 56.4% 60.2% 61.0% 60.4%
Students of Color
70.4% 71.5% 73.2% 70.6% 75.9%
Enrolled 3 or More Years
40.9% 54.0% 47.8% 47.7% 51.5%

Mathematics
35%
Trend Score
-7
Reading
38%
Trend Score
-12
Mathematics
50%
Trend Score
+7
Reading
29%
Trend Score
-16
Mathematics
52nd
Reading
32nd
Cole Academy
SPRING 2024-2025 ACADEMIC PERFORMANCE REPORT
NWEA MAP Growth Assessment
The 2024-2025 School Year administration of the NWEA MAP Growth Assessment continues to use NWEA's enhanced item-
selection algorithm, rst introduced in the 2023-2024 school year. According to NWEA, this enhancement has resulted in
elevated Mathematics scores compared to the 2020 National Norms.
Please refer to the current Guidance Document for
additional details.
Achievement
The 2020 NWEA national norms in mathematics and reading provide us with a benchmark for how students typically perform
within grade level. The percent of students meeting national norms informs us of the proportion of students achieving at or
above the 50th percentile (typical achievement). The primary achievement target in the Academy’s Charter Contract is that at
least 50% of students in grades 3-8 enrolled for at least one year earn assessment scores at or above their spring, grade-level,
national norm. If the Academy has less than 50% of its students achieving at grade level, the Academy is expected to improve
over time. Improvement over time is measured by the Trend Score which is dened as the score in the current year minus the
average of the last three years (CY - AVG(PY1 + PY2 + PY3)).
2024-2025 - Percent of Students Meeting Spring National Achievement Norms
Growth
A Conditional Growth Percentile (CGP), or simply Growth Percentile, is a student’s percentile rank for growth among their
academic peers. A CGP of 50 means that the student’s growth was higher than 50 percent of their academic peers. At the
school level, we aggregate this measure in two ways. First, the percentage of students with a CGP of 50 or greater is displayed.
The second measure (Median Growth Percentile, MGP) identies the midpoint of growth percentiles for students in the school.
The primary growth target contained in the Charter Contract is that the Academy’s MGP should be greater than or equal to 50.
If the Academy fails to meet this target, they are expected to show improvement over time. Improvement over time is measured
by the Trend Score which is dened as the score in the current year minus the average of the last three years (CY - AVG(PY1 +
PY2 + PY3)).
2024-2025 - Percent of Students with a Fall-to-Spring Growth Percentile of 50 or Greater
2024-2025 - Fall-to-Spring Median Growth Percentile

Mathematics Reading
Cole Academy
SPRING 2024-2025 ACADEMIC PERFORMANCE REPORT
Percent Meeting NWEA MAP Spring Achievement National Norms
All Students Grades 3 - 6 enrolled for at least one year
School-Wide by Year
By Grade Level

Cole Academy
SPRING 2024-2025 ACADEMIC PERFORMANCE REPORT
NWEA MAP Fall-to-Spring Growth
Percent of Students with a Fall-to-Spring Growth Percentile of 50 or Greater
All Students Grades 3 - 6
Fall-to-Spring Median Growth Percentile
All Students Grades 3 - 6

Mathematics
12%
1 year change
-13
ELA
12%
1 year change
-17
Mathematics
-4
ELA
-9
Cole Academy
SPRING 2024-2025 ACADEMIC PERFORMANCE REPORT
Michigan Student Test of Educational Progress (M-STEP)
The Michigan Student Test of Educational Progress (M-STEP) is an assessment given during the spring of each school year.
The state of Michigan requires that the Academy assess all students in grades 3-7 using the M-STEP in English Language Arts
(ELA) and Mathematics. While the primary performance standards outlined in the Charter Contract do not contain expectations
regarding state assessment performance, the M-STEP is still a consideration in the Charter Contract. For schools that do not
meet the primary standards on the NWEA assessments in achievement and growth, the Center utilizes the M-STEP to compare
each Academy’s performance to traditional districts where students would otherwise attend if not enrolled at the Academy. The
Center uses a weighted average to calculate the performance of a "composite district" representing all districts where students
at the Academy would otherwise attend. This "district" is called the Composite Resident District (CRD).
Achievement
M-STEP is the state of Michigan's summative assessment that measures how well students are mastering state academic
standards. The proportion of students in the Academy who are either Advanced or Procient shows us how well students
achieve against the standards.
2024-2025 - Percent of Students Advanced or Procient on M-STEP Mathematics and English
Language Arts
Comparative Achievement (CRD) - M-STEP
The percentage of advanced or procient students is compared to the Academy’s CRD percentage. This shows how the
Academy is helping students master state standards compared to the schools they would attend based on residency. The
metric presented displays the dierence between the percentage of the Academy's students that meet the benchmark and the
percentage of the CRD's students that meet the benchmark.
2024-2025 - Percent of Students Advanced or Procient on M-STEP vs. CRD

Mathematics ELA
Mathematics ELA
Cole Academy
SPRING 2024-2025 ACADEMIC PERFORMANCE REPORT
Percent Meeting M-STEP Prociency vs. CRD
All Students Grades 3 - 6
Percent Meeting M-STEP Prociency By Grade Level

Mathematics
54th
ELA
44th
Mathematics
+7
ELA
-4
Cole Academy
SPRING 2024-2025 ACADEMIC PERFORMANCE REPORT
State Assessment Student Growth Percentile (SGP)
Student Growth Percentiles (SGPs) on Michigan state assessments measure the progress of individual students over one or
more years. Essentially, SGPs indicate how much a student has learned in a specic subject area compared to a group of
peers who achieved a similar score on the previous test (or multiple previous tests) in that subject. While the primary
benchmark for growth performance is the NWEA growth standard mentioned earlier, for schools that do not meet this standard
the Center uses the mean student growth percentile on state assessments to assess the performance of a CMU school in
comparison to their CRD.
Growth
The all grades, mean student growth percentile(SGP) of the Academy in Mathematics and ELA.
2024-2025 - Mean SGP on State Assessments in Mathematics and English Language Arts
Comparative Growth (CRD)
The mean SGP of the academy is compared to the mean SGP of their CRD. This shows how the Academy is helping students
grow with respect to state standards compared to the schools they would attend based on residency. The metric displays the
dierence between the mean SPG of the Academy's students and the mean SGP of the CRD's students.
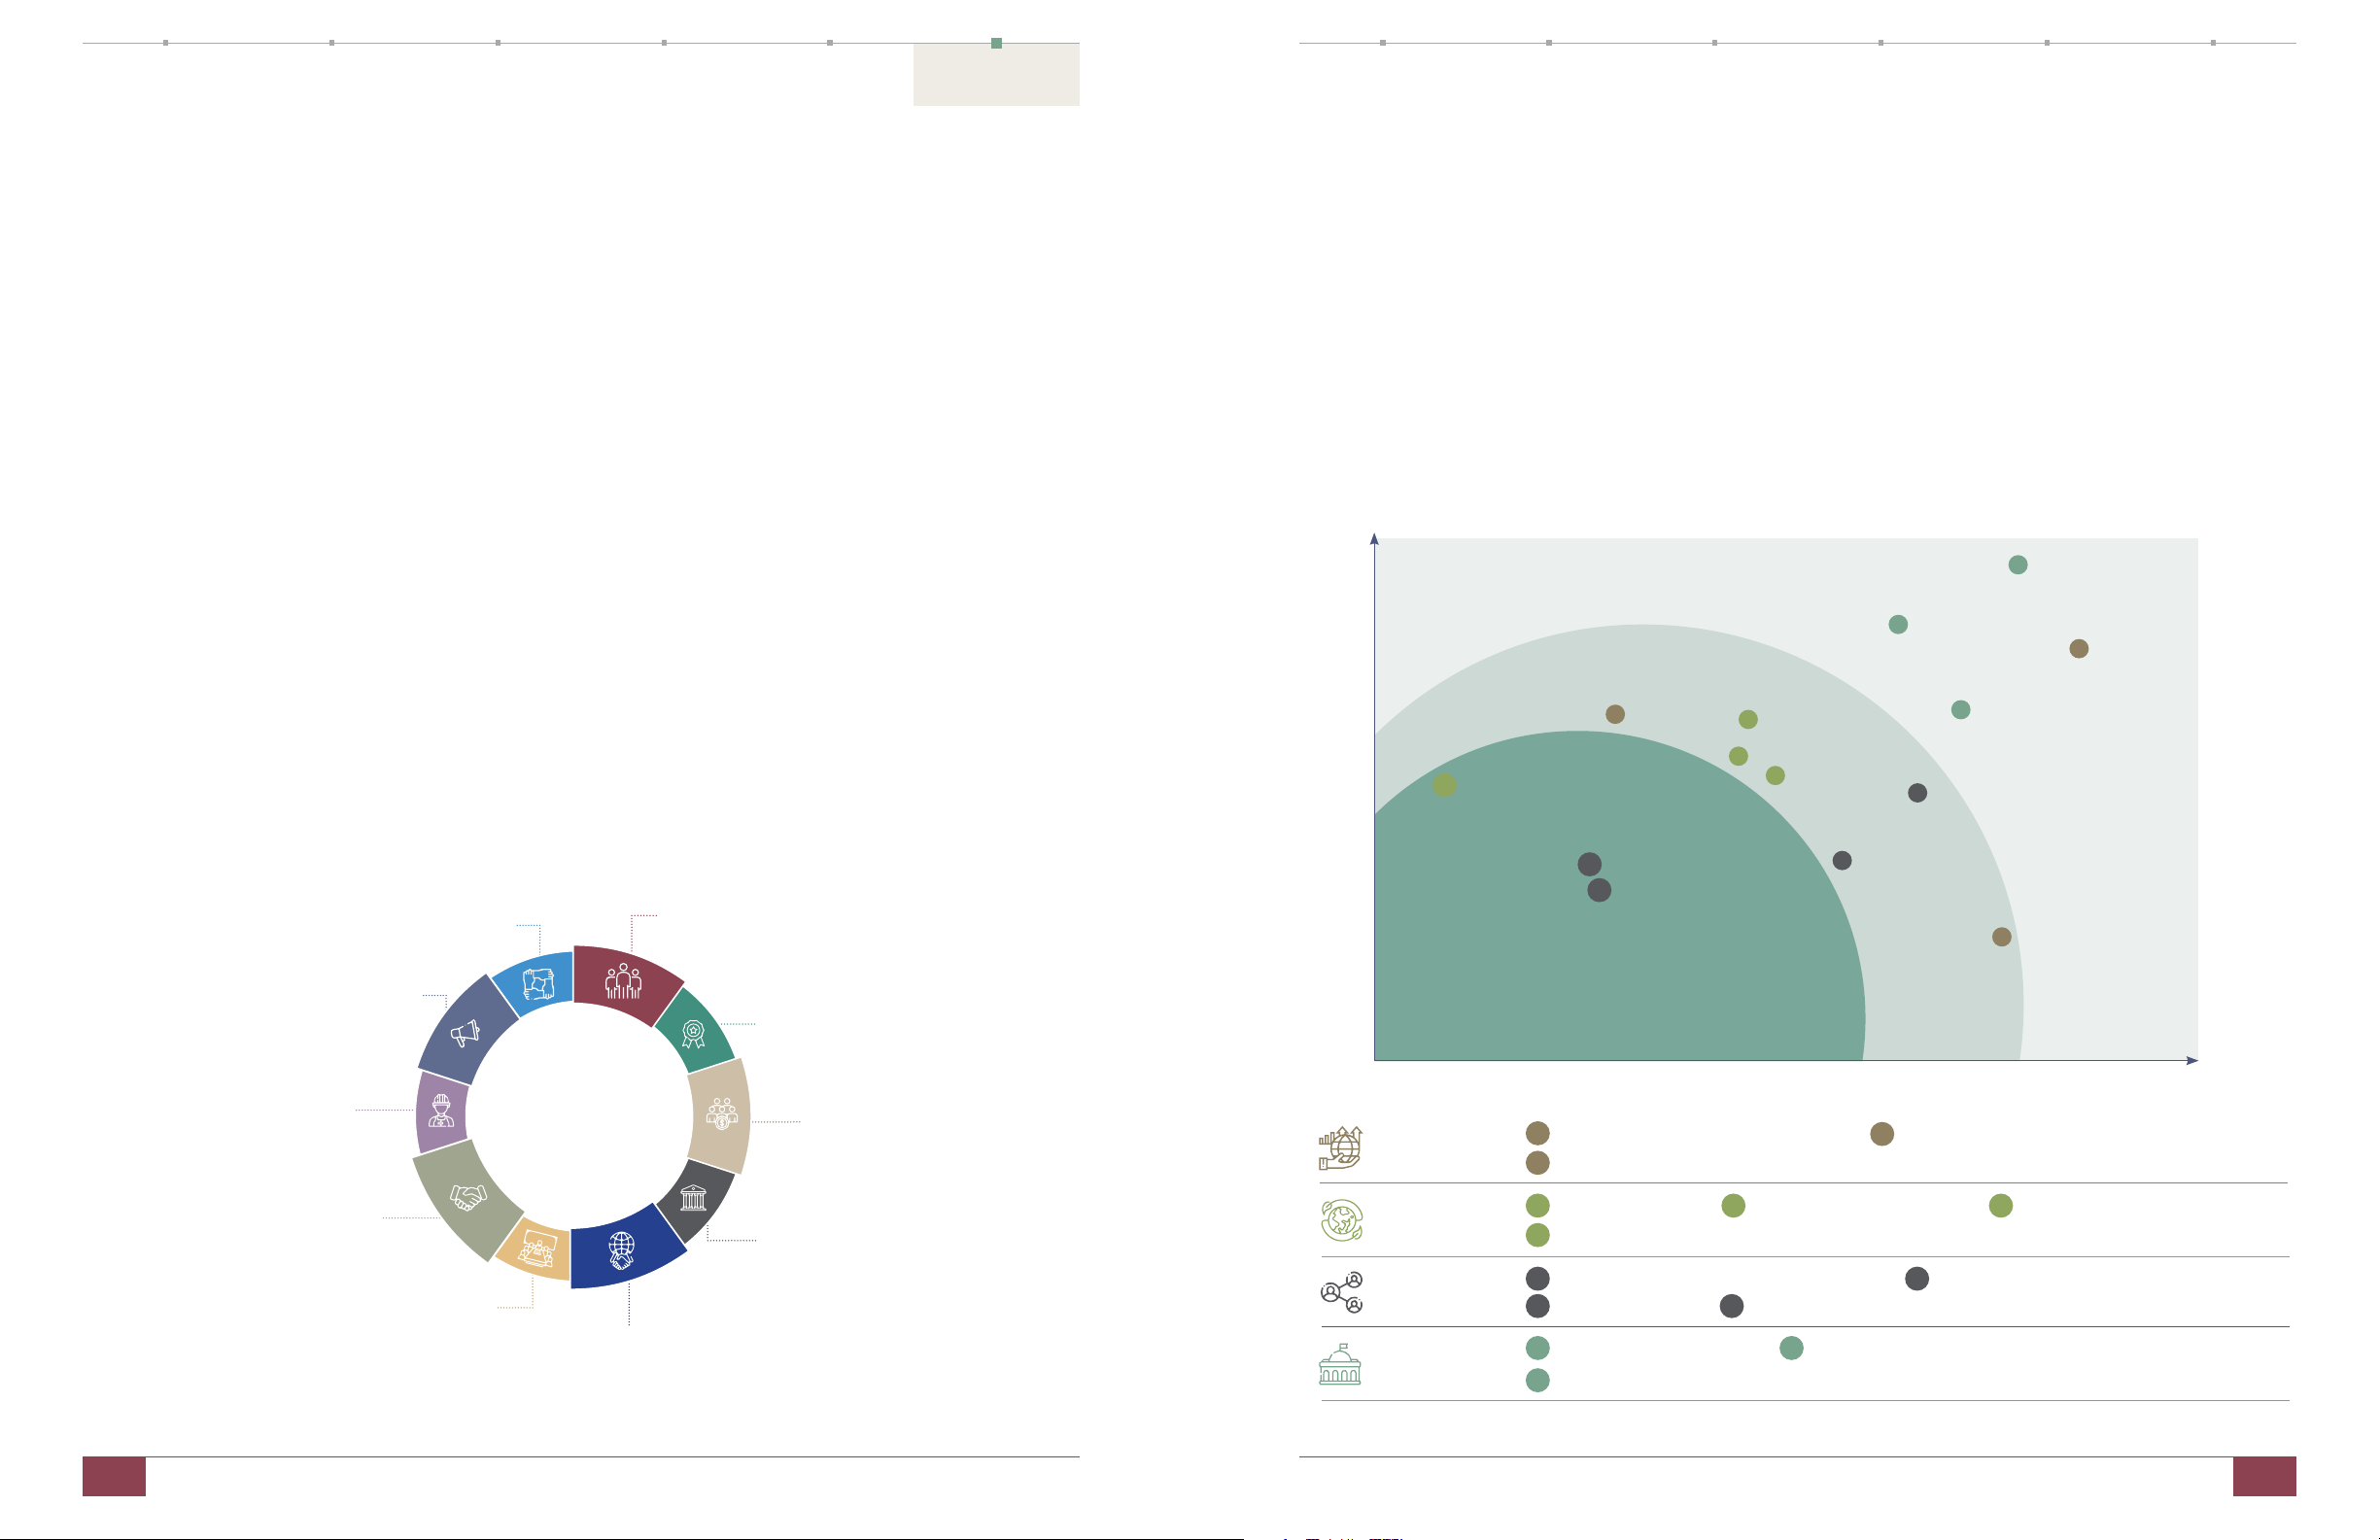
2024-2025 - Mean SGP on State Assessments vs. CRD

THE GOVERNOR JOHN ENGLER CENTER FOR CHARTER SCHOOLS
CENTRAL MICHIGAN UNIVERSITY | MOUNT PLEASANT, MI 48859
(989) 774-2100 | www.TheCenterForCharters.org