ATLAS Arkansas Teaching & Learning Assessment System 2025 Snapshot Report PDF Free Download
1 / 7/7
100%

2025
Sna
ps
ho
t
Re
p
o
rt
An overview of the 2024-2025
ATLAS 3-10 and End-of-Course
summative assessment results

PERFORMANCE BY
CONTENT AREA
Executive
Summary
The ATLAS end
-
of
-
y
ea
r
su
mma
t
i
v
e a
ss
e
ss
men
t
mea
sur
e
s
p
e
r
fo
r
mance fo
r
all A
r
kan
s
a
s
pu
blic
s
chool
stu
den
ts
in g
r
ade
s
3
–
8
in Engli
s
h Lang
u
age A
rts
(
ELA
),
ma
t
hema
t
ic
s
,
and
s
cience
.
High
s
chool
stu
den
ts
t
ake ELA a
ss
e
ss
men
ts
in g
r
ade
s
9
and
10
and end
-
of
-
co
urs
e e
x
am
s
in Algeb
r
a I
,
Geome
try
,
and Biolog
y.
Thi
s
r
e
p
o
rt
pr
o
v
ide
s
a high
-
le
v
el
su
mma
ry
of
2024
–
25
r
e
su
l
ts
,
t
he
s
econd
y
ea
r
of ATLAS
admini
str
a
t
ion
.
Wi
t
h an a
v
e
r
age com
p
le
t
ion
r
a
t
e of
98
%,
ATLAS i
s
aligned
t
o A
r
kan
s
a
s
con
t
en
t
st
anda
r
d
s
and
pr
o
v
ide
s
s
cale
s
co
r
e
s
t
ha
t
r
eflec
t
stu
den
t
p
e
r
fo
r
mance
.
S
tu
den
ts
a
r
e cla
ss
ified in
t
o
p
e
r
fo
r
mance le
v
el
s
,
w
i
t
h Le
v
el
3
indica
t
ing ma
st
e
ry
of g
r
ade
-
le
v
el con
t
en
t
,
r
eadine
ss
fo
r
t
he ne
xt
g
r
ade
,
and alignmen
t
w
i
t
h college and ca
r
ee
r
e
xp
ec
t
a
t
ion
s.
In this Report
EXECUTIVE
SUMMARY
OVERVIEW AND
KEY HIGHLIGHTS

Timeline
Da
t
e
Ac
t
ion
A
pr
il
14
-
Ma
y
16
,
2024
S
u
mma
t
i
v
e Te
st
ing Windo
w
J
u
l
y
ADE
r
elea
s
e
s
ATLAS
r
e
su
l
ts
t
o familie
s
and ed
u
ca
t
o
rs
v
ia
t
he ATLAS
p
o
rt
al
.
School
,
di
str
ic
t
,
and
st
a
t
e ATLAS
r
e
su
l
ts
a
r
e
pu
bli
s
hed on ADE
’
s
M
y
SchoolInfo
w
eb
s
i
t
e
.
A
u
g
ust
ADE
pu
bli
s
he
s
2024
-
2025
g
r
o
wt
h da
t
a fo
r
t
eache
rs
,
s
chool
s
,
and di
str
ic
ts.
A
u
g
ust
–
Se
pt
embe
r
ADE
s
ec
ur
el
y
r
elea
s
e
s
2024
-
2025
acco
u
n
t
abili
ty
da
t
a
(
pr
e
-
a
pp
eal
)
t
o
di
str
ic
ts
,
incl
u
ding
s
chool le
tt
e
r
g
r
ade
s
and
s
im
u
la
t
ed di
str
ic
t
le
tt
e
r
g
r
ade
s.
Oc
t
obe
r
ADE
pu
blicl
y
r
elea
s
e
s
of
2024
-
2025
s
chool acco
u
n
t
abili
ty
da
t
a on b
r
and ne
w
r
e
p
o
rt
ca
r
d
s
a
s
p
a
rt
of A
r
kan
s
a
s
’
s
r
e
v
am
p
ed M
y
SchoolInfo
w
eb
s
i
t
e
.
Da
t
a
O
v
e
rv
ie
w
Ac
r
o
ss
all g
r
ade
s
,
A
r
kan
s
a
s
s
a
w
mode
st
inc
r
ea
s
e
s
in
su
bjec
t
ma
st
e
ry
a
s
ed
u
ca
t
o
rs
adj
ust
ed
t
o
t
he
s
econd
y
ea
r
of ATLAS
.
Gain
s
w
e
r
e mo
st
no
t
able in ma
t
h and
s
cience
.
S
t
a
t
e
w
ide Gain
s
in Yea
r
T
w
o
+
0.8
% +
2.7
% +
2.4
%
2025

Ke
y
Highligh
ts
School or District ELA Math Science
O
v
e
r
all inc
r
ea
s
e
s
in
pr
oficienc
y
There is an overall increase in proficiency across English Language Arts (ELA), mathematics, and science.
In ELA all grades, except grade 9, showed improvement over prior year.
In math all grades including EOCs, except grade 5 showed improvement over prior year.
In science all grades including biology, except grade 8 showed improvement over prior year.
No
t
able Gain
s
in High School Ma
t
hema
t
ic
s
Performance improved more sharply in high School mathematics than any other subject or grade band.
Algebra I students showed an increase from 26.9% to 30.8% scoring in performance at level 3 and 4
Geometry students showed an increase from 18% to 21.5% scoring in performance at level 3 and 4
Im
pr
o
v
ed Coho
rt
Pe
r
fo
r
mance T
r
end
s
Cohort analysis offers valuable insights into how well students are progressing from one year to the next
and helps identify both strengths and areas for improvement:
Grade 4 Cohort
students showed an increase in levels 3-4 performance in ELA from 36.1 to 39.2% from prior year
students showed an increase in levels 3-4 performance in math from 37.8 to 43.1% from prior year
students showed an increase in levels 3-4 performance in science from 35.9 to 43% from prior year
Grade 7 & 8 Cohort
students showed an increase in levels 3-4 performance in ELA from 32.3 to 33% from prior year
students showed an increase in levels 3-4 performance in math from 37.7 to 39.3% from prior year
students showed an increase in levels 3-4 performance in science from 34.6 to 39.3% from prior year
2025

Performance by
Content Area
2025

Summary of Change
by Content Area
2025
Percentage of students earning Level 3 and Level 4
ELA
Math
Science
Grades
2023-
2024
2024-
2025
%
Change
2023-
2024
2024-
2025
%
Change
2023-
2024
2024-
2025
%
Change
3
36.10%
35.90%
-0.20%
37.80%
39.70%
1.90%
35.90%
38.50%
2.60%
4
36.00%
39.20%
3.20%
38.00%
43.10%
5.10%
35.80%
39.50%
3.70%
5
36.60%
36.60%
0.00%
38.00%
37.20%
-0.80%
35.60%
37.80%
2.20%
6
34.10%
35.30%
1.20%
37.70%
39.60%
1.90%
34.70%
36.70%
2.00%
7
32.20%
32.60%
0.40%
37.80%
39.30%
1.50%
36.30%
38.40%
2.00%
8
32.10%
33.00%
0.90%
27.60%
31.70%
4.10%
35.30%
38.10%
2.80%
9
32.20%
30.90%
-1.30%
10
31.70%
34.00%
2.30%
Algebra I*
26.80%
30.80%
4.00%
Geometry*
18.00%
21.50%
3.50%
Biology*
36.40%
37.70%
1.30%
*
Incl
u
de
s
all g
r
ade
s
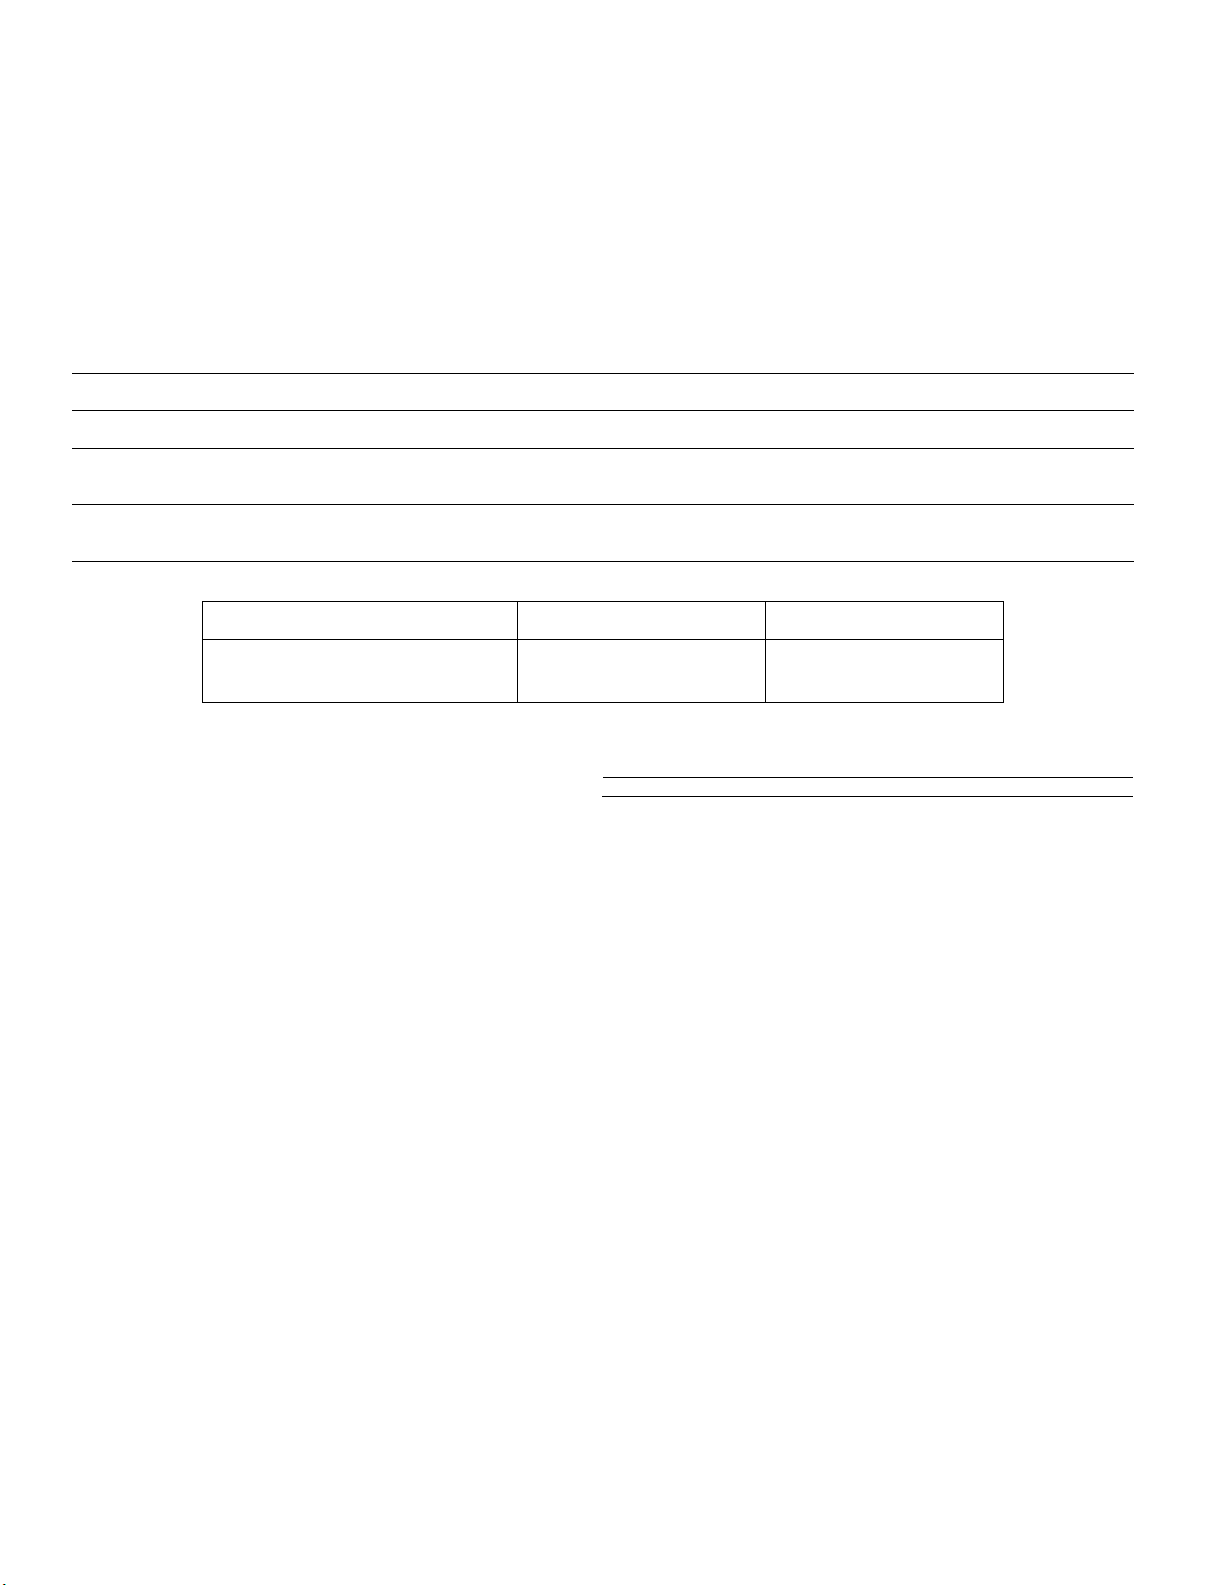
The cha
rt
belo
w
su
mma
r
i
z
e
s
change in
p
e
r
cen
t
age f
r
om
2024
t
o
2025
admini
str
a
t
ion
.
The change
s
in g
r
een
s
ho
w
ed an inc
r
ea
s
e in
p
e
r
fo
r
mance
,
The change
s
in
r
ed
s
ho
w
a
dec
r
ea
s
e in
p
e
r
fo
r
mance
.

Ke
y
Highligh
ts
Pe
r
fo
r
mance in Ma
t
h EOC
s
fo
r
S
tu
den
ts
w
ho a
r
e on an Accele
r
a
t
ed Pa
t
h
w
a
y
For students who are enrolled in Algebra I or Geometry earlier than the typical path (7 and 8 grade),
there is a drastic improvement in overall performance. This suggests that the right students are being
accelerated and that they rise to the challenge when given the opportunity.
th th
2025