Baidu (BIDU US) Generative AI related revenue generation ramping up PDF Free Download
1 / 7/7
100%

PLEASE READ THE ANALYST CERTIFICATION AND IMPORTANT DISCLOSURES ON LAST PAGE
MORE REPORTS FROM BLOOMBERG: RESP CMBR <GO> OR http://www.cmbi.com.hk
1
MN
22 Nov 2023
CMB International Global Markets | Equity Research | Company Update
Baidu (BIDU US)
Generative AI related revenue generation
ramping up
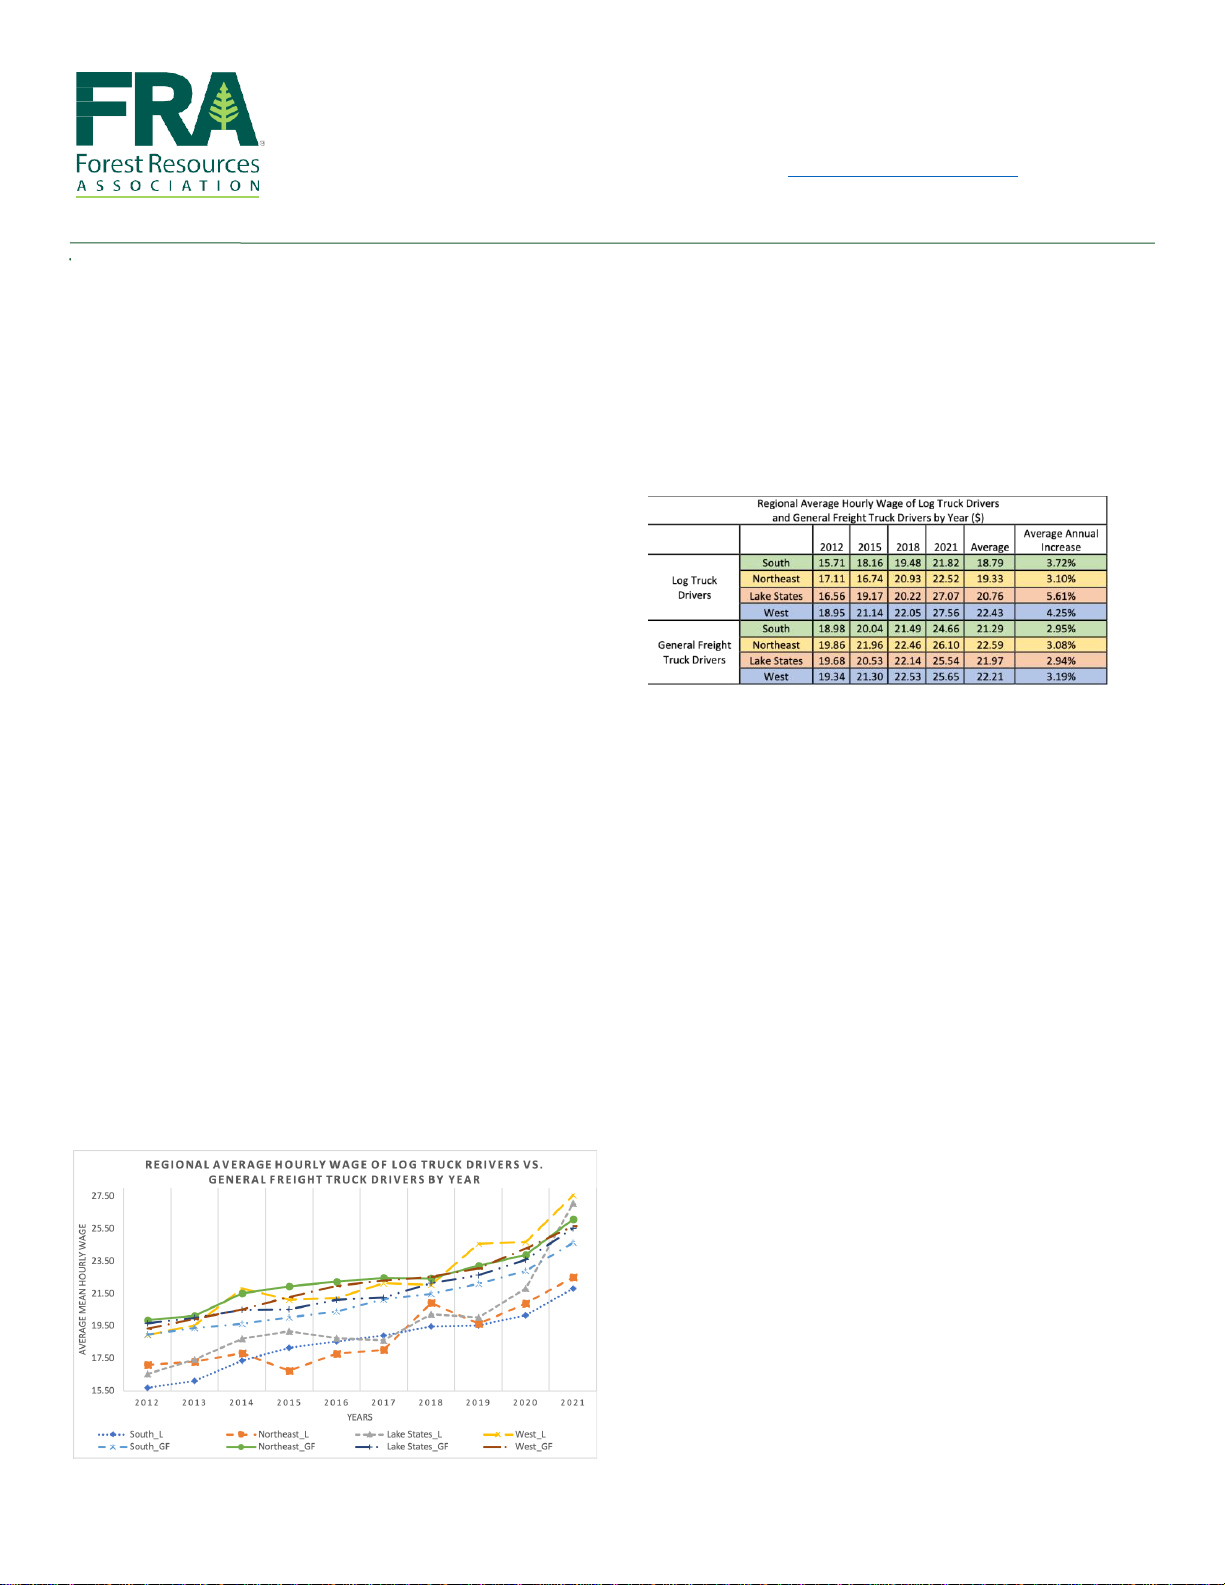
Baidu announced its 3Q23 results on 21 Nov: revenue was RMB34.4bn, up 6%
YoY, 1% higher than Bloomberg consensus estimates. Non-GAAP net income
was RMB7.3bn, ahead of consensus estimates of RMB6.3bn, thanks to a beat
in Baidu Core non-GAAP OP, aided by better-than-expected cost control in non-
core business. Management noted that generative AI related cloud revenue has
contributed low single digit percentage of total cloud revenue in 3Q23, and
expects generative AI empowered new initiatives to bring hundreds of millions
of incremental ads revenue in 4Q23. Although Baidu’s ads revenue growth is
still highly correlated with overall macro environment, the ramp up of generative
AI related revenue likely propels better revenue growth outlook for Baidu, in our
view. We fine-tune our SOTP-based TP to US$195.6 (was US$199.4). BUY.
Generative AI feature is on track to revitalize Baidu’s ads revenue
growth. Baidu Core revenue was up by 5% YoY to RMB26.6bn in 3Q23
(77% of total revenue), and was 1% better than consensus. In Sep 2023,
MAUs of Baidu app were 663mn, up 5.0% YoY (3Q22: 5.0%). Baidu Core’s
online ads business revenue grew 5% YoY and 0.4% QoQ to RMB19.7bn
in 3Q23. By incorporating generative AI, Baidu can help advertisers achieve
higher conversions and ROI, which in return propels an evolvement of ads
monetization formats from cost per mile (CPM) to cost per click (CPC) and
cost per sale (CPS), therefore showing potential to revitalizing ads revenue
growth over mid-to-long term, in our view. We estimate 7.5% YoY revenue
growth for Baidu Core ads business in 4Q23.
Cloud business revenue growth to bottom out. Non-ad revenue was up
6% YoY to RMB6.9bn and accounted for 26.0% of Baidu Core revenue
(3Q22: 25.9%). Baidu Cloud revenue declined by 2% YoY to RMB4.4bn in
3Q23 (2Q23: +5%; 3Q22: +24%), mainly due to: 1) a relatively high base
for smart transportation (ST) projects; and 2) soft macro and Baidu’s
strategic move to focus on quality projects. But the cloud business segment
sustained non-GAAP operating profitability. Management is confident that
cloud revenue growth will return to positive in 4Q23, as high base effect for
ST vertical will wear off, and generative AI related cloud revenue may
continue to ramp up. We forecast revenue from Baidu Cloud to grow 10%
YoY in 4Q23.
Expecting a relatively stable margin profile for Baidu Core in
4Q23/2024E. Baidu’s GPM was 52.7% in 3Q23, up 2.7pp YoY. Non-GAAP
OPM for Baidu Core was 25.1%, better than Bloomberg consensus at
22.6%, thanks to better-than-expected cost control of mature businesses.
Although the ramp up of monetization of generative AI related initiatives
likely brings additional costs, and increase in revenue contribution from
relatively low margin cloud business likely weighs on margins, we expect
Baidu Core to maintain a relatively stable margin profile by implementing
stringent cost control of non-core businesses. We forecast Baidu Core non-
GAAP OPM to reach 20.0%/22.9% in 4Q23/2024E (4Q22/2023E:
21.4%/23.2%).
Target Price
US$195.60
(Previous TP
US$199.40)
Up/Downside
72.5%
Current Price
US$113.42
China Internet
Saiyi HE, CFA
(852) 3916 1739
hesaiyi@cmbi.com.hk
Ye TAO
franktao@cmbi.com.hk
Wentao LU, CFA
luwentao@cmbi.com.hk
Stock Data
Mkt Cap (US$ mn)
39,824.6
Avg 3 mths t/o (US$ mn)
98.1
52w High/Low (US$)
160.22/93.36
Total Issued Shares (mn)
351.1
Source: FactSet
Shareholding Structure
Robin Yanhong Li
16.5%
Source: HKEx
Share Performance
Absolute
Relative
1-mth
6.5%
-3.2%
3-mth
-11.6%
-16.5%
6-mth
-9.9%
-19.8%
Source: FactSet
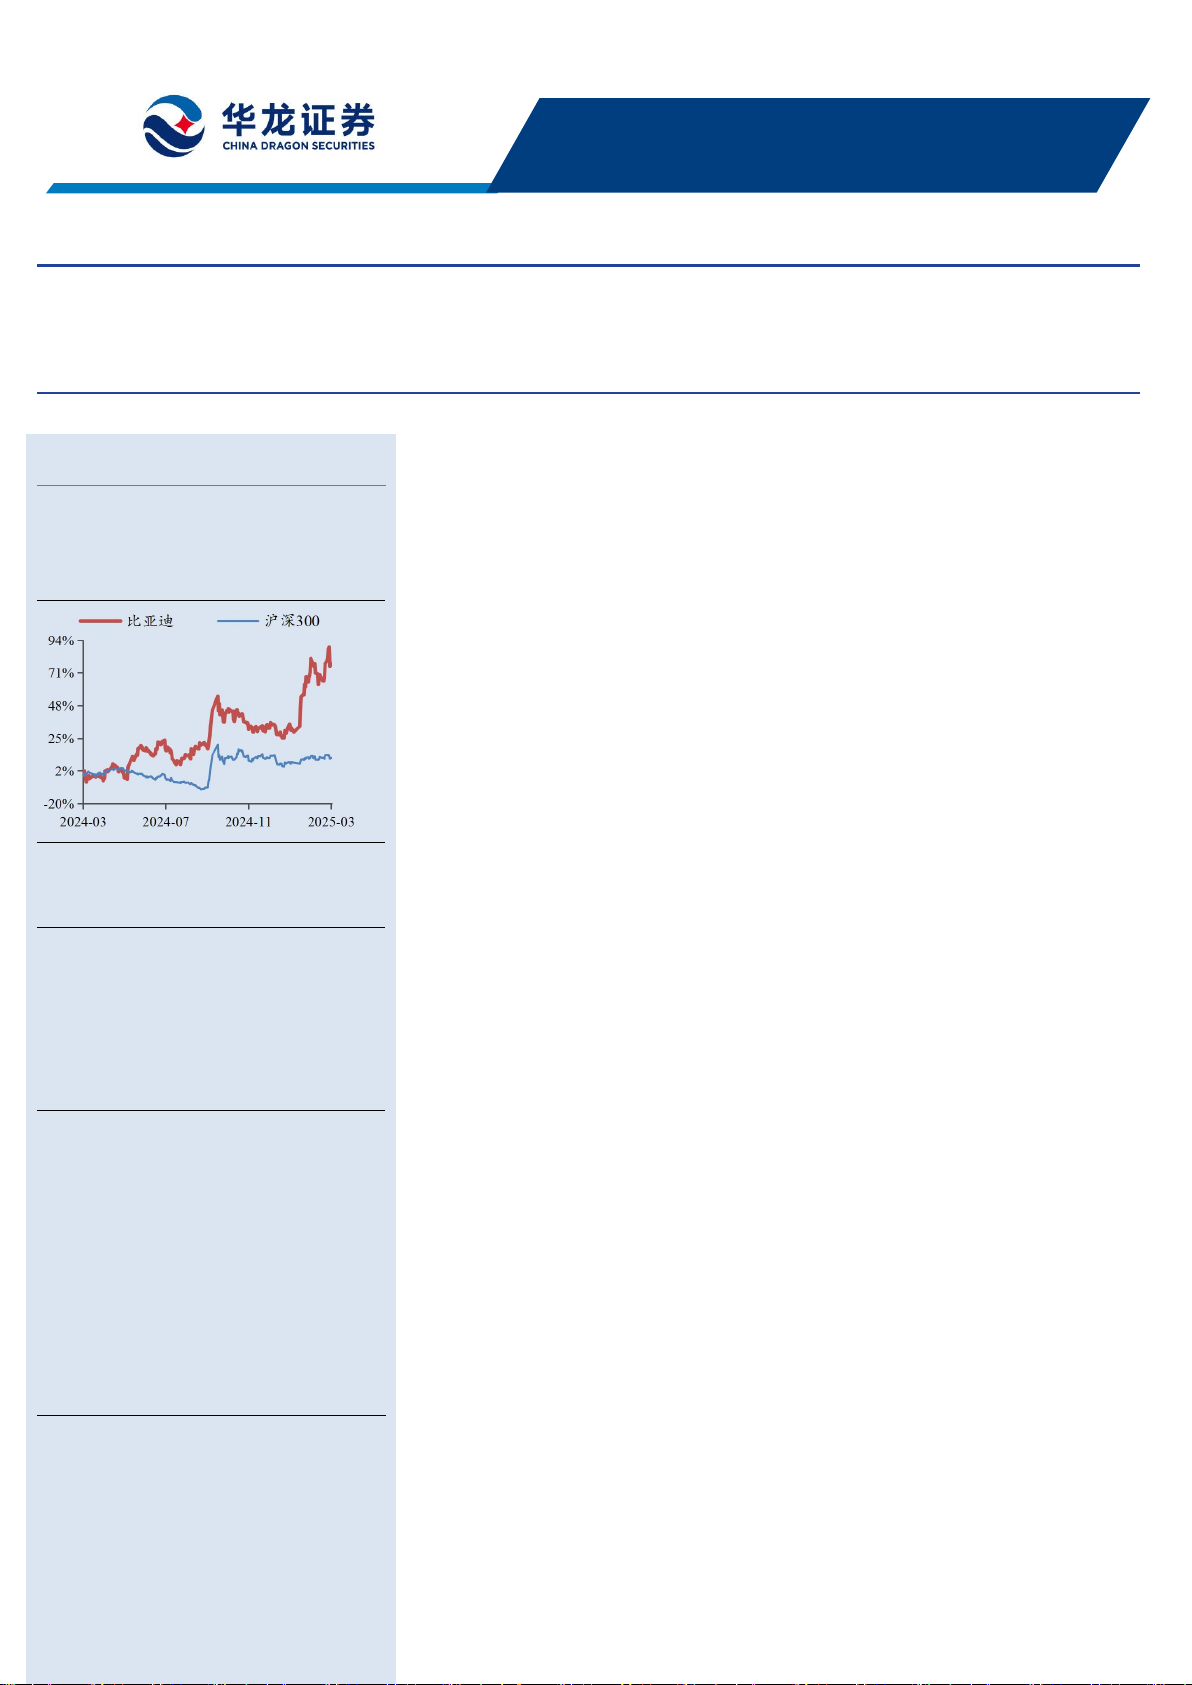
12-mth Price Performance
Source: FactSet
Earnings Summary
(YE 31 Dec)
FY21A
FY22A
FY23E
FY24E
FY25E
Revenue (RMB mn)
124,493
123,675
135,046
147,945
164,443
YoY growth (%)
16.3
(0.7)
9.2
9.6
11.2
Adjusted net profit (RMB mn)
18,830.0
20,680.0
26,844.9
27,111.8
31,679.4
EPS (Adjusted) (RMB)
53.53
58.90
75.70
75.69
87.57
Consensus EPS (RMB)
na
na
72.95
73.96
82.11
P/E (x)
42.3
40.1
13.1
13.8
11.7
ROE (%)
5.1
3.4
8.8
7.5
8.0
Source: Company data, Bloomberg, CMBIGM estimates

22 Nov 2023
PLEASE READ THE ANALYST CERTIFICATION AND IMPORTANT DISCLOSURES ON LAST PAGE
2
Figure 1: Baidu: quarterly financial results
(RMBbn)
1Q22
2Q22
3Q22
4Q22
1Q23
2Q23
3Q23
3Q23
Consensus
Diff%
Baidu Group
Online marketing
16.9
18.3
19.9
19.6
18.0
21.1
21.3
21.2
0.9%
YoY growth (%)
-6.4%
-12.3%
-5.3%
-5.6%
6.2%
15.4%
7.0%
Other services
11.5
11.4
12.6
13.5
13.2
13.0
13.1
12.9
1.4%
YoY growth (%)
14.4%
8.1%
15.9%
9.2%
14.7%
14.0%
4.0%
Total revenue
28.4
29.6
32.5
33.1
31.1
34.1
34.4
34.2
0.7%
YoY growth (%)
1.0%
-5.4%
1.9%
0.0%
9.6%
14.9%
5.9%
Gross profit
12.9
14.5
16.3
16.1
16.0
17.9
18.2
18.2
0.0%
Operating profit
2.6
3.4
5.3
4.6
5.0
5.2
6.3
6.9
-8.8%
Non-GAAP net profit
3.9
5.5
5.9
5.4
5.7
8.0
7.3
6.3
15.8%
YoY growth (%)
-10%
3%
16%
32%
48%
44%
23%
GPM (%)
45.3%
48.8%
50.0%
48.8%
51.3%
52.5%
52.7%
53.1%
-0.4 ppt
OPM (%)
9.2%
11.5%
16.3%
13.9%
16.0%
15.3%
18.2%
20.1%
-1.9 ppt
Non-GAAP NPM (%)
13.7%
18.7%
18.1%
16.2%
18.4%
23.5%
21.1%
18.4%
2.7 ppt
Baidu Core
Revenue
21.4
23.2
25.2
25.7
23.0
26.4
26.6
26.4
0.8%
YoY growth (%)
4.4%
-3.7%
2.3%
-1.2%
7.6%
14.0%
5.3%
Baidu Core - online
marketing
15.6
17.1
18.7
18.0
16.6
19.6
19.7
19.6
0.4%
YoY growth (%)
-3.6%
-10.1%
-3.6%
-5.5%
6.3%
14.7%
5.2%
Baidu Core - Others
5.8
6.1
6.5
7.6
6.4
6.8
6.9
6.9
0.5%
YoY growth (%)
34.4%
20.8%
24.1%
10.4%
11.1%
12.1%
5.5%
Non-GAAP OP
3.7
5.1
6.7
5.5
5.4
6.5
6.7
6.0
12.0%
Non-GAAP NP
3.8
5.4
5.8
4.9
5.3
7.7
7.0
5.6
24.2%
YoY growth (%)
-21.9%
-8.3%
-1.5%
6.3%
38.5%
41.2%
20.6%
Non-GAAP OPM (%)
17.2%
22.1%
26.4%
21.4%
23.3%
24.7%
25.1%
22.6%
2.5 ppt
Non-GAAP NPM (%)
17.8%
23.5%
22.8%
19.2%
22.9%
29.1%
26.2%
21.2%
4.9 ppt
Source: Company data, Bloomberg, CMBIGM
Changes in forecast and valuation
Figure 2: Baidu forecast revision
Current
Previous
Change (%)
RMB bn
2023E
2024E
2025E
2023E
2024E
2025E
2023E
2024E
2025E
Revenue
135.0
147.9
164.4
136.2
148.0
163.8
-0.9%
-0.1%
0.4%
Gross Profit
69.7
77.0
87.5
69.4
75.2
85.1
0.5%
2.3%
2.9%
Non-GAAP net profit
26.8
27.1
31.7
25.6
25.6
29.6
5.0%
5.8%
7.1%
Gross Margin
51.6%
52.0%
53.2%
50.9%
50.8%
51.9%
0.7 ppt
1.2 ppt
1.3 ppt
Non-GAAP net margin
19.9%
18.3%
19.3%
18.8%
17.3%
18.1%
1.1 ppt
1.0 ppt
1.2 ppt
Source: CMBIGM estimates

22 Nov 2023
PLEASE READ THE ANALYST CERTIFICATION AND IMPORTANT DISCLOSURES ON LAST PAGE
3
Figure 3: Baidu Core business segment forecast revision
Current
Previous
Change (%)
RMB bn
2023E
2024E
2025E
2023E
2024E
2025E
2023E
2024E
2025E
Revenue
103.6
114.0
129.2
104.4
113.6
128.2
-0.8%
0.3%
0.8%
Non-GAAP Operating
Profit
24.1
26.1
31.0
23.7
24.8
28.9
1.6%
5.0%
7.2%
Non-GAAP net profit
25.2
25.1
29.3
24.0
23.7
27.2
5.0%
5.8%
7.6%
Non-GAAP OPM
17.8%
17.6%
18.8%
17.4%
16.8%
17.6%
0.4 ppt
0.8 ppt
1.2 ppt
Non-GAAP NPM
18.7%
16.9%
17.8%
17.6%
16.0%
16.6%
1.1 ppt
0.9 ppt
1.2 ppt
Source: CMBIGM estimates
SOTP valuation of US$195.6 per ADS
Our SOTP-based target price is US$195.6, which comprises, per ADS:
1) US$69.2 (prior US$68.5) for Baidu Core (main business, excluding Apollo and Baidu
Cloud, mainly including the core search and feed ads business), based on unchanged 7.0x
2023E non-GAAP PE. The lift in valuation is mainly due to a lift in non-GAAP net income
forecast.
2) US$21.9 (prior US$22.8) for Apollo ASD, based on 2.0x 2030E revenue, and discounted
back using a 13.0% WACC.
3) US$35.3 (prior US$36.9) for Baidu Cloud, based on unchanged 4.8x 2023E PS.
4) US$56.6 net cash (prior US$58.2).
5) US$12.6 (prior US$13.0) for iQIYI and other investments, with a 30% holding discount
applied to the share price of US$18.0 as of market close on 22 Nov 2023.
Figure 4: Baidu: SOTP valuation
Segment
NOPAT
(US$mn)
Valuation
method/multiple
Valuation
(RMBmn)
Valuation
(US$mn)
Baidu's
stake
Valuation
of Baidu's
stake
(US$mn)
USD/ADS
Valuation
as % of
total (%)
Core business and cash
1) Baidu core (ex-
Apollo and Cloud)
3,507
7.0x 2023E PE
176,748
24,548
100.0
24,548
69.2
35.4
2) Apollo ASD
55,926
7,767
100.0
7,767
21.9
11.2
3) Baidu Cloud (ex-
ASD)
4.8x 2023E PS
90,046
12,506
100.0
12,506
35.3
18.0
4) Net cash
144,618
20,086
100.0
20,086
56.6
29.0
Valuation of core
business and cash
64,908
183.0
93.6
iQIYI and strategic investment
1) iQIYI
Market value
34,992
4,860
51.5
2,503
7.1
2) Trip.com group
Market value
176,991
24,582
10.8
2,655
7.5
3) Uxin
Market value
393
55
9.1
5
0.0
4) HAND Enterprise
Solutions
Market value
9,430
1,310
5.3
69
0.2
5) Kuaishou
Market value
241,692
33,568
3.1
1,043
2.9
6) Yusys Technologies
Market value
15,260
2,119
5.1
109
0.3
Valuation of iQIYI
and investments
6,383
18.0

22 Nov 2023
PLEASE READ THE ANALYST CERTIFICATION AND IMPORTANT DISCLOSURES ON LAST PAGE
4
Valuation of iQIYI
and investment (with
30% holding
discount)
4,468
12.6
6.4
Total Baidu valuation
(US$mn)
69,376
Number of ADS
outstanding (mn)
355
Valuation per ADS
(US$)
195.6
Source: Company data, CMBIGM estimates
Note: 1) American depositary share (ADS); iQIYI (IQ US); Trip.com Group (TCOM US); Uxin (UXIN US); HAND Enterprise solution (300170 SH);
Kuaishou (1024 HK); Yusys Technologies (300674 SH); 2) data as of 22 Nov 2023 market close; 3) we fine-tuned exchange rate assumption from
RMB:USD = 1:6.925 to RMB:USD = 1:7.2
Our target price translates into 18.6/18.6x 2023/2024E PE on non-GAAP basis, or
13.2/13.2x if excluding net cash.

22 Nov 2023
PLEASE READ THE ANALYST CERTIFICATION AND IMPORTANT DISCLOSURES ON LAST PAGE
5
Financial Summary
INCOME STATEMENT
2020A
2021A
2022A
2023E
2024E
2025E
YE 31 Dec (RMB mn)
Revenue
107,074
124,493
123,675
135,046
147,945
164,443
Cost of goods sold
(55,158)
(64,314)
(63,935)
(65,322)
(70,959)
(76,942)
Gross profit
51,916
60,179
59,740
69,725
76,986
87,501
Operating expenses
(37,576)
(49,661)
(43,829)
(48,473)
(52,714)
(57,975)
SG&A expense
(18,063)
(24,723)
(20,514)
(24,038)
(26,778)
(29,764)
R&D expense
(19,513)
(24,938)
(23,315)
(24,434)
(25,936)
(28,210)
Operating profit
14,340
10,518
15,911
21,252
24,273
29,526
Share of (losses)/profits of associates/JV
(2,248)
(932)
(1,910)
(1,221)
(1,084)
(965)
Adjusted EBITDA
27,504
24,914
29,663
34,623
38,019
44,157
Net Interest income/(expense)
2,255
2,130
3,332
4,540
3,154
3,442
Foreign exchange gain/loss
(660)
100
(1,484)
1,044
835
668
Other income/expense
9,403
(1,038)
(5,737)
2,183
2,205
2,227
Pre-tax profit
23,090
10,778
10,112
27,799
29,382
34,898
Income tax
(4,064)
(3,187)
(2,578)
(5,155)
(7,197)
(8,406)
After tax profit
19,026
7,591
7,534
22,643
22,185
26,491
Minority interest
(3,446)
(2,635)
(25)
958
1,431
1,697
Net profit
22,472
10,226
7,559
21,685
20,754
24,795
Adjusted net profit
22,020
18,830
20,680
26,845
27,112
31,679
BALANCE SHEET
2020A
2021A
2022A
2023E
2024E
2025E
YE 31 Dec (RMB mn)
Current assets
183,342
213,315
212,850
238,994
269,371
304,444
Cash & equivalents
35,782
36,850
53,156
79,820
107,841
139,917
Restricted cash
758
10,821
11,330
11,330
11,330
11,330
Account receivables
8,668
9,981
11,733
9,990
10,944
12,164
Other current assets
138,134
155,663
136,631
137,854
139,256
141,033
Non-current assets
149,366
166,719
178,123
176,864
179,512
182,228
PP&E
17,508
23,027
23,973
28,017
32,018
36,109
Intangibles
8,457
8,947
8,095
2,792
1,439
64
Goodwill
22,248
22,605
22,477
22,477
22,477
22,477
Other non-current assets
101,153
112,140
123,578
123,578
123,578
123,578
Total assets
332,708
380,034
390,973
415,858
448,883
486,672
Current liabilities
68,385
74,488
79,630
84,637
87,979
90,566
Short-term borrowings
3,016
4,168
5,343
5,343
5,343
5,343
Account payables
36,716
41,384
38,014
41,809
43,775
44,602
Other current liabilities
28,653
28,936
36,273
37,486
38,861
40,620
Non-current liabilities
72,480
81,594
73,538
65,480
64,355
63,823
Long-term borrowings
0
12,629
13,722
0
0
0
Bond payables
60,335
55,772
49,461
55,125
54,000
53,468
Obligations under finance leases
4,693
5,569
4,810
4,810
4,810
4,810
Deferred income
97
129
159
159
159
159
Other non-current liabilities
7,355
7,495
5,386
5,386
5,386
5,386
Total liabilities
140,865
156,082
153,168
150,117
152,334
154,388
Share capital
0
0
0
0
0
0
Capital surplus
47,213
47,548
47,748
47,948
48,148
48,348
Retained earnings
135,483
163,911
175,730
203,465
234,074
269,609
Other reserves
3,102
7,148
8,393
8,393
8,393
8,393
Total shareholders equity
185,798
218,607
231,871
259,806
290,615
326,350
Minority interest
6,045
5,345
5,934
5,934
5,934
5,934
Total equity and liabilities
332,708
380,034
390,973
415,858
448,883
486,672

22 Nov 2023
PLEASE READ THE ANALYST CERTIFICATION AND IMPORTANT DISCLOSURES ON LAST PAGE
6
CASH FLOW
2020A
2021A
2022A
2023E
2024E
2025E
YE 31 Dec (RMB mn)
Operating
Profit before taxation
23,090
10,778
10,112
27,799
29,382
34,898
Depreciation & amortization
18,180
16,438
14,725
5,700
5,742
5,654
Tax paid
(4,064)
(3,187)
(2,578)
(5,155)
(7,197)
(8,406)
Change in working capital
(18,207)
(18,691)
(16,758)
5,528
986
(411)
Others
5,201
14,784
20,669
7,089
7,196
7,817
Net cash from operations
24,200
20,122
26,170
40,961
36,109
39,551
Investing
Capital expenditure
(5,084)
(10,896)
(8,286)
(8,286)
(8,286)
(8,286)
Acquisition of subsidiaries/ investments
(2,396)
(247)
(14)
0
0
0
Net proceeds from disposal of short-term
investments
(486)
0
0
0
0
0
Others
(19,586)
(20,301)
4,356
(130)
(104)
(84)
Net cash from investing
(27,552)
(31,444)
(3,944)
(8,416)
(8,390)
(8,370)
Financing
Net borrowings
12,390
8,840
(6,813)
(13,722)
0
0
Share repurchases
(13,054)
(7,581)
(1,925)
0
0
0
Others
6,329
22,137
2,348
7,091
302
895
Net cash from financing
5,665
23,396
(6,390)
(6,631)
302
895
Net change in cash
Cash at the beginning of the year
34,439
36,540
47,671
65,236
91,150
119,171
Exchange difference
(212)
(943)
1,729
0
0
0
Cash at the end of the year
36,540
47,671
65,236
91,150
119,171
151,247
GROWTH
2020A
2021A
2022A
2023E
2024E
2025E
YE 31 Dec
Revenue
(0.3%)
16.3%
(0.7%)
9.2%
9.6%
11.2%
Gross profit
16.5%
15.9%
(0.7%)
16.7%
10.4%
13.7%
Operating profit
127.4%
(26.7%)
51.3%
33.6%
14.2%
21.6%
Net profit
992.5%
(54.5%)
(26.1%)
186.9%
(4.3%)
19.5%
Adj. net profit
21.1%
(14.5%)
9.8%
29.8%
1.0%
16.8%
PROFITABILITY
2020A
2021A
2022A
2023E
2024E
2025E
YE 31 Dec
Gross profit margin
48.5%
48.3%
48.3%
51.6%
52.0%
53.2%
Operating margin
13.4%
8.4%
12.9%
15.7%
16.4%
18.0%
Adj. net profit margin
20.6%
15.1%
16.7%
19.9%
18.3%
19.3%
Return on equity (ROE)
12.8%
5.1%
3.4%
8.8%
7.5%
8.0%
GEARING/LIQUIDITY/ACTIVITIES
2020A
2021A
2022A
2023E
2024E
2025E
YE 31 Dec
Net debt to equity (x)
(0.5)
(0.5)
(0.5)
(0.6)
(0.6)
(0.6)
Current ratio (x)
2.7
2.9
2.7
2.8
3.1
3.4
Receivable turnover days
27.0
27.0
31.6
29.0
25.5
25.3
Payable turnover days
226.5
218.6
223.5
220.0
217.1
206.8
VALUATION
2020A
2021A
2022A
2023E
2024E
2025E
YE 31 Dec
P/E
13.1
42.3
40.1
13.1
13.8
11.7
P/E (diluted)
13.2
43.2
40.5
13.2
14.0
11.8
P/B
1.6
2.0
1.3
1.1
1.0
0.9
P/CFPS
15.5
47.9
17.1
8.8
10.4
9.4
Source: Company data, CMBIGM estimates. Note: The calculation of net cash includes financial assets.

22 Nov 2023
PLEASE READ THE ANALYST CERTIFICATION AND IMPORTANT DISCLOSURES ON LAST PAGE
7
Disclosures & Disclaimers
Analyst Certification
The research analyst who is primary responsible for the content of this research report, in whole or in part, certifies that with respect to the securities
or issuer that the analyst covered in this report: (1) all of the views expressed accurately reflect his or her personal views about the subject securities
or issuer; and (2) no part of his or her compensation was, is, or will be, directly or indirectly, related to the specific views expressed by that analyst in
this report.
Besides, the analyst confirms that neither the analyst nor his/her associates (as defined in the code of conduct issued by The Hong Kong Securities
and Futures Commission) (1) have dealt in or traded in the stock(s) covered in this research report within 30 calendar days prior to the date of issue
of this report; (2) will deal in or trade in the stock(s) covered in this research report 3 business days after the date of issue of this report; (3) serve as
an officer of any of the Hong Kong listed companies covered in this report; and (4) have any financial interests in the Hong Kong listed companies
covered in this report.
CMBIGM Ratings
BUY : Stock with potential return of over 15% over next 12 months
HOLD : Stock with potential return of +15% to -10% over next 12 months
SELL : Stock with potential loss of over 10% over next 12 months
NOT RATED : Stock is not rated by CMBIGM
OUTPERFORM : Industry expected to outperform the relevant broad market benchmark over next 12 months
MARKET-PERFORM : Industry expected to perform in-line with the relevant broad market benchmark over next 12 months
UNDERPERFORM : Industry expected to underperform the relevant broad market benchmark over next 12 months
CMB International Global Markets Limited
Address: 45/F, Champion Tower, 3 Garden Road, Hong Kong, Tel: (852) 3900 0888 Fax: (852) 3900 0800
CMB International Global Markets Limited (“CMBIGM”) is a wholly owned subsidiary of CMB International Capital Corporation Limited (a wholly owned
subsidiary of China Merchants Bank)
Important Disclosures
There are risks involved in transacting in any securities. The information contained in this report may not be suitable for the purposes of all investors. CMBIGM
does not provide individually tailored investment advice. This report has been prepared without regard to the individual investment objectives, financial position
or special requirements. Past performance has no indication of future performance, and actual events may differ materially from that which is contained in the
report. The value of, and returns from, any investments are uncertain and are not guaranteed and may fluctuate as a result of their dependence on the
performance of underlying assets or other variable market factors. CMBIGM recommends that investors should independently evaluate particular investments
and strategies, and encourages investors to consult with a professional financial advisor in order to make their own investment decisions.
This report or any information contained herein, have been prepared by the CMBIGM, solely for the purpose of supplying information to the clients of CMBIGM
or its affiliate(s) to whom it is distributed. This report is not and should not be construed as an offer or solicitation to buy or sell any security or any interest in
securities or enter into any transaction. Neither CMBIGM nor any of its affiliates, shareholders, agents, consultants, directors, officers or employees shall be
liable for any loss, damage or expense whatsoever, whether direct or consequential, incurred in relying on the information contained in this report. Anyone
making use of the information contained in this report does so entirely at their own risk.
The information and contents contained in this report are based on the analyses and interpretations of information believed to be publicly available and reliable.
CMBIGM has exerted every effort in its capacity to ensure, but not to guarantee, their accuracy, completeness, timeliness or correctness. CMBIGM provides
the information, advices and forecasts on an "AS IS" basis. The information and contents are subject to change without notice. CMBIGM may issue other
publications having information and/ or conclusions different from this report. These publications reflect different assumption, point-of-view and analytical
methods when compiling. CMBIGM may make investment decisions or take proprietary positions that are inconsistent with the recommendations or views in
this report.
CMBIGM may have a position, make markets or act as principal or engage in transactions in securities of companies referred to in this report for itself and/or
on behalf of its clients from time to time. Investors should assume that CMBIGM does or seeks to have investment banking or other business relationships with
the companies in this report. As a result, recipients should be aware that CMBIGM may have a conflict of interest that could affect the objectivity of this report
and CMBIGM will not assume any responsibility in respect thereof. This report is for the use of intended recipients only and this publication, may not be
reproduced, reprinted, sold, redistributed or published in whole or in part for any purpose without prior written consent of CMBIGM.
Additional information on recommended securities is available upon request.
For recipients of this document in the United Kingdom
This report has been provided only to persons (I)falling within Article 19(5) of the Financial Services and Markets Act 2000 (Financial Promotion) Order 2005
(as amended from time to time)(“The Order”) or (II) are persons falling within Article 49(2) (a) to (d) (“High Net Worth Companies, Unincorporated Associations,
etc.,) of the Order, and may not be provided to any other person without the prior written consent of CMBIGM.
For recipients of this document in the United States
CMBIGM is not a registered broker-dealer in the United States. As a result, CMBIGM is not subject to U.S. rules regarding the preparation of research reports
and the independence of research analysts. The research analyst who is primary responsible for the content of this research report is not registered or qualified
as a research analyst with the Financial Industry Regulatory Authority (“FINRA”). The analyst is not subject to applicable restrictions under FINRA Rules
intended to ensure that the analyst is not affected by potential conflicts of interest that could bear upon the reliability of the research report. This report is
intended for distribution in the United States solely to "major US institutional investors", as defined in Rule 15a-6 under the US, Securities Exchange Act of
1934, as amended, and may not be furnished to any other person in the United States. Each major US institutional investor that receives a copy of this report
by its acceptance hereof represents and agrees that it shall not distribute or provide this report to any other person. Any U.S. recipient of this report wishing to
effect any transaction to buy or sell securities based on the information provided in this report should do so only through a U.S.-registered broker-dealer.
For recipients of this document in Singapore
This report is distributed in Singapore by CMBI (Singapore) Pte. Limited (CMBISG) (Company Regn. No. 201731928D), an Exempt Financial Adviser as defined
in the Financial Advisers Act (Cap. 110) of Singapore and regulated by the Monetary Authority of Singapore. CMBISG may distribute reports produced by its
respective foreign entities, affiliates or other foreign research houses pursuant to an arrangement under Regulation 32C of the Financial Advisers Regulations.
Where the report is distributed in Singapore to a person who is not an Accredited Investor, Expert Investor or an Institutional Investor, as defined in the Securities
and Futures Act (Cap. 289) of Singapore, CMBISG accepts legal responsibility for the contents of the report to such persons only to the extent required by law.
Singapore recipients should contact CMBISG at +65 6350 4400 for matters arising from, or in connection with the report.