BMP Initiation - BUY PDF Free Download
1 / 15/15
100%

BMP Initiation – BUY
November 21, 2025
ACBS Research Department www.acbs.com.vn 1
Tel: (+84) (28) 7300 7000 Bloomberg: ACBS <GO>

BMP Initiation - BUY
21-Nov-25
ACBS Research Department www.acbs.com.vn 2
Tel: (+84) (28) 7300 7000 Bloomberg: ACBS <GO>
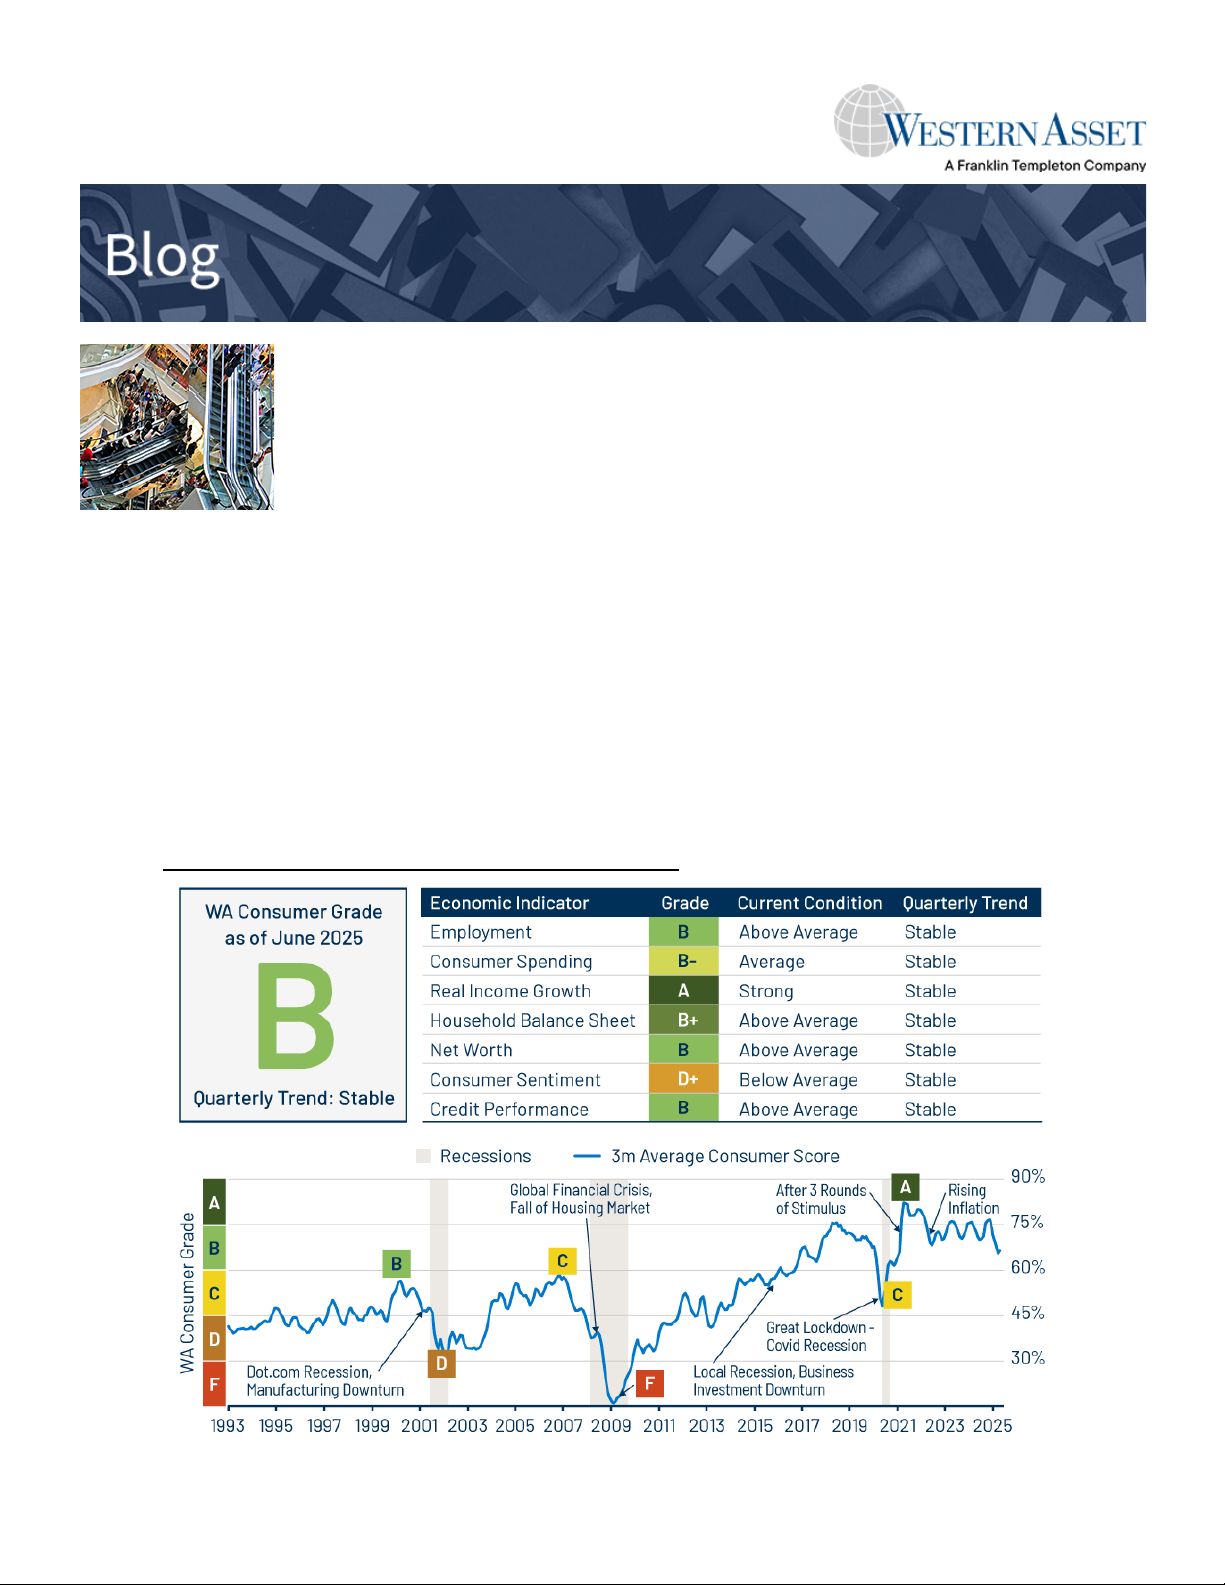
Binh Minh Plastics Joint Stock Company (HSX: BMP)
BMP is a leading enterprise in the construction plastic industry in Vietnam. BMP
currently holds a 27% market share nationwide and 50% market share in the
South. The company has recorded stable business results in recent years, mainly
due to a significant decrease in raw material costs (mainly PVC resin). With the
prospect of PVC prices remaining low in 2026, we forecast that BMP will maintain
revenue and profit growth of 4% and 8.3%, respectively, in 2026. The target price
for the stock by the end of 2026 is VND181,600/share. Rating BUY.
BMP's output products include three main types of plastic pipes: uPVC, HDPE, and
PP-R. As a subsidiary of The Nawaplastic Industries, BMP enjoys input advantages
over other companies, with most of its raw materials (PVC resin) sourced
domestically. As a result, BMP consistently achieves higher profit margins compared
to other companies in the industry.
The continuous decrease in PVC resin prices since 2022 has positively supported
BMP's profit margin. For Q3/2025, BMP recorded revenue of VND1,554 billion (+9.3%
YoY) and NPAT of VND351 billion (+21% YoY and +6% compared to the previous
quarter). Gross profit margin improved from 42.6% in the same period last year to
47.2%, thanks to the continued decline in PVC resin prices (-12.8% YoY).
Additionally, sales volume increased due to higher discount and the recovery in
domestic demand, while the selling price of plastic pipes was estimated to remain
stable YoY. Cumulative revenue for 9M2025 reached VND4,295 billion (+19% YoY)
with NPAT of VND967 billion (+27.3% YoY). Increased sales volume and a 15.5% YoY
decrease in PVC resin costs were the main drivers behind this performance.
BMP's financial structure is healthy, with the lowest debt ratio compared to other
companies in the industry. With a high proportion of cash and short-term deposits,
BMP's financial risk is low.
Outlook
PVC resin prices are expected to remain low due to the sluggish economic outlook in
China, particularly in the real estate sector. Additionally, the average Brent crude oil
price for 2026 is projected to decrease to USD58 per barrel according to the EIA and
USD56 per barrel according to Goldman Sachs, which will also help maintain low PVC
prices.
We forecast BMP's full-year results for 2025 to be revenue of VND5,515 billion
(+19.5% YoY) and NPAT of VND1,315 billion (+32.8% YoY). For 2026, we expect
revenue to reach VND5,710 billion (+4% YoY) and NPAT to reach VND1,425 billion
(+8.3% YoY) due to sustained low PVC resin prices and increased demand for plastic
pipe products. Using a discounted cash flow method, we value BMP at 181,600
VND/share by the end of 2026.
Mr. Hung Phan
(+84 8) 7300 7000 - Ext: 1044
hungpv@acbs.com.vn
Company Coverage
Recommendation
BUY
HSX: BMP
Construction & Materials
Target price (VND) 181,600
Market price (VND) 157,000
Expected share price return 15.7%
Expected dividend yield 8.9%
Expected total return 24.6%
Stock performance (%)
YTD
1M
3M
12M
Absolute 30.4
3.2
23.0
42.4
Relative -1.0
1.9
22.9
3.9
Source: Bloomberg
Ownership
The Nawaplastic 54.99%
KWE Beteiligungen 11.37%
Stock Statistics 20-Nov-2025
Bloomberg code PVS VN
52-week range (VND)
100,200 -
180,000
Shares O/S (m) 82
Mkt cap (VND bn) 12,893
Mkt cap (USD m) 489
Est. Foreign room left
(%) 14.8
Est. free float (%) 43.8
3m avg daily vol (shrs)
136,811
VND/USD 26,381
Index: VNIndex / HNX
1638.29/261.39
2022
2023
2024
2025F
2026F
Net Sales (VNDbn)
5,808
5,157
4,616
5,515
5,710
Growth (%)
28%
-11%
-10%
19%
4%
EBITDA (VNDbn)
1,146
1,505
1,424
1,877
1,978
EBITDA margin
20%
29%
31%
34%
35%
Net income (VNDbn)
694
1,041
991
1,316
1,425
Growth (%)
224%
50%
-5%
33%
8%
EPS (bonus-adjusted, VND)
8,400
12,600
11,990
15,912
17,237
Growth (%)
224%
50%
-5%
33%
8%
ROE (%)
28%
39%
37%
47%
48%
ROIC (%)
22%
30%
29%
38%
38%
Net debt/EBITDA (x)
-1.1
-1.3
-1.3
-1.1
-1.2
PER (times)
18.7
12.5
13.1
9.9
9.1
EV/EBITDA (x)
5.3
4.1
4.3
3.3
3.1
PBR (times)
4.9
4.8
4.8
4.5
4.1
DPS (VND)
5,700
11,800
11,840
14,000
14,000
Dividend yield (%)
4%
8%
8%
9%
9%
0
200
400
600
800
1,000
1,200
0
50
100
150
200 Price-Volume
VND '000 '000
shrs

BMP Initiation - BUY
21-Nov-25
ACBS Research Department www.acbs.com.vn 3
Tel: (+84) (28) 7300 7000 Bloomberg: ACBS <GO>
Vietnam’s Plastic Industry
According to the Vietnam Plastics Association (VPA), the Vietnamese plastics
industry has a revenue scale of over USD31 billion, with more than 4,000 enterprises,
of which 90% are small and medium-sized enterprises, mainly concentrated in the
southern region. Over the past five years, the industry has consistently achieved a
growth rate of 12-15% per year.
According to Mordor Intelligence, Vietnam's plastic market is projected to reach
approximately 11.84 million tons by 2025 and increase to 17.76 million tons by 2030.
From 2025 to 2030, the industry's compound annual growth rate (CAGR) is
forecasted at 8.44%.
The process of urbanization, the rise of the middle class, and the development of e-
commerce have driven the demand for plastics in construction, packaging, and
household products. At the same time, Vietnam's emergence as a major global
manufacturing hub has also played an important role in the growth of the domestic
plastic market.
Source: ACBS, MoIT, NTP
Regard the input material, according to a report by VIRAC (2024), Vietnam's plastic
industry is only capable of producing certain raw materials such as PVC, PP, PET, PS,
and PE (derived from petroleum or natural gas), with an annual production capacity of
nearly 3 million tons. As a result, the industry remains heavily reliant on imported raw
materials, accounting for approximately 70% of total supply. These imports mainly
come from countries such as China, South Korea, Thailand, and others. Additionally,
imported raw materials are often preferred due to their competitive pricing. As a
result, many companies in the plastics industry are forced to maintain large
inventories of raw materials to ensure uninterrupted production. This, in turn, leads
to higher financial costs and exposes businesses to risks from exchange rate
fluctuations and global oil price volatility.
Construction Plastic Segment
The growth of demand in the construction plastics sector is largely influenced by the
real estate and construction market. Furthermore, due to a significant increase in
capacity prior to 2019 (CAGR = 15% from 2015 to 2018), the domestic construction
plastics segment has often faced an oversupply situation, with consumption only
meeting 40% of its designed capacity. As a result, most companies in this sector
operate below their full capacity.
35%
22%
25%
18%
Vietnam Plastic Industry structure
Packaging
Household
Construction
Engineering

BMP Initiation - BUY
21-Nov-25
ACBS Research Department www.acbs.com.vn 4
Tel: (+84) (28) 7300 7000 Bloomberg: ACBS <GO>
PVC, PP, and HDPE are the 3 main types of plastic resins used in the building plastics
industry. Although Vietnam has the ability to produce PVC and PP, domestic
production only meets around 30-40% of annual demand. In 2024, Vietnam imported
1.1 million tons of PVC (+26.8% YoY), primarily from Taiwan (27%), China (21%), and
Indonesia (14%).
Source: ACBS, VPA
Overview of Binh Minh Plastic JSC
Binh Minh Plastic Joint Stock Company (HOSE: BMP) was established in 1977 and
listed on the HOSE stock exchange in 2006. It is a leading enterprise in the plastics
construction material industry in Vietnam. Since 2018, BMP has been a subsidiary of
The Nawaplastic Industries (Saraburi) Co., Ltd, a company under SCG Thailand
Group.
BMP
NTP
HSG
Stroman
Dekko
Capacity (ton/ year) 150.000
260.000
130.000
140.000
53.000
Production 2024 (ton) 78.100
108.328
~50.000
n/a
n/a
% capacity 52%
42%
38%
n/a
n/a
Market share 2024 23%
32%
15%
n/a
n/a
29% 28% 28% 27% 23%
24% 28% 29% 31% 32%
0%
10%
20%
30%
40%
50%
60%
70%
80%
90%
100%
2020 2021 2022 2023 2024
Construction plastic market share
BMP NTP HSG Other
250
300
350
400
2020 2021 2022 2023 2024
Construction plastic demand
thousand ton

BMP Initiation - BUY
21-Nov-25
ACBS Research Department www.acbs.com.vn 5
Tel: (+84) (28) 7300 7000 Bloomberg: ACBS <GO>
With a distribution network of over 2,200 distributors/retail stores across the
country, BMP typically holds around 25-27% of the national market share, ranking
second after NTP (which holds 30% of the market share), and 50% of the market
share in the South.
BMP operates 4 factories with a total design capacity of 150,000 tons per year, with
73% of its capacity located in the South. This region is also BMP's primary market, as
plastic pipe products are typically prioritized for local consumption near the factory,
due to the bulky nature of the products and high transportation costs.
Source: BMP, ACBS
The output products of BMP include three main types of plastic pipes: uPVC, HDPE,
and PP-R. Among these, uPVC pipes account for the largest share, representing
83.3% of the total design capacity.
BMP
factories Year of operation
Capacity
(ton/year)
In which: uPVC capacity
HDPE + PPR
HCM 1977
5.000
5.000
0
Binh Duong 1999
80.000
65.000
15.000
Hung Yen 2007
40.000
30.000
10.000
Long An
Phase 1:2015
Phase 2: 2017
5.000
25.000
25.000
0
Product Year of
operation Characteristics Applications
uPVC 1977 Low pressure resistance Residential construction
HDPE 2002 High pressure resistance
Infrastructure
construction
PP-R 2009
High pressure and high
temperature resistance Residential construction
55%
11%
5%
5%
24%
BMP's shareholder
The Nawaplastic Industries
KWE Beteiligungen AG
FTIF
Vietnam Holding Ltd
Other
Plastic resin
• PVC
• HDPE
• PP
Extrusion
Technology
Plastic
Pipes
and
Fittings
• Residential Plastic Pipes (uPVC,
PP-R)
• Infrastructure Plastic Pipes
(HDPE)

BMP Initiation - BUY
21-Nov-25
ACBS Research Department www.acbs.com.vn 6
Tel: (+84) (28) 7300 7000 Bloomberg: ACBS <GO>
The main input materials for BMP include three types of plastic resins: PVC (Polyvinyl
Chloride), PP (Polypropylene), and HDPE (High-Density Polyethylene). The cost of
raw materials consistently accounts for a significant proportion of total production
costs, ranging from 65% to 75%.
As a subsidiary of The Nawaplastic Industries (a leading plastic pipe manufacturer and
distributor in Thailand), BMP enjoys an input advantage over other companies in the
industry. The PVC resin (which makes up the largest portion of BMP’s resin
composition) is supplied by two domestic suppliers, TPC Vina and AGC Chemicals,
with an equal split of 50:50. Notably, TPC Vina is a member company of the SCG
Group, the same group to which BMP belongs. This allows BMP to reduce its
dependency on imported raw materials and not have to maintain large inventories of
materials, unlike many other companies in the same industry. In contrast, NTP (one
of BMP’s major competitors) imports 100% of its resin for production.
Competitors
Source: BMP, NTP, HSG
With the location of its factories as mentioned above, BMP does not have a
competitive advantage in the Northern market (only holding a 5% market share
there). Furthermore, this is where Tien Phong Plastic JSC (HNX: NTP) – an established
company with an extensive distribution network – dominates with a 60% market
share in the North and 30% market share nationwide (as of 2024).
In the Southern market, BMP competes directly with HSG and Stroman. Since the end
products of these companies are often not significantly different from each other,
competition primarily hinges on the discount levels offered by each company.
Moreover, the market for these products tends to be concentrated around the
factory due to the bulky nature of the products.
BMP
NTP
HSG
Stroman VN
Dekko
Capacity (ton/ year) 150.000
260.000
~130.000
140.000
53.000
In which: North
40.000
185.000
19.800
70.000
33.000
Central
15.000
12.000
20.000
South
110.000
60.000
97.981
70.000
74% 71% 79% 75% 64% 65%
0%
10%
20%
30%
40%
50%
60%
70%
80%
90%
100%
2019 2020 2021 2022 2023 2024
Production cost by factors
Raw material Labor Depreciation Outsourcing Other

BMP Initiation - BUY
21-Nov-25
ACBS Research Department www.acbs.com.vn 7
Tel: (+84) (28) 7300 7000 Bloomberg: ACBS <GO>
Business operations are sensitive to raw material costs
Source: BMP, ACBS
Period 2012-2020: During this period, the selling price of products remained almost
unchanged. Revenue growth was primarily driven by an increase in sales volume. The
increase in capacity of BMP, along with the positive trends in the real estate and
construction markets, boosted the demand for plastic pipes. However, from 2016 to
2020, the growth rate in sales volume slowed compared to 2012-2016 due to
stronger competition from HSG, Stroman, and Dekko (Hung Yen) in the market.
Additionally, gross profit margin declined as the price of PVC resin increased.
Period 2021-2024: In 2021, the price of PVC resin surged sharply (+51% YoY),
marking the first year BMP raised its product prices (+20% YoY). The significant
increase in PVC prices was driven by the conflict between Russia and Ukraine, which
caused a surge in crude oil and gas prices. The increase in raw material costs outpaced
the selling price increase, resulting in a decline in BMP’s net profit margin to its lowest
level.
0.0%
5.0%
10.0%
15.0%
20.0%
25.0%
0
1,000
2,000
3,000
4,000
5,000
6,000
7,000
2012 2013 2014 2015 2016 2017 2018 2019 2020 2021 2022 2023 2024 9T2025
BMP's business results
Revenue NPAT Net profit margin
bil VND
10
15
20
25
30
35
40
45
50
55
60
BMP's selling price and input price
Selling price PVC input price
(mil/ tấn)

BMP Initiation - BUY
21-Nov-25
ACBS Research Department www.acbs.com.vn 8
Tel: (+84) (28) 7300 7000 Bloomberg: ACBS <GO>
From 2022 to 2024, BMP’s net profit margin steadily improved as the price of PVC
resin decreased due to falling oil prices (from $101 per barrel in 2022 to $81 per barrel
in 2024). Many petrochemical plants resumed operations after the Covid pandemic,
increasing PVC supply, while global construction demand, especially in China, had not
yet recovered. However, during this period, BMP’s market share declined from 27.5%
to 23.2%, as BMP maintained a higher price policy compared to its competitors in
order to maximize profit margins in the context of weak market demand.
Source: BMP, NTP, ACBS
Strong Growth in 9M2025 Business Results
BMP announced its Q3/2025 financial report with revenue of VND1,554 billion (+9.3%
YoY) and NPAT of VND351 billion (+21% YoY and +6% compared to the previous
quarter). The revenue increase was primarily driven by a 9% YoY increase in sales
volume, while the price of plastic pipes remained stable YoY. In addition to the
recovery in domestic demand, the increase in discount levels positively supported
the growth in sales volume. The total discount-to-revenue ratio rose to 15%
compared to 12.3% YoY and 12.5% from the previous quarter. Moreover, the gross
profit margin improved from 42.6% YoY to 47.2%, thanks to a continued decline in
the price of PVC resin (-12.8% YoY).
For 9M2025, accumulated revenue reached VND4,295 billion (+19% YoY) and NPAT
was VND967 billion (+27.3% YoY). The increase in sales volume, along with a 15.5%
YoY decrease in PVC resin prices, were the main factors driving this growth. The total
discount-to-revenue ratio increased to 14.2% from 12.7% YoY, which also positively
supported sales volume. As a result, BMP’s market shares improved from 23% at the
end of 2024 to around 27% in Q3/2025.
-
200
400
600
800
1,000
1,200
1,400
1,600
30
35
40
45
50
55
60
2018 2019 2020 2021 2022 2023 2024
BMP vs NTP's selling price
PVC resin price NTP sale price BMP sale price
(mil VND/ ton) USD/ ton

BMP Initiation - BUY
21-Nov-25
ACBS Research Department www.acbs.com.vn 9
Tel: (+84) (28) 7300 7000 Bloomberg: ACBS <GO>
Strong financial position
Source: BMP, NTP, DNP, ACBS
With their leading market positions, BMP and NTP have consistently maintained high
profit margins. Among them, BMP achieves higher profitability thanks to:
BMP maintains higher selling prices, while NTP prioritizes market share.
Domestic input supply helps reduce costs and minimize raw-material
inventory.
More effective control of SG&A expenses, supported by SCG in technology,
ERP implementation, and supply-chain management. As a result, BMP’s ratio
of G&A expenses to revenue has always been lower than peers (a 5-year
average of 2%, compared with 3.6% for NTP and 6% for DNP).
In addition, BMP has the lowest debt-to-total-assets ratio in the industry, averaging
only 1.9%, all of which is short-term debt. This structure has remained stable since
0%
5%
10%
15%
20%
25%
2012 2013 2014 2015 2016 2017 2018 2019 2020 2021 2022 2023 2024
Net Profit margin
BMP NTP DNP
0%
5%
10%
15%
20%
25%
30%
2012 2013 2014 2015 2016 2017 2018 2019 2020 2021 2022 2023 2024
SG&A/ Revenue
BMP NTP DNP

BMP Initiation - BUY
21-Nov-25
ACBS Research Department www.acbs.com.vn 10
Tel: (+84) (28) 7300 7000 Bloomberg: ACBS <GO>
2018. With cash and short-term financial investment accounting for an average of
50% of total assets, BMP faces virtually no risk in meeting debt obligations.
BMP’s financial expenses-to-revenue ratio is on average 0.5% higher than NTP’s but
still much lower than DNP’s. Given its low debt level, this is mainly because BMP offers
higher payment discounts compared to NTP.
Source: BMP, NTP, DNP, ACBS
High dividend payout ratio
BMP has consistently maintained the highest dividend payout ratio in the industry for
many years, at 97–100%, corresponding to a dividend yield of around 7–11% from
2019 to the present. This high payout is due to BMP having no investment plans
during this period. For 2025, we expect this payout ratio to continue to be maintained.
Tickers 2021
2022
2023
2024
BMP 99,3%
100%
100%
100%
NTP 66%
57%
59%
50%
DNP 0%
0%
0%
0%
0%
10%
20%
30%
40%
50%
BMP NTP DNP
Total Debt/ Total Assets 2024
0%
2%
4%
6%
8%
10%
12%
2012 2013 2014 2015 2016 2017 2018 2019 2020 2021 2022 2023 2024
Financial expense/ Revenue
BMP NTP DNP

BMP Initiation - BUY
21-Nov-25
ACBS Research Department www.acbs.com.vn 11
Tel: (+84) (28) 7300 7000 Bloomberg: ACBS <GO>
Outlook and Valuation
PVC Resin Price Outlook
Since PVC resin is derived from petroleum (and partly from coal), PVC prices are
influenced by movements in oil and gas prices. In addition, because domestic
production capacity only meets 30–40% of Vietnam’s PVC resin demand, domestic
PVC prices are also affected by Chinese PVC prices. China is the world’s largest PVC
producer, accounting for 40–45% of global output.
For 2025–2026, PVC resin prices are expected to remain low due to China’s weak
economic outlook, particularly the sluggish real estate sector. Furthermore, the
average Brent oil price in 2026 is forecast to drop to USD58/ bbl by the EIA and
USD56/ bbl by Goldman Sachs, which will reduce PVC production costs. The key
drivers of this forecast are slower oil demand growth and increasing supply from
OPEC+.
Forecast
We project BMP’s FY2025 financial results with revenue of VND5,515 billion (+19.5%
YoY) and NPAT of VND1,315 billion (+32.8% YoY). This implies the following Q4 2025
results:
Revenue: VND1,315 billion (+22.9% YoY), based on full-year sales volume of
92 thousand tons (+18% YoY), assuming flat selling prices and a 14% YoY
decline in average PVC input prices in 2025.
NPAT at VND348 billion (+50.8% YoY).
Our forecasts are 3% and 24.6% higher than BMP’s 2025 revenue and net profit
targets, respectively. For 2026, we forecast revenue of VND 5,710 billion (+4% YoY)
and NPAT of VND1,425 billion (+8.3% YoY), based on the following key assumptions:
Sales volume grows 4% YoY driven by domestic real estate market recovery
Selling prices remain stable, while PVC input prices decline slightly by 3%
BMP maintains its current discount rate to preserve market share
Valuation
Using the Discounted Cash Flow (DCF) method, we value BMP at VND 181,600 per
share by end-2026, including expected cash dividends of VND 14,000 per share
(equivalent to 140% of par value). This represents an upside potential of 24.6%
compared to the current market price. Recommendation: BUY.

BMP Initiation - BUY
21-Nov-25
ACBS Research Department www.acbs.com.vn 12
Tel: (+84) (28) 7300 7000 Bloomberg: ACBS <GO>
BMP FINANCIALS MODEL
(VND bn except where stated) 2022
2023
2024
2025F
2026F
Total Net Sales 5,808
5,157
4,616
5,515
5,710
Sales growth (%)
28%
-11%
-10%
19%
4%
CoGS ex-dep'n 4,031
2,868
2,516
2,901
2,954
SG&A 632
783
676
737
777
SG&A as % of sales
11%
15%
15%
13%
14%
EBITDA 1,146
1,505
1,424
1,877
1,978
EBITDA margin (%)
20%
29%
31%
34%
35%
Depreciation 170
172
111
104
108
Operating profit 975
1,333
1,313
1,772
1,871
Operating profit margin (%)
17%
26%
28%
32%
33%
Net interest expense -53
-117
-78
-67
-84
as % of avg, net debt
5%
7%
4%
3%
4%
Tax 177
266
250
329
356
Effective tax rate (%)
20%
20%
20%
20%
20%
Minorities -
-
-
-
-
Net profit 694
1,041
991
1,316
1,425
Net profit margin (%)
12%
20%
21%
24%
25%
Cash earnings 864
1,213
1,102
1,420
1,533
Number of shares (m) 81861
81861
81861
81861
81861
EPS (VND) 8,400
12,600
11,990
15,912
17,237
Share split factor (x) 1.0
1.0
1.0
1.0
1.0
Adjusted EPS (VND) 8,400
12,600
11,990
15,912
17,237
EPS growth (%)
224%
50%
-5%
33%
8%

BMP Initiation - BUY
21-Nov-25
ACBS Research Department www.acbs.com.vn 13
Tel: (+84) (28) 7300 7000 Bloomberg: ACBS <GO>
KEY CASHFLOW AND BS ITEMS 2022 2023 2024 2025F 2026F
Increase in working capital (16) (460) 168 5 (6)
Capex 154 70 77 65 67
Other cash flow items 0 0 0 0 0
Free cash flow 726 1,604 857 1,350 1,472
Share issues (m) 0 0 0 0 0
Dividends paid 467 966 969 1146 1146
Increase in net debt -338 -688 97 -178 -300
Net debt, end of year (1,268) (1,956) (1,859) (2,037) (2,337)
Enterprise value 5,872 5,184 5,281 5,103 4,803
Shareholders' equity 2,621 2,690 2,702 2,858 3,123
BVPS (VND) 32,022 32,857 33,004 34,916 38,152
Net debt / equity (%)
-48%
-73%
-69%
-71%
-75%
Net debt / EBITDA (x) -1.1 -1.3 -1.3 -1.1 -1.2
Total assets
3,045 3,255 3,200 3,401 3,690
KEY RETURN AND VALUATION RATIOS 2022 2023 2024 2025F 2026F
ROE (%) 28.3% 39.2% 36.8% 47.3% 47.7%
ROA (%) 33.2% 42.3% 40.7% 53.7% 52.8%
ROIC (%) 22.2% 30.3% 28.9% 38.3% 38.4%
WACC (%) 15.0% 15.0% 15.0% 15.0% 15.0%
EVA (%) 7.2% 15.3% 13.9% 23.3% 23.4%
PER (x) 18.7 12.5 13.1 9.9 9.1
EV/EBITDA (x) 5.3 4.1 4.3 3.3 3.1
EV/FCF (x) 8.4 3.8 7.1 4.5 4.2
PBR (x) 4.9 4.8 4.8 4.5 4.1
PSR (x) 1.2 1.4 1.5 1.3 1.3
EV/sales (x) 1.1 1.2 1.3 1.1 1.1
Dividend yield (%) 3.6% 7.5% 7.5% 8.9% 8.9%

BMP Initiation - BUY
21-Nov-25
ACBS Research Department www.acbs.com.vn 14
Tel: (+84) (28) 7300 7000 Bloomberg: ACBS <GO>
CONTACTS
Ho Chi Minh City Head Office
117 Nguyen Dinh Chieu, Dist. 3, Ho Chi Minh City
Tel: (+84 28) 7300 7000
Fax: (+84 28) 7300 3751
Hanoi Office
10 Phan Chu Trinh, Hoan Kiem Dist., Ha Noi
Tel: (+84 4) 3942 9395
Fax: (+84 4)3942 9407
RESEARCH & MARKET STRATEGY DEPARTMENT
Head of Research
& Market Strategy
Trang Do
(+84 28) 7300 7000 (x1041)
trangdm@acbs.com.vn
Manager – Properties
Truc Pham
(+84 28) 7300 7000 (x1043)
trucptt@acbs.com.vn
Manager – Financials
Hung Cao
(+84 28) 7300 7000 (x1049)
hungcv@acbs.com.vn
Manager – Retail, Technology
Chi Luong
(+84 28) 7300 7000 (x1042)
chiltk@acbs.com.vn
Manager – Bonds
Tuyen Vo
(+84 28) 7300 7000 (x1110)
tuyenvdp@acbs.com.vn
Associate – Oil & Gas
Hung Phan
(+84 28) 7300 7000 (x1044)
hungpv@acbs.com.vn
Associate – Construction
Dat Do
(+84 28) 7300 7000 (x1048)
datdt@acbs.com.vn
Associate – Utilities
Toan Pham
(+84 28) 7300 7000 (x1051)
toanpd@acbs.com.vn
Analyst – Technical
Huu Vo
(+84 28) 7300 7000 (x1052)
huuvp@acbs.com.vn
INSTITUTIONAL CLIENT DIVISION
Director
Huong Chu
(+84 28) 7300 7000 (x1083)
huongctk@acbs.com.vn
groupis@acbs.com.vn
Manager
Huynh Nguyen
(+84 28) 7300 6879 (x1088)
huynhntn@acbs.com.vn
BMP Initiation - BUY
21-Nov-25
ACBS Research Department www.acbs.com.vn 15
Tel: (+84) (28) 7300 7000 Bloomberg: ACBS <GO>
DISCLAIMER
Our Recommendation System
BUY: Expected prospective total return (including dividends) in VND will be 20% or more within 12 months
OUTPERFORM: Expected prospective total return (including dividends) in VND will be from 10% to 20% within 12 months
NEUTRAL: Expected prospective total return (including dividends) in VND will be from -10% to 10% within 12 months
UNDERPERFORM: Expected prospective total return (including dividends) in VND will be from -20% to -10% within 12 months
SELL: Expected prospective total return (including dividends) in VND will be less than -20% within 12 months
Analyst Certification(s)
We, the author(s) of this report, hereby certify (1) that the views expressed in this research report accurately reflect our personal views about
any or all of the subject securities or issuers referred to in this research report and (2) no part of our compensation was, is, or will be directly
or indirectly related to the specific recommendations or views expressed in this research report.
Important Disclosures
ACBS and/or an affiliate thereof (hereby collectively called ACBS) did or may seek to do business with companies covered in this report as its
routine business. ACBS's proprietary trading accounts may have a position in such companies’ securities. As a result, the investor should be
aware that ACBS may have a conflict of interest from time to time.
ACBS produces a variety of research products including, but not limited to, fundamental analysis, equity-linked analysis, quantitative
analysis, and trade ideas. Recommendations contained in one type of research product may differ from recommendations contained in other
types of research products, whether as a result of differing time horizons, methodologies, or otherwise.
Disclaimer
This report is provided for information purposes only. ACBS makes no express or implied warranties, and expressly disclaims all warranties
of merchantability or fitness for a particular purpose or use with respect to any data included in this report. ACBS will not treat unauthorized
recipients of this report as its clients. Prices shown (if any) are indicative and ACBS is not offering to buy or sell or soliciting offers to buy or
sell any financial instrument. Without limiting any of the foregoing and to the extent permitted by law, in no event shall ACBS, nor any
affiliate, nor any of their respective officers, directors, partners, or employees have any liability for (a) any special, punitive, indirect, or
consequential damages; or (b) any lost profits, lost revenue, loss of anticipated savings or loss of opportunity or other financial loss,
even if notified of the possibility of such damages, arising from any use of this report or its contents. Other than disclosures relating to
ACBS, the information contained in this report has been obtained from sources that ACBS believes to be reliable, but ACBS does not
represent or warrant that it is accurate or complete. The views in this report are subject to change, and ACBS has no obligation to update its
opinions or the information in this report.
Some parts of this report reflect the assumptions, views and analytical methods of the analysts who prepared them, and ACBS is not
responsible for any error of their works and assumptions. ACBS may have issued, and may in the future issue, other reports that are
inconsistent with, and reach different conclusions from, the information presented in this report.
The analyst recommendations in this report reflect solely and exclusively those of the author(s), and such opinions were prepared
independently of any other interests, including those of ACBS. This report does not constitute personal investment advice or take into
account the individual financial circumstances or objectives of the investors who receive it. The securities discussed herein may not be
suitable for all investors. ACBS recommends that investors independently evaluate each issuer, securities or instrument discussed herein
and consult any independent advisors they believe necessary. The value of and income from any investment may fluctuate from day to day
as a result of changes in relevant economic markets (including changes in market liquidity). The information herein is not intended to predict
actual results, which may differ substantially from those reflected. Past performance is not necessarily indicative of future results.
This report may not be distributed to the public media or used by the public media without prior written consent of ACBS. Otherwise it
will be considered as illegal. The breacher shall compensate fully to ACBS any loss or damage which arises from such breach (if any).
In the event that the distribution and/or receipt of this report is prohibited by the investor’s jurisdiction, the investor shall dismiss this report
immediately otherwise it will be at his/her own risks.
ACBS does not provide tax advice and nothing contained herein should be construed to be tax advice. Accordingly, the investors should seek
advice based on their particular circumstances from an independent tax advisor. This report may contain links to third-party websites. ACBS
is not responsible for the content of any third-party website or any linked content contained in a third-party website. Content contained on
such third-party websites is not part of this report and is not incorporated by reference into this report. The inclusion of a link in this report
does not imply any endorsement by ACBS. Access to any third-party website is at the investor’s own risks, and the investor should always
review the terms and privacy policies at third-party websites before submitting any personal information to them. ACBS is not responsible
for such terms and privacy policies and expressly disclaims any liability for them.
© Copyright ACBS (2025). All rights reserved. No part of this report may be reproduced in any manner without the prior written
permission of ACBS.