IBM Telco Network Cloud Manager - Performance 1.4.5 PDF Free Download
1 / 674/674
100%

IBM Telco Network Cloud Manager - Performance 1.4.5
IBM

© Copyright IBM Corp. 2024.
US Government Users Restricted Rights - Use, duplication or disclosure restricted by GSA ADP Schedule Contract with IBM Corp.

Tables of Contents
Release summary
Quick Start Guide
Considerations for GDPR readiness
Notices
IBM Telco Network Cloud Manager - Performance training and education
Product overview
Telco Network Cloud Manager - Performance architecture
Foundation services
Dashboard
Kafka
Pack Service
NiFi
UI
Zookeeper
Data collector services
File Collector
SNMP Collector
SNMP Discovery
Flow Collector
Collection process
Remote Flow Collector
Default normalized flow record fields in Telco Network Cloud Manager - Performance
Normalized sFlow fields
DNS Collector
ICMP Ping Collector
Performance Metric services
Analytics Service
Flow Analytics
Built-in aggregation definitions
Resource Management
Threshold
Data storage services
Data stores in Telco Network Cloud Manager - Performance
Cassandra
DiamondDB
Network File System (NFS)
Postgres
Timeseries
Data storage in time series database
Technology pack content
Designer tool
Deployment modes
Cluster deployment
StatefulSets in Telco Network Cloud Manager - Performance
Sizing and dimensioning
Accessibility
System requirements
Hardware requirements
Software requirements
Storage requirements
Port requirements for a typical installation
Getting started
Types of data in Telco Network Cloud Manager - Performance
Categorizing the network traffic based on IP grouping
Handling network performance data
Categorizing the network based on geographical sites
Installing
Installation scenarios
Installing Telco Network Cloud Manager - Performance on OpenShift Container Platform
Roadmap for installing Telco Network Cloud Manager - Performance on OpenShift Container Platform
Telco Network Cloud Manager - Performance Operator
Planning for Telco Network Cloud Manager - Performance installation
Downloading the installation media
Downloading the Technology Packs media
Licenses and entitlements
Preparing your environment
Installing the prerequisite software
Preparing Red Hat OpenShift cluster
Installing IBM products for integrated installation
1
6
7
9
11
13
13
16
17
17
17
18
18
18
18
18
19
19
20
20
21
21
23
24
24
26
26
27
28
28
29
30
30
32
32
32
33
33
33
34
35
35
36
38
38
39
39
40
40
42
43
46
47
47
48
48
48
49
49
50
52
53
53
53
54
54
54
55
55

Shared persistent storage
Configuring the Ceph storage class
Enabling NTP on your cluster
Configuring your cluster with hostnames
Pre-installation tasks
Creating a custom namespace
Creating the entitlement API key and secret
Creating the IBM Operator catalog source
Installing software
Installing the Telco Network Cloud Manager - Performance Operator
(Optional) Installing Telco Network Cloud Manager - Performance offline
Preparing a server for local Docker registry
Preparing a bastion host
Setting up Rook Ceph Operator in a network restricted (airgap) environment
Mirroring images on the bastion host
Creating a route
Installing Technology Packs
Setting up LDAP authentication
Creating an LDAP user
Authenticating with Microsoft Active Directory users
Setting up Apache NiFi
Enriching the Network and Region IDs for Wireless Technology Packs
Enabling the processor groups from NiFi UI
Moving the data files from EMS to Apache NiFi
NiFi housekeeping
Setting up integration with Jazz for Service Management
Setting up Jazz for Service Management for integration
Configuring single sign-on on the Jazz for Service Management server
Stopping Jazz for Service Management application servers
Starting Jazz for Service Management application servers
Setting up integration with Watson AIOps Event Manager
Postinstallation tasks
Supporting shared namespaces
Accessing Telco Network Cloud Manager - Performance dashboards
Logging in to the Dashboard Application Services Hub portal
Installation directory structure
Generating the audit report
Optional: Publishing Telco Network Cloud Manager - Performance Dashboards menus
Uninstalling
Uninstalling Technology Packs
Uninstalling Telco Network Cloud Manager - Performance Operator
Installing Telco Network Cloud Manager - Performance on Kubernetes environment
Roadmap for installing Telco Network Cloud Manager - Performance on Kubernetes
Planning for Telco Network Cloud Manager - Performance installation
Downloading the installation media
Downloading the Technology Packs media
Preparing your environment
Installing the prerequisite software
Preparing Kubernetes (K8s) cluster
Installing IBM products for integrated installation
Shared persistent storage
Configuring the Ceph storage class
Enabling NTP on your cluster
Configuring your cluster with hostnames
Running the prerequisite script
Installing software
Installing Telco Network Cloud Manager - Performance
(Optional) Installing Telco Network Cloud Manager - Performance offline
Installing on offline servers from a Linux system
Installing Technology Packs
Setting up LDAP authentication
Creating an LDAP user
Authenticating with Microsoft Active Directory users
Setting up Apache NiFi
Enriching the Network and Region IDs for Wireless Technology Packs
Enabling the processor groups from NiFi UI
Moving the data files from EMS to Apache NiFi
NiFi housekeeping
Setting up integration with Jazz for Service Management
Setting up Jazz for Service Management for integration
Configuring single sign-on on the Jazz for Service Management server
Stopping Jazz for Service Management application servers
Starting Jazz for Service Management application servers
56
56
57
58
58
58
59
59
61
61
66
66
67
68
73
74
74
79
79
82
84
84
86
87
89
89
89
91
92
92
93
93
93
94
94
94
97
97
98
98
99
101
101
103
103
105
105
106
106
108
108
108
109
110
110
111
112
116
116
118
123
123
126
128
128
130
130
132
132
133
134
135
135

Setting up Telco Network Cloud Manager - Performance for integration
Setting up integration with Tivoli Netcool/OMNIbus
Postinstallation tasks
Supporting shared namespaces
Accessing Telco Network Cloud Manager - Performance dashboards
Logging in to the Dashboard Application Services Hub portal
Installation directory structure
Viewing Telco Network Cloud Manager - Performance Pods on Kubernetes Dashboard
Generating the audit report
Optional: Publishing Telco Network Cloud Manager - Performance Dashboards menus
Uninstalling
Uninstalling Technology Packs
Uninstalling Telco Network Cloud Manager - Performance
Configuring
Configuring Telco Network Cloud Manager - Performance system environment
Accessing system configuration pages
Generic functions
Managing Alarm rules
Kafka topic format with exported threshold violations
Managing batch jobs for metrics
Configuring an N-point peak value
Configuring a percentile value
Mapping the dashboards and analytics
Managing streams for metrics
Managing thresholds
Enrich properties in a threshold definition
Managing the data anomaly configurations
Configuring metric anomaly detection
Managing Autonomous systems
Managing domain names
Managing Flow aggregations
Managing Flow interfaces
Managing Flow IP Grouping
Managing NBAR
Managing flow data retention profiles
Managing Type of Service
Managing Audit trail
Managing automation scripts
Managing automation jobs
Managing time schedules
Managing Busy hours
Managing User-defined calculations (UDC)
Managing ICMP Ping profiles
Managing Resource types
Managing Resource grouping
Resource grouping
Managing site grouping
Managing SNMP Discovery profiles
Managing files with hostnames for SNMP discovery
Managing SNMP credentials
Managing SD-WAN controller profile
Data availability and reporting
Monitoring data ingestion health for performance data coverage
Monitoring data ingestion health for priority metric group coverage
TNCP application health monitoring
Configuring integration with Watson AIOps Event Manager
Creating a launch-in-context tool
Configuring launch-in-context menu
Additional configuration settings
Enabling geo-redundancy
Mapping the device IP address to the exporter IP address for flow data
Binding a remote context to a resource type instance
Setting up domain support from Config Map
Creating domain-specific groups and non-admin users
Creating domain-specific non-admin users
Creating and granting roles in Dashboard Application Services Hub
Creating and using domain-specific LDAP users
Creating the domain-specific users in Dashboard Designer
Multitenancy support
Enabling multitenancy
Setting up multitenancy from Config Map
Creating tenant-specific non-admin users
Creating and granting roles in Dashboard Application Services Hub
Creating tenant-specific groups and non-admin users
Creating and using tenant-specific LDAP users
136
137
137
138
138
139
139
142
142
142
143
143
144
145
145
146
148
148
151
152
156
156
158
159
161
165
168
170
173
174
175
176
177
177
178
179
180
181
182
183
185
187
190
192
194
195
196
197
199
200
201
202
202
205
206
208
209
209
210
210
212
212
213
214
215
215
216
217
218
218
220
220
215
221
222

Creating the tenant users in Dashboard Designer
Adding the nonadmin group to dashboards in Dashboard Designer
Enriching the tenant property for resource type instances in bulk
Enriching the resource type instances with tenants from the Resource Management page
Configuring retention period for timeseries data
Configuring logging
Configuring the retention period for batch job history
Configuring the retention period for audit trail history data
Supporting multibyte (non-ASCII) characters in Telco Network Cloud Manager - Performance Dashboards
Configuring time zone support for Batch Analytics
Updating the manager value in annotations section of YAML file
Configuring Technology Packs
Running the Huawei U2000 Adaptor script
Configuring the Cisco EPNM Technology Pack
Configuring the Nokia Altiplano Technology Pack
Configuring the Nokia NSP Technology Pack
Installing the Nokia NSP Technology Pack
Apache NiFi setup for Nokia NSP Technology Pack
Glossary
Configuring Fortinet SD-WAN Technology Pack
Setting up Apache NiFi for Fortinet SD-WAN Technology Pack
Configuring the Cisco SD-WAN Technology Pack
Installing the Cisco SD-WAN Technology Pack
Apache NiFi setup for Cisco SD-WAN Technology Pack
Cisco SD-WAN vManage Rest API definitions
Known issue with interface speed in Cisco Edge devices
Configuring the Cloud Monitoring Technology Packs
Deploying Telegraf plug-in to monitor cloud and virtualization clusters
Setting up Apache NiFi
Remote monitoring
Setting up Remote Flow Collector
Setting up Remote SNMP discovery and collection
Setting up Remote ICMP Ping Collector
Upgrading
Upgrading to 1.4.5
Upgrading the Threshold Service
Setting the dual query parameters for the old data
Administering
User administration
Default users
User and group management from Dashboard Application Services Hub
Creating a user to access dashboards from Dashboard Application Services Hub
Creating users to access the visualizations in Kubernetes
Creating users to access the visualizations in OpenShift Container Platform
User administration from Designer tool
Creating a user to access Telco Network Cloud Manager - Performance Dashboards
Tool Content Groups and Engine User Groups
Managing Tool Content Groups and Engine User Groups
Designer tool Users
Adding users
Importing users in bulk
Managing users
Encrypting passwords
Controlling the Telco Network Cloud Manager - Performance services
Database administration
Cleaning and maintaining the inventory database
NFS data back up and restore
NFS data backup
NFS data restore
Scaling the Timeseries Service to handle large data
Report scheduler configurations
Configuring the scheduler email
High availability
Set up Kafka high availability
Setting up horizontal auto scaling of Pods
Network device discovery
SNMP discovery process
Resource discovery
Discovery-related files and folders
Troubleshooting discovery
File-based discovery process
Scheduling the discovery
Performance data collection models
223
224
224
225
225
227
228
229
229
230
230
231
231
232
233
234
237
238
241
242
242
244
246
246
248
264
264
265
268
268
269
270
273
275
275
279
279
280
280
280
281
282
282
283
284
284
285
285
286
286
288
289
290
290
291
291
293
294
294
295
296
296
297
297
298
299
300
300
301
302
302
304
304

Polling the network
Enabling and disabling formulas
Troubleshooting network polling
File-based data collection model
Configuring the metric collection
Creating and managing Technology Packs
Accessing the Pack service UI
Workflow to create a Technology Pack
Create new pack
Create lookup data
Edit a Technology Pack content
Import and export Technology Pack content
Deploy the Technology Pack
Installing Technology Packs
Uninstalling Technology Packs
Pack rule models
NiFi record path expression
REST APIs
Troubleshooting
Issue with importing or deleting large Technology Packs
Rapid device onboarding
Technology Pack Development Tool
Installing the tool
Preparing your environment
Creating a Technology Pack project
Validating the MIB files
Creating an SNMP-based Technology Pack content
Creating discovery formulas
Running the discovery
Interactive discovery tool
Creating collection formulas
Running the collection formulas
Creating a File-based Technology Pack content
Creating discovery formulas for a file-based technology pack
Running the discovery for file-based Technology Packs
Creating collection formulas
Running the file collection formulas
Creating the inventory model files
Creating metrics
Validating the pack content
Packaging the Technology Pack bundle
Deploying the custom Technology Pack
Command line interface
Troubleshooting Technology Pack Development Tool
FAQs
Integrating
Integrating with Watson AIOps Metric Manager
IBM Operations Analytics - Predictive Insights integration flow
Summary of integration tasks
Prerequisites
Software requirements and dependencies
Quick reference to Watson AIOps Metric Manager installation
Quick reference to Watson AIOps Metric Manager configuration
Setting up integration with Watson AIOps Metric Manager
Setting up external Kafka broker
Configuring integration with external Kafka and Predictive Insights
Encrypting passwords
Troubleshooting
Supported output formats
Monitoring networks
Telco Network Cloud Manager - Performance Dashboards
Getting started with Telco Network Cloud Manager - Performance Dashboards
Dashboards and technology pack dependencies
Logging in to the reporting interface
Accessing the Telco Network Cloud Manager - Performance Dashboards
Generic functions of Telco Network Cloud Manager - Performance Dashboards
Group and Time period filter conditions
Interface traffic monitoring
Cloud monitoring dashboards
Cluster summary
Node summary
Node details
Pod summary
Pod details
305
305
306
307
307
308
309
310
311
315
316
316
317
318
322
322
324
326
330
331
332
332
334
334
334
336
336
337
338
339
340
340
341
341
342
340
343
344
344
345
346
347
347
348
348
350
350
350
351
351
351
352
352
353
354
354
354
355
355
356
356
357
357
359
359
361
364
365
366
366
368
369
370
371

Container summary
Container details
TNC-P monitoring dashboards
TNC-P overview
TNC-P Node details
TNC-P Pod details
TNC-P PersistentVolumeClaim details
ICMP Ping dashboards
Ping overview
Device overview
Device ping details
Interface ping details
Performance alarm overview
Metric viewer dashboard
Mobile Access and Core dashboards
Circuit switch access dashboards
Packet switch access dashboards
Circuit switch core dashboards
IP links performance overview
Source and destination details
GPON Optical Line Terminal (OLT) dashboards
GPON OLT overview
System health details
Traffic monitoring (Uplink Interface) details
Traffic monitoring (PON Port) details
Optical monitoring details
Load balancer dashboards
Load balancer overview
GTM details
LTM details
Pool details
Pool member details
Virtual server details
WiFi overview dashboard
WiFi Client Count
WiFi Interference and Noise Performance
Netflow dashboards
Applications response overview dashboard
Applications response time dashboard
Applications dashboards
Autonomous Systems dashboards
Conversations dashboards
IP Address Grouping dashboards
Destinations dashboards
Protocols dashboards
QoS Queue dashboards
Sources dashboards
ToS dashboards
Network traffic overview dashboard
SD-WAN dashboards
SD-WAN health overview
Interface details
WAN link details
Tunnel QoE
Application per tunnel details
Application performance
Device health
Viewing specific threshold violations from Event Viewer
Launching the Metric Threshold Violation dashboard
Metric Threshold Violation dashboard
Metric viewer dashboard
Managing and using Designer tool
Accessing the Dashboard Designer
Getting started with the Dashboard Designer
Quick reference to creating dashboards
Managing the Dashboard Designer
Layouts
Creating a custom layout
Managing layouts
Charts
Chart types
Widgets
Setting data definitions by using custom data definitions
372
373
374
375
376
377
378
379
380
380
382
382
383
384
386
387
389
393
396
397
397
398
400
400
401
402
403
404
405
407
408
409
410
411
413
414
414
415
416
417
418
419
420
423
424
426
426
427
427
428
429
429
430
431
431
432
432
433
433
434
384
437
437
438
438
439
440
440
441
442
443
444
445

Creating custom widgets
Setting widget properties for all the chart types
Setting chart properties
Setting properties for Badge charts
Setting title properties
Setting value properties
Setting color properties for Badge charts
Setting chart properties for Bar, Area, and Line charts
Setting X-axis and Y-axis properties
Setting plot properties
Setting series properties
Setting legend properties
Setting chart color properties
Setting properties for Baseline chart
Setting chart properties for Bullet charts
Setting chart properties for Circos charts
Setting properties for Complex Gauge chart
Setting value ranges and colors
Setting chart properties for Gauge charts
Setting value ranges and colors
Setting properties for Grid charts
Setting column properties
Setting other properties
Setting table or column width in a Grid chart
Setting chart properties for Heatmap charts
Setting chart properties for Pie, Donut, or Gauge charts
Setting chart properties
Setting series properties
Setting chart properties for Quadrant Motion charts
Setting X-axis and Y-axis properties for Quadrant Motion chart
Setting color properties for Quadrant Motion charts
Setting properties for Radar chart
Setting X-axis and Y-axis properties
Setting chart properties for Range Column charts
Setting chart properties for Sankey charts
Setting properties for Scatter and Bubble charts
Setting properties for Tag Cloud chart
Setting properties for Topology chart
Setting properties for Tree chart
Setting properties for Treemap chart
Setting chart properties for Venn charts
Setting properties for Map chart
Saving custom widgets as templates
Specialized widgets
Creating custom widgets to list all instances
Creating a web widget
Creating a multi-chart widget
Managing custom widgets, custom templates, or specialized widgets
Publishing custom widgets
Testing database connection with Connector Source
Data Definitions
Creating a custom data definition
Managing custom data definitions
Filters
Creating a conditional or dependent filter
Creating a direct or independent filter
Managing filters
Dashboards
Creating a dashboard
Setting relations
Creating a master-listener relation
Creating a drill-down relation
Mapping metrics data
Creating a drill-down URL relation
Managing dashboards
Exporting and importing dashboards
Predefined dashboard components
Creating custom dashboards with the predefined components
Publishing a predefined widget
Scenarios
Themes
Creating and deploying a theme
447
449
450
450
450
450
451
451
451
452
453
454
454
454
455
455
456
456
456
456
457
457
458
458
458
459
459
459
460
460
460
461
461
462
462
462
463
463
464
465
466
466
468
469
470
471
472
473
475
475
476
476
477
478
479
480
481
481
482
484
485
486
487
488
489
491
494
499
500
501
506
507

Managing custom themes
Menu Access
Adding new menu item to Home menu
Managing menus
Managing Engine user interface
Viewing dashboards and widgets
Report scheduling
Scheduling tasks
Managing scheduled tasks
Scenarios and use cases
Monitoring the Busy hours based on UDCs
Monitoring the Busy hours based on metrics from child Resource level that are rolled up to Parent level
Troubleshooting and support
Troubleshooting a problem
Log files in Telco Network Cloud Manager - Performance
Known problems and solutions
Technology Pack installation might fail after an upgrade
Troubleshooting installation, upgrade, and setup
Custom time period setting must match with the aggregated data retention value
Resource types and Resource groups are not loaded in the dashboard filter bar
Metrics from the selected Resource groups are not loaded in some Analytics configuration pages
Set the polling interval to filter the Resource types from Condition editor
Use UDCs instead of metrics in a batch job or stream creation
Retaining the metrics from Batch Analytics with weekly and monthly schedules
Not able to accept the certificate on Chrome browser on Mac
Managing resources for Cassandra and Inventory nodes
Common issues in Telco Network Cloud Manager - Performance services
Error in writing the Flow raw data to the database
When the device filter is changed from a drill-down Flow dashboard, Resource ID mapping is incorrect
Changing the mandatory path setting
Delay in ICMP Ping collection for newly discovered devices
Duplicate ICMP Ping metrics
Troubleshooting Telco Network Cloud Manager - Performance Dashboards
Common issues in Dashboards
Common issues in translated pages
Kubernetes dashboard UI fails to start
Reference
REST API definitions
Metric APIs
anomalies
lastValue
metrics
entity
resources
resourceTypes
summary
timeseries
Flow APIs
aggregation
qossummary
summary
timeseries
REST APIs for Resource Management
inventory resources
inventory descendants
inventory relations
inventory create
inventory tenants
REST APIs to configure the Telco Network Cloud Manager - Performance system
Dashboard reference
Properties of the summary-level dashboards
Properties of the Interface traffic monitoring dashboard
Properties of the IP links performance overview dashboards
Properties of the GPON Optical Line Terminal (OLT) dashboards
Properties of the ICMP Ping dashboards
Properties of the Load balancer dashboards
Properties of the Mobile Circuit switch access dashboard
Properties of the Mobile Circuit switch core dashboard
Properties of the Mobile Packet switch access dashboard
Properties of the WiFi overview dashboard
Properties of the WiFi client count dashboard
Properties of WiFi interference and noise performance dashboard
508
508
508
509
510
512
515
515
517
518
519
523
526
526
527
529
529
530
530
531
531
532
532
532
533
533
534
534
534
534
535
535
536
536
537
538
538
538
539
539
541
543
545
547
548
549
553
557
557
560
562
566
569
569
570
571
572
573
574
596
597
597
597
598
601
602
605
606
608
610
611
611

Properties of the NetFlow dashboards
Properties of the Network traffic overview dashboard
Properties of the Applications response overview dashboard
Properties of the Cisco SD-WAN dashboards
Formula language developer's reference
Language basics
SNMP formula language
Network device discovery
Writing custom discovery formulas
Discovery formula structure
Creating discovery formulas
Writing custom collection formulas
Collection formula structure
Operators
Common functions
Writing custom metrics
Metric structure
File-based formula language
UDC expressions and functions reference
General expressions
Operators
Arithmetic operators
Logic Operators
Functions
Elements
Math functions
abs
ceil
exp
floor
log
round
sqr
sqrt
trunc
Special aggregation functions
Logic functions
InGroup
isNull
nullValue
decode
Conditional Operator (?)
Null functions
Conversion functions
Traffic functions
percentFail
percentOk
thresholdDiv
Erlang based functions
circ
crit
gos
gose
TC4
toff
Aggregation types
Metrics
Complex metrics
Computation for complex metrics
After time aggregation and after entity aggregation
After time aggregation
Before time aggregation
Aggregation properties
Configuring Flow devices
Supported devices and flow formats
Configuring NetFlow on Cisco routers
Cisco IOS command modes
Command modes
Configuring Flexible NetFlow and Application Visibility and Control (AVC)
Configuring standard Flow fields
Configuring Quality of Service (QoS) on Cisco devices
Configuring Application Response Time (ART) on Cisco devices
Enabling NetFlow on your devices
611
612
612
613
614
615
615
616
616
616
619
626
627
627
628
632
632
633
633
633
635
635
636
636
637
637
637
637
638
638
638
638
639
639
639
639
640
640
640
641
641
641
642
642
642
643
643
643
643
644
644
645
645
645
645
645
646
646
647
647
647
648
648
648
649
649
649
650
650
650
651
653
653

Configuring the Flow Exporters
Customizing the number of entries in flow cache
Monitoring NetFlow information
An example Cisco device configuration
Configuring flow on Juniper devices
Configuring J-Flow versions 5 and 8
Configuring J-Flow version 9
Configuring the sampling instance
Configuring J-Flow version 9 for SRX-DataCenter devices
Using the show commands
Verifying the configuration with show commands
Viewing device configuration
Configuring NetStream traffic on Huawei devices
Configuring NetStream export
654
654
654
655
655
656
656
657
658
658
660
661
661
661

Release summary
Release summary for IBM® Telco Network Cloud Manager - Performance, version 1.4.5.
Contents
Description
What's new in IBM Telco Network Cloud Manager - Performance, version 1.4.5
Value propositions
Features of Telco Network Cloud Manager - Performance
Supported network technology and devices
System requirements
Media content
Installing Telco Network Cloud Manager - Performance
Known issues
Technical information PDF library
Support
Description
IBM Telco Network Cloud Manager - Performance, version 1.4.5 is a comprehensive network Analytics and Performance Management Suite. At its core, Telco Network
Cloud Manager - Performance is a network monitoring tool that detects the dips or anomalies in network performance and accelerates better user experience.
Telco Network Cloud Manager - Performance constantly checks network devices and traffic and provides an overview of network performance status to communication
service providers (CSPs) and media service providers (MSPs). It can monitor and provide tiered and timely alerts on fixed (wireline), mobile (wireless) devices, and cloud
or virtualized network anomalies all in a single pane.
Telco Network Cloud Manager - Performance is a containerized application and can be deployed on IBM Red Hat® OpenShift® and on Kubernetes K8s platform.
Table 1. Release update
Version Type of release Availability
1.4.5
Telco Network Cloud Manager - Performance core is available in the OpenShift Container Platform catalog.
Telco Network Cloud Manager - Performance Base for Kubernetes can be downloaded from IBM Passport Advantage.
Telco Network Cloud Manager - Performance Advanced Package for both OpenShift Container Platform and Kubernetes can
be downloaded from IBM Passport Advantage®.
Technology Packs can be downloaded from IBM Passport Advantage.
February 2024
CAUTION:
Before you attempt an installation of Telco Network Cloud Manager - Performance, you’re advised to read these release notes. Failure to read these Release Notes® might
result in a corrupted, incomplete, or failed installation.
What's new in IBM Telco Network Cloud Manager - Performance, version 1.4.5
Fixes, new features, capabilities, and enhancements in V 1.4.5.
New and updated System Configuration pages
The following new and updated System Configuration pages are available:
Managing thresholds
Managing the data anomaly configurations
Managing automation scripts
Managing automation jobs
Discovery profiles
Discovery host files
Data availability reports
TNCP Application health reports
Enhancements to Threshold definitions
More than one threshold evaluation profile can be supported for the same metric and Resource scope. It helps in addressing the requirements of users in different
domains. You can create a threshold profile with the following features:
Create a threshold profile with one metric, all, or a group of resources, and one Time schedule.
Support for multiple evaluation criteria with multiple Time schedules for the same threshold profile.
Support for multiple profiles creation for the same metric and resource combination and for different domains. The domain is represented as a Tag and the
Tag name must be unique.
Support for mixed operators in the Alarm predicate. For example, you can assign >= for a critical threshold and <= for a major threshold in the same Alarm
predicate.
IBM Telco Network Cloud Manager - Performance 1.4.5 1

Support to enrich the properties that are associated with a Resource type in the threshold definition. The enriched properties are appended to the
entityExtendedProperties and the Extended section in the Event log messages.
For more information, see:
Managing thresholds
Enrich properties in a threshold definition
Data anomaly configuration page
The Data anomaly page is used to configure the metric data anomalies that are based on specific baseline time periods. When the anomalies are detected, alarms
are sent to the Event Viewer. The anomaly configurations are flexible.
For more information, see Managing the data anomaly configurations.
NiFi ingestion health monitoring pages
For more information, see Data availability reports
TNCP Application health pages
For more information, see TNCP application health monitoring.
High availability
Multiple Kafka and Zookeeper
To maintain high availability of Kafka nodes, you need to make sure that the high availability of Zookeeper is also maintained.
For more information, see of Kafka and Zookeeper
Auto scaling Inventory and Timeseries Pods
To automatically scale the Telco Network Cloud Manager - Performance Pods to match the demand see Setting up horizontal auto scaling of Pods.
New and updated Technology Packs
No new Technology Packs are added in this release. Some Technology Pack versions are upgraded. For more information, see Table 4.
Architectural changes
Sleeping Cell Service is introduced. Currently, the Sleeping cell Service hosts the Anomaly detection UI. Any other UIs that are related to configuring the python
scripts can be added in this service in future.
Auto scaling feature uses the OpenTelemetry.
Upgrade path
Upgrade is supported from Telco Network Cloud Manager - Performance V 1.4.4 to 1.4.5. For more information, see Upgrading.
Supported installations
Installation is supported on both OpenShift Container Platform and Kubernetes cloud platforms. See Install Telco Network Cloud Manager - Performance.
Value propositions
IBM Telco Network Cloud Manager - Performance, version 1.4.5 offers the following unique value to service providers:
Rationalize the number of tools that they use for monitoring network performance.
Effectively monitors and analyzes network traffic of all formats that include the NetFlow and sFlow.
Optimize their network and service management processes for consistent network quality levels and customer experience.
Low cost of deployment and operation.
Manage complex modern network infrastructure in real time.
A web-based network performance monitoring for remote access.
As a multi-vendor solution that is part of a broader integrated AI Ops Management suite, it can provide broad visibility across operations and business functions of
consistent performance management data.
In a nutshell, Telco Network Cloud Manager - Performance provides the following network performance management solutions to service providers:
Monitor network devices at a high scale.
Monitor hybrid network domains - fixed, mobile, and cloud.
Monitor across physical and virtual network interfaces.
Identify, isolate, and troubleshoot performance bottlenecks and issues.
Features of Telco Network Cloud Manager - Performance
The following are the distinctive features and functions in Telco Network Cloud Manager - Performance version 1.4.5:
Highly scalable and simple deployment
Telco Network Cloud Manager - Performance is deployed as a cloud-native application, its deployment is simple and fast.
Telco Network Cloud Manager - Performance is built on highly scalable microservices architecture on cloud.
Open and flexible integrations
It supports open access to data and integration with multiple data sources with Rapid Device Onboarding (RDO) Toolkit.
Accomplishing accurate onboarding of devices in a dynamic network infrastructure is critical to any enterprise. Rapid Device Onboarding feature in Telco Network
Cloud Manager - Performance can discover new or replaced devices that get connected. It can bring new devices such as routers, switches, and servers into a
network environment seamlessly.
Streaming and batch analytics
It provides real-time monitoring capability with low latency. It supports user-configurable dual processing pipelines, extract-transform-load (ETL), and extract-
load-transform (ELT).
Unified monitoring across layers and domains
As a converged network performance monitoring system, it monitors across multiple layer and domains. It can screen critical health status of both wireline devices,
wireless devices, line-of-business applications, and network traffic all in a single system. It supports OSSii performance management integrations.
Flexible NetFlow, sFlow, and Cisco Application Visibility and Control (AVC)
2 IBM Telco Network Cloud Manager - Performance 1.4.5

Network-Based Application Recognition (NBAR)
Next Generation Network-Based Application Recognition (NBAR2) and
Application Response Time (ART)
QoS to collect the Queue Drops to report the number of drops in the queue.
Type of Service to determine the packet delivery prioritization for low-delay, high-throughput, highly reliable service, or normal service for NetFlow traffic. On
all Flow packets, Type of Service byte is represented as Differentiated Service Code Point (DSCP) and Explicit Congestion Notification.
Supports configurable Autonomous systems and IP Grouping for enterprise network management with the help of new aggregation views.
Provides flexible retention periods for raw and aggregated data.
Provides DNS lookup for inventory data.
Performance reporting
Telco Network Cloud Manager - Performance has easy to read built-in visualizations on common performance metrics.
Actionable insights and trends visibility on domain to device level
A library of ready-to-use Technology Packs that encompass device and file-based EMS integrations for wireline and wireless domains. It delivers performance
information of all devices that are connected to a network. Features like data collection and resource discovery ensure that all the devices in your network are
working correctly.
Self-service dashboards
A wide range of visualizations and reporting as domain-specific dashboards are provided in Telco Network Cloud Manager - Performance. These dashboards
provide analytical, diagnostic, and mitigation capabilities on common network performance metrics. You can customize the visibility of your own significant metrics.
Predefined dashboard components
Telco Network Cloud Manager - Performance has a library of predefined or custom widgets and dashboards that are readily available in the Dashboard Designer
tool. You can add these widgets to a dashboard layout, previewed, and published immediately. These widgets come with readily available data definitions and filters
and there by saving much time and provide a high level of flexibility.
For more information, see built-in dashboard components.
Supported network technology and devices
Functions that are supported by Telco Network Cloud Manager - Performance.
Table 2. Supported Telco Network Cloud Manager - Performance functions
Functions Value
IP SLA Cisco
Huawei
Juniper
MIB - II RFC1213 (MIB-II)
Class-Based QoS Cisco
Huawei
Juniper
Supported internet protocols IPv4
IPv6
Load Balancer F5 Big IP
Transmission Ciena
Cisco Wireless Controllers Cisco 2504 Wireless Controller
Cisco 3504 Wireless Controller
Cisco 5520 Wireless Controller
Cisco 5760 Wireless LAN Controller
Cisco 8540 Wireless Controller
Cisco Catalyst 3850 24-P Switch
SD-WAN supported Cisco devices Cisco vEdge
Cloud Services Router (CSR) 1000 V
1000 Series-Integrated Services Routers (ISRs)
4000 Series ISRs, and with platforms Network Functions Virtualization (NFV) by using Cisco SD-Branch
solutions such as
Cisco 5000 Series Enterprise Network Compute System (ENCS)
Cisco UCS® E-Series
SD-WAN supported Fortinet devices https://www.fortinet.com/products/sd-wan
See Models and Specifications section.
Wireless technologies
GSM
UMTS
LTE
5G NR
Huawei
Fixed IP Huawei SNMP devices
Cisco SNMP devices
Juniper M/T series
Juniper ERX
Huawei U2000
ACME Packet Net-Net 9200 HDR
IBM Telco Network Cloud Manager - Performance 1.4.5 3

Functions Value
Fixed Access Huawei SNMP GPON
Nokia 5529 SDC
Nokia Altiplano
IP Core Nokia NSP
Infoblox DNS
Cisco EPNM
Metro Ethernet Accedian
ADVA
Supported flow formats Cisco NetFlow (V1, V5, and V9) and Flexible NetFlow
Juniper J-Flow (V5 and V9)
Huawei NetStream (V5 and V9)
Alcatel CFlow (V9)
IPFIX
sFlow v5
Supported flow transport protocols UDP
SCP
Note: Configure your SELinux to support the SCTP protocol.
Application Visibility and Control (AVC) supported Cisco
devices.
Cisco Aggregation Services Routers (ASR) 1000 Series, Cisco ISR 4000 Series
Cisco Cloud Services Router (CSR) 1000 V, Cisco-Integrated Service Routers Generation 2 (ISR G2)
System requirements
For more information about system requirements for the IBM Telco Network Cloud Manager - Performance, version 1.4.5, see the Requirements section.
http://www-969.ibm.com/software/reports/compatibility/clarity/index.html
Media content
Table 3. Telco Network Cloud Manager - Performance 1.4.5 contains the following media packages
Components File name Part no.
IBM Telco Network Cloud Manager - Performance V 1.4.5 English Core eAssembly G0BCQEN
IBM Telco Network Cloud Manager - Performance V 1.4.5 English Base for Kubernetes
Note: Download the package from IBM Fix Central by using the file name.
M0H7HEN.tar.gz M0H7HEN
IBM Telco Network Cloud Manager - Performance V1.4.5 English Advanced eAssembly G0BCREN
IBM Telco Network Cloud Manager - Performance V 1.4.5 English Multiplatform Advanced M0H7JEN.tar.gz M0H7JEN
IBM Telco Network Cloud Manager - Performance V 1.4.5 Multilingual Multiplatform Quick Start Guide M0H7KML.tar.gz M0H7KML
Download the Technology Packs media packages from IBM Passport Advantage portal. Telco Network Cloud Manager - Performance consists of the following Technology
Pack bundles:
Table 4. Part numbers for Technology Packs
Bundle Component File name Bundle part number
IBM Telco Network Cloud Manager - Performance V1.4.5 Technology Packs eAssembly G0BCSML
Dependent Tech Packs Bundle
M0H7LML.tar.gz
Network Wireless v1.4.0 network-wireless-1.4.0.jar M0H7LML
Neutral Access Gom v1.8.0 neutral-access-gom-1.8.0.jar
Network Health v1.20.5 network-health-1.20.5.jar
Network Health Generic v1.7.0 network-health-generic-1.7.0.jar
Network Health (extension) v1.7.1 network-health-extension-1.7.1.jar
SDWAN GOM v1.5.0 sdwan-gom-1.5.0.jar
Network Health Tech Packs Bundle
M06VMML.tar.gz
Network Health for Cisco Devices v1.5.0 network-health-cisco-1.5.0.jar M06VMML
Network Health for Huawei Devices v1.4.0 network-health-huawei-1.4.0.jar
Network Health for Juniper Devices v1.4.0 network-health-juniper-1.4.0.jar
Network Probe Tech Packs Bundle
M0BP5ML.tar.gz
Network Probe for Cisco IPSLA v1.6.0 network-probe-cisco-1.6.0.jar M0BP5ML
Network Probe for Huawei NQA v1.8.0 network-probe-huawei-1.8.0.jar
Network Probe for Juniper RPM v1.9.1 network-probe-juniper-1.9.1.jar
Network QoS Tech Packs Bundle
M0BPRML.tar.gz
Network QoS for Cisco CBQoS v1.5.0 network-qos-cisco-1.5.0.jar M0BPRML
Network QoS for Huawei CBQoS v1.5.0 network-qos-huawei-1.5.0.jar
Network QoS for Juniper CoS v1.4.0 network-qos-juniper-1.4.0.jar
Metro Ethernet Tech Packs Bundle
M0BPSML.tar.gz
Network Ethernet Adva Optical v1.2.0 network-ethernet-adva-1.2.0.jar M0BPSML
Network Ethernet Accedian v1.1.0 network-ethernet-accedian-1.1.0.jar
Network Cisco IP SLA Ethernet v1.0.0 network-cisco-ip-sla-ethernet-1.0.0.jar
IP Core Tech Packs Bundle
M0BP6ML.tar.gz
Nokia NSP v1.4.4 nokia-nsp-1.4.4.jar M0BP6ML
Infoblox DNS v1.0.0 network-infoblox-dns-1.0.0.jar
Cisco EPNM v1.0.0 ciscoepnmxml-ciscoepnm-1.0.0.jar
SD-WAN Tech Packs Bundle
M0BP7ML.tar.gz
Cisco SD-WAN v1.4.0 cisco-sdwan-1.4.0.jar M0BP7ML
Fortinet SD-WAN v1.0.1 fortinet-sdwan-1.0.1.jar
MPLS Tech Packs Bundle
M05KRML.tar.gz
Network Cisco MPLS v1.1.0 network-cisco-mpls-1.1.0.jar M05KRML
Network Juniper MPLS v1.2.0 network-juniper-mpls-1.2.0.jar
4 IBM Telco Network Cloud Manager - Performance 1.4.5

Bundle Component File name Bundle part number
Network Huawei MPLS TE v1.0.0 network-huawei-mpls-te-1.0.0.jar
Network Generic MPLS LSP v1.1.0 network-mpls-lsp-1.1.0.jar
Network Juniper MPLS RSVP Tunnel v1.0.0 network-juniper-rsvp-tunnel-1.0.0.jar
WiFi Tech Packs Bundle
M0BPTML.tar.gz
WiFi Health for Cisco Controllers v1.7.0 wifi-health-cisco-1.7.0.jar M0BPTML
Load Balancer Tech Packs Bundle
M0BPVML.tar.gz
Load Balancer for F5 BIG-IP v1.7.0 load-balancer-f5BigIp-1.7.0.jar M0BPVML
Fixed Access Tech Packs Bundle
M0BP8ML.tar.gz
Network Access GPON for Huawei OLTs v1.5.0 network-access-huawei-1.5.0.jar M0BP8ML
ACME Packet Net-Net 9200 HDR-SBC v1.1.0 network-health-acmepacket-sbc-hdr-1.1.0.jar
Nokia Altiplano v1.0.0 nokiaaltiplanojson-nokiaaltiplanoaccess-1.0.0.jar
Huawei iManager U2000 V200R016C60 v1.3.1 network-u2000-huawei-1.3.1.jar
Network Access Nokia v1.4.0 network-access-nokia-1.4.0.jar
ACME Packet Net-Net 9200 HDR v1.3.0 network-health-acmepacket-1.3.0.jar
Transmission Tech Packs Bundle
M0BP9ML.tar.gz
Ciena Transmission v1.3.0 network-transmission-ciena-1.3.0.jar M0BP9ML
Network Flow Tech Packs Bundle
M06VSML.tar.gz
Network Flow v1.3.0 network-flow-1.3.0.jar M06VSML
Wireless 5G Tech Packs Bundle
M0BPBML.tar.gz
NR Huawei NUTRAN V100R015C10 v1.5.0 nr-huawei-nutran-v100r015c10-1.5.0.jar M0BPBML
Wireless 4G Tech Packs Bundle
M0BPCML.tar.gz
LTE Huawei EUTRAN V100R015C10 v1.6.0 lte-huawei-eutran-v100r015c10-1.6.0.jar M0BPCML
LTE ZTE EUTRAN IR14 v1.0.0 lte-zte-eutran-lr14-1.0.0.jar
LTE Huawei HSS V900R008 v1.1.0 lte-huawei-hss-v900r008-1.1.0.jar
LTE Huawei MME V900R018C10 v1.1.0 lte-huawei-mme-v900r018c10-1.1.0.jar
LTE Huawei PCRF V300R005C00 v1.1.0 lte-huawei-pcrf-v300r005c00-1.1.0.jar
LTE Huawei SGWPGW V900R018C10 v1.2.0 lte-huawei-sgwpgw-v900r018c10-1.2.0.jar
LTE Huawei IMS v1.0.0 lte-huawei-ims-v1-1.0.0.jar
LTE Cisco vEPC v1.0.0 ciscovepccsv-ciscovepc-1.0.0.jar
Wireless 3G Tech Packs Bundle
M0BPDML.tar.gz
UMTS Huawei MSCS V200R011C10 v1.5.0 umts-huawei-mscs-v200r011c10-1.5.0.jar M0BPDML
UMTS Huawei UTRAN V100R015C10SPC156 v1.5.0 umts-huawei-utran-v100r015c10spc156-1.5.0.jar
UMTS ZTE UTRAN UR17 v1.1.0 umts-zte-utran-ur17-1.1.0.jar
UMTS Huawei MGW V200R010C20 v1.2.0 umts-huawei-mgw-v200r010c20-1.2.0.jar
Wireless 2G Tech Packs Bundle
M0BPFML.tar.gz
GSM Huawei BSS V900R021C10SPC600 v1.6.0 gsm-huawei-bss-v900r021c10spc600-1.6.0.jar M0BPFML
GSM Huawei STP V200R005C08 v1.0.0 gsm-huawei-stp-v200r005c08-1.0.0.jar
GSM Tekelec STP R46-1 v1.1.0 gsm-tekelec-stp-r46-1-1.1.0.jar
Cloud Monitoring Tech Packs Bundle
M06VTML.tar.gz
Cloud Kubernetes v1.8.0 cloud-kubernetes-1.8.0.jar M06VTML
Cloud VMWare vSphere v1.1.0 cloud-vmware-vsphere-1.1.0.jar
Supported languages
Telco Network Cloud Manager - Performance documentation is available in the following languages:
English
Brazilian Portuguese
Czech
French
German
Italian
Japanese
Korean
Polish
Spanish
Simplified Chinese
Traditional Chinese
Turkish
Telco Network Cloud Manager - Performance application is available in the following languages:
English
German
French
Brazilian Portuguese
Simplified Chinese
Traditional Chinese
Installing Telco Network Cloud Manager - Performance
For step-by-step installation instructions, see Install Telco Network Cloud Manager - Performance.
Known issues
Provides the list of all current known problems and issues with IBM Telco Network Cloud Manager - Performance, version 1.4.5.
IBM Telco Network Cloud Manager - Performance 1.4.5 5

For a list of known issues and resolutions for IBM Telco Network Cloud Manager - Performance, version 1.4.5, see Known issues Telco Network Cloud Manager -
Performance.
Technical information PDF library
Documentation in PDF format for Telco Network Cloud Manager - Performance can be obtained from the following link:
PDF Documentation.
Support
IBM Electronic Support offers a portfolio of online support tools and resources that provide comprehensive technical information to diagnose and resolve problems and
maintain your IBM products.
IBM has developed many smart online tools and proactive features that can help you prevent problems from occurring in the first place, or quickly and easily troubleshoot
problems when they occur. IBM's improved personalization of support resources helps you focus on and be alerted to exactly the information and resources that are
needed for efficient and effective problem prevention and resolution. For more information, see https://support.podc.sl.edst.ibm.com/support/home/.
Quick Start Guide
This document describes a quick and easy way to install Telco Network Cloud Manager - Performance.
Considerations for GDPR readiness
Notices
IBM Telco Network Cloud Manager - Performance training and education
Use this information to understand IBM Telco Network Cloud Manager - Performance education material and training.
Quick Start Guide
IBM® Telco Network Cloud Manager - Performance
Version 1.4.5
This document describes a quick and easy way to install Telco Network Cloud Manager - Performance.
Note:
Telco Network Cloud Manager - Performance 1.4.5 Licensed Materials - Property of IBM. © Copyright IBM Corp. 2024. US Government Users Restricted Rights - Use,
duplication or disclosure restricted by GSA ADP Schedule Contract with IBM Corp.
IBM, the IBM logo, and ibm.com® are trademarks or registered trademarks of International Business Machines Corp., registered in many jurisdictions worldwide. Other
product and service names might be trademarks of IBM or other companies. A current list of IBM trademarks is available on the web at "Copyright and trademark
information" (www.ibm.com/legal/copytrade.shtml).
About this task
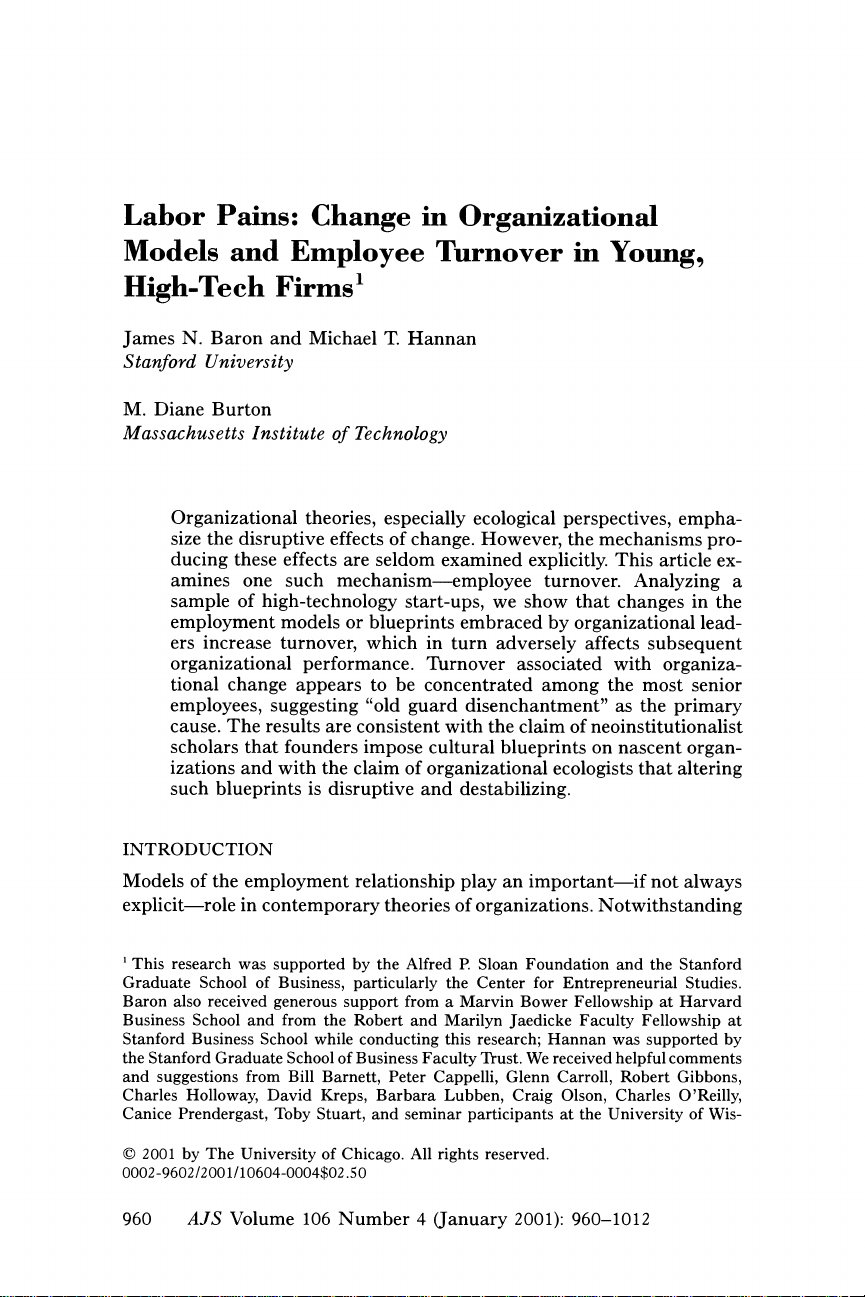
Product overview
IBM Telco Network Cloud Manager - Performance, version 1.4.5 is a cloud-native offering for managing large-scale low latency modern network infrastructure. It is
suitable for service providers like telecommunications companies, network transport, internet service providers (ISP), media, and, entertainment service providers. The
offering helps the service providers to manage both physical, and virtualized network layers, and to manage Virtualized Network Functions (VNF).
Telco Network Cloud Manager - Performance provides an extensive library of commercial off-the-shelf (COTS) network interfaces that are called Technology Packs. The
architecture of these Technology Packs can be SNMP type, Flow, or File-based type that requires Apache NiFi.
6 IBM Telco Network Cloud Manager - Performance 1.4.5

IBM Telco Network Cloud Manager - Performance System
UI Service Dashboard
Sleeping cell
Threshold
Analytics
Stream Batch Predictive Analytics
Resource Management
File Collector SNMP Collector
Visualization & Export
Analytics
Storage
Collectors
Cassandra CarbonData
Config Store
Timeseries
PostgreSQL
ResourceDB
SNMP Discovery
DiamondDB
Kafka
Designer Tool Tivoli Netcool OMNIbus
Jazz for Service Management
Flow Collector DNS Collector
Flow Analytics
Operator (cloud orchestration) Security (Authentication) Operational
NiFi Collector
Ping Collector
NiFi (Data flow automation)
Pack Service
Pack Service UI
Procedure
1. Access the software and documentation
Telco Network Cloud Manager - Performance is delivered as a highly scalable and resilient application with flexible and autonomous operations. Components are
delivered as containers with reusable features and repeatable orchestration. Software can be downloaded by using its part numbers from IBM Passport Advantage®
website.
2. Evaluate the hardware and system configuration
Review the hardware and software requirements for Telco Network Cloud Manager - Performance.
Telco Network Cloud Manager - Performance is a containerized application and can be deployed on IBM OpenShift® Container Platform or on Native Kubernetes
platform on Red Hat® Enterprise Linux® 7.6 (x86_64) and higher clusters. See System requirements.
3. Review the installation architecture.
See specific installation scenarios that are related to Telco Network Cloud Manager - Performance and its integrations.
4. Installing the product on a server
Two installation scenarios are available.
Integrated installation where the other IBM products are integrated with Telco Network Cloud Manager - Performance to use full functional capabilities and
also to access all the visualizations from Dashboard Application Services Hub as single pane of glass.
Offline Telco Network Cloud Manager - Performance installation on intranet.
The following list outlines the high-level steps for installing and setting up Telco Network Cloud Manager - Performance:
a. Install your cloud platform.
b. Install the prerequisite software.
c. Install Telco Network Cloud Manager - Performance.
d. Install the Technology Packs to discover and collect the performance metrics from the Technology Packs and from custom content.
e. Set up integration with IBM Tivoli® Netcool®/OMNIbus to view the threshold violation alarms from Event Viewer.
f. Set up integration with Watson™ AIOps Metric Manager to see baseline thresholds for predictive analytics.
g. Set up integration with Jazz® for Service Management for visualizations.
h. Set up Apache NiFi environment for File-based Technology Packs.
i. Configure Telco Network Cloud Manager - Performance system.
5. Get started.
Resource discovery is done from the discovered devices by Telco Network Cloud Manager - Performance based on the configurations.
Collect and store the performance metrics.
Monitor the dashboards.
See the Monitoring networks section from Telco Network Cloud Manager - Performance on IBM Documentation to understand the exhaustive list of
visualizations and their business uses.
What to do next
More information
For more information, see the following resources and support:
IBM Telco Network Cloud Manager - Performance on IBM Knowledge Center
Considerations for GDPR readiness
IBM Telco Network Cloud Manager - Performance 1.4.5 7

Note: This document is intended to help you in your preparations for GDPR readiness. It provides information about features of IBM® Telco Network Cloud Manager -
Performance that you can configure, and aspects of the product's use, that you must consider to help your organization with GDPR readiness. This information isn’t an
exhaustive list, due to the many ways that clients can choose and configure features, and the large variety of ways that the product can be used in itself and with third-
party applications and systems.
Clients are responsible for ensuring their own compliance with various laws and regulations, including the European Union General Data Protection Regulation.
Clients are solely responsible for obtaining advice of competent legal counsel as to the identification and interpretation of any relevant laws and regulations that
might affect the clients' business and any actions the clients might need to take to comply with such laws and regulations.
The products, services, and other capabilities described herein aren’t suitable for all client situations and might have restricted availability. IBM doesn’t provide
legal, accounting, or auditing advice or represent or warrant that its services or products ensure that clients are in compliance with any law or regulation.
Table of contents
1. GDPR
2. Product Configuration for GDPR
3. Data Life Cycle
4. Data Collection
5. Data Storage
6. Data Access
7. Data Processing
8. Data Deletion
9. Data Monitoring
10. Capability for Restricting Use of Personal Data
GDPR
General Data Protection Regulation (GDPR) has been adopted by the European Union ("EU") and applies from May 25, 2018.
Why is GDPR important?
GDPR establishes a stronger data protection regulatory framework for processing of personal data of individuals. GDPR brings:
New and enhanced rights for individuals
Widened definition of personal data
New obligations for processors
Potential for significant financial penalties for noncompliance
Compulsory data breach notification
Read more about GDPR
EU GDPR Information Portal
ibm.com®/GDPR website
Product Configuration - Considerations for GDPR Readiness
Offering configuration
The following sections provide considerations for configuring Telco Network Cloud Manager - Performance to help your organization with GDPR readiness.
The information that is collected and processed by Telco Network Cloud Manager - Performance is primarily network performance data, possibly with device
connection information.
However, the user login credentials (username and password) are managed by the Security Service in Telco Network Cloud Manager - Performance with the help of
OpenLDAP. You can configure your own LDAP for user authentication.
If Telco Network Cloud Manager - Performance is integrated with Dashboard Application Services Hub, you can configure to use the Security Services from
Dashboard Application Services Hub.
Data Life Cycle
What is the end-to-end process through which personal data goes through when using the offering?
This offering processes network information. By default, the Security Service in Telco Network Cloud Manager - Performance manages the user credentials with
OpenLDAP. You can configure to use the Security Services from Dashboard Application Services Hub. The personal content is limited to basic personal information.
Authentication among all the Pods on OpenShift® Container Platform and Kubernetes is handled by the Security Service in Telco Network Cloud Manager -
Performance or from Dashboard Application Services Hub based on your system environment.
Personal data used for online contact with IBM
Telco Network Cloud Manager - Performance clients can submit online comments, feedback, or requests to contact IBM about Telco Network Cloud Manager -
Performance subjects in various ways, primarily:
Public comments area on pages in the Telco Network Cloud Manager - Performance community on IBM developerWorks®
Public comments area on pages of Telco Network Cloud Manager - Performance documentation in IBM Knowledge Center
Public comments in the Telco Network Cloud Manager - Performance space of dWAnswers
Feedback forms in the Telco Network Cloud Manager - Performance community
Typically, only the client name and email address are used, to enable personal replies for the subject of the contact, and the use of personal data conforms to the
IBM Online Privacy Statement.
Data Collection
8 IBM Telco Network Cloud Manager - Performance 1.4.5

Types of data collected
Telco Network Cloud Manager - Performance collects technically identifiable personal information such as device IDs, usage-based identifiers, static IP address.
In Telco Network Cloud Manager - Performance, you can also configure LDAP settings to use OpenLDAP.
Data Storage
Data in Telco Network Cloud Manager - Performance in different data sources for different types of data.
All the inventory data is stored in Cassandra database.
All the metric data is stored in CarbonData that is wrapped in DiamondDB Service.
All the system configuration data is stored in PostgreSQL database.
The data from all services is mounted on external Ceph for OpenShift Container Platform and NFS Service for Kubernetes.
For more information, see Data storage services Telco Network Cloud Manager - Performance.
Data Access
Only authenticated users with correct access rights can view the dashboards and configuration pages from Engine interface or from Dashboard Application Services Hub.
For the users, Telco Network Cloud Manager - Performance data access is through Dashboard Application Services Hub portal or from the user management in Dashboard
Designer.
For more information, see User administration Telco Network Cloud Manager - Performance.
Data Processing
Telco Network Cloud Manager - Performance captures performance data from network devices. Network performance data does not contain traffic information from
users, or personal device information when they connected to the network.
Data Deletion
Telco Network Cloud Manager - Performance metric data is deleted based on data retention. The data is removed after the specified retention periods.
For more information, see Retention period timeseries data.
Data Monitoring
No personal or user information is written into logs, but the log files aren’t encrypted in Telco Network Cloud Manager - Performance. Typically, only the Telco Network
Cloud Manager - Performance administrator can access those log files and no usernames and passwords or IP addresses are included in memory dumps.
Capability for Restricting Use of Personal Data
In Telco Network Cloud Manager - Performance, data collection from network devices is restricted in following ways:
In SNMP devices, network polling can be controlled at resource level by setting the pollingInterval parameter. See Telco Network Cloud Manager -
Performance Network Polling SNMP.
Notices
This information was developed for products and services that are offered in the US. This material might be available from IBM in other languages. However, you may be
required to own a copy of the product or product version in that language in order to access it.
IBM may not offer the products, services, or features discussed in this document in other countries. Consult your local IBM representative for information on the products
and services currently available in your area. Any reference to an IBM product, program, or service is not intended to state or imply that only that IBM product, program, or
service may be used. Any functionally equivalent product, program, or service that does not infringe any IBM intellectual property right may be used instead. However, it is
the user's responsibility to evaluate and verify the operation of any non-IBM product, program, or service.
IBM may have patents or pending patent applications covering subject matter described in this document. The furnishing of this document does not grant you any license
to these patents. You can send license inquiries, in writing, to:
IBM Director of Licensing
IBM Corporation
North Castle Drive, MD-NC119
Armonk, NY 10504-1785
US
For license inquiries regarding double-byte character set (DBCS) information, contact the IBM Intellectual Property Department in your country or send inquiries, in
writing, to:
Intellectual Property Licensing
Legal and Intellectual Property Law
IBM Japan Ltd.
19-21, Nihonbashi-Hakozakicho, Chuo-ku
Tokyo 103-8510, Japan
IBM Telco Network Cloud Manager - Performance 1.4.5 9

INTERNATIONAL BUSINESS MACHINES CORPORATION PROVIDES THIS PUBLICATION "AS IS" WITHOUT WARRANTY OF ANY KIND, EITHER EXPRESS OR IMPLIED,
INCLUDING, BUT NOT LIMITED TO, THE IMPLIED WARRANTIES OF NON-INFRINGEMENT, MERCHANTABILITY OR FITNESS FOR A PARTICULAR PURPOSE. Some
jurisdictions do not allow disclaimer of express or implied warranties in certain transactions, therefore, this statement may not apply to you.
This information could include technical inaccuracies or typographical errors. Changes are periodically made to the information herein; these changes will be incorporated
in new editions of the publication. IBM may make improvements and/or changes in the product(s) and/or the program(s) described in this publication at any time without
notice.
Any references in this information to non-IBM websites are provided for convenience only and do not in any manner serve as an endorsement of those websites. The
materials at those websites are not part of the materials for this IBM product and use of those websites is at your own risk.
IBM may use or distribute any of the information you provide in any way it believes appropriate without incurring any obligation to you.
Licensees of this program who wish to have information about it for the purpose of enabling: (i) the exchange of information between independently created programs and
other programs (including this one) and (ii) the mutual use of the information which has been exchanged, should contact:
IBM Director of Licensing
IBM Corporation
North Castle Drive, MD-NC119
Armonk, NY 10504-1785
US
Such information may be available, subject to appropriate terms and conditions, including in some cases, payment of a fee.
The licensed program described in this document and all licensed material available for it are provided by IBM under terms of the IBM Customer Agreement, IBM
International Program License Agreement or any equivalent agreement between us.
The performance data discussed herein is presented as derived under specific operating conditions. Actual results may vary.
The client examples cited are presented for illustrative purposes only. Actual performance results may vary depending on specific configurations and operating conditions.
Information concerning non-IBM products was obtained from the suppliers of those products, their published announcements or other publicly available sources. IBM has
not tested those products and cannot confirm the accuracy of performance, compatibility or any other claims related to non-IBM products. Questions on the capabilities of
non-IBM products should be addressed to the suppliers of those products.
Statements regarding IBM's future direction or intent are subject to change or withdrawal without notice, and represent goals and objectives only.
All IBM prices shown are IBM's suggested retail prices, are current and are subject to change without notice. Dealer prices may vary.
This information is for planning purposes only. The information herein is subject to change before the products described become available.
This information contains examples of data and reports used in daily business operations. To illustrate them as completely as possible, the examples include the names of
individuals, companies, brands, and products. All of these names are fictitious and any similarity to actual people or business enterprises is entirely coincidental.
COPYRIGHT LICENSE:
This information contains sample application programs in source language, which illustrate programming techniques on various operating platforms. You may copy,
modify, and distribute these sample programs in any form without payment to IBM, for the purposes of developing, using, marketing or distributing application programs
conforming to the application programming interface for the operating platform for which the sample programs are written. These examples have not been thoroughly
tested under all conditions. IBM, therefore, cannot guarantee or imply reliability, serviceability, or function of these programs. The sample programs are provided "AS IS",
without warranty of any kind. IBM shall not be liable for any damages arising out of your use of the sample programs.
Each copy or any portion of these sample programs or any derivative work must include a copyright notice as follows:
© (your company name) (year).
Portions of this code are derived from IBM Corp. Sample Programs.
© Copyright IBM Corp. _enter the year or years_.
Trademarks
IBM, the IBM logo, and ibm.com are trademarks or registered trademarks of International Business Machines Corp., registered in many jurisdictions worldwide. Other
product and service names might be trademarks of IBM or other companies. A current list of IBM trademarks is available on the web at "Copyright and trademark
information" at www.ibm.com/legal/copytrade.shtml.
Adobe, Acrobat, PostScript and all Adobe-based trademarks are either registered trademarks or trademarks of Adobe Systems Incorporated in the United States, other
countries, or both.
IT Infrastructure Library is a registered trademark of the Central Computer and Telecommunications Agency which is now part of the Office of Government Commerce.
Intel, Intel logo, Intel Inside, Intel Inside logo, Intel Centrino, Intel Centrino logo, Celeron, Intel Xeon, Intel SpeedStep, Itanium, and Pentium are trademarks or registered
trademarks of Intel Corporation or its subsidiaries in the United States and other countries.
The registered trademark Linux® is used pursuant to a sublicense from the Linux Foundation, the exclusive licensee of Linus Torvalds, owner of the mark on a world wide
basis.
Red Hat®, JBoss®, OpenShift®, Fedora®, Hibernate®, Ansible®, CloudForms®, RHCA®, RHCE®, RHCSA®, Ceph®, and Gluster® are trademarks or registered trademarks of Red
Hat, Inc. or its subsidiaries in the United States and other countries.
Microsoft and Windows are trademarks of Microsoft Corporation in the United States, other countries, or both.
ITIL is a registered trademark, and a registered community trademark of The Minister for the Cabinet Office, and is registered in the U.S. Patent and Trademark Office.
UNIX is a registered trademark of The Open Group in the United States and other countries.
10 IBM Telco Network Cloud Manager - Performance 1.4.5

Java and all Java-based trademarks and logos are trademarks or registered trademarks of Oracle and/or its affiliates.
Cell Broadband Engine is a trademark of Sony Computer Entertainment, Inc. in the United States, other countries, or both and is used under license therefrom.
Linear Tape-Open, LTO, the LTO Logo, Ultrium, and the Ultrium logo are trademarks of HP, IBM Corp. and Quantum in the U.S. and other countries.
Terms and conditions for product documentation
Permissions for the use of these publications are granted subject to the following terms and conditions.
Applicability
These terms and conditions are in addition to any terms of use for the IBM website.
Personal use
You may reproduce these publications for your personal, noncommercial use provided that all proprietary notices are preserved. You may not distribute, display or
make derivative work of these publications, or any portion thereof, without the express consent of IBM.
Commercial use
You may reproduce, distribute and display these publications solely within your enterprise provided that all proprietary notices are preserved. You may not make
derivative works of these publications, or reproduce, distribute or display these publications or any portion thereof outside your enterprise, without the express
consent of IBM.
Rights
Except as expressly granted in this permission, no other permissions, licenses or rights are granted, either express or implied, to the publications or any
information, data, software or other intellectual property contained therein.
IBM reserves the right to withdraw the permissions granted herein whenever, in its discretion, the use of the publications is detrimental to its interest or, as
determined by IBM, the above instructions are not being properly followed.
You may not download, export or re-export this information except in full compliance with all applicable laws and regulations, including all United States export
laws and regulations.
IBM MAKES NO GUARANTEE ABOUT THE CONTENT OF THESE PUBLICATIONS. THE PUBLICATIONS ARE PROVIDED "AS-IS" AND WITHOUT WARRANTY OF ANY
KIND, EITHER EXPRESSED OR IMPLIED, INCLUDING BUT NOT LIMITED TO IMPLIED WARRANTIES OF MERCHANTABILITY, NON-INFRINGEMENT, AND FITNESS
FOR A PARTICULAR PURPOSE.
IBM Telco Network Cloud Manager - Performance training and education
Use this information to understand IBM® Telco Network Cloud Manager - Performance education material and training.
Course name Telco Network Cloud Manager - Performance (Kickstart Bootcamp)
Course duration 4 days
Audience System integrator or Administrator who install, use, deploy, administer, or troubleshoot Telco Network Cloud Manager - Performance.
Prerequisites The following prerequisites are needed:
Student must be familiar with system administration concepts and strong UNIX administration skills.
Student must also be familiar with TCP/IP fundamentals and have previous scripting experience.
Basic Kubernetes and Docker knowledge.
Knowledge in basic network performance (KPI, Technologies, SNMP, files), Kafka, SQL and NoSQL database, NiFi, and Zookeeper is an
advantage.
Knowledge in IBM Tivoli® Netcool® Performance Manager and IBM Netcool Performance Insight® is an advantage.
Course overview Telco Network Cloud Manager - Performance is a cloud-based offering for managing large-scale low latency modern network infrastructure. It is
suitable for service providers like telecommunications companies, internet service providers (ISP), media, and, entertainment service providers. The
offering helps the service providers to manage across physical, and virtualized network layers and to manage virtualized network functions. As Telco
Network Cloud Manager - Performance continue to become widely adopted, system integrator and administrator are increasingly required to
understand how to deploy, use, manage, and administer the system.
Course
objectives
After the completion of this course, the following tasks can be done by the students:
Describe the Telco Network Cloud Manager - Performance system, the architecture, components, and processes.
Establish new Telco Network Cloud Manager - Performance system users and provide ongoing user support.
Identify, explain, and use the key Telco Network Cloud Manager - Performance system features and functions.
Undertake data-handling tasks, system management tasks, and other common server and user web interface administration responsibilities.
Monitor and maintain the Telco Network Cloud Manager - Performance server network.
Troubleshoot problems that might arise in the Telco Network Cloud Manager - Performance user and administration scenarios.
Install and configure the Telco Network Cloud Manager - Performance system.
Install the Technology Packs.
Hands-on training is not included.
IBM Telco Network Cloud Manager - Performance 1.4.5 11

Course content
summary
Architecture for Telco Network Cloud Manager - Performance
Overview of Technology Packs
Data flow and collection
Administration
Alarms and Threshold
Monitoring networks
Troubleshooting
Log files and analysis
Telco Network Cloud Manager - Performance system installation
Technology Pack installation
Lesson flow Tivoli Netcool Performance Manager vs Telco Network Cloud Manager - Performance
Differences between Tivoli Netcool Performance Manager, Telco Network Cloud Manager - Performance, and IBM Network Performance
Insight
Data Process Flow
Technology pack Content
Architecture for Telco Network Cloud Manager - Performance
Telco Network Cloud Manager - Performance Architecture and components & technologies
Technology Packs
NiFi
Processors
ID Formation
Demo with Huawei 5G
Inventory
Model files and Relationship Hierarchy
File Collector
Discoveries
Formulas
Input Sheet (Dev folder)
Timeseries
Metric files
Services and Debugging (Kafka, Cassandra, Timeseries, Inventory URLs)
Data flow and collection
File-based data flow
NiFi overview (NiFi canvas, data verification)
Data flow
Cluster configuration
File Collector design (Configurations)
Discovery and Formula files
Data flow and verification
SNMP data flow
SNMP Discovery
Discovery profile and credentials
Discovery tool to rerun discovery.
SNMP Collector
Troubleshooting
Cluster configuration
Administration
User group and management (Roles, Privileges, and so on)
Storage Administration
Alarms and Thresholds
Export Alarm
Omnibus
Kafka
SNMP Trap
Monitoring networks
Built-in Dashboards and features (Walk-through of the dashboards, options available, and drills)
Other integrations
Integration with IBM Netcool Operations Insight
Dashboard Application Services Hub
Tivoli Netcool/OMNIbus
Integration with Watson™ AIOps Metric Manager
Troubleshooting
Installation troubleshooting
Data flow and Collection troubleshooting
Dashboard troubleshooting
Administration troubleshooting (Roles, Credentials, Access)
12 IBM Telco Network Cloud Manager - Performance 1.4.5

Current® Known Issues and workaround
Log files and analysis
Access the log files location for different services
End to end troubleshooting by using logs when dashboards have no data.
Check logs from UI and Dashboard level.
Check logs from Discovery level.
Check logs from Inventory and Inventory UI Table.
Check logs from Collector Level.
SNMP data
File-based data
Check logs from Analytics level.
Check logs from Timeseries database.
Check logs from database and SQL Query.
Telco Network Cloud Manager - Performance system installation
Installation of the Telco Network Cloud Manager - Performance software
Disaster recovery, back up and restore
Technology Pack installation
Commands to install, uninstall, and status check for the Technology Packs.
Training aids
and tools
It is an online instructor-led training that combines the following teaching methods to provide students with sufficient skills to use Telco Network
Cloud Manager - Performance:
Lecture
Discussion
Demonstration
Q/A sessions
Training
schedule
To be announced later
For training
registration form
and other
information,
email us.
inpmtraining@persistent.com
Telco Network Cloud Manager - Performance product overview
Telco Network Cloud Manager - Performance is a cloud-based application to monitor network performance. It provides a comprehensive view of the performance metrics
to improve the service to your customers. You can customize what metrics you want to monitor across your network infrastructure to deliver the best quality of service.
Telco Network Cloud Manager - Performance system consists of many microservices. The microservices can be installed in a cluster of servers (a distributed system).
The following capabilities are available in the product:
Flexible and robust and can handle many types of performance metrics. It can also populate metrics from streaming platforms such as Apache Kafka and Apache
Pulsar.
A cloud native deployment that offers the ease and low upkeep on centralized management and horizontal scaling.
Fulfills the network performance reporting use cases of 5G network engineers. It has the flexibility to model the network object hierarchy and continuous update of
network collection formulas on both real-time and historic performance data.
Provides the network performance reporting needs of Managed Service Providers (MSP). The MSP customers can view the view device performance in their own
networks.
Telco Network Cloud Manager - Performance architecture
IBM® Telco Network Cloud Manager - Performance provides a comprehensive view of the performance metrics and improve the service to your customers. You can
customize what metrics you want to monitor across your network infrastructure to deliver the quality of service. With its sophisticated troubleshooting capabilities
and statistical measurements, network engineers can quickly identify and fix potential quality problems before the customers can experience quality dips.
Technology pack content
Telco Network Cloud Manager - Performance provides an extensive library of off-the-shelf network interfaces that are called technology packs, which can be
quickly deployed, extended, and modified to manage different vendors and technologies on a single system. Technology packs are independent modules that
provide technology-specific data models, vendor-specific metrics and key performance indicators (KPIs), and reports and graphs.
Designer tool
Telco Network Cloud Manager - Performance comes with Designer tool, which is a simple browser-based tool to create highly functional business dashboards from
various data sources. You can create complex, dynamic, and interactive visual representations from various data sources and display historical and real-time data.
You don’t need any programming or SQL query language skills to use it.
Deployment modes
Learn about the deployment architecture of Telco Network Cloud Manager - Performance on supported container platforms. It can be installed on Red Hat® Linux®
cluster in a private cloud environment.
Accessibility
Accessibility features assist users who have a disability, such as restricted mobility or limited vision, to use information technology content successfully.
Telco Network Cloud Manager - Performance architecture
IBM Telco Network Cloud Manager - Performance 1.4.5 13

IBM® Telco Network Cloud Manager - Performance provides a comprehensive view of the performance metrics and improve the service to your customers. You can
customize what metrics you want to monitor across your network infrastructure to deliver the quality of service. With its sophisticated troubleshooting capabilities and
statistical measurements, network engineers can quickly identify and fix potential quality problems before the customers can experience quality dips.
Get the features and functions of Telco Network Cloud Manager - Performance from this information.
Figure 1. Telco Network Cloud Manager - Performance architecture
images/tncp_archi_145.svg
(Click image to view in a new window.)
IBM Telco Network Cloud Manager - Performance System
UI Service Dashboard
Sleeping cell
Threshold
Analytics
Stream Batch Predictive Analytics
Resource Management
File Collector SNMP Collector
Visualization & Export
Analytics
Storage
Collectors
Cassandra CarbonData
Config Store
Timeseries
PostgreSQL
ResourceDB
SNMP Discovery
DiamondDB
Kafka
Designer Tool Tivoli Netcool OMNIbus
Jazz for Service Management
Flow Collector DNS Collector
Flow Analytics
Operator (cloud orchestration) Security (Authentication) Operational
NiFi Collector
Ping Collector
NiFi (Data flow automation)
Pack Service
Pack Service UI
Telco Network Cloud Manager - Performance services
Telco Network Cloud Manager - Performance system is based on microservices architecture. The data that is collected from the configured devices is stored in the
timeseries database for long-term storage. The other services can the process the data.
The following are the different layers in Telco Network Cloud Manager - Performance architecture:
Operational Services
These services have specific operations in the Telco Network Cloud Manager - Performance solution.
App
The App Service manages the site grouping configuration page. Also, it controls the scheduler that kick starts the house keep activity for audit trial.
Operator
Telco Network Cloud Manager - Performance contains Operator Service. An Operator is a method of packaging, deploying, and managing a Kubernetes-native
application.
Security
The Security Service monitors the LDAP authentication.
Pack Service
Collectors
Multiple collectors are available to cater for different data formats and protocols, such as SNMP, file-based data from EMS for both Wired and Wireless devices, and
flow data from Netflow and sFlow-enabled devices as a unified platform.
The following are the set of collectors to collect data from different data sources:
DNS Collector
File Collector
Flow Collector
NiFi Collector
Ping Collector
SNMP Collector
SNMP Discovery
Data storage
Data from different data sources are stored in timeseries database and Resource database. The following types of data are stored in Telco Network Cloud Manager -
Performance:
Resource data storage
14 IBM Telco Network Cloud Manager - Performance 1.4.5

Discovered resources that include resource properties and resource hierarchy relationships are stored in Cassandra database that is available as a separate
service. This information is shared with other microservices by using REST APIs or WebSocket subscriptions.
Metric data storage
Performance metric data from all the collectors is stored in Timeseries database. Metric data is shared with other micro services by using metrics REST API,
or stream by using Kafka or WebSocket. The database is optimized to improve the overall performance and long-term storage. Storage optimization
minimizes the data retrieval time and reduces hardware and administration costs.
Configuration data storage
All the system configuration data is stored in PostgreSQL database that is available as a separate service.
Analytics
This layer consists of the following components:
Analytics
The selected metrics are defined by the Analytics Service for aggregations and other calculations. These metrics are loaded into a time series data store for
high-performance queries and formula calculation that is handled by the Analytics Service.
The Analytics service provides user-defined calculation (UDC) metrics and resource hierarchy. For example, roll up, arithmetic operations and functions. Two
modes of analytics are available; stream and batch mode.
Stream mode
Computation on the collected data is done and output is available in real time.
Batch mode
Computation of temporal, spatial, or a combination of both for metrics and defined UDCs.
Flow Analytics
The Flow Analytics Service is also responsible for aggregation processes for Flow data. It refines the raw data, filters the results, and aggregates the KPI
values. The values are aggregated by SUM, and the results are then stored in timeseries database.
Threshold
The primary objective of thresholding is to determine any violations and to generate alerts.
When the value of a metric falls outside the acceptable threshold range, the system generates and stores the event condition and forwards it to the Event
Management System. It can send the data for event generation to Tivoli® Netcool®/OMNIbus and the generated alarms can be viewed from the Event Viewer.
This data can also be exported to a Kafka topic or SNMP trap that can be consumed for alarm analytics.
The following types of thresholds are supported:
Burst
Ignores the natural network bursts by evaluating how long in a row that the violations occurred per resource. Burst thresholds can be set and reset
multiple times.
Period
Involves the concept of accumulated duration for which the threshold is violated. This duration is accumulated per resource until the end of the
period. The threshold is violated as soon as the accumulated duration by period of a data spike exceeds a certain duration of time. If the period
thresholds are violated, they are not reset until the end of the period.
Baseline
Provides a view into resource behavior outside the normal range. It uses a profiled deviation function to compare the current daily behavior with the
baseline as data flows throughout the system in real time.
Baseline thresholds are available through integration with Watson™ AIOps Metric Manager.
Sleeping cell
The Sleeping cell Service hosts the Anomaly detection UI. Any other UIs that are related to configuring the python scripts can be added here in future.
Visualization framework and export
Microservices that are involved in the Visualization framework and export layer.
UI Service
With the help of REST APIs, performance data across resource information and metric information can be queried and used for visual representation
for root cause analysis.
Dashboard Service
Stores all the administration pages and dashboard files that are given with Telco Network Cloud Manager - Performance. All the dashboard user
access data is stored in PostgreSQL database. All the dashboard pages are stored in their respective technology packs.
Designer tool
The Dashboard Service has a built-in dashboard Designer tool for all its custom visualization needs.
Telco Network Cloud Manager - Performance Dashboards
A wide range of visualizations and reporting as domain-specific dashboards are provided in Telco Network Cloud Manager - Performance. These dashboards
provide analytical, diagnostic, and mitigation capabilities on common network performance metrics. You can customize the visibility of your own significant
metrics.
Note: Dashboards JSON files and menu definitions are available in Technology Packs. See Dashboards and technology pack dependencies.
System administration pages
A wide range of configuration pages are available for fine-tuning the Telco Network Cloud Manager - Performance Dashboards for performance of and
visualizations. All the configuration data is stored in PostgreSQL database.
Note: System administration pages are available in microservices. See Accessing system configuration pages
Designer tool
The operations dashboards allow rich report output. It also has a built-in Designer tool application that provides a simple drag-and-drop interface to create
customized dashboards and reports.
The following modules are available in Designer tool:
IBM Telco Network Cloud Manager - Performance 1.4.5 15

Dashboard Designer
It’s a web-based dashboard builder software with drag-and-drop interface that helps to create and share live dashboards with historical and real-time
data. You can convert your business-critical data into interactive dashboards, and then customize them. You can create dashboards for visual analysis
that can contain large amounts of data that is displayed in a meaningful way easily and quickly. The following are its key capabilities:
Create different types of widgets and dashboards with a wide range of customizations.
Connect to Telco Network Cloud Manager - Performance data sources and query the enterprise-critical data.
Publish dashboards and make them available to users based on their User Groups.
Connector
Data query component that can connect and automatically generate request queries to fetch data from data sources. It retrieves the data for visual
representations in the widgets. The widgets in the dashboard must be connected to the data source to display data on it.
Engine
Data visualization component. All the dashboards that are created from Dashboard Designer are published on the Engine. You can access and manage
the Engine separately.
Scheduler
Automated report scheduling feature takes information from your dashboards proactively to the right users at the right time. You can set up a
dashboard to run itself at specified time periods and send the results automatically to the people who must see them.
Telco Network Cloud Manager - Performance functions
Discovery
Network discovery for SNMP devices is the process that collects information about detected network devices such as routers, switches, servers, and firewalls in
your network environment. It helps you to understand how the network devices are connected and communicate with each other.
The file-based discovery is in-band discovery where the resources are discovered through incoming files.
Data collection and polling
Polling that is associated with SNMP devices is the process where the devices on the network are checked periodically to collect information that is related to the
performance of the device. For example, operational status, or other health metrics. You can collect the metrics from different SNMP-enabled devices and resource
types based on the data in the Management Information Base (MIB) variables of the devices.
File-based resource and metric collection is handled by NiFi and File Collector Services. NiFi Service parses the CSV/XML files that are generated from the EMS and
converts the records to a common Avro record format. These records contain inventory and metric data. The File Collector segregates the inventory data and metric
data and sends the inventory data to the Inventory Service and metric data to the Timeseries Service for further processing and storage.
Integrations
Products that are integrated with Telco Network Cloud Manager - Performance.
IBM Netcool Operations Insight®
You can configure integration with Standard Input (stdin) probe that is bundled with Telco Network Cloud Manager - Performance to send threshold violation events
to Netcool Operations Insight Operations Management. These events can be viewed from IBM Tivoli Netcool/OMNIbus Event Viewer.
Watson AIOps Metric Manager
You can configure to send the baseline threshold violation events to a Kafka topic in a compatible format that can be accessed by IBM Operations Analytics -
Predictive Insights for predictive analytics.
Jazz® for Service Management
Dashboard Application Services Hub provides visualization and dashboard services in Jazz for Service Management. It has a single console for administering IBM
products and related applications. Visualizations in Telco Network Cloud Manager - Performance are federated into Dashboard Application Services Hub.
Rapid device onboarding
A Rapid Device Onboarding Toolkit is available for DevOps team to expand the data collection such as adding new metrics or resource types. Existing metrics and formulas
can be edited or new metrics and formulas can be added.
Rapid SNMP device onboarding
Rapid onboarding for new SNMP devices that are introduced in the network can be completed within 1 day. Within this period, required discovery formulas,
collection formulas, and metrics can be created and deployed for Telco Network Cloud Manager - Performance to start discovery and polling.
Rapid file device onboarding
Rapid onboarding for new file-based EMS in your network environment to be ready for Telco Network Cloud Manager - Performance to start discovery and data
collection.
Foundation services
Foundation services are the basic infrastructure services that are used by multiple other Telco Network Cloud Manager - Performance services.
Data collector services
All the different collectors are available as microservices and collect metric data from different data sources. The data from all collectors is standardized to produce
a time series record format.
Performance Metric services
Services that are needed for Telco Network Cloud Manager - Performance entity metric data that is collected, aggregated, and monitored.
Data storage services
Data from different sources is stored in these services.
Foundation services
Foundation services are the basic infrastructure services that are used by multiple other Telco Network Cloud Manager - Performance services.
16 IBM Telco Network Cloud Manager - Performance 1.4.5

Dashboard
The Dashboard Service hosts the Telco Network Cloud Manager - Performance Dashboards. These dashboards are technology neutral JSON files and require
properties files.
Kafka
Apache Kafka is fast, scalable, durable, and fault-tolerant providing a unified, high-throughput, low-latency platform for handling real-time data feeds.
Pack Service
Pack Service is an automated and quick way to update and create Technology Packs by using the web-based UI. It can and handle predefined data sources. Using
the Pack Service, you can create pack rule models and generate all the artifacts automatically and deploy them to the relevant Telco Network Cloud Manager -
Performance components.
NiFi
Telco Network Cloud Manager - Performance contains NiFi as Service. It is used to automate and manage the data flow between the network devices and Telco
Network Cloud Manager - Performance. Apache NiFi is used in file-based data collection where it parses the metric files from EMS to standard AVRO record format.
The AVRO records are published to Kafka for File Collector Service to consume, process, and load to Telco Network Cloud Manager - Performance system.
UI
The UI service operates in cluster load-balancing mode. Each instance of UI is fully operational and capable of serving requests.
Zookeeper
ZooKeeper is a centralized infrastructure and set of services that enable synchronization across a cluster. ZooKeeper maintains common objects that are needed in
large cluster environments, such as configuration information, distributed synchronization, and group services.
Dashboard
The Dashboard Service hosts the Telco Network Cloud Manager - Performance Dashboards. These dashboards are technology neutral JSON files and require properties
files.
Dashboard Service can be operated on multiple instances in your cluster.
For example, if you have four nodes in the cluster and you have Dashboard Service available on two nodes, the Console Integration link might point to one node. But in the
backend, they are load balanced.
Dashboard Designer, Engine, and the Scheduler are deployed as separate web applications.
Kafka
Apache Kafka is fast, scalable, durable, and fault-tolerant providing a unified, high-throughput, low-latency platform for handling real-time data feeds.
Kafka is run as a cluster on one or more servers that can span multiple data centers. The Kafka cluster stores streams of records in categories called topics. Each record
consists of a key, a value, and a timestamp. Kafka is generally used for two broad classes of applications.
Building real-time streaming data pipelines that reliably get data between systems or applications.
Building inter-service, asynchronous communications.
In Telco Network Cloud Manager - Performance, Kafka is used in the following scenarios:
In file-based data collection that uses Apache NiFi to convert the network performance data that is collected from your EMS as files into records in Avro format. The
data from the Avro records is written to Kafka topic. File Collector reads these records, and further processes the data.
The Timeseries Service routes the timeseries records that are received in real time to Kafka topics that are required by the Threshold and Streaming Analytics
Services. The stream data is written to Kafka topics that are distributed to Streaming Analytics. The batch jobs and Busy hour schedules are also routed to the Batch
Analytics through the Kafka topics.
Related concepts
Analytics Service
Threshold
Pack Service
Pack Service is an automated and quick way to update and create Technology Packs by using the web-based UI. It can and handle predefined data sources. Using the
Pack Service, you can create pack rule models and generate all the artifacts automatically and deploy them to the relevant Telco Network Cloud Manager - Performance
components.
Pack Service is a low code tool that allows the domain expert to configure how data can be ingested into Telco Network Cloud Manager - Performance.
Pack Service can generate the following Technology Pack components:
Artifacts for resource model, relationship, and metric.
Additional formulas for File Collector to process further.
Pack Service also has some data source types, each of these has a pre-built NiFi templates.
When a user deploy a pack rule, the pack rule is validated, built by using rules, and apply those into target NiFi template.
These NiFi templates normalize the raw data into records for pack rule. A set of NiFi Processors are used to evaluate the rule against the records and transform
them into Avro records for further processing.
IBM Telco Network Cloud Manager - Performance 1.4.5 17

NiFi
Telco Network Cloud Manager - Performance contains NiFi as Service. It is used to automate and manage the data flow between the network devices and Telco Network
Cloud Manager - Performance. Apache NiFi is used in file-based data collection where it parses the metric files from EMS to standard AVRO record format. The AVRO
records are published to Kafka for File Collector Service to consume, process, and load to Telco Network Cloud Manager - Performance system.
How Apache NiFi fits in file-based data flow?
Apache NiFi provides web-based UI and provides a seamless experience between design, control, feedback, and monitoring.
It is highly customizable with low latency, high throughput, dynamic prioritization, and modifiable flows at run time.
It provides data provenance module to track the data flow from start to end.
It provides options to create custom processors and reporting tasks to suit all types of data.
It provides user administration and can be integrated with LDAP for authorization.
UI
The UI service operates in cluster load-balancing mode. Each instance of UI is fully operational and capable of serving requests.
The UI Service provides the required REST APIs that pull data from the Resource Management Service and Timeseries Service.
Zookeeper
ZooKeeper is a centralized infrastructure and set of services that enable synchronization across a cluster. ZooKeeper maintains common objects that are needed in large
cluster environments, such as configuration information, distributed synchronization, and group services.
The Kafka brokers, topics, and partition information are maintained in Zookeeper. Zookeeper stores the metadata from Kafka. Data such as the location of partitions and
the configuration of topics are stored outside of Kafka itself, in a separate Zookeeper cluster.
Data collector services
All the different collectors are available as microservices and collect metric data from different data sources. The data from all collectors is standardized to produce a time
series record format.
File Collector
Collects generic data from file-based devices with the help of Apache NiFi. It collects data from different sources and normalizes the data for File Collector module
to apply formulas. Apache NiFi converts the network performance data that is collected from your EMS as files into records in Avro format and sent to Kafka
message bus. Avro stores the data definition (schema) in JSON format and makes it easy to be read and interpreted by any program. Data is written to a Kafka topic.
SNMP Collector
Collects performance metrics through SNMP protocol. It uses formulas to do computations such as delta, arithmetic operation on metric values that are collected.
It calculates metric values for the data that is collected by SNMP Collector. It uses formulas that are deployed against specific resource types. SNMP enabled
devices can be configured to probe and measure how traffic is flowing across the network with SNMP metric data such as response times, latency, jitter, packet
loss, and device health metrics. This information can be used to determine the current performance of the network from the user perspective.
SNMP Discovery
The SNMP Discovery Service helps to discover the network resources. It makes use of predefined discovery formulas, collection formulas, and metrics that are
available in Technology Pack content. It can also process the user-defined formulas for Rapid SNMP device onboarding.
Flow Collector
A Flow is a sequence of packets with common characteristics such as same source and destination IP address, transport layer port information, and type of
protocol. The Flow enabled devices or exporters collect Flow data from the network.
DNS Collector
The DNS Collector Service resolves the DNS names for reporting and distributing the interface metadata.
ICMP Ping Collector
The Internet Control Message Protocol (ICMP) is one of the protocols of the TCP/IP suite. It is a network layer protocol that serves the purpose of error reporting
and network path diagnostic functions. The ICMP echo request and the ICMP echo reply messages are commonly known as ping messages. ICMP Ping is a
troubleshooting tool that is used to test for connectivity between network devices. It is also used to test for network delay and packet loss.
File Collector
Collects generic data from file-based devices with the help of Apache NiFi. It collects data from different sources and normalizes the data for File Collector module to
apply formulas. Apache NiFi converts the network performance data that is collected from your EMS as files into records in Avro format and sent to Kafka message bus.
Avro stores the data definition (schema) in JSON format and makes it easy to be read and interpreted by any program. Data is written to a Kafka topic.
File-based performance data processing
File Collector performs the following tasks:
18 IBM Telco Network Cloud Manager - Performance 1.4.5

File Collector reads the Avro records, sorts, and puts the inventory data into the database in Inventory Service and metric data into the time series database in
Timeseries Service.
It also sorts the windowed data, discovers resources, and runs formulas.
Network
ApacheNiFi
IBM Telco Network Cloud Manager - Performance System
KAFKA
File
Collector
Resource
Management Timeseries
Avro format Avro format Avro format
Performance files
Avro format
Avro format
Performance files Performance files Performance files
EMS EMS EMS
EMS
Related concepts
NiFi
SNMP Collector
Collects performance metrics through SNMP protocol. It uses formulas to do computations such as delta, arithmetic operation on metric values that are collected. It
calculates metric values for the data that is collected by SNMP Collector. It uses formulas that are deployed against specific resource types. SNMP enabled devices can be
configured to probe and measure how traffic is flowing across the network with SNMP metric data such as response times, latency, jitter, packet loss, and device health
metrics. This information can be used to determine the current performance of the network from the user perspective.
SNMP performance data processing
SNMP Collector Service collects all the SNMP metrics and provides performance network monitoring for specific quality of service measurements. The SNMP Collector
generates poll requests on all discovered SNMP devices, and SNMP credentials from Kafka topics. Discovery of SNMP resources and properties is handled by SNMP
Discovery Service.
Polling definitions
By default, you can trace the polling definitions from the log file that is associated with SNMP Collector Service. The polling definition messages are in the following
format:
<agent>/<OID>/<index>[<interval in ms>]
Where:
Field name Description
<agent> The resource that must be polled.
<OID> The OID on the resource that must be polled.
<index>
interval The time interval that the OID or instance on the resource that must be polled.
For example,
10.212.5.2:1039/1.3.6.1.4.1.9.2.2.1.1.13/185[300000]
Related information
configure SNMP credentials
SNMP Discovery
The SNMP Discovery Service helps to discover the network resources. It makes use of predefined discovery formulas, collection formulas, and metrics that are available in
Technology Pack content. It can also process the user-defined formulas for Rapid SNMP device onboarding.
IBM Telco Network Cloud Manager - Performance 1.4.5 19

To support the discovery process, built-in discovery formulas and required MIB files are provided as Technology Pack content in the installation media. During the
reconciliation process, it is decided if a resource must be added, updated or deleted.
Additionally, it helps to get the configured SNMP credentials for the network devices and the SNMP request to the SNMP Collector Service. This information is then
updated into the database.
Flow Collector
A Flow is a sequence of packets with common characteristics such as same source and destination IP address, transport layer port information, and type of protocol. The
Flow enabled devices or exporters collect Flow data from the network.
The Flow Collector Service in Telco Network Cloud Manager - Performance performs these basic functions:
Receives Flow records from Flow-exporters.
Parses, validates, and normalizes the various Flow record formats into a common format.
Enriches and filters Interfaces based on enable or disable flag set per network interface.
Limits the number of interfaces that are enabled in Telco Network Cloud Manager - Performance
Stores the normalized and enriched Flow records in DiamondDB Service in CarbonData.
Data flow for Flow data within the system:
Flow Devices
CarbonData Config Store
PostgreSQLDiamondDB
Remote Flow
Collector
Kafka
Resource
Management
Timeseries Threshold
Flow Analytics DNS CollectorFlow Collector
Note: To enrich the Flow interfaces, you must run SNMP Discovery. For more information, see Resource discovery.
Collection process
A collection process must be able to receive the flow information that is passing through multiple network elements within the data network.
Remote Flow Collector
Install Remote Flow Collector if you want the collector to be co-located with the Flow exporters from which it is collecting data. The Flow records that are collected
by the Remote Collectors are sent to the hosts where the Flow Collector Service is located.
Default normalized flow record fields in Telco Network Cloud Manager - Performance
A default list of normalized Flow fields that are used with a common label across V9 and IPFIX flow formats and applicable for all vendors and protocols. Make sure
to configure all the required fields in your Flow records.
Collection process
A collection process must be able to receive the flow information that is passing through multiple network elements within the data network.
Flow metric collection
Traffic on a data network can be perceived as a flow of data between two end-points that passes through network elements. For administrative or other purposes, it is
beneficial to have the network elements observe these flows and report their characteristics to Telco Network Cloud Manager - Performance to understand the network
usage patterns.
The three main components in NetFlow technology are; NetFlow cache, NetFlow exporter, and NetFlow collector.
NetFlow cache
A large amount of network information is condensed into a database of NetFlow information that is called the NetFlow cache. NetFlow can be configured to capture
flows to the NetFlow cache. Typically, the NetFlow cache is constantly filling with flows and the router or switch searches the cache for flows that are terminated or
expired and these flows are exported to the NetFlow collector.
NetFlow exporter
The NetFlow exporter sends flows that are in the cache to a NetFlow collector. NetFlow exporters are configured for Ingress interface traffic and Egress interface
traffic or both.
Flow collector
Flow Collector receives and pre-processes flow data that is received from a flow exporter.
A flow is ready for export when it is inactive, when no new packets are received for the flow or if the flow is long lived (active) and lasts longer than the active timer. A flow
is inactive if it did not receive a packet for a specific duration that is longer than the inactive timeout value that is specified in the configuration. The flow record is deleted
from the flow cache and an export record is generated, when the inactive timeout is triggered. By default, active timeout value is 30 minutes and inactive timeout value is
15 seconds.
The collector component in Telco Network Cloud Manager - Performance can then process and transform the data.
20 IBM Telco Network Cloud Manager - Performance 1.4.5

The collection process in Telco Network Cloud Manager - Performance is as follows:
Acquisition
Parse
Filter Transform Publish
Flow packets are
collected
via UDP/SCTP listeners
Unpacks the received
data (packets) and
interprets the
content
Make decisions
or disposition
based on rules or
configuration
Normalization into
a common, or TNCP
native format for
downline-
processing
Sends Flow data to
Analytics by using
Kafka Message Bus
Remote Flow Collector
Install Remote Flow Collector if you want the collector to be co-located with the Flow exporters from which it is collecting data. The Flow records that are collected by the
Remote Collectors are sent to the hosts where the Flow Collector Service is located.
It performs the same functions as a Flow Collector Service does.
Remote Flow Collector listens on UDP port and copy Flow packets from the exporter.
It writes the Flow packets to remote Kafka.
Flow Collector connects to the remote Kafka and reads and parses the Flow packets from remote Kafka.
Remote Flow Collector data flow
Remote Flow
Collector
Flow Devices
UDP/SCTP
Kafka
Zookeeper
Flow Collector Flow Devices
UDP/SCTP
Default normalized flow record fields in Telco Network Cloud Manager - Performance
A default list of normalized Flow fields that are used with a common label across V9 and IPFIX flow formats and applicable for all vendors and protocols. Make sure to
configure all the required fields in your Flow records.
Standard Flow fields
Important: These Flow fields that are stored by default in Telco Network Cloud Manager - Performance database.
Normalized Flow
Fields V9 Field name IPFIX field name Required
packetSequence =header(sequenceNumber)
Note: This is calculated by Collector.
exportTimestamp
Millis
=header(unixSeconds) * 1000 + (header(unixNSecs) /
1000000)
baseTimestamp = exportTimestampMillis -
header(sysuptime)
systemInitTimeMillisec
onds
templateID =header(sourceID) +
templateID
=header(sourceID) +
templateID
startTimestampM
illis
=baseTimestamp + bytes(24-27) =baseTimestamp+
21(LAST_SWITCHED)
endTimestampMil
lis
=baseTimestamp + bytes(28-31) =baseTimestamp+
21(LAST_SWITCHED)
inOctets 1 (IN_BYTES) 1 (octetDeltaCount) Yes
Note: You must have either inOctets or outOctets in your Flow record.
IBM Telco Network Cloud Manager - Performance 1.4.5 21

Normalized Flow
Fields V9 Field name IPFIX field name Required
inPackets 2 (IN_PKTS) 2 (packetDeltaCount) Yes
Note: You must have either inPackets or outPackets in your Flow
record.
protocolId 4 (PROTOCOL) 4 ( protocolIdentifier) Yes
srcTos 5 (SRC_TOS) 5 (ipClassOfService)
tcpBits 6 (TCP_FLAGS) 6 (tcpControlBits)
srcPort 7 (L4_SRC_PORT) 7 (sourceTransportPort) Yes
Note: You must have srcPort or dstPort along with protocolID if
applicationId field is not configured.
srcIp 8 (IPV4_SRC_ADDR) 8 (sourceIPv4Address)
srcMask 9 (SRC_MASK) 9
(sourceIPv4PrefixLengt
h)
inIfId 10 (INPUT_SNMP) 10 (ingressInterface) Yes
dstPort 11 (L4_DST_PORT) 11
(destinationTransportP
ort)
Yes
Note: You must have srcPort or dstPort along with protocolID if
applicationId field is not configured.
dstIp 12 (IPV4_DST_ADDR) 12
(destinationIPv4Addres
s)
Yes
dstMask 13 (DST_MASK) 13 (
destinationIPv4Prefix
Length)
outIfId 14 (OUTPUT_SNMP) 14 (egressInterface) Yes
nextHopIp 15 (IPV4_NEXT_HOP) 15
(ipNextHopIPv4Address)
bgpSrcAsNum 16 (SRC_AS) 16 ( bgpSourceAsNumber)
bgpDstAsNum 17 (DST_AS) 17
(bgpDestinationAsNumbe
r)
bgpNextHopIp 18 (BGP_IPV4_NEXT_HOP) 18
(bgpNextHopIPv4Address)
endMs =baseTimestamp+21(LAST_SWITCH
ED)
21 (flowEndSysUpTime)
startMs =baseTimestamp+22(FIRST_SWITC
HED)
22 (flowStartSysUpTime)
outOctets 23 (OUT_BYTES) 23
(postOctetDeltaCount)
Yes
Note: You must have either inOctets or outOctets in your Flow record.
outPackets 24 (OUT_PKTS) 24
(postPacketDeltaCount)
Yes
Note: You must have either inPackets or outPackets in your Flow
record.
srcIp 27 (IPV6_SRC_ADDR) 27 (sourceIPv6Address) Yes
dstIp 28 (IPV6_DST_ADDR) 28
(destinationIPv6Addres
s)
Yes
srcMask 29 (IPV6_SRC_MASK) 29
(sourceIPv6PrefixLengt
h)
dstMask 30 (IPV6_DST_MASK) 30
(destinationIPv6Prefix
Length)
applicationId 95 (APPLICATION TAG) 95 (application tag)
policyQosClassi
fication
Hierarchy
41000
(policyQosClassificationHiera
rchy)
8232 (
policyQosClassificatio
n
Hierarchy)
These fields are required for QoS functionality and also for Top QoS
Hierarchies with Queue ID aggregation to work correctly.
policyQosQueueI
d42128 (Queue ID) 9360 (Queue ID)
flowDirection 61 (DIRECTION) 61 (flowDirection)
Note: If Application ID field is not available, then appName is resolved by using /etc/protocols and /etc/services as lookup tables or finding the service name based on a
lookup from port and protocol fields from a NetFlow record. When no match is found, the appName field is populated with <protocolId>:<lowerPortNumber>
Fields that are not part of the Flow data records but are enriched by the current Telco Network Cloud Manager - Performance solution are as follows:
OUT_IF_ENTITY_ID
IN_IF_ENTITY_ID
OUT_IF_ENABLED
IN_IF_ENABLED
SRC_IP_GROUP
DST_IP_GROUP
Application monitoring
Table 1. NBAR fields (Derived from application name options template)
22 IBM Telco Network Cloud Manager - Performance 1.4.5

Normalized field name V9 field name IPFIX field name
Normalized field name V9 field name IPFIX field name
applicationDescription 94 (APPLICATION DESCRIPTION) 94 (applicationDescription)
applicationID 95 (APPLICATION ID) 95 (applicationId)
applicationName 96 (APPLICATION NAME) 96 (applicationName)
Table 2. NBAR2 fields (Derived from application attributes options template)
Normalized field name V9 field name IPFIX field name
applicationCategoryName 45000 (application category name) 12232 (applicationCategoryName)
applicationSubCategoryName 45001 (application sub category name) 12233 (applicationSubCategoryName)
applicationGroupName 45002 (application group name) 12234 (applicationGroupName)
applicationBusinessRelevance 45012 (application business-relevance) 12244 (applicationBusiness Relevance)
p2p technology 288 (p2p technology) 288 (p2pTechnology)
tunnel technology 289 (tunnel technology) 289 (tunnelTechnology)
encrypted technology 290 (encrypted technology) 290 (encryptedTechnology )
Table 3. ART data fields
Normalized field name V9 field name IPFIX field name Required
maxServerNwkTime 42088 (Server Network Time [max]) 9320 (maxServerNwkTime) You must configure your device for at least one of the fields.
maxClientNwkTime 42085 (Client Network Time [max]) 9317 (maxClientNwkTime)
maxServerRespTime 42075 (Server Reposnse Time [max]) 9307 (maxServerRespTime)
maxTotalRespTime 42078 (Total Response Time [max]) 9310 (maxTotalRespTime)
serverIPv4Address
Or
serverIPv6Address
45005 (serverIpv4Address)
Or
45007 (serverIPv6Address)
12237 (serverIpv4Address)
Or
12239 (serverIPv6Address)
Yes
ApplicationID 95 (APPLICATION ID) 95 (applicationId) Yes
outIfID 14 (OUTPUT_SNMP) 14 (egressInterface) Yes
ipDiffServCodePoint 195 (ipDiffServCodePoint) 195 (ipDiffServCodePoint) Yes
QoS monitoring
Table 4. QoS data fields
Normalized field name V9 field name IPFIX field name Required
policyQoSQueueDrop 42129 (QoS Queue Drop) 9361 (policyQosQueueDrop) Yes
OutIfID 14 (OUTPUT_SNMP) 14 (egressInterface) Yes
policyQoSQueueID 42128 (Queue ID) 9360 (policyQosQueueId) Yes
monitoringInterval
EndMilliSeconds 360 (monitoringInterval
EndMilliSeconds)
360 (monitoringInterval
EndMilliSeconds)
No
Note: If this field is not configured in your device, use the
timestamp from the received packet.
Table 5. classmap options template table fields
Normalized field name V9 field name IPFIX field name
classId 41001 (c3pl class cce-id) 8233 (classId)
className 41002 (c3pl class name) 8234 (className)
classType 41003 (c3pl class type) 8235 (classType)
Table 6. policymap options template table fields
Normalized field name V9 field name IPFIX field name
policyID 41004 (c3pl policy cce-id) 8236 (policyID)
policyName 41005 (c3pl policy name) 8237 (policyName)
policyType 41006 (c3pl policy type ) 8238 (policyType)
Normalized sFlow fields
sFlow is a technology for monitoring traffic in data networks that have switches and routers. sFlow also know as sampled flow used mandatory sampling technology
to collect traffics data and to achieve scalability.
Related information
AVC-Export:Monitoring
IP Flow Information Export (IPFIX) Entities
Normalized sFlow fields
sFlow is a technology for monitoring traffic in data networks that have switches and routers. sFlow also know as sampled flow used mandatory sampling technology to
collect traffics data and to achieve scalability.
sFlow operates by regularly polling interface counters and sampling traffic on a switch or router. This data is forwarded to a dedicated workstation for analysis.
Normalized NetFlow field sFlow field Description
exporterIp sender.address
version version
pktSeqNum flow_sample.pktseqno Flow Sample Header - Sequence Number
IBM Telco Network Cloud Manager - Performance 1.4.5 23

Normalized NetFlow field sFlow field Description
flowRecordType flowrecordtype Flow Record Type
See https://sflow.org/developers/structures.php.
flowSeqNum flow_sample.sequence_number Flow record - Sample Sequence number
sysUptime sysuptime
exportMs timestamp
startMs timestamp
endMs timestamp
protocolId sample_ipv4.protocol flow.rec.dcd_ipProtocol
tcpBits sampled_ipv4.tcp_flags flow.rec.dcd_tcpFlags
rawSrcTos sampled_ipv4.tos flow.rec.dcd_ipTos
srcPort sampled_ipv4.src_port flow.rec.dcd_sport
dstPort sampled_ipv4.dst_port flow.rec.dcd_dport
inIfId flow_sample.input flow.rec.inputport
outIfId flow_sample.output flow.rec.outputport
direction valuebyte(0) valuebyte(0)
inOctets pkt.flow.bytes pkt.flow.bytes
inPackets pkt.flow.frames pkt.flow.frames
nextHopIp extended_router.nexthop flow.rec.nextHop
bgpNextHopIp extended_gateway.nexthop flow.rec.bgpNextHop
bgpSrcAsNum extended_gateway.src_as flow.rec.src_as
bgpDstAsNum extended_gateway.src_peer_as flow.rec.src_peer_as
srcIp sampled_ipv4.src_ip flow.rec.ipsrc
dstIp sampled_ipv4.dst_ip flow.rec.ipdst
srcMask extended_router.src_mask_len flow.rec.srcMask
dstMask extended_router.dst_mask_len flow.rec.dstMask
Related information
sFlow Version 5
DNS Collector
The DNS Collector Service resolves the DNS names for reporting and distributing the interface metadata.
By default, the network requests that support DNS lookup run on port 53 for TCP and UDP protocols.
ICMP Ping Collector
The Internet Control Message Protocol (ICMP) is one of the protocols of the TCP/IP suite. It is a network layer protocol that serves the purpose of error reporting and
network path diagnostic functions. The ICMP echo request and the ICMP echo reply messages are commonly known as ping messages. ICMP Ping is a troubleshooting
tool that is used to test for connectivity between network devices. It is also used to test for network delay and packet loss.
Ping Collector functions
ICMP Ping Collector has these purposes.
To test the network availability to the devices and interfaces in your network.
To test the network latency between your cluster and devices or interfaces.
ICMP Ping Collector works as follows:
Ping profiles are configured from the Ping profiles configuration page. The data is then stored in the Config Store that is in PostgreSQL database in Telco Network
Cloud Manager - Performance system. Ping polling is supported on both IPv4 and IPv6 addresses.
Ping polling is configured by using the following properties:
Polling Interval (sec)
How frequently, the ping request must be initiated. (Min 10 sec, Max 43200 sec)
Timeout (sec)
How long polling process must wait for a response from target device or interface before a new ping packet is sent. (Min 1 sec, Max 10 sec)
Ping count
How many ping attempts on target device or interface before it is given up. (Min 1, Max 10)
To increase the time between each ping attempt, use the ping-collector.ping-wait-interval-seconds parameter in the Common config map. Follow these
steps:
1. Log in to cloud web console of your cluster.
2.
Select tncp from Namespace pane.
3.
Select tncp from Projects pane.
24 IBM Telco Network Cloud Manager - Performance 1.4.5

4.
Expand Config and Storage > Config Maps > common in the pane in the navigation pane.
5. Expand Workloads > Config Maps > common.
6. Add the following property in the common Config Map:
"ping-collector.ping-wait-interval-seconds": "105"
The default value is 1 second.
7. Restart the Ping Collector Service.
Payload Size (bytes)
Size of ICMP packets to be used for the ping request. Default is set to 32 bytes. (Min 32 bytes, Max 65507 bytes)
Based on the ICMP Ping profiles that are configured by using the devices, interfaces, or Resource groups, three metrics are collected by ICMP Ping Collector
Service.
The collected metrics are then stored in the Timeseries database in Telco Network Cloud Manager - Performance system.
Inventory
Service
ICMP Ping
Collector
Service
Config Store
(PostgreSQL)
Timeseries
Service
Network
Metrics
Load Ping
profiles
Devices/
Interfaces/
Resource
groups
REST API Ping
In Telco Network Cloud Manager - Performance, Ping Collector Service is available that can be configured to test the ping status of the devices, their interfaces, and also
based on the Resource groups.
Metrics collected
Ping Status, Response Time, and Packet Loss metrics are collected and stored in the database.
ICMP.Ping.Status, 0 (Failure), 100 (Success)
ICMP.Ping.Response.Time.ms, metric in milliseconds
ICMP.Ping.Packet.Loss.Percent, percentage of packet loss, which is determined by sending multiple ping requests and tallying up the lost packets. (Min 0%,
Max 100%)
Remote ICMP Ping Collector Service
You can set up one or more Ping Collector Services on a remote servers within the geographically separated data centers. Make sure to configure the Ping profiles with the
remoteContext names. For more information, see Setting up Remote Ping Collector.
Ping Collector
Service
Inventory Service
Timeseries Service
Remote Ping
Collector Service
Dashboard
Service
Metrics Metrics
Devices/Interfaces
ICMP Ping profile with
RemoteContext
Schedule job
Cloud Patform
Related tasks
Managing ICMP Ping profiles
IBM Telco Network Cloud Manager - Performance 1.4.5 25

Performance Metric services
Services that are needed for Telco Network Cloud Manager - Performance entity metric data that is collected, aggregated, and monitored.
Analytics Service
Analytics Service aggregates the RAW data that is collected from various collectors. Analytics microservice performs computation of metrics along with resource
type and time series aggregation. The analysis is done on the data that is collected from Telco Network Cloud Manager - Performance system and stored in the time
series database.
Flow Analytics
The Flow Analytics Service computes Top-N aggregations for 1 minute, 30 minutes, and 1-day intervals and also evaluates thresholds on interface usage. It
provides Traffic Ingress and Egress details of every interface level.
Resource Management
Resource Management Service stores all the information about the resource types and their instances that are discovered from the network. The discovery is
performed by SNMP Discovery from SNMP-enabled devices, Flow Collector for Flow-enabled devices, and File Collector for file-based devices. Resource
Management is associated with the Inventory Service in Telco Network Cloud Manager - Performance system.
Threshold
Provides static and baseline thresholds on performance data. A threshold is a value that is compared against the predefined threshold configurations. It is
evaluated to see whether it violates a specific restriction. The primary objective of thresholding is to determine any violations and to generate alerts. When the
value falls outside the acceptable threshold range, the system generates and stores the event condition and forwards it to the Event Management System.
Analytics Service
Analytics Service aggregates the RAW data that is collected from various collectors. Analytics microservice performs computation of metrics along with resource type and
time series aggregation. The analysis is done on the data that is collected from Telco Network Cloud Manager - Performance system and stored in the time series
database.
The Analytics Service supports the following granularity for data aggregations:
1 minute
5 minutes
10 minutes
15 minutes
30 minutes
Hourly on hour boundary
Daily on day boundary
Note: The 1 min and 5 min aggregations are supported only for streaming.
The metric values are aggregated based on an aggregator, which might be sum, min, max, or average. The results are then published to Timeseries Service through web
sockets.
Analytics Service workflow
The Analytics Service workflow is as follows:
The triggered jobs notify all the analytics services to run the job through report event messages and send the results are published to Timeseries and DiamondDB
Services.
Each analytics service has a pool of calculation engine that runs the job request by using the Round-Robin method.
The calculated results outputs to DiamondDB in multiple batches.
Batch Analytics
Stream Analytics
Analytics
Resource
Management Timeseries
KAFKA
PostgreSQL
Types of data analysis
Batch Analytics
26 IBM Telco Network Cloud Manager - Performance 1.4.5

Performance data is collected over time, and then fed into the Analytics Service for processing. Processing of data is done on the stored data. Batch processing is
most often used when the data is large, or when data sources are legacy systems that are not capable of delivering data in streams. It has the following features:
An engine to extract the scheduled analytics jobs, including metric computation, resource aggregation, and time aggregation.
It also handles Busy Hour analytics to calculate busiest hour of day of performance utilization.
Streaming Analytics
Performance data is fed into an analytics system as it arrives and processing is done in real time. By building data streams, you can feed data into the Analytics
Service as soon as it is generated and get near-instant analysis. It has the following features:
Option to scale horizontally (add more nodes) for increased throughput.
Extract-Transform-Load (ETL) engine for real time (low latency) analytics that includes metric computation, and resource aggregation.
Calculating busy hours
Network engineers often use busy hours to determine necessary network capacity. They must provide enough capacity to support traffic during times of peak
demand. Busy hours are also used to generate long-term trends for projecting traffic growth. They often focus on data that is collected during the busiest hours
because that is the time when the system is most stressed and therefore most likely to behave abnormally. The analysis of the abnormalities is important because
the busy hour is the time when the greatest number of customers use the system, and therefore, experience the problems that arise.
Busy hours are calculated and updated for a defined period, and stored in the database. Using stored busy hours is the most efficient way to run reports. Busy hour
calculations are complex and involve large amounts of data. Therefore, using stored busy hours can save time and increase the efficiency and speed of the server.
Table 1. Aggregations types supported by the Analytics Service
Analysis type Metric type Aggregation
type Uses
Spatial Only Streaming Analytics performs resource aggregation and complex formula
computation as the data is available. The derived calculation is added as new
metric, S<agg>_metricName.
Sum
Average
Max
Count
Min
Null
SumMin
SumAvg
SumMax
MinSum
MinAvg
MinMax
AvgSum
AvgMin
AvgMax
MaxSum
MaxMin
MaxAvg
MinNull
AvgNull
MaxNull
SumNull
NullSum
NullMin
NullAvg
NullMax
Network level data export that is based on data
granularity. Usage example – Export to external
database for data manipulation.
Temporal only Less than a day – Timeseries/Batch Analytics perform aggregation in real
time based on data granularity.
Daily aggregation - Batch Analytic performs daily aggregation and add the
information as a new metric. For example, t<agg>
_<1day>_metricName.
More than daily, Timeseries performs the aggregation in real time based on
daily aggregated data.
Resource level historical monitoring for
troubleshooting and capacity planning purpose.
Spatial then
temporal
Streaming analytics performs the spatial aggregations, and then Timeseries
performs the temporal aggregations.
Network level overview for daily trend
monitoring and troubleshooting
Temporal then
spatial
Batch Analytics query timeseries for temporal aggregated metrics
Performs resource aggregation.
Adds as new metric. For example,
t<agg>s<agg>_1day _metricName.
Network level overview, with capability to drill
down to resource level historical information.
Note: If you have multiple Analytics Pods and the service YAML file is modified for some reason, stop and start all the instances of the Pod for better load balancing with
the existing jobs, streams, or busy hour definitions.
Related concepts
Kafka
Flow Analytics
The Flow Analytics Service computes Top-N aggregations for 1 minute, 30 minutes, and 1-day intervals and also evaluates thresholds on interface usage. It provides
Traffic Ingress and Egress details of every interface level.
The Flow Analytics Service is also responsible for aggregation processes. It refines the raw data, filters the results, and aggregates the KPI values. The values are
aggregated by SUM, and the results are then stored in Telco Network Cloud Manager - Performance database.
Flow Analytics Service aggregates the data every 1 minute, 30 minutes, and 1-day intervals. For 1-minute aggregation, it is distributed based on record segmentation and
the aggregation is based on SUM of RAW data. For 30 minutes and 1-day aggregation, it is distributed based on the aggregation type. The aggregation for 30 minutes is
based on SUM of 1-minute data and for daily aggregation is based on SUM of 30-minutes data.
The Flow Analytics Service also triggers the IP to Domain Name, and Domain Name to IP resolution to DNS service.
Flow Analytics Service provides these basic functions:
Categorizes, aggregates, and ranks the data that is collected by the Flow Collector Service.
Built-in aggregation definitions
This section details the built-in aggregation types and their grouping keys. Based on these aggregations the data for the Top Talker views from the Traffic Details
dashboard is populated. These aggregations are user configurable.
IBM Telco Network Cloud Manager - Performance 1.4.5 27

Built-in aggregation definitions
This section details the built-in aggregation types and their grouping keys. Based on these aggregations the data for the Top Talker views from the Traffic Details
dashboard is populated. These aggregations are user configurable.
Table 1. Flow aggregations
Aggregation name Grouping keys
Top Applications IF_ID + APP_NAME
Top Applications with Source ToS IF_ID + APP_NAME+SRC_TOS
Top Destination Autonomous System IF_ID+BGP_DST_AS_NUM
Top Source Autonomous System IF_ID+BGP_SRC_AS_NUM
Top Autonomous System Conversations IF_ID+BGP_SRC_AS_NUM+BGP_DST_AS_NUM
Top Destinations IF_ID+DST_IP
Top Destinations with Application IF_ID+DST_IP+APP_NAME
Top Destination IP Groups IF_ID+DST_IP_GROUP
Top Destination IP Groups with Application IF_ID+DST_IP_GROUP+APP_NAME
Top Destination IP Groups with Protocol IF_ID+DST_IP_GROUP+PROTOCOL_ID
Top Destination IP Groups with Source ToS IF_ID+DST_IP_GROUP+SRC_TOS
Top Conversations IF_ID+SRC_IP+DST_IP
Top Conversations with Application IF_ID+SRC_IP+DST_IP+APP_NAME
Top Conversations with ToS IF_ID+SRC_IP+DST_IP+SRC_TOS
Top IP Group Conversations with Application IF_ID +SRC_IP_GROUP+DST_IP_GROUP+APP_NAME
Top IP Group Conversations with Protocol IF_ID +SRC_IP_GROUP+DST_IP_GROUP+PROTOCOL_ID
Top IP Group Conversations with Source ToS IF_ID +SRC_IP_GROUP+DST_IP_GROUP+SRC_TOS
Top QoS Hierarchies with Queue ID IF_ID+POLICY_QOS_CLASSIFICATION_HIERARCHY+POLICY_QOS_QUEUE_ID
Top Protocols IF_ID+PROTOCOL_ID
Top Protocols with Application IF_ID+PROTOCOL_ID+APP_NAME
Top Protocols with Destination IP IF_ID+PROTOCOL_ID+DST_IP
Top Protocols with Source IP IF_ID+PROTOCOL_ID+SRC_IP
Top Protocols with Conversation IF_ID+PROTOCOL_ID+SRC_IP+DST_IP
Top Sources IF_ID+SRC_IP
Top Source with Application IF_ID+SRC_IP+APP_NAME
Top Conversations IF_ID+SRC_IP+DST_IP
Top Conversations with Application IF_ID+SRC_IP+DST_IP+APP_NAME
Top Conversations with ToS IF_ID+SRC_IP+DST_IP+SRC_TOS
Top Source IP Groups IF_ID+SRC_IP_GROUP
Top IP Group Conversations IF_ID+SRC_IP_GROUP+DST_IP_GROUP
Top IP Group Conversations with Application IF_ID+SRC_IP_GROUP+DST_IP_GROUP+APP_NAME
Top IP Group Conversations with Source ToS IF_ID+SRC_IP_GROUP+DST_IP_GROUP+SRC_TOS
Top Source IP Groups with Protocol IF_ID+DST_IP_GROUP+PROTOCOL_ID
Top Source IP Groups with Source ToS IF_ID +SRC_IP_GROUP+SRC_TOS
Top Source ToS IF_ID+SRC_TOS
Related information
Managing Flow aggregations
Resource Management
Resource Management Service stores all the information about the resource types and their instances that are discovered from the network. The discovery is performed
by SNMP Discovery from SNMP-enabled devices, Flow Collector for Flow-enabled devices, and File Collector for file-based devices. Resource Management is associated
with the Inventory Service in Telco Network Cloud Manager - Performance system.
All the discovered Resource types are sent to Resource Management. The following tasks are handled by Resource Management:
Validates if the resource types contain valid properties or not.
Stores the resource types and their relations in Cassandra database for future query.
Stores the history of resources.
Broadcasts the discovered or updated resources to subscribers.
Handles queries on resource types and relations.
All the services that need resource types information either query or subscribe to the Resource Management Service. Any update on the resource types is broadcasted to
the subscribers. This way, the subscribers can respond to the availability of any new resources.
Resource Management stores both physical and logical resources (region and site). The logical resources can be defined through the model files that are configured in
Technology Packs.
A GenericGroup type is added by default to the system whereby you can place resource types in a static group without the need for an associated model.
28 IBM Telco Network Cloud Manager - Performance 1.4.5

Threshold
Provides static and baseline thresholds on performance data. A threshold is a value that is compared against the predefined threshold configurations. It is evaluated to
see whether it violates a specific restriction. The primary objective of thresholding is to determine any violations and to generate alerts. When the value falls outside the
acceptable threshold range, the system generates and stores the event condition and forwards it to the Event Management System.
All the real-time metric data from Timeseries Service is written to a Kafka topic that can be used by Threshold Service. It handles the following operations:
Static threshold at metric, resource, and group level
Can integrate with IBM® Netcool® Operations Insight® Operations Management. When coupled with output from Streaming Analytics, the Telco Network Cloud
Manager - Performance can send real-time alerts of threshold violations to Tivoli® Netcool/OMNIbus.
Supported types of thresholds
Telco Network Cloud Manager - Performance supports burst or static thresholds. It does threshold evaluations on the performance metric data by using period-based data
aggregations against the threshold definitions.
Selected performance metrics can be exported from the time series database to a preconfigured Kafka topic that is compatible with IBM Operations Analytics - Predictive
Insights.
Thresholds define the status of an attribute based on specific conditions. You can enable threshold evaluation on a selected Resource type. A threshold is violated when
the result of the collected metric value is evaluated as exceeding (>=) or dropping (<=) to a specified configured threshold level. The actual evaluation and disposition
depends on the threshold type, >=, <=, or Band.
Static thresholding is user-defined static values at specific intervals, which analyze data and generate events when a violation occurs for anomaly detection. Static
thresholds are of two types, burst and period.
You can define a static threshold for a metric with Threshold Definition configuration page. If these static thresholds are violated for any performance measure on a device
or interface, events are generated at a predefined severity level.
Telco Network Cloud Manager - Performance provides the following types of thresholds:
Burst
Ignores the natural network bursts by evaluating how long in a row the violations occurred per resource. Burst thresholds can be set and reset multiple times.
Period
Involves the concept of accumulated duration for which the threshold is violated. This duration is accumulated per Resource type until the end of the SLA period.
The threshold is violated as soon as a data spike accumulated duration by period exceeds a certain duration of time. If the period thresholds are violated, they are
not reset until the end of the period.
Baseline
Provides a view into resource behavior outside the normal range. It uses a profiled deviation function to compare the current daily behavior with the baseline as
data flows throughout the system (in real time). What is normal is defined and what is not normal is flagged.
Note: Baseline thresholds are available through integration with Watson™ AIOps Metric Manager.
Baseline thresholds are enabled in Technology Packs as follows:
name=CPU.Utilization.Percent
description="The percentage of CPU utilization"
units=Percent
aliases=[cpuBusyPoll,JuniperERX CPU Utilization,JuniperChassis CPU Utilization avg last 5min,Huawei CPU
Utilization,CiscoDevice System CPU Utilization CPM]
properties={
resource-types="cpu,card,device",
baselineEnabled="true"
}
Note: Some metrics that are available in some Technology Packs are enabled with baseline threshold and have the property baselineEnabled="true". For more
information, see List of technology packs with baseline thresholds enabled for some metrics..
Types of violations
Violations can be exported to IBM Tivoli Netcool/OMNIbus, Kafka, and SNMP Trap.
The list of possible values for alarm severity.
Critical
Major
Minor
Warning
System configuration pages
The following configuration pages are available in Telco Network Cloud Manager - Performance or defining and viewing threshold violation alerts:
Configuring threshold definitions
You can define threshold profiles for selected metrics.
Configuring alarm rules
You can define the targets and target groups for routing the alarms.
Configuring time schedules
IBM Telco Network Cloud Manager - Performance 1.4.5 29

You can define different time schedules to enable or disable threshold monitoring. You have the flexibility to schedule the alarms for the selected metrics at peak
hours, off-peak hours, weekdays, and weekend or at a specific hour in a specific day of a specific month.
Related concepts
Kafka
Related tasks
Managing thresholds
Managing Alarm rules
Managing time schedules
Data storage services
Data from different sources is stored in these services.
Typically, four different databases are available in Telco Network Cloud Manager - Performance system. Data is collected, processed, and stored for real time and historic
availability.
Important: On Red Hat OpenShift® Container Platform, all file-based storage classes are supported but it is validated on csi-cephfs extensively. Whereas on Kubernetes
cloud platform NFS is also supported. Both NFS and csi-cephfs are validated extensively.
Data stores in Telco Network Cloud Manager - Performance
Telco Network Cloud Manager - Performance consists of three storage services.
Cassandra
Apache Cassandra is an open source distributed storage system. It is highly scalable and partitioned row store. It is a wide column store and NoSQL database
management system that is designed to handle large amounts of data across many servers with low latency.
DiamondDB
Telco Network Cloud Manager - Performance uses Apache CarbonData for long-term storage of processed Flow metrics that it collects from the Flow Technology
Pack. In Telco Network Cloud Manager - Performance, Apache CarbonData is bundled in the microservice DiamondDB and the CarbonData is integrated with Spark.
Network File System (NFS)
Telco Network Cloud Manager - Performance uses NFS-based file storage as the default Persistent Volume on Kubernetes environment only. The NFS is a
client/server application to view, store, and update files on a remote computer as though they were on your own computer. NFS uses Remote Procedure Calls
(RPCs) to route requests between clients and servers. The NFS protocol is one of several distributed file system standards for network-attached storage (NAS).
Network File System enables the storage and retrieval of data from multiple disks and directories across a shared network.
Postgres
PostgreSQL is an open source, object-relational database. It is extensible, ACID compliant, and supports high availability and backup and restore functions.
Timeseries
Timeseries Service has an internal database that stores all the metric data that is collected from collector services. Timeseries Service supports dynamic
aggregations during query time.
Data stores in Telco Network Cloud Manager - Performance
Telco Network Cloud Manager - Performance consists of three storage services.
Resource Management (Inventory Service) that consists of the network object data in Cassandra database.
Timeseries Service that consists of the selected resource measurements in DiamondDB data store configuration.
Note: DiamondDB is a fast distributed scalable time series database that is written on CarbonData.
PostgreSQL Service that consists of all Telco Network Cloud Manager - Performance system configuration data.
The following table lists the types of data that is stored in the database tables:
Table 1. Database schema
Data Storage Type of data
Resource data The Inventory service stores the network resources that are discovered.
It contains:
Network resources name and its type.
Network resources properties
For example, cell_power, region_id and more.
Resource relations
Provides resource information to other microservices through REST or WebSocket subscription.
Timeseries data Time series measurements are collected from network equipment.
Storage of performance metrics that are collected from all the collector services in the system. These metrics are provided to other microservices
through REST, or stream by using Kafka or WebSocket.
Behind the hood, it optimizes data for long-term storage.
Configuration
data
Telco Network Cloud Manager - Performance system configuration data is stored.
30 IBM Telco Network Cloud Manager - Performance 1.4.5

Data flow to and from data sources in Telco Network Cloud Manager - Performance.
Resource and configuration data flow to Cassandra and PostgreSQL databases in Telco Network Cloud Manager - Performance.
IBM Telco Network Cloud Manager - Performance 1.4.5 31

Data flow from configuration pages in Telco Network Cloud Manager - Performance Dashboards.
Cassandra
Apache Cassandra is an open source distributed storage system. It is highly scalable and partitioned row store. It is a wide column store and NoSQL database
management system that is designed to handle large amounts of data across many servers with low latency.
Cassandra database is provided as a container with a stateful set in Telco Network Cloud Manager - Performance. All the resource data that is collected by the following
services is and from the installed Technology Packs is sent to the Resource Management Service, which stores all this data to Cassandra database:
SNMP Discovery Service
File Collector
The Analytics Service uses the resource data from Resource Management Service.
DiamondDB
Telco Network Cloud Manager - Performance uses Apache CarbonData for long-term storage of processed Flow metrics that it collects from the Flow Technology Pack. In
Telco Network Cloud Manager - Performance, Apache CarbonData is bundled in the microservice DiamondDB and the CarbonData is integrated with Spark.
Apache CarbonData is a new big data file format for faster interactive query by using advanced columnar storage, index, compression, and encoding techniques to improve
computing efficiency. It helps in speeding up queries by an order of magnitude faster over Peta Bytes of data.
The following network performance data is stored in CarbonData database:
Flow metrics
The DiamondDB-read Service is introduced to handle all the queries to the database. Whereas the DiamondDB Service handles the ingestion of data into the database.
The DiamondDB-export Service is introduced to handle the bulk queries especially from the Batch Analytics Service. It does not impact the query performance of the
Dashboard Service.
Related information
Apache CarbonData Documentation
Network File System (NFS)
32 IBM Telco Network Cloud Manager - Performance 1.4.5

Telco Network Cloud Manager - Performance uses NFS-based file storage as the default Persistent Volume on Kubernetes environment only. The NFS is a client/server
application to view, store, and update files on a remote computer as though they were on your own computer. NFS uses Remote Procedure Calls (RPCs) to route requests
between clients and servers. The NFS protocol is one of several distributed file system standards for network-attached storage (NAS). Network File System enables the
storage and retrieval of data from multiple disks and directories across a shared network.
You can increase the storage capacity or adjust the system performance in real time to quickly adjust to changes in workload demands.
NFS is available as a service in Telco Network Cloud Manager - Performance system. It uses NFS protocol for data transfer from different data sources in the system and
stores it in NFS Service. You can monitor, start, and stop NFS service on all or individual nodes in Telco Network Cloud Manager - Performance cluster.
Stopping the NFS service is considered as a maintenance action and it is recommended to do this action if it is instructed by the IBM® support. The stopped NFS service
resumes along with the node restart. That is, the stopped state does not persist a node restart.
Postgres
PostgreSQL is an open source, object-relational database. It is extensible, ACID compliant, and supports high availability and backup and restore functions.
Telco Network Cloud Manager - Performance uses PostgreSQL database for storing the data from system configuration pages. It also stores all the data that is related to
the dashboards that are available in the system.
The PostgreSQL database is available as a service in Telco Network Cloud Manager - Performance.
The postgres-th Service is introduced, which is an instance of postgres Service that is added to the deployment architecture to enable quicker execution of update
queries on the state table. The state table is used by the Threshold Service to maintain the state of thresholds violated by the metrics.
Geographic redundancy mechanism can be implemented on the PostgreSQL database that stored all the configuration data except the Threshold data.
Timeseries
Timeseries Service has an internal database that stores all the metric data that is collected from collector services. Timeseries Service supports dynamic aggregations
during query time.
The performance metric data from the following Telco Network Cloud Manager - Performance services is pushed to Timeseries Service through a web socket and the data
is loaded into the database:
File Collector
SNMP Collector
The data to and from Timeseries Service is handled from the following three channels:
Kafka
Web socket
REST API
Typically, the timeseries database consists of four components; metric name, timestamp, value, and a tag, which is the resource name. The metric is saved by the generic
metric name.
With the introduction of new distributed architecture in the Timeseries Service, it can store the data in itself without the dependency on DiamondDB Service. If your data is
huge, consider increasing the CPU and memory of the Timeseries Pod, and you can also replicate the Timeseries Pod instances for load balancing.
Data storage in time series database
Database schema that stores the performance metric data that is collected with the help of Timeseries Service. The time series data consists of both performance
raw metrics, aggregated metrics, UDCs, and metric threshold values.
Data storage in time series database
Database schema that stores the performance metric data that is collected with the help of Timeseries Service. The time series data consists of both performance raw
metrics, aggregated metrics, UDCs, and metric threshold values.
Metric types
The following types of metrics are stored in time series database:
Raw metrics
A raw count of some network performance event.
User-Defined Calculations
A mathematical expression based on one or more raw metrics, or other User-Defined Calculations that are available within the Telco Network Cloud Manager -
Performance system. They are also called as complex metrics. You can either create User-Defined Calculations from User-Defined Calculations configuration UI or
available in some Technology Packs. See Managing User-defined calculations (UDC).
Analytic metrics
Aggregated metrics that are analyzed from the configured batch jobs, streams, and stored busy hours. These metrics are used in Telco Network Cloud Manager -
Performance Dashboards and system configuration pages.
Streams can be created from Streaming Analytics configuration page or available in some Technology Packs. See Managing streams for metrics.
IBM Telco Network Cloud Manager - Performance 1.4.5 33

Metric origin
Metrics that are stored in Timeseries Service have the origin property to differentiate from where the metric is coming from. The different types of origin based on the
type of metric that are being saved are as follows:
Metrics that come from installed Technology Packs do not have the origin property.
For example,
name=CPU.Utilization.Percent
description="The percentage of CPU utilization"
units=Percent
aliases=[cpuBusyPoll,JuniperERX CPU Utilization,JuniperChassis CPU Utilization avg last 5min,Huawei CPU
Utilization,CiscoDevice System CPU Utilization CPM]
properties={
resource-types="cpu,card,device",
baselineEnabled="true"
}
Note: The CPU-Utilization-Percent.metric is baseline-enabled metric as you can see from the definition.
Metrics that are configured as batch jobs, streams, and busy hours have the origin as Analytic.
For example, for a metric that is configured for batch analytics, tavg_15min_CPU.Utilization.Percent.metric.
name="tavg_15min_CPU.Utilization.Percent"
description="Metric created from Batch Analytics"
units=""
aliases=[]
properties={
origin="Analytic"
aggregator="Average"
resource-types="device"
}
For example, for a metric that is configured for streaming analytics, ssum_Region.Huawei_2G_Call_Drop_Rate_Percent.metric.
name="ssum_Region.Huawei_2G_Call_Drop_Rate_Percent"
description="Metric created from Streaming Analytics"
units=""
aliases=[]
properties={
"resource-types":"region",
"aggregator":"Sum",
"origin":"Analytic"
}
For example, for a metric that is configured for Busy Hour, sbhd_min_day_nUtranCell.N.CA.SCell.Add.Att.metric.
name="sbhd_min_day_nUtranCell.N.CA.SCell.Add.Att"
description="Busy Hour Determiner"
units=""
aliases=[]
properties":{
"resource-types":"nUtranCell",
"aggregator":"min",
"origin":"Analytic"
}
Metrics that are configured as UDCs, which can also be called as complex metrics have the origin property as UserDefined.
For example, for a metric that is configured as UDC, Region.Huawei_3G_Call_Drop_Rate_CS_Percent.metric.
name="Region.Huawei_3G_Call_Drop_Rate_CS_Percent"
description="Call drop rate"
units="percent"
aliases=[]
properties={
origin="UserDefined"
aggregator="Sum"
resource-types="region"
}
Technology pack content
Telco Network Cloud Manager - Performance provides an extensive library of off-the-shelf network interfaces that are called technology packs, which can be quickly
deployed, extended, and modified to manage different vendors and technologies on a single system. Technology packs are independent modules that provide technology-
specific data models, vendor-specific metrics and key performance indicators (KPIs), and reports and graphs.
A technology pack is an application package that is designed for use with Telco Network Cloud Manager - Performance. A technology pack provides technology-related
performance management functions. An example is Global System for Mobile Communications (GSM). A technology pack is deployed on the core application platform. A
technology pack can be configured to present wireless data or wire line data information specific to vendors and technology.
Two types of technology packs are available in Telco Network Cloud Manager - Performance:
SNMP-based technology packs
SNMP Technology packs are a collection of MIBs, formulas, and other integration tools. Each technology pack is designed to collect and report on a specific vendor
or technology. Performance metrics and inventory data are collected directly from SNMP-enabled devices with the help of vendor-specific MIB files. Only some
34 IBM Telco Network Cloud Manager - Performance 1.4.5

wireline Technology Packs are SNMP-based ones.
File-based technology packs
Performance metrics are collected in files from the EMS. Apache NiFi parses, converts the files into Avro records, and writes to Kafka. The File Collector Service in
Telco Network Cloud Manager - Performance reads the data from the Kafka topic, runs metric and discovery formulas, and writes the data to Inventory Service and
Timeseries Services. All the Wireless Technology Packs and some Wireline Technology Packs that contain data in file format are file-based ones.
Flow technology pack
Flow Collector collects the metrics from the Flow records from exporters. It parses, validates, and normalizes the various Flow record formats into a common
format. It enriches and filters Interfaces based on enable or disable flag set per network interface.
For typical content in a Technology Pack, see Installing Technology Packs.
Designer tool
Telco Network Cloud Manager - Performance comes with Designer tool, which is a simple browser-based tool to create highly functional business dashboards from various
data sources. You can create complex, dynamic, and interactive visual representations from various data sources and display historical and real-time data. You don’t need
any programming or SQL query language skills to use it.
Administrator
Dashboard Users
Dashboard Developers
Publish Dashboard
or Widget
Engine
Dashboard Designer
JSON File
Connector
The components in Designer tool are as follows:
Dashboard Designer
It’s a web-based dashboard builder software with drag-and-drop interface that helps to create and share live dashboards with historical and real-time data. You
can convert your business-critical data into interactive dashboards, and then customize them. You can create dashboards for visual analysis that can contain large
amounts of data that is displayed in a meaningful way easily and quickly.
Create different types of widgets and dashboards with a wide range of customizations.
Connect to multiple data sources and query the enterprise-critical data.
Publish dashboards and make them available to users based on their User Groups.
Engine
Data visualization component. Engine is deployed as a web application on WebSphere® Application Server Liberty.
All the dashboards that are created from Dashboard Designer are published on the Engine. You can access and manage the Engine separately.
Connector
Data query component that can connect to your data anywhere and automatically generate request queries to fetch data from selected data sources. It then
retrieves the data for visual representations in the widgets. The widgets in the dashboard must be connected to the data source to display data on it.
Deployment modes
Learn about the deployment architecture of Telco Network Cloud Manager - Performance on supported container platforms. It can be installed on Red Hat® Linux® cluster
in a private cloud environment.
Telco Network Cloud Manager - Performance cluster is made up of a set of machines that serve as nodes within the cluster. You can configure master and worker nodes,
where the OpenShift® Container Platform Pods and containers, which are known as workloads, are deployed. Each Pod contains one or more containers.
Telco Network Cloud Manager - Performance deployment is supported on the following cloud platforms:
Red Hat OpenShift Container Platform
IBM Telco Network Cloud Manager - Performance 1.4.5 35

You can install Telco Network Cloud Manager - Performance on a container platform, by using OpenShift. All the microservices run within containers, and
communication between these containers is managed and orchestrated by OpenShift.
See Prepare Red Hat OpenShift cluster Telco Network Cloud Manager - Performance.
You can install Telco Network Cloud Manager - Performance on a container platform, by using Kubernetes (K8s) platform. All the microservices run within
containers, and communication between these containers is managed and orchestrated by Native Kubernetes. See Install Telco Network Cloud Manager -
Performance Kubernetes.
Cluster deployment
IBM® Telco Network Cloud Manager - Performance cluster is deployed as containerized applications within pods. The cluster is made up of a set of machines that
serve as nodes within the cluster.
Sizing and dimensioning
The minimum hardware requirements for different types of Telco Network Cloud Manager - Performance cluster deployment.
Cluster deployment
IBM® Telco Network Cloud Manager - Performance cluster is deployed as containerized applications within pods. The cluster is made up of a set of machines that serve as
nodes within the cluster.
Typically, a cluster has one master node and the remaining machines serve as worker nodes, where the pods and containers, which are known as workloads, are deployed.
tncp is the namespace where IBM Telco Network Cloud Manager - Performance services are installed.
Service/Statefulset name POD name Container PVC
analytics-batch analytics-batch-<replica_no> basecamp-analytics-batch keystore-security
sessions-security
logs-analytics-batch
analytics-stream analytics-stream-<replica_no> basecamp-analytics-stream keystore-security
sessions-security
content-analytics
logs-analytics-stream
app apps-<replica_no> basecamp-apps keystore-security
sessions-security
logs-app
cassandra cassandra-<replica_no> cassandra data-cassandra-0
dashboard dashboard-<replica_no> basecamp-dashboard keystore-security
sessions-security
logs-dashboard
diamond-db diamond-db-<replica_no> diamond-db data-diamond-db
logs-diamond-db
diamond-db-export diamond-db-export<replica_no> diamond-db-export data-diamond-db
logs-diamond-db-export
diamond-db-read diamond-db-read_<replica_no> diamond-db-read data-diamond-db
diamond-db-read
dns-collector dns-collector-<replica_no> basecamp-dns-collector keystore-security
sessions-security
logs-dns-collector
file-collector file-collector-<replica_no> basecamp-file-collector content-file-collector
work-file-collector
logs-file-collector
flow_analytics flow_analytics-<replica_no> basecamp-flow-analytics keystore-security
sessions-security
logs-flow-analytics
flow-collector flow-collector-<replica_no> basecamp-flow-collector conf-flow-collector
content-flow-collector
keystore-security
sessions-security
logs-flow-collector
inventory inventory-<replica_no> inventory
elasticsearch
keystore-security
sessions-security
content-inventory
esdata-inventory
logs-inventory
kafka kafka-<replica_no> kafka data-kafka
36 IBM Telco Network Cloud Manager - Performance 1.4.5

Service/Statefulset name POD name Container PVC
nifi nifi-<replica_no> nifi content-nifi
data
spool-nifi
flow-nifi
operator operator-<replica_no> basecamp-operator N/A
Note: This Pod is applicable only for Kubernetes cloud platform.
pack-service pack-service-<replica_no> basecamp-pack-service keystore-security
sessions-security
work-pack
logs
pack-content
ping-collector ping-collector-<replica_no> basecamp-ping-collector keystore-security
logs-ping-collector
postgres postgres-0 postgres
symmetric-ds
data-postgres
pack-content
postgres-th postgres-th-0 postgres-th data-postgres-th
security security-<replica_no> security keystore-security
sessions-security
users-security
sleeping-cell sleeping-cell<replica_no> sleeping-cell keystore-security
sessions-security
logs
snmp-collector snmp-collector-<replica_no> basecamp-snmp-collector content-snmp-collector
logs-snmp-collector
snmp-discovery snmp-discovery-0 basecamp-snmp-discovery keystore-security
sessions-security
content-snmp-discovery
logs-snmp-discovery
threshold threshold-<replica_no> basecamp-threshold keystore-security
sessions-security
conf-threshold
logs-threshold
timeseries timeseries-<replica_no> timeseries content-timeseries
keystore-security
logs-timeseries
data-timeseries
ui ui-<replica_no> basecamp-ui keystore-security
sessions-security
logs-ui
zookeeper zookeeper-0 zookeeper data-zookeeper
log-zookeeper
Note: Your cloud platform distributes the Telco Network Cloud Manager - Performance microservices on all worker nodes in the cluster.
Cluster behavior
Provides the relevance between Telco Network Cloud Manager - Performance microservices and the node behavior in a cluster.
Telco Network Cloud Manager - Performance supports the following types of node behavior.
Cluster singleton
A clustered singleton service (also known as an HA singleton) is a service that is deployed on multiple nodes in a cluster, but is providing its service on only one of
the nodes. The node that is running the singleton service is typically called the oldest node.
Load balancing
Load balancing improves the distribution of workloads across multiple nodes where each of the node serves different set of clients that are mutually exclusive.
Managed load balancing
The difference between Load Balancing with Managed load balancing here is that, node acts as manager node to monitor the load-balancing activities. The manager
node monitors and distributes the workload among the active nodes.
Data replication
A replication strategy determines the nodes where data replicas are placed. The replicas on multiple nodes are stored to ensure reliability and fault tolerance.
Monitoring in each node
A service that is installed on each node in a cluster, where it monitors and provides information on the installed nodes.
Single instance
A service that is installed on a single node in a cluster, which provides its service across all nodes.
The following table lists the service components and their node behavior. Use the following information as guidance to set up your environment.
Services Node behavior
IBM Telco Network Cloud Manager - Performance 1.4.5 37

Services Node behavior
Analytics Stream Load balancing
Analytics Batch Load balancing
Apps Single instance
Cassandra Data replication
Dashboard Load balancing
Diamond DB Data replication
DNS Collecor Cluster singleton
Ping Collector Cluster singleton
File Collector Load balancing
Flow Collector Load balancing
Flow Analytics Load balancing
Inventory Load balancing
Kafka Data replication
NiFi Load balancing
Postgres Cluster singleton
Security Cluster singleton
SNMP Collector Load balancing
SNMP Discovery Cluster singleton
Threshold Data replication
Timeseries Load balancing
UI Load balancing
Zookeeper Cluster singleton
StatefulSets in Telco Network Cloud Manager - Performance
The following StatefulSets are available in Telco Network Cloud Manager - Performance.
StatefulSets in Telco Network Cloud Manager - Performance
The following StatefulSets are available in Telco Network Cloud Manager - Performance.
analytics-batch
analytics-stream
app
cassandra
dashboard
diamond-db
diamond-db-export
diamond-db-read
dns-collector
file-collector
flow-analytics
flow-collector
inventory
kafka
nfs
Only applicable for Kubernetes environment
nifi
operator
Only applicable for Kubernetes environment
ping-collector
postgres
postgres-th
security
sleeping-cell
snmp-collector
snmp-discovery
threshold
timeseries
ui
zookeeper
Sizing and dimensioning
The minimum hardware requirements for different types of Telco Network Cloud Manager - Performance cluster deployment.
Attention: A Full (final) Sizing must be performed by qualified IBM® personnel before any customer hardware is purchased. You can contact IBM Professional Service
Personnel and begin this process. By not adhering to this process, you can incur extra cost and significant delays to the implementation of a fully optimal system.
Dimensioning includes the following steps:
38 IBM Telco Network Cloud Manager - Performance 1.4.5

Prepare a full sizing report for customer.
List the hardware and prerequisite software needed.
List the deployment choices available for customer.
Hardware sizing for a full deployment of Telco Network Cloud Manager - Performance on
private cloud
For more information, see Hardware requirements.
Important: For sizing and dimensioning of production environment, contact IBM Support Personnel to customize according to your requirements.
Accessibility
Accessibility features assist users who have a disability, such as restricted mobility or limited vision, to use information technology content successfully.
Accessibility features
Telco Network Cloud Manager - Performance application partially conforms to accessibility features.
The web-based interface for system administration and Telco Network Cloud Manager - Performance Dashboards, and Designer tool in Telco Network Cloud Manager -
Performance V1.4.5 include the following major accessibility features:
Enables users to use assistive technologies, such as screen-reader software and digital speech synthesizer, to hear what is displayed on the screen. Consult the
product documentation of the assistive technology for details on using those technologies with this product.
Enables users to operate specific or equivalent features by using only the keyboard.
The Telco Network Cloud Manager - Performance uses the latest W3C Standard, WAI-ARIA 1.0 (US Section 508, and Web Content Accessibility Guidelines (WCAG) 2.0
(http://www.w3.org/TR/WCAG20/). To take advantage of accessibility features, use the latest release of your screen reader in combination with Mozilla Firefox ESR
browser version 65 or later. See Software requirements.
The Telco Network Cloud Manager - Performance product documentation in IBM® Documentation is enabled for accessibility. The accessibility features of IBM
Documentation are described at IBM Accessibility Requirements.
Interface information
The Telco Network Cloud Manager - Performance web user interface and product documentation on IBM Knowledge Center rely on cascading stylesheets to render
content properly and to provide a usable experience.
IBM Knowledge Center provides an equivalent way for low-vision users to use their custom display settings, including high-contrast mode. You can control font size by
using the device or browser settings.
The Telco Network Cloud Manager - Performance web user interface includes WAI-ARIA navigational landmarks that you can use to quickly navigate to functional areas in
the application.
The Telco Network Cloud Manager - Performance user interface does not have content that flashes 2 - 55 times per second.
Related accessibility information
In addition to standard IBM help desk and support websites, IBM has established a TTY telephone service for use by deaf or hard of hearing customers to access sales
and support services:
TTY service 800-IBM-3383 (800-426-3383) (within North America)
IBM and accessibility
For more information about the IBM commitment to accessibility, see IBM Accessibility.
Related information
Accessibility in Jazz for Service Management
System requirements
Complete set of requirements for Telco Network Cloud Manager - Performance.
For requirements of other integrated products, see the related product documentation.
Hardware requirements
Hardware specifications vary according to your cluster size and server topology that you want to use.
Software requirements
The supported operating systems and other software that are needed to set up the Telco Network Cloud Manager - Performance as a OpenShift® Container Platform
cluster.
IBM Telco Network Cloud Manager - Performance 1.4.5 39

Storage requirements
The Telco Network Cloud Manager - Performance services use persistent storage. The services have different capacity requirements, persistent volume claims, and
access modes.
Port requirements for a typical installation
Before you install Telco Network Cloud Manager - Performance software, open the ports in this table to avoid any conflicts that might exist in your system.
Hardware requirements
Hardware specifications vary according to your cluster size and server topology that you want to use.
The following are the minimum hardware requirements for a Telco Network Cloud Manager - Performance Demo, Proof of concept (POC), or trial system.
Attention: For sizing and dimensioning of production environment, contact IBM® Support to customize according to your requirements.
Nodes Quantity Spec per node Total vCPU Total Memory (GB) Total hard disk (GB)
Master node 1 vCPU = 4
RAM = 16 GB
HDD = 120 GB
4 16 120
Worker nodes 3 vCPU = 4
RAM = 16 GB
HDD = 120 GB
12 48 360
Total 4 16 64 480
These requirements are calculated without the centralized logging. If you follow centralized logging, refer to the following link for hardware requirements: Kubernetes
Cluster Hardware Recommendations
Note: The smallest OpenShift® Container Platform cluster requires the following hosts:
One temporary bootstrap machine
The cluster requires the bootstrap machine to deploy the OpenShift Container Platform cluster on the three control plane machines. You can remove the bootstrap
machine after you install the cluster. Installation of the cluster begins with the creation of a bootstrap node. This node is needed only during the start phase of
OpenShift Container Platform cluster installation. When the initial minimum cluster with one master node and at least three worker nodes is operational, you can
redeploy the bootstrap node as a worker node.
Three control plane or master nodes
At least three compute machines, which are also known as worker nodes.
Nodes Quantity Spec per node Total vCPU Total Memory (GB) Total hard disk (GB)
Bootstrap node 1 vCPU = 4
RAM = 16 GB
HDD = 120 GB
4 16 120
Master node 3 vCPU = 4
RAM = 16 GB
HDD = 120 GB
12 48 360
Worker nodes 3 vCPU = 4
RAM = 16 GB
HDD = 120 GB
12 48 360
Total 7 26 112 840
If you have the minimum hardware requirements on OpenShift Container Platform or native Kubernetes cloud platform, you can store the metric records as specified in
the table.
Features Value (records per hour)
SNMP collection 30 million
NiFi collection 190 million
File collection (wireline and wireless, or combination) 100 million
Batch Analytics queries 4 million
Streaming Analytics queries 2 million
Related information
OpenShift Container Platform - Machine requirements for a cluster with user-provisioned infrastructure
Software requirements
The supported operating systems and other software that are needed to set up the Telco Network Cloud Manager - Performance as a OpenShift® Container Platform
cluster.
40 IBM Telco Network Cloud Manager - Performance 1.4.5

Software requirements for Telco Network Cloud Manager - Performance.
Table 1. Supported Operating System and platforms
Component Name Version
Cloud platform
Kubernetes (K8s)
1.24
Red Hat® OpenShift
Container Platform
4.9, 4.10, 4.11, 4.12, 4.14
Operating
System
7.6 64-bit
Note: Make sure that the nfs-utils package is installed on all nodes in your Kubernetes cloud platform.
Red Hat Enterprise
Linux® CoreOS
(RHCOS)
For all master nodes, use RHCOS.
For worker nodes, use any of the following operating systems based on the version of OpenShift Container Platform.
For OpenShift Container Platform 4.9
Red Hat Enterprise Linux CoreOS (RHCOS) 4.9
Red Hat Enterprise Linux (RHEL) 8.4
For OpenShift Container Platform 4.10
Red Hat Enterprise Linux CoreOS (RHCOS) 4.10
Red Hat Enterprise Linux (RHEL) 8.4
For OpenShift Container Platform 4.11
Red Hat Enterprise Linux CoreOS (RHCOS) 4.11
Red Hat Enterprise Linux (RHEL) 8.6
Note: IBM® Netcool® Operations Insight® V1.6.7 is tested on OpenShift Container Platform V4.10.
For OpenShift Container Platform 4.12
Red Hat Enterprise Linux CoreOS (RHCOS) 4.12
Red Hat Enterprise Linux (RHEL) 8.6
Note: In OpenShift Container Platform latest versions, you must use RHCOS for all control plane machines, but you can use Red
Hat Enterprise Linux (RHEL) as the operating system for compute machines, which are also known as worker machines.
Note: If needed, create and use sudo user and password.
Table 2. Browser support for desktop and laptop
Web browser Version
Mozilla Firefox Latest version
Mozilla Firefox
ESR
Latest version
Google Chrome 71 or later
Note: Google Chrome is the recommended browser. For scheduling tasks, ensure that Google Chrome web browser version 77.0.3865.90 is
installed.
Edge On Windows 10
Third-party software that is required for Telco Network Cloud Manager - Performance.
Table 3. Required third-party software
Component Version
Apache Cassandra 3.0
Apache CarbonData 1.6.1
PostgreSQL 11
Apache NiFi
Note: Needed for File Collector Service only.
1.10
Apache Kafka 0.11.0.3
Zookeeper 6.2.0.2
Open Java™ x86_64 1.8.0
OpenLDAP
Note: It is used if your Telco Network Cloud Manager - Performance environment is not integrated with Dashboard Application Services Hub or you are
not using an external LDAP server.
1.3.0
Table 4. Integrated IBM products
Component Version
IBM Netcool Operations Insight 1.6.7
Note: Telco Network Cloud Manager - Performance is installed on the same namespace as IBM Netcool Operations Insight.
1.6.6
Note: On-prem version alone is supported.
Related information
IBM Telco Network Cloud Manager - Performance 1.4.5 41

Red Hat Enterprise Linux CoreOS (RHCOS)
RHEL Versions Utilized by RHEL CoreOS and OCP
Storage requirements
The Telco Network Cloud Manager - Performance services use persistent storage. The services have different capacity requirements, persistent volume claims, and access
modes.
Table 1. Stateful Sets and their PVC details
Service PVC Capacity required Supported storage types Storage access mode
analytics-batch keystore-security 1 GiB csi-cephfs ReadWriteMany
sessions-security 2 GiB csi-cephfs ReadWriteMany
logs-analytics-batch-0 10 GiB csi-cephfs ReadWriteMany
analytics-stream keystore-security 1 GiB csi-cephfs ReadWriteMany
sessions-security 2 GiB csi-cephfs ReadWriteMany
content-analytics 1 GiB csi-cephfs ReadWriteMany
logs-analytics-stream-0 10 GiB csi-cephfs ReadWriteMany
app keystore-security 1 GiB csi-cephfs ReadWriteMany
sessions-security 2 GiB csi-cephfs ReadWriteMany
logs-app-0 10 GiB csi-cephfs ReadWriteMany
cassandra data-cassandra-0 10 GiB csi-cephfs ReadWriteMany
dashboard keystore-security 1 GiB csi-cephfs ReadWriteMany
sessions-security 2 GiB csi-cephfs ReadWriteMany
logs-dashboard-0 10 GiB csi-cephfs ReadWriteMany
diamond-db data-diamond-db 10 GiB csi-cephfs ReadWriteMany
logs-diamond-db-0 10 GiB csi-cephfs ReadWriteMany
diamond-db-export data-diamond-db 20 GiB csi-cephfs ReadWriteMany
logs-diamond-db-export-0 10 GiB csi-cephfs ReadWriteMany
diamond-db-read data-diamond-db 20 GiB csi-cephfs ReadWriteMany
logs-diamond-db-read-0 10 GiB csi-cephfs ReadWriteMany
dns-collector keystore-security 1 GiB csi-cephfs ReadWriteMany
sessions-security 2 GiB csi-cephfs ReadWriteMany
logs-dns-collector-0 10 GiB csi-cephfs ReadWriteMany
file-collector content-file-collector 10 GiB csi-cephfs ReadWriteMany
work-file-collector 10 GiB csi-cephfs ReadWriteMany
logs-file-collector-0 10 GiB csi-cephfs ReadWriteMany
flow-analytics keystore-security 1 GiB csi-cephfs ReadWriteMany
sessions-security 2 GiB csi-cephfs ReadWriteMany
logs-flow-analytics-0 10 GiB csi-cephfs ReadWriteMany
flow-collector keystore-security 1 GiB csi-cephfs ReadWriteMany
sessions-security 2 GiB csi-cephfs ReadWriteMany
conf-flow-collector 10 GiB csi-cephfs ReadWriteMany
content-flow-collector 10 GiB csi-cephfs ReadWriteMany
logs-flow-collector-0 10 GiB csi-cephfs ReadWriteMany
inventory content-inventory 10 GiB csi-cephfs ReadWriteMany
keystore-security 1 GiB csi-cephfs ReadWriteMany
sessions-security 2 GiB csi-cephfs ReadWriteMany
logs-inventory-0 10 GiB csi-cephfs ReadWriteMany
solrdata-inventory-0 10 GiB csi-cephfs ReadWriteMany
kafka data-kafka-0 20 GiB csi-cephfs ReadWriteMany
nifi content-nifi 10 GiB csi-cephfs ReadWriteMany
spool-nifi 10 GiB csi-cephfs ReadWriteMany
data-nifi-0 10 GiB csi-cephfs ReadWriteMany
flow-nifi-0 10 GiB csi-cephfs ReadWriteMany
pack-service keystore-security 1 GiB csi-cephfs ReadWriteMany
sessions-security 2 GiB csi-cephfs ReadWriteMany
work-pack 5GiB csi-cephfs ReadWriteMany
log-pack-service-0 10 GiB csi-cephfs ReadWriteMany
pack-content 2 GiB csi-cephfs ReadWriteMany
ping-collector keystore-security 1 GiB csi-cephfs ReadWriteMany
logs-ping-collector-0 10 GiB csi-cephfs ReadWriteMany
postgres pack-content 2 GiB csi-cephfs ReadWriteMany
data-postgres-0 10 GiB csi-cephfs ReadWriteMany
postgres-th data-postgres-th-0 10 GiB csi-cephfs ReadWriteMany
security users-security 2 GiB csi-cephfs ReadWriteMany
keystore-security 1 GiB csi-cephfs ReadWriteMany
sessions-security 2 GiB csi-cephfs ReadWriteMany
42 IBM Telco Network Cloud Manager - Performance 1.4.5

Service PVC Capacity required Supported storage types Storage access mode
sleeping-cell keystore-security 1 GiB
sessions-security 2 GiB
logs-sleeping-cell-0 10 GiB
snmp-collector content-snmp-collector 10 GiB csi-cephfs ReadWriteMany
logs-snmp-collector-0 10 GiB csi-cephfs ReadWriteMany
snmp-discovery content-snmp-discovery 10 GiB csi-cephfs ReadWriteMany
keystore-security 1 GiB csi-cephfs ReadWriteMany
sessions-security 2 GiB csi-cephfs ReadWriteMany
logs-snmp-discovery-0 10 GiB csi-cephfs ReadWriteMany
threshold keystore-security 1 GiB csi-cephfs ReadWriteMany
sessions-security 2 GiB csi-cephfs ReadWriteMany
logs-threshold-0 10 GiB csi-cephfs ReadWriteMany
timeseries content-timeseries 10 GiB csi-cephfs ReadWriteMany
keystore-security 1 GiB csi-cephfs ReadWriteMany
data-timeseries-0 10 GiB csi-cephfs ReadWriteMany
logs-timeseries-0 10 GiB csi-cephfs ReadWriteMany
backup-time series-0 10 GiB csi-cephfs ReadWriteOnce
ui keystore-security 1 GiB csi-cephfs ReadWriteMany
sessions-security 2 GiB csi-cephfs ReadWriteMany
logs-ui-0 10 GiB csi-cephfs ReadWriteMany
zookeeper data-zookeeper-0 10 GiB csi-cephfs ReadWriteMany
log-zookeeper-0 10 GiB csi-cephfs ReadWriteMany
solr
Note: Telco Network Cloud Manager - Performance that is deployed on Kubernetes cloud platform supports NFS storage type along with csi-cephfs.
Related information
Telco Network Cloud Manager - Performance cluster deployment
Telco Network Cloud Manager - Performance stateful services
Port requirements for a typical installation
Before you install Telco Network Cloud Manager - Performance software, open the ports in this table to avoid any conflicts that might exist in your system.
List of default ports that must be available for installation and configuration of Telco Network Cloud Manager - Performance. You can get the port numbers for OpenShift®
Container Platform Services by using the following command:
oc get services -o wide -n tncp
Or
oc get services -o wide -n tncp
NAME TYPE CLUSTER-IP EXTERNAL-IP PORT(S) AGE SELECTOR
analytics-batch ClusterIP 172.30.181.231 <none> 30028/TCP,30029/TCP 38h
service=analytics-batch
analytics-stream ClusterIP 172.30.251.70 <none> 30030/TCP,30031/TCP 38h
service=analytics-stream
analytics-stream-direct ClusterIP None <none> 30062/TCP,30063/TCP 38h
service=analytics-stream
app ClusterIP 172.30.126.228 <none> 30037/TCP 38h service=app
cassandra ClusterIP None <none> 9042/TCP,7000/TCP 38h
service=cassandra
dashboard ClusterIP 172.30.150.178 <none> 31080/TCP,31443/TCP 38h
service=dashboard
diamond-db ClusterIP 172.30.56.182 <none> 30010/TCP,30008/TCP 38h service=diamond-
db
diamond-db-cluster ClusterIP None <none> 7110/TCP 38h service=diamond-
db
diamond-db-cluster-export ClusterIP None <none> 8120/TCP 38h service=diamond-
db-export
diamond-db-cluster-read ClusterIP None <none> 8110/TCP 38h service=diamond-
db-read
diamond-db-export ClusterIP 172.30.237.123 <none> 30120/TCP,30118/TCP 38h service=diamond-
db-export
diamond-db-read ClusterIP 172.30.130.65 <none> 30110/TCP,30108/TCP 38h service=diamond-
db-read
dns-collector ClusterIP 172.30.126.125 <none> 30042/TCP,30043/TCP 38h service=dns-
collector
file-collector ClusterIP 172.30.202.151 <none> 30024/TCP 38h service=file-
collector
flow-analytics ClusterIP 172.30.134.194 <none> 30044/TCP,30045/TCP 38h service=flow-
analytics
flow-collector ClusterIP 172.30.238.159 <none> 30040/TCP,30041/TCP 38h service=flow-
collector
flow-collector-external ClusterIP 172.30.209.177 <none> 4381/TCP,4379/UDP 38h service=flow-
collector
inventory ClusterIP 172.30.122.82 <none> 30016/TCP,30017/TCP 38h
service=inventory
kafka ClusterIP 172.30.12.102 <none> 9092/TCP 38h service=kafka
IBM Telco Network Cloud Manager - Performance 1.4.5 43

nifi ClusterIP 172.30.81.73 <none> 30026/TCP 38h service=nifi
opentelemetry ClusterIP 172.30.122.116 <none> 30050/TCP 38h <none>
pack-service ClusterIP 172.30.73.36 <none> 30048/TCP,30049/TCP 38h service=pack-
service
ping-collector ClusterIP 172.30.212.95 <none> 30050/TCP,30051/TCP 38h service=ping-
collector
postgres ClusterIP 172.30.67.129 <none> 5432/TCP,31415/TCP 38h service=postgres
postgres-th ClusterIP 172.30.225.128 <none> 5433/TCP 38h
service=postgres-th
security ClusterIP 172.30.127.250 <none> 389/TCP 38h service=security
sleeping-cell ClusterIP 172.30.127.128 <none> 30053/TCP 38h
service=sleeping-cell
snmp-collector ClusterIP 172.30.131.190 <none> 30034/TCP,30035/TCP 38h service=snmp-
collector
snmp-discovery ClusterIP 172.30.86.67 <none> 30018/TCP,30019/TCP 38h service=snmp-
discovery
solr NodePort 172.30.202.166 <none> 8993:31190/TCP,8983:31830/TCP 38h
service=inventory
threshold ClusterIP 172.30.181.78 <none> 30032/TCP,30033/TCP 38h
service=threshold
timeseries ClusterIP 172.30.66.133 <none> 30014/TCP,30015/TCP 38h
service=timeseries
tncp-sap ClusterIP 172.30.44.215 <none> 30048/TCP,30049/TCP 4d20h service=tncp-sap
ui ClusterIP 172.30.23.83 <none> 30021/TCP 38h service=ui
zookeeper ClusterIP 172.30.91.246 <none> 2181/TCP,2888/TCP,3888/TCP 38h
service=zookeeper
You can see the IP addresses and TCP port numbers of all the services. If you want to see the UDP and SCTP port numbers of all the services, see the YAML file of the Pod.
Steps to access the YAML file from the Stateful Set
1. Log in to the cloud platform web console for your cluster.
2. Make sure you are in tncp project or namespace.
3. From the navigation, click Home > Workloads > Stateful Sets.
4. Click any service and click the Edit resource ( ) icon to see the YAML file.
$ sudo kubectl get services -o wide -n tncp
Due to security requirements, all the services are on ClusterIP. NodePorts are not exposed.
$ sudo kubectl get services -o wide -n tncp
NAME TYPE CLUSTER-IP EXTERNAL-IP PORT(S)
AGE SELECTOR
analytics-batch ClusterIP 10.107.48.3 <none> 30028/TCP,30029/TCP
44h service=analytics-batch
analytics-batch-nodeport NodePort 10.110.102.33 <none> 30028:30028/TCP,30029:30029/TCP
22h service=analytics-batch
analytics-stream ClusterIP 10.108.181.103 <none> 30030/TCP,30031/TCP
44h service=analytics-stream
analytics-stream-direct ClusterIP None <none> 30062/TCP,30063/TCP
44h service=analytics-stream
analytics-stream-nodeport NodePort 10.99.83.47 <none> 30030:30030/TCP,30031:30031/TCP
22h service=analytics-stream
app ClusterIP 10.104.213.8 <none> 30037/TCP
44h service=app
app-nodeport NodePort 10.106.175.15 <none> 30037:30037/TCP
22h service=app
cassandra ClusterIP None <none> 9042/TCP,7000/TCP
44h service=cassandra
cassandra-nodeport ClusterIP None <none> 9042/TCP,7000/TCP
22h service=cassandra
dashboard ClusterIP 10.111.135.142 <none> 31080/TCP,31443/TCP
44h service=dashboard
dashboard-external NodePort 10.101.56.111 <none> 31080:31080/TCP,31443:31443/TCP
44h service=dashboard
diamond-db ClusterIP 10.105.178.69 <none> 30010/TCP,30008/TCP
44h service=diamond-db
diamond-db-cluster ClusterIP None <none> 7110/TCP
44h service=diamond-db
diamond-db-cluster-export ClusterIP None <none> 8120/TCP
44h service=diamond-db-export
diamond-db-cluster-read ClusterIP None <none> 8110/TCP
44h service=diamond-db-read
diamond-db-export ClusterIP 10.99.247.215 <none> 30120/TCP,30118/TCP
44h service=diamond-db-export
diamond-db-nodeport NodePort 10.103.85.58 <none> 30010:30010/TCP,30008:30008/TCP
22h service=diamond-db
diamond-db-read ClusterIP 10.107.145.152 <none> 30110/TCP,30108/TCP
44h service=diamond-db-read
diamond-db-read-nodeport NodePort 10.103.238.8 <none> 30110:30110/TCP,30108:30108/TCP
22h service=diamond-db-read
dns-collector ClusterIP 10.104.180.137 <none> 30042/TCP,30043/TCP
44h service=dns-collector
dns-collector-nodeport NodePort 10.105.49.251 <none> 30042:30042/TCP,30043:30043/TCP
22h service=dns-collector
file-collector ClusterIP 10.104.250.0 <none> 30024/TCP
44h service=file-collector
file-collector-nodeport NodePort 10.107.16.129 <none> 30024:30024/TCP
22h service=file-collector
flow-analytics ClusterIP 10.105.121.191 <none> 30044/TCP,30045/TCP
44h service=flow-analytics
flow-analytics-nodeport NodePort 10.107.41.211 <none> 30044:30044/TCP,30045:30045/TCP
22h service=flow-analytics
44 IBM Telco Network Cloud Manager - Performance 1.4.5

flow-collector ClusterIP 10.96.236.211 <none> 30040/TCP,30041/TCP
44h service=flow-collector
flow-collector-external ClusterIP 10.104.37.49 <none> 4381/TCP,4379/UDP
44h service=flow-collector
flow-collector-external-nodeport NodePort 10.97.88.201 <none> 4381:30038/TCP,4379:30039/UDP
22h service=flow-collector
flow-collector-nodeport NodePort 10.97.248.53 <none> 30040:30040/TCP,30041:30041/TCP
22h service=flow-collector
inventory ClusterIP 10.102.115.198 <none> 30016/TCP,30017/TCP
44h service=inventory
inventory-nodeport NodePort 10.111.55.202 <none> 30016:30016/TCP,30017:30017/TCP
22h service=inventory
kafka ClusterIP 10.109.234.243 <none> 9092/TCP
44h service=kafka
kafka-nodeport NodePort 10.105.186.27 <none> 9092:30006/TCP
22h service=kafka
nfs ClusterIP 10.96.120.48 <none> 2049/TCP,20048/TCP,111/TCP
44h service=nfs
nfs-external NodePort 10.107.48.114 <none> 2049:32049/TCP
44h service=nfs
nifi ClusterIP 10.107.209.242 <none> 30026/TCP
44h service=nifi
nifi-external NodePort 10.96.46.125 <none> 30026:30026/TCP
44h service=nifi
opentelemetry ClusterIP 10.102.209.12 <none> 30050/TCP
44h <none>
operator ClusterIP 10.108.225.73 <none> 30051/TCP
44h service=operator
pack-service ClusterIP 10.100.101.208 <none> 30048/TCP,30049/TCP
44h service=pack-service
ping-collector ClusterIP 10.96.153.253 <none> 30050/TCP,30051/TCP
44h service=ping-collector
postgres ClusterIP 10.102.152.195 <none> 5432/TCP,31415/TCP
44h service=postgres
postgres-nodeport NodePort 10.97.142.217 <none> 5432:30000/TCP
22h service=postgres
postgres-th ClusterIP 10.99.50.17 <none> 5433/TCP
44h service=postgres-th
postgres-th-nodeport NodePort 10.109.168.216 <none> 5433:30001/TCP
22h service=postgres-th
security ClusterIP 10.107.245.75 <none> 389/TCP
44h service=security
security-nodeport NodePort 10.97.60.73 <none> 389:30389/TCP
22h service=security
sleeping-cell ClusterIP 10.108.103.157 <none> 30053/TCP
44h service=sleeping-cell
snmp-collector ClusterIP 10.107.124.230 <none> 30034/TCP,30035/TCP
44h service=snmp-collector
snmp-discovery ClusterIP 10.108.82.134 <none> 30018/TCP,30019/TCP
44h service=snmp-discovery
snmp-discovery-nodeport NodePort 10.97.73.45 <none> 30018:30018/TCP,30019:30019/TCP
22h service=snmp-discovery
solr NodePort 10.111.9.136 <none> 8993:31743/TCP,8983:30498/TCP
44h service=inventory
threshold ClusterIP 10.106.181.214 <none> 30032/TCP,30033/TCP
44h service=threshold
threshold-nodeport NodePort 10.98.14.94 <none> 30032:30032/TCP,30033:30033/TCP
22h service=threshold
timeseries ClusterIP 10.96.183.252 <none> 30014/TCP,30015/TCP
44h service=timeseries
timeseries-nodeport NodePort 10.98.62.43 <none> 30014:30014/TCP,30015:30015/TCP
22h service=timeseries
ui ClusterIP 10.106.57.33 <none> 30021/TCP
44h service=ui
ui-nodeport NodePort 10.98.203.22 <none> 30021:30021/TCP
22h service=ui
zookeeper ClusterIP 10.100.172.166 <none> 2181/TCP,2888/TCP,3888/TCP
44h service=zookeeper
zookeeper-nodeport NodePort 10.105.173.131 <none> 2181:30004/TCP,2888:30056/TCP,3888:31435/TCP
22h service=zookeeper
Internal - port must be open to allow connections inside the cluster.
External - port must be open to allow connections from outside the cluster.
Microservice Service type http/https ports
analytics-batch ClusterIP 30028
30029
analytics-stream ClusterIP 30030
30031
app ClusterIP 30037
cassandra ClusterIP 9042
7000
dashboard ClusterIP 31443
IBM Telco Network Cloud Manager - Performance 1.4.5 45

Microservice Service type http/https ports
diamond-db
diamond-db-cluster
diamond-db-cluster-read
diamond-db-read
ClusterIP 30010
30008
7110
8110
30110
30108
dns-collector ClusterIP 30042
30043
file-collector ClusterIP 30024
flow-analytics ClusterIP 30044
30045
flow-collector ClusterIP 30040
30041
flow-collector-external ClusterIP 4381
4379
inventory ClusterIP 30016
30017
kafka ClusterIP 9092
nifi ClusterIP 30026
operator ClusterIP 30051
pack-service ClusterIP 30048
30049
ping-collector ClusterIP 30050
30051
postgres ClusterIP 5432
31415
postgres-th ClusterIP 5433
security ClusterIP 389
sleeping-cell ClusterIP 30053
snmp-collector ClusterIP 30034
30035
snmp-discovery ClusterIP 30018
30019
threshold ClusterIP 30032
30033
timeseries ClusterIP 30014
30015
ui ClusterIP 30021
zookeeper ClusterIP 2181
2888
3888
Note: The even number ports are HTTP ports and odd number ports are HTTPS ports.
Getting started
Telco Network Cloud Manager - Performance offers different advantages for network operators, users, and administrators.
You can install Telco Network Cloud Manager - Performance on OpenShift® Container Platform or Kubernetes (K8s).
The following table summarizes which scenario to choose based on your installation goals.
Table 1. Goals that determine the scenario
Scenario Goal
46 IBM Telco Network Cloud Manager - Performance 1.4.5

Scenario Goal
Integrated
installation
This scenario presents data from multiple sources in a unified display as single pane of glass.
Integrate with Watson™ AIOps Event Manager component of Watson AIOps so that the threshold violations can be sent for raising alarms and for
launch-in-context to a specific alarm to display the metric in Metric viewer dashboard.
Integrate with Watson AIOps Metric Manager to view the baseline anomaly thresholds from Watson AIOps Metric Manager can be sent to Watson
AIOps Event Manager for predictive analytics.
Dedicated
stand-alone
installation
Display the data from multiple sources in Telco Network Cloud Manager - Performance Engine interface directly without integration with Dashboard
Application Services Hub. Choose this scenario if you are installing Telco Network Cloud Manager - Performance in a clean environment without other
preexisting IBM® solutions.
Types of data in Telco Network Cloud Manager - Performance
Different types of network data that is handled by Telco Network Cloud Manager - Performance.
Handling network performance data
Use this information to understand the end to end processing of different types of performance data that is handled by Telco Network Cloud Manager - Performance
V1.4.5.
Types of data in Telco Network Cloud Manager - Performance
Different types of network data that is handled by Telco Network Cloud Manager - Performance.
Data that is collected, stored, and aggregated by Telco Network Cloud Manager - Performance can be categorized as follows:
NetFlow fields
Standard Flow fields
For more information, see Normalized flow fields.
Application Response Time (ART) fields
For more information, see Normalized flow fields.
Quality of Service (QoS) fields
For more information, see Normalized flow fields.
Entity or performance metric fields
Standard SNMP metrics
Metrics that are collected from the installed SNMP Technology Packs.
IP SLA
IP SLA metrics are collected from Cisco, Huawei, and Juniper devices. Discovery for the IP SLA enabled devices is performed and polling is done by Telco Network
Cloud Manager - Performance and the metrics are stored in the timeseries database.
CBQOS metrics
Class-based QoS metrics are collected from Cisco, Huawei, and Juniper devices. If these metrics are enabled, you can see them on the Metric viewer dashboard.
WiFi metrics
Metrics that are collected from WiFi Controllers. These metrics are rendered on the WiFi overview dashboard.
For more information about WiFi metrics, see WiFi overview dashboard properties.
Wireless network performance metrics
Metrics that are collected from the installed vendor-specific wireless Technology Packs.
Performance metrics from other file-based devices
Metrics that are collected from the installed vendor-specific file-based Technology Packs.
Categorizing the network traffic based on IP grouping
You can form department-wise IP groups and associate them to certain bill plans. The bills can be generated periodically and used for accounting.
Categorizing the network traffic based on IP grouping
You can form department-wise IP groups and associate them to certain bill plans. The bills can be generated periodically and used for accounting.
About this task
IP address grouping is based in the standard Flow fields from the Administration page.
Procedure
1. Configure the IP Grouping from System Configuration settings.
For more information, see Configure Flow IP groups.
After you configure the IP grouping from System Configurations, you can see the related data is populated in Telco Network Cloud Manager - Performance database.
2. Turn on all the aggregations under the IP Grouping area.
For more information, see Configure Flow aggregations.
IBM Telco Network Cloud Manager - Performance 1.4.5 47

Results
You can now see the IP Grouping information is displayed in the NetFlow dashboards.
Handling network performance data
Use this information to understand the end to end processing of different types of performance data that is handled by Telco Network Cloud Manager - Performance
V1.4.5.
Before you begin
Make sure to install the required Technology Packs.
About this task
These processes cover information about configuring the devices for data collection, configuring the Telco Network Cloud Manager - Performance environment to handle
the data, and the data display from various visualizations that are available in Telco Network Cloud Manager - Performance Dashboards.
The following standard SNMP metrics are required:
CPU.Utilization.Percent
Network.Inbound.Discards.Count
Network.Outbound.Discards.Count
Network.Inbound.Utilization.Percent
Network.Outbound.Utilization.Percent
Network.Inbound.Errors.Count
Network.Outbound.Errors.Count
Procedure
Handling standard SNMP metrics.
Configure the SNMP metrics through Network Polling on Telco Network Cloud Manager - Performance system.
The polled metrics are then stored in Telco Network Cloud Manager - Performance database.
Configure the thresholds for anomaly detection for these metrics on Telco Network Cloud Manager - Performance system.
Configure the network discoveries on Telco Network Cloud Manager - Performance system for all the supported IP SLA probe operations.
Categorizing the network based on geographical sites
You can categorize your enterprise network based on different geographical areas by specifying the IP address ranges for each site.
Categorizing the network based on geographical sites
You can categorize your enterprise network based on different geographical areas by specifying the IP address ranges for each site.
About this task
This grouping helps in monitoring the individual group bandwidth usage, usage-based billing, and accounting. You can see the Group filter in most of the NetFlow
dashboards.
Procedure
Configure IP grouping from Administration pages on the web portal.
For more information, see Configure sites.
After you configure the IP grouping from Administration pages, you can see the related data is populated in Telco Network Cloud Manager - Performance database.
Installing
Use this information to install IBM® Telco Network Cloud Manager - Performance, version 1.4.5.
About this task
Step-by-step instructions to install Telco Network Cloud Manager - Performance on all the nodes in your cluster.
Installation scenarios
IBM Telco Network Cloud Manager - Performance can be installed on both OpenShift® Container Platform and Kubernetes platform. Instructions are given
separately for each cloud platform.
48 IBM Telco Network Cloud Manager - Performance 1.4.5

Installing Telco Network Cloud Manager - Performance on OpenShift Container Platform
The installation information contains the installation prerequisites, instructions for preparing to install, installation, and uninstallation of IBM Telco Network Cloud
Manager - Performance, version 1.4.5 on OpenShift Container Platform.
Installing Telco Network Cloud Manager - Performance on Kubernetes environment
The installation information contains the installation prerequisites, instructions for preparing to install, installation, and uninstallation of IBM Telco Network Cloud
Manager - Performance, version 1.4.5 on Native Kubernetes environment.
Installation scenarios
IBM® Telco Network Cloud Manager - Performance can be installed on both OpenShift® Container Platform and Kubernetes platform. Instructions are given separately for
each cloud platform.
Your cluster administrator and project administrator can work together to prepare the cluster and install the Telco Network Cloud Manager - Performance.
Installation scenarios
You have the following scenarios:
Stand-alone install Integrated install
Internet access?
Install script
Offline install
Install with OLM
OCP Kubernetes
Installation scenarios
Yes No Yes
No
Internet access?
Integrate with Watson AIOps?
Yes
No
Stand-alone install Integrated install
Yes
No
Offline install
Integrate with NOI Onprem
Important: On OpenShift Container Platform environment, the cloud version of Watson™ AIOps is integrated. Whereas on the Kubernetes environment, the on-premises
version of Netcool® Operations Insight® is integrated.
Installing on OpenShift Container Platform
Installing with the Red Hat® OpenShift Operator Lifecycle Manager (OLM).
Installing in an offline environment (airgap)
Installing on Kubernetes
Installing with the downloaded eImage and with the help of installation scripts.
Installing in an offline environment (airgap)
Installing Telco Network Cloud Manager - Performance on OpenShift Container
Platform
The installation information contains the installation prerequisites, instructions for preparing to install, installation, and uninstallation of IBM® Telco Network Cloud
Manager - Performance, version 1.4.5 on OpenShift® Container Platform.
About this task
IBM Telco Network Cloud Manager - Performance 1.4.5 49

Following are the installation scenarios that you can choose from:
Stand-alone installation where Telco Network Cloud Manager - Performance is not integrated with any component of Watson™ AIOps. All the built-in dashboards
can be accessed directly from Engine user interface.
Integrate Telco Network Cloud Manager - Performance with Watson AIOps Event Manager and Watson AIOps Metric Manager. The built-in dashboards are viewed
from Dashboard Application Services Hub portal.
This scenario has the following option:
Install Telco Network Cloud Manager - Performance in the Watson AIOps project or namespace.
If you do not have internet access, use the installing offline method.
Roadmap for installing Telco Network Cloud Manager - Performance on OpenShift Container Platform
Use the task roadmap to guide you through the high-level installation, configuration, and integration tasks that are applicable for various installation scenarios.
Planning for Telco Network Cloud Manager - Performance installation
To successfully install and administer Telco Network Cloud Manager - Performance, you must have a strong understanding of Red Hat® OpenShift processes and
concepts. Before you install the product, read the hardware and software requirements.
Preparing your environment
Before you run the installation, you must prepare your target environments. Install the prerequisite software.
Pre-installation tasks
Before you install Telco Network Cloud Manager - Performance, complete the following tasks.
Installing software
Use this information to install Telco Network Cloud Manager - Performance core software, and then install the vendor-specific COTS Technology Pack bundles that
can be downloaded separately.
Setting up LDAP authentication
Lightweight Directory Access Protocol (LDAP) provides an extra security to user management. LDAP server implementations are typically tailored to the needs of
your organization. You can either use your own LDAP server and the configured users or use the built-in OpenLDAP by specifying the LDAP credentials (username
and password) to log in to Telco Network Cloud Manager - Performance.
Authenticating with Microsoft Active Directory users
Microsoft Active Directory can be used for managing user authentication and user data. The Microsoft Active Directory provides a Lightweight Directory Access
Protocol (LDAP) service. Therefore, WebSphere® Application Server supports LDAP and WebSphere Application Server supports the Microsoft Active Directory.
Setting up Apache NiFi
Use this information to set up and start Apache NiFi to convert the EMS data files to Avro format records and write them to Kafka.
Setting up integration with Jazz for Service Management
These tasks are required for integrated installation only. Use this information to set up the federation between Jazz® for Service Management and Telco Network
Cloud Manager - Performance to work correctly and to access the web-based visualizations.
Setting up integration with Watson AIOps Event Manager
Follow these instructions to integrate Telco Network Cloud Manager - Performance with Watson AIOps Event Manager to send threshold violation alarms.
Postinstallation tasks
Perform these postinstallation tasks after the installation of Telco Network Cloud Manager - Performance is complete.
Uninstalling
The scope here is only to uninstall all the resources in Telco Network Cloud Manager - Performance. It does not cover the uninstallation of the cloud platform.
Roadmap for installing Telco Network Cloud Manager - Performance on OpenShift
Container Platform
Use the task roadmap to guide you through the high-level installation, configuration, and integration tasks that are applicable for various installation scenarios.
Note:
The image provides a bird's-eye-view of the tasks that are needed.
Topics that are associated with each block might have some related tasks. You must perform all the tasks of the parent and sub topics.
Do not zoom in the page as it might disrupt the hot spot functions in the image map.
Stand-alone installation scenario
In this scenario, Telco Network Cloud Manager - Performance is not integrated with any other IBM® product. Telco Network Cloud Manager - Performance Dashboards can
be accessed directly from the Engine user interface.
50 IBM Telco Network Cloud Manager - Performance 1.4.5

Manage
Resource
Grouping
Plan
Prepare Install cloud
platform
Install Install TNCP
Operator
Set up LDAP
authentication
Observe the
existing LDAP
setup or edit if
required
Create LDAP
users
Set up
Apache NiFi
Post-
installation
Enrich Network
and Region IDs
for wireless
Tech Packs
Enable
processor
groups on NiFi
UI
Move data
files from
EMS to NiFi
(Optional) Run
Huawei U2000
adaptor script
Manage batch
analytics jobs
Manage
analytics
streams
Manage
metric
thresholds
Manage
alarm rules
Manage
Resource
types and
instances
Manage site
groups
Manage time
schedulesMa
Manage Busy
Hours
Manage User
Defined
Calculations
Manage
SNMP
discovery
profiles
Manage
SNMP
credentials
User
administration
from Dashboard
Designer
Manage data
retention period
Manage Type
of Service
Manage
Autonomous
Systems
Manage Flow
Interfaces
Manage Flow
Aggregations
Manage
NBAR
Manage
Flow IP
Grouping
Manage
Domain
Names
Admin tasks
to access
Dashboards
Configure
TNCP
System
Download &
extract
Technology
Packs
Access TNCP
Dashboards
Download
& extract
Advanced
bundle
Manage Ping
profiles
Install Tech
Packs
Install TNCP
operator
instance
Integrated installation
In this scenario, Telco Network Cloud Manager - Performance is integrated with Watson™ AIOps Event Manager and Watson AIOps Metric Manager components of Watson
AIOps. Telco Network Cloud Manager - Performance Dashboards are accessed from the Dashboard Application Services Hub portal.
IBM Telco Network Cloud Manager - Performance 1.4.5 51

Plan
Prepare Install cloud
platform
Install IBM
products to
integrate
Install Install
TNCP operator
Install Tech
Packs
(Optional)
Set up LDAP
authentication
Observe the
existing LDAP
setup or edit if
required
Create LDAP
users
Set up
Apache NiFi
Integrate
with JazzSM
Integrate
with Event
Manager
Post-
installation
Enrich Network
and Region IDs
for wireless Tech
Packs
Enable
processor
groups on NiFi
UI
Move data
files from
EMS to NiFi
(Optional) Run
Huawei U2000
adaptor script
Set up
JazzSM for
integration
Set up Event
Manager
integration
Access the UI
from DASH
Admin tasks
to access
Dashboards
User
administration
from WAS
Configure
Single Sign-
on on DASH
Manage
Resource
Grouping
Manage batch
analytics jobs
Manage
analytics
streams
Manage
metric
thresholds
Manage
alarm rules
Manage
Resource
types and
instances
Manage site
groups
Manage time
schedules
Manage Busy
Hours
Manage User
Defined
Calculations
Manage
SNMP
discovery
profiles
Manage
SNMP
credentials
Manage data
retention period
Manage Type
of Service
Manage
Autonomous
Systems
Manage Flow
Interfaces
Manage Flow
Aggregations
Manage
NBAR
Manage
Flow IP
Grouping
Manage
Domain
Names
Configure
TNCP
System
User
administration
from Dashboard
Designer
User
administration
from DASH
Manage Ping
profiles
Download
& extract
Advanced
bundle
Download &
extract
Technology
Packs
Install TNCP
operator
instance
Telco Network Cloud Manager - Performance Operator
Operators provide a method of packaging, deploying, and managing a Kubernetes application. A Kubernetes application is an app that is both deployed on
Kubernetes and managed to use the Kubernetes APIs and kubectl or oc tools.
Telco Network Cloud Manager - Performance Operator
Operators provide a method of packaging, deploying, and managing a Kubernetes application. A Kubernetes application is an app that is both deployed on Kubernetes and
managed to use the Kubernetes APIs and kubectl or oc tools.
An Operator is a Kubernetes-native set of resources, and is defined as a controller combined with one or more custom resource definitions (CRDs). The controller is
custom code that is deployed to a Kubernetes cluster and is designed to watch for changes to custom Kubernetes resources and react to them. CRDs enable custom
objects to look and act just like the built-in, native Kubernetes objects.
Operators build upon the Kubernetes resource and controller pattern and also include application-specific knowledge to automate common tasks. It extends the
Kubernetes API to create, configure, and manage instances of complex applications. An Operator essentially understands two domains: Kubernetes and something else.
By combining knowledge of both domains, it can automate tasks that usually require a human operator that understands both domains.
Operators can manage more than one resource kind, and for each kind, you can deploy one or more instances of it.
For an in-depth description of operators, see the Red Hat® OpenShift®: Operators Framework video from Red Hat.
52 IBM Telco Network Cloud Manager - Performance 1.4.5

Planning for Telco Network Cloud Manager - Performance installation
To successfully install and administer Telco Network Cloud Manager - Performance, you must have a strong understanding of Red Hat® OpenShift® processes and
concepts. Before you install the product, read the hardware and software requirements.
About this task
For information on Red Hat OpenShift Container Platform, see the Red Hat OpenShift Container Platform documentation.
Downloading the installation media
Licensed customers can download the Telco Network Cloud Manager - Performance Advanced Package electronic images from IBM Passport Advantage.
Downloading the Technology Packs media
Licensed customers can download the Telco Network Cloud Manager - Performance electronic images for Technology Packs from IBM Passport Advantage®
website.
Licenses and entitlements
Telco Network Cloud Manager - Performance includes licenses that determine the components that you are entitled to use.
Related information
System requirements
Downloading the installation media
Licensed customers can download the Telco Network Cloud Manager - Performance Advanced Package electronic images from IBM®.
About this task
Download and extract the IBM Telco Network Cloud Manager - Performance V1.4.5 English Multiplatform Advanced, which has additional files and folders on the master
node in your cluster.
Procedure
1. Copy the M0H7JEN.tar.gz image to a location of your choice in the master node in your OpenShift® Container Platform cluster.
For example, /installers/advanced. It is referred to as <DIST_DIR>.
2. Use the following command to extract the media:
tar -zxvf M0H7JEN.tar.gz
Or use the following command:
gunzip -c M0H7JEN.tar.gz | tar -xvf -
You can see the following files and folders of significance:
remote
basecamp-remote-flow-collector-2.4.5.0.tar.gz
basecamp-remote-inventory-2.4.5.0.tar.gz
basecamp-remote-ping-collector-2.4.5.0.tar.gz
basecamp-remote-snmp-collector-2.4.5.0.tar.gz
basecamp-remote-snmp-discovery-2.4.5.0.tar.gz
resource-report
Extract the basecamp-resource-report-2.4.5.0.tgz file. It contains the script to generate a report with information on device classification. For more
information about this feature, see Generating the audit report.
tools
The following scripts of significance are available in this folder:
omnibus
It has the launch-tool.js script file that is needed for integration with IBM Tivoli® Netcool®/OMNIbus. For more information, see Setting up
integration with Watson AIOps Event Manager.
snmp
This folder has snmp-formula.sh script to enable or disable the metrics to be collected and displayed in the dashboards. For more information, see
Enabling and disabling formulas.
Downloading the Technology Packs media
Licensed customers can download the Telco Network Cloud Manager - Performance electronic images for Technology Packs from IBM® Passport Advantage® website.
IBM Telco Network Cloud Manager - Performance 1.4.5 53

About this task
Download and extract Telco Network Cloud Manager - Performance Technology Packs on the infra node in your OpenShift® Container Platform cluster.
Note: You do not need to download the Telco Network Cloud Manager - Performance core software.
Download and extract Telco Network Cloud Manager - Performance Technology Packs on the master node in your Kubernetes cluster.
Procedure
1. Download the needed Technology Pack images to a location of your choice.
For example, M0BPRML.tar.gz. The location is referred to as <DIST_DIR_PACKS>.
2. Use the following command to extract the Technology Pack software:
tar -zxvf M0BPRML.tar.gz
You can find the COTS Technology Pack JAR files that are available in the bundle.
For more information about the Technology Pack bundles, see part numbers for Technology Packs in Release summary topic.
If the /packs folder does not exist, the folder is created.
All the Jar files that are available in the bundle are copied to the /packs folder.
Licenses and entitlements
Telco Network Cloud Manager - Performance includes licenses that determine the components that you are entitled to use.
License types
The following three license types are available for Telco Network Cloud Manager - Performance:
Trial license for non-production use
Standard production use
What is included with Telco Network Cloud Manager - Performance license?
Images for most of the entitlements that are included with your Telco Network Cloud Manager - Performance are available through the IBM® Entitled Registry.
You can download the IBM Telco Network Cloud Manager - Performance V1.4.5 English Multiplatform Advanced eImage and Technology Pack bundles from IBM Passport
Advantage®.
Obtaining your entitlement API key
You must have your IBM entitlement API key to access images in the IBM Entitled Registry. For more information, see Creating the entitlement API key and secret.
Obtaining Red Hat OpenShift Container Platform
You can use your Telco Network Cloud Manager - Performance entitlement to install Red Hat® OpenShift® Container Platform on the environment of your choice.
You can download Red Hat OpenShift either from IBM Passport Advantage or directly from the Red Hat Customer Portal.
Preparing your environment
Before you run the installation, you must prepare your target environments. Install the prerequisite software.
Installing the prerequisite software
Install the prerequisite products before you install Telco Network Cloud Manager - Performance.
Enabling NTP on your cluster
The clocks of all the nodes in your cluster must be synchronized. If your system does not have access to the internet, you must set up a master node as an NTP
xserver to achieve this synchronization.
Configuring your cluster with hostnames
You must ensure that your computer hostname is configured correctly before you set up Telco Network Cloud Manager - Performance clusters.
Installing the prerequisite software
Install the prerequisite products before you install Telco Network Cloud Manager - Performance.
About this task
Prerequisite software for integrated installation where Telco Network Cloud Manager - Performance is integrated with Jazz® for Service Management for unified
visualizations as single pane of glass.
54 IBM Telco Network Cloud Manager - Performance 1.4.5

Cloud platform of your choice
Red Hat® OpenShift® Container Platform
Kubernetes (K8s)
IBM® products for integration
Jazz for Service Management
Watson™ AIOps Event Manager
Note: When you have the Watson AIOps Event Manager component, both Dashboard Application Services Hub and Tivoli® Netcool®/OMNIbus are
available in your environment.
Watson AIOps Metric Manager
Prerequisite software for dedicated stand-alone installation, where all the visualizations are accessed from Telco Network Cloud Manager - Performance
Engine interface.
Preparing Red Hat OpenShift cluster
Prepare your Red Hat OpenShift cluster for deployment.
Installing IBM products for integrated installation
Install the needed IBM products according to your entitlement.
Shared persistent storage
To install Telco Network Cloud Manager - Performance, you must have a supported file storage system on your Red Hat OpenShift cluster. Ensure that you have a
storage class that is already configured in OpenShift Container Platform that can be used for creating storage for Telco Network Cloud Manager - Performance
services.
Related information
Getting started
Preparing Red Hat OpenShift cluster
Prepare your Red Hat® OpenShift® cluster for deployment.
About this task
Follow these steps in the table to prepare your cluster.
Item Details
Provision the needed machines. See Deployment modes.
Download and install Red Hat OpenShift Container Platform. For the installation steps, see Product DocumentationPreparing your
environmentOpenShift Container Platform 4.12.
For Red Hat OpenShift videos, see:
https://www.youtube.com/user/rhopenshift/videos.
Install the OpenShift Container Platform CLI. Getting started with the OpenShift CLI.
Familiarize yourself with the command-line interfaces that you need to install Telco Network
Cloud Manager - Performance and communicate with the cluster.
For more information, see,
Helm documentation: Commands.
Kubernetes CLI commands.
Related information
OpenShift Container Platform 4.12 Documentation
Installing IBM products for integrated installation
Install the needed IBM® products according to your entitlement.
About this task
Make sure you have the following IBM products to integrate with Telco Network Cloud Manager - Performance to get the full feature benefits from it:
Watson™ AIOps Event Manager (IBM Tivoli® Netcool®/OMNIbus). You can view the threshold violation alarms for configured performance metrics in Event Viewer
and also for in-depth analysis of specific metrics by launch-in-context to Metric viewer dashboard.
Watson AIOps Metric Manager (Watson AIOps Metric Manager) for predictive analytics of the metrics that generate baseline threshold violations.
Procedure
IBM Telco Network Cloud Manager - Performance 1.4.5 55

1. Install the Watson AIOps Event Manager components of Watson AIOps according to your entitlement.
2. Install the Watson AIOps Metric Manager.
Shared persistent storage
To install Telco Network Cloud Manager - Performance, you must have a supported file storage system on your Red Hat® OpenShift® cluster. Ensure that you have a storage
class that is already configured in OpenShift Container Platform that can be used for creating storage for Telco Network Cloud Manager - Performance services.
Typically, you can work with any type of storage class for Telco Network Cloud Manager - Performance deployment.
In the test environments, Rook Ceph® and NFS storage classes are tested. Information is provided to support it.
Note: If you need help with other storage providers in your OpenShift Container Platform environment, contact IBM® Support.
Configuring the Ceph storage class
For Telco Network Cloud Manager - Performance, you can use a preexisting storage class that is installed along with OpenShift Container Platform or create your
own. During the installation of Telco Network Cloud Manager - Performance, you must specify the storage classes for components that require persistence.
Configuring the Ceph® storage class
For Telco Network Cloud Manager - Performance, you can use a preexisting storage class that is installed along with OpenShift® Container Platform or create your own.
During the installation of Telco Network Cloud Manager - Performance, you must specify the storage classes for components that require persistence.
About this task
Telco Network Cloud Manager - Performance is tested with Ceph Storage Class. Use this information to set up Ceph Storage Class by using the Ansible Playbook. For
more information, see https://github.com/IBM/community-automation/tree/master/ansible/csi-cephfs-fyre-play.
Procedure
1. Run the following command to see the available storage classes:
oc get sc
Alternatively, you can go to storage classes in the left navigation in Red Hat OpenShift web console to see what storage classes are available in your cluster.
2. Generate SSH key for IBM® GitHub to clone repository.
See https://github.ibm.com/settings/keys.
3. Install git repository.
yum install git
4. Install epel-release and ansible.
dnf install https://dl.fedoraproject.org/pub/epel/epel-release-latest-8.noarch.rpm -y
dnf install ansible -y
5. Clone the repository in a folder.
For example, ceph
git clone https://github.com/IBM/community-automation.git
git clone https://github.com/rook/rook.git
You can find the following content:
ansible.cfg csi-cephfs.yml examples Jenkinsfile README.md roles
Set up Ceph.
6. Copy examples/inventory content to a higher-level directory.
cd community-automation/ansible/csi-cephfs-fyre-play/
cp examples/inventory .
You can find the following content:
ansible.cfg csi-cephfs.yml examples inventory Jenkinsfile README.md roles
7. Update inventory to modify the IP address and root password of the infra node.
cat inventory
<myserver.ibm.com> ansible_connection=ssh ansible_ssh_user=root ansible_ssh_pass=<password>
ansible_ssh_common_args='-o StrictHostKeyChecking=no'
8. Install Ceph by using the Ansible Playbook.
ansible-playbook -i inventory csi-cephfs.yml
9. Check that the Ceph Storage Class is installed.
56 IBM Telco Network Cloud Manager - Performance 1.4.5

oc get sc
NAME PROVISIONER RECLAIMPOLICY VOLUMEBINDINGMODE ALLOWVOLUMEEXPANSION AGE
csi-cephfs (default) rook-ceph.cephfs.csi.ceph.com Delete Immediate true 6m10s
rook-ceph-block rook-ceph.rbd.csi.ceph.com Delete Immediate true 6m10s
rook-cephfs rook-ceph.cephfs.csi.ceph.com Delete Immediate true 6m11s
Note: The csi-cephfs storage class is used by Telco Network Cloud Manager - Performance and the rook-cephfs storage class is used by Watson™ AIOps.
oc get pods -n rook-ceph
NAME READY STATUS RESTARTS AGE
csi-cephfsplugin-5fdxp 3/3 Running 0 5m33s
csi-cephfsplugin-bk7x5 3/3 Running 0 5m33s
csi-cephfsplugin-provisioner-5c65b94c8d-p7hgf 6/6 Running 0 5m32s
csi-cephfsplugin-provisioner-5c65b94c8d-zrs7r 6/6 Running 0 5m32s
csi-cephfsplugin-qsttw 3/3 Running 0 5m33s
csi-rbdplugin-97ftx 3/3 Running 0 5m34s
csi-rbdplugin-fmhqg 3/3 Running 0 5m34s
csi-rbdplugin-provisioner-569c75558-594jd 6/6 Running 0 5m33s
csi-rbdplugin-provisioner-569c75558-bcbrb 6/6 Running 0 5m33s
csi-rbdplugin-v7tng 3/3 Running 0 5m34s
rook-ceph-crashcollector-worker0.tncpqacluster2.cp.fyre.ibm75jv 1/1 Running 0 4m12s
rook-ceph-crashcollector-worker1.tncpqacluster2.cp.fyre.ib2tgrv 1/1 Running 0 4m44s
rook-ceph-crashcollector-worker2.tncpqacluster2.cp.fyre.ibwzmqv 1/1 Running 0 3m17s
rook-ceph-mds-myfs-a-6d68d4b46c-sm44x 1/1 Running 0 3m18s
rook-ceph-mds-myfs-b-7485957c69-8nzlv 1/1 Running 0 3m17s
rook-ceph-mgr-a-7d94f86f47-dxpsc 1/1 Running 0 3m42s
rook-ceph-mon-a-d995b4677-htmsr 1/1 Running 0 4m54s
rook-ceph-mon-b-fb7d5c6f4-c2qbh 1/1 Running 0 4m45s
rook-ceph-mon-c-646b8b4d79-8n9vc 1/1 Running 0 4m12s
rook-ceph-operator-59cbfb7c7c-qg6t2 1/1 Running 0 6m35s
rook-ceph-osd-0-7547b5ddd6-56wf9 1/1 Running 0 3m32s
rook-ceph-osd-1-56546d7db7-hlvt9 1/1 Running 0 3m31s
rook-ceph-osd-2-6ccc64d59b-hnbzr 1/1 Running 0 3m30s
rook-ceph-osd-prepare-worker0.tncpqacluster2.cp.fyre.ibm.c5f898 0/1 Completed 0 3m41s
rook-ceph-osd-prepare-worker1.tncpqacluster2.cp.fyre.ibm.csxzlg 0/1 Completed 0 3m41s
rook-ceph-osd-prepare-worker2.tncpqacluster2.cp.fyre.ibm.cvsvc2 0/1 Completed 0 3m40s
rook-discover-2ntqb 1/1 Running 0 6m12s
rook-discover-9v4jk 1/1 Running 0 6m12s
rook-discover-k4vdw 1/1 Running 0 6m12s
Enabling NTP on your cluster
The clocks of all the nodes in your cluster must be synchronized. If your system does not have access to the internet, you must set up a master node as an NTP xserver to
achieve this synchronization.
About this task
Use the following instructions to enable NTP for your cluster:
Procedure
1. Run the following command to configure NTP clients on each node in your cluster:
a. Use the following command to configure the NTP clients:
yum install ntp
b. Use the following command to enable the service:
systemctl enable ntpd
c. Use the following command to start the NTPD:
systemctl start ntpd
2. Run the following command to enable the service on each node in your cluster:
chkconfig ntpd on
3. If you want to use an existing NTP server as the X server in your environment, complete the following steps:
a. Configure the firewall on the local NTP server to enable UDP input traffic on Port 123 and replace 192.168.1.0/24 with the IP addresses in the cluster, as
shown in the following example with RHEL hosts:
# iptables -A RH-Firewall-1-INPUT -s 192.168.1.0/24 -m state --state NEW -p udp --dport 123 -j ACCEPT
4. Save and restart iptables. Run the following command on all the nodes in your cluster:
# service iptables save
# service iptables restart
5. Finally, configure clients to use the local NTP server. Edit the /etc/ntp.conf file and add the following line:
server $LOCAL_SERVER_IP OR HOSTNAME
IBM Telco Network Cloud Manager - Performance 1.4.5 57

Configuring your cluster with hostnames
You must ensure that your computer hostname is configured correctly before you set up Telco Network Cloud Manager - Performance clusters.
About this task
Make sure that all nodes can resolve all cluster addresses.
Procedure
1. Make sure all the hostnames of the servers in your cluster are DNS resolvable.
Run the following command with your server name to check that the server is configured correctly:
nslookup myserver-worker01.ibm.com
Server: 10.60.90.206
Address: 10.60.90.206#53
Name: myserver-worker01.ibm.com
Address: 10.210.117.34
Note: If you do not see name of the server in the output, it is not DNS resolvable.
2. Repeat for all servers in the clusters.
Pre-installation tasks
Before you install Telco Network Cloud Manager - Performance, complete the following tasks.
About this task
Use these tasks to prepare for the installation of Telco Network Cloud Manager - Performance Operator.
Creating a custom namespace
A cluster administrator must create the OpenShift projects (Kubernetes namespaces) where you plan to deploy the Telco Network Cloud Manager - Performance
software.
Creating the entitlement API key and secret
Complete the following steps to create a Docker registry secret to enable your deployment to pull operand images from the IBM Entitled Registry.
Creating the IBM Operator catalog source
To ensure that your cluster uses the correct software images, you must create the appropriate catalog sources for your environment. Operator Lifecycle Manager
(OLM) uses an Operator catalog to discover and install Operators and their dependencies. A catalog source is a repository of cluster service versions (CSVs), custom
resource definitions (CRDs), and packages that comprise an application. To ensure that OLM can use the Cloud Pak for Data operators to install the software, you
must create the appropriate catalog sources for your environment.
Creating a custom namespace
A cluster administrator must create the OpenShift® projects (Kubernetes namespaces) where you plan to deploy the Telco Network Cloud Manager - Performance
software.
About this task
You can create the namespace from OpenShift Container Platform web console or by using OpenShift Container Platform CLI.
Permissions you need for this task
You must be a cluster administrator.
When you need to complete this task
You must complete this task the first time you install Telco Network Cloud Manager - Performance.
Procedure
Create a custom namespace from OpenShift Container Platform web console. Follow these steps:
1. Log in to the OpenShift Container Platform web console for your cluster.
2. From the navigation, click Home > Projects to open the Projects page.
3. Click Create Project.
4. Enter a project name or namespace.
For example, tncp. Add a display name and description as needed.
5. Click Create.
58 IBM Telco Network Cloud Manager - Performance 1.4.5

Or
Create a custom namespace with OpenShift Container Platform CLI. Follow these steps:
1. Log in to the OpenShift Container Platform from your cluster node. Run the following command:
oc login -s <openshift_server_url> -u <cluster_admin_pwd> -p <cluster_admin_pwd>
Use the following command if you are on the Infra node.
oc login -u kubeadmin -p <cluster_admin_pwd>
2. Create the namespace into which you want to install the Operator, and then switch to the new namespace.
$NAMESPACE=tncp
oc create namespace $NAMESPACE
3. Change to the new project that you created with the following command:
oc project tncp
Creating the entitlement API key and secret
Complete the following steps to create a Docker registry secret to enable your deployment to pull operand images from the IBM® Entitled Registry.
About this task
You can create a Docker registry secret either through command line or by using the OpenShift® Container Platform web console.
Procedure
Obtain the entitlement key that is assigned to your IBM ID to get you access to the IBM Entitled Registry. Follow these steps:
1. Log in to My IBM Container Software Library external link with the account (username and password) that has entitlement to IBM software. The key that is
displayed is the key that can be used to access the Entitled Registry.
2. On the Get entitlement key tab, select Copy key to copy the entitlement key to the clipboard, in the Entitlement key field.
3. Save the API key in a text file.
4. Verify the validity of the key by logging in to the IBM Entitled Registry with a container tool.
docker login cp.icr.io --username cp --password <your entitlement key>
Create a Docker registry secret from OpenShift Container Platform web console. Follow these steps:
1. Log in to the OpenShift Container Platform web console for your cluster.
2. From the navigation, click Workloads > Secrets.
3. Change the project to openshift-config.
4. From the Name column, click pull-secret > Actions > Edit Secret.
5. Click Add Credentials.
6. Provide the following details:
Field Value
Registry Server Address cp.icr.io
Username Your entitled registry username
Password Your entitlement key that is generated in the previous step.
Email Your registered email address
7. Click Save.
Or
Create a Docker registry secret by using the command line to enable your deployment to pull Telco Network Cloud Manager - Performance image from the IBM
Entitled Registry. Run the following command to create the docker registry secret:
oc create secret docker-registry 'cp.icr.io' \
--docker-server='cp.icr.io' \
--docker-username='cp' \
--docker-password='pwd' \
--docker-email='<email>' \
--namespace='<target_namespace>'
Where,
cp.icr.io is the entitled registry.
cp is the entitled user.
pwd is the entitled password.
target_namespace is the namespace that is created earlier, which is tncp.
Creating the IBM Operator catalog source
To ensure that your cluster uses the correct software images, you must create the appropriate catalog sources for your environment. Operator Lifecycle Manager (OLM)
uses an Operator catalog to discover and install Operators and their dependencies. A catalog source is a repository of cluster service versions (CSVs), custom resource
IBM Telco Network Cloud Manager - Performance 1.4.5 59

definitions (CRDs), and packages that comprise an application. To ensure that OLM can use the Cloud Pak for Data operators to install the software, you must create the
appropriate catalog sources for your environment.
About this task
Before you can install Telco Network Cloud Manager - Performance, you must add the IBM® Operator catalog. To create catalog sources that automatically pull the latest
images from the IBM Entitled Registry, you can use OpenShift® Container Platform or OpenShift Container Platform CLI.
Create the catalog sources with the OpenShift Container Platform web console.
Create the catalog sources with the OpenShift Container Platform CLI.
Procedure
Create the IBM Operator catalog source with the OpenShift Container Platform console. Follow these steps:
1. Log in to your OpenShift Container Platform cluster console.
2. Add the catalog source for the IBM Operator Catalog.
a. Click + at the upper-right area of the page to open the Import YAML page.
b. Paste the following text:
apiVersion: operators.coreos.com/v1alpha1
kind: CatalogSource
metadata:
name: ibm-operator-catalog
namespace: openshift-marketplace
spec:
displayName: IBM Operator Catalog
publisher: IBM Content
sourceType: grpc
image: icr.io/cpopen/ibm-operator-catalog:latest
updateStrategy:
registryPoll:
interval: 45m
c. Click Create.
3. Verify that the IBM Operator Catalog source is added to your cluster.
a. From the navigation menu, click Operators > OperatorHub.
b. From the Project list, select openshift-marketplace.
c. Verify that the IBM Operator Catalog source is included.
Or
Add the catalog source for the IBM Operator Catalog with the OpenShift Container Platform CLI. Follow these steps:
1. Check whether the IBM Operator Catalog exists on your cluster:
oc get catalogsource -n openshift-marketplace
NAME DISPLAY TYPE PUBLISHER AGE
ibm-operator-catalog IBM Operator Catalog grpc IBM Content 7m56s
2. Create the catalog source by running the following commands.
cat <<EOF |oc apply -f -
apiVersion: operators.coreos.com/v1alpha1
kind: CatalogSource
metadata:
name: ibm-operator-catalog
namespace: openshift-marketplace
spec:
displayName: IBM Operator Catalog
publisher: IBM Content
sourceType: grpc
image: icr.io/cpopen/ibm-operator-catalog:latest
updateStrategy:
registryPoll:
interval: 45m
3. Verify that the catalog source is added with the following command:
oc get catalogsource ibm-operator-catalog -n openshift-marketplace
Review the output to ensure that an entry that is called ibm-operator-catalog is available.
4. Verify that ibm-operator-catalog is in READY state:
oc get catalogsource -n openshift-marketplace ibm-operator-catalog \
-o jsonpath='{.status.connectionState.lastObservedState} {"\n"}'
It might take several minutes before the catalog source is ready. If the command does not return READY, wait a few minutes and try to verify the status
again.
5. Verify that the IBM Operator Catalog Pod is added to your cluster.
What to do next
Now that you created the required catalog source for your environment, you are ready to complete the installation of Telco Network Cloud Manager - Performance
software.
60 IBM Telco Network Cloud Manager - Performance 1.4.5

Related information
Operator Framework glossary of common terms in the Red Hat OpenShift Container Platform documentation
Installing software
Use this information to install Telco Network Cloud Manager - Performance core software, and then install the vendor-specific COTS Technology Pack bundles that can be
downloaded separately.
Before you begin
Ensure that the cluster meets the minimum requirements for installing. See System requirements.
Ensure that a cluster administrator completed the required Pre-installation tasks for your environment. Specifically, verify that a cluster administrator completed
the following tasks:
The cluster is set up and working correctly.
The cluster is configured to pull the software images. For details, see Creating the entitlement API key and secret.
ibm-operator-catalog source exists. For details, see Creating the IBM Operator catalog source.
Ensure that all nodes have internet access. If you do not have internet access, use offline installation process.
Ensure that the necessary user permissions are in place for all the installation directories.
Ensure that all the hosts in your cluster are in the same time zone.
Install Jazz® for Service Management.
Install the following Watson™ AIOps components:
Watson AIOps Event Manager
Watson AIOps Metric Manager
About this task
Installation of Telco Network Cloud Manager - Performance is a three-step process:
1. Install the Telco Network Cloud Manager - Performance Operator.
2. Optional, install the Telco Network Cloud Manager - Performance Advanced bundle.
Advanced bundle contains the files for setting up Remote Flow Collector, Remote SNMP Discovery. For more information, see Downloading the installation media.
3. Install the needed Technology Packs.
Installing the Telco Network Cloud Manager - Performance Operator
The Telco Network Cloud Manager - Performance Operator can be installed by using the Container Application Software for Enterprises (CASE) installer from the
OperatorHub in the Red Hat OpenShift web console.
(Optional) Installing Telco Network Cloud Manager - Performance offline
Typically, the procedure to install Telco Network Cloud Manager - Performance images on a Kubernetes cluster is same whether the host has access to internet or
not. In offline installation, containers are pulled from the Docker Hub to a computer that has access to internet, and then a single package with all the containers is
created. The single package can be copied to the hosts where they can be installed without internet access.
Creating a route
An Red Hat OpenShift route is a way to expose a service by giving it an externally reachable hostname. The Red Hat OpenShift routers provide external hostname
mapping and load balancing to services over protocols that pass distinguishing information directly to the router. The hostname must be present in the protocol in
order for the router to determine where to send it.
Installing Technology Packs
Use this information to install the Technology Pack content that is available with Telco Network Cloud Manager - Performance installation media. The ready-to-use
Technology Pack content includes predefined vendor-specific discovery formulas, collection formulas, and metrics that you can use for discovery and polling the
devices.
Installing the Telco Network Cloud Manager - Performance Operator
The Telco Network Cloud Manager - Performance Operator can be installed by using the Container Application Software for Enterprises (CASE) installer from the
OperatorHub in the OpenShift® web console.
Before you begin
Ensure that you completed all the steps in Pre-installation tasks.
All the needed images are accessible in the IBM® Entitled Registry (cp.icr.io) for which you need an entitlement key.
Ensure that a OpenShift Container Platform Storage Class exists that can be used to create Persistent Volume Claims for Telco Network Cloud Manager -
Performance.
Install the unzip Red Hat Linux® utility with the following command:
yum install unzip
About this task
You can install the TNCP catalog in either of the following ways:
Install the TNCP Operator from OpenShift Container Platform web console.
Create an Operator instance.
IBM Telco Network Cloud Manager - Performance 1.4.5 61

Procedure
Install the Operator from OpenShift Container Platform web console. Follow these steps:
1. From the navigation, click Operators > OperatorHub.
Make sure you are in openshift-marketplace project space.
2. From the OperatorHub page, search for TNCP and click the IBM Telco Network Cloud Manager - Performance tile.
3. Click Install.
4. From the Install Operator page, provide the following details:
The supported update channels are shown, with 1.4 selected by default. It indicates that an Operator subscription is automatically created to keep the
Operator up to date when new versions are delivered to the channel.
Note: Make sure to select 1.4 channel.
Installation Mode
Choose whether to install the Operator into all namespaces in the cluster or into a specific namespace. By default, All namespaces on the cluster is
selected.
Installed Namespace
By default, openshift-operators is selected. If you install the Operator in the openshift-operators project, it is accessible by all other projects or
namespaces.
Note: If you chose the option A specific namespace on the cluster, you can change the namespace. This option is not supported for the IBM Telco
Network Cloud Manager - Performance Operator.
Approval Strategy
Click Automatic to indicate that the installation must proceed with no additional approval. The running instance of your Operator is automatically
upgraded whenever new versions are delivered to the channel.
Click Manual if you want to review a generated Install Plan for the Operator and then manually approve the installation. You must review the Install
Plan for each new Operator version that is delivered to the channel, and then manually approve an upgrade.
Note: If needed, you can change the approval strategy later.
5. Click Install to install the Operator.
If you chose a Manual approval strategy, review and approve the Install Plan of the subscription. No additional action is needed if you selected an Automatic
approval strategy.
6. Wait for the installation to complete, and then click View installed Operators in Namespace openshift-operators.
The IBM Telco Network Cloud Manager - Performance Operator is displayed on the Installed Operators page with a deployment status as Succeeded.
7. Select the openshift-operators project from the Projects list.
8. Verify that the IBM Telco Network Cloud Manager - Performance Operator Pod is created from OpenShift Container Platform web console. Follow these
steps:
a. Click Workloads > Pods.
b. Select the openshift-operators project from the Projects list.
c. Verify that the tncp-operator-<build_signature> Pod is created.
You can also run the following command to check that the Operator Pod is working:
oc get pods -n openshift-operators | grep -i tncp
tncp-operator-74cbf4b98d-f45zt 1/1 Running 0 102s
Create the Telco Network Cloud Manager - Performance Operator instance. Follow these steps:
1. Change the project to custom namespace that you created earlier, which is tncp.
2. Click Operators > Installed Operators.
3. Click TNCP under Provided APIs.
4. Click Create TNCP.
From the Form View tab, specify the following values:
Note: These parameters are used in creating the Custom Resource Definition that is applied based on the values that are given by you. A custom resource
definition (CRD) file defines your own object kinds and allows the apiserver to handle the entire lifecycle.
Name of the instance
Labels for the instance
Name of the Storage Class
Note: If you are using Ceph as the Persistent Storage, the value as csi-cephfs is shown.
Accept the license.
In the Redundancy section, enter the following entries to enable geo-redundancy for Postgres Service:
Provide the cluster route in the Cluster field. If you are installing the TNCP instance on the primary cluster, then provide the route to the primary
cluster. If you are installing the TNCP instance on the secondary cluster, then provide the route to the secondary cluster.
Provide the cluster routes for all the clusters in your network in the Clusters field. Provide the primary route first in the list and rest can be in any order
of your preference. Maintain the same order in all the clusters.
For example,
Cluster: symmetric-registration-tncp.apps.primarycluster1.example.com
Clusters:
- symmetric-registration-tncp.apps.primarycluster1.example.com
- standby-sync-tncp.apps.secondarycluster2.cp.example.com
Note: Make sure to create the same routes in your OpenShift Container Platform web console after the installation is complete.
Note: For more information, see:
Enabling Geo-redundancy
Creating a route
In the Scaling section, select the auto checkbox.
This setting enables horizontal auto scaling of Telco Network Cloud Manager - Performance Pods that is based on the values in the sizing sheet. For
more information, see Setting up horizontal auto scaling of Pods.
62 IBM Telco Network Cloud Manager - Performance 1.4.5

In the Services section, provide the CPU limits and memory limits for all the services.
The default values for each service are as follows:
Service Default values
security resources:
cpu: 100m
memory: 1Gi
app resources:
cpu: 200m
memory: 1Gi
snmp-discovery resources:
cpu: '1'
memory: 4Gi
timeseries resources:
cpu: '1'
memory: 1.5Gi
kafka resources:
cpu: 500m
memory: 2Gi
flow-analytics resources:
cpu: 500m
memory: 1250Mi
analytics-stream resources:
cpu: '2'
memory: 6Gi
postgres-th resources:
cpu: 100m
memory: 1Gi
cassandra resources:
cpu: '2'
memory: 10Gi
dns-collector resources:
cpu: 200m
memory: 1Gi
threshold resources:
cpu: 200m
memory: 1Gi
diamond-db resources:
cpu: 800m
memory: 4Gi
diamond-db-read resources:
cpu: 800m
memory: 4Gi
diamond-db-export resources:
cpu: 800m
memory: 4Gi
ping-collector resources:
cpu: 1m
memory: 1Gi
zookeeper resources:
cpu: 100m
memory: 1Gi
flow-collector resources:
cpu: 500m
memory: 1250Mi
analytics-batch resources:
cpu: '1'
memory: 3Gi
ui resources:
cpu: 200m
memory: 1Gi
dashboard
diamond-db resources:
cpu: 800m
memory: 4Gi
postgres resources:
cpu: 500m
memory: 1Gi
inventory resources:
cpu: 500m
memory: 1Gi
file-collector resources:
cpu: 1500m
memory: 4Gi
snmp-collector resources:
cpu: '1'
memory: 1Gi
nifi resources:
cpu: '1'
memory: 2Gi
pack-service resources:
cpu: '2'
memory: 4Gi
Note: Update these values only if you want to change the default values for any service in increase the performance. Otherwise, the default values are
applicable.
5. Click Create.
Verify that the instance is created.
6. Verify that all the Pods, Stateful Services are up. Make sure you are in tncp project.
IBM Telco Network Cloud Manager - Performance 1.4.5 63

Click Workloads > Pods.
Click Workloads > Stateful Services.
7. Verify the Telco Network Cloud Manager - Performance Pods are up. Make sure that the Dashboard Pod is up.
oc get services -o wide -n tncp
NAME TYPE CLUSTER-IP EXTERNAL-IP PORT(S) AGE
SELECTOR
analytics-batch ClusterIP 172.30.238.92 <none> 30028/TCP,30029/TCP 5d
service=analytics-batch
analytics-stream ClusterIP 172.30.77.246 <none> 30030/TCP,30031/TCP 5d18h
service=analytics-stream
analytics-stream-direct ClusterIP None <none> 30062/TCP,30063/TCP 5d
service=analytics-stream
app ClusterIP 172.30.163.190 <none> 30037/TCP 5d18h
service=app
basecamp-pack ClusterIP 172.30.153.86 <none> 30048/TCP,30049/TCP 108d
service=basecamp-pack
cassandra ClusterIP None <none> 9042/TCP,7000/TCP 5d18h
service=cassandra
dashboard ClusterIP 172.30.213.88 <none> 31080/TCP,31443/TCP 5d18h
service=dashboard
diamond-db ClusterIP 172.30.3.173 <none> 30010/TCP,30008/TCP 5d18h
service=diamond-db
diamond-db-cluster ClusterIP None <none> 7110/TCP 5d18h
service=diamond-db
diamond-db-cluster-export ClusterIP None <none> 8120/TCP 5d18h
service=diamond-db-export
diamond-db-cluster-read ClusterIP None <none> 8110/TCP 5d18h
service=diamond-db-read
diamond-db-export ClusterIP 172.30.241.149 <none> 30120/TCP,30118/TCP 5d18h
service=diamond-db-export
diamond-db-read ClusterIP 172.30.81.211 <none> 30110/TCP,30108/TCP 5d18h
service=diamond-db-read
dns-collector ClusterIP 172.30.146.37 <none> 30042/TCP,30043/TCP 5d18h
service=dns-collector
file-collector ClusterIP 172.30.114.44 <none> 30024/TCP 5d
service=file-collector
flow-analytics ClusterIP 172.30.203.220 <none> 30044/TCP,30045/TCP 5d18h
service=flow-analytics
flow-collector ClusterIP 172.30.252.245 <none> 30040/TCP,30041/TCP 5d18h
service=flow-collector
flow-collector-external ClusterIP 172.30.109.183 <none> 4381/TCP,4379/UDP 5d18h
service=flow-collector
inventory ClusterIP 172.30.7.156 <none> 30016/TCP,30017/TCP 5d18h
service=inventory
kafka ClusterIP 172.30.89.32 <none> 9092/TCP 5d18h
service=kafka
nifi ClusterIP 172.30.194.167 <none> 30026/TCP 5d18h
service=nifi
pack-service ClusterIP 172.30.49.82 <none> 30048/TCP,30049/TCP 5d
service=pack-service
ping-collector ClusterIP 172.30.105.95 <none> 30050/TCP,30051/TCP 5d18h
service=ping-collector
postgres ClusterIP 172.30.223.149 <none> 5432/TCP,31415/TCP 5d18h
service=postgres
postgres-th ClusterIP 172.30.65.202 <none> 5433/TCP 5d18h
service=postgres-th
security ClusterIP 172.30.47.30 <none> 389/TCP 5d18h
service=security
snmp-collector ClusterIP 172.30.19.168 <none> 30034/TCP,30035/TCP 5d18h
service=snmp-collector
snmp-discovery ClusterIP 172.30.70.4 <none> 30018/TCP,30019/TCP 5d18h
service=snmp-discovery
solr NodePort 172.30.66.92 <none> 8993:31741/TCP,8983:32093/TCP 5d
service=inventory
threshold ClusterIP 172.30.56.203 <none> 30032/TCP,30033/TCP 5d18h
service=threshold
timeseries ClusterIP 172.30.181.107 <none> 30014/TCP,30015/TCP 5d18h
service=timeseries
ui ClusterIP 172.30.64.171 <none> 30021/TCP 5d18h
service=ui
zookeeper ClusterIP 172.30.52.247 <none> 2181/TCP,2888/TCP,3888/TCP 5d18h
service=zookeeper 6d22h service=zookeeper
You can observe the Pods as they are installing from the OpenShift Container Platform web console. Installation completes when you see all the Pods are in running
state.
Note:
The following Config Maps are created:
common Config Map is created with LDAP default settings.
generic-metric-mapper
kube-root-ca.crt
openshift-service-ca.crt
threshold-omnibus-rule
timeseries-retention Config Map to configure the time series data retention.
The following Pods are created and scaled up to 1:
App
Cassandra
Dashboard
Diamond-db
Diamond-db-read
64 IBM Telco Network Cloud Manager - Performance 1.4.5

Diamond-db-export
Kafka
Operator
Pack Service
Postgres
Postgres-th
Security
Timeseries
UI
Zookeeper
The following Pods are created but scaled down to 0:
Analytics batch
Any technology pack that has built-in batch jobs.
Analytics-stream
Any technology pack that has built-in streams.
DNS Collector
It is scaled up after the Flow Technology Pack is installed.
File Collector
It is scaled up after a File-based Technology Pack is installed.
Flow Analytics
It is scaled up after the Flow Technology Pack is installed.
Flow Collector
It is scaled up after the Flow Technology Pack is installed.
NiFi
It is scaled up after a File-based Technology Pack is installed.
Ping Collector
Manually, scale up the service to see the Ping Profiles page and dashboards.
SNMP Collector
It is scaled up after an SNMP-based Technology Pack is installed.
SNMP Discovery
It is scaled up after an SNMP-based Technology Pack is installed.
Threshold
It is scaled up after a Technology Pack that has baseline threshold definitions is installed.
Inventory
If it is not scaled up by default, manually, scale up the Inventory Pod.
Results
After the installation of Watson™ AIOps components on OpenShift Container Platform, you can see all the routes to access Dashboard Application Services Hub and
WebSphere® Application Server are created. Follow these steps to access Dashboard Application Services Hub:
1. Make sure you are in the noi project.
2. Run the following command to get the Dashboard Application Services Hub route:
oc describe noi
To get the routes for Dashboard Application Services Hub and WebSphere Application Server, go to the following section in the output:
WebGUI:
Update your hosts file( On the machine you are running your Browser) or your DNS settings with this mapping
$NODE_IP netcool-noi.apps.tncpnoicluster.cp.fyre.ibm.com
firefox https://netcool-noi.apps.<cloud_domain>.com:443/ibm/console
Default credentials are: icpadmin/password you can get from the secret noi-icpadmin-secret using the following
kubectl get secret noi-icpadmin-secret -o json -n noi| grep ICP_ADMIN_PASSWORD | cut -d : -f2 | cut -d '"' -f2 |
base64 -d;echo
WAS Console:
Update your hosts file( On the machine you are running your Browser) or your DNS settings with this mapping
$NODE_IP was-noi.apps.tncpnoicluster.cp.fyre.ibm.com
firefox https://was-noi.apps.<cloud_domain>.com:443/ibm/console
Default credentials are: smadmin/password you can get from the secret noi-was-secret using the following
kubectl get secret noi-was-secret -o json -n noi| grep WAS_PASSWORD | cut -d : -f2 | cut -d '"' -f2 | base64 -
d;echo
3. Run the following command to get the password to access Dashboard Application Services Hub as icpadmin user:
kubectl get secret noi-icpadmin-secret -o json -n noi| grep ICP_ADMIN_PASSWORD | cut -d : -f2 | cut -d '"' -f2 |
base64 -d;echo
IBM Telco Network Cloud Manager - Performance 1.4.5 65

4. Run the following command to get the password to access WebSphere Application Server as smadmin user:
kubectl get secret noi-was-secret -o json -n noi| grep WAS_PASSWORD | cut -d : -f2 | cut -d '"' -f2 | base64 -d;echo
After the installation of Telco Network Cloud Manager - Performance, the Dashboard Service route and NiFi Service route are created. Follow these steps to access
the Telco Network Cloud Manager - Performance Dashboards:
1. Go to Networking > Routes.
The routes for the following services are created by default:
Dashboard
NiFi
2. The Dashboard Service route is already created. Click the link to launch the dashboards.
3. Access the Telco Network Cloud Manager - Performance Dashboards by using the default credentials npiadmin/npiadmin.
4. Click the NiFi route to access the NiFi web interface.
Note: You can also create routes for other services as needed.
(Optional) Installing Telco Network Cloud Manager - Performance offline
Typically, the procedure to install Telco Network Cloud Manager - Performance images on a Kubernetes cluster is same whether the host has access to internet or not. In
offline installation, containers are pulled from the Docker Hub to a computer that has access to internet, and then a single package with all the containers is created. The
single package can be copied to the hosts where they can be installed without internet access.
About this task
Instructions are provided for the following two scenarios:
Preparing a server for local Docker registry
A local Docker registry is used to store all images in your restricted environment. You need a server that has internet connectivity to pull all the images to a server to
set up the Docker registry. All other servers in your cluster must be able to access this server.
Preparing a bastion host
Prepare a bastion host that can access the OpenShift® cluster, the local Docker registry, and the internet. The bastion host must be on a Linux® x86_64 platform, or
any operating system that the IBM Cloud Pak® CLI (cloudctl) and the Red Hat OpenShift CLI supports. The bastion host locale must be set to English.
Setting up Rook Ceph Operator in a network restricted (airgap) environment
In an airgap installation, obtaining the containers is always a challenge. You can get the images to a local storage repository and install them from there. Use this
documentation to install Rook Ceph Storage class on Red Hat® OpenShift Container Platform in an airgap environment.
Mirroring images on the bastion host
Preparing a server for local Docker registry
A local Docker registry is used to store all images in your restricted environment. You need a server that has internet connectivity to pull all the images to a server to set up
the Docker registry. All other servers in your cluster must be able to access this server.
About this task
Create the registry and ensure that it meets the following requirements:
Supports Docker Manifest V2, Schema 2.
Is accessible from both the bastion host and your OpenShift® cluster nodes.
Has the username and password of a user who can write to the target registry from the bastion host.
Has the username and password of a user who can read from the target registry that is on the OpenShift cluster nodes.
Allows path separators in the image name.
Ensure that you have the following credentials:
The credentials of a user who can write and create repositories. The bastion host uses these credentials.
The credentials of a user who can read all repositories. The OpenShift cluster uses these credentials.
Complete the following steps to prepare a local Docker registry:
Procedure
1. On your server where the Docker registry is to be set up, create the following environment variables with the installer image name and the image inventory:
export CASE_ARCHIVE=ibm-tncp-case-1.4.3.tgz
2. Download the archive and image inventory to the offline store:
cloudctl case save \
--case https://github.com/IBM/cloud-pak/raw/master/repo/case/${CASE_ARCHIVE} \
--outputdir /tmp/cases
Downloading and extracting the CASE ...
- Success
Retrieving CASE version ...
- Success
Validating the CASE ...
- Success
Creating inventory ...
66 IBM Telco Network Cloud Manager - Performance 1.4.5

- Success
Finding inventory items
- Success
Resolving inventory items ...
Parsing inventory items
- Success
3. Extract the CASE bundle to get the /ibm-tncp-case/inventory/operator/files/airgap.sh file.
4. Initialize a Docker registry service with the following command:
./airgap.sh registry service init -r <docker_registry_server>:5000
[INFO] Initializing /tmp/docker-registry/data
[INFO] Initializing /tmp/docker-registry/auth
[INFO] Initializing /tmp/docker-registry/certs
[INFO] Creating /tmp/docker-registry/auth/htpasswd
Adding password for user admin
[INFO] Generating self-sign certificate
Generating RSA private key, 4096 bit long modulus (2 primes)
..........................................................................................................................
.................++++
.....................................++++
e is 65537 (0x010001)
Generating a RSA private key
.......................++++
..........................................................................................................................
.........................................++++
writing new private key to '/tmp/docker-registry/certs/server.key'
-----
Signature ok
subject=C = US, ST = New York, L = Armonk, O = IBM Cloud Pak, CN = tncpcluster4-inf:5000
Getting CA Private Key
[INFO] username = <user_name>
[INFO] password = <password>
Write down the <user_name> and <password>.
5. Start the Docker registry with the following command:
./airgap.sh registry service start
INFO] Container engine: /usr/bin/podman
[INFO] Starting registry
57a02706b0e39f1ea5e9cc8d841d21e9ddeb27fe916ba3d8b11cf68c6bb77845
[INFO] Registry service started at <docker_registry_server>:5000
6. Add registry CA certificate to the cluster by using the following command:
./airgap.sh cluster add-ca-cert --registry <docker_registry_server>:5000
[INFO] Extracting certificate authority from <docker_registry_server> ...
[INFO] Certificate authority saved to /root/.airgap/certs/<docker_registry_server>:5000-ca.crt
[INFO] Updating configmap airgap-trusted-ca
W0423 06:34:35.586875 59015 helpers.go:553] --dry-run is deprecated and can be replaced with --dry-run=client.
configmap/airgap-trusted-ca patched
[INFO] Updating cluster image configuration
image.config.openshift.io/cluster patched
Preparing a bastion host
Prepare a bastion host that can access the OpenShift® cluster, the local Docker registry, and the internet. The bastion host must be on a Linux® x86_64 platform, or any
operating system that the IBM Cloud Pak® CLI (cloudctl) and the Red Hat OpenShift CLI supports. The bastion host locale must be set to English.
About this task
Complete the following steps on the bastion node:
Procedure
1. Install OpenSSL 1.11.1 or higher.
2. Install the Docker or Podman.
yum check-update
yum install docker
See Podman Installation Instructions.
3. Install the latest version of the IBM Cloud Pak CLI. The minimum supported version is 3.4.4. For a list of available binary files, see cloud-pak-cli
a. Download the binary file:
sudo wget https://github.com/IBM/cloud-pak-cli/releases/download/v3.7.0/cloudctl-linux-amd64.tar.gz
tar -xvf cloudctl-linux-amd64.tar.gz
sudo mv cloudctl-linux-amd64 /usr/bin/cloudctl
b. Extract the file and move it to /usr/bin folder.
tar -xvf cloudctl-linux-amd64.tar.gz
mv cloudctl-linux-amd64 /usr/bin/cloudctl
IBM Telco Network Cloud Manager - Performance 1.4.5 67

c. Confirm that cloudctl is installed:
cloudctl --help
The cloudctl usage is displayed.
4. Install the oc Red Hat OpenShift CLI tool. See Getting started with the CLI in the Red Hat® OpenShift documentation.
5. Install the skopeo CLI 1.0.0 or higher. See Installing skopeo from packages.
6. Create a directory that serves as the offline store.
This offline store must be persistent to avoid transferring data more than one time. The persistence also helps to run the mirroring process multiple times or on a
schedule.
For example, the following directory is used in the subsequent steps:
mkdir /tmp/cases
Setting up Rook Ceph Operator in a network restricted (airgap) environment
In an airgap installation, obtaining the containers is always a challenge. You can get the images to a local storage repository and install them from there. Use this
documentation to install Rook Ceph Storage class on Red Hat® OpenShift® Container Platform in an airgap environment.
Information in this document can be used when the bastion host in your cluster and all other nodes in your cluster do not have internet access. You can download Ceph
images as files and clone and copy the repository to any system that has internet connection.
Follow these steps to install Rook Ceph Operator in an airgap environment:
Download images as files
Clone and copy Ceph repository
Set up a local registry on a worker node in your cluster
Load the images to the local container registry
Create Red Hat OpenShift ImageContentSourcePolicy
Install Ceph as a storage class
Download images as files
Download all the needed images as files to a system that has internet connection. Use the Skopeo tool to mirror the images into a directory. You might find the following
images that are specific to your version:
quay.io/ceph/ceph:v17.2.1
quay.io/cephcsi/cephcsi:v3.6.2
registry.k8s.io/sig-storage/csi-snapshotter:v6.0.1
registry.k8s.io/sig-storage/csi-attacher:v3.4.0
registry.k8s.io/sig-storage/csi-node-driver-registrar:v2.5.1
registry.k8s.io/sig-storage/csi-resizer:v1.4.0
registry.k8s.io/sig-storage/csi-provisioner:v3.1.0
rook/ceph:master
Follow these steps to download the images:
1. If you do not have Skopeo and Podman installed, use the following commands to install them:
# yum install skopeo
# yum install podman
2. Create a directory to place the downloaded images.
# mkdir -p $HOME/<rookImages>
3. Download the images as files one by one.
# skopeo copy --all docker://quay.io/ceph/ceph:v17.2.1 dir://$HOME/<rookImages>/ceph-v17.2.1
skopeo copy --all docker://quay.io/cephcsi/cephcsi:v3.6.2 dir://$HOME/<rookImages>/cephcsi-v3.6.2
skopeo copy --all docker://registry.k8s.io/sig-storage/csi-snapshotter:v6.0.1 dir://$HOME/<rookImages>/csi-snapshotter-
v6.0.1
skopeo copy --all docker://registry.k8s.io/sig-storage/csi-attacher:v3.4.0 dir://$HOME/<rookImages>/csi-attacher-v3.4.0
skopeo copy --all docker://registry.k8s.io/sig-storage/csi-node-driver-registrar:v2.5.1 dir://$HOME/<rookImages>/csi-node-
driver-registrar-v2.5.1
skopeo copy --all docker://registry.k8s.io/sig-storage/csi-resizer:v1.4.0 dir://$HOME/<rookImages>/csi-resizer-v1.4.0
skopeo copy --all docker://registry.k8s.io/sig-storage/csi-provisioner:v3.1.0 dir://$HOME/<rookImages>/csi-provisioner-
v3.1.0
skopeo copy --all docker://rook/ceph:master dir://$HOME/<rookImages>/ceph-master
You can now transfer the downloaded images to a local registry on any worker node in your cluster that is not connected to internet.
Clone and copy Ceph repository
Clone the Ceph repository to a system that has internet access and copy it to the Infra host in your cluster that has no internet access. You can clone it in the same server
where you downloaded the Ceph images.
1. Make sure you installed git repository. If not, install it with the following command:
#yum install git
68 IBM Telco Network Cloud Manager - Performance 1.4.5

2. Clone the repository with the following command:
# git clone https://github.com/rook/rook.git
Cloning into 'rook'...
remote: Enumerating objects: 102271, done.
remote: Counting objects: 100% (82/82), done.
remote: Compressing objects: 100% (70/70), done.
remote: Total 102271 (delta 30), reused 35 (delta 12), pack-reused 102189
Receiving objects: 100% (102271/102271), 50.04 MiB | 24.59 MiB/s, done.
Resolving deltas: 100% (70754/70754), done
3. Archive the repository that is cloned in the rook folder to create a TAR file with the following command:
# tar -cvzf <rook.tgz> rook/
4. Move the <rook.tgz> file to the OpenShift Container Platform cluster Infra node. Follow these commands:
scp -r <rook.tgz> user@<ocp_infra_host>:<directory_path_to_copy>
Set up a local registry on a worker node in your cluster
The local container registry is used to host all the container images that are downloaded from internet. Typically, you must set up a local container registry on a node that
has no internet connection.
Follow these steps to set up the local registry:
1. Create the directories that are needed for the repository. Follow these commands:
# mkdir /opt/registry
# export REGISTRY_BASE="/opt/registry"
# mkdir -p ${REGISTRY_BASE}/{auth,certs,data,downloads}
# mkdir -p ${REGISTRY_BASE}/downloads/{images,tools,secrets}
# cd ${REGISTRY_BASE}/certs
2. Generate the self-signed certificate. Follow these commands:
# openssl req -newkey rsa:2048 -nodes -keyout domain.key -x509 -days 36500 -out domain.crt -subj
"/C=$CERT_COUNTRY/ST=$CERT_STATE/L=$CERT_LOCATION/O=$CERT_ORGANIZATION/OU=$CERT_ORGANIZATION_UNIT/CN=$CERT_COMMON_NAME/ema
ilAddress=$CERT_EMAIL" -addext "subjectAltName=DNS:$CERT_COMMON_NAME ,DNS:$CERT_COMMON_NAME.$DOMAIN_NAME"
for example ,
# openssl req -newkey rsa:2048 -nodes -keyout domain.key -x509 -days 36500 -out domain.crt -subj
"/C=MY/ST=TS/L=KL/O=TEST/OU=TESTABC/CN=api.xyzcluster.cp/emailAddress=abc@test.com" -addext
"subjectAltName=DNS:api.xyzcluster.cp ,DNS:api.xyzcluster.cp.abc.test.com"
Generating a RSA private key
.........................................................................................+++++
.......................+++++
writing new private key to 'domain.key'
You can see two files that are generated.
domain.crt
domain.key
3. Make sure you trust the self-signed certificate. It is needed for the oc command to be able to log in to your registry during the mirroring process. Follow these
commands:
# cp ${REGISTRY_BASE}/certs/domain.crt /etc/pki/ca-trust/source/anchors/
# update-ca-trust extract
4. Generate a username and password to access the registry.
Note: Install the httpd tool if it is not available.
# yum install httpd-tools
# htpasswd -bBc ${REGISTRY_BASE}/auth/htpasswd <user> <password>
For example,
# htpasswd -bBc ${REGISTRY_BASE}/auth/htpasswd admin <password>
Adding password for user admin
Check that the password is created.
# ls ${REGISTRY_BASE}/auth/
htpasswd
5. Start the registry. Follow these commands:
Note: Make sure that the port 5000 is open on your host. It is the default port for the registry.
# echo 'podman run --name my-registry --rm -d -p 5000:5000 \
-v ${REGISTRY_BASE}/data:/var/lib/registry:z \
-v ${REGISTRY_BASE}/auth:/auth:z -e "REGISTRY_AUTH=htpasswd" \
-e "REGISTRY_AUTH_HTPASSWD_REALM=Registry" \
-e "REGISTRY_HTTP_SECRET=ALongRandomSecretForRegistry" \
-e REGISTRY_AUTH_HTPASSWD_PATH=/auth/htpasswd \
-v ${REGISTRY_BASE}/certs:/certs:z \
-e REGISTRY_HTTP_TLS_CERTIFICATE=/certs/domain.crt \
-e REGISTRY_HTTP_TLS_KEY=/certs/domain.key \
docker.io/library/registry:2' > ${REGISTRY_BASE}/downloads/tools/start_registry.sh
# ls ${REGISTRY_BASE}/downloads/tools/
start_registry.sh
Change the file permission and run it again.
IBM Telco Network Cloud Manager - Performance 1.4.5 69

# chmod a+x ${REGISTRY_BASE}/downloads/tools/start_registry.sh
# ${REGISTRY_BASE}/downloads/tools/start_registry.sh
6. Verify the connectivity to the registry with curl command. Provide the username and password that is created in Step 4.
$ curl -u <user>:<password> -k https://registry:5000/v2/_catalog
{"repositories":[]}
Load the images to the local container registry
Run these steps from the same server where you have downloaded the Ceph images.
1. Run the following command to log in to the local container registry that is airgapped:
# skopeo login -u <user> -p <password> <local_container_registry_host>:5000
2. Load all the images that are downloaded from the source container registry to the local container registry. Follow these commands:
skopeo copy --all dir:/$HOME/<rookImages>/ceph-v17.2.1
docker://<local_container_registry_host>:5000/quay.io/ceph/ceph:v17.2.1
skopeo copy --all dir:/$HOME/<rookImages>/cephcsi-v3.6.2
docker://<local_container_registry_host>:5000/quay.io/cephcsi/cephcsi:v3.6.2
skopeo copy --all dir:/$HOME/<rookImages>/csi-snapshotter-v6.0.1
docker://<local_container_registry_host>:5000/registry.k8s.io/sig-storage/csi-snapshotter:v6.0.1
skopeo copy --all dir:/$HOME/<rookImages>/csi-attacher-v3.4.0
docker://<local_container_registry_host>:5000/registry.k8s.io/sig-storage/csi-attacher:v3.4.0
skopeo copy --all dir:/$HOME/<rookImages>/csi-node-driver-registrar-v2.5.1
docker://<local_container_registry_host>:5000/registry.k8s.io/sig-storage/csi-node-driver-registrar:v2.5.1
skopeo copy --all dir:/$HOME/<rookImages>/csi-resizer-v1.4.0
docker://<local_container_registry_host>:5000/registry.k8s.io/sig-storage/csi-resizer:v1.4.0
skopeo copy --all dir:/$HOME/<rookImages>/csi-provisioner-v3.1.0
docker://<local_container_registry_host>:5000/registry.k8s.io/sig-storage/csi-provisioner:v3.1.0
skopeo copy --all dir:/$HOME/<rookImages>/ceph-master docker://<local_container_registry_host>:5000/rook/ceph:master
3. Connect to the registry to check for the availability of the repositories. Follow these commands:
# curl -u <user>:<password> -k https://<local_container_registry_host>:5000/v2/_catalog
{"repositories":
["quay.io/ceph/ceph",
"quay.io/cephcsi/cephcsi",
"registry.k8s.io/sig-storage/csi-attacher",
"registry.k8s.io/sig-storage/csi-node-driver-registrar",
"registry.k8s.io/sig-storage/csi-provisioner",
"registry.k8s.io/sig-storage/csi-resizer",
"registry.k8s.io/sig-storage/csi-snapshotter",
"rook/ceph"]}
4. Pull the images from the local container registry and capture digests that related to Ceph® images. Follow these commands:
# podman login
Username: <user>
Password: <password>
# podman pull docker://<local_container_registry_host>:5000/quay.io/ceph/ceph:v17.2.1
# podman pull docker://<local_container_registry_host>:5000/quay.io/cephcsi/cephcsi:v3.6.2
# podman pull docker://<local_container_registry_host>:5000/registry.k8s.io/sig-storage/csi-snapshotter:v6.0.1
# podman pull docker://<local_container_registry_host>:5000/registry.k8s.io/sig-storage/csi-attacher:v3.4.0
# podman pull docker://<local_container_registry_host>:5000/registry.k8s.io/sig-storage/csi-node-driver-registrar:v2.5.1
# podman pull docker://<local_container_registry_host>:5000/registry.k8s.io/sig-storage/csi-resizer:v1.4.0
# podman pull docker://<local_container_registry_host>:5000/registry.k8s.io/sig-storage/csi-provisioner:v3.1.0
# podman pull docker://<local_container_registry_host>:5000/rook/ceph:master
5. Check the images with the following command:
# podman images --digests
REPOSITORY TAG DIGEST
IMAGE ID CREATED SIZE
rook/ceph master
sha256:d6e21278cc27b26c292d0be4c64c2f0c3422c035315db8637d1ba7332f79a93d 3f1b3854530c 45 hours ago 1.38 GB
quay.io/ceph/ceph v17.2.1
sha256:d3f3e1b59a304a280a3a81641ca730982da141dad41e942631e4c5d88711a66b e5af760fa1c1 13 days ago 1.32 GB
quay.io/cephcsi/cephcsi v3.6.2
sha256:28cf09273afe88570758393c30b9d4cffcd6e7428cfb9e96ee5b69510ec8d1df f14e6ab48b3e 4 weeks ago 1.43 GB
registry.k8s.io/sig-storage/csi-snapshotter v6.0.1
sha256:ad16874e2140256a809cada2b4ac3d931d5b73b0bee23ed0f8d60bdd778cfec2 22ad45d93cb3 6 weeks ago 56.9 MB
registry.k8s.io/sig-storage/csi-node-driver-registrar v2.5.1
sha256:0103eee7c35e3e0b5cd8cdca9850dc71c793cdeb6669d8be7a89440da2d06ae4 720dcdb19637 8 weeks ago 20.9 MB
registry.k8s.io/sig-storage/csi-resizer v1.4.0
sha256:9ebbf9f023e7b41ccee3d52afe39a89e3ddacdbb69269d583abfc25847cfd9e4 551fd931edd5 5 months ago 56.8 MB
registry.k8s.io/sig-storage/csi-provisioner v3.1.0
sha256:122bfb8c1edabb3c0edd63f06523e6940d958d19b3957dc7b1d6f81e9f1f6119 c3dfb4b04796 5 months ago 59.1 MB
registry.k8s.io/sig-storage/csi-attacher v3.4.0
sha256:8b9c313c05f54fb04f8d430896f5f5904b6cb157df261501b29adc04d2b2dc7b 03e115718d25 6 months ago 56.2 MB
Create Red Hat OpenShift ImageContentSourcePolicy
Create new ImageContentSourcePolicy on your Red Hat OpenShift cluster to enable the redirection of requests to pull images from a local container registry rather
than pulling them from internet. Complete the following steps from the Infra node of your Red Hat OpenShift cluster:
1. Paste the following content into a file. For example, osImgContentSrcPolicy.yaml:
70 IBM Telco Network Cloud Manager - Performance 1.4.5

apiVersion: operator.openshift.io/v1alpha1
kind: ImageContentSourcePolicy
metadata:
name: rook-ceph-images
spec:
repositoryDigestMirrors:
- mirrors:
- <local_container_registry_host>:5000/quay.io/ceph
source: quay.io/ceph
- mirrors:
- <local_container_registry_host>:5000/rook
source: docker.io/rook
- mirrors:
- <local_container_registry_host>:5000/registry.k8s.io/sig-storage
source: registry.k8s.io/sig-storage
- mirrors:
- <local_container_registry_host>:5000/quay.io/cephcsi
source: quay.io/cephcsi
2. Apply the osImgContentSrcPolicy.yaml file with the following command:
# oc apply -f osImgContentSrcPolicy.yaml
imagecontentsourcepolicy.operator.openshift.io/rook-ceph-images created
The Red Hat OpenShift Machine Config Operator updates the registry configuration settings on each node in the cluster and reloads the configuration. The
/etc/containers/registries.conf file is updated with the following lines:
unqualified-search-registries = ["registry.access.redhat.com", "docker.io"]
short-name-mode = ""
[[registry]]
prefix = ""
location = "docker.io/rook"
mirror-by-digest-only = true
[[registry.mirror]]
location = "<local_container_registry_host>:5000/rook"
[[registry]]
prefix = ""
location = "quay.io/ceph"
mirror-by-digest-only = true
[[registry.mirror]]
location = "<local_container_registry_host>:5000/quay.io/ceph"
[[registry]]
prefix = ""
location = "quay.io/cephcsi"
mirror-by-digest-only = true
[[registry.mirror]]
location = "<local_container_registry_host>:5000/quay.io/cephcsi"
[[registry]]
prefix = ""
location = "registry.k8s.io/sig-storage"
mirror-by-digest-only = true
[[registry.mirror]]
location = "<local_container_registry_host>:5000/registry.k8s.io/sig-storage"
Note: Notice the flag mirror-by-digest-only is set as true, which tells that the image must be referenced by the digest value and the image is pulled from its
mirror, the <local_container_registry_host>.
Install Ceph as a storage class
Ceph Storage can be used as storage for Telco Network Cloud Manager - Performance installation. Make sure that the appropriate disk is attached to the nodes and is
available for installation. Follow these steps:
1. Go to the folder where the Rook Ceph image files are copied and run following commands:
# cd <directory_path_to_copy>
# tar -zxvf rook.tgz
# cd rook/deploy/examples
# kubectl create -f crds.yaml -f common.yaml -f operator.yaml
Note:
2. Edit the YAML for the newly created deployments and update image to refer by the digest value instead of the tag. Follow these steps:
a. Log in to cloud web console and go to Workloads > Deployments.
b. Change the project to rook-ceph and search for the deployment.
c. Click the deployment and go to the YAML tab to edit it.
d. Search for image: section and update the value with digest value instead of the tag.
e. Save and reload.
f. Make sure that the Pods in the deployment are in running state.
3. Deploy the Red Hat OpenShift SCC with the following command:
# oc create -f operator-openshift.yaml
Note: Repeat step Step2.
4. Deploy rook cluster with the following command:
IBM Telco Network Cloud Manager - Performance 1.4.5 71

# oc create -f cluster.yaml
Note: Repeat step Step2.
5. Deploy the rook toolbox with the following command:
# oc create -f toolbox.yaml
deployment.apps/rook-ceph-tools created
Note: Repeat step Step2.
6. Check whether all the Ceph Pods are running. Follow these commands:
# oc get pods -n rook-ceph
NAME READY STATUS RESTARTS AGE
csi-cephfsplugin-gpd7r 3/3 Running 0 4h18m
csi-cephfsplugin-gxhqz 3/3 Running 0 4h18m
csi-cephfsplugin-provisioner-84c6d55d96-gh6zx 6/6 Running 0 69m
csi-cephfsplugin-provisioner-84c6d55d96-vgmj8 6/6 Running 0 69m
csi-cephfsplugin-x4jp9 3/3 Running 0 4h18m
csi-rbdplugin-7jvpv 3/3 Running 0 4h18m
csi-rbdplugin-n94vc 3/3 Running 0 4h18m
csi-rbdplugin-provisioner-748b4cd558-52c7z 6/6 Running 0 69m
csi-rbdplugin-provisioner-748b4cd558-wphkv 6/6 Running 0 69m
csi-rbdplugin-zffnd 3/3 Running 0 4h18m
rook-ceph-crashcollector-worker0.tncpqacluster4.cp.fyre.ib7472z 1/1 Running 0 13m
rook-ceph-crashcollector-worker1.tncpqacluster4.cp.fyre.iblpp97 1/1 Running 0 26m
rook-ceph-crashcollector-worker2.tncpqacluster4.cp.fyre.ibw5tt6 1/1 Running 0 13m
rook-ceph-mds-myfs-a-55667f46b5-qhq48 1/1 Running 0 13m
rook-ceph-mds-myfs-b-585fb8d46f-fp45d 1/1 Running 0 13m
rook-ceph-mgr-a-547586d6fb-8z7sw 2/2 Running 0 26m
rook-ceph-mgr-b-795976fc48-p526t 2/2 Running 0 26m
rook-ceph-mon-a-7cc4d4c87b-pbr2r 1/1 Running 0 27m
rook-ceph-mon-b-88d4d8c66-z4gcn 1/1 Running 0 27m
rook-ceph-mon-c-575b49f65f-2tvr9 1/1 Running 0 27m
rook-ceph-operator-77bb58dbb9-9m5fv 1/1 Running 0 28m
rook-ceph-osd-0-86df9d4549-h6696 1/1 Running 0 26m
rook-ceph-osd-1-58f9dddfb9-z2dn9 1/1 Running 0 26m
rook-ceph-osd-2-85465697f9-mhkdf 1/1 Running 0 26m
rook-ceph-osd-3-6f8fbc797c-47c8q 1/1 Running 0 26m
rook-ceph-osd-4-5fff7f944-dbfq6 1/1 Running 0 26m
rook-ceph-osd-5-6f76c5c48c-rgfzl 1/1 Running 0 26m
rook-ceph-osd-prepare-5f953fa7e1fb55e6f1eab3315fd074b3-xgxsk 0/1 Completed 0 25m
rook-ceph-osd-prepare-a610dfe215b77a688b44e67f5a041c2e-l7qch 0/1 Completed 0 25m
rook-ceph-osd-prepare-e51f434f3bbc84edaa08b061130c141b-24vl6 0/1 Completed 0 25m
rook-ceph-tools-668489b76d-rgjrh 1/1 Running 0 158m
7. Create a Ceph shared file system with the following command:
kubectl create -f filesystem.yaml
cephfilesystem.ceph.rook.io/myfs created
Note: Repeat step Step2.
8. Check whether the corresponding file system Pods are running with the following command:
kubectl -n rook-ceph get pod -l app=rook-ceph-mds
NAME READY STATUS RESTARTS AGE
rook-ceph-mds-myfs-a-55667f46b5-qhq48 1/1 Running 0 27s
rook-ceph-mds-myfs-b-585fb8d46f-fp45d 1/1 Running 0 27s
9. Create a storage class with the following command:
kubectl create -f csi/cephfs/storageclass.yaml
storageclass.storage.k8s.io/rook-cephfs created
Note: Repeat step Step2.
10. Check whether the storage class is created with the following command:
kubectl get sc -n rook-ceph
NAME PROVISIONER RECLAIMPOLICY VOLUMEBINDINGMODE ALLOWVOLUMEEXPANSION AGE
rook-cephfs rook-ceph.cephfs.csi.ceph.com Delete Immediate true 47s
11. Execute into the rook toolbox Pod and make sure that the Ceph cluster is healthy with the following command:
kubectl -n rook-ceph exec -it deploy/rook-ceph-tools -- bash
$ ceph status
cluster:
id: 7e6e3a0d-0429-4aea-bdf8-8ca1cc1969b0
health: HEALTH_OK
services:
mon: 3 daemons, quorum c,b,a (age 16m)
mgr: a(active, since 15m), standbys: b
mds: 1/1 daemons up, 1 hot standby
osd: 6 osds: 6 up (since 15m), 6 in (since 16m)
data:
volumes: 1/1 healthy
pools: 3 pools, 49 pgs
objects: 24 objects, 451 KiB
usage: 130 MiB used, 1.2 TiB / 1.2 TiB avail
pgs: 49 active+clean
72 IBM Telco Network Cloud Manager - Performance 1.4.5

io:
client: 853 B/s rd, 1 op/s rd, 0 op/s wr
Mirroring images on the bastion host
Procedure
1. Download the IBM® Telco Network Cloud Manager - Performance archive and image inventory to the offline store.
a. On your bastion host, create the following environment variables with the installer image name and the image inventory:
export CASE_ARCHIVE=ibm-tncp-case-1.4.5.tgz
export CASE_INVENTORY_SETUP=operator
b. Download the archive and image inventory to the offline store:
cloudctl case save \
--case https://github.com/IBM/cloud-pak/raw/master/repo/case/${CASE_ARCHIVE} \
--outputdir /tmp/cases
Downloading and extracting the CASE ...
- Success
Retrieving CASE version ...
- Success
Validating the CASE ...
- Success
Creating inventory ...
- Success
Finding inventory items
- Success
Resolving inventory items ...
Parsing inventory items
- Success
c. Run the following command to verify that the CASE and the image CSV files are available:
ls /tmp/cases/
total 32K
drwxr-xr-x 2 jey 64 Apr 22 23:37 charts/
-rw-r--r-- 1 jey 22K Apr 22 23:37 ibm-tncp-case-1.4.5.tgz
-rw-r--r-- 1 jey 32 Apr 22 23:37 ibm-tncp-case-1.4.5-charts.csv
-rw-r--r-- 1 jey 795 Apr 22 23:37 ibm-tncp-case-1.4.5-images.csv
d. Log in to the OpenShift® cluster as a cluster administrator
oc login <cluster host:port> --username=<cluster admin user> --password=<cluster admin password>
2. Configure the registry authorization. Follow these steps:
a. Create auth secret for the source image registry with the following commands:
cloudctl case launch --case /tmp/cases/${CASE_ARCHIVE}
--namespace tncp --inventory operator --action configure-creds-airgap
--args "--registry cp.icr.io --user <user_name> --pass <password>"
Welcome to the CASE launcher
Attempting to retrieve and extract the CASE from the specified location
[✓] CASE has been retrieved and extracted
Attempting to validate the CASE
Skipping CASE validation...
Attempting to locate the launch inventory item, script, and action in the specified CASE
[✓] Found the specified launch inventory item, action, and script for the CASE
Attempting to check the cluster and machine for required prerequisites for launching the item
Checking for required prereqs...
No requires section specified.
Required prereqs result: OK
Checking user permissions...
No user rules specified.
[✓] Cluster and Client Prerequisites have been met for the CASE
Running the CASE operator launch script with the following action context: configureCredsAirgap
Executing inventory item operator, action configureCredsAirgap : launch.sh
-------------Configuring authentication secret-------------
[INFO] Creating registry authencation secret for cp.icr.io
[INFO] Registry secret created in /root/.airgap/secrets/cp.icr.io.json
[INFO] Done
[✓] CASE launch script completed successfully
OK
b. Create auth secret for target image registry with the following commands:
cloudctl case launch --case /tmp/cases/${CASE_ARCHIVE}
--namespace tncp --inventory operator --action configure-creds-airgap
--args "--registry <cluster host:port> --user <user_name> --pass <password>"
Welcome to the CASE launcher
Attempting to retrieve and extract the CASE from the specified location
[✓] CASE has been retrieved and extracted
Attempting to validate the CASE
Skipping CASE validation...
Attempting to locate the launch inventory item, script, and action in the specified CASE
[✓] Found the specified launch inventory item, action, and script for the CASE
IBM Telco Network Cloud Manager - Performance 1.4.5 73

Attempting to check the cluster and machine for required prerequisites for launching the item
Checking for required prereqs...
No requires section specified.
Required prereqs result: OK
Checking user permissions...
No user rules specified.
[✓] Cluster and Client Prerequisites have been met for the CASE
Running the CASE operator launch script with the following action context: configureCredsAirgap
Executing inventory item operator, action configureCredsAirgap : launch.sh
-------------Configuring authentication secret-------------
[INFO] Creating registry authencation secret for tncpcluster4-inf:5000
[INFO] Registry secret created in /root/.airgap/secrets/tncpcluster4-inf:5000.json
[INFO] Done
[✓] CASE launch script completed successfully
OK
3. Mirror the images from the Docker registry server with the following command:
cloudctl case launch --case /tmp/cases/${CASE_ARCHIVE}
--namespace tncp --inventory operator --action mirror-images
--args "--registry <cluster host:port> --inputDir /tmp/cases"
All the images that are listed in the downloaded CASE that are in the images.csv file are copied to the target registry in the air-gap environment.
Creating a route
An Red Hat OpenShift route is a way to expose a service by giving it an externally reachable hostname. The Red Hat OpenShift routers provide external hostname mapping
and load balancing to services over protocols that pass distinguishing information directly to the router. The hostname must be present in the protocol in order for the
router to determine where to send it.
About this task
Use this information to understand the steps to create a route for a service as needed. In this example, a route for the DiamondDB Service is created. You can use the
route to access the database directly by using it.
CAUTION:
Only the Dashboard Service and NiFi Service routes that are automatically created after the installation of Telco Network Cloud Manager - Performance is secured. All
other routes that are manually created are not secure. Therefore, exercise caution when you create routes for other services.
Procedure
1. Log in to the OpenShift® Container Platform web console for your cluster.
2. Make sure you are in the correct project where Telco Network Cloud Manager - Performance is installed.
3. Navigate to Networking > Routes.
4. Click Create Route and provide the following details:
Field Value Description
Name diamonddb A unique name for the route within the project.
Hostname You can leave it empty. Public hostname for the route. If not specified, a hostname is generated.
Path /Path that the router watches to route traffic to the service.
Service diamond-db Select a service for which you want to create a route from the list.
Target Port 30010 ->30010 (TCP) Select the port number for the service.
5. Select the Secure Route checkbox to create https URL of the route.
Note: For all the even number ports, http is used and for odd number ports, https is used.
6. Click Create.
You can see the route that is created in the Routes page.
7. Click the route to access the Diamond DB service node. Append the SQL statement to the URL to retrieve data from the database.
For example, http://diamonddb-<myserver.ibm.com>/api/execute?sql=show tables&format=csv
8. Optional: If you are configuring Geo-redundancy, create the required routes.
For more information, see Enabling Geo-redundancy.
Related information
Port requirements for a typical installation
Installing Technology Packs
Use this information to install the Technology Pack content that is available with Telco Network Cloud Manager - Performance installation media. The ready-to-use
Technology Pack content includes predefined vendor-specific discovery formulas, collection formulas, and metrics that you can use for discovery and polling the devices.
74 IBM Telco Network Cloud Manager - Performance 1.4.5

Before you begin
Make sure to install, set up your cluster, and configure your Telco Network Cloud Manager - Performance system successfully.
Make sure to install Telco Network Cloud Manager - Performance Operator.
Make sure to download the Technology Pack bundles.
Make sure that the NiFi Service is scaled to 1 to enable the creation of the NiFi template successfully. Follow these steps:
About this task
Categorization of the Technology Packs is as follows. For more information, see Media content.
Technology Pack Architecture type Device type Dependencies
ACME Packet Net-Net 9200 HDR v1.3.0 File-based Wireline Network Health v1.18.0
ACME Packet Net-Net 9200 HDR-SBC v1.1.0 File-based Wireline Network Health v1.18.0
File-based Wireline Network Health v1.18.0
Ciena Transmission v1.3.0 File-based Wireline Network Health v1.18.0
Cisco EPNM v1.0.0 File-based Wireline Network Health v1.18.0
Cisco SD-WAN v1.4.0 File-based Wireline Network Health v1.18.0
SDWAN GOM v1.5.0
Fortinet SD-WAN v1.0.1 File-based Wireline Network Health v1.18.0
SDWAN GOM v1.5.0
GSM Huawei BSS V900R021C10SPC600 v1.5.0 File-based Wireless Network Wireless v1.4.0
GSM Huawei STP V200R005C08 v1.0.0 File-based Wireless Network Wireless v1.4.0
GSM Tekelec STP R46-1 v1.1.0 File-based Wireless Network Wireless v1.4.0
Huawei iManager U2000 V200R016C60 v1.3.1 File-based Wireline Neutral Access Gom v1.8.0
Network Health v1.18.0
Infoblox DNS v1.0.0
Load Balancer for F5 BIG-IP v1.7.0 SNMP Wireline Network Health v1.18.0
LTE Cisco vEPC v1.0.0 File-based Wireless Network Wireless v1.4.0
LTE Huawei EUTRAN V100R015C10 v1.5.0 File-based Wireless Network Wireless v1.4.0
LTE Huawei IMS v1.0.0 File-based Wireless Network Wireless v1.4.0
LTE Huawei HSS V900R008 v1.1.0 File-based Wireless Network Wireless v1.4.0
LTE Huawei MME V900R018C10 v1.1.0 File-based Wireless Network Wireless v1.4.0
LTE Huawei PCRF V300R005C00 v1.1.0 File-based Wireless Network Wireless v1.4.0
LTE Huawei SGWPGW V900R018C10 v1.2.0 File-based Wireless Network Wireless v1.4.0
LTE ZTE EUTRAN IR14 v1.0.0 File-based Wireless Network Wireless v1.4.0
Cloud Kubernetes v1.8.0 File-based Cloud None
Cloud VMWare vSphere v1.1.0 File-based Cloud None
Network Access GPON for Huawei OLTs v1.5.0 SNMP Wireline Neutral Access Gom v1.8.0
Network Health v1.18.0
Network Cisco MPLS v1.1.0 SNMP Wireline Network Health v1.18.0
Neutral Access Gom v1.8.0
Network Ethernet Accedian v1.1.0 SNMP Wireline Network Health v1.18.0
Network Ethernet Adva Optical v1.2.0 SNMP Wireline Network Health v1.18.0
Network Cisco IP SLA Ethernet v1.0.0 SNMP Wireline Network Health v1.18.0
Network Flow v1.3.0 Flow Flow Network Health v1.18.0
Network Health Generic v1.7.0
Network Health Extension v1.7.0
Network Health (extension) v1.7.0 SNMP Wireline Network Health v1.18.0
Network Health Generic v1.7.0
Network Health for Cisco Devices v1.5.0 SNMP Wireline Network Health v1.18.0
Network Health Generic v1.7.0
Network Health for Huawei Devices v1.4.0 SNMP Wireline Network Health v1.18.0
Network Health Generic v1.7.0
Network Health for Juniper Devices v1.4.0 SNMP Wireline Network Health v1.18.0
Network Health Generic v1.7.0
Network Health Generic v1.7.0 SNMP Wireline Network Health v1.18.0
Network Health v1.18.0 SNMP Wireline None
Network Cisco MPLS v1.1.0 SNMP Wireline Network Health v1.18.0
Network Huawei MPLS TE v1.0.0 SNMP Wireline Network Health v1.18.0
Network Juniper MPLS v1.2.0 SNMP Wireline Network Health v1.18.0
Network Generic MPLS LSP v1.1.0 SNMP Wireline Network Health v1.18.0
Network Juniper MPLS RSVP Tunnel v1.0.0 SNMP Wireline Network Health v1.18.0
Network Probe for Cisco IPSLA v1.6.0 SNMP Wireline Network Health v1.18.0
IBM Telco Network Cloud Manager - Performance 1.4.5 75

Technology Pack Architecture type Device type Dependencies
Network Probe for Huawei NQA v1.8.0 SNMP Wireline Network Health v1.18.0
Network Probe for Juniper RPM v1.9.0 SNMP Wireline Network Health v1.18.0
Network QoS for Cisco CBQoS v1.5.0 SNMP Wireline Network Health v1.18.0
Network QoS for Huawei CBQoS v1.5.0 SNMP Wireline Network Health v1.18.0
Network QoS for Juniper CoS v1.4.0 SNMP Wireline Network Health v1.18.0
Network Wireless v1.4.0 File-based Wireless None
Neutral Access GOM v1.8.0 SNMP Wireline Network Health v1.18.0
Network Access Nokia v1.4.0 File-based Wireline Neutral Access Gom v1.8.0
Network Health v1.18.0
Nokia NSP v1.4.0 File-based Wireline Network Health v1.18.0
SDWAN GOM v1.5.0 File-based Wireline Network Health v1.18.0
NR Huawei NUTRAN V100R015C10 v1.5.0 File-based Wireless Network Wireless v1.4.0
UMTS Huawei MGW V200R010C20 v1.2.0 File-based Wireless Network Wireless v1.4.0
UMTS Huawei MSCS V200R011C10 v1.5.0 File-based Wireless Network Wireless v1.4.0
UMTS Huawei UTRAN V100R015C10SPC156 v1.5.0 File-based Wireless Network Wireless v1.4.0
UMTS ZTE UTRAN UR17 v1.1.0 File-based Wireless Network Wireless v1.4.0
WiFi Health for Cisco Controllers v1.7.0 SNMP Wireline Network Health v1.18.0
Note:
The Global Object Model (gom) is designed to define a base set of vendor-neutral objects that can be reused across technologies and vendors.
Network Health (Extension) v1.7.0 is the dependent Technology Pack for all Wireline SNMP packs and also the Flow pack.
SNMP Technology Packs have the following content with in the sub folders:
dashboard
json
Contains specific dashboard JSON files.
menus
Contains menu definitions for the SNMP pack specific dashboards.
properties
Contains all the dashboard properties files for all translated languages.
Note: Dashboards are available in some packs only.
discovery
Contains a folder with the name of the Technology Pack
that has the discovery files with the extension .discovery.
inventory
With in the model folder, Property and Relationship subfolders are available. These folders contain the inventory model files that contain properties and
relationships in the resources. Both property and relationship files have the extension .model.
Note: The inventory folder is available in some packs only.
metrics
Contains the metric files that are organized according to the available Resource types in the pack. Metric files have the extension .metric.
snmp
It has formulas and mibs sub folders. The formulas folder contains the collection formula files with the extension .formula. All the formulas are organized according
to the available Resource types in the pack. The mibs folder contains the MIB files that needed for the Technology Pack.
pack-<pack_name>-details.xlsx
Contains an excel file with all the pack content. For example, pack-network-probe-juniper-details.xlsx.
pack.properties
Contains pack metadata and the dependent packs information.
File-based Technology Packs have the following content:
analytics
Contains predefined batch jobs, streams, and user-defined calculations that are imported directly when the pack is installed as JSON files. You can see these
default jobs and user-defined calculations in Batch Analytics and User-Defined Calculations administration pages. This content is available in some packs only.
file
It has the following subfolders:
discoveries
Contains a folder with the name of the Technology Pack that has the discovery files with the extension .discovery.
formulas
Contains a folder with the name of the Technology Pack that has the collection formula files with the extension .formula. All the formulas are organized
according to the available Resource types in the pack.
inventory
With in the model folder, Property and Relationship sub folders are available. These folders contain the inventory model files that contain properties and parent-
child relationship within the resources. Both property and relationship files have the extension .model.
metrics
Contains the metric files that are organized according to the available Resource types in the pack. Metric files have the extension .metric.
nifi-collector
76 IBM Telco Network Cloud Manager - Performance 1.4.5

Contains Apache NiFi related files that include the NiFi flow templates, lookup files, and so on.
pack-<pack_name>-details.xlsx
An excel file with all the pack content. For example, pack-nr-huawei-nutran-v100r015c10-1.0.0-details.xlsx.
pack.properties
Contains pack metadata and the dependent packs.
Flow Technology Pack has the following content:
dashboard
json
Contains all the Flow dashboard JSON files.
menus
Contains all the Flow dashboard menu definitions as JSON files.
properties
Contains all the Flow dashboard properties files for all translated languages.
flow
Contains all the Flow metric formulas as .formula files.
inventory
With in the model folder, Property and Relationship sub folders are available. These folders contain the inventory model files that contain properties and parent-
child relationship within the resources. Both property and relationship files have the extension .model.
metrics
Contains the metric files that are organized according to the available Resource types in the pack. Metric files have the extension .metric.
pack-network-flow-details.xlsx
An excel file with all the pack content.
pack.properties
Contains pack metadata and the dependent packs.
Network Wireless Technology Pack
dashboard
json
Contains all the mobile dashboard JSON files.
menus
Contains all the mobile dashboard menu as JSON files.
properties
Contains all the mobile dashboard properties files for all translated languages.
inventory
With in the model folder, Property and Relationship sub folders are available. These folders contain the inventory model files that contain properties and parent-
child relationship within the resources. Both property and relationship files have the extension .model.
pack-network-wireless-details.xlsx
An excel file with all the pack content.
pack.properties
Contains pack metadata.
Procedure
1. Download the packs to a directory in your local file system.
For example, <DIST_DIR_PACKS>/packs.
2. Make sure that all the services in Telco Network Cloud Manager - Performance are scaled up.
3. Access Telco Network Cloud Manager - Performance dashboards.
4. Click Administration > Pack management > Pack service.
You can see the Pack service page that has a grid. After you import the packs, you can the list of packs and their details.
5. Click the Import ( ) icon from the upper right of the page and select the Technology Pack JAR file that you want to import and click Upload.
The maximum size of the JAR file must be less than 500 MB.
You can see the Technology Pack in the grid.
6. Click the Deploy ( ) icon in the Actions pane and select Validate.
This action validates the pack content and displays validation errors if any.
After the validation is successful, you can see the Validated message in the State column on the Pack service page.
7. Click the Deploy ( ) icon in the Actions pane and select Deploy to deploy the pack.
Before the pack is deployed, it is validated and displays validation errors if any. After that, the state is changed to deploying.
8. Check the installation log file from the following location:
From the Pack service UI, click the link in the State column for a specific Technology Pack to view the Pack log messages for the pack.
IBM Telco Network Cloud Manager - Performance 1.4.5 77

9. If the Technology Packs have the Batch Analytics jobs, streams, and User-Defined Calculations (UDCs), check in analytics-stream-
0:/opt/basecamp/analytics/work/pack-installation.logs file until it is completed, make sure that it has no errors.
Results
The following services are scaled up after the installation of Telco Network Cloud Manager - Performance Technology Packs:
SNMP Discovery and SNMP Collector
If an SNMP Technology Pack is installed, the pack installer scales up these services, and then starts these collectors.
NiFi and File Collector
If a file-based Technology Pack is installed, the pack installer scales up these services, and then starts these collectors.
Analytics Stream and Analytics Batch
If a Technology Pack that contains the preconfigured streams or batch jobs is installed, the pack installer scales up these services, and then it starts these services.
DNS Collector, Flow Collector, and Flow Analytics
If the Network Flow Technology Pack is installed, the pack installer scales up these services, and then starts these services.
For File-based Technology Packs, all the NiFi templates are automatically uploaded to Apache NiFi UI. The content within the pack is distributed to different
services in vendor-specific directories. Verify that the templates are available in the NiFi UI.
What to do next
78 IBM Telco Network Cloud Manager - Performance 1.4.5

After the Technology Packs are installed, you might not see the default dashboard menus on the Telco Network Cloud Manager - Performance Dashboards. Manually,
publish the menus. See Optional: Publishing Telco Network Cloud Manager - Performance Dashboards menus.
Related tasks
Setting up Apache NiFi
Managing streams for metrics
Managing User-defined calculations (UDC)
Setting up LDAP authentication
Lightweight Directory Access Protocol (LDAP) provides an extra security to user management. LDAP server implementations are typically tailored to the needs of your
organization. You can either use your own LDAP server and the configured users or use the built-in OpenLDAP by specifying the LDAP credentials (username and
password) to log in to Telco Network Cloud Manager - Performance.
About this task
After the installation of Telco Network Cloud Manager - Performance, the common Config Map is created with default LDAP settings. You can modify the settings according
to your requirements.
Procedure
1. Log in to the OpenShift® Container Platform web console of your cluster.
2.
Select tncp from Namespace pane.
3.
Select tncp from Projects pane.
4.
Expand Workloads > Config Maps > common in the Config and Storage pane in the navigation pane.
5. Expand Workloads > Config Maps > common.
6. Observe the following properties in common Config Map.
security.provider=ldap
security.ldap.hostname=security
7. Optional: Edit the common Config Map directly from OpenShift Container Platform web console.
8. If you change the common Config Map, rename the tncp-operator in the annotations section as follows:
annotations:
manager: tncp-operator-<updated>
It is to make sure that on the Operator does not revert your changes to default.
9. Restart the following Services in order that have authentication with Security Service:
Inventory
UI
Dashboard
Batch Analytics
Streaming Analytics
Apps
Threshold
SNMP Discovery
Creating an LDAP user
The Security Service has an OpenLDAP image that is integrated with it. OpenLDAP software is an open source implementation of the Lightweight Directory Access
Protocol. If you want to use the built-in OpenLDAP server, use this information to create user credentials to log in to Telco Network Cloud Manager - Performance.
Related information
Controlling the Telco Network Cloud Manager - Performance services
Creating an LDAP user
The Security Service has an OpenLDAP image that is integrated with it. OpenLDAP software is an open source implementation of the Lightweight Directory Access
Protocol. If you want to use the built-in OpenLDAP server, use this information to create user credentials to log in to Telco Network Cloud Manager - Performance.
About this task
IBM Telco Network Cloud Manager - Performance 1.4.5 79

Many options are available to create a user in LDAP. You can use the commands that are provided here to create a user without an LDIF file. LDIF, or the LDAP Data
Interchange Format, is a text format for representing LDAP data and commands.
Procedure
1. Log in to your cloud platform web console.
2. Make sure you are in tncp project or namespace.
3. Click Workloads > Pods.
4. Click Security Pod and access the terminal.
5. To create user <usename> in a file <usename>, use these commands:
For example, to create a user charlie,
echo -e "dn: cn=charlie,ou=people,dc=customer,dc=com\nobjectclass: inetOrgPerson\ncn: charlie\nsn: charlie\nuid:
charlie\nuserPassword: charlie" > /tmp/<charlie>
You can see the charlie user file without ldif extension in the output:
adddashboardusersgroup.ldif addnpiadministratorsgroup.ldif charlie npi1.ldif
The following content can be seen in the charlie file:
# cat charlie
dn: cn=charlie,ou=people,dc=customer,dc=com
objectclass: inetOrgPerson
cn: charlie
sn: charlie
uid: charlie
userPassword: charlie
6. Add user charlie to LDAP with this command:
ldapadd -H ldap://:1389/ -x -D "cn=admin,dc=customer,dc=com" -f /tmp/charlie -w admin
Enter the password for LDAP. By default, it is admin. You can see the following output:
adding new entry "cn=charlie,ou=people,dc=customer,dc=com"
7. Create a file to add user charlie to npiusers group with this command:
echo -e "dn: cn=npiusers,ou=groups,dc=customer,dc=com\nchangetype: modify\nadd: uniqueMember\nuniqueMember:
cn=charlie,ou=people,dc=customer,dc=com\n" > /tmp/charlienpiusersgroup
The following content can be seen in the file:
#cat /tmp/charlienpiusersgroup
dn: cn=npiusers,ou=groups,dc=customer,dc=com
changetype: modify
add: uniqueMember
uniqueMember: cn=charlie,ou=people,dc=customer,dc=com
8. Add user charlie to npiusers group with this command:
ldapmodify -H ldap://:1389/ -x -D "cn=admin,dc=customer,dc=com" -f /tmp/charlienpiusersgroup -w admin
Enter the password for LDAP. By default, it is admin. You can see the following output:
modifying entry "cn=npiusers,ou=groups,dc=customer,dc=com"
9. Create file to add user charlie into dashboardusers group with this command:
echo -e "dn: cn=dashboardusers,ou=groups,dc=customer,dc=com\nchangetype: modify\nadd: uniqueMember\nuniqueMember:
cn=charlie,ou=people,dc=customer,dc=com\n" > /tmp/charliedashboardusersgroup
The following content can be seen in the file:
#cat /tmp/charliedashboardusersgroup
dn: cn=dashboardusers,ou=groups,dc=customer,dc=com
changetype: modify
add: uniqueMember
uniqueMember: cn=charlie,ou=people,dc=customer,dc=com
10. Add user charlie into dashboardusers group with this command:
ldapmodify -H ldap://:1389/ -x -D "cn=admin,dc=customer,dc=com" -f /tmp/charliedashboardusersgroup -w admin
Enter the password for LDAP. By default, it is admin. You can see the following output:
modifying entry "cn=dashboardusers,ou=groups,dc=customer,dc=com"
11. Run a search to ensure that the user charlie is created and is added to npiusers and dashboardusers groups with this command:
ldapsearch -H ldap://:1389/ -x -b dc=customer,dc=com -D "cn=admin,dc=customer,dc=com" -w admin
The following output can be seen:
extended LDIF
#
# LDAPv3
# base <dc=customer,dc=com> with scope subtree
# filter: (objectclass=*)
# requesting: ALL
#
80 IBM Telco Network Cloud Manager - Performance 1.4.5

# customer.com
dn: dc=customer,dc=com
objectClass: dcObject
objectClass: organization
dc: customer
o: example
# users, customer.com
dn: ou=users,dc=customer,dc=com
objectClass: organizationalUnit
ou: users
# user01, users, customer.com
dn: cn=user01,ou=users,dc=customer,dc=com
cn: User1
cn: user01
sn: Bar1
objectClass: inetOrgPerson
objectClass: posixAccount
objectClass: shadowAccount
userPassword:: Yml0bmFtaTE=
uid: user01
uidNumber: 1000
gidNumber: 1000
homeDirectory: /home/user01
# user02, users, customer.com
dn: cn=user02,ou=users,dc=customer,dc=com
cn: User2
cn: user02
sn: Bar2
objectClass: inetOrgPerson
objectClass: posixAccount
objectClass: shadowAccount
userPassword:: Yml0bmFtaTI=
uid: user02
uidNumber: 1001
gidNumber: 1001
homeDirectory: /home/user02
# readers, users, customer.com
dn: cn=readers,ou=users,dc=customer,dc=com
cn: readers
objectClass: groupOfNames
member: cn=user01,ou=users,dc=customer,dc=com
member: cn=user02,ou=users,dc=customer,dc=com
# people, customer.com
dn: ou=people,dc=customer,dc=com
ou: people
description: people
objectClass: organizationalUnit
# groups, customer.com
dn: ou=groups,dc=customer,dc=com
ou: groups
description: groups
objectClass: organizationalUnit
# npiadmin, people, customer.com
dn: cn=npiadmin,ou=people,dc=customer,dc=com
objectClass: inetOrgPerson
cn: npiadmin
sn: npiadmin
uid: npiadmin
userPassword:: bnBpYWRtaW4=
# npiuser, people, customer.com
dn: cn=npiuser,ou=people,dc=customer,dc=com
objectClass: inetOrgPerson
cn: npiuser
sn: npiuser
uid: npiuser
userPassword:: bnBpdXNlcg==
# npiadministrators, groups, customer.com
dn: cn=npiadministrators,ou=groups,dc=customer,dc=com
objectClass: groupOfUniqueNames
cn: npiadministrator
cn: npiadministrators
uniqueMember: cn=npiadmin,ou=people,dc=customer,dc=com
# npiusers, groups, customer.com
dn: cn=npiusers,ou=groups,dc=customer,dc=com
objectClass: groupOfUniqueNames
cn: npiuser
cn: npiusers
uniqueMember: cn=npiuser,ou=people,dc=customer,dc=com
uniqueMember: cn=charlie,ou=people,dc=customer,dc=com
# dashboardusers, groups, customer.com
dn: cn=dashboardusers,ou=groups,dc=customer,dc=com
objectClass: groupOfUniqueNames
cn: dashboarduser
cn: dashboardusers
uniqueMember: cn=npiadmin,ou=people,dc=customer,dc=com
IBM Telco Network Cloud Manager - Performance 1.4.5 81

uniqueMember: cn=npiuser,ou=people,dc=customer,dc=com
uniqueMember: cn=charlie,ou=people,dc=customer,dc=com
# charlie, people, customer.com
dn: cn=charlie,ou=people,dc=customer,dc=com
objectClass: inetOrgPerson
cn: charlie
sn: charlie
uid: charlie
userPassword:: Y2hhcmxpZQ==
# search result
search: 2
result: 0 Success
# numResponses: 14
# numEntries: 13
What to do next
Create the same user in Dashboard Designer and assign the needed roles.
Related information
User administration from Designer tool
Authenticating with Microsoft Active Directory users
Microsoft Active Directory can be used for managing user authentication and user data. The Microsoft Active Directory provides a Lightweight Directory Access Protocol
(LDAP) service. Therefore, WebSphere® Application Server supports LDAP and WebSphere Application Server supports the Microsoft Active Directory.
Follow these steps:
Before you begin
Configure Jazz for Service Management with Microsoft Active Directory
Create users and groups in Microsoft Active Directory
Create users in Dashboard Designer
Access the Telco Network Cloud Manager - Performance Dashboards with the users from Microsoft Active Directory repository
Before you begin
Ensure that you have performed the following task:
Set up the federation between Jazz® for Service Management and Telco Network Cloud Manager - Performance to work correctly and to access the web-based
visualizations. For more information, see Setting up integration with Jazz for Service Management.
Configure Jazz for Service Management with Microsoft Active Directory
You can authenticate Telco Network Cloud Manager - Performance dashboards with users from an Active Directory database on a Lightweight Directory Access Protocol
(LDAP) server. With this method, you use the standard user accounts that are registered with the LDAP server. The same user ID can be used to authenticate to the TNCP
application and to the LDAP server. Follow these steps:
1. Log in to Dashboard Application Services Hub portal as smadmin user.
2. Expand Console Settings ( ) > WebSphere Administrative Console.
3. Select Security > Global security.
4. From the Available realm definitions list, select Federated repositories and click Configure.
5. Click Manage repositories and select LDAP repository from the Add list.
6. Provide the following details:
82 IBM Telco Network Cloud Manager - Performance 1.4.5

Specify a unique identifier for the repository.
Select Microsoft Windows Active Directory from the Directory type list.
Specify the primary hostname of the LDAP server and port number.
Specify the distinguished name and bind password for the application server, which is used to bind to the directory server.
7. Click OK and then Save.
8. Save the configuration and restart the Dashboard Application Services Hub portal by using the following command:
$/opt/IBM/JazzSM/profile/bin/stopServer.sh server1 -username smadmin -password Smadmin01
Ensure that all the Java™ processes associated with Dashboard Application Services Hub are stopped, and then start the server by using the following command:
$/opt/IBM/JazzSM/profile/bin/startServer.sh server1
Create users and groups in Microsoft Active Directory
Create the users and groups in Active Directory and add the users to each of the groups. Follow these steps:
1. Click Start
2. On the Active Directory domain controller, open Active Directory Users and Computers.
For example, create the user john.doe to represent a domain user with a valid logon account.
Note: If the users are existing, then go to step 4 to create groups and add the users to the groups.
3. Select Action > New > User and follow the prompts to create a new Active Directory user.
4. Select Action > New > Group and follow the prompts to create a new Active Directory group.
Create the following groups:
ConsoleAdmin
ConsoleUser
dashboarduser
manager-gui
manager-jmx
manager-script
manager-status
npiadministrator
npiuser
ReadAdmin
WriteAdmin
5. Create the following custom groups:
ldap-user-group1
ldap-admin-group1
6. Right-click the username and select Add to a group to add the new user to the new group.
You might also want to add your own Windows account to the new group. Adding your own account to the Telco Network Cloud Manager - Performance groups
makes it easy to demonstrate some features, such as assigning roles to group members.
Create users in Dashboard Designer
See User administration from Designer tool.
Update the Dashboard Service YAML file
Log in to your cloud platform web console.
Click Workloads > Stateful Sets > file-collector.
Add the parameters and their values to the dashboard Stateful Set YAML file.
IBM Telco Network Cloud Manager - Performance 1.4.5 83

From the file-collector service, click the Actions( ) icon, and select Edit Stateful Set.
The Edit a resource page loads. Add the parameters and their values.
Click the Edit resource icon ( ) to add the parameters and their values.
Add the security.dash.group-mapping parameter in args: section and specify a value.
security.dash.group-mapping": "ldap-user-group1->npiuser,dashboarduser,ConsoleUser|ldap-admin-group1
>npiadministrator,dashboarduser,ConsoleAdmin
Access the Telco Network Cloud Manager - Performance Dashboards with the users from
Microsoft Active Directory repository
Access the Telco Network Cloud Manager - Performance Dashboards by using the users that are created on Microsoft Active Directory. See Accessing Telco Network Cloud
Manager - Performance dashboards.
Related information
Configuring the LDAP federated repository
Setting up Apache NiFi
Use this information to set up and start Apache NiFi to convert the EMS data files to Avro format records and write them to Kafka.
About this task
These one-time tasks are needed for NiFi-based Technology Packs only.
Enriching the Network and Region IDs for Wireless Technology Packs
Network and Region IDs are needed to enable data collection for network and region resource types. This information is specific to a customer based on the
network. These values are available as variables in the lookup CSV file for each Technology Pack. The values must be replaced with actual values before you start
the data flow through Apache NiFi UI.
Enabling the processor groups from NiFi UI
After Apache NiFi is stared, you can access its user interface to set up the environment for File Collector. Apache NiFi is used for data flow for all File-based
Technology Packs. Every installed pack has its own processor group that must be enabled and started for data processing.
Moving the data files from EMS to Apache NiFi
Create a simple NiFi flow that monitors a folder for file and copies to a different folder. This NiFi flow must be created to transfer data files from EMS to the spool
directory in NiFi.
Enriching the Network and Region IDs for Wireless Technology Packs
Network and Region IDs are needed to enable data collection for network and region resource types. This information is specific to a customer based on the network.
These values are available as variables in the lookup CSV file for each Technology Pack. The values must be replaced with actual values before you start the data flow
through Apache NiFi UI.
About this task
You need to update the actual values for Network and Region IDs for the following Technology Packs:
umts-huawei-mscs-v200r011c10-1.5.0
umts-huawei-utran-v100r015c10spc156-1.5.0
umts-huawei-mgw-v200r010c20-1.2.0.jar
nr-huawei-nutran-v100r015c10-1.5.0
lte-huawei-eutran-v100r015c10-1.5.0
gsm-huawei-bss-v900r021c10spc600-1.5.0
lte-huawei-mme-v900r018c10-1.1.0
lte-huawei-pcrf-v300r005c00-1.1.0
lte-huawei-sgwpgw-v900r018c10-1.2.0
lte-huawei-hss-v900r008-1.1.0
gsm-tekelec-stp-r46-1-1.1.0
gsm-huawei-stp-v200r005c08-1.0.0
lte-zte-eutran-lr14-1.0.0
umts-zte-utran-ur17-1.1.0
Note: If you do not provide valid values for Region and Network resources according to your network, you might see the Network and Region ID values as undefined.
Procedure
84 IBM Telco Network Cloud Manager - Performance 1.4.5

Update the following columns with specific values in the lookup CSV file for each Technology Pack that is installed.
Table 1. Replacing the Network and Region IDs with actual values
Technology Pack CSV file name CSV file location Columns to be edited.
umts-huawei-mscs-v200r011c10-
1.5.0
NetworkRegionLookup.cs
v
${content_dir}/nifi-
collector/config/${pack_name}/NetworkRegionLookup.csv
mscId,networkId,regionId
msc1,PLMN,East
msc2,PLMN,West
msc3,PLMN,North
msc4,PLMN,South
umts-huawei-utran-
v100r015c10spc156-1.5.0
NetworkRegionLookup_rn
c.csv
${content_dir}/nifi-
collector/config/${pack_name}/NetworkRegionLookup_rnc.csv
rncId,networkId,regionId
rnc1,PLMN,East
rnc2,PLMN,West
rnc3,PLMN,North
rnc4,PLMN,South
NetworkRegionLookup_n
odeb.csv
${content_dir}/nifi-
collector/config/${pack_name}/NetworkRegionLookup_nodeb.csv
nodebId,networkId,regionI
d
nodeb1,PLMN,East
nodeb2,PLMN,West
nodeb3,PLMN,North
nodeb4,PLMN,South
nr-huawei-nutran-v100r015c10-
1.5.0
NetworkRegionLookup.cs
v
${content_dir}/nifi-
collector/config/${pack_name}/NetworkRegionLookup.csv
gNodeBId,networkId,region
Id
gNodeB1,PLMN,East
gNodeB2,PLMN,West
gNodeB3,PLMN,North
gNodeB4,PLMN,South
lte-huawei-eutran-v100r015c10-
1.5.0
NetworkRegionLookup.cs
v
${content_dir}/nifi-
collector/config/${pack_name}/NetworkRegionLookup.csv
eNodeBId,networkId,region
Id
eNodeB1,PLMN,East
eNodeB2,PLMN,West
eNodeB3,PLMN,North
eNodeB4,PLMN,South
gsm-huawei-bss-
v900r021c10spc600-1.5.0
NetworkRegionLookup_bs
c.csv
${content_dir}/nifi-
collector/config/${pack_name}/NetworkRegionLookup_bsc.csv
bscId,networkId,regionId
bsc1,PLMN,East
bsc2,PLMN,West
bsc3,PLMN,North
bsc4,PLMN,South
NetworkRegionLookup_bt
s.csv
${content_dir}/nifi-
collector/config/${pack_name}/NetworkRegionLookup_bts.csv
bsId,networkId,regionId
bs1,PLMN,East
bs2,PLMN,West
bs3,PLMN,North
bs4,PLMN,South
lte-huawei-mme-v900r018c10-
1.1.0
NetworkRegionLookup.cs
v
${ content_dir }/nificollector/ config/$ {pack_name}/
NetworkRegio nLookup.csv
mmeFunctionId,networkId,r
egionId
mmeFunctionId1,PLMN,East
mmeFunctionId2,PLMN,West
mmeFunctionId3,PLMN,North
mmeFunctionId4,PLMN,South
lte-huawei-pcrf-v300r005c00-1.1.0 NetworkRegionLookup.cs
v
${ content_dir }/nificollector/ config/$ {pack_name}/
NetworkRegio nLookup.csv
cgpId,networkId,
regionId cgpId1,
PLMN,North cgpId2,
PLMN,South cgpId3,
PLMN,East cgpId4,
PLMN,West
lte-huawei-sgwpgw-v900r018c10-
1.2.0
NetworkRegionLookup.cs
v
${ content_dir}/nificollector/ config/$ {pack_name}/
NetworkRegio nLookup.csv
ugwFunctionId,networkId,
regionId ugwFunctionId1,
PLMN,North
ugwFunctionId2,
PLMN,South
ugwFunctionId3,
PLMN,East ugwFunctionId4,
PLMN,Central
lte-huawei-hss-v900r008-1.1.0 NetworkRegionLookup.cs
v
${ content_dir }/nificollector/ config/$ {pack_name}/
NetworkRegio nLookup.csv
HuaweiHssId,networkId,
regionId HuaweiHss_Id1,
PLMN,North HuaweiHss_Id2,
PLMN,East HuaweiHss_Id3,
PLMN,West HuaweiHss_Id4,
PLMN,South
umts-huawei-mgw-v200r010c20-
1.2.0
NetworkRegionLookup.cs
v
${ content_dir }/nificollector/ config/$ {pack_name}/
NetworkRegio nLookup.csv
mgwId,networkId,
regionId mgwId1,
PLMN,North mgwId2,
PLMN,South mgwId3,
PLMN,East mgwId4,
PLMN,Central
gsm-tekelec-stp-r46-1-1.1.0 NetworkRegionLookup.cs
v
${ content_dir }/nificollector/ config/$ {pack_name}/
NetworkRegio nLookup.csv
stpId,networkId,
regionId stpId1,
PLMN,North stpId2,
PLMN,Central stpId3,
PLMN,West stpId4,
PLMN,South
gsm-huawei-stp-v200r005c08-
1.0.0
NetworkRegionLookup.cs
v
$ {content_dir }/nificollector/ config/$ {pack_name}/
NetworkRegio nLookup.csv
stpId,networkId,regionId
stpId1,PLMN,North
stpId2,PLMN,South
stpId3,PLMN,East
stpId4,PLMN,Central
IBM Telco Network Cloud Manager - Performance 1.4.5 85

Technology Pack CSV file name CSV file location Columns to be edited.
lte-zte-eutran-lr14-1.0.0 NetworkRegionLookup.cs
v
$ {content_dir }/nificollector/ config/$ {pack_name}/
NetworkRegio nLookup.csv
ENODEBFUNCTION,networkId,
regionId
ENODEBFUNCTION1,PLMN,Nort
h
ENODEBFUNCTION2,PLMN,Cent
ral
ENODEBFUNCTION3,PLMN,West
ENODEBFUNCTION4,PLMN,Sout
h
umts-zte-utran-ur17-1.1.0 NetworkRegionLookup.cs
v
$ {content_dir }/nificollector/ config/$ {pack_name}/
NetworkRegio nLookup.csv
rncId,networkId,regionId
rncId1,PLMN,North
rncId2,PLMN,East
rncId3,PLMN,West
rncId4,PLMN,South
Enabling the processor groups from NiFi UI
After Apache NiFi is stared, you can access its user interface to set up the environment for File Collector. Apache NiFi is used for data flow for all File-based Technology
Packs. Every installed pack has its own processor group that must be enabled and started for data processing.
About this task
For more information, see Getting started with Apache NiFi.
Procedure
Follow these steps to access the NiFi web interface on OpenShift® Container Platform:
1. Log in to the OpenShift Container Platform web console for your cluster.
2. Make sure you are in noi project.
3. Go to Networking > Routes.
4. Click the nifi route link.
You can see the following UI that has a canvas to orchestrate a data flow for the installed File-based Technology Packs:
All the processor groups
Follow these steps to access the NiFi web interface on Kubernetes cluster:
1. Open a web browser and type the following URL:
http://<node_hostname>:30026/nifi
Where,
<node_hostname> is the hostname of any node in your cluster.
30026 is the port number of the NiFi Service on the node where it is installed.
86 IBM Telco Network Cloud Manager - Performance 1.4.5

You can see the following UI that has a canvas to orchestrate a data flow for the installed File-based Technology Packs:
All the processor groups
Right-click the processor group and select Configure > CONTROLLER SERVICES.
You can see all the controller services and their details in your data flow in a table.
Optional: Click the Enable icon ( ) and enable all the controller services.
Click the processor group and select Start to start the data collection.
What to do next
If you notice that the Resource types are not loaded in the filter bars in Telco Network Cloud Manager - Performance Dashboards, stop and start the UI Service.
Moving the data files from EMS to Apache NiFi
Create a simple NiFi flow that monitors a folder for file and copies to a different folder. This NiFi flow must be created to transfer data files from EMS to the spool directory
in NiFi.
About this task
The data flow with NiFi processors helps in data files transfer from EMS to the /spool/packs/<pack_name>/in directory in NiFi. The following processors are needed to
create the data flow:
GetSFTP
The GetSFTP processor fetches files from an SFTP Server and creates FlowFiles from them. If the source data files are available in another server, SFTP them to
NiFi server by using the PutFile processor.
Note: You can also use GetSFTP processor.
UpdateAttribute
The UpdateAttribute processor updates the attributes of a FlowFile by using the properties or rules that are added by the user. It updates the attributes for a
FlowFile by using the Attribute Expression Language or deletes the attributes based on a regular expression.
PutFile
The PutFile processor is used to store the file from the data flow to the spool directory of the pack.
Two scenarios are available to transfer the data files from EMS to NiFi:
Scenario 1
For most of the wireline Technology Packs, the remote data file is transferred to the NiFi server location with GetSFTP and PutFile processors.
Scenario 2
For most of the wireless Technology Packs the remote data files that are arranged in multiple folders are transferred to the NiFi server location with GetSFTP,
UpdateAttribute and PutFile processors. For example, ACME Packet Net-Net 9200 HDR v1.0.0 pack.
Procedure
Access NiFi UI.
Moving the data files from one server to another NiFi server in scenario 1
Drag the processor icon to the NiFi canvas and select GetFTP or GetSFTP processor from the list.
Right-click on the processor and select Configure and in the Properties tab provide values for the following properties:
IBM Telco Network Cloud Manager - Performance 1.4.5 87

Property ValueProperty Value
Hostname Hostname of the server where the data files are available.
Username Username to access the host server.
Password Password to access the host server.
Transfer Mode ASCII for XML files
Binary for .gz files
Remote Path Path to the location where the data files are available. Make sure that you can SFTP to this location.
Private Key Path The fully qualified path to the Private Key file
Properties that are applicable for GetSFTP processor only.
Private Key Passphrase Password for the private key
Host File If you provide this value, the file is used as the Host Key. Otherwise, no use host key file is used.
Strict Host Key Checking Indicates whether strict enforcement of hosts keys must be applied
Send Keep Alive On Timeout Indicates whether to send a single Keep Alive message when SSH socket times out.
Optional: To prevent the transfer of large files to NiFi input directory for processing before the file is copied completely, configure the following additional
parameters in GetSFTP processor:
Property Value
Polling Interval Determines how long to wait between fetching the new files from remote location to NiFi input location. By default, it is 60 seconds. You might
want to increase the value, if you can determine the time to transfer the larger data files from remote server to the NiFi input location.
Ignore Dotted
files
Make sure that this property is set to true. Files that start with a dot (".") are considered as hidden files and not transferred for processing.
Note: Make sure that you rename with dot prefix the large files that might take time to transfer from the remote server to the NiFi input location.
Click Apply and go back to canvas.
Drag the processor icon to the NiFi canvas and select PutFile processor from the list.
Right-click on the processor and select Configure and in the Properties tab add the location of the input directory to Directory property.
Click GetSFTP processor and drag to PutFile processor to connect both of them.
Start both the processors.
Moving the data files from one server to another NiFi server in scenario 2
Drag the processor icon to the NiFi canvas and select GetSFTP processor from the list.
Right-click on the processor and select Configure and in the Properties tab provide values for the following properties:
Property Value
Hostname Hostname of the server where the data files are available.
Username Username to access the host server.
Password Password to access the host server.
Transfer Mode ASCII for XML files
Binary for .gz files
Remote Path Path to the location where the data files are available in many subfolders. Make sure that you can SFTP to this location. For example,
/ems_output/card/1590662105.csv
/ems_output/session-realm/1590662105.csv
/ems_output/system/1590662105.csv
Optional: To prevent the transfer of large files to NiFi input directory for processing before the file is copied completely, configure the following additional
parameters in GetSFTP processor:
Property Value
Polling Interval Determines how long to wait between fetching the new files from remote location to NiFi input location. By default, it is 60 seconds. You might
want to increase the value if you can determine the time to transfer the larger data files from remote server to the NiFi input location.
Ignore Dotted
files
Make sure that this property is set to true. Files that start with a dot (".") are considered as hidden files and not transferred for processing.
Note: Make sure that you rename with dot prefix the large files that might take time to transfer from the remote server to the NiFi input location.
Click Apply and go back to canvas.
Drag the processor icon to the NiFi canvas and select UpdateAttribute processor from the list.
Right-click on the processor and select Configure and in the Properties tab. Click the Add Property ( ) icon to add the following properties and their values:
Property Value
filename ${filename:prepend(${path:replace(‘/’,’_’)})}
It replaces the "/" in the data file path to "_". For example,
ems_output_card_1590662105.csv
ems_output_session-realm_1590662105.csv
ems_output_system_1590662105.csv
GetSFTP.remote.source The remote server where the data files are located. For example, localhost.
path Path where the data files are available. For example,
/ems_output/card/1590662105.csv
/ems_output/session-realm/1590662105.csv
/ems_output/system/1590662105.csv
.
Click Apply and go back to canvas.
Click GetSFTP processor and drag to UpdateProcessor processor to connect both of them.
Drag the processor icon to the NiFi canvas and select PutFile processor from the list.
Right-click on the processor and select Configure and in the Properties tab add the location of the input directory to Directory property.
For example, /spool/packs/<pack_name>/in. After the data file is processed by NiFi from the /spool/packs/<pack_name>/in directory, the files can be viewed from
the Data Provenance on the Global menu.
Click UpdateProcessor processor and drag to PutFile processor to connect both of them.
Start all the processors.
88 IBM Telco Network Cloud Manager - Performance 1.4.5

NiFi housekeeping
NiFi provides a built-in data provenance feature where all the raw and processed files are stored within the Provenance Repository. You can search and view this
information in Data Provenance from the Global menu.
NiFi housekeeping
NiFi provides a built-in data provenance feature where all the raw and processed files are stored within the Provenance Repository. You can search and view this
information in Data Provenance from the Global menu.
Since the Provenance Repository in NiFi stores both raw and processed data, the storage requirement is high. Size your storage requirement based on your data and their
wanted retention period.
Use the following formula to calculate the storage:
Required Content Storage size = (N * I * H) * R * P
Where,
N = Raw file size per interval
I = Number of intervals per hour
H = Retention period in hour
R = 30 (The table describes how to derive the formula and ratio)
P = storage percentage= 1/archive.max.usage.percentage (1/0.8 = 1.25)
Note: The default retention period is 1 day. It can be configured in NiFi Pod YAML file with this parameter.
NIFI_CONTENT_RETENTION_PERIOD = 24 hours
Contact IBM® Support to assess your storage requirements.
Following table shows some example scenarios that you can use to calculate your storage requirements:
Scenario Size of raw file Observations with formula
1 2 hrs Content storage =(1.1*4*2)*30*1.25 =330 M
2 2 hrs Content storage =(2.1*4*2)*30*1.25 =630 M
3 2 hrs Content storage =(5.3*4*2)*30*1.25 =1590 M
4 4 hrs Content storage =(5.3*4*4)*30*1.25 =3180 M
5 4 hrs Content storage =(2.1*4*4)*30*1.25 =1260 M
6 6 hrs Content storage =(2.1*4*6)*30*1.25 =1890
Setting up integration with Jazz for Service Management
These tasks are required for integrated installation only. Use this information to set up the federation between Jazz® for Service Management and Telco Network Cloud
Manager - Performance to work correctly and to access the web-based visualizations.
About this task
Perform these tasks during fresh installation scenarios where you are doing the integration for the first time. When you integrate Telco Network Cloud Manager -
Performance with Jazz for Service Management, you have the following scenario to consider:
If Watson™ AIOps and Telco Network Cloud Manager - Performance are in the same namespace or project.
Setting up Jazz for Service Management for integration
Perform these tasks on the Jazz for Service Management server.
Configuring single sign-on on the Jazz for Service Management server
Use these instructions to establish single sign-on support.
Setting up Jazz for Service Management for integration
Perform these tasks on the Jazz® for Service Management server.
About this task
When Telco Network Cloud Manager - Performance and IBM® Netcool® Operations Insight® are installed in the same project, integration between Telco Network Cloud
Manager - Performance and Jazz for Service Management is automated.
Only, the following manual tasks are needed:
Procedure
IBM Telco Network Cloud Manager - Performance 1.4.5 89

Restart the WebGUI pod, which is [install]-webgui-0.
Verify the users and certificates in WebSphere Application Server.
Make sure that the following users are available in WebSphere Application Server:
npiadmin
npiuser
smadmin
tncpadmin
tncpuser
Go to Users and Groups > Manage Users.
Go to SSL certificate and key management > Key stores and certificates > NodeDefaultTrustStore > Signer certificates.
Verify the console integration for Telco Network Cloud Manager - Performance.
90 IBM Telco Network Cloud Manager - Performance 1.4.5

Retrieve the secret for the tncpadmin user with the following command:
kubectl get secret tncp-admin -o json -n noi| grep password | cut -d : -f2 | cut -d '"' -f2 | base64 -d;echo
Copy the secret and log in to the Dashboard Application Services Hub portal as npiadmin/tncpadmin_secret.
Configuring single sign-on on the Jazz for Service Management server
Use these instructions to establish single sign-on support.
About this task
To configure Global Security to enable SSO, follow these steps:
Procedure
1. Log in to Jazz® for Service Management server as an admin user.
2. In the navigation pane, click Console Settings > Websphere Administrative Console and click Launch Websphere administrative console.
3. In the WebSphere Application Server administrative console navigation pane, click Security > Global security.
4. In the Administrative Security section, select the Enable administrative security checkbox.
5. In the Application Security section, select the Enable application security checkbox.
6. In the Authentication section, expand Web and SIP security and click Single sign-on (SSO).
7. Click Enabled option if the SSO is disabled.
8. Click Requires SSL if all the requests are expected to use HTTPS.
9. Enter the fully qualified domain names in the Domain name field where SSO is effective.
For example, .ibm.com
If the domain name is not fully qualified, the Jazz for Service Management Server does not set a domain name value for the LtpaToken cookie and SSO is valid only
for the server that created the cookie. Single sign-on feature is necessary for different components of Netcool Operations Insight to interact with each other. For
SSO to work across the Tivoli applications, their application servers must be installed in same domain (use the same domain name).
10. Set the LTPA V2 Cookie name to LtpaToken2.
11. Optional: Enable the Interoperability Mode option if you want to support SSO connections in WebSphere Application Server version 5.1.1 or later to interoperate
with previous versions of the application server.
12. Select the Web inbound security attribute propagation checkbox to propagate information from the first login application server to the other application servers.
13. Clear the Set security cookies to HTTPOnly to help prevent cross-site scripting attacks checkbox.
14. Click OK to save your changes.
15. Stop and restart all the Jazz for Service Management server instances.
What to do next
When you start Jazz for Service Management, you must use a URL in the format protocol://host.domain:port /*. If you do not use a fully qualified domain name, Jazz for
Service Management cannot use SSO between Tivoli products.
The configured single sign-on uses SSO tokens that are set in HTTP cookies to carry authenticated sessions. By default, these cookies expire after 120 minutes. To change
this value, follow these steps:
1. In the WebSphere Application Server administrative console navigation pane, click Security > Global security.
2. In the Authentication section, click LTPA.
3. Change the LTPA timeout value to a different value.
This value must be greater than the Cache timeout.
IBM Telco Network Cloud Manager - Performance 1.4.5 91

The credentials expire after the specified period you might have to validate your credentials again.
Stopping Jazz for Service Management application servers
You can stop any Jazz for Service Management application server by using the IBM WebSphere stopServer command. You might need to restart the application
server after you complete a configuration task for an integration service, or stop the application server for maintenance. To start the server again, use the
startServer command.
Starting Jazz for Service Management application servers
You can start any Jazz for Service Management virtualization and reporting servers by using the IBM WebSphere startServer command. You might need to restart
the application server after you complete a configuration task for an integration service, or after you stop the application server for maintenance.
Stopping Jazz for Service Management application servers
You can stop any Jazz® for Service Management application server by using the IBM WebSphere stopServer command. You might need to restart the application server
after you complete a configuration task for an integration service, or stop the application server for maintenance. To start the server again, use the startServer command.
Procedure
1. On the relevant Jazz for Service Management server, open a command window.
2. Change to the WAS_HOME/bin directory.
The default location for <JazzSM_WAS_Profile> is /opt/IBM/JazzSM/profile.
3. Run the following command:
./stopServer.sh <server_name> -username <WAS_admin_user_name> -password <WAS_admin_password>
Where
server_name
Enter the name of the application server that was specified when the application server profile was created. For example, server1.
WAS_admin_user_name
The default username is smadmin.
WAS_admin_password
It is the password that is specified at the time of installation.
Example
stopServer.sh server1 -username smadmin -password
jazzsmpwd
Related information
Common directory locations
Starting Jazz for Service Management application servers
You can start any Jazz® for Service Management virtualization and reporting servers by using the IBM WebSphere startServer command. You might need to restart the
application server after you complete a configuration task for an integration service, or after you stop the application server for maintenance.
About this task
The same procedure applies to any Jazz for Service Management application server.
Procedure
1. On the relevant Jazz for Service Management server, open a command window.
2. Change to the JazzSM_WAS_Profile/bin directory.
The default location for <JazzSM_WAS_Profile> is /opt/IBM/JazzSM/profile
.
3. Run the following command:
./startServer.sh server_name
Where
server_name
Enter the name of the application server that was specified when the application server profile was created.
For example, server1.
Related information
Common directory locations
92 IBM Telco Network Cloud Manager - Performance 1.4.5

Setting up integration with Watson AIOps Event Manager
Follow these instructions to integrate Telco Network Cloud Manager - Performance with Watson™ AIOps Event Manager to send threshold violation alarms.
About this task
You must do this configuration if you want to send the threshold violations to Watson AIOps Event Manager to be displayed in Event Viewer.
Procedure
1. Log in to your cloud platform web console.
2. Select noi from Projects pane.
3. Expand Workloads > Config Maps > common in the Config and Storage pane in the navigation pane.
4. Add the following properties to the file and save it.
Table 1. Setting in common Config Map file
Option Description Example
OMNI_HOST IP address of the server where Watson AIOps Event Manager is installed.
If you are connecting an on-prem instance of Watson AIOps Event Manager,
run the following command in the Object Server:
netstat -tlpn | grep -i nco_objserv
Get the IP address that is pointing to the Object Server on port 4100 or non-
default port.
127.127.127.127
On OpenShift® Container Platform that is integrated
with IBM® Netcool® Operations Insight®
<ncoprimary-0_pod_name>.<objserv-agg-
primary_service_name>.<namespace>
For example, noi-ncoprimary-0.noi-objserv-agg-primary.noi
OBJECT_SERVE
R
ObjectServer name By default, the Watson AIOps Event Manager Object Server
name is AGG_P .
OMNI_PORT Use this parameter if you have a non-default port. By default, the port is 4100.
The contents of the common Config Map file.
OMNI_HOST: "127.127.127.127"
OBJECT_SERVER: AGG_P
OMNI_PORT: ‘7100’
5. After you change the common Config Map, rename the tncp-operator in the annotations section as follows:
annotations:
manager: tncp-operator-<updated>
It is to make sure that the Operator does not revert the changes to default.
6. Restart all instances of Threshold Service in your cluster.
What to do next
Configure the thresholds and alarm rules for performance metrics, which you want to display on Watson AIOps Event Manager.
Related information
Controlling the Telco Network Cloud Manager - Performance services
Postinstallation tasks
Perform these postinstallation tasks after the installation of Telco Network Cloud Manager - Performance is complete.
Supporting shared namespaces
If you are sharing a namespace between Watson™ AIOps and Telco Network Cloud Manager - Performance, update the common Config Map.
Accessing Telco Network Cloud Manager - Performance dashboards
Use these steps to access the Telco Network Cloud Manager - Performance Dashboards.
Installation directory structure
Use this information to understand the important directories that are created in the microservice containers. You can see this information from each Pod on your
cloud platform web console.
Generating the audit report
The resource-report script is used to generate a report that contains audit information on device classification.
Optional: Publishing Telco Network Cloud Manager - Performance Dashboards menus
After the installation of Telco Network Cloud Manager - Performance, you can access Telco Network Cloud Manager - Performance Dashboards directly.
Supporting shared namespaces
IBM Telco Network Cloud Manager - Performance 1.4.5 93

If you are sharing a namespace between Watson™ AIOps and Telco Network Cloud Manager - Performance, update the common Config Map.
About this task
You can select any namespace in which you installed the Telco Network Cloud Manager - Performance application from the TNC-P monitoring dashboards.
Procedure
Log in to Telco Network Cloud Manager - Performance cloud web console.
Select tncp from Namespace pane.
Expand Workloads > Config Maps > common in the Config and Storage pane in the navigation pane.
Select tncp from Projects pane.
Expand Workloads > Config Maps > common.
Add the following property in the common Config Map:
"tncp.namespaces": "<namespace>"
For example, if you have installed Telco Network Cloud Manager - Performance in the noi namespace, use the following code in the common Config Map.
"tncp.namespaces": "noi"
Restart the UI Service.
Accessing Telco Network Cloud Manager - Performance dashboards
Use these steps to access the Telco Network Cloud Manager - Performance Dashboards.
Procedure
Logging in to the Dashboard Application Services Hub portal
Depending upon your organization’s deployment, you can access the reporting interface through Dashboard Application Services Hub.
Related tasks
Creating a route
Related information
Accessing system configuration pages
Logging in to the Dashboard Application Services Hub portal
Depending upon your organization’s deployment, you can access the reporting interface through Dashboard Application Services Hub.
Procedure
Installation directory structure
Use this information to understand the important directories that are created in the microservice containers. You can see this information from each Pod on your cloud
platform web console.
Typical directory stack for all the microservices.
94 IBM Telco Network Cloud Manager - Performance 1.4.5

Typical contents of the common folders in all services:
bin
Script to stop and start the microservice.
lib
Specific library files that are needed for the microservice.
conf
Contains the security keystore for single-sign for inter-service communications.
work
logs
Contains a separate log file for each microservice.
Other significant folders and contents available in Telco Network Cloud Manager - Performance Stateful Services.
Service Folder structure
analytics-batch
analytics-stream
/opt/basecamp/analytics
resources
Extract the basecamp-ui-analytics.zip file to see the following folders for the configuration pages:
udc
sbh
sa
ba
app /opt/basecamp/app
resources
basecamp-ui-apps.zip
site
Contains all the content that is required for the Sites configuration page.
cassandra It is available in the root directory. Contains Apache Cassandra database folders and files.
dashboard /opt/basecamp/dashboard
lib
Contains the database JAR file.
resources
basecamp-ui-dashboard.zip
oed
Contains the WAR files for Dashboard Designer, Engine, and Scheduler. It also contains SQL files that are used to create
the tables to store the dashboard data in PostgreSQL database.
localization
Contains all the localized built-in dashboards JSON files.
dashboards
config
Contains the connection properties file for database configuration.
config-ui-dashboard
Contains all the content that is required for Config UI pages.
blaze
Contains the Blaze WAR file.
diamond-db /opt/diamond
bin
Contains the CarbonData database client and server
work
Contains metrics and metadata that are stored in the database.
diamond-db-read /opt/diamond
bin
Contains the CarbonData database client and server
work
Contains metrics and metadata that are stored in the database.
IBM Telco Network Cloud Manager - Performance 1.4.5 95

Service Folder structure
dns-collector /opt/basecamp/dns-collector
/opt/basecamp/dns-collector/resources has the basecamp-ui-dnscollector.zip file that contains the Domain names
administration page.
file-collector /opt/basecamp/file-collector
content
discoveries
Contains discovery formula files that are copied from the installed Technology Packs. All formulas are categorized under
different technologies of the installed Technology Packs. Inside each folder, the following sub folders and files are
available,
Typically, device for wireline devices or network for wireless devices
pipeline.conf
property
relation
formulas
Contains collection formula files that are copied from the installed Technology Packs. All formulas are categorized under
different technologies of the installed Technology Packs.
flow-analytics /opt/basecamp/flow-analytics/
resources
Contains the basecamp-ui-flowanalytics.zip file that has the the Flow Aggregations administration page.
flow-collector /opt/basecamp/flow-collector
resources
Contains the basecamp-ui-flowcollector.zip file that has the following Flow administration pages:
Autonomous Systems
Flow Interfaces
Flow IP Grouping
NBAR
Retention Profiles
Type of Service
inventory /opt/basecamp/inventory
resources
Contains basecamp-ui-inventory.zip file with content for Resource Management configuration page.
content
Contains model files for properties and relationships.
kafka It is available in root directory. Contains folders and files of Kafka.
nfs
Note: This service is applicable
for Kubernetes environment
only.
It is available in root directory. Its storage folder stores data from the following service that is available in individual folders:
postgres
content
Contains a hidden folder .installed that has a copy of all installed Technology Packs. If you uninstall any pack, it is moved to
.uninstalled folder.
cassandra
zookeeper
kafka
diamond-db
nifi
config
Contains folders for each pack and their lookup CSV files, which are required by other processor available in NiFi
template for enrichment and processing of input data.
template
Contains the NiFi template XML files for the installed Technology Packs, which automatically loaded to NiFi UI during
pack installation.
security
timeseries
inventory
snmp-collector
snmp-discovery
file-collector
nifi /opt/nifi/nifi-current
Contains folders and files for Apache NiFi.
ping-collector /opt/basecamp/ping-collector
Contains the directories and files that are needed for Ping Collector Service to collect the ICMP ping metrics.
resources
Contains basecamp-ui-pingcollector.zip file with content for Ping Profiles configuration page.
postgres It is available in root directory. Contains folders and files of PostgreSQL database. It also stores the dashboard metadata.
96 IBM Telco Network Cloud Manager - Performance 1.4.5

Service Folder structure
postgres-th It is available in root directory. Contains folders and files of PostgreSQL database. Stores the threshold state data.
security It is available in root directory. Contains folders and files of Security Service. It also has all the LDAP users and groups files.
sleeping-cell /opt/basecamp/sleeping-cell
Contains files for the Data anomaly configuration page in /opt/basecamp/sleeping-cell/resources folder.
snmp-collector /opt/basecamp/snmp-collector
Contains the directories and files that are needed for SNMP Collector Service that provides metric polling of any OIDs.
content
formulas
mibs
bindings
snmp-discovery /opt/basecamp/snmp-discovery
basecamp-ui-snmpdiscovery.zip
Contains the following SNMP Discovery profile and SNMP Credentials administration pages.
content
discovery
mibs
sysobjectid.discovery
threshold /opt/basecamp/threshold
resources
Contains the basecamp-ui-threshold.zip file that has the following configuration pages:
Alarm
Threshold definitions
Time schedules
stdin-probe
Contains 64-bit STDIN probe is available in /stdin-probe/omnibus/probes directory.
timeseries /opt/basecamp/timeseries
content
All the metrics are stored in metrics folder.
/opt/basecamp/timeseries/data/warehouse
Contains the files related to the distributed timeseries.
ui /opt/basecamp/ui
Contains the directories and files that are needed for UI Service to function.
zookeeper It is available in root directory. Contains the directories and files that are needed for Zookeeper Service to function.
Generating the audit report
The resource-report script is used to generate a report that contains audit information on device classification.
About this task
The following information is available in the report:
Count and list of managed devices on the system
Count and list of client devices on the system
Count and list of unclassified devices on the system
Procedure
1. Extract the basecamp-resource-report-2.4.3.0.tgz file that is available in the Advanced bundle (M0BP2EN.tar.gz) at <DIST_DIR>/resource-report folder.
2. Use the following command to run the /bin/resource-report script:
cd <DIST_DIR>/resource-report/bin
./resource-report --inventory-service.hosts=<inventory-service.hosts>
Where, <inventory-service.hosts> is the hostname where the Inventory Service is available in your cluster.
For example, <myserver.ibm.com>
The following output files are generated:
A PDF file with summary of the report that shows the count of all resource types.
A CSV file with a list of managed devices, client devices, and unclassified devices
IBM Telco Network Cloud Manager - Performance 1.4.5 97

Optional: Publishing Telco Network Cloud Manager - Performance Dashboards
menus
After the installation of Telco Network Cloud Manager - Performance, you can access Telco Network Cloud Manager - Performance Dashboards directly.
About this task
All the dashboards and system configuration pages that are available in your installed Technology Packs are automatically published and can be accessed directly. You do
not need to publish them from the Dashboard designer tool. These steps are needed for the dashboards that are manually created. To access these dashboards, you must
publish them manually.
Users with a Menu Administrator role or System Administrator role can create and publish menus only when they have access to an Engine instance and one or
more Engine User Groups.
Important: Before you publish the dashboards, observe the following points:
Wait for all the Pods are up on OpenShift® Container Platform or Kubernetes web console.
Expand the Home menu and check all the menu items are available or not based on the Technology Packs that are installed.
Procedure
Complete the following steps to publish the Home menu:
1. Log in to the Telco Network Cloud Manager - Performance Dashboards with npiadmin/<tncp_admin_secret> credentials.
Note: Access the Telco Network Cloud Manager - Performance Dashboards by using the Dashboard Service route from OpenShift Container Platform web console.
2. In the navigation pane of Dashboard Designer, click Menu Access.
You can see the default Home menu.
3. Click Home and wait for the menu to load.
4. To publish the menu, click Publish.
5. In the Publish Menu window, click Publish Menu and Dashboards to publish a menu along with all its dashboards and drill-down dashboards.
Important: You can see the dashboards menu and its items based on the Technology Packs that you installed. See Dashboards and technology pack dependencies.
A confirmation message that indicates that the menu is published is displayed. You can also see the Administration menu and its pages.
What to do next
After you publish a menu, you must log in to Engine and view the published dashboards.
If your environment is integrated with Dashboard Application Services Hub, follow these steps:
1. Log in to Dashboard Application Services Hub portal with npiadmin/<tncp_admin_secret> credentials.
2. On the navigation bar, click Performance > TNCP > Metric dashboards.
The Telco Network Cloud Manager - Performance Dashboards Welcome page loads with menu bar to go to different Telco Network Cloud Manager -
Performance Dashboards and configuration pages.
If your environment is not integrated with Dashboard Application Services Hub, log in to the Telco Network Cloud Manager - Performance Dashboards user interface
with npiadmin/npiadmin credentials.
Note: Access the Telco Network Cloud Manager - Performance Dashboards by using the Dashboard Service route from OpenShift Container Platform web console.
Related information
Adding new menu item to Home menu
Uninstalling
The scope here is only to uninstall all the resources in Telco Network Cloud Manager - Performance. It does not cover the uninstallation of the cloud platform.
About this task
Uninstallation is a two-step process where you must uninstall the Technology Packs and then uninstall Telco Network Cloud Manager - Performance.
Uninstalling Technology Packs
Uninstall Technology Packs and the related GOM files from the system.
Uninstalling Telco Network Cloud Manager - Performance Operator
Uninstall the Telco Network Cloud Manager - Performance Operator and the related software from the system.
Uninstalling Technology Packs
Uninstall Technology Packs and the related GOM files from the system.
Before you begin
98 IBM Telco Network Cloud Manager - Performance 1.4.5

Back up your data.
Procedure
1. Access Telco Network Cloud Manager - Performance dashboards.
2. Click Administration > Pack management > Pack service.
You can see the Pack service page that has a grid. After you deploy the packs, you can see the list of packs and their details.
3. Click the Deploy ( ) icon in the Actions pane and select Remove and click Confirm.
If the Technology Pack JAR file is edited after the deployment, the state changes to draft. To delete the pack, click More actions ( ) and select History. Select the
revision that is deployed earlier. It applies a filter to the pack JAR file listing page and lists only the selected revision with state deployed. You can then remove or
uninstall the pack JAR file that is previously deployed.
After it is removed successfully, you can see the removed message in the State column on the Pack service page.
4. To check the pack logs, click the removed link in the State column for the Technology Pack to view the Pack log messages.
Uninstalling Telco Network Cloud Manager - Performance Operator
Uninstall the Telco Network Cloud Manager - Performance Operator and the related software from the system.
Before you begin
Make sure to back up the storage.
Procedure
Log in to the OpenShift® Container Platform web console for your cluster.
Uninstall the Operator instance.
From the navigation, click Operators > Installed Operators.
You can see all the Operators that are available in your cluster.
Make sure you are in the correct project in which you installed Telco Network Cloud Manager - Performanceoperator.
For example, noi.
Search for TNCP Operator and click the TNCP tab.
You can see the instance of the Operator.
Click the more options ( ) icon and select Delete TNCP.
The Operator instance is removed.
Wait for all the Pods to be removed.
Remove the Persistent Volume Claims.
Click Storage > Persistent Volume Claims.
Make sure you are in the correct project in which you installed Telco Network Cloud Manager - Performanceoperator.
For example, noi.
You can see the list of PVCs on the Persistent Volume Claims page.
IBM Telco Network Cloud Manager - Performance 1.4.5 99

Click the more options ( ) icon and select Delete the Persistent Volume Claim.
Repeat for all the PVCs.
Optional: Alternatively, remove the PVCs from command-line option. Run the command from the infra node.
Change the project by using the following command:
oc project <project_name>
Where, <project_name> project name or namespace where Telco Network Cloud Manager - Performance is installed.
Note: Run the following command in a single line.
oc delete pvc
conf-flow-collector
content-analytics
content-file-collector
content-flow-collector
content-inventory
content-nifi
content-snmp-collector
content-snmp-discovery
content-timeseries
data-cassandra-0
data-diamond-db
data-kafka-0
data-nifi-0
data-postgres-0
data-postgres-th-0
data-timeseries-0
data-zookeeper-0
esdata-inventory-0
flow-nifi-0
keystore-security
log-zookeeper-0
logs-analytics-batch-0
logs-analytics-stream-0
logs-app-0
logs-dashboard-0
logs-diamond-db-0
logs-diamond-db-export-0
logs-diamond-db-read-0
logs-file-collector-0
logs-flow-analytics-0
logs-flow-collector-0
logs-inventory-0
logs-pack-service-0
logs-snmp-collector-0
logs-snmp-discovery-0
logs-threshold-0
logs-timeseries-0
logs-ui-0
pack-content
sessions-security
solrdata-inventory-0
spool-nifi
users-security
work-file-collector
work-pack --ignore-not-found=true
Verify that all the PVC's are removed from all Pods by using the command:
oc get pvc
Note: If you have multiple Pods for a service, remove them manually from your cloud web console.
Remove the TNCP Operator.
From the navigation, click Operators > Installed Operators.
You can see all the Operators that are available in your cluster.
Search for TNCP Operator and click.
Delete the tncp-operator Role and RoleBinding
Run the following commands to remove the tncp-operator Role and RoleBinding:
oc delete rolebinding tncp-operator
oc delete role tncp-operator
Note: The Pack Service requires the tncp-operator Role and RoleBinding.
Uninstall the operator
Click the more options ( ) icon and select Uninstall Operator.
The Operator is removed from all namespaces.
Results
The following data is removed:
100 IBM Telco Network Cloud Manager - Performance 1.4.5

TNCP Operator instance
TNCP Operator
All the Pods from Telco Network Cloud Manager - Performance
Project or Namespace
In Red Hat OpenShift Container Platform environment, remove the project with the following command:
oc delete ns noi
Persistent Volume Claims
Installing Telco Network Cloud Manager - Performance on Kubernetes environment
The installation information contains the installation prerequisites, instructions for preparing to install, installation, and uninstallation of IBM® Telco Network Cloud
Manager - Performance, version 1.4.5 on Native Kubernetes environment.
Roadmap for installing Telco Network Cloud Manager - Performance on Kubernetes
Use the task roadmap to guide you through the high-level installation, configuration, and integration tasks that are applicable for integrated installation scenario.
Planning for Telco Network Cloud Manager - Performance installation
To successfully install and administer Telco Network Cloud Manager - Performance, you must have a strong understanding of Red Hat® OpenShift® processes and
concepts. Before you install the product, read the hardware and software requirements.
Preparing your environment
Before you run the installation, you must prepare your target environments. Install the prerequisite software.
Installing software
Use this information to install Telco Network Cloud Manager - Performance core software, and then install the vendor-specific COTS Technology Pack bundles that
can be downloaded separately.
Setting up LDAP authentication
Lightweight Directory Access Protocol (LDAP) provides an extra security to user management. LDAP server implementations are typically tailored to the needs of
your organization. You can either use your own LDAP server and the configured users or use the built-in OpenLDAP by specifying the LDAP credentials (username
and password) to log in to Telco Network Cloud Manager - Performance.
Authenticating with Microsoft Active Directory users
Microsoft Active Directory can be used for managing user authentication and user data. The Microsoft Active Directory provides a Lightweight Directory Access
Protocol (LDAP) service. Therefore, WebSphere® Application Server supports LDAP and WebSphere Application Server supports the Microsoft Active Directory.
Setting up Apache NiFi
Use this information to set up and start Apache NiFi to convert the EMS data files to Avro format records and write them to Kafka.
Setting up integration with Jazz for Service Management
These tasks are required for integrated installation only. Use this information to set up the federation between Jazz® for Service Management and Telco Network
Cloud Manager - Performance to work correctly and to access the web-based visualizations.
Setting up integration with Tivoli Netcool/OMNIbus
Follow these instructions to integrate Telco Network Cloud Manager - Performance with Tivoli® Netcool®/OMNIbus to send threshold violation alarms.
Postinstallation tasks
Perform these postinstallation tasks after the installation of Telco Network Cloud Manager - Performance is complete.
Uninstalling
The scope here is only to uninstall all the resources in Telco Network Cloud Manager - Performance. It does not cover the uninstallation of the cloud platform.
Roadmap for installing Telco Network Cloud Manager - Performance on Kubernetes
Use the task roadmap to guide you through the high-level installation, configuration, and integration tasks that are applicable for integrated installation scenario.
Note:
The image provides a bird's-eye-view of the tasks that are needed. Click a block on the image to open the related topic.
Topics that are associated with each block might have some related tasks. You must perform all the tasks of the parent and sub topics.
Do not zoom in the page as it might disrupt the hot spot functions in the image map.
Stand-alone installation scenario
In this scenario, Telco Network Cloud Manager - Performance is not integrated with any other IBM® product. Telco Network Cloud Manager - Performance Dashboards can
be accessed directly from the Engine user interface.
Figure 1. Stand-alone installation scenario
IBM Telco Network Cloud Manager - Performance 1.4.5 101

Manage
Resource
Grouping
Plan
Prepare Install cloud
platform
Install Install TNCP
Operator
Install Tech
Packs
Set up LDAP
authentication
Observe the
existing LDAP
setup or edit if
required
Create LDAP
users
Set up
Apache NiFi
Post-
installation
Enrich Network
and Region IDs
for wireless
Tech Packs
Enable
processor
groups on NiFi
UI
Move data
files from
EMS to NiFi
(Optional) Run
Huawei U2000
adaptor script
Manage batch
analytics jobs
Manage
analytics
streams
Manage
metric
thresholds
Manage
alarm rules
Manage
Resource
types and
instances
Manage site
groups
Manage time
schedulesMa
Manage Busy
Hours
Manage User
Defined
Calculations
Manage
SNMP
discovery
profiles
Manage
SNMP
credentials
User
administration
from Dashboard
Designer
Manage data
retention period
Manage Type
of Service
Manage
Autonomous
Systems
Manage Flow
Interfaces
Manage Flow
Aggregations
Manage
NBAR
Manage
Flow IP
Grouping
Manage
Domain
Names
Admin tasks
to access
Dashboards
Configure
TNCP
System
Access TNCP
Dashboards
Manage Ping
profiles
Download Core
and Advanced
bundles
Download
Tech Packs Extract software
Integrated installation
In this scenario, Telco Network Cloud Manager - Performance is integrated with Tivoli® Netcool®/OMNIbus and IBM Operations Analytics - Predictive Insights components
of IBM Netcool Operations Insight®. Telco Network Cloud Manager - Performance Dashboards are accessed from the Dashboard Application Services Hub portal.
Figure 2. Integrated installation scenario
102 IBM Telco Network Cloud Manager - Performance 1.4.5

Download Core
and Advanced
bundles
Extract software
Plan
Prepare Install cloud
platform
Run
prerequisite
scanner
Install IBM
products to
integrate
Install Install core
software
Install Tech
Packs
(Optional)
Set up LDAP
authentication
Observe the
existing LDAP
setup or edit if
required
Create LDAP
users
Set up
Apache NiFi
Integrate
with JazzSM
Integrate
with OMNIbus
Post-
installation
Enrich Network
and Region IDs
for wireless Tech
Packs
Enable
processor
groups on NiFi
UI
Move data
files from
EMS to NiFi
(Optional) Run
Huawei U2000
adaptor script
Set up
JazzSM for
integration
Set up TNCP
for integration
with DASH
Set up OMNIbus
integration
Access the UI
from DASH
Admin tasks
to access
Dashboards
User
administration
from DASH
User
administration
from Dashboard
Designer
Configure
Single Sign-
on on DASH
Manage
Resource
Grouping
Manage batch
analytics jobs
Manage
analytics
streams
Manage
metric
thresholds
Manage
alarm rules
Manage
Resource
types and
instances
Manage site
groups
Manage time
schedulesMa
Manage Busy
Hours
Manage User
Defined
Calculations
Manage
SNMP
discovery
profiles
Manage
SNMP
credentials
Manage data
retention period
Manage Type
of Service
Manage
Autonomous
Systems
Manage Flow
Interfaces
Manage Flow
Aggregations
Manage
NBAR
Manage
Flow IP
Grouping
Manage
Domain
Names
Configure
TNCP
System
Manage Ping
profiles
Download
Tech Packs
User
administration
from WAS
Planning for Telco Network Cloud Manager - Performance installation
To successfully install and administer Telco Network Cloud Manager - Performance, you must have a strong understanding of Red Hat® OpenShift® processes and
concepts. Before you install the product, read the hardware and software requirements.
About this task
For information on Red Hat OpenShift Container Platform, see the Red Hat OpenShift Container Platform documentation.
Downloading the installation media
Licensed customers can download the Telco Network Cloud Manager - Performance electronic images from IBMPassport Advantage.
Downloading the Technology Packs media
Licensed customers can download the Telco Network Cloud Manager - Performance electronic images for Technology Packs from IBM Passport Advantage®
website.
Related information
System requirements
IBM Telco Network Cloud Manager - Performance 1.4.5 103

Downloading the installation media
Licensed customers can download the Telco Network Cloud Manager - Performance electronic images from IBM®Passport Advantage.
About this task
Download and extract the IBM Telco Network Cloud Manager - Performance V1.4.5 English Base for Kubernetes software, which is the core bundle on the master
node in your Kubernetes cluster.
Download and extract the IBM Telco Network Cloud Manager - Performance V1.4.5 English Multiplatform Advanced, which has additional files and folders on the
master node in your Kubernetes cluster.
Procedure
1. Copy the M0H7HEN.tar.gz-TIV-TNCP.tar.gz image from IBM Passport Advantage to a location of your choice in the master node in your Kubernetes cluster.
For example, /installers/core. It is referred to as <DIST_DIR>.
2. Use the following command to extract the media:
tar -zxvf M0H7HEN.tar.gz-TIV-TNCP.tar.gz
Or use the following command:
gunzip -c M0H7HEN.tar.gz-TIV-TNCP.tar.gz | tar -xvf -
You can see the following files and folders of significance:
etc
tools
backup.sh
This script helps to back up NFS data.
encrypt.sh
This script helps to create an encrypted password from a text that can be used in the system anywhere.
offline.sh and offline.bat
These scripts can be used to download all Telco Network Cloud Manager - Performance Docker images from the Docker hub without access to
internet.
prerequisites.sh
This script checks if your environment has all the requirements.
restore.sh
This script helps to restore the backup NFS data.
integrations
dash
Contains the dash-integration.tar.gz file that is used for integrating Telco Network Cloud Manager - Performance with Jazz® for Service
Management.
license
services
A folder that contains all the microservices that are available in Telco Network Cloud Manager - Performance.
Every service has a yaml configuration file. The following subfolders for each microservices are available:
analytics
app
cassandra
ceph
dashboard
diamond-db
dns-collector
file-collector
flow-analytics
flow-collector
inventory
kafka
nfs
nifi
operator
pack-service
ping-collector
postgres
postgres-threshold
security
sleeping-cell
snmp-collector
snmp-discovery
threshold
timeseries
ui
104 IBM Telco Network Cloud Manager - Performance 1.4.5

zookeeper
install.sh
Script to run the Telco Network Cloud Manager - Performance installer.
tncp-cr-template.yaml
A template that contains the custom resource definition to use with the installation script.
uninstall.sh
Script to uninstall Telco Network Cloud Manager - Performance software.
3. Download M0H7JEN.tar.gz advanced bundle to the <DIST_DIR>.
4. Use the following command to extract the media:
tar -zxvf M0H7JEN.tar.gz
Or, use the following command:
gunzip -c M0H7JEN.tar.gz | tar -xvf -
You can see the following files and folders of significance:
remote
basecamp-remote-flow-collector-2.4.5.0.tar.gz
basecamp-remote-inventory-2.4.5.0.tar.gz
basecamp-remote-ping-collector-2.4.5.0.tar.gz
basecamp-remote-snmp-collector-2.4.5.0.tar.gz
basecamp-remote-snmp-discovery-2.4.5.0.tar.gz
resource-report
Extract the basecamp-resource-report-2.4.5.0.tgz file. It contains the script to generate a report with information on device classification. For more
information about this feature, see Generating the audit report.
tools
The following scripts of significance are available in this folder:
omnibus
It has the launch-tool.js script file that is needed for integration with IBM Tivoli® Netcool®/OMNIbus. For more information, see Setting up
integration with Tivoli Netcool/OMNIbus.
snmp
This folder has snmp-formula.sh script to enable or disable the metrics to be collected and displayed in the dashboards. For more information, see
Enabling and disabling formulas.
Downloading the Technology Packs media
Licensed customers can download the Telco Network Cloud Manager - Performance electronic images for Technology Packs from IBM® Passport Advantage® website.
About this task
Download and extract Telco Network Cloud Manager - Performance Technology Packs on the infra node in your OpenShift® Container Platform cluster.
Note: You do not need to download the Telco Network Cloud Manager - Performance core software.
Download and extract Telco Network Cloud Manager - Performance Technology Packs on the master node in your Kubernetes cluster.
Procedure
1. Download the needed Technology Pack images to a location of your choice.
For example, M0BPRML.tar.gz. The location is referred to as <DIST_DIR_PACKS>.
2. Use the following command to extract the Technology Pack software:
tar -zxvf M0BPRML.tar.gz
You can find the COTS Technology Pack JAR files that are available in the bundle.
For more information about the Technology Pack bundles, see part numbers for Technology Packs in Release summary topic.
If the /packs folder does not exist, the folder is created.
All the Jar files that are available in the bundle are copied to the /packs folder.
Preparing your environment
Before you run the installation, you must prepare your target environments. Install the prerequisite software.
Installing the prerequisite software
Install the prerequisite products before you install Telco Network Cloud Manager - Performance.
Enabling NTP on your cluster
The clocks of all the nodes in your cluster must be synchronized. If your system does not have access to the internet, you must set up a master node as an NTP
xserver to achieve this synchronization.
Configuring your cluster with hostnames
You must ensure that your computer hostname is configured correctly before you set up Telco Network Cloud Manager - Performance clusters.
IBM Telco Network Cloud Manager - Performance 1.4.5 105

Running the prerequisite script
Run the prerequisite script to check whether your environment meets certain requirements. Run the script on all nodes in your cluster.
Installing the prerequisite software
Install the prerequisite products before you install Telco Network Cloud Manager - Performance.
About this task
Prerequisite software for integrated installation where Telco Network Cloud Manager - Performance is integrated with Jazz® for Service Management for unified
visualizations as single pane of glass.
Cloud platform of your choice
Red Hat® OpenShift® Container Platform
Kubernetes (K8s)
IBM® products for integration
Jazz for Service Management
Watson™ AIOps Event Manager
Note: When you have the Watson AIOps Event Manager component, both Dashboard Application Services Hub and Tivoli® Netcool®/OMNIbus are
available in your environment.
Watson AIOps Metric Manager
Prerequisite software for dedicated stand-alone installation, where all the visualizations are accessed from Telco Network Cloud Manager - Performance
Engine interface.
Preparing Kubernetes (K8s) cluster
Prepare your Kubernetes (K8s) cluster for deployment.
Installing IBM products for integrated installation
Install the needed IBM products according to your entitlement.
Shared persistent storage
To install Telco Network Cloud Manager - Performance, you must have a supported file storage system on your Red Hat OpenShift cluster. Ensure that you have a
storage class that is already configured in OpenShift Container Platform that can be used for creating storage for Telco Network Cloud Manager - Performance
services.
Related information
Getting started
Preparing Kubernetes (K8s) cluster
Prepare your Kubernetes (K8s) cluster for deployment.
About this task
Follow the steps in the table to prepare your cluster.
Item Details
Provision the virtual machines. See Deployment considerations.
Review the system requirements. See Kubernetes Cluster Hardware Recommendations.
Open the needed ports. See the Table.
Install the Docker container on Master node and Worker nodes. For more information about installing Docker, see the
Docker Documentation.
Install kubeadm,kubelet, and kubectl. For more information about the installation, see
Installing kubeadm, kubelet and kubectl.
Set up Kubernetes Control Plane on the Master node. See Overview of kubeadm. Take note of the output for the
JOIN command for worker nodes.
Install a Pod network add-on so that your Pods can communicate with each other. Calico is used here.
Calico is a networking and network policy provider. Calico supports a flexible set of networking options so you
can choose the most efficient option for your situation, including nonoverlay and overlay networks, with or
without BGP.
Install a Pod network add-on with the following command on the control-plane node or a node that has the
kubeconfig credentials:
kubectl apply -f <add-on.yaml>
Note: You can install only one Pod network per cluster.
Deploy Calico with the following command:
kubectl apply -f
https://docs.projectcalico.org/v3.11/manif
ests/calico.yaml
106 IBM Telco Network Cloud Manager - Performance 1.4.5

Item Details
Join all the nodes to your cluster. The nodes are where your workloads that have the containers and Pods run. To add new nodes to your cluster, do the following tasks
on each worker node:
1. Run the command so on that is the output of
kubeadm init command.
Note: When you run this command from the
control plane or master node, make sure that the
token is not expired.
For example,
kubeadm join --token <token>
<control-plane-host>:<control-plane-
port>
--discovery-
token-ca-cert-hash sha256:<hash>
2. Verify that the node is now a part of the cluster
with the following command:
Note: Run these commands master node only.
kubectl get nodes
kubectl describe node <node_name>
3. Verify that the cluster is working correctly with the
following commands:
Note: Run these commands in master node only.
Check versioning with the following
commands:
kubeadm version
kubelet --version
kubectl version
Check cluster information with the following
command:
kubectl cluster-info
Check component status with the following
command:
kubectl get cs
Check Nodes status with the following
command:
kubectl get nodes
Check Pods status with the following
command:
kubectl get pods --all-
namespaces -o wide
Deploy Kubernetes Dashboard. For more information, see Deploying the Dashboard UI.
Access the Dashboard externally. 1. Edit the dashboard service and change service
type from ClusterIP to NodePort. Run the following
command:
kubectl -n kubernetes-dashboard edit
service kubernetes-dashboard
2. Get the mapped port for Dashboard Service port
with the following command:
kubectl -n kubernetes-dashboard get
services
3. Use the NodePort, which is the external port for
kubernetes-dashboard to log in to the
Dashboard as follows:
https://<master_node_IP>: <externalPort>
For more information, see Accessing Dashboard 1.7.x
and above.
Optional: Edit the port number for Kubernetes Dashboard if it clashes with any of the service ports in Telco
Network Cloud Manager - Performance.
Run the following commands to update the port number:
kubectl -n kubernetes-dashboard edit
service kubernetes-dashboard
Update the nodePort to 31000.
Note: Recommend updating to 31000 for easy
remembrance and consistency.
Ports to be opened on Kubernetes cluster.
Component Default ports Protocol Node
Kubernetes API Server 6443 TCP Master
IBM Telco Network Cloud Manager - Performance 1.4.5 107

Component Default ports Protocol Node
etcd Server client API 2379-2380 TCP Master
Kubelet API 10250 TCP Master
kube-scheduler 10251 TCP Master
kube-controller-manager 10252 TCP Master
Read-Only Kubelet API 10255 TCP Master
Kubelet API 10250 TCP Worker
Read-Only Kubelet API 10255 TCP Worker
NodePort Services 30000-32767 TCP Worker
Installing IBM products for integrated installation
Install the needed IBM® products according to your entitlement.
About this task
Make sure you have the following IBM products to integrate with Telco Network Cloud Manager - Performance to get the full feature benefits from it:
Watson™ AIOps Event Manager (IBM Tivoli® Netcool®/OMNIbus). You can view the threshold violation alarms for configured performance metrics in Event Viewer
and also for in-depth analysis of specific metrics by launch-in-context to Metric viewer dashboard.
Watson AIOps Metric Manager (Watson AIOps Metric Manager) for predictive analytics of the metrics that generate baseline threshold violations.
Procedure
1. Install the Watson AIOps Event Manager components of Watson AIOps according to your entitlement.
2. Install the Watson AIOps Metric Manager.
Shared persistent storage
To install Telco Network Cloud Manager - Performance, you must have a supported file storage system on your Red Hat® OpenShift® cluster. Ensure that you have a storage
class that is already configured in OpenShift Container Platform that can be used for creating storage for Telco Network Cloud Manager - Performance services.
Typically, you can work with any type of storage class for Telco Network Cloud Manager - Performance deployment.
In the test environments, Rook Ceph® and NFS storage classes are tested. Information is provided to support it.
Note: If you need help with other storage providers in your OpenShift Container Platform environment, contact IBM® Support.
Configuring the Ceph storage class
For Telco Network Cloud Manager - Performance, you can use a preexisting storage class that is installed along with OpenShift Container Platform or create your
own. During the installation of Telco Network Cloud Manager - Performance, you must specify the storage classes for components that require persistence.
Configuring the Ceph® storage class
For Telco Network Cloud Manager - Performance, you can use a preexisting storage class that is installed along with OpenShift® Container Platform or create your own.
During the installation of Telco Network Cloud Manager - Performance, you must specify the storage classes for components that require persistence.
About this task
Telco Network Cloud Manager - Performance is tested with Ceph Storage Class. Use this information to set up Ceph Storage Class by using the Ansible Playbook. For
more information, see https://github.com/IBM/community-automation/tree/master/ansible/csi-cephfs-fyre-play.
Procedure
1. Run the following command to see the available storage classes:
oc get sc
Alternatively, you can go to storage classes in the left navigation in Red Hat OpenShift web console to see what storage classes are available in your cluster.
2. Generate SSH key for IBM® GitHub to clone repository.
See https://github.ibm.com/settings/keys.
3. Install git repository.
yum install git
4. Install epel-release and ansible.
108 IBM Telco Network Cloud Manager - Performance 1.4.5

dnf install https://dl.fedoraproject.org/pub/epel/epel-release-latest-8.noarch.rpm -y
dnf install ansible -y
5. Clone the repository in a folder.
For example, ceph
git clone https://github.com/IBM/community-automation.git
git clone https://github.com/rook/rook.git
You can find the following content:
ansible.cfg csi-cephfs.yml examples Jenkinsfile README.md roles
Set up Ceph.
6. Copy examples/inventory content to a higher-level directory.
cd community-automation/ansible/csi-cephfs-fyre-play/
cp examples/inventory .
You can find the following content:
ansible.cfg csi-cephfs.yml examples inventory Jenkinsfile README.md roles
7. Update inventory to modify the IP address and root password of the infra node.
cat inventory
<myserver.ibm.com> ansible_connection=ssh ansible_ssh_user=root ansible_ssh_pass=<password>
ansible_ssh_common_args='-o StrictHostKeyChecking=no'
8. Install Ceph by using the Ansible Playbook.
ansible-playbook -i inventory csi-cephfs.yml
9. Check that the Ceph Storage Class is installed.
oc get sc
NAME PROVISIONER RECLAIMPOLICY VOLUMEBINDINGMODE ALLOWVOLUMEEXPANSION AGE
csi-cephfs (default) rook-ceph.cephfs.csi.ceph.com Delete Immediate true 6m10s
rook-ceph-block rook-ceph.rbd.csi.ceph.com Delete Immediate true 6m10s
rook-cephfs rook-ceph.cephfs.csi.ceph.com Delete Immediate true 6m11s
Note: The csi-cephfs storage class is used by Telco Network Cloud Manager - Performance and the rook-cephfs storage class is used by Watson™ AIOps.
oc get pods -n rook-ceph
NAME READY STATUS RESTARTS AGE
csi-cephfsplugin-5fdxp 3/3 Running 0 5m33s
csi-cephfsplugin-bk7x5 3/3 Running 0 5m33s
csi-cephfsplugin-provisioner-5c65b94c8d-p7hgf 6/6 Running 0 5m32s
csi-cephfsplugin-provisioner-5c65b94c8d-zrs7r 6/6 Running 0 5m32s
csi-cephfsplugin-qsttw 3/3 Running 0 5m33s
csi-rbdplugin-97ftx 3/3 Running 0 5m34s
csi-rbdplugin-fmhqg 3/3 Running 0 5m34s
csi-rbdplugin-provisioner-569c75558-594jd 6/6 Running 0 5m33s
csi-rbdplugin-provisioner-569c75558-bcbrb 6/6 Running 0 5m33s
csi-rbdplugin-v7tng 3/3 Running 0 5m34s
rook-ceph-crashcollector-worker0.tncpqacluster2.cp.fyre.ibm75jv 1/1 Running 0 4m12s
rook-ceph-crashcollector-worker1.tncpqacluster2.cp.fyre.ib2tgrv 1/1 Running 0 4m44s
rook-ceph-crashcollector-worker2.tncpqacluster2.cp.fyre.ibwzmqv 1/1 Running 0 3m17s
rook-ceph-mds-myfs-a-6d68d4b46c-sm44x 1/1 Running 0 3m18s
rook-ceph-mds-myfs-b-7485957c69-8nzlv 1/1 Running 0 3m17s
rook-ceph-mgr-a-7d94f86f47-dxpsc 1/1 Running 0 3m42s
rook-ceph-mon-a-d995b4677-htmsr 1/1 Running 0 4m54s
rook-ceph-mon-b-fb7d5c6f4-c2qbh 1/1 Running 0 4m45s
rook-ceph-mon-c-646b8b4d79-8n9vc 1/1 Running 0 4m12s
rook-ceph-operator-59cbfb7c7c-qg6t2 1/1 Running 0 6m35s
rook-ceph-osd-0-7547b5ddd6-56wf9 1/1 Running 0 3m32s
rook-ceph-osd-1-56546d7db7-hlvt9 1/1 Running 0 3m31s
rook-ceph-osd-2-6ccc64d59b-hnbzr 1/1 Running 0 3m30s
rook-ceph-osd-prepare-worker0.tncpqacluster2.cp.fyre.ibm.c5f898 0/1 Completed 0 3m41s
rook-ceph-osd-prepare-worker1.tncpqacluster2.cp.fyre.ibm.csxzlg 0/1 Completed 0 3m41s
rook-ceph-osd-prepare-worker2.tncpqacluster2.cp.fyre.ibm.cvsvc2 0/1 Completed 0 3m40s
rook-discover-2ntqb 1/1 Running 0 6m12s
rook-discover-9v4jk 1/1 Running 0 6m12s
rook-discover-k4vdw 1/1 Running 0 6m12s
Enabling NTP on your cluster
The clocks of all the nodes in your cluster must be synchronized. If your system does not have access to the internet, you must set up a master node as an NTP xserver to
achieve this synchronization.
About this task
Use the following instructions to enable NTP for your cluster:
Procedure
IBM Telco Network Cloud Manager - Performance 1.4.5 109

1. Run the following command to configure NTP clients on each node in your cluster:
a. Use the following command to configure the NTP clients:
yum install ntp
b. Use the following command to enable the service:
systemctl enable ntpd
c. Use the following command to start the NTPD:
systemctl start ntpd
2. Run the following command to enable the service on each node in your cluster:
chkconfig ntpd on
3. If you want to use an existing NTP server as the X server in your environment, complete the following steps:
a. Configure the firewall on the local NTP server to enable UDP input traffic on Port 123 and replace 192.168.1.0/24 with the IP addresses in the cluster, as
shown in the following example with RHEL hosts:
# iptables -A RH-Firewall-1-INPUT -s 192.168.1.0/24 -m state --state NEW -p udp --dport 123 -j ACCEPT
4. Save and restart iptables. Run the following command on all the nodes in your cluster:
# service iptables save
# service iptables restart
5. Finally, configure clients to use the local NTP server. Edit the /etc/ntp.conf file and add the following line:
server $LOCAL_SERVER_IP OR HOSTNAME
Configuring your cluster with hostnames
You must ensure that your computer hostname is configured correctly before you set up Telco Network Cloud Manager - Performance clusters.
About this task
Make sure that all nodes can resolve all cluster addresses.
Procedure
1. Make sure all the hostnames of the servers in your cluster are DNS resolvable.
Run the following command with your server name to check that the server is configured correctly:
nslookup myserver-worker01.ibm.com
Server: 10.60.90.206
Address: 10.60.90.206#53
Name: myserver-worker01.ibm.com
Address: 10.210.117.34
Note: If you do not see name of the server in the output, it is not DNS resolvable.
2. Repeat for all servers in the clusters.
Running the prerequisite script
Run the prerequisite script to check whether your environment meets certain requirements. Run the script on all nodes in your cluster.
Before you begin
Perform the following tasks:
If the firewall is enabled, run the following commands to open the needed ports for Calico Container Network Interface (CNI) on all nodes in your cluster:
Note: The tcp port numbers 9099 and 179 are for Calico Container Network Interface (CNI) that is used in the installation of Kubernetes. If you are using any other
CNI, open the appropriate ports.
#Calico network plugin
firewall-cmd --permanent --zone=public --add-port=9099/tcp
firewall-cmd --permanent --zone=public --add-port=179/tcp
firewall-cmd --permanent --zone=public --add-port=30030/tcp
firewall-cmd --permanent --zone=public --add-port=30037/tcp
If the firewall is enabled, run the following command to add firewall port range for all Telco Network Cloud Manager - Performance services at each node:
firewall-cmd --add-port=3000-32767/tcp –permanent
Or
If the firewall is enabled, run the following command to add firewall with white IP addresses:
110 IBM Telco Network Cloud Manager - Performance 1.4.5

firewall-cmd --permanent --zone=public --add-source=<192.168.100.0>/24
firewall-cmd --permanent --zone=public --add-source=<192.168.222.123>/32
Where <192.168.100.0> and <192.168.222.123> are the base IP range in your environment.
Make sure that the following repos are installed or updated:
Red Hat® repo
It is needed in /etc/yum.repos.d to install RPMs.
unzip.x86_64 RPM
It is needed to extract the Telco Network Cloud Manager - Performance Technology Packs during installation.
Update package container-selinux to V2.107-3 with this command.
yum install -y http://mirror.centos.org/centos/7/extras/x86_64/Packages/container-selinux-2.107-3.el7.noarch.rpm
If you are unable to install docker or containerd, then run the command to update the SELinux package to V2.107-3.
Install bc with the following command:
yum install bc
bc is a UNIX command, which stands for basic calculator. It is a command-line utility that offers everything you expect from a simple scientific or financial
calculator.
Configure inotify with for following parameters:
fs.inotify.max_user_watches defines the maximum number of users, and fs.inotify.max_user_instances defines the maximum number of inotify
instances that can be created per real user ID.
vi /etc/sysctl.conf
fs.inotify.max_user_watches=64000
fs.inotify.max_user_instances=64000
sysctl -p
Inotify is a Linux® kernel feature that monitors file systems and immediately alerts an attentive application to relevant events, such as a delete, read, write, and
even an unmount operation.
Make sure that you have internet access to download Docker and Kubernetes repos.
Procedure
1. Copy the prerequisites.sh file to all the nodes.
2. Run the following commands as root or sudo user:
cd /<DIST_DIR>/etc/tools
./prerequisites.sh
The following items are checked by the script:
Checks for the availability of package nfs-utils.
If the firewall is enabled, it checks whether the port numbers are opened or not.
Sample output without firewalld
Start Prerequisite Scan ....
[INFO] nfs-utils check --- ok
[INFO] unzip installed check --- ok
which: no bc in (/usr/local/sbin:/usr/local/bin:/usr/sbin:/usr/bin:/root/bin)
[ERROR] bc is not installed --- failed
[ERROR] Inotify max user watches is less than 64000 --- failed
Run below command to set inotify max user watches :
echo fs.inotify.max_user_watches=64000 | tee -a /etc/sysctl.conf
sysctl -p
[ERROR] Inotify max user instances is less than 64000 --- failed
Run below command to set inotify max user instances :
echo fs.inotify.max_user_instances=64000 | tee -a /etc/sysctl.conf
sysctl -p
Prerequisite Scan Completed.
Installing software
Use this information to install Telco Network Cloud Manager - Performance core software, and then install the vendor-specific COTS Technology Pack bundles that can be
downloaded separately.
Before you begin
Ensure that the cluster meets the minimum requirements for installing. See System requirements.
Verify that your cluster administrator completed the following tasks:
The cluster is set up and working correctly.
Ensure that all nodes have internet access. If you do not have internet access, use offline installation process.
Ensure that the necessary user permissions are in place for all the installation directories.
IBM Telco Network Cloud Manager - Performance 1.4.5 111

Ensure that all the hosts in your cluster are in the same time zone.
Install the Jazz for Service Management.
Install the following IBM® Netcool® Operations Insight® components:
IBM Tivoli® Netcool/OMNIbus
IBM Operations Analytics - Predictive Insights
About this task
Installation of Telco Network Cloud Manager - Performance is a three-step process:
Note: For more information about the software bundles and their part numbers, see Media content section in Release summary.
1. Install the Telco Network Cloud Manager - Performance core software bundle for Kubernetes cluster.
2. Optional, install the Telco Network Cloud Manager - Performance Advanced software bundle, which has additional files and folders.
Advanced bundle contains the files for setting up Remote Flow Collector, Remote SNMP Discovery. For more information, see Downloading the installation media.
3. Install the needed Technology Packs.
Installing Telco Network Cloud Manager - Performance
When you run the installation script, Telco Network Cloud Manager - Performance services are installed on all worker nodes in your Kubernetes cluster. Run the
installation script on master node.
Installing Technology Packs
Use this information to install the Technology Pack content that is available with Telco Network Cloud Manager - Performance installation media. The ready-to-use
Technology Pack content includes predefined vendor-specific discovery formulas, collection formulas, and metrics that you can use for discovery and polling the
devices.
Installing Telco Network Cloud Manager - Performance
When you run the installation script, Telco Network Cloud Manager - Performance services are installed on all worker nodes in your Kubernetes cluster. Run the
installation script on master node.
You can install the Telco Network Cloud Manager - Performance software with the install.sh script in two ways:
Install with default settings. By default, NFS persistent storage is supported.
Install with a custom resource definition.
A custom resource is an extension of the Kubernetes API that is not available in a default Kubernetes installation. It represents a customization of a particular
Kubernetes installation. You create a custom resource file by editing the tncp-cr-template.yaml file that is provided in the core installation bundle.
Installing with default settings
1. Log in to the master node.
2. Run the following command to install Telco Network Cloud Manager - Performance as root user or use sudo:
If you are using NFS as the storage class, use the following command:
cd <DIST_DIR>
./install.sh
The following installation output is seen:
Creating namespace...
Installing nfs...
Installing operator...
Creating default TNCP instance...
Creating services with nodePort...
Install complete.
If you are using Ceph as the storage class, use the following command:
cd <DIST_DIR>
./install.sh --storage=ceph
The following installation output is seen:
Creating namespace...
Installing ceph...
No resources found in tncp namespace.
Installing operator...
Creating TNCP instance...
Install complete.
Installing by using a custom resource definition
1. Log in to the master node.
2. Open the tncp-cr-template.yaml file that is available in the <DIST_DIR> directory in an editor and update the values as needed. The template has the following
contents:
apiVersion: tncp.ibm.com/v1
kind: TNCP
metadata:
name: tncp #CR instance name, we can give name as per our choice
namespace: tncp #Change the namespace as per target TNCP product namespace
112 IBM Telco Network Cloud Manager - Performance 1.4.5

spec:
license:
accept: true
#Add the scaling parameter to the tncp-cr-template.yaml file
scaling: #This setting is to enable horizontal scaling of the TNCP Pods based on the values in the
sizing sheet.
auto: true
services: #This section is not mandatory, if you specify this, then resource limits are updated based
on the values that are provided
security: #Service name, add this for only for those services where you need to update the resource
limits
resources:
cpu: 100m #Default CPU limit, if you want to change this value, then specify a greater value
memory: 1Gi #Default memory limit, if you want to change this value, then specify a greater value
app:
resources:
cpu: 200m
memory: 1Gi
snmp-discovery:
resources:
cpu: '1'
memory: 4Gi
timeseries:
resources:
cpu: '1'
memory: 1.5Gi
kafka:
resources:
cpu: 500m
memory: 2Gi
flow-analytics:
resources:
cpu: 500m
memory: 1250Mi
analytics-stream:
resources:
cpu: '2'
memory: 6Gi
postgres-th:
resources:
cpu: 100m
memory: 1Gi
cassandra:
resources:
cpu: '2'
memory: 10Gi
dns-collector:
resources:
cpu: 200m
memory: 1Gi
threshold:
resources:
cpu: 200m
memory: 1Gi
diamond-db-read:
resources:
cpu: 800m
memory: 4Gi
zookeeper:
resources:
cpu: 100m
memory: 1Gi
flow-collector:
resources:
cpu: 500m
memory: 1250Mi
analytics-batch:
resources:
cpu: '1'
memory: 3Gi
ui:
resources:
cpu: 200m
memory: 1Gi
dashboard:
resources:
cpu: 500m
memory: 2Gi
diamond-db:
resources:
cpu: 800m
memory: 4Gi
diamond-db-export:
resources:
cpu: 800m
memory: 4Gi
pack-service:
resources:
cpu: '2'
memory: 4Gi
ping-collector
resources:
cpu: 1m
memory: 1Gi
postgres:
resources:
IBM Telco Network Cloud Manager - Performance 1.4.5 113

cpu: 100m
memory: 1Gi
inventory:
resources:
cpu: 500m
memory: 1Gi
file-collector:
resources:
cpu: 1500m
memory: 4Gi
snmp-collector:
resources:
cpu: '1'
memory: 1Gi
nifi:
resources:
cpu: '1'
memory: 2Gi
storageClassName: nfs #This is default storageClassName for nfs, change the value if any other storage class
is available. For example, csi-cephfs for ceph
3. Run the install.sh script with the following command:
sudo ./install.sh --cr=tncp-cr-template.yaml
The following installation output is seen:
Creating namespace...
Installing nfs...
Installing operator...
Creating default TNCP instance from file tncp-cr-template.yaml...
tncp.tncp.ibm.com/tncp created
Creating services with nodePort...
Install complete.
4. Verify the Telco Network Cloud Manager - Performance Pods are up. Make sure that the Dashboard Pod is up.
$ sudo kubectl get services -o wide -n tncp
NAME TYPE CLUSTER-IP EXTERNAL-IP PORT(S)
AGE SELECTOR
analytics-batch ClusterIP 10.98.62.223 <none> 30028/TCP,30029/TCP
25h service=analytics-batch
analytics-stream ClusterIP 10.108.205.246 <none> 30030/TCP,30031/TCP
25h service=analytics-stream
analytics-stream-direct ClusterIP None <none> 30062/TCP,30063/TCP
25h service=analytics-stream
app ClusterIP 10.106.174.140 <none> 30037/TCP
25h service=app
cassandra ClusterIP None <none> 9042/TCP,7000/TCP
25h service=cassandra
dashboard ClusterIP 10.104.244.144 <none> 31080/TCP,31443/TCP
25h service=dashboard
dashboard-external NodePort 10.111.83.174 <none> 31080:31080/TCP,31443:31443/TCP
25h service=dashboard
diamond-db ClusterIP 10.107.225.23 <none> 30010/TCP,30008/TCP
25h service=diamond-db
diamond-db-cluster ClusterIP None <none> 7110/TCP
25h service=diamond-db
diamond-db-cluster-export ClusterIP None <none> 8120/TCP
25h service=diamond-db-export
diamond-db-cluster-read ClusterIP None <none> 8110/TCP
25h service=diamond-db-read
diamond-db-export ClusterIP 10.101.54.51 <none> 30120/TCP,30118/TCP
25h service=diamond-db-export
diamond-db-read ClusterIP 10.102.137.231 <none> 30110/TCP,30108/TCP
25h service=diamond-db-read
dns-collector ClusterIP 10.108.43.220 <none> 30042/TCP,30043/TCP
25h service=dns-collector
file-collector ClusterIP 10.103.104.138 <none> 30024/TCP
25h service=file-collector
flow-analytics ClusterIP 10.107.107.59 <none> 30044/TCP,30045/TCP
25h service=flow-analytics
flow-collector ClusterIP 10.97.191.165 <none> 30040/TCP,30041/TCP
25h service=flow-collector
flow-collector-external ClusterIP 10.111.253.244 <none> 4381/TCP,4379/UDP
25h service=flow-collector
inventory ClusterIP 10.99.53.71 <none> 30016/TCP,30017/TCP
25h service=inventory
kafka ClusterIP 10.107.193.76 <none> 9092/TCP
25h service=kafka
nfs ClusterIP 10.101.94.71 <none> 2049/TCP,20048/TCP,111/TCP
25h service=nfs
nfs-external NodePort 10.101.245.118 <none> 2049:32049/TCP
25h service=nfs
nifi ClusterIP 10.96.66.243 <none> 30026/TCP
25h service=nifi
nifi-external NodePort 10.99.119.141 <none> 30026:30026/TCP
25h service=nifi
operator ClusterIP 10.106.165.110 <none> 30051/TCP
25h service=operator
pack-service ClusterIP 10.103.95.35 <none> 30048/TCP,30049/TCP
25h service=pack-service
ping-collector ClusterIP 10.106.160.156 <none> 30050/TCP,30051/TCP
25h service=ping-collector
postgres ClusterIP 10.105.46.217 <none> 5432/TCP,31415/TCP
25h service=postgres
114 IBM Telco Network Cloud Manager - Performance 1.4.5

postgres-th ClusterIP 10.111.93.156 <none> 5433/TCP
25h service=postgres-th
security ClusterIP 10.96.109.20 <none> 389/TCP
25h service=security
snmp-collector ClusterIP 10.110.85.105 <none> 30034/TCP,30035/TCP
25h service=snmp-collector
snmp-discovery ClusterIP 10.99.1.33 <none> 30018/TCP,30019/TCP
25h service=snmp-discovery
solr NodePort 10.97.48.88 <none> 8993:30011/TCP,8983:32762/TCP
25h service=inventory
threshold ClusterIP 10.105.175.143 <none> 30032/TCP,30033/TCP
25h service=threshold
timeseries ClusterIP 10.97.103.39 <none> 30014/TCP,30015/TCP
25h service=timeseries
ui ClusterIP 10.107.11.252 <none> 30021/TCP
25h service=ui
zookeeper ClusterIP 10.101.71.2 <none> 2181/TCP,2888/TCP,3888/TCP
25h service=zookeeper
Result
You can observe the Pods as they are installing from Kubernetes Dashboard. Installation completes when you see all the Pods are in running state.
Note:
The following Config Maps are created:
common Config Map is created with LDAP default settings.
generic-metric-mapper
kube-root-ca.crt
threshold-omnibus-rule
timeseries-retention Config Map to configure the time series data retention.
The following Pods are created and scaled up to 1:
App
Cassandra
Dashboard
Diamond-db
Diamond-db-read
Inventory
Kafka
Operator
Pack Service
Postgres
Postgres-th
Security
Timeseries
UI
Zookeeper
The following Pods are created but scaled down to 0:
Analytics batch
Any technology pack that has batch jobs defined in it.
Analytics-stream
Any technology pack that has streams defined in it.
DNS Collector
It is scaled up after the Flow Technology Pack is installed.
File Collector
It is scaled up after a File-based Technology Pack is installed.
Flow Analytics
It is scaled up after the Flow Technology Pack is installed.
Flow Collector
It is scaled up after the Flow Technology Pack is installed.
NiFi
It is scaled up after a File-based Technology Pack is installed.
Ping Collector
Manually, scale up the service to see the Ping Profiles page and dashboards.
SNMP Collector
It is scaled up after an SNMP-based Technology Pack is installed.
SNMP Discovery
It is scaled up after an SNMP-based Technology Pack is installed.
Inventory
If it is not scaled up by default, manually, scale up the Inventory Pod.
(Optional) Installing Telco Network Cloud Manager - Performance offline
Typically, the procedure to install Telco Network Cloud Manager - Performance images on a Kubernetes cluster is same whether the host has access to internet or
not. In offline installation, containers are pulled from the Docker Hub to a computer that has access to internet, and then a single package with all the containers is
created. The single package can be copied to the hosts where they can be installed without internet access.
IBM Telco Network Cloud Manager - Performance 1.4.5 115

Related reference
Setting up horizontal auto scaling of Pods
(Optional) Installing Telco Network Cloud Manager - Performance offline
Typically, the procedure to install Telco Network Cloud Manager - Performance images on a Kubernetes cluster is same whether the host has access to internet or not. In
offline installation, containers are pulled from the Docker Hub to a computer that has access to internet, and then a single package with all the containers is created. The
single package can be copied to the hosts where they can be installed without internet access.
About this task
Instructions are provided for the following two scenarios:
Installing on offline servers from a Linux system
Pull the containers from the Docker hub to a Linux® system with internet access, and then install on offline servers. With the following steps, you can deploy Telco
Network Cloud Manager - Performance within your secure network.
Installing on offline servers from a Linux system
Pull the containers from the Docker hub to a Linux® system with internet access, and then install on offline servers. With the following steps, you can deploy Telco Network
Cloud Manager - Performance within your secure network.
About this task
To install Telco Network Cloud Manager - Performance in an air-gap environment, you need at least one server to access internet. Rest of the servers in your cluster need
not have internet access.
Procedure
1. Download the Telco Network Cloud Manager - Performance installation media from IBM® Passport Advantage to a server that has internet access.
For example, Server A.
2. Copy the image to a location of your choice.
For example, /installers/core. It is referred to as <DIST_DIR>.
3. Use the following command to extract the media:
tar -zxvf tncp-1.4.5.tar.gz
Or use the following command:
gunzip -c tncp-1.4.5.tar.gz | tar -xvf -
See Downloading the installation media for files and folders available in the media.
4. Run the offline.sh script by using the following commands:
cd <DIST_DIR>/etc/tools
./offline.sh
Note: This step requires access to internet.
All the docker images are downloaded from the Docker hub and saved as tncp-1.4.5-images.tar file in <DIST_DIR>/etc/tools location.
The output is as follows:
Downloading ceph/ceph:v15...
Downloading docker.io/persistentsystems/basecamp-analytics:2.4.1.0-229-
4b69a3f4@sha256:56d2b5161122ff38da41ea4759d917369c0d3f698b3827ee9f0c1cd9c2fcbdbb...
Downloading docker.io/persistentsystems/basecamp-app:2.4.1.0-229-
4b69a3f4@sha256:23bd8873a491dc5b64e6dc4878e6c6090ac15c7dbfbc9cb5d8243662b7e407be...
Downloading docker.io/persistentsystems/basecamp-
cassandra:3.11.10.1@sha256:ec6467e23ff284307b94774503f99bbace70fd52a0c08ee795bc41eebd4f6dfb...
Downloading docker.io/persistentsystems/basecamp-dashboard:2.4.1.0-229-
4b69a3f4@sha256:f4d26bf9e51fbd3ec0afe0ae9cfc18c1322181ce39247addf2a83fea6cb5ce82...
Downloading docker.io/persistentsystems/basecamp-dns-collector:2.4.1.0-149-
7ffee825@sha256:a746914e6a426abf1f6d7f8a979743ea51864f63fbd8c14f0137111fa7feb4ce...
Downloading docker.io/persistentsystems/basecamp-file-collector:2.4.1.0-149-
7ffee825@sha256:0954780afcc5216d43800a0532e89a0723460634b60d5ed51472b2bba41c902d...
Downloading docker.io/persistentsystems/basecamp-flow-analytics:2.4.1.0-149-
7ffee825@sha256:681c2d15f35e2617af66d23f2cd09e17bb9ddf9598fc900c03e1d211c02265ee...
Downloading docker.io/persistentsystems/basecamp-flow-collector:2.4.1.0-149-
7ffee825@sha256:bead2861019722a19cb41a79385e7b6b58f79612617eb395e645746a5653b818...
Downloading docker.io/persistentsystems/basecamp-inventory:2.4.1.0-229-
4b69a3f4@sha256:e0634efd0472bceb9d5273e0733325c2bc029915407d944c835460602c7a13bf...
Downloading docker.io/persistentsystems/basecamp-
kafka:3.3.3.2@sha256:0773f47ee55815ecc4cb6120cd8d24e37918ab3cffe06fee87d67b1531af9c43...
Downloading docker.io/persistentsystems/basecamp-
ldap:1.0.7@sha256:d5e8abb2654a3566371bff7419319207731d6878c1f670d630a1bfdd10901a2f...
116 IBM Telco Network Cloud Manager - Performance 1.4.5

Downloading docker.io/persistentsystems/basecamp-
nfs:1.0.12@sha256:a3b8cb9976db74d571de3e18f30b9b1b2567c47bb0a40232c93b34825e9ec211...
Downloading docker.io/persistentsystems/basecamp-
nifi:1.10.0.13@sha256:b9ffa5c3434111df0fb608bd1092c5e49fc2aada6afb8994f1f1eeed585c54aa...
Downloading docker.io/persistentsystems/basecamp-
postgres:11.2@sha256:fc0e7467a393d80ba39295f724190d3eb24e4ccc22bb191cd987b08f2b5c3400...
Downloading docker.io/persistentsystems/basecamp-snmp-collector:2.4.1.0-149-
7ffee825@sha256:b6a76ce79566c3c351883f5bb726c5ea7db7b86d339d193aa1bdd8fe4191978e...
Downloading docker.io/persistentsystems/basecamp-snmp-discovery:2.4.1.0-149-
7ffee825@sha256:277f503840ed04e035c1b94c95c4ed797f1a89ce05efc385b84ab6a346a4c71d...
Downloading docker.io/persistentsystems/basecamp-threshold:2.4.1.0-229-
4b69a3f4@sha256:6d1f243643a3cc0c836eee2e9450394c3ced4460718fd4ca519c5dd8cfce8904...
Downloading docker.io/persistentsystems/basecamp-timeseries:2.4.1.0-229-
4b69a3f4@sha256:f0f2abb4c655e4223728b0c7a2301b494223b838a8b3424599047c8ef04716b0...
Downloading docker.io/persistentsystems/basecamp-ui:2.4.1.0-229-
4b69a3f4@sha256:f370dc1c2ce80801f2ab6d1aeba4be9662e2a2691c99e68407716ea5778ee759...
Downloading docker.io/persistentsystems/basecamp-
zookeeper:5.5.0.2@sha256:9aa7cbcf5440baa832bc048796b78366efdd4337b808bdcdc7af9a31457c7cbd...
Downloading docker.io/persistentsystems/diamond-
db:2.0.0.21@sha256:0d280334e8584c04d9e41881f6cf08799647614fdb7732ebfce819631460b036...
Downloading docker.io/persistentsystems/tncp-operator:1.4.2-127-
1c82047c@sha256:c70c4a0a3f775bc4ab66d09b77296ca894929b774af0c11ed23331c9b3dbea86...
Downloading rook/ceph:v1.4.2...
Download complete.
5. Copy the tncp-1.4.5-images.tar to the master node.
6. Copy the tncp-1.4.5-images.tar file to all worker nodes to a location of your choice.
For example, /tmp/images.
You can use the following command:
cp <DIST_DIR>/etc/tools/tncp-1.4.5-images.tar root@workernode:/tmp/images/
7. Run the prerequisite script.
8. In all worker nodes, extract the tncp-1.4.5-images.tar.
9. In all worker nodes, run the install.sh file that is available in the tncp-1.4.5-images.tar file. It loads the .tar files to the Docker repository. Run the following
commands:
cd /tmp/images
./install.sh
10. Check that Docker images are successfully loaded with the following command:
docker images
$ sudo docker images
REPOSITORY TAG IMAGE ID CREATED SIZE
k8s.gcr.io/kube-apiserver v1.21.3 3d174f00aa39 5 weeks ago 126MB
k8s.gcr.io/kube-scheduler v1.21.3 6be0dc1302e3 5 weeks ago 50.6MB
k8s.gcr.io/kube-controller-manager v1.21.3 bc2bb319a703 5 weeks ago 120MB
k8s.gcr.io/kube-proxy v1.21.3 adb2816ea823 5 weeks ago 103MB
persistentsystems/tncp-operator 1.4.2-127-1c82047c 5caa4058cd1d 2 months ago 578MB
persistentsystems/basecamp-snmp-discovery 2.4.1.0-149-7ffee825 3172fc9f1ee5 2 months ago 781MB
persistentsystems/basecamp-file-collector 2.4.1.0-149-7ffee825 cbfb53e7fd21 2 months ago 658MB
persistentsystems/basecamp-dns-collector 2.4.1.0-149-7ffee825 d1d3dfeaa1e2 2 months ago 591MB
persistentsystems/basecamp-flow-collector 2.4.1.0-149-7ffee825 b264bc0fda27 2 months ago 731MB
persistentsystems/basecamp-flow-analytics 2.4.1.0-149-7ffee825 f65dad247806 2 months ago 715MB
persistentsystems/basecamp-snmp-collector 2.4.1.0-149-7ffee825 2810eb0aee84 2 months ago 691MB
persistentsystems/basecamp-analytics 2.4.1.0-229-4b69a3f4 bf524d7dacbd 2 months ago 740MB
persistentsystems/basecamp-threshold 2.4.1.0-229-4b69a3f4 ef4bf482712f 2 months ago 1.44GB
persistentsystems/basecamp-dashboard 2.4.1.0-229-4b69a3f4 cde9958ca669 2 months ago 2.06GB
persistentsystems/basecamp-ui 2.4.1.0-229-4b69a3f4 b67b3020584d 2 months ago 776MB
persistentsystems/basecamp-app 2.4.1.0-229-4b69a3f4 56ef1d320758 2 months ago 628MB
persistentsystems/basecamp-inventory 2.4.1.0-229-4b69a3f4 2a9119d84d5e 2 months ago 627MB
persistentsystems/basecamp-timeseries 2.4.1.0-229-4b69a3f4 2149cd9fbdf2 2 months ago 583MB
persistentsystems/basecamp-nifi 1.10.0.13 06dfed4ce772 2 months ago 2.81GB
persistentsystems/basecamp-ldap 1.0.7 f705b2dd8981 2 months ago 152MB
ceph/ceph v15 2cf504fded39 3 months ago 1.03GB
persistentsystems/basecamp-cassandra 3.11.10.1 da2ea102ee46 3 months ago 402MB
persistentsystems/diamond-db 2.0.0.21 eb2ab8e06c99 3 months ago 793MB
persistentsystems/basecamp-kafka 3.3.3.2 a80ed78d8a9b 3 months ago 596MB
persistentsystems/basecamp-zookeeper 5.5.0.2 f3eb3ce5eae2 3 months ago 694MB
persistentsystems/basecamp-postgres 11.2 5f305eb9cb03 3 months ago 282MB
k8s.gcr.io/pause 3.4.1 0f8457a4c2ec 7 months ago 683kB
persistentsystems/basecamp-nfs 1.0.12 ed5a69915b41 8 months ago 103MB
k8s.gcr.io/coredns/coredns v1.8.0 296a6d5035e2 10 months ago 42.5MB
rook/ceph v1.4.2 24ec62bb5700 12 months ago 1.07GB
k8s.gcr.io/etcd 3.4.13-0 0369cf4303ff 12 months ago 253MB
calico/node v3.11.3 4f4edb11a2f4 15 months ago 261MB
calico/pod2daemon-flexvol v3.11.3 8a7b52b94812 15 months ago 112MB
calico/cni v3.11.3 0f4b3848f931 15 months ago 222MB
calico/kube-controllers v3.11.3 5a18f5dbc200 15 months ago 52.5MB
kubernetesui/dashboard v2.0.0-rc5 fe0df1b24096 18 months ago 126MB
kubernetesui/metrics-scraper v1.0.3 3327f0dbcb4a 19 months ago 40.1MB
11. Copy the Telco Network Cloud Manager - Performance installation media, tncp-1.4.5.tar.gz file from Server A to the master node in your cluster.
Copy the file to a location of your choice.
For example, /installers/core. It is referred to as <DIST_DIR2>.
12. Use the following command to extract the media:
tar -zxvf tncp-1.4.5.tar.gz
IBM Telco Network Cloud Manager - Performance 1.4.5 117

Or use the following command:
gunzip -c tncp-1.4.5.tar.gz | tar -xvf -
See Downloading the installation media for files and folders available in the media.
13. Run the following commands on the master node to install Telco Network Cloud Manager - Performance as root user or use sudo:
cd <DIST_DIR2>
./install.sh --offline=true
<DIST_DIR2> is the directory where you extracted the copied installation media.
Note: It assumes that your storage class is NFS.
14. After the installation is complete, use the following command to check the Pod status in the master node:
kubectl get pods
You can see the following output:
#kubectl get pods
NAME READY STATUS RESTARTS AGE
analytics-batch-0 1/1 Running 6 (44h ago) 5d6h
analytics-stream-0 1/1 Running 0 5d6h
app-0 1/1 Running 10 5d9h
cassandra-0 1/1 Running 0 5d9h
dashboard-0 1/1 Running 2 4d11h
diamond-db-0 1/1 Running 3 (5d9h ago) 5d9h
diamond-db-export-0 1/1 Running 0 5d9h
diamond-db-read-0 1/1 Running 1 5d9h
dns-collector-0 1/1 Running 0 5d6h
file-collector-0 1/1 Running 0 5d6h
flow-analytics-0 1/1 Running 1 5d6h
flow-collector-0 1/1 Running 2 (44h ago) 5d6h
inventory-0 2/2 Running 2 5d5h
kafka-0 1/1 Running 22 (44h ago) 5d9h
nifi-0 1/1 Running 1 5d6h
ping-collector-0 1/1 Running 0 3m49s
postgres-0 2/2 Running 0 5d9h
postgres-th-0 1/1 Running 0 5d9h
security-0 1/1 Running 0 5d9h
snmp-collector-0 1/1 Running 0 5d6h
snmp-discovery-0 1/1 Running 0 5d6h
threshold-0 1/1 Running 1 (44h ago) 5d6h
timeseries-0 1/1 Running 7 (5d8h ago) 5d9h
ui-0 1/1 Running 1 (43h ago) 4d11h
zookeeper-0 1/1 Running 1 5d9h
Installing Technology Packs
Use this information to install the Technology Pack content that is available with Telco Network Cloud Manager - Performance installation media. The ready-to-use
Technology Pack content includes predefined vendor-specific discovery formulas, collection formulas, and metrics that you can use for discovery and polling the devices.
Before you begin
Make sure to install, set up your cluster, and configure your Telco Network Cloud Manager - Performance system successfully.
Make sure to install Telco Network Cloud Manager - Performance Operator.
Make sure to download the Technology Pack bundles.
Make sure that the NiFi Service is scaled to 1 to enable the creation of the NiFi template successfully. Follow these steps:
In OpenShift® Container Platform dashboard, click Stateful Sets in Workloads pane and select the service that you want to scale up or down.
Click the Actions( ) icon for the service that you want to stop or scale down.
Select Edit Stateful Set.
The YAML file is displayed.
Increase the replicas number to 1 in the file.
For example,
spec:
replicas: 1
selector:
matchLabels:
service: analytics-batch
In Kubernetes dashboard, click Stateful Sets in Workloads pane and select the service that you want to scale up or down.
Click the Actions( ) icon and select Scale for the service that you want to stop or scale down.
In the Desired replicas field, select 1.
If the Actual replicas field contains 2, then you can scale down the number by decrementing in Desired replicas.
118 IBM Telco Network Cloud Manager - Performance 1.4.5

Click Scale.
About this task
Categorization of the Technology Packs is as follows. For more information, see Media content.
Technology Pack Architecture type Device type Dependencies
ACME Packet Net-Net 9200 HDR v1.3.0 File-based Wireline Network Health v1.18.0
ACME Packet Net-Net 9200 HDR-SBC v1.1.0 File-based Wireline Network Health v1.18.0
File-based Wireline Network Health v1.18.0
Ciena Transmission v1.3.0 File-based Wireline Network Health v1.18.0
Cisco EPNM v1.0.0 File-based Wireline Network Health v1.18.0
Cisco SD-WAN v1.4.0 File-based Wireline Network Health v1.18.0
SDWAN GOM v1.5.0
Fortinet SD-WAN v1.0.1 File-based Wireline Network Health v1.18.0
SDWAN GOM v1.5.0
GSM Huawei BSS V900R021C10SPC600 v1.5.0 File-based Wireless Network Wireless v1.4.0
GSM Huawei STP V200R005C08 v1.0.0 File-based Wireless Network Wireless v1.4.0
GSM Tekelec STP R46-1 v1.1.0 File-based Wireless Network Wireless v1.4.0
Huawei iManager U2000 V200R016C60 v1.3.1 File-based Wireline Neutral Access Gom v1.8.0
Network Health v1.18.0
Infoblox DNS v1.0.0
Load Balancer for F5 BIG-IP v1.7.0 SNMP Wireline Network Health v1.18.0
LTE Cisco vEPC v1.0.0 File-based Wireless Network Wireless v1.4.0
LTE Huawei EUTRAN V100R015C10 v1.5.0 File-based Wireless Network Wireless v1.4.0
LTE Huawei IMS v1.0.0 File-based Wireless Network Wireless v1.4.0
LTE Huawei HSS V900R008 v1.1.0 File-based Wireless Network Wireless v1.4.0
LTE Huawei MME V900R018C10 v1.1.0 File-based Wireless Network Wireless v1.4.0
LTE Huawei PCRF V300R005C00 v1.1.0 File-based Wireless Network Wireless v1.4.0
LTE Huawei SGWPGW V900R018C10 v1.2.0 File-based Wireless Network Wireless v1.4.0
LTE ZTE EUTRAN IR14 v1.0.0 File-based Wireless Network Wireless v1.4.0
Cloud Kubernetes v1.8.0 File-based Cloud None
Cloud VMWare vSphere v1.1.0 File-based Cloud None
Network Access GPON for Huawei OLTs v1.5.0 SNMP Wireline Neutral Access Gom v1.8.0
Network Health v1.18.0
Network Cisco MPLS v1.1.0 SNMP Wireline Network Health v1.18.0
Neutral Access Gom v1.8.0
Network Ethernet Accedian v1.1.0 SNMP Wireline Network Health v1.18.0
Network Ethernet Adva Optical v1.2.0 SNMP Wireline Network Health v1.18.0
Network Cisco IP SLA Ethernet v1.0.0 SNMP Wireline Network Health v1.18.0
Network Flow v1.3.0 Flow Flow Network Health v1.18.0
Network Health Generic v1.7.0
Network Health Extension v1.7.0
Network Health (extension) v1.7.0 SNMP Wireline Network Health v1.18.0
Network Health Generic v1.7.0
Network Health for Cisco Devices v1.5.0 SNMP Wireline Network Health v1.18.0
Network Health Generic v1.7.0
Network Health for Huawei Devices v1.4.0 SNMP Wireline Network Health v1.18.0
Network Health Generic v1.7.0
Network Health for Juniper Devices v1.4.0 SNMP Wireline Network Health v1.18.0
Network Health Generic v1.7.0
Network Health Generic v1.7.0 SNMP Wireline Network Health v1.18.0
Network Health v1.18.0 SNMP Wireline None
Network Cisco MPLS v1.1.0 SNMP Wireline Network Health v1.18.0
Network Huawei MPLS TE v1.0.0 SNMP Wireline Network Health v1.18.0
Network Juniper MPLS v1.2.0 SNMP Wireline Network Health v1.18.0
Network Generic MPLS LSP v1.1.0 SNMP Wireline Network Health v1.18.0
Network Juniper MPLS RSVP Tunnel v1.0.0 SNMP Wireline Network Health v1.18.0
Network Probe for Cisco IPSLA v1.6.0 SNMP Wireline Network Health v1.18.0
Network Probe for Huawei NQA v1.8.0 SNMP Wireline Network Health v1.18.0
Network Probe for Juniper RPM v1.9.0 SNMP Wireline Network Health v1.18.0
Network QoS for Cisco CBQoS v1.5.0 SNMP Wireline Network Health v1.18.0
Network QoS for Huawei CBQoS v1.5.0 SNMP Wireline Network Health v1.18.0
Network QoS for Juniper CoS v1.4.0 SNMP Wireline Network Health v1.18.0
IBM Telco Network Cloud Manager - Performance 1.4.5 119

Technology Pack Architecture type Device type Dependencies
Network Wireless v1.4.0 File-based Wireless None
Neutral Access GOM v1.8.0 SNMP Wireline Network Health v1.18.0
Network Access Nokia v1.4.0 File-based Wireline Neutral Access Gom v1.8.0
Network Health v1.18.0
Nokia NSP v1.4.0 File-based Wireline Network Health v1.18.0
SDWAN GOM v1.5.0 File-based Wireline Network Health v1.18.0
NR Huawei NUTRAN V100R015C10 v1.5.0 File-based Wireless Network Wireless v1.4.0
UMTS Huawei MGW V200R010C20 v1.2.0 File-based Wireless Network Wireless v1.4.0
UMTS Huawei MSCS V200R011C10 v1.5.0 File-based Wireless Network Wireless v1.4.0
UMTS Huawei UTRAN V100R015C10SPC156 v1.5.0 File-based Wireless Network Wireless v1.4.0
UMTS ZTE UTRAN UR17 v1.1.0 File-based Wireless Network Wireless v1.4.0
WiFi Health for Cisco Controllers v1.7.0 SNMP Wireline Network Health v1.18.0
Note:
The Global Object Model (gom) is designed to define a base set of vendor-neutral objects that can be reused across technologies and vendors.
Network Health (Extension) v1.7.0 is the dependent Technology Pack for all Wireline SNMP packs and also the Flow pack.
SNMP Technology Packs have the following content with in the sub folders:
dashboard
json
Contains specific dashboard JSON files.
menus
Contains menu definitions for the SNMP pack specific dashboards.
properties
Contains all the dashboard properties files for all translated languages.
Note: Dashboards are available in some packs only.
discovery
Contains a folder with the name of the Technology Pack
that has the discovery files with the extension .discovery.
inventory
With in the model folder, Property and Relationship sub folders are available. These folders contain the inventory model files that contain properties and
relationships in the resources. Both property and relationship files have the extension .model.
Note: The inventory folder is available in some packs only.
metrics
Contains the metric files that are organized according to the available Resource types in the pack. Metric files have the extension .metric.
snmp
It has formulas and mibs sub folders. The formulas folder contains the collection formula files with the extension .formula. All the formulas are organized according
to the available Resource types in the pack. The mibs folder contains the MIB files that needed for the Technology Pack.
pack-<pack_name>-details.xlsx
Contains an excel file with all the pack content. For example, pack-network-probe-juniper-details.xlsx.
pack.properties
Contains pack metadata and the dependent packs information.
File-based Technology Packs have the following content:
analytics
Contains predefined batch jobs, streams, and user-defined calculations that are imported directly when the pack is installed as JSON files. You can see these
default jobs and user-defined calculations in Batch Analytics and User-Defined Calculations administration pages. This content is available in some packs only.
file
It has the following sub folders:
discoveries
Contains a folder with the name of the Technology Pack that has the discovery files with the extension .discovery.
formulas
Contains a folder with the name of the Technology Pack that has the collection formula files with the extension .formula. All the formulas are organized
according to the available Resource types in the pack.
inventory
With in the model folder, Property and Relationship sub folders are available. These folders contain the inventory model files that contain properties and parent-
child relationship within the resources. Both property and relationship files have the extension .model.
metrics
Contains the metric files that are organized according to the available Resource types in the pack. Metric files have the extension .metric.
nifi-collector
Contains Apache NiFi related files that include the NiFi flow templates, lookup files, and so on.
pack-<pack_name>-details.xlsx
An excel file with all the pack content. For example, pack-nr-huawei-nutran-v100r015c10-1.0.0-details.xlsx.
pack.properties
120 IBM Telco Network Cloud Manager - Performance 1.4.5

Contains pack metadata and the dependent packs.
Flow Technology Pack has the following content:
dashboard
json
Contains all the Flow dashboard JSON files.
menus
Contains all the Flow dashboard menu definitions as JSON files.
properties
Contains all the Flow dashboard properties files for all translated languages.
flow
Contains all the Flow metric formulas as .formula files.
inventory
With in the model folder, Property and Relationship sub folders are available. These folders contain the inventory model files that contain properties and parent-
child relationship within the resources. Both property and relationship files have the extension .model.
metrics
Contains the metric files that are organized according to the available Resource types in the pack. Metric files have the extension .metric.
pack-network-flow-details.xlsx
An excel file with all the pack content.
pack.properties
Contains pack metadata and the dependent packs.
Network Wireless Technology Pack
dashboard
json
Contains all the mobile dashboard JSON files.
menus
Contains all the mobile dashboard menu as JSON files.
properties
Contains all the mobile dashboard properties files for all translated languages.
inventory
With in the model folder, Property and Relationship sub folders are available. These folders contain the inventory model files that contain properties and parent-
child relationship within the resources. Both property and relationship files have the extension .model.
pack-network-wireless-details.xlsx
An excel file with all the pack content.
pack.properties
Contains pack metadata.
Procedure
1. Download the packs to a directory in your local file system.
For example, <DIST_DIR_PACKS>/packs.
2. Make sure that all the services in Telco Network Cloud Manager - Performance are scaled up.
3. Access Telco Network Cloud Manager - Performance dashboards.
4. Click Administration > Pack management > Pack service.
You can see the Pack service page that has a grid. After you import the packs, you can the list of packs and their details.
5. Click the Import ( ) icon from the upper right of the page and select the Technology Pack JAR file that you want to import and click Upload.
The maximum size of the JAR file must be less than 500 MB.
You can see the Technology Pack in the grid.
6. Click the Deploy ( ) icon in the Actions pane and select Validate.
This action validates the pack content and displays validation errors if any.
After the validation is successful, you can see the Validated message in the State column on the Pack service page.
7. Click the Deploy ( ) icon in the Actions pane and select Deploy to deploy the pack.
Before the pack is deployed, it is validated and displays validation errors if any. After that, the state is changed to deploying.
8. Check the installation log file from the following location:
From the Pack service UI, click the link in the State column for a specific Technology Pack to view the Pack log messages for the pack.
IBM Telco Network Cloud Manager - Performance 1.4.5 121

9. If the Technology Packs have the Batch Analytics jobs, streams, and User-Defined Calculations (UDCs), check in analytics-stream-
0:/opt/basecamp/analytics/work/pack-installation.logs file until it is completed, make sure that it has no errors.
Results
The following services are scaled up after the installation of Telco Network Cloud Manager - Performance Technology Packs:
SNMP Discovery and SNMP Collector
If an SNMP Technology Pack is installed, the pack installer scales up these services, and then starts these collectors.
NiFi and File Collector
If a file-based Technology Pack is installed, the pack installer scales up these services, and then starts these collectors.
Analytics Stream and Analytics Batch
If a Technology Pack that contains the preconfigured streams or batch jobs is installed, the pack installer scales up these services, and then it starts these services.
DNS Collector, Flow Collector, and Flow Analytics
If the Network Flow Technology Pack is installed, the pack installer scales up these services, and then starts these services.
For File-based Technology Packs, all the NiFi templates are automatically uploaded to Apache NiFi UI. The content within the pack is distributed to different
services in vendor-specific directories. Verify that the templates are available in the NiFi UI.
What to do next
122 IBM Telco Network Cloud Manager - Performance 1.4.5

After the Technology Packs are installed, you might not see the default dashboard menus on the Telco Network Cloud Manager - Performance Dashboards. Manually,
publish the menus. See Optional: Publishing Telco Network Cloud Manager - Performance Dashboards menus.
Related tasks
Setting up Apache NiFi
Managing streams for metrics
Managing User-defined calculations (UDC)
Setting up LDAP authentication
Lightweight Directory Access Protocol (LDAP) provides an extra security to user management. LDAP server implementations are typically tailored to the needs of your
organization. You can either use your own LDAP server and the configured users or use the built-in OpenLDAP by specifying the LDAP credentials (username and
password) to log in to Telco Network Cloud Manager - Performance.
About this task
After the installation of Telco Network Cloud Manager - Performance, the common Config Map is created with default LDAP settings. You can modify the settings according
to your requirements.
Procedure
1. Log in to the OpenShift® Container Platform web console of your cluster.
2.
Select tncp from Namespace pane.
3.
Select tncp from Projects pane.
4.
Expand Workloads > Config Maps > common in the Config and Storage pane in the navigation pane.
5. Expand Workloads > Config Maps > common.
6. Observe the following properties in common Config Map.
security.provider=ldap
security.ldap.hostname=security
7. Optional: Edit the common Config Map directly from OpenShift Container Platform web console.
8. If you change the common Config Map, rename the tncp-operator in the annotations section as follows:
annotations:
manager: tncp-operator-<updated>
It is to make sure that on the Operator does not revert your changes to default.
9. Restart the following Services in order that have authentication with Security Service:
Inventory
UI
Dashboard
Batch Analytics
Streaming Analytics
Apps
Threshold
SNMP Discovery
Creating an LDAP user
The Security Service has an OpenLDAP image that is integrated with it. OpenLDAP software is an open source implementation of the Lightweight Directory Access
Protocol. If you want to use the built-in OpenLDAP server, use this information to create user credentials to log in to Telco Network Cloud Manager - Performance.
Related information
Controlling the Telco Network Cloud Manager - Performance services
Creating an LDAP user
The Security Service has an OpenLDAP image that is integrated with it. OpenLDAP software is an open source implementation of the Lightweight Directory Access
Protocol. If you want to use the built-in OpenLDAP server, use this information to create user credentials to log in to Telco Network Cloud Manager - Performance.
About this task
IBM Telco Network Cloud Manager - Performance 1.4.5 123
Many options are available to create a user in LDAP. You can use the commands that are provided here to create a user without an LDIF file. LDIF, or the LDAP Data
Interchange Format, is a text format for representing LDAP data and commands.
Procedure
1. Log in to your cloud platform web console.
2. Make sure you are in tncp project or namespace.
3. Click Workloads > Pods.
4. Click Security Pod and access the terminal.
5. To create user <usename> in a file <usename>, use these commands:
For example, to create a user charlie,
echo -e "dn: cn=charlie,ou=people,dc=customer,dc=com\nobjectclass: inetOrgPerson\ncn: charlie\nsn: charlie\nuid:
charlie\nuserPassword: charlie" > /tmp/<charlie>
You can see the charlie user file without ldif extension in the output:
adddashboardusersgroup.ldif addnpiadministratorsgroup.ldif charlie npi1.ldif
The following content can be seen in the charlie file:
# cat charlie
dn: cn=charlie,ou=people,dc=customer,dc=com
objectclass: inetOrgPerson
cn: charlie
sn: charlie
uid: charlie
userPassword: charlie
6. Add user charlie to LDAP with this command:
ldapadd -H ldap://:1389/ -x -D "cn=admin,dc=customer,dc=com" -f /tmp/charlie -w admin
Enter the password for LDAP. By default, it is admin. You can see the following output:
adding new entry "cn=charlie,ou=people,dc=customer,dc=com"
7. Create a file to add user charlie to npiusers group with this command:
echo -e "dn: cn=npiusers,ou=groups,dc=customer,dc=com\nchangetype: modify\nadd: uniqueMember\nuniqueMember:
cn=charlie,ou=people,dc=customer,dc=com\n" > /tmp/charlienpiusersgroup
The following content can be seen in the file:
#cat /tmp/charlienpiusersgroup
dn: cn=npiusers,ou=groups,dc=customer,dc=com
changetype: modify
add: uniqueMember
uniqueMember: cn=charlie,ou=people,dc=customer,dc=com
8. Add user charlie to npiusers group with this command:
ldapmodify -H ldap://:1389/ -x -D "cn=admin,dc=customer,dc=com" -f /tmp/charlienpiusersgroup -w admin
Enter the password for LDAP. By default, it is admin. You can see the following output:
modifying entry "cn=npiusers,ou=groups,dc=customer,dc=com"
9. Create file to add user charlie into dashboardusers group with this command:
echo -e "dn: cn=dashboardusers,ou=groups,dc=customer,dc=com\nchangetype: modify\nadd: uniqueMember\nuniqueMember:
cn=charlie,ou=people,dc=customer,dc=com\n" > /tmp/charliedashboardusersgroup
The following content can be seen in the file:
#cat /tmp/charliedashboardusersgroup
dn: cn=dashboardusers,ou=groups,dc=customer,dc=com
changetype: modify
add: uniqueMember
uniqueMember: cn=charlie,ou=people,dc=customer,dc=com
10. Add user charlie into dashboardusers group with this command:
ldapmodify -H ldap://:1389/ -x -D "cn=admin,dc=customer,dc=com" -f /tmp/charliedashboardusersgroup -w admin
Enter the password for LDAP. By default, it is admin. You can see the following output:
modifying entry "cn=dashboardusers,ou=groups,dc=customer,dc=com"
11. Run a search to ensure that the user charlie is created and is added to npiusers and dashboardusers groups with this command:
ldapsearch -H ldap://:1389/ -x -b dc=customer,dc=com -D "cn=admin,dc=customer,dc=com" -w admin
The following output can be seen:
extended LDIF
#
# LDAPv3
# base <dc=customer,dc=com> with scope subtree
# filter: (objectclass=*)
# requesting: ALL
#
124 IBM Telco Network Cloud Manager - Performance 1.4.5
# customer.com
dn: dc=customer,dc=com
objectClass: dcObject
objectClass: organization
dc: customer
o: example
# users, customer.com
dn: ou=users,dc=customer,dc=com
objectClass: organizationalUnit
ou: users
# user01, users, customer.com
dn: cn=user01,ou=users,dc=customer,dc=com
cn: User1
cn: user01
sn: Bar1
objectClass: inetOrgPerson
objectClass: posixAccount
objectClass: shadowAccount
userPassword:: Yml0bmFtaTE=
uid: user01
uidNumber: 1000
gidNumber: 1000
homeDirectory: /home/user01
# user02, users, customer.com
dn: cn=user02,ou=users,dc=customer,dc=com
cn: User2
cn: user02
sn: Bar2
objectClass: inetOrgPerson
objectClass: posixAccount
objectClass: shadowAccount
userPassword:: Yml0bmFtaTI=
uid: user02
uidNumber: 1001
gidNumber: 1001
homeDirectory: /home/user02
# readers, users, customer.com
dn: cn=readers,ou=users,dc=customer,dc=com
cn: readers
objectClass: groupOfNames
member: cn=user01,ou=users,dc=customer,dc=com
member: cn=user02,ou=users,dc=customer,dc=com
# people, customer.com
dn: ou=people,dc=customer,dc=com
ou: people
description: people
objectClass: organizationalUnit
# groups, customer.com
dn: ou=groups,dc=customer,dc=com
ou: groups
description: groups
objectClass: organizationalUnit
# npiadmin, people, customer.com
dn: cn=npiadmin,ou=people,dc=customer,dc=com
objectClass: inetOrgPerson
cn: npiadmin
sn: npiadmin
uid: npiadmin
userPassword:: bnBpYWRtaW4=
# npiuser, people, customer.com
dn: cn=npiuser,ou=people,dc=customer,dc=com
objectClass: inetOrgPerson
cn: npiuser
sn: npiuser
uid: npiuser
userPassword:: bnBpdXNlcg==
# npiadministrators, groups, customer.com
dn: cn=npiadministrators,ou=groups,dc=customer,dc=com
objectClass: groupOfUniqueNames
cn: npiadministrator
cn: npiadministrators
uniqueMember: cn=npiadmin,ou=people,dc=customer,dc=com
# npiusers, groups, customer.com
dn: cn=npiusers,ou=groups,dc=customer,dc=com
objectClass: groupOfUniqueNames
cn: npiuser
cn: npiusers
uniqueMember: cn=npiuser,ou=people,dc=customer,dc=com
uniqueMember: cn=charlie,ou=people,dc=customer,dc=com
# dashboardusers, groups, customer.com
dn: cn=dashboardusers,ou=groups,dc=customer,dc=com
objectClass: groupOfUniqueNames
cn: dashboarduser
cn: dashboardusers
uniqueMember: cn=npiadmin,ou=people,dc=customer,dc=com
IBM Telco Network Cloud Manager - Performance 1.4.5 125

uniqueMember: cn=npiuser,ou=people,dc=customer,dc=com
uniqueMember: cn=charlie,ou=people,dc=customer,dc=com
# charlie, people, customer.com
dn: cn=charlie,ou=people,dc=customer,dc=com
objectClass: inetOrgPerson
cn: charlie
sn: charlie
uid: charlie
userPassword:: Y2hhcmxpZQ==
# search result
search: 2
result: 0 Success
# numResponses: 14
# numEntries: 13
What to do next
Create the same user in Dashboard Designer and assign the needed roles.
Related information
User administration from Designer tool
Authenticating with Microsoft Active Directory users
Microsoft Active Directory can be used for managing user authentication and user data. The Microsoft Active Directory provides a Lightweight Directory Access Protocol
(LDAP) service. Therefore, WebSphere® Application Server supports LDAP and WebSphere Application Server supports the Microsoft Active Directory.
Follow these steps:
Before you begin
Configure Jazz for Service Management with Microsoft Active Directory
Create users and groups in Microsoft Active Directory
Create users in Dashboard Designer
Access the Telco Network Cloud Manager - Performance Dashboards with the users from Microsoft Active Directory repository
Before you begin
Ensure that you have performed the following task:
Set up the federation between Jazz® for Service Management and Telco Network Cloud Manager - Performance to work correctly and to access the web-based
visualizations. For more information, see Setting up integration with Jazz for Service Management.
Configure Jazz for Service Management with Microsoft Active Directory
You can authenticate Telco Network Cloud Manager - Performance dashboards with users from an Active Directory database on a Lightweight Directory Access Protocol
(LDAP) server. With this method, you use the standard user accounts that are registered with the LDAP server. The same user ID can be used to authenticate to the TNCP
application and to the LDAP server. Follow these steps:
1. Log in to Dashboard Application Services Hub portal as smadmin user.
2. Expand Console Settings ( ) > WebSphere Administrative Console.
3. Select Security > Global security.
4. From the Available realm definitions list, select Federated repositories and click Configure.
5. Click Manage repositories and select LDAP repository from the Add list.
6. Provide the following details:
126 IBM Telco Network Cloud Manager - Performance 1.4.5

Specify a unique identifier for the repository.
Select Microsoft Windows Active Directory from the Directory type list.
Specify the primary hostname of the LDAP server and port number.
Specify the distinguished name and bind password for the application server, which is used to bind to the directory server.
7. Click OK and then Save.
8. Save the configuration and restart the Dashboard Application Services Hub portal by using the following command:
$/opt/IBM/JazzSM/profile/bin/stopServer.sh server1 -username smadmin -password Smadmin01
Ensure that all the Java™ processes associated with Dashboard Application Services Hub are stopped, and then start the server by using the following command:
$/opt/IBM/JazzSM/profile/bin/startServer.sh server1
Create users and groups in Microsoft Active Directory
Create the users and groups in Active Directory and add the users to each of the groups. Follow these steps:
1. Click Start
2. On the Active Directory domain controller, open Active Directory Users and Computers.
For example, create the user john.doe to represent a domain user with a valid logon account.
Note: If the users are existing, then go to step 4 to create groups and add the users to the groups.
3. Select Action > New > User and follow the prompts to create a new Active Directory user.
4. Select Action > New > Group and follow the prompts to create a new Active Directory group.
Create the following groups:
ConsoleAdmin
ConsoleUser
dashboarduser
manager-gui
manager-jmx
manager-script
manager-status
npiadministrator
npiuser
ReadAdmin
WriteAdmin
5. Create the following custom groups:
ldap-user-group1
ldap-admin-group1
6. Right-click the username and select Add to a group to add the new user to the new group.
You might also want to add your own Windows account to the new group. Adding your own account to the Telco Network Cloud Manager - Performance groups
makes it easy to demonstrate some features, such as assigning roles to group members.
Create users in Dashboard Designer
See User administration from Designer tool.
Update the Dashboard Service YAML file
Log in to your cloud platform web console.
Click Workloads > Stateful Sets > file-collector.
Add the parameters and their values to the dashboard Stateful Set YAML file.
IBM Telco Network Cloud Manager - Performance 1.4.5 127

From the file-collector service, click the Actions( ) icon, and select Edit Stateful Set.
The Edit a resource page loads. Add the parameters and their values.
Click the Edit resource icon ( ) to add the parameters and their values.
Add the security.dash.group-mapping parameter in args: section and specify a value.
security.dash.group-mapping": "ldap-user-group1->npiuser,dashboarduser,ConsoleUser|ldap-admin-group1
>npiadministrator,dashboarduser,ConsoleAdmin
Access the Telco Network Cloud Manager - Performance Dashboards with the users from
Microsoft Active Directory repository
Access the Telco Network Cloud Manager - Performance Dashboards by using the users that are created on Microsoft Active Directory. See Accessing Telco Network Cloud
Manager - Performance dashboards.
Related information
Configuring the LDAP federated repository
Setting up Apache NiFi
Use this information to set up and start Apache NiFi to convert the EMS data files to Avro format records and write them to Kafka.
About this task
These one-time tasks are needed for NiFi-based Technology Packs only.
Enriching the Network and Region IDs for Wireless Technology Packs
Network and Region IDs are needed to enable data collection for network and region resource types. This information is specific to a customer based on the
network. These values are available as variables in the lookup CSV file for each Technology Pack. The values must be replaced with actual values before you start
the data flow through Apache NiFi UI.
Enabling the processor groups from NiFi UI
After Apache NiFi is stared, you can access its user interface to set up the environment for File Collector. Apache NiFi is used for data flow for all File-based
Technology Packs. Every installed pack has its own processor group that must be enabled and started for data processing.
Moving the data files from EMS to Apache NiFi
Create a simple NiFi flow that monitors a folder for file and copies to a different folder. This NiFi flow must be created to transfer data files from EMS to the spool
directory in NiFi.
Enriching the Network and Region IDs for Wireless Technology Packs
Network and Region IDs are needed to enable data collection for network and region resource types. This information is specific to a customer based on the network.
These values are available as variables in the lookup CSV file for each Technology Pack. The values must be replaced with actual values before you start the data flow
through Apache NiFi UI.
About this task
You need to update the actual values for Network and Region IDs for the following Technology Packs:
umts-huawei-mscs-v200r011c10-1.5.0
umts-huawei-utran-v100r015c10spc156-1.5.0
umts-huawei-mgw-v200r010c20-1.2.0.jar
nr-huawei-nutran-v100r015c10-1.5.0
lte-huawei-eutran-v100r015c10-1.5.0
gsm-huawei-bss-v900r021c10spc600-1.5.0
lte-huawei-mme-v900r018c10-1.1.0
lte-huawei-pcrf-v300r005c00-1.1.0
lte-huawei-sgwpgw-v900r018c10-1.2.0
lte-huawei-hss-v900r008-1.1.0
gsm-tekelec-stp-r46-1-1.1.0
gsm-huawei-stp-v200r005c08-1.0.0
lte-zte-eutran-lr14-1.0.0
umts-zte-utran-ur17-1.1.0
Note: If you do not provide valid values for Region and Network resources according to your network, you might see the Network and Region ID values as undefined.
Procedure
128 IBM Telco Network Cloud Manager - Performance 1.4.5
Update the following columns with specific values in the lookup CSV file for each Technology Pack that is installed.
Table 1. Replacing the Network and Region IDs with actual values
Technology Pack CSV file name CSV file location Columns to be edited.
umts-huawei-mscs-v200r011c10-
1.5.0
NetworkRegionLookup.cs
v
${content_dir}/nifi-
collector/config/${pack_name}/NetworkRegionLookup.csv
mscId,networkId,regionId
msc1,PLMN,East
msc2,PLMN,West
msc3,PLMN,North
msc4,PLMN,South
umts-huawei-utran-
v100r015c10spc156-1.5.0
NetworkRegionLookup_rn
c.csv
${content_dir}/nifi-
collector/config/${pack_name}/NetworkRegionLookup_rnc.csv
rncId,networkId,regionId
rnc1,PLMN,East
rnc2,PLMN,West
rnc3,PLMN,North
rnc4,PLMN,South
NetworkRegionLookup_n
odeb.csv
${content_dir}/nifi-
collector/config/${pack_name}/NetworkRegionLookup_nodeb.csv
nodebId,networkId,regionI
d
nodeb1,PLMN,East
nodeb2,PLMN,West
nodeb3,PLMN,North
nodeb4,PLMN,South
nr-huawei-nutran-v100r015c10-
1.5.0
NetworkRegionLookup.cs
v
${content_dir}/nifi-
collector/config/${pack_name}/NetworkRegionLookup.csv
gNodeBId,networkId,region
Id
gNodeB1,PLMN,East
gNodeB2,PLMN,West
gNodeB3,PLMN,North
gNodeB4,PLMN,South
lte-huawei-eutran-v100r015c10-
1.5.0
NetworkRegionLookup.cs
v
${content_dir}/nifi-
collector/config/${pack_name}/NetworkRegionLookup.csv
eNodeBId,networkId,region
Id
eNodeB1,PLMN,East
eNodeB2,PLMN,West
eNodeB3,PLMN,North
eNodeB4,PLMN,South
gsm-huawei-bss-
v900r021c10spc600-1.5.0
NetworkRegionLookup_bs
c.csv
${content_dir}/nifi-
collector/config/${pack_name}/NetworkRegionLookup_bsc.csv
bscId,networkId,regionId
bsc1,PLMN,East
bsc2,PLMN,West
bsc3,PLMN,North
bsc4,PLMN,South
NetworkRegionLookup_bt
s.csv
${content_dir}/nifi-
collector/config/${pack_name}/NetworkRegionLookup_bts.csv
bsId,networkId,regionId
bs1,PLMN,East
bs2,PLMN,West
bs3,PLMN,North
bs4,PLMN,South
lte-huawei-mme-v900r018c10-
1.1.0
NetworkRegionLookup.cs
v
${ content_dir }/nificollector/ config/$ {pack_name}/
NetworkRegio nLookup.csv
mmeFunctionId,networkId,r
egionId
mmeFunctionId1,PLMN,East
mmeFunctionId2,PLMN,West
mmeFunctionId3,PLMN,North
mmeFunctionId4,PLMN,South
lte-huawei-pcrf-v300r005c00-1.1.0 NetworkRegionLookup.cs
v
${ content_dir }/nificollector/ config/$ {pack_name}/
NetworkRegio nLookup.csv
cgpId,networkId,
regionId cgpId1,
PLMN,North cgpId2,
PLMN,South cgpId3,
PLMN,East cgpId4,
PLMN,West
lte-huawei-sgwpgw-v900r018c10-
1.2.0
NetworkRegionLookup.cs
v
${ content_dir}/nificollector/ config/$ {pack_name}/
NetworkRegio nLookup.csv
ugwFunctionId,networkId,
regionId ugwFunctionId1,
PLMN,North
ugwFunctionId2,
PLMN,South
ugwFunctionId3,
PLMN,East ugwFunctionId4,
PLMN,Central
lte-huawei-hss-v900r008-1.1.0 NetworkRegionLookup.cs
v
${ content_dir }/nificollector/ config/$ {pack_name}/
NetworkRegio nLookup.csv
HuaweiHssId,networkId,
regionId HuaweiHss_Id1,
PLMN,North HuaweiHss_Id2,
PLMN,East HuaweiHss_Id3,
PLMN,West HuaweiHss_Id4,
PLMN,South
umts-huawei-mgw-v200r010c20-
1.2.0
NetworkRegionLookup.cs
v
${ content_dir }/nificollector/ config/$ {pack_name}/
NetworkRegio nLookup.csv
mgwId,networkId,
regionId mgwId1,
PLMN,North mgwId2,
PLMN,South mgwId3,
PLMN,East mgwId4,
PLMN,Central
gsm-tekelec-stp-r46-1-1.1.0 NetworkRegionLookup.cs
v
${ content_dir }/nificollector/ config/$ {pack_name}/
NetworkRegio nLookup.csv
stpId,networkId,
regionId stpId1,
PLMN,North stpId2,
PLMN,Central stpId3,
PLMN,West stpId4,
PLMN,South
gsm-huawei-stp-v200r005c08-
1.0.0
NetworkRegionLookup.cs
v
$ {content_dir }/nificollector/ config/$ {pack_name}/
NetworkRegio nLookup.csv
stpId,networkId,regionId
stpId1,PLMN,North
stpId2,PLMN,South
stpId3,PLMN,East
stpId4,PLMN,Central
IBM Telco Network Cloud Manager - Performance 1.4.5 129

Technology Pack CSV file name CSV file location Columns to be edited.
lte-zte-eutran-lr14-1.0.0 NetworkRegionLookup.cs
v
$ {content_dir }/nificollector/ config/$ {pack_name}/
NetworkRegio nLookup.csv
ENODEBFUNCTION,networkId,
regionId
ENODEBFUNCTION1,PLMN,Nort
h
ENODEBFUNCTION2,PLMN,Cent
ral
ENODEBFUNCTION3,PLMN,West
ENODEBFUNCTION4,PLMN,Sout
h
umts-zte-utran-ur17-1.1.0 NetworkRegionLookup.cs
v
$ {content_dir }/nificollector/ config/$ {pack_name}/
NetworkRegio nLookup.csv
rncId,networkId,regionId
rncId1,PLMN,North
rncId2,PLMN,East
rncId3,PLMN,West
rncId4,PLMN,South
Enabling the processor groups from NiFi UI
After Apache NiFi is stared, you can access its user interface to set up the environment for File Collector. Apache NiFi is used for data flow for all File-based Technology
Packs. Every installed pack has its own processor group that must be enabled and started for data processing.
About this task
For more information, see Getting started with Apache NiFi.
Procedure
1. Open a web browser and type the following URL:
http://<node_hostname>:30026/nifi
Where,
<node_hostname> is the hostname of any node in your cluster.
30026 is the port number of the NiFi Service on the node where it is installed.
You can see the following UI that has a blank canvas to orchestrate a data flow:
All the processor groups
2. Right-click the processor group and select Configure > CONTROLLER SERVICES.
You can see all the controller services and their details in your data flow in a table.
3. Click the Enable icon ( ) and enable all the controller services.
4. Click the processor group and select Start to start the data collection.
Moving the data files from EMS to Apache NiFi
Create a simple NiFi flow that monitors a folder for file and copies to a different folder. This NiFi flow must be created to transfer data files from EMS to the spool directory
in NiFi.
About this task
130 IBM Telco Network Cloud Manager - Performance 1.4.5

The data flow with NiFi processors helps in data files transfer from EMS to the /spool/packs/<pack_name>/in directory in NiFi. The following processors are needed to
create the data flow:
GetSFTP
The GetSFTP processor fetches files from an SFTP Server and creates FlowFiles from them. If the source data files are available in another server, SFTP them to
NiFi server by using the PutFile processor.
Note: You can also use GetSFTP processor.
UpdateAttribute
The UpdateAttribute processor updates the attributes of a FlowFile by using the properties or rules that are added by the user. It updates the attributes for a
FlowFile by using the Attribute Expression Language or deletes the attributes based on a regular expression.
PutFile
The PutFile processor is used to store the file from the data flow to the spool directory of the pack.
Two scenarios are available to transfer the data files from EMS to NiFi:
Scenario 1
For most of the wireline Technology Packs, the remote data file is transferred to the NiFi server location with GetSFTP and PutFile processors.
Scenario 2
For most of the wireless Technology Packs the remote data files that are arranged in multiple folders are transferred to the NiFi server location with GetSFTP,
UpdateAttribute and PutFile processors. For example, ACME Packet Net-Net 9200 HDR v1.0.0 pack.
Procedure
Access NiFi UI.
Moving the data files from one server to another NiFi server in scenario 1
Drag the processor icon to the NiFi canvas and select GetFTP or GetSFTP processor from the list.
Right-click on the processor and select Configure and in the Properties tab provide values for the following properties:
Property Value
Hostname Hostname of the server where the data files are available.
Username Username to access the host server.
Password Password to access the host server.
Transfer Mode ASCII for XML files
Binary for .gz files
Remote Path Path to the location where the data files are available. Make sure that you can SFTP to this location.
Private Key Path The fully qualified path to the Private Key file
Properties that are applicable for GetSFTP processor only.
Private Key Passphrase Password for the private key
Host File If you provide this value, the file is used as the Host Key. Otherwise, no use host key file is used.
Strict Host Key Checking Indicates whether strict enforcement of hosts keys must be applied
Send Keep Alive On Timeout Indicates whether to send a single Keep Alive message when SSH socket times out.
Optional: To prevent the transfer of large files to NiFi input directory for processing before the file is copied completely, configure the following additional
parameters in GetSFTP processor:
Property Value
Polling Interval Determines how long to wait between fetching the new files from remote location to NiFi input location. By default, it is 60 seconds. You might
want to increase the value, if you can determine the time to transfer the larger data files from remote server to the NiFi input location.
Ignore Dotted
files
Make sure that this property is set to true. Files that start with a dot (".") are considered as hidden files and not transferred for processing.
Note: Make sure that you rename with dot prefix the large files that might take time to transfer from the remote server to the NiFi input location.
Click Apply and go back to canvas.
Drag the processor icon to the NiFi canvas and select PutFile processor from the list.
Right-click on the processor and select Configure and in the Properties tab add the location of the input directory to Directory property.
Click GetSFTP processor and drag to PutFile processor to connect both of them.
Start both the processors.
Moving the data files from one server to another NiFi server in scenario 2
Drag the processor icon to the NiFi canvas and select GetSFTP processor from the list.
Right-click on the processor and select Configure and in the Properties tab provide values for the following properties:
Property Value
Hostname Hostname of the server where the data files are available.
Username Username to access the host server.
Password Password to access the host server.
Transfer Mode ASCII for XML files
Binary for .gz files
Remote Path Path to the location where the data files are available in many subfolders. Make sure that you can SFTP to this location. For example,
/ems_output/card/1590662105.csv
/ems_output/session-realm/1590662105.csv
/ems_output/system/1590662105.csv
Optional: To prevent the transfer of large files to NiFi input directory for processing before the file is copied completely, configure the following additional
parameters in GetSFTP processor:
Property Value
Polling Interval Determines how long to wait between fetching the new files from remote location to NiFi input location. By default, it is 60 seconds. You might
want to increase the value if you can determine the time to transfer the larger data files from remote server to the NiFi input location.
IBM Telco Network Cloud Manager - Performance 1.4.5 131

Property Value
Ignore Dotted
files
Make sure that this property is set to true. Files that start with a dot (".") are considered as hidden files and not transferred for processing.
Note: Make sure that you rename with dot prefix the large files that might take time to transfer from the remote server to the NiFi input location.
Click Apply and go back to canvas.
Drag the processor icon to the NiFi canvas and select UpdateAttribute processor from the list.
Right-click on the processor and select Configure and in the Properties tab. Click the Add Property ( ) icon to add the following properties and their values:
Property Value
filename ${filename:prepend(${path:replace(‘/’,’_’)})}
It replaces the "/" in the data file path to "_". For example,
ems_output_card_1590662105.csv
ems_output_session-realm_1590662105.csv
ems_output_system_1590662105.csv
GetSFTP.remote.source The remote server where the data files are located. For example, localhost.
path Path where the data files are available. For example,
/ems_output/card/1590662105.csv
/ems_output/session-realm/1590662105.csv
/ems_output/system/1590662105.csv
.
Click Apply and go back to canvas.
Click GetSFTP processor and drag to UpdateProcessor processor to connect both of them.
Drag the processor icon to the NiFi canvas and select PutFile processor from the list.
Right-click on the processor and select Configure and in the Properties tab add the location of the input directory to Directory property.
For example, /spool/packs/<pack_name>/in. After the data file is processed by NiFi from the /spool/packs/<pack_name>/in directory, the files can be viewed from
the Data Provenance on the Global menu.
Click UpdateProcessor processor and drag to PutFile processor to connect both of them.
Start all the processors.
NiFi housekeeping
NiFi provides a built-in data provenance feature where all the raw and processed files are stored within the Provenance Repository. You can search and view this
information in Data Provenance from the Global menu.
NiFi housekeeping
NiFi provides a built-in data provenance feature where all the raw and processed files are stored within the Provenance Repository. You can search and view this
information in Data Provenance from the Global menu.
Since the Provenance Repository in NiFi stores both raw and processed data, the storage requirement is high. Size your storage requirement based on your data and their
wanted retention period.
Use the following formula to calculate the storage:
Required Content Storage size = (N * I * H) * R * P
Where,
N = Raw file size per interval
I = Number of intervals per hour
H = Retention period in hour
R = 30 (The table describes how to derive the formula and ratio)
P = storage percentage= 1/archive.max.usage.percentage (1/0.8 = 1.25)
Note: The default retention period is 1 day. It can be configured in NiFi Pod YAML file with this parameter.
NIFI_CONTENT_RETENTION_PERIOD = 24 hours
Contact IBM® Support to assess your storage requirements.
Following table shows some example scenarios that you can use to calculate your storage requirements:
Scenario Size of raw file Observations with formula
1 2 hrs Content storage =(1.1*4*2)*30*1.25 =330 M
2 2 hrs Content storage =(2.1*4*2)*30*1.25 =630 M
3 2 hrs Content storage =(5.3*4*2)*30*1.25 =1590 M
4 4 hrs Content storage =(5.3*4*4)*30*1.25 =3180 M
5 4 hrs Content storage =(2.1*4*4)*30*1.25 =1260 M
6 6 hrs Content storage =(2.1*4*6)*30*1.25 =1890
Setting up integration with Jazz for Service Management
These tasks are required for integrated installation only. Use this information to set up the federation between Jazz® for Service Management and Telco Network Cloud
Manager - Performance to work correctly and to access the web-based visualizations.
About this task
132 IBM Telco Network Cloud Manager - Performance 1.4.5

Perform these tasks during fresh installation scenarios where you are doing the integration for the first time. When you integrate Telco Network Cloud Manager -
Performance with Jazz for Service Management, you have the following scenario to consider:
If Watson™ AIOps and Telco Network Cloud Manager - Performance are in the same namespace or project.
Setting up Jazz for Service Management for integration
Perform these tasks on the Jazz for Service Management server.
Configuring single sign-on on the Jazz for Service Management server
Use these instructions to establish single sign-on support.
Setting up Telco Network Cloud Manager - Performance for integration
Perform these tasks on the Telco Network Cloud Manager - Performance master node.
Setting up Jazz for Service Management for integration
Perform these tasks on the Jazz® for Service Management server.
Procedure
1. Copy the dash-integration.tar.gz file that is available in <DIST_DIR>/etc/integrations/dash folder to the server where Jazz for Service Management is installed.
Copy the file to a location of your choice.
For example, /tmp/dash.
2. Extract the dash-integration.tar.gz file with the following command:
tar -xzvf dash-integration.tar.gz
You can find the following significant files and folders:
integration.sh
integration.settings
resources
blind-trust-manager.jar
eWasAddUsersAndGroups.py
com.ibm.tivoli.ac.ess.authnsvc_1.1.2.201501192348.zip
It is the bundled Security Services package.
3. Edit the integration.settings file for these parameters. Rest of the parameters can be retained as they are.
vi integration.settings
Table 1. Setting in integration.settings file
Option Description Example
DASH_USERNA
ME
The username of the administrator user in the local Dashboard
Application Services Hub portal.
smadmin
DASH_PASSWO
RD
The password of the administrator user in the local Dashboard
Application Services Hub portal.
<smadmin_password>
DASHBOARD_H
OST
The host and port of the Telco Network Cloud Manager -
Performance Dashboard Service that is used for integration.
myserver.ibm.com:31443
Note: 31443 is the https external port number of the Dashboard Service.
For example, https://dashboard-mercury.apps.<user>.os.fyre.ibm.com:443.
If port forwarding is available, you can use <infranode>:31443
DOMAIN_NAME Domain name of the Dashboard Service host .ibm.com
The contents of the integration.settings file.
DASH_USERNAME=smadmin
DASH_PASSWORD=smadmin1
DASHBOARD_HOST=dashboard_host:31443
DOMAIN_NAME=.ibm.com
WAS_PROFILE_NAME=JazzSMProfile
WAS_NODE=JazzSMNode01
WAS_SERVER_NAME=server1
WAS_PROFILE_PATH=/opt/IBM/JazzSM/profile/
JAZZSM_SEC_DIR=/opt/IBM/JazzSM/security/
WAS_BIN_PATH=/opt/IBM/WebSphere/AppServer/bin/
JAZZSMUI_BIN_PATH=/opt/IBM/JazzSM/ui/bin/
JAZZSM_HOME=/opt/IBM/JazzSM/
4. Run the integration script.
sudo ./integration.sh
You can see the following output:
Updating DASH...
Updating DASH with security services...
Updating DASH with users, groups and certificates...
Updating DASH with console integration...
Updating DASH to use trusted roles...
IBM Telco Network Cloud Manager - Performance 1.4.5 133

Updating DASH to use support LTPA tokens...
Restarting DASH security service...
Updating DASH complete.
Check the <DIST_DIR>/integration.log file for the status of the integration.
The following tasks are performed in the background:
Security Services is installed or updated.
Dashboard Application Services Hub updated with default users, groups, and certificates.
All the trusted roles are updated.
Console Integration is created.
Security Services is restarted.
5. Check the console integration log file for the events and if any issues exist.
Verify on WebSphere Application Server to see all the background tasks are in place.
6. Log in to Dashboard Application Services Hub as administrator user.
7. Select Console Settings > General > WebSphere Administrative Console in the console navigation.
8. Click Launch WebSphere administrative console.
9. From the navigation pane, click Users and Groups > Manage Users.
You can see the following users:
npiadmin
npiuser
tncpadmin
tncpuser
10. From the navigation pane, click Users and Groups > Manage groups.
You can see all the groups.
ConsoleAdmin
ConsoleUser
ReadAdmin
WriteAdmin
dashboarduser
manager-gui
manager-jmx
manager-script
manager-status
npiadministrator
npiuser
11. Click Security > SSL certificate and key management > Key stores and certificates > NodeDefaultTrustStore > Signer certificates from the list of Secure Socket Layer
(SSL) configurations.
You can see that the new CA certificate is available.
Configuring single sign-on on the Jazz for Service Management server
Use these instructions to establish single sign-on support.
About this task
To configure Global Security to enable SSO, follow these steps:
Procedure
1. Log in to Jazz® for Service Management server as an admin user.
2. In the navigation pane, click Console Settings > Websphere Administrative Console and click Launch Websphere administrative console.
3. In the WebSphere Application Server administrative console navigation pane, click Security > Global security.
4. In the Administrative Security section, select the Enable administrative security checkbox.
5. In the Application Security section, select the Enable application security checkbox.
6. In the Authentication section, expand Web and SIP security and click Single sign-on (SSO).
7. Click Enabled option if the SSO is disabled.
8. Click Requires SSL if all the requests are expected to use HTTPS.
9. Enter the fully qualified domain names in the Domain name field where SSO is effective.
For example, .ibm.com
If the domain name is not fully qualified, the Jazz for Service Management Server does not set a domain name value for the LtpaToken cookie and SSO is valid only
for the server that created the cookie. Single sign-on feature is necessary for different components of Netcool Operations Insight to interact with each other. For
SSO to work across the Tivoli applications, their application servers must be installed in same domain (use the same domain name).
10. Set the LTPA V2 Cookie name to LtpaToken2.
11. Optional: Enable the Interoperability Mode option if you want to support SSO connections in WebSphere Application Server version 5.1.1 or later to interoperate
with previous versions of the application server.
12. Select the Web inbound security attribute propagation checkbox to propagate information from the first login application server to the other application servers.
13. Clear the Set security cookies to HTTPOnly to help prevent cross-site scripting attacks checkbox.
14. Click OK to save your changes.
15. Stop and restart all the Jazz for Service Management server instances.
What to do next
134 IBM Telco Network Cloud Manager - Performance 1.4.5

When you start Jazz for Service Management, you must use a URL in the format protocol://host.domain:port /*. If you do not use a fully qualified domain name, Jazz for
Service Management cannot use SSO between Tivoli products.
The configured single sign-on uses SSO tokens that are set in HTTP cookies to carry authenticated sessions. By default, these cookies expire after 120 minutes. To change
this value, follow these steps:
1. In the WebSphere Application Server administrative console navigation pane, click Security > Global security.
2. In the Authentication section, click LTPA.
3. Change the LTPA timeout value to a different value.
This value must be greater than the Cache timeout.
The credentials expire after the specified period you might have to validate your credentials again.
Stopping Jazz for Service Management application servers
You can stop any Jazz for Service Management application server by using the IBM WebSphere stopServer command. You might need to restart the application
server after you complete a configuration task for an integration service, or stop the application server for maintenance. To start the server again, use the
startServer command.
Starting Jazz for Service Management application servers
You can start any Jazz for Service Management virtualization and reporting servers by using the IBM WebSphere startServer command. You might need to restart
the application server after you complete a configuration task for an integration service, or after you stop the application server for maintenance.
Stopping Jazz for Service Management application servers
You can stop any Jazz® for Service Management application server by using the IBM WebSphere stopServer command. You might need to restart the application server
after you complete a configuration task for an integration service, or stop the application server for maintenance. To start the server again, use the startServer command.
Procedure
1. On the relevant Jazz for Service Management server, open a command window.
2. Change to the WAS_HOME/bin directory.
The default location for <JazzSM_WAS_Profile> is /opt/IBM/JazzSM/profile.
3. Run the following command:
./stopServer.sh <server_name> -username <WAS_admin_user_name> -password <WAS_admin_password>
Where
server_name
Enter the name of the application server that was specified when the application server profile was created. For example, server1.
WAS_admin_user_name
The default username is smadmin.
WAS_admin_password
It is the password that is specified at the time of installation.
Example
stopServer.sh server1 -username smadmin -password
jazzsmpwd
Related information
Common directory locations
Starting Jazz for Service Management application servers
You can start any Jazz® for Service Management virtualization and reporting servers by using the IBM WebSphere startServer command. You might need to restart the
application server after you complete a configuration task for an integration service, or after you stop the application server for maintenance.
About this task
The same procedure applies to any Jazz for Service Management application server.
Procedure
1. On the relevant Jazz for Service Management server, open a command window.
2. Change to the JazzSM_WAS_Profile/bin directory.
The default location for <JazzSM_WAS_Profile> is /opt/IBM/JazzSM/profile
.
3. Run the following command:
./startServer.sh server_name
Where
IBM Telco Network Cloud Manager - Performance 1.4.5 135

server_name
Enter the name of the application server that was specified when the application server profile was created.
For example, server1.
Related information
Common directory locations
Setting up Telco Network Cloud Manager - Performance for integration
Perform these tasks on the Telco Network Cloud Manager - Performance master node.
Before you begin
Make sure that Telco Network Cloud Manager - Performance is up and running.
About this task
Perform this step to use authentication from IBM® WebSphere® Application Server instead of LDAP.
Procedure
1. Log in to Kubernetes Dashboard.
https://<master_node_IP>:<Dashboard_externalPort>
For example, https://myserver.ibm.com:30419.
Note: You can also use IP address of the master node.
2. Select tncp from Namespace pane.
3. Click Config Maps in the Config and Storage pane in the navigation pane.
4. Edit the common Config Map to remove LDAP settings and include the following parameters:
Table 1. Settings in common Config Map file
Option Description Example
security.dash.hostname
s
A comma-separated list of hostnames that are running Dashboard Application Services Hub. <DASH_Host>
security.dash.port The port number that the Dashboard Application Services Hub is listening on the hosts. By default, the https port is
16311.
security.dash.username The Dashboard Application Services Hub admin username. By default, it is smadmin.
security.dash.password The plain text or encrypted Dashboard Application Services Hub admin password. <smadmin_password>
security.dash.domainNa
me
Domain name of the Dashboard Service host
Important: This parameter is required only if the Dashboard Application Services Hub is available on-
premises.
For example, .ibm.com
The contents of the common Config Map file.
"security.dash.domainName": ".ibm.com",
"security.dash.hostnames": "<DASH_server_hostname>",
"security.dash.password": "<smadmin_password>",
"security.dash.port": "16311",
"security.dash.username": "smadmin"
5. After you change the common Config Map, rename the tncp-operator in the annotations section as follows:
annotations:
manager: tncp-operator-<updated>
It is to make sure that on the Operator restart, the changes are not reverted to default.
6. Restart the following services in order that have configuration pages:
Inventory
UI
Dashboard
Apps
Stream Analytics
Batch Analytics
Threshold
SNMP Discovery
See Controlling the Telco Network Cloud Manager - Performance services.
7. Log in to Dashboard Application Services Hub with npiadmin/npiadmin default credentials.
8. In the navigation pane, click Console Settings > Console Integration.
9. Click Save.
You can see the Console Integration ( ) icon on Dashboard Application Services Hub.
136 IBM Telco Network Cloud Manager - Performance 1.4.5

10. Click TNCP > Test to verify the connection.
Related information
Accessing system configuration pages
Logging in to the Dashboard Application Services Hub
Setting up integration with Tivoli Netcool/OMNIbus
Follow these instructions to integrate Telco Network Cloud Manager - Performance with Tivoli® Netcool®/OMNIbus to send threshold violation alarms.
About this task
You must do this configuration if you want to send the threshold violations to Tivoli Netcool/OMNIbus to be displayed in Event Viewer.
Note: From yourTelco Network Cloud Manager - Performance cluster, you can connect to on-prem instance of Tivoli Netcool/OMNIbus.
Procedure
1. Log in to Kubernetes Dashboard.
https://<master_node_IP>:<Dashboard_externalPort>
For example, https://myserver.ibm.com:30419.
Note: You can also use IP address of the master node.
2. Select tncp from Namespace pane.
3. Expand Workloads > Config Maps > common in the Config and Storage pane in the navigation pane.
4. Add the following properties to the file and save it.
Table 1. Setting in common Config Map file
Option Description Example
OMNI_HOST IP address of the server where Tivoli Netcool/OMNIbus is installed.
If you are connecting an on-prem instance of Tivoli Netcool/OMNIbus, run the following
command in the Object Server:
netstat -tlpn | grep -i nco_objserv
Get the IP address that is pointing to the Object Server on port 4100 or nondefault port.
127.127.127.127
OBJECT_SERVE
R
ObjectServer name By default, the Tivoli Netcool/OMNIbus Object
Server name is NCOMS.
OMNI_PORT If you have a nondefault port, use this parameter. By default, the port is 4100.
The contents of the common Config Map file.
OMNI_HOST: "127.127.127.127"
OBJECT_SERVER: AGG_P
OMNI_PORT: ‘7100’
5. After you change the common Config Map, rename the tncp-operator in the annotations section as follows:
annotations:
manager: tncp-operator-<updated>
It is to make sure that on the Operator restart, the changes are not reverted to default.
6. Restart all instances of the Threshold Service in your cluster.
What to do next
Configure the thresholds and alarm rules for performance metrics, which you want to display on Tivoli Netcool/OMNIbus.
Related information
Controlling the Telco Network Cloud Manager - Performance services
Postinstallation tasks
Perform these postinstallation tasks after the installation of Telco Network Cloud Manager - Performance is complete.
Supporting shared namespaces
If you are sharing a namespace between Watson™ AIOps and Telco Network Cloud Manager - Performance, update the common Config Map.
Accessing Telco Network Cloud Manager - Performance dashboards
Use these steps to access the Telco Network Cloud Manager - Performance Dashboards.
Installation directory structure
Use this information to understand the important directories that are created in the microservice containers. You can see this information from each Pod on your
IBM Telco Network Cloud Manager - Performance 1.4.5 137

cloud platform web console.
Generating the audit report
The resource-report script is used to generate a report that contains audit information on device classification.
Optional: Publishing Telco Network Cloud Manager - Performance Dashboards menus
After the installation of Telco Network Cloud Manager - Performance, you can access Telco Network Cloud Manager - Performance Dashboards directly.
Supporting shared namespaces
If you are sharing a namespace between Watson™ AIOps and Telco Network Cloud Manager - Performance, update the common Config Map.
About this task
You can select any namespace in which you installed the Telco Network Cloud Manager - Performance application from the TNC-P monitoring dashboards.
Procedure
Log in to Telco Network Cloud Manager - Performance cloud web console.
Select tncp from Namespace pane.
Expand Workloads > Config Maps > common in the Config and Storage pane in the navigation pane.
Select tncp from Projects pane.
Expand Workloads > Config Maps > common.
Add the following property in the common Config Map:
"tncp.namespaces": "<namespace>"
For example, if you have installed Telco Network Cloud Manager - Performance in the noi namespace, use the following code in the common Config Map.
"tncp.namespaces": "noi"
Restart the UI Service.
Accessing Telco Network Cloud Manager - Performance dashboards
Use these steps to access the Telco Network Cloud Manager - Performance Dashboards.
Procedure
Access dashboards from Dashboard Application Services Hub on Kubernetes environment. Follow these steps:
1. Log in to Dashboard Application Services Hub.
2. Click Performance > TNCP > Metric dashboards.
The dashboard page loads with menu bar to go to different Telco Network Cloud Manager - Performance Dashboards and configuration pages.
3. Provide the following credentials to log in to the dashboards:
npiadmin/npiadmin
Access from Telco Network Cloud Manager - Performance Engine interface directly.
1. Get the Dashboard Service external port number by using the following commands:
# kubectl get services | grep dashboard
You can see the following output:
NAME TYPE CLUSTER-IP EXTERNAL-IP PORT(S) AGE
dashboard NodePort 10.111.60.174 <none> 31443:31443/TCP 2d7h
2d7h
2. Use the following URL to log in to the Telco Network Cloud Manager - Performance Dashboards user interface:
http://<dashboard_service_node_host_name>:<dashboard_service_externalPort>/dashboards
For example, http://<dashboard_service_node_host_name>:31443/dashboards.
3. Provide the following credentials to log in to the dashboards:
npiadmin/npiadmin
138 IBM Telco Network Cloud Manager - Performance 1.4.5

Logging in to the Dashboard Application Services Hub portal
Depending upon your organization’s deployment, you can access the reporting interface through Dashboard Application Services Hub.
Related tasks
Creating a route
Related information
Accessing system configuration pages
Logging in to the Dashboard Application Services Hub portal
Depending upon your organization’s deployment, you can access the reporting interface through Dashboard Application Services Hub.
Procedure
Access the reporting interface from Dashboard Application Services Hub on Kubernetes environment.
1. Open a web browser and enter the following URL for the Jazz® for Service Management UI and reporting server:
https://host.domain:port/DASH_context_root
For example, https://<myserver.ibm.com>:16311/ibm/console
Where,
host.domain is the fully qualified domain name (FQDN) or IP address of the Jazz for Service Management UI and reporting server.
When single sign-on (SSO) is enabled, ensure that you use the fully qualified hostname in the URL of the Jazz for Service Management reporting and UI
server. SSO requires that the browser pass LTPA cookies to the Jazz for Service Management application server, and these cookies contain the fully qualified
hostname.
port is the secure HTTP port number that was specified during installation. The default value is 16311.
/DASH_context_root is the context root for the console that was specified during installation. The default value is /ibm/console.
2. Enter the user ID and password in the Dashboard Application Services Hub login page. Click Log in.
For example, npiadmin/npiadmin
The Dashboard Application Services Hub Welcome page opens.
Installation directory structure
Use this information to understand the important directories that are created in the microservice containers. You can see this information from each Pod on your cloud
platform web console.
Typical directory stack for all the microservices.
Typical contents of the common folders in all services:
bin
Script to stop and start the microservice.
lib
Specific library files that are needed for the microservice.
conf
Contains the security keystore for single-sign for inter-service communications.
work
logs
Contains a separate log file for each microservice.
Other significant folders and contents available in Telco Network Cloud Manager - Performance Stateful Services.
Service Folder structure
IBM Telco Network Cloud Manager - Performance 1.4.5 139

Service Folder structure
analytics-batch
analytics-stream
/opt/basecamp/analytics
resources
Extract the basecamp-ui-analytics.zip file to see the following folders for the configuration pages:
udc
sbh
sa
ba
app /opt/basecamp/app
resources
basecamp-ui-apps.zip
site
Contains all the content that is required for the Sites configuration page.
cassandra It is available in the root directory. Contains Apache Cassandra database folders and files.
dashboard /opt/basecamp/dashboard
lib
Contains the database JAR file.
resources
basecamp-ui-dashboard.zip
oed
Contains the WAR files for Dashboard Designer, Engine, and Scheduler. It also contains SQL files that are used to create
the tables to store the dashboard data in PostgreSQL database.
localization
Contains all the localized built-in dashboards JSON files.
dashboards
config
Contains the connection properties file for database configuration.
config-ui-dashboard
Contains all the content that is required for Config UI pages.
blaze
Contains the Blaze WAR file.
diamond-db /opt/diamond
bin
Contains the CarbonData database client and server
work
Contains metrics and metadata that are stored in the database.
diamond-db-read /opt/diamond
bin
Contains the CarbonData database client and server
work
Contains metrics and metadata that are stored in the database.
dns-collector /opt/basecamp/dns-collector
/opt/basecamp/dns-collector/resources has the basecamp-ui-dnscollector.zip file that contains the Domain names
administration page.
file-collector /opt/basecamp/file-collector
content
discoveries
Contains discovery formula files that are copied from the installed Technology Packs. All formulas are categorized under
different technologies of the installed Technology Packs. Inside each folder, the following sub folders and files are
available,
Typically, device for wireline devices or network for wireless devices
pipeline.conf
property
relation
formulas
Contains collection formula files that are copied from the installed Technology Packs. All formulas are categorized under
different technologies of the installed Technology Packs.
flow-analytics /opt/basecamp/flow-analytics/
resources
Contains the basecamp-ui-flowanalytics.zip file that has the the Flow Aggregations administration page.
140 IBM Telco Network Cloud Manager - Performance 1.4.5

Service Folder structure
flow-collector /opt/basecamp/flow-collector
resources
Contains the basecamp-ui-flowcollector.zip file that has the following Flow administration pages:
Autonomous Systems
Flow Interfaces
Flow IP Grouping
NBAR
Retention Profiles
Type of Service
inventory /opt/basecamp/inventory
resources
Contains basecamp-ui-inventory.zip file with content for Resource Management configuration page.
content
Contains model files for properties and relationships.
kafka It is available in root directory. Contains folders and files of Kafka.
nfs
Note: This service is applicable
for Kubernetes environment
only.
It is available in root directory. Its storage folder stores data from the following service that is available in individual folders:
postgres
content
Contains a hidden folder .installed that has a copy of all installed Technology Packs. If you uninstall any pack, it is moved to
.uninstalled folder.
cassandra
zookeeper
kafka
diamond-db
nifi
config
Contains folders for each pack and their lookup CSV files, which are required by other processor available in NiFi
template for enrichment and processing of input data.
template
Contains the NiFi template XML files for the installed Technology Packs, which automatically loaded to NiFi UI during
pack installation.
security
timeseries
inventory
snmp-collector
snmp-discovery
file-collector
nifi /opt/nifi/nifi-current
Contains folders and files for Apache NiFi.
ping-collector /opt/basecamp/ping-collector
Contains the directories and files that are needed for Ping Collector Service to collect the ICMP ping metrics.
resources
Contains basecamp-ui-pingcollector.zip file with content for Ping Profiles configuration page.
postgres It is available in root directory. Contains folders and files of PostgreSQL database. It also stores the dashboard metadata.
postgres-th It is available in root directory. Contains folders and files of PostgreSQL database. Stores the threshold state data.
security It is available in root directory. Contains folders and files of Security Service. It also has all the LDAP users and groups files.
sleeping-cell /opt/basecamp/sleeping-cell
Contains files for the Data anomaly configuration page in /opt/basecamp/sleeping-cell/resources folder.
snmp-collector /opt/basecamp/snmp-collector
Contains the directories and files that are needed for SNMP Collector Service that provides metric polling of any OIDs.
content
formulas
mibs
bindings
snmp-discovery /opt/basecamp/snmp-discovery
basecamp-ui-snmpdiscovery.zip
Contains the following SNMP Discovery profile and SNMP Credentials administration pages.
content
discovery
mibs
sysobjectid.discovery
IBM Telco Network Cloud Manager - Performance 1.4.5 141

Service Folder structure
threshold /opt/basecamp/threshold
resources
Contains the basecamp-ui-threshold.zip file that has the following configuration pages:
Alarm
Threshold definitions
Time schedules
stdin-probe
Contains 64-bit STDIN probe is available in /stdin-probe/omnibus/probes directory.
timeseries /opt/basecamp/timeseries
content
All the metrics are stored in metrics folder.
/opt/basecamp/timeseries/data/warehouse
Contains the files related to the distributed timeseries.
ui /opt/basecamp/ui
Contains the directories and files that are needed for UI Service to function.
zookeeper It is available in root directory. Contains the directories and files that are needed for Zookeeper Service to function.
Viewing Telco Network Cloud Manager - Performance Pods on Kubernetes Dashboard
You can view all the Pods and their status in your worker nodes from Kubernetes Dashboard.
Viewing Telco Network Cloud Manager - Performance Pods on Kubernetes
Dashboard
You can view all the Pods and their status in your worker nodes from Kubernetes Dashboard.
Procedure
1. Log in to the Kubernetes Dashboard.
https://<master_node_IP>:<Kubernetes_Dashboard_externalPort>
2. Click Pods in the Workloads pane in the left navigation pane and select npi from Namespace pane.
3. Click any Pod to see its details.
Generating the audit report
The resource-report script is used to generate a report that contains audit information on device classification.
About this task
The following information is available in the report:
Count and list of managed devices on the system
Count and list of client devices on the system
Count and list of unclassified devices on the system
Procedure
1. Extract the basecamp-resource-report-2.4.3.0.tgz file that is available in the Advanced bundle (M0BP2EN.tar.gz) at <DIST_DIR>/resource-report folder.
2. Use the following command to run the /bin/resource-report script:
cd <DIST_DIR>/resource-report/bin
./resource-report --inventory-service.hosts=<inventory-service.hosts>
Where, <inventory-service.hosts> is the hostname where the Inventory Service is available in your cluster.
For example, <myserver.ibm.com>
The following output files are generated:
A PDF file with summary of the report that shows the count of all resource types.
A CSV file with a list of managed devices, client devices, and unclassified devices
142 IBM Telco Network Cloud Manager - Performance 1.4.5

Optional: Publishing Telco Network Cloud Manager - Performance Dashboards
menus
After the installation of Telco Network Cloud Manager - Performance, you can access Telco Network Cloud Manager - Performance Dashboards directly.
About this task
All the dashboards and system configuration pages that are available in your installed Technology Packs are automatically published and can be accessed directly. You do
not need to publish them from the Dashboard designer tool. These steps are needed for the dashboards that are manually created. To access these dashboards, you must
publish them manually.
Users with a Menu Administrator role or System Administrator role can create and publish menus only when they have access to an Engine instance and one or
more Engine User Groups.
Important: Before you publish the dashboards, observe the following points:
Wait for all the Pods are up on OpenShift® Container Platform or Kubernetes web console.
Expand the Home menu and check all the menu items are available or not based on the Technology Packs that are installed.
Procedure
Complete the following steps to publish the Home menu:
1. Log in to the Telco Network Cloud Manager - Performance Dashboards with npiadmin/<tncp_admin_secret> credentials.
Note: Access the Telco Network Cloud Manager - Performance Dashboards by using the Dashboard Service route from OpenShift Container Platform web console.
2. In the navigation pane of Dashboard Designer, click Menu Access.
You can see the default Home menu.
3. Click Home and wait for the menu to load.
4. To publish the menu, click Publish.
5. In the Publish Menu window, click Publish Menu and Dashboards to publish a menu along with all its dashboards and drill-down dashboards.
Important: You can see the dashboards menu and its items based on the Technology Packs that you installed. See Dashboards and technology pack dependencies.
A confirmation message that indicates that the menu is published is displayed. You can also see the Administration menu and its pages.
What to do next
After you publish a menu, you must log in to Engine and view the published dashboards.
If your environment is integrated with Dashboard Application Services Hub, follow these steps:
1. Log in to Dashboard Application Services Hub portal with npiadmin/<tncp_admin_secret> credentials.
2. On the navigation bar, click Performance > TNCP > Metric dashboards.
The Telco Network Cloud Manager - Performance Dashboards Welcome page loads with menu bar to go to different Telco Network Cloud Manager -
Performance Dashboards and configuration pages.
If your environment is not integrated with Dashboard Application Services Hub, log in to the Telco Network Cloud Manager - Performance Dashboards user interface
with npiadmin/npiadmin credentials.
Note: Access the Telco Network Cloud Manager - Performance Dashboards by using the Dashboard Service route from OpenShift Container Platform web console.
Related information
Adding new menu item to Home menu
Uninstalling
The scope here is only to uninstall all the resources in Telco Network Cloud Manager - Performance. It does not cover the uninstallation of the cloud platform.
About this task
Uninstallation is a two-step process where you must uninstall the Technology Packs and then uninstall Telco Network Cloud Manager - Performance.
Uninstalling Technology Packs
Uninstall Technology Packs and the related GOM files from the system.
Uninstalling Telco Network Cloud Manager - Performance
Uninstall the Telco Network Cloud Manager - Performance and its related software from the system.
Uninstalling Technology Packs
Uninstall Technology Packs and the related GOM files from the system.
Before you begin
IBM Telco Network Cloud Manager - Performance 1.4.5 143

Back up your data.
Procedure
1. Access Telco Network Cloud Manager - Performance dashboards.
2. Click Administration > Pack management > Pack service.
You can see the Pack service page that has a grid. After you deploy the packs, you can see the list of packs and their details.
3. Click the Deploy ( ) icon in the Actions pane and select Remove and click Confirm.
If the Technology Pack JAR file is edited after the deployment, the state changes to draft. To delete the pack, click More actions ( ) and select History. Select the
revision that is deployed earlier. It applies a filter to the pack JAR file listing page and lists only the selected revision with state deployed. You can then remove or
uninstall the pack JAR file that is previously deployed.
After it is removed successfully, you can see the removed message in the State column on the Pack service page.
4. To check the pack logs, click the removed link in the State column for the Technology Pack to view the Pack log messages.
Uninstalling Telco Network Cloud Manager - Performance
Uninstall the Telco Network Cloud Manager - Performance and its related software from the system.
Before you begin
Make sure to back up the storage.
Procedure
Run the following command from the master node if you are using Ceph:
./uninstall.sh --storage=ceph
1. To delete each Pod from Telco Network Cloud Manager - Performance, run the following command:
kubectl delete pods <pod_name> --grace-period=0 --force
2. Manually delete the /var/lib/rook folder from all the nodes.
Note: After the command is run, Ceph storage class is not removed completely. The command halts without completing all the Pods.
3. Run the uninstall script again.
./uninstall.sh --storage=ceph
Run the following command from the master node if you are using NFS as the storage class:
./uninstall.sh -f
Results
The following data is removed:
144 IBM Telco Network Cloud Manager - Performance 1.4.5

All Telco Network Cloud Manager - Performance Pods
Namespace noi or tncp
Persistent Volume Claims
Storage classes
Configuring
Configure the different microservices that are available in Telco Network Cloud Manager - Performance to work together to collect, process, and visualize the performance
metrics.
About this task
You can view the current settings, modify the settings, add new, or delete an existing configuration item. These configuration settings are stored in the PostgreSQL
database, which is config DB.
Each configuration setting is associated with a separate widget on Telco Network Cloud Manager - Performance UI.
Configuring Telco Network Cloud Manager - Performance system environment
Use this information to configure your Telco Network Cloud Manager - Performance system.
Configuring integration with Watson AIOps Event Manager
Use this information to integrate Telco Network Cloud Manager - Performance with the Tivoli® Netcool®/OMNIbus application.
Additional configuration settings
Use this information to perform some additional configuration settings in your Telco Network Cloud Manager - Performance environment. Use these settings as
applicable for your specific installation scenario.
Configuring Telco Network Cloud Manager - Performance system environment
Use this information to configure your Telco Network Cloud Manager - Performance system.
You must do some general system configuration and tuning for optimizing the system performance. During implementation, you must configure the application options to
meet your requirements.
The Telco Network Cloud Manager - Performance dashboards are pre-configured with working sets of default configurations that are created after installation. A broad
range of functions in Telco Network Cloud Manager - Performance can be administratively configured.
Important: If you want to configure the Telco Network Cloud Manager - Performance system in bulk by using REST API curl commands, see Using REST APIs to configure
the Telco Network Cloud Manager - Performance system.
You can configure the following items from system configuration pages:
Accessing system configuration pages
Telco Network Cloud Manager - Performance system has many configuration pages that are configured by the administrators to fine-tune to make the system
collect, process, and store the performance metrics.
Generic functions
Use this information to understand the generic interactivity and filtering functions that are available on configuration UI pages in Telco Network Cloud Manager -
Performance.
Managing Alarm rules
The Alarm rules page is used to activate or deactivate alarm exporter rules and to define alarm targets and target groups. An alarm rule consists of the criteria by
which alarms can be selected. You can define the targets or the target groups that the alarms are exported.
Managing batch jobs for metrics
Performance data that is collected from different collectors is stored in Timeseries and DiamondDB Services. The Batch analytics processes the historical data.
Batch processing is most often used when the data is large.
Mapping the dashboards and analytics
You can associate a custom dashboard with an existing Batch analytics job.
Managing streams for metrics
Performance data that is collected from different collectors is fed into the Analytics Service as it arrives. Processing on the data is done in real time. By building data
streams, you can feed data into the Analytics Service as soon as it is generated and get near-instant analysis.
Managing thresholds
You can use threshold values to measure against the data that must be monitored across all the available resource types and their instances. Threshold report
capabilities exist at both the resource type and instance levels. The information is stored in the database and sent to the target rules.
Managing the data anomaly configurations
The Data anomaly page is used to detect the metric data anomalies. When the anomalies are detected, alarms are sent to the Event Viewer. The anomaly
configurations are flexible.
Managing Autonomous systems
To assign a routing domain for your network, configure the Autonomous System that uses Border Gateway Protocol (BGP). BGP shares routing information with
other Autonomous systems with the help of a globally unique 16-digit identification number that is known as the AS number (ASN). AS numbers are assigned by the
Internet Assigned Numbers Authority (IANA).
Managing domain names
Domain name is an identification of a unique computer system on the internet that is universally agreed by web servers and online administrations and offers all
related destination information. To access an organization’s web-based facilities, website users must identify the exact domain name. A complete domain name
consists of one or more subdomain names and one top-level domain name that is separated by dots (.). For example, <myserver.ibm.com> is a complete domain
name.
Managing Flow aggregations
User configurable Flow aggregations increase the performance of Telco Network Cloud Manager - Performance system by optimizing the CPU utilization and reduce
the I/O demands on database. It helps in Top Talker optimizations. Top N Talkers support feature helps you analyze large amount of data that Flexible NetFlow
captures from the network traffic. You can filter, aggregate, and sort the data for display. When you are sorting and displaying the data in the NetFlow cache, you can
limit the display output to a specific number of entries with the highest values (Top N Talkers) for traffic volume, packet counters, and so on.
IBM Telco Network Cloud Manager - Performance 1.4.5 145

Managing Flow interfaces
Flow records provide unidirectional measurements of traffic that is entering (ingress) or leaving (egress) a network interface. Telco Network Cloud Manager -
Performance models this process by associating an Ingress Interface and Egress Interface with each network interface. Each Flow record is associated with the
appropriate flow interface.
Managing Flow IP Grouping
Create logical grouping of IP addresses and address ranges. This grouping helps in monitoring the individual NetFlow bandwidth usage, usage-based billing, and
accounting.
Managing NBAR
Configure your devices to send NBAR and NBAR2 data to gain better visibility on the applications in your NetFlow traffic. This information helps you identify the
bandwidth usage of the applications in your network and also prioritize and control the application traffic. You can define the business relevance of the applications
and apply the correct QoS policies to improve the performance and user experience of business-critical applications.
Managing flow data retention profiles
Describes how to configure the retention profiles for different type of flow data that is collected by Telco Network Cloud Manager - Performance Flow Collector and
DNS Collector Services.
Managing Type of Service
Typically, this feature determines the packet delivery prioritization for low-delay, high-throughput, highly reliable service, or normal service for NetFlow traffic. On
all Flow packets, Type of Service byte is represented as Differentiated Service Code Point (DSCP) and Explicit Congestion Notification.
Managing Audit trail
You can track the recent changes to Telco Network Cloud Manager - Performance system configuration changes that you and other administrators who are made to
your system environment. It is especially useful in organizations with multiple administrators. It is especially useful during the audit reviews.
Managing automation scripts
The Automation scripts page is used to manage executor scripts and provision to upload scripts as file and saved as text. These scripts can be scheduled to run to
monitor the metric data anomalies and raise alarms in Tivoli® Netcool®/OMNIbus.
Managing automation jobs
The Automation jobs page is used to run the automation scripts that are uploaded from the Automation scripts page.
Managing time schedules
A schedule entry contains all the settings that are needed to run a job at a predetermined time. Currently, the Time scheduling is introduced for scheduling
threshold violation alarms. With a schedule entry, you can schedule threshold violation alarms that are run at a predetermined date and time with a fixed end date
or without an end date. It provides users the ability to define different time schedules for enabling or disabling threshold monitoring. You have the flexibility to
schedule the alarm alerts for the selected metrics at peak hours, off-peak hours, weekdays, and weekend.
Managing Busy hours
The Busy hour feature provides a way of calculating the busiest hour of the day for a performance metric. It is the greatest value for any performance metric for a
defined period (such as daily or weekly). The data for the busiest hour of the day, week, and month based on the designated determiner. The Busy hour determiner
Resource type or group must be same or lower than the Focal Resource type or group.
Managing User-defined calculations (UDC)
User-defined calculations (UDC) are performance measurements that you create. A UDC is in contrast to the other performance measurements that are created at
the time of system setup and not subject to modification.
Managing ICMP Ping profiles
In Telco Network Cloud Manager - Performance, Ping Collector Service is available to ping the devices, interfaces, and metrics that are collected are stored in the
database and can be visualized through the ICMP Ping dashboards.
Managing Resource types
You can manage and analyze your network and gather information about network Resource types and their instances and how they are all connected. A Resource
type is an addressable, managed node or host that is hierarchical and contain parent and child types. In a network, the Resource type has one or more instances
that are identifiable with Resource ID.
Managing Resource grouping
To support many Resource types with many different Resource type instances in your network, Telco Network Cloud Manager - Performance must be flexible and
scalable. Different aspects of the network must be grouped to give an easier access to data and monitoring requirements.
Managing site grouping
You can categorize your enterprise network based on different geographical areas by specifying the IP address ranges for each site. Site grouping helps in
monitoring the individual site bandwidth usage, usage-based billing, and accounting.
Managing SNMP Discovery profiles
A discovery profile is a group of discovery settings that are saved in the database that includes the IP addresses of the resources to be discovered. You can control
the discovery process. You can also specify the IP address range or subnet. You can also provide a list of IP addresses with the FQDN of the hosts to be discovered
in bulk. You can control the discovery job for the configured profiles on demand.
Managing SNMP credentials
You can configure the SNMP credentials for all SNMP-enabled devices in your network to send the data to Telco Network Cloud Manager - Performance system. This
information is stored in database.
Managing SD-WAN controller profile
Configuring SD-WAN controller profile helps you to save the SD-WAN controller link with a name and access it directly if needed. The SD-WAN controller profile
page can also be accessed from the SD-WAN health overview dashboard.
Data availability and reporting
Data availability or data coverage describes the completeness of data for processing in Telco Network Cloud Manager - Performance.
TNCP application health monitoring
Currently, you can monitor File Collector performance with the help of these reports.
Accessing system configuration pages
Telco Network Cloud Manager - Performance system has many configuration pages that are configured by the administrators to fine-tune to make the system collect,
process, and store the performance metrics.
About this task
All the administration pages are available in Telco Network Cloud Manager - Performance microservices. The following table gives the mapping of administration pages
with microservices in which they are bundled:
Administration page Service
Alarm rules threshold
146 IBM Telco Network Cloud Manager - Performance 1.4.5

Administration page Service
Audit trail dashboard
Autonomous systems flow-collector
Automation jobs app
Automation scripts app
Batch analytics analytics-batch
Busy hour definitions analytics-batch
Dashboard and analytics-mapping analytics-batch
Data collection overview pack-service
Priority KPIs coverage pack-service
Data anomaly sleeping-cell
Discovery profiles snmp-discovery
Domain names dns-collector
FC: Ingestion health pack-service
FC: Metrics inserted vs ingestion pack-service
FC: Resource inventory discovery pack-service
Flow aggregations flow-analytics
Flow interfaces flow-collector
Flow IP grouping flow-collector
Group configuration inventory
NBAR flow-collector
Pack service pack-service
Ping profiles ping-collector
Resource management inventory
Retention profiles flow-collector
SD-WAN controller profiles dashboard
Sites app
SNMP credentials snmp-discovery
Streaming analytics analytics-stream
Threshold definitions threshold
Time scheduling threshold
Type of service (ToS) flow-collector
User-defined calculations analytics-batch
Procedure
1. Log in to Telco Network Cloud Manager - Performance Dashboards directly in dedicated stand-alone installation.
Or
2. Log in to Dashboard Application Services Hub if your environment is integrated with Watson™ AIOps components.
3. Click Administration and access the system configuration pages:
The configuration pages are categorized as follows:
Analytics
Alarm rules
Batch analytics
Dashboard and analytic mapping
Streaming analytics
Threshold definitions
Flow
Autonomous systems
Domain names
Flow aggregations
Flow interfaces
Flow IP grouping
NBAR
Retention profiles
Type of service (ToS)
General
Audit trail
Automation jobs
Automation scripts
Time scheduling
Metric management
Busy hour definitions
User-defined calculations (UDC)
NiFi ingestion health
Data collection overview
Priority KPIs coverage
Pack management
Pack service
Ping
Ping profiles
Resource management
IBM Telco Network Cloud Manager - Performance 1.4.5 147

Group configuration
Resource management
Sites
SNMP discovery
Discovery profiles
SNMP credentials
SD-WAN
SD-WAN controller profiles
TNCP application health
FC: Resource inventory discovery
FC: Ingestion health
FC: Metrics inserted vs ingestion
Generic functions
Use this information to understand the generic interactivity and filtering functions that are available on configuration UI pages in Telco Network Cloud Manager -
Performance.
About this task
Every page reflects the total number of entries that are available on top of the grid that is displayed. You can also scroll both horizontally and vertically in the grid. All the
data from configuration pages is stored in their respective tables in PostgreSQL database.
Typically, you can do the following tasks on the configuration UI pages:
Create
The names of the entries can include the following characters:
Alpha-numeric
Special characters like:
#
%
_
-
/
.
<
>
:
Note:
Only in the Resource Management page, you can use "/","<", ">", "_", and ":" for resource ID name.
In the Streaming analytics page, you can use "_", ".", and "-" for the stream name. Internally, "." is converted to "_". Do not create two streams with
the same name differentiated by "." and "_" special characters as the streams are not considered unique.
Find
Filter
Rename
Delete
Import
Export
Note: When you export the content from the administration pages, the data is saved as a JSON file. It is applicable for all pages.
Go to a specific page.
Set the number of records to be displayed in the grid on a page.
The generic functions that are applicable on all the administration pages are listed here.
Procedure
Enter the name of the component in the Search by <component_name> field and click the icon to retrieve it for quick access.
Note: Make sure the names of items in the configuration page does not exceed 60 characters long. Otherwise, you might notice that names in the grid overlap.
Click the icon and provide a Resource type name to filter the component.
It is applicable for Batch Analytics, Streaming Analytics, and Busy Hour configuration pages.
Enter the page number in the Page field at the lower left to go to a specific page. You can also use the arrows to increment or decrement the page number. You can
also go to the first page and last page.
Select the number of records to be displayed per page from the list at the lower left.
For Audit trail page, you can select a maximum of 1000 records per page.
Click the column header from any grid widgets to sort in ascending or descending order.
You can sort the data in numerical or alphabetical, depending on what type of data is populated in the grid widget.
Note: The sort function on the Alarm rule column is not applied when you enable or disable the alarm rule from the Alarm rules configuration page.
Select a number in the lower-right corner to change the number of items to be displayed in the table.
Go to a specific page by using the arrows in the bottom of the page.
Navigate to a specific page from the page numbers at the bottom of the page.
Managing Alarm rules
148 IBM Telco Network Cloud Manager - Performance 1.4.5

The Alarm rules page is used to activate or deactivate alarm exporter rules and to define alarm targets and target groups. An alarm rule consists of the criteria by which
alarms can be selected. You can define the targets or the target groups that the alarms are exported.
About this task
Allows the user to create and modify alarm targets and target groups. Threshold violation alarms can be exported to the following targets:
1. IBM® Tivoli® Netcool®/OMNIbus
2. Kafka
3. SNMP Trap
Note: Create targets first, followed by target groups and Alarm rules.
Procedure
Click Administration > General > Alarm rules.
You can see the Alarm rules page that has a grid with configured Alarm rules and their details.
Searching and refreshing the Alarm rules
Click the Refresh ( ) icon to display the latest set of Alarm rules.
Click the Search ( ) icon and provide a search string to filter specific Alarm rules from the table.
Creating new alarm rule
Click Create new and enter the following details in the Create new Alarm Rule page:
Table 1. Entering values in Create New Alarm Rule page
Field Details
Rule name Specify a name for the rule.
Alarm types Target
The following are the targets where the violations can be exported to.
OMNIbus
Kafka
SNMP Trap
SNMP traps are basic alarm messages from SNMP-enabled devices.
Target groups
Click Save.
You can see the new rule in the grid in Alarm rules page.
Click the More actions ( ) icon to disable or enable a rule.
By default, the Alarm rule is enabled.
Creating targets
Click the Targets tab in Alarm rules page.
Click Create new and enter the following details in the Create New Target page:
Table 2. Entering values in Create new Target page
Field Details
Target name Specify a name for the Target.
IBM Telco Network Cloud Manager - Performance 1.4.5 149

Field Details
Target type Select from the options.
OMNIbus
Generated threshold violation data is sent to IBM Tivoli Netcool/OMNIbus for alarm viewing.
Note: You cannot create two targets with OMNIbus.
Kafka
Provide the additional mandatory details.
Kafka Broker List
List of Kafka broker hosts. For example,
<kafka_broker_host>:<kafka_broker_
port>
You can use multiple Kafka brokers that are available in your cluster. Use a comma-separated list.
Kafka Topic
Name of the topic to which the violated metrics and their values are written to.
SNMP Trap
SNMP Traps are alert messages that are sent from a remote SNMP-enabled device to a central collector, called as SNMP manager such
as IBM Tivoli Netcool/OMNIbus.
Enter the following details:
SNMP Version
v2c
v3
SNMP Host
SNMP Port
Read Community
Level
It is applicable for SNMP V3 version only. It has these options.
noAuthNoPriv
authNoPriv
authPriv
Security name
It is applicable for SNMP V3 version only for all levels.
Auth type
It is applicable for authNoPriv and authPriv levels
Auth password
It is applicable for authNoPriv and authPriv levels
Note: The minimum length of the password must be eight characters.
Priv type
It is applicable for authPriv level only.
Priv password
It is applicable for authPriv level only.
Note: The minimum length of the password must be eight characters.
Context name
It is applicable for SNMP V3 version only for all levels.
Click Save.
You can see the new target in the grid in Targets page.
Creating new target group
Click the Targets groups tab in Alarm rules page.
Click Create new and enter the following details in the Create new Group page:
Table 3. Entering values in Create new Target page
Field Details
Target group
name
Specify a name for the Target group.
Target type Select from the available Targets that are created and available on Targets page. it helps in creating a group of targets that you can send the
violations to raise alarms.
Select a single or multiple targets from the Available Targets pane and click Add (>) icon to move it to the Selected Targets pane.
You can also click Add all ( ) to move all the Targets to a group.
Click Save.
You can see the new target group in the grid in Target groups page.
Editing Alarm rules, Targets, and Target groups
Click the Edit ( ) icon in Actions column to update an existing item in Alarm rules, Targets, or Target groups pages.
Make the changes as needed and click Update.
The changes are written to the selected entry.
Click Save as to save the changes to new entry.
Deleting Alarm rules, Targets, and Target groups
150 IBM Telco Network Cloud Manager - Performance 1.4.5

Select a single entry from the table and click the ( ) icon from the Action column to delete and click Confirm.
Click OK.
Select multiple entries from the table and click the Delete icon from the blue ribbon and click Confirm.
Click OK.
Note: You cannot delete a Target if it is associated with a Target group. Delete the Target group first to delete the Target.
Importing and exporting the Alarm rules, Targets, and Target groups
Click the Import ( ) icon to import items in Alarm rules, Targets, and Targets groups pages from an external backup file.
Make sure to be on the page for the item you want to import. This option is useful in migration scenario.
It displays the number of items that are imported from the selected JSON file.
Note: Import overwrites the existing entries, if any. When you import your JSON file for an existing alarm rule, it overwrites and updates the alarm rule data with the
values in the JSON file.
Select the items from the grid that you want to export to a JSON file and click Export ( ) and save the JSON file.
Kafka topic format with exported threshold violations
When you configure the alarm export target as Kafka, the contents of the Kafka topic is described here.
Related tasks
Managing thresholds
Managing time schedules
Related information
Threshold
Kafka topic format with exported threshold violations
When you configure the alarm export target as Kafka, the contents of the Kafka topic is described here.
Content of the Kafka topic that has the exported threshold violations
The Kafka topic name is configured in Alarm Rules configuration page. Typically, the created topic with metric threshold violations contains offset, key, and message parts.
Offset
The offset identifies each record location within the partition.
Key
It is the configured metric that is violating the configured thresholds values.
Message
The message part is in JSON format. When a new violation occurs, new message is written to the topic with its timestamp.
Event severity levels
A severity level is associated with each generated alert to help you to prioritize and manage alerts. Six default severity levels are available.
Level Meaning
0 Clear
1 Indeterminate
Note: Currently, Intermediate level is not supported.
2 Warning
3 Minor
4 Major
5 Critical
Example Kafka topic content
Violation
Key
Entity/TV/0/
CPU.Utilization.Percent
/1705027200027
Message
{
"timestamp": 1705027200027,
"description": "CPU.Utilization.Percent: 86.0 under threshold (<IP_Address>)",
"parentEntity": "<IP_Address>",
"acknowledged": 0,
"key": "TimeSeries/1/<IP_Address>/CPU.Utilization.Percent/1705027200027|post-rped",
"id": "ThresholdViolation",
IBM Telco Network Cloud Manager - Performance 1.4.5 151

"properties": {
"leavingTime": "0",
"thresholdType": "1",
"violationUpdateTime": "1705031400032",
"tag": "post-rped",
"accumulatedTime": "0",
"leavingOccurrences": "0",
"upperLimit": "100.0",
"evaluationNo": "1",
"profile": "tprped",
"resetTime": "0",
"metric": "CPU.Utilization.Percent",
"mode": "1",
"severity": "2",
"numEvents": "0",
"evaluationType": "2",
"consecutiveOccurrences": "14",
"inViolation": "true",
"violationStartTime": "1705027200027",
"entityExtendedProperties": "shortDisplayName=Agent4.persistent.co.in"
},
"entityType": "device",
"entity": "<IP_Address>",
"category": "TimeSeries",
"severity": 2
}
Related concepts
Threshold
Related tasks
Managing Alarm rules
Managing batch jobs for metrics
Performance data that is collected from different collectors is stored in Timeseries and DiamondDB Services. The Batch analytics processes the historical data. Batch
processing is most often used when the data is large.
About this task
Some of the COTS Technology Packs for Telco Network Cloud Manager - Performance have in built jobs that are imported directly on installation. The list of Technology
Packs that contain readily importable jobs.
gsm-huawei-bss-v900r021c10spc600-1.5.0.jar
lte-huawei-eutran-v100r015c10-1.5.0.jar
umts-huawei-mscs-v200r011c10-1.5.0.jar
nr-huawei-nutran-v100r015c10-1.5.0.jar
umts-huawei-utran-v100r015c10spc156-1.5.0.jar
Procedure
Click Administration > Analytics > Batch analytics.
You can see the Batch analytics page that has a grid with configured batch jobs and their details.
Filter the jobs that are mapped to a dashboard
Click the Dashboard list and select a dashboard to see all the jobs that are associated with it.
For more information, see Mapping the dashboards and analytics.
Searching and refreshing the batch jobs
Click the Refresh ( ) icon to display the most recent set of jobs.
Click the Search ( ) icon and provide a search string to filter specific jobs from the table.
Filtering Resource types or groups
Click the Filter ( ) icon and select a focal resource type or group to filter and display the items under it in the table.
Click the Import ( ) icon to import jobs from an external backup file.
Note: Currently, only JSON file format of size 500 MB or less is supported.
This option is useful in migration scenario.
Creating new batch job
Click Create new and enter the following details in the Create new job page:
Table 1. Entering values in Create new job page
152 IBM Telco Network Cloud Manager - Performance 1.4.5

Field Details
Field Details
Job name Provide a name for the batch job.
Focal Resource type
and group
Click Browse to select the Focal Resource type or group from where the metrics can be selected for a specific Resource type or group. It
is the main Resource type or group from which you want to view metrics.
Note: If you are using a dynamic group in your job and want to deactivate it from the Group configuration page, make sure to delete or
disable the job first.
Resource filter Note: Currently, Resource filter is enabled for Resource types only and not for Resource groups.
1. Click Condition editor.
2. Select properties that are associated with Focal Resource type that is selected previously.
You can see the formula based on the selected properties in the Formula Editor.
3. Use the following operators to build the formula based on the selected properties:
Logical Or (||)
Logical And (&&)
Equal to (==)
Not equal to (!=)
Greater than (>)
Greater than equal to (>=)
Less than (<)
Less than equal to (<=)
Note: Currently, <, <=, >, >= operators are not working as expected in filtering the Resource types. Also, if the expression in the
Condition editor contains these characters, the expression is not parsed for filtering.
4. Click Clear to remove the formula from the editor.
5. Click Add.
You can see the formula in the Resource filter field on Create new page.
For example, if you selected interface as the Resource type, you might want to use the property and its value as ifIndex=5. You can
create more complex formulas with the available properties in this filter.
Schedule name Select the schedule name from the following options:
EVERYHOUR
EVERYHOURBYMIN10
EVERYDAY
EVERYDAYBYHOUR2
EVERYWEEK
EVERYMONTH
Based on the selected schedule, time period and granularity options change. See table.
Time period Select the time period from the following options:
Last hour
Last day
Last week
Last month
Time period options change based on the selected schedule name. See table.
Granularity Select the following granularity options:
15 Min
30 Min
Hour
Day
Week
Month
Based on the time attribute selected, the data is rolled up or aggregated for that time frame.
Granularity options change based on the schedule and time period selections. See table.
Custom calculation
(Optional)
N-point peak
See Configuring an N-point peak value.
Percentile
See Configuring a percentile value.
Metrics pane
Select a Focal
Resource type or group
Select a Resource type or group from the list.
Note: It is auto-populated with the Focal Resource type or group that is selected previously.
IBM Telco Network Cloud Manager - Performance 1.4.5 153

Field Details
Metric 1. Select a metric type from the following options:
Analytic
It represents the metrics that come from batch jobs, streams, and stored busy hour definitions that a user defines.
Metric
It represents the raw metrics that come from installed Technology Packs.
UDC
It represents the metrics that a user creates.
Metrics that are available in the selected field type are displayed.
Note: Type in the search field by its name.
2. Select a single metric or multiple metrics and click the arrow ( ) to move the selected metrics to the Selected metrics pane.
3. Select an aggregator for the metric. The following options are available:
Sum
SumMin
SumAvg
SumMax
SumNull
Min
MinSum
MinAvg
MinMax
MinNull
Average
AvgSum
AvgMin
AvgMax
AvgNull
Max
MaxSum
MaxMin
MaxAvg
MaxNull
NULL
NullSum
NullMin
NullAvg
NullMax
Count
Note: If you select UDC from the Metric field, the aggregator that is used in the UDC is prepopulated in the Aggregator field. You
cannot select a different aggregator for it.
4. Click Delete metrics ( ) icon to delete the selected metric.
Table 2. Schedule dependency on time period and
granularity
Schedule Time period Granularity
EVERYHOUR Last hour 15 Min
30 Min
Hour
EVERYHOURBYMIN10 Last hour 15 Min
30 Min
Hour
EVERYDAY Last day 15 Min
30 Min
Hour
Day
EVERYDAYBYHOUR2 Last day 15 Min
30 Min
Hour
Day
EVERYWEEK Last week Day
Week
EVERYMONTH Last week Day
Week
Last month Day
Week
Month
Click Save to save the job.
The newly created job with all its attributes is available in the Batch analytics page.
The Status column in the grid shows whether the job is enabled or disabled.
Editing a job
To update an existing job, click the Edit icon ( ) in the Action column on Batch analytics page.
154 IBM Telco Network Cloud Manager - Performance 1.4.5

You can see the Update job page.
Make the changes as needed and click Update, and then confirm.
The changes are written to the selected job.
Click Save as to save the changes to a new job.
Deleting a batch job
Select a single entry or multiple entries from the table and click the ( ) icon to delete and click Confirm.
Click the Run during the selected period ( ) icon, select start date and time and end date and time from the time picker window during which you want the
enabled job to be run. Click Confirm.
Note: Your job must be in enabled state to run during the selected period.
Click the History ( ) icon in Action pane for a job to see the run history of the job in the History page.
Entries in the History page depend on Resource and granularity definitions in the job. It displays the number of metrics in the Metrics column and the status of the
run in the Status column. You can see the following status options:
Done
Started
Error
Note: If you notice an error in status for a job run, you can rerun the job in that specific period by using the Run during the selected period option.
By default, a maximum of 100 records can be viewed in the grid. All the records in the grid are sorted in descending order and you cannot change the sorting order.
Expand the twistie see the details of the entry in the History page. The default retention period for batch history is 30 days. You can customize this value by
changing the delete-batch-history-interval setting in the analytics-batch-0 Service YAML file. For more information, see Configuring the retention period
for batch job history.
Note: The result size calculation depends on the Resource and granularity definitions in the job.
Click the More actions ( ) icon to enable or disable a job.
Note: By default, the created job is enabled.
To stop the collection of metric values from a job, select the job and click Disable.
Optional: When you select a job from the grid on the Batch analytics page, the following group options are available on the upper right of the grid.
Enable
To enable multiple jobs together, select the jobs in Batch analytics page and click Enable.
Disable
To disable multiple jobs together, select the jobs in Batch analytics page and click Disable.
Delete
To delete multiple jobs together, select the jobs in Batch analytics page and click Delete.
Export
To export multiple jobs together, select the jobs in Batch analytics page and click Export. Save the Batch analytics.json file.
Cancel
To clear the selected jobs in Batch analytics page, click Cancel.
Results
The created metrics for batch analysis are stored in timeseries database with this naming convention, t<aggregator>s<aggregator>_<granularity>_<metric_name>.metric.
For example, for single-level aggregation metric, tsum_15min_CPU.Utilization.Percent.metric.
Configuring an N-point peak value
You can configure this parameter to measure the difference between the highest and the lowest values in bandwidth usage and a specific number of occurrences of
the peak.
IBM Telco Network Cloud Manager - Performance 1.4.5 155

Configuring a percentile value
Use a percentile value instead of the average or max statistics to better represent a metric that shows an occasional burst or spike. Typically, 95th percentile is an
accurate analysis on network bandwidth usage. This value can tell your bandwidth usage 95% of the time and 5% of the time you might notice spikes. It is a good
number to bill customers based on their peak traffic usage and not based on the highest (100 - Nth) percent. It can also be used for network planning.
Configuring an N-point peak value
You can configure this parameter to measure the difference between the highest and the lowest values in bandwidth usage and a specific number of occurrences of the
peak.
About this task
To calculate the N-point peak value, you need the following parameters:
Metric for which the peak value must be calculated.
Number of data points to be picked from the raw data that is represented by N.
Sort order to be applied can be either min or max.
Specified time period within which to calculate the peak value.
For example, see the N-point peak configuration for the metric, ICMP.Ping.Response.Time.ms in the following video:
Calculation of N-point peak value
For 5:30 PM IST to 6:29 PM IST:
{0.43,0.439,0.426,0.386,0.366,0.368,0.707,0.373,0.873,0.523,,0.375}
Three highest values where you use MAX as the sorting order: 0.937,0.873,0.707
Add the three values and take average (Metric aggregator is average):
(0.937+0.873+0.707)=2.517/3=0.839
Therefore, at 5:30 PM IST tavg_hour_3peak_max_ICMP.Ping.Response.Time.ms=0.839
Procedure
1. In the Create new job page in Batch Analytics, click Custom calculation list, and select N-point peak.
You can see the N-point peak job pane open.
2. Drag the slider handle to a value that you want for the peak value points.
Any number within the range of 2 - 20 is accepted. By default,the value is 2.
3. Sort from the Sort order list.
You can select MIN or MAX from the list based on whether you want to sort the values from highest to lowest or lowest to highest. If you use MIN as the sorting
order, take the N lowest values. If you take MAX as the sorting order, take N highest values.
4. Continue with the rest of the steps as described in Managing batch jobs for metrics.
Results
The created metrics for batch analysis are stored in timeseries database with this naming convention,
t<aggregator>s<aggregator>_<granularity>_<N_peak>_<sort_order>_<metric_name>.metric. For example,
tsum_15min_3peak_max_CPU.Utilization.Percent.metric.
Configuring a percentile value
Use a percentile value instead of the average or max statistics to better represent a metric that shows an occasional burst or spike. Typically, 95th percentile is an accurate
analysis on network bandwidth usage. This value can tell your bandwidth usage 95% of the time and 5% of the time you might notice spikes. It is a good number to bill
customers based on their peak traffic usage and not based on the highest (100 - Nth) percent. It can also be used for network planning.
About this task
For example, see the percentile configuration for the metric, ssum_nUtranCell.N.CA.SCell.Act.Att in the following video:
Consider the following scenario:
The <percentile> returns the specific percentile of the values in a particular range. To calculate the 79th percentile, you can apply the following formula:
PERCENTILE(Array of values,<percentile>/100)
Calculation of percentile value N.
N = PERCENTILE(array,k)
The PERCENTILE function uses the following arguments:
Array (required argument) – It is the array or range of data that defines the relative standing.
k (required argument) – The percentile value in the range 0…1, inclusive.
Consider the following values for the metric ICMP.Ping.Response.Time.ms:
Timestamp ICMP.Ping.Response.Time.ms
Nov 3, 2022, 3:30 PM 39.978
Nov 3, 2022, 3:35 PM 39.916
156 IBM Telco Network Cloud Manager - Performance 1.4.5

Nov 3, 2022, 3:40 PM 39.817
Nov 3, 2022, 3:45 PM 40.485
Nov 3, 2022, 3:50 PM 41.099
Nov 3, 2022, 3:55 PM 40.834
Nov 3, 2022, 4:00 PM 40.525
Nov 3, 2022, 4:05 PM 39.821
Nov 3, 2022, 4:10 PM 39.915
Nov 3, 2022, 4:15 PM 40.395
Nov 3, 2022, 4:20 PM 39.837
Nov 3, 2022, 4:25 PM 39.849
=PERCENTILE(data_range,0.79)=40.513
79th percentile value for the data range is 40.513.
Observe the same data for the 79th percentile metric from the Metric viewer dashboard. You can see the 79th percentile value of 40.513 at Nov 3, 2022, 3:30 PM
timestamp.
Timestamp tsum_hour_79percentile_ICMP.Ping.Response.Time.ms
Nov 3, 2022, 1:30 PM 40.06
Nov 3, 2022, 2:30 PM 40.49
Nov 3, 2022, 3:30 PM 40.513
Nov 3, 2022, 4:30 PM 40.151
Nov 3, 2022, 5:30 PM 40.706
Follow these steps to configure the Percentile value for the batch analytic metrics:
Procedure
1. In the Create new job page in Batch Analytics, click Custom calculation list, and select Percentile.
You can see the Percentile job pane open.
2. Drag the slider handle to a value that you want for percentile.
Or, you can also enter an exact number in the range 1 - 100 into the text input field. By default, the value is 95.
3. Continue with the rest of the steps as described in Managing batch jobs for metrics.
Results
The created metrics for batch analysis are stored in timeseries database with this naming convention,
t<aggregator>s<aggregator>_<granularity>_<percentile>_<metric_name>.metric. For example,
tsum_hour_79percentile_ICMP.Ping.Response.Time.ms.metric.
You can view this metric that is configured with percentile value from the Metric Viewer dashboard.
Figure 1. Displaying a percentile metric in Metric Viewer
Figure 2. Displaying a percentile metric in a grid widget in Metric Viewer
IBM Telco Network Cloud Manager - Performance 1.4.5 157

Mapping the dashboards and analytics
You can associate a custom dashboard with an existing Batch analytics job.
About this task
After the mapping, you can see the dashboards that have jobs that are mapped to them from the Dashboard list in the Batch analytics page. You can then filter the jobs
that are associated with a particular dashboard to be displayed in the grid. Currently, you can map only the batch jobs to custom dashboards that are created from the
Dashboard Designer or built-in dashboards. For built-in dashboard mapping, ensure that the correct dashboard name is used and the batch job metrics that are associated
with the dashboard.
Procedure
Click Administration > Analytics > Dashboard and analytics mapping.
You can see the Dashboard and analytics-mapping page that has a grid with mapped dashboards and the batch jobs details.
Searching and refreshing the mapping
Click the Refresh ( ) icon to display the most recent set of dashboards and jobs.
Click the Search ( ) icon and provide a search string of a dashboard or job to filter specific from the table.
Creating new mapping
Click Create new and enter the following details in the Create new/Update page:
Dashboard name
If you are mapping a job to a dashboard, the dashboard name must be the same name that is available as a built-in or custom dashboard. Custom
dashboards can be created with Dashboard Designer. To map a built-in dashboard with a job, you must know the jobs that are associated with the
dashboard. These jobs are available from the Technology Packs that are installed on your system.
Job name
Select a job from the list of available jobs. These jobs include both built-in jobs that are available from the installed Technology Packs and the jobs that users
create.
Note: Currently, you can map one job to a dashboard at a time. If you want to add multiple jobs to a dashboard, you must create multiple mappings.
Click Save to save the mapping.
The newly created mapping with all its attributes is available in the Dashboard and analytics-mapping page.
You can see the dashboards that have associated jobs can be filtered from the Dashboard list in the Batch analytics page.
Editing an existing mapping
To update an existing mapping, click the Edit icon ( ) in the Action column on Dashboard and analytics-mapping page.
You can see the Create new/Update page.
Clear the existing job that is mapped to the dashboard and select a new one from the Job name list.
Deleting mappings
Select a single entry or multiple entries from the table and click the ( ) icon to delete and click Confirm.
158 IBM Telco Network Cloud Manager - Performance 1.4.5

Managing streams for metrics
Performance data that is collected from different collectors is fed into the Analytics Service as it arrives. Processing on the data is done in real time. By building data
streams, you can feed data into the Analytics Service as soon as it is generated and get near-instant analysis.
About this task
Some of the COTS Technology Packs for Telco Network Cloud Manager - Performance have in built streams that are imported directly on installation. The list of Technology
Packs that contain readily importable streams.
Note: If you modify the Resource types or groups for which some streams are already available, you might notice that the changes take a while to reflect. For example, if
you add, update, or delete some Resource types or groups, you might not see the changes in the immediate window period, which is one minute. But you can see the
changes in the subsequent window periods.
Procedure
SNMP technology packs
network-access-huawei-1.5.0.jar
File-based technology packs
network-access-nokia-1.4.0.jar
cisco-sdwan-1.4.0.jar
cloud-kubernetes-1.8.0.jar
Click Administration > Analytics > Streaming analytics.
You can see the Streaming analytics page that has a grid with configured streams and their details.
Searching and refreshing the streams
Click the Refresh ( ) icon to display the latest set of streams.
Click the Search ( ) icon and provide a search string to filter specific streams from the table.
Filtering Resource types or groups
Click the Filter ( ) icon and select a focal resource type or group to filter and display the items under it in the table.
Click the Import ( ) icon to import streams from an external backup file.
Note: Currently, only JSON file format of size 500 MB or less is supported.
This option is useful in migration scenario.
Creating new stream
Click Create new and enter the following details in the Streaming analytics page:
Table 1. Entering values in Create new stream page
Field Details
Stream name Provide a name for the stream.
You can use "_", ".", and "-" for the stream name. Internally, "." is converted to "_". Do not create two streams with the same name
differentiated by "." and "_" special characters as the streams are not considered unique.
Focal Resource type
and group
Click Browse to select the Focal Resource type or Resource group from where the metrics can be selected for a specific Resource type or
group. It is the main Resource type or group from which you want to view metrics.
Note: If you are using a dynamic group in your stream and want to deactivate or delete it from the Group configuration page, make sure to
delete or disable the stream first.
Resource filter Note: Currently, Resource filter is enabled for Resource types only and not for Resource groups.
1. Click Condition editor.
2. Select properties that are associated with Focal Resource type that is selected previously.
You can see the formula based on the selected properties in the Formula Editor.
3. Use the following operators to build the formula based on the selected properties:
Logical Or (||)
Logical And (&&)
Equal to (==)
Not equal to (!=)
Greater than (>)
Greater than equal to (>=)
Less than (<)
Less than equal to (<=)
Note: Currently, <, <=, >, >= operators are not working as expected in filtering the Resource types. Also, if the expression in the
Condition editor contains these characters, the expression is not parsed for filtering.
4. Click Clear to remove the formula from the editor.
5. Click Add.
You can see the formula in the Resource filter field on Create new page.
For example, if you selected interface as the Resource type, you might want to use the property and its value as ifIndex=5. You can
create more complex formulas with the available properties in this filter.
IBM Telco Network Cloud Manager - Performance 1.4.5 159

Field Details
Window period Select any of the following options:
1 min
5 min
10 min
15 min
30 min
Based on the time attribute selected, the data is rolled up or aggregated for that time frame.
Metrics pane
Select a Focal
Resource type or
group
Select a Focal resource type or group that is available at the same level or descendants in the hierarchy.
Metric 1. Select a metric type from the following options:
Analytic
It represents the metrics that come from batch jobs, streams, and stored busy hour definitions that are defined by users.
Metric
It represents the raw metrics that come from installed Technology Packs.
UDC
It represents the metrics that are created by user.
Metrics that are available in the selected field type are displayed.
Note: Type in the search field by its name.
2. Select a single metric or multiple metrics and click the arrow ( ) to move the selected metrics to the Selected metrics pane.
3. Select an aggregator for the metric. The following options are available:
Sum
SumMin
SumAvg
SumMax
SumNull
Min
MinSum
MinAvg
MinMax
MinNull
Average
AvgSum
AvgMin
AvgMax
AvgNull
Max
MaxSum
MaxMin
MaxAvg
MaxNull
NULL
NullSum
NullMin
NullAvg
NullMax
Count
Note: If you select UDC from the Metric field, the aggregator that is used in the UDC is prepopulated in the Aggregator field. You
cannot select a different aggregator for it.
4. Click Delete metrics ( ) icon to delete the selected metric.
Click Save.
You can see the new stream in the Streaming analytics page.
Click the More actions ( ) icon and click Start to start the stream.
Note: Streams are not started automatically after the installation of the Technology Packs. You must start them from the Streaming analytics page.
The Status column in the grid shows the status of the stream as started or stopped.
Optional: When you select stream from the grid on the Streaming analytics page, the following group options are available on the upper right of the grid.
Start
To start multiple streams together, select the streams in Streaming analytics page and click Start.
Stop
To stop multiple streams together, select the streams in Streaming analytics page and click Stop.
Delete
To delete multiple streams together, select the streams in Streaming analytics page and click Delete.
Export
To export multiple streams together, select the streams in Streaming analytics page and click Export. Save the Streaming analytics.json file.
Cancel
To clear the selected streams in Streaming analytics page, click Cancel.
160 IBM Telco Network Cloud Manager - Performance 1.4.5

Editing a stream
To update an existing stream, click the Edit icon ( ) in the Action column on Streaming analytics page.
You can see the Update stream page.
Make the changes as needed and click Update, and then confirm.
The changes are written to the selected stream.
Click Save as to save the changes to a new stream.
Deleting a stream
Stop the streams that you want to delete.
Select a single entry or multiple entries from the table and click the ( ) icon to delete and click Confirm.
Results
The created metrics for streaming analysis are stored in time series database with this naming convention, s<aggregator>_<metric_name>.metric. For example,
savg_gNodeBFunction.N.SIG.gNB.CallAtt.Max.metric.
Managing thresholds
You can use threshold values to measure against the data that must be monitored across all the available resource types and their instances. Threshold report capabilities
exist at both the resource type and instance levels. The information is stored in the database and sent to the target rules.
Before you begin
If you want to import the threshold definitions from another server, make sure to create the required alarm rules and time schedules for the thresholds.
The following Technology Packs have some metrics that are enabled for the baseline thresholds:
gsm-huawei-bss
lte-huawei-eutran
lte-huawei-mme
lte-huawei-sgwpgw
network-health
neutral-access-gom
nr-huawei-nutran
umts-huawei-utran
network-flow
The metrics that are enabled for baseline thresholds appear in the Threshold definitions page. The structure of the metric is as follows:
name=cell.Call.Seizure.Success.Rate
description="Call seizure Success Rate"
units=percent
aliases=[]
properties={
resource-types="cell", aggregator="average", baselineEnabled="true"
}
About this task
More than one threshold evaluation profile can be supported for the same metric and Resource scope. It helps in addressing the requirements of users in different
domains. You can create the threshold profiles with the following features:
Create a threshold profile with one metric, all, or a group of resources, and one Time schedule.
Support for multiple evaluation criteria with multiple Time schedules for the same threshold profile.
Note: When you define multiple evaluation criteria, their associated time schedules must not overlap.
Support for multiple profiles creation for the same metric and resource combination and for different domains. The domain is represented as a Tag and the Tag
name must be unique.
Support for mixed operators in the Alarm predicate. This support is available only if the limit values that are defined do not overlap. You can assign >= for a major
threshold and <= for a minor threshold in the same Alarm predicate. For example:
Critical >= 40, Major >= 30 Minor <=20
Procedure
Click Administration > Analytics > Threshold definitions.
You can see the Threshold definitions page that has a grid with configured definitions and their details.
Important: All the baseline-enabled metrics from the installed Technology Packs are displayed in the grid as Default baseline threshold for
<metric name>.
Searching and refreshing the definitions
Click the Refresh ( ) icon to display the latest set of definitions.
Click the Search ( ) icon and provide a search string to filter specific threshold definitions from the table.
IBM Telco Network Cloud Manager - Performance 1.4.5 161

Creating a threshold profile
Click Create new to see the Create new Threshold profile page.
Enter the following details in the page:
Table 1. Entering values in Create new Threshold profile page
Field Details
Profile name Specify a name for the profile.
Tag Enter a unique tag name that represents a specific domain or group. The Tag name must be unique for any two threshold definitions that have
the same metric and Resource combination. Alpha-numeric characters and hyphens are supported. The tag name must be within 35 characters
in length.
Available
metrics
Click Browse to select a metric.
Threshold scope Define the scope of the threshold profile. You can apply it to a Resource group or a Resource type instance. You can select the following options:
Global
The threshold profile is applicable to all Resource types and Resource groups available in your system.
Resource group, Resource type instance, or both
The threshold profile is applicable to a specific Resource group or their instances or both according to your selections.
When you select this option, the Browse Resource type instances window opens. You can select single or multiple Resource groups or
single or multiple Resource type instances or both.
Optional, click Group configuration to create new group.
You are redirected to the Group configuration page to create a new configuration. Create a group according to your requirements and
save.
You can go back to the Browse Resource type instances page you are working on and continue with the rest of the configurations. Refresh
the Resource groups tree to see the new group and select the new group.
Click Save to save the selections.
Target rule Select an existing target rule. Verify that the Targets and Target groups are already created.
Click Create new rule icon ( ) to create new alarm rule.
Click Edit rule icon ( ) to edit an existing alarm rule.
For more information, see Managing Alarm rules.
Add evaluation Click to add the threshold evaluation detail. Evaluation 1 is created in the Evaluation name pane.
Evaluation
criteria
Enter the following details in the Evaluation criteria.
Note: You can add multiple evaluation criteria in the same threshold profile.
Time schedule
Note: If a time schedule is not defined for the threshold definition, metric violations are displayed as Always in Activation schedule column in
the Threshold Definitions page.
Select an existing schedule.
Click Create new schedule icon ( ) to create new schedule.
Click Edit schedule icon ( ) to edit an existing alarm rule.
For more information, see Managing time schedules.
Define a threshold violation profile.
Baseline
threshold
Select the checkbox to enable a baseline threshold violation profile. Only metrics with baseline threshold enabled can be targeted to a
predefined Kafka topic for Watson™ AIOps Metric Manager consumption. Unlike burst and period thresholds, baseline dynamically adapts to
historical data.
Burst threshold Select the Burst threshold if you want to measure how long in a row the violations occurred per Resource.
Disabled
Use the toggle button to enable or disable the threshold type.
Note: You can disable a threshold but retain the configuration values by clearing the Enabled toggle button. If you want to reuse this threshold
with the same values, you click Enabled. You can set the advanced levels in the Enabled state.
162 IBM Telco Network Cloud Manager - Performance 1.4.5

Field Details
Alarm predicate
Define the level of threshold violations.
Non-Violation <-> Warning Violation <-> Minor Violation <-> Major Violation <-> Critical Violation
Critical
Major
Minor
Warning
Define the values to raise an alarm. It is the level of the threshold. The metric value must be greater than or equals to this value to trigger a
threshold violation for >= and less than or equals to this value for <=. Burst threshold has a maximum limit of -9999999999999.99 to
9999999999999.99.
Note: You can define values for single or multiple severities in one evaluation.
>=
Detects violations when they exceed threshold values.
<=
Detects violations when they fall short of threshold values.
Band
You can provide a range of values for upper-limit and lower-limit.
Detects violations when they go outside a range (or band) between two threshold values.
Note: For Band type, you can select only Critical, Major, and Minor only one at a time. The warning level is not valid for Band mode.
Evaluation
formula
You can see the threshold definitions in the Evaluation formula pane.
Click Clear to remove the values that are defined for the threshold violation types.
Click Delete to remove the entire evaluation.
Advanced It is enabled only when the threshold is in an Enabled state. Enter the values in the Burst threshold advanced levels window.
Generate events
Yes
Choose Yes if you want to generate an event when a threshold violation occurs.
No
Choose No if you do not want to generate an event when a threshold violation occurs.
Reset time in seconds
Enter the time in seconds to reset the defined values in the Enter time in seconds and Enter occurrence. If the value is set to 0, the threshold
violation cannot be reset.
The burst threshold has a maximum limit of 2147483 seconds.
Non-Violation <-> Warning Violation <-> Minor Violation <-> Major Violation <-> Critical Violation
Enter values for the following fields and click Save:
Enter time in seconds
Duration of accumulated time from consecutive threshold violation events in seconds. The burst threshold has a maximum limit of
2147483 seconds.
Enter occurrence
Number of consecutive threshold violation events for triggering the threshold. The burst threshold has a maximum limit of 2147483647
occurrences.
Clear time in seconds
Duration of accumulated time from consecutive nonviolation events in seconds after which the violation is cleared. The burst threshold
has a maximum limit of 2147483 seconds.
Clear occurrence
Number of consecutive nonviolation events when the threshold is cleared. The burst threshold has a maximum limit of 2147483647
occurrences.
Period threshold Select the Period threshold if you want to measure the accumulated duration for which the threshold is violated. The threshold is violated when
a data spike-accumulated duration by period exceeds a certain duration of time. If the period thresholds are violated, they are not reset until
the end of the period.
Disabled
Use the toggle button to enable or disable the threshold type.
Note: You can disable a threshold but retain the configuration values by clearing the Enabled toggle button. If you want to reuse this threshold
with the same values, you click Enabled. You can set the advanced levels in Enabled state.
IBM Telco Network Cloud Manager - Performance 1.4.5 163

Field Details
Alarm predicate
Non-Violation <-> Warning Violation <-> Minor Violation <-> Major Violation <-> Critical Violation
Define the level of threshold violations.
Critical
Major
Minor
Warning
Define the values to raise an alarm. It is the level of the threshold. The metric value must be greater than or equals to this value to trigger a
threshold violation for >= and less than or equals to this value for <=. Period threshold has a maximum limit of -9999999999999.99 to
9999999999999.99.
Note: You can define values for single or multiple severity in one evaluation.
>=
Detects violations when they exceed threshold values.
<=
Detects violations when they fall short of threshold values.
Band
You can provide a range of values for upper-limit and lower-limit.
Detects violations when they go outside a range (or band) between two threshold values.
Note: For Band type, you can select only Critical, Major, and Minor only one at a time. The warning level is not valid for Band mode.
Advanced It is enabled only when the threshold is in an Enabled state. Enter the values in the Period threshold advanced levels window.
Generate events
Yes
No
Period granularity
Choose the period for which you want threshold violations reported.
Day
Week
Month
Enter time in seconds
Duration of accumulated time from consecutive threshold violation events in seconds. Period threshold has a maximum limit of 2147483
seconds.
Evaluation
formula
You can see the threshold definitions in the Evaluation formula pane.
Click Clear to remove the values that are defined for the threshold violation types.
Click Delete to remove the entire evaluation.
Click Save to save the threshold profile.
The newly created profile with all its attributes is available in the Threshold Definitions page. You can see the enabled threshold types and their definitions in the
grid.
Note: If a threshold definition contains multiple evaluation criteria, you can click the chevron icon that is available before the checkbox that associated with the
profile. It can be collapsed and toggled to open.
Important: A profile can be saved only if the metric and resource type pair is unique. For example, Metric A and Resource type X pair can be used in a different
profile with Tag option.
Editing a threshold profile
To update an existing threshold definition, click the Edit icon ( ) in the Action column on Threshold Definitions page.
You can see the Update Threshold profile page.
164 IBM Telco Network Cloud Manager - Performance 1.4.5

Make the changes as needed and click Update.
The changes are written to the selected threshold profile.
Click Save as to save the changes to a profile.
Note: The combination of Metric, Resource, and Tag must be unique for a threshold profile.
Deleting a threshold profile
Select a single entry or multiple entries from the table and click the ( ) icon to delete and click Confirm.
Importing and exporting the threshold definitions
Click the Import ( ) icon to import definitions from an external backup file.
Note: Currently, only JSON file format of size 500 MB or less is supported.
This option is useful in a migration scenario.
Select the items from the grid that you want to export to a JSON file and click Export ( ) and save the Threshold Definitions.json file.
It displays the number of profiles that are imported from the selected JSON file.
Note: Import overwrites the existing threshold profile, if any. When you import your JSON file for an existing threshold profile, it overwrites and updates the
threshold data with the values in the JSON file.
Results
Threshold evaluation for a metric is done based on the following criteria and priority:
If the threshold profile has the specific metric, group, and Resource type
If the threshold profile has the specific metric and Resource type
If the threshold profile has the specific metric and group
If the threshold profile has the specific metric and global resource type, which indicates all Resource types and groups.
Enrich properties in a threshold definition
Use this information to enrich the properties that are associated with a Resource type in threshold definition. The enriched properties are appended to the
entityExtendedProperties and the Extended section in the Event log messages.
Related tasks
Managing time schedules
Managing Alarm rules
Related information
Threshold
Enrich properties in a threshold definition
Use this information to enrich the properties that are associated with a Resource type in threshold definition. The enriched properties are appended to the
entityExtendedProperties and the Extended section in the Event log messages.
Run the API command to enrich the properties
Run the following curl API command to enrich the properties that are associated with one or more Resource types as a comma-separated list:
curl -X POST --data 'threshold.resource-properties-enrichment=["resourcetype1->property1,propertyN","resourcetypeN-
>property1,propertyN"]' http://<Threshold_host>:30032/rest/setting
Note: The Threshold_host is the node where the Threshold Service is running.
For example,
curl -X POST --data 'threshold.resource-properties-enrichment=["radioSlot->apName,channel","channel->apName,channel","ap-
>apName,channel","interface->ifName,ifSpeed"]' http://localhost:30032/rest/setting
Note: When the Threshold Service is restarted, this data does not persist. To retain this data permanently, add the same data to the common Config Map.
Observe the Threshold log file
You can see the enriched properties in the Threshold log file. Follow these steps:
1. Log in to your cloud platform web console on your primary cluster.
2. Click Workloads > Pods > threshold-0.
3. Click the View logs ( ) icon to see the logs.
If you run the following API call,
curl -X POST --data 'threshold.resource-properties-enrichment=["device->shortDisplayName,vendor"]'
http://Threshold_host:30032/rest/setting
Note: The Threshold_host is the node where the Threshold Service is running.
IBM Telco Network Cloud Manager - Performance 1.4.5 165

The event is enriched with the properties. You can see the following messages in the log files:
[INFO] [2023-12-27 10:56:57.249] [threshold-threshold.dispatcher-16] GYMTH0011I: Sending Event details:
TimeSeriesThresholdViolation(key->TimeSeries/1/team-rped/127.0.0.0/CPU.Utilization.Percent/1703669207513,parentEntity->
0,id->ThresholdViolation,entity->0,entityType->device,category->TimeSeries,properties->entityId=0,parentEntityId=0,
parentEntityName=127.0.0.0,metric=CPU.Utilization.Percent,violationStartTime=1703669207513,violationUpdateTime=17036746075
35,
inViolation=true,consecutiveOccurrences=19,evaluationType=2,thresholdType=1,mode=0,lowerLimit=42.0,numEvents=0,severity=4,
profile=tp_rped,accumulatedTime=0,leavingOccurrences=0,leavingTime=0,resetTime=0,evaluationNo=1,hasParentName=true,
entityExtendedProperties=shortDisplayName=myserver.ibm.com;vendor=Cisco,team=team-rped,timestamp->1703669207513,
severity->4,resourceId->127.0.0.0,description->Threshold Violation (severity: major) on Entity (id: 127.0.0.0)
metric value 50.0 is outside the bounds of the static threshold definition (limitType: >= / upperLimit: unknown
/ lowerLimit: 42.0 / numEvents: 0 / accumulatedTime: 0 / leavingOccurrences: 0 / leavingTime: 0 / resetTime: 0),
acknowledged->0)
Update the common Config Map to persist the data
Perform this step to retain the data permanently and also to add these properties as columns in the Event Viewer.
1. Make sure that you are in noi project.
2. Go to Workloads > ConfigMaps > common.
3. Click the YAML tab.
4. Add the following parameters and the required values in the data section:
threshold.resource-properties-enrichment=["radioSlot->apName,channel","channel->apName,channel","ap-
>apName,channel","interface->ifName,ifSpeed"]
5. Restart the Threshold Service.
1. Change the namespace to tncp.
2. Go to Config and Storage > Config Maps > common.
3. Click the YAML tab.
4. Add the following parameters and the required values in the data section:
threshold.resource-properties-enrichment=["radioSlot->apName,channel","channel->apName,channel","ap-
>apName,channel","interface->ifName,ifSpeed"]
5. Restart the Threshold Service.
Customize Event Viewer to display additional columns
Update the evtmanager-objserv-agg-primary-config ConfigMap.
Set up views in Event Viewer to display the selected properties as columns
Update the evtmanager-objserv-agg-primary-config ConfigMap
Important: This step is required for OpenShift® Container Platform environment alone. In OpenShift Container Platform environment, the cloud version of Watson™ AIOps
is integrated with Telco Network Cloud Manager - Performance.
1. Make sure that you are in noi project.
2. Go to Workloads > ConfigMaps > evtmanager-objserv-agg-primary-config.
3. Click the YAML tab.
4. Add the following parameters in the agg-p-props-append section:
data:
agg-p-props-append: |
NRestOS.Enable: TRUE
NHttpd.EnableHTTP: TRUE
NHttpd.ListeningPort: 8080
Connections: 1024
5. Add the following parameters in the agg-p-sql-extensions section:
alter table alerts.status add column SiteName varchar(255);
go
alter table alerts.status add column StateName varchar(255);
go
alter table alerts.status add column vendor varchar(255);
go
alter table alerts.status add column id varchar(255);
go
alter table alerts.status add column parentId varchar(255);
go
alter table alerts.status add column version varchar(255);
go
alter table alerts.status add column _active varchar(255);
go
alter table alerts.status add column technology varchar(255);
go
alter table alerts.status add column Vendor varchar(255);
go
166 IBM Telco Network Cloud Manager - Performance 1.4.5

alter table alerts.status add column type varchar(255);
go
alter table alerts.status add column tenant varchar(255);
go
alter table alerts.status add column displayName varchar(255);
Note: Add the columns to be enriched in alarms and can add any trigger to clear the alarms based on the properties that are specified in the Enrich properties
(Optional) pane in the Data anomaly page. For more information, see Enrich properties in Data anomaly page.
6. Restart evtmanager-ncoprimary-0 pod.
In K8 environment, follow this information to update the alert.status table to add the columns.
Updating the alerts.status table
Display the properties in Event Viewer as columns
Set the available properties as event data in the Event Viewer columns. Follow these steps to add new event data to Event Viewer:
1. Go to Incident > Event Viewer.
2. Click the Edit View ( ) icon.
The view builder is loaded in a new page.
3. Click the Display Columns tab.
4. Use the following fields and buttons to add or remove event data from the view:
Available fields
Lists all available event data fields. Select the field of the event data that you want to appear as a new column in the event list. Click Add selected field to add
the selected event data field to the event list as a column. Click Add all fields to add all fields to the event list as columns.
Event list view
Lists all the fields that are selected and displayed as columns in the event list. Click Remove selected fields to remove the selected event data field from the
event list columns. Click Remove all fields to remove all fields from the event list columns. Use the arrow buttons to the right of this list to change the display
order of the columns in the event list.
Lock column
Locks the selected column at the far left of the Event list view so that the column is always displayed when you scroll horizontally. Use the arrow buttons to
the right of the list to change the display order of the locked columns in the event list. You cannot change the display order to mix locked columns and
unlocked columns.
5. Click Save to save the view and continue customizing the view, or click Save and Close to save the view and close the View Builder.
Wait for your changes to be applied to the Event list view. You can now see the enriched properties as columns in the Event Viewer.
Update the threshold-omnibus-rule ConfigMap
To map the enriched properties to the columns that are already available in the Event Viewer, follow these steps:
1. Make sure that you are in noi project.
2. Go to Workloads > ConfigMaps > threshold-omnibus-rule.
3. Click the YAML tab.
4. Add the columns that you want to introduce in Event Viewer in the else block under data section.
For example, if you want to add the property Vendor, use the following lines of code that is highlighted:
else
{
@Manager = $Manager
@Class = $Class
@Agent = $Agent
@Node = $Node
@AlertKey = $AlertKey
@AlertGroup = $AlertGroup
@ExtendedAttr = $ExtendedAttr
$extended_attributes = split($ExtendedAttr,extendedAttributes,";")
log( warn, "ExtendedAttr: "+$ExtendedAttr)
foreach ( key in extendedAttributes )
{
log( warn, "key: "+key)
$extended_property_attributes = split(extendedAttributes[key],extendedPropertyAttributes,"=")
$name = extract( extendedAttributes[key], "(.*)=" )
log( warn, "name: "+$name)
$value = extract( extendedAttributes[key], ".*=(.*)" )
log( warn, "value: "+$value)
switch($name)
{
case "Vendor":
@Vendor = $value
update(@Vendor, TRUE)
}
}
5. Restart the Threshold Service.
IBM Telco Network Cloud Manager - Performance 1.4.5 167

1. Change the namespace to tncp.
2. Go to Config and Storage > Config Maps > threshold-omnibus-rule.
3. Click the YAML tab.
4. Add the columns that you want to introduce in Event Viewer in the else block under data section.
For example, if you want to add the property Vendor, use the following lines of code that is highlighted:
else
{
@Manager = $Manager
@Class = $Class
@Agent = $Agent
@Node = $Node
@AlertKey = $AlertKey
@AlertGroup = $AlertGroup
@ExtendedAttr = $ExtendedAttr
$extended_attributes = split($ExtendedAttr,extendedAttributes,";")
log( warn, "ExtendedAttr: "+$ExtendedAttr)
foreach ( key in extendedAttributes )
{
log( warn, "key: "+key)
$extended_property_attributes = split(extendedAttributes[key],extendedPropertyAttributes,"=")
$name = extract( extendedAttributes[key], "(.*)=" )
log( warn, "name: "+$name)
$value = extract( extendedAttributes[key], ".*=(.*)" )
log( warn, "value: "+$value)
switch($name)
{
case "Vendor":
@Vendor = $value
update(@Vendor, TRUE)
}
}
5. Restart the Threshold Service.
Managing the data anomaly configurations
The Data anomaly page is used to detect the metric data anomalies. When the anomalies are detected, alarms are sent to the Event Viewer. The anomaly configurations
are flexible.
Procedure
Searching and refreshing the data anomaly configurations
Click Administration > Anomaly detection > Data anomaly.
Click the Refresh ( ) icon to display the latest set of data anomaly configurations.
Click the Search ( ) icon and provide a search string to filter a specific data anomaly configuration from the table.
Create a data anomaly configuration
Click Create new and enter the following details in the Data anomaly page.
Field Details
Job name Provide a name for the anomaly job.
Script Select the script that you want to run from the list. These user-defined scripts are
uploaded from the Automation scripts page. See Managing automation scripts.
Baseline period in days Provide any value between 2 and 30. It is considered as the baseline period for
calculating the metric value. For example, if you specify 2, two days data is taken
excluding the current and its previous day.
Resource type Select the Resource type.
168 IBM Telco Network Cloud Manager - Performance 1.4.5

Field Details
Resource filter
Note: It is an optional configuration.
If there is a failure to raise alerts, Resources for the selected Resource type
that has KPI values that match the condition are grouped based on first
property that is used in the Resource filter field.
1. Click Condition editor.
2. Select properties that are associated with Focal Resource type that is
selected previously.
You can see the formula based on the selected properties in the Formula
Editor.
3. Use the following operators to build the formula based on the selected
properties:
Logical Or (||)
Logical And (&&)
Equal to (==)
Not equal to (!=)
Greater than (>)
Greater than equal to (>=)
Less than (<)
Less than equal to (<=)
Note: Currently, <, <=, >, >= operators are not working as expected in filtering
the Resource types. Also, if the expression in the Condition editor contains
these characters, the expression is not parsed for filtering.
4. Click Clear to remove the formula from the editor.
5. Click Add.
You can see the formula in the Resource filter field on the Create new page.
For example, if you selected interface as the Resource type, you might want to use
the property and its value as ifIndex='5'. You can create more complex formulas
with the available properties in this filter.
Note: Keep the values within single quotation marks.
Schedule name Select the schedule name from the following options:
EVERY15MIN
EVERYDAY
EVERYDAYBYHOUR10
EVERYDAYBYHOUR2
EVERYHOUR
EVERYHOURBYMIN10
Time aggregator The following options are available:
Average
Min
Max
Based on the selection, data for the selected metric is aggregated for the specified
baseline period.
Select metric Select a metric for which you want to analyze the data anomaly.
Timezone Select the time zone.
Threshold criteria pane
Property name Select a property from the list. Properties are populated in the list based on the
Resource type selection.
Property value Provide a value for the property in the text box. Click inside the text area to see the
formula. You can build it further.
Add Weekly average AND OR Deviation condition Click + icon to the following fields:
Condition
Comparison operator
Value
Condition Select either Aggregated value or Deviation % condition.
Comparison operator Select a comparison operator from the list.
Value Provide a value for the selected condition.
Logical operator Select a logical operator. You can select another condition from the Condition field
and provide a value for it from the Value field.
For example, you can build a formula as follows:
[{ vendor == 'Huawei', aggregated_value == 50 | Deviation > 20%
}]
Add more If you want to add multiple formulas by using multiple properties, follow these
steps:
1. Click outside the curly brackets of the previously added condition.
2. Click Add more.
3. Define a new Threshold criteria.
Click Reset to reset the formulas and start over.
Enrich properties (Optional) pane
Resource type The selected Resource type is available in the field and it cannot be edited.
Properties Select the additional properties to be enriched with the Threshold summary. The
selected properties appear as follows:
resource.Vendor,resource.displayName,resource.lastUpdate,resour
ce.ranMarketDesc
These properties are displayed in the Event Viewer after you add them in the
Properties pane.
Note: For more information, see Configuring metric anomaly detection.
IBM Telco Network Cloud Manager - Performance 1.4.5 169

Note: _active property cannot be added in Tivoli Netcool/OMNIbus schema. If the _active property is used in a job, you might see an error.
Editing a job
To update an existing job, click the Edit icon ( ) in the Action column on Batch analytics page.
You can see the Update job page.
Make the changes as needed and click Update, and then confirm.
The changes are written to the selected job.
Click Save as to save the changes to a new job.
Deleting a job
Select a single entry or multiple entries from the table and click the ( ) icon to delete and click Confirm.
Click the Run ( ) icon for a job in the table for which you want the enabled job to be run.
Click the History ( ) icon in Action pane for a job to see the run history of the job in the History page.
Expand the twistie see the details of the entry in the History page.
Click the More actions ( ) icon to enable or disable a job.
Note: By default, the created job is enabled.
To stop a job, select the job and click Disable.
Export the Data anomaly jobs
Select the items from the grid that you want to export to a JSON file and click Export ( ) and save the Data anomaly.json file.
Configuring metric anomaly detection
Configuring metric anomaly detection
Prerequisites
Install Python 3.6.
Upload the automation scripts
See Managing automation scripts
Pass Telco Network Cloud Manager - Performance admin secret and Tivoli Netcool/OMNIbus
secret
1. Open your cloud platform web console.
2. Make sure that you are in the correct project or namespace. Foe example, noi or tncp.
3. Go to Workloads > Stateful Sets and select the app Service and click YAML.
4. Update the YAML to add the following lines:
env:
- name: JAVA_OPTS
value: '-XX:MaxRAMPercentage=80.0 -Dfile.encoding=UTF-8'
- name: tncp.password
valueFrom:
secretKeyRef:
name: tncp-admin
key: password
5. Log in to the app Service Pod and check whether the tncp.password environment variable accessible in the Pod. Follow these steps:
a. Go to Workloads > Pods and select the app Service and click Terminal.
You must see the password to log in to the Telco Network Cloud Manager - Performance Dashboards.
b. Enter the following commands:
printenv tncp.password
hgWKb6A9BmvmZG9DmXbA
6. Add the Tivoli Netcool/OMNIbussecret. Update the app Service YAML file with the following lines:
- name: omnibus.password
valueFrom:
secretKeyRef:
key: OMNIBUS_ROOT_PASSWORD
name: evtmanager-omni-secret
170 IBM Telco Network Cloud Manager - Performance 1.4.5

Configure to download Python dependencies with internet access
1. Open your cloud platform web console.
2. Make sure that you are in the correct project or namespace. Foe example, noi or tncp.
3. Go to Workloads > Stateful Sets and select the app Service and click YAML.
4. Update the YAML to add the following line in the args section:
- '--auto-resolve-dependency=true'
Configure to download Python dependencies without internet access
Make sure you have internet access on one virtual machine. Follow these steps:
1. Create script to generate folder with /opt/basecamp/app/work/script_name inside work directory of app pod and then shall perform next steps.
2. Create Python environment in the virtual machine with internet access. Use the following commands:
# cd /tmp
# python3 -m venv DataAnomaly
# cd DataAnomalyScript
# ls -lrt
total 4
-rw-r--r-- 1 root root 69 Dec 10 00:25 pyvenv.cfg
lrwxrwxrwx 1 root root 3 Dec 10 00:25 lib64 -> lib
drwxr-xr-x 3 root root 23 Dec 10 00:25 lib
drwxr-xr-x 2 root root 6 Dec 10 00:25 include
drwxr-xr-x 2 root root 173 Dec 10 00:25 bin
3. Run following command in /bin folder to upgrade:
pip3 install --upgrade pip
4. Copy the following files from /opt/basecamp/app/bin/ folder in the app Service Pod to /tmp/DataAnomalyScript location in the virtual machine.
dependency_resolver.sh
/opt/basecamp/app/work/<DataAnomaly.py>
5. Run the dependency_resolver.sh from the virtual machine with the following commands:
chmod u+x dependency_resolver.sh
./dependency_resolver.sh /tmp/<folder with script name>/<python script> /tmp/<folder with script name>/
For example,
./dependency_resolver.sh /tmp/DataAnomaly/DataAnomaly.py /tmp/DataAnomaly/
A file by name requirements.txt is created.
6. Run pip3 command on the requirements.txt file to install required dependencies. Use the following command:
pip3 install -r <path_to_requirments.txt>
You can see many folders with different library files created.
7. Extract the path for libraries from output in the previous step. Use the following commands:
# pip3 show six
Name: six
Version: 1.16.0
Summary: Python 2 and 3 compatibility utilities
Home-page: https://github.com/benjaminp/six
Author: Benjamin Peterson
Author-email: benjamin@python.org
License: MIT
Location: /usr/local/lib/python3.6/site-packages
Requires:
Required-by: cryptography, iniparse, pyOpenSSL, python-dateutil, python-linux-procfs, pyudev, subscription-manager
8. Copy all the library folders with files that are downloaded from Step6 from the virtual machine to the app Service Pod in the
/opt/basecamp/app/work/script_name/lib/python3.6/site-packages folder and /opt/basecamp/app/work/script_name/lib64/python3.6/site-packages
respectively.
Your Python environment is ready for script execution.
Upload the config JSON scripts (Optional)
See Managing automation jobs
Configure metric data anomaly
See Managing the data anomaly configurations
Configure the Resource type cache in Telco Network Cloud Manager - Performance
1. Make sure that you are in noi project.
IBM Telco Network Cloud Manager - Performance 1.4.5 171

2. Go to Workloads > ConfigMaps > common.
3. Click the YAML tab.
4. Add the following parameters in the data section:
data:
cache.inventory.resourceProperties: '[type,vendor,technology]'
cache.inventory.resourceTypes: '[eUtranCell,nUtranCell]'
cache.inventory.rootResourcesToCache: '[nUtranCell,nUtranRelation]'
Or
data:
cache.inventory.resourceProperties: '[type,vendor,technology]'
cache.inventory.resourceTypes: '[*]'
cache.inventory.rootResourcesToCache: '[*]'
Where,
The metric summary API returns the output for the Resource properties and the Resource types that are specified in the
cache.inventory.resourceProperties and cache.inventory.resourceTypes parameters.
All the properties that are defined in the Enrich properties (Optional) pane, the first property in the Resource filter, and the properties in threshold Threshold
criteria of the Data anomaly page must be specified in the cache.inventory.resourceProperties parameter. For more information, see Enrich
properties in Data anomaly page.
5. Restart the following Telco Network Cloud Manager - Performance services:
Inventory
Timeseries
UI
Dashboard
Customize Event Viewer to display additional columns
Update the evtmanager-objserv-agg-primary-config ConfigMap.
Set up views in Event Viewer to display the selected properties as columns
Update the evtmanager-objserv-agg-primary-config ObjectServer Config Map
Important: This step is required for OpenShift® Container Platform environment alone. In OpenShift Container Platform environment, the cloud version of Watson™ AIOps
is integrated with Telco Network Cloud Manager - Performance.
1. Make sure that you are in noi project.
2. Go to Workloads > ConfigMaps > evtmanager-objserv-agg-primary-config.
3. Click the YAML tab.
4. Add the following parameters in the agg-p-props-append section:
data:
agg-p-props-append: |
NRestOS.Enable: TRUE
NHttpd.EnableHTTP: TRUE
NHttpd.ListeningPort: 8080
Connections: 1024
5. Run command to expose 8080 port:
oc expose po evtmanager-ncoprimary-0 --port=8080 --type=NodePort --name=objserve-http-client-external-portforward
evtmanager-ncoprimary-0 is Pod name.
A new service with new port is created.
For example,
oc expose po evtmanager-ncoprimary-0 --port=8080 --type=NodePort --name=objserve-http-client-external-portforward
service/objserve-http-client-external-portforward exposed
oc get svc | grep objserve-http-client-external-portforward
objserve-http-client-external-portforward NodePort 172.30.121.170 <none> 8080:30699/TCP
6. Add the following parameters in the agg-p-sql-extensions section:
alter table alerts.status add column SiteName varchar(255);
go
alter table alerts.status add column StateName varchar(255);
go
alter table alerts.status add column vendor varchar(255);
go
alter table alerts.status add column du varchar(255);
go
alter table alerts.status add column nr varchar(255);
go
alter table alerts.status add column id varchar(255);
go
alter table alerts.status add column parentId varchar(255);
go
alter table alerts.status add column duName varchar(255);
go
172 IBM Telco Network Cloud Manager - Performance 1.4.5

alter table alerts.status add column NFName varchar(255);
go
alter table alerts.status add column version varchar(255);
go
alter table alerts.status add column _active varchar(255);
go
alter table alerts.status add column ranMarketDesc varchar(255);
go
alter table alerts.status add column ranMarket varchar(255);
go
alter table alerts.status add column technology varchar(255);
go
alter table alerts.status add column Vendor varchar(255);
go
alter table alerts.status add column type varchar(255);
go
alter table alerts.status add column tenant varchar(255);
go
alter table alerts.status add column displayName varchar(255);
Note: Add the columns to be enriched in alarms and can add any trigger to clear the alarms based on the properties that are specified in the Enrich properties
(Optional) pane in the Data anomaly page. For more information, see Enrich properties in Data anomaly page.
7. Restart evtmanager-ncoprimary-0 pod.
Update the threshold-omnibus-rule Config Map
Important: This step is required for Kubernetes environment alone. In Kubernetes environment, the on-premises version of Netcool Operations Insight® is integrated with
Telco Network Cloud Manager - Performance.
1. Make sure that you are in tncp project.
2. Go to Config and Storage > Config Maps > threshold-omnibus-rule.
3. Click the Edit resource ( ) icon.
4.
Display the properties in Event Viewer as columns
Set the available properties as event data in the Event Viewer columns. Follow these steps to add new event data to Event Viewer:
1. Go to Incident > Event Viewer.
2. Click the Edit View ( ) icon.
The view builder is loaded in a new page.
3. Click the Display Columns tab.
4. Use the following fields and buttons to add or remove event data from the view:
Available fields
Lists all available event data fields. Select the field of the event data that you want to appear as a new column in the event list. Click Add selected field to add
the selected event data field to the event list as a column. Click Add all fields to add all fields to the event list as columns.
Event list view
Lists all the fields that are selected and displayed as columns in the event list. Click Remove selected fields to remove the selected event data field from the
event list columns. Click Remove all fields to remove all fields from the event list columns. Use the arrow buttons to the right of this list to change the display
order of the columns in the event list.
Lock column
Locks the selected column at the far left of the Event list view so that the column is always displayed when you scroll horizontally. Use the arrow buttons to
the right of the list to change the display order of the locked columns in the event list. You cannot change the display order to mix locked columns and
unlocked columns.
5. Click Save to save the view and continue customizing the view, or click Save and Close to save the view and close the View Builder.
Wait for your changes to be applied to the Event list view.
For more information, see Setting up views for event lists.
Managing Autonomous systems
To assign a routing domain for your network, configure the Autonomous System that uses Border Gateway Protocol (BGP). BGP shares routing information with other
Autonomous systems with the help of a globally unique 16-digit identification number that is known as the AS number (ASN). AS numbers are assigned by the Internet
Assigned Numbers Authority (IANA).
Procedure
Click Administration > General > Autonomous systems.
You can see the Autonomous systems page that has the configured Autonomous systems are available.
Searching and refreshing the Autonomous systems
IBM Telco Network Cloud Manager - Performance 1.4.5 173

Click the Refresh ( ) icon to display the latest set of Autonomous systems.
Click the Search ( ) icon and provide a search string to filter specific Autonomous systems from the table.
Creating new Autonomous system.
Click Create new and enter the Autonomous system information.
ID
Mandatory field that represents a unique ASN.
Note: Autonomous System numbers one to 64511 are available by IANA/ARIN (IANA/American Registry for Internet Numbers) for global use. The 64512 -
65535 series is reserved for private and reserved purposes.
Name
Name of the Autonomous System.
Note: Autonomous System numbers, one to 64511 have predefined names for global use. The 64512 - 65535 series is reserved for private and reserved
purposes.
Country
Country to which the specific network routing domain belongs.
Is public
Whether network domain is a private use ASN or with in the public Autonomous System range.
Click Save.
Editing an Autonomous System
Click the Edit ( ) icon in Actions column to update an existing Autonomous System.
In the Update Autonomous system page, change the values and click Update.
Delete an Autonomous System.
Select a single entry or multiple entries from the table and click the ( ) icon to delete and click Confirm.
Importing and exporting the Autonomous systems
Click the Import ( ) icon to import Autonomous systems from an external backup file.
This option is useful in migration scenario.
Select the items from the grid that you want to export to a JSON file and click Export ( ) and save the Autonomous systems.json file.
Related information
List of Autonomous Numbers
Managing domain names
Domain name is an identification of a unique computer system on the internet that is universally agreed by web servers and online administrations and offers all related
destination information. To access an organization’s web-based facilities, website users must identify the exact domain name. A complete domain name consists of one or
more subdomain names and one top-level domain name that is separated by dots (.). For example, <myserver.ibm.com> is a complete domain name.
About this task
Configuring Domain Names helps in handling the frequently used, well-known domain names of your organization.
You can add a set of pre-defined domain names in Telco Network Cloud Manager - Performance system, such as youtube.com, facebook.com, yahoo.com.
With these pre-defined configurations, the DNS performs forward resolution to get a list of IP addresses for the domain names. When a flow record is received, DNS
Service in Telco Network Cloud Manager - Performance tries to match the source IP and destination IP with the resolved IP address and maps it to the domain name.
Without these pre-defined configurations, the aggregation takes the IP address and performs DNS reserve resolution, which might not populate a friendly domain name.
You can configure domain names to be resolved for IP address mapping.
Note: Database tables store specific types of data and can be categorized into the configuration, event, aggregation, and flow data in database tables. The database table
for configuration displays the data for Domain names.
Procedure
Click Administration > General > Domain names.
You can see the Domain Names page that has a list of Domain names available from the installed Technology Packs.
Searching and refreshing the Domain names
Click the Refresh ( ) icon to display the latest set of Domain names.
Click the Search ( ) icon and provide a search string to filter specific Domain names from the table.
174 IBM Telco Network Cloud Manager - Performance 1.4.5

Add a Domain name.
Click Create new and enter the new Domain name in the Add Domain name page.
Click Save.
Delete a Domain name.
Select a single entry or multiple entries from the table and click the ( ) icon to delete and click Confirm.
This option helps you to delete an entry that has a typographical error.
1. Delete any entry that is no longer needed.
2. Delete a wrong entry and create a new entry.
Note: Domain names that start or end with "." or "-" are not accepted.
Importing and exporting the Domain names
Click the Import ( ) icon to import Domain names from an external backup file.
This option is useful in migration scenario.
Select the items from the grid that you want to export to a JSON file and click Export ( ) and save the Domain names.json file.
Managing Flow aggregations
User configurable Flow aggregations increase the performance of Telco Network Cloud Manager - Performance system by optimizing the CPU utilization and reduce the
I/O demands on database. It helps in Top Talker optimizations. Top N Talkers support feature helps you analyze large amount of data that Flexible NetFlow captures from
the network traffic. You can filter, aggregate, and sort the data for display. When you are sorting and displaying the data in the NetFlow cache, you can limit the display
output to a specific number of entries with the highest values (Top N Talkers) for traffic volume, packet counters, and so on.
About this task
By default, some of the aggregations are enabled and the others are user configurable. Some of these aggregations require other related configurations to be enabled. The
following table provides information about all the available user configurable aggregations:
Aggregation Aggregation fields Enabled by
default
Required more configuration
setting
Top Applications APP_NAME Yes
Top Applications with Source ToS APP_NAME, SRC_TOS No Managing Type of Service
Top Destination Autonomous System BGP_DST_AS_NUM No Managing Autonomous systems
Top Source Autonomous System BGP_SRC_AS_NUM No Managing Autonomous systems
Top Autonomous System Conversations BGP_SRC_AS_NUM, BGP_DST_AS_NUM No Managing Autonomous systems
Top Destinations DST_IP Yes
Top Destinations with Application DST_IP, APP_NAME Yes
Top Destination IP Groups DST_IP_GROUP No Managing Flow IP Grouping
Top Destination IP Groups with
Application
DST_IP_GROUP, APP_NAME No Managing Flow IP Grouping
Top Destination IP Groups with Protocol DST_IP_GROUP, PROTOCOL_ID No Managing Flow IP Grouping
Top Destination IP Groups with Source
ToS
DST_IP_GROUP, SRC_TOS No Managing Flow IP Grouping
Managing Type of Service
Top QoS Hierarchies with Queue Id POLICY_QOS_CLASSIFICATION_HIERARCHY,
POLICY_QOS_QUEUE_ID
No
Top Protocols PROTOCOL_ID Yes
Top Protocols with Application PROTOCOL_ID, APP_NAME Yes
Top Protocols with Destination IP PROTOCOL_ID, DST_IP Yes
Top Protocols with Source IP PROTOCOL_ID, SRC_IP Yes
Top Protocols with Conversation SRC_IP_GROUP, DST_IP_GROUP No Managing Flow IP Grouping
Top Sources SRC_IP Yes
Top Sources with Application SRC_IP, APP_NAME Yes
Top Conversations SRC_IP, DST_IP Yes
Top Conversations with Application SRC_IP, DST_IP, APP_NAME Yes
Top Conversations with ToS SRC_IP, DST_IP, SRC_TOS No Managing Type of Service
Top Source IP Groups SRC_IP_GROUP No Managing Flow IP Grouping
Top Source IP Groups with Application SRC_IP_GROUP, APP_NAME No Managing Flow IP Grouping
Top IP Group Conversations SRC_IP_GROUP, DST_IP_GROUP No Managing Flow IP Grouping
Top IP Group Conversations with
Application
SRC_IP_GROUP, DST_IP_GROUP, APP_NAME No Managing Flow IP Grouping
Top IP Group Conversations with Protocol SRC_IP_GROUP, DST_IP_GROUP, PROTOCOL_ID No Managing Flow IP Grouping
Top IP Group Conversations with Source SRC_IP_GROUP, DST_IP_GROUP, SRC_TOS No Managing Flow IP Grouping
Managing Type of Service
Top Source IP Groups with Protocol SRC_IP_GROUP, PROTOCOL_ID No Managing Flow IP Grouping
IBM Telco Network Cloud Manager - Performance 1.4.5 175

Aggregation Aggregation fields Enabled by
default
Required more configuration
setting
Top Source IP Groups with Source ToS SRC_IP_GROUP, SRC_TOS No Managing Flow IP Grouping
Managing Type of Service
Top Source ToS SRC_TOS No Managing Type of Service
Procedure
Enable or disable an aggregation or modify the aggregation fields from the list.
1. Click Administration > Flow > Flow aggregation.
You can see the Flow aggregation page that has a grid with collected interfaces from the exporters and their details.
Searching and refreshing the streams
2. Click the Refresh ( ) icon to display the latest set of aggregations.
3. Click the Search ( ) icon and provide a search string to filter a specific aggregation from the table.
Enabling and disabling the Flow aggregations
4. Select the aggregations from the grid and click Enable or Disable to enable or disable the aggregations for flow data collection.
Exporting the Flow aggregations
5. Select the aggregations from the grid that you want to export to a JSON file and click Export ( ) and save the Flow aggregations.json file.
It displays the number of profiles that are imported from the selected JSON file.
Note: Importing the aggregations from an external JSON file is not supported.
Results
When an aggregation type is disabled, the historical data remains in the database with no further updates to the CFG schema tables and Flow Metric schema tables.
Managing Flow interfaces
Flow records provide unidirectional measurements of traffic that is entering (ingress) or leaving (egress) a network interface. Telco Network Cloud Manager - Performance
models this process by associating an Ingress Interface and Egress Interface with each network interface. Each Flow record is associated with the appropriate flow
interface.
About this task
Telco Network Cloud Manager - Performance automatically creates Flow interfaces when flow records are processed. When new interfaces are created, they are enabled
unless the total number of interfaces exceeds the limit. Telco Network Cloud Manager - Performance processes the data that is associated with a flow interface only if it is
enabled.
Procedure
Click Administration > Flow > Flow interfaces.
You can see the Flow interfaces page that has a grid with collected interfaces from the exporters and their details.
Searching and refreshing the interfaces
Click the Refresh ( ) icon to display the latest set of interfaces.
Click the Search ( ) icon and provide a search string to filter specific interfaces from the table.
Enabling and disabling the Flow Interfaces
Select the Interfaces from the grid and click Enable or Disable to enable or disable the Interfaces for flow data collection.
Exporting the Flow interfaces
Select the Interfaces from the grid that you want to export to a JSON file and click Export ( ) and save the Flow interfaces.json file.
It displays the number of profiles that are imported from the selected JSON file.
Note: Importing the interfaces from an external JSON file is not supported.
What to do next
You must repeat the same process to enable or disable all interfaces as needed.
176 IBM Telco Network Cloud Manager - Performance 1.4.5

Note: Currently, you cannot select multiple interfaces to configure to enable or disable for traffic data collection at a time.
Managing Flow IP Grouping
Create logical grouping of IP addresses and address ranges. This grouping helps in monitoring the individual NetFlow bandwidth usage, usage-based billing, and
accounting.
About this task
To configure multiple IP ranges into a single IP address group, create multiple row entries with same IP address group.
Make sure that the IP range does not overlap with existing ones. Otherwise, you might see Overlapping Ip address grouping range message.
Procedure
Click Administration > Flow > Flow IP Grouping.
You can see the Flow IP Grouping page that has a grid.
Searching and refreshing the IP Groups
Click the Refresh ( ) icon to display the latest set of IP groups that you created.
Click the Search ( ) icon and provide a search string to filter specific IP groups from the table.
Creating an IP address group.
Click Create new and enter the following details in the Add Flow IP grouping page:
IP Address Group
Logical name to the group. Create your IP Grouping by location. For example, branch offices or departments for easier monitoring.
Start Address Range
Start IP address for the range.
End Address Range
End IP address for the range.
Enabled
A flag to enable or disable the specified IP address group.
Click Save to save the settings.
Editing an IP address group.
Click the Edit ( ) icon in Actions column to update an IP group.
In the Update Flow IP grouping page, change the IP address ranges and click Update and confirm.
Click Save as to save the changes to a new group.
Enabling and disabling the Flow IP Grouping
Select the IP groups from the grid and click Enable or Disable to enable or disable the IP groups for Flow data collection in bulk.
Deleting an IP address group.
Select an entry from the table and click icon to delete an entry that is not needed.
Exporting the IP groups
Select the items from the grid that you want to export to a JSON file and click Export ( ) and save the Flow IP grouping.json file.
Importing the IP groups
Click the Import ( ) button and add the JSON file that has the IP group definitions and click Upload.
Managing NBAR
Configure your devices to send NBAR and NBAR2 data to gain better visibility on the applications in your NetFlow traffic. This information helps you identify the bandwidth
usage of the applications in your network and also prioritize and control the application traffic. You can define the business relevance of the applications and apply the
correct QoS policies to improve the performance and user experience of business-critical applications.
About this task
NBAR and NBAR2 configured devices send Flow packets that contain the following metrics:
Engine ID
Selector ID
IBM Telco Network Cloud Manager - Performance 1.4.5 177

Name
Description
Category Name
Subcategory Name
Group Name
P2P Technology
Tunnel Technology
Encrypted Technology
Business Relevance
Procedure
Click Administration > Flow > NBAR.
You can see the NBAR page that has a grid with collected interfaces from the exporters and their details.
Searching and refreshing the NBAR values
Click the Refresh ( ) icon to display the latest set of NBAR values.
Click the Search ( ) icon and provide a search string to filter specific interfaces from the table.
Enabling and disabling the NBAR
Select the Interfaces from the grid and click Enable or Disable to enable or disable the NBAR.
Exporting the NBAR entries
Select the NBAR entries from the grid that you want to export to a JSON file and click Export ( ) and save the NBAR.json file.
It displays the number of profiles that are imported from the selected JSON file.
Note: Importing the interfaces from an external JSON file is not supported.
Click the Edit ( ) icon in Actions column to update an existing NBAR value.
Click Enable ART to enable the collection of Application Response Time (ART) metrics for TCP traffic.
The following fields are not editable:
Engine ID
A unique identifier for the engine that determined the Selector ID. The Engine ID is the first 8 bits that provide information about the engine that classifies
the flow.
Selector ID
The remaining 24 bits that provide information about the application.
Note: Engine ID and Selector ID constitute the Application ID.
Name
Name of the application that is derived from the Application ID.
Description
Application description that can be derived from the Application option template.
Click Update to save the settings.
Related information
Cisco Application Visibility and Control Field Definition Guide for Third-Party Customers
Managing flow data retention profiles
Describes how to configure the retention profiles for different type of flow data that is collected by Telco Network Cloud Manager - Performance Flow Collector and DNS
Collector Services.
About this task
Retention profiles control how long the raw and aggregated data, and log files are retained by the system. Setting the retention profiles help in maintaining the amount of
data to be stored in the database and free the additional disk space. You can change the default values to modify the retention periods.
Procedure
Click Administration > General > Retention Profiles.
You can see the Retention Profiles page that has a list of profiles available.
Data type Default retention period
DNS 12 months
FLOW_METRIC.1 DAY 12 months
FLOW_METRIC.30 MIN 12 months
FLOW_METRIC.1 MIN 1 month
FLOW_METRIC.RAW 2 days
178 IBM Telco Network Cloud Manager - Performance 1.4.5

Searching and refreshing the retention profiles
Click the Refresh ( ) icon to display the latest set of profiles.
Click the Search ( ) icon and provide a search string to filter specific profile names from the table.
Editing a retention profile
Click the Edit ( ) icon in Actions column to update an existing retention profile.
Name
The Name field is already selected and not editable.
Period
Type the period for which you want to retain the data.
Unit
Select the unit; Days, Weeks, or Months.
Note: Retention period must be configured with tradeoff between storage size and number of days to keep the data. The dashboards will not show any data after
the time period that you selected for a particular type.
Click Update and confirm to save the settings.
Exporting the retention profiles
Select the items from the grid that you want to export to a JSON file and click Export ( ) and save the Retention Profiles.json file.
Related tasks
Configuring retention period for timeseries data
Managing Type of Service
Typically, this feature determines the packet delivery prioritization for low-delay, high-throughput, highly reliable service, or normal service for NetFlow traffic. On all Flow
packets, Type of Service byte is represented as Differentiated Service Code Point (DSCP) and Explicit Congestion Notification.
Procedure
Click Administration > General > Type of Service.
You can see the Type of Service (ToS) page that has a list of Type of Service names available.
Searching and refreshing the Type of Service names
Click the Refresh ( ) icon to display the latest set of ToS items.
Click the Search ( ) icon and provide a search string to filter specific ToS items from the table.
Edit the Type of Services mappings.
Click the Edit ( ) icon in Actions column and modify the Type of Services metrics as follows:
ToS ID
This field is not editable. This field implements the Type of Service on the NetFlow packet to tradeoff on delay, throughput, reliability, and cost.
ToS Name
You can specify any name to your Type of Service class. Typically, the classes and their IDs are as follows:
DSCP Code DSCP ID (Decimal format) IP Precedence
Best Effort 0 0 - Routine or Best Effort
CS1, AF11-13 8,10,12,14 1 - Priority
CS2, AF21-23 16,18,20,22 2 - Immediate
CS3, AF31-33 24,26,28,30 3 - Flash - used for voice signaling
CS4, AF41-43 32,34,36,38 4 - Flash Override
CS5, EF 40, 46 5 - Critical - used for voice RTP
CS6 48 6 - Internetwork Control
CS7 56 7 - Network Control
Where:
CS - Class Selector
AFxy - Assured Forwarding (x=class, y=drop precedence)
EF - Expedited Forwarding
Note: Traffic classification is an automated process that categorizes network traffic according to various parameters into a number of traffic classes.
Note: The ToS names must be unique.
Click Update, and then click Confirm to save the settings.
IBM Telco Network Cloud Manager - Performance 1.4.5 179

Exporting the ToS items
Select the items from the grid that you want to export to a JSON file and click Export ( ) and save the Type of Service.json file.
Related information
DSCP and Precedence Values
Managing Audit trail
You can track the recent changes to Telco Network Cloud Manager - Performance system configuration changes that you and other administrators who are made to your
system environment. It is especially useful in organizations with multiple administrators. It is especially useful during the audit reviews.
About this task
The Audit trail is useful for troubleshooting. Because it captures user and date, you can trace an issue to a specific change. It is a smart way for administrators to keep a
log of their work.
The Audit trail history shows the most recent setup changes that are made to your system. The following content is listed:
Who made the changes?
What are the changes?
When the changes are made? (Timestamp)
You can also sort the records by the column names in the table and also use a search string to filter.
Procedure
Click Administration > General > Audit trail.
You can see the Audit trail page that has the records.
Displaying and filtering
Display and filter the records in the Audit trail
Field Details
Context Name of the configuration page where changes are made.
The following contexts are available:
ALL
ALARM.ALARM_RULE
ALARM.ALARM_SCHEDULE
ALARM.ALARM_TARGET
ALARM.ALARM_TARGET_GROUP
ANALYTICS.BATCH
ANALYTICS.DASHBOARDLINK
It represents the Dashboard and analytics mapping page, which is one of the system configuration pages. See Mapping the dashboards
and analytics.
ANALYTICS.UDC
DASHBOARD.PUBLISH
When a new Technology Pack is installed and the dashboards that are available in it are published automatically, you can see the status
from the Audit trail page under the action PUBLISH.
Note: The DASHBOARD.PUBLISH context is applicable for the dashboards that are published automatically and not for manual publish
from the Dashboard Designer tool.
DISCOVERY.DISCOVERY_PROFILE
DISCOVERY.SNMP_CREDENTIAL
FLOW.TOS
ICMP.ICMP_PROFILE
INVENTORY
INVENTORY.GROUP_DEFINITION
THRESHOLD.THRESHOLD_PROFILE
THRESHOLD.THRESHOLD_PROFILE_V2
Action Action performed by the user. All the actions are categorized under the following types:
ALL
DELETE
INSERT
PUBLISH
It is associated with the dashboards that are published automatically after the installation of the Technology Packs. Typically, the user for
this action is shown as system.
UPDATE
It includes, all changes made in the page and import action. If the imported entry is a new one, it is considered as an insert action.
User The user who performed the change to the page. Typically, you might see npiadmin, other admin, and nonadmin users and system. If some
changes are performed automatically by Telco Network Cloud Manager - Performance, system is displayed as the user.
From Specific start date in dd/mm/yyyy format. The default value is the previous day.
180 IBM Telco Network Cloud Manager - Performance 1.4.5

Field Details
To Specific end date in dd/mm/yyyy format. The default value is the current day.
Description To provide a search string to filter the records.
Note: If the search string has some special characters like, "^", "\", "|", """ in the Description field, the records are not filtered correctly.
Use the following filter options:
In the Context field, delete the default value, All to select an audit history of specific page.
In the Action field, delete the default value, All to select an audit history of a specific action. For example, DELETE, INSERT, UPDATE
In the User field, delete the default value, All to select an audit history of a specific user.
In the From and To fields, select the start date and end date.
In the Description field, provide a search string to be used to filter the records.
Click Filter to load all the available records based on your selections.
Note: If you use REST API calls to update, delete or insert a record in any system configuration page, those changes can also be tracked in the audit history.
Click the link in the Description column for a specific context in the results to see the actual change performed on the page.
If the change performed is insertion or deletion, you can see the details of the record. If a page has updates to the previous values, you can see a modal that
displays New and Old sections for comparison of changes performed.
Sort the filtered records by using Context, Action, User, and Timestamp columns.
Exporting the records
Select the records that you want to export and click Export.
Save the Audit trail.json file to a location of your choice.
Related tasks
Configuring the retention period for audit trail history data
Managing automation scripts
The Automation scripts page is used to manage executor scripts and provision to upload scripts as file and saved as text. These scripts can be scheduled to run to monitor
the metric data anomalies and raise alarms in Tivoli® Netcool®/OMNIbus.
About this task
Currently, only Python scripts can be uploaded.
Procedure
1. Click Administration > General > Automation scripts.
Searching and refreshing the Automation scripts
2. Click the Refresh ( ) icon to display the latest set of Automation scripts.
3. Click the Search ( ) icon and provide a search string to filter a specific Automation script from the table.
Upload an Automation script
4. Click Create new and enter the new script name in the Automation scripts page.
5. Select python as the script type.
6. Click Upload script ( ) icon and click Add file.
7. Browse and select the script file and click Upload.
8. Click Save.
You can see the new script in the grid in the Automation scripts page.
9. Click the More actions ( ) icon to disable or enable a script.
By default, the Automation script is enabled.
Delete an Automation script.
10. Select a single entry or multiple entries from the table and click the ( ) icon to delete and click Confirm.
This option helps you to delete an entry that has a typographical error.
a. Delete any entry that is no longer needed.
b. Delete a wrong entry and create a new entry.
Export the Automation scripts
11. Select the items from the grid that you want to export to a JSON file and click Export ( ) and save the Automation scripts.json file.
Edit an Automation script
12. To update an existing job, click the Edit icon ( ) in the Action column on Automation job page.
You can see the Update script page.
IBM Telco Network Cloud Manager - Performance 1.4.5 181

13. Click the View script( ) icon to view the uploaded script.
14. Make the changes needed and click Update, and then confirm.
The changes are written to the selected job.
15. Click Save as to save the changes to a new job.
Related tasks
Managing automation jobs
Managing the data anomaly configurations
Related reference
Configuring metric anomaly detection
Managing automation jobs
The Automation jobs page is used to run the automation scripts that are uploaded from the Automation scripts page.
About this task
These jobs are scheduled and run at different time schedules. All the scripts that are uploaded from the Automation jobs page are available for job runs on the page.
Procedure
1. Click Administration > General > Automation jobs.
Searching and refreshing the Automation jobs
2. Click the Refresh ( ) icon to display the latest set of Automation jobs.
3. Click the Search ( ) icon and provide a search string to filter a specific Automation job from the table.
Create an Automation job
4. Click Create new and enter the new job name in the Job name field in the Automation jobs page.
5. Select a script that is already uploaded from the Automation scripts page in the Script field.
6. Select a schedule to run the script from the Schedule name field.
Select the schedule name from the following options:
EVERYHOUR
EVERYHOURBYMIN10
EVERYDAY
EVERYDAYBYHOUR2
EVERYDAYBYHOUR10
EVERY15MIN
7. Click Upload CONFIG JSON for script ( ) icon and click Add file.
8. Browse and select the configuration script JSON file and click Save.
9. Click Save.
You can see the jobs in the grid in the Automation jobs page.
Note: _active property cannot be added in Tivoli® Netcool®/OMNIbus schema. If the _active property is used in a job, you might see an error.
10. Click the More actions ( ) icon to disable or enable a job.
By default, the Automation job is enabled.
11. Click the Run ( ) icon in the Action pane to run the enabled job.
12. Click the History ( ) icon in the Action pane to view the status of the job executions for a job to see the run history of the job in the History page.
Expand a timestamp to see the comments that are related to the job run status. You might see a message that appears as follows:
Script Execution Finished with status : Failed , time taken 3s , baselinestart - None ,
baselineend - None , starttime - None , endtime - None , num_alerts - 0 ,
Comments - Error encountered while Parsing JSON , Param not found - 'metricName'
Edit an Automation job
13. To update an existing job, click the Edit icon ( ) in the Action column on Automation job page.
You can see the Update job page.
14. Click the View CONFIG JSON for script( ) icon to view the uploaded script in JSON format.
15. Make the changes that are needed and click Update, and then confirm.
The changes are written to the selected job.
16. Click Save as to save the changes to a new job.
Delete an Automation script.
182 IBM Telco Network Cloud Manager - Performance 1.4.5

17. Select a single entry or multiple entries from the table and click the ( ) icon to delete and click Confirm.
This option helps you to delete an entry that has a typographical error.
a. Delete any entry that is no longer needed.
b. Delete a wrong entry and create a new entry.
Import and export the Automation jobs
18. Click the Import ( ) icon to import Automation jobs from an external backup file.
This option is useful in a migration scenario.
19. Select the items from the grid that you want to export to a JSON file and click Export ( ) and save the Automation jobs.json file.
Managing time schedules
A schedule entry contains all the settings that are needed to run a job at a predetermined time. Currently, the Time scheduling is introduced for scheduling threshold
violation alarms. With a schedule entry, you can schedule threshold violation alarms that are run at a predetermined date and time with a fixed end date or without an end
date. It provides users the ability to define different time schedules for enabling or disabling threshold monitoring. You have the flexibility to schedule the alarm alerts for
the selected metrics at peak hours, off-peak hours, weekdays, and weekend.
Procedure
Click Administration > General > Time scheduling.
You can see the Time scheduling page that has a grid with configured schedules and their details.
Searching and refreshing the Time schedule names
Click the Refresh ( ) icon to display the latest set of schedules.
Click the Search ( ) icon and provide a search string to filter specific schedule names from the table.
Creating new time schedule
Click Create new and enter the following details in the Create New Schedule page:
Table 1. Entering values in Create New Schedule page.
Field Details
Schedule Name Specify a name for the time schedule.
Timezone Select a time zone as applicable.
Enable a job evaluation during the following time
period
To enable a threshold violation alert at a specified time period.
Note: If you select this option, the schedule is displayed as true in the Enabled column in the Time
scheduling page.
Disable a job evaluation during the following time
period
To disable a threshold violation alert at a specified time period.
Note: If you select this option, the schedule is displayed as false in the Enabled column in the Time
scheduling page.
IBM Telco Network Cloud Manager - Performance 1.4.5 183

Field Details
Frequency Daily
Select the following details:
Recurrence interval in days
Select the number of days for the alert to be enabled or disabled.
Recur only on weekdays
If you select this option, the alarm is enabled or disabled on weekdays only.
From
Specific start time period in hours, minutes. You can click + to add more time periods.
To
Specific end time period in hours, minutes. You can click + to add more time periods.
Weekly
Select the following details:
Select a specific day of the week.
Select a specific time. From
Specific start time period in hours, minutes. You can click + to add more time periods.
To
Specific end time period in hours, minutes. You can click + to add more time periods.
Select All to select all days.
Select None to clear the days.
Monthly
Select the following details:
Select a specific month.
Select All to select all months.
Select None to clear the days.
Select a specific date in the month.
Or
Select a specific day in the month.
From
Specific start time period in hours, minutes. You can click + to add more time periods.
To
Specific end time period in hours, minutes. You can click + to add more time periods.
Starting On Starting date and time period for the enabled or disabled alarm.
Now
By default, reflects previous 24hrs time.
Later
Select the specific date and time periods.
Ending On Ending date and time period for the enabled or disabled alarm.
Click Save to save the time schedule.
The newly created schedule with all its attributes is available in the Time scheduling page.
Editing a time schedule
Click the Edit ( ) icon in Action column to update an existing schedule.
In the Update schedule page, change the details and click Update and confirm.
Click Save as to save the changes to new time schedule.
Deleting time schedules
Select a single entry from the table and click the ( ) icon from the Action column to delete and click Confirm.
Click OK.
Select multiple entries from the table and click the Delete icon from the blue ribbon and click Confirm.
Click OK.
Importing and Exporting the sites
Click the Import ( ) icon to import sites from an external backup file.
This option is useful in migration scenario.
Select the items from the grid that you want to export to a JSON file and click Export ( ) and save the Time scheduling.json file.
Related tasks
Managing Alarm rules
Managing thresholds
Related information
Threshold
184 IBM Telco Network Cloud Manager - Performance 1.4.5

Managing Busy hours
The Busy hour feature provides a way of calculating the busiest hour of the day for a performance metric. It is the greatest value for any performance metric for a defined
period (such as daily or weekly). The data for the busiest hour of the day, week, and month based on the designated determiner. The Busy hour determiner Resource type
or group must be same or lower than the Focal Resource type or group.
Procedure
Click Administration > Metric Management > Busy hour definition.
You can see the Busy hour definition page that has a grid with configured Busy hours and their details.
Searching and refreshing the Busy hours
Click the Refresh ( ) icon to display the latest set of Busy hours.
Click the Search ( ) icon and provide a search string to filter specific Busy hours from the table.
Filtering based on Focal Resource type or group
Click the Filter ( ) icon and select a Focal Resource type or group to filter and display the items in the table.
Click the Import ( ) icon to import Busy hour definitions from an external backup file.
Note: Currently, only JSON file format of size 500 MB or less is supported.
This option is useful in migration scenario.
Creating new Busy hour definition
Click Create new and enter the following details in the Create new Busy hour page:
Table 1. Entering values in Create new Busy hour page
Field Details
Busy hour name Provide a name for the Busy hour definition.
Focal Resource
type and group
Click Browse to select the Focal Resource type or group from where the metrics can be selected for a specific Resource type or group. It is the
main Resource type group from which you want to view metrics.
Note: If you are using a dynamic group in your Busy hour definition and want to deactivate or delete it from the Group configuration page, make
sure to delete or disable the Busy hour definition first.
Resource filter Note: Currently, Resource filter is enabled for Resource types only and not for Resource groups.
1. Click Condition filter.
2. Select properties that are associated with Focal Resource type that is selected previously.
You can see the formula based on the selected properties in the Formula Editor.
3. Use the following operators to build the formula based on the selected properties:
Logical Or (||)
Logical And (&&)
Equal to (==)
Not equal to (!=)
Greater than (>)
Greater than equal to (>=)
Less than (<)
Less than equal to (<=)
Note: Currently, <, <=, >, >= operators are not working as expected in filtering the Resource types. Also, if the expression in the Condition
editor contains these characters, the expression is not parsed for filtering.
4. Click Clear to remove the formula from the editor.
5. Click Add.
You can see the formula in the Resource filter field on Create new page.
For example, if you selected interface as the Resource type, you might want to use the property and its value as ifIndex=5. You can create
more complex formulas with the available properties in this filter.
Aggregation
type
Select any of the following options:
Min
Max
Smallest or largest value to be used for the busy hour, min, or max. max uses the greatest value for the busy hour. min uses the smallest value
for the busy hour. For example, min is used where a metric represents the percentage of a channel's availability - the busier the equipment the
less percentage availability there is.
Schedule name Select the schedule type from the following options:
EVERYDAY
EVERYWEEK
EVERYMONTH
Time period Select the time period from the following options:
Last day
Last week
Last month
Time period options change based on the selected schedule name. See table.
IBM Telco Network Cloud Manager - Performance 1.4.5 185

Field Details
Granularity Select the following granularity options:
Day
Week
Month
Based on the time attribute selected, the data is rolled up or aggregated for that time frame.
Granularity options change based on the schedule and time period selections. See table.
Sliding mode Select either Non-sliding or Slidingmode. By default, the value for this parameter is nonsliding.
A sliding busy hour is a busy hour that is calculated based on the busiest hour of the day, across intervals other than hourly boundaries.
The default interval for sliding busy hours is 15 minutes. Using this interval that a sliding busy hour can start at any 15-minute interval of an
hour and extend thereafter for 60 minutes. For example, from 10:15 to 11:15 or 10:30 to 11:30.
Nonsliding means that the busy hour is always aligned to hours, for example 14:00 to 15:00 or 18:00 to 19:00. Sliding busy hours are
calculated down to the interval of the data, for example 14:15 to 15:15.
Slide by The following options are available:
15 min
30 min
Note: If you select the Non-sliding mode, this field is not applicable.
Metrics pane
A busy hour determiner is the metric that is used to determine the busiest hour. Metrics that are used for busy hour determination typically represent a suitable
metric for measuring how busy a system is, by using positive indicators that answer such questions as:
When does the network have the most traffic?
When are most of the calls initiated?
When are the most calls successfully connected?
When does the network have the most traffic?
When are most of the calls initiated?
When are the most calls successfully connected?
Select a Focal
Resource type
or group
Select a resource type or group that is available from the selected Focal Resource type or group.
Metric Select any of the following options:
1. Select a metric type from the following options:
Analytic
It represents the metrics that come from batch jobs, streams, and stored busy hour definitions that are defined by users.
Metric
It represents the raw metrics that come from installed Technology Packs.
UDC
It represents the metrics that are created by user.
Metrics that are available in the selected field type are displayed.
Note: Type in the search field by its name.
2. Select a single metric and click the arrow ( ) to move the selected metric to the Selected metrics pane.
3. Select an aggregator for the metric. The following options are available:
Sum
SumMin
SumAvg
SumMax
SumNull
Min
MinSum
MinAvg
MinMax
MinNull
Average
AvgSum
AvgMin
AvgMax
AvgNull
Max
MaxSum
MaxMin
MaxAvg
MaxNull
NULL
NullSum
NullMin
NullAvg
NullMax
Count
Note: If you select UDC from the Metric field, the aggregator that is used in the UDC is prepopulated in the Aggregator field. You cannot
select a different aggregator for it.
4. Click Delete metric ( ) icon to delete the selected metric.
Table 2. Schedule dependency on time period
and granularity
186 IBM Telco Network Cloud Manager - Performance 1.4.5

Schedule Time period Granularity
EVERYDAY Last day Day
EVERWEEK Last week Day
Week
EVERYMONTH Last month Day
Week
Month
Click Save to save the Busy hour
The newly created Busy hour definition with all its attributes is available in the Busy hour definition page.
The Status column in the grid shows whether the Busy hour definition is enabled or disabled.
Click the More actions ( ) icon to enable or disable a Busy hour definition.
Note: By default, the created Busy hour definition is enabled.
To stop the collection of metric values from a Busy hour definition, select the Busy hour definition and click Disable.
Click the Run during the selected period ( ) icon, select start date and time and end date and time during which you want the enabled job to be run. Click
Confirm.
Note: Your job must be in enabled state to run during the selected period.
Optional: When you select a Busy hour definition from the grid on the Busy hour definition page, the following group options are available on the upper right of the
grid.
Enable
To enable multiple definitions together, select the definitions in Busy hour definition page and click Enable.
Disable
To disable multiple definitions together, select the definitions in Busy hour definition page and click Disable.
Delete
To delete multiple definitions together, select the definitions in Busy hour definition page and click Delete.
Export
To export multiple definitions together, select the definitions in Busy hour definition page and click Export. Save the Busy hour definition.json file.
Cancel
To clear the selected definitions in Busy hour definition page, click Cancel.
Editing a Busy hour definition
Click the Edit icon ( ) in the Action column on Busy hour definition page.
Make the changes as needed and click Update.
The changes are written to the selected item.
Click Save as to save the changes to a new Busy hour.
Deleting a Busy hour definition
Select a single entry or multiple entries from the table and click the ( ) icon to delete and click Confirm.
Results
The created Busy hours metrics are in timeseries database with this naming convention, sbhd_<aggregator>_<granularity>_<metric_name>.metric. For example,
sbhd_min_day_nUtranCell.N.CA.SCell.Add.Att.metric.
Managing User-defined calculations (UDC)
User-defined calculations (UDC) are performance measurements that you create. A UDC is in contrast to the other performance measurements that are created at the
time of system setup and not subject to modification.
About this task
To successfully create UDCs, you must understand mathematical and algebraic expressions. As a general guideline, you create a UDC in these scenarios.
You want to create a performance measurement that is not already on your system.
You want to build a complex expression (more than one field or operator).
Two most important components of a UDC
Expression
Represents the mathematical computation. For more information, see UDC expressions and function reference. Expressions consist of fields, operators, functions,
and constants.
Aggregation type
Determines how data values are aggregated (rolled-up) over time and element. The aggregation type informs Telco Network Cloud Manager - Performance software
how to aggregate over time and over element.
Expressions and aggregation types are critical because they affect how Telco Network Cloud Manager - Performance software calculates the resulting values of the UDC.
IBM Telco Network Cloud Manager - Performance 1.4.5 187

Some of the COTS Technology Packs for Telco Network Cloud Manager - Performance have in built UDCs that are imported directly on installation. The list of Technology
Packs that contain readily importable UDCs:
gsm-huawei-bss-v900r021c10spc600-1.5.0.jar
lte-huawei-eutran-v100r015c10-1.5.0.jar
nr-huawei-nutran-v100r015c10-1.5.0.jar
umts-huawei-mscs-v200r011c10-1.5.0.jar
umts-huawei-utran-v100r015c10spc156-1.5.0.jar
cloud-kubernetes-1.8.0.jar
Procedure
Click Administration > Metric Management > User-defined calculations (UDC).
You can see the User-defined calculations (UDC) page that has a grid with configured UDCs and their details.
Searching and refreshing the UDCs
Click the Refresh ( ) icon to display the latest set of UDCs.
Click the Search ( ) icon and provide a search string to filter specific UDCs from the table.
Filtering based on aggregations
Click the Filter ( ) icon and select an aggregation type to filter and display the items in the table.
Optional: Click the Import ( ) icon to import the custom UDCs.
Note: Currently, only JSON file format of size 500 MB or less is supported.
If you want to import the existing JSON files without the nonmandatory fields, you can edit the JSON file. Set the values for the optional fields empty and set the
value for modified field as zero. In the example, OWNER, DESCRIPTION, PARSED_FORMULA, and FIELD_TYPE fields are empty. The MODIFIED field is set to zero.
For example,
{
"OWNER": "",
"FORMULA": "[msc]![{msc.Caller.Call.Attempts}]",
"DESCRIPTION": "",
"PARSED_FORMULA": "",
"UDC_CONFIG_NAME": "Region.Huawei_Call_Attempts_Count",
"FIELD_TYPE": "",
"MODIFIED": 0,
"FOCAL_ENTITY": "region",
"AGGREGATION": "Sum",
"DATA_TYPE": "DOUBLE"
}
Creating new UDC
Click Create new and enter the following details in the Create new UDC page:
Table 1. Entering values in Create new UDC page
Field Details
Insert UDC
name
Provide a name for the UDC.
Recommended naming conventions for UDCs,
UDC name must have at least two parts. For example, <prefix>.<metric _name>.
Typically, prefix can be <resource type>.
<metric_ name> is the name of the UDC that given during its creation.
The substring before the first "." must not have any special characters. The prefix can have alphanumeric values but it must not
start with numbers.
UDC name must not start with a number.
For example, Region.Huawei_2G_Incoming_Handover_Success_Rate_Percent
UDC properties pane
Focal Resource
type
Click Browse to select the Focal Resource type from where the metrics can be selected for a specific Resource type and to which you want to
apply the UDC. It is the main Resource type from which you want to view metrics.
188 IBM Telco Network Cloud Manager - Performance 1.4.5

Field Details
Aggregation Following options are available:
Average
AvgMax
AvgMin
AvgNull
AvgSum
Count
Max
MaxAvg
MaxMin
MaxNull
MaxSum
Min
MinAvg
MinMax
MinNull
MinSum
Null
NullAvg
NullMax
NullMin
NullSum
Sum
SumAvg
SumMax
SumMin
SumNull
Description Description of the UDC
UDC definition pane to build and validate an expression for the UDC
Select a function Select any of the following options. You can see the formula sample in the Formula pane.
Aggregation
vsum
Math
Abs
Ceil
Exp
Floor
Log
Round
Sqr
Sqrt
Trunc
Miscellaneous
InGroup
IsNull
NullValue
decode
nullInt
nullFloat
Operators
+
-
*
/
%
^
==
=
!=
>
>=
<
<=
Condition
AND
&&
OR
||
String
StringToInt
Traffic
circ
crit
gos
percentFail
percentOk
thresholdDiv
toff
IBM Telco Network Cloud Manager - Performance 1.4.5 189

Field Details
Add field Select a Resource type.
Select a field type from the following options:
UDC
It represents the metrics that are created by user.
Metric
It represents the raw metrics that come from installed Technology Packs.
Analytic
It represents the metrics that come from batch jobs, streams, and busy hour definitions that are defined by users.
Resource properties
All the properties that are associated with the selected Focal Resource type are listed. You can use the properties in creating the
UDC formula.
Select a metric and click Add.
Validate After the UDC is created, validate the formula. Validation checks for the correct use of expression syntax.
Clear Clears the selected details and resets for a new selection.
You can see the UDC in the User-defined calculations (UDC) page.
Using the Resource properties in creating UDCs
Click Add field > Resource properties.
All the properties that are associated with the selected Focal Resource type are listed.
You can use a combination of UDC, Metric, Analytic along with Resource properties to create highly specific UDC formula that applies filters and values based on the
properties that are entered in the formula.
Note: These properties are retrieved from the Cassandra database where all the inventory data is stored.
Examples,
([interface]![{Network.Outbound.Throughput.bps}] / StringToInt([interface]![{bandwidth}])) * 100
[cellOperator]![{cellOperator.N.ThpVol.DL.PLMN}]/StringToInt([cellOperator]![{displayName}]) *100
Important: After the UDC is created with a complex formula that includes metrics and Resource properties in the definition, you can use the UDC to create Batch
jobs, streams, and busy hour definitions.
See the video that shows how the Resource properties from a UDC can be used to view the metrics along with the selected properties from the Metric viewer
dashboard.
Editing a UDC
To update an existing UDC, click the Edit icon ( ) in the Action column on User-defined calculations (UDC) page.
Make the changes as needed and click Update.
The changes are written to the selected UDC.
Note: If any streams that use this UDC metric are running, those streams must be restarted to calculate with the new formula.
Click Save as to save the changes to a new UDC.
Deleting a UDC
Select a single entry or multiple entries from the table and click the ( ) icon to delete and click Confirm.
Exporting the UDCs
Select the items from the grid that you want to export to a JSON file and click Export ( ) and save the User-defined calculations(UDC).json file.
Related information
Expressions and functions in User-defined calculations
Managing ICMP Ping profiles
In Telco Network Cloud Manager - Performance, Ping Collector Service is available to ping the devices, interfaces, and metrics that are collected are stored in the database
and can be visualized through the ICMP Ping dashboards.
Before you begin
Make sure that you perform the following tasks:
Make sure to scale the ICMP Ping Collector Service. Only after that you can see the Ping Profiles configuration page. To scale up the service, follow these steps:
1. Scale up the stateful service with the following command:
kubectl scale -n <namespace> statefulset <service_name> --replicas=1
Or
2. Scale up from your cloud platform web console. Follow these steps:
190 IBM Telco Network Cloud Manager - Performance 1.4.5

a. Click Stateful Sets in Workloads pane and select the service that you want to start.
b. Click the icon, and select Edit Pod Count.
c. Click the controls to increase or decrease the Pods and click Save.
To scale up, click the + icon.
To scale down, click the - icon.
1. Click Stateful Sets in Workloads pane and select the service that you want to start.
2. Click Scale resource ( ) icon.
3. Click the controls to increase or decrease the Pods in the Desired replicas section and click Save.
Make sure to configure the Discovery profiles for the devices in your network and wait for the discovery of the SNMP devices completes. See Discovery profiles.
Make sure to configure the Resource groups. See Resource groups.
Note: It is required if you want to use groups in your Ping profile scope.
Procedure
Click Administration > Ping > Ping profiles.
You can see the Ping profiles page that has a grid with configured Ping profiles and their details.
Searching and refreshing the Ping profiles
Click the Refresh ( ) icon to display the latest set of Ping profiles.
Click the Search ( ) icon and provide a search string to filter specific Ping profiles from the table.
Creating new Ping profile and enabling it for Ping status and to collect ICMP ping metrics.
Click Create new and enter the following details in the Create new profile page:
Table 1. Entering values in Create new page
Field Details
Profile name Provide a name for the Ping profile.
Description Provide the description for the Ping profile.
Polling interval (sec) It is the time interval between ping requests. By default, the value is 300 seconds. Maximum value is 43200 seconds and minimum
value is 10 seconds.
Ping count Number of packets that are sent to ping the device or interface. By default, the value is 1. Maximum value is 10 and minimum value is
1.
Timeout (sec) Time in seconds before the ping utility waits for a reply from the destination. By default, the value is 1 second. Maximum value is 10
seconds and minimum value is 1 second.
Payload size (bytes) It is packet size from source to destination. By default, the value is 32. Maximum value is 65507 bytes and minimum value is 32 bytes.
Remote context Provide the same name of the remote context that you mentioned in the /conf/application.conf file to set up the remote ping and
collection.
Profile scope
Important: You can select either devices, interfaces, or Resource groups or in combination of any two or all three. If you select devices and other combinations,
the collected metrics can be viewed from the ICMP Ping dashboards. If you select interfaces alone, you can view the metrics from the Metric Viewer dashboard. If
you select the Resource groups that include devices in it, you can view the collected metrics from the ICMP Ping dashboards.
Show display name or
Hide display name
An eyeball icon to show or hide the display name of the selected devices or interfaces.
Selected devices
Add Click Add to search and select a device by display name or ID. You can select single or multiple devices. After the selection is complete,
click Select Device to list the devices in the Selected devices pane.
If you want to delete devices, select them and click Delete ( ).
If you have a long list of devices that are selected, you can control the display of the devices from Items per page. You can also
navigate to a particular page.
Use the following rules in your search strings:
The following special characters are restricted in the search string:
', ", \ , <, >
Partial search with regex is supported.
Replace the restricted special characters with either period Or asterisk. For example, interface:.2. or interface:*2*.
Note: These search string rules are applicable only when you search from Add and not from search option in the Selected devices.
Selected interfaces
IBM Telco Network Cloud Manager - Performance 1.4.5 191

Field Details
Add Click Add to search and select interfaces. You can select single or multiple interfaces. After the selection is complete, click Select
Interface to list the interfaces in the Selected interfaces pane.
If you want to delete interfaces, select them and click Delete ( ).
If you have a long list of interfaces that are selected, you can control the display of the interfaces from Items per page. You can also
navigate to a particular page.
Use the following rules in your search strings:
The following special characters are restricted in the search string:
', ", \ , <, >
Partial search with regex is supported.
Replace the restricted special characters with either period or asterisk. For example, interface:.2. or interface:*2*.
Note: These search string rules are applicable only when you search from Add and not from search option in the Selected interfaces.
Selected groups
Note: From the selected Resource groups, the associated devices and interfaces are identified and processed by the Ping Collector Service.
Add Click Add to search and select Resource groups that are already configured. You can select single or multiple groups. After the
selection is complete, click Select Group to list the devices in the Selected groups pane.
If you want to delete groups, select them and click Delete ( ).
If you have a long list of groups that are selected, you can control the display of the groups from Items per page. You can also navigate
to a particular page.
Use the following rules in your search strings:
The following special characters are restricted in the search string:
', ", \ , <, >
Partial search with regex is supported.
Replace the restricted special characters with either period Or asterisk. For example, interface:.2. or interface:*2*.
Note: These search string rules are applicable only when you search from Add and not from search option in the Selected groups.
Enable a profile Click the toggle to enable or disable a profile after it is created. By default, it is disabled.
Click Save.
The newly created profile with all its attributes is available in the Ping profiles page.
Note: The profile is saved only if the resource or group in the profile scope are unique to this profile and not used in another profile scope.
Select a single profile and click the More actions ( ) icon to enable or disable the profiles.
For multiple entries, select and Enable or Disable from the blue ribbon.
To update an existing profile, click the Edit icon ( ) in the Action column on Ping profiles page.
Make the changes as needed and click Update.
The changes are written to the selected profile.
Click Save as to save the changes to a new Ping profile.
Deleting Ping profiles
Select a single entry from the table and click the ( ) icon from the Action column to delete and click Confirm.
For multiple entries, select and delete from the blue ribbon.
Importing and exporting the profiles
Click the Import ( ) icon to import profiles from an external backup file.
This option is useful in migration scenario.
Select the items from the grid that you want to export to a JSON file and click Export ( ) and save the Ping profiles.json file.
Managing Resource types
You can manage and analyze your network and gather information about network Resource types and their instances and how they are all connected. A Resource type is
an addressable, managed node or host that is hierarchical and contain parent and child types. In a network, the Resource type has one or more instances that are
identifiable with Resource ID.
About this task
You can perform the following tasks:
Display all the Resource types for a specific date and time.
Display specific subsets of information by filtering to a specific Resource type and their instances.
View details for a specific Resource type instance.
Edit a specific Resource type instance.
Delete a specific Resource type instance.
Create a Resource type instance and set values for its properties.
192 IBM Telco Network Cloud Manager - Performance 1.4.5

Procedure
Click Administration > General > Resource management.
You can see the Resource management page that has the Resource types available from the installed Technology Packs. You can load the resource types.
Displaying and filtering
Display and filter the Resource types and their instances
Field Details
Date period Select a date.
Time period Select a time period.
Click Load Resources to load all the available resource types and instances based on your selections.
Click a resource type from the Resource hierarchy pane.
Field Details
Resource type Change the Resource type from the list on the right pane to load its associated instances.
Resource type instance ID or display name
Note: You have an option to show or hide the Display name.
Search for a Resource type with ID or display name.
Note: A specific resource ID or name can be searched with wildcard "*".
You can see all the available child resource types for the selected resource type in the right pane.
Click the Hide display name ( ) icon to hide them.
Note: The display names for the Resource types are shown in blue.
Expand any child resource type to select an instance.
Right-click any resource type instance, you can see four options.
View Resource type instance details
Edit Resource type instance details
Delete Resource type instance
Show history
Viewing resource type instance details
Click View Resource type instance details to see the information of the instance.
You can see all the details of the instance and its properties.
Editing a Resource type instance
Click Edit Resource type instance details and edit the content and click Update.
You can delete a Resource member or set values for the available properties.
Deleting Resource type instance
Click Delete Resource type instance to delete the instance.
Viewing the change history that comes from audit trail information
Click Show history to see the changes made to a resource type instance in the Resource type instance history page.
It displays the following data for the changes that are made to a resource type instance in chronological order:
Timestamp
When the changes are made?
User
Who made the changes? For the changes that are made automatically by the Telco Network Cloud Manager - Performance system during the device
discovery, the user is displayed as system.
Details
Specific changes that are made. The changes can be deleting a resource type or instance, updating any value in the resource type instance, or inserting a new
resource type instance.
You can sort the data on Timestamp and User columns.
Creating an instance for a Resource type
Click Create new and enter the details in Create new Resource type instance page.
Table 1.
Option Details
Resource type Uneditable field that displays the parent Resource type. For example, interface.
Resource type instance
ID
Specify an ID for the Resource type instance. For example, 10.55.55.555_interface:<5001>
Resource type instance
properties
Set values for the required properties as required from properties that are available in the pane.
Note: All the properties in the selected Resource type are displayed for the Resource type instance to be set. From here, you can set the
Polling interval. The default interval is 300 seconds.
Resource type instance
members
Drag the available resource types from child Resource types on left navigation pane to the grid in Resource members pane.
Note: For GenericGroup, all the available Resource types are listed to the grid in Resource type instance members pane.
Click Save.
You can see the Resource type instance under the Resource type in Resource management page.
Exporting the Resource types
Select the Resource types that you want to export from Resource management page to a JSON file and click Export ( ) and save the Resource
management.json file.
IBM Telco Network Cloud Manager - Performance 1.4.5 193

Managing Resource grouping
To support many Resource types with many different Resource type instances in your network, Telco Network Cloud Manager - Performance must be flexible and scalable.
Different aspects of the network must be grouped to give an easier access to data and monitoring requirements.
About this task
The resource grouping provides flexibility to group resources in the following ways:
Group Resource types based on similar attribute or property, such as location or vendor.
Group Resource types manually where the resources do not have common property or values.
Group devices or Resource types based on similar role. For example, interface that is connected to the WAN link. It has no common property or common value.
Reporting at network level with the ability to drill down to devices and resource types under the group. The reported metrics can be one-to-one or user-defined
metrics. Reports can range from daily to monthly to historical view.
You can perform the following actions on the Group configuration page:
Create new group by selecting group resources manually or by defining a grouping rule.
Create custom grouping rules to group and edit resources on your network to use with your network inventory, data collection, thresholding, and reporting. Groups
that are created from the custom grouping rules are called the dynamic groups.
Edit an existing group or rule.
Manage group to delete, import, export, activate, and deactivate the groups.
Validate the group.
Present the group hierarchy.
Procedure
Click Administration > General > Group configuration.
You can see the Group configuration page that has the existing Resource groupings available from the installed Technology Packs.
Searching, refreshing, and importing the Resource groups
Click the Refresh ( ) icon to display the latest set of groups.
Click the Search ( ) icon and provide a search string to filter specific group names from the table.
Click the Import ( ) icon to import Resource groups from an external JSON file.
Display the Resource type groupings.
You can see the Resource hierarchy and table that has following columns on the Group configuration page:
Columns Details
Group hierarchy It lists all the groups that are saved. It displays both activated and not activated groups. If a group is selected from the hierarchy view, the table
displays the details of that group. You can expand the group and see more details of the group in the hierarchy view.
Group name Given group name
Description Given group description
Grouping Grouping type, which can be dynamic (grouping that is created by using the grouping rule) or static (Group that is created manually by selecting
group resources).
Create time Timestamp to show when the group is created.
Update time Timestamp to show when the group is updated.
Status Status of the group, which can be Activate or Deactive.
Action You can perform the following tasks on a selected group:
Edit ( )
Delete ( )
More actions ( )
Creating a Resource type group
Click Create new and enter the following details in Create new Group page:
Table 1.
Option Details
Group name Group name accepts up to 50 character, and it allows the following characters:
Alpha-numeric
Special characters like
<
>
:
-
_
/
.
Description Description of the group can be up to 250 characters that includes white spaces.
Create From the Create section, you can select Group or Grouping rule.
194 IBM Telco Network Cloud Manager - Performance 1.4.5

Creating a Resource group
Click Group from the Create section and enter the following details:
1. From the Resource hierarchy view, select a resource type.
You can also search for a Resource type with Resource type instance ID or display name properties.
2. Select and drop the instance from the Resource hierarchy view to Resource type instance members pane to create a group.
3. Repeat the process for all other instances to form the group.
Note: You can select instances from different Resource types to form the group.
4. If you want to remove instances from the group, select the instances in the Resource type instance members pane and click the Delete ( ) icon.
5. Click Save to save the group.
6. Click Save and activate to save and activate the group.
7. Click Validate to validate the group.
A modal is displayed with the selected grouping hierarchy with a validation message.
Creating a Resource group rule
Click Grouping rule from the Create section and enter the following details:
1. Enter a sub-group name.
Optional, it is required only when internal property values based sup grouping required for resources eligible by Grouping condition.
Subgroup name provides a multi-level group definition with comma as level separator.
For example, $resource.vendor, $resource.type. Subgroup name can be empty.
2. Click Add field and select the required properties for the selected Resource type.
Grouping condition is a criterion based on which, resources are added to a group. It is the group membership criteria.
3. You can also search by a specific property name and select them.
4. Click Add.
5. Select an operator that you want to use in the grouping rule from the Operators list to create an expression.
6. Repeat step 2 through step 4 to select properties for another Resource type.
7. Click Validate to validate the group.
Important: Validation, initializing, and monitoring a grouping operation is an expensive operation, the condition must not be generic or involve many
resources to be scanned. Condition must be specific to your use case.
Helps to validate the grouping rules and provide grouping structure after initializing or activating the grouping rule in Resource management. A modal is
displayed with the selected grouping hierarchy with a validation message.
8. Click Save to save the group without initializing the grouping in inventory.
9. Click Save and activate to save the grouping rule and activate the grouping in Resource Management.
Editing a Resource group
In the Group configuration page, click the Edit ( ) icon to edit a group.
In the Update Group page, make the updates to the content as needed.
Click Validate to validate your changes and click Update
Deleting the Resource groups
In the Group configuration page, click the Delete ( ) icon to delete the group.
Activating and deactivating a group
Click the More actions ( ) icon to activate or deactivate the group.
These options are applicable to dynamic groups only.
Activate
Activate a dynamic group.
Deactivate
Deactivate a dynamic group.
Note: If you are using a dynamic group in a stream or batch job and you want to deactivate the group, make sure to delete or disable the stream or job first.
Exporting the Resource groups
Select the Resource groups that you want to export from Group configuration page to a JSON file and click Export ( ) and save the Group
configuration.json file.
Resource grouping
Resource grouping
You can create Resource type groups and Resource grouping rules.
Groups
Grouping acts like a taxonomy. The intent of grouping is to identify objects that have a common set of attribute and property values, and to organize the objects in a
common place (by creating a group membership relation) expressing the circumstance of satisfying the criteria for selection.
Grouping rules
Grouping rules are organized hierarchically. Each level in the hierarchy is intended to represent an incremental refinement in categorization. The first rule in a
grouping branch, which is called as root, typically selects a broad range of objects, for example: all active objects (that is, state = on). The next level of refinement in
IBM Telco Network Cloud Manager - Performance 1.4.5 195

a branch intended to organize technologically would perhaps have rules to discriminate by type of device. For example, router or switch. And the next level might
further classify in terms of device capacity, or capability.
A grouping rule is evaluated by the conjunction of all rule conditions that are defined along a branch in the grouping hierarchy. Group membership is granted at the
leaf level, the most precise taxonomic location, when the complete condition of a grouping rule (the aggregate of all conditions from root to leaf) is met.
Grouping rules can contain the following:
Static text
Provides another level to the tree, but does not sort or filter the results. You can create meaningful names for your rules.
Variables
Used alone, sort the results according to the variable, but do not filter the results. If you use a variable to sort according to ifSpeed, all the resources are
included in the result and are grouped according to the different ifSpeed of the resources. You can also nest variables. The results of nested variables are
sorted according to each variable.
Conditions
Use variables to filter the results. Only resources that match the condition are included in the result. A condition does not sort the results. All the resources
that match the condition are grouped. If you use a condition to filter according to: ifSpeed, only the resources that match the condition are included in the
result. Unlike with variables, all the resources that match the condition are grouped. They are not sorted according to the different ifSpeed. Conditions can
also be nested. A nested condition filters the results again. Only resources that match all the conditions are included in the result. Only the result of the
lowest level of the tree is used by the Inventory Service to create groups.
Operators and functions for grouping rules
Operators that can be used to create grouping rules.
Table 1.
Operator Description
|| Joins two conditions. Resources are included in the results if they match either condition.
&& Joins two conditions. Resources are included in the results if they match both conditions. This operator has the same effect as creating nested
conditions.
== Tests if the variable is equal to a value. Use this operator to test against only one value.
!= Tests if the variable is not equal to a value. Use this operator to test against only one value.
> Tests if the variable is greater than the value. Use this operator to test against only one value. It does a comparison based on an ASCII sort, if the value
is enclosed in double quotation marks. It does a comparison based on a numeric sort, if the value is not enclosed in double quotation marks.
>= Tests if the variable is greater than or equal to the value.
< Tests if the variable is less than the value. Use this operator to test against only one value. It does a comparison based on an ASCII sort, if the value is
enclosed in double quotation marks. It does a comparison based on a numeric sort, if the value is not enclosed in double quotation marks.
<= Tests if the variable is less than or equal to the value.
Functions Description
like('<regex expression>') Used to include resources that match partial conditional properties over resource string properties value.
For example,
resource.displayName.like('my*')
notLike('<regex expression>') Used to exclude resources that match partial conditional properties over resource string properties value.
For example,
resource.displayName.notLike('my*')
Managing site grouping
You can categorize your enterprise network based on different geographical areas by specifying the IP address ranges for each site. Site grouping helps in monitoring the
individual site bandwidth usage, usage-based billing, and accounting.
About this task
Site grouping configuration is applicable for Wireline resources only.
Procedure
Click Administration > General > Sites.
You can see the Sites page that has the configured site groupings are available.
Searching and refreshing the Sites
Click the Refresh ( ) icon to display the latest set of Sites.
Click the Search ( ) icon and provide a search string to filter specific Sites from the table.
Creating new site group
Click Create new and enter the following details in the Create new site page:
Table 1. Entering values in Create new site page
Field Details
Site name Logical name to the site. Create your site by location.
196 IBM Telco Network Cloud Manager - Performance 1.4.5

Field Details
IP address range Provide the IP address range that defines the scope of the devices for site grouping. Values in this field can be as follows:
From
10.55.239.137 to 10.55.239.140
Click the Remove the IP address range ( ) icon to delete and reenter.
Click the Add new IP address range ( ) icon to add more IP address ranges.
Click Save to save the site.
The newly created site is available in the Sites page.
Editing a site grouping
Click the Edit ( ) icon in Actions column to update an existing site.
In the Update site page, change the IP address ranges and click Update and confirm.
Click Save as to save the changes to a new site.
Deleting a site
Select a single entry or multiple entries from the table and click the ( ) icon to delete and click Confirm.
Importing and Exporting the sites
Click the Import ( ) icon to import sites from an external backup file.
This option is useful in migration scenario.
Select the items from the grid that you want to export to a JSON file and click Export ( ) and save the Sites.json file.
Managing SNMP Discovery profiles
A discovery profile is a group of discovery settings that are saved in the database that includes the IP addresses of the resources to be discovered. You can control the
discovery process. You can also specify the IP address range or subnet. You can also provide a list of IP addresses with the FQDN of the hosts to be discovered in bulk. You
can control the discovery job for the configured profiles on demand.
Before you begin
Make sure that the SNMP credentials are configured.
Procedure
Click Administration > SNMP discovery > Discovery profiles.
You can see the Discovery profiles page that has a grid with configured profiles and the following details.
Profile name
Name of the discovery profile
IP address range
IP address range that is specified in the profile.
Hostname list
Hostnames that are specified in the profile.
Discovery details
Displays the number of devices that are discovered from the profile and the time that is taken to discover them in milliseconds. Click the hyperlink to view the
SNMP Discovery Service log file. You can stop the discovery for the profile, refresh the SNMP Discovery Service log file, or export the SNMP Discovery Service
log file.
Discovery status
Displays the discovery status as Completed, Not
run, or In progress.
Failed list
If one or more devices from the discovery profile are not discovered for any reason, the Show full list link is displayed. Click the link to see the IP addresses
or the hostnames of the devices that are not discovered from the profile.
Last run
Last run date of the discovery profile. If a profile is newly created and the discovery is yet to run, this column displays the value Not run.
SNMP credential
The SNMP credential that is associated with the discovery profile.
Remote context
The remote context name is specified in the profile. Currently, it is not supported.
Enabled
Displays whether the profile is enabled or not.
IBM Telco Network Cloud Manager - Performance 1.4.5 197

Action
This column has the action icons to edit, delete, on-demand discovery (test, run, stop), and to enable or disable the discovery for the profile.
Searching and refreshing the Discover profiles
Click the Refresh ( ) icon to display the latest set of Discover profiles.
Click the Search ( ) icon and provide a search string to filter specific Discover profiles from the table.
Creating a new discovery profile and enabling it for discovery
Click Create new and enter the following details in the Create new profile page:
Table 1.
Field Details
Profile name Provide a name for the discovery profile.
Enable a profile Click the toggle button to enable or disable the profile.
Remote context Provide the same name of the remote context that you mentioned in the application.conf file to set up the remote SNMP discovery and
collection.
For more information, see Binding a remote context to a resource type instance and Multitenancy support.
SNMP credential Select an SNMP credential that is already configured for the profile and the IP address or the IP address range. You can leave it blank. If you
leave it blank, during the discovery operation, the SNMP Discovery Service searches all the available SNMP Credentials and selects the first
applicable credentials for the devices. As a best practice, always map the profile with a credential either select an existing credential or create a
new one.
Click the Create new SNMP credential ( ) icon to create a new credential for the discovery profile. Follow the steps from Managing SNMP
credentials.
Click the Update SNMP credential ( ) if you want to update credential that is associated with the profile.
Single or
multiple IP
address or
Hostname
Comma-separated list of hostnames. For example, hostname1, hostname2.
IP address
range
Provide the IP address range that defines the scope of the devices to be discovered.
Values in this field can be as follows:
IP address range
For example, 10.55.239.137-10.55.239.140
Individual IP addresses as a comma-separated list
For example, 10.55.239.31, 10.55.240.45
Combination of both
For example, 10.55.239.137-10.55.239.140,10.55.239.31
Note: IPv6 address format is supported.
Hosts file Select a hosts file from the list. Hosts files are created by using the Discovery host files page. You can add multiple hostnames to file and call
that file to discover the Resources that are available in it.
Click to create new hosts file and add the hostname.
Click icon to edit the selected hosts name file.
Note: If you use this option for discovery, the hostnames and IP addresses that are in the selected hosts file are not displayed in the grid on the
Discovery profiles page
Click Save.
The newly created profile with all its attributes is available in the Discover profiles page.
Select a single profile or multiple profiles and click the More actions ( ) icon to enable or disable the profiles.
Update an existing profile.
To update an existing profile, click the Edit icon ( ) in the Action column on the Discover profiles page.
Make the changes as needed and click Update.
The changes are written to the selected profile.
Click Save as to save the changes to a new discovery profile.
Deleting Discover profiles
Select a single entry or multiple entries from the table and click the ( ) icon to delete and click Confirm.
On-demand discovery: Test the discovery.
To test the discovery for an existing discovery profile, click the Test discovery icon ( ).
It runs the discovery in Test mode. The following message is seen whether the discovery job is submitted to the SNMP Discovery Service:
198 IBM Telco Network Cloud Manager - Performance 1.4.5

Successfully submitted test discovery profile job for <profile_name> to discovery service.
Click Check logs to see the SNMP Discovery Service log file.
You can stop the discovery for the profile, refresh the SNMP Discovery Service log file, or export the SNMP Discovery Service log file to a text file with the file name
as <current_date>-<profile_name>-<current_timestamp>.
For example, 04202022-profile1-134408.txt.
On-demand discovery: Run the discovery.
To run the discovery for a profile, click the Run discovery icon ( ).
It runs the discovery in Live mode. The following message is seen whether the discovery job is submitted to the SNMP Discovery Service:
Successfully submitted discovery profile job for <profile_name> to discovery service.
Click Check logs to see the SNMP Discovery Service log file.
You can stop the discovery for the profile, refresh the SNMP Discovery Service log file, or export the SNMP Discovery Service log file.
On-demand discovery: Stop the discovery.
To stop the discovery for a profile, click the Stop discovery icon ( ), and then click Confirm.
After the discovery is started and you try to stop it, the Discovery details column shows the status as Partially discovered 3/4 in <time> ms. It continues
to discover all the devices in the profile but stops sending them to the Inventory Service. You can see the following message in SNMP Discovery Service log file:
Reconcile cancelled for <IP address>:161
Importing and exporting the profiles
Click the Import ( ) icon to import profiles from an external backup file.
This option is useful in a migration scenario.
Select the items from the grid that you want to export to a JSON file and click Export ( ) and save the Discover profiles.json file.
After the JSON files are imported, the following parameter values are set to default values:
Discovery status: Not run
Failed list: None
Last run: Not run
Managing files with hostnames for SNMP discovery
Use this configuration page to create a hosts name file that contains multiple hostnames with a specific format. You can then use the file in the SNMP Discovery
profiles page for bulk discovery of Resources.
Managing files with hostnames for SNMP discovery
Use this configuration page to create a hosts name file that contains multiple hostnames with a specific format. You can then use the file in the SNMP Discovery profiles
page for bulk discovery of Resources.
About this task
You can use the Discovery host files page to create hosts files that contain a list of IP Addresses and the hostname for the Resources to be discovered in your network.
These files are used as input to the Discovery profiles page to set the discovery.
Procedure
1. Click Administration > SNMP discovery > Discovery host files.
You can see the Discovery host files page that has a grid with host file details.
Searching and refreshing the Discover host files
2. Click the Refresh ( ) icon to display the latest set of files.
3. Click the Search ( ) icon and provide a search string to filter specific files from the table.
Creating a new host names file
4. Click Create new and enter the following details in the Create new host file page:
Host file name
Host file name must contain Alpha-numeric characters and underscore special character. Name must start with an alphabet.
Content
The hostname entries must be in the following format:
<IP Address1><whitespace><Hostname1>
<IP Address2><whitespace><Hostname2>
<IP Address3><white space><Hostname3>
Note: Make sure that you do not inadvertently insert a duplicate entry to prevent duplicate discovery of the same host.
5. Click Save.
IBM Telco Network Cloud Manager - Performance 1.4.5 199

Importing the host files
6. Click the Import ( ) icon to import files from an external backup file.
This option is useful in a migration scenario.
Note: Only text file formats are supported.
Related tasks
Managing SNMP Discovery profiles
Managing SNMP credentials
You can configure the SNMP credentials for all SNMP-enabled devices in your network to send the data to Telco Network Cloud Manager - Performance system. This
information is stored in database.
Procedure
1. Click Administration > SNMP discovery > SNMP credentials.
You can see the SNMP credentials page that has a grid with configured credentials and their details.
Searching and refreshing the SNMP credentials
2. Click the Refresh ( ) icon to display the latest set of SNMP credentials.
3. Click the Search ( ) icon and provide a search string to filter specific SNMP credentials from the table.
Creating new SNMP credential
4. Click Create new and enter the following details in the Create new SNMP credential page:
Table 1. Entering values in Create new SNMP credential
Field Details
Credential name Provide a name to the SNMP Credential.
SNMP Version Specify the SNMP version that is associated with this SNMP configuration. Make sure to select the version that is supported on the device.
SNMP versions are as follows:
V1
Basic version of SNMP. This version is supported by most devices and simple to set up. It has limited security.
V2
Supports 64-bit counters to monitor the bandwidth usage of networks high volumes of data. It has limited security.
V3
Supports authentication and encryption of the credentials for multiple users. Highly secure version.
SNMP Port Specify the needed port. By default, it is 161.
Read
Community
Specify the name of the SNMP read community. It is used to retrieve the information from a device in read-only mode. SNMP community string
is like the user ID or password and is needed for SNMP V1 and V2 versions only. SNMP V3 version uses username and password credentials
with encryption key.
By default, the SNMP community strings for SNMP V1 and V2 versions are set to Public. You can change all the community strings to customized
values in this field.
Retries Specify how many times you want the SNMP helper and polling operations to attempt to access a device.
TimeOut(ms) Specify the time in milliseconds to wait for a reply from SNMP request before the timeout.
Auth (Applicable for SNMP V3) pane
Context name An SNMP context defines a collection of management information that is accessible to an SNMP entity. Each context in a management domain
has a unique identifier. The Context Name field is optional and depends on the user.
Security name Security Name is used when access control is set up.
Level Specify the needed level of authentication and privacy. The following levels are available:
noAuthNoPriv
Select this option for SNMP communities that have no authentication or private key. In this case, you do not need to specify any
passwords. Then, specify the Context Name and Security Name.
AuthNoPriv
Select this option for SNMP communities that have an authentication key but no private key. Then, specify values in the Auth Type,
Context Name, Security Name, and Auth Password fields.
Note: The minimum length of the Auth Password must be eight characters and provide the same password that is set on the device.
AuthPriv
Select this option for SNMP communities that have both an authentication and a private key. Then, specify values in the Auth type, Priv
type, Priv password, Context name, Security name, Auth password, Priv password fields.
Note: The minimum length of the Priv password must be eight characters and provide the same password that is set on the device.
Auth type This field is applicable if the level is AuthNoPriv and AuthPriv to specify the type of encryption for the authentication password. The following
types of encryption are available:
SHA1
MD5
200 IBM Telco Network Cloud Manager - Performance 1.4.5

Field Details
Auth password Auth password
Priv type This field is applicable if the level is authPriv to specify the type of encryption for the privacy password. The following types of encryption are
available:
DES
AES128
AES192
AES256
Priv password Privacy password. It must be same as the device privacy password.
Note: The minimum length of the Priv password must be eight characters.
5. Click Save.
The newly created credential with all its attributes is available in the SNMP credentials page.
Editing a credential
6. To update an existing credential, click the Edit icon ( ) in the Action column on and edit the details in the Edit SNMP credential page.
7. Make the changes as needed and click Update.
The changes are written to the selected profile.
8. Click Save as to save the changes to a new credential.
Deleting credentials
9. Select a single entry or multiple entries from the table and click the ( ) icon to delete and click Confirm.
Importing and exporting the credentials
10. Click the Import ( ) icon to import SNMP credentials from an external backup file.
This option is useful in migration scenario.
11. Select the items from the grid that you want to export to a JSON file and click Export ( ) and save the SNMP credentials.json file.
Managing SD-WAN controller profile
Configuring SD-WAN controller profile helps you to save the SD-WAN controller link with a name and access it directly if needed. The SD-WAN controller profile page can
also be accessed from the SD-WAN health overview dashboard.
About this task
The SD-WAN controller profile is available only after the Cisco SD-WAN Technology Pack is installed.
Procedure
To access the SD-WAN controller profile page, click Administration > SD-WAN > SD-WAN controller profiles.
You can also access this page from the SD-WAN health overview dashboard.
Searching and refreshing the profile names
Click the Refresh ( ) icon to display the latest set of controller profiles.
Click the Search ( ) icon and provide a search string to filter specific profile names from the table.
Add a controller profile.
Click Create new and provide the following values in the Create new profile page:
Profile name
Give a name to the profile. You can give a name to identify the vendor. Currently, Cisco SD-WAN is supported. For example, Cisco-profile.
URL
Provide the URL of the Cisco SD-WAN vManage dashboards that you have access to.
Note: It provides the ability to launch this link as an external page on browser.
Click Save.
Editing a profile
Click the Edit ( ) icon in Actions column to update an existing profile.
In the Update SD-WAN profile page, change the values and click Update.
Delete a profile.
Select a single entry or multiple entries from the table and click the ( ) icon to delete and click Confirm.
This option helps you to delete an entry that has a typographical error.
1. Delete any entry that is no longer needed.
IBM Telco Network Cloud Manager - Performance 1.4.5 201

2. Delete a wrong entry and create a new entry.
Importing and exporting the profiles
Click the Import ( ) icon to import profiles from an external backup file.
This option is useful in migration scenario.
Select the items from the grid that you want to export to a JSON file and click Export ( ) and save the SD-WAN controller profiles.json file.
Data availability and reporting
Data availability or data coverage describes the completeness of data for processing in Telco Network Cloud Manager - Performance.
Telco Network Cloud Manager - Performance system includes the data availability feature to facilitate that the system is loading data.
You might want to see overall data loading performance at a high level for a few key blocks or data sources. When missing data is noticed at summary level reports, you
can drill down to the lower-level resource instances.
Monitoring of data availability is concentrated on key resource types and metric groups, which are being used for reporting.
If the data is loaded for a period, then summary runs regardless of the amount of data. Often, the data that is collected for a particular period is reused multiple times, for
example, a whole days, weeks or month's worth of data. Performance data that is aggregated over predefined time intervals (raw, hour, day) is stored in the database for
later use as normal KPIs. The aggregated data is called the summary data.
Terminology used in this section:
KPI indicates the raw counters
A metric indicates the formulas that are created based on KPIs.
Monitoring data ingestion health for performance data coverage
The Data collection overview report from data ingestion health section helps to analyze and monitor the summarized data availability. You can drill down from the
summary-level data coverage to detailed level KPI group coverage and identifying the missing Resources in the KPI group. Currently, only daily summaries of
performance data coverage are supported.
Monitoring data ingestion health for priority metric group coverage
The Priority metric group overview report from NiFi ingestion health section helps to analyze and monitor the data availability percentage of the metric groups in the
installed Technology packs. You can drill down to see the metric coverage and KPIs that are associated with the metrics. You can see the missing KPIs and the
Resources.
Monitoring data ingestion health for performance data coverage
The Data collection overview report from data ingestion health section helps to analyze and monitor the summarized data availability. You can drill down from the
summary-level data coverage to detailed level KPI group coverage and identifying the missing Resources in the KPI group. Currently, only daily summaries of performance
data coverage are supported.
Sometimes, you might notice a delay in sending the network performance data from NiFi nodes to Kafka. Incomplete data availability is seen in the following scenarios:
Total data loss in some periods at source
Late data at source
Dropped data at source
Data loss in transit to NiFi or File Collector Services
To help in these scenarios, data ingestion health reports are created in Telco Network Cloud Manager - Performance. You can monitor the following from these reports:
Status of the data availability as daily summaries.
KPI group coverage overview at a specific granularity period
KPI group coverage details report displays the KPIs in the group and data coverage for the KPIs.
Missing Resource types from the KPI group.
Data collection overview: Daily summary
Access and use the Data collection overview: Daily summary report.
Click Administration > NiFi ingestion health > Data collection overview.
You can see the following information on the report:
Select Date is to select a specific date to view the data availability as daily summaries of one hour granularity. You can see 24 data points from 0 to 23.
Data source is displayed from the installed Technology Pack. If you installed multiple packs, you can see multiple datasources.
Resource count (max) that displays the total number of Resource instances for the day.
Data availability percentage indicates color-coded representation of data in hourly granularity.
A legend that is displayed at the end of the report is represented in the following colors:
Green indicates the High data availability=100%
Yellow indicates the Intermediate data availability <100%
Red indicates Low data availability=0%
202 IBM Telco Network Cloud Manager - Performance 1.4.5

KPI group overview
Click any specific granularity hour in the Data availability percentage section to drill down to the KPI group overview report for that hour. You can see the following
information:
Data source that is associated with the selected Technology Pack.
Selected date is the date on which the data availability is monitored.
Selected hour is the granularity period that is selected to drill down to the KPI group overview report.
KPI group is the group that is associated with the data source.
Resource count is the total number of Resource instances for the selected hour.
Data availability percentage indicates color-coded representation of data in 5 min granularity for the selected hour. Based on the granularity period, the number of
data points is determined.
A legend that is displayed at the end of the report is represented in the following colors:
Green indicates the High data availability=100%
Yellow indicates the Intermediate data availability <100%
Red indicates Low data availability=0%
Gray indicates that no data is produced during that period.
KPI group detail chart
Click any specific granularity period in the Data availability percentage section of the KPI group overview to drill down to the KPI group detail chart for that period. You can
see the following information:
Data source that is associated with the selected granularity.
KPI group that is associated with the data source.
IBM Telco Network Cloud Manager - Performance 1.4.5 203

Selected date is the date on which the data availability is monitored.
KPI column displays the KPI IDs that are associated with the KPI group.
Resource type that is associated with each KPI in the group.
Resource count is the total number of Resource instances for the selected time.
Data availability percentage indicates color-coded representation of data in hourly granularity.
A legend that is displayed at the end of the report is represented in the following colors:
Green indicates the High data availability=100%
Yellow indicates the Intermediate data availability <100%
Red indicates Low data availability=0%
KPI group detail chart: Missing resources
Click any specific granularity period in the Data availability percentage section of the KPI group detail chart to drill down to the KPI group detail chart: Missing resources
for that period. You can see the following information:
Data source that is associated with the selected granularity.
KPI group that is associated with the data source.
KPI
Selected date is the date on which the data availability is monitored.
Interval is the granularity period that is selected from the KPI group overview that can be seen in the Data availability percentage column in the KPI group detail
chart.
KPI column displays the KPI IDs that are associated with the KPI group.
Resource id that is associated with each KPI in the group.
Resource type that is associated with each KPI in the group.
Click Export to export all the data
204 IBM Telco Network Cloud Manager - Performance 1.4.5

Monitoring data ingestion health for priority metric group coverage
The Priority metric group overview report from NiFi ingestion health section helps to analyze and monitor the data availability percentage of the metric groups in the
installed Technology packs. You can drill down to see the metric coverage and KPIs that are associated with the metrics. You can see the missing KPIs and the Resources.
Priority metric group overview: Daily summary
Access and use the Priority metric group overview: Daily summary report.
Click Administration > NiFi ingestion health > Priority metric group coverage.
You can see the following information on the report:
Select Date is to select a specific date to view the data availability as daily summaries of one hour granularity. You can see 24 data points from 0 to 23.
Priority metric group column displays the metric groups that are available from the installed Technology Packs.
Resource count (max) that displays the total number of Resource instances.
Data availability percentage indicates color-coded representation of data in hourly granularity.
A legend that is displayed at the end of the report is represented in the following colors:
Green indicates the High data availability=100%
Yellow indicates the Intermediate data availability <100%
Red indicates Low data availability=0%
Priority metric group
Click any specific granularity hour in the Data availability percentage section to drill down to the Priority metric group report for that hour. You can see the following
information:
Metric group is the group that is associated with the installed Technology Pack and that is associated with the selected for the drill-down dashboard.
Selected date is the date on which the data availability is monitored.
Selected hour is the granularity period that is selected to drill down to the Priority metric group report.
Metric column displays the metric names that are associated with the metric group.
Resource count is the maximum number of Resource types for the selected hour.
Data availability percentage indicates color-coded representation of data in 5 min granularity for the selected hour. You can see 12 data points.
A legend that is displayed at the end of the report is represented in the following colors:
Green indicates the High data availability=100%
Yellow indicates the Intermediate data availability <100%
Red indicates Low data availability=0%
IBM Telco Network Cloud Manager - Performance 1.4.5 205

Priority metric detail chart: Missing Resources and KPIs
Click any specific granularity period in the Data availability percentage section of the Priority metric group report to drill down to the Priority metric detail chart: Missing
Resources and KPIs for that period. You can see the following information:
Metric group that is associated with the selected granularity from the Priority metric group chart.
Metric that is associated with the selected granularity from the Priority metric group chart.
Selected date is the date on which the data availability is monitored.
Interval
Number of missing KPIs is the total number of missing KPIs in the metric.
Resource id
Resource type that is associated with each KPI in the group.
TNCP application health monitoring
Currently, you can monitor File Collector performance with the help of these reports.
Follow these steps to access the TNCP application health monitoring reports:
Click Administration > TNCP application health > FC: Resource inventory discovery.
206 IBM Telco Network Cloud Manager - Performance 1.4.5

Click Administration > TNCP application health > FC: Ingestion health.
Click Administration > TNCP application health > FC: Metrics inserted vs ingestion.
FC: Resource inventory discovery
You can notice the Resources and Relations that are discovered in a particular cycle and the time that is taken for the discovery of these items. You can configure the time
period for each cycle. In the following example image, you can see one hour cycles.
Expand the cycle to see details of the discoveries.
FC: Ingestion health
IBM Telco Network Cloud Manager - Performance 1.4.5 207

FC: Metrics inserted vs ingestion
File Collector discovers the performance metric data from Kafka message bus and writes the data to the TimeSeries database. You might see a delay in messages that are
consumed from Kafka and the parsed records that are written to the database. Typically, the message volume from Kafka is directly proportional to the metrics used in the
formulas. A Kafka message might combine many records to a single message. File Collector parses the messages and writes them as multiple records to the Timeseries
database.
In the FC: Metrics inserted vs ingestion report, you can monitor the lag between what is consumed from Kafka and what is written to the database. The data is displayed in
15 min granularity for 24 hours. If a delay exists, the line that is shown for Written appears at the bottom of the Consumed. Hover over any data point to see the number of
messages that are written vs consumed at a specific timestamp.
Configuring integration with Watson™ AIOps Event Manager
Use this information to integrate Telco Network Cloud Manager - Performance with the Tivoli® Netcool®/OMNIbus application.
The Tivoli Netcool/OMNIbus Web GUI customizable dashboards display real-time performance information and event data.
An event contains information such as resource type, threshold configuration values, metric value, hostname, and port details. When an event is selected, some of the
data for the event is sent to Telco Network Cloud Manager - Performance, where it then builds a block of HTML content that redirects the browser to Telco Network Cloud
Manager - Performance Dashboards.
Launch-in-context is the concept of moving seamless from one product UI to another (either in a different console or in the same console or portal interface). With single
sign-on and with the target UI in position at the proper point, users can continue with their task.
208 IBM Telco Network Cloud Manager - Performance 1.4.5

Right-click an event in the Event Viewer to display the tools that are added from the alerts menu. You select the option to launch-in-context from this menu to display a
detailed Telco Network Cloud Manager - Performance report for the time period of the threshold violation.
Creating a launch-in-context tool
You can create tools that are run from right-click menus in event lists or when users click a widget. Different tool formats are supported.
Configuring launch-in-context menu
You can add tool entries to the menus, create new sub menus, and modify or delete menu items.
Related information
Configuring launch-in-context integrations with Tivoli products
Creating a launch-in-context tool
You can create tools that are run from right-click menus in event lists or when users click a widget. Different tool formats are supported.
Procedure
1. Log in to Jazz® for Service Management server as an administrator user, such as npiadmin.
Make sure that npiadmin user has the following roles that are assigned to access Tivoli® Netcool®/OMNIbus Web GUI:
ncw_admin
ncw_user
netcool_rw
2. Select Administration > Event Management Tools > Tool Configuration from the left pane.
3. Click Create Tool and enter the following details:
Option Description
Name Provide the Telco Network Cloud Manager - Performance launch-in-context script name.
For example, Launch_to_TNCP.
Type Select Script.
Script
Commands
Copy and paste the contents of the file launch-tool.js. The script is available in the advanced bundle M0H7JEN.tar.gz in
<DIST_DIR>/tools/omnibus folder path.
4. Select the data source name OMNIBUS.
5. Clear the Execute for each selected row checkbox.
6. Click Save.
A confirmation message is displayed. Click OK to close the message.
Related information
Tools overview
Configuring launch-in-context menu
You can add tool entries to the menus, create new sub menus, and modify or delete menu items.
About this task
The two supplied menus are the alerts menu and the tools menu. The alerts menu can also be opened from the right-click menu when you select an event.
Procedure
1. Log in to Jazz® for Service Management server as npiadmin user.
Make sure that npiadmin user has the following roles that are assigned to access Tivoli® Netcool®/OMNIbus Web GUI:
ncw_admin
ncw_user
netcool_rw
2. Select Administration > Event Management Tools > Menu Configuration from the left pane.
3. Select the alerts menu in the window, and then click Modify.
The Menus Editor is displayed.
4. Move the newly created launch-in-context tool from the Available items to the Current items.
a. Select the launch-in-context tool name, launch-tool in the Available items on the left, click the arrow to move it to the Current items section.
b. Select launch-tool from the Current items section and click Rename.
c. In the Label text box, enter a meaningful name for the new launch-in-context menu.
For example, Launch_to_TNCP.
d. Click Save.
5. Use the options on the right to move the menu option up or down.
Separators might also be added by selecting <Separator> in the Available Items area of the window. The separator might be moved up and down.
6. Click Save.
The following message is displayed:
IBM Telco Network Cloud Manager - Performance 1.4.5 209

Menu has been successfully modified.
7. Click OK to close the message.
Results
When you right-click an event in Event Viewer, you can see the launch-in-context tool name as a selectable option in the menu. Select the tool to see the report in Telco
Network Cloud Manager - Performance Dashboards, which is associated with the interface that violated the threshold and generated the event.
Additional configuration settings
Use this information to perform some additional configuration settings in your Telco Network Cloud Manager - Performance environment. Use these settings as applicable
for your specific installation scenario.
Enabling geo-redundancy
Geographic redundancy ensures uninterrupted communications in your clusters with geographically separated cluster deployments. When you have geographically
separated data centers, it is a safeguard that is known as geographical redundancy. This approach provides business continuity and resiliency against catastrophic
events and natural disasters. In Telco Network Cloud Manager - Performance, geo-redundancy is used to replicate the system configuration data.
Mapping the device IP address to the exporter IP address for flow data
Use the information to map the device IP address to the exporter IP address for flow data. The mapped IP address is used by the Flow Collector as the exporter IP
address and provision it as a Flow device in the inventory.
Multitenancy support
Telco Network Cloud Manager - Performance can be configured to support multitenancy.
Configuring retention period for timeseries data
Use the information to configure the retention period for timeseries data and the historical data in DiamondDB. The configured retention period for a metric is
applicable at the time of ingestion. When a record is loaded with retention period of 30 days, it is purged after 30 days based on its timestamp. If you change the
retention period after the ingestion, it does not take effect on the loaded record. It is applicable for new record only.
Configuring logging
The default logging level and log file retention can be set from the Common Config Map.
Configuring the retention period for batch job history
Use the information to configure the retention period for batch job run history.
Configuring the retention period for audit trail history data
Use this information to configure the retention period for audit trail history information. All the data is stored in PostgreSQL database that is available as a separate
service in Telco Network Cloud Manager - Performance. Information from the database is also displayed in the Resource type instance history window on the
Resource management configuration page.
Supporting multibyte (non-ASCII) characters in Telco Network Cloud Manager - Performance Dashboards
You can display some of the device properties in multibyte characters in both dashboards and system configuration pages. For example, you can display Resource
types in non-ASCII characters in the display name. The SNMP Discovery Service is modified to support this feature. Currently, this feature is supported for SNMP
discovery only.
Configuring time zone support for Batch Analytics
Batch Analytics Service supports time zone configuration. Use this information to configure it.
Updating the manager value in annotations section of YAML file
Annotations are metadata that you define and add yourself. Annotations can be added to Kubernetes resources during their creation or modified later as needed.
Enabling geo-redundancy
Geographic redundancy ensures uninterrupted communications in your clusters with geographically separated cluster deployments. When you have geographically
separated data centers, it is a safeguard that is known as geographical redundancy. This approach provides business continuity and resiliency against catastrophic events
and natural disasters. In Telco Network Cloud Manager - Performance, geo-redundancy is used to replicate the system configuration data.
Cluster setup
Currently, you can set up Geo-redundancy for Postgres Services in your OpenShift® Container Platform clusters. Most of the configuration data is stored in the PostgreSQL
database in Telco Network Cloud Manager - Performance.
You have the symmetric-ds container in the postgres Pod that is used to set up the Geo-redundancy in Telco Network Cloud Manager - Performance.
Consider the following scenario, you have two separate clusters in two different locations. One cluster acts as primary and the other as standby. For example,
Primary cluster is tncp.apps.primarycluster1.example.com.
Secondary cluster is tncp.apps.secondarycluster2.example.com.
Enable geo-redundancy for the Postgres Service in your clusters
You can configure the geo-redundancy clusters in two ways.
During Telco Network Cloud Manager - Performance instance creation from OLM UI. See Installing the Operator.
When you create the Telco Network Cloud Manager - Performance instance, you must define the primary cluster and standby clusters.
After the installation of Telco Network Cloud Manager - Performance.
You can create and apply a Custom Resource Definition to define the primary and standby clusters.
210 IBM Telco Network Cloud Manager - Performance 1.4.5

Follow these steps if you have not configured the servers for geo-redundancy at the time of instance creation.
1. Check that the symmetric-ds Pod is in ready state.
a. Log in to your OpenShift Container Platform web console on your primary cluster.
b. Click Workloads > Pods > postgres-0 > Logs.
c. Select symmetric-ds from the list.
You can see Waiting for valid symmetric URL in CR messages in the log.
2. Create and apply the Geo-redundancy configuration as a YAML file.
Note: This step is required if you have not configured the Geo-redundancy in the Custom Resource Definition. You want to configure it after the installation of Telco
Network Cloud Manager - Performance.
On the primary cluster, run the following commands:
a. Apply the Custom Resource Definition to define the geo-redundancy clusters.
cat <<EOF |oc apply -f -
apiVersion: tncp.ibm.com/v1
kind: TNCP
metadata:
name: tncp
namespace: <project>
spec:
license:
accept: true
storageClassName: csi-cephfs
redundancy:
cluster: symmetric-registration-tncp.apps.primarycluster1.example.com
clusters:
- symmetric-registration-tncp.apps.primarycluster1.example.com
- standby-sync-tncp.apps.secondarycluster2.example.com
Note: The values in cluster and clusters are defined in the custom resource definition in the custom resource definition of the Telco Network Cloud Manager -
Performance instance.
On the secondary cluster, run the following commands:
a. Apply the Geo-redundancy configuration.
cat <<EOF |oc apply -f -
apiVersion: tncp.ibm.com/v1
kind: TNCP
metadata:
name: tncp
namespace: tncp
spec:
license:
accept: true
storageClassName: csi-cephfs
redundancy:
cluster: standby-sync-tncp.apps.secondarycluster2.example.com
clusters:
- symmetric-registration-tncp.apps.primarycluster1.example.com
- standby-sync-tncp.apps.secondarycluster2.example.com
3. Delete the postgres Stateful Set on both the clusters.
4. Restart the Operator Pod on both the clusters. The postgres Stateful Set is recreated.
Verify the geo-redundancy setup
These steps are applicable for both ways of setting up geo-redundancy. On the primary cluster, do the following tasks:
Log in to your OpenShift Container Platform web console in your primary cluster.
Click Workloads > Pods > postgres-0 .
Select symmetric-ds from the list and click the Terminal tab.
Go to /opt/symmetric-ds/engines/ directory.
Open the tncp-<random_value>.properties file. You can see that only the sync.url parameter is updated with symmetric-registration-
tncp.apps.primarycluster1.example.com value.
On the secondary cluster, do the following tasks:
Log in to your OpenShift Container Platform web console in your secondary cluster.
Click Workloads > Pods > postgres-0 .
Select symmetric-ds from the list and click the Terminal tab.
Go to /opt/symmetric-ds/engines/ directory.
Open the tncp-<random_value>.properties file.
You can see that the sync.url is updated with standby-sync-tncp.apps.secondarycluster2.example.com value.
You can see that the registration.url is updated with symmetric-registration-tncp.apps.primarycluster1.example.com value.
registration.url When an unregistered node starts up in a cluster, it attempts to register with the node specified by the registration URL, which is the primary
node. The primary node centrally controls nodes on the network by allowing registration and returning configuration to a node after it is registered.
sync.url is an end point that is used by other nodes in the replication cluster to communicate with the node. This end point is used to share data related to
agent configuration and Telco Network Cloud Manager - Performance application configuration that is stored in PostgreSQL database.
Make sure you see the following log messages in the symmetric-ds container log file from both your primary and stand-by nodes:
Creating SYM trigger <trigger_name>
Creating SYM ............
Creating SYM ............
Creating SYM ............
Done synchronizing triggers
Successfully registered node
IBM Telco Network Cloud Manager - Performance 1.4.5 211

Next steps
Restart all the services that are associated with system configuration pages. See Accessing system configuration pages.
Observe the changes made to any configuration page on the primary cluster is reflected in the secondary cluster as well. Also, the change is logged in the
symmetric-ds Pod logs. It is a two-way replication. Configuration changes that are made in the secondary cluster like create, edit, and delete are replicated in the
primary cluster. The same information is reflected on the respective system configuration UI on page refresh.
Mapping the device IP address to the exporter IP address for flow data
Use the information to map the device IP address to the exporter IP address for flow data. The mapped IP address is used by the Flow Collector as the exporter IP
address and provision it as a Flow device in the inventory.
About this task
You can create a new CSV file and add mapping information or edit an existing mapping file from the Flow Collector Pod in Kubernetes.
Procedure
1. Create a CSV file that contains the mapping information and save it a local directory of your choice.
For example, /tmp/export-mapping.csv.
2. Edit the export-mapping.csv file with different exporter IP address to device IP address mapping that you want in separate rows in the format <exporterIP>,
<deviceIP>.
The IP address can either be a fully qualified domain name or IP address.
For example,
10.233.220.201,10.43.12.2
10.55.239.250,10.55.239.199
10.55.239.3,10.55.239.199
3. Run the <DIST_DIR>/etc/tools/checkin.sh script to import the mapping file from the local file system to the Flow Collector Pod in Kubernetes.
cd <DIST_DIR>/etc/tools/
./checkin.sh flow-collector /tmp/export-mapping.csv /opt/basecamp/flow-collector/conf/exporter-mapping.csv
<DIST_DIR> is the folder where Telco Network Cloud Manager - Performance installation media is extracted.
4. Optional: If you want to edit the existing exporter-mapping.csv file, run the <DIST_DIR>/etc/tools/edit.sh script.
cd <DIST_DIR>/etc/tools/
./edit.sh flow-collector /opt/basecamp/flow-collector/conf/exporter-mapping.csv
The exporter-mapping.csv file opens in the vi editor.
5. Optional: If you want to export the mapping file from the Flow Collector Pod in Kubernetes to a file in your local file system, run the
<DIST_DIR>/etc/tools/checkout.sh script.
cd <DIST_DIR>/etc/tools/
./checkout.sh flow-collector /opt/basecamp/flow-collector/conf/exporter-mapping.csv /tmp/mymapping.csv
Binding a remote context to a resource type instance
Use this information to overcome the issue of overlapping IP addresses from different domains. The scope for this solution is extended to both Flow and SNMP data. It is
supported on Telco Network Cloud Manager - Performance environment that is integrated with Dashboard Application Services Hub only and not with OpenLDAP.
About this task
Consider the following scenario:
You have two customers, A, and B and these two customers have overlapping IP address ranges. For example, both have a router with IP address 156.122.10.2, how does
Telco Network Cloud Manager - Performance manage to distinguish between these two devices without any data loss. To address this issue, Remote Flow and SNMP
Collectors are introduced to provision the inventory with a remote context name that is appended to all the resource type instances.
Note: The remoteContext parameter is introduced to represent a domain.
You must configure a Remote Flow Collector and Configure Remote SNMP Collector along with Remote SNMP Discovery for each data center that represents a specific
remoteContext on Flow and SNMP-enabled devices.
Note: If a resource type switches the domain for any reason, the data for the resource type from the previous domain is not merged and you might see data loss.
212 IBM Telco Network Cloud Manager - Performance 1.4.5

The scenario for Remote Flow Collector setup for each domain in your network and configure the remote context can be represented as follows.
Flow Collector
Remote Flow
Collector
Domain A
Kafka
Remote Flow
Collector
Domain B
Kafka
Flow Collector
Resource
Management
DiamondDB
PostgreSQL Timeseries
Note: You can follow the same steps to set up each domain in your network and configure the remote context for Remote SNMP discovery and collection as well. For more
information, see Setting up remote SNMP discovery and collection.
Procedure
1. Set up Remote Flow Collector.
2. Make sure that you specify the domain name for the remote.context parameter in /conf/application.conf file.
All the resource type instances and interfaces that are related to the remoteContext have the domain name that is appended to them and stored in the database.
Note: The remote context property is non-editable on the Resource Management page so that the domain value is always taken from the remote.context.
3. If you want to restrict the visibility of resource type instances that belong to specific domains to specific users only, follow these steps:
Visualizing resource type instances that belong to specific domains for specific users only in OpenShift® Container Platform environment.
a. Optional: Create and use domain-specific LDAP user to visualize specific resource types.
Use this step only if you are using LDAP to create the users and groups. After you do this step, you can jump to the step 3.e.
b. Logging in to the reporting interface
c. Creating domain-specific non-admin users
d. Creating and granting roles in Dashboard Application Services Hub
e. Create the same users from Dashboard Designer and assign roles and groups.
See Creating the domain-specific users in Dashboard Designer.
Visualizing resource type instances that belong to specific domains for specific users only in Kubernetes environment.
a. Optional: Create and use domain-specific LDAP user to visualize specific resource types.
Use this step only if you are using LDAP to create the users and groups. After you do this step, you can jump to the step 3.e.
b. Logging in to the reporting interface
c. Create nonadmin users and specific groups.
See Creating domain-specific groups and non-admin users.
d. Grant roles to the new users from the Dashboard Application Services Hub portal.
See Granting roles to the new users.
e. Create the same users from Dashboard Designer and assign roles and groups.
See Creating the domain-specific users in Dashboard Designer.
4. Setting up domain support from Config Map.
5. Access the Telco Network Cloud Manager - Performance Dashboards as the new user.
See Accessing the Telco Network Cloud Manager - Performance.
6. Go to any dashboard, and click the Device filter to see only specific resource type instances from a specific domain that the user has access to.
Related information
Installing and setting up Remote Flow Collector
Setting up domain support from Config Map
IBM Telco Network Cloud Manager - Performance 1.4.5 213

After the installation of Telco Network Cloud Manager - Performance, the common Config Map is created. Add the settings that are needed to set up domain support to the
Config Map.
Procedure
1. Log in to Telco Network Cloud Manager - Performance cloud web console.
2.
Select tncp from Namespace pane.
If you have a stand-alone installation, the Namespace is tncp.
3.
Select <project> from Projects pane.
If you have a standalone installation, the <project> is tncp. If your Telco Network Cloud Manager - Performance is integrated with Watson™ AIOps, use noi.
4. Expand Workloads > Config Maps > common.
5. Add the following property in the common Config Map:
"resource.remoteContextSupport":"true"
6. Restart the following Services in the same order.
UI
Dashboard
Creating domain-specific groups and non-admin users
You must create domain-specific user groups and non-admin users, Assign the domain groups to the users who can access the specific dashboards.
Procedure
1. Log in to Dashboard Application Services Hub portal as smadmin user.
2. Expand Console Settings ( ) > WebSphere Administrative Console.
3. Click Launch WebSphere Administrative Console.
Create groups.
4. In the navigation pane, click Users and Groups > Manage Groups.
5. In the Manage Groups window, click Create
6. In the Group name box, enter the name of the group and append the remote context that is configured from the Remote Flow Collector and Remote SNMP Collector.
For example, use the remoteContext_<anyname> format.
7. Click Create.
Create users.
8. In the navigation pane, click Manage Users.
9. In the Manage Users window, click Create.
10. In the User ID field, type a unique name to identify the user.
This user ID is added to the user registry and used as the login account name.
Assign users to domain-specific groups.
11. Click Create.
12. Click Group Membership to add the user as a member of one or more existing groups.
13. In the Search by field, select the attribute from the list that you want to use to search for one or more users.
For example, select Group name.
14. In the Search for field, either type the string that you want to search for to limit the set of groups, or use the wildcard character (*) to search for all groups. Whether
the search is case-sensitive or case-insensitive depends on the user registry that you are using.
15. Click Search.
After the search completes, the results are displayed in two lists:
Available - the list is for groups that matched the search criteria.
Mapped To - the list is for groups that the user is already a member.
16. In the Available column, select the domain-specific user group that is created in Step 6.
Make sure to select the following groups also and click < Add:
ConsoleAdmin
ConsoleUser
ReadAdmin
WriteAdmin
dashboarduser
manager-gui
manager-jmx
manager-script
manager-status
npiadministrator
npiuser
17. Click Create.
214 IBM Telco Network Cloud Manager - Performance 1.4.5

18. Close the WebSphere Administrative Console window.
What to do next
Create the same user from Dashboard Designer. See User administration from Designer tool.
Related information
Creating users to access the visualizations
Creating domain-specific non-admin users
You must create tenant-specific users who can access the specific dashboards.
Procedure
1. Log in to Dashboard Application Services Hub portal as smadmin user.
2. Expand Console Settings ( ) > WebSphere Administrative Console.
3. Click Launch WebSphere Administrative Console.
Create users.
4. In the navigation pane, click Manage Users.
5. In the Manage Users window, click Create.
6. In the User ID field, type a unique name to identify the user.
This user ID is added to the user registry and used as the login account name.
7. Close the WebSphere Administrative Console window.
What to do next
Create and grant roles in Dashboard Application Services Hub.
Create the same user from Dashboard Designer.
Related information
Creating users to access the visualizations
Creating and granting roles in Dashboard Application Services Hub
You must create new users to access Dashboard Application Services Hub that are same as the users that you created in WebSphere Application Server. New console
users must be granted access to resources based on the role to which they are assigned. These steps are applicable for OpenShift® Container Platform alone.
Creating roles in Dashboard Application Services Hub
1. Log in to Dashboard Application Services Hub portal as icpadmin user.
2. From the upper right, click Console Settings > ( ) > Roles.
Use this Roles page to manage all console roles. You can view detailed information about the roles and create new roles. For each role, you can define the level of
access to views, pages, and widgets. The access level that you set for the role applies to all users and groups that are members of that role.
3. Click New. The General Properties panel for the new role is displayed.
4. Create all the specific groups that you created in WebSphere Application Server as roles with a specific prefix. .
For example, if you are creating the groups for IP address overlapping, use the prefix as remoteContext_. If you are creating the groups for multitenancy, use the
prefix as tenant_.
Note: Role name can use letters, numbers, white spaces, and underscores. The role name cannot start with number. The role name must be fewer than 215
characters.
5. Click Save to save your changes and return to Roles.
6. Go to User Roles and search for the specific users that you created.
7. Assign the specific group roles to the specific users.
ConsoleUser
dashboarduser
Specific user groups (Domain and tenant)
For example, if you are creating the groups for IP address overlapping, use the prefix as remoteContext_. If you are creating the groups for multitenancy, use the
prefix as tenant_.
IBM Telco Network Cloud Manager - Performance 1.4.5 215

8. Click Save.
9. Log in back as npiadmin user.
Granting roles to the new users
1. Log in to Dashboard Application Services Hub portal as icpadmin user.
2. In the navigation pane, select Console Settings > ( ) > User Roles.
3. To assign a role to a user, click Search. A list of available users is displayed.
4. Select the new user from the User ID column.
A list of available roles for the selected user is displayed on a new page.
5. Assign the specific group role that is created in Creating roles in Dashboard Application Services Hub.
6. Click Save.
What to do next
Log off from Dashboard Application Services Hub and log in again to ensure all the privileges that include admin privileges are available to the new user.
Creating and using domain-specific LDAP users
You can create an open LDAP user and groups that are specific to different network domains. Use these LDAP users to access the Resource types that belong to those
domains. You can either use your own LDAP server and the configured users or use the built-in OpenLDAP by specifying the LDAP credentials (username and password) to
log in to Telco Network Cloud Manager - Performance.
Steps to create and use domain specific LDAP users:
Create LDAP users
Create remoteContext groups
Add users to all the groups
What to do next
Create LDAP users
Follow these steps to create built-in OpenLDAP users from Telco Network Cloud Manager - Performance system:
1. Log in to your cloud platform web console.
2. Make sure you are in tncp project or namespace.
3. Click Workloads > Pods.
4. Click Security Pod and access the terminal.
5. Create LDAP users as needed.
Follow the commands to create <userA>, <userB>, and <userC>:
echo "dn: cn=<userA>,ou=people,dc=customer,dc=com
objectclass: inetOrgPerson
cn: <userA>
sn: <userA>
uid: <userA>
userPassword: <userA>
dn: cn=<userB>,ou=people,dc=customer,dc=com
objectclass: inetOrgPerson
cn: <userB>
sn: <userB>
uid: <userB>
userPassword: <userB>
dn: cn=<userC>,ou=people,dc=customer,dc=com
objectclass: inetOrgPerson
cn: <userC>
sn: <userC>
uid: <userC>
userPassword: <userC>"> /tmp/ldpusers
Note: The ldpusers input file is created and saved in /tmp folder.
6. Add the users to LDAP with this command:
ldapadd -H ldap://:1389/ -x -D "cn=admin,dc=customer,dc=com" -f /tmp/ldpusers -w admin
For more information, see Creating an LDAP user.
Create remoteContext groups
Create the groups that are needed for domain-specific groups as remoteContext_<group_name> where remoteContext represents the domain. Follow these steps:
1. Log in to your cloud platform web console.
2. Make sure you are in tncp project or namespace.
3. Click Workloads > Pods.
4. Click Security Pod and access the terminal.
5. To create a group, give the following commands:
216 IBM Telco Network Cloud Manager - Performance 1.4.5

echo "dn: cn=remoteContext_<group_name1>,ou=groups,dc=customer,dc=com
objectClass: groupOfUniqueNames
cn: remoteContext_<group_name1>
uniqueMember: cn=<userA>,ou=people,dc=customer,dc=com
dn: cn=remoteContext_<group_name2>,ou=groups,dc=customer,dc=com
objectClass: groupOfUniqueNames
cn: remoteContext_<group_name2>
uniqueMember: cn=<userB>,ou=people,dc=customer,dc=com
dn: cn=remoteContext_<group_name3>,ou=groups,dc=customer,dc=com
objectClass: groupOfUniqueNames
cn: remoteContext_<group_name3>
uniqueMember: cn= <userC>,ou=people,dc=customer,dc=com"> /tmp/ldpgroups
Note: The ldpgroups input file is created and saved in /tmp folder.
6. Create the groups with the following command:
ldapadd -H ldap://:1389/ -x -D "cn=admin,dc=customer,dc=com" -f /tmp/ldpgroups -w admin
Add users to all the groups
Add the newly created users to npiusers, dashboardusers, and remoteContext groups. Follow these steps:
1. Run the following commands in the Security Pod terminal:
echo "dn: cn=npiusers,ou=groups,dc=customer,dc=com
changetype: modify
add: uniqueMember
uniqueMember: cn=<userA>,ou=people,dc=customer,dc=com
dn: cn=npiusers,ou=groups,dc=customer,dc=com
changetype: modify
add: uniqueMember
uniqueMember: cn=<userB>,ou=people,dc=customer,dc=com
dn: cn=dashboardusers,ou=groups,dc=customer,dc=com
changetype: modify
add: uniqueMember
uniqueMember: cn=<userA>,ou=people,dc=customer,dc=com
dn: cn=dashboardusers,ou=groups,dc=customer,dc=com
changetype: modify
add: uniqueMember
uniqueMember: cn=<userB>,ou=people,dc=customer,dc=com
dn: cn=<remoteContext_group>,ou=groups,dc=customer,dc=com
changetype: modify
add: uniqueMember
uniqueMember: cn=<userC>,ou=people,dc=customer,dc=com" > /tmp/ldpuserstogroup
Note: Add the user to the <remoteContext_group> only if you have not added in the previous step.
2. Repeat the commands for all other LDAP users that are created earlier to the groups.
3. Run the following command to add the users to groups:
ldapmodify -H ldap://:1389/ -x -D "cn=admin,dc=customer,dc=com" -f /tmp/ldpuserstogroup -w admin
4. Run the following command to list all the users and groups that are created and available:
ldapsearch -H ldap://:1389/ -x -b dc=customer,dc=com -D "cn=admin,dc=customer,dc=com" -w admin
What to do next
Creating the domain-specific users in Dashboard Designer
Set up domain support from Config Map.
Restart the UI and Dashboard Services.
Creating the domain-specific users in Dashboard Designer
To access the Telco Network Cloud Manager - Performance Dashboards, create the same domain-specific users in Dashboard Designer.
Procedure
1. Log in to Dashboard Designer UI as npiadmin user.
Create a Tool Content Group by name nonadmin.
2. In the navigation pane of Dashboard Designer, click Users and Groups > Tool Content Groups.
3. Click Add Group and create a group by name nonadmin.
Create an Engine User Group by name nonadmin.
IBM Telco Network Cloud Manager - Performance 1.4.5 217

4. In the navigation pane of Dashboard Designer, click Users and Groups > Engine User Groups.
5. Click Add Group and create a group by name nonadmin.
Create all the domain-specific users and assign the nonadmin groups to them.
6. In the navigation pane of Dashboard Designer, click Users and Groups > Users.
7. Click Add User.
8. Give a domain-specific username in the User name field.
Use the same domain-specific users that you created in the Dashboard Application Services Hub portal or the LDAP users.
9. In the Tool Role pane, click System Administrator.
10. Click Assign Groups in the Tool Content Group(s) pane.
11. Select nonadmin group and click to add the Tool Content Groups and Engine User Groups to Selected User Groups pane.
12. Expand Engine Access pane and click Assign Instances and select TNCP instance and click to add the instance to Selected Engine Instances pane.
13. To enable the user to access Schedule Tasks menu on Tool Content Groups and Engine User Groups, select the Scheduler checkbox.
The user can create and manage scheduled tasks for all the dashboards that are displayed on the Engine, irrespective of the assigned User Group.
14. Click Assign Groups in the User Group(s) pane and select nonadmin and click to add the group to Selected User Groups pane.
15. Click Save to see the user in the Users page.
Multitenancy support
Telco Network Cloud Manager - Performance can be configured to support multitenancy.
Multitenancy is a reference to the mode of operation of software where multiple independent instances of one or multiple applications operate in a shared environment.
The instances (tenants) are logically isolated, but physically integrated. The degree of logical isolation must be complete, but the degree of physical integration will vary
See the following image to understand how multitenancy works in Telco Network Cloud Manager - Performance:
Related information
https://www.gartner.com/it-glossary/multitenancy
Enabling multitenancy
Multi-tenancy provides the capability to support multiple customers or organizations (tenants) by using a single deployment of an application. It ensures that each tenant
can access only the data that they are authorized to use. Such applications are called multi-tenant applications.
About this task
Multi-tenancy in Telco Network Cloud Manager - Performance is not available by default.
Important: Multi-tenancy is applicable only when Telco Network Cloud Manager - Performance is integrated with Dashboard Application Services Hub and not on the built-
in OpenLDAP. You can enable multi-tenancy on Telco Network Cloud Manager - Performance with other user repositories like LDAP and OMNIbus ObjectServer as well.
218 IBM Telco Network Cloud Manager - Performance 1.4.5

Multi-tenancy workflow covers the following tasks:
Map the resource type instances
with tenants
Resource
Management
Service
Administrator
Dashboard
User
User
Repository
UI Service
Timeseries
Service
Create and map
tenant roles/groups
to users
REST API request
Fetches
specific resource type
instances
Procedure
Enabling multitenancy in OpenShift® Container Platform
Setting up multitenancy from Config Map.
UI Service extracts the tenant roles for the logged in user and displays the resource type instances that are associated with the tenant.
Optional: Create and use tenant-specific LDAP users
Use this step only if you are using LDAP to create the users and groups. After you do this step, you can jump to the step Create tenant users in Dashboard designer.
Create tenant specific non-admin users. You can do the tenants allocation for resource type instances according to your use case and reporting requirements.
Create and grant roles in Dashboard Application Services Hub.
Create tenant users in Dashboard designer
Add the nonadmin group to the dashboards in Dashboard Designer
Enrich the resource type instances in inventory with a specific tenant value for the tenant property.
Note: Make sure that the tenant that you are adding is already created. Tenants enable the administrators of your environment to limit access to assets and data
items to specified users in one or more user groups. Users can access assets and data items that are associated with their own tenants.
Resource type instances can have multiple tenant values that are associated with them. Tenant enrichment can be done by either the Resource Management page.
See Enriching the resource type instances with tenants from the Resource Management page.
Note: The tenant configuration is irrelevant in the context of any rollup aggregations and metrics calculations.
Enabling multitenancy in Kubernetes cloud platform
Setting up multitenancy from Config Map.
UI Service extracts the tenant roles for the logged in user and displays the resource type instances that are associated with the tenant.
Optional: Create and use tenant-specific LDAP users
Use this step only if you are using LDAP to create the users and groups. After you do this step, you can jump to the step Creating the tenant users in Dashboard
Designer.
Create tenant-specific groups and non-admin users
Create tenant users in Dashboard designer
Add the nonadmin group to the dashboards in Dashboard Designer
Enrich the resource type instances in inventory with a specific tenant value for the tenant property.
Note: Make sure that the tenant that you are adding is already created. Tenants enable the administrators of your environment to limit access to assets and data
items to specified users in one or more user groups. Users can access assets and data items that are associated with their own tenants.
Resource type instances can have multiple tenant values that are associated with them. Tenant enrichment can be done by either the Resource Management page.
See Enriching the resource type instances with tenants from the Resource Management page.
Note: The tenant configuration is irrelevant in the context of any rollup aggregations and metrics calculations.
What to do next
1. Log in to the Telco Network Cloud Manager - Performance Dashboards as a tenant user..
2. Access the Metric viewer dashboard.
Only those resource types and instances that the logged in user has access to are visible.
Note: The user is assigned with a specific tenant group and the same tenant is also assigned to the resource type in the Resource Management page.
Important: Currently, multitenancy is not applicable for QoS and ATR resource types on the Flow dashboards. But it is applicable for the Metric viewer dashboard.
Related tasks
Managing Resource types
IBM Telco Network Cloud Manager - Performance 1.4.5 219

Setting up multitenancy from Config Map
After the installation of Telco Network Cloud Manager - Performance, the common Config Map is created. Add the settings that are needed to set up multitenancy to the
Config Map.
Procedure
1. Log in to Telco Network Cloud Manager - Performance cloud web console.
2.
Select tncp from Namespace pane.
3.
Select tncp from Projects pane.
4.
Expand Workloads > Config Maps > common in the Config and Storage pane in the navigation pane.
5. Expand Workloads > Config Maps > common.
6. Add the following property in the common Config Map:
"resource.multiTenancy": "true",
7. Restart the following services in the same order.
UI
Dashboard
Creating tenant-specific non-admin users
You must create tenant-specific users who can access the specific dashboards.
Procedure
1. Log in to Dashboard Application Services Hub portal as smadmin user.
2. Expand Console Settings ( ) > WebSphere Administrative Console.
3. Click Launch WebSphere Administrative Console.
Create users.
4. In the navigation pane, click Manage Users.
5. In the Manage Users window, click Create.
6. In the User ID field, type a unique name to identify the user.
This user ID is added to the user registry and used as the login account name.
For easy distinction, use the user<anyname> format. Here, <anyname> is the same name that is used in the tenant group without the word tenant. For example,
userMY.
7. Close the WebSphere Administrative Console window.
What to do next
Create and grant roles in Dashboard Application Services Hub.
Create the same user from Dashboard Designer.
Related information
Creating users to access the visualizations
Creating and granting roles in Dashboard Application Services Hub
You must create new users to access Dashboard Application Services Hub that are same as the users that you created in WebSphere Application Server. New console
users must be granted access to resources based on the role to which they are assigned. These steps are applicable for OpenShift® Container Platform alone.
Creating roles in Dashboard Application Services Hub
1. Log in to Dashboard Application Services Hub portal as icpadmin user.
220 IBM Telco Network Cloud Manager - Performance 1.4.5

2. From the upper right, click Console Settings > ( ) > Roles.
Use this Roles page to manage all console roles. You can view detailed information about the roles and create new roles. For each role, you can define the level of
access to views, pages, and widgets. The access level that you set for the role applies to all users and groups that are members of that role.
3. Click New. The General Properties panel for the new role is displayed.
4. Create all the specific groups that you created in WebSphere Application Server as roles with a specific prefix. .
For example, if you are creating the groups for IP address overlapping, use the prefix as remoteContext_. If you are creating the groups for multitenancy, use the
prefix as tenant_.
Note: Role name can use letters, numbers, white spaces, and underscores. The role name cannot start with number. The role name must be fewer than 215
characters.
5. Click Save to save your changes and return to Roles.
6. Go to User Roles and search for the specific users that you created.
7. Assign the specific group roles to the specific users.
ConsoleUser
dashboarduser
Specific user groups (Domain and tenant)
For example, if you are creating the groups for IP address overlapping, use the prefix as remoteContext_. If you are creating the groups for multitenancy, use the
prefix as tenant_.
8. Click Save.
9. Log in back as npiadmin user.
Granting roles to the new users
1. Log in to Dashboard Application Services Hub portal as icpadmin user.
2. In the navigation pane, select Console Settings > ( ) > User Roles.
3. To assign a role to a user, click Search. A list of available users is displayed.
4. Select the new user from the User ID column.
A list of available roles for the selected user is displayed on a new page.
5. Assign the specific group role that is created in Creating roles in Dashboard Application Services Hub.
6. Click Save.
What to do next
Log off from Dashboard Application Services Hub and log in again to ensure all the privileges that include admin privileges are available to the new user.
Creating tenant-specific groups and non-admin users
You must create tenant-specific user groups and assign the users who can access the specific dashboards.
Procedure
1. Log in to Dashboard Application Services Hub portal as smadmin user.
2. Expand Console Settings ( ) > WebSphere Administrative Console.
3. Click Launch WebSphere Administrative Console.
Create groups.
4. In the navigation pane, click Users and Groups > Manage Groups.
5. In the Manage Groups window, click Create.
6. In the Group name box, enter the name of the group and append the domain name that is configured from the Remote Flow Collector.
You must use the tenant_<anyname> format. For example, tenant_MY.
7. Click Create.
Create users.
8. In the navigation pane, click Manage Users.
9. In the Manage Users window, click Create.
10. In the User ID field, type a unique name to identify the user.
This user ID is added to the user registry and used as the login account name.
For easy distinction, use the user<anyname> format. Here, <anyname> is the same name that is used in the tenant group without the word tenant. For example,
userMY.
11. Click Create.
Assign users to tenant-specific groups.
12. Click Group Membership to add the user as a member of one or more existing groups.
13. In the Search by field, select the attribute from the list that you want to use to search for one or more users.
For example, select Group name.
IBM Telco Network Cloud Manager - Performance 1.4.5 221

14. In the Search for field, either type the string that you want to search for to limit the set of groups, or use the wildcard character (*) to search for all groups. Whether
the search is case-sensitive or case-insensitive depends on the user registry that you are using.
15. Click Search.
After the search completes, the results are displayed in two lists:
Available - the list is for groups that matched the search criteria.
Mapped To - the list is for groups that the user is already a member.
16. In the Available column, select the domain-specific user group that is created in Step 6.
Make sure to select the following groups also and click < Add.
ConsoleUser
dashboarduser
npiuser
Tenant-specific group (tenant_MY)
17. Click Create.
18. Close the WebSphere Administrative Console window.
What to do next
Create the same user from Dashboard Designer.
Related information
Creating users to access the visualizations
Creating and using tenant-specific LDAP users
You can create an open LDAP user and groups that are specific to different network tenants. Use these LDAP users to access the Resource types that belong to those
tenants. You can either use your own LDAP server and the configured users or use the built-in OpenLDAP by specifying the LDAP credentials (username and password) to
log in to Telco Network Cloud Manager - Performance.
Steps to create and use tenant-specific LDAP users:
Create LDAP users
Create tenant groups
Add users to all the groups
What to do next
Create LDAP users
Follow these steps to create built-in OpenLDAP users from Telco Network Cloud Manager - Performance system:
1. Log in to your cloud platform web console.
2. Make sure you are in tncp project or namespace.
3. Click Workloads > Pods.
4. Click Security Pod and access the terminal.
5. Create LDAP users as needed.
Follow the commands to create <userA>, <userB>, and <userC>:
echo "dn: cn=<userA>,ou=people,dc=customer,dc=com
objectclass: inetOrgPerson
cn: <userA>
sn: <userA>
uid: <userA>
userPassword: <userA>
dn: cn=<userB>,ou=people,dc=customer,dc=com
objectclass: inetOrgPerson
cn: <userB>
sn: <userB>
uid: <userB>
userPassword: <userB>
dn: cn=<userC>,ou=people,dc=customer,dc=com
objectclass: inetOrgPerson
cn: <userC>
sn: <userC>
uid: <userC>
userPassword: <userC>"> /tmp/ldpusers
Note: The ldpusers input file is created and saved in /tmp folder.
6. Add the users to LDAP with this command:
ldapadd -H ldap://:1389/ -x -D "cn=admin,dc=customer,dc=com" -f /tmp/ldpusers -w admin
For more information, see Creating an LDAP user.
Create tenant groups
Create the groups that are needed for tenant-specific groups as tenant_<group_name> where tenant_ represents a tenant. Follow these steps:
1. Log in to your cloud platform web console.
222 IBM Telco Network Cloud Manager - Performance 1.4.5

2. Make sure you are in tncp project or namespace.
3. Click Workloads > Pods.
4. Click Security Pod and access the terminal.
5. To create a group, give the following commands:
echo "dn: cn=tenant_<group_name1>,ou=groups,dc=customer,dc=com
objectClass: groupOfUniqueNames
cn: tenant_<group_name1>
uniqueMember: cn=<userA>,ou=people,dc=customer,dc=com
dn: cn=tenant_<group_name2>,ou=groups,dc=customer,dc=com
objectClass: groupOfUniqueNames
cn: tenant_<group_name2>
uniqueMember: cn=<userB>,ou=people,dc=customer,dc=com
dn: cn=tenant_<group_name3>,ou=groups,dc=customer,dc=com
objectClass: groupOfUniqueNames
cn: tenant_<group_name3>
uniqueMember: cn= <userC>,ou=people,dc=customer,dc=com"> /tmp/ldpgroups
Note: The ldpgroups input file is created and saved in /tmp folder.
6. Create the groups with the following command:
ldapadd -H ldap://:1389/ -x -D "cn=admin,dc=customer,dc=com" -f /tmp/ldpgroups -w admin
Add users to all the groups
Add the newly created users to npiusers, dashboardusers, and tenant groups. Follow these steps:
1. Run the following commands in the Security Pod terminal:
echo "dn: cn=npiusers,ou=groups,dc=customer,dc=com
changetype: modify
add: uniqueMember
uniqueMember: cn=<userA>,ou=people,dc=customer,dc=com
dn: cn=npiusers,ou=groups,dc=customer,dc=com
changetype: modify
add: uniqueMember
uniqueMember: cn=<userB>,ou=people,dc=customer,dc=com
dn: cn=dashboardusers,ou=groups,dc=customer,dc=com
changetype: modify
add: uniqueMember
uniqueMember: cn=<userA>,ou=people,dc=customer,dc=com
dn: cn=dashboardusers,ou=groups,dc=customer,dc=com
changetype: modify
add: uniqueMember
uniqueMember: cn=<userB>,ou=people,dc=customer,dc=com
dn: cn=<tenant_group>,ou=groups,dc=customer,dc=com
changetype: modify
add: uniqueMember
uniqueMember: cn=<userC>,ou=people,dc=customer,dc=com" > /tmp/ldpuserstogroup
Note: Add the user to the <tenant_group> only if you have not added in the previous step.
2. Repeat the commands for all other LDAP users that are created earlier to the groups.
3. Run the following command to add the users to groups:
ldapmodify -H ldap://:1389/ -x -D "cn=admin,dc=customer,dc=com" -f /tmp/ldpuserstogroup -w admin
4. Run the following command to list all the users and groups that are created and available:
ldapsearch -H ldap://:1389/ -x -b dc=customer,dc=com -D "cn=admin,dc=customer,dc=com" -w admin
What to do next
Creating the tenant users in Dashboard Designer
Setting up multitenancy from Config Map
Restart the UI and Dashboard Services.
Creating the tenant users in Dashboard Designer
To access the Telco Network Cloud Manager - Performance Dashboards, create the same tenant users in Dashboard Designer.
Procedure
1. Log in to Dashboard Designer UI as npiadmin user.
Create a Tool Content Group by name nonadmin.
IBM Telco Network Cloud Manager - Performance 1.4.5 223

2. In the navigation pane of Dashboard Designer, click Users and Groups > Tool Content Groups.
3. Click Add Group and create a group by name nonadmin.
Create an Engine User Group by name nonadmin.
4. In the navigation pane of Dashboard Designer, click Users and Groups > Engine User Groups.
5. Click Add Group and create a group by name nonadmin.
Create all the tenant users and assign the nonadmin groups to them.
6. In the navigation pane of Dashboard Designer, click Users and Groups > Users.
7. Click Add User.
8. Give a tenant username in the User name field.
Use the same tenant users that you created in the Dashboard Application Services Hub portal or the LDAP users.
9. In the Tool Role pane, click the following roles:
Dashboard Developer
Publisher
Menu Administrator
10. Click Assign Groups in the Tool Content Group(s) pane.
11. Select nonadmin group and click to add the Tool Content Groups and Engine User Groups to Selected User Groups pane.
12. Expand Engine Access pane and click Assign Instances and select TNCP instance and click to add the instance to Selected Engine Instances pane.
13. To enable the user to access Schedule Tasks menu on Tool Content Groups and Engine User Groups, select the Scheduler checkbox.
The user can create and manage scheduled tasks for all the dashboards that are displayed on the Engine, irrespective of the assigned User Group.
14. Click Assign Groups in the User Group(s) pane and select nonadmin and click to add the group to Selected User Groups pane.
15. Click Save to see the user in the Users page.
What to do next
Restart the UI Service.
Adding the nonadmin group to dashboards in Dashboard Designer
Add the nonadmin group to the dashboards menus so the tenant users can access these dashboards from the menus.
Procedure
1. In the navigation pane of Dashboard Designer, click Menu Access > Home.
You can see the dashboard menus based on the installed Technology Packs in your environment in a tree structure.
2. Click the User Groups tab on the upper right of the window.
3. Drag the nonadmin user group to a dashboard node.
Note: Tenant users can view only those dashboards that have the nonadmin group that is assigned to them. It is applicable to both the built-in dashboards and the
custom dashboards.
Enriching the tenant property for resource type instances in bulk
To enable resource-level multitenancy, the managed service provider must identify the resource type instances and allocate tenant property values by considering users
need for access control and the dashboard design.
About this task
All inventory resource types have the mandatory property tenant. Default and mandatory value is base. You can assign multiple tenant values for a resource type
instances along with the base value.
You can do the enrichment in two ways, enrich from the Resource Management page or do the bulk enrichment with REST API.
Use the REST API for bulk enrichment of the tenant property with required values all in one go.
Procedure
1. Use the following command to get the authentication cookies before you run the secure REST API:
curl -k --cookie-jar cookies.txt -X POST -d
"j_username=<USERNAME>&j_password=<PASSWORD>&Login=" "https://<HOST>:<PORT>/dashboards/j_security_check"
Where,
<USERNAME>
Use the administrator username. By default, it is npiadmin
224 IBM Telco Network Cloud Manager - Performance 1.4.5

<PASSWORD>
Use the administrator password. By default, it is npiadmin.
<HOST>
Hostname of the Dashboard Service node.
<PORT>
Port number of the Dashboard Service node. By default, it is 31443.
2. Use the following command to get all the interfaces that belong to a remote domain to a JSON file (output.json).
curl --insecure --cookie ./cookies.txt
https://<HOST>:<PORT>/inventory/rest/topology/resources?type=
device | python -m json.tool > <output>.json
3. Pick needed interfaces from the output and create a JSON file.
4. Add values for the tenant property to the resource types and use the file as payload to POST command.
curl -k --cookie-jar cookies.txt -X POST -d
'{"resources":
[{"id": "10.55.239.111_interface:<1>", "index": "1","type": "interface"}], "tenant":"kl","updateBy":"user"}'
"https://<HOST>:<PORT>/inventory/rest/topology/resources/tenant"
The following code snippet shows the payload format:
{"resources": [<list of resources json with key fields only.dont include property tenant>],
"tenant":"<comma separated tenant values>",
"updateBy":"user"
}`
Json payload example :
`{"resources": [{
"id": "10.55.239.111_interface:<1>",
"index": "1",
"type": "interface"
},{
"id": "10.55.239.111_interface:<2>",
"index": "2",
"type": "interface"
}],
"tenant":"MY",
"updateBy":"user"
}
Related tasks
Enriching the Flow device and interface instances from Resource Management page
Enriching the resource type instances with tenants from the Resource Management
page
Enrich the Flow devices and interfaces with tenant property individually from the Resource Management page. This task must be repeated for every resource type and
their instances one by one.
Procedure
1. Click Administration > General > Resource Management.
You can see the Resource Management page that has the resource types available from the installed Technology Packs. You can load the resource types.
2. Click Load Resources to load all the available resource types and instances based on your selections.
3. Change the resource type from the list on the right pane to load its associated instances.
4. Click a resource type from the Resource hierarchy pane.
You can see all the available child resource types for the selected resource type in the right pane.
5. Right-click any device resource type instance and select Edit Resource type instance details.
6. Enter values for the tenant property in the Resource properties pane.
By default, all resource types have the base tenant that cannot be deleted. You can add comma-separate list of tenants that you created.
For example, base, MY, CA.
7. Click Update.
Related tasks
Creating tenant-specific groups and non-admin users
Configuring retention period for timeseries data
IBM Telco Network Cloud Manager - Performance 1.4.5 225

Use the information to configure the retention period for timeseries data and the historical data in DiamondDB. The configured retention period for a metric is applicable at
the time of ingestion. When a record is loaded with retention period of 30 days, it is purged after 30 days based on its timestamp. If you change the retention period after
the ingestion, it does not take effect on the loaded record. It is applicable for new record only.
About this task
Metric data is pre-aggregated as hour, day, month, and year and saved in the Timeseries database along with raw data. You can define the retention periods for both raw
and aggregated data. Define the retentions values for each aggregation to override the default values in the timeseries-retention ConfigMap.
You can do this task immediately after the installation of Telco Network Cloud Manager - Performance.
For raw data, update the default retention period. By default, it is 180 days. Define a value to override the default value in the timeseries-retention ConfigMap. You
can do this task immediately after the installation of Telco Network Cloud Manager - Performance.
For aggregated data, update the default retention periods for each granularity in the common ConfigMap.
Set a specific retention period for a specific metric. For example, CPU.Utilization.Percent=10.
Set a specific retention period for a metric with a regular expression (regex). Java™ regex must be used. For example, .*30min.*=30. For example,
<metric_name_regex>=<retention_in_days>.
Procedure
Follow these steps to update the timeseries-retention ConfigMap to configure the raw data retention:
Follow these steps on OpenShift® Container Platform:
Note: The timeseries-retention ConfigMap is available after the installation of Telco Network Cloud Manager - Performance is complete.
1. Make sure you are in noi project.
2. Go to Workloads > ConfigMaps > timeseries-retention.
3. Click the YAML tab.
4. In the following section, update the default value as needed:
data:
retention.conf: |
default=180
.*_smin_.*=30
.*_smax_.*=30
.*_ssum_.*=30
.*_savg_.*=30
.*day.*=365
.*hour.*=30
.*30min.*=30
.*15min.*=30
.*10min.*=30
CPU.Utilization.Percent_.*30min.*=30
5. Restart the timeseries Service.
Follow these steps on Kubernetes cloud platform:
1. Make sure you are in tncp project.
2. From the left navigation pane, select Config and Storage > Config Maps > timeseries-retention.
3. Click Edit resource > YAML.
4. In the following section, update the default value to a value of your choice:
data:
retention.conf: |
default=180
.*_smin_.*=30
.*_smax_.*=30
.*_ssum_.*=30
.*_savg_.*=30
.*day.*=365
.*hour.*=30
.*30min.*=30
.*15min.*=30
.*10min.*=30
CPU.Utilization.Percent_.*30min.*=30
5. Restart the Timeseries Service.
Follow these steps to update the common Config Map to configure the aggregated data retention:
Follow these steps on OpenShift Container Platform:
1. Make sure you are in the correct project where you installed Telco Network Cloud Manager - Performance.
For example, noi or tncp project.
2. Go to Workloads > ConfigMaps > common.
3. Click the YAML tab.
The default values are as follows:
timeseries.pre-agg.hourly.retention.period.inday= 32
timeseries.pre-agg.daily.retention.period.inmonth= 12
226 IBM Telco Network Cloud Manager - Performance 1.4.5

timeseries.pre-agg.weekly.retention.period.inyear= 1
timeseries.pre-agg.monthly.retention.period.inyear= 1
4. In the YAML section, update values as needed:
For example,
timeseries.pre-agg.hourly.retention.period.inday: '35'
timeseries.pre-agg.daily.retention.period.inmonth: '15'
timeseries.pre-agg.weekly.retention.period.inyear: '2'
timeseries.pre-agg.monthly.retention.period.inyear: '2'
Note: The granularity can be converted as follows:
HOUR = DAY
DAY = MONTH
WEEK = YEAR
MONTH = YEAR
5. Restart the Timeseries Service.
Follow these steps on Kubernetes cloud platform:
1. Make sure you are in tncp project.
2. From the left navigation pane, select Config and Storage > Config Maps > common.
3. Click the YAML tab.
The default values are as follows:
timeseries.pre-agg.hourly.retention.period.inday= 32
timeseries.pre-agg.daily.retention.period.inmonth= 12
timeseries.pre-agg.weekly.retention.period.inyear= 1
timeseries.pre-agg.monthly.retention.period.inyear= 1
4. In the YAML section, update values as needed:
For example,
timeseries.pre-agg.hourly.retention.period.inday: '35'
timeseries.pre-agg.daily.retention.period.inmonth: '15'
timeseries.pre-agg.weekly.retention.period.inyear: '2'
timeseries.pre-agg.monthly.retention.period.inyear: '2'
Note: The granularity can be converted as follows:
HOUR = DAY
DAY = MONTH
WEEK = YEAR
MONTH = YEAR
5. Restart the Timeseries Service.
Related tasks
Managing flow data retention profiles
Controlling the services
Configuring logging
The default logging level and log file retention can be set from the Common Config Map.
About this task
Procedure
1. Log in to Telco Network Cloud Manager - Performance cloud web console.
2.
Select tncp from Namespace pane.
If you have a stand-alone installation, the Namespace is tncp.
3.
Select <project> from Projects pane.
If you have a stand-alone installation, the <project> is tncp. If your Telco Network Cloud Manager - Performance is integrated with Watson™ AIOps, use noi.
4. Expand Workloads > Config Maps > common.
Setting the log level
5. Add the following property in the common Config Map:
"logging.level:"{DEBUG | INFO | WARN | ERROR | ALL | OFF}"
If you do not set any values, the default logging level is INFO. If you set the logging level as OFF, the logging is disabled.
Table 1. Log level rules for different options
Logging level DEBUG INFO WARN ERROR ALL OFF
IBM Telco Network Cloud Manager - Performance 1.4.5 227

Logging level DEBUG INFO WARN ERROR ALL OFF
DEBUG YES NO NO NO YES NO
INFO YES YES NO NO YES NO
WARN YES YES YES NO YES NO
ERROR YES YES YES YES YES NO
OFF NO NO NO NO NO YES
Setting the retention period for log files
6. To specify the retention period for the historical log files, add the following property in the common Config Map:
The setting comes into effect from the start of the day and not with immediate effect.
"logging.history":"nn"
Note:
The default value is 10. This setting determines how many days these log files are maintained in the /<service>/logs directory.
For example,
sh-4.4$ pwd
/opt/basecamp/analytics
sh-4.4$ ls
bin conf lib logs resources work
sh-4.4$ cd logs
sh-4.4$ pwd
/opt/basecamp/analytics/logs
sh-4.4$ ls
basecamp-analytics_batch-16-06-2023.0.log.gz basecamp-analytics_batch-20-06-2023.0.log.gz
basecamp-analytics_batch-17-06-2023.0.log.gz basecamp-analytics_batch-21-06-2023.0.log.gz
basecamp-analytics_batch-18-06-2023.0.log.gz basecamp-analytics_batch-22-06-2023.0.log.gz
basecamp-analytics_batch-19-06-2023.0.log.gz basecamp-analytics_batch.log
What to do next
Restart the following services:
App
DNS Collector
File Collector
Flow Collector
Ping Collector
SNMP Collector
SNMP Discovery
Timeseries
Inventory
Analytics
Flow Analytics
Threshold
Configuring the retention period for batch job history
Use the information to configure the retention period for batch job run history.
About this task
By default, the run history for all the jobs that are available in the Batch analytics configuration page is 30 days. You can configure this value according to your
requirements. Follow these steps:
Procedure
Log in to the web console of your cloud platform.
Expand Workloads > Stateful Sets > analytics-batch.
Click the YAML tab.
Add the parameter and its value to the analytics-batch Stateful Set YAML file in the args: section and specify a value. By default, the interval is 30 days. After this
period, the history is cleared.
delete-batch-history-interval=30.days
The analytics-batch-0 Pod is restarted.
Note: History is cleared based on the restart time + 1 hour. Thereafter, the history is cleared once in every 24 hours to delete the history that is 30 days old.
Click the Edit resource icon ( ).
228 IBM Telco Network Cloud Manager - Performance 1.4.5

Add the parameter and its value to the analytics-batch Stateful Set YAML file in the args: section and specify a value. By default, the interval is 30 days. After this
period, the history is cleared.
delete-batch-history-interval=30.days
Configuring the retention period for audit trail history data
Use this information to configure the retention period for audit trail history information. All the data is stored in PostgreSQL database that is available as a separate service
in Telco Network Cloud Manager - Performance. Information from the database is also displayed in the Resource type instance history window on the Resource
management configuration page.
About this task
By default, the following settings are applicable for retaining the audit history:
audit.trail.retention.day=365
Where, audit.trail.retention.day is the number of days the data is retained in the database.
If you want to customize these values, follow these steps to update the common config map:
Procedure
Follow these steps on OpenShift® Container Platform:
1. Log in to your cloud platform web console.
2. Make sure you are in the correct project where you installed Telco Network Cloud Manager - Performance.
For example, noi or tncp project.
3. Go to Workloads > Config Maps > common.
4. Click the YAML tab and enter the following line and update the default value of 365 days to a value of your choice:
audit.trail.retention.day=120
5. Restart the app Service.
Follow these steps on Kubernetes cloud platform:
1. Log in to your cloud platform web console.
2. Make sure you are in the correct project where you installed Telco Network Cloud Manager - Performance.
For example, noi project.
3. From the left navigation pane, select Config and Storage > Config Maps > common.
4. Click the YAML tab and enter the following line and update the default value of 365 days to a value of your choice:
audit.trail.retention.day=120
5. Restart the app Service.
Related tasks
Managing Audit trail
Supporting multibyte (non-ASCII) characters in Telco Network Cloud Manager -
Performance Dashboards
You can display some of the device properties in multibyte characters in both dashboards and system configuration pages. For example, you can display Resource types in
non-ASCII characters in the display name. The SNMP Discovery Service is modified to support this feature. Currently, this feature is supported for SNMP discovery only.
About this task
Currently, the following OIDs can be configured at the Device level to support the display in non-ASCII characters:
sysName
sysDescr
sysLocation
sysContact
Procedure
1. Make sure that the OIDs are configured to support multibyte characters at the device level.
For example, sysName.
2. After the discovery is done, observe the SNMP Discovery log file.
You can see the displayName shown in multibyte characters:
IBM Telco Network Cloud Manager - Performance 1.4.5 229

[INFO] [2020-08-19 08:52:40.748] [akka.tcp://snmpdiscovery@192.168.194.47:2567/user/snmp-discovery/singleton/discovery-engine-
Discovered device is {"displayName":"日本18","id":"10.55.239.188","ipAddress":"10.55.239.188",
"sysContact":"43.82.38.68.32.83.104.101.110.122.104.101.110.44.32.72.117.97.119.101.105.32.84.101.99.104.110.111.108.111.103.1
"sysDescr":"3.49.50.51","sysLocation":"7.87.51.56.95.76.65.66","sysName":"e6:97:a5:e6:9c:ac:31:38",
"sysObjectID":"1.3.6.1.4.1.2011.2.80.8","sysServices":"78","sysUpTime":"41 days, 21:36:36.30","tenant":"base","type":"device",
3. You can also see it in Resource Management system configuration page .
Configuring time zone support for Batch Analytics
Batch Analytics Service supports time zone configuration. Use this information to configure it.
Procedure
On Red Hat OpenShift® Container Platform
Open your cloud platform web console.
Make sure you are in the correct project where you installed Telco Network Cloud Manager - Performance.
For example, noi or tncp project.
Go to Workloads > Stateful Sets and select the analytics-batch Service and click YAML.
Update the YAML to add the time zone support with the following code:
args:
- '--timezone=Asia/Kolkata'
On Kubernetes cloud platform
Open your cloud platform web console.
https://<master_node_IP>:<Dashboard_externalPort>
Go to Workloads > Stateful Sets and select the analytics-batch Service and click the Edit resource ( ) icon.
Update the YAML to add the time zone support with the following code:
args:
- '--timezone=Asia/Kolkata'
Updating the manager value in annotations section of YAML file
Annotations are metadata that you define and add yourself. Annotations can be added to Kubernetes resources during their creation or modified later as needed.
Typically, when you want to customize the values in any Stateful Set in TNCP, you can change the value of the manager key under the annotations section in the YAML file.
When you restart the Operator Service, your customizations are retained and can continue to come into effect. With this flexibility, you can tailor the Kubernetes
environment to meet your specific requirements without modifying the core Kubernetes codebase.
Consider the scenario where you updated the following values in the YAML file of one of the Stateful Sets,
resources:
limits:
cpu: '4'
memory: 16Gi
requests:
230 IBM Telco Network Cloud Manager - Performance 1.4.5

cpu: '4'
memory: 16Gi
If you want the data to persist even after the service is restarted, change the value in the manager key in the annotations section in the metadata section of the YAML.
metadata:
name: ui
namespace: tncp
uid: eaa8b36e-6fef-41ec-a74d-2e646c25df34
resourceVersion: '14135131'
generation: 160
creationTimestamp: '2024-04-27T05:20:45Z'
labels:
app.kubernetes.io/instance: ui
app.kubernetes.io/managed-by: manual
app.kubernetes.io/name: ui
service: ui
annotations:
hash: ShVCEE58y+thfvBrKw+J7g==
manager: tncp-operator2
Note: If you change the manager value to a custom value, for example manager: tncp-operator2, remember to change it back to the default value during upgrade.
The default value is manager: tncp-operator. You might have to redo the customization after the upgrade is complete.
Configuring Technology Packs
Some technology packs require additional configuration tasks for them to start collecting metrics and inventory data.
Additional configuration steps for certain technology packs
Only some Technology Packs need to be configured specially for them to start collecting data. Most of the Technology Packs start collecting data after they are installed on
the Telco Network Cloud Manager - Performance system.
Running the Huawei U2000 Adaptor script
Use this information to run the Huawei U2000 Adaptor script. It is needed only if you installed the network-u2000-huawei Technology Pack.
Configuring the Cisco EPNM Technology Pack
Cisco Evolved Programmable Network Manager (EPNM) Technology Pack is designed to provide simplified, converged, end-to-end lifecycle management for carrier-
grade networks of all sizes.
Configuring the Nokia Altiplano Technology Pack
Nokia Altiplano Technology Pack is the software-defined access network (SDAN) solution from Nokia. At the heart of the solution is the Altiplano Access Controller.
It is a network management application with a simple unified interface to visualize, optimize, and enhance the fixed access network, supporting SDN-native, legacy,
and third-party equipment.
Configuring the Nokia NSP Technology Pack
Nokia NSP Technology Pack is a collection of network resources inventory, metrics from flat files and calculated metrics, and resource type groupings. Nokia NSP
Technology requires specific configuration settings to start collecting inventory and metric data.
Configuring Fortinet SD-WAN Technology Pack
Fortinet FortiGate delivers fast, scalable, and flexible Secure SD-WAN for cloud-first, security-sensitive, and global enterprises. Fortinet Secure SDWAN (software-
defined wide-area network) solution enables enterprises to transform and secure all WAN edges.
Configuring the Cisco SD-WAN Technology Pack
Cisco SD-WAN offers a software-defined WAN solution that enables enterprises and organizations to connect users to their applications securely. It provides a
software overlay that runs over standard network transport, including MPLS, broadband, and internet to deliver applications and services.
Configuring the Cloud Monitoring Technology Packs
Monitoring the cloud platforms is critical to organizations. Cloud Monitoring makes it easier to identify patterns and discover potential security risks in the
infrastructure. The Cloud Monitoring Technology Packs in Telco Network Cloud Manager - Performance collect performance metrics across the cloud system that
can be visualized in the built-in dashboards.
Running the Huawei U2000 Adaptor script
Use this information to run the Huawei U2000 Adaptor script. It is needed only if you installed the network-u2000-huawei Technology Pack.
Before you begin
Make sure you have installed the network-u2000-huawei Technology Pack.
Make sure that the Perl with CPAN module Text::CSV is installed. This module is the prerequisite to parse the CSV files.
About this task
The Huawei U2000 Adaptor (U2000_adaptor_script.pl) is a daemon Perl script that is used for the following tasks:
LAG aggregation
Uses the IG80034, IG80078, IG80099 Ethernet indicator group files to generate new LAG aggregator IG80320 file.
PON port filtering
It performs the PON port filtering based on the data that is available inside the PON ports file.
Procedure
IBM Telco Network Cloud Manager - Performance 1.4.5 231

Run the following steps to set the Huawei U2000 Adaptor properties.
By default, the U2000_adaptor_properties.properties file is located in /var/storage/nifi/content/nifi-collector/script/network_u2000_huawei directory.
1. Update the U2000_adaptor_properties.properties file to set the values for following properties.
Property Description Suggested value
INPUT_DIRECTOR
YThe input directory of the Adaptor that contains the incoming RAW files and XML files from the
network devices.
/var/storage/nifi/content/nifi-
collector/script/network_u2000_huawei/i
nput
Make sure that the input directory is
available. If not, you must manually create
this directory.
INPUT_OVERLOAD
_DIRECTORY The input directory for the discarded data file. If the Adaptor is unable to direct any UBA files due
to the exceed UBA limit settings, these files are written to a discarded data file in
INPUT_OVERLOAD_DIRECTORY.
/var/storage/nifi/content/nifi-
collector/script/network_u2000_huawei/
overload
If the overload directory is not created,
the Adaptor creates it automatically.
UBA.n.n_INPUT_
DIRECTORY
For example,
UBA.1.1_INPUT_
DIRECTORY
The output directory of the Adaptor where the NIFI collector processed the UBA files. /var/storage/nifi/spool/packs/network-
u2000-huawei-1.0.0/in
The in directory is created automatically
at the time of technology pack installation.
LOG_DIR The directory of the log files. /var/storage/nifi/content/nifi-
collector/script/network_u2000_huawei/l
ogs
Make sure that the logs directory is
available. If not, you must manually create
this directory.
BACKUP_INPUT_D
IRECTORY All the files are placed in this directory after the port filtering process.
Note:
Clean up the directory manually or with a script. This directory might contain large data and
require sufficient space.
/var/storage/nifi/content/nifi-
collector/script/network_u2000_huawei/
backup
If the backup directory is not created, the
Adaptor creates it automatically.
For example, the U2000_adaptor_properties.properties file content:
INPUT_DIRECTORY=/var/storage/nifi/content/nifi-collector/script/network_u2000_huawei/input
INPUT_OVERLOAD_DIRECTORY=/var/storage/nifi/content/nifi-collector/script/network_u2000_huawei/overload
ADAPTOR_SYNC_FILE=adaptor.sync
UBA_LIST=UBA.1.1
UBA.1.1_INPUT_DIRECTORY=/var/storage/nifi/spool/packs/network-u2000-huawei-1.0.0/in
UBA.1.1_ELEMENT_LIMIT=100000
LOG_LEVEL=1
LOG_DIR=/var/storage/nifi/content/nifi-collector/script/network_u2000_huawei/logs
BACKUP_INPUT_DIRECTORY=/var/storage/nifi/content/nifi-collector/script/network_u2000_huawei/backup
Run the following command to start U2000_adaptor_script.pl script.
By default, the U2000_adaptor_script.pl file is located in /var/storage/nifi/content/nifi-collector/script/network_u2000_huawei directory.
1. To start the Huawei U2000 Adaptor script,
perl U2000_adaptor_script.pl start
2. To stop the Huawei U2000 Adaptor script,
perl U2000_adaptor_script.pl -stop
Configuring the Cisco EPNM Technology Pack
Cisco Evolved Programmable Network Manager (EPNM) Technology Pack is designed to provide simplified, converged, end-to-end lifecycle management for carrier-grade
networks of all sizes.
Cisco EPNM Technology Pack overview
The Cisco Evolved Programmable Network (EPN) Manager is an all-in-one management solution for the converged packet and optical networks. It provides device
management, network service provisioning, and network assurance across core, edge, aggregation, and access networks that consist of a wide range of Cisco device
families.
The rich set of device and network management functions is easily accessible to network operators from a graphical user interface. The home screen of the Cisco EPN
Manager is a dashboard view that users can configure to display key information to summarize the status of the network. You can add, remove, and configure dashlets to
suit your needs for a quick view of the network when you first log in.
Access the NiFi UI
Follow these steps to access the NiFi web interface on OpenShift® Container Platform:
1. Log in to your cloud platform web console of your cluster.
2. Make sure you are in tncp project or namespace.
3. Navigate to Networking > Routes.
4. Click the NiFi route link.
232 IBM Telco Network Cloud Manager - Performance 1.4.5

You can see the UI that has a canvas to orchestrate a data flow for the installed File-based Technology Packs:
1. Open a web browser and type the following URL on Kubernetes cloud platform:
http://<node_hostname>:30026/nifi
Where, <node_hostname> is the hostname of any node in your cluster.
30026 is the port number of the NiFi Service on the node where it is installed.
You can see the UI that has a canvas to orchestrate a data flow for the installed File-based Technology Packs:
Configure the variables to authenticate to Evolved Programmable Network (EPN) Manager
server
Variables are defined in and are available to any processor defined at that level and descendants. Follow these steps to obtain the EPNM server access.
1. Right-click the ciscoepnmxml-ciscoepnm Technology Pack template on the project canvas and select Variables from the menu.
2. In the Variables window, provide values for the following variables:
Variable name Value
authorization The password, which you received from Cisco that is encrypted in Base64 format.
hostIP IP address of the EPNM Server.
Related information
Cisco Evolved Programmable Network Manager
Configuring the Nokia Altiplano Technology Pack
Nokia Altiplano Technology Pack is the software-defined access network (SDAN) solution from Nokia. At the heart of the solution is the Altiplano Access Controller. It is a
network management application with a simple unified interface to visualize, optimize, and enhance the fixed access network, supporting SDN-native, legacy, and third-
party equipment.
Nokia Altiplano Technology Pack overview
Altiplano offers a complete suite of network management functions and SDN control to run a broadband network. Altiplano is a cloud-native software platform that has
the virtualized access platform. It is focused on automating the fixed access network.
The virtualized access platform consists of two products: the Altiplano Access Controller and the Altiplano Access Virtualizer. These platforms can manage abstraction
levels to enable programmability and automation.
IBM Telco Network Cloud Manager - Performance 1.4.5 233

Access the NiFi UI
Follow these steps to access the NiFi web interface on OpenShift® Container Platform:
1. Log in to your cloud platform web console of your cluster.
2. Make sure you are in tncp project or namespace.
3. Navigate to Networking > Routes.
4. Click the NiFi route link.
You can see the UI that has a canvas to orchestrate a data flow for the installed File-based Technology Packs:
1. Open a web browser and type the following URL on Kubernetes cloud platform:
http://<node_hostname>:30026/nifi
Where, <node_hostname> is the hostname of any node in your cluster.
30026 is the port number of the NiFi Service on the node where it is installed.
You can see the UI that has a canvas to orchestrate a data flow for the installed File-based Technology Packs:
Configure the variables to authenticate to Nokia Altiplano server
Variables are defined in and are available to any processor defined at that level and descendants. Follow these steps to obtain the EPNM server access.
1. Right-click the nokiaaltiplanojson-nokiaaltiplanoaccess Technology Pack template on the project canvas and select Variables from the menu.
2. In the Variables window, provide values for the following variables:
Variable name Value
authorization The password, which you received from Nokia that is encrypted in Base64 format.
hostUrl IP address of the server that has Nokia Altiplano Access Controller, which is a single management interface for the operator's OSS.
Related information
Altiplano Developer Portal
Configuring the Nokia NSP Technology Pack
Nokia NSP Technology Pack is a collection of network resources inventory, metrics from flat files and calculated metrics, and resource type groupings. Nokia NSP
Technology requires specific configuration settings to start collecting inventory and metric data.
234 IBM Telco Network Cloud Manager - Performance 1.4.5

Nokia Network Service Platform (NSP) Technology Pack overview
Nokia NSP Technology Pack that is installed on IBM® Telco Network Cloud Manager - Performance containerized application to collects metrics and inventory information
from specific network devices and technologies that operate in the Nokia NSP NFM-P environment. The data is then visualized in dashboards that are available in IBM
Telco Network Cloud Manager - Performance.
The LogToFile feature of the Nokia NSP Network Functions Manager – Packet (NFM-P) server allows the downstream systems to retrieve metric data as it arrives and
without any filtering. The data is fed to the downstream systems in a streaming fashion. The downstream system must do the filtering with caution and as necessary.
The Apache NiFi processes the events that are received from Kafka.
Data collection
Figure 1. Integration of Nokia NSP Technology Pack and NSP NFM-P
FTP
FTP
NFM -P
NiFi
Kafka
Inventory
Timeseries
AVRO Records
Discoveries
Formulas
Inventory and Metric files
Inventory and Metric files
Event notification
File Collector
REST Request/Response for
Authentication
REST Request/Response for
Subscription
REST Request/Response for
Inventory and Metric data
(fileAvailable/
LogFileAvailable/
AttributeChange)
(Click image to view in a new window.)
Kafka integration
Communication between Telco Network Cloud Manager - Performance and Nokia NSP NFM-P server is through the RESTful and Kafka NBI interface. Kafka is used
for the following tasks in this integration:
Kafka connection is used to monitor object creation and deletion, property changes, and keep-alive messages.
During authentication, NiFi provides a request to NSP NFM-P server by using InvokeHTTP processor and the response is sent as a token from the NFM-P
server. Authentication is mandatory to fetch the file-based data and subscription data from server. The token is refreshed every one hour.
Telco Network Cloud Manager - Performance creates the subscription for the metric classes by providing all the class names of the metrics in a subscription
request.
REST API calls
Telco Network Cloud Manager - Performance uses the REST API services such as findtoFile and registerLogToFile from NFM-P servers. findtoFile
service is used to fetch inventory data and OAM Test results and registerLogToFile service is used to fetch the metric data for performance and accounting
statistics.
Inventory file creation
By using the bearer token, Telco Network Cloud Manager - Performance provides inventory classes request to NSP NFM-P server. The InvokeHttp processor uses
the following REST API call to send the file request to Nokia and the fetch the inventory file.:
https://${NFMP}:8443/nfm-p/rest/api/v2/general/findToFile/
The GetFile processor takes the inventory request file from the server and processes it. The response shows that number of inventory file requests that are
fetched.
Metric file creation
The performance statistics files are collected by using RESTAPI and Apache Kafka.
The GetMetricRequestFile and GetOAM_MetricRequestFile processors fetch the request file for performance, accounting, and OAM classes and process
them. The InvokeHttp processor sends requests to the Nokia servers for metric files.
AVRO record conversion
The metrics (XML files) and inventory (XML files) from the NSP NFM-P Server are parsed by Apache NiFi and converted to normalized AVRO record files and sent to
the File Collector.
Parsing and storing the data
File Collector processes the incoming AVRO records through discoveries and formula files. The attributes and model-related data is stored in Cassandra database
and metric data is sent to Diamond DB and Timeseries databases in Telco Network Cloud Manager - Performance.
You can view the collected and processed metrics from the Metric Viewer dashboard.
Supported metric classes in Nokia NSP Technology Pack
IBM Telco Network Cloud Manager - Performance 1.4.5 235

The Nokia NSP Technology Pack contains the statistics counters that are configured from managed NFM-P servers. Typically, the performance statistics provide
information of network objects, which includes physical equipment, routing, and other network element properties. For example, the network devices health such as CPU
Utilization is monitored to ensure early detection of network issues.
Nokia NSP Technology Pack supports the following metrics for the network infrastructure:
Performance statistics for network objects
Accounting statistics for network ports
OAM statistics for OAM tests
Accounting classes provide statistics that are related to packet and octet throughput for queues that are associated with network ports. OAM Test suite must be
configured and scheduled beforehand to collect statistics that are related to OAM classes. These test result metrics help in detecting significant latency from the OAM test
triggered.
ClassName Request Type Class Category
equipment.AllocatedMemoryStats registerLogToFile Performance
equipment.AvailableMemoryStats registerLogToFile Performance
equipment.BaseCard findToFile N/A
equipment.ControlProcessor findToFile N/A
equipment.DaughterCard findToFile N/A
equipment.HardwareTemperature registerLogToFile N/A
equipment.InterfaceAdditionalStats registerLogToFile Performance
equipment.InterfaceStats registerLogToFile Performance
equipment.ManagementPort findToFile N/A
equipment.MediaIndependentStats registerLogToFile Performance
equipment.PhysicalPort findToFile N/A
equipment.Shelf findToFile N/A
equipment.SystemCpuMonStats registerLogToFile Performance
equipment.SystemCpuStats registerLogToFile Performance
equipment.SystemMemoryStats registerLogToFile Performance
ethernetoam.CfmEthTest findToFile OAM test
ethernetoam.CfmEthTestResult registerSasLogToFile/ findToFile OAM test
ethernetoam.CfmOneWayDelayTest findToFile OAM test
ethernetoam.CfmOneWayDelayTestResult registerSasLogToFile/ findToFile OAM test
lag.Interface findToFile N/A
nqueue.Entry findToFile N/A
nqueue.ForwardingClass findToFile N/A
nqueue.Policy findToFile NA
service.CombinedNetworkEgressOctets registerLogToFile Accounting
service.CombinedNetworkIngressOctets registerLogToFile Accounting
Metric class Inventory class
equipment.AllocatedMemoryStats equipment.shelf
equipment.AvailableMemoryStats
equipment.SystemCpuStats
equipment.SystemMemoryStats
equipment.HardwareTemperature equipment.BaseCard
equipment.ControlProcessor
equipment.DaughterCard
equipment.InterfaceAdditionalStats equipment.PhysicalPort
equipment.ManagementPort
lag.Interface
equipment.InterfaceStats equipment.PhysicalPort
equipment.ManagementPort
lag.Interface
equipment.MediaIndependentStats equipment.PhysicalPort
equipment.ManagementPort
ethernetoam.CfmEthTestResult equipment.shelf
ethernetoam.CfmEthTestResult ethernetoam.CfmEthTest
ethernetoam.CfmOneWayDelayTestResult ethernetoam.CfmOneWayDelayTest
service.CombinedNetworkEgressOctets
service.CombinedNetworkIngressOctets
nqueue.Entry
nqueue.ForwardingClass
nqueue.Policy
Devices and services
NFM-P server compatibility
Nokia NSP 1.1.0 Technology Pack is tested with NFM-P server version 21.3.
Supported devices
The list of Nokia devices that are supported by Nokia NSP Technology Pack.
236 IBM Telco Network Cloud Manager - Performance 1.4.5

Nokia 7750 SR (SR3, SR4, SR5, SR6)
Nokia 7450 ESS (SR1, SR2, SR7, SR8)
Nokia 7705 SAR (SR61)
Nokia 7701 CPAA (CPAA)
Nokia 7950 (SR62)
Nokia Traffic Generator ((TG1, TG2)
Nokia VSR-NRC
Nokia MPLS, LSP Tunnels
OSPF, LDP
Nokia IES Services
Nokia VPRN Services
Nokia VLL Epipe Services
Nokia VPLS Services
Nokia Composite Service
Load balancing
The FAILOVER FLOW section in the NiFi data flow handles load balancing in Nokia NSP Technology Pack. The status of NSP and NFM-P servers are checked by providing
the location service request by using the following REST API calls:
NFM-P
https://{NFMP}/rest-gateway/rest/api/v1/location/services/{serviceName}
NSP
https://{SDN}/rest-gateway/rest/api/v1/location/services/{serviceName}
If the servers are down, the primary servers are replaced with secondary servers. The failover condition process is repeated to check for the secondary servers. When a
switch in NSP NFM-P servers occurs, a smooth transitioning to the secondary server and a full inventory can be started if Telco Network Cloud Manager - Performance is
configured. Before full inventory is collected from the servers, a request to check the server status is sent every 15 mins.
If the active server goes down, it takes 10 - 15 mins for the secondary server to take charge and get connected. The OSS client keeps sending the request until it is
connected to the server. The authentication gets established by itself and access token is generated automatically after the switchover.
The subscription doesn’t get renewed as nothing is changed on the auxiliary server. After the switchover, the Telco Network Cloud Manager - Performance checks if the
subscription is active or not. If the subscription is not active, it is immediately renewed.
If the SDN server also goes down, then the SDN takes the active NFM-P server IP from the location service and work as expected.
Installing the Nokia NSP Technology Pack
Download the M0BP6ML.tar.gz file that contains the Nokia NSP Technology Pack from IBM Passport Advantage.
Setting up Apache NiFi for Nokia NSP Technology Pack
Set up and start Apache NiFi to convert the data files that are collected from Nokia NSP servers. Convert the data to Avro format records and write them to Kafka.
These records are then picked up by File Collector for processing the metrics and device inventory data.
Glossary
Glossary of terms that are related to the Nokia NSP Technology.
Installing the Nokia NSP Technology Pack
Download the M0BP6ML.tar.gz file that contains the Nokia NSP Technology Pack from IBM Passport Advantage.
Before you begin
Make sure your Telco Network Cloud Manager - Performance system is set up and configured successfully.
Procedure
1. Download and extract the technology pack.
As an entitled customer, use your credentials to download the pack with its part number. You can find the Nokia NSP Technology Pack files in the /packs folder. The
packs.sh file that is used to install the pack is available in the bundle.
The following folders and files of significance are available in the Nokia NSP Technology Pack:
file
It has the following sub folders:
discoveries
Contains a folder with the name of the Technology Pack that has the discovery files with the extension .discovery.
formulas
Contains a folder with the name of the Technology Pack that has the collection formula files with the extension .formula. All the formulas are organized
according to the available Resource types in the pack.
inventory
With in the model folder, Property and Relationship sub folders are available. These folders contain the inventory model files that contain properties and
parent-child relationship within the resources. Both property and relationship files have the extension .model.
metrics
Contains the metric files that are organized according to the available Resource types in the pack. Metric files have the extension .metric.
IBM Telco Network Cloud Manager - Performance 1.4.5 237

nifi-collector
Contains Apache NiFi related files that include the NiFi flow templates, lookup files.
/config/nokia-nsp
inventory
Contains the Inventory_Class_Request.json file that has all the resource types and properties that are associated with Nokia devices.
metric
Contains the following JSON files:
Event_Subscription_Format.json
It has the event subscription formats that show the availability and other status changes related to the metrics.
Metric_Class_Request.json
It has all the accounting and performance metric classes and their attributes that can be collected from the devices.
OAM_Metric_Class_Request.json
It has all the OAM test classes and their attributes that can be collected from the devices.
ssl
Contains the keystore and truststore files for SSL SAML authentication
template
nokia-nsp.xml
pack.properties
Contains pack metadata and the dependent packs.
pack-nokia-nsp-details.xlsx
An excel file with all the pack content.
2. Install Technology Packs
Setting up Apache NiFi for Nokia NSP Technology Pack
Set up and start Apache NiFi to convert the data files that are collected from Nokia NSP servers. Convert the data to Avro format records and write them to Kafka. These
records are then picked up by File Collector for processing the metrics and device inventory data.
Before you begin
The following tasks must be completed before you start the configurations on Apache NiFi for Nokia NSP Technology Pack:
Configure the Open VPN to connect to Nokia servers.
Encrypt the password that is sent to you from Nokia to Base64 format. You can use any online tool. For example, https://www.base64encode.org/.
Log in to the Nokia server by using the credentials.
Get the keystore and truststore certificates from the Nokia servers and replace them at /packs/nifi-collector/config/nokia-nsp/ssl folder.
NiFi setup tasks
Following are the major configuration tasks that needed to set up Apache NiFi to start collecting metrics and inventory metadata from NFM-P server:
Access the NiFi UI
Configure the variables for failover setup
Authenticate to the NFM-P servers
Create the inventory files
Collect and store the inventory files
Create the subscription ID for metric classes
Create metric files
Convert to AVRO record format
Access the NiFi UI
Follow these steps to access the NiFi web interface on OpenShift® Container Platform:
1. Log in to your cloud platform web console of your cluster.
2. Make sure you are in tncp project or namespace.
3. Navigate to Networking > Routes.
4. Click the NiFi route link.
You can see the UI that has a canvas to orchestrate a data flow for the installed File-based Technology Packs:
1. Open a web browser and type the following URL on Kubernetes cloud platform:
http://<node_hostname>:30026/nifi
Where, <node_hostname> is the hostname of any node in your cluster.
30026 is the port number of the NiFi Service on the node where it is installed.
You can see the UI that has a canvas to orchestrate a data flow for the installed File-based Technology Packs:
238 IBM Telco Network Cloud Manager - Performance 1.4.5

NiFi flow in the Nokia NSP Technology Pack project is divided into the following sections:
FAILOVER FLOW
AUTHENTICATION
INVENTORY FILES CREATION
COLLECTING AND STORING THE INVENTORY FILES
SUBSCRIPTION FOR METRIC CLASSES
METRIC FILES CREATION
CONVERT TO AVRO RECORDS
Configure the variables for failover setup
Variables are created and configured within the NiFi UI. Variables are defined at the Process Group level. Variables are defined in and are available to any processor
defined at that level and descendants. Follow these steps to update the global SDN and NFMP variables:
1. In the FAILOVER FLOW section, right-click the project canvas with nothing selected and select Variables from the menu.
2. In the Variables window, provide values for the following variables:
Note: You can see all the referencing processors for each of the variable.
Variable name Value
NFMP IP address of the NFMP server
SDN IP address of the SDN server
aux IP address of the aux server
file_path
secondary_NFMP IP address of the secondary NFMP server for failover
secondary_SDN IP address of the secondary SDN server for failover
3. Click Apply.
4. Start all the processors under Failover flow.
Authenticate to the NFM-P servers
The InvokeHTTP processor is configured to authenticate to the NFM-P server and to obtain a response token from the server. Authentication is mandatory to fetch file-
based data and subscription data from the server. The response bearer token is refreshed after every hour. The API call is as follows:
https://{SDN}:{port}/rest-gateway/rest/api/v1/auth/token
Telco Network Cloud Manager - Performance can connect to the Nokia NSP server successfully after the SSL check in controller servers and authentication.
1. In the AUTHENTICATION section, right-click the InvokeHTTP processor and select Configure.
2. Provide values for the following properties:
IBM Telco Network Cloud Manager - Performance 1.4.5 239

Parameter Value
Authorization The password that is sent to you from Nokia that is encrypted to Base64 format.
3. Right-click on the project canvas with nothing selected and select Configure.
4. Click the View Configuration ( ) icon on the StandardSSLContextService controller service.
5. In the Controller Service Details window, provide values for the following properties:
Parameter Value
Keystore Filename Location where the keystore file is available. By default, it is /packs/nifi-collector/config/nokia-nsp/ssl.
Keystore password Keystore password.
Truststore Filename Location where the truststore file is available. By default, it is /packs/nifi-collector/config/nokia-nsp/ssl.
Truststore Password Truststore password.
6. Click OK.
7. Click the Enable ( ) icon on the StandardSSLContextService controller service.
8. Disable the EmbeddedDbService controller service and enable again.
9. Start all the processors under AUTHENTICTION flow.
Create the inventory files
Inventory classes request is sent with the bearer token to the server. A non-readable 0-bytes response is sent from the server. The fileAvailable event notification is
received from Kafka. Then, the inventory files are created at the specified location in file name attribute in request. You can fetch these XML files through FTP from that
location. By default, the inventory files are fetched once a day. The files are stored in a temporary database in NiFi for further processing. The API call is as follows:
240 IBM Telco Network Cloud Manager - Performance 1.4.5

https://${NFMP}:{port}/nfm-p/rest/api/v2/general/findToFile/
1. In the INVENTORY FILES CREATION flow, right-click the GetInventoryFile processor and select Configure.
2. Provide values for the following property:
Property Value
Input Directory Location where the Inventory_Class_Request.json file is available. By default, it is ${content_dir}/nifi_collector}/config/${pack_name}/inventory
3. Click Apply.
4. Start all the processors in the INVENTORY FILES CREATION flow.
Collect and store the inventory files
1. In the COLLECTING AND STORING THE INVENTORY FILES section, right-click the ListSFTP and FetchSFTP processors and select Configure.
2. Provide values for the following properties:
Property Value
Username ossuser
Password Specify the password that you received from Nokia for the ossuser user.
3. Click Apply.
4. Start all the processors in the COLLECTING AND STORING THE INVENTORY FILES flow.
Create the subscription ID for metric classes
A subscription is created for all the metric classes and the subscription is bearer token to the InvokeHttp processor. Subscription ID and topic ID are returned in the
response. The API call is as follows:
https://{SDN}:{port}/nbi-notification/api/v1/notifications/subscriptions
1. In the SUBSCRIPTION FOR METRIC CLASSES section, right-click the GetEventSubscription_RequestFile processor and select Configure.
2. Provide values for the following properties:
Property Value
Input Directory Location where the Event_Subscription_Format.json file is available. By default, it is ${content_dir}/nifi_collector}/config/${pack_name}/metric
3. Click Apply.
4. Start all the processors in the SUBSCRIPTION FOR METRIC CLASSES flow.
Create metric files
Metric classes request is sent with the bearer token and the subscription ID to the server. A non-readable 0-bytes response is sent from the server. The
logfileAvailable event notification is received from Kafka. Then, the metric files are created at the specified location in file name attribute in request.
Note: OAM metric files are created with findToFile event notifications from Kafka.
The metric files are received in XML format. The metric classes are then processed and converted to Avro Records and passed as input to the File Collector Service.
1. In the METRIC FILES CREATION section, right-click the GetOAM_MetricRequestFile and GetMetricRequestFile processors.
2. Select Configure and provide values for the following properties:
Processor Property Value
GetEventSubscription_Req
uestFile Input Directory Location where the OAM_Metric_Class_Request.json file is available. By default, it is
${content_dir}/nifi_collector}/config/${pack_name}/metric
GetMetricRequestFile Input Directory Location where the Metric_Class_Request.json file is available. By default, it is
${content_dir}/nifi_collector}/config/${pack_name}/metric
3. Click Apply.
4. Start all the processors in the METRIC FILES CREATION flow.
Convert to AVRO record format
1. In the CONVERT TO AVRO RECORDS section, right-click the FetchSFTMMetricFiles processor and select Configure.
2. Provide values for the following properties:
Property Value
Username ossuser
Password Specify the password that you received from Nokia for the ossuser user.
3. Click Apply.
4. Start all the processors in the CONVERT TO AVRO RECORDS flow.
Glossary
Glossary of terms that are related to the Nokia NSP Technology.
NSP
Network Service Platform. A carrier software-defined networking (SDN) platform that unifies service automation, network optimization, and dynamic assurance so
that network operators can deliver on-demand network services efficiently, profitably, and with scalability.
NFM-P
Network Functions Manager – Packet. The NFM-P is an advanced IP/MPLS and mobile network management system that has a modular, scalable architecture. The
system provides multiple GUI, web, and OSS interfaces, and can integrate with other management systems.
NFM-T
Network Functions Manager – Packet. The NFM-P is an advanced IP/MPLS and mobile network management system that has a modular, scalable architecture. The
system provides multiple GUI, web, and OSS interfaces, and can integrate with other management systems.
IBM Telco Network Cloud Manager - Performance 1.4.5 241

NSM
Network and Service Management. A Nokia Canada business unit responsible to develop Service and Network Management products.
OIPS
Open Interface Professional Support.
OSS
Operations Support Systems.
Configuring Fortinet SD-WAN Technology Pack
Fortinet FortiGate delivers fast, scalable, and flexible Secure SD-WAN for cloud-first, security-sensitive, and global enterprises. Fortinet Secure SDWAN (software-defined
wide-area network) solution enables enterprises to transform and secure all WAN edges.
Fortinet SD-WAN Technology Pack overview
Devices and platforms
For more information, see https://www.fortinet.com/products/sd-wan
See Models and Specifications section.
Setting up Apache NiFi for Fortinet SD-WAN Technology Pack
Set up and start Apache NiFi to convert the data files that are collected from Fortinet SD-WAN servers to Avro format records and write them to Kafka. These
records are then picked up by File Collector for processing the metrics and device inventory data.
Related information
https://www.fortinet.com/products/sd-wan
Setting up Apache NiFi for Fortinet SD-WAN Technology Pack
Set up and start Apache NiFi to convert the data files that are collected from Fortinet SD-WAN servers to Avro format records and write them to Kafka. These records are
then picked up by File Collector for processing the metrics and device inventory data.
Before you begin
To get a session and token from FortiManager and FortiGate to fetch data in NiFi, the default credentials are set to admin/admin.
ADOM values are configured as Site values. You must manually configure the ADOMs sites and add FortiGate devices to the ADOMs.
For more information, see https://docs.fortinet.com/document/fortimanager/5.4.0/cookbook/666580/adding-online-fortigates-to-fortimanager-5-4-1-adoms.
NiFi setup tasks
Following are the configuration tasks that are needed to set up Apache NiFi to start collecting metrics and inventory metadata from Fortinet SD-WAN control pane:
Access the NiFi UI on Red Hat OpenShift Container Platform.
Access the NiFi UI on your cloud platform.
Enable the controller services.
Configure the variables.
Access the NiFi UI on OpenShift Container Platform
Follow these steps to access the NiFi web interface on OpenShift® Container Platform:
1. Log in to your cloud platform web console of your cluster.
2. Make sure you are in tncp project or namespace.
3. Navigate to Networking > Routes.
4. Click the NiFi route link.
You can see the UI that has a canvas to orchestrate a data flow for the installed File-based Technology Packs:
242 IBM Telco Network Cloud Manager - Performance 1.4.5

Access the NiFi UI on Kubernetes
1. Open a web browser and type the following URL on Kubernetes cloud platform:
http://<node_hostname>:30026/nifi
Where, <node_hostname> is the hostname of any node in your cluster.
30026 is the port number of the NiFi Service on the node where it is installed.
You can see the UI that has a canvas to orchestrate a data flow for the installed File-based Technology Packs:
NiFi flow
NiFi flow in the Fortinet SD-WAN Technology Pack project is divided into the following sections:
Get session value for FortiManager authentication
Get token value for FortiGate authentication
Generate flow data
Device and Interface flow
Generate Tunnel Data
Generate Application Data
Generate AVRO Record
Enable the controller services
1. Right-click the Fortinet SD-WAN processor group and select Configure > CONTROLLER SERVICES.
The following Controller Services are available:
2. Click the Enable icon ( ) and enable all the controller services.
3. Close the window.
4. Click the processor group and select Start to start the data collection.
Configure the variables
Right-click the project canvas with nothing selected and select Variables from the menu.
In the Variables window, provide values for the following variables:
Variable Value
interval The default value is 10 minutes, which is expressed as 600 seconds. You can increase or decrease this value to delay or fasten the AVRO record
generation by the NiFi Collector Service that can be picked up by the File Collector Service. You must update the Flow File Processors to
schedule to run according to this value as well.
vmanage IP address of the FortiManager Dashboard.
Note: Rest of the variable values are auto-populated for you.
IBM Telco Network Cloud Manager - Performance 1.4.5 243

After a variable value is changed, click OK and Apply.
Start all the processors in the flow.
Configuring the Cisco SD-WAN Technology Pack
Cisco SD-WAN offers a software-defined WAN solution that enables enterprises and organizations to connect users to their applications securely. It provides a software
overlay that runs over standard network transport, including MPLS, broadband, and internet to deliver applications and services.
Cisco SD-WAN Technology Pack overview
The Cisco SD-WAN solution is a cloud-delivered wide area network (WAN) overlay architecture that extends the principles of software-defined networking (SDN) into the
WAN. The solution is broken up into four planes, data, control, management, and orchestration.
The following are the key components for each plane:
Cisco vManage
Cisco SD-WAN vManage API is a REST API interface for controlling, configuring, and monitoring the Cisco devices in an overlay network. The following are the
usecases for vManage APIs:
Monitor device status.
Configure a device, such as attaching a template to device.
Query and aggregate device statistics.
For more information about the vManage Rest APIs, see Cisco SD-WAN vManage Rest API definitions.
It belongs to the Management plane, which represents the user interface of the solution. Network administrators and operators can configure, provision, monitor,
and troubleshoot the devices from here.
Cisco vBond
It belongs to the orchestration plane. vBond is responsible for onboarding the devices into the SD-WAN fabric with its Zero-Touch provisioning process.
Cisco vSmart
It belongs to control plane and it is the brain of the solution. It is responsible for enforcing the policies centrally. These policies are created on the vManage.
Cisco WAN Edge Routers
These routers establish the network fabric and forwarding traffic. Cisco WAN Edge routers come in multiple forms, virtual, and physical, and are selected based on
the connectivity, throughput, and functional needs of the site.
Cisco SD-WAN uses Overlay Management Protocol (OMP) that manages the overlay network. OMP runs between the vSmart controllers and WAN Edge routers where
control plane information is exchanged over a secure connection. Bidirectional Forwarding Detection (BFD) is used by the WAN Edge routers to probe and measure the
performance of the transport links.
Supported metrics in Technology Pack
Resource Type Metric Name Metric Description
sdwanDevice CPU.Utilization.Per
cent The percentage of CPU utilization
sdwanDevice Memory.Utilization.
Percent The percentage of total memory in use out of all memory allocated for the device.
244 IBM Telco Network Cloud Manager - Performance 1.4.5

Resource Type Metric Name Metric Description
sdwanDevice sdwanDevice.Availab
ility.Uptime.minute
s
Calculate the availability uptime in minutes.
sdwanDevice sdwanDevice.Disk.Ut
ilization.Percent The average Disk usage during a specified collection period
sdwanDevice sdwanDevice.Crash.C
ount Number of times device crash
sdwanDevice sdwanDevice.Reboot.
Count Number of times device rebooted
interface Network.Inbound.Dis
cards.Count The number of inbound packets, which were chosen to be discarded even though no errors are detected to prevent their
being deliverable to a higher-layer protocol.
interface Network.Inbound.Err
ors.Count The number of inbound packets that contained errors that are prevented from being delivered to a higher-layer protocol.
interface Network.Inbound.Oct
ets.Bytes The number of octets (bytes) received on this interface since the last successful retrieval of this value.
interface Network.Inbound.Pac
kets.Count The total number of packets that are delivered to a higher layer, during the last polling period. This metric excludes any
packets that were received by an interface, but were not passed on.
interface Network.Inbound.Thr
oughput.kbps Number of incoming kilo-bits per seconds
interface Network.Inbound.Uti
lization.Percent The average percentage of the inbound bandwidth (capacity) used on this interface during the last polling period. The
percentage is valid only if the interface has a defined bandwidth (that is, ifSpeed is nonzero).
interface Network.Outbound.Di
scards.Count The number of outbound packets, which were chosen to be discarded even though no errors are detected to prevent their
being transmitted.
interface Network.Outbound.Er
rors.Count The number of Outbound packets that contained errors that are prevented from being delivered to a higher-layer protocol.
interface Network.Outbound.Oc
tets.Bytes The number of octets (bytes) transmitted out of this interface during the last polling period.
interface Network.Outbound.Pa
ckets.Count The total packets (all packets) transmitted out of this interface during the last polling period.
interface Network.Outbound.Pa
ckets.pps Number of Outgoing packets per seconds
interface Network.Outbound.Th
roughput.kbps Number of Outgoing kilo-bits per seconds
interface Network.Outbound.Ut
ilization.Percent The average percentage of the outbound bandwidth (capacity) used on this resource on this interface during the last polling
period. This percentage is valid only if the interface has a defined bandwidth, that is, the ifSpeed OID (defined in the
RFC1213-MIB) is nonzero.
tunnel Network.Inbound.Oct
ets.Bytes The number of octets (bytes) received on this interface since the last successful retrieval of this value.
tunnel Network.Outbound.Oc
tets.Bytes The number of octets (bytes) transmitted out of this interface during the last polling period.
tunnel tunnel.FEC.Loss.Rec
overy.Percent Tunnel FEC loss recovery percent
tunnel tunnel.Jitter.ms Tunnel jitter ms
tunnel tunnel.Latency.ms Tunnel latency ms
tunnel tunnel.Loss.Percent Tunnel loss percent
tunnel tunnel.QoE.Score Tunnel QoE score
wanLink wanLink.Jitter.ms WanLink jitter ms
wanLink.Latency.ms WanLink latency ms
wanLink wanLink.Loss.Percen
tWanLink loss percentage
application application.FEC.Rec
overy.Rate.Percent Application FEC recovery rate percent
application application.Total.T
raffic.Percent Application total traffic percent
application application.Total.U
sage.Bytes Application total usage bytes
application application.Usage.B
ytes Application usage bytes
applicationP
erTunnel
applicationPerTunne
l.Total.Traffic.Per
cent
ApplicationPerTunnel total traffic percent
applicationP
erTunnel
applicationPerTunne
l.Total.Usage.Bytes ApplicationPerTunnel total usage bytes
applicationP
erTunnel
applicationPerTunne
l.Usage.Bytes ApplicationPerTunnel usage bytes
applicationPerTunne
l.Usage.Packets ApplicationPerTunnel usage packets
Devices and platforms
You can deploy Cisco SD-WAN on the following devices and platforms:
Cisco vEdge
Cloud Services Router (CSR) 1000 V
1000 Series-Integrated Services Routers (ISRs)
4000 Series ISRs, and with platforms Network Functions Virtualization (NFV) by using Cisco SD-Branch solutions such as
Cisco 5000 Series Enterprise Network Compute System (ENCS)
Cisco UCS® E-Series
Installing the Cisco SD-WAN Technology Pack
Download the M0BP7ML.tar.gz file that contains the Technology Pack from IBM® Passport Advantage®.
IBM Telco Network Cloud Manager - Performance 1.4.5 245

Setting up Apache NiFi for Cisco SD-WAN Technology Pack
Set up and start Apache NiFi to convert the data files that are collected from Cisco SD-WAN servers to Avro format records and write them to Kafka. These records
are then picked up by File Collector for processing the metrics and device inventory data.
Cisco SD-WAN vManage Rest API definitions
These APIs play an important role for clients to consume the features provided by vManage.
Known issue with interface speed in Cisco Edge devices
The interface speed value from the Cisco Edge devices (Cloud Services Router (CSR) 1000 V) is shown in bps instead of Mbps. It results in incorrect value for the
interface utilization metrics.
Related information
Cisco SD-WAN
Cisco SD-WAN Cloud scale architecture
Installing the Cisco SD-WAN Technology Pack
Download the M0BP7ML.tar.gz file that contains the Technology Pack from IBM® Passport Advantage®.
Before you begin
Make sure your Telco Network Cloud Manager - Performance system is set up and configured successfully.
Procedure
1. Download the Technology Pack
2. Install Technology Packs
Setting up Apache NiFi for Cisco SD-WAN Technology Pack
Set up and start Apache NiFi to convert the data files that are collected from Cisco SD-WAN servers to Avro format records and write them to Kafka. These records are
then picked up by File Collector for processing the metrics and device inventory data.
Before you begin
The following tasks must be completed before you start the configurations on Apache NiFi for Cisco SD-WAN Technology Pack:
Configure the Open VPN to connect to Cisco SD-WAN servers.
Log in to the server by using the credentials that are sent to you by Cisco.
Make sure to use the correct port number that is allotted to you.
NiFi setup tasks
Following are the major configuration tasks that are needed to set up Apache NiFi to start collecting metrics and inventory metadata from Cisco SD-WAN control pane:
Access the NiFi UI on OpenShift Container Platform
Enable the controller services
Authentication
Configure the variables
API calls for different resource types
Access the NiFi UI on OpenShift Container Platform
Follow these steps to access the NiFi web interface on OpenShift® Container Platform:
1. Log in to your cloud platform web console of your cluster.
2. Make sure you are in tncp project or namespace.
3. Navigate to Networking > Routes.
4. Click the NiFi route link.
You can see the UI that has a canvas to orchestrate a data flow for the installed File-based Technology Packs:
Access the NiFi UI on Kubernetes
1. Open a web browser and type the following URL on Kubernetes cloud platform:
http://<node_hostname>:30026/nifi
Where, <node_hostname> is the hostname of any node in your cluster.
246 IBM Telco Network Cloud Manager - Performance 1.4.5

30026 is the port number of the NiFi Service on the node where it is installed.
You can see the UI that has a canvas to orchestrate a data flow for the installed File-based Technology Packs:
NiFi flow in the Cisco SD-WAN Technology Pack project is divided into the following sections:
Get token value for authentication
Generate flow data
Device and interface flow
Generate wanLink data
Generate tunnel data
Generate Application Data
Generate ApplicationPerTunnel data
Generate AVRO Record
Enable the controller services
1. Right-click the Cisco SD-WAN processor group and select Configure > CONTROLLER SERVICES.
The following Controller Services are available:
2. Click the Enable icon ( ) and enable all the controller services.
3. Close the window.
4. Click the processor group and select Start to start the data collection.
Authentication
After the installation of the Technology Pack, make sure to log in to the Cisco VPN with the credentials that are allotted to you. A REST API request is sent to the Cisco
servers to obtain the token, which is used in data collection. Use the following steps to view the token:
1. Right-click the queue between the PutSQL processor and select List queue.
2. Click the View content ( ) icon to see the token that is obtained from the Cisco server.
Data flow for the various resource types is automatically done. The collected data is transformed to Avro format in the file-collector.records Kafka topic for File
Collector Service to pick up and parse.
Configure the variables
You can change the interval variable value if you want to increase or decrease the Avro record generation interval time. Rest of the variable values are auto-populated for
you.
1. Right-click the project canvas with nothing selected and select Variables from the menu.
2. In the Variables window, provide values for the following variables:
IBM Telco Network Cloud Manager - Performance 1.4.5 247

Variable Value
interval The default value is 10 minutes, which is expressed as 600 seconds. You can increase this value to delay the Avro record generation by the NiFi
Collector Service that can be picked up by the File Collector Service.
j-password Password to access the vManage dashboard.
j-username Username to access the vManage dashboard.
port Port number to access the vManage dashboard.
vmanage IP address of the vManage dashboard, which is 10.10.20.90.
3. After a variable value is changed, click OK and Apply.
4. Start all the processors in the flow.
API calls for different resource types
Follow these steps to locate the API script body for the different resource types from the associated processors:
1. Right-click the processor.
2. Select View Configuration and click the PROPERTIES tab.
3. Click the value field for the Script Body property to see the REST API call and URL used to obtain the data.
The processors responsible for API calls to the Cisco SD-WAN servers for different resource types are as follows:
Flow section Processor name Property URL
Device and interface flow getInterfaces Script Body https://'+urlport+'/dataservice/device/interface?
deviceId='+deviceIP
Generate wanLink data GetWanLink Script Body https://'+urlport+'/dataservice/device/tloc
https://'+urlport+'/dataservice/statistics/approute/aggregation
Generate Tunnel data GetTunnel Script Body https://'+urlport+'/dataservice/device
https://'+urlport+'/dataservice/statistics/approute/fec/aggrega
tion
Generate Application data GetApplication Script Body https://'+urlport+'/dataservice/device
https://'+urlport+'/dataservice/statistics/dpi/aggregation
Generate ApplicationPerTunnel
data
GetApplicationPerTunn
el Script Body https://'+urlport+'/dataservice/statistics/dpi
For more information about REST APIs, see Cisco SD-WAN vManage Rest API definitions.
Traffic Generation and vSmart policy activation
To get data from SD-WAN servers for Application and Application Per
Tunnel resource types, follow these steps:
https://devnetsandbox.cisco.com/sandbox-instructions/Cisco_SD-WAN_19_2/DevNet_Sandbox_Traffic_Generation.pdf
Note: Perform this step before you start the processors on the NiFi flow.
Cisco SD-WAN vManage Rest API definitions
248 IBM Telco Network Cloud Manager - Performance 1.4.5

These APIs play an important role for clients to consume the features provided by vManage.
vManage REST API access control is based on sessions. All users will be able to get a session after successfully logging in.
Base URI
Every data service API request begins with the following Base URI.
https://{{vmanage}}:{{port}}/dataservice/
SdwanDevice resource type
Provides device resource type metrics information and its properties from the vManage dashboard.
URI
https://{{vmanage}}:{{port}}/dataservice/device/interface?deviceId=<device_id>
Sample URI
https://<IP_address>:8443/dataservice/device/interface?deviceId=10.10.1.17
Method
The supported request type.
https GET
Response
The results are returned as JSON data that contains an array of the following fields:
Name Data type Description
system-ip string IP address of the device
number-vsmart-control-connections number Number vsmart control connections
expectedControlConnections number Number of devices that can connect to the Cisco SD_WAN servers.
rebootCount number Maximum number of restarts allowed.
crashCount number Maximum number of unrecoverable crashes
JSON code
{
"header": {
"generatedOn": 1634185346348
},
"data": [
{
"system-ip": "10.10.1.1",
"number-vsmart-control-connections": 1,
"expectedControlConnections": 1,
"rebootCount": 3,
"crashCount": 0
},
{
"system-ip": "10.10.1.5",
"number-vsmart-control-connections": 0,
"expectedControlConnections": 0,
"ompPeersUp": 0,
"ompPeersDown": 0,
"rebootCount": 2,
"crashCount": 0
},
...
]
}
Interface resource type
Provides interface resource type metrics information and its properties from the vManage dashboard.
URI
https://{{vmanage}}:{{port}}/dataservice/device/counters
Sample URI
https://<IP_address>:8443/dataservice/device/counters
Method
The supported request type
https GET
URL parameters
Name Required Description
deviceId Yes Device ID for which interface metrics are obtained.
Response
The results are returned as JSON data that contains an array of the following fields:
IBM Telco Network Cloud Manager - Performance 1.4.5 249

Name Data type Description
Name Data type Description
speed-mbps string Interface speed
mtu string Maximum Transmission Unit (MTU) is the largest size in bytes that a certain layer can forward.
vdevice-dataKey string It identifies the unique key for each record in the output.
vpn-id string Cisco VPN identification number
ifname string Interface name
if-oper-status string Specifies the operator status of the interface
if-admin-status string Specifies the configured status of the Interface
af-type string Assured Forwarding type
ifindex string Interface index
vdevice-host-name string Device hostname
uptime string Device uptime
ipv6-address string IPv6 address
hwaddr string Hardware address of the ethernet interface also known as MAC address.
ip-address string IP address
port-type string Interface type
encap-type string Encapsulation type
rx-drops string Total number of packets dropped
rx-errors string Total number of packets received with error
rx-kbps string Displays the receiving speed of the monitored device
rx-octets string Status counters for the incoming and outgoing bytes of the port
rx-packets number Total number of packets received
tx-drops string Total number of transmitted packets dropped
tx-errors string Total number of packets transmitted with error
tx-kbps string Displays the transmitted speed of the monitored device
tx-octets string Status counters for the incoming and outgoing bytes of the port
tx-packets string Total number of packets transmitted
tx-pps string Total number of transmitted packets per second
JSON code
{
"header": {
"generatedOn": 1631096272594,
"viewKeys": {
"uniqueKey": [
"vdevice-dataKey"
],
"preferenceKey": "grid-CEdgeInterface"
},
"columns": [
{
"title": "VPN (VRF)",
"property": "vpn-id",
"width": 50,
"dataType": "string"
},
{
"title": "Interface Name",
"property": "ifname",
"width": 100,
"dataType": "string"
},
{
"title": "Interface description",
"property": "description",
"width": 100,
"dataType": "string"
},
{
"title": "Physical Address",
"property": "hwaddr",
"width": 120,
"dataType": "string"
},
{
"title": "IPv4 Address",
"property": "ip-address",
"width": 120,
"dataType": "string"
},
{
"title": "IPv4 Subnet Mask",
"property": "ipv4-subnet-mask",
"width": 120,
"dataType": "string"
},
{
"title": "Admin Status",
"property": "if-admin-status",
"display": "icon",
"iconProperty": "if-admin-status",
"icon": [
250 IBM Telco Network Cloud Manager - Performance 1.4.5

{
"key": "if-state-up",
"value": "images/up.png"
},
{
"key": "if-state-down",
"value": "images/down.png"
}
],
"width": 120,
"dataType": "string"
},
{
"title": "Oper Status",
"property": "if-oper-status",
"display": "icon",
"iconProperty": "if-oper-status",
"icon": [
{
"key": "if-oper-state-ready",
"value": "images/up.png"
},
{
"key": "if-oper-state-lower-layer-down",
"value": "images/down.png"
},
{
"key": "if-oper-state-no-pass",
"value": "images/down.png"
}
],
"width": 100,
"dataType": "string"
},
{
"title": "Interface Type",
"property": "interface-type",
"width": 100,
"dataType": "string"
},
{
"title": "BIA Address",
"property": "bia-address",
"width": 100,
"dataType": "string"
},
{
"title": "IPv6 Address",
"property": "ipv6-addrs",
"hideable": true,
"dataType": "ipv6-address"
},
{
"title": "ipv4-tcp-adjust-mss",
"property": "ipv4-tcp-adjust-mss",
"width": 100,
"dataType": "string"
},
{
"title": "ipv6-tcp-adjust-mss",
"property": "ipv6-tcp-adjust-mss",
"width": 100,
"dataType": "string"
},
{
"title": "If Index",
"property": "ifindex",
"width": 75,
"dataType": "string"
},
{
"title": "AF Type",
"property": "af-type",
"width": 100,
"dataType": "string"
},
{
"title": "MTU",
"property": "mtu",
"width": 60,
"dataType": "string"
},
{
"title": "Speed (mbps)",
"property": "speed-mbps",
"width": 120,
"dataType": "string"
},
{
"title": "Tx Kbps",
"property": "tx-kbps",
"width": 100,
"dataType": "number"
},
{
"title": "Rx Kbps",
IBM Telco Network Cloud Manager - Performance 1.4.5 251

"property": "rx-kbps",
"width": 100,
"dataType": "number"
},
{
"title": "Tx PPS",
"property": "tx-pps",
"width": 100,
"dataType": "number"
},
{
"title": "Rx PPS",
"property": "rx-pps",
"width": 100,
"dataType": "number"
},
{
"title": "Rx Octets",
"property": "rx-octets",
"width": 100,
"dataType": "number"
},
{
"title": "Rx unicast Packets",
"property": "rx-packets",
"width": 100,
"dataType": "number"
},
{
"title": "Tx Octets",
"property": "tx-octets",
"width": 100,
"dataType": "number"
},
{
"title": "Tx unicast pakcets",
"property": "tx-packets",
"width": 100,
"dataType": "number"
},
{
"title": "Rx discards",
"property": "rx-drops",
"width": 100,
"dataType": "number"
},
{
"title": "Tx discards",
"property": "tx-drops",
"width": 100,
"dataType": "number"
},
{
"title": "Rx Errors",
"property": "rx-errors",
"width": 100,
"dataType": "number"
},
{
"title": "Tx Errors",
"property": "tx-errors",
"width": 100,
"dataType": "number"
},
{
"title": "Num Flaps",
"property": "num-flaps",
"width": 70,
"dataType": "string"
},
{
"title": "Last Updated",
"property": "lastupdated",
"displayFormat": "DD MMM YYYY h:mm:ss A z",
"inputFormat": "unix-time",
"hideable": false,
"minWidth": 200,
"dataType": "date"
}
],
"fields": [
{
"property": "vdevice-name",
"dataType": "string"
},
{
"property": "vdevice-host-name",
"dataType": "string"
},
{
"property": "vpn-id",
"dataType": "string"
},
{
"property": "ifname",
"dataType": "string"
252 IBM Telco Network Cloud Manager - Performance 1.4.5

},
{
"property": "description",
"dataType": "string"
},
{
"property": "hwaddr",
"dataType": "string"
},
{
"property": "ip-address",
"dataType": "string"
},
{
"property": "ipv4-subnet-mask",
"dataType": "string"
},
{
"property": "if-admin-status",
"dataType": "string",
"display": "icon"
},
{
"property": "if-oper-status",
"dataType": "string",
"display": "icon"
},
{
"property": "interface-type",
"dataType": "string"
},
{
"property": "bia-address",
"dataType": "string"
},
{
"property": "ipv6-addrs",
"dataType": "ipv6-address"
},
{
"property": "ipv4-tcp-adjust-mss",
"dataType": "string"
},
{
"property": "ipv6-tcp-adjust-mss",
"dataType": "string"
},
{
"property": "ifindex",
"dataType": "string"
},
{
"property": "af-type",
"dataType": "string"
},
{
"property": "mtu",
"dataType": "string"
},
{
"property": "speed-mbps",
"dataType": "string"
},
{
"property": "tx-kbps",
"dataType": "number"
},
{
"property": "rx-kbps",
"dataType": "number"
},
{
"property": "tx-pps",
"dataType": "number"
},
{
"property": "rx-pps",
"dataType": "number"
},
{
"property": "rx-octets",
"dataType": "number"
},
{
"property": "rx-packets",
"dataType": "number"
},
{
"property": "tx-octets",
"dataType": "number"
},
{
"property": "tx-packets",
"dataType": "number"
},
{
IBM Telco Network Cloud Manager - Performance 1.4.5 253

"property": "rx-drops",
"dataType": "number"
},
{
"property": "tx-drops",
"dataType": "number"
},
{
"property": "rx-errors",
"dataType": "number"
},
{
"property": "tx-errors",
"dataType": "number"
},
{
"property": "num-flaps",
"dataType": "string"
},
{
"property": "lastupdated",
"dataType": "date"
}
]
},
"data": [
{
"vdevice-name": "10.10.1.11",
"rx-errors": 0,
"tx-kbps": 0,
"if-admin-status": "if-state-up",
"ipv6-tcp-adjust-mss": "0",
"tx-pps": 0,
"tx-errors": 0,
"ifname": "Control Plane",
"interface-type": "iana-iftype-other",
"rx-pps": 0,
"if-oper-status": "if-oper-state-ready",
"ifindex": "0",
"num-flaps": "0",
"ipv4-tcp-adjust-mss": "0",
"rx-packets": 0,
"bia-address": "00:00:00:00:00:00",
"vpn-id": "0",
"vdevice-host-name": "dc-cedge01",
"mtu": "0",
"rx-drops": 0,
"tx-drops": 0,
"hwaddr": "00:00:00:00:00:00",
"speed-mbps": "10240000000",
"vdevice-dataKey": "10.10.1.11-0-Control Plane--00:00:00:00:00:00",
"tx-octets": 0,
"tx-packets": 0,
"rx-kbps": 0,
"rx-octets": 0,
"lastupdated": 1631096272557
},
{
"vdevice-name": "10.10.1.11",
"rx-errors": 0,
"tx-kbps": 0,
"if-admin-status": "if-state-up",
"ipv6-tcp-adjust-mss": "0",
"description": "port.sbx-mgmt",
"tx-pps": 0,
"tx-errors": 0,
"ifname": "GigabitEthernet1",
"interface-type": "iana-iftype-ethernet-csmacd",
"rx-pps": 1,
"if-oper-status": "if-oper-state-ready",
"ifindex": "1",
"num-flaps": "0",
"ipv4-tcp-adjust-mss": "0",
"rx-packets": 57260,
"bia-address": "52:54:00:04:3e:3b",
"vpn-id": "512",
"vdevice-host-name": "dc-cedge01",
"ipv4-subnet-mask": "255.255.255.0",
"mtu": "1500",
"rx-drops": 0,
"tx-drops": 0,
"hwaddr": "52:54:00:04:3e:3b",
"ip-address": "10.10.20.172",
"speed-mbps": "1024000000",
"vdevice-dataKey": "10.10.1.11-512-GigabitEthernet1-10.10.20.172-52:54:00:04:3e:3b",
"tx-octets": 5816,
"tx-packets": 60,
"rx-kbps": 2,
"rx-octets": 13821998,
"lastupdated": 1631096272557
},
...
]
}
254 IBM Telco Network Cloud Manager - Performance 1.4.5

wanLink resource type
Provides wanLink resource type metrics information from the vManage dashboard.
URI
https://{{vmanage}}:{{port}}/dataservice/statistics/approute/aggregation
Sample URL
https://<IP_address>:8443/dataservice/statistics/approute/aggregation
Method
The supported request type
https POST
URL parameters
Post query
{
"query":{
"condition":"AND",
"rules":[
{
"value":[
"1"
],
"field":"entry_time",
"type":"date",
"operator":"last_n_hours"
},
{
"value":[
"100"
],
"field":"loss_percentage",
"type":"number",
"operator":"less"
},
{
"value":[
"<replaceIP_String>"
],
"field":"vdevice_name",
"type":"string",
"operator":"in"
}
]
},
"aggregation":{
"field":[
{
"property":"local_color",
"order":"asc",
"sequence":1
}
],
"metrics":[
{
"property":"loss_percentage",
"type":"avg"
},
{
"property":"latency",
"type":"avg"
},
{
"property":"jitter",
"type":"avg"
}
]
}
}
The replaceIP_String is your device IP address from which the wanLink resource type data must be processed.
Response
The results are returned as JSON data that contains an array of the following fields:
Name Data type Description
entry_time date Metric timestamp
count number Count
local_color string Configure two tunnel interfaces, one with color silver and the other with color gold.
jitter number Jitter in your network
loss_percentage number Percentage of packet loss in your network
latency number Latency in your network
JSON code
IBM Telco Network Cloud Manager - Performance 1.4.5 255

{
"header": {
"generatedOn": 1631097887168,
"columns": [
{
"property": "entry_time",
"title": "Entry_time",
"dataType": "date",
"isDisplay": true
},
{
"property": "jitter",
"title": "Jitter",
"dataType": "number",
"isDisplay": true
},
{
"property": "loss_percentage",
"title": "Loss_percentage",
"dataType": "number",
"isDisplay": true
},
{
"property": "latency",
"title": "Latency",
"dataType": "number",
"isDisplay": true
},
{
"property": "local_color",
"title": "Local_color",
"dataType": "string",
"isDisplay": true
}
],
"fields": [
{
"property": "entry_time",
"dataType": "date"
},
{
"property": "jitter",
"dataType": "number"
},
{
"property": "loss_percentage",
"dataType": "number"
},
{
"property": "latency",
"dataType": "number"
},
{
"property": "local_color",
"dataType": "string"
}
]
},
"entryTimeList": [
1631097600000,
1631097000000,
...
],
"data": [
{
"entry_time": 1631096400000,
"count": 2,
"local_color": "mpls",
"jitter": 0.5,
"loss_percentage": 0.075,
"latency": 102.5
},
{
"entry_time": 1631096400000,
"count": 2,
"local_color": "public-internet",
"jitter": 0.5,
"loss_percentage": 0,
"latency": 102
},
...
]
}
wanLink properties
Provides properties information for the wanLink resource type from the vManage dashboard.
URI
https://{{vmanage}}:{{port}}/dataservice/device/tloc
Sample URLs
256 IBM Telco Network Cloud Manager - Performance 1.4.5

https://<IP_address>:8443/dataservice/device/tloc
Method
The supported request type.
https Post
Response
The results are returned as JSON data that contains an array of the following fields:
Name Data type Description
color string
system-ip string
bfdSessionsDown string
_id string
controlConnectionsUp string
bfdSessionsUp string
controlConnectionsDown string
JSON code
{
"header": {
"generatedOn": 1631098152425,
"title": "tlocStatus"
},
"data": [
{
"color": "mpls",
"system-ip": "10.10.1.11",
"bfdSessionsDown": 0,
"_id": 9,
"controlConnectionsUp": 2,
"bfdSessionsUp": 6,
"controlConnectionsDown": 0
},
{
"color": "default",
"system-ip": "10.10.1.1",
"expectedControlConnections": 1,
"_id": 174,
"controlConnectionsUp": 5,
"controlConnectionsToVsmarts": 1,
"controlConnectionsDown": 0
},
...
]
}
Tunnel resource type
Provides tunnel resource type metrics information and its properties from the vManage dashboard.
URI
https://{{vmanage}}:{{port}}/dataservice/statistics/approute/fec/aggregation
Sample URLs
https://<IP_address>:8443/dataservice/statistics/approute/fec/aggregation
Method
The supported request type.
https Post
URL parameters
Post query
{
"query": {
"condition": "AND",
"rules": [
{
"value": [
"1"
],
"field": "entry_time",
"type": "date",
"operator": "last_n_hours"
},
{
"value": [
"<replaceIP_String>"
],
"field": "vdevice_name",
"type": "string",
IBM Telco Network Cloud Manager - Performance 1.4.5 257

"operator": "in"
}
]
},
"aggregation": {
"field": [
{
"property": "name",
"sequence": 1,
"size": 50
},
{
"property": "proto",
"sequence": 2
}
],
"metrics": [
{
"property": "loss_percentage",
"type": "avg"
},
{
"property": "vqoe_score",
"type": "avg"
},
{
"property": "latency",
"type": "avg"
},
{
"property": "jitter",
"type": "avg"
},
{
"property": "rx_octets",
"type": "sum"
},
{
"property": "tx_octets",
"type": "sum"
}
]
}
}
The replaceIP_String is your device IP address from which the wanLink resource type data must be processed.
Response
The results are returned as JSON data that contains an array of the following fields:
Name Data type Description
loss_percentage number Percentage of packet loss in your network
latency number Latency in your network
count number Count of ?
tx_octets number Status counters for the incoming and outgoing bytes of the port
jitter number Jitter in your network
rx_octets number Status counters for the incoming and outgoing bytes of the port
proto string Protocol
name number
fecLossRecovery number Forward error correction loss recovery percent
vqoe_score number Viptela Quality of Experience (vQoE) score
JSON code
{
"header": {
"generatedOn": 1634192530194,
"columns": [
{
"property": "fec_re",
"title": "Fec_re",
"dataType": "number",
"isDisplay": true
},
{
"property": "vqoe_score",
"title": "Vqoe_score",
"dataType": "number",
"isDisplay": true
},
{
"property": "fec_tx",
"title": "Fec_tx",
"dataType": "number",
"isDisplay": true
},
{
"property": "jitter",
"title": "Jitter",
"dataType": "number",
"isDisplay": true
258 IBM Telco Network Cloud Manager - Performance 1.4.5

},
{
"property": "rx_octets",
"title": "Rx_octets",
"dataType": "number",
"isDisplay": true
},
{
"property": "loss_percentage",
"title": "Loss_percentage",
"dataType": "number",
"isDisplay": true
},
{
"property": "proto",
"title": "Proto",
"dataType": "string",
"isDisplay": true
},
{
"property": "latency",
"title": "Latency",
"dataType": "number",
"isDisplay": true
},
{
"property": "name",
"title": "Name",
"dataType": "string",
"isDisplay": true
},
{
"property": "fec_rx",
"title": "Fec_rx",
"dataType": "number",
"isDisplay": true
},
{
"property": "tx_octets",
"title": "Tx_octets",
"dataType": "number",
"isDisplay": true
}
],
"fields": [
{
"property": "fec_re",
"dataType": "number"
},
{
"property": "vqoe_score",
"dataType": "number"
},
{
"property": "fec_tx",
"dataType": "number"
},
{
"property": "jitter",
"dataType": "number"
},
{
"property": "rx_octets",
"dataType": "number"
},
{
"property": "loss_percentage",
"dataType": "number"
},
{
"property": "proto",
"dataType": "string"
},
{
"property": "latency",
"dataType": "number"
},
{
"property": "name",
"dataType": "string"
},
{
"property": "fec_rx",
"dataType": "number"
},
{
"property": "tx_octets",
"dataType": "number"
}
]
},
"data": [
{
"loss_percentage": 0,
"latency": 2.75,
"count": 4,
IBM Telco Network Cloud Manager - Performance 1.4.5 259

"tx_octets": 0,
"jitter": 1,
"rx_octets": 0,
"proto": "IPSEC",
"name": "10.10.1.13:mpls-10.10.1.17:public-internet",
"fecLossRecovery": "-",
"vqoe_score": 10
},
...
]
}
Application resource type
Provides application resource type metrics information and its properties from the vManage dashboard.
URI
https://{{vmanage}}:{{port}}/dataservice/statistics/dpi/aggregation
Sample URLs
https://10.10.20.90:8443/dataservice/statistics/dpi/aggregation
Method
The supported request type.
https Post
URL parameters
Post query
{
"query": {
"condition": "AND",
"rules": [
{
"value": [
"1"
],
"field": "entry_time",
"type": "date",
"operator": "last_n_hours"
},
{
"value": [
"replaceIP_String"
],
"field": "vdevice_name",
"type": "string",
"operator": "in"
},
{
"value": [
"network-service",
"web",
"webmail"
],
"field": "family",
"type": "string",
"operator": "in"
}
]
},
"aggregation": {
"field": [
{
"property": "family",
"sequence": 1,
"size": 3
}
],
"metrics": [
{
"property": "octets",
"type": "sum"
}
],
"histogram": {
"property": "entry_time",
"type": "minute",
"interval": 10,
"order": "asc"
}
}
}
Response
The results are returned as JSON data that contains an array of the following fields:
Name Data type Description
260 IBM Telco Network Cloud Manager - Performance 1.4.5

Name Data type Description
entry_time date
count number
family string
octets number
JSON code
{
"header": {
"generatedOn": 1631098307381,
"columns": [
{
"property": "entry_time",
"title": "Entry_time",
"dataType": "date",
"isDisplay": true
},
{
"property": "octets",
"title": "Octets",
"dataType": "number",
"isDisplay": true
},
{
"property": "family",
"title": "Family",
"dataType": "string",
"isDisplay": true
}
],
"fields": [
{
"property": "entry_time",
"dataType": "date"
},
{
"property": "octets",
"dataType": "number"
},
{
"property": "family",
"dataType": "string"
}
]
},
"entryTimeList": [
1631098200000,
1631097600000,
1631097000000,
1631096400000,
1631095800000,
1631095200000,
1631094600000
],
"data": [
{
"entry_time": 1631096400000,
"count": 43,
"family": "network-service",
"octets": 243330
},
{
"entry_time": 1631096400000,
"count": 14,
"family": "web",
"octets": 4032
},
{
"entry_time": 1631095200000,
"count": 67,
"family": "network-service",
"octets": 342068
},
...
]
}
Application Per Tunnel resource type
Provides applicationPerTunnel resource type metrics information and its properties from the vManage dashboard.
URI
https://{{vmanage}}:{{port}}/dataservice/statistics/dpi
Sample URL
https://<IP_address>:8443/dataservice/statistics/dpi
IBM Telco Network Cloud Manager - Performance 1.4.5 261

Method
The supported request type.
https GET
Response
The results are returned as JSON data that contains an array of the following fields:
Name Data type Description
host_name string
vmanage_system_ip string
device_model string
octets number
packets number
application string
family string
entry_time date
vmanage_system_ip string
local_system_ip string
local_color string
remote_system_ip string
remote_color string
JSON code
{
"header": {
"generatedOn": 1631169026088,
"viewKeys": {
"uniqueKey": [],
"preferenceKey": "grid-raw_dpistatistics"
},
"columns": [],
"fields": [
{
"property": "vip_idx",
"dataType": "number"
},
{
"property": "entry_time",
"dataType": "date"
},
{
"property": "vpn_id",
"dataType": "number"
},
{
"property": "source_ip",
"dataType": "string"
},
{
"property": "dest_ip",
"dataType": "string"
},
{
"property": "source_port",
"dataType": "number"
},
{
"property": "dest_port",
"dataType": "number"
},
{
"property": "octets",
"dataType": "number"
},
{
"property": "packets",
"dataType": "number"
},
{
"property": "application",
"dataType": "string"
},
{
"property": "family",
"dataType": "string"
},
{
"property": "create_time",
"dataType": "date"
},
{
"property": "expire_time",
"dataType": "date"
},
{
"property": "ip_proto",
"dataType": "number"
262 IBM Telco Network Cloud Manager - Performance 1.4.5

},
{
"property": "tunnel_encap",
"dataType": "string"
}
],
"chart": {
"xAxis": [
"entry_time"
],
"yAxis": [
"octets",
"packets"
],
"series": [
"family",
"application"
],
"title": "DPI",
"xAxisLabel": "Time",
"yAxisLabel": ""
}
},
"data": [
{
"ip_proto": 17,
"remote_color": "public-internet",
"device_model": "vedge-CSR-1000v",
"pkt_dup_r_pkts": 0,
"device_family": "network-service",
"fec_d_pkts": 0,
"packets": 4,
"source_ip": "10.10.21.11",
"local_color": "public-internet",
"flow_id": 9223372036854775807,
"statcycletime": 1631167800160,
"source_port": 48818,
"octets": 284,
"local_system_ip": "10.10.1.13",
"tenant": "default",
"dest_port": 53,
"entry_time": 1631166801245,
"tunnel_encap": "IPSEC",
"create_time": 1631166785479,
"device_application": "dns",
"vip_time": 1631166801245,
"end_time": 1631166790484,
"expire_time": 1631166790484,
"vmanage_system_ip": "10.10.1.13",
"start_time": 1631166785479,
"application": "dns",
"remote_system_ip": "10.10.1.11",
"vdevice_name": "10.10.1.13",
"dest_ip": "10.17.248.11",
"vip_idx": 90,
"family": "network-service",
"fec_r_pkts": 0,
"host_name": "site1-cedge01",
"vpn_id": 1,
"id": "AXvJLWNmag33uAGRiAXu"
},
{
"ip_proto": 17,
"remote_color": "mpls",
"device_model": "vedge-CSR-1000v",
"pkt_dup_r_pkts": 0,
"device_family": "network-service",
"fec_d_pkts": 0,
"packets": 4,
"source_ip": "10.10.22.11",
"local_color": "mpls",
"flow_id": 9223372036854775807,
"statcycletime": 1631167800162,
"source_port": 41696,
"octets": 284,
"local_system_ip": "10.10.1.15",
"tenant": "default",
"dest_port": 53,
"entry_time": 1631166801017,
"tunnel_encap": "IPSEC",
"create_time": 1631166785791,
"device_application": "dns",
"vip_time": 1631166801017,
"end_time": 1631166790793,
"expire_time": 1631166790793,
"vmanage_system_ip": "10.10.1.15",
"start_time": 1631166785791,
"application": "dns",
"remote_system_ip": "10.10.1.11",
"vdevice_name": "10.10.1.15",
"dest_ip": "10.17.248.11",
"vip_idx": 93,
"family": "network-service",
"fec_r_pkts": 0,
"host_name": "site2-cedge01",
"vpn_id": 1,
IBM Telco Network Cloud Manager - Performance 1.4.5 263

"id": "AXvJLWNoag33uAGRiAZL"
},
...
],
"pageInfo": {
"startTime": "1631166801245",
"endTime": "1631166185804",
"count": 269
}
}
Related information
Cisco SD-WAN vManage API
Known issue with interface speed in Cisco Edge devices
The interface speed value from the Cisco Edge devices (Cloud Services Router (CSR) 1000 V) is shown in bps instead of Mbps. It results in incorrect value for the interface
utilization metrics.
For more information about this issue, see Cisco Bug: CSCvu63792 - vManage REST API reports cedge interface speed in bps.
Configuring the Cloud Monitoring Technology Packs
Monitoring the cloud platforms is critical to organizations. Cloud Monitoring makes it easier to identify patterns and discover potential security risks in the infrastructure.
The Cloud Monitoring Technology Packs in Telco Network Cloud Manager - Performance collect performance metrics across the cloud system that can be visualized in the
built-in dashboards.
Overview
In Telco Network Cloud Manager - Performance, two cloud infrastructure monitoring technology packs are available. These Technology Packs help to manage, monitor,
and evaluate the performance Kubernetes and VMware cloud computing architecture, infrastructure, and services.
Kubernetes cloud platform monitoring
VMware monitoring
In this solution, Telegraf is used to collect the performance metrics from cloud infrastructure. Telegraf is a plugin-driven open source server agent for collecting and
sending metrics and events from databases.
Architecture of the solution is as follows:
1. Telegraf agent collects performance metrics from the managed systems.
2. Collected metrics are written to a Kafka topic in InfluxDB line protocol format.
3. Data from the external Kafka is sent to the NiFi Service in Telco Network Cloud Manager - Performance.
4. The data is then published to the Kafka Service in Telco Network Cloud Manager - Performance and converted to Avro format.
5. The Avro format records are sent to the File Collector Service in Telco Network Cloud Manager - Performance that can then be stored in database.
Install the Technology Packs
1. Download and extract the M06VTML.tar.gz file that contains the Technology Pack from IBM® Passport Advantage®.
It contains the following Technology Packs:
cloud-kubernetes-1.8.0.jar
cloud-vmware-vsphere-1.1.0.jar
For more information, see Download the Technology Pack.
2. Install Technology Packs.
Deploying Telegraf plug-in to monitor cloud and virtualization clusters
Monitoring the cloud platforms is critical to organizations. In Telco Network Cloud Manager - Performance, Cloud Monitoring Technology Packs are introduced.
These packs collect performance metrics across the cloud system that can be visualized in the built-in dashboards.
Setting up Apache NiFi
Set up and start Apache NiFi to convert the data files that are collected from external Kafka. Convert the data to Avro format records and write them to Kafka. These
records are then picked up by File Collector for processing the metrics and device inventory data.
264 IBM Telco Network Cloud Manager - Performance 1.4.5

Deploying Telegraf plug-in to monitor cloud and virtualization clusters
Monitoring the cloud platforms is critical to organizations. In Telco Network Cloud Manager - Performance, Cloud Monitoring Technology Packs are introduced. These
packs collect performance metrics across the cloud system that can be visualized in the built-in dashboards.
Cluster setup
You require three environments:
Cluster where Telco Network Cloud Manager - Performance is installed. It is where the Monitoring Technology Pack is installed.
Server where the Telegraf plug-in is installed that can be referred to as the agent environment. This server must be outside the managed cluster that is being
monitored.
Kubernetes cluster that you want to monitor and collect performance metrics. These metrics are collected and sent to Telco Network Cloud Manager - Performance
database for visualization. This cluster can be referred to as the managed cluster.
Telegraf Set up tasks
Before you begin
Configure the managed Kubernetes cluster to communicate with Telegraf agent
Set up Telegraf agent
Install and configure Kafka on agent environment
Telegraf agent maintenance
Troubleshooting
Before you begin
You must install the Telegraf agent and external Kafka in the same network as the managed environment.
Get the Telegraf configuration files from the Technology Packs.
Packs are extracted at /installers/core folder. It is referred to as <DIST_DIR>.
The M06VTML.tar.gz bundle has the following technology packs:
cloud-kubernetes-1.8.0.jar
Note: You need this Technology pack to monitor the performance of a Kubernetes cluster.
You can see the following files in the /plugin folder:
remote_monitoring.yaml
telegraf.conf
telegraf_linux_amd64
cloud-vmware-vsphere-1.1.0.jar
Note: You need this technology pack to monitor the performance of a VMware cluster.
Configure the managed Kubernetes cluster to communicate with Telegraf agent
Follow these steps on the Kubernetes cluster that you are trying to monitor:
1. Copy the remote_monitoring.yaml file from the <DIST_DIR> where you extracted the cloud-kubernetes-1.8.0.jar file.
Custom Resource Definition that can create the namespace, serviceaccount, ClusterRole, and ClusterRoleBinding objects for the managed cloud
cluster. These objects are needed to connect the Telegraf agent with the managed cloud cluster.
2. Run the following command to apply the Custom Resource definition:
kubectl apply -f remote_monitoring.yaml
The following objects are created:
Namespace – remote-telegraf-ns
Service account – remote-telegraf-account
ClusterRole – remote-telegraf-roles
ClusterRoleBindings – remote-telegraf-rolebind , remote-telegraf-scc-rolebind, remote-telegraf-kubelet-rolebind
3. Verify that the token is generated under the remote-telegraf-ns namespace with the following command:
kubectl get secret -n remote-telegraf-ns
A token is generated. For example, remote-telegraf-account-token_<value>.
4. Copy and use the token that is generated in the previous step to get the secret with the following command:
kubectl describe secret remote-telegraf-account-token-q9qq4 -n remote-telegraf-ns
Note: Token is used as the bearer_token_string during the configuration of Telegraf.
5. To monitor etcd component, copy the etcd certificates and key from this managed Kubernetes environment to system where the Telegraf agent is installed. The
certificates (apiserver-etcd-client.crt and apiserver-etcd-client.key) are usually at /etc/kubernetes/pki.
6. Run the following commands to get the managed cluster details.
To get apiserver URL, run the kubectl cluster-info command.
Note: The apiserver URL is needed in both Kubernetes plugin and kube_inventory plugin during Telegraf setup.
To get nodeIP, run the kubectl get nodes -o wide command.
7. To get nodePorts, run the kubectl cluster-info dump >
dump.txt command.
IBM Telco Network Cloud Manager - Performance 1.4.5 265

Search for daemonEndpoints in the dump.txt file. For each node, one daemonEndpoints block is available, which contain the port of kubelet.
Note: Apiserver URL, NodeIP, and nodePorts are used to configure the Kubernetes plug-in of Telegraf agent.
8. To get the apiserver_url, scheduler_url, and controller_url, follow these steps:
In the managed Kubernetes cluster, go to /etc/kubernetes/manifests and locate the following files:
etcd.yaml
The default port for etcd is 2379.
kube-apiserver.yaml
The default port for api-sever is 6443.
kube-scheduler.yaml
The default port for scheduler is 10259.
kube_controller-manager.yaml
The default port for controller is 10257.
Get the IP address and port details from the yaml files.
9. Go to agent environment and check if the apiserver, scheduler, and controller IP addresses are accessible by using this command:
telnet <masterNode_IP> <port>
Configure the Telegraf agent plug-ins
Configure the Kubernetes, kube_inventory, and kube_admin plug-ins for your cluster monitoring in agent environment.
1. Copy the /plugin/telegraf.conf and /plugin/telegraf_linux_amd64 files from the Technology Pack to the agent environment to a location of your choice. For example,
/opt/<remote_monitor_setup>.
The telegraf.conf file has different input blocks, and each block represents one input plug-in.
2. • Get the Kubernetes nodes by using following command on the managed Kubernetes system:
kubectl get nodes -o wide
3. Configure the telegraf.conf file to enter the following values:
Block Values
[[inputs.kubernetes]] kubelet_url = "https://10.10.10.10:10250"
apiserver_url = "https://10.10.10.10:6443"
bearer_token_string = "aaabbbccc"
insecure_skip_verify = true
Note: The number of inputs.kubernetes blocks depends on the number of nodes you have in your managed cluster.
For more information, see https://github.com/influxdata/telegraf/tree/master/plugins/inputs/kubernetes
[inputs.kube_inventory]] [[inputs.kube_inventory]]
insecure_skip_verify = true
namespace = ""
url = "https://10.10.10.10:6443"
bearer_token_string = "aaabbbccc"
You can get the list of nodes in your managed cluster with the following command:
kubernetes get nodes -o wide
Note: Every managed cluster must have one [inputs.kube_inventory]] block.
For more information, see https://github.com/influxdata/telegraf/tree/master/plugins/inputs/kube_inventory
[[inputs.kube_admin]] apiserver_urls = [ "https://10.10.10.10:6443" ] # list of all API-Server urlspresent
(separated by semicolon )in your cluster setup.
insecure_skip_verify = true
bearer_token_string = "aaabbbccc"
controller_urls = [ "https://10.10.10.10:10257" ] # list of all controller_urls (separated
by semicoln )present in your cluster setup.
scheduler_urls = [ "https://10.10.10.10:10259" ] # list of all scheduler_urls (separated
by semicolon ) present in your cluster setup
# #etcd_urls = [ "https://10.10.10.10:2379" ]
# # path of certificates stored in agent environment
# #tls_cert = "D:/__TELEGRAPH/CODEBASE/etcd_certs/apiserver-etcd-client.crt"
# #tls_key = "D:/__TELEGRAPH/CODEBASE/etcd_certs/apiserver-etcd-client.key"
Note: Every managed cluster must have one [[inputs.kube_admin]] block.
266 IBM Telco Network Cloud Manager - Performance 1.4.5

Block Values
[[inputs.vsphere]]
It is needed to configure the
VMWare(vsphere) plug-in.
## List of vCenter URLs to be monitored.
vcenters = [ "https://10.10.100.10" ]
username = "abc" #"ibm_user"
password = "abc@123" #"abc@123"
insecure_skip_verify = true
datastore_instances = true
Note: This block must be configured for vShpere Client.
For more information, see https://github.com/influxdata/telegraf/tree/master/plugins/inputs/vsphere.
Set up Kafka on the agent environment
Install Kafka
Use the following steps to install Kafka:
1. Install Java™ to run Apache Kafka without any errors.
# yum -y install java-1.8.0-openjdk
# java -version
2. Download the most recent stable version of Apache Kafka from the official website or use the following wget command to download it directly and extract it.
wget https://mirrors.estointernet.in/apache/kafka/2.7.0/kafka_2.13-2.7.0.tgz
tar -xzf kafka_2.13-2.7.0.tgz
Note: If the wget command fails, use
wget https://archive.apache.org/dist/kafka/2.8.1/kafka-2.8.1-src.tgz
3. Create a symbolic link for Kafka package, then add Kafka environment path to .bash_profile file and then initialize it as shown.
ln -s kafka_2.13-2.7.0 kafka
# echo "export PATH=$PATH:/root/kafka_2.13-2.7.0/bin" >> ~/.bash_profile
# source ~/.bash_profile
4. Start the Zookeeper, which comes built-in with the Kafka package. Since it is a single node cluster, you can start the zookeeper with default properties.
zookeeper-server-start.sh -daemon /root/kafka/config/zookeeper.properties
5. Telnet to Zookeeper port at 2181 to validate whether the zookeeper is accessible or not by telnet to Zookeeper port 2181.
telnet localhost 2181
6. Create a topic.
kafka-topics.sh --create --zookeeper localhost:2181 --replication-factor 1 --partitions 1 --topic <topic_name>
7. Verify that the topic is created.
kafka-topics.sh --zookeeper localhost:2181 --list
For more information, see https://kafka.apache.org/quickstart.
Configure Kafka output plug-in
Add following block in the telegraf.conf file to send the metrics to Kafka server.
[[outputs.kafka]]
brokers = ["10.46.43.195:9093"] # Port of Kafka broker
topic = "minikube" # kafka topic
For more information, see https://github.com/influxdata/telegraf/tree/master/plugins/outputs/kafka.
Telegraf agent maintenance
Start the Telegraf agent
After the configuration of the input plug-ins and the Kafka output plug-in is complete, start the Telegraf agent by using the following command:
./telegraf_linux_amd64 -config ./telegraf.conf
If user want to run the Telegraf agent as background service, then go to the location /etc/systemd/system/ and create telegraf.service with the following
content:
[Unit]
Description=Telegraf Service
[Service]
Type=simple
Restart=always
RestartSec=1
User=root
ExecStart=/opt/<remote_monitor_setup>/telegraf_linux_amd64 -config /opt/<remote_monitor_setup>/telegraf.conf
[Install]
WantedBy=multi-user.target
Run the following commands to start and stop the Telegraf Service:
systemctl start telegraf
systemctl stop telegraf
systemctl status telegraf
Clean up the Telegraf agent
IBM Telco Network Cloud Manager - Performance 1.4.5 267

If you need to clean up the Telegraf agent for some reason, delete the binary files and configuration files from the agent environment.
Note: If you created the background service, delete the /etc/systemd/system/telegraf.service file.
Troubleshooting
If you notice issues to connect to the managed environment, and you are unable to telnet to the master node, follow these steps on all the master nodes in your cluster:
1. Open the /etc/kubernetes/manifests/kube-scheduler.yaml file, modify the following lines:
Clear the line (spec->containers->command) containing this phrase: -
--port=0
Change the - --bind-address=127.0.0.1 to -
--bind-address=masterNodeIP
Change the host to masterNodeIP and port to 10259 under livenessProbe and startupProbe.
2. Open the /etc/kubernetes/manifests/kube-controller-manager.yaml file, update the following lines:
Clear the line (spec->containers->command) containing this phrase: - --port=0
Change the - --bind-address=127.0.0.1 to - --bind-address=
masterNodeIP
Change the host to masterNodeIP and port to 10257 under livenessProbe and startupProbe.
Restart the kubelet Service with the following command:
sudo systemctl restart kubelet.service
Verify that you are now able to connect to the managed environment.
telnet <masterNodeIP> <port>
Setting up Apache NiFi
Set up and start Apache NiFi to convert the data files that are collected from external Kafka. Convert the data to Avro format records and write them to Kafka. These
records are then picked up by File Collector for processing the metrics and device inventory data.
Access the NiFi UI
Follow these steps to access the NiFi web interface on OpenShift® Container Platform:
1. Log in to your cloud platform web console of your cluster.
2. Make sure you are in tncp project or namespace.
3. Navigate to Networking > Routes.
4. Click the NiFi route link.
You can see the UI that has a canvas to orchestrate a data flow for the installed File-based Technology Packs:
1. Open a web browser and type the following URL on Kubernetes cloud platform:
http://<node_hostname>:30026/nifi
Where, <node_hostname> is the hostname of any node in your cluster.
30026 is the port number of the NiFi Service on the node where it is installed.
You can see the UI that has a canvas to orchestrate a data flow for the installed File-based Technology Packs:
Configuring the NiFi flow for Kubernetes Technology Pack
Processor Property Default value
ConsumeKafka Kafka brokers <external_kafka_host_IP>:9092
Topic Name(s) <kafka_topic_name>
Group ID <kafka_topic_name>
PublishKafka Kafka brokers kafka:9092
QueryRecord Cache Schema Update the interval value to 300 in the select statement.
Configuring the NiFi flow for VMware Technology Pack
Processor Property Default value
ConsumeKafka Kafka brokers <external_kafka_host_IP>:9092
Topic Name(s) <kafka_topic_name>
Group ID <kafka_topic_name>
PublishKafka Kafka brokers kafka:9092
QueryRecord Cache Schema Update the interval value to 300 in the select statement.
Remote monitoring
268 IBM Telco Network Cloud Manager - Performance 1.4.5

Remote monitoring enables connectivity of two or more computers or network nodes that are on separate networks and in different geographical locations.
With the help of Telco Network Cloud Manager - Performance, you can monitor the following types of network traffic remotely:
Flow data collection
SNMP data discovery and collection
ICMP ping data collection
Setting up Remote Flow Collector
Optionally, install the Flow Collector Service on a remote host as a stand-alone installation to keep the collector closer to your data center. Remote Flow Collector
sends captured flow packet to flow collector that uses Kafka messaging.
Setting up Remote SNMP discovery and collection
You can set up the SNMP discovery and metric collection remotely on a separate node. You can set up Telco Network Cloud Manager - Performance to discover
resource types and metrics from the SNMP-enabled devices alone.
Setting up Remote ICMP Ping Collector
Optionally, install the ICMP Ping Collector Service on a remote host as a stand-alone installation to keep the collector closer to your data center. Remote Ping
Collector sends ping requests and captures ping responses, and then writes ping metrics and resource details to Timeseries and Inventory directly.
Setting up Remote Flow Collector
Optionally, install the Flow Collector Service on a remote host as a stand-alone installation to keep the collector closer to your data center. Remote Flow Collector sends
captured flow packet to flow collector that uses Kafka messaging.
Before you begin
You can install Kafka version 2.4.1 on the server where you want to install Remote Flow Collector or use other Kafka cluster if available.
Make sure you have Java™ SDK v8 on the node where you are installing the Remote Flow Collector.
Procedure
1. Download and extract the IBM® Telco Network Cloud Manager - Performance, version 1.4.5 English Multiplatform Advanced package that has M0H7JEN.tar.gz file.
Download and extract the file to <DIST_DIR>.
2. Copy and extract the /remote/basecamp-remote-flow-collector-2.4.5.0.tar.gz file to a location of your choice.
You can see the following files and folders:
bin
conf
etc
lib
work
3. Edit the settings in /conf/application.conf file.
Parameter Description Default value
collector.flow.ud
p.ports
The UDP port from where the Flow Collector is listening. 4379
collector.flow.sc
tp.ports
The SCTP port from where the Flow Collector is listening. 4381
main.zk-url URL with Zookeeper node IP address with port number http://<zookeeper_IP_add>:2181
messaging.kafk
a.broker-list
Kafka brokerlist with Kafka node IP address with port number <kafka_IP_add>:9092
messaging.kafk
a.zk-connect
Zookeeper node IP address with port number <zookeeper_IP_add>:2181
remote.id Unique ID for the Remote Flow Collector rfc1
remote.context Domain name of the Remote Flow Collector node.
It is required to append the domain name to the interfaces. Currently, it is used for Flow
interfaces only to avoid overlapping of IP addresses from different domains that can be uniquely
identified with domain name that is appended to the IP addresses.
Note: The remote.context parameter is introduced to represent a domain.
"MY"
remote.topic The name of the Kafka topic to which the records that are collected from the Remote Flow
Collector are written to.
<remote.flow.topic>
remote.cluster.c
ollector.protocol
The cluster Flow Collector Service protocol or the Dashboard Service protocol if you are
accessing with proxy server setup.
http
remote.cluster.c
ollector.hosts
The cluster Flow Collector Service host or dashboard if via proxy <host name>
remote.cluster.c
ollector.port
Port number of the cluster where the Remoter Flow Collector is installed.
Use the <proxy_port> if you have configured a proxy server.
30040
On OpenShift® Container Platform, the port is
443. Typically, the port of the Route, is 443,
which is the default https port.
If you have configured a proxy server, this
port is the Dashboard Service port, which is
31443 in Kubernetes environment.
remote.cluster.c
ollector.proxy.pa
th
Proxy server path. Note: Optional, use this only if you have
configured a proxy server.
IBM Telco Network Cloud Manager - Performance 1.4.5 269

Parameter Description Default value
remote.cluster.c
ollector.proxy.to
kens
Proxy server token. Note: Optional, use this only if you have
configured a proxy server.
In Kubernetes environment, the token can be
obtained from here:
<https://<server>:
<dashboardPort>/remoteToken/>
In OpenShift Container Platform
environment, the token can be obtained from
here:
https://<dashboard-route>/remoteToken/<
Note: Optional, use this only if you have
configured a proxy server.
collector.flow.udp.ports = [ 4379 ]
collector.flow.sctp.ports = [ 4381 ]
main.zk-url = "http://<zookeeper_node_IP_add>:2181"
messaging.kafka.broker-list = "<kafka_node_IP_add>:9092"
messaging.kafka.zk-connect = "<zookeeper_node_IP_add>:2181"
remote.id = "remote-X"
remote.context = ""
remote.topic = "remote.flow.topic"
remote.cluster.collector.protocol = "http"
remote.cluster.collector.hosts = [<cluster-node>]
remote.cluster.collector.port = 30040
remote.cluster.collector.proxy.path = ""
remote.cluster.collector.proxy.tokens = [""]
4. Use the following command to run bin/remote-flow-collector script:
cd <DIST_DIR>/remote_flow
./bin/remote-flow-collector
5. Check the log files in the Flow Collector Pod in your cluster.
[INFO] [2020-11-16 11:22:48.720] [akka.tcp://flow-collector@<IP>:2554/user/basecamp-flow-collector/flow-collector/flow-
collector-mgr/singleton] [flow-collector-flow-collector.dispatcher-2111] remote RemoteCollector [
<collector.flow.remote.id>,<messaging.kafka.broker-list>.<collector.flow.remote.topic>,,9223372030684775807) already
registered
[INFO] [2020-11-16 11:22:48.716] [akka.actor.ActorSystemImpl (flow-collector)] [qtp85930990-46] Receiving
RemoteCollector(<collector.flow.remote.id>,<message.kafka.broker.list>,<collector.flow.remote.topic>,,9223372030684775807)
Related information
Remote Flow Collector
Setting up Remote SNMP discovery and collection
You can set up the SNMP discovery and metric collection remotely on a separate node. You can set up Telco Network Cloud Manager - Performance to discover resource
types and metrics from the SNMP-enabled devices alone.
Before you begin
If you are on OpenShift® Container Platform, create a route for the Inventory Service and Timeseries Service.
Note: Remote Flow Collector, Remote SNMP Collector, and Remote SNMP Discovery must use proxy to connect to the cluster services via https protocol. The proxy is the
Dashboard Service. In OpenShift Container Platform environment, you can use the service route as the hostname and port is 443. In Kubernetes environment, you can use
nodePort to directly access the proxy or use the HA Proxy to access proxy.
Install Remote SNMP Discovery
1. On a separate server where you want to install the SNMP Discovery, copy the basecamp-remote-snmp-discovery-2.4.3.0.tar.gz file from the Advanced bundle
(M0H7JEN.tar.gz).
2. Extract the basecamp-remote-snmp-collector-2.4.5.0.tar.gz file.
Extract the file to <DIST_DIR>/remote/<remote_snmp_discovery>.
3. Remove the <DIST_DIR>/remote/<remote_snmp_discovery>/conf/application-remote-centric.conf file.
4. Rename the <DIST_DIR>/remote/<remote_snmp_discovery>/conf/application-cluster-centric.conf to application.conf.
The contents of the application.conf file are as follows:
# Non-configurable sections
main.zk-url="localhost:2181"
config.user=postgres
config.password=postgres
snmp-discovery.entity.discovery-content-path=content
cluster.name=snmpdiscovery
remote.enabled=true
config.url="http://localhost"
270 IBM Telco Network Cloud Manager - Performance 1.4.5

# Configurable sections
remote.prefix-with-context=true
remote.context=<prefixString>
inventory-service.protocol=https
inventory-service.hosts="cluster-node"
inventory-service.port=31443
inventory-service.proxy.path=inventory/
inventory-service.proxy.tokens="Tokens"
remote.cluster.discovery.protocol=https
remote.cluster.discovery.hosts=["cluster-node"]
remote.cluster.discovery.port=31443
remote.cluster.discovery.proxy.path=snmp-discovery/
remote.cluster.discovery.proxy.tokens=["Token"]
akka.cluster.local.seeds=["remote-node"]
Install Remote SNMP Collector
1. On a separate server where you want to install the SNMP Collector, copy the basecamp-remote-snmp-collector-2.4.3.0.tar.gz file from the Advanced bundle
(M0H7JEN.tar.gz).
2. Extract the /remote/basecamp-remote-snmp-collector-2.4.5.0.tar.gz file.
Extract the file to <DIST_DIR>/remote/<remote_snmp_collector> folder.
3. Remove the <DIST_DIR>/remote/<remote_snmp_collector>/conf/application-remote-centric.conf file.
4. Rename the <DIST_DIR>/remote/<remote_snmp_collector>/application-cluster-centric.conf to application.conf.
The contents of the file are as follows:
# Non-configurable sections
main.zk-url="localhost:2181"
messaging.kafka.zk-connect="localhost:2181"
messaging.kafka.broker-list="localhost:9092"
formula.sharding.journal-plugin=jdbc-journal
formula.sharding.snapshot-plugin=jdbc-snapshot-store
jdbc-journal.slick.db.driver="org.h2.Driver"
jdbc-snapshot-store.slick.db.driver="org.h2.Driver"
remote.enabled=true
cluster.name=snmp-collector
# Configurable sections
remote.context=<prefixString>
inventory-service.hosts="cluster-node"
inventory-service.port=31443
inventory-service.protocol=https
inventory-service.proxy.path=inventory/
inventory-service.proxy.tokens="Tokens"
timeseries-service.hosts=["cluster-node"]
timeseries-service.port=31443
timeseries-service.protocol=https
timeseries-service.proxy.path=timeseries/
timeseries-service.proxy.tokens=["Tokens"]
remote.cluster.collector.protocol=https
remote.cluster.collector.hosts=["cluster-node"]
remote.cluster.collector.port=31443
remote.cluster.collector.proxy.path=snmp-collector/
remote.cluster.collector.proxy.tokens=["Tokens"]
akka.cluster.local.seeds=["remote-node"]
jdbc-journal.slick.db.url="jdbc:h2:tcp://<first-remote-node>:9092/akka-persistence;DATABASE_TO_UPPER=false;"
jdbc-snapshot-store.slick.db.url="jdbc:h2:tcp://<first-remote-node>:9092/akka-persistence;DATABASE_TO_UPPER=false;"
Configure Remote SNMP Discovery
Edit the application.conf file to configure the connections from Remote SNMP Discovery with the following services in your cloud platform clusters:
Inventory
SNMP Discovery
Parameter Description Default value
remote.prefix-with-context To determine whether you want to prefix Resource type ID with remote.context. By default, it is set to true.
remote.context Prefix that can be used for the Resource type ID and remoteContext property. <prefixString>
For example, IND or MY to indicate the
geographies.
inventory-service.hosts
Inventory Service hostname in your cluster
Inventory Service route
<cluster-node>
inventory-service.port
Dashboard Service port
80 that is used on the route.
By default, Dashboard Service port is
31443.
inventory-service.protocol Inventory Service protocol https
inventory-service.proxy.path Proxy server path inventory/
IBM Telco Network Cloud Manager - Performance 1.4.5 271

Parameter Description Default value
inventory-service.proxy.tokens Proxy server token can be obtained from https://<dashboard_service_host>:
<dashboard_Port>/remoteToken/
<Tokens>
remote.cluster.discovery.hosts The Remote SNMP Discovery Service host. <remote-SNMP_discovery_host>
remote.cluster.discovery.port The Remote SNMP Discovery port. 31443
remote.cluster.discovery.proto
col
The Remote SNMP Discovery protocol https
remote.cluster.discovery.proxy.
path
The proxy path snmp-discovery/
remote.cluster.discovery.proxy.
tokens
Proxy token can be obtained from https://<dashboard_service_host>:
<dashboard_Port>/remoteToken/.
<Token>
akka.cluster.local.seeds The Remote Collector Service node <remote-SNMP_collector_host>
Configure Remote SNMP Collector
Edit the application.conf file to configure the connections from Remote SNMP Collector with the following services in your cloud platform clusters:
Inventory
Timeseries
SNMP Collector
Parameter Description Default value
remote.context Prefix that can be used for the Resource type ID and remoteContext property. <prefixString>
For example, IND or MY to indicate the
geographies.
inventory-
service.hosts Inventory Service hostname in your cluster
Inventory Service route
<cluster-node>
inventory-
service.port Cluster Dashboard Service port
Cluster Dashboard Service port that is used on the route.
By default, Dashboard Service port is
31443. In OpenShift Container Platform, it
is 80.
inventory-
service.protocol
Inventory Service protocol https
inventory-
service.proxy.path
Proxy server path. inventory/
inventory-
service.proxy.toke
ns
Proxy server token can be obtained from https://<dashboard_service_host>:
<dashboard_Port>/remoteToken/
<Tokens>
timeseries-
service.hosts Timeseries Service hostname in your cluster
Timeseries Service route
<cluster-node>
timeseries-
service.port Cluster Dashboard Service port
Cluster Dashboard Service port that is used on the route.
By default, Dashboard Service port is
31443. In OpenShift Container Platform, it
is 80.
timeseries-
service.protocol
Timeseries Service protocol https
timeseries-
service.proxy.path
Proxy server path. timeseries/
timeseries-
service.proxy.toke
ns
Proxy server token can be obtained from https://<dashboard_service_host>:
<dashboard_Port>/remoteToken/
<Tokens>
remote.cluster.col
lector.protocol
Remote SNMP Collector Service protocol Https
remote.cluster.col
lector.hosts
Remote SNMP Collector Service host <cluster-node>
remote.cluster.col
lector.port
Remote SNMP Collector Service port 31443
remote.cluster.col
lector.proxy.path
Your proxy server path snmp-collector/
remote.cluster.col
lector.proxy.token
s
Proxy token can be obtained from https://<dashboard_service_host>:<dashboard_Port>/remoteToken/ ["Tokens"]
akka.cluster.local.
seeds
The Remote Collector Service node <remote-node>
272 IBM Telco Network Cloud Manager - Performance 1.4.5

Parameter Description Default value
jdbc-
journal.slick.db.ur
l
jdbc:h2:tcp://<first-remote-node>:9092/akka-persistence;DATABASE_TO_UPPER=false;. Where <first-
remote-node> is the IP address of the first instance of the Remote SNMP Collector Service.
jdbc-snapshot-
store.slick.db.url
jdbc:h2:tcp://<first-remote-node>:9092/akka-persistence;DATABASE_TO_UPPER=false;. Where, <first-
remote-node> is the host of IP address of the first instance of the Remote SNMP Collector Service.
Controlling the remote services
Start and stop the Remote SNMP Collector Service
cd <DIST_DIR>/remote/<remote_snmp_collector>
./bin/start-remote-snmp-collector
./bin/stop-remote-snmp-collector
Start and stop the Remote SNMP Discovery Service
cd <DIST_DIR>/remote/<remote_snmp_discovery>
./bin/start-remote-snmp-discovery
./bin/stop-remote-snmp-discovery
What to do next
Configure the Discovery profile page with the same value as you defined for the remote.context parameter in your application.conf files. For more information, see
Managing SNMP Discover profiles.
By default, the next device discovery starts in 24 hours. If you want to expedite the process, run the following commands to manually start the discovery:
To discover a specific profile, run the following command:
curl http://localhost:30018/rest/discovery?discover-profile=<profile name>
To discover all profiles, run the following command:
curl http://localhost:30018/rest/discovery?discover-all
Setting up Remote ICMP Ping Collector
Optionally, install the ICMP Ping Collector Service on a remote host as a stand-alone installation to keep the collector closer to your data center. Remote Ping Collector
sends ping requests and captures ping responses, and then writes ping metrics and resource details to Timeseries and Inventory directly.
Procedure
1. Download and extract the IBM® Telco Network Cloud Manager - Performance, version 1.4.5 English Multiplatform Advanced package that has M0H7JEN.tar.gz file.
Download and extract the file to <DIST_DIR>.
2. Copy and extract the /remote/basecamp-remote-ping-collector-2.4.5.0.tar.gz file to a location of your choice. For example, /<DIST_DIR>/rempte_ping.
You can see the following files and folders:
bin
conf
etc
lib
work
3. Edit the settings in /conf/application-cluster-centric.conf file. Update parameters from only the configurable sections.
Parameter Description Default value
remote.context Domain name of the Remote Ping Collector node.
The remote.context parameter is introduced to represent a domain.
"MY"
inventory-
service.hosts
The cluster Inventory Service host or Dashboard Service host if you
configured a proxy server.
<host name>
Inventory-
service.port
Port number of the cluster where the Inventory Service is installed.
Use the <proxy_port> if you configured a proxy server.
On OpenShift® Container Platform, the port is 443. Typically, the port
of the Route, is 443, which is the default https port.
If you configured a proxy server, this port is the Dashboard Service
port, which is 31443 in Kubernetes environment.
inventory-
service.protocol
The cluster Inventory Service protocol or the Dashboard Service
protocol if you are accessing with proxy server setup.
Https
inventory-
service.proxy.path
Proxy server path. Note: Optional, use this parameter only if you configured a proxy
server.
inventory-
service.proxy.toke
ns
Proxy server token. Note: Optional, use this parameter only if you configured a proxy
server.
In Kubernetes environment, the token can be obtained from here:
<https://<server>:<dashboardPort>/remoteToken/>
In OpenShift Container Platform environment, the token can be
obtained from here:
https://<dashboard-route>/remoteToken/
timeseries-
service.hosts
The cluster Timeseries Service host or Dashboard Service host if you
configured a proxy server.
<host name>
IBM Telco Network Cloud Manager - Performance 1.4.5 273

Parameter Description Default value
timeseries-
service.port
Port number of the cluster where the Timeseries Service is installed.
Use the <proxy_port> if you configured a proxy server.
On OpenShift Container Platform, the port is 443. Typically, the port
of the Route, is 443, which is the default https port.
If you configured a proxy server, this port is the Dashboard Service
port, which is 31443 in Kubernetes environment.
timeseries-
service.protocol
The cluster Timeseries Service protocol or the Dashboard Service
protocol if you are accessing with proxy server setup.
Https
timeseries-
service.proxy.path
Proxy server path. Note: Optional, use this parameter only if you configured a proxy
server.
timeseries-
service.proxy.toke
ns
Proxy server token. In Kubernetes environment, the token can be obtained from here:
<https://<server>:<dashboardPort>/remoteToken/
In OpenShift Container Platform environment, the token can be
obtained from here:
https://<dashboard-route>/remoteToken/
Note: Optional, use this parameter only if you configured a proxy
server.
remote.cluster.icm
p.protocol
The cluster Ping Collector Service protocol or the Dashboard Service
protocol if you are accessing with proxy server setup.
Https
remote.cluster.icm
p.hosts
The cluster Ping Collector Service host or Dashboard Service host if
you configured a proxy.
<host name>
remote.cluster.icm
p.port
Port number of the cluster where the Ping Collector is installed.
Use the <proxy_port> if you configured a proxy server.
On OpenShift Container Platform, the port is 443. Typically, the port
of the Route, is 443, which is the default https port.
If you configured a proxy server, this port is the Dashboard Service
port, which is 31443 in Kubernetes environment.
remote.cluster.icm
p.proxy.path
Proxy server path. Note: Optional, use this parameter only if you configured a proxy
server.
remote.cluster.icm
p.proxy.tokens
Proxy server token. In Kubernetes environment, the token can be obtained from here:
<https://<server>:<dashboardPort>/remoteToken/
In OpenShift Container Platform environment, the token can be
obtained from here:
https://<dashboard_route>/remoteToken/
Note: Optional, use this parameter only if you configured a proxy
server.
akka.cluster.local.
seeds
A list of comma-separated remote nodes, which are needed for
cluster formation.
jdbc-
journal.slick.db.url
jdbc-snapshot-
store.slick.db.url
logging.level Logging level can be INFO, DEBIG, ERROR, or WARN.
# Non-configurable sections
ping-collector.sharding.journal-plugin=jdbc-journal
ping-collector.sharding.snapshot-plugin=jdbc-snapshot-store
jdbc-journal.slick.db.driver="org.h2.Driver"
jdbc-snapshot-store.slick.db.driver="org.h2.Driver"
remote.enabled=true
cluster.name=ping-collector
config.url="http://localhost"
# Required if you see port conflict with Remote SNMP Collector
akka.remote.artery.canonical.port=2566
http.port = 25082
https.port = 25444
jmx.port = 25911
# Configurable sections
remote.context=<prefixString>
inventory-service.hosts="cluster-node"
inventory-service.port=k8s nodeport - 31443, ocp route with https - 443, ocp route with http - 80
inventory-service.protocol=https
inventory-service.proxy.path=inventory/
inventory-service.proxy.tokens="Tokens"
timeseries-service.hosts=["cluster-node"]
timeseries-service.port=k8s nodeport - 31443, ocp route with https - 443, ocp route with http - 80
timeseries-service.protocol=https
timeseries-service.proxy.path=timeseries/
timeseries-service.proxy.tokens=["Tokens"]
remote.cluster.icmp.protocol=https
remote.cluster.icmp.hosts=["cluster-node"]
remote.cluster.icmp.port=k8s nodeport - 31443, ocp route with https - 443, ocp route with http - 80
remote.cluster.icmp.proxy.path=ping-collector/
remote.cluster.icmp.proxy.tokens=["Tokens"]
akka.cluster.local.seeds=["first-remote-node", "other-remote-nodes"] #list of remote nodes in comma separated which
required for cluster formation
jdbc-journal.slick.db.url="jdbc:h2:tcp://<first-remote-node>:9092/akka-persistence;DATABASE_TO_UPPER=false;"
jdbc-snapshot-store.slick.db.url="jdbc:h2:tcp://<first-remote-node>:9092/akka-persistence;DATABASE_TO_UPPER=false;"
logging.level=INFO
274 IBM Telco Network Cloud Manager - Performance 1.4.5

4. Rename the /conf/application-cluster-centric.conf file to /conf/application.conf.
5. Use the following command to start the Remote Ping Collector:
cd <DIST_DIR>/remote_ping
./bin/start-remote-ping-collector
Use the following command to stop the Remote Ping Collector:
cd <DIST_DIR>/remote_ping
./bin/stop-remote-ping-collector
6. Check the log files in the Ping Collector Pod in your cluster.
[INFO] [2020-11-16 11:22:48.720] [akka.tcp://ping-collector@<IP>:2554/user/basecamp-ping-collector/ping-collector/ping-
collector-mgr/singleton] [ping-collector-ping-collector.dispatcher-2111] remote RemoteCollector
[<collector.ping.remote.id>,<messaging.kafka.broker-list>.<collector.ping.remote.topic>,,9223372030684775807) already
registered
[INFO] [2020-11-16 11:22:48.716] [akka.actor.ActorSystemImpl (ping-collector)] [qtp85930990-46] Receiving
RemoteCollector(<collector.ping.remote.id>,<message.kafka.broker.list>,<collector.ping.remote.topic>,,9223372030684775807)
Upgrading
Upgrade your IBM® Telco Network Cloud Manager - Performance clusters to the latest release.
Before you begin
Make sure you are on IBM Telco Network Cloud Manager - Performance V1.4.4.
Ensure that you completed all the steps in Pre-installation tasks.
All the needed images are accessible in the IBM Entitled Registry (cp.icr.io) for which you need an entitlement key.
Upgrading to 1.4.5
Use this information to upgrade to Telco Network Cloud Manager - Performance 1.4.5 from your current version.
Setting the dual query parameters for the old data
After the upgrade to 1.4.5, some data that is stored in DiamondDB might not be visible. Update the specific parameters in the Timeseries Service YAML file to
ensure that the data is retrieved from both DiamondDB and Timeseries Services.
Upgrading to 1.4.5
Use this information to upgrade to Telco Network Cloud Manager - Performance 1.4.5 from your current version.
Upgrade the Telco Network Cloud Manager - Performance on Red Hat® OpenShift® by using the Operator Lifecycle Manager (OLM) user interface and CASE (Container
Application Software for Enterprises).
Upgrade to Telco Network Cloud Manager - Performance V1.4.5 on Red Hat OpenShift
Container Platform
Before you begin
Optional, if you changed the annotations manager value in any StatefulSet, rename it to original value. For more information, see Updating the manager value
in annotations section of YAML file.
Manually, update the Postgres CPU resources to at least 500 m for both limits and requests. Follow the specific method depending on how the system is
installed before upgrade:
If the installation of Telco Network Cloud Manager - Performance V1.4.4 is done by using a custom resource definition, follow these steps:
Open your cloud platform web console.
Go to Operators > Installed operators.
Click TNCP from Provided APIs column and click the instance.
From the Actions list, select Edit TNCP.
Add or update the YAML file to increase the CPU to minimum 500m as in the following code block and click Save:
spec:
license:
accept: true
services:
postgres:
resources:
cpu: 500m
storageClassName: csi-cephfs
If the installation of Telco Network Cloud Manager - Performance V1.4.4 is not done by using a custom resource definition, follow these steps:
Open your cloud platform web console and change the namespace to noi.
Go to Workloads > Stateful Sets and select the postgres Service and click YAML.
Update the YAML to increase the CPU to minimum 500 m as follows:
IBM Telco Network Cloud Manager - Performance 1.4.5 275

- resources:
limits:
cpu: 500m
memory: 1Gi
requests:
cpu: 500m
memory: 1Gi
Click Save.
Stop all processors that are running in the NiFi user interface.
Uninstall the 1.4.4 Operator
1. Log in to OpenShift Container Platform web console.
2. If you renamed any annotation manager values previously, you must rename them back to the original name tncp-operator.
3. Go to Operators > OperatorHub > openshift-marketplace and search for tncp.
4. Click the installed IBM® Telco Network Cloud Manager - Performance Version 1.4.4, and then click Uninstall.
Note: Do not delete the instance. All the Pods are still running.
Upgrade to V1.4.5
1. Go to Operators > OperatorHub > openshift-marketplace.
2. Verify that the catalog Pod is running in the openshift-marketplace project.
3. Go to Operators > OperatorHub > openshift-operators and search for tncp.
4. Click the Telco Network Cloud Manager - Performance 1.4.5 catalog tile and click Install.
5. From the Install Operator page, provide the following details:
Update Channel
The supported update channels are shown, with 1.4 selected by default. It indicates that an Operator subscription is automatically created to keep the
Operator up to date when new versions are delivered to the channel.
Note: Make sure to select 1.4 channel.
Installation Mode
Choose whether to install the Operator into all namespaces in the cluster or into a specific namespace. By default, All namespaces on the cluster is
selected.
Installed Namespace
By default, openshift-operators is selected. If you install the Operator in the openshift-operators project, it is accessible by all other projects or
namespaces.
Note: If you chose the option A specific namespace on the cluster, you can change the namespace. This option is not supported for the IBM Telco
Network Cloud Manager - Performance Operator.
Approval Strategy
Click Automatic to indicate that the installation must proceed with no additional approval. The running instance of your Operator is automatically
upgraded whenever new versions are delivered to the channel.
Click Manual if you want to review a generated Install Plan for the Operator and then manually approve the installation. Review the Install Plan for
each new Operator version that is delivered to the channel, and then manually approve an upgrade.
Note: If needed, you can change the approval strategy later.
Verify that the Operator Pod is created and running in the openshift-operators project.
Go to the tncp project from Operators > Installed Operators > tncp.
Go to Workloads > Pods and verify that all Telco Network Cloud Manager - Performance Pods are re-created with the latest image.
Verify that the log PVCs are successfully created.
If you had an updated annotation manager value for any specific configuration changes, configure the parameters again and rename the manager
value.
Manually, start all the processors from the NiFi interface again.
Upgrade to Telco Network Cloud Manager - Performance V1.4.5 on Kubernetes
276 IBM Telco Network Cloud Manager - Performance 1.4.5

Before you begin
If you changed the annotation manager value, rename it to original value.
Manually, update the Postgres CPU resources to at least 500 m for both limits and requests. Follow the specific method based on how the system is installed
before upgrade:
If the installation of Telco Network Cloud Manager - Performance V1.4.4 is not done by using a custom resource definition, follow these steps:
Open your cloud platform web console.
https://<master_node_IP>:<Dashboard_externalPort>
Go to Workloads > Stateful Sets and select the postgres Service and click the Edit resource ( ) icon.
Update the YAML to increase the CPU to minimum 500 m as follows:
- resources:
limits:
cpu: 500m
memory: 1Gi
requests:
cpu: 500m
memory: 1Gi
Click Update.
Stop all processors that are running in the NiFi user interface.
Upgrade to V1.4.5
1. Download the Telco Network Cloud Manager - Performance V1.4.5 software from IBM Passport Advantage.
Use the following file name to search and download:
1.4.5-TIV-TNCP.tar.gz and extract the package.
For more information, see Downloading the installation media.
2. Run the following installation script:
cd <DIST_DIR>
./install.sh
The following output can be seen:
Error from server (AlreadyExists): namespaces "tncp" already exists
Context "kubernetes-admin@kubernetes" modified.
error: 'storage' already has a value (nfs), and --overwrite is false
role.rbac.authorization.k8s.io/pod-access unchanged
rolebinding.rbac.authorization.k8s.io/pod-access unchanged
clusterrole.rbac.authorization.k8s.io/pod-access unchanged
clusterrolebinding.rbac.authorization.k8s.io/pod-access unchanged
statefulset.apps/nfs configured
service/nfs unchanged
service/nfs-external unchanged
Note: All the service images are updated with the new images.
Install Technology Packs
Consider the following scenarios,
Upgrade the existing Technology Packs to new versions.
Install new Technology Packs that are not in your environment.
Note: In both the scenarios, you must deploy the Technology Packs from the Pack service UI.
After Telco Network Cloud Manager - Performance is upgraded, follow these steps to install the Technology Packs:
Note: Rarely, you notice the pack installation failing with the following error message:
IBM Telco Network Cloud Manager - Performance 1.4.5 277

Follow the workaround here.
1. Download the packs to a directory in your local file system.
For example, <DIST_DIR_PACKS>/packs.
2. Access Telco Network Cloud Manager - Performance dashboards.
3. Click Administration > Pack management > Pack service.
You can see the Pack service page that has a grid. After you deploy the packs, you can see the list of packs and their details.
4. Click the Import ( ) icon from the upper right of the page and select the Technology Pack JAR file that you want to import and click Upload.
Use this option to import a new Technology Pack that is not available in the table.
Note: The JAR file size cannot exceed more than 500 MB.
5. Click the Import and replace ( ) option for a specific pack that is available in the table to import a JAR file to replace the existing one.
Note: The JAR file size cannot exceed more than 500 MB.
6. Click the Deploy ( ) icon in the Actions pane and select Validate.
This action validates the pack content and displays validation errors if any.
After the validation is successful, you can see the Validated message in the State column on the Pack service page.
7. Click the Deploy ( ) icon in the Actions pane and select Deploy to deploy the pack.
Before the pack is deployed, it is validated and displays validation errors if any. After that, the state is changed to deploying.
8. From the Pack service UI, click the link in the State column for a specific Technology Pack to view the Pack log messages for the pack.
Important: If the dashboards are not published by default. Manually, publish them. After the Technology Pack is installed, NiFi flows are created, start the processors
manually. Discoveries are run, metrics are collected. You can then see the metrics in the dashboards.
For more information, see Installing Technology Packs.
Install the Advanced bundle
1. Copy the M0H7JEN.tar.gz file to a location of your choice in the master node in your cluster.
2. Use the following command to extract the media:
tar -zxvf M0H7JEN.tar.gz
Or use the following command:
gunzip -c M0H7JEN.tar.gz | tar -xvf -
You can see the following files and folders of significance:
remote
basecamp-remote-snmp-discovery-2.4.5.0.tar.gz
basecamp-remote-flow-collector-2.4.5.0.tar.gz
basecamp-remote-snmp-collector-2.4.5.0.tar.gz
basecamp-remote-ping-collector-2.4.5.0.tar.gz
basecamp-remote-inventory-2.4.5.0.tar.gz
resource-report
Extract the basecamp-resource-report-2.4.5.0.tgz file. It contains the script to generate a report with information on device classification. For more
information about this feature, see Generating the audit report.
tools
278 IBM Telco Network Cloud Manager - Performance 1.4.5

The following scripts of significance are available in this folder:
omnibus
It has the launch-tool.js script file that is needed for integration with IBM Tivoli® Netcool®/OMNIbus. For more information, see Setting up
integration with Watson AIOps Event Manager.
snmp
This folder has snmp-formula.sh script to enable or disable the metrics to be collected and displayed in the dashboards. For more information, see
Enabling and disabling formulas.
3. Use the remote collectors as needed. See Postinstallation tasks.
Upgrading the Threshold Service
When you upgrade from 1.4.4 to 1.4.5, you notice some changes in the database schema for Threshold Service. It is due to the changes in the Threshold definitions
administration page.
Upgrading the Threshold Service
When you upgrade from 1.4.4 to 1.4.5, you notice some changes in the database schema for Threshold Service. It is due to the changes in the Threshold definitions
administration page.
About this task
After you upgrade Telco Network Cloud Manager - Performance to 1.4.5, you can see the following changes in the Threshold schema:
A new table by name THRESHOLD.UPGRADE is available to display the status of the upgrade.
If it is successfully upgraded, you can notice that the version is updated from 1 to 2 in the THRESHOLD.UPGRADE table.
Data in THRESHOLD.THRESHOLD_PROFILE is updated to THRESHOLD.THRESHOLD_PROFILE_V2 and THRESHOLD.THRESHOLD_PROFILE_HIST to
THRESHOLD.THRESHOLD_PROFILE_V2_HIST.
You notice the tag column in the THRESHOLD.STATE table. The default value is an empty string.
A new composite key is created for the THRESHOLD.STATE, which is a combination of resource_id, tag, metric, and threshold_type.
Setting the dual query parameters for the old data
After the upgrade to 1.4.5, some data that is stored in DiamondDB might not be visible. Update the specific parameters in the Timeseries Service YAML file to ensure that
the data is retrieved from both DiamondDB and Timeseries Services.
About this task
Follow these steps:
Procedure
1. Log in to your OpenShift® Container Platform web console on your primary cluster.
2. Expand Workloads > Stateful Sets > timeseries.
3.
Click the YAML tab.
Add the parameters to the Timeseries Stateful Set YAML file in the args: section. The following parameter is existing in the YAML file.
- '--timeseries.pre-agg.meta.path=/opt/basecamp/timeseries/data'
Add the new parameters as follows:
- '--database.read.url=diamonddb://diamond-db-read:30110'
- '--timeseries.diamond.export.url=diamonddb://diamond-db-export:30120'
- '--old.database.cutoffInMs=<Time of upgrade in Epoch format>'
The value for the old.database.cutoffs parameter must be the day that you completed the upgrade with time as 12 midnight in Epoch time format.
For example, if the date is 18th, June 2023, its Epoch timestamp in milliseconds is 1687046400000.
The timeseries-0 Pod is restarted automatically.
4.
Click the Edit resource icon ( ).
5. Add the parameters to the Timeseries Stateful Set YAML file in the args: section. The following parameter is existing in the YAML file.
- '--timeseries.pre-agg.meta.path=/opt/basecamp/timeseries/data'
Add the new parameters as follows:
- '--database.read.url=diamonddb://diamond-db-read:30110'
- '--timeseries.diamond.export.url=diamonddb://diamond-db-export:30120'
- '--old.database.cutoffInMs=<Time of upgrade in Epoch format>'
IBM Telco Network Cloud Manager - Performance 1.4.5 279

The value for the old.database.cutoffs parameter must be the day that you completed the upgrade with time as 12 midnight in Epoch time format.
For example, if the date is 18th, June 2023, its Epoch timestamp in milliseconds is 1687046400000.
6. Click Save.
The timeseries-0 Pod is restarted automatically.
What to do next
You can query the historical data by using the REST API or from the Metric Viewer dashboard.
Administering
Administration is the set of tasks by which you manage and monitor the IBM® Telco Network Cloud Manager - Performance environment. Typically, these tasks are
performed by Network Architects and Administrators.
About this task
The following tasks can be done on the Telco Network Cloud Manager - Performance system:
User and group management for all the visualizations
Database administration
Control the services.
User administration
In Telco Network Cloud Manager - Performance, the default user is npiadmin to view the dashboards. You create new users and grant specific roles to them to
handle specific tasks.
Controlling the Telco Network Cloud Manager - Performance services
You can start and stop the containers and services in Telco Network Cloud Manager - Performance from your cloud platform web console and also by using
command line.
Database administration
Provides information about essential administration tasks such as backing up and restoring your performance data that is stored in IBM Telco Network Cloud
Manager - Performance databases.
Scaling the Timeseries Service to handle large data
Use this information to scale in and scale out the TimeSeries Service ff you have large data from the installed Technology Packs.
Report scheduler configurations
Scheduled reports are run at specified times and can be automatically sent by email to a user or a mailing list. Configurations that are needed to run the report
scheduler configurations are preset after the installation of Telco Network Cloud Manager - Performance.
User administration
In Telco Network Cloud Manager - Performance, the default user is npiadmin to view the dashboards. You create new users and grant specific roles to them to handle
specific tasks.
Summary of user creation tasks,
Scenario where Telco Network Cloud Manager - Performance system is integrated with Dashboard Application Services Hub, you can use either LDAP
authentication or use WebSphere Application Server to create users.
Scenario where Telco Network Cloud Manager - Performance is not integrated with Dashboard Application Services Hub, use LDAP authentication and create users.
In both the scenarios, you must add the same users to Dashboard Designer
Use LDAP authentication and create users.
Add the same users to Dashboard Designer.
Default users
After the installation of Telco Network Cloud Manager - Performance, some users, groups, and roles are created by default.
User and group management from Dashboard Application Services Hub
Use this information to provide user access to Telco Network Cloud Manager - Performance Dashboards based on the default user roles and user groups.
User administration from Designer tool
Use the role-based and group-based access control options to create users and assign user roles and groups to them. User roles enable users to perform different
tasks on the Designer tool application. It is applicable for the custom dashboards that are created with Designer tool. The user administration for the dashboards
the are available by default cannot be done with Designer tool.
Encrypting passwords
For security reasons, encrypt all the passwords that are used in system configurations and for user management.
Default users
After the installation of Telco Network Cloud Manager - Performance, some users, groups, and roles are created by default.
Users and their groups
280 IBM Telco Network Cloud Manager - Performance 1.4.5

The following table describes users that are present after installation, along with their groups in Kubernetes environment, which is supported with on-prem
Jazz® for Service Management.
Table 1. Users present after installation Telco Network Cloud Manager - Performance and Jazz for Service Management
Username Group Default
password Description
npiadmin ConsoleAdmin
ConsoleUser
ReadAdmin
WriteAdmin
dashboarduser
manager-gui
manager-jmx
manager-
script
manager-
status
npiadmin
npiuser
npiadmin This user is authorized for all operations.
By default, this user has permissions to administer all of the web interfaces.
npiuser ConsoleUser
dashboarduser
npiuser
npiuser By default, this user has permissions to access Telco Network Cloud Manager - Performance
dashboards.
Users and roles
The following table describes users that are present after installation, along with their roles in OpenShift® Container Platform environment, which is supported
on cloud-based Jazz for Service Management.
Table 2. Users present after installation Telco Network Cloud Manager - Performance and Jazz for Service Management
Username Roles Default
password Description
npiadmin ConsoleAdmin
ConsoleUser
dashboarduse
r
npiadmin
npiuser
npiadmin This user is authorized for all operations.
By default, this user has permissions to administer all of the web interfaces.
npiuser ConsoleUser
dashboarduse
r
npiuser
npiuser By default, this user has permissions to access Telco Network Cloud Manager - Performance dashboards.
User and group management from Dashboard Application Services Hub
Use this information to provide user access to Telco Network Cloud Manager - Performance Dashboards based on the default user roles and user groups.
These tasks are applicable for integrated installation scenario where Telco Network Cloud Manager - Performance Dashboards is integrated with Dashboard Application
Services Hub.
Telco Network Cloud Manager - Performance users have the following access to its web interfaces:
Web interfaces Usage
System
Configuration
The Telco Network Cloud Manager - Performance Dashboards is pre-configured with working sets of default configurations. A broad range of functions
in Telco Network Cloud Manager - Performance can be administratively configured.
The System Configuration Console is to configure your Telco Network Cloud Manager - Performance system that is integrated with Dashboard
Application Services Hub.
Performance
Dashboards
Telco Network Cloud Manager - Performance provides built-in and interactive network traffic performance dashboards.
You can administer the users specific to Telco Network Cloud Manager - Performance Dashboards here.
Administering users
User administration involves setting user access through the following tasks:
1. Creating and assigning groups to the user in WebSphere® administrative console.
2. Assigning roles to the created user to allow user to work with Telco Network Cloud Manager - Performance web interfaces from Dashboard Application Services
Hub console settings.
3. Adding the user to gain access to Telco Network Cloud Manager - Performance Dashboards from Telco Network Cloud Manager - Performance Dashboards System
Administration.
Creating a user to access dashboards from Dashboard Application Services Hub
If your Telco Network Cloud Manager - Performance system is integrated with Dashboard Application Services Hub, follow these steps to access the Telco Network
IBM Telco Network Cloud Manager - Performance 1.4.5 281

Cloud Manager - Performance Dashboards.
Creating a user to access dashboards from Dashboard Application Services Hub
If your Telco Network Cloud Manager - Performance system is integrated with Dashboard Application Services Hub, follow these steps to access the Telco Network Cloud
Manager - Performance Dashboards.
About this task
If you have Telco Network Cloud Manager - Performance system that is integrated on Dashboard Application Services Hub, you can use WebSphere Application Server
from Dashboard Application Services Hub portal for user administration.
If you have Telco Network Cloud Manager - Performance as a stand-alone system, you can use the default OpenLDAP for user administration.
Important: The user must be created both in Designer tool to access the dashboards in both cases.
Procedure
Using WebSphere Application Server to create users.
Log in to Dashboard Application Services Hub portal.
See Logging in to the reporting interface.
Create the user from Dashboard Application Services Hub portal.
See:
Creating users to access the visualizations
Creating users to access the visualizations in OpenShift Container Platform
Creating users from Dashboard Designer.
In the navigation pane of Dashboard Designer, click Users and Groups > Users.
Click Add User.
Use the same username that you used to create the LDAP user or the user you created in WebSphere Application Server.
In the username field, enter the name of the user.
In the Tool Role pane, click System Administrator.
Expand Engine Access pane and click Assign Instances and select TNCP instance and click to add the instance to Selected Engine Instances pane.
To enable the user to access Schedule Tasks menu on Tool Content Groups and Engine User Groups, select the Scheduler checkbox.
The user can create and manage scheduled tasks for all the dashboards that are displayed on the Engine, irrespective of the assigned User Group.
To assign Tool Content Groups and Engine User Groups, in the User Group(s) pane, click Assign Groups.
Select npiadmin group and click to add the Tool Content Groups and Engine User Groups to Selected User Groups pane.
Click Save to see the user in the Users page.
What to do next
You can now log in to Dashboard Application Services Hub with the new user and password.
Creating users to access the visualizations in Kubernetes
Use these steps to create new users and assign the groups to the user, which provides with the appropriate access for accessing Jazz™ for Service Management
server.
Creating users to access the visualizations in OpenShift Container Platform
Use these steps to create new users and assign the groups to the user, which provides with the appropriate access for accessing Jazz™ for Service Management
server.
Creating users to access the visualizations in Kubernetes
Use these steps to create new users and assign the groups to the user, which provides with the appropriate access for accessing Jazz™ for Service Management server.
About this task
You can create one or more users. The users are added to the registry and a login account for each new user is automatically created. When you create the new user, you
can also add the user as a member of one or more groups.
You must add the user and groups sequentially. Use the following order.
1. Create the users on WebSphere Application Server.
2. Assign the users to the relevant groups on WebSphere Application Server.
Procedure
282 IBM Telco Network Cloud Manager - Performance 1.4.5

1. Log in to Dashboard Application Services Hub portal as smadmin user.
2. Expand Console Settings ( ) > WebSphere Administrative Console.
3. Click Launch WebSphere Administrative Console.
4. From the navigation pane, click Users and Groups > Manage Users.
5. Click Create to create a new user.
6. In the User ID field, type a unique name to identify the user.
This user ID is added to the user registry and used as the login account name.
7. In the First name field, type the given or first name of the user.
8. In the Last name field, type the family or last name of the user.
9. Optional: In the E-mail field, type an e-mail address for the user.
10. In the Password and Confirm password field, type a unique password.
11. Click Group Membership to add the user as a member of one or more existing groups.
12. In the Search by field, select the attribute from the list that you want to use to search for one or more users.
For example, select group name.
13. In the Search for field, either type the string that you want to search to limit the set of groups, or use the wildcard character (*) to search for all groups. Whether the
search is case-sensitive or case-insensitive depends on the user registry that you are using.
14. In the Maximum results field, specify the maximum number of search results that you want to display.
15. Click Search.
After the search completes, the results are displayed in two lists:
Available - the list is for groups that matched the search criteria
Mapped To - the list is for groups that the user is already a member.
16. In the Available column, select the following groups and click < Add:
ConsoleAdmin
ConsoleUser
ReadAdmin
WriteAdmin
dashboarduser
manager-gui
manager-jmx
manager-script
manager-status
npiadministrator
npiuser
Important:
If you are creating an admin user to access the visualizations, make sure to assign npiadministrator and dashboarduser groups to the user.
If you are creating a non-admin user to access the visualizations, make sure to assign npiuser and dashboarduser groups to the user.
17. Optional: To undo or remove the user as a member, highlight the groups from the Mapped To list and then click Remove >.
18. Click Close to return to Create a User page.
19. Click Create.
If successful, a message displays that indicates that the user is created. Also, the user ID and other user information are added to the user registry, and a new login
account is created for the user.
20. To create another user, click Create Like.
21. Repeat the process until all the new users are created.
Creating users to access the visualizations in OpenShift® Container Platform
Use these steps to create new users and assign the groups to the user, which provides with the appropriate access for accessing Jazz™ for Service Management server.
About this task
You can create one or more users. The users are added to the registry and a login account for each new user is automatically created. When you create the new user, you
can also add the user as a member of one or more groups.
You must add the user and groups sequentially. Use the following order.
1. Create the users WebSphere Application Server.
2. Create roles in Dashboard Application Services Hub
3. Assign the users to the relevant roles on Dashboard Application Services Hub.
Create user
1. Log in to Dashboard Application Services Hub portal as smadmin user.
2. Expand Console Settings ( ) > WebSphere Administrative Console.
3. Click Launch WebSphere Administrative Console.
4. From the navigation pane, click Users and Groups > Manage Users.
5. Click Create to create a new user.
6. In the User ID field, type a unique name to identify the user.
This user ID is added to the user registry and used as the login account name.
7. In the First name field, type the given or first name of the user.
8. In the Last name field, type the family or last name of the user.
9. In the E-mail field, type an e-mail address for the user.
10. In the Password and Confirm password field, type a unique password.
IBM Telco Network Cloud Manager - Performance 1.4.5 283

11. Close the WebSphere Administrative Console window.
Create roles
1. Log in to Dashboard Application Services Hub portal as icpadmin user.
2. From the upper right, click Console Settings > ( ) > Roles.
3. Use this Roles page to manage all console roles. You can view detailed information about the roles and create new roles. For each role, you can define the level of
access to views, pages, and widgets. The access level that you set for the role applies to all users and groups that are members of that role.
4. Click New. The General Properties panel for the new role is displayed.
5. Click Save to save your changes and return to Roles.
6. Go to User Roles and search for the tenant users that you created.
7. Assign the specific tenant group roles to the tenant users.
ConsoleUser
dashboarduser
npiadministrator
npiuser
8. Click Save.
Grant roles to the new users
1. Log in to Dashboard Application Services Hub portal as icpadmin user.
2. In the navigation pane, select Console Settings > ( ) > User Roles.
3. To assign a role to a user, click Search. A list of available users is displayed.
4. Select the new user from the User ID column.
A list of available roles for the selected user is displayed on a new page.
5. Assign the roles that are created earlier to the user.
6. Click Save.
What to do next
Log off from Dashboard Application Services Hub and log in again to ensure all the privileges that include admin privileges are available to the new user.
User administration from Designer tool
Use the role-based and group-based access control options to create users and assign user roles and groups to them. User roles enable users to perform different tasks
on the Designer tool application. It is applicable for the custom dashboards that are created with Designer tool. The user administration for the dashboards the are
available by default cannot be done with Designer tool.
Security is based on the role and groups that are assigned to a user. A role is a group of permissions that control the actions that a user can perform on the Designer tool
application.
During installation, a default user is added to Dashboard Designer. This default user has access to Dashboard Designer and an Engine instance. However, the user cannot
access any Engine User Groups.
The default user first needs to create a System Administrator user, and then that System Administrator can grant access to the Engine user groups, to the
default user.
The default user can add multiple Tool Content Groups, Engine User Groups, Dashboard Designer users, Engine users, and Designer tool users.
The default user can assign only one user role to each user and an Engine instance, but can assign multiple Tool Content Groups and Engine User Groups to each user.
Creating a user to access Telco Network Cloud Manager - Performance Dashboards
Follow these steps to access the Telco Network Cloud Manager - Performance Dashboards from Engine user interface or from Dashboard Application Services Hub.
Creating a user to access Telco Network Cloud Manager - Performance Dashboards
Follow these steps to access the Telco Network Cloud Manager - Performance Dashboards from Engine user interface or from Dashboard Application Services Hub.
About this task
If you have Telco Network Cloud Manager - Performance system that is not integrated with Dashboard Application Services Hub, you must use LDAP authentication.
Use LDAP authentication to create users.
Important: The user must be created both using LDAP and also Designer tool to access the dashboards.
Procedure
1. Optional: Setting up LDAP authentication
This step is needed only if you are using LDAP user repository.
284 IBM Telco Network Cloud Manager - Performance 1.4.5

Creating users from Dashboard Designer.
2. Log in to Dashboard Designer UI as any administrator user.
See Accessing the Dashboard designer.
3. In the navigation pane of Dashboard Designer, click Users and Groups > Users.
4. Click Add User.
Use the same username that you used to create the LDAP user.
5. In the username field, enter the name of the user.
6. In the Tool Role pane, click System Administrator.
7. Expand Engine Access pane and click Assign Instances and select TNCP instance and click to add the instance to Selected Engine Instances pane.
8. To enable the user to access Schedule Tasks menu on Tool Content Groups and Engine User Groups, select the Scheduler checkbox.
The user can create and manage scheduled tasks for all the dashboards that are displayed on the Engine, irrespective of the assigned User Group.
9. To assign Tool Content Groups and Engine User Groups, in the User Group(s) pane, click Assign Groups.
10. Select npiadmin group and click to add the Tool Content Groups and Engine User Groups to Selected User Groups pane.
11. Click Save to see the user in the Users page.
What to do next
You can now log in to Telco Network Cloud Manager - Performance Dashboards with the new user and password from Dashboard Application Services Hub or from Engine.
Tool Content Groups and Engine User Groups
Dashboard Designer displays Tool Content Groups and Engine User Groups. Only a System Administrator or a default user can grant access to these user
groups.
Designer tool Users
You can add different types of users such as users who can access both Dashboard Designer and Managing Tool Content Groups and Engine User Groups, or users
who can access only Managing Tool Content Groups and Engine User Groups or only Dashboard Designer. You can also grant these users access to one or more Tool
Content Groups and Managing Tool Content Groups and Engine User Groups User Groups.
Related information
Default Dashboard designer roles
Tool Content Groups and Engine User Groups
Dashboard Designer displays Tool Content Groups and Engine User Groups. Only a System
Administrator or a default user can grant access to these user groups.
Dashboard Designer displays the following types of user groups:
Tool Content Groups
Content indicates all the dashboard components and contents such as Layouts, Widgets, Data Definitions, Filters, Dashboards, and Menus that are created by users.
Users belonging to the same Tool Content Group can view, use, modify, and delete contents that are created by each other.
A default user or a System Administrator can create multiple Tool Content Groups, and assign one or more Tool Content Groups to a single user.
Engine User Groups
Group of users who can access only those dashboards and widgets that are published on a specified Engine instance.
All the published dashboards and widgets are displayed on an Engine instance. Users belonging to the same Engine User Group can access all the dashboards and
widgets that are published on the Engine instance that is assigned to that group.
A default user or System Administrator can create multiple Engine User Groups, and assign one or more Engine Groups to a single user.
Managing Tool Content Groups and Engine User Groups
You can add, search, modify, or delete Tool Content Groups and Engine User Groups.
Managing Tool Content Groups and Engine User Groups
You can add, search, modify, or delete Tool Content Groups and Engine User Groups.
Before you begin
To manage Tool Content Groups and Engine User Groups, you must be logged in as a System
Administrator or as a default user.
About this task
You need to perform similar tasks and steps to manage Tool Content Groups and Engine User Groups. This topic provides information about all the common tasks that can
be performed on the Tool Content Groups page and Engine User Groups page.
Procedure
IBM Telco Network Cloud Manager - Performance 1.4.5 285

Complete the following steps to view, add, search, edit, or delete Tool Content Groups and Engine User Groups:
1. To manage Tool Content Groups, in the left navigation pane of Dashboard Designer, click Users and Groups > Tool Content Groups. In the Tool Content Groups page,
complete the tasks that are provided in the following task table.
2. To manage Engine User Groups, in the left navigation pane of Dashboard Designer, click Users and Groups > Engine User Groups. In the Engine User Groups page,
complete the tasks that are provided in the following task table.
3. Complete any of the following tasks:
Table 1. Common Tool Content Groups and Engine User Groups tasks
Task Steps
Add a group a. Click Add Group.
A window opens.
b. In the Name field, enter a name for the group.
c. In the Description field, enter a description for the group.
d. Complete any of the following steps:
To save the newly added group, click Save.
If you don’t want to add the group, click Cancel.
Edit a group description
a. To edit a description of a group, click the Edit icon that is displayed on that row.
b. Modify the existing description.
c. Complete any of the following steps:
To save the modifications, click the Save.
Click Cancel to restore the original description.
Search a group To find a group, enter the name of the group in the Search field.
Delete groups a. To delete a group or multiple groups, complete any of the following steps:
Click the Delete icon on the group row.
Select the group, and then click the Delete button.
To delete multiple groups, select multiple groups, and then click the Delete button.
A confirmation message is displayed.
b. Click Ok.
Designer tool Users
You can add different types of users such as users who can access both Dashboard Designer and Managing Tool Content Groups and Engine User Groups, or users who can
access only Managing Tool Content Groups and Engine User Groups or only Dashboard Designer. You can also grant these users access to one or more Tool Content
Groups and Managing Tool Content Groups and Engine User Groups User Groups.
Using Dashboard Designer, you can create the following users:
Dashboard Designer users
Dashboard Designer users can create dashboards, menus, themes, and dashboard components such as layout, widgets, filters, and data definitions.
Based on the user role Dashboard Designer users can be categorized as follows:
Users with access to Dashboard Designer only
These users have a Dashboard Developer role assigned to them. They cannot preview the content that is created by them or their group members as they
are not assigned any Managing Tool Content Groups and Engine User Groups instance or Managing Tool Content Groups and Engine User Groups User
Groups.
If you want such users to preview any dashboard content, then you must assign an Managing Tool Content Groups and Engine User Groups instance and an
Managing Tool Content Groups and Engine User Groups User Group to such users.
Users with access to Dashboard Designer and Managing Tool Content Groups and Engine User Groups
These users have Publisher, System Administrator, or Menu Administrator role. They can preview dashboard content, publish widget and
dashboards, create menus, and deploy dashboards and themes, as they can access Managing Tool Content Groups and Engine User Groups.
These users have an Managing Tool Content Groups and Engine User Groups instance, and one or more Managing Tool Content Groups and Engine User
Groups User Groups assigned to them.
Managing Tool Content Groups and Engine User Groups users
Can access only Managing Tool Content Groups and Engine User Groups. These users are not assigned any default Dashboard Designer role or Tool Content Groups.
Adding users
You can view, add, modify, search, or delete Dashboard Designer users and Tool Content Groups and Engine User Groups users by using Dashboard Designer. You
can also import users in bulk by using a CSV file.
Importing users in bulk
You can import users, Tool Content Groups, and Engine User Groups to the latest Designer tool version in bulk by using a CSV file.
Managing users
You can view, modify, search, or delete users by using Dashboard Designer.
Adding users
You can view, add, modify, search, or delete Dashboard Designer users and Tool Content Groups and Engine User Groups users by using Dashboard Designer. You can also
import users in bulk by using a CSV file.
Before you begin
286 IBM Telco Network Cloud Manager - Performance 1.4.5

Before you add users, you must ensure that the following tasks are completed:
The Tool Content Groups and Engine User Groups instance is added.
At least one Tool Content Group is created.
At least one Tool Content Groups and Engine User Groups User Group is created.
To add users, you must be logged in as a System Administrator or as a default user.
Procedure
Adding Dashboard Designer users with access to Dashboard Designer only.
To add Dashboard Designer users only, complete the following steps:
1. In the left navigation pane of Dashboard Designer, click Users and Groups > Users.
A Users page opens in a new tab.
2. Click Add User.
An Add User window that displays the TOOL ACCESS pane opens.
3. In the User name field, enter the name of the user.
4. In the Tool Role pane, click Dashboard Developer.
5. In the Tool Content Group(s) pane, click the Assign Groups list.
A pop-up window opens where the Tool Content Groups are listed alphabetically sorted in ascending order. Complete the following steps in the pop-up
window:
Click one or more Tool Content Groups that are listed under Content Groups (select one or more) pane and click to add the Tool Content Groups
to Selected Content Groups pane.
If you want to delete any group from the Selected Content Groups pane, then click the Delete icon that is displayed next to it.
6. Click Save.
A Dashboard Designer user is created. This user can access Dashboard Designer, create tool content and dashboards but cannot preview them.
If you want the user to preview tool content and dashboards, then you must assign the Tool Content Groups and Engine User Groups instance and the Tool
Content Groups and Engine User Groups to the user. Complete the steps 5 and 6 that are provided in the Adding Engine users section.
Adding Dashboard Designer users with access to Dashboard Designer and Tool Content Groups and Engine User Groups
To add a user who can access both Dashboard Designer and Tool Content Groups and Engine User Groups, complete the following steps:
1. In the left navigation pane of Dashboard Designer, click Users and Groups > Users.
A Users page opens in a new tab.
2. Click Add User.
An Add User window that displays the TOOL ACCESS pane opens.
3. In the User name field, enter the name of the user.
4. In the Tool Role pane, click either Publisher, Menu Administrator, or System Administrator.
Note: A System Administrator can access all the Tool Content Groups. Therefore, if you select System Administrator, then you do not need to select a specific
content group from Tool Content Group(s) pane.
5. In the Tool Content Group(s) pane, click the Assign Groups list.
A pop-up window opens where the Tool Content Groups are listed alphabetically sorted in ascending order. Complete the following steps in the pop-up
window:
Click one or more Tool Content Groups that are listed under Content Groups (select one or more) pane, and click to add the Tool Content Groups
to Selected Content Groups pane.
If you want to delete any group from the Selected Content Groups pane, then click the Delete icon that is displayed next to it.
6. Assign the Tool Content Groups and Engine User Groups instance and Tool Content Groups and Engine User Groups User Group to the user.
Complete the steps 5 and 6 that are provided in the Adding Engine users section.
Adding Tool Content Groups and Engine User Groups users
To add Tool Content Groups and Engine User Groups users only, complete the following steps:
1. In the left navigation pane of Dashboard Designer, click Users and Groups > Users.
A Users page opens in a new tab.
2. Click Add User.
An Add User window that displays the TOOL ACCESS pane opens.
3. In the User name field, enter the name of the user.
4. In the Tool Role pane, click None.
5. To assign Tool Content Groups and Engine User Groups instance, complete the following steps:
a. Expand the ENGINE ACCESS pane, and in the Engine Instance(s) pane, click Assign Instances.
A pop-up window opens displaying the Tool Content Groups and Engine User Groups instance.
b. Click the Tool Content Groups and Engine User Groups instance that is listed under Engine Instance (select one or more) pane and click to add
the instance to Selected Engine Instances pane.
To delete the selected instance from the Selected Engine Instances pane, click the Delete icon that is displayed next to the instance.
c. To enable the user to access Schedule Tasks menu on Tool Content Groups and Engine User Groups, select the Scheduler checkbox.
The user can create and manage scheduled tasks for all the dashboards that are displayed on Engine, irrespective of the assigned User Group.
6. To assign Tool Content Groups and Engine User Groups User Groups, in the User Group(s) pane, complete the following steps:
IBM Telco Network Cloud Manager - Performance 1.4.5 287

a. Click the Assign Groups list.
A pop-up window opens where the Tool Content Groups and Engine User Groups that are listed alphabetically sorted in ascending order.
b. Click one or more Tool Content Groups and Engine User Groups that are listed under User Groups (select one or more) pane and click to add the
Tool Content Groups and Engine User Groups to Selected User Groups pane.
If you want to delete any group from the Selected User Groups pane, then click the Delete icon that is displayed next to it.
Results
After a user is created, in the PostgreSQL database, the user details are stored in the following tables:
Dashboard Designer user details are in USERS table under T_DEFAULT_TOOL table.
Tool Content Groups and Engine User Groups user details are in USERS table under T_DEFAULT_ENGINE table.
Designer tool users are stored in both the tables.
What to do next
After you add or delete a user, you must add or delete the username and password of that user in the basic-registry.xml file.
Importing users in bulk
You can import users, Tool Content Groups, and Engine User Groups to the latest Designer tool version in bulk by using a CSV file.
Before you begin
Ensure that you upgrade Designer tool installation to its latest version or install its latest version on your server. The latest Designer toolDesigner tool installation image
contains the following CSV file:
import_users_sample.csv: A sample file that contains dummy data.
After you install Designer tool, the CSV file is available at the following locations:
$install_dir/prdutil/data/importUser
Where: install_dir is the directory where you installed the application.
You must edit the CSV files to include the following information for each user that you plan to import:
User name
Username must not be more than 50 characters in length. Can contain alphanumeric characters with underscores. Username cannot contain spaces or special
characters.
Tool Role
Enter either Dashboard Developer, System Administrator, Publisher, None, or Menu Administrator. If you enter any other role or change the syntax
or capitalization of the available roles, then the import for the record fails.
Tool Content Groups
Can contain blank, single, or multiple values based on the following scenarios:
If the user has access to multiple content groups, then you can enter multiple group names, each separated by a pipe symbol.
If the user's role is None or System Administrator, then you must leave this column blank.
If the user's role is Dashboard Developer, Publisher, or Menu Administrator, then this column must contain at least one value. If it does not
contain a value, then the import fails. You can enter multiple content group names for a single user by separating each group with a pipe symbol.
If you enter new content groups, then those groups are also created.
Engine Instances
Can contain a single value or you can leave it blank.
Note: If you leave it blank, then you cannot create any Engine users, Designer tool users, nor can you enable any Dashboard Designer users to preview any tool
content.
Engine User Groups
Enter either single or multiple values. For multiple values, separate each value by a pipe symbol. If you enter new user groups, then those groups are also created.
Ensure that the CSV file is complete in context to the following parameters:
Contains valid data
Does not contain any additional columns or blank rows
Does not contain duplicate usernames. For example, if Dashboard Designer already contains a user who is named 'User_abc', then you cannot add another user with
the same name.
For a user, if you add an Engine instance, then you must add an Engine User Group. Else, the import for that user record fails.
To import users, you must be logged in as a root user.
Procedure
Complete the following steps to import users in bulk:
1. Copy the CSV file that contains user information to the Designer tool installation directory.
2. Run the following command to import users to an on-premises installation of Designer tool:
288 IBM Telco Network Cloud Manager - Performance 1.4.5

./import_users.sh <FILE_PATH>
Where <FILE_PATH> is the path of your .csv file.
For example
./import_users.sh
$install_dir/prdutil/data/importUsers/import_users_sample.csv
Where: $install_dir is the directory where you installed the application.
Note: To resolve any import users-related issues, check the ImportUsersReport.log file that is placed at install_dir/prdutil
Results
The imported users are displayed on the Users tab in the Dashboard Designer.
What to do next
After you add or delete a user, you must add or delete the username and password of that user in the basic-registry.xml file for on premises installation package.
Managing users
You can view, modify, search, or delete users by using Dashboard Designer.
Before you begin
To manage users, you must be logged in as a System Administrator or as a default user.
Procedure
Complete the following steps to view, modify, search, or delete users:
To view or search users, complete the following steps:
1. In the left navigation pane of Dashboard Designer, click Users and Groups > Users.
The Users page opens. It displays all the users.
2. To find a user, enter the name of the user in the Search field.
To delete a user or delete multiple users, complete the following steps:
1. To delete a user or users, complete any one of the following steps in the Users page:
To delete a user, click the Delete icon that is displayed next to the user or select the user and click the Delete button.
To delete multiple users, select multiple users, and then click the Delete button.
2. In the confirmation message window that is displayed, click Ok.
To modify a user, complete the following steps:
1. In the left navigation pane of Dashboard Designer, click Users and Groups > Users.
The Users page opens. It displays all the users.
2. To edit a user, click the Edit icon that is displayed on the user row.
The Edit a user window is displayed.
3. In the Tool Role pane, click the role that you want to assign to the user.
Note:
If you click System Administrator, then the already selected Content Groups that are displayed in the Tool Content Group(s) pane are deleted, as the
System Administrator has access to all the Tool Content Groups.
If you click None, then the already selected Content Groups that are displayed in the Tool Content Group(s) pane are deleted. You cannot select any
Content Group as the user is an Engine user only and cannot access any Tool content.
If you click any Tool Role other than System Administrator and None, then the existing Content Groups are retained.
4. To add or delete Content Groups, complete the following steps in the Tool Content Group(s) pane:
a. Click the Assign Groups list.
A pop-up window opens where the Tool Content Groups are listed alphabetically sorted in ascending order.
b. Click one or more Tool Content Groups that are listed under Content Groups (select one or more) pane, and click to add the Tool Content Groups
to Selected Content Groups pane.
If you want to delete any group from the Selected Content Groups pane, then click the Delete icon that is displayed next to it.
5. To delete an Engine instance that is assigned to a user or to disable the access to Schedule Tasks, complete any of the following steps in the ENGINE ACCESS
pane:
a. In the Engine Instance(s) pane, click the Assign Instance list.
A pop-up window opens displaying the Engine instance.
b. To delete the selected instance from the Selected Engine Instances pane, click the Delete icon that is displayed next to the instance.
c. To disable the access to Schedule Tasks, clear the Scheduler check box.
Note:
If you delete an Engine instance, then the Engine User Groups that are assigned to that user are also deleted. The user cannot preview any Tool
content.
Users with System Administrator, Publisher or Menu
Administrator role, and Engine users must have at least one instance assigned to them.
IBM Telco Network Cloud Manager - Performance 1.4.5 289

6. To add or delete Engine User Groups, complete the following steps in the User Group(s) pane:
a. Click the Assign Groups list.
A pop-up window opens where the Engine Groups are listed alphabetically sorted in ascending order.
b. Click one or more Engine Groups that are listed under User Groups (select one or more) pane, and click to add the Engine Groups to Selected
User Groups pane.
If you want to delete any group from the Selected User Groups pane, then click the Delete icon that is displayed next to it.
Note: Users with System Administrator, Publisher, or Menu Administrator role, and Engine users must have at least one Engine User
Group assigned to them.
7. To save the changes, click Save. Else, click Cancel.
What to do next
After you add or delete a user, you must add or delete the user name and password of that user in the basic-registry.xml file.
Encrypting passwords
For security reasons, encrypt all the passwords that are used in system configurations and for user management.
About this task
An administrator can encrypt the passwords by using the encrypt.sh script that is available in <DIST_DIR>/etc/tools directory. This is script is available in the Telco
Network Cloud Manager - Performance core installation package for Kubernetes environment.
Procedure
Run the encrypt.sh script.
cd <DIST_DIR>/etc/tools
./encrypt.sh <password_text>
You can get the encrypted password that can be copied and used in any configuration setting as needed.
Controlling the Telco Network Cloud Manager - Performance services
You can start and stop the containers and services in Telco Network Cloud Manager - Performance from your cloud platform web console and also by using command line.
About this task
The following tasks are described here:
Start the services.
Stop the services.
Scale up the services.
Scale down the services.
Procedure
Stop the services in your cluster by using command line.
1. Help command to set a new size for a Deployment, ReplicaSet, Replication Controller, or StatefulSet.
kubectl scale --help
2. Stop a stateful service.
kubectl scale -n <namespace> statefulset <service_name> --replicas=0
3. Start a stateful service.
kubectl scale -n <namespace> statefulset <service_name> --replicas=1
Start, stop, scale up, and scale down from the cloud platform web console.
1. Click Stateful Sets in Workloads pane and select the service that you want to start.
2. Click the icon, and select Edit Pod Count.
You can see the following window:
290 IBM Telco Network Cloud Manager - Performance 1.4.5

3. Click the controls to increase or decrease the Pods and click Save.
To scale up, click the + icon.
To scale down, click the - icon.
Stopping or scaling down the services
Click Stateful Sets in Workloads pane and select the service that you want to stop or scale down.
Click the Actions( ) icon, and select Scale.
In the Desired replicas field, select 0.
If the Actual replicas field contains 2, then you can scale down the number by decrementing in Desired replicas.
Click Scale.
Or, click the icon for the service that you want to stop or scale down.
Select Edit Stateful Set.
The YAML file is displayed.
Reduce the replicas number to zero in the file.
For example,
spec:
replicas: 0
selector:
matchLabels:
service: analytics-batch
Delete a Pod from the dashboard to restart it back automatically.
1. Click Workloads > Pods and select the Pod that you want to delete.
2.
Click the icon, and select Delete Stateful Set.
Database administration
Provides information about essential administration tasks such as backing up and restoring your performance data that is stored in IBM® Telco Network Cloud Manager -
Performance databases.
If your Telco Network Cloud Manager - Performance is installed in Kubernetes environment, then NFS is used as a storage service. In OpenShift® Container Platform
environment Ceph is used by default.
A backup is a safeguard against unexpected data loss and application errors. If you lose the original data, then you can reconstruct it by using a backup.
Important: As a part of database best practices, it is recommended that you run backup operation regularly. Backup and recovery procedures protect your database
against data loss and reconstruct the data, if there is a data loss.
Cleaning and maintaining the inventory database
A clean Inventory database is crucial for maintaining the Resource types and the properties that are collected by Telco Network Cloud Manager - Performance from
different sources.
NFS data back up and restore
Telco Network Cloud Manager - Performance uses the Network File System (NFS) protocol that enables the storage and retrieval of data. NFS is a component of
storage technology.
Cleaning and maintaining the inventory database
A clean Inventory database is crucial for maintaining the Resource types and the properties that are collected by Telco Network Cloud Manager - Performance from
different sources.
Keeping all the inactive Resource type instances from which the data is not collected is a waste of storage space. It also impacts the performance in querying the large
amount of unnecessary data. When you query the data, the Inventory might retrieve in inactive Resource type instances that are not useful.
By default, the Inventory Service soft deletes Resource type instance data if requested and maintains this data in its database. Inventory resource cleaner removes such
Resource type instances from the Inventory database by hard deletion of soft deleted and inactive resource type instances. The Inventory Service cleans the database in
IBM Telco Network Cloud Manager - Performance 1.4.5 291

three steps:
Checks the values set in the File Collector Service YAML file, and the last update value on the Resource type instances.
Updates the status of the Resource type instances to active or inactive.
The _active base property added to all the Resource types. It is set to TRUE for all Resource type instances from which the File Collector Service receives data in
next polling interval. After the data polling is stopped for a Resource type instance, File Collector Service waits for the next 3600 seconds and sends a trigger to the
Inventory Service to set _active property to FALSE.
All the Resource type instances that are set to inactive are removed from the database.
CAUTION:
Exercise caution in deleting the Resource types. When you query the database, the result might not have data for these Resource type instances that you are trying to
query.
Enable inactive resource tracking in the File Collector Service
Add the file-collector.data-availability.retention setting in the File Collector Service YAML file. Follow these steps.
Log in to your cloud platform web console.
Make sure you are in the correct project where you installed Telco Network Cloud Manager - Performance.
For example, noi or tncp project.
Go to Workloads > Stateful Sets and select the file-collector Service and click YAML.
Update the YAML to add the time period support with the following code:
args:
'--file-collector.data-availability.retention=3600'
Log in to your cloud platform web console.
Go to Workloads > Stateful Sets and select the file-collector Service and click the Edit resource ( ) icon.
Update the YAML to add the time zone support with the following code:
args:
'--file-collector.data-availability.retention=3600'
View the _active flag for the Resource type instances
Follow these steps:
1. Click Administration > General > Resource management.
You can see the Resource management page that has the Resource type and their instances available from the installed Technology Packs. You can load the
Resource types and instances.
2. Right-click any Resource type that has associated instances and select View Resource type instance details to the value of the _active flag.
Note: If the data is being sent to the File Collector, the flag is set to true.
See the following video to view the _active flag:
Clean the Resource type instances from the Inventory database
Add the needed settings to the common config map to trigger the Resource type instances cleanup. Follow these steps:
1. Log in to Telco Network Cloud Manager - Performance cloud web console.
2.
Select tncp from Namespace pane.
3.
Select tncp from Projects pane.
4.
Expand Workloads > Config Maps > common in the Config and Storage pane in the navigation pane.
5. Expand Workloads > Config Maps > common.
6. Add the following properties in the common Config Map:
resource.retentions.config: 'gtpu|omch=1,ipLayer=1'
resource.retentions.schedule.hour: '10:35'
resource.retentions.max.cleanup.count: '300000'
resource.retentions.log.report: 'true'
Property Description
292 IBM Telco Network Cloud Manager - Performance 1.4.5

Property Description
resource.ret
entions.conf
ig
Specify the criteria for the cleanup. Enter the list of Resource type instances to clean separated by pipe. The following criteria can be used:
*=15 to remove all the Resource type instances in the Inventory that are inactive from 15 days.
device|interface=10 to remove all the Resources of type device or interface in Inventory that is in the active from 10 days.
device=15,interface=10 to remove all the Resources of type device that is inactive from 15 days and of type interface that is
inactive from 10 days.
For example,
'gtpu|omch=1,ipLayer=1'
resource.ret
entions.sche
dule.hour
Specify the hour of day in hh:mm format at which the scheduler runs cleanup daily. It is Inventory Pod time in 24-hour format.
For example,
'10:35'
resource.ret
entions.max.
cleanup.coun
t
By default, maximum 200000 inactive Resource type instances can be deleted in one scheduler run. To modify this count, specify a different
value for the parameter.
For example,
'300000'
resource.ret
entions.log.
report
By default, the logging is disabled for Resource type instances deletion. Set this flag to true to log the deletion. The Resource type instances
cleaner logs a report of the deleted Resource type instances in each execution. For example, you can see the cleaner_<timestamp>.json log file
in the Inventory Service log file:
7. Restart the Inventory Service.
Result
After the cleanup scheduler runs, you might see the following messages in the Inventory Service logs:
[INFO] [2023-03-23 10:35:00.336] Resource cleaner running........
[INFO] [2023-03-23 10:35:00.338] unsupported msg in running ()
[INFO] [2023-03-23 10:35:00.338] Scaning deleted/inactive resources.
[INFO] [2023-03-23 10:35:00.339] fetching resources for config Retention(1,Set(gtpu, omch, ipLayer)).
[INFO] [2023-03-23 10:35:00.339] fetching resources deleted on 1679481300336 and types Set(gtpu, omch, ipLayer).
[INFO] [2023-03-23 10:35:00.498] fetching resources inactive resources from 1679481300336 and types Set(gtpu, omch, ipLayer).
[INFO] [2023-03-23 10:35:00.632] fetched 3 deleted(0) incative(3) resources before/from 1679481300336 and types gtpu,omch,ipLayer
[INFO] [2023-03-23 10:35:00.634] Cleaned 3 deleted/inactive resource before 2023-03-22T10:35:00.336Z
[INFO] [2023-03-23 10:35:00.634] Cleaning 3 deleted resources.
[INFO] [2023-03-23 10:35:00.636] Cleaning 3 resources.
[INFO] [2023-03-23 10:35:00.913] Push Event to Kafka {"event":"REMOVE","timestamp":1679481300336,"resource":{"_active":"false","boar
[INFO] [2023-03-23 10:35:01.369] Push Event to Kafka {"event":"REMOVE","timestamp":1679481300336,"resource":{"_active":"false","disp
[INFO] [2023-03-23 10:35:01.516] Push Event to Kafka {"event":"REMOVE","timestamp":1679481300336,"resource":{"_active":"false","boar
[INFO] [2023-03-23 10:35:01.523] cleaned 3 resources deleted/inactive before 2023-03-22T10:35:00.336Z.
[INFO] [2023-03-23 10:35:01.523] Cleanup finished.
[INFO] [2023-03-23 10:35:01.523] Cleaned 3 deleted/inactive resources
[INFO] [2023-03-23 10:35:01.525] Resource cleaner ready........
[INFO] [2023-03-23 10:36:53.902] 3 resources detected for regrouping
REST API
The following APIs can be used to remove the inactive Resource type instances:
stats
It is used to test retention configuration and resource type instances that are eligible for cleanup.
GET https://<dashboard route>/admin/cleaner/stats
It looks at the resource.retentions.config parameter that is already set and lists the content that can be cleaned up. You might see the following output:
{
"title":"Resource cleaner Report",
"retentions":"nUtranCell=1",// retention config
"effectiveTime":"1670383800462",//cleaner execution time
"user":"system",//username who trigger cleanup
"count":"0",//Number of resources deleted
"resources":[
]
}
execute
It is used to run a one-time cleanup. The cleanup is run in background and the cleanup report is written to log files.
GET https://<dashboard route>/admin/cleaner/execute
Note: Run this API on master node alone. It works only if the Resource retention configuration is set.
IBM Telco Network Cloud Manager - Performance 1.4.5 293

NFS data back up and restore
Telco Network Cloud Manager - Performance uses the Network File System (NFS) protocol that enables the storage and retrieval of data. NFS is a component of storage
technology.
Data from different data sources is stored in the following databases that are available in Telco Network Cloud Manager - Performance system.
All inventory data in Cassandra
All metric data from DiamondDB
All configuration data from PostgreSQL
By default, all these data is stored in Network File System (NFS) server.
NFS data backup
You can run the backup and restore procedure on the Network File System (NFS) based storage.
NFS data restore
Explains how to restore Telco Network Cloud Manager - Performance data to a previous state.
Related information
Network File System (NFS)
Data storage services
NFS data backup
You can run the backup and restore procedure on the Network File System (NFS) based storage.
About this task
Explains how to backup Telco Network Cloud Manager - Performance contents to your local directory.
Procedure
1. Log in to Kubernetes Dashboard.
a. https://<master_node_IP>:<Dashboard_externalPort>
2. Stop all the services in Telco Network Cloud Manager - Performance except for NFS from the Kubernetes dashboard.
Scale all the StatefulSets to 0, except for NFS Service. See, Controlling the Telco Network Cloud Manager - Performance services.
3. Run the backup.sh script that is available in <DIST_DIR>/etc/tools directory.
cd <DIST_DIR>/etc/tools
./backup.sh
Where, <DIST_DIR> refers to path where the Telco Network Cloud Manager - Performance image is extracted in the master node of your Kubernetes cluster.
For example,
./backup.sh
[info] Backing up data...
[info] Locating NFS server...
[info] Connecting to NFS server at <host_name>...
[info] Generating tar.gz file...
[info] Backup complete.
4. Verify that the backup.tar.gz file is successfully created.
ls <DIST_DIR>/etc/tools
backup.sh checkout.sh mirror.sh prerequisites.sh
backup.tar.gz edit.sh offline.bat restore.sh
checkin.sh execute.sh offline.sh shell.sh
5. Start all the services in Telco Network Cloud Manager - Performance from the Kubernetes dashboard.
See, Controlling the Telco Network Cloud Manager - Performance services.
Results
The backup script creates backup.tar.gz file, which contains the snapshot of the data, configuration, and pack content.
NFS data restore
Explains how to restore Telco Network Cloud Manager - Performance data to a previous state.
About this task
294 IBM Telco Network Cloud Manager - Performance 1.4.5

Assuming that your Telco Network Cloud Manager - Performance system fails, run the following steps to restore your backup content to the system.
Procedure
1. Log in to Kubernetes Dashboard.
a. https://<master_node_IP>:<Dashboard_externalPort>
2. Stop all the services in Telco Network Cloud Manager - Performance except for NFS from the Kubernetes dashboard.
Scale all the StatefulSets to 0, except for NFS Service. See, Controlling the Telco Network Cloud Manager - Performance services.
3. Run the restore.sh script that is available in <DIST_DIR>/etc/tools directory.
cd <DIST_DIR>/etc/tools
./restore.sh backup.tar.gz
Where,
<DIST_DIR> refers to path where the Telco Network Cloud Manager - Performance image is extracted in the master node of your Kubernetes cluster.
backup.tar.gz is the file name that was generated by the backup script.
The backup.tar.gz file contains the snapshot of the data, configuration, and pack content.
For example,
./restore.sh backup.tar.gz
[info] Restoring data...
[info] Locating NFS server...
[info] Connecting to NFS server at <host_name>...
[info] Restoring data from backup.tar.gz file...
[info] Restore complete.
4. Start all the services in Telco Network Cloud Manager - Performance from the Kubernetes dashboard.
See, Controlling the Telco Network Cloud Manager - Performance services.
Results
All the inventory, configuration, and historical metric backup data is restored.
Scaling the Timeseries Service to handle large data
Use this information to scale in and scale out the TimeSeries Service ff you have large data from the installed Technology Packs.
Procedure
Log in to your OpenShift® Container Platform web console on your primary cluster.
Scaling in the Timeseries Service
Expand Workloads > Pods > timeseries-0.
Click the YAML tab.
Update the memory and cpu values according to the data in your environment in the Timeseries Stateful Set YAML file in the following section:
containers:
- resources:
limits:
cpu: '1'
memory: '<1610612736>'
requests:
cpu: '1'
memory: '<1610612736>'
Click Save.
The timeseries-0 Pod is restarted automatically.
Scaling out the Timeseries Service by replicating the Timeseries Pod instances
Expand Workloads > Pods > timeseries-0.
Click the Teminal tab and give the following command:
Note: You must run this command to increase the Pod count.
curl http://localhost:30014/cluster?setClusterSize=3
Successsh-4.4$ ^C
Expand Workloads > StatefulSets > timeseries.
Click Actions > Edit Pod count and give number to replicate the Pods.
For example, give 3 based on the number specified in the curl command.
Click Save.
IBM Telco Network Cloud Manager - Performance 1.4.5 295

Report scheduler configurations
Scheduled reports are run at specified times and can be automatically sent by email to a user or a mailing list. Configurations that are needed to run the report scheduler
configurations are preset after the installation of Telco Network Cloud Manager - Performance.
By default, the scheduler configuration properties are set in the dashboard yaml configuration file during Telco Network Cloud Manager - Performance installation.
The Chrome browser and driver is also installed during the installation. You need to have the following Chrome browser and driver versions in order for schedule reports to
work correctly in your cloud environment.
Component Version
Chrome Browser 100.0.4896.75
Chrome Driver 100.0.4896.60
Note: From the Dashboard Service terminal on your cloud platform web console, run the following command to verify the Chrome browser and driver versions:
[basecamp@dashboard-0 Linux]$ ./chromedriver version
Starting ChromeDriver 100.0.4896.60 (6a5d10861ce8de5fce22564658033b43cb7de047-refs/branch-heads/4896@{#875}) on port 9515
Only local connections are allowed.
Please see https://chromedriver.chromium.org/security-considerations for suggestions on keeping ChromeDriver safe.
[1655106320.954][SEVERE]: bind() failed: Cannot assign requested address (99)
ChromeDriver was started successfully.
[basecamp@dashboard-0 Linux]$ /opt/google/chrome/chrome -product-version
100.0.4896.75
Configuring the scheduler email
Use this information for configuring the email settings that can be used for sending the scheduled reports to your email. The simple mail transfer protocol (SMTP)
configuration specifies how Telco Network Cloud Manager - Performance connects to the mail server that delivers email.
About this task
Update the dashboard yaml configuration file with the required information.
Procedure
1. Log in to the web console.
2. Select the tncp project.
3. Click Workloads > Stateful Sets > dashboard.
4.
Click the Edit resource icon ( ) to add the parameters and their values.
Or
5.
From the dashboard service, click the Actions( ) icon, and select Edit.
The Edit a resource page loads. Add the parameters and their values.
6.
Click the YAML tab to add the parameters and their values to the file.
Or
7.
From the dashboard service, click the Actions( ) icon, and select Edit Stateful Set.
Add the parameters and their values to the YAML file.
8. Set the following parameters in args: section and specify the values as needed.
Table 1. Configuring email settings in dashboard yaml file
Option Description Example
email.smtp.port The supported SMTP port number. 25
The SMTP default port is 25.
email.smtp.host The Telco Network Cloud Manager - Performance master node
where SMTP is supported.
mail.mydomain.com
email.smtp.rela
y
The Telco Network Cloud Manager - Performance master node
where SMTP relay protocol is supported.
mail.mydomain.com
email.smtp.user
name
The username of the administrator user. in the localDashboard
Application Services Hub portal.
npiadmin
296 IBM Telco Network Cloud Manager - Performance 1.4.5

Option Description Example
email.smtp.pass
word
The password of the administrator user. in the localDashboard
Application Services Hub portal.
<encrypted_password>
To encrypt the password, see Encrypting passwords. Copy the encrypted
password and place it in this configuration file.
email.from The email address of the sender. xyz@my.ibm.com
For example, the content of dashboard yaml configuration file:
image: >-
cp.icr.io/cp/tncp/basecamp-dashboard:2.3.1.0-41-
42c6191a@sha256:bd13dbc3acff1e7b3a576b2f523b8d621be94ae990c9f5552d905f02f9b3052f
args:
- '--ui-hosts=ui'
- '--ui.port=30021'
- '--dashboard.prd.username=npi'
- '--dashboard.prd.password=npi'
- '--http.port=31080'
- '--https.port=31443'
- '--email.smtp.port=25'
- '--email.smtp.host=127.127.127.127'
- '--email.smtp.relay=127.127.127.127'
- '--email.smtp.username=npiadmin'
- '--email.smtp.password=<password>
- '--email.from=tncp@my.ibm.com'
High availability
Learn about high availability, setting up and managing a high availability environment for Kafka nodes in Telco Network Cloud Manager - Performance.
High availability systems are designed to tolerate service interruption to a portion of the infrastructure while maintaining service availability. Service interruption can come
from the failure of infrastructure such as compute, networking, or storage, or from maintenance, such as upgrading or replacing infrastructure.
Set up Kafka high availability
Apache Kafka is a horizontally scalable, highly available, fault tolerant, low-latency, high-throughput event streaming platform.
Setting up horizontal auto scaling of Pods
Use this information to automatically scale the Telco Network Cloud Manager - Performance Pods to match the demand.
Set up Kafka high availability
Apache Kafka is a horizontally scalable, highly available, fault tolerant, low-latency, high-throughput event streaming platform.
A Kafka cluster can be broken down into two components, a control plane and a data plane. Kafka uses the Apache ZooKeeper cluster to provide most of its control plane
functionality. ZooKeeper tracks each broker and provides replicated and consistent storage for the cluster metadata. ZooKeeper also elects one Kafka broker to be the
controller. For Kafka cluster to be highly available, you must make sure that both control plane and data plane are highly available.
Set up high availability in ZooKeeper
To have a highly available ZooKeeper, use at least three servers. If you have more than three, it's better to use an odd number. By default, one replica of ZooKeeper is
available in Telco Network Cloud Manager - Performance. To achieve high availability, a minimum of three ZooKeeper instances are required. To create the three instances
to form a quorum, follow these steps:
1. Log in to your OpenShift® Container Platform web console on your primary cluster.
2. Expand Workloads > StatefulSets > zookeeper.
3. Click the YAML tab.
4. Define the value for the ZOOKEEPER_INSTANCE_ENTRIES parameter in the env section to 3.
- name: ZOOKEEPER_INSTANCE_ENTRIES
value: '3'
5. Click Save.
The ZooKeeper Pod is restarted automatically after you update the YAML file.
Then, you must manually scale up the Pods to three. Follow these steps:
1. Open your cloud platform web console.
https://<master_node_IP>:<Dashboard_externalPort>
2. Go to Workloads > Stateful Sets and select the zookeeper Service.
3. Click the Edit resource ( ) icon and define the value for the ZOOKEEPER_INSTANCE_ENTRIES parameter in the env section to 3.
- name: ZOOKEEPER_INSTANCE_ENTRIES
value: '3'
4. Click Save.
IBM Telco Network Cloud Manager - Performance 1.4.5 297

The ZooKeeper Pod is restarted automatically and the Pods are scaled up to three.
Verify that the ZooKeeper created the quorum of three cluster by using the following command:
echo srvr | nc zookeeper-<ordinal-number> 2181
echo srvr | nc zookeeper-1 2181
Set up high availability in Kafka
By default, one replica of Kafka is available in Telco Network Cloud Manager - Performance. You can scale to odd or even number of Kafka instances.
Manually scale up the Kafka Pods to the required number.
Related information
How to achieve high availability for Apache Kafka
Setting up horizontal auto scaling of Pods
Use this information to automatically scale the Telco Network Cloud Manager - Performance Pods to match the demand.
Horizontal scaling means that the response to increased load is to deploy more Pods. Currently, this feature is tested on the Inventory and TimeSeries Pods.
Enable horizontal scaling on Pods
At the time of installation of Telco Network Cloud Manager - Performance, follow these steps:
1. See the Scaling section in Installing the Operator on or Installing on Kubernetes.
2. Complete the installation.
After all the Pods are up and running, verify the environment variable settings in the Inventory and TimeSeries Stateful Sets. Follow these steps:
1. Log in to your cloud platform web console.
2. Go to Workloads > StatefulSets > timeseries.
Make sure that you are in noi or tncp namespace.
3. Click the Environment tab. If the scaling setting is enabled successfully, you can see the TELEMETRY_REMOTE variable and its value as
http://opentelemetry:30050/otel.
4. Repeat the steps 1 through 3 for Inventory StatefulSet to see the same TELEMETRY_REMOTE variable with its value as http://opentelemetry:30050/otel.
298 IBM Telco Network Cloud Manager - Performance 1.4.5

Install the Technology Packs
Make sure that the needed Technology Packs are installed to collect the data flow.
Update the sizing sheet
The sizing sheet is available in the Operator Pod. Follow these steps to locate and update it:
1. Log in to your cloud platform web console.
2. Go to Workloads > Pods > tncp-operator.
Make sure that you are in openshift_operators namespace.
3. Click Terminal and run the following commands:
cd /opt/basecamp/operator/resources
pwd
/opt/basecamp/operator/resources
ls
core extras sizing
4. Copy the sizing sheet from the Operator Pod to the host server with the following command:
kubectl cp openshift-operators/tncp-operator-<build_signature>/opt/basecamp/operator/resources/sizing/sizing.xlsm
/root/<your_directoty>/sizing.xlsm
5. Use a file manager like the winSCP to copy the sizing.xlsm file from the host server to your local system.
6. Open the sizing.xlsm file and update the values of the data collection to change the Total records (Million/hour) based on your requirement, the # of Instances
change.
Note: Use the formulas in the sheet to update the number of instances for auto scaling. For example, the TimeSeries Service on the # of Instances column has the
following formula.
=IF('Hardware Specs'!B7="Production",ROUNDUP(G13/F13, 0),ROUND(G13/F13,3))
Change the values in the specific columns that are in the formula to change the # of Instances value.
7. Copy the updated sizing.xlsm sheet to the Operator Pod host by using a file manager like WinSCP.
8. Copy the sizing.xlsm file from the Operator Pod host to its original location, /opt/basecamp/operator/resources/sizing/ folder with the following command:
kubectl cp ./sizing.xlsm openshift-operators/tncp-operator-
<build_signature>/opt/basecamp/operator/resources/sizing/sizing.xlsm
9. Auto scaling of the TimeSeries and Inventory Pods is done based on the value in the # of Instances column in the updated sizing.xlsm sheet.
10. Observe the log messages in the Operator Pod and also the scaling of the TimeSeries or Inventory Pods based on the updates to the sizing.xlsm file.
[INFO] [2024-02-28 15:47:14.425] Received new metrics values for namespace tncp: inventory.resources -> 48.0
[INFO] [2024-02-28 15:47:14.425] Calculating tncp service sizings based on metrics: Map(timeseries.records-per-hour -> 14754.0
[INFO] [2024-02-28 07:00:14.574] Sizing tncp:timeseries to 6 instances with 4.2 cpu and 192.0GB memory
[INFO] [2024-02-28 07:00:46.408] Received new metrics values for namespace tncp: timeseries.records-per-hour -> 0.0
Network device discovery
Network discovery is a process that helps to map and monitor your network infrastructure. All the network devices can connect and communicate with each other.
The virtual and mobile networks are changing dynamically. It is essential to have an automatic discovery for continuous device onboarding. It helps to monitor the network
state to identify bottlenecks and failures, and to ensure optimum network efficiency.
The discovery methods that function at layer 3, discover the devices, resources, and their properties in the network. Typically, three methods of discovery are available in
Telco Network Cloud Manager - Performance.
SNMP discovery
Discovery that is performed on the SNMP-based devices.
File-based discovery
IBM Telco Network Cloud Manager - Performance 1.4.5 299

Discovery that is performed on the file-based devices.
SNMP discovery process
Network discovery process gathers information about resources on your network. Make sure that you always gave most up-to-date inventory of the discovered
resources and resource types.
File-based discovery process
After the discovery, the discovered devices and their resources are stored in Cassandra database in the Inventory Service.
SNMP discovery process
Network discovery process gathers information about resources on your network. Make sure that you always gave most up-to-date inventory of the discovered resources
and resource types.
Telco Network Cloud Manager - Performance collects extra metadata that is related to performance metrics. All the information is stored in database. The SNMP Discovery
Service is the primary microservice that is used in discovery. Discovery formulas and the required MIB files are provided for discovery operations.
Resource discovery
Discovery is handled by SNMP Discovery Service. Discovered devices and their resources are stored in Cassandra database.
Discovery-related files and folders
Install the technology pack content that is bundled with Telco Network Cloud Manager - Performance installation media. The content is distributed in different
microservices and used for both discovery and polling operations by Telco Network Cloud Manager - Performance.
Troubleshooting discovery
Device caching and synchronization are built-in mechanisms to avoid discovering the same device twice. You can also troubleshoot discovery by monitoring
discovery events in the log file.
Resource discovery
Discovery is handled by SNMP Discovery Service. Discovered devices and their resources are stored in Cassandra database.
During discovery, Telco Network Cloud Manager - Performance discovers the configured SNMP devices and Telco Network Cloud Manager - Performance discovers their
resources from the devices. As these resources respond, their addresses and properties are stored in the database for use in the analysis phase. The analysis phase stores
the resource information.
Configuring discovery profile and device credentials
For more information, see Managing SNMP discovery profiles and Managing SNMP credentials.
Mapping SNMP credential to SNMP Discovery profile
You can select an SNMP credential that is already configured for the profile and the IP address or the IP address range. You can opt to leave it blank. If you leave it
blank, during the discovery operation, the SNMP Discovery Service searches all the available SNMP Credentials. It might take longer time to discover these devices
and might result in timeout or performance degradation.
See the following logs from SNMP Discovery Service log files where a Discovery profile is not mapped with a credential:
Start discovering ipaddress 10.55.239.184 with credential List((Cert1,161,3000,2), (Cert2,161,3000,2),
(Cert3,161,3000,2), (TestCert1,161,3000,2), (TestCert3,161,3000,2), (PersistentCert1,161,3000,2),
(PersistentCert2,161,3000,2),
(SNMPCert1,161,7000,7))
Start discovering 10.55.239.184 using Cert1
Note: In the credential list, the (Cert1,161,3000,2) indicates, the name of the SNMP credential, SNMP port number, timeout in milliseconds, and number of
retries.
The SNMP Discovery Service searches through all the existing credentials and uses the first applicable credential to start the discovery. It might take longer time to
start the discovery for this device.
See the following logs from SNMP Discovery Service log files where a Discovery profile is mapped with a credential:
Start discovering ipaddress 10.55.239.188 with credential List((PersistentCert1,161,3000,2))
Discovery for this device is faster.
On-demand discovery
You can run network discovery on demand and observe the status. You can initiate, control and observe the discovery of the devices in your network from the
Discovery profiles system configuration page. For more information, see Managing SNMP discovery profiles.
Stages in discovery
Discovery in Telco Network Cloud Manager - Performance is done in two stages.
Typically, the configured devices are discovered and device IP addresses and their credentials are pulled by SNMP Collector Service.
The second-level discovery is done based on the device IDs of the discovered devices. Only, the device entities that are referred to as resource types and
their properties are discovered by Telco Network Cloud Manager - Performance. Telco Network Cloud Manager - Performance discovers the vendor-specific
resources that are associated with the devices and stores the resource data in Cassandra database.
In Rapid SNMP device onboarding scenario, you can create your own discovery formulas, package, and install them to start the discovery of both devices and
their resource types.
Important: Do not modify the preinstalled discovery files that are available in the Technology Packs.
Data flow during the discovery process is as follows:
1. Configure the SNMP Discovery profile and SNMP credentials.
2. SNMP Discovery Service discovers all the SNMP devices or agents based on the configurations from SNMP Discovery profile and based on the discovery
formulas that are available in the installed Technology Packs.
300 IBM Telco Network Cloud Manager - Performance 1.4.5

3. SNMP Discovery Service sends the discovered resources to the Inventory Service directly to be stored in the Cassandra database.
4. SNMP Collector loads and subscribes the SNMP resources and based on the collection formulas from the installed Technology Packs to poll OIDs from the
SNMP-enabled devices or agents.
5. SNMP Collector computes the collection formulas and sends the results directly to the Timeseries Service.
Discovered resources and their IDs
When a device is discovered, an ID is generated. Telco Network Cloud Manager - Performance inherits the device ID and discovers the resources that are associated
with the device and performs the following tasks:
system-objectid.discovery file is run to obtain the sysObjectId of the device.
sysObjectId is the vendor's identification number of OID of an SNMP-managed object type. It represents the type of device and can also indicate the
model number. It uses dotted decimal format. For example, some vendor IDs are as follows:
Table 1. Vendor and model identification
numbers
Vendor OID
Cisco 1.3.6.1.4.1.9
Huawei 1.3.6.1.4.1.2011
Juniper 1.3.6.1.4.1.2636
Juniper Networks/Unisphere 1.3.6.1.4.1.4874
For more information, see IANA-registered Private Enterprise Numbers.
All the discovery files that match with the same sysObjectId are run to obtain the resources from those devices.
The discovered resources are assigned an ID and stored in the inventory data in Cassandra.
Before these resources are stored, a validation check or reconciliation is done based on the resource name. The resource name is expected to be an invariant
field and it is used to compare if the resource is a rediscovered one. If the resource is updated, the record is updated. The status is set to U in the tables.
Otherwise, it is ignored as an existing resource.
During a scheduled discovery, if some existing resources for a device are not discovered, those resources are deleted and the status is set to D in the tables.
Resource types
When you install the technology packs, the resource types are displayed for all types of devices in the Resource Management page in Administration.
During discovery, the SNMP Discovery Service does the following tasks:
Checks if the discovered resource type is available in the database or not.
If it is available, it is written to inventory data in Cassandra.
If the resource type is not available, the record is dropped.
Related information
Supporting multibyte (non-ASCII) characters in Telco Network Cloud Manager - Performance
Discovery-related files and folders
Install the technology pack content that is bundled with Telco Network Cloud Manager - Performance installation media. The content is distributed in different
microservices and used for both discovery and polling operations by Telco Network Cloud Manager - Performance.
All the content related to discovery process is available in SNMP Discovery Service and is distributed as follows:
/opt/basecamp/snmp-discovery/content/ folder has the following folders and files.
discovery
Contains the discovery formulas arranged as, <vendor>/<vendor-specific discovery formula files>.
mibs
Contains the MIB files arranged as, mibs/<vendor>/<vendor-specific MIB files>.
system-objectid.discovery
Discovery formulas
Predefined discovery formulas that are available in the technology pack are used by Telco Network Cloud Manager - Performance to discover the vendor-specific devices
and their resources based on the OIDs from their associated MIB files.
Typical content of a vendor-specific discovery formula is as follows:
when resource.type = 'device' and resource.sysobjectid like '1.3.6.1.4.1.2011'
select hwEntityStateTable.index, hwEntityAdminStatus as adminStatus, hwEntityOperStatus as operStatus, hwEntityStandbyStatus,
hwEntityTemperature, entPhysicalTable.index, entPhysicalIndex, entPhysicalDescr, entPhysicalVendorType, entPhysicalName,
entPhysicalClass from HuaweiEntityExtentMib.hwEntityStateTable LEFT JOIN EntityMib.entPhysicalTable ON
hwEntityStateTable.index = entPhysicalTable.index where entPhysicalClass = 7
set type = 'fan'
set vendor = "Huawei"
set entityDescr = resource.entPhysicalDescr
set id = context.host + '_Huawei_Fan:<' + resource.index + '>'
unset entPhysicalDescr'
Content of the system-objectid.discovery file is as follows:
when resource.type = "unknown" and resource.ipAddress is not ""
select sysName as name, sysDescr, sysObjectID, sysUpTime, sysContact, sysName, sysLocation, sysServices from system where
IBM Telco Network Cloud Manager - Performance 1.4.5 301

sysObjectId is not null
set type = 'device'
set ipAddress = context.host
set id = context.host
set vendor = Utils.vendor(resource.sysObjectId)
MIB files
All vendor-specific and dependent standard MIB files that are required for the predefined formulas are available and installed with the pack content. All MIB files are
arranged in specific vendor folders.
Troubleshooting discovery
Device caching and synchronization are built-in mechanisms to avoid discovering the same device twice. You can also troubleshoot discovery by monitoring discovery
events in the log file.
Synchronization between credential record and device information
If the SNMP Collector Service receives the record with device parent ID before the device credentials or vice-verse, it loops back the record 10 times with an
interval of one minute. It waits for the credential information, failing which, it drops the record with a warning message.
Log files associated with discovery
Monitor the /opt/basecamp/snmp-discovery/logs file from SNMP Discovery Pod.
File-based discovery process
After the discovery, the discovered devices and their resources are stored in Cassandra database in the Inventory Service.
Discovery formulas
Discovery rules are available in the as predefined discovery formulas for specific vendors and technologies. These discovery formulas are used by Telco Network Cloud
Manager - Performance to discover the vendor-specific devices and their resources.
An example of Avro record from Apache NiFi from where basic inventory and metric information can be obtained:
{
"resource" : "deviceIP=10.71.214.65, deviceID=7340054, deviceName=FTTO_Test1, resourceID=NE:7340054;FR:0;S:5;CP:-1;PP:-
-0-;ONU:0, id=FTTO_Test1/Frame:0/Slot:5/Port:0/ONU ID:0, type=huaweiGponOnt, granularityPeriod=15, indicatorGroupID=IG80112",
"time" : 1526372100000,
"tpe" : "NUMBER",
"kpi" : "upAverageThroughput",
"value" : "110.00"
}
After the Technology Pack is installed, you can see the discovery formulas in the following location:
/opt/basecamp/file-collector/content/discoveries/<tech_pack>. The discovery formulas have .discovery as the file extension. These formulas contain additional discovery
rules to obtain more information about the resources, properties, and their relationships.
Typically, every Technology Pack has three types of discovery formulas.
Device discovery rule
These rules are used in discovery formulas in built-in Technology Packs for resource discovery to create or enrich in-band discovered resources and the relation
discovery (stitch) to create relations among the resources.
For example,
engine file
when resource.type like 'cabinet'
select * from local.cabinet
set vendor = 'cabinet'
set prop2 = resource.prop2
unset prop1
Resource and properties discovery rules that are specific to a resource type.
Optionally, formulas can contain discovery rules to obtain additional properties. For example,
engine file
when resource.type like 'cabinet'
select * from local.<resource_type>
set prop1 = <resource_type>.prop1
set prop2 = <resource_type>.prop2
set prop2 = <resource_type>.prop3
Resource relationship rules
For example,
engine file
relate device to cabinet as contain when target.name == source.prop2
nokiaDevice.discovery file contents.
engine file
when resource.vendor like 'Nokia'
302 IBM Telco Network Cloud Manager - Performance 1.4.5

select deviceName from local.gponIgmpCard UNION ALL select deviceName from local.gponMulticastSystem UNION ALL select
deviceName from local.gponInterface UNION ALL select deviceName from local.gponEthernetLag UNION ALL select deviceName from
local.gponCard UNION ALL select deviceName from local.gponOnt UNION ALL select deviceName from local.gponUniPort UNION ALL
select deviceName from local.gponVoice UNION ALL select deviceName from local.gponOntEthernetPort UNION ALL select deviceName
from local.gponVlan UNION ALL select deviceName from local.gponBridgePortVlan UNION ALL select deviceName from local.gponXdsl
set id = resource.deviceName
set name = resource.deviceName
set type = 'device'
set vendor = 'Nokia'
Syntax rules for discovery formulas
A .discovery file can contain either discovery formula or relationship formula, not both.
A resource type available as a table by its name and all its properties as columns within the table.
A resource type is available in two schemas, local and global. Local schema is for resources that are processed within the inventory interval, while global is all
resources that are available in Inventory Service.
Note: Global schema is meant for lookups and enrichment by using global as main query table can impact performance.
The when clause in a discovery formula is to filter the local resources that are returned by local schemas tables. If the when clause is missing from a discovery
formula, the data is not filtered.
SQL query expressions in H2 SQL grammar are required for the discovery formulas.
The set and unset directives are to further transform the properties after the query. These directives are based on JavaScript expressions.
Global schemas
Discovery model files
Discovery model files are applicable for both SNMP and File-based discovery. Two types of model files are available in the Inventory Service:
/opt/basecamp/services/inventory/content/model/Property
The model files have .model as the file extension. Every resource type has its own property model file that describes all the properties that are available in that
resource type. For example, the contents of gponCard.model file is as follows:
type gponCard extends snmpPollable{
property index String{
required = true
}
property vendor String
property id String
property hwFrameType String
property tpFrameId String
property tpSlotId String
property hwSerialNumber String
property cardType String
property sysName String
property deviceType String
property portType String
property displayName String
property deviceName String
property deviceIP String
property objectID String
property cardID String
property portSlot String
property portShelf String
property portRack String
property portPort String
property card String
property portCard String
property deviceID String
property resourceID String
property granularityPeriod String
property waitPeriod String
property interval String
}
}
/opt/basecamp/services/inventory/content/model/Relationship
The model files have .model as the file extension. Every resource type has its own relationship model file that describes the resource grouping based on the
resource type and the device. For example, the contents of device-card.model file is as follows:
relationship contain device ->> card
Stages in discovery
Apache NiFi and File Collector Service parse and extract the information from the input files from EMS.
IBM Telco Network Cloud Manager - Performance 1.4.5 303

Kafka
EMS
Apache NiFi
Timeseries Inventory
Resource Management
File Collector
XML/CSV Files
Avro Records
Avro Records
Metrics Resources and
Reationships
1
2
3
4 5
Scheduling the discovery
Use this information to update the File Collector YAML file to schedule the discovery process to run periodically by setting the configuration.
Scheduling the discovery
Use this information to update the File Collector YAML file to schedule the discovery process to run periodically by setting the configuration.
Procedure
Log in to your cloud platform web console.
Click Workloads > Stateful Sets > file-collector.
Add the parameters and their values to the file-collector Stateful Set YAML file.
From the file-collector service, click the Actions( ) icon, and select Edit Stateful Set.
The Edit a resource page loads. Add the parameters and their values.
Click the Edit resource icon ( ) to add the parameters and their values.
Add the file-collector.inventory.interval parameter in args: section and specify a value. By default, the interval is 3600. To disable the discovery, set this value to
zero.
For example,
image: >-
cp.icr.io/cp/tncp/basecamp-file-collector:2.3.1.0-15-
8328b12a@sha256:64475b04a15f4fe9c916e531045b5cbdbb210c4e810c30aaaec0a2a72fe3c469
args:
- '--file-collector.kafka.bootstrap=kafka:9092'
- '--file-collector.timeseries.hosts=timeseries-0.timeseries'
- '--file-collector.timeseries.port=30014'
- '--inventory-service.hosts=inventory-0.inventory'
- '--inventory-service.port=30016'
- '--http.port=30024'
- '--https.port=30025'
- '--file-collector.inventory.interval=7200'
if you specify 7200, the discovery process is run once in two hours.
Rename the tncp-operator in the annotations section as follows:
metadata:
annotations:
manager: tncp-operator-<updated>
It is to make sure that on the Operator restart, the changes are not reverted to default.
Save the file.
When the YAML file is updated and saved, the Pod is restarted automatically.
Performance data collection models
The performance metrics to be collected are supplied from the Technology Packs and stored in time series database for further processing and visualization.
Typically, in Telco Network Cloud Manager - Performance, you can perform two types of data collection:
304 IBM Telco Network Cloud Manager - Performance 1.4.5

SNMP resource and metric polling
Network polling is a process to collect information from devices and to monitor their behavior. A technique that continually interrogates a peripheral device to see
whether it has data to transfer. You can collect the metrics from different SNMP-enabled devices and entity types based on the data in the Management Information
Base (MIB) variables of the devices.
File-based resource and metric collection
The File Collector is configured to collect metrics from the discovered resources based on the installed Technology Packs. The File Collector Service parses the files
that are generated from the EMS and converts the files into a common Avro record format. These records contain inventory and metric data. The File Collector sorts
the windowed data and sends the inventory data to the Resource management and metric data to the Timeseries Service for further processing and storage.
Polling the network
Polling is for SNMP metric collection from the devices in your network and to store the data in the database. You can collect the metrics from different devices and
entity types based on the data in the Management Information Base (MIB) variables of the devices.
File-based data collection model
Typically, the File Collector Service collects and performs computations on data in a windowed fashion. It makes the arrival of data sensitive to processing window.
Polling the network
Polling is for SNMP metric collection from the devices in your network and to store the data in the database. You can collect the metrics from different devices and entity
types based on the data in the Management Information Base (MIB) variables of the devices.
About this task
Typically, network polling for resources is performed every 300 seconds, which is the default polling interval.
Procedure
1. Install the Technology Pack content that comes with the predefined formulas, metrics, and MIB files.
Telco Network Cloud Manager - Performance supports SNMP metrics, vendor-specific IP SLA metrics, and device health metrics for Cisco, Huawei, and Juniper
devices.
Apart from using the predefined metrics, you can also create or modify metrics and formulas. For more information, see Rapid device onboarding.
2. Optional: You can add or edit the property pollingInterval for each resource type from Resource Management page under Administration to set new polling
interval. The default polling interval is 300 seconds.
Enabling and disabling formulas
Currently, the formulas that are available in the built-in technology packs are more than the ones that are used in Telco Network Cloud Manager - Performance
Dashboards. By default, the formulas that are not needed for data visualizations in dashboards are disabled by appending an "_" to the formula name. For example,
Channel.Interference.Power.dBm.formula_.
Troubleshooting network polling
To troubleshoot network polling, monitor the polling events in SNMP Collector Service log files.
Related information
Installing Technology Packs
Managing Resource types
Enabling and disabling formulas
Currently, the formulas that are available in the built-in technology packs are more than the ones that are used in Telco Network Cloud Manager - Performance
Dashboards. By default, the formulas that are not needed for data visualizations in dashboards are disabled by appending an "_" to the formula name. For example,
Channel.Interference.Power.dBm.formula_.
About this task
You can enable or disable the metrics to be collected and displayed in the dashboards and there by control the system performance and resource utilization. Make sure to
install all the required technology packs so that the metrics are enabled.
Use this information to control the metric polling by enabling or disabling the metrics by using the snmp-formula.sh script as root or sudo user from master node. The
snmp-formula.sh is available in the Advanced bundle in <DIST_DIR>/tools/snmp/ folder.
Usage of the script.
cd <DIST_DIR>
sudo ./tools/snmp/snmp-formula.sh
Error: Argument missing
Usage: options
options:
list List all formulas available in the system
enable <formula id> Enable the given formula id. Formula id is combination of grouping name and metric name.
disable <formula id> Disable the given formula id. Formula id is combination of grouping name and metric name.
Procedure
IBM Telco Network Cloud Manager - Performance 1.4.5 305

1. List all the formulas in the installed technology packs and their status by using the following command:
sudo ./tools/snmp/snmp-formula.sh list
You can see the following output:
cisco_ipsla/http/Probe.HTTP.DNS.RTT.ms ENABLED (default)
cisco_ipsla/http/Probe.HTTP.RTT.ms ENABLED (default)
cisco_ipsla/http/Probe.HTTP.TCP-Connect.RTT.ms ENABLED (default)
cisco_ipsla/http/Probe.HTTP.Total.Transaction.RTT.ms ENABLED (default)
cisco_ipsla/jitter/Probe.Jitter.Inbound.Avg.ms ENABLED (default)
cisco_ipsla/jitter/Probe.Jitter.Inbound.One-way.Avg.ms ENABLED (default)
cisco_ipsla/jitter/Probe.Jitter.Inbound.Packet.Loss.Percent ENABLED (default)
cisco_ipsla/jitter/Probe.Jitter.Outbound.Avg.ms ENABLED (default)
cisco_ipsla/jitter/Probe.Jitter.Outbound.One-way.Avg.ms ENABLED (default)
cisco_ipsla/jitter/Probe.Jitter.Outbound.Packet.Loss.Percent ENABLED (default)
cisco_ipsla/jitter/Probe.Jitter.Packet.Count ENABLED (default)
cisco_ipsla/jitter/Probe.Jitter.Packet.Loss.Percent ENABLED (default)
cisco_ipsla/jitter/Probe.Jitter.Succeeded.Percent ENABLED (default)
cisco_ipsla/round_trip/Probe.Echo.Probe.Count ENABLED (default)
cisco_ipsla/round_trip/Probe.Echo.Probe.Loss.Percent ENABLED (default)
cisco_ipsla/round_trip/Probe.Echo.Probe.Succeeded.Percent ENABLED (default)
cisco_ipsla/round_trip/Probe.Echo.RTT.ms ENABLED (default)
cisco_ipsla/rtp/Probe.RTP.Inbound.Inter-Arrival.Jitter.ms ENABLED (default)
cisco_ipsla/rtp/Probe.RTP.Inbound.Jitter.Avg.ms ENABLED (default)
cisco_ipsla/rtp/Probe.RTP.Inbound.Packet.Loss.Percent ENABLED (default)
cisco_ipsla/rtp/Probe.RTP.Outbound.Inter-Arrival.Jitter.ms ENABLED (default)
cisco_ipsla/rtp/Probe.RTP.Outbound.Jitter.Avg.ms ENABLED (default)
cisco_ipsla/rtp/Probe.RTP.Outbound.Packet.Loss.Percent ENABLED (default)
cisco_ipsla/rtp/Probe.RTP.RTT.ms ENABLED (default)
cisco_ipsla/voip/Probe.VOIP.ICPIF ENABLED (default)
cisco_ipsla/voip/Probe.VOIP.MOS ENABLED (default)
cisco_ipsla/http/Probe.HTTP.Transaction.Failed.Percent DISABLED (default)
cisco_ipsla/http/Probe.HTTP.Transaction.Succeeded.Percent DISABLED (default)
cisco_ipsla/jitter/Probe.Jitter.Inbound.Negative.Max.ms DISABLED (default)
cisco_ipsla/jitter/Probe.Jitter.Inbound.Positive.Max.ms DISABLED (default)
cisco_ipsla/jitter/Probe.Jitter.Outbound.Negative.Max.ms DISABLED (default)
cisco_ipsla/jitter/Probe.Jitter.Outbound.Positive.Max.ms DISABLED (default)
cisco_ipsla/jitter/Probe.Jitter.Packet.Loss.Unknown.Percent DISABLED (default)
cisco_ipsla/jitter/Probe.Jitter.Probe.Count DISABLED (default)
cisco_ipsla/jitter/Probe.Jitter.Probes.Lost.Percent DISABLED (default)
cisco_ipsla/jitter/Probe.Jitter.Probes.Succeeded.Percent DISABLED (default)
cisco_ipsla/jitter/Probe.Jitter.RTT.Avg.ms DISABLED (default)
cisco_ipsla/jitter/Probe.Jitter.RTT.Std-Dev.ms DISABLED (default)
cisco_ipsla/jitter/Probe.Jitter.RTT.ms.stddev DISABLED (default)
cisco_ipsla/rtp/Probe.RTP.Inbound.Early.Packets.Percent DISABLED (default)
cisco_ipsla/rtp/Probe.RTP.Inbound.Frame.Loss.Count DISABLED (default)
cisco_ipsla/rtp/Probe.RTP.Inbound.Late.Packets.Percent DISABLED (default)
cisco_ipsla/rtp/Probe.RTP.Inbound.MOS-CQ DISABLED (default)
cisco_ipsla/rtp/Probe.RTP.Inbound.MOS-LQ DISABLED (default)
cisco_ipsla/rtp/Probe.RTP.Inbound.R-Factor DISABLED (default)
cisco_ipsla/rtp/Probe.RTP.Outbound.MOS-CQ DISABLED (default)
cisco_ipsla/rtp/Probe.RTP.Outbound.R.Factor DISABLED (default)
cisco_ipsla/rtp/Probe.RTP.Packet.Loss.Unknown.Percent DISABLED (default)
cisco_ipsla/tests/Probe.Duplicate.Poll.Count DISABLED (default)
cisco_ipsla/tests/Probe.Missed.Count DISABLED (default)
cisco_ipsla/tests/Probe.Tests.Duplicate.Poll.Count DISABLED (default)
cisco_ipsla/tests/Probe.Tests.Missed.Count DISABLED (default)
cisco_ipsla/tests/Probe.Tests.Test.Availability.Percent DISABLED (default)
cisco_ipsla/tests/Probe.Tests.Test.Count DISABLED (default)
2. Enable a metric by using the following command:
sudo ./tools/snmp/snmp-formula.sh enable <formula_ID>
Where, <formula_ID> is a combination of group subdirectory path and metric name.
Note: You must use the subdirectory structure for the metric that you want to enable.
For example,
sudo ./tools/snmp/snmp-formula.sh enable cisco_ipsla/jitter/Probe.Jitter.Probes.Lost.Percent
3. Disable a metric by using the following command:
sudo ./tools/snmp/snmp-formula.sh disable <formula_ID>
Where, <formula_ID> is a combination of group subdirectory path and the metric name.
Note: You must use the subdirectory structure for the metric that you want to disable.
sudo ./tools/snmp/snmp-formula.sh disable cisco_ipsla/voip/Probe.VOIP.MOS
Troubleshooting network polling
To troubleshoot network polling, monitor the polling events in SNMP Collector Service log files.
About this task
306 IBM Telco Network Cloud Manager - Performance 1.4.5

Monitor the /opt/basecamp/snmp-collector/logs from SNMP Collector Pod. The log file shows the following events:
All the initial poll definitions
Changes to the existing definitions
New poll definitions
File-based data collection model
Typically, the File Collector Service collects and performs computations on data in a windowed fashion. It makes the arrival of data sensitive to processing window.
Two ways of tuning the data collection process,
Improving confidence
Confidence is a measure of making sure that all records within a timestamp or period are received. Increase in confidence levels results in minimizing the data loss.
Reducing latency
Latency is a measure of delay between receiving a record and performing computations on it for storage. Reducing the latency results in faster data refreshes and
more real-time data. Reducing the latency can facilitate faster data refreshes and more near real-time data but the late data is lost.
Tuning depends on data arrival patterns and requirements. If all data arrives in a fixed pattern and predefined duration, then the window progress can be tuned to the
duration. If the incoming data pattern is not fixed and late data comes after long delays, then the decision can be made to delay the window progress. Or, take middle
approach to wait for most of the data to arrive with a calculated risk for late data to get dropped.
You must understand the following concepts to create the best configuration to your environment:
Wave period
Periodic intervals where File Collector checks whether a window is ready to be closed (active window). The criteria for a window to be closed is number of waves
that has no new data that comes in the window period that is wait period. If new data comes into the window within this period, then the wait period is reset, and
wait continues.
Window period
Length of time that is needed to group a set of data before it slides to next period. For example, if the window period is configured to 15 minutes (900 seconds) and
the current window is 1:00:00 AM to 1:14:59 AM. After the window is progressed, all the data that is collected and grouped by the period is written to timeseries
database. The next timestamp 1:15:00 AM to 1:29:59 AM is made the current window. Records that are received with older than current window timestamp get
dropped while records with future timestamps are buffered until the window period is active.
Wait duration
It is the amount of time the File Collector waits for data on the period before it progresses to the next window. This duration can be depicted in number of waves.
For example, if the wait period is set to 10 minutes (600 seconds), and waves set to the default value of 10 seconds, number of waves is equal to wait period /
wave. That is, 600/300 is equal to two waves. The window period progresses only if the collector doesn't receive any new data for the period for exactly two waves.
Otherwise, the count is restarted.
Configuring the metric collection
Use this information to update the File Collector YAML file to configure the metric collection.
Related information
Network device discovery
Configuring the metric collection
Use this information to update the File Collector YAML file to configure the metric collection.
About this task
Required parameters
file-collector.wave.period
Describes wave interval in seconds that triggers window state checking. Default value is 10 seconds.
file-collector.default.interval
Default data interval in seconds. Default value is 1800 seconds.
file-collector.default.wait
Describes the time interval in seconds that must pass since last record is updated to the window. Then, the window is eligible to be closed for further processing.
Default value is 10 seconds.
Procedure
1. Log in to your cloud platform web console.
2. Select tncp from Projects.
3. Click Workloads > Stateful Sets > file-collector.
4.
Click the Edit resource icon ( ) to add the parameters and their values.
Or
IBM Telco Network Cloud Manager - Performance 1.4.5 307

5.
From the file-collector service, click the icon, and select Edit.
The Edit a resource page loads. Add the parameters and their values.
6.
From the file-collector service, click the icon, and select Edit Stateful Set.
Add the parameters and their values to the YAML file.
7. Set the following parameters in args: section and specify the values as needed.
file-collector.default.wait
file-collector.default.interval
file-collector.inventory.interval
For example,
image: >-
cp.icr.io/cp/tncp/basecamp-file-collector:2.3.1.0-15-
8328b12a@sha256:64475b04a15f4fe9c916e531045b5cbdbb210c4e810c30aaaec0a2a72fe3c469
args:
- '--file-collector.kafka.bootstrap=kafka:9092'
- '--file-collector.timeseries.hosts=timeseries-0.timeseries'
- '--file-collector.timeseries.port=30014'
- '--inventory-service.hosts=inventory-0.inventory'
- '--inventory-service.port=30016'
- '--http.port=30024'
- '--https.port=30025'
- '--file-collector.default.wait=180'
- '--file-collector.default.interval=300'
- '--file-collector.inventory.interval=3600'
- '--logging.level=INFO'
- '--file-collector.disable-db=true'
8. Save the file.
When the YAML file is updated and saved, the Pod is restarted automatically.
Creating and managing Technology Packs
Accomplishing device onboarding accurately and consistently is critical to any enterprise. Rapid onboarding for new devices that are introduced in the network can be
completed within one day. Within this period, the required discovery formulas, collection formulas, and metrics can be created and deployed for Telco Network Cloud
Manager - Performance to start discovery and metric collection.
Use this information to understand the current capabilities of Pack Service UI and some open items that are part of the upcoming deliveries.
Current capabilities of the Pack Service
Create a pack rule with basic information from the Pack Service web UI and export it to an Excel format to add all the artifacts manually.
Import an existing pack rule to the Pack Service web UI and validate some of the artifacts.
Deploy the pack rule to your existing Telco Network Cloud Manager - Performance environment to start collecting the metrics and to view them on the Metric
Viewer dashboard.
SNMP packs are also supported by the Pack Service. You can install and edit an SNMP pack. However, you cannot create a rule-based file for an SNMP pack.
Create lookup and enrichment CSV files and supporting scripts to packs that are created from the Pack Service.
Export a pack rule together with all the supporting content as pack JAR file for distribution.
Capabilities that are given in the upcoming releases
Cleaning up the web UI for better user experience in crafting pack rules.
Integrating with User authentication and authorization and linking with audit details.
Benchmarking and performance tuning for Technology Packs that are generated by the Pack Service.
Improving the performance for pack rule deployment.
Solution overview
Pack Service, which is delivered as a part of Telco Network Cloud Manager - Performance solution can be used to create custom Technology Packs and also to customize
the (Commercial Off-the-Shelf) COTS Technology Packs.
A technology pack is an application package that is designed for use with Telco Network Cloud Manager - Performance. A technology pack provides technology-related
performance management functions. An example is Global System for Mobile Communications (GSM). A technology pack is deployed on the core application platform. A
technology pack can be configured to present wireless, wireline, or flow data information that is specific to vendors and technology.
Pack Service has a web-based tool to design and develop Technology Pack that can be deployed in Telco Network Cloud Manager - Performance system. The content can
then be used to discover and poll the resources from newly on-boarded devices.
Note: Currently, this tool is supported to create File-based Technology Packs and not SNMP Technology Packs.
With the help of the Pack Service UI, you can create the following artifacts that are needed to develop a Technology Pack that can be later deployed in the Telco Network
Cloud Manager - Performance system:
Discovery formulas
Discovery formulas are used to discover and analyze the network. Discovery formulas are used against managed nodes or hosts only and their resource types and
are designed to return a list of resource types, their properties, and other metadata.
Collection formulas
308 IBM Telco Network Cloud Manager - Performance 1.4.5

Collection formulas are used to collect information about the status of various devices in the network during polling. These formulas are applied against raw or
statistical data that is collected from managed nodes and saved in the database.
Inventory model files
The model files contain models, which are the inventory metadata applicable for the resource type and relationships, which are the hierarchical relationships of the
resource types.
NiFi-collector files and folders in File-based Technology Packs to process the raw and statistical data. Template data in XML or lookup files, or script format are sent
to the NiFi Collector Service as flow template for further processing to Avro format.
Metrics
A metric is a single data value, which is identified by the resource and displayed in a report.
Note:
Using the Pack Service, you can create pack rule models and generate all the artifacts automatically and deploy them to the relevant Telco Network Cloud Manager -
Performance components.
File collection
NiFi Collector
File Collector
Core Services
Inventory
Timeseries
Threshold
Analytics
Pack Service
Discovery & Metric formulas
REST APIS
Metric files
Template - XML/ Lookup/scripts
Model files
For more information about how the Technology Pack content is distributed to different Telco Network Cloud Manager - Performance Services, see .
Pack Service functions
Pack Service contains set of data source types. Each one of these data source types is mapped to a specific NiFi Common Template.
NiFi Common templates are pre-built based on the requirements from the market.
When a pack rule is deployed, the pack rule is validated, built, and applied to the target common template to produce the final NiFi Flow template. The common
templates are used in the following ways:
Get raw data and normalize each record for pack rule.
Set of NiFi processors to evaluate the rules against the records.
Transform to Avro record for further processing by File Collector.
Pack Service can generate NiFi flow template from the rules and common templates that are specified in the UI. It can also gather and generate artifacts for
resource model, relationships, formulas, and metrics.
Pack Service also generates extra formulas for File Collector to process further.
Note: Apache NiFi is used to parse raw data without spatial and temporal context. Further processing that requires spatial and temporal context is handled by File
Collector for discovery and metric formulas.
After Telco Network Cloud Manager - Performance is installed on your system, you can see that the Pack Service Pod is up and running and you can access the Pack
service UI.
Accessing the Pack service UI
Use this information to access the Pack service UI in your Telco Network Cloud Manager - Performance cluster.
Workflow to create a Technology Pack
You can use the Pack service UI to create a Technology Pack in different scenarios.
Deploy the Technology Pack
Pack rule models
Pack rule is a model in a standard schema that is needed for the Pack Service to generate a Technology Pack.
REST APIs
Use this information to understand some sample Rest API requests and responses by using curl commands directly.
Troubleshooting
Use this information to understand some issues you might find in the usage of the Pack Service.
Accessing the Pack service UI
Use this information to access the Pack service UI in your Telco Network Cloud Manager - Performance cluster.
Before you begin
IBM Telco Network Cloud Manager - Performance 1.4.5 309

After the Telco Network Cloud Manager - Performance is installed, you can see the Pack service is scaled up. Ensure that Telco Network Cloud Manager - Performance
Version 1.4.5 is up and running.
that
Use the following steps to access the Pack service page:
1. Log in to your Telco Network Cloud Manager - Performance Dashboards.
See Logging in to the reporting interface.
2. Click Administration > Pack management > Pack service.
You can see the Pack service page.
Workflow to create a Technology Pack
You can use the Pack service UI to create a Technology Pack in different scenarios.
Consider the following scenarios:
Create a complete Technology Pack from the beginning.
Create a data source ID and other artifacts in the Pack rule on the web UI and deploy the Technology Pack in your Telco Network Cloud Manager - Performance
environment.
Note: You can create the data source ID alone in the web UI, commit the changes, and export the contents to Excel, JSON, or JAR format and continue to handcraft
the Technology Pack. After it is complete, it can be imported back to the web UI and deployed.
The workflow to create a Technology Pack from scratch is as follows:
310 IBM Telco Network Cloud Manager - Performance 1.4.5

Create a Technology Pack from an existing Pack rule.
You require the Pack rule file in Excel, JSON, or JAR format.
If a Pack rule file does not exist in Excel, JSON, or JAR file format, create the Rule file in the Pack web UI. Export the contents to Excel, JSON, or JAR format
and update the contents to handcraft the Pack rule that is specific to your Technology Pack.
Or
Take an existing Pack rule file in Excel, JSON, or JAR format and update the contents to handcraft the Pack rule specific to your Technology Pack.
In both these options, you must import back the updated Excel, JSON, or JAR file to Pack Rule Web UI and deploy the Technology Pack in your Telco Network Cloud
Manager - Performance environment.
Create new pack
Currently, you can create a Pack rule by using a combination of Pack service web UI and handcraft from the exported file JAR file.
Edit a Technology Pack content
The pack rule content that is handcrafted can be validated on the Update Pack rule page before it is deployed. You can make the corrections and deploy.
Import and export Technology Pack content
Import is useful in migration scenarios. Export options can be used to bundle the pack content after it is created to be deployed on another environment.
Create new pack
Currently, you can create a Pack rule by using a combination of Pack service web UI and handcraft from the exported file JAR file.
The following tasks are described here:
Access the Pack service UI
Generic functions in Pack service UI
Create minimum pack rule content
Create the Technology Pack artifacts
Create basic profile data
Create Resource type details
Access the Pack service UI
See Accessing the Pack service UI.
Generic functions in Pack service UI
IBM Telco Network Cloud Manager - Performance 1.4.5 311

Pack rule is a model in a standard schema that Pack Service is designed to accept. You must provide the data according to the schema to generate a Telco Network Cloud
Manager - Performance Technology Pack.
Some of the generic functions that are applicable for all Technology Packs are as follows:
Searching for a Technology Pack
Click the Search table ( ) icon and type the first few characters of the Technology Pack name to see the pack that you are interested in.
Refreshing a Technology Pack
Click the Refresh ( ) icon to refresh the contents in the Pack service screen.
Importing a Technology Pack
Click the Import ( ) icon to import an existing JAR file from your local file system. If a pack is existing in the table with the same name, it does not import it. If it
is a new pack, it is added to the table.
Click Add File to browse and upload a pack JAR file.
Note: The file size cannot exceed 500 MB.
Note: You might notice that the upload might take a while. It might be due to the anti-virus scan before the file is uploaded.
Some of the functions that are specific to a Technology Pack that is available in the table are as follows:
Editing a Technology Pack
Click the Edit ( ) icon to update the pack JAR file data.
Deleting a Technology Pack
Click the Delete ( ) icon to delete a pack from the table.
Exporting a Technology Pack
Click the Export ( ) icon to export the pack JAR file. All the pack content is downloaded to your default Downloads folder as a JAR file only.
Importing and replacing an existing Technology Pack
Click the Import and replace ( ) icon to import a pack JAR file. If it is already in the table, it replaces the existing pack.
Note: Currently, JAR file format alone is supported.
Deploying a Technology Pack
Click the Deploy ( ) icon to see the following actions:
Validate
Validate the Technology Pack before you deploy it to avoid errors during the deployment.
Deploy
Installs the Technology Pack in your cloud environment.
Remove
Uninstalls the Technology Pack from your cloud environment.
Using the More actions icon
Click the More actions ( ) icon that opens a panel of action icons is available. The following options are specific to a pack:
Pack rule ( )
It can be used to update the pack rule. This option is available only if the Technology Pack is created from the Pack Service.
Lookup ( )
It can be used to update or create a lookup data for the Technology Pack.
Pack content ( )
Displays the available pack artifacts, such as metrics, formulas, models, and discovery files. You can edit, delete, export, and import and replace the file for
any of the artifacts. If you updated or replaced the file content previously, you can view the history and compare the versions.
History ( )
You can see revision history of the pack. You can compare the changes in any two selected revisions. You can copy or export the content for any of the
revisions.
Create minimum pack rule content
Create the minimum content on the Pack Service web UI and export the content JAR file format. You can then manually enter all the pack content and its artifacts and
import it back to deploy from the Pack service UI. Or, you can continue to create all the artifacts on the UI itself.
1. Click the Create new ( ) button to open the Create new Pack rule page.
2. Select the Data source type, which is the NiFi template for the source file format from the list.
312 IBM Telco Network Cloud Manager - Performance 1.4.5

In Pack service, each pack rule is based on a data source type. Typically, each data source type is set of data from NiFi parsing for the same set of raw data. The
records are normalized to apply the pack rules. All the common templates that are bundled in the Pack Service are listed as data source type field.
Select the type that is applicable for the Technology Pack that you are creating. For example, 3gppPmXml.
Note: A new data source type can be created by adding NiFi common template to the Pack Service and specify the data source type in the pack.json file in the Pack
Service repository.
3. Enter the data source ID in Data source id field.
Data source ID to identify the pack. You can uniquely identify a Technology Pack by its data source type and ID combination.
4. Enter the pack ID in the Pack key field. For example, 00000000-0000-0000-0000-000000000000.
It is an optional field. It is needed when you want to handle exact same raw data in multiple different ways. For example, when you upgrade software for a set of
devices or network elements in stages and a set of raw metrics or properties changes between these different versions of software, you can identify the version
with Pack key.
5. Optional: Click Commit and enter a comment and confirm. You can now see your Pack rule in the table.
You can perform the following tasks at this stage:
a. Click the Export ( ) icon for the pack to export the pack as a JAR file.
Note: Pack artifacts are not yet available at this stage.
b. Click the Edit ( ) icon to update the following fields and click Commit:
Name
Description
Version
Variables
c. Click More actions > Pack content to continue to add more content to the Pack.
d. Click More actions > Pack rule to continue to add more content to the Pack.
e. Click More actions > Pack rule and click the Export ( ) icon to export the pack content in JSON or Excel file format.
Note: It is applicable for custom packs only and not for COTS Technology Packs.
f. Click More actions > Pack rule and click the Import ( ) icon and select Import and replace to import an Excel or JSON file from your local folder and
replace it with the existing rule.
g. Click More actions > Pack rule and click the Import ( ) icon and select select Patch to import an Excel or JSON file from your local folder and append to
the existing rule.
6. Add the Technology Pack content. See Create the Technology Pack artifacts.
Create the Technology Pack artifacts
Create all the artifacts that are needed to develop a Technology Pack. You can create the following artifacts in profile section:
Domain
Model
Extra properties at the Technology Pack level and provide regex or lookup expression.
Resource types
Add the following content at the Resource Type level and provide regex or lookup expression:
Extra properties
Hierarchy details
Model
KPI details
Formulas
Create basic profile data
Expand the Profile section in the Pack details pane and create the following content:
Domain
Currently, the Pack Service supports two domains, Wireless and Wireline. It is used for hierarchy.
When Wireless is specified, the Resource type is expected to relate under Region and Network, and when Wireline is specified, the Resource type is expected to
relate under Device.
Select the domain for the Technology Pack from the following options:
Wireless
Wireline
Model
Field Details
Model fields
Vendor Provide the record path expression and click Validate. Provide a value for the expression path and click Evaluate.
Technology Provide the record path expression and click Validate. Provide a value for the expression path and click Evaluate.
Version Provide the record path expression and click Validate. Provide a value for the expression path and click Evaluate.
Device Provide the record path expression and click Validate. Provide a value for the expression path and click Evaluate.
Region Provide the record path expression and click Validate. Provide a value for the expression path and click Evaluate.
Network Provide the record path expression and click Validate. Provide a value for the expression path and click Evaluate.
Create extra properties
Field Details
IBM Telco Network Cloud Manager - Performance 1.4.5 313

Field Details
Extra properties > Add properties
Name Provide the name of the property.
Expression Expression to define the property.
Note: Click Validate to validate the expression.
Enrichment Select the checkbox to enrich the property. Inventory enrichment property uses the inventory KPI.
Internal Select the checkbox if you do not want to include the property in the Resource type now but include it later.
Create Resource type details
Along with a Resource type, you must create model, metrics, and formulas.
Create a Resource type
1. In the Resource Type section, enter the following details:
Field Details
Disable Resource
type
Select the checkbox if you do not want to enable the Resource type after it is created. By default, the Resource type is enabled after it
is created.
Include KPI filter Select the checkbox to include the KPI filter along with the Resource filter.
ResourceType Provide a name for the Resource type.
Filter Expression to filter the Resource types.
ResourceId Provide Resource ID.
2. Click Next to create a model .
Create model that is specific to the Resource type
1. In the Model section, enter the following details:
Field Details
Vendor Provide the record path expression and click Validate. Provide a value for the expression path and click Evaluate.
Note: It is a mandatory field.
Technology Provide the record path expression and click Validate. Provide a value for the expression path and click Evaluate.
Note: It is a mandatory field.
Version Provide the record path expression and click Validate. Provide a value for the expression path and click Evaluate.
Note: It is a mandatory field.
Device Provide the record path expression and click Validate. Provide a value for the expression path and click Evaluate.
Region Provide the record path expression and click Validate. Provide a value for the expression path and click Evaluate.
Network Provide the record path expression and click Validate. Provide a value for the expression path and click Evaluate.
Display name Provide the record path expression and click Validate. Provide a value for the expression path and click Evaluate.
2. If you want to create extra properties for the Resource type, expand the Extra properties section and clickAdd properties and enter the details as shown in
the table.
3. Expand the Hierarchy details section and click Add hierarchy to create a hierarchy.
Provide the following details in the Add/Edit hierarchy page:
Field Details
Parent type For example, device.
Lookup For example, deviceID.
You can see the hierarchy in the Hierarchy details pane.
You can also create a new property that is linked to a parent property. Click Add properties and enter property name and the parent property name in the
Add/Edit property page and click OK.
4. Click Next to create metrics.
Create KPIs
1. In the KPI details section, click Add KPI and enter the following details:
Field Details
Disabled Click the checkbox if you want to disable the metric. By default, the metric is enabled after it is created.
Name Name of the metric.
Filter Expression to filter the metrics.
Value Define a value for the metric.
Timestamp Define a timestamp for the metric in milliseconds.
Interval Define an interval for the metric collection.
Unit Define a unit for the metric.
Aggregation Define an aggregation for the metric.
Description Provide a description for the metric.
2. Click OK.
You can see the metric in the table. You can edit it if needed. You can also delete the metric if it is not needed.
3. Click the Settings ( ) icon to enable all the metrics in the table in bulk or disable all the metrics in the table in bulk.
4. You can also search for a metric from the Search table field.
Note: You can search the table by a value from any column to see a specific KPI.
5. Click Add KPI to create more KPIs as needed.
6. Click Next to create formulas.
Create formulas
314 IBM Telco Network Cloud Manager - Performance 1.4.5

1. In the Formula section, click Add formula and enter the following details:
Fields Details
Disabled Select the checkbox to disable the formula. By default, the formula is enabled after its creation.
Name Name of the formula.
Formula
expression
Define the formula expression.
Unit Define a unit for the output of the formula expression.
Aggregation Define an aggregation to be used in the formula.
Description Provide a description for the formula.
Source pane
Timestamp Provide a timestamp for the formula in milliseconds. If it is defined, this timestamp is applicable for all sub-KPIs that created in the
following section.
Interval Define an interval for the formula to be run.
2. In the KPIs pane, click Add KPI to create more KPIs.
3. Enter the following details:
Fileds Details
KPI filter Expression to filter the metrics.
KPI value Define a value for the metric.
Timestamp Define a timestamp for the metric.
Interval Define an interval for the metric collection.
4. Click OK.
You can see the formula in the table. You can edit it if needed. You can also delete the formula if it is not needed.
5. Click the Settings ( ) icon to enable all the formulas in the table in bulk or disable all the formulas in the table in bulk.
6. You can also search for a formula from the Search table field.
Note: You can search the table by a value from any column to see a specific formula.
7. Click Add formula to create more formulas as needed.
8. click Done to complete the creation of all Pack artifacts.
At this stage, click Add Resource Type type if you want to create more. See Create Resource type details.
9. Click Commit and enter a comment in the text box and click Confirm.
You can see your pack in the Pack service page.
Create lookup data
Lookup is for data enrichment that is not directly available from incoming raw data. For example, it is used to identify region and market for the incoming network
element. Typically, the raw data comes with information to lookup another lookup table to get the customer-specific data or view.
Create lookup data
Lookup is for data enrichment that is not directly available from incoming raw data. For example, it is used to identify region and market for the incoming network element.
Typically, the raw data comes with information to lookup another lookup table to get the customer-specific data or view.
In this solution, where lookup can be directly created, everything about lookup table is kept dynamic so that extra tables can be created and modified at run time.
1. Click the More actions ( ) icon and select Lookup.
2. Click the Create new ( ) button to open the Pack lookup page.
3. Enter the look up name.
For example, devices.
4. Click Add/Edit header ( ) icon.
5. Click the Add header ( ) icon and enter the header name that you want to give in your lookup data in the Text field.
6. Click OK.
Similarly, you can create all the headers that are needed in the lookup. For example, you can create the following headers for the devices lookup:
Key
It is the default header for which you must provide values. These values appear as rows in the For example, display name for the device.
DeviceName
DevicePort
DeviceUser
DevicePassword
You can see the headers in the Pack lookup page.
7. Click Add record to enter actual values for all the fields that are created.
8. Click OK and click Commit.
9. Provide comment in the Comment field and click Confirm.
10. Click the Edit ( ) icon for the lookup and edit the values for all the headers that are created previously.
11. Click the Delete ( ) icon to delete the lookup record.
12. Click Commit and provide comment in the Comment field and click Confirm.
You can see your lookup with its name, headers, and their values as specified by you.
IBM Telco Network Cloud Manager - Performance 1.4.5 315

13. You can perform the following actions on your lookup records that are available in the Pack lookup page.
Click the Edit icon to add or edit the lookup headers and their values.
Click the Delete ( ) icon to delete the lookup completely.
Click the Export ( ) icon to export the lookup to a JSON or an Excel format.
Click the Import icon and select Import and replace to import an available lookup and replace it with a specific lookup that is available on the Pack lookup
page.
Or, select Patch to append more lookup records from an external lookup to an existing lookup on the Pack lookup page.
Click the History ( ) icon to view all the modifications that are made to a lookup in the table.
From the History page, select any two revisions that you want to compare and click the Compare revisions ( ) button.
You can compare the changes that are done in both the revisions. You can also perform the following actions:
Copy to clipboard
Click the Copy to clipboard ( ) icon to copy the contents of a revision.
Export a revision content
Click the Export ( ) icon to export the contents of the revision to a JSON file.
You can see the file in your default Downloads folder with the name in this format:
Lookup-<pack_name>-<lookup_name>-<timestamp>.
For example: Lookup-telemetry-telemetry-devices-1677997818022.
Edit a Technology Pack content
The pack rule content that is handcrafted can be validated on the Update Pack rule page before it is deployed. You can make the corrections and deploy.
Edit a pack JAR content
1. For a specific pack on the Pack service page click the Edit ( Edit icon) icon.
Pack JAR Edit window opens with the pack details.
2. You can update only the following details:
Name
Description
Version
3. Click Commit.
4. Enter a comment in the text area and click Confirm.
Edit a pack rule
1. Click the More actions ( ) icon for a specific Technology Pack from the table and select Pack rule.
2. Edit the existing pack rule content.
Validate the content from the Pack service UI itself.
Note:
3.
Import and export Technology Pack content
Import is useful in migration scenarios. Export options can be used to bundle the pack content after it is created to be deployed on another environment.
Import options
You can import a new Technology Pack JAR file, replace an existing Technology Pack JAR file. You can import and replace an existing Pack rule file and also the individual
pack content files.
Importing a new Technology Pack JAR file
1. Click the Import ( ) icon to import a Pack JAR file.
a. Click Add fileto locate the file from your local file system to import.
b. Click Upload.
Use this option to import a new Technology Pack that is not available in the table.
Note: The JAR file size cannot exceed more than 500 MB.
Importing an existing Technology Pack JAR file
1. Click the Import and replace option for a specific pack that is available in the table to import a JAR file to replace the existing one.
2. Click Add file, browse, and select the file to import.
316 IBM Telco Network Cloud Manager - Performance 1.4.5

3. Click Upload.
Note: The JAR file size cannot exceed more than 500 MB.
Importing a pack rule file
1. Click the More actions ( ) icon for a specific Technology Pack from the table and select Pack rule.
2. Select Import and replace.
Using this option, you can replace an existing pack rule with the one that is imported in JSON or Excel format.
Or
3. Click the More actions ( ) icon and select Patch for a Technology Pack content that is in the table.
Using this option, you can append new content or update the existing content with the one that is imported in JSON or Excel format.
Note: These import options are available only for a custom Technology Pack and not for COTS packs.
Importing pack content
1. Click the More actions > Pack content > Import icon to import a new external pack content file and replace an existing file with updated content.
Note: Maximum size of the file can be 200 MB.
2. Click the More actions > Pack content > Import and replace file to import and replace an existing pack artifact file with an external file.
For example, use this option if you want to replace an existing .discovery file with an external .discovery file.
Note: Maximum size of the file can be 200 MB.
Export
You can export the entire Technology Pack to a JAR file. Or, you export a pack rule content to JSON or Excel formats. You can also export a pack content as individual files.
Exporting a pack to a JAR file
1. Click the Export ( ) icon for a specific pack in the table.
You can see that the pack content is exported to a JAR file and is saved to your default Downloads directory.
Exporting pack rule
1. Click the More actions ( ) icon for a specific Technology Pack from the table and select Pack rule.
2. Click the Export ( ) for a specific pack in the table.
3. Select JSON or Excel format to export the content to.
You can see that the pack content is exported to the selected format and is saved to your default Downloads directory.
Note: This export option is available only for a custom Technology Pack and not for COTS packs.
Exporting pack content
1. Click the More actions ( ) icon for a specific Technology Pack from the table and select Pack content.
2. Click the Export ( ) for a specific pack content in the table.
For example, use this option if you want to export a .discovery file, click the Export icon for that content. The content is exported to your default Downloads
directory.
Deploy the Technology Pack
When you are ready to deploy the technology pack in Telco Network Cloud Manager - Performance environment, follow these steps:
1. Select the pack name and click the Deploy ( ) icon.
You can see a success message after the deployment. The different deployment states are as follows in order that they appear are as follows:
draft
It is the state before deployment or when a technology pack is edited and committed.
Validating
The build job is started after the deployment is initiated. It is the state when the system is validating the technology pack content. If no error is found in the
validation state, build progresses.
building
After a successful validation, if the content is good the build job is created.
built
It is the state after the content is built successfully.
errored
It is the status after deployment and when the pack cannot be deployed due to errors in validation.
deploying
If no error is found, the state is changed to deploying.
deployed
It is the state after deployment is completed successfully. If deployment is unsuccessful for any reason, the state is changed to errored.
removing
IBM Telco Network Cloud Manager - Performance 1.4.5 317

It is a state after you try to remove a pack from the Deploy ( ) options.
removed
It is a state after a pack is uninstalled and removed from the Telco Network Cloud Manager - Performance system.
2. It takes a while to refresh the status on the page. Click the Refresh ( ) icon on the Pack page to see the correct state of the pack.
3. Click the link in the State column for any technology pack in the Pack page, you can see the logs for build task, pack task, and Threshold Crossing Alert (TCA) task.
4. Check the Pack Service log file for any error messages.
5. Go to NiFi web UI and check whether the NiFi template for the pack is generated or not.
Installing Technology Packs
Use this information to install the Technology Pack content that is available with Telco Network Cloud Manager - Performance installation media. The ready-to-use
Technology Pack content includes predefined vendor-specific discovery formulas, collection formulas, and metrics that you can use for discovery and polling the
devices.
Uninstalling Technology Packs
Uninstall Technology Packs and the related GOM files from the system.
Installing Technology Packs
Use this information to install the Technology Pack content that is available with Telco Network Cloud Manager - Performance installation media. The ready-to-use
Technology Pack content includes predefined vendor-specific discovery formulas, collection formulas, and metrics that you can use for discovery and polling the devices.
Before you begin
Make sure to install, set up your cluster, and configure your Telco Network Cloud Manager - Performance system successfully.
Make sure to install Telco Network Cloud Manager - Performance Operator.
Make sure to download the Technology Pack bundles.
Make sure that the NiFi Service is scaled to 1 to enable the creation of the NiFi template successfully. Follow these steps:
In OpenShift® Container Platform dashboard, click Stateful Sets in Workloads pane and select the service that you want to scale up or down.
Click the Actions( ) icon for the service that you want to stop or scale down.
Select Edit Stateful Set.
The YAML file is displayed.
Increase the replicas number to 1 in the file.
For example,
spec:
replicas: 1
selector:
matchLabels:
service: analytics-batch
In Kubernetes dashboard, click Stateful Sets in Workloads pane and select the service that you want to scale up or down.
Click the Actions( ) icon and select Scale for the service that you want to stop or scale down.
In the Desired replicas field, select 0.
If the Actual replicas field contains 2, then you can scale down the number by decrementing in Desired replicas.
318 IBM Telco Network Cloud Manager - Performance 1.4.5

Click Scale.
About this task
SNMP Technology Packs have the following content with in the sub folders:
dashboard
json
Contains specific dashboard JSON files.
menus
Contains menu definitions for the SNMP pack specific dashboards.
properties
Contains all the dashboard properties files for all translated languages.
Note: Dashboards are available in some packs only.
discovery
Contains a folder with the name of the Technology Pack
that has the discovery files with the extension .discovery.
inventory
With in the model folder, Property and Relationship subfolders are available. These folders contain the inventory model files that contain properties and
relationships in the resources. Both property and relationship files have the extension .model.
Note: The inventory folder is available in some packs only.
metrics
Contains the metric files that are organized according to the available Resource types in the pack. Metric files have the extension .metric.
snmp
It has formulas and mibs sub folders. The formulas folder contains the collection formula files with the extension .formula. All the formulas are organized according
to the available Resource types in the pack. The mibs folder contains the MIB files that needed for the Technology Pack.
pack-<pack_name>-details.xlsx
Contains an excel file with all the pack content. For example, pack-network-probe-juniper-details.xlsx.
pack.properties
Contains pack metadata and the dependent packs information.
File-based Technology Packs have the following content:
analytics
Contains predefined batch jobs, streams, and user-defined calculations that are imported directly when the pack is installed as JSON files. You can see these
default jobs and user-defined calculations in Batch Analytics and User-Defined Calculations administration pages. This content is available in some packs only.
file
It has the following subfolders:
discoveries
Contains a folder with the name of the Technology Pack that has the discovery files with the extension .discovery.
formulas
Contains a folder with the name of the Technology Pack that has the collection formula files with the extension .formula. All the formulas are organized
according to the available Resource types in the pack.
inventory
With in the model folder, Property and Relationship sub folders are available. These folders contain the inventory model files that contain properties and parent-
child relationship within the resources. Both property and relationship files have the extension .model.
metrics
Contains the metric files that are organized according to the available Resource types in the pack. Metric files have the extension .metric.
nifi-collector
Contains Apache NiFi related files that include the NiFi flow templates, lookup files, and so on.
pack-<pack_name>-details.xlsx
An excel file with all the pack content. For example, pack-nr-huawei-nutran-v100r015c10-1.0.0-details.xlsx.
pack.properties
Contains pack metadata and the dependent packs.
Flow Technology Pack has the following content:
dashboard
json
Contains all the Flow dashboard JSON files.
menus
Contains all the Flow dashboard menu definitions as JSON files.
properties
Contains all the Flow dashboard properties files for all translated languages.
flow
Contains all the Flow metric formulas as .formula files.
IBM Telco Network Cloud Manager - Performance 1.4.5 319

inventory
With in the model folder, Property and Relationship sub folders are available. These folders contain the inventory model files that contain properties and parent-
child relationship within the resources. Both property and relationship files have the extension .model.
metrics
Contains the metric files that are organized according to the available Resource types in the pack. Metric files have the extension .metric.
pack-network-flow-details.xlsx
An excel file with all the pack content.
pack.properties
Contains pack metadata and the dependent packs.
Network Wireless Technology Pack
dashboard
json
Contains all the mobile dashboard JSON files.
menus
Contains all the mobile dashboard menu as JSON files.
properties
Contains all the mobile dashboard properties files for all translated languages.
inventory
With in the model folder, Property and Relationship sub folders are available. These folders contain the inventory model files that contain properties and parent-
child relationship within the resources. Both property and relationship files have the extension .model.
pack-network-wireless-details.xlsx
An excel file with all the pack content.
pack.properties
Contains pack metadata.
Procedure
1. Download the packs to a directory in your local file system.
For example, <DIST_DIR_PACKS>/packs.
2. Make sure that all the services in Telco Network Cloud Manager - Performance are scaled up.
3. Access Telco Network Cloud Manager - Performance dashboards.
4. Click Administration > Pack management > Pack service.
You can see the Pack service page that has a grid. After you import the packs, you can the list of packs and their details.
5. Click the Import ( ) icon from the upper right of the page and select the Technology Pack JAR file that you want to import and click Upload.
The maximum size of the JAR file must be less than 500 MB.
You can see the Technology Pack in the grid.
6. Click the Deploy ( ) icon in the Actions pane and select Validate.
This action validates the pack content and displays validation errors if any.
After the validation is successful, you can see the Validated message in the State column on the Pack service page.
7. Click the Deploy ( ) icon in the Actions pane and select Deploy to deploy the pack.
Before the pack is deployed, it is validated and displays validation errors if any. After that, the state is changed to deploying.
8. Check the installation log file from the following location:
From the Pack service UI, click the link in the State column for a specific Technology Pack to view the Pack log messages for the pack.
320 IBM Telco Network Cloud Manager - Performance 1.4.5

9. If the Technology Packs have the Batch Analytics jobs, streams, and User-Defined Calculations (UDCs), check in analytics-stream-
0:/opt/basecamp/analytics/work/pack-installation.logs file until it is completed, make sure that it has no errors.
Results
The following services are scaled up after the installation of Telco Network Cloud Manager - Performance Technology Packs:
SNMP Discovery and SNMP Collector
If an SNMP Technology Pack is installed, the pack installer scales up these services, and then starts these collectors.
NiFi and File Collector
If a file-based Technology Pack is installed, the pack installer scales up these services, and then starts these collectors.
Analytics Stream and Analytics Batch
If a Technology Pack that contains the preconfigured streams or batch jobs is installed, the pack installer scales up these services, and then it starts these services.
DNS Collector, Flow Collector, and Flow Analytics
If the Network Flow Technology Pack is installed, the pack installer scales up these services, and then starts these services.
For File-based Technology Packs, all the NiFi templates are automatically uploaded to Apache NiFi UI. The content within the pack is distributed to different
services in vendor-specific directories. Verify that the templates are available in the NiFi UI.
What to do next
IBM Telco Network Cloud Manager - Performance 1.4.5 321

After the Technology Packs are installed, you might not see the default dashboard menus on the Telco Network Cloud Manager - Performance Dashboards. Manually,
publish the menus. See Publishing menus.
Uninstalling Technology Packs
Uninstall Technology Packs and the related GOM files from the system.
Before you begin
Back up your data.
Procedure
1. Access Telco Network Cloud Manager - Performance dashboards.
2. Click Administration > Pack management > Pack service.
You can see the Pack service page that has a grid. After you deploy the packs, you can see the list of packs and their details.
3. Click the Deploy ( ) icon in the Actions pane and select Remove and click Confirm.
If the Technology Pack JAR file is edited after the deployment, the state changes to draft. To delete the pack, click More actions ( ) and select History. Select the
revision that is deployed earlier. It applies a filter to the pack JAR file listing page and lists only the selected revision with state deployed. You can then remove or
uninstall the pack JAR file that is previously deployed.
After it is removed successfully, you can see the removed message in the State column on the Pack service page.
4. To check the pack logs, click the removed link in the State column for the Technology Pack to view the Pack log messages.
Pack rule models
Pack rule is a model in a standard schema that is needed for the Pack Service to generate a Technology Pack.
Pack rule
The schema of the rule must comply with the following rules:
Based on the data source type, the common template to use for the pack rules is identified.
The data source type and ID combination uniquely identify all the packs in Telco Network Cloud Manager - Performance.
Pack key and Pack sections are needed when you want to handle the exact same raw data in multiple different ways. For example, when you upgrade software for a
set of devices or network elements in stages and a set of Metrics and their properties change between the software. Hence you must identify the software (pack
key) that might involve lookup from external system and handle it under its own pack rule.
All those rule fields that start with metaXx accept record path expression, both RHS, and LHS.
All those rule fields that end with xxFilter accept record path condition only, which is LHS.
Pack rule models
The Pack Service supports pack rules model in multiple different formats but with the same schema. Supported formats are JSON and Excel.
Note: Use pack rule export feature to get JSON or Excel files and use it as base.
322 IBM Telco Network Cloud Manager - Performance 1.4.5

JSON
{
"dataSourceType": "3gppPmXml",
"dataSourceId": "LteHuaweiEutran",
"packs": [
{
"domain": "Wireless",
"model": {
"metaVendor": "Huawei",
"metaTechnology": "LTE",
"metaVersion": "v100r017c10spc125",
"metaRegion": "East",
"metaNetwork": "PLMN"
},
"resourceTypes": [
{
"resourceFilter": "[/measCollecFile/measData/measInfo/@measInfoId='1526726811']",
"resourceType": "ENodeBFunction",
"metaResourceId": "substringBefore(/measCollecFile/measData/measInfo/measValue/@measObjLdn,'/')",
"model": {
"relate": {
"parentType": "Region",
"parentLookupProperty": "region"
}
},
"kpis": [
{
"kpiFilter": "[zipContains(/measCollecFile/measData/measInfo/measTypes,
/measCollecFile/measData/measInfo/measValue/measResults, '1526737822')]",
"kpiName": "eNodeBFunction.eNodeB.Unavail.Num",
"metaKpiValue": "zipValue(/measCollecFile/measData/measInfo/measTypes,
/measCollecFile/measData/measInfo/measValue/measResults, '1526737822')",
"metaTimestamp": "toDate(/measCollecFile/fileHeader/measCollec/@beginTime, 'yyyy-MM-dd\\'T\\'HH:mm:ssX')",
"metaInterval": "replaceRegex(/measCollecFile/measData/measInfo/granPeriod/@duration, '[A-Z]','')",
"unit": "number",
"aggregation": "sum",
"description": "Number of times an eNodeB becomes unavailable."
}
]
}
]
}
]
}
Excel
NiFi record path
NiFi Record Path is an expression that is derived from the NiFi expression language. It is used specifically in their UpdateRecord processor. This expression language can
handle most of the expressions that are needed to extract details out of statistic data for further processing by Telco Network Cloud Manager - Performance. Hence it is
opted for Pack rules. However, to maintain simplicity, some advance features of the language such as relative path, descendant operators, array index, and embedded
path filters are not supported.
Relative path, for example, ./relative/path
descendant operators, for example, //child/path
Array index, for example, /path/array[0]
embedded path filters, for example, /path[/something='x']/child
As for conditional updates, NiFi record path expressions expect it to be broken down to left-hand-side (LHS) operation and right-hand-side (RHS) operation.
LHS: /key[/another='some value']
RHS: 'new value'
It can be expressed as [/another='some value'] -> 'new value'
IBM Telco Network Cloud Manager - Performance 1.4.5 323

Note: The '->' at the RHS is direct expression. (Previously, needed braces around expression are removed from build basecamp-pack-service:2.4.1.0-172 onward.)
In better example with context:
- kpiName: kpi2
metaKpiValue: "[/another='some value'] -> /value2"
metaTimestamp: "/timestamp"
metaInterval: 900
unit: count
Then, there maybe case where you want to have if else. In NiFi Record path, there is no direct else-if but rather you can use multiple conditional expressions to archive
the same. For example,
LHS: /key[/another='some x']
RHS:'new value 1'
LHS: /key[/another='some y']
RHS: 'new value 2'
Which can be expressed with Telco Network Cloud Manager - Performance syntactic sugar way:
{[/another='some x'] -> 'new value 1', [/another='some y'] -> 'new value 2'}
Note: The surrounding curly braces and comma to separate each.
And in better example with context:
- kpiName: kpi2
metaKpiValue: "{[/another='some x'] -> 'new value 1', [/another='some y'] -> 'new value 2'}"
metaTimestamp: "/timestamp"
metaInterval: 900
unit: count
The condition expression can also be made of multiple conditions. for example, say for the RHS expression to be evaluated against the LHS field, it might need to meet two
conditions.. /anotherOne of value 'x' and /anotherTwo of value 'y'. It can be expressed as [/anotherOne = 'x' && /anotherTwo =
'y']. More than one && can be used. And also can be used in the place of &&.
NiFi record path expression
Use this information to understand the different expressions that are available, what they do, and how they work.
Related information
Apache NiFi RecordPath Guide
NiFi record path expression
Use this information to understand the different expressions that are available, what they do, and how they work.
Expressions can be divided into two groups.
Target expressions, which produce value that can be assigned to target field, such as substringAfter( /name, ' ' ). A target expression can also be used
within a filter but does not return a boolean (true or false value) and therefore cannot itself be an entire filter. For example, you can use a path such as [
substringAfter(/name, ' ') = 'Doe'] but you cannot use [ substringAfter(/name, ' ') ] because doing so doesn’t really make sense, as filters
must be boolean values.
Filter expressions, which are to be used as a filter, such as [ contains(/name,'John')
].
Standalone functions
Function name Description
substring substring(value (expression), start index (int), end index (int)).
The substring function returns a portion of a String value. The function requires 3 arguments; the value to take a portion of, the 0-based start index
(inclusive), and the 0-based end index (exclusive). The start index and end index can be 0 to indicate the first character of a String, a positive integer to
indicate the nth index into the string, or a negative integer. If the value is a negative integer, say -n, then this represents the nth character for the end.
A value of-1 indicates the last character in the String. For example, substring( 'hello world', 0, -1 ) means to take the string hello, and
return characters 0 through the last character, so the return value is hello world.
substringAft
er Expression function substringAfter(value (expression), pattern (literal)). Returns the portion of a String value that occurs after the
first occurrence of some other value.
substringAft
erLast expression function substringAfterLast(value (expression), pattern
(literal)).
Returns the portion of a String value that occurs after the last occurrence of some other value.
substringBef
ore expression function substringBefore(value (expression), pattern (literal)), pattern (literal)).
Returns the portion of a String value that occurs before the first occurrence of some other value.
substringBef
orelLast Expression function substringBeforeLast(value (expression), pattern
(literal)).
Returns the portion of a String value that occurs before the last occurrence of some other value.
replace Expression function replace(value (expression), pattern (literal), replace
(literal)).
Replaces all occurrences of a String with another String.
324 IBM Telco Network Cloud Manager - Performance 1.4.5

Function name Description
replaceRegex Expression function replaceRegex(value (expression), pattern (regex), replace
(literal)).
Evaluates a Regular Expression against the contents of a String value and replaces any match with another value. This function requires 3 arguments;
the String to run the regular expression against, the regular expression to run, and the replacement value. The replacement value may optionally use
back-references, such as $1.
concat Expression function concat(value (expression), ...).
Concatenates all the arguments together.
fieldName Expression function fieldName(value (expression).
Normally, when a path is given to a particular field in a Record, what is returned is the value of that field. It can sometimes be useful, however, to
obtain the name of the field instead of the value. To do this, we can use the fieldName function.
toDate Expression function toDate(value (expression), format (literal), zone
(literal)).
Converts a String to a date.
toString Expression function toString(value (expression), encoding (literal)).
Converts a value to a String, using the given character set if the input type is "bytes"
toBytes Expression function toBytes(value (expression), encoding (literal)).
Converts a String to byte[], using the given character set.
coalesce Expression function coalesce(value (expression), ...).
Returns the first value from the given arguments that is non-null.
format Expression function format(value (expression), format (literal), zone
(literal)).
Converts a Date to a String in the given format with an optional time zone.
trim Expression function trim(value (expression)).
Removes whitespace from the start and end of a string.
toUpperCase Expression function toUpperCase(value (expression)).
Change the entire String to upper case.
toLowerCase Expression function toLowerCase(value (expression)).
Changes the entire string to lower case.
base64Encode Expression function base64Encode(value (expression)).
Converts a String using Base64 encoding, using the UTF-8 character set.
base64Decode Expression function base64Decode(value (expression)).
Decodes a Base64-encoded String.
escapeJson Expression function escapeJson(value (expression)).
JSON Stringifies a Record, Array or simple field (e.g. String), using the UTF-8 character set.
unescapeJson Expression function unescapeJson(value (expression)).
Converts a stringified JSON element to a Record, Array or simple field (e.g. String), using the UTF-8 character set.
hash Expression function hash(value (expression), algorithm (literal)).
Converts a String using a hash algorithm (HA-384, SHA-224, SHA-256, MD2, SHA, SHA-512, MD5).
padLeft Expression function padLeft(value (expression), length (int), pad
(literal)).
Prepends characters to the input String until it reaches the desired length.
padRight Expression function padRight(value (expression), length (int), pad
(literal)).
Appends characters to the input String until it reaches the desired length.
uuid5 Expression function uuid5(value (expression), namespace (expression)). Inserts a UUID v5 into the target field.
zipValue Expression function zipValue(key (expression), value (expression), field (literal),
delimiter (literal)). zip key string and value strings and get value for given field name using given delimiter.
delimitedFie
ld Expression function delimitedField(value (expression), index (literal number),
delimiter(literal)).
Splits value by delimiter if given, otherwise by spaces and get field value at index.
csvLookup Expression function csvLookup(lookupName (literal), key (expression), default
(expression)).
Returns look up value from CSV. Currently, only default value is used and the the actual lookup should be directly implemented in NiFi common
template.
path Expression function (/)
property Expression function (without prefix slash or surrounded qoutes)
identifier Expression function internal
literalStrin
gExpression function (surrounded by quotes)
literalNumbe
rExpression function (value number including decimal and scientific numbers)
Filter functions
Function name Description
equal conditional filter (=)
notEqual Conditional filter (!=)
greater Conditional filter (>)
greaterAndEqu
al Conditional filter (>=)
lesser Conditional filter (<)
lesserAndEqua
lConditional filter (<=)
IBM Telco Network Cloud Manager - Performance 1.4.5 325

Function name Description
contains Conditional filter contains(value (expression), pattern (literal)).
Returns true if a string value contains the provided substring, false otherwise.
matchesRegex Conditional filter matchesRegex(value (expression), pattern (regex)).
Evaluates a Regular Expression against the contents of a string value and returns true if the Regular Expression exactly matches the String value, false
otherwise.
startsWith Conditional filter startsWith(value (expression), pattern (literal)).
Returns true if a string value starts with the provided substring, false otherwise.
endsWith Conditional filter endsWith(value (expression), pattern (literal)).
Returns true if a string value ends with the provided substring, false otherwise.
not Conditional filter not(value (condition)).
Inverts the value of the function or expression that is passed into the not function.
isEmpty Conditional filter isEmpty(value (expression)).
Returns true if the provided value is either null or is an empty string.
isBlank Conditional filter isBlank(value (expression)).
Returns true if the provided value is either null or is an empty string or a string that consists only of white space (spaces, tabs, carriage returns, and
new-line characters).
zipContains Conditional filter zipContains(key (expression), value (expression), field (literal),
delimiter (literal)).
zip key string and value strings and test if it contains given field name using given delimiter.
REST APIs
Use this information to understand some sample Rest API requests and responses by using curl commands directly.
List all pack rules available in the system
curl --request GET \
--url http://<pack_service_host>:30048/v1/Default/storage/pack-rule
\
Output
[
{
"lastUpdated": 1655889686311,
"dataSourceType": "3gppPmXml",
"dataSourceId": "3gppPmXml-json",
"owner": "System",
"versions": 3
},
{
"lastUpdated": 1655886760813,
"dataSourceType": "3gppPmXml",
"dataSourceId": "3gppPmXml-xlsx",
"owner": "System",
"versions": 2
}
]
All the pack rules are version controlled in the Pack Service.
Save new pack rule
curl --request POST \
--url http://<pack_service_host>:30048/v1/Default/storage/pack-rule \
--header 'Content-Type: application/json' \
--data '{
"lastUpdated": 0,
"owner": "System",
"description": "this is test 1",
"state": "draft",
"packRule": {
"dataSourceType": "3gppPmXml",
"dataSourceId": "3gppPmXml-json",
"metaJsonKey": "undefined",
"packs": [ ... ]
}
}'
Output
{
"errors": [],
"warnings": [],
"infos": [
{
"code": 117440515,
"message": "Request completed successfully for /storage/pack-rule (2.4.1.0-50-fac28017-1049)"
},
{
"code": 117440542,
"message": "Pack rule updated (0)"
326 IBM Telco Network Cloud Manager - Performance 1.4.5

}
]
}
Save new pack rule from Excel
curl --request POST \
--url http://<pack_service_host>:30048/v1/Default/storage/pack-rule \
--header 'Content-Type: multipart/form-data; boundary=---011000010111000001101001' \
--form xlsx=@/home/<user>/Downloads/PackServiceRulesv3-3gppPmXml.xlsx
Output
{
"errors": [],
"warnings": [],
"infos": [
{
"code": 117440515,
"message": "Request completed successfully for /storage/pack-rule (2.4.1.0-50-fac28017-1049)"
},
{
"code": 117440542,
"message": "Pack rule updated (0)"
}
]
}
Retrieve the latest pack rule
curl --request GET \
--url http://<pack_service_host>:30048/v1/Default/storage/pack-rule/3gppPmXml/3gppPmXml-xlsx
Output
{
"lastUpdated": 1655886760813,
"owner": "System",
"description": "import from excel"m
"packRule": {
"dataSourceType": "3gppPmXml",
"dataSourceId": "3gppPmXml-xlsx",
"metaJsonKey": "undefined",
"packs": [ ... ]
}
}
Retrieve the N-1 pack rule
curl --request GET \
--url 'http://<pack_service_host>:30048/v1/Default/storage/pack-rule/3gppPmXml/3gppPmXml-xlsx?nBefore=1&owner=System'
Output
{
"lastUpdated": 1655886579527,
"owner": "System",
"description": "import from excel"m
"packRule": {
"dataSourceType": "3gppPmXml",
"dataSourceId": "3gppPmXml-xlsx",
"metaJsonKey": "undefined",
"packs": [ ... ]
}
}
Retrieve pack rule content as Excel
curl --request GET \
--url http://<pack_service_host>:30048/v1/Default/storage/pack-rule/3gppPmXml/3gppPmXml-json \
--header 'Accept: application/vnd.openxmlformats-officedocument.spreadsheetml.sheet'
Patch existing pack rule with additional Resource types
When you create a pack rule with one Resource type and when you want to add another Resource type later, you can patch the existing content with new content. New
content gets appended to the existing content and the version of the pack gets updated. Currently, patch is applicable only if you want to add additional Resource types
alone and not for other artifacts.
Create a pack rule with the following command:
curl --request POST \
--url http://<pack_service_host>:30048/v1/Default/storage/pack-rule \
--header 'Content-Type: application/json' \
--data '{
"lastUpdated": 0,
"owner": "System",
"packRule": {
"dataSourceType": "3gppPmXml",
IBM Telco Network Cloud Manager - Performance 1.4.5 327

"dataSourceId": "3gppPmXml-json",
"metaJsonKey": "undefined",
"packs": [
{
"packId": "00000000-0000-0000-0000-000000000000",
"validPackId": false,
"domain": "Wireless",
"model": {
"metaVendor": "Huawei",
"metaTechnology": "xml",
"metaVersion": "v4",
"metaDevice": "undefined",
"metaRegion": "undefined",
"metaNetwork": "undefined"
},
"resourceTypes": [
{
"resourceFilter": "[/measCollecFile/fileHeader/fileSender/@elementType='eNodeB']",
"resourceType": "ENodeB",
"metaResourceId": "/measCollecFile/measData/measInfo/measValue/@measObjLdn",
"model": {
"relate": {
"parentType": "Region",
"parentLookupProperty": "region"
}
},
"kpis": [
{
"kpiFilter": "[zipContains(/measCollecFile/measData/measInfo/measTypes,
/measCollecFile/measData/measInfo/measValue/measResults, '1593835645')]",
"kpiName": "m1593835645",
"metaKpiValue": "zipValue(/measCollecFile/measData/measInfo/measTypes,
/measCollecFile/measData/measInfo/measValue/measResults, '1593835645')",
"metaTimestamp": "toDate(/measCollecFile/fileHeader/measCollec/@beginTime, 'yyyy-MM-dd\\'T\\'HH:mm:ssX')",
"metaInterval": "replaceRegex(/measCollecFile/measData/measInfo/granPeriod/@duration, '[A-Z]','')",
"unit": "bytes",
"aggregation": "avg"
},
{
"kpiFilter": "[zipContains(/measCollecFile/measData/measInfo/measTypes,
/measCollecFile/measData/measInfo/measValue/measResults, '1593835646')]",
"kpiName": "m1593835646",
"metaKpiValue": "zipValue(/measCollecFile/measData/measInfo/measTypes,
/measCollecFile/measData/measInfo/measValue/measResults, '1593835646')",
"metaTimestamp": "toDate(/measCollecFile/fileHeader/measCollec/@beginTime, 'yyyy-MM-dd\\'T\\'HH:mm:ssX')",
"metaInterval": "replaceRegex(/measCollecFile/measData/measInfo/granPeriod/@duration, '[A-Z]','')",
"unit": "bytes",
"aggregation": "avg"
}
]
}
]
}
]
},
"description": "this is test 1",
"state": "draft"
}'
List the pack rule with the following command:
curl --request GET \
--url http://<pack_service_host>:30048/v1/Default/storage/pack-rule
Output
[
{
"lastUpdated": 1655951895384,
"dataSourceType": "3gppPmXml",
"dataSourceId": "3gppPmXml-json",
"owner": "System",
"versions": 1
}
]
Patch the pack rule with a new Resource type with the following command:
curl --request PATCH \
--url http://<pack_service_host>:30048/v1/Default/storage/pack-rule/3gppPmXml/3gppPmXml-json \
--header 'Content-Type: application/json' \
--data '{
"dataSourceType": "3gppPmXml",
"dataSourceId": "3gppPmXml-json",
"metaJsonKey": "undefined",
"packs": [
{
"packId": "00000000-0000-0000-0000-000000000000",
"validPackId": false,
"domain": "Wireless",
"model": {
"metaVendor": "Huawei",
"metaTechnology": "xml",
"metaVersion": "v1",
"metaDevice": "undefined",
"metaRegion": "undefined",
328 IBM Telco Network Cloud Manager - Performance 1.4.5

"metaNetwork": "undefined"
},
"resourceTypes": [
{
"resourceFilter": "[/measCollecFile/fileHeader/fileSender/@elementType='RNC']",
"resourceType": "RNC",
"metaResourceId": "/measCollecFile/measData/measInfo/measValue/@measObjLdn",
"model": {
"relate": {
"parentType": "Region",
"parentLookupProperty": "region"
}
},
"kpis": [
{
"kpiFilter": "[zipContains(/measCollecFile/measData/measInfo/measTypes,
/measCollecFile/measData/measInfo/measValue/measResults, '1593835645')]",
"kpiName": "m1593835645",
"metaKpiValue": "zipValue(/measCollecFile/measData/measInfo/measTypes,
/measCollecFile/measData/measInfo/measValue/measResults, '1593835645')",
"metaTimestamp": "toDate(/measCollecFile/fileHeader/measCollec/@beginTime, 'yyyy-MM-dd\\'T\\'HH:mm:ssX')",
"metaInterval": "replaceRegex(/measCollecFile/measData/measInfo/granPeriod/@duration, '[A-Z]','')",
"unit": "bytes",
"aggregation": "avg"
},
{
"kpiFilter": "[zipContains(/measCollecFile/measData/measInfo/measTypes,
/measCollecFile/measData/measInfo/measValue/measResults, '1593835646')]",
"kpiName": "m1593835646",
"metaKpiValue": "zipValue(/measCollecFile/measData/measInfo/measTypes,
/measCollecFile/measData/measInfo/measValue/measResults, '1593835646')",
"metaTimestamp": "toDate(/measCollecFile/fileHeader/measCollec/@beginTime, 'yyyy-MM-dd\\'T\\'HH:mm:ssX')",
"metaInterval": "replaceRegex(/measCollecFile/measData/measInfo/granPeriod/@duration, '[A-Z]','')",
"unit": "bytes",
"aggregation": "avg"
}
]
}
]
}
]
}'
List the pack rule with the following command:
curl --request GET \
--url http://<pack_service_host>:30048/v1/Default/storage/pack-rule
Output
[
{
"lastUpdated": 1655951941330,
"dataSourceType": "3gppPmXml",
"dataSourceId": "3gppPmXml-json",
"owner": "System",
"versions": 2
}
]
You can also verify that the new Resource type RNC is added with the following command:
curl --request GET \
--url http://<pack_service_host>:30048/v1/Default/storage/pack-rule/3gppPmXml/3gppPmXml-json
Enrich the pack with Lookup
Lookup is needed for data enrichment that is not directly available from incoming raw data. Raw data comes with certain code that defines lookup against another lookup
table to get the needed data. It can identify region and market for incoming network element. It is based on parent code that needs to be looked up against customer-
provided lookup table to get appropriate region and market for reporting purpose.
Note: The Record path expression csvLookup is validated against this lookup to make sure the correct lookup table and value field are available.
curl --request POST \
--url http://<pack_service_host>:30048/v1/Default/storage/pack-lookup \
--header 'Content-Type: application/json' \
--data '{
"lastUpdated": 0,
"owner": "System",
"description": "inital",
"lookup": {
"dataSourceType": "3gppPmXml",
"dataSourceId": "3gppPmXml-json",
"lookupName": "location",
"valueFields": [
"region",
"market"
],
"records": [
{
"key": "id01",
"values": [
"Johor",
"South"
]
IBM Telco Network Cloud Manager - Performance 1.4.5 329

},
{
"key": "id02",
"values": [
"Kuala Lumpur",
"Central"
]
},
{
"key": "id03",
"values": [
"Penang",
"North"
]
}
]
}
}'
Output
{
"errors": [],
"warnings": [],
"infos": [
{
"code": 117440515,
"message": "Request completed successfully for /storage/pack-lookup (2.4.1.0-129-f426f664-1206)"
},
{
"code": 117440549,
"message": "Pack lookup updated (1658120060064)"
}
]
}
View the Pack rule model APIs in Swagger editor
Follow these steps:
1. Click the following files to view the Pack service APIs in Swagger Editor (https://editor.swagger.io/) that is in built into IBM Documentation:
openapi-pack-recordpath.yaml
openapi-pack-tncp.yaml
Troubleshooting
Use this information to understand some issues you might find in the usage of the Pack Service.
Duplicate keys in lookup
Currently, when you can create a lookup with duplicate keys in the Pack service UI. It will be fixed in the next release to accept only unique keys.
Do not use reserved words in properties and formula definitions
After the installation of a Technology Pack installation is complete, you might notice that the File Collector Service is restarted with a formula-related exception for
the Resource types. See the following exception message:
Caused by: java.lang.IllegalArgumentException: Failed on parsing script to engine huawei-
ims/scscf/scscf.number.of.407.messages.that.do.not.have.subsequent.messages.when.network.redundancy.is.not.implemented.for
.the.originating.cscf.formula
at persistent.npm.collector.file.formula.Loader.tryEngine(BaseEngine.scala:51)
Caused by: javax.script.ScriptException: SyntaxError: <unknown>:1:76 Expected , but found eof
value(KPI.Scscf_Number_of_407_Messages_That_Do_Not_Have_Subsequent_Messages_
^ in nashorn:parser.js at line number 52
at jdk.nashorn.api.scripting.NashornScriptEngine.throwAsScriptException(NashornScriptEngine.java:470)
at jdk.nashorn.api.scripting.NashornScriptEngine.evalImpl(NashornScriptEngine.java:454)
at jdk.nashorn.api.scripting.NashornScriptEngine.evalImpl(NashornScriptEngine.java:406)
To resolve this issue, remove or replace the string when from the formulas. See the following syntax for the formula:
Scscf.Number.of.407.Messages.That.Do.Not.Have.Subsequent.Messages.Whn.Network.Redundancy.Is.Not.Implemented.for.the.Origin
ating.Cscf
Ensure that the following reserved words are avoided in your formula and property definitions:
when
label
Timestamp mismatch
Timestamp is not matching in the raw, Avro, and Metric Viewer data. Make sure you follow the formats that are described in the following link:
https://docs.oracle.com/javase/7/docs/api/java/text/SimpleDateFormat.html
Issue with Never remember history setting in Mozilla Firefox browser
If you set Never remember history option in Firefox settings, and you try to edit a technology pack content from the Pack page. You might not see any content in the
Update Pack rule page.
Wrong version for Telemetry Technology Pack
After the Telemetry Technology Pack is imported successfully to Pack Service UI, you might see the wrong version of the pack is displayed. It must show as 1.0.0.
The same is observed in the pack logs.
330 IBM Telco Network Cloud Manager - Performance 1.4.5

Nonreadable messages in the pack log files
If you try to deploy a pack that has validation errors, you cannot see clear messages in the pack log files. To see these nonreadable messages, click the link in the
State column for the technology pack in the Pack page, and see the build task log messages. Typically, you cannot decipher these messages. Therefore, you must
validate all the individual content from the UI before you commit and deploy the pack.
Record path syntax error
When you try to deploy a Pack rule, you might see some error messages. For example, for the LTE Huawei EUTRAN Technology Pack, you might see these error
messages:
Pack request validation failed due invalid expression for metaProperty in packId=00000000-0000-0000-0000-000000000000,type=eUt
Check Pack Service log file for more details on this error. You might see the following syntax error:
Not able to parse SubstringBefore(substringAfter(replace(replace(/measCollecFile/measData/measInfo/measValue/@measObjLdn,' ','
To resolve this issue, do the following steps:
Go to the Resource type EUtranCell and find the exact field that uses the expression in the Excel that is eNodeBFunctionName under Extra properties
section.
From the Pack Service web UI, go to Pack Section 00000000-0000-0000-0000-000000000000 and Resource type EUtranCellModelExtra Properties.
Edit the Record path expression SubstringBefore to substringBefore and validate the expression.
Issue with importing or deleting large Technology Packs
When you import or delete a Technology Pack Jar file of 13 MB or more, you might notice a connection timeout error, and the action fails.
Issue with importing or deleting large Technology Packs
When you import or delete a Technology Pack Jar file of 13 MB or more, you might notice a connection timeout error, and the action fails.
Symptoms
You can import a Technology Pack content in the following ways:
Click the Import icon that is available on the upper right of the Pack Service UI to import a pack that is not in the table.
Click the More actions ( ) icon and select Import and replace for a Technology Pack content that are in the table. Using this option, you can replace an existing
pack with the one that is imported in JSON or Excel format.
Click the More actions ( ) icon and select Patch for a Technology Pack content that are in the table. Using this option, you can append new content or update the
existing content with the one that is imported in JSON or Excel format.
Click the More actions > Pack content > Import icon to import a new external pack content file and replace an existing file with updated content.
Note: Maximum size of the file can be 200 MB.
Click the More actions > Pack content > Import and replace file to import and replace an existing pack artifact file with an external file.
For example, use this option if you want to replace an existing .discovery file with an external .discovery file.
Note: Maximum size of the file can be 200 MB.
Resolving the problem
To resolve this issue, follow these steps in Firefox browser:
1. Open a new tab in Firefox browser.
2. Type about:config in the address bar and press Enter.
3. Click Accept the Risk and Continue to proceed.
4. In the search bar on the about:config page, type network.http.connection-timeout.
The default value for the setting is 90 seconds.
IBM Telco Network Cloud Manager - Performance 1.4.5 331

5. Click the Edit button and change the setting to 300 and save.
6. Close the tab and restart the browser to apply the changes.
Rapid device onboarding
You can create both SNMP Technology Packs and File-based Technology Packs for Rapid device onboarding to bring new devices into a network environment smoothly
and seamlessly. Accomplishing device onboarding accurately and consistently is critical to any enterprise.
Rapid onboarding for new devices that are introduced in the network can be completed within 1 day. Within this period, the required discovery formulas, collection
formulas, and metrics can be created and deployed for Telco Network Cloud Manager - Performance to start discovery and polling.
Rapid device onboarding solutions
Rapid File device onboarding and Rapid SNMP device onboarding can be achieved with the help of Technology Pack Development Tool that is provided free of cost for
Telco Network Cloud Manager - Performance customers.
You can do the following tasks in this solution:
Create new discovery formulas.
Create new collection formulas.
Create new metrics.
Package the custom Technology Pack content.
Deploy the custom Technology Pack on Telco Network Cloud Manager - Performance system to start discovery and polling.
Components used in Rapid SNMP device onboarding:
Technology Pack Development Environment
Pack Tool
Device Discovery Tool
SNMP Formula Tool
SNMP MIB Tool
SNMP Binding Tool
File Collector Tool
Discovery Helper Tool
Technology Pack Development Tool
Technology Pack Development Tool is a command-line tool to design and develop Technology Pack that can be deployed in Telco Network Cloud Manager -
Performance system. The content can then be used to discover and poll the resources from newly on-boarded devices.
Technology Pack Development Tool
Technology Pack Development Tool is a command-line tool to design and develop Technology Pack that can be deployed in Telco Network Cloud Manager - Performance
system. The content can then be used to discover and poll the resources from newly on-boarded devices.
Prepackaged Technology Pack content
Telco Network Cloud Manager - Performance has the prepackaged Technology Pack content that can be used to discover the resources to collect the device health
metrics.
Devices are discovered and polled by Telco Network Cloud Manager - Performance to collect the device health metrics.
With the help of the Technology Pack Development Tool, you can create the following artifacts that are needed to develop a Technology Pack that can be later deployed in
the Telco Network Cloud Manager - Performance system:
Discovery formulas
Discovery formulas are used to discover and analyze the network. Discovery formulas are used against managed nodes or hosts only and their resource types and
are designed to return a list of resource types, their properties, and other metadata.
332 IBM Telco Network Cloud Manager - Performance 1.4.5

Collection formulas
Collection formulas are used to collect information about the status of various devices in the network during polling. These formulas are applied against a resource
type or managed item in the host to produce a result (numeric) that is saved in the database.
Inventory model files
The model files contain properties, which are the inventory metadata applicable for the resource type and relationships, which are the hierarchical relationships of
the resource types.
All the needed MIB files are bundled and packaged in SNMP Technology Packs.
Batch jobs and streams for analytics in File-based Technology Packs.
NiFi-collector files and folders in File-based Technology Packs.
Metrics
A metric is a single data value, which is identified by the resource and displayed in a report.
Important: Do not use this tool to customize the built-in Technology Pack content that is provided with Telco Network Cloud Manager - Performance.
Overview of the Technology Pack Development Tool tasks
Provides the development environment to run the various command-line tools. The following command-line tools are available:
Pack tool
Common for both SNMP and File-based Technology Packs
Discovery tool
Used in validating the discovery formulas in SNMP Technology Packs. Validates the syntax during the development phase.
Interactive discovery tool
Used in creating the discovery formulas in SNMP Technology Packs.
SNMP binding tool
Used to generate binding for the existing MIB files.
SNMP formula tool
Used in validating the collection formulas in SNMP Technology Packs. Validates the syntax during the development phase.
SNMP MIB tool
Used to view a MIB file source and to validate the content in the MIB files.
File Collector tool
Used in validating the discovery formulas and collection formulas in File-based Technology Packs. Validates the syntax during the development phase.
Controls the versioning.
Process flow for creating a technology pack by using the Technology Pack Development Tool.
Create Technology Pack project
Discovery formulas
MIB files Definition Validate Excecute
Collection formulas
Metrics
MIB files Binding Definition Validate Excecute
Definition Validate
Package the Technology Pack build
Software specifications for Technology Pack Development Tool
Currently, the tool is supported on RHEL 7.x systems.
Requires Open JDK x86_64 V1.8.0.
Python version 2.x or 3.x. It is needed for the interactive discovery formula tool.
Installing the tool
Installation of the Technology Pack Development Tool is simple and fast.
Preparing your environment
Use this information to understand the steps needed to prepare the environment for your Technology Pack development.
Creating an SNMP-based Technology Pack content
Use these steps to create an SNMP-based Technology Pack.
Creating a File-based Technology Pack content
Use these steps to create a File-based Technology Pack.
IBM Telco Network Cloud Manager - Performance 1.4.5 333

Creating the inventory model files
Inventory model files are needed for both SNMP and File-based Technology Packs.
Creating metrics
You can create your own specific device performance metric definitions that you want Telco Network Cloud Manager - Performance to poll and collect.
Validating the pack content
As a best practice, test that the syntax of the formulas and metrics to make sure that they work correctly. Use the validate option in the pack-tool script.
Packaging the Technology Pack bundle
You can generate the JAR file package of the custom Technology Pack with the content that you developed by using the Technology Pack Development Tool.
Deploying the custom Technology Pack
Deploy the custom Technology Pack in Telco Network Cloud Manager - Performance system to use the content to discover and poll the devices and resources. The
collected metrics are stored in the database and can be rendered on Telco Network Cloud Manager - Performance Dashboards.
Command line interface
Use this information to understand the usage of some command-line options that are available in Technology Pack Development Tool.
Troubleshooting Technology Pack Development Tool
You can use this troubleshooting and support information to troubleshoot problems with Technology Pack Development Tool.
Installing the tool
Installation of the Technology Pack Development Tool is simple and fast.
Procedure
1. Download the latest version of the Technology Pack Development Tool.
2. Extract the media to a location of choice with the following command:
cd /<pack_dev_tool>
$ tar zxvf tncp-rdo-sdk-2.4.1.0-120.tar.gz
Where, <pack_dev_tool> is the directory where you extracted the tool media.
You can see the following directories and files:
bin
device-discovery-tool
discovery-helper-tool
file-collector-tool
pack-tool
snmp-binding-tool
snmp-formula-tool
snmp-mib-tool
lib
Contains the library files that are needed for the tool.
Preparing your environment
Use this information to understand the steps needed to prepare the environment for your Technology Pack development.
About this task
Perform the following tasks:
1. Creating a Technology Pack project
A workspace that contains all the Technology Pack content is needed from where you can bundle the content later.
2. Validating the MIB files
This step is needed for SNMP Technology Packs only. Copy and validate the standard and prerequisite MIB files that are required for the Technology Pack content.
Creating a Technology Pack project
Create a workspace directory to keep the Technology Packs project files that are developed.
Validating the MIB files
A MIB file contains object definitions, which are organized to groups. Typically, the object definitions in a MIB file are organized in groups, such as System, Interface,
or TCP. Use the snmp-mib-tool script to view a MIB file source and to validate the content in the MIB files.
Creating a Technology Pack project
Create a workspace directory to keep the Technology Packs project files that are developed.
About this task
Use the pack_tool script to create a workspace for your project.
Procedure
334 IBM Telco Network Cloud Manager - Performance 1.4.5

1. Create a workspace directory for the workspace with the following command:
cd /<pack_dev_tool>
$ mkdir <workspace>
Where, workspace is the project directory.
Note: Make sure that the workspace name has no spaces in it.
2. Optional: You can also create a softlink to the repository that you are using directly.
For example, to convert your Git repository as the workspace directory to develop the packs, follow these commands:
$ cd ~/git/
$ git clone git@<repo_server.ibm.com>:<my_repo>/<my_file>.git
$ cd ~/<pack_dev_tool>
$ ln -s ~/git/<my_pack> <workspace>
A new workspace by name <my_pack> is created that contains the new Technology Pack with the same name as the workspace.
Note: Make sure that the <my_pack> name has no spaces in it.
3. Run the following command:
cd /<pack_dev_tool>
bin/pack-tool new <my_pack>
New project by name <my_pack> is created that contains the new Technology Pack with the same name as the workspace.
What to do next
Verify that the Technology Pack with the name <my_pack> is created as follows:
$ find workspace/<my_pack>
workspace/<my_pack>
workspace/<my_pack>/file
workspace/<my_pack>/file/discoveries
workspace/<my_pack>/file/discoveries/<my_pack>
workspace/<my_pack>/file/formulas
workspace/<my_pack>/file/formulas/<my_pack>
workspace/<my_pack>/nifi-collector
workspace/<my_pack>/nifi-collector/template
workspace/<my_pack>/nifi-collector/config
workspace/<my_pack>/nifi-collector/config/<my_pack>
workspace/<my_pack>/nifi-collector/doc
workspace/<my_pack>/nifi-collector/doc/<my_pack>
workspace/<my_pack>/nifi-collector/script
workspace/<my_pack>/nifi-collector/script/<my_pack>
workspace/<my_pack>/snmp
workspace/<my_pack>/snmp/mibs
workspace/<my_pack>/snmp/formulas
workspace/<my_pack>/discovery
workspace/<my_pack>/inventory
workspace/<my_pack>/inventory/rules
workspace/<my_pack>/inventory/model
workspace/<my_pack>/inventory/model/Property
workspace/<my_pack>/inventory/model/Property/<my_pack>
workspace/<my_pack>/inventory/model/Relationship
workspace/<my_pack>/inventory/model/Relationship/<my_pack>
workspace/<my_pack>/metrics
workspace/<my_pack>/metrics/<my_pack>
workspace/<my_pack>/pack.properties
Note: The pack.properties file contains the technology pack version. The default is 1.0.0.
It consists the subdirectories for both File and SNMP Technology Packs:
snmp/mibs
All the MIB files (for both formula and discovery) go to this directory. Subdirectories are allowed.
snmp/formulas
All SNMP formula files go here.
discovery
All the SNMP discovery files go here. Subdirectories are allowed.
metrics
All the time series metric definitions go to the subdirectory. The metrics/<my_pack> subdirectory is created.
pack.properties
Contains pack information. The default version is 1.0.0.
inventory/model
All .model files for Properties and Relationships go here.
file/discoveries
All discovery files for file-based Technology Pack
file/formulas
All formula files for file-based Technology Pack
IBM Telco Network Cloud Manager - Performance 1.4.5 335

nifi-collector
All files that are related to the NiFi Collector Service.
Related reference
Command line interface
Validating the MIB files
A MIB file contains object definitions, which are organized to groups. Typically, the object definitions in a MIB file are organized in groups, such as System, Interface, or
TCP. Use the snmp-mib-tool script to view a MIB file source and to validate the content in the MIB files.
About this task
The snmp-mib-tool script is available in /<pack_dev_tool>/bin directory. Follow these steps to validate the MIB files that are required to develop your Technology Pack
content.
Procedure
1. Copy all the required standard and prerequisite MIB files to the following directory:
/workspace/<my_pack>/snmp/mibs
2. View the list of MIB files available in your Technology Pack content by using the following command:
bin/snmp-mib-tool <my_pack> list
You can see the list of MIB files that you have copied in step 1.
3. View a specific MIB file source by using the following command:
bin/snmp-mib-tool <my_pack> show <MIB_name>
For example:
bin/snmp-mib-tool <my_pack> show CISCO-MEMORY-POOL-MIB
You can see the content of the CISCO-MEMORY-POOL-MIB file.
4. Generate the binding with all the required MIB files.
For example, create a binding with RFC1213-MIB for a formula that required the MIB as follows:
$ bin/snmp-binding-tool <my_pack> generate RFC1213-MIB
Generating bindings for mib RFC1213-MIB...
Generating bindings for mib RFC1213-MIB complete.
Class files are generated and arranged in separate MIB folders for all the OBJECT_TYPES in the MIB file.
Creating an SNMP-based Technology Pack content
Use these steps to create an SNMP-based Technology Pack.
About this task
1. Create new project with the help of /bin/pack-tool and verify that the pack directories are created.
For more information, see Creating a Technology Pack project.
2. Create and copy the following files to it's respective directory:
Discovery formulas (You can also use the discovery interactive tool)
For more information, see .
Model definitions
For more information, see Creating the inventory model files.
Collection formulas
For more information, see Creating collection formulas.
Metrics definition files
For more information, see Creating metrics .
3. Validate the files syntax for the model and metrics files with the help of /bin/pack-tool.
For more information, see Validating the pack content.
4. Test the discovery formulas against the SNMP-based devices with the help of /bin/device-discovery-tool.
336 IBM Telco Network Cloud Manager - Performance 1.4.5

For more information, see Running the discovery.
Creating discovery formulas
You can create your own discovery formulas for the resources from the SNMP devices to be discovered by Telco Network Cloud Manager - Performance.
Creating collection formulas
You can create your own collection formulas that you want Telco Network Cloud Manager - Performance to poll and collect the specific device performance metrics.
You can create custom collection formulas for any type of device and resources within it.
Creating discovery formulas
You can create your own discovery formulas for the resources from the SNMP devices to be discovered by Telco Network Cloud Manager - Performance.
About this task
You can create discovery formulas for new SNMP devices and their resources based on their resource types. These discovery formulas can be directly discovered.
Procedure
1. Copy all the standard and dependent MIB files that are needed for the discovery formulas that you plan to create.
Arrange the vendor-specific MIB files by creating sub directories as follows:
workspace/<my_pack>/snmp/mibs/
workspace/<my_pack>/snmp/mibs/cisco
workspace/<my_pack>/snmp/mibs/cisco/CISCO-ENHANCED-MEMPOOL-MIB
workspace/<my_pack>/snmp/mibs/cisco/CISCO-ENTITY-SENSOR-MIB
workspace/<my_pack>/snmp/mibs/cisco/CISCO-ENVMON-MIB
workspace/<my_pack>/snmp/mibs/cisco/CISCO-MEMORY-POOL-MIB
workspace/<my_pack>/snmp/mibs/cisco/CISCO-PROCESS-MIB
workspace/<my_pack>/snmp/mibs/cisco/CISCO-QOS-PIB-MIB
workspace/<my_pack>/snmp/mibs/cisco/CISCO-SMI
workspace/<my_pack>/snmp/mibs/cisco/CISCO-TC
workspace/<my_pack>/snmp/mibs/cisco/CISCO-ENTITY-FRU-CONTROL-MIB
workspace/<my_pack>/snmp/mibs/cisco/INET-ADDRESS-MIB
workspace/<my_pack>/snmp/mibs/huawei
workspace/<my_pack>/snmp/mibs/huawei/HUAWEI-ENTITY-EXTENT-MIB
workspace/<my_pack>/snmp/mibs/huawei/HUAWEI-MIB
workspace/<my_pack>/snmp/mibs/ietf
workspace/<my_pack>/snmp/mibs/ietf/IANAifType-MIB
workspace/<my_pack>/snmp/mibs/ietf/IF-MIB
workspace/<my_pack>/snmp/mibs/ietf/SNMPv2-CONF
workspace/<my_pack>/snmp/mibs/ietf/SNMPv2-MIB
workspace/<my_pack>/snmp/mibs/ietf/SNMPv2-SMI
workspace/<my_pack>/snmp/mibs/ietf/SNMPv2-TC
workspace/<my_pack>/snmp/mibs/ietf/BRIDGE-MIB
workspace/<my_pack>/snmp/mibs/ietf/ENTITY-MIB
workspace/<my_pack>/snmp/mibs/ietf/HCNUM-TC
workspace/<my_pack>/snmp/mibs/ietf/HOST-RESOURCES-MIB
workspace/<my_pack>/snmp/mibs/ietf/IANA-ENTITY-MIB
workspace/<my_pack>/snmp/mibs/ietf/P-BRIDGE-MIB
workspace/<my_pack>/snmp/mibs/ietf/SNMP-FRAMEWORK-MIB
workspace/<my_pack>/snmp/mibs/ietf/UUID-TC-MIB
workspace/<my_pack>/snmp/mibs/ietf/RFC1155-SMI
workspace/<my_pack>/snmp/mibs/ietf/RFC1158-MIB
workspace/<my_pack>/snmp/mibs/ietf/RFC-1212
workspace/<my_pack>/snmp/mibs/ietf/RFC1213-MIB
workspace/<my_pack>/snmp/mibs/juniper
workspace/<my_pack>/snmp/mibs/juniper/JUNIPER-MIB
workspace/<my_pack>/snmp/mibs/juniper/JUNIPER-SMI
workspace/<my_pack>/snmp/mibs/juniper/Juniper-MIBs
workspace/<my_pack>/snmp/mibs/juniper/Juniper-System-MIB
workspace/<my_pack>/snmp/mibs/juniper/Juniper-TC
workspace/<my_pack>/snmp/mibs/juniper/Juniper-UNI-SMI
2. Create the discovery formula file as follows:
For example, to create a formula file by name, cisco-memorypool.discovery for a Cisco device:
when resource.type = 'device' and resource.sysobjectid like '1.3.6.1.4.1.9'
select index, ciscomemorypooltype as memoryPoolType, ciscomemorypoolname as memoryPoolName,
ciscomemorypoolvalid as memoryPoolValid from CiscoMemoryPoolMib.ciscoMemoryPoolTable
where ciscomemorypoolvalid = 1
set type = 'memory'
set vendor = 'Cisco'
set id = context.host + '_MemoryPool<' + resource.index + '>'
Note: You can use any objects from MIB-II system table in the when clause and the sysobjectid can be more restrictive to filter a specific device model.
3. Save the file in /workspace/<my_pack>/discovery/<group> folder. Arrange the discovery formulas in separate directories to avoid conflicts.
IBM Telco Network Cloud Manager - Performance 1.4.5 337

Note: All the discovery formulas must have the file extension as .discovery.
4. Create all the formulas to discover devices and their resources.
What to do next
Validate the content to make sure there are no errors in the formulas.
Running the discovery
You can directly run the discovery formulas from the custom Technology Pack by using the device-discovery-tool script.
Writing the discovery formulas with the interactive tool
The discovery-helper-tool script is a wizard-based interactive tool that can be used to write discovery formulas by providing some inputs.
Related concepts
Writing custom discovery formulas
Running the discovery
You can directly run the discovery formulas from the custom Technology Pack by using the device-discovery-tool script.
About this task
device-discovery-tool is available in the /<pack_dev_tool>/bin directory. The script runs all the discovery formulas that are available in the custom Technology Pack that is
created.
The device-discovery-tool is useful in validating the formulas before the custom Technology Pack is deployed in Telco Network Cloud Manager - Performance system.
Procedure
Use the following command to run the discovery formulas from the custom Technology Pack that is created:
$ bin/device-discovery-tool <my_pack> 'snmp://public@<device_IP>:161'
INFO: Discovered device is Resource [kind: device, name: 127.0.0.1,
properties: Set(sysobjectid=1.3.6.1.4.1.2636, name=127.0.0.1, type=device)]
INFO: Found 1 supported definitions
INFO: Topology JSON =
{"resources": [{"type": "chassis", "name":
"127.0.0.1_Chassis:<-1><1><0><0>", "properties":
{"index": "1.1.0.0","jnxcontainersdescription":
"chassis frame","jnxoperatingl3index": "0","jnxcontentsserialno":
"S/N TS4821","jnxoperatingl1index": "1","jnxcontentspartno":
"710-013698","jnxoperatingdescription":"midplane","vendor":
"Juniper","name": "127.0.0.1_Chassis:<-1><1><0><0>",
"jnxoperatingcontentsindex":"1","jnxfilleddescription":
"chassis frame","jnxfilledstate": "3","jnxoperatingl2index": "0",
"type": "chassis","jnxcontentsrevision": "REV 03","jnxcontainerslevel":
"0","jnxcontainersview":"1","jnxcontainersindex": "1",
"jnxfilledcontainerindex": "1","jnxcontentscontainerindex": "1"}}]},
"relations": []}
INFO: Successfuly completed discovery, found 1 resource(s)
Note: You can copy the JSON output into any JSON viewer to see the content more effectively. For example:
{
"resources": [
{
"type": "chassis",
"name": "127.0.0.1_Chassis:<-1><1><0><0>",
"properties": {
"index": "1.1.0.0",
"jnxcontainersdescription": "chassis frame",
"jnxoperatingl3index": "0",
"jnxcontentsserialno": "S/N TS4821",
"jnxoperatingl1index": "1",
"jnxcontentspartno": "710-013698",
"jnxoperatingdescription": "midplane",
"vendor": "Juniper",
"name": "127.0.0.1_Chassis:<-1><1><0><0>",
"jnxoperatingcontentsindex": "1",
"jnxfilleddescription": "chassis frame",
"jnxfilledstate": "3",
"jnxoperatingl2index": "0",
"type": "chassis",
"jnxcontentsrevision": "REV 03",
"jnxcontainerslevel": "0",
"jnxcontainersview": "1",
"jnxcontainersindex": "1",
338 IBM Telco Network Cloud Manager - Performance 1.4.5

"jnxfilledcontainerindex": "1",
"jnxcontentscontainerindex": "1"
}
}
]
}
Related concepts
Network device discovery
Related reference
Command line interface
Writing the discovery formulas with the interactive tool
The discovery-helper-tool script is a wizard-based interactive tool that can be used to write discovery formulas by providing some inputs.
Before you begin
Make sure you have Python version 2.x or 3.x is installed.
About this task
The tool has several steps that are tied back to the discovery formula structure.
Procedure
Run the tool with the following command:
./bin/discovery-helper-tool <my_pack>
The following interactive output is shown:
First step: provide general information
Enter resource type that you want to create : memory
Specify vendor for the resource type:
....
option [<keyword> to search, ENTER for next page]: 9
Second step: Identify primary table
Choose Mib Module where your Mib table to discover property from:
....
option [<keyword> to search, ENTER for next page]: 0
Selected module is CISCO-ENHANCED-MEMPOOL-MIB
Choose Mib table from the module:
....
option : 2
Selected table is cempMemPoolTable
Choose Mib objects from the table (one by one):
....
option [D to done, -<number> to delete, <keyword> to search, ENTER for next page]: cempmempooli
....
option [D to done, -<number> to delete, <keyword> to search, ENTER for next page]: 75
Selected objects are ['cempMemPoolIndex']
....
option [D to done, -<number> to delete, <keyword> to search, ENTER for next page]: 86,91,92
Selected objects are ['cempMemPoolIndex', 'cempMemPoolType', 'cempMemPoolValid', 'cempNotificationConfig']
....
option [D to done, -<number> to delete, <keyword> to search, ENTER for next page]: -92
Selected objects are ['cempMemPoolIndex', 'cempMemPoolType', 'cempMemPoolValid']
....
option [D to done, -<number> to delete, <keyword> to search, ENTER for next page]: 80
Selected objects are ['cempMemPoolIndex', 'cempMemPoolName', 'cempMemPoolType', 'cempMemPoolValid']
....
option [D to done, -<number> to delete, <keyword> to search, ENTER for next page]: d
Specify TNCP propery name for the mib objects (one by one):
Name for index [ENTER for index] :
Name for cempMemPoolIndex [ENTER for cempMemPoolIndex] : memoryPoolIndex
Name for cempMemPoolName [ENTER for cempMemPoolName] : memoryPoolName
Name for cempMemPoolType [ENTER for cempMemPoolType] : memoryPoolType
Name for cempMemPoolValid [ENTER for cempMemPoolValid] : memoryPoolValid
Third step: Identify secondary tables
Do you want to enrich discovery from another mib table [y/n] : n
Output :
when resource.type = 'device' and resource.sysobjectid like '1.3.6.1.4.1.9'
IBM Telco Network Cloud Manager - Performance 1.4.5 339

select index, cempMemPoolIndex AS memoryPoolIndex, cempMemPoolName AS memoryPoolName, cempMemPoolType AS memoryPoolType,
cempMemPoolValid AS memoryPoolValid from CiscoEnhancedMempoolMib.cempMemPoolTable
set type='memory'
set vendor='Cisco'
set id=context.host + '_Cisco_memory:<' + resource.index + '>'
Forth step: Writing discovery to pack
Do you want to save this to a discovery file [y/n] : y
file saved as ~/sdk/workspace/pack-demo/discovery/pack-demo/cisco-memory.discovery
Creating collection formulas
You can create your own collection formulas that you want Telco Network Cloud Manager - Performance to poll and collect the specific device performance metrics. You
can create custom collection formulas for any type of device and resources within it.
Before you begin
1. Copy all the standard and dependent MIB files that are required for the collection formulas that you plan to create and arrange them in vendor-specific directories
to avoid conflicts.
Note: Discovery and polling operations share the MIB files. So, you must copy only those files that are not already available.
2. Generate the binding with all the required MIB files.
For example, create a binding with RFC1213-MIB for a formula that required the MIB as follows:
$ bin/snmp-binding-tool <my_pack> generate RFC1213-MIB
Generating bindings for mib RFC1213-MIB...
Generating bindings for mib RFC1213-MIB complete.
Procedure
1. Create the collection formula file as follows:
For example, to create a formula file by name, interface.inbound.octets.formula.
interface.inbound.octets = value(RFC1213_MIB.ifInOctets) when resource.type == 'interface'
2. Save the file in the following directory based on the type of Technology Pack folder. Arrange the discovery formulas in separate directories to avoid conflicts.
workspace/<my_pack>/snmp/formulas/<group>
workspace/<my_pack>/file/formulas/<group>
Note:
All the collection formulas must have the file extension as .formula. If the file has more than one formula in it, save it as .formulas.
As a best practice, create a formula file for a single metric. Make sure that the formula or the expression is written in one statement. A formula with multiple
statements is not supported.
3. Create all the required formulas to poll the devices and their resources.
What to do next
Validate the content to make sure there are no errors in the formulas.
Running the collection formulas
You can directly run the custom collection formulas from the custom Technology Pack by using the snmp-formula-tool script.
Running the file collection formulas
You can directly run the discovery files with the help of available inventory model files that are available in the custom Technology Pack by using the file-
collector-tool script.
Related concepts
SNMP formula language
Related information
enable disable formulas
Running the collection formulas
You can directly run the custom collection formulas from the custom Technology Pack by using the snmp-formula-tool script.
340 IBM Telco Network Cloud Manager - Performance 1.4.5

About this task
snmp-formula-tool is available in the /<pack_dev_tool>/bin directory. The script runs all the collection formulas that are available in the custom Technology Pack that is
created.
The snmp-formula-tool is useful in validating and running the formulas before the custom Technology Pack is deployed in Telco Network Cloud Manager - Performance
system.
Procedure
1. Use the following command to list all the collection formulas in the custom Technology Pack that is created:
$ bin/snmp-formula-tool <my_pack> list
Formulas
- interface.inbound.octets(ifInOctets: RFC1213_MIB.ifInOctets)
2. Use the following command to run the collection formulas from the custom Technology Pack that is created:
$ bin/snmp-formula-tool <my_pack> execute 1/interface/vendor=cisco RFC1213_MIB.ifInOctets=1000,2000,3500,5500
Executing with interface resource 1[vendor=cisco,agent=1:3030]...
1:3030/1.3.6.1.2.1.2.2.1.10.0[300000]
Calculated 1000.0 at timestamp 1535606392689 for interface.inbound.octets.
Calculated 2000.0 at timestamp 1535606452690 for interface.inbound.octets.
Calculated 3500.0 at timestamp 1535606512690 for interface.inbound.octets.
Calculated 5500.0 at timestamp 1535606572690 for interface.inbound.octets.
Execution complete in 1 seconds.
For example:
If multiple properties are available in a formula, specify as:
1/interface/vendor=cisco,name='1.1.1.1_If<1>'
If multiple OIDs are available in a formula, specify as:
CISCO_MEMORY_POOL_MIB.ciscoMemoryPoolFree=10,50
CISCO_MEMORY_POOL_MIB.ciscoMemoryPoolLargestFree=20,40
Creating a File-based Technology Pack content
Use these steps to create a File-based Technology Pack.
About this task
1. Create a new project with the help of /bin/pack-tool and verify that the pack directories are created.
For more information, see Creating a Technology Pack project.
2. Create and copy the following files to its respective directory:
Discovery formulas
For more information, see Creating discovery formulas for a file-based technology pack.
Model definitions
For more information, see Creating the inventory model files.
Collection formulas
For more information, see Creating collection formulas.
Metrics definition files
For more information, see Creating metrics.
NiFi Collector content
Manually, create the Apache NiFi related files that include the NiFi flow templates, lookup files, and script files as needed.
3. Validate the files syntax for the model and metrics files with the help of /bin/pack-tool.
For more information, see Validating the pack content.
4. Test the discovery formulas against the file-based devices with the help of /bin/file-collector-tool.
For more information, see Running the discovery.
5. Test collection formula expression with a simulated value with the help of /bin/file-collector-tool.
For more information, see .
Creating discovery formulas for a file-based technology pack
You can create your own discovery formulas for the resources from the file-based devices to be discovered by Telco Network Cloud Manager - Performance.
Creating collection formulas
You can create your own collection formulas that you want Telco Network Cloud Manager - Performance to poll and collect the specific device performance metrics.
You can create custom collection formulas for any type of device and resources within it.
IBM Telco Network Cloud Manager - Performance 1.4.5 341

Creating discovery formulas for a file-based technology pack
You can create your own discovery formulas for the resources from the file-based devices to be discovered by Telco Network Cloud Manager - Performance.
About this task
You can create discovery formulas for new file-based devices and their resources based on their resource types. These discovery formulas can be directly discovered.
Procedure
1. Create the discovery formula files as follows:
For example, create the discovery formula files as follows for a Huawei device:
network.discovery
engine file
when type is 'bsc' then resource.vendor == 'Huawei' and resource.technology == 'GSM' and resource.version ==
'v900r021c10spc600'
select * from local.bsc
set id = new RegExp('.+').test(resource.networkId) ? new RegExp('.+').exec(resource.networkId):'undefined'
set type = 'network'
set networkType = 'GSM'
set displayName = new RegExp('.+').test(resource.networkId) ? new RegExp('.+').exec(resource.networkId):'undefined'
unset regionId
unset parentId
bsBbuBoard.discovery
engine file
when resource.type like 'bsBbuBoard' and resource.vendor == 'Huawei' and resource.technology == 'GSM' and
resource.version == 'v900r021c10spc600'
select * from local.bsBbuBoard
set parentId = new RegExp('(.+?)\/').test(resource.id) ? new RegExp('(.+?)\/').exec(resource.id)[1]:null
set displayName = resource.id
set boardType = new RegExp('.+\/(.+)\/.+\/.+\/.+').test(resource.id) ? new
RegExp('.+\/(.+)\/.+\/.+\/.+').exec(resource.id)[1]:null
set cabinetNo = new RegExp('.+\/.+\/(.+)\/.+\/.+').test(resource.id) ? new
RegExp('.+\/.+\/(.+)\/.+\/.+').exec(resource.id)[1]:null
set subrackNo = new RegExp('.+\/.+\/.+\/(.+)\/.+').test(resource.id) ? new
RegExp('.+\/.+\/.+\/(.+)\/.+').exec(resource.id)[1]:null
set slotNo = new RegExp('.+\/.+\/.+\/.+\/(.+)').test(resource.id) ? new
RegExp('.+\/.+\/.+\/.+\/(.+)').exec(resource.id)[1]:null
unset bscId
2. Save the file in /workspace/<my_pack>/discovery/<group> folder. Arrange the discovery formulas in separate directories to avoid conflicts.
Note: All the discovery formulas must have the file extension as .discovery.
3. Create all the formulas to discover devices and their resource types.
What to do next
Validate the content to make sure there are no errors in the formulas.
Running the discovery for file-based Technology Packs
You can directly run the discovery formulas from the custom Technology Pack by using the file-collector-tool script.
Running the discovery for file-based Technology Packs
You can directly run the discovery formulas from the custom Technology Pack by using the file-collector-tool script.
About this task
file-collector-tool is available in the /<pack_dev_tool>/bin directory. The script runs all the discovery formulas that are available in the custom Technology Pack that is
created.
The file-collector-tool is useful in validating the formulas before the custom Technology Pack is deployed in Telco Network Cloud Manager - Performance system.
Procedure
Use the following command to run the discovery formulas from the custom Technology Pack that is created:
$ bin/file-collector-tool <my_pack> inventory --recordFile
Note: You can copy the JSON output into any JSON viewer to see the content more effectively. For example,
342 IBM Telco Network Cloud Manager - Performance 1.4.5

Related concepts
Network device discovery
Related reference
Command line interface
Creating collection formulas
You can create your own collection formulas that you want Telco Network Cloud Manager - Performance to poll and collect the specific device performance metrics. You
can create custom collection formulas for any type of device and resources within it.
Before you begin
1. Copy all the standard and dependent MIB files that are required for the collection formulas that you plan to create and arrange them in vendor-specific directories
to avoid conflicts.
Note: Discovery and polling operations share the MIB files. So, you must copy only those files that are not already available.
2. Generate the binding with all the required MIB files.
For example, create a binding with RFC1213-MIB for a formula that required the MIB as follows:
$ bin/snmp-binding-tool <my_pack> generate RFC1213-MIB
Generating bindings for mib RFC1213-MIB...
Generating bindings for mib RFC1213-MIB complete.
Procedure
1. Create the collection formula file as follows:
For example, to create a formula file by name, interface.inbound.octets.formula.
interface.inbound.octets = value(RFC1213_MIB.ifInOctets) when resource.type == 'interface'
2. Save the file in the following directory based on the type of Technology Pack folder. Arrange the discovery formulas in separate directories to avoid conflicts.
workspace/<my_pack>/snmp/formulas/<group>
workspace/<my_pack>/file/formulas/<group>
Note:
All the collection formulas must have the file extension as .formula. If the file has more than one formula in it, save it as .formulas.
As a best practice, create a formula file for a single metric. Make sure that the formula or the expression is written in one statement. A formula with multiple
statements is not supported.
3. Create all the required formulas to poll the devices and their resources.
What to do next
Validate the content to make sure there are no errors in the formulas.
Running the collection formulas
You can directly run the custom collection formulas from the custom Technology Pack by using the snmp-formula-tool script.
Running the file collection formulas
You can directly run the discovery files with the help of available inventory model files that are available in the custom Technology Pack by using the file-
collector-tool script.
Related concepts
SNMP formula language
Related information
enable disable formulas
Running the file collection formulas
You can directly run the discovery files with the help of available inventory model files that are available in the custom Technology Pack by using the file-collector-
tool script.
IBM Telco Network Cloud Manager - Performance 1.4.5 343

About this task
The file-collector-tool is available in the /<pack_dev_tool>/bin directory. The script runs all the collection formulas that are available in the custom Technology
Pack that is created. The tool is useful in validating the formulas before the custom Technology Pack is deployed on the Telco Network Cloud Manager - Performance
system.
The file-collector-tool is useful in validating and running the formulas before the custom Technology Pack is deployed in Telco Network Cloud Manager -
Performance system.
Procedure
Use the following command to run the collection formulas from the custom Technology Pack that is created:
$ bin/file-collector-tool <my_pack> formula --recordFile=data/<output.psv>
--------------------------------
File Collector Tool v2.2.0.0-99-394be417
--------------------------------
Found record file: data/<output.psv>
WRN: configured to use dummy db
INF: file collector db loaded (1)
INF: discovery engine is ready
INF: query time for 1 are 0.0055 secs
INF: formula engine is ready
INF: timeseries write initiated for 1 records
Result: 1566543900000 bond.Machine.Network.Interface.Bytes.Received 123.0 {resource=1, resourcetype=bond}
You can see the result of the execution.
Creating the inventory model files
Inventory model files are needed for both SNMP and File-based Technology Packs.
About this task
The following two types of model files are needed:
The property model files
List of properties and its data type for each resource type. These files are placed in /<my_pack>/inventory/model/Property folder.
The relationship model files
List of model files that specify the relationship between resource types. These files are placed in /<my_pack>/inventory/model/Relationship folder.
Procedure
1. Follow these steps to create the property model (.model) files:
type cbqosMatch extends snmpPollable{
property index String{
required = true
}
property vendor String
property matchStmtName Stirng
property classPolicyName String
property className String
property classActionType String
property classDirection Integer
property classMatchInterface String
property displayName String
property shortDisplayName String
}
2. Follow these steps to create the relationship model (.model) files:
relationship contain device ->> cbqosMatch
Creating metrics
You can create your own specific device performance metric definitions that you want Telco Network Cloud Manager - Performance to poll and collect.
344 IBM Telco Network Cloud Manager - Performance 1.4.5

Procedure
1. Create the metric file as follows:
For example, to create a metric file by name, icmp-out-dest-unreached.metric:
name=icmp.out.dest.unreached
description="The number of ICMP destination unreachable message sent
aliases=[]
properties={
resource.type=device
}
2. Save the file in /<my_project>/<my_pack>/metrics/<group> folder.
Arrange the metric formulas in vendor-specific directories to avoid conflicts.
Note: All the metrics must have the file extension as .metric.
What to do next
Validate the content to make sure there are no error in the formulas.
Validating the pack content
As a best practice, test that the syntax of the formulas and metrics to make sure that they work correctly. Use the validate option in the pack-tool script.
About this task
You can perform this step intermittently during the Technology Pack development or at the end before packaging.
Procedure
Run the following command:
Validating the discovery formulas:
bin/pack-tool validate <my_pack>
Validating <my_pack> pack...
Validating inventory models...
Validating discovery...
- Validating cisco-memorypool.discovery...
Validating metrics...
Validating snmp formulas...
Validating <my_pack> pack complete.
Validating the collection formulas:
$ bin/pack-tool validate <my_pack>
Validating <my_pack> pack...
Validating inventory models...
Validating discovery...
- Validating cisco-memorypool.discovery...
Validating metrics...
Validating snmp formulas...
- Validating interface.inbound.octets.formula...
Validating <my_pack> pack complete.
Validating the metrics:
$ bin/pack-tool validate <my_pack>
Validating <my_pack> pack...
Validating inventory models...
Validating discovery...
- Validating cisco-memorypool.discovery...
Validating metrics...
- Validating icmp-out-dest-unreached.metric...
IBM Telco Network Cloud Manager - Performance 1.4.5 345

- Validating snmp formulas...
- Validating interface.inbound.octets.formula...
Validating <my_pack> pack complete.
Note: The validation error is due to missing double quotation marks in the metric definition. You can fix the errors during validation and rerun.
Packaging the Technology Pack bundle
You can generate the JAR file package of the custom Technology Pack with the content that you developed by using the Technology Pack Development Tool.
About this task
Use the build option in pack-tool script to package the Technology Pack that can be deployed on the Telco Network Cloud Manager - Performance system.
Procedure
Run the build command as follows.
$ bin/pack-tool build <my_pack>
Building pack <my_pack> [version 1.0.0]...
- Adding file snmp/mibs/cisco/CISCO-ENHANCED-MEMPOOL-MIB...
- Adding file snmp/mibs/cisco/CISCO-ENTITY-SENSOR-MIB...
- Adding file snmp/mibs/cisco/CISCO-ENVMON-MIB...
- Adding file snmp/mibs/cisco/CISCO-MEMORY-POOL-MIB...
- Adding file snmp/mibs/cisco/CISCO-PROCESS-MIB...
- Adding file snmp/mibs/cisco/CISCO-QOS-PIB-MIB...
- Adding file snmp/mibs/cisco/CISCO-SMI...
- Adding file snmp/mibs/cisco/CISCO-TC...
- Adding file snmp/mibs/cisco/CISCO-ENTITY-FRU-CONTROL-MIB...
- Adding file snmp/mibs/cisco/INET-ADDRESS-MIB...
- Adding file snmp/mibs/huawei/HUAWEI-ENTITY-EXTENT-MIB...
- Adding file snmp/mibs/huawei/HUAWEI-MIB...
- Adding file snmp/mibs/ietf/IANAifType-MIB...
- Adding file snmp/mibs/ietf/IF-MIB...
- Adding file snmp/mibs/ietf/SNMPv2-CONF...
- Adding file snmp/mibs/ietf/SNMPv2-MIB...
- Adding file snmp/mibs/ietf/SNMPv2-SMI...
- Adding file snmp/mibs/ietf/SNMPv2-TC...
- Adding file snmp/mibs/ietf/BRIDGE-MIB...
- Adding file snmp/mibs/ietf/ENTITY-MIB...
- Adding file snmp/mibs/ietf/HCNUM-TC...
- Adding file snmp/mibs/ietf/HOST-RESOURCES-MIB...
- Adding file snmp/mibs/ietf/IANA-ENTITY-MIB...
- Adding file snmp/mibs/ietf/P-BRIDGE-MIB...
- Adding file snmp/mibs/ietf/SNMP-FRAMEWORK-MIB...
- Adding file snmp/mibs/ietf/UUID-TC-MIB...
- Adding file snmp/mibs/ietf/RFC1155-SMI...
- Adding file snmp/mibs/ietf/RFC1158-MIB...
- Adding file snmp/mibs/ietf/RFC-1212...
- Adding file snmp/mibs/ietf/RFC1213-MIB...
- Adding file snmp/mibs/juniper/JUNIPER-MIB...
- Adding file snmp/mibs/juniper/JUNIPER-SMI...
- Adding file snmp/mibs/juniper/Juniper-MIBs...
- Adding file snmp/mibs/juniper/Juniper-System-MIB...
- Adding file snmp/mibs/juniper/Juniper-TC...
- Adding file snmp/mibs/juniper/Juniper-UNI-SMI...
- Adding file snmp/formulas/rfc1213/interface.inbound.octets.formula...
- Adding file discovery/cisco/cisco-memorypool.discovery...
- Adding file pack.properties...
Building pack <my_pack> complete.
--------------------------
Pack Tool v2.2.0.0-99-394be417
--------------------------
Building pack <my-pack> [version 1.0.0]...
Checking pack type
File pack type. Will delete snmp types directory
- Adding file pack.properties...
- Adding file inventory/model/Relationship/Device-bond.model...
- Adding file inventory/model/Property/bond.model...
- Adding file file/formulas/test/bond.Machine.Network.Interface.Bytes.Received.formula...
- Adding file file/discoveries/test/Device-bond.discovery...
- Adding file file/discoveries/test/bond.discovery...
Building pack test complete.
All the custom content that is available in the <my_pack> directory is bundled. The <my_pack>-1.0.0.jar file is available in the following directory:
346 IBM Telco Network Cloud Manager - Performance 1.4.5

$ cd <pack_dev_tool>
$ find build/
build/
build/<my_pack>
Deploying the custom Technology Pack
Deploy the custom Technology Pack in Telco Network Cloud Manager - Performance system to use the content to discover and poll the devices and resources. The
collected metrics are stored in the database and can be rendered on Telco Network Cloud Manager - Performance Dashboards.
About this task
After the Technology Pack is bundled with the custom content, you can deploy and run discovery and polling from Telco Network Cloud Manager - Performance
Dashboards as usual.
Procedure
1. Copy the custom Technology Pack bundle to Telco Network Cloud Manager - Performance system to a location of your choice.
For example, <DIST_DIR>.
2. Install the custom Technology pack..
The <my_pack>-1.0.0.jar file that is available in your <DIST_DIR> is extracted and the content is distributed to different directories.
Command line interface
Use this information to understand the usage of some command-line options that are available in Technology Pack Development Tool.
pack_tool
pack-tool command can be run as root user. The script is available in /<pack_dev_tool>/bin directory. Where, <pack_dev_tool> is the directory where Technology Pack
Development Tool is extracted.
Usage
Run the following command as root user:
$ bin/pack-tool
--------------------------
Pack Development Tool v1.0
--------------------------
Usage: pack-tool [command] [options]
commands:
new <pack> - creates a new pack project
build [<pack>] - builds the specified pack project
clean [<pack>] - cleans the specified pack project
validate [<pack>] - validates the specified pack project
deploy [<pack>] - deploy the specific pack project
help - displays help
Parameters
new
Creates a project workspace to contain the Technology Packs that are developed.
build
Builds and packages the Technology Pack after the development is completed.
clean
Cleans the specified Technology Pack project. If a project name is not specified, it cleans all projects.
validate
Validates that content with in the Technology Packs after the development is complete.
deploy
help
Provides the usage of the pack-tool command.
device-discovery-tool
The device-discovery-tool command is used to run the discovery formulas that are created for your custom Technology Pack. The script is available in
/<pack_dev_tool>/bin directory. Where, <pack_dev_tool> is the directory where Technology Pack Development Tool is extracted.
IBM Telco Network Cloud Manager - Performance 1.4.5 347

Usage
Run the following command as root user:
$ bin/device-discovery-tool
--------------------------------
Discovery Device Tool v0.4.0.2
--------------------------------
discovery-device-tool [pack] snmp://[credential]@[host]:[port]?[options]
credential:
version 1/2c - [read community string]:[write community string]
version 3 - [user name]:[authentication]:[encryption]:[context]
authentication:
md5(password) - MD5 password
sha1(password) - SHA1 password
none - No authentication
encryption:
des(password) - DES key
aes(password) - AES key
aes128(password) - AES 128-bit key
aes192(password) - AES 192-bit key
aes256(password) - AES 256-bit key
none - No encryption
options:
version - SNMP Version (2,3). Default is auto-detect
timeout - SNMP timeout in milisecond. Default is 5 seconds
retries - Number of retries before giving up. Default is 3 times
Parameters
pack
Name of the Technology Pack.
credential
Credentials for two the SNMP versions:
version 1/2c - [read community string]:[write community string]
read community string: name of the SNMP read community.
write community string: name of the SNMP write community.
version 3 - [user name]:[authentication]:[encryption]:[context]
user name: the username to be used for this SNMP V3 community name.
authentication: the password to be used for authentication (MD5 or SHA1) for this SNMP V3 element.
encryption: the type of encryption for the privacy password. The following types of encryption are available:
3-DES
AES 128
AES 192
AES 256
context: the context name to be used for this SNMP V3 community name.
Host
Hostname of the device associated with this SNMP configuration.
port
The port associated with this SNMP configuration. By default, it is 161.
options
Provide the additional information as follows:
version - the SNMP Version (2 or 3) associated with this SNMP configuration.
timeout - the length of time (in seconds) to wait for a response from a request. Default is 5 seconds.
retries - the number of times that a request is tried again if a request failure. Default is three times
file-collector-tool
Troubleshooting Technology Pack Development Tool
You can use this troubleshooting and support information to troubleshoot problems with Technology Pack Development Tool.
For troubleshooting the usage of Technology Pack Development Tool for creating custom technology packs, see the related information.
FAQs
FAQs
What to do when an index is not available from a MIB Table?
Symptoms
In MIB files, some table indexes might not be part of table entry sequence. You can’t query the indexes as individual entry since these indexes aren’t recognized as
a column. To extract an individual index to create a property, or to use it as a common column to perform join, regular expression can be explored to further address
348 IBM Telco Network Cloud Manager - Performance 1.4.5

this issue.
In this scenario, where the indexes of a MIB Table aren’t present as key, the Rapid device onboarding tool generates the following error message when you’re trying
to create a discovery formula:
column xxx not found
For example, in the bsnAPIfChannelInterferenceInfoTable of AIRESPACE-WIRELESS-MIB, the tool returns these three indexes bsnAPDot3MacAddress,
bsnAPIfSlotId, and bsnAPIfInterferenceChannelNo as a combination of three different fields. You can’t break each field into specific property except for
bsnAPIfInterferenceChannelNo as this field is the only index that is recognized as key in the MIB file. See the following image from the MIB Browser:
The AIRESPACE-WIRELESS-MIB.bsnAPIfChannelInterferenceInfoTable index values are 136.117.86.59.62.96.1.3. This value is combination of three different
fields:
MAC address: 136.117.86.59.62.96
Slot ID: 1
Channel: 3
Resolving the problem
To resolve this issue, use H2 regex function as follows: MAC address:
MAC address:
regexp_replace(bsnAPIfChannelInterferenceInfoTable.index, '[.][0-9]+[.][0-9]+$', '') as macAddress
Slot ID
regexp_replace(bsnAPIfChannelInterferenceInfoTable.index, '^.*[.]([0-9]+)[.][0-9]+$', '$1') as slotId
Channel
regexp_replace(bsnAPIfChannelInterferenceInfoTable.index, '^.*[.][0-9]+[.]([0-9]+)$', '$1') as channel
For example, a complete discovery formula definition can be written as follows:
when resource.type = 'device' and resource.sysobjectid like '1.3.6.1.4.1.9'
select
bsnAPIfChannelInterferenceInfoTable.index,
bsnapifinterferencechannelno as channelno,
bsnAPTable.index,
bsnapname as apName,
bsnApIpAddress as ipAddress,
bsnapdot3macaddress as resolvedMacAddress,
regexp_replace(bsnAPIfChannelInterferenceInfoTable.index, '[.][0-9]+[.][0-9]+$', '') as macAddress,
regexp_replace(bsnAPIfChannelInterferenceInfoTable.index, '^.*[.]([0-9]+)[.][0-9]+$', '$1') as slotId,
regexp_replace(bsnAPIfChannelInterferenceInfoTable.index, '^.*[.][0-9]+[.]([0-9]+)$', '$1') as channel
from AirespaceWirelessMib.bsnAPTable inner join AirespaceWirelessMib.bsnAPIfChannelInterferenceInfoTable
on bsnAPTable.index = regexp_replace(bsnAPIfChannelInterferenceInfoTable.index, '[.][0-9]+[.][0-9]+$', '')
where bsnapifinterferencepower IS NOT NULL
set type = 'channel'
set vendor = 'Cisco'
set name = context.host + '_ChannelNo<' + resource.macAddress + '.' + resource.slotId + '.' + resource.channel + '>'
Misleading messages in validating the collection formulas
When you are validating the collection formulas with the snmp-formula-tool, you might notice that the execution is completed without a result for the calculation. For
example, see the following formula and its validation:
bin/snmp-formula-tool pack-demo execute 10.55.239.57_Enhanced_Memory_Pool:2.1
/memory/vendor=Huawei 'CISCO_ENHANCED_MEMPOOL_MIB.cempMemPoolUsed=20,30,40'
'CISCO_ENHANCED_MEMPOOL_MIB.cempMemPoolFree=50,60,70'
--------------------------
Snmp Formula Tool v2.2.0.0-99-394be417
--------------------------
Executing with memory resource
10.55.239.57_Enhanced_Memory_Pool:2.1[vendor=Huawei,tenant=base,id=10.55.239.57_Enhanced_Memory_Pool:2.1,type=memory,agent=10.5
5.239.57_Enhanced_Memory_Pool:2.1:3030]...
Execution complete in 5 seconds.
IBM Telco Network Cloud Manager - Performance 1.4.5 349

The result can mislead as the snmp-formula-tool did not provide the correct reasons for not displaying the calculation.
In this example, the collection formulas have invalid properties that do not belong to the specified vendor. Other possible causes include but not limited to missing
.formula file or incorrect .formula extension in the /snmp/formulas directory.
Integrating
You can set up Telco Network Cloud Manager - Performance with other IBM products. Use this information for necessary configuration tasks required to set up the
available integrations.
About this task
Currently, Telco Network Cloud Manager - Performance is integrated with Watson™ AIOps Metric Manager component of Watson AIOps on OpenShift® Container Platform
environment.
Telco Network Cloud Manager - Performance is integrated with IBM® Operations Analytics - Predictive Insights, on on-prem version of IBM Netcool® Operations Insight®
on Kubernetes environment.
Integrating with Watson AIOps Metric Manager
When you integrate Telco Network Cloud Manager - Performance with IBM Operations Analytics - Predictive Insights, the IBM Operations Analytics - Predictive
Insights analyzes the metric data that is collected by Telco Network Cloud Manager - Performance and generates alarms when it identifies anomalies in the data.
Related information
Watson AIOps component overview
Integrating with Watson AIOps Metric Manager
When you integrate Telco Network Cloud Manager - Performance with IBM® Operations Analytics - Predictive Insights, the IBM Operations Analytics - Predictive Insights
analyzes the metric data that is collected by Telco Network Cloud Manager - Performance and generates alarms when it identifies anomalies in the data.
About this task
Note: The terms IBM Operations Analytics - Predictive Insights and Watson™ AIOps Metric Manager are used interchangeably on the documentation and they mean the
same.
IBM Operations Analytics - Predictive Insights is real-time performance analysis software for business services. By analyzing data from various sources and integrating
with existing monitoring products, IBM Operations Analytics - Predictive Insights learns the normal behavior of a business service and creates a performance model.
When IBM Operations Analytics - Predictive Insights detects or forecasts anomalous behavior, an alarm is generated.
Telco Network Cloud Manager - Performance component integrates with the IBM Operations Analytics - Predictive Insights Managed Mediation tool. The IBM Operations
Analytics - Predictive Insights Managed Mediation tool is used to configure the data presentation to IBM Operations Analytics - Predictive Insights. The Mediation tool can
be installed on Windows or Linux® systems.
IBM Operations Analytics - Predictive Insights integration flow
Integration of Telco Network Cloud Manager - Performance V1.4.5 component with IBM IBM Operations Analytics - Predictive Insights V1.3.6.
Summary of integration tasks
Describes the tasks that are needed for integrating Telco Network Cloud Manager - Performance with Watson AIOps Metric Manager.
Prerequisites
Ensure that you fulfill the prerequisites for integrating Telco Network Cloud Manager - Performance with IBM Operations Analytics - Predictive Insights.
Setting up integration with Watson AIOps Metric Manager
Follow these instructions to integrate with Watson AIOps Metric Manager to see anomalies from baseline thresholds.
Setting up external Kafka broker
Set up Kafka broker on any server of your choice.
Configuring integration with external Kafka and Predictive Insights
Due to Kafka version incompatibility between Telco Network Cloud Manager - Performance and IBM Operations Analytics - Predictive Insights, performance data
from Telco Network Cloud Manager - Performance timeseries database is sent to an external Kafka broker. IBM Operations Analytics - Predictive Insights is then
configured to consume the data in supported JSON format from external Kafka topic.
Troubleshooting
Some troubleshooting tasks in Integrating with Operations Analytics Predictive Insights are described here.
Supported output formats
IBM Operations Analytics - Predictive Insights integration flow
Integration of Telco Network Cloud Manager - Performance V1.4.5 component with IBM® IBM Operations Analytics - Predictive Insights V1.3.6.
IBM Operations Analytics - Predictive Insights integration
Timeseries Service writes the timeseries data to a Kafka topic to enable the IBM Operations Analytics - Predictive Insights to monitor the performance metrics that are
collected by Telco Network Cloud Manager - Performance.
Due to Kafka version incompatibility between Telco Network Cloud Manager - Performance and IBM Operations Analytics - Predictive Insights, performance data from
Telco Network Cloud Manager - Performance timeseries database is sent to an external Kafka broker. IBM Operations Analytics - Predictive Insights is then configured to
350 IBM Telco Network Cloud Manager - Performance 1.4.5

consume the data in supported JSON format from external Kafka topic.
The IBM Operations Analytics - Predictive Insights integration solution works as follows:
Telco Network Cloud Manager - Performance Threshold service is started.
The Threshold service gets a list of baseline enabled thresholds metrics.
An entry is created for each baseline enabled threshold metric in the Threshold Definitions configuration page with the following naming convention: "Default
baseline threshold for <metric_name>".
The baseline enabled thresholds metrics are sent to a Kafka topic to export the timeseries data.
The timeseries data is enriched with resource metadata to determine the device and resource type to make the data compatible for Predictive Insights.
After the enrichment process, the Threshold Service consumes the timeseries records from the Kafka. It writes the response to the Kafka topic on external Kafka
broker in a format that is compatible for Predictive Insights. Typically, it is in JSON file format.
Summary of integration tasks
Describes the tasks that are needed for integrating Telco Network Cloud Manager - Performance with Watson™ AIOps Metric Manager.
About this task
Use this information as a quick reference for integrating Telco Network Cloud Manager - Performance with IBM® Operations Analytics - Predictive Insights.
Procedure
1. Set up IBM Operations Analytics - Predictive Insights.
IBM Operations Analytics - Predictive Insights Mediation tool is configured and ready to start consuming and analyzing the data. For more information, see
Quick reference to Watson AIOps Metric Manager installation
Quick reference to Watson AIOps Metric Manager configuration
2. Set up the external Kafka broker on any server of your choice.
See, Setting up external Kafka broker.
3. Configure external Kafka broker.
See, Setting up integration with Watson AIOps Metric Manager.
4. On the IBM Operations Analytics - Predictive Insights server, configure the required settings in mediation_spark_datestamp/config/config.properties file.
For more information, see Configuring integration with external Kafka and Predictive Insights.
5. View the anomalies in Tivoli® Netcool®/OMNIbus Event Viewer.
Prerequisites
Ensure that you fulfill the prerequisites for integrating Telco Network Cloud Manager - Performance with IBM® Operations Analytics - Predictive Insights.
The most up-to-date information about supported hardware, software, browsers, and operating systems are provided by the IBM Software Product Compatibility Reports
website.
Software requirements and dependencies
Ensure that you have all of the required software before you start the integration.
Quick reference to Watson AIOps Metric Manager installation
Use this information as a quick reference if you are new to Watson™ AIOps Metric Manager.
Quick reference to Watson AIOps Metric Manager configuration
Perform these basic steps to configure IBM Operations Analytics - Predictive Insights after the installation is complete. You can then use the system.
Related information
Hardware and software requirements for IBM Operations Analytics - Predictive Insights
System requirements for Telco Network Cloud Manager - Performance
Software requirements and dependencies
Ensure that you have all of the required software before you start the integration.
Ensure that the following software is installed and running.
Watson AIOps Metric Manager V1.3.6
See the following resources:
IBM Operations Analytics Predictive Insights Managed Version 1.3.6 Release Notes
Planning your installation for Watson™ AIOps Metric Manager
Installing Watson AIOps Metric Manager
IBM Telco Network Cloud Manager - Performance 1.4.5 351

Note: If you installed and configured IBM® Operations Analytics - Predictive Insights as standard, anomalies that are generated by IBM Operations Analytics - Predictive
Insights are displayed in the OMNIbus Event Viewer.
IBM Telco Network Cloud Manager - Performance, version 1.4.5
See the following resources:
Telco Network Cloud Manager - Performance Release Summary
System Requirements
Installing and configuring IBM Telco Network Cloud Manager - Performance
Kafka versions
Kafka versions that are supported by IBM Operations Analytics - Predictive Insights are 0.11.0.2 and 0.11.0.3.
The Kafka version that is supported by Telco Network Cloud Manager - Performance is 0.11.0.3.
Related information
Apache Kafka
Quick reference to Watson AIOps Metric Manager installation
Use this information as a quick reference if you are new to Watson™ AIOps Metric Manager.
The following table lists the high-level steps for installing IBM® Operations Analytics - Predictive Insights.
Table 1. Quick reference for installing IBM Operations Analytics - Predictive Insights
Action Description
Read about deployment considerations and system requirements for IBM Operations Analytics - Predictive Insights. Deployment
scenarios
Before you install IBM Operations Analytics - Predictive Insights, you must complete extra tasks, depending on your environment. Planning
for
installatio
n
Preparing
to install
Install the prerequisites, associated products, and components of IBM Operations Analytics - Predictive Insights in the order that they are presented
here.
Installing the
prerequisite
software
Installing IBM Operations Analytics - Predictive Insights.
You can install all IBM Operations Analytics - Predictive Insights components on a single server. This section contains the steps that are required to
perform a single-server installation. The installation of IBM Operations Analytics - Predictive Insights components can be performed only on the
server on which you are running the IBM Installation Manager. Remote installation of Operations Analytics Predictive Insights Managed components
is not supported, you must install each component on its host server.
Installing
Operations
Analytics
Predictive
Insights
Managed
After you install IBM Operations Analytics - Predictive Insights, you need to perform some postinstallation tasks. Post-installation
- System status
You must uninstall the products and components in the order that is specified. Uninstalling
Operations
Analytics
Predictive
Insights
Managed
To troubleshoot any installation issues, you can refer to the installation logs. Installation log
files
You need to install the mediation tool. Installing the
Mediation tool on
Windows
Related information
IBM Operations Analytics Predictive Insights Managed V 1.3.6 documentation on IBM Documentation
Quick reference to Watson™ AIOps Metric Manager configuration
Perform these basic steps to configure IBM® Operations Analytics - Predictive Insights after the installation is complete. You can then use the system.
Action Description
352 IBM Telco Network Cloud Manager - Performance 1.4.5

Action Description
The full sets of required post-installation configuration tasks are described in this section. Initial configuration of Operations Analytics
Predictive Insights Managed
Mediation is the process of defining which data Operations Analytics Predictive Insights Managed analyzes. Configuring mediation
You need to perform steps to configure additional security when Operations Analytics Predictive Insights Managed is
deployed with Dashboard Application Services Hub.
Configuring security
Use the procedures outlined in this section to administrate Operations Analytics Predictive Insights Managed. Administering
To view alarms in the OMNIbus Event Viewer or Active Event List (AEL). Viewing alarms in the Active Event List
Setting up integration with Watson AIOps Metric Manager
Follow these instructions to integrate with Watson™ AIOps Metric Manager to see anomalies from baseline thresholds.
Before you begin
Make sure that the following items are available:
Kafka broker is installed. See, Software requirements and dependencies.
Kafka topic is created. This Kafka topic is to be used for integrating with IBM® Operations Analytics - Predictive Insights.
About this task
You must do this configuration if you want to export the performance metrics that are enabled for baseline thresholds from the timeseries database to a Kafka topic. The
format of the Kafka topic contents must be compatible for IBM Operations Analytics - Predictive Insights to consumer and raise the anomalies.
Procedure
1. Log in to Network Performance Insight for Service Providers master node as root user.
https://<master_node_IP>:<Dashboard_externalPort>
2.
Select tncp from Namespace pane.
3.
Select tncp from Projects pane.
4.
Expand Workloads > Config Maps > common in the Config and Storage pane in the navigation pane.
5. Expand Workloads > Config Maps > common.
6. Edit the common Config Map. Follow these steps:
"PI_KAFKA_BROKERS": "<Kafka_hostname>:<Kafka_port_number>"
"PI_KAFKA_TOPIC": "<Kafka_topic_name_for_pi>"
"pi.kafka.message.size": "10"
"pi.tenant.id": "TNCP"
Where,
Table 1. Setting in settings.properties file
Option Description Example
PI_KAFKA_BROKER
S
The IP address of the Kafka broker, which is to be integrated with IBM Operations Analytics - Predictive Insights. 127.127.127.127:90
92
PI_KAFKA_TOPIC The Kafka topic name for IBM Operations Analytics - Predictive Insights to consume the data from.
If topic is not created, the Threshold Service creates the topic in the external Kafka automatically.
pi_metrics_tncp
pi.kafka.message.si
ze
It is an optional configuration. It is to set a limit on the total number of metrics data per Kafka message. By default,
it is 100.
10
pi.tenant.id
It is an optional configuration. By default, it is TNCP if it is not configured. TNCP
The contents of the common Config Map file.
"PI_KAFKA_BROKERS": "127.127.127.127:9092"
"PI_KAFKA_TOPIC": "tncp"
"pi.kafka.message.size": "10"
"pi.tenant.id": "TNCP"
7. Edit the common Config Map file directly from your cloud platform dashboard.
8. Restart all instances of the Threshold Service in your cluster.
Related information
Managing thresholds
Controlling the Telco Network Cloud Manager - Performance services
IBM Telco Network Cloud Manager - Performance 1.4.5 353

Setting up external Kafka broker
Set up Kafka broker on any server of your choice.
About this task
Follow these steps to create a Kafka topic that is to be used for integrating with IBM® Operations Analytics - Predictive Insights.
Procedure
1. Download and extract Kafka V2.8.x from here:
https://archive.apache.org/dist/kafka/2.8.1/kafka_2.13-2.8.1.tgz
2. Start the ZooKeeper server by using the following command:
bin/zookeeper-server-start.sh config/zookeeper.properties
3. Start the Kafka server by using the following command:
bin/kafka-server-start.sh config/server.properties
4. List the available Kafka topics that are created by using the following command:
Note: Run this command after the topic is created.
For example,
bin/kafka-topics.sh --list --zookeeper localhost:2181
pi_metrics_tncp
5. See the output messages that are written to the Kafka topic by using the following command:
Note: Run this command after the topic is created.
bin/kafka-console-consumer.sh --bootstrap-server localhost:9092 --topic pi_metrics_tncp
Related information
Kafka Quickstart
Configuring integration with external Kafka and Predictive Insights
Due to Kafka version incompatibility between Telco Network Cloud Manager - Performance and IBM® Operations Analytics - Predictive Insights, performance data from
Telco Network Cloud Manager - Performance timeseries database is sent to an external Kafka broker. IBM Operations Analytics - Predictive Insights is then configured to
consume the data in supported JSON format from external Kafka topic.
Before you begin
The data in the Kafka topic must conform to the following requirements:
The data must be in Predictive Insights compatible format. For more information, see JSON file for REST Mediation service.
Specify a tenant identifier with each message. The tenant identifier is used later to map to a topic name in Predictive Insights. For more information, see Configuring
integration with Kafka.
About this task
Integrate Predictive Insights and external Kafka that contains the metric data available from Telco Network Cloud Manager - Performance timeseries database. The data
that is available in the Kafka topic depends on the configuration on the Threshold Service.
Procedure
On Predictive Insights server, configure the following settings in mediation_spark_datestamp/config/config.properties:
kafka.metadata.broker.list=myserver1.ibm.com:9092
kafka.zookeeper.connect=myserver1.ibm.com:2181
kafka.metric.topic.name=pi_metrics_tncp
For more information, see Configuring integration with Kafka on IBM Documentation.
Encrypting passwords
For security reasons, encrypt all the passwords that are used in system configurations and for user management.
Encrypting passwords
354 IBM Telco Network Cloud Manager - Performance 1.4.5

For security reasons, encrypt all the passwords that are used in system configurations and for user management.
About this task
An administrator can encrypt the passwords by using the npm-encrypt.sh script that is available in /opt/IBM/basecamp/basecamp-tools/bin directory.
Procedure
Run the npm-encrypt.sh script as follows:
cd /opt/IBM/basecamp/basecamp-tools/bin
./npm-encrypt.sh <password>
You can get the encrypted password that can be copied and used in configuration settings as required.
Troubleshooting
Some troubleshooting tasks in Integrating with Operations Analytics Predictive Insights are described here.
Log files in Threshold Service
Log files can be used to examine processing results and problems.
You can check the Kafka logs for any issues.
The Kafka log files are located in /tmp/kafka-logs directory. Threshold Service log files are located in /opt/basecamp/threshold/logs.
Supported output formats
The Threshold Service supports the returning time series data in the following format.
JSON
Standard JSON format
JSON sample for standard metric data.
{
"groups": [
{
"tenantID": "TNCP",
"timestamp": 1662536700000,
"resourceID": "e7da672b-27e7-41b7-8bf0-3875de231e77-noi-analytics-batch-0-basecamp-analytics-batch",
"metrics": {
"kubernetesContainer_CPUUsageCoreNanoseconds_nanoseconds": 858724519430
},
"attributes": {
"node": "e7da672b-27e7-41b7-8bf0-3875de231e77-noi-analytics-batch-0",
"group": "kubernetesContainer",
"group_name": "kubernetesContainer"
}
},
{
"tenantID": "TNCP",
"timestamp": 1662536701000,
"resourceID": "e7da672b-27e7-41b7-8bf0-3875de231e77-noi-analytics-batch-0-basecamp-analytics-batch",
"metrics": {
"kubernetesContainer_restartsTotal_number": 0
},
"attributes": {
"node": "e7da672b-27e7-41b7-8bf0-3875de231e77-noi-analytics-batch-0",
"group": "kubernetesContainer",
"group_name": "kubernetesContainer"
}
}
]
}
IBM Operations Analytics - Predictive Insights compatible format
The IBM® Operations Analytics - Predictive Insights compatible sample to send metric data to IBM Operations Analytics - Predictive Insights.
Use this JSON format file to load data into IBM Operations Analytics - Predictive Insights for use with the REST Mediation service.
{
"groups": [
{
"tenantID": "TNCP",
"timestamp": 1543861808339,
"resourceID": "Agent235.ibm.com-0",
IBM Telco Network Cloud Manager - Performance 1.4.5 355

"metrics": {
"Network_Inbound_Errors_Count": 0,
"Network_Inbound_Broadcast_pps": 0,
"Network_Outbound_Errors_Count": 0,
"Network_Inbound_Discards_Count": 246624,
"Network_Inbound_Packets_Count": 0,
"Network_Inbound_Utilization_Percent": 0,
"Network_Outbound_Utilization_Percent": 7.999120096789353e-8,
"Network_Inbound_Non-Unicast_pps": 0
},
"attributes": {
"node": "Agent235.ibm.com",
"group": "interface",
"group_name": "interface"
}
},
{
"tenantID": "NPI",
"timestamp": 1543861802927,
"resourceID": "Agent219.ibm.com-Mu1",
"metrics": {
"Network_Inbound_Unicast_pps": 215.01959450759514,
"Network_Unknown_Protocols_Dropped_Count": 44180
},
"attributes": {
"node": "Agent219.ibm.com",
"group": "interface",
"group_name": "interface"
}
}]}
Monitoring networks
In today’s telecom networks, the rate at which data is generated is increasing at an alarming rate, which is driven by an information-based economy. The volume of data to
be consumed and analyzed is increased significantly, underlining the importance of effective visualizations for an easier analysis and resolution of network issues.
Telco Network Cloud Manager - Performance Dashboards is a network monitoring tool.
You can view the network performance data from Telco Network Cloud Manager - Performance Dashboards. The Telco Network Cloud Manager - Performance Dashboards
and its drill-down dashboards help you to monitor the comprehensive network performance metrics from a single pane of glass.
Telco Network Cloud Manager - Performance Dashboards
After the system is configured according to your requirements, Telco Network Cloud Manager - Performance can start collecting, aggregating, and storing the
network performance data. The data is rendered on various ready-to-use dashboards that it offers.
Telco Network Cloud Manager - Performance Dashboards
After the system is configured according to your requirements, Telco Network Cloud Manager - Performance can start collecting, aggregating, and storing the network
performance data. The data is rendered on various ready-to-use dashboards that it offers.
The following types of metrics are stored in Telco Network Cloud Manager - Performance database:
Raw metrics
UDC metrics
Analytic metrics
See, Data storage in time series database.
For more information about dashboard properties, see Dashboard reference.
Getting started with Telco Network Cloud Manager - Performance Dashboards
This information provides instructions and general information on how to use the Telco Network Cloud Manager - Performance Dashboards that render network
performance data from Telco Network Cloud Manager - Performance.
Interface traffic monitoring
This interactive dashboard covers the entire device and traffic data representation.
Cloud monitoring dashboards
Predefined dashboards, which display metrics and general information to get end-to-end observability of the Kubernetes cloud infrastructure. You can get complete
visibility into the health, availability, and performance of your K8 cloud clusters and there by meet SLAs.
TNC-P monitoring dashboards
Predefined dashboards that are used to monitor the health of IBM® Telco Network Cloud Manager - Performance, which is a cloud native application that can be
deployed on both OpenShift® Container Platform and Kubernetes platforms.
ICMP Ping dashboards
Ping is a network utility that is used to test if a host is reachable over a network or over the Internet by using the Internet Control Message Protocol (ICMP). When
you initiate an ICMP, the request is sent from a source to a destination host. If the destination host successfully receives the ICMP request, it replies to the source
host with an ICMP reply message along with the round-trip time.
Performance alarm overview
Use Performance alarm overview dashboard to monitor the performance alarms that are raised by Telco Network Cloud Manager - Performance.
Metric viewer dashboard
Metric viewer dashboard displays the collected performance metrics that are stored in the Telco Network Cloud Manager - Performance database. You can monitor
the new device types and vendors that are on boarded into your network immediately.
Mobile Access and Core dashboards
Use the Mobile Access and Core dashboards to monitor the health and utilization of the mobile networks, based on the metrics and trends monitoring.
356 IBM Telco Network Cloud Manager - Performance 1.4.5

IP links performance overview
The fundamental usage of IP links performance overview dashboard is for the network administrator to reduce the mean time that is taken to identify an event in a
network, its effects on the network and its root cause to efficiently manage the network performance.
GPON Optical Line Terminal (OLT) dashboards
GPON gives the user the ability to consolidate multiple services onto a single fiber transport network. This technology reduces costs and infrastructure and
maintains the increased bandwidth.
Load balancer dashboards
The Load Balancer dashboards monitor network load balancing with F5 BIG IP technology. The Load Balancer dashboards provide an insight into the distribution of
network traffic across server resources in multiple geographies. These servers can be on premises or hosted on cloud. These dashboards provide visualizations on
the performance and availability of your global applications.
WiFi overview dashboard
WiFi overview dashboards are instrumental for enterprises in monitoring the health and performance of the WiFi network. This dashboard represents key
performance indicators (KPI), in the form of widgets, of a WiFi network to monitor the network. You can navigate further from these widgets to analyze specific
diagnostics.
Netflow dashboards
Network flow monitoring is often used to resolve network performance issues and ensure Quality of Service (QoS) for key applications and services.
SD-WAN dashboards
Software-defined Wide Area Network (SD-WAN) dashboards in Telco Network Cloud Manager - Performance support applications that are hosted in on-premises
data centers, public or private clouds, and SaaS services. Currently, only Cisco devices are supported. These dashboards work together with Cisco SD-WAN
controllers and provide seamless visibility into the network.
Viewing specific threshold violations from Event Viewer
Using the launch-in-context feature, you can access the Metric Threshold Violation dashboard from IBM Tivoli® Netcool®/OMNIbus Event Viewer. The Metric
Threshold Violation dashboard determines the root cause of a metric threshold violation and to resolve the problem.
Getting started with Telco Network Cloud Manager - Performance Dashboards
This information provides instructions and general information on how to use the Telco Network Cloud Manager - Performance Dashboards that render network
performance data from Telco Network Cloud Manager - Performance.
The Telco Network Cloud Manager - Performance Dashboards report the network performance data that is gathered and stored by the Telco Network Cloud Manager -
Performance and its components. You can derive the following information from the dashboards:
Summary level views of the network and see how your network resources are performing.
Detailed views from the listener and drill-down widgets. You can switch between different metric views to analyze and monitor your network.
For more information about Publishing Telco Network Cloud Manager - Performance Dashboards menus, see Optional: Publishing Telco Network Cloud Manager -
Performance Dashboards menus.
Dashboards and technology pack dependencies
Use this information to understand the technology pack dependencies for Telco Network Cloud Manager - Performance Dashboards.
Logging in to the reporting interface
Access the components in reporting interface.
Accessing the Telco Network Cloud Manager - Performance Dashboards
Access the dashboards from Telco Network Cloud Manager - Performance Dashboards page.
Generic functions of Telco Network Cloud Manager - Performance Dashboards
Use this information to understand the generic interactivity and filtering functions that are available on Telco Network Cloud Manager - Performance Dashboards.
Dashboards and technology pack dependencies
Use this information to understand the technology pack dependencies for Telco Network Cloud Manager - Performance Dashboards.
The following table summarizes the Telco Network Cloud Manager - Performance Dashboards and technology pack dependencies.
Menu Sub menu Dashboard Technology pack
Network Metric viewer
Performance alarm overview
network-health-1.20.5.jar
Note: Some of the content for the Metric viewer dashboard also comes from the
Dashboard Service.
Mobile Access Circuit switch access network-health-1.20.5.jar
network-wireless-1.4.0.jar
gsm-huawei-bss-v900r021c10spc600-1.6.0.jar
umts-huawei-utran-v100r015c10spc156-1.5.0.jar
Packet switch access network-health-1.20.5.jar
network-wireless-1.4.0.jar
gsm-huawei-bss-v900r021c10spc600-1.6.0.jar
umts-huawei-utran-v100r015c10spc156-1.5.0.jar
lte-huawei-eutran-v100r015c10-1.6.0.jar
nr-huawei-nutran-v100r015c10-1.5.0.jar
Core Circuit switch core network-health-1.20.5.jar
network-wireless-1.4.0.jar
umts-huawei-mscs-v200r011c10-1.5.0.jar
IBM Telco Network Cloud Manager - Performance 1.4.5 357

Menu Sub menu Dashboard Technology pack
Transport IP IP links performance overview network-probe-cisco-1.6.0.jar
network-probe-huawei-1.8.0.jar
network-probe-juniper-1.9.1.jar
Transport Optical GPON OLT overview neutral-access-gom-1.8.0.jar
network-access-huawei-1.5.0.jar
network-access-nokia-1.4.0.jar
Infra Load balancer Load balancer overview
GTM details
LTM details
Pool details
Pool member details
Virtual server details
load-balancer-f5BigIp-1.7.0.jar
Device Interface traffic monitoring network-health-1.20.5.jar
WiFi WiFi overview wifi-health-cisco-1.7.0.jar
Ping Device overview
Device ping details
Ping overview
network-health-1.20.5.jar
network-health-extension-1.7.1.jar
NetFlow Applications Top applications
Top applications with ToS
network-flow-1.3.0.jar
Conversations Top conversations
Top conversations with application
Top conversations with ToS
Destinations Top destinations
Top destinations with applications
IP address
grouping
Top IP group conversations with
protocol
Top source IP groups with ToS
Top destination IP groups with
protocol
Top destination IP groups
Top destination IP groups with ToS
Top IP group conversations with ToS
Top IP group conversations
Top IP groups with application
Top source IP groups with
application
Top IP group conversations with
application
Top source IP groups with protocol
Protocols Top protocols with conversation
Top protocols with destination
Top protocols with application
Top protocols
Top protocols with source
Sources Top sources
Top sources with application
ToS Top ToS
Autonomous
systems
Top source autonomous systems
Top autonomous system
conversations
Top destination autonomous
systems
QoS Queue QoS Queue drops
Applications response overview
Network traffic overview
TNC-P
monitoring
Platform TNC-P overview
TNC-P Node details
TNC-P Pod details
TNC-P PersistentVolumeClaim
details
cloud-kubernetes-1.8.0.jar
Cloud Kubernetes Cluster summary
Node summary
Pod summary
Container summary
cloud-kubernetes-1.8.0.jar
358 IBM Telco Network Cloud Manager - Performance 1.4.5

Menu Sub menu Dashboard Technology pack
SD-WAN SD-WAN health overview
Tunnel QoE
Application performance
Device health
cisco-sdwan-1.4.0.jar
network-health-1.20.5.jar
sdwan-gom-1.5.0.jar
Note: Network Health (Extension) v1.7.1 is the dependent Technology Pack for all the wireline SNMP packs and also the Network Flow pack.
Note: The network-health-vendor and network-probe-vendor are vendor-specific technology packs.
Note: For a complete list of the bundled Technology Packs in Telco Network Cloud Manager - Performance, see Installing Technology Packs.
For more information about the metrics and other properties of each dashboard, see Dashboard reference.
Logging in to the reporting interface
Access the components in reporting interface.
About this task
Depending upon the deployment of your organization, you can access the reporting interface from:
Dashboard Application Services Hub portal.
Access the dashboards from Dashboard Application Services Hub portal, where Telco Network Cloud Manager - Performance Dashboards are federated on.
Telco Network Cloud Manager - Performance Engine.
Access from Telco Network Cloud Manager - Performance Engine interface directly in dedicated Telco Network Cloud Manager - Performance stand-alone
installation.
Note: The default username and password to log in to Dashboard Application Services Hub to access Telco Network Cloud Manager - Performance Dashboards is
npiadmin/npiadmin. If you are accessing the Telco Network Cloud Manager - Performance Dashboards directly, use npiadmin/npiadmin.
Procedure
Access the reporting interface from Dashboard Application Services Hub portal in an integrated installation scenario as follows:
1. Open a web browser and enter the following URL for the Jazz™ for Service Management UI and reporting server:
https://host.domain:port/DASH_context_root
For example, https://<myserver.ibm.com>:16311/ibm/console
Where,
host.domain is the fully qualified hostname or IP address of the Jazz for Service Management UI and reporting server.
When single sign-on (SSO) is enabled, ensure that you use the fully qualified hostname in the URL of the Jazz for Service Management reporting and
UI server. SSO requires that the browser pass LTPA cookies to the Jazz for Service Management application server, and these cookies contain the fully
qualified hostname.
port is the secure HTTP port number that was specified during installation. The default value is 16311.
/DASH_context_root is the context root for the console that was specified during installation. The default value is /ibm/console.
2. Enter the user ID and password in the Dashboard Application Services Hub login page and click Log in.
For example, npiadmin/npiadmin.
The Dashboard Application Services Hub Welcome page opens.
3. Click Console Integration icon ( ) on the navigation bar and select NPI > Performance > Dashboards.
The Telco Network Cloud Manager - Performance Dashboards Welcome page loads with menu bar to go to different Telco Network Cloud Manager -
Performance Dashboards, administration pages, and reporting interfaces.
Access from Telco Network Cloud Manager - Performance Engine interface directly in dedicated stand-alone installation.
Access the Telco Network Cloud Manager - Performance Dashboards by using its route from the OpenShift® Container Platform web console.
Provide the following credentials to log in to the dashboards:
npiadmin/npiadmin
The Telco Network Cloud Manager - Performance Dashboards Welcome page loads with menu bar to go to different Telco Network Cloud Manager - Performance
Dashboards, Administration pages, and the reporting interface with Report scheduling and Designer tool options.
Accessing the Telco Network Cloud Manager - Performance Dashboards
Access the dashboards from Telco Network Cloud Manager - Performance Dashboards page.
About this task
The welcome page appears as follows:
IBM Telco Network Cloud Manager - Performance 1.4.5 359

(Click image to view in a new window.)
Procedure
Select the dashboard of your choice under the following tabs.
Click Network to see the following dashboard:
Performance alarm overview
Metric viewer
Click Infra > Device to see the following dashboard:
Interface traffic monitoring
Click Infra > Load balancer to see the following dashboards:
GTM details
LTM details
Pool member details
Pool details
Virtual server details
Load balancer overview
Click Infra > Ping to see the following dashboards:
Ping overview
Device overview
Device ping details
Click Infra > WiFi to see the following dashboards:
WiFi overview
Click Mobile > Access to see the following dashboard:
Circuit switch access
Packet switch access
Click Mobile > Core to see the following dashboard:
Circuit switch core
Click Netflow to see all the NetFlow built-in Top N resource views and Network Traffic Overview, Applications Response Overview dashboards.
You can see the following dashboards:
Dashboard group Available views
Applications Top applications
Top applications with ToS
Conversations Top conversations
Top conversations with application
Top conversations with ToS
Destinations Top destinations with application
Top destinations
IP address grouping Top IP group conversations with protocol
Top source IP groups with ToS
Top destination IP groups with protocol
Top destination IP groups
Top destination IP groups with ToS
Top source IP groups
Top IP group conversations with ToS
Top IP group conversations
Top IP groups with application
Top source IP groups with application
Top IP group conversations with application
Top source IP groups with protocol
360 IBM Telco Network Cloud Manager - Performance 1.4.5

Dashboard group Available views
Protocols Top protocols with conversation
Top protocols with destination
Top protocols with application
Top protocols
Top protocols with source
Sources Top sources
Top sources with application
ToS Top ToS
Autonomous systems Top source autonomous systems
Top autonomous system conversations
Top destination autonomous systems
QoS Queue QoS Queue drops
Applications response overview Applications response overview: Top 10 dashboard that contains various widgets.
Applications response time
Network traffic overview Network traffic overview: Top 10 Traffic dashboard that contains various widgets.
Click Transport > IP to see the following dashboard:
IP links performance overview
Click Transport > Optical to see the following dashboard:
GPON OLT overview
Click TNC-P monitoring > Platform. You can see the following dashboards:
TNC-P overview
TNC-P Node details
TNC-P Pod details
TNC-P PersistentVolumeClaim details
Click Cloud > Kubernetes. You can see the following dashboards:
Cluster summary
Node summary
Pod summary
Container summary
Click SD-WAN to see the following dashboards:
SD-WAN health overview
Tunnel QoE
Application performance
Device health
Click Reporting > Report scheduling to see the interface to generate automated reports at scheduled intervals and send them anyone in your organization.
Click Reporting > Designer tool to see the interface to create new dashboards and its artifacts with the help of the Dashboard Designer tool.
Click Administration and access the system configuration pages.
For more information about the system configuration pages, see Accessing system configuration pages.
Generic functions of Telco Network Cloud Manager - Performance Dashboards
Use this information to understand the generic interactivity and filtering functions that are available on Telco Network Cloud Manager - Performance Dashboards.
Procedure
Generic interactivity that is applicable for all Telco Network Cloud Manager - Performance Dashboards:
1. Click Auto Refresh ( ) icon to enable or disable auto refresh.
Note: By default, the data is auto refreshed every 1 minute.
If auto refresh option is enabled, the dashboard metrics are refreshed with latest values.
2. Click More Options ( ) icon to perform the following tasks:
Note: Make sure that the email settings are configured.
Email Dashboard URL ( )
Note: For this option, to send the report to multiple recipients, use comma or semi colons to separate the email IDs.
Email Dashboard URL to link or embed ( )
Note: For this option, to send the report to multiple recipients, use comma or semi colons to separate the email IDs.
Email Dashboard PDF ( )
Note: For this option, sending the report PDF to multiple recipients is not supported.
3. Click Email Dashboard URL ( ) icon to email the dashboard link with Telco Network Cloud Manager - Performance valid users.
Complete the following steps to email the URL:
a. In the Email Dashboard URL file window that is displayed, enter the following details:
i. Subject
ii. Email To
Ensure that the email address is valid and in correct format.
iii. Message
b. Click Send
IBM Telco Network Cloud Manager - Performance 1.4.5 361

4. Click Email Dashboard URL to link or embed ( ) icon to email the dashboard URL to link or embed.
Complete the following steps to email the URL.
a. In the Email Dashboard URL to link or embed file window that is displayed, enter the following details:
i. Choose either one of the options from Generate a link list.
To launch the Dashboard from an external application
To embed the Dashboard in an external application
ii. Subject
iii. Email To
Ensure that the email address is valid and in correct format.
iv. Message
b. Click Send
5. Click Email Dashboard PDF ( ) icon to email the dashboard view as a PDF.
Complete the following steps to email a PDF:
a. In the Email Dashboard PDF file window that is displayed, enter the following details:
i. Subject
ii. Email To
Ensure that the email address is valid and in correct format.
iii. Content
b. Click Send
6. Click Save As ( ) icon and select PDF, CSV, or XLS to save and export the dashboard to the selected file format.
Note: In a PDF file format, the complete data is populated in the next page on a tabular format. You need to click the grid to view the complete data.
Generic interactivity that is applicable for Telco Network Cloud Manager - Performance Dashboards widgets:
The interactivity options differ based on the different types of Telco Network Cloud Manager - Performance Dashboards.
1. To maximize the widget display, click .
2. To minimize the widget display, click .
3. To hide the widget, click .
4. To display the widget, click .
5. To change to a different chart type, click and select a different chart type from the widget.
The widget renders according to the selected chart type.
6. The following icon on a widget indicates that it is a drill-down chart. Click one of the elements from the chart widget.
For example, in a bar chart, click one of the bars to further drill down to one hierarchy level down which correspond to the bar that you selected.
Note: For widgets that are shown in the dashboards that have a controller-listener interaction, click any of the values to change the listener widget that
displays the related data for the selected value.
Generic interactivity that is applicable for Grid widget.
1. Click the column header from any grid widgets to sort in ascending or descending order.
You can sort the data in numerical or alphabetical, depending on what type of data is populated in the grid widget.
2. Widget-level filters are available for the Grid chart type.
Filter details:
a. Click the icon that is available next to the column name.
A window that has a list, a field for entering filter inputs, and two buttons Apply Filter and Clear Filter appear.
b. From the first list field, select any one of the values:
Equals: If you want to include any column value in the filter results, select this value.
Not Equal: If you want to exclude any column value in the filter results, select this value.
Starts With: If you want to filter the column values that start with a particular letter, select this value.
Ends With: If you want to filter the column values that end with a particular letter, select this value.
Contains: If you want to filter the column value that is based on a particular letter or a sequence of letters it contains, select this value.
Not Contains: If you want to filter the column value based on a particular letter or a sequence of letters it does not contain, select this value.
c. In the field, enter the value for which you want to apply the filter.
d. After you enter the filter value in the field, two grouping options and another list and filter field appear. You can group the filter results of the two list
and field values. The grouping options are:
AND: Conditions from both the first and the second list and field pair must match with the values of column.
OR: Conditions from any one of the two list and field pairs must match with the values of column.
e. Click Apply Filter.
f. Click Clear Filter and then Apply Filter to see the original table.
Note: When you click Clear Filter, it clears the option that you selected from the available options and not resets the content on the dashboard.
Filtering options that are applicable for Telco Network Cloud Manager - Performance Dashboards.
The filter options and list differ based on the different types of Telco Network Cloud Manager - Performance Dashboards.
Table 1. Filter options
Filter name Filter description Telco Network Cloud Manager -
Performance Dashboards
Parent Resource
Type
The list contains the available types of resources. Metric Viewer
Instances The list contains the configured or discovered devices for the Parent Resource Type. Metric Viewer
Child Resource
Type
The list is generated based on the available resource types for that selected parent instance. Metric Viewer
362 IBM Telco Network Cloud Manager - Performance 1.4.5

Filter name Filter description Telco Network Cloud Manager -
Performance Dashboards
Instances The list contains the configured or discovered devices for the Child Resource Type. Metric Viewer
Group The list contains the locations to view the traffic levels. Performance alarm overview
IP Links Performance Overview
GPON OLT Overview
All Load Balancer dashboards
ICMP Ping dashboards
Ping overview
Device overview
Region The list contains the regions to view the health and utilization of the mobile access networks. Mobile Access and Core
dashboards
OLT The list contains the configured or discovered GPON network's OLT (Optical Line Terminals). GPON OLT Overview drill-down
dashboards:
System Health Details
Traffic Monitoring (PON Port)
Details
Traffic Monitoring (Uplink
Interface) Details
Optical Monitoring Details
LTM The list contains the available LTM devices in your load-balancing environment. Pool Details
Pool Member Details
Virtual Server Details
Top N From the list, you can choose N number of Top Performers to compare historical poll data across multiple
entities and metrics in a selected network view.
GPON OLT Overview drill-down
dashboards:
System Health Details
Traffic Monitoring (PON Port)
Details
Traffic Monitoring (Uplink
Interface) Details
Optical Monitoring Details
GTM Details
LTM Details
Pool Details
Pool Member Details
Virtual Server Details
Source The list contains the IP addresses of source servers. IP Links Performance Overview
drill-down dashboard:
Source and Destination
Details
Destination The list contains the destination IP addresses for the specific source IP addresses.
Time period The dashboard data is populated based on the Telco Network Cloud Manager - Performance server time
zone.
Last hour, filters the last 1 hour of the current time.
Last 6 hours, filters the last 6 hours of the current time.
Last 12 hours, filters the last 12 hours of the current time.
Last 24 hours, filters the last 24 hours from the current time and day.
Last 7 days, filters the last 7 days from the current time and day.
Last 30 days, filters the last 30 days from the current time and day.
Last 365 days, filters the last 365 days from the current time and day.
Custom, from the Custom Time Period Selection, you can filter based on a specific date and time
range.
View the start and end time on the dashboard title bar. The start and end time is displayed according to the
filter that you select.
For example, if the current time is 3.00 PM on 11/13/17 and you select the filter for Last 24 Hours. The
dashboard displays the time period as: 11/12/17, 3:00 PM - 11/13/17, 2:59 PM <Timezone>.
Note: The time period list differs based on the different types of Telco Network Cloud Manager -
Performance Dashboards.
Performance Alarm Overview
Metric Viewer
IP Links Performance Overview
Source and Destination
Details
GPON OLT Overview
GPON OLT Overview drill-down
dashboards:
System Health Details
Traffic Monitoring (PON Port)
Details
Traffic Monitoring (Uplink
Interface) Details
Optical Monitoring Details
All Load Balancer dashboards
All SD-WAN dashboards
All NetFlow dashboards
All WiFi dashboards
All ICMP Ping dashboards
Site This filter is specific to SD-WAN dashboards. The list of sites. SD-WAN dashboards:
Device health
Interface details
Application performance
Tunnel QoE
WAN link details
IBM Telco Network Cloud Manager - Performance 1.4.5 363

Filter name Filter description Telco Network Cloud Manager -
Performance Dashboards
Device The list of devices.
This filter is specific to SD-WAN dashboards and some NetFlow dashboards.
SD-WAN dashboards:
Device health
Interface details
Application performance
Tunnel QoE
WAN link details
NetFlow dashboards
ICMP Ping dashboard
Device ping details
Interface The list of interfaces. This filter is specific to SD-WAN dashboards, Applications response time, and some
NetFlow dashboards.
Interface details dashboard in SD-
WAN
Applications response overview
drill-down dashboard in SD-WAN.
NetFlow dashboards
Application The list of applications.
This filter is specific to SD-WAN dashboards and Applications response time, Flow dashboard.
Application performance.
Applications response time
Tunnel This filter is specific to SD-WAN dashboards. The list of tunnels. Tunnel QoE.
WAN link This filter is specific to SD-WAN dashboards. The list of WAN links. WAN link details.
Controller This filter is specific to WiFi dashboards. The list of controllers. WiFi Overview
WiFi Client Count
WiFi Interference
AP Radio
Channel
The list of AP Radio Channels. WiFi Interference
Direction The list of directions. NetFlow dashboards
Target The list of targets. Applications response time
Ping status Ping status of the devices, which can be Reachable or Unreachable. ICMP Ping dashboards
Device overview
Worst N Worst <N> number of devices that are not reachable or partially reachable with in the selected time
period.
ICMP Ping dashboards
Ping overview
What to do next
Click Apply Filter to apply the filter selection.
The dashboard reloads the data according to the filter selections.
Group and Time period filter conditions
Group and Time period filter conditions
Conditions that are applicable for the Group and Time period filter. These filter options are available on the IP Links Performance Overview, GPON OLT Overview, and Load
Balancer dashboards.
The table describes the conditions that can be applied to the filters and the time periods that are based on it.
Table 1. Group and Time period conditions
Dashboard Filter options Condition
Group Time period
IP Links
Performance
Overview
ALL Last hour
Last 6 hours
Last 12 hours
Last 24 hours
Last 7 hays
Last 30 days
Last 365 days
When you select ALL from the Group filter option, all time period options are
available.
<group_name> and
<resource_group_name>
Last hour
Last 6 hours
Last 12 hours
Last 24 hours
Last 7 hays
Last 30 days
Last 365 days
When you select a group from the Group filter option, the Time Period filter
option list starts from last 24 hours and more.
364 IBM Telco Network Cloud Manager - Performance 1.4.5

Dashboard Filter options Condition
Group Time period
GPON OLT
Overview
ALL Last hour
Last 6 hours
Last 12 hours
Last 24 hours
Last 7 hays
Last 30 days
Last 365 days
When you select ALL from the Group filter option.
<group_name> and
<resource_group_name>
Last 24 Hours When you select a group from the Group filter option, the Time Period filter
option list displays only last 24 hours.
Load Balancer
dashboards
ALL Last Hour
Last 6 Hours
Last 12 Hours
Last 24 Hours
Last 7 Days
Last 30 Days
Last 365 Days
Custom
Note: Use Custom filter to
get more granularity.
When you select a group from the Group filter option, the Time Period filter
option list displays only last 24 hours.
<group_name> and
<resource_group_name>
Last Hour
Last 6 Hours
Last 12 Hours
Last 24 Hours
Last 7 Days
Last 30 Days
Last 365 Days
Custom
Note: Use Custom filter to
get more granularity.
When you select a group from the Group filter option, the Time Period filter
option list starts from last 24 hours and more.
Filters used in SD-WAN dashboards.
Filter Dashboards
Site Device health
Interface details
Application performance
Tunnel QoE
WAN link details
Device Device health
Interface details
Application performance
Tunnel QoE
WAN link details
Interface Interface details
Application Application performance
Tunnel Tunnel QoE
WAN link WAN link details
Interface traffic monitoring
This interactive dashboard covers the entire device and traffic data representation.
Interface traffic monitoring can be used to monitor the network performance details of a particular device and the interface traffic details for a device. You can identify any
anomalies from just visualizing the network entities trend charts.
Interface traffic monitoring is a Free Form dashboard where you can edit the dashboard and add a published widget to it. For more information about the Free Form
dashboard, see Create Free Form dashboards.
Interface traffic monitoring
1. Click Infra > Device > Interface traffic monitoring
The Interface traffic monitoring dashboard loads.
2. From the filter options, select Device, Time Period, and then click Apply Filter.
You can select the filter values or time that you want to display in dashboards to which the filter is assigned. For more information, see Generic functions of Telco
Network Cloud Manager - Performance Dashboards.
Available widgets
Widget name Widget type Description
Top 10 Inbound Utilization (%) Donut Measures the bandwidth utilization for incoming traffic for the highest Inbound Packet Discards on the
interfaces.
IBM Telco Network Cloud Manager - Performance 1.4.5 365

Widget name Widget type Description
Top 10 Outbound Utilization
(%)
Donut Measures outbound bandwidth utilization for the highest Outbound Packet Discards on the interfaces.
Inbound Utilization Trend Timeseries Displays the utilization trend over a period.
Outbound Utilization Trend Timeseries Displays the utilization trend over a period.
Interface Traffic Summary Grid Displays multiple network interfaces and the metrics.
Cloud monitoring dashboards
Predefined dashboards, which display metrics and general information to get end-to-end observability of the Kubernetes cloud infrastructure. You can get complete
visibility into the health, availability, and performance of your K8 cloud clusters and there by meet SLAs.
Typically, these dashboards help you in the following ways:
Observe your cloud platform infrastructure and understand the utilization trends and help to plan capacity building.
Discover the cloud resources in minutes and help in real-time performance monitoring.
Detect the performance issues so that you can manage the availability and downtime of the nodes in your cluster.
Track critical metrics like CPU utilization, disk I/O, network traffic, volume traffic, threads, and processes to monitor performance so that you can manage optimum
resource allocation and utilization.
You must install the following Technology Packs to view these dashboards:
Monitoring for Kubernetes Cloud Environment (cloud-kubernetes-1.8.0.jar)
The following dashboards can be seen from the menu:
Cluster summary
Node summary
Pod summary
Container summary
Cluster summary
Cluster summary dashboard is the starting point for cloud infrastructure monitoring that can pin point the problem detection and root cause analytics.
Node summary
Kubernetes manages the workloads by embedding containers into Pods, which then operate on nodes. Monitoring the health of a Kubernetes cluster node can help
you understand the components that impact the health of the nodes in your cluster.
Pod summary
Kubernetes cloud platform deploys, manages, and scales containerized applications on multiple node servers. A Pod is a group of one or more containers, with
shared storage and network resources, and a specification for how to run the containers.
Container summary
Pods can abstract multiple containers that share the resources that are provided by the Pod, such as network, storage, and memory. Typically, a one-to-one
relationship exists between a Pod and a container, but in certain scenarios, a Pod might run multiple containers in it.
Cluster summary
Cluster summary dashboard is the starting point for cloud infrastructure monitoring that can pin point the problem detection and root cause analytics.
Following are the benefits of the widgets in the Cluster summary dashboard:
Continuous insights on quality, scalability, and performance of your cloud network.
Real-time analysis of the digital experience for the cloud subscribers.
Operational insights on cloud DevOps and automation that is in place.
The following metrics and their trends are observed through the Cluster summary dashboard:
CPU Utilization (%)
Memory Utilization (%)
File System Utilization (%)
It helps in continuous real-time discovery of the following artifacts in your Kubernetes cloud environment:
Nodes
Pods
Containers
Namespaces
Deployments
Replica Sets
Deamon Sets
366 IBM Telco Network Cloud Manager - Performance 1.4.5

Services
Available widgets
Note: No drill-down dashboards or listener widgets and dashboards are available in the Cluster summary dashboard.
1. Click Cloud > Kubernetes > Cluster summary.
This dashboard displays all the cloud components and the specific metrics and their trends.
2. From the filter options, choose the Cluster and Time period.
Select the cluster that you want to observe from the Cluster filter.
From the Time period filter, select any of the following periods.
Last hour
Last 6 hours
Last 12 hours
Last 24 hours
Last 7 days
Last 30 days
Last 365 days
Custom
You can select the filter values or time ranges that you want to display in dashboards to which the filter is assigned. For more information, see Generic functions of
Telco Network Cloud Manager - Performance Dashboards.
3. Click Apply Filter.
The dashboard refreshes the data according to the filter attribute values.
Table 1. Dashboard interactions
Controller widget Listener dashboard
Cluster summary
Table 2. Available widgets
Widgets name Chart type Description
Nodes Badge A Kubernetes cluster consists of a set of worker machines, called Nodes, that run containerized applications. Displays
the total nodes in the selected cluster. It has the following associated badges:
Not ready
Unknown
Ready
Click on the widget to launch the Node summary dashboard.
Pods Badge A Pod represents a set of running containers in your cluster. Displays the total number of Pods in the cluster. It has the
following associated badges:
Failed
Pending
Running
Unknown
Succeeded
Click on the widget to launch the Pod summary dashboard.
Containers Badge Containers are used to abstract an application from the physical environment to deploy and manage software in the
cloud. Displays the total number of containers in the cluster:
Terminated
Waiting
Running
Click on the widget to launch the Container summary dashboard.
Namespaces Badge Namespaces provide a mechanism for isolating groups of resources within a single cluster. Displays the total number of
namespaces in the cluster. It has the following associated badges:
Terminated
Active
Deployments Badge Unavailable Replicas
Available Replicas
Total Replicas
Replica Sets Badge Displays the total deployments in the cluster. It has the following associated badges:
Available Replicas
Desired Replicas
Fully Labelled Replicas
Observed Replicas
Ready Replicas
IBM Telco Network Cloud Manager - Performance 1.4.5 367

Widgets name Chart type Description
Deamon Sets Badge Displays the total number of deamon sets. It has the following associated badges:
Unavailable Nodes
Available Nodes
Scheduled Nodes
Unscheduled Nodes
Ready Nodes
Services Badge Shows the total number of Services that are running in the selected cluster.
CPU Utilization (%) Gauge Displays the CPU Utilization in percentage of all the node in the selected cluster. It has Used and Total badges that show
the total number of used against total CPU cores.
Memory Utilization
(%) Gauge Displays the Memory Utilization in percentage of all the node in the selected cluster. It has Used and Total badges that
show the used memory against total memory in GB.
File System
Utilization (%) Gauge Displays the File System Utilization in percentage of all the node in the selected cluster. It has Used and Total badges
that show the used against total file system in GB.
CPU Utilization (%)
Trend Timeseries Displays the CPU Utilization trend in percentage of all the node in the selected cluster.
Memory Utilization
(%) Trend Timeseries Displays the Memory Utilization trend in percentage of all the node in the selected cluster.
File System
Utilization (%) Trend Timeseries Displays the File System Utilization trend in percentage of all the node in the selected cluster.
Node summary
Kubernetes manages the workloads by embedding containers into Pods, which then operate on nodes. Monitoring the health of a Kubernetes cluster node can help you
understand the components that impact the health of the nodes in your cluster.
The Node summary dashboard displays the details of the node and the resources that are used by the node based on the metrics that are collected and displayed.
Available widgets and their interactions
Node summary
1. Click Cloud > Kubernetes > Node summary.
This dashboard displays all the node components and the specific metrics and their trends.
2. From the filter options, choose the Cluster and Time period.
Select the cluster that you want to observe from the Cluster filter.
From the Time period filter, select any of the following periods.
Last hour
Last 6 hours
Last 12 hours
Last 24 hours
Last 7 days
Last 30 days
Last 365 days
Custom
You can select the filter values or time ranges that you want to display in dashboards to which the filter is assigned. For more information, see Generic functions of
Telco Network Cloud Manager - Performance Dashboards.
3. Click Apply Filter.
The dashboard refreshes the data according to the filter attribute values.
Table 1. Widget interactions
Controller dashboard Listener dashboards
Node summary Node details
Pod details
Table 2. Available widgets
Widgets Chart type Description
Current Status: <cluster>
Total Nodes Badge Total number of nodes in the cluster
Not Ready Badge Number of nodes that are not ready and scaled to zero.
Unknown Badge Number of nodes that are unknown
Ready Badge Number of nodes that are ready and scaled up.
368 IBM Telco Network Cloud Manager - Performance 1.4.5

Widgets Chart type Description
Node Summary Grid Table that displays the following metrics:
Node
Readiness
CPU capacity (cores)
CPU Utilization (%)
Memory Utilization (%)
Total Inbound Volume (Bytes)
Total Inbound Errors
Total Outbound Volume (Bytes)
Total Outbound Errors
Total Major Memory Faults
CPU Utilization (%) Trend Timeseries Displays the CPU Utilization trend in percentage of a node in the selected cluster.
Memory Utilization (%) Trend Timeseries Displays the Memory Utilization trend in percentage of a node in the selected cluster.
Traffic Volume (Bytes) Trend Timeseries Displays the Traffic Volume trend in bytes of a node in the selected cluster.
Traffic Error Trend Timeseries Displays the network Traffic Errors trend in number of a node in the selected cluster.
File System Usage (Bytes) Trend Timeseries The file system utilization data in bytes that includes total space, used space, and free space for all of the
shared file systems a node in your cluster.
Run Time Image File System Usage
(Bytes) Trend
Timeseries The file system usage in bytes of the docker image for the container.
Node details
The Node details dashboard is a listener dashboard that is launched from the Node Summary widget in the Node summary dashboard.
Node details
The Node details dashboard is a listener dashboard that is launched from the Node Summary widget in the Node summary dashboard.
It displays the basic details of a selected node in your cluster and other health indicator metrics of the node.
Node details
1. Click Cloud > Kubernetes > Node summary.
This dashboard displays all the node components and the specific metrics and their trends.
2. Click any node from the Node Summary table to launch the Node details dashboard that displays the details of the selected node.
3. From the filter options, choose the Cluster Node, and Time period.
Select the cluster that you want to observe from the Cluster filter.
Select a node from the Node filter
From the Time period filter, select any of the following periods.
Last hour
Last 6 hours
Last 12 hours
Last 24 hours
Last 7 days
Last 30 days
Last 365 days
Custom
You can select the filter values or time ranges that you want to display in dashboards to which the filter is assigned. For more information, see Generic functions of
Telco Network Cloud Manager - Performance Dashboards.
4. Click Apply Filter.
The dashboard refreshes the data according to the filter attribute values.
Table 1. Widget interactions
Controller dashboard Listener dashboard Listener dashboard
Node summary Node details Pod details
Table 2. Available widgets
Controller widgets Chart type Description
Node Details
Cluster Badge Name of the cluster to which the selected Pod belongs to.
Node Badge Node hostname from the selected cluster.
IP address Badge IP address of the node
Telegraf host Badge The hostname where the Telegraf application is installed.
OS Image Badge Image name of the Operating System
Kernel Version Badge Kernel version of the Operating System
Kube Proxy Version Badge The Kubernetes network proxy version that runs on each node.
Kubelet Version Badge The version of the kubelet, which is the primary node agent that runs on each node.
Total Containers Badge Total number of containers in the node.
Current Status
Total Pods Badge Total number of Pods in the node
IBM Telco Network Cloud Manager - Performance 1.4.5 369

Controller widgets Chart type Description
Failed Badge Total number of failed Pods in the node
Pending Badge Total number of pending Pods in the node
Running Badge Total number of running Pods in the node
Allocatable Pods Badge The number of pods that can be allocated to the node.
Capacity Pods Badge The total number of pods the node can contain.
Allocatable vs Capacity CPU cores Timeseries Displays the trends in the following metrics:
Allocatable CPU cores
The number of CPU cores that can be allocated to a node.
Capacity CPU cores
Total number of CPU cores that node can contain.
Allocatable vs Capacity Memory Bytes Timeseries Displays the trends in the following metrics:
Allocatable Memory Bytes
The memory in bytes that can be allocated to a node.
Capacity Memory Bytes
Total memory in bytes that node can contain.
Allocatable vs Capacity Pods Timeseries Displays the trends in the following metrics:
Allocatable Pods
The number of Pods that can be allocated to the node.
Capacity Pods
Total number of Pods that the node can contain.
Memory RSS vs Memory Working Set (Bytes) Trend Timeseries Displays the trends in the following metrics:
Memory RSS (Bytes)
The memory RSS in bytes that can be allocated to a node.
Memory Working Set (Bytes)
Total memory working set in bytes that node can contain.
Node details Grid Displays the following information:
Pod
Phase
CPU Utilization (%)
Memory Utilization (%)
Total Inbound Volume (Bytes)
Total Inbound Error
Total Outbound Volume (Bytes)
Total Outbound Error
Total major Memory Faults
Pod summary
Kubernetes cloud platform deploys, manages, and scales containerized applications on multiple node servers. A Pod is a group of one or more containers, with shared
storage and network resources, and a specification for how to run the containers.
Pods are created on the nodes in your cluster by using workload resources such as Deployment or Job. If your Pods need to track state, then consider the StatefulSet
resource.
Available widgets and their interactions
Pod summary
1. Click Cloud > Kubernetes > Pod summary.
This dashboard displays all the cloud components and the specific metrics and their trends.
2. From the filter options, choose the Cluster, Namespace, and Time period.
Select the cluster that you want to observe from the Cluster filter.
Select the namespace to observe the Pods that are associated with it from the Namespace filter.
From the Time period filter, select any of the following periods.
Last hour
Last 6 hours
Last 12 hours
Last 24 hours
Last 7 days
370 IBM Telco Network Cloud Manager - Performance 1.4.5

Last 30 days
Last 365 days
Custom
You can select the filter values or time ranges that you want to display in dashboards to which the filter is assigned. For more information, see Generic functions of
Telco Network Cloud Manager - Performance Dashboards.
3. Click Apply Filter.
The dashboard refreshes the data according to the filter attribute values.
Table 1. Widget interactions
Controller widget Listener dashboard
Pod Summary Pod details
Table 2. Available widgets
Controller widgets Chart type Description
Current Status: <cluster> - <namespace>
Total Pods Badge Total number of Pods in the namespace
Failed Badge Total number of Pods that failed to start in the namespace.
Unknown Badge Total number of Pods that are not known in the namespace.
Pending Badge Total number of Pods that are pending in the namespace.
Succeeded Badge Total number of Pods that succeeded to start in the namespace.
Running Badge Total number of Pods that are running in the namespace.
Pod Summary Grid Displays the following information:
Pod
Phase
CPU Utilization (%)
Memory Utilization (%)
Total Inbound Volume (Bytes)
Total Inbound Error
Total Outbound Volume (Bytes)
Total Outbound Error
Total Major Memory Faults
CPU Utilization (%) Trend Timeseries Displays the CPU Utilization trend in percentage of the Pods in the selected namespace.
Memory Utilization (%) Trend Timeseries Displays the Memory Utilization trend in percentage of the Pods in the selected namespace.
Traffic Volume (Bytes) Trend Timeseries Displays the Traffic Volume trend in bytes of the Pods in the selected namespace.
Errors Trend Timeseries Displays the Errors trend in number of the Pods in the selected namespace.
System Volume Usage (Bytes)
Trend
Timeseries Comparison between capacity, available, and used volume filesystem
File System Usage (Bytes) Trend Timeseries The file system utilization data in bytes that includes total space, used space, and free space for all of the shared file
systems a Pod.
Pod details
The Pod details dashboard is a listener dashboard that is launched from the Pod Summary widget in the Pod summary dashboard.
Pod details
The Pod details dashboard is a listener dashboard that is launched from the Pod Summary widget in the Pod summary dashboard.
It displays the basic Pod details and other health indicator metrics of the Pod.
Pod details
1. Click Cloud > Kubernetes > Pod summary.
This dashboard displays all the Pod components and the specific metrics and their trends.
2. Click any Pod from the Pod Summary table to launch the Pod details dashboard that displays the details of the selected Pod.
3. From the filter options, choose the Cluster, Namespace, and Time period.
Select the cluster that you want to observe from the Cluster filter.
Select the namespace to observe the Pods that are associated with it from the Namespace filter.
From the Time period filter, select any of the following periods.
Last hour
Last 6 hours
Last 12 hours
Last 24 hours
Last 7 days
Last 30 days
Last 365 days
Custom
You can select the filter values or time ranges that you want to display in dashboards to which the filter is assigned. For more information, see Generic functions of
Telco Network Cloud Manager - Performance Dashboards.
4. Click Apply Filter.
The dashboard refreshes the data according to the filter attribute values.
IBM Telco Network Cloud Manager - Performance 1.4.5 371

Table 1. Dashboard interactions
Controller dashboard Listener dashboard Listener dashboard
Pod summary Pod details Container details
Table 2. Available widgets
Controller widgets Chart type Description
Current Pod details
Cluster Badge Name of the cluster to which the selected Pod belongs to.
Namespace Badge Namespace that the Pod belongs to
Node Badge Node in which the Pod is available
Pod Badge Name of the selected Pod
Telegraf host Badge Hostname where the Telegraf application is installed.
Readyness Badge State of the Pod.
Restart count Badge Number of times the Pod is restarted.
Memory RSS vs Memory Working Set
(Bytes) Trend
Timeseries Displays the trends in the following metrics:
Memory RSS
The amount of anonymous and swap cache memory and it equals to the value of total_rss from
the memory.status file.
Memory Working Set
The amount of working set memory, this includes recently accessed memory, dirty memory, and
kernel memory.
CPU Utilization (%) Trend Timeseries Displays the CPU Utilization trend in percentage of the selected Pod.
Memory Utilization (%) Trend Timeseries Displays the Memory Utilization trend in percentage of the selected Pod
Traffic Volume (Bytes) Trend Timeseries Displays the Traffic Volume trend in bytes of the selected Pod.
Errors Trend Timeseries Displays the Errors trend in number of the selected Pod.
Pod details Grid Displays the following information:
Container
Node
Pod
Phase
Total Major Memory Faults
A memory fault occurs when the Pod uses memory in an incorrect way or uses memory that does
not belong to it.
CPU Utilization (%)
Memory Utilization (%)
Container summary
Pods can abstract multiple containers that share the resources that are provided by the Pod, such as network, storage, and memory. Typically, a one-to-one relationship
exists between a Pod and a container, but in certain scenarios, a Pod might run multiple containers in it.
The Container summary dashboard displays the details of the container and the resources that are used by it based on the metrics that are collected and displayed.
Available widgets and their interactions
Container summary
The Container summary dashboard displays the details of the containers in a Pod and the resources that are used by them based on the metrics that are collected and
displayed.
Container summary
1. Click Cloud > Kubernetes > Container summary.
This dashboard displays all the container components and the specific metrics and their trends.
2. From the filter options, choose the Cluster, Namespace, Pod, and Time period.
Select the cluster that you want to observe from the Cluster filter.
Select the Namespace and Pod to observe the containers that are associated with them.
From the Time period filter, select any of the following periods.
Last hour
Last 6 hours
Last 12 hours
Last 24 hours
Last 7 days
Last 30 days
372 IBM Telco Network Cloud Manager - Performance 1.4.5

Last 365 days
Custom
You can select the filter values or time ranges that you want to display in dashboards to which the filter is assigned. For more information, see Generic functions of
Telco Network Cloud Manager - Performance Dashboards.
3. Click Apply Filter.
The dashboard refreshes the data according to the filter attribute values.
Table 1. Dashboard interactions
Controller dashboard Listener dashboard
Container summary Container details
Table 2. Available widgets
Controller widgets Chart type Description
Current Status <cluster> - <namespace> - Pod
Total Containers Badge Total number of containers in the selected Pod.
Terminated Badge Total number of terminated containers in the selected Pod.
Waiting Badge Total number of containers in the selected Pod that are in waiting state.
Running Badge Total number of containers in the selected Pod that are running.
Container Summary Grid Table that displays the following metrics:
Container
State
Total Major Memory Faults
Root File System Capacity Bytes
Root File System Available Bytes
Root File System Used Bytes
CPU Utilization (%)
Memory Utilization (%)
CPU Utilization (%)
Trend
Timeseries Displays the CPU Utilization trend in percentage of a Pod in the selected cluster.
Memory Utilization
(%) Trend
Timeseries Displays the Memory Utilization trend in percentage of a Pod in the selected cluster.
Log File System
(Bytes) Trend
Timeseries Displays the bytes used for the log files in the system.
Auto-generated data file that contains information about usage patterns, activities, and operations within an operating system,
application, server, or another device.
Root File System
(Bytes) Trend
Timeseries Displays the bytes used for the root files in the system.
The root file system is the top of the hierarchical file tree. It contains the files and directories critical for system operation,
including the device directory and programs for starting the system.
Container Restart
Count Trend
Timeseries Displays the restart count of the Pod in the selected time period.
Container details
The Container details dashboard is a listener dashboard that is started from the Container Summary widget in the Container summary dashboard. It can also be
started from the Node details and Pod details dashboards.
Container details
The Container details dashboard is a listener dashboard that is started from the Container Summary widget in the Container summary dashboard. It can also be started
from the Node details and Pod details dashboards.
It displays the basic details of a selected Pod in your namespace and other health indicator metrics of the Pod and its containers.
Container details
1. Click Cloud > Kubernetes > Container summary.
This dashboard displays all the node components and the specific metrics and their trends.
2. Click any container from the Container Summary table to launch the Container details dashboard that displays the details of the selected Pod and its containers.
3. From the filter options, choose the Cluster , Namespace, Pod, Container, and Time period.
Select the cluster that you want to observe from the Cluster filter.
Select a node from the Node filter
From the Time period filter, select any of the following periods.
Last hour
Last 6 hours
Last 12 hours
Last 24 hours
Last 7 days
Last 30 days
Last 365 days
Custom
You can select the filter values or time ranges that you want to display in dashboards to which the filter is assigned. For more information, see Generic functions of
Telco Network Cloud Manager - Performance Dashboards.
IBM Telco Network Cloud Manager - Performance 1.4.5 373

4. Click Apply Filter.
The dashboard refreshes the data according to the filter attribute values.
5. You can launch the Container details dashboard as a listener dashboard from Node details and Pod details dashboards also.
Table 1. Dashboard interactions
Controller dashboard Listener dashboard
Container summary Container details
Node summary Node details
Container details
Pod summary Pod details
Container details
Table 2. Available widgets
Controller widgets Chart type Description
Current Container details
Container Badge Name of the container that belongs to the Pod.
Telegraf host Badge The hostname where the Telegraf application is installed.
Pod Badge The selected Pod for the selected Container.
Node Badge The node in which the Pod exists.
Namespace Badge The namespace in which the Pod exists
Cluster Badge The cluster in which the node exists.
Readiness Badge Pod readiness, which denotes the condition of the Pod.
Restart Count Badge Number of times the Pod is restarted.
State Code Badge The numerical representation of the current state of the container. Possible values are 0, 1, 2 and 3, which
represent "running", "terminated", "waiting" and "unknown".
State Badge Pod state. The three possible container states are Waiting, Running, and Terminated. It is measured by the
last value of kubernetesContainer.stateCode.number metric.
State Reason Badge When pod is running in state, the value is displayed as N/A.
Spec CPU Period (µs) Badge Denotes the period in which container CPU utilization is tracked.
FS Sector Write Total Badge Denotes the Cumulative count of bytes written that is measured with avg(
ssum_kubernetesContainerCAdvisor.containerFSSectorWritesTotal.number) metric.
CPU Utilization (%) Trend Timeseries Displays the CPU Utilization trend in percentage of the selected Pod.
Memory Utilization (%) Trend Timeseries Displays the Memory Utilization trend in percentage of the selected Pod.
Log File System (Bytes) Trend Timeseries Displays the bytes used for the log files in the system.
Root File System (Bytes) Trend Timeseries Displays the bytes used for the root files in the system.
Memory RSS vs Memory Working
Set (Bytes) Trend
Timeseries Displays the trends in the following metrics:
Memory RSS (Bytes)
The amount of anonymous and swap cache memory and it equals to the value of total_rss from the
memory.status file.
Memory Working Set (Bytes)
The amount of working set memory, this includes recently accessed memory, dirty memory, and kernel
memory.
TNC-P monitoring dashboards
Predefined dashboards that are used to monitor the health of IBM® Telco Network Cloud Manager - Performance, which is a cloud native application that can be deployed
on both OpenShift® Container Platform and Kubernetes platforms.
Telco Network Cloud Manager - Performance is a comprehensive network Analytics and Performance Management Suite.
Telco Network Cloud Manager - Performance constantly checks network devices and traffic and provides an overview of network performance status to communication
service providers (CSPs) and media service providers (MSPs). It can monitor and provide tiered and timely alerts on fixed (wireline), mobile (wireless) devices, and cloud
or virtualized network anomalies all in a single pane.
These dashboards help you in the following ways:
Observe the Pod restart count and restart occurrence time.
Monitor the disc space issues and the disc usage of the persistent volume claim.
Monitor the CPU and Memory usage of the current worker node. Understand the total CPU and Memory available in the node, and the current usage of CPU and
Memory.
The following dashboards can be seen from the menu:
TNC-P overview
TNC-P Node details
TNC-P Pod details
TNC-P PersistentVolumeClaim details
You must install the following Technology Packs to view these dashboards:
Monitoring for Kubernetes Cloud Environment (cloud-kubernetes-1.8.0.jar)
374 IBM Telco Network Cloud Manager - Performance 1.4.5

TNC-P overview
It is the starting point for IBM Telco Network Cloud Manager - Performance infrastructure monitoring that can pin point the problem detection and root cause
analytics.
TNC-P Node details
It displays the health indicator metrics of the selected node in your Telco Network Cloud Manager - Performance cluster.
TNC-P Pod details
It displays the health indicator metrics of Pods in the selected node in your Telco Network Cloud Manager - Performance cluster.
TNC-P PersistentVolumeClaim details
It displays the health indicator metrics of PersistentVolumeClaim (PVC) in the selected cluster and namespace in your Telco Network Cloud Manager - Performance
environment.
TNC-P overview
It is the starting point for IBM® Telco Network Cloud Manager - Performance infrastructure monitoring that can pin point the problem detection and root cause analytics.
The following are the benefits of the widgets in the TNC-P overview dashboard:
Status of the Pods, Persistent Volume Claims, CPU, memory, and top five Pods that are restarted maximum number of times in the selected cluster and namespace
for the specific time period.
Node readiness for the selected time period.
CPU and memory usage trends for the selected time period.
Available widgets and their interactions
TNC-P overview
1. Click TNC-P monitoring > Platform > TNC-P overview.
This dashboard displays all the cloud components and the specific metrics and their trends.
2. From the filter options, choose the Cluster, Namespace, and Time period.
Select the cluster that you want to observe from the Cluster filter.
Select the namespace from the Namespace filter.
Note: Currently, tncp namespace alone can be selected.
Note:
After you apply Interim Fix2 to your existing environment, you can select your configured namespace from the list. For more information, see
From the Time period filter, select any of the following periods.
Last hour
Last 6 hours
Last 12 hours
Last 24 hours
Last 7 days
Last 30 days
Last 365 days
Custom
You can select the filter values or time ranges that you want to display in dashboards to which the filter is assigned. For more information, see Generic functions of
Telco Network Cloud Manager - Performance Dashboards.
3. Click Apply Filter.
The dashboard refreshes the data according to the filter attribute values.
Table 1. Widget interactions
Controller widgets Listener dashboard Listener widgets
Total Pods and all it's related badge widgets TNC-P Pod details N/A
Total PersistentVolumeClaims and all its related badge widgets TNC-P PersistentVolumeClaim details N/A
Total CPU TNC-P Node details N/A
Total Memory TNC-P Node details
CPU Utilization TNC-P Node details N/A
Memory Utilization TNC-P Node details N/A
Node Readiness N/A CPU Utilization (%) Trend
Memory Utilization (%) Trend
IBM Telco Network Cloud Manager - Performance 1.4.5 375

Controller widgets Listener dashboard Listener widgets
CPU Utilization (%) Trend
Memory Utilization (%) Trend
TNC-P Node details N/A
Table 2. Available widgets
Widgets name Chart type Description
Current Status: <cluster>-<namespace>
Total Pods Badge It has the following badges:
Failed
Unknown
Pending
Running
Succeeded
Total PersistentVolumeClaims Badge It has the following badges:
Lost
Pending
Bound
Total CPU Badge Displays the CPU Utilization in number of cores.
Total Memory Badge Displays the total memory usage in GB.
CPU Utilization Badge Displays the CPU Utilization in percentage.
Memory Utilization Badge Displays the memory Utilization in percentage.
Top 5 Restarted Pods Bar chart Displays the five Pods that restarted the most number of times.
Summary For: <time period>
Node Readiness Grid Table that displays the following metrics:
Node Name
Readiness
CPU Request (cores)
CPU Limit (cores)
Total Capacity CPU (cores)
CPU Utilization (%)
Memory Request (GB)
Memory Limit (GB)
Total Capacity Memory (GB)
Memory Utilization (%)
Total Capacity File System (GB)
File System Utilization (%)
Node: <Node hostname>
CPU Utilization (%) Trend Timeseries Displays the CPU Utilization trend in percentage of all the node in the selected cluster.
Memory Utilization (%) Trend Timeseries Displays the Memory Utilization trend in percentage of all the node in the selected cluster.
TNC-P Node details
It displays the health indicator metrics of the selected node in your Telco Network Cloud Manager - Performance cluster.
TNC-P Node details
1. Click TNC-P monitoring > Platform > TNC-P Node details.
This dashboard displays all the health metrics and their trends for a specific node in your Telco Network Cloud Manager - Performance cluster.
2. From the filter options, choose the Cluster, Namespace, Node, and Time period.
Select the cluster that you want to observe from the Cluster filter.
Select the namespace from the Namespace filter.
Note: Currently, tncp namespace alone can be selected.
Select a specific node that you want to observe from the Node filter.
From the Time period filter, select any of the following periods.
Last hour
Last 6 hours
Last 12 hours
Last 24 hours
Last 7 days
Last 30 days
Last 365 days
Custom
You can select the filter values or time ranges that you want to display in dashboards to which the filter is assigned. For more information, see Generic functions of
Telco Network Cloud Manager - Performance Dashboards.
3. The TNC-P Node details dashboard can also be launched from the following dashboards as a listener dashboard:
TNC-P overview
TNC-P Pod details
376 IBM Telco Network Cloud Manager - Performance 1.4.5

4. Click Apply Filter.
The dashboard refreshes the data according to the filter attribute values.
Dashboard interactions
Note: No listener widgets or dashboards are available for the TNC-P Node details dashboard.
Table 1. Available widgets
Widgets Chart type Description
<cluster> - <namespace> - <node hostname>
CPU Utilization (%) Gauge Displays the CPU Utilization in percentage.
Memory Utilization (%) Gauge Displays the Memory Utilization in percentage.
Total CPU Badge Displays the CPUs in number of cores.
Total Memory Badge Displays the total memory in GB.
CPU Usage Summary Grid Table that displays the following metrics:
Pod name
Requested (cores)
Limits (cores)
Max Utilization (%)
Avg Utilization (%)
Memory Usage Summary Grid Table that displays the following metrics:
Pod name
Requested (GB)
Limits (GB)
Max Utilization (%)
Avg Utilization (%)
CPU Utilization (%) Trend Timeseries Displays the CPU Utilization trend in percentage of a node in the selected cluster and namespace.
Memory Utilization (%) Trend Timeseries Displays the Memory Utilization trend in percentage of a node in the selected cluster and namespace.
TNC-P Pod details
It displays the health indicator metrics of Pods in the selected node in your Telco Network Cloud Manager - Performance cluster.
TNC-P Pod details
1. Click TNC-P monitoring > Platform > TNC-P Pod details.
This dashboard displays all the health metrics and their trends for a specific node in your Telco Network Cloud Manager - Performance cluster.
2. From the filter options, choose the Cluster, Namespace, Phase, and Time period.
Select the cluster that you want to observe from the Cluster filter.
Select the namespace from the Namespace filter.
Note: Currently, tncp namespace alone can be selected.
Select the phase of the Pods that you want to observe from the Phase filter.
You have the following options:
ALL
Failed
Pending
Running
Succeeded
Unknown
Note: For more information about the Pod phases, see Pod Lifecycle.
From the Time period filter, select any of the following periods.
Last hour
Last 6 hours
Last 12 hours
Last 24 hours
Last 7 days
Last 30 days
Last 365 days
Custom
You can select the filter values or time ranges that you want to display in dashboards to which the filter is assigned. For more information, see Generic functions of
Telco Network Cloud Manager - Performance Dashboards.
3. The TNC-P Pod details dashboard can also be invoked from theTNC-P overview dashboard as a listener dashboard.
4. Click Apply Filter.
The dashboard refreshes the data according to the filter attribute values.
IBM Telco Network Cloud Manager - Performance 1.4.5 377

Widget interactions
Table 1. Widget interactions
Controller widget Listener dashboard
Current Pod Summary Status TNC-P Node details
Table 2. Available widgets
Widgets Chart type Description
<cluster> - <namespace> - <phase>
Current Pod
Summary Status
Grid Table that displays the following metrics:
Pod Name
Restart Count
Phase
Node
Age
Availability (%)
Available (%) Trend Timeseries Displays the Pods that are available over the selected time period in percentage.
Pod Restart Status Heatmap Displays the Pods that are up and running, which are shown in green blocks over the selected time period. If any Pod is
restarted, it is displayed in red at the specific time that it happens.
TNC-P PersistentVolumeClaim details
It displays the health indicator metrics of PersistentVolumeClaim (PVC) in the selected cluster and namespace in your Telco Network Cloud Manager - Performance
environment.
A PersistentVolume (PV) is a piece of storage in the cluster that is provisioned by an administrator or dynamically provisioned by using Storage Classes. A
PersistentVolumeClaim (PVC) is a request for storage by a user. PVCs consume PV resources in the cluster. PVCs are requests for those resources and also act as claim
checks to the resource. When a suitable PV storage is found that matches the PVC request, they are then bound together.
TNC-P PersistentVolumeClaim details
1. Click TNC-P monitoring > Platform > TNC-P PersistentVolumeClaim details.
This dashboard displays all the health metrics and their trends for a specific PVC in your Telco Network Cloud Manager - Performance cluster.
2. From the filter options, choose the Cluster, Namespace, Phase, and Time period.
Select the cluster that you want to observe from the Cluster filter.
Select the namespace from the Namespace filter.
Note: Currently, tncp namespace alone can be selected.
Select the phase of the PVCs that you want to observe from the Phase filter.
You have the following options:
ALL
Bound
Used for PersistentVolumeClaims that are bound.
Lost
Used for PersistentVolumeClaims that lost their underlying Persistent Volume. The claim is bound to the Persistent Volume earlier that does not exist
anymore and all the data is lost.
Pending
Used for PersistentVolumeClaims that are not yet bound.
Note: For more information, see https://www.kubermatic.com/blog/keeping-the-state-of-apps-4-persistentvolumes-and-persistentvolum/
From the Time period filter, select any of the following periods.
Last hour
Last 6 hours
Last 12 hours
Last 24 hours
Last 7 days
Last 30 days
Last 365 days
Custom
You can select the filter values or time ranges that you want to display in dashboards to which the filter is assigned. For more information, see Generic functions of
Telco Network Cloud Manager - Performance Dashboards.
3. The TNC-P PersistentVolumeClaim details dashboard can also be invoked from theTNC-P overview dashboard as a listener dashboard.
4. Click Apply Filter.
The dashboard refreshes the data according to the filter attribute values.
Widget interactions
378 IBM Telco Network Cloud Manager - Performance 1.4.5

Table 1. Widget interactions
Controller widget Listener widget
PersistentVolumeClaim Summary Usage vs Free Utilization - <PVC_name>
Table 2. Available widgets
Widgets Chart type Description
PersistentVolumeClaim Summary Grid Table that displays the following metrics:
PVC name
Phase
Capacity (GB)
Usage (GB)
Utilization (%)
Free (GB)
Free (%)
PVC Utilization (%) Trend Timeseries Displays the PVC utilization trend over the selected time period of all the PVCs that are available in the cluster.
Usage vs Free Utilization -
<PVC_name>
Stacked area It is a listener widget from the PersistentVolumeClaim Summary. It displays the used and free storage by the
selected PVC in percentage.
ICMP Ping dashboards
Ping is a network utility that is used to test if a host is reachable over a network or over the Internet by using the Internet Control Message Protocol (ICMP). When you
initiate an ICMP, the request is sent from a source to a destination host. If the destination host successfully receives the ICMP request, it replies to the source host with an
ICMP reply message along with the round-trip time.
Typically, an ICMP echo request is sent to the devices, or the interfaces, or to the specified Resource group either individually or in combination, and the round-trip time is
measured. It waits for a valid UDP packet to be returned. The test passes if the valid return packet is received within the timeout period. The test fails if the specified
timeout period expires.
The following metrics are collected and stored in the Timeseries database in Telco Network Cloud Manager - Performance.
ICMP.Ping.Status, 0 (Failure), 100 (Success)
ICMP.Ping.Response.Time.ms, metric in milliseconds
ICMP.Ping.Packet.Loss.Percent, percentage of packet loss, which is determined by sending multiple ping requests and tallying up the lost packets. (Min 0%,
Max 100%)
You must install the following Technology Packs to see the data in these dashboards:
Network Health 1.20.0
Network Health Extension 1.7.1
The following ICMP Ping dashboards can be seen from the Infra menu:
Ping overview
Device overview
Device ping details
These dashboards help in detecting the network problems by monitoring the devices in your network and show real-time response time and also rate the response time
among the devices.
Important: If the ICMP Ping profile is configured with a RemoteContext, all the widgets that show the IP Address display the RemoteContext appended to the device,
device hostname, interface or interface display name. The same RemoteContext is also specified in the /<remote_ping_collector_svc>/conf/application.conf file on
remote host.
Ping overview
The Ping overview dashboard gives you a summary of information about the health of the selected devices. It displays the total, reachable, and unreachable devices
and their ping metrics in worst order.
Device overview
The Device overview dashboard gives the summary of the managed devices response to a ping utility as currently reachable or not, the percentage of reachability,
and the number of packets that make the complete round trip within a specific number of milliseconds.
Device ping details
The Device ping details dashboard provides the ICMP ping metric details and trends of a selected device or a device in context from either Ping overview and Device
overview.
Related information
Ping Collector
Managing ICMP Ping profiles
IBM Telco Network Cloud Manager - Performance 1.4.5 379

Ping overview
The Ping overview dashboard gives you a summary of information about the health of the selected devices. It displays the total, reachable, and unreachable devices and
their ping metrics in worst order.
The following metrics are collected and stored in the Timeseries database in Telco Network Cloud Manager - Performance.
ICMP.Ping.Status, 0 (Failure), 100 (Success)
ICMP.Ping.Response.Time.ms, metric in milliseconds
ICMP.Ping.Packet.Loss.Percent, percentage of packet loss, which is determined by sending multiple ping requests and tallying up the lost packets. (Min 0%,
Max 100%)
Available widgets and their interactivity
Ping overview
1. Click Infra > Ping > Ping overview.
This dashboard displays the real-time ping status of the devices in your network. Worst N device ranking in terms of reachability, response time, and packet loss.
2. From the filter options, choose the Group, Worst N, and Time period.
Group filter is applicable if you select the Resource groups from the Ping profiles configuration page. You can select the Resource group to monitor the
devices and their interfaces. Select ALL to include all Resource groups.
From the Worst N filter, select number of worst performing devices in your network in an descending order.
From the Time period filter, select any of the following periods.
Last hour
Last 6 hours
Last 12 hours
Last 24 hours
Last 7 days
Last 30 days
Last 365 days
Custom
You can select the filter values or time ranges that you want to display in dashboards to which the filter is assigned. For more information, see Generic functions of
Telco Network Cloud Manager - Performance Dashboards.
3. Click Apply Filter.
The dashboard refreshes the data according to the filter attribute values.
Table 1. Widget interactions
Controller widgets Listener dashboard Drill-down dashboard
Current Ping Status
Total Devices N/A Device overview
Reachable Devices N/A
Unreachable Devices N/A
Worst Devices Reachability Device ping details N/A
Worst Response Time Device ping details N/A
Worst Packet Loss Device ping details N/A
Table 2. Available widgets
Widget name Chart type Description
Total Devices Badge Total number of discovered devices in your network for which the Ping profile is configured.
Reachable
Devices
Badge Telco Network Cloud Manager - Performance sends an ICMP ping to the managed devices (every 300 seconds by default). Devices
that respond are considered reachable.
Unreachable
Devices
Badge Telco Network Cloud Manager - Performance sends an ICMP ping to the managed devices (every 300 seconds by default). Devices
that do not respond after the set number of retries are considered unreachable.
Note: All these badge values are based on the current ping status irrespective of selected time period.
Worst Devices
Reachability
Grid Device reachability ranking of the selected devices based on the Worst N filter in ascending order. It is displayed in percentage.
Worst Response
Time
Grid Response time is the average time in milliseconds. Response time ranking of the selected devices based on the Worst N filter in
descending order. Response time is the time in milliseconds between a ping utility that sends a request to a device and receiving a
response. It is the sum of round-trip latency and service time.
Worst Packet
Loss
Grid Packet loss ranking of the selected devices based on the Worst N filter in descending order. The lost packets of data not reaching
their destination after it is transmitted across a network that is measure in percentage.
Device overview
The Device overview dashboard gives the summary of the managed devices response to a ping utility as currently reachable or not, the percentage of reachability, and the
number of packets that make the complete round trip within a specific number of milliseconds.
380 IBM Telco Network Cloud Manager - Performance 1.4.5

The primary usage of the ICMP Ping dashboards is to continuously monitor the devices and interfaces in your network. The built-in Ping utility sends ICMP packets to a
target device, interface, or to a group of Resource types to measure device reachability as ping status, response time, and packet loss.
Device overview
1. Click Infra > Ping > Device overview.
This dashboard displays the real-time ping status, which is the last ping status and also the Reachability % of the devices in your network along with other ICMP
ping metrics.
Or
2. Click any of the badge widgets in the Ping overview dashboard to launch the Device overview dashboard contextually as listener widget.
3. From the filter options, choose the Group, Ping status, and Time period.
Group filter is applicable if you select the Resource groups from the Ping profiles configuration page. You can select the Resource group to monitor the
devices and their interfaces. Select ALL to include all the Resource groups.
From the Ping status filter, select ALL to view all the managed devices in your network. Select Reachable to view all the devices that have the last ping status
as 100%. Select Unreachable to view all the devices that have the last ping status as 0%.
From the Time period filter, select any of the following periods.
Last hour
Last 6 hours
Last 12 hours
Last 24 hours
Last 7 days
Last 30 days
Last 365 days
Custom
You can select the filter values or time ranges that you want to display in dashboards to which the filter is assigned. For more information, see Generic functions of
Telco Network Cloud Manager - Performance Dashboards.
4. Click Apply Filter.
The dashboard refreshes the data according to the filter attribute values.
Table 1. Widget interactions
Controller widgets Listener widgets Drill-down widgets
Devices Device ping details N/A
Table 2. Available widgets
Widget name Chart type Description
Devices Grid This widget displays the following metrics:
Reachability %
The reachability status indicates whether Telco Network Cloud Manager - Performance can reach device and the maximum
value is 100%. Typically, ICMP (ping testing) is used to communicate regularly with the target device. Any communication
failures, including the loss of the network path or routing, affect the reachability statistics. If a device is not reachable, then a
value of 0% is returned.
Response Time (ms)
Response time is the time that is taken for each packet exchange between the ping utility and the host server. It is the
average reaction time of your connection, how fast you get a response after a request is sent.
Packet Loss (%)
Packet loss is when the data that is sent from one managed device to another fails to arrive. It can occur for various reasons.
Current Ping Status
It is the last value irrespective of Time period selection, the value of which is 0 or 100.
Note: When the resource is not reachable at all during the entire selected time period and periods where it doesn't receive
any response, the Response Time (ms) metric is shown as null.
IBM Telco Network Cloud Manager - Performance 1.4.5 381

Device ping details
The Device ping details dashboard provides the ICMP ping metric details and trends of a selected device or a device in context from either Ping overview and Device
overview.
You can further drill down to a specific interface of the device and launch the Interface ping details.
Device ping details
Click Infra > Ping > Device ping details.
This dashboard displays the real-time ping status, which is the last ping status and also the Reachability % of the devices in your network along with other ICMP
ping metrics.
From the filter options, choose the Device and Time period.
From the Device filter, select a specific device to view all the interfaces and the ICMP metric trends that are associated with the device.
From the Time period filter, select any of the following periods.
Last hour
Last 6 hours
Last 12 hours
Last 24 hours
Last 7 days
Last 30 days
Last 365 days
Custom
You can select the filter values or time ranges that you want to display in dashboards to which the filter is assigned. For more information, see Generic functions of
Telco Network Cloud Manager - Performance Dashboards.
Click Apply Filter.
The dashboard refreshes the data according to the filter attribute values.
Table 1. Widget interactions
Controller widgets Listener widgets Drill-down widgets
Device Ping Details N/A N/A
Device Interfaces Interface ping details N/A
Reachability (%) Trend N/A N/A
Response Time (ms) Trend N/A N/A
Packet Loss (%) Trend N/A N/A
Table 2. Available widgets
Widget name Chart type Description
Device Ping Details Grid Provides the ping details of the specific device in context. Displays all the three ICMP ping metrics along with the following
properties in a grid:
Hostname
IP Address
Vendor
Current Ping Status
Note: When the resource is not reachable at all during the entire selected time period and periods where it doesn't receive any
response, the Response Time (ms) metric is shown as null.
Device Interfaces Grid Displays all the interface names, interface index, and the ping metrics that are associated with the interfaces in context.
Important: Click any interface to drill down to the Interface ping details dashboard.
Note: When the resource is not reachable at all during the entire selected time period and periods where it doesn't receive any
response, the Response Time (ms) metric is shown as null.
Trend for Device: <Device name>
Reachability (%)
Trend
Timeseries Displays the Reachability trend in percentage for the device in context over the selected time period.
Response Time
(ms) Trend
Timeseries Displays the Response time trend in milliseconds for the device in context over the selected time period.
Packet Loss (%)
Trend
Timeseries Displays the Packet loss trend in percentage for the device in context over the selected time period.
Interface ping details
The Interface ping details is a listener dashboard for the Device ping details that shows the interface-level ICMP ping metrics. It helps you to identify the specific
interface that is not responding sufficiently to the ICMP pings.
Interface ping details
The Interface ping details is a listener dashboard for the Device ping details that shows the interface-level ICMP ping metrics. It helps you to identify the specific interface
that is not responding sufficiently to the ICMP pings.
Interface ping details
382 IBM Telco Network Cloud Manager - Performance 1.4.5

Click Infra > Ping > Device ping details > Interface ping details.
From the Time period filter, select any of the following periods.
Last hour
Last 6 hours
Last 12 hours
Last 24 hours
Last 7 days
Last 30 days
Last 365 days
Custom
You can select the filter values or time ranges that you want to display in dashboards to which the filter is assigned. For more information, see Generic functions of
Telco Network Cloud Manager - Performance Dashboards.
Click Apply Filter.
The dashboard refreshes the data according to the filter attribute values.
Table 1. Widget interactions
Controller widgets Listener widgets Drill-down widgets
Interface Ping Details N/A N/A
Reachability (%) Trend N/A N/A
Response Time (ms) Trend N/A N/A
Packet Loss (%) Trend N/A N/A
Table 2. Available widgets
Widget name Chart type Description
Interface Ping
Details
Grid Displays the interface name, interface index, and the ping metrics that are associated with the interface in context.
Note: When the resource is not reachable at all during the entire selected time period and periods where it doesn't receive any
response, the Response Time (ms) metric is shown as null.
Reachability (%)
Trend
Timeseries Displays the Reachability trend in percentage for the interface in context over the selected time period.
Response Time
(ms) Trend
Timeseries Displays the Response time trend in milliseconds for the interface in context over the selected time period.
Packet Loss (%)
Trend
Timeseries Displays the Packet loss trend in percentage for the interface in context over the selected time period.
Performance alarm overview
Use Performance alarm overview dashboard to monitor the performance alarms that are raised by Telco Network Cloud Manager - Performance.
Static thresholding is user-defined static values at specific intervals, which analyze data and generate events when a violation occurs for anomaly detection. Performance
alarm overview dashboard provides an overview of the total performance alarms and its details.
Available widgets and their interactivity
The diagram shows the master-listener, and drill-down interactions between the available widgets:
Performance alarm overview
1. Click Network > Performance alarm overview.
The Performance alarm overview dashboard loads. It displays all the performance alarms that are raised by Telco Network Cloud Manager - Performance.
2. From the filter options, choose the Group, and Time period.
You can select the filter values or time that you want to display in dashboards to which the filter is assigned. For more information, see Generic functions of Telco
Network Cloud Manager - Performance Dashboards.
3. Click Apply Filter.
The Performance alarm overview dashboard provides an overview of the performance alarm data.
You can see the performance alarm data that is triggered by Telco Network Cloud Manager - Performance from the severity badge widgets and the alarm details grid
widget.
IBM Telco Network Cloud Manager - Performance 1.4.5 383

Table 1. Widget interactions
Controller widgets Listener widgets
Total N/A
Critical Alarm Details
Major
Minor
Warning
Clear
Table 2. Available widgets
Widget name Chart type Description
Total Badge Displays the total number of performance alarms that is triggered by Telco Network Cloud Manager - Performance.
Critical Badge Displays the total number of critical performance alarms that is triggered by Telco Network Cloud Manager - Performance.
Major Badge Displays the total number of major performance alarms that is triggered by Telco Network Cloud Manager - Performance
Minor Badge Displays the total number of minor performance alarms that is triggered by Telco Network Cloud Manager - Performance
Warning Badge Displays the total number of warning performance alarms that is triggered by Telco Network Cloud Manager - Performance
Clear Badge Displays the total number of performance alarms that is cleared by the event management systems.
Alarm Details Grid A dynamic grid that displays the alarm details for the selected performance alarm from the severity badge widget.
The alarm details information is displayed in the grid widget are as follows:
Tag - a unique tag name that represents a specific domain or group.
Node - Display the server node that the alarm is triggered from.
Instance - Displays the resource name that the alarm is triggered for.
Metric - Displays the metric name that the alarm is triggered for.
Limit Type - Displays the threshold limit type, Over, Under, or Band.
Limit - Displays the threshold limit value before a violation is triggered.
Value - Displays the threshold limit value.
Summary - Displays the threshold description.
First Occurrence - Display the timestamp of the first occurrence or the alarm.
You can set the filter condition:
Click the filter icon
( ).
The Filter pop-up window loads.
Set the conditions from the Filter pop-up window and click Filter
The list refreshes according to the filter conditions set.
4. Click the identified alarm data from the Alarm Details dynamic grid to drill down.
The Metric viewer history : <Node> - <Instance_name> page loads in a new tab. It displays the selected alarm data for the predefined time range of historical data.
Table 3. Historical Data widgets
Widget name Chart type Description
Last 24 Hours Timeseries Displays the alarm metric timeseries data for the selected node and instance for the last 24 hours from the current time.
Last 7 Days Timeseries Displays the alarm metric timeseries data for the selected node and instance for the last 7 days from the current time.
Last 30 Days Timeseries Displays the alarm metric timeseries data for the selected node and instance for the last 30 days from the current time.
Last 365 Days Timeseries Displays the alarm metric timeseries data for the selected node and instance for the last 365 days from the current time.
Metric viewer dashboard
Metric viewer dashboard displays the collected performance metrics that are stored in the Telco Network Cloud Manager - Performance database. You can monitor the
new device types and vendors that are on boarded into your network immediately.
384 IBM Telco Network Cloud Manager - Performance 1.4.5

Metric Viewer is a general-purpose dashboard. You have the flexibility to view any metric in the system for early data flow verification, device monitoring, and comparison
analysis.
You can populate any metric of interest that is stored in the timeseries database, and monitor the resource and historical trending for a specific resource type.
Note: Metric Viewer dashboard is created in React JS script.
Metric viewer
1. Click the All Metrics View link from the Metric Threshold Violation dashboard.
The Metric viewer dashboard loads in a new tab as the previous dashboard.
2. Or, click Network > Metric viewer
The Metric viewer dashboard loads.
3. From the filter pane, select the following options:
Filter Description
Resource type Select ALL to select all resource types. Or select a specific resource type or group for which you want to display the instances and
metrics.
Compare by
Metrics Use this option to select the metrics associated with a selected Resource instance.
Note: You can select up to five metrics for a Resource instance.
Resource instances Use this option to select a metric and the Resource instances, which are associated with the selected metric.
Note: You can select up to five Resource instances for a metric.
Time period Select a time period for the display. You have the following options:
Last Hour
Last 6 Hours
Last 12 Hours
Last 24 Hours
Last 7 Days
Last 30 Days
Last 365 Days
Custom
Apply Apply your selections from the filters. Widget-level filters appear in the layout area.
Clear the layout Click to clear the existing widgets in the layout.
Add a widget (maximum
30)
You can add a maximum of 30 widgets to the layout. Each widget can be used to display different metrics from different Resource type
instances.
Widget time filter Click to display the time filter on the widgets.
Show all chart filters Click to display all other filters on the widgets.
Show display name Click to show the display name along with the instance ID of the Resource instances from the Select a Resource instance list.
4. Click Apply to the widget with metric data.
Compare by metrics
Note:
The time zone that is displayed on the Metric Threshold Violation dashboard banner is local browser time zone.
On the Metric Threshold Violation, the first and last occurrences of alarms are shown in local browser time zone.
On the Event Viewer, first and last occurrences of alarms are shown in GMT time zone.
5. Hover over a data point on the line chart to see the details of the metric.
6. Click the Select a threshold profile ( ) to display the threshold profiles defined for the selected metrics. Click Clear threshold to remove the threshold
baselines.
Severity of the threshold violations for the metric is displayed in the legend. Legend is customizable.
From the Threshold Profile filter, profile name is auto-populated with the configured profile for the metric that is in the Metric Threshold Violation dashboard.
Note: If you launch this dashboard from the menu Network > Metric viewer, then you can select the profile for the metric that you want to display.
IBM Telco Network Cloud Manager - Performance 1.4.5 385

7. Use the zoom bar to zoom in and zoom out to a specific area in the chart for closer look at the data. You can drag the sliders to automatically zoom to the selected
items, without marking them.
8. Click the Change chart type ( ) icon to change the chart type in the widget.
9. Click the Hide filter ( ) to hide the filter pane.
10. Click the Export ( ) icon to export dashboard with the existing content to the following options:
PDF
JSON
CSV
Excel
All
Click All to export the content to all formats and a .zip file is created that can be downloaded and extracted.
11. Click the Import ( ) icon and click Add file to browse and select a JSON file that can be imported to the dashboard.
The data from the JSON file is populated in to the dashboard.
Mobile Access and Core dashboards
Use the Mobile Access and Core dashboards to monitor the health and utilization of the mobile networks, based on the metrics and trends monitoring.
Mobile Access dashboards
The following diagram shows the available Mobile Access dashboards.
Mobile Core dashboard
The following diagram shows the available Mobile Core dashboard.
The Mobile Access and Core dashboards are based on the following key components:
Accessibility
The Mobile Access dashboards widgets populate the important accessibility performance indicator of the mobile access networks, based on 2G, 3G, 4G, and 5G
technology.
The Mobile Core dashboard widgets populate the important accessibility performance indicator of the mobile core networks.
Retainability
The Mobile Access dashboards widgets populate the retainability percentage of the mobile access networks, based on 2G, 3G, 4G, and 5G technology.
The Mobile Core dashboard widgets populate the retainability percentage of the mobile core networks.
Usage
With CS Access dashboards, you can monitor the 2G TCH Attempts and TCH Traffic usage trend and 3G RAB Attempts and Voice Traffic usage trend for the last day
at a selected regional level.
With PS Access dashboards, you can monitor the 4G and 5G uplink and downlink usage trend for the last day at a selected regional level.
With Mobile Core dashboard, you can monitor the traffic and subscribers trend for the last day at a selected regional level.
Circuit switch access dashboards
Circuit switch access dashboards.
Packet switch access dashboards
Packet switch access dashboards.
Circuit switch core dashboards
Circuit switch core dashboards.
386 IBM Telco Network Cloud Manager - Performance 1.4.5

Circuit switch access dashboards
Circuit switch access dashboards.
The Mobile Circuit switch access dashboard displays the metrics based on the following key components:
Accessibility
The Mobile Circuit switch access dashboard widgets populate the availability and accessibility of the mobile access networks, based on 2G, and 3G technology. The
Accessibility displays the current time values for the Access network connectivity metrics at a selected regional level.
Retainability
The Mobile Circuit switch access dashboard widgets populate the retainability percentage of the mobile access networks, based on 2G, and 3G technology. The
retainability section displays the current time values for the retainability and mobility metrics at a selected regional level.
Usage
The usage line charts display data for 2G TCH Attempt and TCH Traffic and 3G RAB Attempt and Voice Traffic usage for the last day at a selected regional level.
Available widgets and their interactivity
The diagram shows the interactions between the available widgets in Circuit switch access dashboard:
Circuit switch access
1. Click Mobile > Access > Circuit switch access.
2. You can filter data based on Region.
The list contains the region to view the health and utilization of the mobile access networks.
3. Click Apply Filter.
You can select the filter values or time that you want to display in dashboards to which the filter is assigned. For more information, see Generic functions of Telco
Network Cloud Manager - Performance Dashboards.
The Circuit switch access dashboard refreshes the data based on the region selected.
Table 1. Available widgets
Widget component Widget name Chart type Description
Accessibility 2G TCH Availability Badge Displays the percentage of the TCH Availability.
The badge color depicts the availability threshold in percentage (%):
Green - More than 95%
Yellow - Between 90% to 95%
Red - Less than 90%
Call Setup Success Rate Badge Displays the percentage of the Call Setup Success Rate.
The badge color depicts the success rate threshold in percentage (%):
Green - More than 95%
Yellow - Between 90% to 95%
Red - Less than 90%
TCH Blocking Rate Badge Displays the percentage of the TCH Congestion Rate.
The badge color depicts the congestion threshold in percentage (%):
Green - Less than 5%
Yellow - Between 5% to 10%
Red - More than 10%
IBM Telco Network Cloud Manager - Performance 1.4.5 387

Widget component Widget name Chart type Description
Accessibility 3G Availability Badge Displays the cumulative cell availability value.
The badge color depicts the availability threshold in percentage (%):
Green - More than 95%
Yellow - Between 90% to 95%
Red - Less than 90%
RAB Success Rate Badge Displays the percentage of the RAB Success Rate.
The badge color depicts the success rate threshold in percentage (%):
Green - More than 95%
Yellow - Between 90% to 95%
Red - Less than 90%
Call Setup Success Rate Badge Displays the percentage of the Call Setup Success Rate.
The badge color depicts the success rate threshold in percentage (%):
Green - More than 95%
Yellow - Between 90% to 95%
Red - Less than 90%
Retainability 2G Call Drop Rate Badge Displays the percentage of the Call Drop Rate.
The badge color depicts the drop rate threshold in percentage (%):
Green - Less than 5%
Yellow - Between 5% to 10%
Red - More than 10%
Outgoing HO Success Rate Badge Displays the percentage of the Outgoing Handover Success Rate.
The badge color depicts the success rate threshold in percentage (%):
Green - More than 95%
Yellow - Between 90% to 95%
Red - Less than 90%
Incoming HO Success Rate Badge Displays the percentage of the Incoming Handover Success Rate.
The badge color depicts the success rate threshold in percentage (%):
Green - More than 95%
Yellow - Between 90% to 95%
Red - Less than 90%
Retainability 3G Call Drop Rate Badge Displays the percentage of the Call Drop Rate.
The badge color depicts the drop rate threshold in percentage (%):
Green - Less than 5%
Yellow - Between 5% to 10%
Red - More than 10%
Soft HO Success Rate Badge Displays the percentage of the Soft Handover Success Rate.
The badge color depicts the success rate threshold in percentage (%):
Green - More than 95%
Yellow - Between 90% to 95%
Red - Less than 90%
Inter RAT HO Success Rate Badge Displays the percentage of the Inter-RAT Handover Success Rate.
The badge color depicts the success rate threshold in percentage (%):
Green - More than 95%
Yellow - Between 90% to 95%
Red - Less than 90%
Usage Usage 2G Timeseries Displays the 2G usage traffic utilization for the last day of the selected region.
Usage 3G Timeseries Displays the 3G usage traffic utilization for the last day of the selected region.
Drill-down dashboards
The overview is at Region level, spatial aggregation of metrics for BSC and RNC resource types. These dashboards are the second-level dashboards. When you click the
badge widgets, you can see the following dashboards:
Dashboard name Widget name Widget type Description
388 IBM Telco Network Cloud Manager - Performance 1.4.5

Dashboard name Widget name Widget type Description
CS Access - 2G Cell: Latest Hourly
Data
Worst 10 cells by TCH Availability (%)
Worst 10 cells by Call Setup Success Rate
(%)
Worst 10 cells by TCH Blocking Rate (%)
Worst 10 cells by Call Drop Rate (%)
Worst 10 cells by Outgoing HO Success Rate
(%)
Worst 10 cells by Incoming HO Success Rate
(%)
Grid Worst 10 Cells with the lowest values for the following BSC
resource type metrics:
TCH Availability (%)
Call Setup Success Rate (%)
TCH Blocking Rate (%)
Call Drop Rate (%)
Outgoing HO Success Rate (%)
Incoming HO Success Rate (%)
CS Access - 3G utranCell: Latest
Hourly Data
Worst 10 utranCells by 3G Availability (%)
Worst 10 utranCells by 3G RAB Establish
Success Rate (%)
Worst 10 utranCells by 3G Call Setup
Success Rate (%)
Worst 10 utranCells by 3G Call Drop Rate
(%)
Worst 10 utranCells by 3G InterRAT HO
Success Rate (%)
Worst 10 utranCells by Soft HO Success
Rate (%)
Grid Worst 10 Cells with the lowest values for the following RNC
resource type metrics:
Availability (%)
RAB Establish Success Rate (%)
Call Setup Success Rate (%)
Call Drop Rate (%)
InterRAT HO Success Rate (%)
Soft HO Success Rate (%)
Metric Viewer History dashboards
Click a resource type in the second-level dashboards to drill down to display the details of a specific metric over the following periods:
Last Day
Last Week
Last Month
Last Year
Packet switch access dashboards
Packet switch access dashboards.
The Mobile Packet switch access dashboard displays the metrics based on the following key components:
Accessibility
The Mobile Packet switch access dashboard widgets populate the availability and accessibility of the mobile access networks, based on 2G, 3G, 4G, and 5G
technology. The Accessibility displays the current time values for the Access network connectivity metrics at a selected regional level.
Retainability
The Mobile Packet switch access dashboard widgets populate the retainability percentage of the mobile access networks, based on 2G, 3G, 4G, and 5G technology.
The retainability displays the current time values for the retainability and mobility metrics at a selected regional level.
Usage
The Mobile Packet switch access dashboard widgets populate the traffic throughput and volume usage trend for the last day at a selected regional level.
Available widgets and their interactivity
The diagram shows the interactions between the available widgets in Packet switch access dashboard:
IBM Telco Network Cloud Manager - Performance 1.4.5 389

Packet switch access
1. Click Mobile > Access > Packet switch access.
2. You can filter data based on Region.
The list contains the region to view the health and utilization of the mobile access networks.
3. Click Apply Filter.
You can select the filter values or time that you want to display in dashboards to which the filter is assigned.
The Packet switch access dashboard refreshes the data based on the region selected.
Table 1. Available widgets
Widget
component Widget name Chart type Description
Accessibility 2G TCH Availability Badge Displays the percentage of the TCH Availability.
The badge color depicts the availability threshold in percentage (%):
Green - More than 95%
Yellow - Between 90% to 95%
Red - Less than 90%
TBF DL Success Rate Badge Displays the percentage of the Downlink Temporary Block Flow Success Rate.
The badge color depicts the success rate threshold in percentage (%):
Green - More than 95%
Yellow - Between 90% to 95%
Red - Less than 90%
PDCH Congestion Rate Badge Displays the percentage of the PDCH Congestion Rate.
The badge color depicts the congestion threshold in percentage (%):
Green - Less than 5%
Yellow - Between 5% to 10%
Red - More than 10%
Accessibility 3G Availability Badge Displays the cumulative cell availability value.
The badge color depicts the availability threshold in percentage (%):
Green - More than 95%
Yellow - Between 90% to 95%
Red - Less than 90%
390 IBM Telco Network Cloud Manager - Performance 1.4.5

Widget
component Widget name Chart type Description
RRC Establish Success Rate Badge Displays the percentage of the RRC Establish Success Rate.
The badge color depicts the success rate threshold in percentage (%):
Green - More than 95%
Yellow - Between 90% to 95%
Red - Less than 90%
RAB Establish Success Rate Badge Displays the percentage of the RAB Establish Success Rate.
The badge color depicts the success rate threshold in percentage (%):
Green - More than 95%
Yellow - Between 90% to 95%
Red - Less than 90%
Accessibility 4G Availability Badge Displays the cumulative cell availability value.
The badge color depicts the availability threshold in percentage (%):
Green - More than 95%
Yellow - Between 90% to 95%
Red - Less than 90%
RRC Establish Success Rate Badge Displays the percentage of the RRC Establish Success Rate.
The badge color depicts the success rate threshold in percentage (%):
Green - More than 95%
Yellow - Between 90% to 95%
Red - Less than 90%
ERAB Establish Success Rate Badge Displays the percentage of the ERAB Establish Success Rate.
The badge color depicts the success rate threshold in percentage (%):
Green - More than 95%
Yellow - Between 90% to 95%
Red - Less than 90%
Accessibility 5G Availability Badge Displays the cumulative cell availability value.
The badge color depicts the availability threshold in percentage (%):
Green - More than 95%
Yellow - Between 90% to 95%
Red - Less than 90%
RRC Establish Success Rate Badge Displays the percentage of the RRC Establish Success Rate.
The badge color depicts the success rate threshold in percentage (%):
Green - More than 95%
Yellow - Between 90% to 95%
Red - Less than 90%
Call Setup Success Rate Badge Displays the percentage of the Call Setup Success Rate.
The badge color depicts the success rate threshold in percentage (%):
Green - More than 95%
Yellow - Between 90% to 95%
Red - Less than 90%
Retainability 3G Call Drop Rate Badge Displays the percentage of the Call Drop Rate.
The badge color depicts the call drop rate threshold in percentage (%):
Green - Less than 5%
Yellow - Between 5% to 10%
Red - More than 10%
InterRAT HO Success Rate Badge Displays the percentage of the Inter-RAT Handover Success Rate.
The badge color depicts the success rate threshold in percentage (%):
Green - More than 95%
Yellow - Between 90% to 95%
Red - Less than 90%
HSPA Drop Rate Badge Displays the percentage of the HSPA Drop Rate.
The badge color depicts the drop rate threshold in percentage (%):
Green - Less than 5%
Yellow - Between 5% to 10%
Red - More than 10%
IBM Telco Network Cloud Manager - Performance 1.4.5 391

Widget
component Widget name Chart type Description
Retainability 4G ERAB Abnormal Release Rate Badge Displays the percentage of the ERAB Drop Rate.
The badge color depicts the drop rate threshold in percentage (%):
Green - Less than 5%
Yellow - Between 5% to 10%
Red - More than 10%
Mobility Success Rate Badge Displays the percentage of the Mobility Success Rate.
The badge color depicts the success rate threshold in percentage (%):
Green - More than 95%
Yellow - Between 90% to 95%
Red - Less than 90%
Retainability 5G IntraRAT Incoming HO Success
Rate
Badge Displays the percentage of the Intra-RAT Incoming Handover Success Rate.
The badge color depicts the success rate threshold in percentage (%):
Green - More than 95%
Yellow - Between 90% to 95%
Red - Less than 90%
InterRAT Outgoing HO Success
Rate
Badge Displays the percentage of the Inter-RAT Outgoing Handover Success Rate.
The badge color depicts the success rate threshold in percentage (%):
Green - More than 95%
Yellow - Between 90% to 95%
Red - Less than 90%
Usage Uplink 4G Timeseries Displays the 4G uplink traffic throughput and volume usage trend for the last day at a selected
regional level.
Downlink 4G Timeseries Displays the 4G downlink traffic throughput and volume usage trend for the last day at a selected
regional level.
Uplink 5G Timeseries Displays the 5G uplink traffic throughput and volume usage trend for the last day at a selected
regional level.
Downlink 5G Timeseries Displays the 5G downlink traffic throughput and volume usage trend for the last day at a selected
regional level.
Drill-down dashboards
The overview is at Region level, spatial aggregation of metrics for specific resource types. These dashboards are the second-level dashboards. When you click the badge
widgets, you can see the following dashboards:
Dashboard name Widget name Widget type Description
PS Access - 2G cell: Latest
Hourly Data
Worst 10 cells by 2G TCH Availability (%)
Worst 10 cells by 2G TBF DL Success Rate (%)
Worst 10 cells by 2G PDCH Congestion Rate
(%)
Grid Worst 10 Cells with the lowest values for the following
metrics:
TCH Availability
TBF DL Success Rate (%)
PDCH Congestion Rate (%)
PS Access - 3G utranCell: Latest
Hourly Data
Worst 10 utranCells by 3G Availability (%)
Worst 10 utranCells by 3G RRC Establish
Success Rate (%)
Worst 10 utranCells by 3G RAB Establish
Success Rate (%)
Worst 10 utranCells by 3G Call Drop Rate (%)
Worst 10 utranCells by 3G InterRAT HO
Success Rate (%)
Worst 10 utranCells by 3G HSPA Drop Rate
(%)
Grid Worst 10 Cells with the lowest values for the following RNC
resource type metrics:
RRC Establish Success Rate (%)
RAB Establish Success Rate (%)
Call Drop Rate (%)
InterRAT HO Success Rate (%)
HSPA Drop Rate (%)
PS Access - 4G eUtranCell:
Latest Hourly Data
Worst 10 eUtranCells by 4G Availability (%)
Worst 10 eUtranCells by 4G RRC Establish
Success Rate (%)
Worst 10 eUtranCells by 4G ERAB Establish
Success Rate (%)
Worst 10 eUtranCells by 4G ERAB Abnormal
Release Rate (%)
Worst 10 eUtranCells by 4G Mobility Success
Rate (%)
Grid Worst 10 Cells with the lowest values for the following
eNodeBfunction resource type metrics:
Availability (%)
RRC Establish Success Rate (%)
ERAB Establish Success Rate (%)
ERAB Abnormal Release Rate (%)
Mobility Success Rate (%)
392 IBM Telco Network Cloud Manager - Performance 1.4.5

Dashboard name Widget name Widget type Description
PS Access - 5G nUtranCell:
Latest Hourly Data
Worst 10 nUtranCells by 5G Availability (%)
Worst 10 nUtranCells by 5G RRC Establish
Success Rate (%)
Worst 10 nUtranCells by 5G Call Setup
Success Rate (%)
Worst 10 nUtranCells by 5G IntraRAT
Incoming HO Success Rate (%)
Worst 10 nUtranCells by 5G InterRAT
Outgoing HO Success Rate (%)
Grid Worst 10 Cells with the lowest values for the following
GNodeBfunction resource type metrics:
Availability (%)
RRC Establish Success Rate (%)
Call Setup Success Rate (%)
IntraRAT Incoming HO Success Rate (%)
InterRAT Outgoing HO Success Rate (%)
Metric Viewer History dashboards
Click a resource type in the second-level dashboards to drill down to display the details of a specific metric over the following periods:
Last Day
Last Week
Last Month
Last Year
Circuit switch core dashboards
Circuit switch core dashboards.
The Mobile Circuit switch core dashboard displays the metrics based on the following key components:
Accessibility
The Circuit switch core dashboard widgets populate the mobile core networks health metrics utilization at a selected region level.
Retainability
The Mobile Circuit switch core dashboard widgets populate the retainability percentage of the mobile access networks. The retainability displays the current time
values for the retainability and mobility metrics at a selected regional level.
Usage
The Mobile Circuit switch core dashboard widgets populate the traffic and subscribers usage trend at a selected regional level.
Available widgets and their interactivity
The diagram shows the interactions between the available widgets in Circuit switch core dashboard:
Circuit switch core
1. Click Mobile > Core > Circuit switch core.
2. You can filter data based on Region.
The list contains the region to view the health and utilization of the mobile access networks.
3. Click Apply Filter.
You can select the filter values or time that you want to display in dashboards to which the filter is assigned. For more information, see Generic functions of Telco
Network Cloud Manager - Performance Dashboards.
The Circuit switch core dashboard refreshes the data based on the region selected.
IBM Telco Network Cloud Manager - Performance 1.4.5 393

Table 1. Available widgets
Widget
component Widget name Chart type Description
Accessibility IMEI Check Success Rate Badge Displays the percentage of the IMEI Check Success Rate.
The badge color depicts the success rate threshold in percentage (%):
Green - More than 95%
Yellow - Between 90% to 95%
Red - Less than 90%
HLR Authentication Success Rate Badge Displays the percentage of the HLR Authentication Success Rate.
The badge color depicts the success rate threshold in percentage (%):
Green - More than 95%
Yellow - Between 90% to 95%
Red - Less than 90%
Call Setup Success Rate Badge Displays the percentage of the Call Setup Success Rate.
The badge color depicts the success rate threshold in percentage (%):
Green - More than 95%
Yellow - Between 90% to 95%
Red - Less than 90%
VOIP Seizure Success Rate Badge Displays the percentage of the VOIP Seizure Success Rate.
The badge color depicts the success rate threshold in percentage (%):
Green - More than 95%
Yellow - Between 90% to 95%
Red - Less than 90%
Paging Success Rate Badge Displays the percentage of the Paging Success Rate.
The badge color depicts the success rate threshold in percentage (%):
Green - More than 95%
Yellow - Between 90% to 95%
Red - Less than 90%
Location Update Success Rate Badge Displays the percentage of the Location Update Success Rate.
The badge color depicts the success rate threshold in percentage (%):
Green - More than 95%
Yellow - Between 90% to 95%
Red - Less than 90%
Accessibility LAC Signaling Operations Success Rate Badge Displays the percentage of the LAC Signaling Operations Success Rate.
The badge color depicts the success rate threshold in percentage (%):
Green - More than 95%
Yellow - Between 90% to 95%
Red - Less than 90%
Accessibility Send Routing Information Success
Rate
Badge Displays the percentage of the Sending Routing Information Success Rate.
The badge color depicts the success rate threshold in percentage (%):
Green - More than 95%
Yellow - Between 90% to 95%
Red - Less than 90%
Retainability Outgoing HO Success Rate Badge Displays the percentage of the Outgoing HO Success Rate.
The badge color depicts the success rate threshold in percentage (%):
Green - More than 95%
Yellow - Between 90% to 95%
Red - Less than 90%
Incoming HO Success Rate Badge Displays the percentage of the Incoming HO Success Rate.
The badge color depicts the success rate threshold in percentage (%):
Green - More than 95%
Yellow - Between 90% to 95%
Red - Less than 90%
IntraMSC HO Success Rate Badge Displays the percentage of the IntraMSC HO Success Rate.
The badge color depicts the success rate threshold in percentage (%):
Green - More than 95%
Yellow - Between 90% to 95%
Red - Less than 90%
394 IBM Telco Network Cloud Manager - Performance 1.4.5

Widget
component Widget name Chart type Description
IntraMSC WCDMA-GSM HO Success
Rate
Badge Displays the percentage of the IntraMSC WCDMA-GSM HO Success Rate.
The badge color depicts the success rate threshold in percentage (%):
Green - More than 95%
Yellow - Between 90% to 95%
Red - Less than 90%
InterMSC WCDMA-GSM HO Success
Rate
Badge Displays the percentage of the InterMSC WCDMA-GSM HO Success Rate.
The badge color depicts the success rate threshold in percentage (%):
Green - More than 95%
Yellow - Between 90% to 95%
Red - Less than 90%
Usage Traffic Timeseries Displays the voice traffic utilization and the call attempts for the last day of the selected
region.
The Time Zoom feature is available for this widget.
Subscribers Timeseries Displays the subscribers metrics utilization for the last day of the selected region.
The Time Zoom feature is available for this widget.
Drill-down dashboards
The overview is at Region level, spatial aggregation of metrics for the following resource types:
bsc
rnc
lZone
officeDirectionMSC
mgwPair
msc
lac
hoTypeMSC
gtpPeerEntityName
These dashboards are the second-level dashboards. When you click the badge widgets, you can see the following dashboards:
Dashboard name Widget name Widget type Description
CS Core - bsc and rnc: Latest
Hourly Data
Worst 10 BSCs by IMEI Check Success Rate (%)
Worst 10 RNCs by IMEI Check Success Rate (%)
Grid Worst 10 BSCs/RNCs with the lowest IMEI Check
Success Rate values
CS Core - gtpPeerEntityName:
Latest Hourly Data
Worst 10 gtpPeerEntityNames by InterMSC WCDMA-
GSM HO Success Rate (%)
Worst 10 gtpPeerEntityNames by IntraMSC WCDMA-
GSM HO Success Rate (%)
Grid Worst 10 gtpPeerEntityNames with the lowest
values for the following metrics: :
IntraMSC WCDMA-GSM HO Success Rate
InterMSC WCDMA-GSM HO Success Rate
CS Core - hoTypeMSC: Latest
Hourly Data
Worst 10 hoTypeMSCs by Outgoing HO Success Rate
(%)
Worst 10 hoTypeMSCs by Incoming HO Success Rate
(%)
Worst 10 hoTypeMSCs by IntraMSC HO Success Rate
(%)
Grid Worst 10 hoTypeMSCs with the lowest values for
the following metrics:
Outgoing HO Success Rate
Incoming HO Success Rate
IntraMSC HO Success Rate
CS Core - lac: Latest Hourly Data Worst 10 lacs by Location Update Success Rate (%)
Worst 10 lacs by LAC Signalling Operations Success
Rate (%)
Grid Worst 10 lacs with the lowest values for the
following metrics:
Location Update Success Rate
LAC Signaling Operations Success Rate
CS Core - lZone: Latest Hourly
Data
Worst 10 lZones by HLR Authentication Success Rate (%) Grid Worst 10 lZones with the lowest HLR
Authentication Success Rate values
CS Core - mgwPair: Latest Hourly
Data
Worst 10 mgwPairs by VOIP Seizure Success Rate (%) Grid Worst 10 mgwPairs with the lowest VOIP Seizure
Success Rate values
CS Core - msc: Latest Hourly Data Worst 10 mscs by Paging Success Rate (%)
Worst 10 mscs by Send Routing Information Success
Rate (%)
Grid Worst 10 mscs with the lowest values for the
following metrics:
Paging Success Rate
Send Routing Information Success Rate
CS Core - officeDirectionMSC:
Latest Hourly Data
Worst 10 officeDirectionMSCs by Call Setup Success Rate
(%)
Grid Worst 10 officeDirectionMSCs with the lowest Call
Setup Success Rate values
Metric Viewer History dashboards
Click a resource type in the second-level dashboards to drill down to display the details of a specific metric over the following periods:
Last Day
IBM Telco Network Cloud Manager - Performance 1.4.5 395

Last Week
Last Month
Last Year
IP links performance overview
The fundamental usage of IP links performance overview dashboard is for the network administrator to reduce the mean time that is taken to identify an event in a
network, its effects on the network and its root cause to efficiently manage the network performance.
The IP links performance is monitored through a heatmap, which provides an overall view of outbound one-way link performance for speech applications between a
source and destination server present at various geographical locations. The performance of IP links is affected by factors such as Latency, Jitter, and Packet Loss. These
three factors are defined as follows:
Latency: Latency is a measurement of delay of a message from source to destination. It is measured in milliseconds.
Jitter: Jitter is defined as the variation in arrival time of messages from source to destination. In other words, Jitter is a variation in latency. It is measured in
milliseconds.
Packet Loss: Packet loss is a percentage of packets that are lost for the packets sent.
This dashboard displays the Latency between the source and destination servers in a particular geographical area. Based on the Latency value, network administrator can
drill down to links that have highest Latency and can get more information about Jitter and Packet Loss between the servers.
Available widgets and their interactivity
The diagram shows the drill-down interactions between the available widgets in IP links performance overview dashboard:
IP links performance overview
1. Click Transport > IP > IP Links Performance Overview.
IP links performance overview dashboard displays IP Links performance data through Average Outbound One Way Latency for Speech Application Heat map chart
type to represent latency.
2. From the filter options, choose the Group and Time period and click Apply Filter.
The dashboard refreshes the data based on the filter values selected.
You can select the filter values or time that you want to display in dashboards to which the filter is assigned. For more information, see Generic functions of Telco
Network Cloud Manager - Performance Dashboards.
Average Outbound One Way Latency for Speech Application
IP links performance overview dashboard displays the data through a Heat map chart type to represent latency. A heat map is a graphical representation of data where the
individual values that are contained in a matrix are represented as colors.
The parameters of Heat map are as follows:
Rows: The rows of the map represent Source IP address.
Columns: The columns of the map represent Destination IP address.
Values: The color coded values of the map represent latency between the source and destination IP links. Click any value in the heat map to drill down to the
Source and Destination Details dashboard.
The standard ranges for Latency and the color that is associated to each range are given at the bottom of the heat map. These ranges are taken from ITU-T G.114
standards for one-way latency for speech applications.
The standard ranges are as follows:
Table 1. Recommended standard ranges for Latency in speech applications
Color Code Description
This color depicts that the Latency between source and destination IP links is 0 - 150 ms. The IP links are performing excellent with this
range of Latency.
This color depicts that the Latency between source and destination IP links is 151 - 237 ms. The IP links are performing well with this
range of Latency.
This color depicts that the Latency between source and destination IP links is in the range 237 - 337 ms. The IP links are performing
well with this range of Latency.
This color depicts that the Latency between source and destination IP links is in the range 338 - 500 ms. The IP links are performing fair
with this range of Latency.
This color depicts that the Latency between source and destination IP links is in the range 501 - 700 ms. The IP links are performing
poor with this range of Latency.
This color depicts that the Latency between source and destination IP links is greater than 700 ms. The IP links are performing very
poor with this range of Latency.
The values in the heat map, which are blank and do not come under any of the color codes depict that the data is not flowing and the communication between the
source and destination IP links is not available.
396 IBM Telco Network Cloud Manager - Performance 1.4.5

Source and destination details
This is a drill-down dashboard of IP links performance overview dashboard.
Source and destination details
This is a drill-down dashboard of IP links performance overview dashboard.
The latency, jitter and packet loss are interdependent in a way that when packet loss is more, user will experience more Latency and in turn the jitter value will get
affected, as there will be fluctuations in the latency.
Available widgets and their interactivity
The diagram shows the interactions between the available widgets in Source and destination details dashboard:
Source and destination details
1. From IP links performance overview dashboard, click any of the colored boxes from the Average Outbound One Way Latency for Speech Application heat map.
Note: When you hover over the colored boxes of the heat map, a tooltip is flashed giving you the details of the Latency between source and destination IP links.
2. From the filter options, choose the Source, Destination, and Time period .
You can select the filter values or time that you want to display in dashboards to which the filter is assigned.
3. Click Apply filter.
The dashboard refreshes the data based on the filter values selected.
Table 1. Available Widgets
Widget name Chart type Typical uses
Source-Destination: Source_IP-
Destination_IP
Badge Displays the IP addresses of the selected Source and Destination.
Maximum Latency
Outbound (ms)
Inbound (ms)
Badge Displays the Outbound and Inbound Latency in milliseconds for source and destination IP links.
Standard range for Outbound and Inbound Latency:
Green: 0-337 ms
Yellow: 338-700 ms
Red: Greater than 700 ms
Maximum Jitter
Outbound (ms)
Inbound (ms)
Badge Displays the Outbound and Inbound Jitter in milliseconds for source and destination IP links.
Standard range for Outbound and Inbound Jitter:
Green: 0-30 ms
Yellow: 31-40 ms
Red: Greater than 40 ms
Maximum Packet Loss
Outbound (%)
Inbound (%)
Badge Displays the Outbound and Inbound Packet Loss in percentage for source and destination IP
links.
Standard range for Outbound and Inbound Packet Loss:
Green: 0%-1%
Yellow: 1.01%-5%
Red: Greater than 5%
Latency, Jitter and Packet Loss Trend
Latency (ms)
Inbound
Outbound
Timeseries Displays the latency in milliseconds for source and destination IP links at a specific timestamps.
Jitter (ms)
Inbound
Outbound
Timeseries Displays the jitter in milliseconds for source and destination IP links at a specific timestamps.
Packet Loss (%)
Inbound
Outbound
Timeseries Displays the packet loss in percentage for source and destination IP links at a specific
timestamps.
GPON Optical Line Terminal (OLT) dashboards
GPON gives the user the ability to consolidate multiple services onto a single fiber transport network. This technology reduces costs and infrastructure and maintains the
increased bandwidth.
A GPON system consists of an optical line terminal (OLT) that connects several optical network terminals (ONTs) together by using a passive optical distribution network
(ODN). The GPON OLT dashboards provide a single view to monitor the OLTs, which include the uplink traffic that communicates with edge routers and switches and the
IBM Telco Network Cloud Manager - Performance 1.4.5 397

downstream direction that communicates with the ONTs.
The GPON OLT overview dashboard is based on the following key components:
System Health
System Health indicates the maximum CPU and Memory utilization at OLT level.
Traffic Monitoring (Uplink Interface)
Traffic monitoring of the uplink interface indicates the maximum incoming and outgoing traffic utilization at OLT level.
Traffic Monitoring (PON Port)
Traffic monitoring of the PON port indicates the maximum upstream and downstream traffic utilization at OLT level.
Optical Monitoring
Optical monitoring of the OLT indicates the maximum optical environmental health metrics at OLT level.
The following diagram shows the drill-down dashboards from GPON OLT overview dashboard.
GPON OLT overview
The fundamental usage of GPON OLT overview dashboard is to provision and maintain the GPON access network by ensuring early detection of optical equipment
and optical module degradation.
System health details
System Health indicates the maximum CPU and Memory utilization at OLT level.
Traffic monitoring (Uplink Interface) details
Traffic monitoring (PON Port) details
Optical monitoring details
GPON OLT overview
The fundamental usage of GPON OLT overview dashboard is to provision and maintain the GPON access network by ensuring early detection of optical equipment and
optical module degradation.
Available widgets and their interactivity
The diagram shows the drill-down interactions between the available widgets in GPON OLT overview dashboard:
GPON OLT overview
1. Click Transport > Optical > GPON OLT overview.
The GPON OLT Overview dashboard loads.
This dashboard displays the metrics values at OLT level, which include the uplink traffic that communicates with Edge routers and switches, as well as the
downstream direction that communicates with the ONTs.
2. From the filter options, choose the Group and Time period.
You can select the filter values or time ranges that you want to display in dashboards to which the filter is assigned. For more information, see Generic functions of
Telco Network Cloud Manager - Performance Dashboards.
3. Click Apply Filter.
The GPON OLT overview widgets load the data based on the filter values.
398 IBM Telco Network Cloud Manager - Performance 1.4.5

Refer to the following tables to understand the GPON OLT overview dashboard widgets and its interactions.
Table 1. Widget interactions
Controller widgets Drill-down dashboard
CPU Utilization System Health Details
Memory Utilization
Ethernet Incoming Utilization Traffic Monitoring (Uplink Interface) Details
Ethernet Outgoing Utilization
Upstream Utilization Traffic Monitoring (PON Port) Details
Downstream Utilization
Downstream Broadcast Utilization
Downstream Multicast Utilization
Downstream Unicast Utilization
Transmitted Optical Signal Optical Monitoring
Received Optical Signal
Laser Bias Current
Voltage
Temperature
Table 2. Available Widgets
Widget name Chart type Typical uses
CPU Utilization Badge Displays the percentage of the maximum CPU utilization at OLT level.
The badge color depicts the CPU utilization threshold in percentage (%):
Green - Less than 75%
Yellow - Between 75% to 85%
Red - More than 85%
Memory Utilization Badge Displays the percentage of the maximum Memory utilization at OLT level.
The badge color depicts the Memory utilization threshold in percentage (%):
Green - Less than 75%
Yellow - Between 75% to 85%
Red - More than 85%
Ethernet Incoming Utilization Badge Displays the percentage of the maximum incoming traffic utilization at OLT level.
The badge color depicts the incoming traffic utilization threshold in percentage (%):
Green - Less than 70%
Yellow - Between 70% to 80%
Red - More than 80%
Ethernet Outgoing Utilization Badge Displays the percentage of the maximum outgoing traffic utilization at OLT level.
The badge color depicts the outgoing traffic utilization threshold in percentage (%):
Green - Less than 70%
Yellow - Between 70% to 80%
Red - More than 80%
Upstream Utilization Badge Displays the percentage of the maximum upstream traffic utilization at OLT level.
The badge color depicts the upstream traffic utilization threshold in percentage (%):
Green - Less than 75%
Yellow - Between 75% to 85%
Red - More than 85%
Downstream Utilization Badge Displays the percentage of the maximum downstream traffic utilization at OLT level.
The badge color depicts the downstream traffic utilization threshold in percentage (%):
Green - Less than 75%
Yellow - Between 75% to 85%
Red - More than 85%
Downstream Broadcast Utilization Badge Displays the percentage of the maximum downstream broadcast traffic utilization at OLT level.
The badge color depicts the downstream broadcast traffic utilization threshold in percentage (%):
Green - Less than 75%
Yellow - Between 75% to 85%
Red - More than 85%
Downstream Multicast Utilization Badge Displays the percentage of the maximum downstream multicast traffic utilization at OLT level.
The badge color depicts the downstream multicast traffic utilization threshold in percentage (%):
Green - Less than 75%
Yellow - Between 75% to 85%
Red - More than 85%
Downstream Unicast Utilization Badge Displays the percentage of the maximum downstream unicast traffic utilization at OLT level.
The badge color depicts the downstream unicast traffic utilization threshold in percentage (%):
Green - Less than 75
Yellow - Between 75to 85
Red - More than 85
Transmitted Optical Signal Badge Displays the decibels (dBm) of the minimum transmitted optical signal at OLT level.
The badge color depicts the transmitted optical signal threshold in decibels (dBm):
Green - More than 3.0
Yellow - Between 2.0 to 3.0
Red - Less than 2.0 to -40.0
IBM Telco Network Cloud Manager - Performance 1.4.5 399

Widget name Chart type Typical uses
Received Optical Signal Badge Displays the decibels (dBm) of the minimum received optical signal at OLT level.
The badge color depicts the received optical signal threshold in decibels (dBm):
Green - More than 3.0
Yellow - Between 2.0 to 3.0
Red - Less than 2.0 to -40.0
Laser Bias Current Badge Displays the milliampere (mA) of the laser bias current at OLT level.
The badge color depicts the laser bias current threshold in milliampere (mA):
Green - 0 - 13.0
Yellow - Between 13.0 to 30.0
Red - More than 30.0
Voltage Badge Displays the maximum voltage (V) value at OLT level.
The badge color depicts the voltage threshold in volt (V):
Green - Between 0 - 10.0
Yellow - Between 10.0 to 15.0
Red - More than 15.0
Temperature Badge Displays the maximum temperature in Celsius at OLT level.
The badge color depicts the temperature threshold in Celsius:
Green - Between 20 - 30
Yellow - More than 30
Red - More than 70
System health details
System Health indicates the maximum CPU and Memory utilization at OLT level.
Available widgets and their interactivity
The diagram shows the interactions between the available widgets in System health details dashboard:
System health details
1. To access the System Health Details dashboard, click any one of the following badge widgets from the GPON OLT overview dashboard page:
CPU Utilization
Memory Utilization
The System health details dashboard loads.
2. From the filter options, choose the OLT, Top N, and Time period and click Apply Filter.
You can select the filter values or time ranges that you want to display in dashboards to which the filter is assigned. For more information, see Generic functions of
Telco Network Cloud Manager - Performance Dashboards.
The dashboard refreshes the data according to the filter attribute values.
Table 1. System health details Widgets
Widget Name Chart Type Description
System Health Summary Grid Displays the Card resources for the selected OLT.
Card
CPU Utilization (%)
Max CPU Utilization (%)
Memory Utilization (%)
Max Memory Utilization (%)
Card Details: <Card> Badge A dynamic badge chart that displays the selected Card resource.
The Card Details identifier is selected from the System Health Summary table.
CPU Utilization (%) Trend Timeseries A dynamic timeseries chart that displays the CPU Utilization (%) trend based on the selected Card resource.
Memory Utilization (%) Trend Timeseries A dynamic timeseries chart that displays the Memory Utilization (%) trend based on the selected Card resource.
Traffic monitoring (Uplink Interface) details
Available widgets and their interactivity
The diagram shows the interactions between the available widgets in Traffic monitoring (Uplink Interface) details dashboard:
400 IBM Telco Network Cloud Manager - Performance 1.4.5

Traffic monitoring (Uplink Interface) details
1. To access the Traffic monitoring (Uplink Interface) details dashboard, click any one of the following badge widgets from the GPON OLT overview dashboard page:
Ethernet Incoming Utilization
Ethernet Outgoing Utilization
The Traffic monitoring (Uplink Interface) details dashboard loads.
2. From the filter options, choose the OLT, Top N, and Time period and click Apply Filter.
You can select the filter values or time ranges that you want to display in dashboards to which the filter is assigned. For more information, see Generic functions of
Telco Network Cloud Manager - Performance Dashboards.
The dashboard refreshes the data according to the filter attribute values.
Table 1. Traffic monitoring (Uplink Interface) details Widgets
Widget Name Chart Type Description
Traffic Monitoring (Uplink Interface)
Summary
Grid Displays the Ethernet port list and its associated metrics for the selected OLT:
Ethernet Port
Incoming Utilization (%)
Max Incoming Utilization (%)
Outgoing Utilization (%)
Max Outgoing Utilization (%)
Incoming Throughput (bps)
Max Incoming Throughput (bps)
Outgoing Throughput (bps)
Max Outgoing Throughput (bps)
Incoming Packets
Max Incoming Packets
Outgoing Packets
Max Outgoing Packets
Ethernet Port Details: <Ethernet Port> Badge A dynamic badge chart that displays the selected Ethernet Port name.
The Ethernet Port Details identifier is selected from the Traffic Monitoring (Uplink Interface)
Summary table.
Incoming Utilization (%) Trend Timeseries Displays the Incoming Utilization (%) trend based on the selected Ethernet Port.
Outgoing Utilization (%) Trend Timeseries Displays the Outgoing Utilization (%) trend based on the selected Ethernet Port.
Incoming Throughput (bps) Trend Timeseries Displays the Incoming Throughput (bps) trend based on the selected Ethernet Port.
Outgoing Throughput (bps) Trend Timeseries Displays the Outgoing Throughput (bps) trend based on the selected Ethernet Port.
Incoming Packets Trend Timeseries Displays the Incoming Packets trend based on the selected Ethernet Port.
Outgoing Packets Trend Timeseries Displays the Outgoing Packets trend based on the selected Ethernet Port.
Traffic monitoring (PON Port) details
Available widgets and their interactivity
The diagram shows the interactions between the available widgets in Traffic monitoring (PON Port) details dashboard:
Traffic monitoring (PON Port) details
1. To access the Traffic monitoring (PON Port) details dashboard, click any one of the following badge widgets from the GPON OLT overview dashboard page:
Upstream Utilization
Downstream Utilization
Downstream Broadcast Utilization
Downstream Multicast Utilization
Downstream Unicast Utilization
IBM Telco Network Cloud Manager - Performance 1.4.5 401

The Traffic monitoring (PON Port) details dashboard loads.
2. From the filter options, choose the OLT, Top N, and Time period and click Apply Filter.
You can select the filter values or time ranges that you want to display in dashboards to which the filter is assigned. For more information, see Generic functions of
Telco Network Cloud Manager - Performance Dashboards.
The dashboard refreshes the data according to the filter attribute values.
Traffic monitoring (PON Port) details widgets
Table 1. Traffic monitoring (PON Port) details Widgets
Widget Name Chart Type Description
Traffic Monitoring (PON Port) Summary Grid Displays the PON port list and its associated metrics for the selected OLT:
PON Port
Upstream Utilization (%)
Max Upstream Utilization (%)
Downstream Utilization (%)
Max Downstream Utilization (%)
Downstream Broadcast Utilization (%)
Max Downstream Broadcast Utilization (%)
Downstream Multicast Utilization (%)
Max Downstream Multicast Utilization (%)
Downstream Unicast Utilization (%)
Max Downstream Unicast Utilization (%)
Upstream Dropped Bytes
Max Upstream Dropped Bytes
Downstream Dropped Bytes
Max Downstream Dropped Bytes
PON Port Details: <PON Port> Badge A dynamic badge chart that displays the selected PON port name.
The PON Port Details identifier is selected from the Traffic Monitoring (PON Port) Summary table.
Upstream Utilization (%) Trend Timeseries Displays the Upstream Utilization (%) trend based on the selected PON Port.
Downstream Traffic Utilization (%) Trend Timeseries Displays the Downstream Traffic Utilization (%) trend based on the selected PON Port.
Upstream Dropped Bytes Trend Timeseries Displays the Upstream Dropped bytes trend based on the selected PON Port.
Downstream Dropped Bytes Trend Timeseries Displays the Downstream Dropped bytes trend based on the selected PON Port.
Upstream Dropped Packets Trend Timeseries Displays the Upstream Dropped packets trend based on the selected PON Port.
Downstream Dropped Packets Trend Timeseries Displays the Downstream Dropped packets trend based on the selected PON Port.
Optical monitoring details
Available widgets and their interactivity
The diagram shows the interactions between the available widgets in Optical monitoring details dashboard:
Optical monitoring details
1. To access the Optical monitoring details dashboard, click any one of the following badge widgets from the GPON OLT overview dashboard page:
Transmitted Optical Signal
Received Optical Signal
Laser Bias Current
Voltage
Temperature
The Optical monitoring details dashboard loads.
2. From the filter options, choose the OLT, Top N, and Time period and click Apply Filter.
You can select the filter values or time ranges that you want to display in dashboards to which the filter is assigned. For more information, see Generic functions of
Telco Network Cloud Manager - Performance Dashboards.
The dashboard refreshes the data according to the filter attribute values.
Table 1. Optical monitoring details Widgets
Widget Name Chart Type Description
402 IBM Telco Network Cloud Manager - Performance 1.4.5

Widget Name Chart Type Description
Optical Monitoring Summary Grid Displays the PON port list and its associated metrics for the selected OLT:
PON Port
Transmitted Optical Signal (dBm)
Min Transmitted Optical Signal (dBm)
Received Optical Signal (dBm)
Min Received Optical Signal (dBm)
Laser Bias Current (mA)
Max Laser Bias Current (mA)
Voltage (V)
Max Voltage (V)
Temperature (˚C)
Max Temperature (˚C)
Load balancer dashboards
The Load Balancer dashboards monitor network load balancing with F5 BIG IP technology. The Load Balancer dashboards provide an insight into the distribution of
network traffic across server resources in multiple geographies. These servers can be on premises or hosted on cloud. These dashboards provide visualizations on the
performance and availability of your global applications.
Data centers that are spread geographically can slow down user requests and network traffic needs that must be managed instantly and load balance during peak
demands and downtime. The number of application connection requests and utilization from users can exceed the capacity of a server that hosts the application. The load
balancing mechanism helps to distribute the inbound requests and processing load of responses across a group of servers that run the same application effectively.
Load balancer components
Typically, the load balancer services that are based on F5 technology consists of the following components:
Global Traffic Manager (GTM)
GTM is also called as BIG-IP DNS that improves the performance and availability of your global applications by sending users to the closest or best-performing
physical, virtual, or cloud environment. It also hyperscales and secures your DNS infrastructure from DDoS attacks.
BIG-IP’s module built to monitor the availability and performance of global resources and use that information to manage network traffic patterns.
Local Traffic Manager (LTM)
BIG-IP’s module that manages and optimizes traffic for network applications and clients. BIG-IP LTM treats all network traffic as stateful connection flows. Even
connectionless protocols such as User Datagram Protocol (UDP) and Internet Control Message Protocol (ICMP) are tracked as flows.
Virtual servers
A virtual server allows BIG-IP systems to send, receive, process, and relay network traffic. A virtual server is a proxy of the actual server (physical, virtual, or
container). Combined with a virtual IP address, which is the application endpoint that is presented to the outside world.
Pools
A configuration object that groups pool members together to receive and process network traffic that is determined by a specified load balancing algorithm.
Collections of similar services available on any number of hosts.
Pool members
A pool member is a node and service port to which BIG-IP LTM can load balance the network traffic. Nodes can be members of multiple pools.
The pool member includes the definition of the application port and the IP address of the physical or virtual server. Refer to it as the service. Unique load balancing
and health monitoring based on the services instead of the host.
Nodes
A configuration object represented by the IP address of a device on the network.
Wide IPs
The Fully Qualified Domain Name (FQDN) of a service.
Load balancing methods
Static load balancing methods do not use any traffic metrics from the node to distribute traffic. Dynamic load balancing methods use traffic metrics from the node to
distribute traffic.
Health monitors keep a close eye on the health of a resource to deem it available or unavailable. They are independent of load balancing methods.
Performance monitors measure the hosts performance and dynamically send traffic to hosts in the pool. They work with corresponding dynamic load balancing methods.
Health monitors can be applied at the node level or at the pool level, but performance monitors can be applied at the node level only.
For more information about the different load balancing methods and algorithms that can be used, see Understanding F5 Load Balancing Methods.
Load balancer overview
With the help of F5 Load balancer from F5 Networks Inc, network traffic is diverted from servers that are overloaded to the other servers that can handle the load.
The F5 load balancer service consists of many components. All the components and the key performance metrics that are collected by them are displayed in the
overview dashboard.
GTM details
F5® BIG-IP® Global Traffic Manager™ (GTM) distributes DNS and user application requests based on business policies, data center and cloud service conditions,
user location, and application performance. BIG-IP GTM delivers flexible global application management in virtual and cloud environments.
LTM details
F5® BIG-IP® Local Traffic Manager™ (LTM) is an intelligent application traffic management tool. It monitors and controls the network traffic to make sure that the
IBM Telco Network Cloud Manager - Performance 1.4.5 403

applications are always available, secure, and fast. BIG-IP LTM includes static and dynamic load balancing to eliminate single points of failure.
Pool details
A load-balancing pool consists of a set of devices such as web servers that can be logically grouped. These pools can receive and process traffic. Instead of sending
client traffic to the destination IP address specified in the client request, Local Traffic Manager sends the request to any of the servers that are members of that
pool. It helps to efficiently distribute the load on your server resources.
Pool member details
A pool consists of pool members. A pool member is a logical object that represents a physical node on the network. A pool is assigned to a virtual server. The BIG-
IP system directs traffic that comes into the virtual server to a member of that pool. An individual pool member can belong to one or multiple pools, depending on
your network traffic configuration.
Virtual server details
A virtual server is one of the most important components of any BIG-IP system. The F5 Virtual Server is a traffic management object on your F5 BIG-IP device. It is
the representation of multiple servers to the user as a single server. The F5 Virtual Server is a virtual IP that serves user requests. It transmits the requests to the
pool that you configure. It is represented by a virtual IP address and a service, such as <IP_address>:80. The primary purpose of a virtual server is to distribute
traffic.
Load balancer overview
With the help of F5 Load balancer from F5 Networks Inc, network traffic is diverted from servers that are overloaded to the other servers that can handle the load. The F5
load balancer service consists of many components. All the components and the key performance metrics that are collected by them are displayed in the overview
dashboard.
Available widgets and their interactivity
The diagram shows the master-listener, and drill-down interactions between the available widgets:
Load balancer overview
1. Click Infra > Load balancer > Load balancer overview.
This dashboard displays the F5 load balancer components.
2. From the filter options, choose the Group and Time period.
You can select the filter values or time ranges that you want to display in dashboards to which the filter is assigned. For more information, see Generic functions of
Telco Network Cloud Manager - Performance Dashboards.
3. Click Apply Filter.
The Load balancer overview widgets load the data based on the filter values.
Table 1. Widget interactions
Controller widgets Listener widgets Drill-down widgets
Local Traffic Managers N/A LTM Details
Global Traffic Managers N/A GTM Details
Virtual Servers N/A Virtual Server Details
Pools N/A Pool Details
Pool Members N/A Pool Member Details
Top 5 LTM - Ranked by Current Connections Top 5 Virtual Servers by Current Connections - <LTM_Device> N/A
Top 5 Virtual Servers by Current Connections - <LTM_Device> N/A Virtual Server Details
Table 2. Available widgets
Widget name Chart type Description
Local Traffic Managers Badge Displays the number of Local Traffic Managers that are available in your load-balancing service.
It also displays the state of the LTMs. The value and color code indicate the number of LTMs that are unavailable,
partially available, and available. Explanation for the color codes is as follows:
Green: Available
Orange: Partially Available
Red: Unavailable
Click the total number of Local Traffic Managers to drill down to LTM Details page.
Virtual Servers Badge Displays the number of Virtual Servers that are available in your load-balancing service.
It also displays the state of the Virtual Servers. The value and color code indicate the number of Virtual Servers
that are unavailable, partially available, and available. Explanation for the color codes is as follows:
Green: Available
Orange: Partially Available
Red: Unavailable
Click the total number of Virtual Servers to drill down to Virtual Server Details page.
404 IBM Telco Network Cloud Manager - Performance 1.4.5

Widget name Chart type Description
Global Traffic Managers Badge Displays the number of Global Traffic Managers that are available in your load-balancing service.
It also displays the state of the GTMs. The value and color code indicate the number of GTMs that are unavailable,
partially available, and available. Explanation for the color codes is as follows:
Green: Available
Orange: Partially Available
Red: Unavailable
Click the total number of Global Traffic Managers to drill down to GTM Details page.
Pools Badge Displays the number of Pools that are available in your load-balancing service.
It also displays the state of the Pools. The value and color code indicate the number of Pools that are unavailable,
partially available, and available. Explanation for the color codes is as follows:
Green: Available
Orange: Partially Available
Red: Unavailable
Click the total number of Pools to drill down to Pool Details page.
Pool Members Badge Displays the number of Pool Members that are available in your load-balancing service.
It also displays the state of the Pool Members. The value and color code indicate the number of Pool Members that
are unavailable, partially available, and available. Explanation for the color codes is as follows:
Green: Available
Orange: Partially Available
Red: Unavailable
Click the total number of Pool Members to drill down to Pool Members Details page.
Top 5 LTM - Ranked by
Current Connections
Grid Displays the top five LTMs by current connections. Current or active connections are the connections that are
available to that LTM at a particular time that is based on the selected time period. The metrics that are displayed
in the Grid widget are as follows:
LTM
Current Connections
Connections per Second
Inbound Throughput (bps)
Outbound Throughput (bps)
CPU Utilization (%)
Memory Utilization (%)
Top 5 Virtual Servers by
Current Connections -
<LTM_Device>
Timeseries Displays the top five Virtual Servers by current connections for the selected LTM. Current or active connections are
the connections that are available to that LTM at a particular time that is based on the selected time period. The
Time Zoom feature is available for this widget.
The timeseries chart refreshes according to the selected metric from the Top 5 LTM - Ranked by Current
Connections grid.
It's a dynamic chart that allows drill down to the Virtual server details dashboard.
4. Click the identified data point from the Top 5 Virtual Servers by Current Connections - <LTM_Device> dynamic timeseries chart to drill down.
Virtual server details dashboard displays the F5 BIG-IP Virtual Servers information in your load-balancing environment.
GTM details
F5® BIG-IP® Global Traffic Manager™ (GTM) distributes DNS and user application requests based on business policies, data center and cloud service conditions, user
location, and application performance. BIG-IP GTM delivers flexible global application management in virtual and cloud environments.
Available widgets and their interactivity
The GTM details and its widgets:
GTM details
1. Click Infra > Load balancer > GTM details.
This dashboard displays the F5 BIG-IP LTM information in your load-balancing environment.
IBM Telco Network Cloud Manager - Performance 1.4.5 405

2. From the filter options, choose the Group, Top N, and Time period.
You can select the filter values or time ranges that you want to display in dashboards to which the filter is assigned. For more information, see Generic functions of
Telco Network Cloud Manager - Performance Dashboards.
3. Click Apply Filter.
The dashboard refreshes the data according to the filter attribute values.
Table 1. Widget interactions
Controller widgets Listener widgets Drill-down widgets
GTM Health Summary GTM Health Details N/A
Status N/A
Health Details
CPU Utilization (%)
Memory Utilization (%)
Dropped per Second Trend
Requests per Second Trend
Resolutions per Second Trend
Current Connections Trend
Connections per Second Trend
Inbound Throughput (bps) Trend
Outbound Throughput (bps) Trend
N/A
WIDE IPS
Wide IP Health Details
N/A
Table 2. Available widgets
Widget name Chart type Description
GTM Health
Summary
Grid Displays the list of Global Traffic Managers that are available in your load-balancing service. This widget displays the metrics to
monitor the health of the GTM. Click any GTM from the table to see the details. The following metrics are monitored:
IP Address
Requests per Second
Max Requests per Second
Resolutions per Second
Max Resolutions per Second
Dropped per Second
Max Dropped per Second
Current Connections
Max Current Connections
Connections per Second
Max Connections per Second
Inbound Throughput (bps)
Max Inbound Throughput (bps)
Outbound Throughput (bps)
Max Outbound Throughput (bps)
GTM Health
Details
Badge Displays the selected GTM identifier and the status of the GTMs that are available.
Status Badge It displays the state of the GTM. The state of a GTM is derived from the status of Wide IPs.
If all Wide IPs are available, status is 1, then the color is Green. GTMs are all available.
If Wide IPs are partially available with a mix status of 1,2,3,4 then the color is Orange. GTMs are partially available.
If all Wide IPs are not available with a status 3,4, then the color is Red. GTMs are unavailable.
Explanation for the color codes is as follows:
Green: Available
Orange: Partially Available
Red: Unavailable
Health Details
CPU Utilization
(%)
Gauge CPU availability that is used across all available cores in the selected GTM.
Memory
Utilization (%)
Gauge Memory availability that is used across all available cores in the selected GTM.
Dropped per
Second Trend
Line The number of requests that are dropped per second.
Note: The Time Zoom feature is available for all the Line charts in this dashboard.
Requests per
Second Trend
Line The number of requests that are satisfied per second.
Resolutions per
Second Trend
Line The number of transaction requests that are completed per second.
Current
Connections
Trend
Line Current or active connections that are available to that GTM at a particular time that is based on the selected time period. It is a
measure of the number of client/server requests that can be handled.
Connections per
Second Trend
Line Active GTM connections that are available per second.
406 IBM Telco Network Cloud Manager - Performance 1.4.5

Widget name Chart type Description
Inbound
Throughput
(bps) Trend
Line Measured in bits per second. Typically, it is the amount of data that is sent to and from the GTM to the client.
Outbound
Throughput
(bps) Trend
Line Measured in bits per second. Typically, it is the amount of data that is sent to and from the client to the GTM.
Wide IPS
Wide IP Health
Details
Grid The main configuration element in a GTM is called a Wide IP or WIP. A Wide IP equates to the common URL that you are load
balancing. For example, www.yourcompany.com. A pool or pools are usually attached to a WIP, which contain the IP addresses it’s
intelligently resolving. BIG-IP® DNS selects pools based on the order in which they are listed in a wide IP. The Wide IP contains one
or more pools, which in turn contain one or more virtual servers.
Status
Wide IP Name
Requests per Second
Max Requests per Second
Resolutions per Second
Max Resolutions per Second
Dropped per Second
Max Dropped per Second
LTM details
F5® BIG-IP® Local Traffic Manager™ (LTM) is an intelligent application traffic management tool. It monitors and controls the network traffic to make sure that the
applications are always available, secure, and fast. BIG-IP LTM includes static and dynamic load balancing to eliminate single points of failure.
Available widgets and their interactivity
The LTM details and its widgets:
LTM details
1. Click Infra > Load balancer > LTM details.
This dashboard displays the F5 BIG-IP LTM information in your load-balancing environment.
2. From the filter options, choose the Group, Top N, and Time period.
You can select the filter values or time ranges that you want to display in dashboards to which the filter is assigned. For more information, see Generic functions of
Telco Network Cloud Manager - Performance Dashboards.
3. Click Apply Filter.
The dashboard refreshes the data according to the filter attribute values.
Table 1. Widget interactions
Controller widgets Listener widgets Drill-down widgets
LTM Health Summary LTM Health Details N/A
Status N/A
Virtual Servers Virtual Servers Details
Pools Pool Details
Pool Members Pool Member Details
CPU Utilization (%) N/A
Memory Utilization (%) N/A
Top 5 Virtual Servers by Current Connections Virtual Servers Details
Current Connections Trend N/A
Connections per Second Trend N/A
Inbound Throughput (bps) Trend N/A
Outbound Throughput (bps) Trend N/A
IBM Telco Network Cloud Manager - Performance 1.4.5 407

Table 2. Available widgets
Widget name Chart type Description
LTM Health Summary Grid Displays the list of Local Traffic Managers that are available in your load-balancing service. This widget displays the metrics to
monitor the health of the LTMs. Click any LTM from the table to see the details. The following metrics are monitored:
LTM
IP Address
Current Connections
Max Current Connections
Connections per Second
Max Connections per Second
Inbound Throughput (bps)
Max Inbound Throughput (bps)
Outbound Throughput (bps)
Max Outbound Throughput (bps)
CPU Utilization (%)
Max CPU Utilization (%)
Memory Utilization (%)
Max Memory Utilization (%)
LTM Health Details Badge Displays the selected LTM identifier and the status of the GTMs that are available.
Status
Virtual Servers
Pools
Pool Members
Badge Status displays the state of the LTMs. The state of a LTM is derived from the status of Virtual Servers.
If all Virtual Servers are available, status is 1, then the color is Green. LTM is available.
If Virtual Servers are partially available with a mixed status of 1,2, 3, 4, then the color is Orange. LTM is partially
available.
If all Virtual Servers are not available with a status of 4, then the color is Red. LTM is unavailable.
Displays the total number of Virtual Servers, Pools, and Pool Members that are associated with a selected LTM.
It also displays the state of the Virtual Servers, Pools, and Pool Members for the LTM. The value and color code indicate the
number of devices that are unavailable, partially available, and available. These badge widget allows drill down to their
respective drill-down pages.
Explanation for the color codes is as follows:
Green: Available
Orange: Partially Available
Red: Unavailable
CPU Utilization (%) Gauge CPU availability that is used across all available cores in the selected LTM.
Memory Utilization
(%)
Gauge Memory availability that is used across all available cores in the selected LTM.
Top 5 Virtual Servers
by Current
Connections
Line Top five Virtual Servers that are available by the current connections in the selected LTM. It drills down to the specific Virtual
Servers Details dashboard.
Note: The Time Zoom feature is available for all the Line charts in this dashboard.
It's a dynamic chart that allows drill down to the Virtual server details dashboard.
Current Connections
Trend
Line Current or active connections that are available to that LTM at a particular time that is based on the selected time period. It is a
measure of the number of client/server requests that can be handled.
Connections per
Second Trend
Line Active LTM connections that are available per second.
Inbound Throughput
(bps) Trend
Line Measured in bits per second. Typically, it is the amount of data that is sent to and from the LTM to the client.
Outbound
Throughput (bps)
Trend
Line Measured in bits per second. Typically, it is the amount of data that is sent to and from the client to the LTM.
Pool details
A load-balancing pool consists of a set of devices such as web servers that can be logically grouped. These pools can receive and process traffic. Instead of sending client
traffic to the destination IP address specified in the client request, Local Traffic Manager sends the request to any of the servers that are members of that pool. It helps to
efficiently distribute the load on your server resources.
Available widgets and their interactivity
The Pool details and its widgets:
Pool details
408 IBM Telco Network Cloud Manager - Performance 1.4.5

1. Click Infra > Load balancer > Pool details.
This dashboard displays the F5 BIG-IP Pool information in your load-balancing environment.
2. From the filter options, choose the Group, LTM, Top N, and Time period.
You can select the filter values or time ranges that you want to display in dashboards to which the filter is assigned. For more information, see Generic functions of
Telco Network Cloud Manager - Performance Dashboards.
3. Click Apply Filter.
The dashboard refreshes the data according to the filter attribute values.
Table 1. Widget interactions
Controller widgets Listener widgets Drill-down widgets
Pool Health Summary Pool Health Details N/A
Current Connections Trend N/A
Connections per Second Trend N/A
Inbound Throughput (bps) Trend N/A
Outbound Throughput (bps) Trend N/A
Table 2. Available widgets
Widget name Chart type Description
Pool Health Summary Grid Displays the Pools that are in the load balancer environment and their associated metrics in the columns:
Status
Status of the Pool member is represented as follows:
Green: Available
Orange: Partially Available
Red: Unavailable
Pool
Load Balancing Algorithm
Current Connections
Max Current Connections
Connections per Second
Max Connections per Second
Inbound Throughput (bps)
Max Inbound Throughput (bps)
Outbound Throughput (bps)
Max Outbound Throughput (bps)
Pool Health Details Badge The selected pool health details. Pool identifier is selected from the Pool Health Summary table.
Current Connections
Trend
Line Current or active connections that are available to that pool at a particular time that is based on the selected time period. It is
a measure of the number of client/server requests that can be handled.
Note: The Time Zoom feature is available for all the Line charts in this dashboard.
Connections per
Second Trend
Line Active pool connections that are available per second.
Inbound Throughput
(bps) Trend
Line Measured in bits per second. Typically, it is the amount of data that is sent from the pool to the client.
Outbound Throughput
(bps) Trend
Line Measured in bits per second. Typically, it is the amount of data that is sent from the client to the pool.
Related information
Pools
Pool member details
A pool consists of pool members. A pool member is a logical object that represents a physical node on the network. A pool is assigned to a virtual server. The BIG-IP
system directs traffic that comes into the virtual server to a member of that pool. An individual pool member can belong to one or multiple pools, depending on your
network traffic configuration.
Available widgets and their interactivity
The Pool member details and its widgets:
Pool member details
1. Click Infra > Load balancer > Pool member details.
This dashboard displays the F5 BIG-IP Pool Member details information in your load-balancing environment. Typically, it shows the pool members that are
configured on a specific device. You can track and monitor the number of pool members, and the virtual server and IP address of the device on which the pool
IBM Telco Network Cloud Manager - Performance 1.4.5 409

members are configured.
2. From the filter options, choose the Group, LTM, Top N, and Time period.
You can select the filter values or time ranges that you want to display in dashboards to which the filter is assigned. For more information, see Generic functions of
Telco Network Cloud Manager - Performance Dashboards.
3. Click Apply Filter.
The dashboard refreshes the data according to the filter attribute values.
Table 1. Widget interactions
Controller widgets Listener widgets Drill-down widgets
Pool Member Health Summary Pool Member Health Details N/A
Current Connections Trend N/A
Connections per Second Trend N/A
Inbound Throughput (bps) Trend N/A
Outbound Throughput (bps) Trend N/A
Table 2. Available widgets
Widget name Chart type Description
Pool Member
Health Summary
Grid Displays the list of all the Pool members that are in the load balancer environment and their associated metrics in the columns:
Status
Status of the Pool member is represented as follows:
Green: Available
Orange: Partially Available
Red: Unavailable
Pool Member
IP addresses
Connection Limit
Current Connections
Max Current Connections
Connections per Second
Max Connections per Second
Inbound Throughput (bps)
Max Inbound Throughput (bps)
Outbound Throughput (bps)
Max Outbound Throughput (bps)
Pool Member
Health Details
Badge The selected pool member health details. IP address of the pool member that is selected from the Pool Member Health Summary
table.
Current
Connections
Trend
Line Current or active connections that are available to that pool member at a particular time that is based on the selected time period.
It is a measure of the number of client/server requests that can be handled. It also displays the Connection Limit metric.
Note: The Time Zoom feature is available for all the Line charts in this dashboard.
Connections per
Second Trend
Line Active connections that are available per second.
Inbound
Throughput (bps)
Trend
Line Measured in bits per second. Typically, it is the amount of data that is sent from the pool member to the client.
Outbound
Throughput (bps)
Trend
Line Measured in bits per second. Typically, it is the amount of data that is sent from the client to the pool member.
Virtual server details
A virtual server is one of the most important components of any BIG-IP system. The F5 Virtual Server is a traffic management object on your F5 BIG-IP device. It is the
representation of multiple servers to the user as a single server. The F5 Virtual Server is a virtual IP that serves user requests. It transmits the requests to the pool that
you configure. It is represented by a virtual IP address and a service, such as <IP_address>:80. The primary purpose of a virtual server is to distribute traffic.
Available widgets and their interactivity
The Virtual server details and its widgets:
Virtual server details
1. Click Infra > Load balancer > Virtual server details.
This dashboard displays the F5 BIG-IP Virtual Servers information in your load-balancing environment.
410 IBM Telco Network Cloud Manager - Performance 1.4.5

2. From the filter options, choose the Group, LTM, Top N, and Time period.
You can select the filter values or time ranges that you want to display in dashboards to which the filter is assigned. For more information, see Generic functions of
Telco Network Cloud Manager - Performance Dashboards.
3. Click Apply Filter.
The dashboard refreshes the data according to the filter attribute values.
Table 1.
Controller widgets Listener widgets Drill-down widgets
Virtual Server Health Summary Virtual Server Health Details N/A
Current Connections Trend N/A
Connections per Second Trend N/A
Inbound Throughput (bps) Trend N/A
Outbound Throughput (bps) Trend N/A
Total Request Trend N/A
CPU Utilization (%) Trend N/A
Widget name Chart type Description
Virtual Server
Health Summary
Grid Displays the list of Virtual Servers that are in the load balancer environment and their associated metrics in the columns:
Status
Status of the virtual server is represented as follows:
Green: Available
Orange: Partially Available
Red: Unavailable
Virtual Server
IP Address
Connection Limit
Current Connections
Max Current Connections
Connections per Second
Max Connections per Second
Total Request
Max Total Request
Inbound Throughput (bps)
Max Inbound Throughput (bps)
Outbound Throughput (bps)
Max Outbound Throughput (bps)
CPU Utilization (%)
Max CPU Utilization (%)
Virtual Server
Health Details
Badge The selected Virtual Server health details. The Virtual Server is selected from Virtual Server Health Summary table.
Current
Connections
Trend
Line Current or active connections that are available to that Virtual Server at a particular time that is based on the selected time period.
It is a measure of the number of client/server requests that can be handled. It also displays the Connection Limit metric.
Note: The TimeZoom feature is available for all the Line charts in this dashboard.
Connections per
Second Trend
Line Active Virtual Server connections that are available per second.
Inbound
Throughput (bps)
Trend
Line Measured in bits per second. Typically, it is the amount of data that is sent to and from the Virtual Server to the client.
Outbound
Throughput (bps)
Trend
Line Measured in bits per second. Typically, it is the amount of data that is sent to and from the client to the Virtual Server.
Total Request
Trend
Line Total number of requests that are handled by the Virtual Server at a particular time period.
CPU Utilization
(%) Trend
Line CPU availability is used across all available cores in the selected Virtual Server.
Related information
Virtual Servers
WiFi overview dashboard
WiFi overview dashboards are instrumental for enterprises in monitoring the health and performance of the WiFi network. This dashboard represents key performance
indicators (KPI), in the form of widgets, of a WiFi network to monitor the network. You can navigate further from these widgets to analyze specific diagnostics.
The WiFi overview is based on the following three key components:
Client Count: The number of clients that are connected to any particular WiFi network (SSID) or Access point (AP) informs the network administrator about the
amount of load on that SSID or Access point. At any given point in time, if the client count increases, network administrator can take a decision on moving clients
between Access Points or SSIDs and reduce the load on network.
Signal Characteristics: WiFi overview dashboards, display signal quality details by using two characteristics as follows.
IBM Telco Network Cloud Manager - Performance 1.4.5 411

Received Signal Strength Indicator (RSSI): RSSI is an estimated measure of power of frequency of a signal that a client receives from the access points. It
varies with the distance between clients and access points, hence indicates the network administrator to adjust the client-access point locations and
maintain the overall network performance.
Signal-to-Noise ratio (SNR): Signal-to-Noise ratio, is the comparison between the power of signal and the presence of noise in the network. This ratio is an
indicator of the quality of the signal. The more the noise the less healthy a signal is. If a client is experiencing low signal-to-noise ratio, a network
administrator adjusts the placement of AP to avoid physical obstacles or adjust the client count of the network.
Worst Performing channels: The worst performing channels widget in the dashboard, gives the details of the channels that are facing high intensity of interference
and noise. It helps to identify the channels that are acting as loopholes in the network, and gives the network administrator a lead to analyze the network to
improve the performance.
Refer the widget details to understand the fundamentals of WiFi overview dashboards.
Available widgets and their interactivity
The drill-down widget interactions can be seen in the following ways:
For any widgets with the ( ) drill-down icon, from the chart, click any bar that represents the interface or metric to open the drill-down dashboard page, which
contains the associated widgets.
The diagram shows the interactions between widgets and their drill-down widgets:
WiFi overview
1. Click Home > WiFi overview.
The WiFi overview dashboard loads.
This dashboard displays the metrics values for KPIs.
2. You can filter data based on the following filters:
Controller, contains the IP address of a controller that manages the Access Points of the network.
Time Period, the list contains of Last Hour, Last 6 Hours, Last 12 Hours, Last 24 Hours, Last 7 Days, Last 30 Days, Last 365 Days and Custom.
Table 1. Widget interactions
Controller widgets Drill-down dashboard
Total APs N/A
Total SSIDs N/A
2.4 GHz Clients WiFi Client Count
5 GHz Clients
Clients by RSSI Quality: Poor WiFi Client Count
Clients by RSSI Quality: Average
Clients by RSSI Quality: Good
Clients by SNR Quality: Poor WiFi Client Count
Clients by SNR Quality: Average
Clients by SNR Quality: Good
WiFi Network Details N/A
Access Points Details N/A
2.4 GHz: Worst 10 Performing Radio By Channel Utilization (%) N/A
5 GHz: Worst 10 Performing Radio By Channel Utilization (%) N/A
Worst 10 Performing Channel By Interference WiFi Interference and Noise Performance
Table 2. Available Widgets
Widget name Chart type Typical uses
Total APs Badge Displays the number of Access Points that are connected to the selected controller.
Total SSIDs Badge Displays the number of SSID (WiFi Network) configured to the selected controller.
2.4 GHz Clients Badge Displays the client count to 2.4 GHz frequency band of signal.
412 IBM Telco Network Cloud Manager - Performance 1.4.5

Widget name Chart type Typical uses
5 GHz Clients Badge Displays the client count to 5 GHz frequency band of signal.
Clients by RSSI Quality: Poor Badge Displays the number of clients who are receiving a poor signal strength. The standard RSSI range is less than or
equal to -70 dBm.
Clients by RSSI Quality: Average Badge Displays the number of clients who are receiving an average signal strength. The standard RSSI range is -46 to
-69 dBm
Clients by RSSI Quality: Good Badge Displays the number of clients who are receiving a good signal strength. The standard RSSI range is greater than
or equal to -45 dBm.
Clients by SNR Quality: Poor Badge Displays the number of clients experiencing the lowest signal-to-noise ratio. The standard SNR range is 0 to 12
dBm. If more number of clients are in the Poor range, network performance is hampered.
Clients by SNR Quality: Average Badge Displays the number of clients experiencing moderate level of signal-to-noise ratio. The standard SNR range is 13
to 19 dBm.
Clients by SNR Quality: Good Badge Displays the number of clients experiencing the highest signal-to-noise ratio. The standard SNR range is equal or
greater than 20 dBm. The more number of clients in this range the better for network performance.
Wi-Fi Network Details Grid Displays the list of attributes of SSID.
1. Status of SSID as Enabled (1) or Disabled (0)
2. QoS Profile (0: Bronze, 1: Silver, 2: Gold, 3: Platinum)
3. Number of clients connected to the SSID
Access Points Details Grid Displays the list of attributes of Access Points (AP)
1. Location of AP
2. IP address of AP
3. Status as Enabled (1) or Disabled (2)
4. Number of clients connected to the AP
2.4 GHz: Worst 10 Performing
Radio By Channel Utilization (%)
Bar Displays the channels that are utilizing most of the bandwidth of 2.4 GHz frequency.
5 GHz: Worst 10 Performing Radio
By Channel Utilization (%)
Bar Displays the channels that are utilizing most of the bandwidth of 5 GHz frequency.
Worst 10 Performing Channel By
Interference
Bar Displays channels that are experiencing highest intensity of interference.
WiFi Client Count
WiFi Client Count Dashboard gives you the number of clients that are attached to 2.4 GHz and 5 GHz frequencies and the client count that is affected by RSSI and
SNR quality trend of WiFi signal. This client count is distributed based on a timestamp. A time series representation of the client count helps you to identify a
definite pattern of client experience in terms of frequency and quality of signal.
WiFi Interference and Noise Performance
A drill-down widget of Top 10 worst performing Channels by Interference, this widget displays the characteristics of a signal. You can identify the interference and
noise ratio for channels. The timeseries chart helps notice a pattern of signal health for particular controller and channel.
WiFi Client Count
WiFi Client Count Dashboard gives you the number of clients that are attached to 2.4 GHz and 5 GHz frequencies and the client count that is affected by RSSI and SNR
quality trend of WiFi signal. This client count is distributed based on a timestamp. A time series representation of the client count helps you to identify a definite pattern of
client experience in terms of frequency and quality of signal.
Access WiFi Client Count
1. Click Home > WiFi Overview
Clients by RSSI Quality
Click Poor, Average, or Good from the badge widget.
Clients by SNR Quality
Click Poor, Average, or Good from the badge widget.
Client Count widgets
You have the options to filter the existing Client Count metrics by using the following filters.
1. From the filter options, choose the Controller and Time Period, and click Apply Filter.
The dashboard refreshes the data according to the filter attribute values.
Table 1. Client Count Widgets
Widget Name Chart Type Description
2.4GHz:Client Count Trend Timeseries Displays the number of clients that are connected to 2.4 GHz frequency based on timestamp
5GHz:Client Count Trend Timeseries Displays the number of clients that are connected to 5 GHz frequency based on timestamp
Client Count by RSSI Quality Trend Timeseries Displays the RSSI quality (signal strength) experienced by a number of clients based on timestamp.
The client count is divided into three categories of signal strength: Poor, Average, Good.
Client Count by SNR Quality Trend Timeseries Displays the SNR quality (Signal-to-Noise ratio) experienced by a number of clients based on timestamp.
The client count is divided into three categories of signal-to-noise ratio: Poor, Average, Good.
IBM Telco Network Cloud Manager - Performance 1.4.5 413

WiFi Interference and Noise Performance
A drill-down widget of Top 10 worst performing Channels by Interference, this widget displays the characteristics of a signal. You can identify the interference and noise
ratio for channels. The timeseries chart helps notice a pattern of signal health for particular controller and channel.
Access WiFi Interference and Noise Performance
1. Click Home > WiFi Overview
Click any bar on the Top 10 Worst Performing Channels by Interference.
WiFi Interference and Noise Performance widgets
You have the options to filter the existing WiFi Interference and Noise Performance metrics with the following filters.
1. From the filter options, choose the Controller, AP Radio Channel and Time period and click Apply Filter.
The dashboard refreshes the data according to the filter attribute values.
Table 1. WiFi Interference and Noise Performance widgets
Widget Name Chart Type Description
Interference score (%) Trend Timeseries Displays the interference score for a selected controller and AP radio channel.
For the selected controller, you can change the AP radio channel to identify a channel with less interference score.
Interference Power (dBm)
Trend
Timeseries Displays the intensity of interference for the selected channel and AP controller. Interference is measured in decibels
(dBm).
For the selected controller, you can change the AP radio channel to identify a channel with less interference power.
Noise (dBm) Trend Timeseries Displays the intensity of noise present in the selected channel of the selected controller.
For the selected controller, you can change the AP radio channel to identify a channel with less noise in its signal.
Netflow dashboards
Network flow monitoring is often used to resolve network performance issues and ensure Quality of Service (QoS) for key applications and services.
Network flow monitoring gives visibility to an effective network and infrastructure management. Telco Network Cloud Manager - Performance Dashboards track the flow of
applications and key services over all areas of the network, such as devices, servers, and more and offer insights into network bandwidth utilization.
Telco Network Cloud Manager - Performance Dashboards populates the performance metrics based on the collected IP network traffic information as the packet enters or
exits an interface of a device.
When you select an interface for a device, this resource provides a view of the applications responsible for traffic volume, either inbound or outbound, through the
interface over the selected time period. This data provides granular details about network traffic that passes through an interface.
Ensure that you've configured your Telco Network Cloud Manager - Performance correctly before using the Netflow dashboards.
Drill-down dashboard views
The diagram shows the flow dashboard groups and the available views.
414 IBM Telco Network Cloud Manager - Performance 1.4.5

Applications response overview dashboard
Applications response overview dashboard displays the overview of the worst performing application-target server pairings based on the Applications Response
Time metrics that are monitored.
Applications dashboards
This topic gives you an overview of the Applications dashboards usage.
Autonomous Systems dashboards
This topic gives you an overview of the Autonomous Systems dashboards usage.
Conversations dashboards
This topic gives you an overview of the Conversations dashboards usage.
IP Address Grouping dashboards
This topic gives you an overview of the IP Address Grouping dashboards usage.
Destinations dashboards
This topic gives you an overview of the Destinations dashboards usage.
Protocols dashboards
This topic gives you an overview of the Protocols dashboards usage.
QoS Queue dashboards
This topic gives you an overview of the QoS Queue dashboard usage.
Sources dashboards
This topic gives you an overview of the Sources dashboards usage.
ToS dashboards
This topic gives you an overview of the ToS dashboard usage.
Network traffic overview dashboard
Network traffic overview dashboard provides comprehensive bandwidth analysis and performance metrics monitoring capabilities by monitoring the worst
performing interfaces. It helps you to understand further the interface utilization trend and also the IP traffic composition that is related to that interface based on
the flow data collected.
Applications response overview dashboard
Applications response overview dashboard displays the overview of the worst performing application-target server pairings based on the Applications Response Time
metrics that are monitored.
Available widgets and their interactivity
The master-listener and drill-down widget interactions can be seen in the following ways:
For any widgets with the ( ) drill-down icon, from the chart, click any bar that represents the interface or metric to open the drill-down dashboard page, which
contains the associated widgets.
For the other widgets that are shown in the diagram to be in a master-listener or drill-down interaction, click any of the bars that represent the interface to change
the listener widget that displays the related data for the selected interface.
The diagram shows the master-listener, and drill-down interactions between the available widgets:
IBM Telco Network Cloud Manager - Performance 1.4.5 415

Applications response overview
1. Click NetFlow > Applications Response Overview.
The Applications Response Overview: Top 10 dashboard loads.
This dashboard provides a view of the top 10 worst performing application-target server pairings based on the Applications Response Time metrics that are
monitored.
2. From the filter options, choose the Device, Interface, and Time period and click Apply Filter.
Note: You can select the Table 1 that you want to display in the dashboard to which the filter is assigned.
The dashboard refreshes the data according to the filter attribute values.
Table 1. Widget interactions
Controller widgets Listener
widgets Drill-down dashboard
Top 10 Applications by Client Network Delay (ms)
Click any bar that represents the application to drill down to
Applications Response Time page.
N/A Applications response time
You can drill down to the Applications response time page from these widgets to
view applications response time issues in a network.
Top 10 Applications by Server Network Delay (ms)
Click any bar that represents the application to drill down to
Applications Response Time page.
Top 10 Applications by Application Delay (ms)
Click any bar that represents the application to drill down to
Applications Response Time page.
Top 10 Applications by Total Delay (ms)
Click any bar that represents the application to drill down to
Applications Response Time page.
Table 2. Available Widgets
Widget name Chart type Typical uses
Top 10 Applications by Client Network
Delay (ms)
Bar Display the top 10 applications delay time of a client based on the Applications Response Time metrics
that are monitored.
The application client delay is shown in milliseconds based on the selected filter attribute values.
Top 10 Applications by Server Network
Delay (ms)
Bar Display the top 10 applications delay time of a server based on the Applications Response Time metrics
that are monitored.
The application server delay is shown in milliseconds based on the selected filter attribute values.
Top 10 Applications by Application Delay
(ms)
Bar Display the top 10 applications delay time of an application based on the Applications Response Time
metrics that are monitored.
The application response delay time is shown in milliseconds based on the selected filter attribute values.
Top 10 Applications by Total Delay (ms) Bar Display the top 10 applications total delay time based on the Applications Response Time metrics that are
monitored.
The total application delay time is shown in milliseconds based on the selected filter attribute values.
Applications response time dashboard
An overview of the Applications response time dashboard usage.
Applications response time dashboard
An overview of the Applications response time dashboard usage.
Access Flow Applications response time view
The Applications response time page shows network response time issues for a particular application or category.
You can drill down to the Applications response time page from the following dashboard:
1. Click NetFlow > Applications response overview.
Applications response overview: Top 10 dashboard loads.
2. Drill down to Applications response time dashboard from any of the widgets in the Applications response overview dashboard.
Applications response time widgets
You have the options to filter the existing Applications response time metrics by using the following filters.
416 IBM Telco Network Cloud Manager - Performance 1.4.5

1. From the filter options, choose the Device, Interface, Application, Target, and Time period and click Apply Filter.
You can drill down to the Applications response time: Response Time for Interface page to see the following widgets:
Max Client Network Delay (ms)
Max Server Network Delay (ms)
Max Application Delay (ms)
Max Total Delay (ms)
The dashboard refreshes the data according to the filter attribute values.
Table 1. Applications response time widgets
Widget Name Chart Type Description
Applications response time
Max Client Network
Delay (ms)
Max Server Network
Delay (ms)
Max Application
Delay (ms)
Max Total Delay (ms)
Badge It displays the following Applications response time metrics in milliseconds.
Max Client Network Delay (ms)
Max Server Network Delay (ms)
Max Application Delay (ms)
Max Total Delay (ms)
Response Time Trend Timeseries It shows the Applications response time metrics that display the application response time delay that is contributed
from the client, server, and application server side.
The following are the application response time metrics that are shown in milliseconds (ms):
Max Client Network delay
Max Server Network delay
Max Application delay
Max Total delay
Response Time in
milliseconds (ms)
Grid
Applications dashboards
This topic gives you an overview of the Applications dashboards usage.
The Applications dashboards is divided into two parts. To access the Applications dashboards, click NetFlow > Applications and select any one of the dashboards:
Top Applications
Top Applications with ToS
Top Applications
This dashboard provides a view of the top 10 applications responsible for monitored traffic on your network, ranked in order of traffic volume for an interface.
Table 1. Available Widgets
Widget Name Chart Type Description
Top 10
Applications
Donut Displays the top 10 applications name with its total traffic volume in octets.
The percentage of the application is based on the selected application that is shown by the widget. The individual application in the
legend adds up to 100%. This percentage can be absolute or relative.
Traffic Volume
Trend
Timeseries This timeseries widget displays the Traffic Volume trend in octets across a selected time.
You can choose to display the Utilization trend in percentage or the Throughput trend in bit per second (bps).
It describes how the application uses the interface bandwidth in octets, bps, or percentage.
Top 10
Applications
Grid Displays the Top 10 traffic data (in octets and packets) of device applications through the selected interface.
The columns that are displayed depend on the flow direction set, either Inbound or Outbound for the selected time period.
Top Applications with ToS
This dashboard provides a top 10 view of network traffic segmented by Type of Service (ToS) method for an interface.
Note: Dashboard filters allow you to choose different views of data to be displayed on the active dashboard tab. You can select the Table 1 that you want to display in
dashboards to which the filter is assigned.
Table 2. Available Widgets
Widget Name Chart Type Description
Top 10
Applications with
ToS
Donut Displays the top 10 applications name by Type of Service (ToS) method for an interface.
The percentage of the Applications with ToS is based on the selected application with ToS that is shown by the widget. The
individual application in the legend adds up to 100%. This percentage can be absolute or relative.
Traffic Volume
Trend
Timeseries This timeseries widget displays the Traffic Volume trend in octets across a selected time.
You can choose to display the Utilization trend in percentage or the Throughput Trend in bit per second (bps).
It describes how the application uses the interface bandwidth in octets, bps, or percentage.
IBM Telco Network Cloud Manager - Performance 1.4.5 417

Widget Name Chart Type Description
Top 10
Applications with
ToS
Grid Displays the Top 10 traffic data (in octets and packets) of device applications with ToS through the selected interface.
The columns that are displayed depend on the flow direction set, either Inbound or Outbound for the selected time period.
Autonomous Systems dashboards
This topic gives you an overview of the Autonomous Systems dashboards usage.
To access the Autonomous Systems dashboards, click NetFlow > Autonomous Systems dashboards and select any one of the dashboards:
Top Autonomous System Conversations
Top Destination Autonomous Systems
Top Source Autonomous Systems
Top Autonomous System Conversations
This dashboard provides a view of the top 10 list of Autonomous System conversations with highest bandwidth consumption. Autonomous System Conversations are
listed with the amount of data that is transferred, in both octets and packets, and the percentage of traffic utilization generated by the autonomous system over the
specified time period.
Table 1. Available Widgets
Widget Name Chart Type Description
Top 10 Autonomous
System Conversations
Donut Displays the top 10 Autonomous System conversations name with its total traffic volume in octets.
The percentage of the conversation is based on the selected conversation that is shown by the widget. The individual
conversation in the legend adds up to 100%. This percentage can be absolute or relative.
Traffic Volume Trend Timeseries This timeseries widget displays the Traffic Volume trend in octets across a selected time period.
You can choose to display the Utilization trend in percentage or the Throughput Trend in bit per second (bps).
It describes how the conversation of Autonomous Systems traffic uses the interface bandwidth in octets, bps, or
percentage.
Top 10 Autonomous
System Conversations
Grid Displays the Top 10 traffic data (in octets and packets) that flows in the selected autonomous systems conversation
through the selected interface of a device.
The columns display depend on the flow direction, either Inbound or Outbound for the selected time period.
Top Destination Autonomous Systems
This dashboard provides a view of the top 10 list of destination Autonomous Systems with highest bandwidth consumption. Destination Autonomous Systems are listed
with the amount of data that is transferred, in both octets and packets, and the percentage of traffic utilization generated by the autonomous system over the specified
time period.
Note:
You can select the Table 1 that you want to display in dashboards to which the filter is assigned.
Table 2. Available Widgets
Widget Name Chart Type Description
Top 10 Destination
Autonomous Systems
Donut Displays the top 10 destination Autonomous Systems name with its total traffic volume in octets.
The percentage of the destination is based on the selected destination that is shown by the widget. The individual
destination in the legend adds up to 100%. This percentage can be absolute or relative.
Traffic Volume Trend Timeseries This timeseries widget displays the Traffic Volume trend in octets across a selected time.
You can choose to display the Utilization trend in percentage or the Throughput trend in bit per second (bps).
It describes how the destination of Autonomous Systems traffic uses the interface bandwidth in octets, bps, or
percentage.
Top 10 Destination
Autonomous Systems
Grid Displays the Top 10 traffic data (in octets and packets) that flows in the selected autonomous systems destination through
the selected interface of a device.
Displays the Top 10 traffic data (in octets and packets) of device destination of Autonomous Systems through the selected
interface.
The columns display depend on the flow direction, either Inbound or Outbound for the selected time period.
Top Source Autonomous Systems
This dashboard provides a view of the top 10 list of source Autonomous Systems with highest bandwidth consumption. Source Autonomous Systems are listed with the
amount of data that is transferred, in both octets and packets, and the percentage of traffic utilization generated by the autonomous system over the specified time period.
Table 3. Available Widgets
Widget Name Chart Type Description
418 IBM Telco Network Cloud Manager - Performance 1.4.5

Widget Name Chart Type Description
Top 10 Source
Autonomous Systems
Donut Displays the top 10 source Autonomous Systems name with its total traffic volume in octets.
The percentage of the source is based on the selected source that is shown by the widget. The individual application in the
legend adds up to 100%. This percentage can be absolute or relative.
Traffic Volume Trend Timeseries This timeseries widget displays the Traffic Volume trend in octets across a selected time.
You can choose to display the Utilization trend in percentage or the Throughput Trend in bit per second (bps).
It describes how the conversation of Autonomous Systems traffic uses the interface bandwidth in octets, bps, or percentage.
Top 10 Source
Autonomous Systems
Grid Displays the Top 10 traffic data (in octets and packets) that flows in the selected autonomous systems sources through the
selected interface of a device.
The columns display depend on the flow direction, either Inbound or Outbound for the selected time period.
Conversations dashboards
This topic gives you an overview of the Conversations dashboards usage.
To access the Conversations dashboards, click NetFlow > Conversations and select any one of the dashboards:
Top Conversations with Application
Top Conversations with ToS
Top Conversations
Top Conversations with Application
This dashboard provides a view of the top 10 most bandwidth consuming conversations with applications that are conducted over your monitored network. Conversations
with application are listed with the amount of data that is transferred in the conversation, in both octets and packets.
Note:
You can select the Table 1 that you want to display in dashboards to which the filter is assigned.
Table 1. Available Widgets
Widget Name Chart Type Description
Top 10 Conversations
with Application
Donut Displays the top 10 conversations with application name with its total traffic volume in octets.
The percentage of the conversations with application is based on the selection on the widget. The individual conversation
with application in the legend adds up to 100%. This percentage can be absolute or relative.
Traffic Volume Trend Timeseries This timeseries widget displays the Traffic Volume trend in octets across a selected time period.
You can choose to display the Utilization trend in percentage or the Throughput trend in bit per second (bps).
It describes how the conversation traffic uses the interface bandwidth in octets, bps, or percentage.
Top 10 Conversations
with Application
Grid Displays the Top 10 traffic data (in octets and packets) that flows in the selected conversations with application through the
selected interface of a device.
The columns display depend on the flow direction, either Inbound or Outbound for the selected time period.
Top Conversations with ToS
This dashboard provides a view of the top 10 most bandwidth consuming conversations with ToS conducted over your monitored network. Conversations with ToS are
listed with the amount of data that is transferred in the conversation, in both octets and packets.
Table 2. Available Widgets
Widget Name Chart Type Description
Top 10
Conversations with
ToS
Donut Displays the top 10 conversations with ToS name with its total traffic volume in octets.
The percentage of the conversations with ToS is based on the selection on the widget. The individual conversation in the legend
adds up to 100%. This percentage can be absolute or relative.
Traffic Volume Trend Timeseries This timeseries widget displays the Traffic Volume trend in octets across a selected time period.
You can choose to display the Utilization trend in percentage or the Throughput trend in bit per second (bps).
It describes how the conversation traffic uses the interface bandwidth in octets, bps, or percentage.
Top 10
Conversations with
ToS
Grid Displays the Top 10 traffic data (in octets and packets) that flows in the selected conversations with ToS through the selected
interface of a device.
The columns display depend on the flow direction, either Inbound or Outbound for the selected time period.
Top Conversations
This dashboard provides a view of the top 10 most bandwidth consuming conversations, which are conducted over your monitored network. Conversations are listed with
the amount of data that is transferred in the conversation, in both octets and packets.
Table 3. Available Widgets
Widget Name Chart Type Typical uses
IBM Telco Network Cloud Manager - Performance 1.4.5 419

Widget Name Chart Type Typical uses
Top 10
Conversations
Donut Displays the top 10 conversations name with its total traffic volume in octets.
The percentage of the conversations is based on the selected conversation that is shown by the widget. The individual conversation
in the legend adds up to 100%. This percentage can be absolute or relative.
Traffic Volume
Trend
Timeseries This timeseries widget displays the Traffic Volume trend in octets across a selected time period.
You can choose to display the Utilization trend in percentage or the Throughput Trend in bit per second (bps).
It describes how the conversation traffic uses the interface bandwidth in octets, bps, or percentage.
Top 10
Conversations
Grid Displays the Top 10 traffic data (in octets and packets) that flows in the selected conversations through the selected interface of a
device.
The columns display depend on the flow direction, either Inbound or Outbound for the selected time period.
IP Address Grouping dashboards
This topic gives you an overview of the IP Address Grouping dashboards usage.
To access the IP Address Grouping dashboards, click NetFlow > IP Address Grouping and select any one of the dashboards:
Top IP Group Conversations with Application
Top IP Group Conversations with ToS
Top IP Group Conversations
Top IP Group Conversations with Protocol
Top Destination IP groups with Application
Top Destination IP Groups with Protocol
Top Destination IP Groups with ToS
Top Destination IP Groups
Top Source IP Groups with Application
Top Source IP Groups with Protocol
Top Source IP Groups with ToS
Top Source IP Groups
Top IP Group Conversations with Application
This dashboard provides a view of the top 10 bandwidth consuming conversations with application that is associated with an IP address group, which is responsible for
the most traffic on your network.
Table 1. Available Widgets
Widget Name Chart Type Description
Top 10 IP Group
Conversations with
Application
Donut Displays the top 10 IP Group conversations with application name and its total traffic volume in octets.
The percentage of the IP Group conversations with application is based on the selection on the widget. The individual IP
Group conversations with application adds up to 100%. This percentage can be absolute or relative.
Traffic Volume Trend Timeseries This timeseries widget displays the Traffic Volume trend in octets across a selected time period.
You can choose to display the Utilization trend in percentage or the Throughput trend in bit per second (bps).
It describes how the IP Group conversations with application traffic utilize the interface bandwidth in octets, bps, or
percentage.
Top 10 IP Group
Conversations with
Application
Grid Displays the Top 10 traffic data (in octets and packets) that flows in the selected IP Group conversations with application
through the selected interface of a device.
The columns display depend on the flow direction, either Inbound or Outbound for the selected time period.
Top IP Group Conversations with Protocol
This dashboard provides a view of the top 10 bandwidth consuming conversations with protocols that are associated with an IP address group, which is responsible for
the most traffic on your network.
Table 2. Available Widgets
Widget Name Chart Type Description
Top 10 IP Group
Conversations with
Protocol
Donut Displays the top 10 conversation IP Groups with protocol name and its total traffic volume in octets.
The percentage of the IP Group conversations with protocol based on the selection on the widget. The individual
conversation IP Groups with protocol adds up to 100%. This percentage can be absolute or relative.
Traffic Volume Trend Timeseries This timeseries widget displays the Traffic Volume trend in octets across a selected time period.
You can choose to display the Utilization trend in percentage or the Throughput trend in bit per second (bps).
It describes how the IP Group conversations with protocols traffic utilize the interface bandwidth in octets, bps, or
percentage.
Top 10 IP Group
Conversations with
Protocol
Grid Displays the Top 10 traffic data (in octets and packets) that flows in the selected conversation IP Groups with protocol
through the selected interface of a device.
The columns display depend on the flow direction, either Inbound or Outbound for the selected time period.
420 IBM Telco Network Cloud Manager - Performance 1.4.5

Top IP Group Conversations with ToS
This dashboard provides a view of the top 10 bandwidth consuming conversations with ToS associated with an IP address group, which is responsible for the most traffic
on your network.
Table 3. Available Widgets
Widget Name Chart Type Description
Top 10 IP Group
Conversations with ToS
Donut Displays the top 10 IP Group conversations with ToS name and its total traffic volume in octets.
The percentage of the IP Group conversations with ToS based on the selection on the widget. The individual IP Group
conversations with ToS adds up to 100%. This percentage can be absolute or relative.
Traffic Volume Trend Timeseries This timeseries widget displays the Traffic Volume trend in octets across a selected time period.
You can choose to display the Utilization trend in percentage or the Throughput trend in bit per second (bps).
It describes how the IP Group conversations with ToS traffic utilize the interface bandwidth in octets, bps, or percentage.
Top 10 IP Group
Conversations with ToS
Grid Displays the Top 10 traffic data (in octets and packets) that flows in the selected IP Group conversations with ToS through
the selected interface of a device.
The columns display depend on the flow direction, either Inbound or Outbound for the selected time period.
Top IP Group Conversations
This dashboard provides a view of the top 10 bandwidth consuming conversations that is associated with an IP address group, which is responsible for the most traffic on
your network.
Note:
You can select the Table 1 that you want to display in dashboards to which the filter is assigned.
Table 4. Available Widgets
Widget Name Chart Type Description
Top 10 IP Group
Conversations
Donut Displays the top 10 IP Group conversations and its total traffic volume in octets.
The percentage of the IP Group conversations is based on the selection on the widget. The individual IP Group conversations
add ups to 100%. This percentage can be absolute or relative.
Traffic Volume Trend Timeseries This timeseries widget displays the Traffic Volume trend in octets across a selected time period.
You can choose to display the Utilization trend in percentage or the Throughput trend in bit per second (bps).
It describes how the IP Group conversations traffic utilize the interface bandwidth in octets, bps, or percentage.
Top 10 IP Group
Conversations
Grid Displays the Top 10 traffic data (in octets and packets) that flows in the selected IP Group conversations through the selected
interface of a device.
The columns display depend on the flow direction, either Inbound or Outbound for the selected time period.
Top Destination IP Groups with Application
This dashboard provides a view of the top 10 domains that serve as destinations of traffic on the network with applications that are associated with an IP address group,
which is responsible for the most traffic on your network.
Table 5. Available Widgets
Widget Name Chart Type Description
Top 10 Destination IP
Groups with Application
Donut Displays the top 10 destination IP Groups with application name and its total traffic volume in octets.
The percentage of the destination IP Groups with application based on the selection on the widget. The individual
destination IP Groups with application adds up to 100%. This percentage can be absolute or relative.
Traffic Volume Trend Timeseries This timeseries widget displays the Traffic Volume trend in octets across a selected time period.
You can choose to display the Utilization trend in percentage or the Throughput trend in bit per second (bps).
It describes how the destination IP Groups with applications traffic utilize the interface bandwidth in octets, bps, or
percentage.
Top 10 Destination IP
Groups with Application
Grid Displays the Top 10 traffic data (in octets and packets) that flows in the selected destination IP Groups with application
through the selected interface of a device.
The columns display depend on the flow direction, either Inbound or Outbound for the selected time period.
Top Destination IP Groups with Protocol
This dashboard provides a view of the top 10 domains that serve as destinations of traffic on the network with protocol that are associated with an IP address group,
which is responsible for the most traffic on your network.
Table 6. Available Widgets
Widget Name Chart Type Description
Top 10 Destination IP
Groups with Protocol
Donut Displays the top 10 destination IP Groups with protocol name and its total traffic volume in octets.
The percentage of the destination IP Groups with protocols based on the selection on the widget. The individual
destination IP Groups with protocol adds up to 100%. This percentage can be absolute or relative.
IBM Telco Network Cloud Manager - Performance 1.4.5 421

Widget Name Chart Type Description
Traffic Volume Trend Timeseries This timeseries widget displays the Traffic Volume trend in octets across a selected time period.
You can choose to display the Utilization trend in percentage or the Throughput trend in bit per second (bps).
It describes how the destination IP Groups with protocols traffic utilize the interface bandwidth in octets, bps, or
percentage.
Top 10 Destination IP
Groups with Protocol
Grid Displays the Top 10 traffic data (in octets and packets) that flows in the selected destination IP Groups with protocol
through the selected interface of a device.
The columns display depend on the flow direction, either Inbound or Outbound for the selected time period.
Top Destination IP Groups with ToS
This dashboard provides a view of the top 10 domains that serve as destinations of traffic on the network with ToS that are associated with an IP address group, which is
responsible for the most traffic on your network.
Table 7. Available Widgets
Widget Name Chart Type Description
Top 10 Destination IP
Groups with ToS
Donut Displays the top 10 destination IP Groups with ToS name and its total traffic volume in octets.
The percentage of the destination IP Groups with ToS is based on the selection on the widget. The individual destination IP
Groups with ToS adds up to 100%. This percentage can be absolute or relative.
Traffic Volume Trend Timeseries This timeseries widget displays the Traffic Volume trend in octets across a selected time period.
You can choose to display the Utilization trend in percentage or the Throughput trend in bit per second (bps).
It describes how the destination IP Groups with ToS traffic utilize the interface bandwidth in octets, bps, or percentage.
Top 10 Destination IP
Groups with ToS
Grid Displays the Top 10 traffic data (in octets and packets) that flows in the selected destination IP Groups with ToS through the
selected interface of a device.
The columns display depend on the flow direction, either Inbound or Outbound for the selected time period.
Top Destination IP Groups
This dashboard provides a view of the top 10 domains that serve as destinations of traffic on the network that are associated with an IP address group, which is
responsible for the most traffic on your network.
Table 8. Available Widgets
Widget Name Chart Type Description
Top 10 Destination
IP Groups
Donut Displays the top 10 destination IP Groups and its total traffic volume in octets.
The percentage of the destination IP Groups based on the selection on the widget. The individual destination IP Groups adds up
to 100%. This percentage can be absolute or relative.
Traffic Volume Trend Timeseries This timeseries widget displays the Traffic Volume trend in octets across a selected time period.
You can choose to display the Utilization trend in percentage or the Throughput trend in bit per second (bps).
It describes how the destination IP Groups with applications traffic utilize the interface bandwidth in octets, bps, or percentage.
Top 10 Destination
IP Groups
Grid Displays the Top 10 traffic data (in octets and packets) that flows in the selected destination IP Groups through the selected
interface of a device.
The columns display depend on the flow direction, either Inbound or Outbound for the selected time period.
Top Source IP Groups with Application
This dashboard provides a view of the top 10 source hosts that contribute to traffic on the network with applications that are associated with IP address group, which is
responsible for the most traffic on your network.
Table 9. Available Widgets
Widget Name Chart Type Description
Top 10 Source IP Groups
with Application
Donut Displays the top 10 source IP Groups with application name and its total traffic volume in octets.
The percentage of the source IP Groups with application is based on the selection on the widget. The individual source IP
Groups with application adds up to 100%. This percentage can be absolute or relative.
Traffic Volume Trend Timeseries This timeseries widget displays the Traffic Volume trend in octets across a selected time period.
You can choose to display the Utilization trend in percentage or the Throughput trend in bit per second (bps).
It describes how the source IP Groups with applications traffic utilize the interface bandwidth in octets, bps, or percentage.
Top 10 Source IP Groups
with Application
Grid Displays the Top 10 traffic data (in octets and packets) that flows in the selected source IP Groups with application through
the selected interface of a device.
The columns display depend on the flow direction, either Inbound or Outbound for the selected time period.
Top Source IP Groups with Protocol
422 IBM Telco Network Cloud Manager - Performance 1.4.5

This dashboard provides a view of the top 10 source hosts that contribute to traffic on the network with protocols that are associated with IP address group, which is
responsible for the most traffic on your network.
Table 10. Available Widgets
Widget Name Chart Type Description
Top 10 Source IP
Groups with Protocol
Donut Displays the top 10 source IP Groups with protocol name and its total traffic volume in octets.
The percentage of the source IP Groups with protocol is based on the selection on the widget. The individual source IP
Groups with protocol adds up to 100%. This percentage can be absolute or relative.
Traffic Volume Trend Timeseries This timeseries widget displays the Traffic Volume trend in octets across a selected time period.
You can choose to display the Utilization trend in percentage or the Throughput trend in bit per second (bps).
It describes how the source IP Groups with protocols traffic utilize the interface bandwidth in octets, bps, or percentage.
Top 10 Source IP
Groups with Protocol
Grid Displays the Top 10 traffic data (in octets and packets) that flows in the selected source IP Groups with protocol through the
selected interface of a device.
The columns display depend on the flow direction, either Inbound or Outbound for the selected time period.
Top Source IP Groups with ToS
This dashboard provides a view of the top 10 source hosts that contribute to traffic on the network with ToS associated with IP address groups, which is responsible for
the most traffic on your network.
Table 11. Available Widgets
Widget Name Chart Type Description
Top 10 Source IP
Groups with ToS
Donut Displays the top 10 source IP Groups with ToS name and its total traffic volume in octets.
The percentage of the source IP Groups with ToS is based on the selection on the widget. The individual source IP Groups
with ToS adds up to 100%. This percentage can be absolute or relative.
Traffic Volume Trend Timeseries This timeseries widget displays the Traffic Volume trend in octets across a selected time period.
You can choose to display the Utilization trend in percentage or the Throughput trend in bit per second (bps).
It describes how the source IP Groups with ToS traffic utilize the interface bandwidth in octets, bps, or percentage.
Top 10 Source IP
Groups with ToS
Grid Displays the Top 10 traffic data (in octets and packets) that flows in the selected source IP Groups with ToS through the
selected interface of a device.
The columns display depend on the flow direction, either Inbound or Outbound for the selected time period.
Top Source IP Groups
This dashboard provides a view of the top 10 source hosts that contribute to traffic on the network that are associated with IP address group, which is responsible for the
most traffic on your network.
Table 12. Available Widgets
Widget Name Chart Type Description
Top 10 Source IP
Groups
Donut Displays the top 10 source IP Groups and its total traffic volume in octets.
The percentage of the source IP Groups based on the selection on the widget. The individual source IP Groups adds up to 100%.
This percentage can be absolute or relative.
Traffic Volume
Trend
Timeseries This timeseries widget displays the Traffic Volume trend in octets across a selected time period.
You can choose to display the Utilization trend in percentage or the Throughput trend in bit per second (bps).
It describes how the source IP Groups with applications traffic utilize the interface bandwidth in octets, bps, or percentage.
Top 10 Source IP
Groups
Grid Displays the Top 10 traffic data (in octets and packets) that flows in the selected source IP Groups through the selected interface
of a device.
The columns display depend on the flow direction, either Inbound or Outbound for the selected time period.
Destinations dashboards
This topic gives you an overview of the Destinations dashboards usage.
To access the Destinations dashboards, click NetFlow > Destinations and select any one of the dashboards:
Top Destinations
Top Destinations with Application
Top Destinations
This dashboard provides a view of the top 10 domains that serve as destinations of traffic on the network, ranked by percentage of the total traffic over the specified time
period.
Table 1. Available Widgets
IBM Telco Network Cloud Manager - Performance 1.4.5 423

Widget Name Chart Type DescriptionWidget Name Chart Type Description
Top 10
Destinations
Donut Displays the top 10 destinations name with its total traffic volume in octets.
The percentage of the destinations is based on the selected destinations that are shown by the widget. The individual destination
adds up to 100%. This percentage can be absolute or relative.
Traffic Volume
Trend
Timeseries This timeseries widget displays the Traffic Volume trend in octets across a selected time period.
You can choose to display the Utilization trend in percentage or the Throughput trend in bit per second (bps).
It describes how the destinations traffic uses the interface bandwidth in octets, bps, or percentage.
Top 10
Destinations
Grid Displays the Top 10 traffic data (in octets and packets) that flows in the selected destinations through the selected interface of a
device.
The columns display depend on the flow direction, either Inbound or Outbound for the selected time period.
Top Destinations with Application
This dashboard provides a view of the top 10 destinations with application responsible for monitored traffic on your network, ranked in order of traffic volume.
Note:
You can select the Table 1 that you want to display in dashboards to which the filter is assigned.
Table 2. Available Widgets
Widget Name Chart Type Description
Top 10 Destinations
with Application
Donut Displays the top 10 destinations with application name with its total traffic volume in octets.
The percentage of the destinations with application is based on the selection on the widget. The individual destination with
application adds up to 100%. This percentage can be absolute or relative.
Traffic Volume Trend Timeseries This timeseries widget displays the Traffic Volume trend in octets across a selected time period.
You can choose to display the Utilization trend in percentage or the Throughput trend in bit per second (bps).
It describes how the destinations traffic uses the interface bandwidth in octets, bps, or percentage.
Top 10 Destinations
with Application
Grid Displays the Top 10 traffic data (in octets and packets) that flows in the selected destination with application through the
selected interface of a device.
The columns display depend on the flow direction, either Inbound or Outbound for the selected time period.
Protocols dashboards
This topic gives you an overview of the Protocols dashboards usage.
To access the Protocols dashboards, click NetFlow > Protocols and select any one of the dashboards:
Top Protocols
Top Protocols with Application
Top Protocols with Source
Top Protocols with Destination
Top Protocols with Conversation
Top Protocols
This dashboard provides a view of the top 10 of the protocols used most for traffic on your monitored network.
Table 1. Available Widgets
Widget Name Chart Type Description
Top 10
Protocols
Donut Displays the top 10 protocols name with its total traffic volume in octets.
The percentage of the protocols is based on the selected destinations that are shown by the widget. The individual protocol adds up
to 100%. This percentage can be absolute or relative.
Traffic Volume
Trend
Timeseries This timeseries widget displays the Traffic Volume trend in octets across a selected time period.
You can choose to display the Utilization trend in percentage or the Throughput trend in bit per second (bps).
It describes how the protocols traffic uses the interface bandwidth in octets, bps, or percentage.
Top 10
Protocols
Grid Displays the Top 10 traffic data (in octets and packets) that flows in the selected protocols through the selected interface of a
device.
The columns display depend on the flow direction, either Inbound or Outbound for the selected time period.
Top Protocols with Application
This dashboard provides a view of the top 10 of the protocols with application used most for traffic on your monitored network.
Table 2. Available Widgets
Widget Name Chart Type Description
424 IBM Telco Network Cloud Manager - Performance 1.4.5

Widget Name Chart Type Description
Top 10 Protocols with
Application
Donut Displays the top 10 protocols with application name and its total traffic volume in octets.
The percentage of the protocols with application is based on the selection on the widget. The individual protocol with
application adds up to 100%. This percentage can be absolute or relative.
Traffic Volume Trend Timeseries This timeseries widget displays the Traffic Volume trend in octets across a selected time period.
You can choose to display the Utilization trend in percentage or the Throughput trend in bit per second (bps).
It describes how the protocols with application traffic utilize the interface bandwidth in octets, bps, or percentage.
Top 10 Protocols with
Application
Grid Displays the Top 10 traffic data (in octets and packets) that flows in the selected protocols with application through the
selected interface of a device.
The columns display depend on the flow direction, either Inbound or Outbound for the selected time period.
Top Protocols with Source
This dashboard provides a view of the top 10 of the protocols with source used most for traffic on your monitored network.
Table 3. Available Widgets
Widget Name Chart Type Description
Top 10 Protocols
with Source
Donut Displays the top 10 protocols with source name and its total traffic volume in octets.
The percentage of the protocols with source is based on the selection on the widget. The individual protocol with source adds
up to 100%. This percentage can be absolute or relative.
Traffic Volume Trend Timeseries This timeseries widget displays the Traffic Volume trend in octets across a selected time period.
You can choose to display the Utilization trend in percentage or the Throughput trend in bit per second (bps).
It describes how the protocols with source traffic utilize the interface bandwidth in octets, bps, or percentage.
Top 10 Protocols
with Source
Grid Displays the Top 10 traffic data (in octets and packets) that flows in the selected protocols with source through the selected
interface of a device.
The columns display depend on the flow direction, either Inbound or Outbound for the selected time period.
Top Protocols with Destination
This dashboard provides a view of the top 10 of the protocols with destination used most for traffic on your monitored network.
Table 4. Available Widgets
Widget Name Chart Type Description
Top 10 Protocols with
Destination
Donut Displays the top 10 protocols with destination name and its total traffic volume in octets.
The percentage of the protocols with destinations is based on the selection on the widget. The individual protocol with
destination adds up to 100%. This percentage can be absolute or relative.
Traffic Volume Trend Timeseries This timeseries widget displays the Traffic Volume trend in octets across a selected time period.
You can choose to display the Utilization trend in percentage or the Throughput trend in bit per second (bps).
It describes how the protocols with destination traffic utilize the interface bandwidth in octets, bps, or percentage.
Top 10 Protocols with
Destination
Grid Displays the Top 10 traffic data (in octets and packets) that flows in the selected protocols with destination through the
selected interface of a device.
The columns display depend on the flow direction, either Inbound or Outbound for the selected time period.
Top Protocols with Conversation
This dashboard provides a view of the top 10 of the protocols with conversation used most for traffic on your monitored network.
Note:
You can select the Table 1 that you want to display in dashboards to which the filter is assigned.
Table 5. Available Widgets
Widget Name Chart Type Description
Top 10 Protocols with
Conversation
Donut Displays the top 10 protocols with conversation name and its total traffic volume in octets.
The percentage of the protocols with conversation is based on the selection on the widget. The individual protocol with
conversation adds up to 100%. This percentage can be absolute or relative.
Traffic Volume Trend Timeseries This timeseries widget displays the Traffic Volume trend in octets across a selected time period.
You can choose to display the Utilization trend in percentage or the Throughput trend in bit per second (bps).
It describes how the protocols with conversations traffic utilize the interface bandwidth in octets, bps, or percentage.
Top 10 Protocols with
Conversation
Grid Displays the Top 10 traffic data (in octets and packets) that flows in the selected protocols with conversation through the
selected interface of a device.
The columns display depend on the flow direction, either Inbound or Outbound for the selected time period.
IBM Telco Network Cloud Manager - Performance 1.4.5 425

QoS Queue dashboards
This topic gives you an overview of the QoS Queue dashboard usage.
QoS Queue drops
1. Click NetFlow > QoS Queue > QoS Queue drops.
The QoS Queue drops: Outbound Traffic Details for Interface dashboard loads.
This dashboard provides a view of the top 10 most QoS Queue drops for traffic on your monitored network for an outbound interface of a device.
It provides the visibility of how the defined traffic classes are performing in terms of packet drops.
Note:
You can select the Table 1 that you want to display in dashboards to which the filter is assigned.
Table 1. Available Widgets
Widget Name Chart Type Description
QoS Queue
drops
Donut Displays the top 10 QoS Queue drops ID with its total drops in packets.
The percentage of the QoS Queue drops is based on the selection on the widget. The individual QoS Queue Drop adds up to 100%.
This percentage can be absolute or relative.
Packet drop
trend
Timeseries This timeseries widget displays the Packet Drop trend in packets across a selected time period.
QoS Queue
drops
Grid Displays the Top 10 QoS Queue drops data in packets that flows in the selected queue for an outbound interface of a device.
Sources dashboards
This topic gives you an overview of the Sources dashboards usage.
To access the Sources dashboards, click NetFlow > Sources and select any one of the dashboards:
Top Sources
Top Sources with Application
Top Sources
This dashboard provides a view of the top 10 sources of traffic used most for traffic on your monitored network.
Note:
You can select the Table 1 that you want to display in dashboards to which the filter is assigned.
Table 1. Available Widgets
Widget Name Chart Type Description
Top 10 Sources Donut Displays the top 10 sources name with its total traffic volume in octets.
The percentage of the sources is based on the selected sources that are shown by the widget. The individual source adds up to
100%. This percentage can be absolute or relative.
Traffic Volume
Trend
Timeseries This timeseries widget displays the Traffic Volume trend in octets across a selected time period.
You can choose to display the Utilization trend in percentage or the Throughput trend in bit per second (bps).
It describes how the sources traffic uses the interface bandwidth in octets, bps, or percentage.
Top 10 Sources Grid Displays the Top 10 traffic data (in octets and packets) that flows in the selected sources through the selected interface of a device.
The columns display depend on the flow direction, either Inbound or Outbound for the selected time period.
Top Sources with Application
This dashboard provides a view of the top 10 sources of traffic with application used most for traffic on your monitored network.
Table 2. Available Widgets
Widget Name Chart Type Description
Top 10 Sources with
Application
Donut Displays the top 10 sources with application name with its total traffic volume in octets.
The percentage of the sources with applications is based on the selection on the widget. The individual sources with
application adds up to 100%. This percentage can be absolute or relative.
Traffic Volume Trend Timeseries This timeseries widget displays the Traffic Volume trend in octets across a selected time period.
You can choose to display the Utilization trend in percentage or the Throughput trend in bit per second (bps).
It describes how the sources with applications traffic utilize the interface bandwidth in octets, bps, or percentage.
426 IBM Telco Network Cloud Manager - Performance 1.4.5

Widget Name Chart Type Description
Top 10 Sources with
Applications
Grid Displays the Top 10 traffic data (in octets and packets) that flows in the selected sources with applications through the
selected interface of a device.
The columns display depend on the flow direction, either Inbound or Outbound for the selected time period.
ToS dashboards
This topic gives you an overview of the ToS dashboard usage.
Top ToS
1. Click NetFlow > ToS > Top ToS.
The Top ToS: Traffic Volume Details for Interface dashboard loads.
This dashboard provides a view of the top 10 most bandwidth consuming Type of Service (ToS) for an interface.
Note:
You can select the Table 1 that you want to display in dashboards to which the filter is assigned.
Table 1. Available Widgets
Widget Name Chart Type Description
Top 10 ToS Donut Displays the top 10 ToS name with its total traffic volume in octets.
The percentage of the ToS is based on the selected ToS shown by the widget. The individual source adds up to 100%. This
percentage can be absolute or relative.
Traffic Volume
Trend
Timeseries This timeseries widget displays the Traffic Volume trend in octets across a selected time period.
You can choose to display the Utilization trend in percentage or the Throughput trend in bit per second (bps).
It describes how the ToS traffic uses the interface bandwidth in octets, bps, or percentage.
Top 10 ToS Grid Displays the Top 10 traffic data (in octets and packets) that flows in the selected ToS through the selected interface of a device.
The columns display depend on the flow direction, either Inbound or Outbound for the selected time period.
Network traffic overview dashboard
Network traffic overview dashboard provides comprehensive bandwidth analysis and performance metrics monitoring capabilities by monitoring the worst performing
interfaces. It helps you to understand further the interface utilization trend and also the IP traffic composition that is related to that interface based on the flow data
collected.
Use Network traffic overview dashboard to monitor network performance details of a particular interface, the traffic trends, and the usage patterns of your network. It
identifies the network Top Talkers on applications that use the most network bandwidth.
Available widgets and their interactivity
The master-listener and drill-down widget interactions can be seen in the following ways:
For any widgets with the ( ) drill-down icon, from the chart, click any bar that represents the interface or metric to open the drill-down dashboard page, which
contains the associated widgets.
For the other widgets that are shown in the diagram to be in a master-listener or drill-down interaction, click any of the bars that represent the interface to change
the listener widget that displays the related data for the selected interface.
The diagram shows the master-listener, and drill-down interactions between the available widgets:
IBM Telco Network Cloud Manager - Performance 1.4.5 427

Network traffic overview
1. Click NetFlow > Network traffic overview .
The Network Traffic Overview: Top 10 Traffic dashboard loads.
This dashboard provides a view of the top 10 traffic details that are ranked in order by traffic volume.
2. You can filter data based on the following filters:
Site, the list contains the locations to view the traffic levels.
Business Hour , the list contains of Business Hour, Non-Business Hour, and both as ALL.
Time Period, the list contains of Last Hour, and Last 24 Hours.
Note:
You can categorize your enterprise network based on different geographical areas and sites. You can configure the sites by specifying the IP address ranges
and the time period for business hours and non-business hours. To configure these properties, see Managing site grouping.
Refer to the conditions applied when you're using the Site and Business Hour filter options.
The six widgets of IP Traffic composition for selected interface are replaced with two new widgets, which are represented by Sankey diagrams.
The new widgets are as follows:
Top 10 Sources with Applications and Destinations
This widget shows the traffic flow and traffic volume between Source and Destination servers and applications.
Available widgets and their interactions
Table 1. Available widgets
Widget name Chart type Typical uses
Top 10 Inbound Utilization
(%)
Bar Display the top 10 worst performing inbound or outbound interfaces, which are based on the interface utilization metric
that is calculated from the flow data collected. The data is displayed based on the selected time period.
Top 10 Outbound
Utilization (%)
Bar
Utilization Deviation Badge Display the interface utilization deviation percentage.
The utilization deviation metric is calculated by comparing the interface utilization values of the previous four weeks over
the same time period.
Utilization Badge Display the interface utilization percentage.
Traffic Volume (Octets) Badge Display the traffic volume in octets for the selected interface.
Interface Speed (bps) Badge Display the interface speed in bits per second (bps).
4-Weeks Utilization Trend Bar Displays the interface utilization trend of the selected interface.
Note: The deviation is calculated based on the 30-minutes aggregation table.
Utilization Trend Timeseries Displays the time-series utilization performance of the selected interface and time period.
Top 10 Sources with
Applications and
Destination
Sankey Displays the top 10 sources IP that consumes the most network bandwidth while interacting with Applications. The
bandwidth consumed by Applications while interacting with Destinations is also displayed.
The thicker the width of the arrows of Sankey diagram, the more is the bandwidth.
Click the Find out more details about top protocols with source. Click here link to see the Top Protocols with Source aggregation dashboard. You can navigate to other
pages from here.
Related concepts
Protocols dashboards
SD-WAN dashboards
Software-defined Wide Area Network (SD-WAN) dashboards in Telco Network Cloud Manager - Performance support applications that are hosted in on-premises data
centers, public or private clouds, and SaaS services. Currently, only Cisco devices are supported. These dashboards work together with Cisco SD-WAN controllers and
provide seamless visibility into the network.
With the introduction of SD-WAN monitoring to Telco Network Cloud Manager - Performance, you can now monitor the traditional MPLS, broadband, 4G LTE networks, and
cloud-based network in a single pane of glass view.
You can identify packet loss, latency, and jitter to maintain consistent network performance and to avoid outages and congestion. SD-WAN is an intelligent cloud-first way
to build your WAN for off-the shelf hardware, virtual instances, private and public cloud. Since it has application aware routing, it can be used in prioritizing business
needs. SD-WAN implementation comes with zero-touch deployment of the devices and centralized orchestration with Cisco vManage.
The job of SD-WAN is to connect the end-users to their respective applications, anytime, anywhere, and from any device.
SD-WAN health overview
NOC Engineers can get visibility of the SD-WAN network health status. They can zoom into specific problematic sites to understand more about the device,
interface, application, WAN link and tunnel health performance.
Tunnel QoE
SD-WAN uses tunnel technology to provide overlays on the transport underlay. SD-WAN is implemented as a network of devices that are connected by encrypted
tunnels. Each SD-WAN device is connected to a set of network services (MPLS, broadband services, and 4G LTE) and monitors the current availability and
performance of these network services.
428 IBM Telco Network Cloud Manager - Performance 1.4.5

Application performance
Application visibility is an important feature of SD-WAN and it is connected to other use cases in SD-WAN solutions. You can monitor and analyze the data traffic in
detail. You can also correlate the protocols and applications and classify them based on the business needs and SLAs.
Device health
You can monitor key device health parameters proactively on the Device health dashboard and identify any anomalies from just visualizing the trend charts. You can
view the time-trended line graphs for the selected device.
Related information
5 use cases for Cisco SD WAN
Cisco SD WAN Application performance optimization
SD-WAN health overview
NOC Engineers can get visibility of the SD-WAN network health status. They can zoom into specific problematic sites to understand more about the device, interface,
application, WAN link and tunnel health performance.
Available widgets and their interactivity
Follow these steps to view the SD-WAN health overviewdashboard and its widgets:
1. Click SD-WAN > SD-WAN health overview.
The dashboard displays various widgets to monitor the SD-WAN network.
2. From the filter options, choose the Time period.
You can select the time range that you want to display in dashboards to which the filter is assigned. For more information, see Generic functions of Telco Network
Cloud Manager - Performance Dashboards.
3. Click Apply filter.
The SD-WAN health overview dashboard loads and displays the widgets with details for the selected time period.
4. Click any device in the Device details table to display the related data in all other listener widgets.
Table 1. Widget interactions
Controller widgets Listener widgets Drill-down widgets
Device details Top 10 Interface Utilization (%) Interface details
Top 10 Tunnels Tunnel QoE
Top 10 Applications Application performance
Top 10 WAN Link Latency (ms) WAN link details
Table 2. Available widgets
Widget name Chart type Description
Device details Grid Displays the device CPU and Memory Utilization, as well as aggregated traffic inbound and outbound volume.
Badge Click Configure SD-WAN controller profiles. Click here. link to launch the SD-WAN controller profiles
configuration page.
Top 10 Interface Utilization
(%)
Bar Displays the bandwidth utilization by top 10 interfaces in your WAN network.
Click any entry to drill down to the Interface details dashboard.
Top 10 Tunnels Grid Displays top 10 SD-WAN tunnels with the following data:
Tunnel endpoint
Tunnel status
Tunnel Jitter
Click any entry to drill down to the Tunnel QoE dashboard.
Top 10 Applications Donut Displays the top 10 applications based on their bandwidth usage to address application performance
optimization.
Click any area in the donut chart to drill down to the Application performance dashboard.
Top 10 WAN Links Latency
(ms)
Line Displays the top 10 WAN links with highest latency.
Click any data point on the line chart to drill down to the WAN link details dashboard.
Interface details
Another important use case in SD-WAN solution is secure direct internet access where the internet traffic is not backhauled from a branch office to a centralized
data center. Backhauling traffic to a centralized data center causes increased bandwidth utilization for the security and network devices and links at the central site,
as well as increased latency that has an impact on application performance. Direct internet access can help solve these issues by allowing Internet-bound traffic.
WAN link details
WAN link is a communication circuit that joins two or more local area networks (LANs) into a wide area network.
Interface details
IBM Telco Network Cloud Manager - Performance 1.4.5 429

Another important use case in SD-WAN solution is secure direct internet access where the internet traffic is not backhauled from a branch office to a centralized data
center. Backhauling traffic to a centralized data center causes increased bandwidth utilization for the security and network devices and links at the central site, as well as
increased latency that has an impact on application performance. Direct internet access can help solve these issues by allowing Internet-bound traffic.
The Interface details dashboard has the widgets that monitor the internet traffic that is used by the devices in your SD-WAN network.
Available dashboard widgets and their interactivity
Follow these steps to view the Interface detailsdashboard and its widgets:
1. Click SD-WAN > SD-WAN health overview > Top 10 Interface Utilization Percent (%) > Interface details.
The dashboard displays various widgets to monitor the interfaces in your SD-WAN network.
2. Or, you can drill down to the Interface details dashboard from Device health dashboard.
3. From the filter options, the Site, Device, Interface, and Time period.
You can select the time range that you want to display in dashboards to which the filter is assigned. For more information, see Generic functions of Telco Network
Cloud Manager - Performance Dashboards.
4. Click Apply filter.
The Interface details dashboard loads and displays the widgets with details for the selected filters.
Available widgets
Table 1. Available widgets
Widget name Chart type Description
Inbound Utilization (%) Trend
You can change the data source type and metric from the widget. You can
see the following metrics on this widget:
Throughput (kbps) Trend
Discards Count Trend
Errors Count Trend
Traffic Volume (Bytes) Trend
Packets Trend
Line Measures the bandwidth utilization trend for incoming traffic for the
highest Inbound Packet Discards on the interfaces.
Outbound Utilization (%) Trend
You can change the data source type and metric from the widget. You can
see the following metrics on this widget:
Throughput (kbps) Trend
Discards Count Trend
Errors Count Trend
Traffic Volume (Bytes) Trend
Packets Trend
Line Measures outbound bandwidth utilization trend for the highest Outbound
Packet Discards on the interfaces.
Interface Traffic Details Grid Displays multiple network interfaces and the associated metrics.
WAN link details
WAN link is a communication circuit that joins two or more local area networks (LANs) into a wide area network.
The application traffic is directed to WAN links that support the SLAs for that application. During periods of performance degradation, the traffic can be directed to other
paths if SLAs are exceeded. Application-aware routing tracks network and path characteristics of the data plane tunnels between Cisco SD-WAN devices and uses the
collected information to compute optimal paths for data traffic. These characteristics include packet loss, latency, and jitter, and the load, cost, and bandwidth of a link.
Available widgets and their interactivity
Follow these steps to view the WAN link detailsdashboard and its widgets:
1. Click SD-WAN > SD-WAN health overview > Top 10 WAN Link Latency (ms) > WAN link details.
The dashboard displays various widgets to monitor applications and their performance in the selected WAN link.
2. From the filter options, the Site, Device, and WAN link.
You can select the time range that you want to display in dashboards to which the filter is assigned. For more information, see Generic functions of Telco Network
Cloud Manager - Performance Dashboards.
3. Click Apply filter.
The WAN link details dashboard loads and displays the widgets with details for the selected time period.
Available widgets
Widget name Chart type Description
Jitter (ms) Trend Line Displays the Jitter trend in milliseconds for the selected WAN link that is associated with a device and site over a specific time
period.
Latency (ms)
Trend
Line Displays the Latency trend in milliseconds for the selected WAN link that is associated with a device and site over a specific time
period.
430 IBM Telco Network Cloud Manager - Performance 1.4.5

Widget name Chart type Description
Packet Loss (%)
Trend
Line Displays the Packet Loss trend in percentage for the selected WAN link that is associated with a device and site over a specific time
period.
WAN Link Details Grid Displays all the WAN link types that are available for the selected device, site, and time period. It also displays the state of the
WAN links along with other metrics.
Tunnel QoE
SD-WAN uses tunnel technology to provide overlays on the transport underlay. SD-WAN is implemented as a network of devices that are connected by encrypted tunnels.
Each SD-WAN device is connected to a set of network services (MPLS, broadband services, and 4G LTE) and monitors the current availability and performance of these
network services.
The application-aware routing in SD-WAN tracks network and path characteristics of the data plane tunnels between SD-WAN devices. It uses the collected information to
compute optimal paths for data traffic, there by improving the quality of experience.
Available dashboard widgets and their interactivity
Follow these steps to view the Tunnel QoEdashboard and its widgets:
Click SD-WAN > SD-WAN health overview > Top 10 Tunnels > Tunnel QoE.
The dashboard displays various widgets to monitor the interfaces in your SD-WAN network.
Or
Click SD-WAN > Tunnel QoE.
From the filter options, the Site, Device, Tunnel, and Time period.
You can select the time range that you want to display in dashboards to which the filter is assigned. For more information, see Generic functions of Telco Network
Cloud Manager - Performance Dashboards.
Click Apply filter.
The Tunnel QoE dashboard loads and displays the widgets with details for the selected filters.
Click any tunnel endpoint from the Tunnel Details widget to drill down to Application per tunnel details dashboard.
Available widgets
Widget name Chart type Description
Inbound Volume
(Bytes) Trend
Line Displays the inbound traffic volume trend in bytes across a selected site, device, tunnel, and time period.
Outbound
Volume (Bytes)
Trend
Line Displays the outbound traffic volume trend in bytes across a selected site, device, tunnel, and time period.
Jitter (ms) Trend Line Displays the Jitter trend in milliseconds for the selected tunnel that is associated with a site and device over a specific time period.
Latency (ms)
Trend
Line Displays the Latency trend in milliseconds for the selected tunnel that is associated with a site, device over a specific time period.
Packet Loss (%)
Trend
Line Displays the Packet Loss trend in percentage for the selected tunnel that is associated with a site, device over a specific time period.
FEC Loss (%)
Recovery Trend
Line Displays the Forward Error Correction (FEC) trend in percentage for the selected tunnel that is associated with a site and device over
a specific time period.
Forward Error Correction (FEC) is a mechanism to recover lost packets on a link by sending extra “parity” packets for every group (N)
of packets. When the receiver receives a subset of packets in the group (at-least N-1) and the parity packet, up to a single lost
packet in the group can be recovered.
Tunnel Details Grid Displays all the tunnel endpoints that are available for the selected site, device, and time period. You can drill down to the
Application per tunnel details dashboard to see the applications that are available in the tunnel endpoint and their performance.
Application per tunnel details
Application per tunnel details
Application per tunnel details is drill-down dashboards from the Tunnel Details widget in Tunnel QoE dashboard.
Available widgets and their interactivity
Follow these steps to view the Application per tunnel details dashboard and its widgets:
1. Click SD-WAN > Tunnel QoE > Tunnel Details > Application per tunnel details.
The dashboard displays various widgets to monitor applications and their performance in the selected tunnel endpoint.
IBM Telco Network Cloud Manager - Performance 1.4.5 431

2. From the filter options, choose the Time period.
You can select the time range that you want to display in dashboards to which the filter is assigned. For more information, see Generic functions of Telco Network
Cloud Manager - Performance Dashboards.
3. Click Apply filter.
The Application per tunnel details dashboard loads and displays the widgets with details for the selected time period.
Available widgets
Widget name Chart type Description
Traffic Volume (Bytes)
Trend
Line Displays the total network traffic in bytes that is consumed by the application per tunnel.
Traffic Volume (Packets)
Trend
Line Displays the total network traffic in packets that is consumed by the application per tunnel.
Application Details Grid Lists the applications that use the tunnel endpoint. It also displays the volume and percentage of traffic that is used by
each application.
Application performance
Application visibility is an important feature of SD-WAN and it is connected to other use cases in SD-WAN solutions. You can monitor and analyze the data traffic in detail.
You can also correlate the protocols and applications and classify them based on the business needs and SLAs.
You can then use application classification in different features, such as monitoring, security policy, cloud on ramp for SaaS, application-aware routing policy, quality of
service (QoS), and more.
Cisco SD-WAN can minimize loss, jitter, and delay or reduce latency and forwarding errors to optimize application performance. In Application performance dashboard,
you can monitor the application visibility and performance.
Available widgets and their interactivity
1. Click SD-WAN > Application performance.
The dashboard displays various widgets to monitor the application performance in your SD-WAN network.
2. From the filter options, the Site, Device, Application, and Time period.
You can select the time range that you want to display in dashboards to which the filter is assigned. For more information, see Generic functions of Telco Network
Cloud Manager - Performance Dashboards.
3. Click Apply filter.
The Application performance dashboard loads and displays the widgets with details for the selected filters.
Available widgets
Widget name Chart type Description
Traffic Volume
(Bytes) Trend
Line Displays the total network traffic in bytes that is consumed by the selected application and device.
FEC Recovery
Rate (%) Trend
Line Displays the Forward Error Correction (FEC) recovery rate trend for the applications on the device.
Forward Error Correction (FEC) is a mechanism to recover lost packets on a link by sending extra “parity” packets for every group (N)
of packets. As long as the receiver receives a subset of packets in the group (at-least N-1) and the parity packet, up to a single lost
packet in the group can be recovered. FEC is supported on Cisco vEdge 1000, 2000, and 5000 routers.
Application
Details
Grid Lists the applications that are available on the device. It also displays the volume, percentage of traffic, and the FEC recovery rate
that is applicable for each application.
Device health
You can monitor key device health parameters proactively on the Device health dashboard and identify any anomalies from just visualizing the trend charts. You can view
the time-trended line graphs for the selected device.
You can investigate potential issues and take corrective actions, as needed, to avoid or mitigate problems. Key metrics that are monitored are the memory and CPU usage.
Available widgets and their interactivity
Follow these steps to view the Device health dashboard and its widgets:
1. Click SD-WAN > Device health.
2. From the filter options, the Site, Device, and Time period.
You can select the time range that you want to display in dashboards to which the filter is assigned. For more information, see Generic functions of Telco Network
Cloud Manager - Performance Dashboards.
3. Click Apply filter.
The Device health dashboard loads and displays the widgets with details for the selected filters.
432 IBM Telco Network Cloud Manager - Performance 1.4.5

Available widgets
Widget name Chart type Description
Device model Badge Displays the selected device model, which is one of the properties in the device configuration.
Reboot Badge Displays the reboot count for the device, which gives an idea on the power state of the device.
Crash Badge Displays the crash count for the device, which gives an idea on the software and hardware errors, CPU state, or
excessive heat.
Launch Interface Details dashboard.
Click here.
Badge When you click the link, the Interface details dashboard is launched. You can also view the network traffic
metrics for the associated device.
CPU Utilization (%) Complex gauge Displays the CPU Utilization percentage by the device. The inner gauge is showing max and outer gauge is
showing last value.
CPU Utilization (%) Trend Line Displays the CPU Utilization (%) trend based on the selected device. The data is displayed as a dynamic time
series chart.
Memory Utilization (%) Complex gauge Displays the Memory Utilization percentage by the device. The inner gauge is showing max and outer gauge is
showing last value.
Memory Utilization (%) Trend Line Displays the Memory Utilization (%) trend based on the selected device. The data is displayed as a dynamic
time series chart.
Viewing specific threshold violations from Event Viewer
Using the launch-in-context feature, you can access the Metric Threshold Violation dashboard from IBM® Tivoli® Netcool®/OMNIbus Event Viewer. The Metric Threshold
Violation dashboard determines the root cause of a metric threshold violation and to resolve the problem.
About this task
The primary objective of thresholding is to determine whether any metric is violating its predefined values and generating alerts. When the value falls outside the
acceptable threshold range, the system generates and stores the event condition and forwards it to the Event Management System. All the thresholds that are targeted to
be sent to IBM Tivoli Netcool/OMNIbus are viewed in the Event Viewer.
The Metric Threshold Violation dashboard displays the threshold violation view of a selected event. The dashboard displays the trend of the metric value and the alarm
severity in 24 hours.
The threshold violation view displays the event details from the last occurrence of the event, based on the following rules:
If the last occurrence of the event is less than 24 hours from the current time, the widget displays the last 24 hours data from the current time.
If the last occurrence of the event is more than 24 hours from the current time, the widget displays the data from 12 hours before the last occurrence and 12 hours
after the last occurrence.
Note: All the data on the dashboard views is populated based on your local time zone.
You can define a static threshold for a metric on the Threshold Definition configuration page. If these static thresholds are violated for any performance measure on a
device or interface, events are generated at a predefined severity level.
Launching the Metric Threshold Violation dashboard
You can start the Metric Threshold Violation dashboard to display the event details for the metrics that violated the set threshold values.
Metric Threshold Violation dashboard
Use the information to understand the changes that are available in the Metric Threshold Violation dashboard.
Related information
Configuring integration with Watson AIOps Event Manager
Launching the Metric Threshold Violation dashboard
You can start the Metric Threshold Violation dashboard to display the event details for the metrics that violated the set threshold values.
Before you begin
Complete the following tasks:
Integrate Telco Network Cloud Manager - Performance with Tivoli® Netcool®/OMNIbus Web GUI application.
Configure launch-in-context integration with Telco Network Cloud Manager - Performance.
Configure the threshold definitions for the metrics on the Threshold Definitions page.
About this task
You can launch the Metric Threshold Violation dashboard from IBM® Tivoli Netcool/OMNIbus Event Viewer.
You can access the events from the Event Viewer to monitor and manage events. See Managing events in the Event Viewer.
Procedure
IBM Telco Network Cloud Manager - Performance 1.4.5 433

1. Log in to Jazz® for Service Management server.
2. Click Incident > Events > Event Viewer in the navigation bar.
The Event Viewer can display events from multiple data sources in the same list.
3. Right-click an event and select Launch_to_TNCP.
Note: Launch_to_TNCP is the label that is created in Configuring launch-in-context menu section.
The Metric Threshold Violation dashboard that is associated with the selected event is displayed in another window.
Note: You can start the Metric Threshold Violation dashboard for events that are triggered by Telco Network Cloud Manager - Performance only.
These events are marked in the Event Viewer with the label NPI/Timeseries in the Manager column.
All Flow events are marked in the Event Viewer with the label Flow appended to the metric.
Related information
Configuring integration with Watson AIOps Event Manager
Metric Threshold Violation dashboard
Use the information to understand the changes that are available in the Metric Threshold Violation dashboard.
About this task
Launch the Metric Threshold Violation dashboard for a specific alarm from Event Viewer or change the available parameters on the dashboard to view any other alarm
details.
Procedure
Launch the Metric Threshold Violation dashboard from the Event Viewer.
The dynamic dashboard loads with the details for the specific metric.
The following information is displayed for each data node of the violated metric:
Metric value. When you hover the mouse over the severity level lines, you can see the data points with metric value, timestamp, and metric name.
Severity of the violation, which can be critical, major, minor, warning. Only those severity levels that are configured on the Threshold Definitions page can be
see as severity lines on the dashboard.
From the filter, the following time period options are available:
Last Hour
Last 6 Hours
Last 12 Hours
Last 24 Hours
Last 7 Days
Last 30 Days
Last 365 Days
Custom
The Metric Threshold Violation dashboard displays the following content:
Option Description
Threshold Profile The threshold definition that is associated with the alarm.
Metric The metric that is in context.
Evaluation The evaluation number that raised the alert.
Threshold mode >=, <=, and Band modes.
434 IBM Telco Network Cloud Manager - Performance 1.4.5

Option Description
Threshold severity Severity of the threshold. You have the following verities:
Critical
Major
Minor
Warning
Value Triggered The value of the metric violation
First Occurrence The first occurrence of the violation
Last Occurrence The last occurrence of the violation
Click any of the following links:
Flow Aggregation View
Click this link to drill down to the Flow Aggregation dashboard for the metric that is displayed in the Metric Threshold Violation. Following is the order of
priority to display the Flow aggregation dashboards based on the aggregations that are enabled from the low Aggregations page:
Top Conversations with Application
Top Applications
Top Sources with Application
Top Destinations with Application
Top Conversations
Top Sources
Top Destinations
Top Protocols with Conversation
Top Protocols with Application
Top Protocols with Source
Top Protocols with Destination
Top Protocols
Note: Flow Aggregation View link is available only for those Flow metrics that have aggregation defined.
All Metrics View
Click this link to drill down to the Metric viewer dashboard for the metric that is displayed in the Metric Threshold Violation.
Metric viewer dashboard
Metric viewer dashboard displays the collected performance metrics that are stored in the Telco Network Cloud Manager - Performance database. You can monitor
the new device types and vendors that are on boarded into your network immediately.
Related concepts
Metric viewer dashboard
Metric viewer dashboard
Metric viewer dashboard displays the collected performance metrics that are stored in the Telco Network Cloud Manager - Performance database. You can monitor the
new device types and vendors that are on boarded into your network immediately.
Metric Viewer is a general-purpose dashboard. You have the flexibility to view any metric in the system for early data flow verification, device monitoring, and comparison
analysis.
You can populate any metric of interest that is stored in the timeseries database, and monitor the resource and historical trending for a specific resource type.
Note: Metric Viewer dashboard is created in React JS script.
Metric viewer
1. Click the All Metrics View link from the Metric Threshold Violation dashboard.
The Metric viewer dashboard loads in a new tab as the previous dashboard.
2. Or, click Network > Metric viewer
The Metric viewer dashboard loads.
3. From the filter pane, select the following options:
Filter Description
Resource type Select ALL to select all resource types. Or select a specific resource type or group for which you want to display the instances and
metrics.
Compare by
Metrics Use this option to select the metrics associated with a selected Resource instance.
Note: You can select up to five metrics for a Resource instance.
Resource instances Use this option to select a metric and the Resource instances, which are associated with the selected metric.
Note: You can select up to five Resource instances for a metric.
Time period Select a time period for the display. You have the following options:
Last Hour
Last 6 Hours
Last 12 Hours
Last 24 Hours
Last 7 Days
Last 30 Days
Last 365 Days
Custom
Apply Apply your selections from the filters. Widget-level filters appear in the layout area.
IBM Telco Network Cloud Manager - Performance 1.4.5 435

Filter Description
Clear the layout Click to clear the existing widgets in the layout.
Add a widget (maximum
30)
You can add a maximum of 30 widgets to the layout. Each widget can be used to display different metrics from different Resource type
instances.
Widget time filter Click to display the time filter on the widgets.
Show all chart filters Click to display all other filters on the widgets.
Show display name Click to show the display name along with the instance ID of the Resource instances from the Select a Resource instance list.
4. Click Apply to the widget with metric data.
Compare by metrics
Note:
The time zone that is displayed on the Metric Threshold Violation dashboard banner is local browser time zone.
On the Metric Threshold Violation, the first and last occurrences of alarms are shown in local browser time zone.
On the Event Viewer, first and last occurrences of alarms are shown in GMT time zone.
5. Hover over a data point on the line chart to see the details of the metric.
6. Click the Select a threshold profile ( ) to display the threshold profiles defined for the selected metrics. Click Clear threshold to remove the threshold
baselines.
Severity of the threshold violations for the metric is displayed in the legend. Legend is customizable.
From the Threshold Profile filter, profile name is auto-populated with the configured profile for the metric that is in the Metric Threshold Violation dashboard.
Note: If you launch this dashboard from the menu Network > Metric viewer, then you can select the profile for the metric that you want to display.
7. Use the zoom bar to zoom in and zoom out to a specific area in the chart for closer look at the data. You can drag the sliders to automatically zoom to the selected
items, without marking them.
8. Click the Change chart type ( ) icon to change the chart type in the widget.
9. Click the Hide filter ( ) to hide the filter pane.
10. Click the Export ( ) icon to export dashboard with the existing content to the following options:
PDF
JSON
CSV
Excel
All
Click All to export the content to all formats and a .zip file is created that can be downloaded and extracted.
11. Click the Import ( ) icon and click Add file to browse and select a JSON file that can be imported to the dashboard.
The data from the JSON file is populated in to the dashboard.
436 IBM Telco Network Cloud Manager - Performance 1.4.5

Managing and using Designer tool
Use the Telco Network Cloud Manager - Performance Designer tool application to create and view custom dashboards from different data sources.
The Designer tool constitutes Dashboard Designer, Engine, and Connector components.
Accessing the Dashboard Designer
Use this information to access and use the Dashboard Designer.
Getting started with the Dashboard Designer
Use this information to get started with the Dashboard Designer.
Quick reference to creating dashboards
Diagrammatic representation of the tasks that are needed to create and deploy a dashboard by using Dashboard Designer.
Managing the Dashboard Designer
Describes how to manage Dashboard Designer components to create and deploy dashboards that support connectivity to different data sources, and then view
these dashboards on the Telco Network Cloud Manager - Performance Engine user interface.
Report scheduling
You can define a schedule to generate dashboard reports in a specific format and email them to one or more email addresses at a defined time interval. You can
also view, edit, cancel, activate, reschedule, or delete the already scheduled tasks.
Accessing the Dashboard Designer
Use this information to access and use the Dashboard Designer.
Procedure
Log in to the reporting interface from Dashboard Application Services Hub or from stand-alone URL based on your deployment.
Click Reporting > DesignerTool to see the interface to create new dashboards and its artifacts with the help of the Dashboard Designer tool.
Dashboard Designer interface is displayed.
(Click image to view in a new window.)
IBM Telco Network Cloud Manager - Performance 1.4.5 437

(Click image to view in a new window.)
Related tasks
Managing the Dashboard Designer
Getting started with the Dashboard Designer
Use this information to get started with the Dashboard Designer.
About this task
The Designer tool Welcome page loads with the following options that help you get started.
Procedure
Your username is displayed at the upper-right area along with a down arrow icon .
Click the down arrow icon to view your user role, role description, Tool Content Groups, Engine User Groups, and Engine instances that are assigned to you.
To create your custom dashboards, click CREATE DASHBOARDS.
The Create a New Dashboard: Select a Layout window is displayed. You can either select any one of the available layouts or click Create a New Layout.
For more information about the Dashboard components, see Managing the Dashboard Designer.
To create components that can be reused to create dashboards, click CREATE COMPONENTS.
The Create Components page opens that displays the following components:
LAYOUTS
WIDGETS
DATA DEFINITION
FILTERS
Click any component that you want to create, the Dashboard Designer page displays a navigation pane and lists all the components that are needed to create and
publish a dashboard.
To use the Designer tool directly, click the Expand icon on the upper-left area of the page.
The Dashboard Designer page displays a navigation pane and lists all the components that are needed to create and publish a dashboard.
Quick reference to creating dashboards
Diagrammatic representation of the tasks that are needed to create and deploy a dashboard by using Dashboard Designer.
Workflow 1
You can create a dashboard and its components from scratch and deploy it on the Engine to view and share. This default workflow is shown in the following diagram:
438 IBM Telco Network Cloud Manager - Performance 1.4.5

Create a
layout
Add charts
to the
dashboard
Set chart
properties
Default tasks
to create and
view a
dashboard
and its
components
Workflow 1 Configure
Connector
source
Create a data
definition
Add data
definitions
Set relations
to the
widgets
Save and
preview the
dashboard
Publish
the
dashboard
Add dashboard
to the menu
Add filters
to the widgets
and the
dashboard
View the
dashboard
on Engine
Assign user
groups to the
dashboard
Workflow 2
You can create a repository of individual dashboard components and create reusable dashboards from them. These dashboards or the dashboard components can then be
reused to quickly create dashboards according to your use case. In this workflow, you can reuse the custom widgets that are created earlier with data definitions and chart
properties configured. This workflow is as shown in the following diagram:
Create
filters
Create
custom
layouts
Create reusable
widgets and
dashboards
Create data
definitions
Create
custom
widgets and
templates
Workflow 2
Create reusable
components
and dashboards
Configure
Connector
source
Set relation
to the
widgets
Save and
preview the
dashboard
Publish or
reuse the
dashboard
Add filters
to the widgets
and the
dashboard
Select a
layout
Add
custom
widgets
View the
dashboard
on Engine
Add dashboard
to the menu
Assign user
groups to the
dashboard
Managing the Dashboard Designer
Describes how to manage Dashboard Designer components to create and deploy dashboards that support connectivity to different data sources, and then view these
dashboards on the Telco Network Cloud Manager - Performance Engine user interface.
Layouts
Layout is a basic component of Dashboard Designer that helps you build a structure for a dashboard. It has placeholders for charts, widget templates, custom
widgets, or external URLs. Dashboard Designer displays two types of layouts, default layouts and custom layouts. Default layouts are the ready to use layouts that
are already provided in the Dashboard Designer. However, you can also create your own layouts and save them as custom layouts. You can create multiple custom
layouts, categorize them, and save them for future use.
Charts
After you select a layout, you must add charts to it. You can select a chart type from the available chart categories. Charts define the way that you want the data of
your applications to be displayed. You can define chart properties only after you add a chart either to a dashboard or to a custom widget.
Widgets
Widgets are charts with defined data sources, monitoring metrics, widget properties, filters, and chart properties.
Testing database connection with Connector Source
Use the Connector component to connect to a data source and select and configure the data provider. Connector is the predefined interface template and is the
base for Connector sources.
Data Definitions
Data definition is the data source that is used in a widget. You can configure the data definitions according to your dashboard requirements to monitor various data
sources. Dashboard Designer displays two types of data definitions, default data definitions and custom data definitions.
Filters
Use filters to filter data that is displayed within dashboards and widgets. Filters help you to interactively explore the data that you want to display in the widgets.
You can add filters at dashboard-level and at widget-level. Dashboard Designer displays two types of filters, default filters and custom filters. Default filters are
already provided in the Dashboard Designer. However, you can also create your own filters and save them as custom filters. You can create multiple custom filters,
categorize them, and save them for future use. Adding custom filters or default filters to dashboards is optional. You can add filters when you are creating or
modifying dashboards.
Dashboards
Use Dashboard Designer to create, view, modify, delete, import, or export dashboards. You can create dashboards to view multiple widgets and set relations
between the widgets. You can also view, modify, or delete widgets within a dashboard.
Themes
Use Dashboard Designer to create, preview, modify, copy, delete, or deploy custom themes. You can also view the default themes in Dashboard Designer, but
cannot modify, delete, or deploy them. Both the default and the custom themes can be applied to Engine only. You cannot apply these themes to the Dashboard
Designer. The default themes along with the deployed custom themes are displayed on Engine.
Menu Access
To publish dashboards, you must add them to a menu. You can publish a menu to Telco Network Cloud Manager - Performance Engine. A menu contains two types
of nodes, category nodes and dashboard nodes. A menu can host multiple dashboards that are categorized by using category nodes.
Managing Engine user interface
After you publish menus or widgets in Dashboard Designer, the dashboards and widgets are displayed on Telco Network Cloud Manager - Performance Engine.
IBM Telco Network Cloud Manager - Performance 1.4.5 439

Layouts
Layout is a basic component of Dashboard Designer that helps you build a structure for a dashboard. It has placeholders for charts, widget templates, custom widgets, or
external URLs. Dashboard Designer displays two types of layouts, default layouts and custom layouts. Default layouts are the ready to use layouts that are already
provided in the Dashboard Designer. However, you can also create your own layouts and save them as custom layouts. You can create multiple custom layouts, categorize
them, and save them for future use.
To create a dashboard, you can select either a default layout or your own custom layout.
Default layouts
The following are the default layouts that are available in Dashboard Designer:
1x1 Layout
Contains one widget placeholder.
1x2 Layout
Contains two widget placeholders in a row.
2x2 Layout
Contains two widget placeholders in two rows each.
2x3 Layout
Contains three widget placeholders in two rows each.
3x3 Layout
Contains three widget placeholders in three rows each.
3x2 Layout
Contains two widget placeholders in three rows each.
2x1 Layout
Contains one widget placeholder in two rows each.
1x3 Layout
Contains three widget placeholders in a row.
3x1 Layout
Contains one widget placeholder in three rows each.
Creating a custom layout
You can create customized layouts according to your requirement by using Dashboard Designer.
Managing layouts
You can view, search, modify, or delete layouts.
Creating a custom layout
You can create customized layouts according to your requirement by using Dashboard Designer.
About this task
After you log in to Dashboard Designer, you can create custom layouts by using any one of the following options on the landing page:
Click CREATE COMPONENTS, then in the Create Components page, click LAYOUTS.
Click the Expand icon to open the left navigation pane of Dashboard Designer.
Click Layouts > Custom > Create New Layout.
Click Dashboards > Create New Dashboards. In the Create a New Dashboard: Select a Layout window, click Create a New Layout.
Procedure
Complete the following steps to create a custom layout:
1. In the left navigation pane of Dashboard Designer, click Layouts > Custom > Create New Layout.
The New Layout tab opens. The page displays a toolbar that shows the following icons:
Undo icon
Redo icon
Delete icon
Reset icon
2. Click the Edit Layout Name icon that is displayed next to the New Layout field, and enter a name for your layout.
3. The Gridlines checkbox is selected by default. If you do not want gridlines view, clear the checkbox.
4. The Filter Area checkbox is selected by default. If you do not want the filter area to be displayed, clear the checkbox.
5. To specify a widget placeholder on the layout, place the pointer in the Draw layout here area and drag it to create a box.
You can create multiple widget placeholders of different sizes in this area. You can move or resize the placeholders. The placeholders cannot overlap each other.
6. To save the layout, click Save Layout.
7. In the Save Layout window, complete any of the following steps:
a. In the Name field, enter a new name for the layout. You can use alphanumeric characters, spaces, and underscore in the dashboard name.
440 IBM Telco Network Cloud Manager - Performance 1.4.5

b. To save the layout to an existing category, click Existing Category, select a category from the list, and click Save.
c. To save the layout to a new category, click New Category, and enter a name for the new category, and click Save.
To save the layout with another name, click the Save As Layout option.
Results
The newly created custom layout is listed under Most Recently Created Layouts in the navigation pane.
What to do next
To use the layout to create a dashboard, click Use this Layout. For more information, see Creating a dashboard.
Managing layouts
You can view, search, modify, or delete layouts.
Procedure
Viewing, deleting, or searching the existing layouts.
To view, delete, or search the existing layouts, complete the following steps:
1. In the left navigation pane of Dashboard Designer, click Layouts > Custom > Manage Layouts.
The All Layouts page opens in a new tab. The page displays all the already created custom layouts.
2. Complete any of the following steps:
To view layouts that belong to a category, from the View list, select a category.
To find a layout, enter the name of the layout in the Search field.
To delete a layout, either select a layout and click the Delete button, or click the Delete icon on the layout row.
To delete multiple layouts, select the layouts that you want to delete, and then click the Delete button.
To create a copy of a layout, click the Copy icon on the layout row. In the Create Copy window, complete the following steps:
In the Name field, enter a new name for the layout. You can use alphanumeric characters, spaces, and underscore in the layout name.
To save the layout to an existing category, click Existing Category, and select a category from the list.
To save the layout to a new category, click New Category, and enter a name for the new category.
To save the layout copy, click Save.
Viewing JSON source of the layout
To view JSON code of the layout, complete the following steps:
1. In the All Layouts page, click the View/Edit icon that is displayed on the layout row.
The layout opens in a new tab. The page displays the layout name.
2. Click the View Source icon to resolve any layout-specific issues.
Modifying layouts to add more widget placeholders or delete existing widget placeholders.
To modify an existing layout, complete the following steps:
1. In the All Layouts page, click the View/Edit icon that is displayed on the layout row.
The New Layout tab opens. The page displays a toolbar that shows the following icons:
Undo icon
Redo icon
Delete icon
Reset icon
2. To modify name of the layout, click the Edit Layout Name icon that is displayed next to the layout's name, and enter a name.
3. The Gridlines checkbox is selected by default. If you do not want gridlines view, clear the checkbox.
4. The Filter Area checkbox is selected by default. If you do not want the filter area to be displayed, clear the checkbox.
5. Go to the end of dashboard, and drag the layout edge to increase its height.
6. Complete any of the following actions:
To add a widget placeholder to the layout, place the pointer in the layout area and drag it to create a box. You can add multiple placeholders to a
layout.
To delete any of the existing widget placeholders or any of the newly added placeholders, click the placeholder, and then click the Delete icon on
the toolbar.
To undo or redo your changes, click the Undo icon or the Redo icon.
To delete all the existing widget placeholders and all the newly created placeholders, click the Reset icon.
Note: After you click the Reset icon, you cannot undo or redo your changes. The entire layout is cleared.
IBM Telco Network Cloud Manager - Performance 1.4.5 441

7. To save the changes to the layout, click Save Layout.
You can save the layout to an existing category or to a new category.
Using a layout to create a dashboard.
To use a layout to create a dashboard, complete the following steps:
1. In the All Layouts page, click the View/Edit icon that is displayed on the layout row.
The layout opens in a new tab. The page displays the layout name and the widget placeholders.
2. To use the layout for a dashboard, click Use this Layout.
The layout opens in a New Dashboard page, where you can create your dashboard. For more information, see Creating a dashboard.
Viewing or searching the existing layouts by using View All Layouts option.
To view or search the existing layouts, complete the following steps:
1. In the left navigation pane of Dashboard Designer, click Layouts > Custom > View All Layouts.
A Layouts pop-up window is displayed.
2. Complete any of the following steps:
To view layouts that belong to a category, from the Category list, select a category.
To find a layout, enter the name of the layouts in the Search field.
Charts
After you select a layout, you must add charts to it. You can select a chart type from the available chart categories. Charts define the way that you want the data of your
applications to be displayed. You can define chart properties only after you add a chart either to a dashboard or to a custom widget.
Dashboard Designer displays multiple chart types under Bar, Time Series, Pie, and Other Charts categories. An icon that represents the chart type is displayed next to each
chart name. You can select any of the available chart types based on your data representation. After you drag a chart to a widget, you need to set properties and data
definitions to complete the widget. For more information about creating a custom widget, see Creating custom widgets.
Important: For line, area, bar charts, if there are more than nine legends then the color of graph repeats after ninth legend. The color of the graph is same for 1st and 10th
legend, 2nd and 11th legend, and so on.
Chart categories and chart types
Bar charts
Bar charts use either horizontal or vertical bars to show comparisons among related metrics values. You can use Bar charts to view changes in metrics values over
time or to compare one or more metrics values between several data groups. The types of bar charts that are available in Dashboard Designer are as follows:
Stacked bars
Stacked columns
Clustered bars
Clustered columns
Time Series charts
Display information as a series of data points at successive time intervals that are connected by straight-line segments. The series of data points are called markers.
Use Time Series charts when you want to view and compare changes in one or more metrics values between several data groups, over a time period. Also, if you
want to plot large number of data points, then you can use Time Series charts. The types of Time Series charts that are available in Dashboard Designer are as
follows:
Line
Area
Baseline
Pie charts
A circular chart that displays data in terms of proportions and percentages. Use Pie charts to compare proportions of the different metrics values that form the
entire data. The types of Pie charts that are available in Dashboard Designer are as follows:
Pie
Donut
Other charts
Other charts include the following chart types:
Badge
A Badge chart displays specific single metric information on the dashboard.
Bubble
A Bubble chart displays the data points that are represented with bubbles. If your data has three data series that contains a set of values, then the sizes of
the bubbles are determined by the values in third data series.
Note: Choose Bubble chart instead of Scatter chart if your data has three data series.
Bullet
A bullet chart displays performance comparison of an entity with its target value. The chart also shows qualitative ranges of performance.
Circos
A circular chart that displays the association between various data components. The data is displayed radially around the circle.
Grid
A Grid is a tabular view for a set of values that is related to a specific attribute.
Complex Gauge
Complex Gauge chart is a circular or semicircular shaped chart with a radical scale and is similar to Gauge chart.
442 IBM Telco Network Cloud Manager - Performance 1.4.5

Gauge
A Gauge chart is also known as speedometer chart or dial chart. The chart contains a pointer to show the current status or reading. Use Gauge charts when
you want to display performance data or current value in a data.
Heatmap
A Heatmap displays data in tabular view. The data is highlighted in different colors to identify measurable differences in the data. Use Heat map charts when
you want to compare multiple performance indicators.
Map
A Map chart provides a set of in-built maps, which include world map and maps of various continents and countries. Use these maps to show data
distribution across various continents, countries, or cities. You can assign various shapes or icons to indicate data items on the map.
Quadrant Motion
A Quadrant Motion chart displays data in four quadrants. Quadrant charts can be used to plot data that contains three measures by using an X-axis, Y-axis,
and motion value.
Radar
A Radar chart displays comparative analysis of values. It compares these values, both to each other within a single data set and in a certain category across
several data sets.
Note:
Data sets with large number of series can be complicated to read with radar chart.
For a chart to be legible, it must contain maximum three axes.
Range Column
A Range Column chart shows a range of floating columns, where each column shows two values on the Y-axis, a minimum value and a maximum value for a
single entity in a category.
Sankey
A Sankey chart is a type of flow diagram that shows flow of data in a system. The width of the arrows is proportional to the quantity of flow.
Scatter
A Scatter chart display value in two-dimensional coordinate system. The data is displayed as a collection of points, each having the value of one variable that
determines the position on the horizontal axis and the value of the other variable that determines the position on the vertical axis.
Sunburst
A Sunburst chart displays an inner circle that is surrounded by rings of deeper hierarchy levels. Each ring corresponds to a level in the hierarchy. The central
circle represents the root node, and the hierarchy moves outwards from it. The angle of each segment is either proportional to a value or divided equally
under its parent node. All these segments can be colored depending on which category or hierarchy level they belong to.
Tag Cloud
A tag cloud helps visualize text data by arranging the words in a way that size of each word is proportional to the frequency of the word or to the variable
value that is associated with the word. You can use different colors and sizes to indicate how often each word is mentioned in a particular text.
Venn
A Venn chart shows similarities and related proportions of entities. Similarities are displayed as overlapped areas of the circles, while relative sizes of the
circles represent relative proportions.
Tree
A tree chart displays data that is organized hierarchically by using parent-child relations. The tree chart displays multiple parent and child nodes.
Topology
Topology chart displays a physical or logical mapping of data.
Treemap
Treemap chart is displayed as a table with cells or rectangles of different height and width. Each rectangle indicates a parent element and the child elements
are tiled within the parent rectangle. From a parent element, you can drill down to all its child and sub child elements.
The size and color of each parent rectangle is proportional to its data point value.
Chart types
You can choose a chart type based on what you want the chart to illustrate.
Related tasks
Setting chart properties
Chart types
You can choose a chart type based on what you want the chart to illustrate.
Choose a chart type based on whether you want to illustrate the following factors:
Correlation or connections between variables of a single group, or to display connection between two or more groups over a time period.
Comparison between two or more variables in a single group or across multiple groups over a time period.
Composition of a single group.
Relation and distribution of variables in single or multiple groups.
Performance indicators.
The following table provides some suggestions on the types of charts that can be used:
Table 1. Choosing chart types
Purpose Chart type
To view contributions of parts to a whole. Bar chart
Pie chart
Stacked chart
IBM Telco Network Cloud Manager - Performance 1.4.5 443

Purpose Chart type
To view trends in time or contrast values across different categories. Line chart
Area chart
Bar chart
Baseline chart
Column chart
Range Column chart
To compare groups of related information against actual values. Bar chart
Radar
To view values in descending or ascending order. Bar chart
Column chart
To view key performance indicators. Gauge chart
Bullet chart
To view variations among related groups for critical values. Heatmap chart
To view the specific values in chart by different bubble sizes. Bubble chart
To view the results of mathematical calculations or experiments. Scatter chart
Venn chart
Grid
To represent speedometers, watches, volume or engine tuners, and so on. Complex Gauge chart
To represent energy or material transfers between processes. Sankey chart
To view hierarchical data. Sunburst chart
Tree chart
Treemap chart
To view textual data. Tag Cloud chart
To view various types of data-related genomes. Circos chart
To view geographical data. Map chart
To view analytical data. Quadrant Motion chart
To view single metric data. Badge chart
To view logical or physical mapping of data. Topology chart
Widgets
Widgets are charts with defined data sources, monitoring metrics, widget properties, filters, and chart properties.
Dashboard Designer displays different types of widgets, such as default widget templates, custom widget templates, and custom widgets.
You can use the Widgets option in Dashboard Designer to perform the following tasks:
To create custom widgets or custom widget templates, where you select a chart type, set data definitions, set filters, set a background image, and set toolbar and
chart properties.
To create multiple custom widgets and custom templates, and save them into various categories for later use.
To publish custom widgets individually or in bulk.
Default and custom widget templates
Widget templates contain a chart with predefined connectors and monitoring parameters. The templates do not contain any predefined data sources or instances. You can
assign data sources and select instances after you drag a widget template to a dashboard. Dashboard Designer displays default widget templates and custom widget
templates.
All the widget templates display a chart icon within curly brackets next to their names. The chart icon indicates the chart type that is used in default or custom widget
template. For example, if the default widget template is created by using a Line chart, then a Line chart icon is displayed within curly brackets.
All the widget templates display an incomplete data definition icon as their data sources and instances are not defined. When you drag a template to a dashboard,
define data sources and instances, and set chart the properties. The template changes to a custom widget that is in a complete state, and hence displays a complete data
definition icon.
To save a custom widget as a template, see Saving custom widgets as templates.
Custom widgets
Custom widgets are charts with user-defined connectors, data sources, monitoring elements, instances, widget properties, filters, background image, and chart
properties.
You can create custom widgets and use them in different dashboards according to your requirement.
444 IBM Telco Network Cloud Manager - Performance 1.4.5

Create custom widgets where you select a chart, set data definition to add one or more data sources, select monitoring parameters, and set widget-level filters.
Create specialized widgets such as web widgets, multi-chart widgets, and a widget to list all the instances for a selected source and resource type.
Save the widgets that you create as custom widget templates.
Based on the state of the data definition, a custom widget can display any of the following Set Data Definition icons:
When the data definition is incomplete, then the custom widget displays an incomplete data definition icon.
When the data definition is complete, then the custom widget displays a complete data definition icon.
When the data definition is deleted, then the custom widget displays a deleted data definition icon.
While you are creating custom widgets, you can complete the following tasks:
Change widget layout
Before you add a chart or template to a widget, you can edit the layout of the widget to add multiple widget placeholders and save the widget as an independent
multi-chart widget. Thus, a single widget can host multiple widgets or charts within it.
For more information, see Specialized widgets.
Embed a website or web application
You can embed a web application or website in a widget by entering an external URL within a widget and save the widget as an independent web widget.
For more information, see Specialized widgets.
Change chart types
If the widget contains Bar charts, Time Series charts, or Pie charts, then you can replace the existing chart with another chart of the same family. For example, if you
use a Pie chart, then you can replace it with a Donut chart. You can change chart types during and after widget creation.
Note: You cannot change a chart type when you preview a widget that contains multiple plots.
Add multiple data sources
Setting data definition is an important step during widget or template creation. It is in this step that you connect a data source to the chart and define the attributes
that must be mapped on the widget. You can set data definitions either by using the Create a Data Definition option or by using the Select from saved Data
Definition option. For more information, see Data Definitions.
You can add multiple data sources in a single widget by using multiple connectors.
Set widget-level filters
You can set default and custom filters for a widget. If the filters are already set in a widget template, then you can add, delete, or rearrange the already set filters.
The total number of default and custom filters, including conditional or dependent filters, cannot exceed five. You can drag filters and change their display order.
Parent (Direct or Independent) filters and child (Conditional or Dependent filters) filters cannot be switched. A parent filter always precedes its child filter. If you
delete a parent filter, then its child filters are also deleted. If you select child (Conditional or Dependent filters) filters, then its parent (Direct or Independent) filters
are added automatically.
After you set widget-level filters, you must map metrics to filters while setting the data definition or in custom data definition.
If widget-level filters are set for a custom widget, then it displays a check mark on Set Filters icon. Else, Set Filters icon does not display any check mark.
Set properties
After you set data definition, you must set toolbar and chart properties before you save the custom widget.
Set background image
You can add, replace, or delete a background image in a widget. You can also add, replace, or delete a background image in a widget after you add the widget to a
dashboard.
For more information about setting a background image in an independent widget, see Creating custom widgets.
You can also create a custom widget that lists all the instances of a specific source. For more information, see Creating custom widgets to list all instances.
After you create custom widgets, you can also publish the custom widgets. For more information, see Publishing custom widgets.
Both widgets and templates are useful when you want to create dashboards within minimal time. You can use a template when you want to monitor different data sources
and instances against preselected monitoring parameters.
Setting data definitions by using custom data definitions
To monitor data sources in Telco Network Cloud Manager - Performance, you must use custom data definitions. To a widget, you can add either single or multiple
custom data definitions, based on the chart type that you select.
Creating custom widgets
Saving custom widgets as templates
You can save a widget as a custom widget template, only when you create the custom widget for the first time.
Specialized widgets
You can create specialized widgets and save them independently. You can also create these widgets within a dashboard.
Managing custom widgets, custom templates, or specialized widgets
You can view, search, modify, copy, or delete custom widgets, custom templates, or specialized widgets. You can publish custom widgets and specialized widgets
independently, except multi-chart widget. You can also view, modify, or delete data definitions, chart properties, widget-level filters, and chart types within a
custom widget or a custom template.
Publishing custom widgets
You can publish a custom widget individually or collectively to an Engine instance and to one or more Engine User Groups. You can modify the published details of
an already published custom widget to add or delete user groups. You can also unpublish widgets.
Setting data definitions by using custom data definitions
To monitor data sources in Telco Network Cloud Manager - Performance, you must use custom data definitions. To a widget, you can add either single or multiple custom
data definitions, based on the chart type that you select.
IBM Telco Network Cloud Manager - Performance 1.4.5 445

About this task
You can add multiple custom data definitions to Time Series, Bar, Bubble, Complex Gauge, Radar, and Scatter charts only. To all the remaining charts, you can add only a
single custom data definition. If you modify a custom data definition, then those modifications are not displayed on the widget, unless you reattach the newly modified
custom data definition to the widget.
Note:
For Complex Gauge chart, you must select two custom data definitions.
For a real-time widget, you cannot add multiple data definitions to the Line chart.
If a dashboard has multiple occurrences of the same custom data definition, then always only a single common version of that custom data definition is maintained within
the dashboard. Whenever you modify such a custom data definition and reattach it to a single widget within the dashboard, all the other similar occurrences, use the
recently added custom data definition version.
The following are the custom data definition version scenarios that you must consider while reattaching custom data definition:
If two dashboards contain multiple occurrences of the same custom data definition, then each dashboard maintains its individual version. If you modify the custom
data definition and reattach it to only one dashboard, then only that dashboard uses the updated version of the custom data definition. The custom data definition
version in the second dashboard remains unchanged.
The recently added custom data definition version always overrides the existing custom data definition versions, irrespective of the individual custom data
definition versions. For example, when two versions of a custom data definition exist, and an older version of the custom data definition is attached to one custom
widget, whereas a modified version of the same custom data definition exists within a dashboard. Then, if you add the custom widget to the dashboard, the custom
data definition version of the added custom widget template is used because it is the recently added custom data definition.
Procedure
To set custom data definitions, complete the following steps:
1. On the widget page, click the Set Data Definition icon to select a data source, and its monitoring elements.
2. In the Set Data Definition window, click Select from saved Data Definition, and then click Continue.
3. In the Set Data Definition window, based on the chart type, click one or more data definitions that are listed under Data Definition (select one or more) pane, and
click to add the data definitions to Selected Data Definition pane.
If you want to delete a selected data definition, click the Delete icon that is displayed next to it.
Note:
Based on the chart type, you must set chart properties for the selected attributes values. For Bar and Time Series charts, you can specify a single attribute
value for X-axis and multiple attributes values for Y-axis. You can also configure dual Y-axis by setting chart properties for right Y-axis.
For a real-time widget, you must use a Line chart and plot a single series only.
4. Optional: If you selected filters for the widget, then ensure that you set and add cases for the query or REST API methods.
For more information about setting and adding cases for the query or REST API methods, see Creating a custom data definition.
5. Click the Set Properties icon.
6. In the Set Properties window, click Chart, and complete any of the following steps to set chart properties based on the chart type that you selected:
Table 1. Chart properties
Chart type Task
Bar or Time
Series
a. Click SERIES.
b. In the SERIES TYPE tab, complete any one of the following steps:
To set one hardcoded legend at a time that results into a single line per series, click Define a Manual Series.
To set multiple lines per series, click Define a Dynamic Series.
c. In the SERIES tab, complete the following steps:
In the X-axis Labels field, enter a column name that is displayed in the custom data definition preview, and that must be displayed
on the chart.
In the Y-axis Values field, enter a column name that is displayed in the custom data definition preview, and that must be displayed
on the chart.
Baseline chart a. Click SERIES.
b. In the X-Axis Label, Actual Value, High Value, Low Value, and Baseline Value fields, enter the required column names from the custom
data definition preview. Enter only those column names that you want to display on the chart.
Grid chart Click COLUMNS, and in each column pane, complete the following steps:
a. In the Column Header Name field, enter a column heading.
b. In the Column Content Value field, enter a column name that is displayed in the custom data definition preview, and that must be
displayed on the chart.
Badge chart a. Click TITLE and in the Badge Title enter a title for the badge chart.
b. Click VALUE and in the Badge Value field, enter a column name that is displayed in the custom data definition preview, and that must be
displayed on the chart.
Pie chart Click SERIES and in the Value field, enter a column name that is displayed in the custom data definition preview, and that must be displayed on
the chart.
Gauge chart a. Click CHART and in the Value field, enter a column name that is displayed in the custom data definition preview, and that must be
displayed on the chart.
b. Click COLORS.
c. In the Range field, select minimum and maximum values for each range.
d. From the Color list, select a color for each predefined range.
Heatmap chart a. Click SERIES.
b. In the Row Values, Column Values, and Heat Value fields, enter column names that are displayed in the custom data definition preview,
and that must be displayed on the chart.
446 IBM Telco Network Cloud Manager - Performance 1.4.5

Chart type Task
Circos chart a. Click SERIES.
b. In the Source, Destination, and Value fields, enter column names that are displayed in the custom data definition preview, and that must
be displayed on the chart.
Sankey chart Click SERIES and in the Source, Destination, and Weightage fields, enter a column name that is used in the saved data definition and that must
be displayed on the chart.
Venn chart Click SERIES and in the Data Set ID, Data Set Value, Data Set Display Name, and Data Set Tooltip fields, enter a column name that is used in the
saved data definition that must be displayed on the chart.
Range Column
chart
Click SERIES and in the X-axis Label, High Value, and Low Value fields, enter a column name that is used in the saved data definition that must
be displayed on the chart.
Quadrant
Motion chart
a. For X-AXIS and Y-AXIS, in the MIN COUNT field, enter a minimum count value and in the MAX COUNT filed, enter a maximum count
value.
b. Click SERIES and in the X-axis Value, Y-axis Value, Motion Control Value, and Legend fields, enter a column name that is used in the
saved data definition that must be displayed on the chart.
Bullet chart a. Click SERIES, and in the Bullet Name and Bullet Value fields, enter a column name that is used in the saved data definition that must be
displayed on the chart.
b. Select the Add Target checkbox, and in the Target Value field, enter a column name that is used in the saved data definition that must be
displayed on the chart.
Scatter and
Bubble charts
a. Click SERIES.
b. In the Data Definition field, enter the name of the Data Definition that you used to create the chart.
c. In the Bubble Size and X-axis Values fields, enter a column name that is used in the data definition that must be displayed on the chart.
Complex Gauge
chart
a. Click SERIES.
b. In the Data Definition field, enter the name of the custom data definition that you used to create the chart.
c. In the Value and Additional Value fields, enter a column name that is used in the saved data definition that must be displayed on the
chart.
Sunburst chart Click SERIES and in the ID, Parent, Name and Value fields, enter a column name that is used in the saved data definition that must be displayed
on the chart.
Tag Cloud chart Click SERIES and in the Word, Value/Frequency, Category and Additional Tooltip Text fields, enter a column name that is used in the saved data
definition that must be displayed on the chart.
Radar chart a. Click SERIES.
b. In the Series Name (that appears in Tooltip) field, enter the tooltip value that must be displayed on the chart.
c. In the X-axis Values and Y-axis Values fields, enter a column name that is used in the Data Definition that must be displayed on the chart.
Tree chart a. Click SERIES.
b. In the ID, Parent, Type, Node label and Metric value fields, enter a column name that is used in the saved data definition that must be
displayed on the chart.
Note: The parent-child relation in the Tree chart is based on the ID and Parent columns.
Treemap chart a. Click SERIES.
b. In the ID, Parent, Node label, Size, and Node value fields, enter the required column names from the custom data definition preview.
Enter only those column names that you want to display on the chart.
Note: The parent-child relation in the Treemap chart is based on the ID and Parent columns.
Topology chart a. Click SERIES.
b. In the Nodes, Value, Source, Destination, and Groups fields, enter a column name that is used in the saved data definition that must be
displayed on the chart.
Note: Groups and Nodes columns are used to establish parent and child node relations within the chart.
Map chart a. Click SERIES.
b. In the MAP pane, in the following fields, enter the required column names from the custom data definition preview. Enter only those
column names that are required to plot a map.
Latitude
Longitude
Display name
ID
Parent
Map
Note: Nested maps are generated based on the ID, Parent, and Map fields.
Note:
Ensure that you enter appropriate column names from the custom data definition preview.
Repeat the steps to map all the data definitions that you selected.
The steps that are mentioned in the table are minimal steps that must be completed for any chart to be displayed. For more information about setting chart
properties, see the following topics:
Setting widget properties for all the chart types
Setting chart properties
Widgets or dashboards that are created by using the JDBC custom data definitions always display the timestamp data in the Epoch format only. However,
while setting chart properties, you can change the display format from Epoch to any other format in Bar, Time Series, and Grid charts only.
7. Close the Set Properties window.
Related tasks
Testing database connection with Connector Source
Creating custom widgets
Before you begin
IBM Telco Network Cloud Manager - Performance 1.4.5 447

Ensure that the data source that you want to monitor are already added.
For more information about connectors and data sources, see Testing database connection with Connector Source.
Ensure that the custom filters that you want to set for a widget are already created.
If you want to set a background image for the widget, then ensure that the image is already available on your computer.
To create specialized widgets such as multi-chart widgets, web widget, and a widget to list all the instances for a selected source and resource type, see Specialized
widgets.
About this task
You can create custom widgets or templates by using any of the following options on the landing page:
Click CREATE COMPONENTS, then in the Create Components page, click WIDGETS.
Click the Expand icon to open the left navigation pane of Dashboard Designer , and click Custom Widgets > Create New Widget.
At any point of widget creation, for Bar, Time Series, and Pie chart categories, you can replace an already selected chart with another chart type that belongs to the same
category. For example, you can replace an existing Pie chart with a Donut chart. The predefined data definitions and chart properties are not altered with change in the
chart type.
Note: You cannot change a chart type when you preview a widget that contains multiple plots.
You can add multiple data definitions to Time Series, Bar, Bubble, Complex Gauge, Radar, and Scatter charts only. To all the remaining charts, you can add only one data
definition.
Procedure
Complete the following steps to create a custom widget:
1. In the navigation pane of Dashboard Designer , click Custom Widgets > Create New Widget.
The New Widget page opens.
2. Click the Edit icon that is displayed next to the New Widget, Widget Description, and Widget Title fields, and enter a name, title, and description for your
widget.
Note: Only alphanumeric characters, spaces, and underscore are supported.
3. The Show Gridlines checkbox is selected by default.
If you do not want the gridlines view, clear the checkbox.
4. In the navigation pane, click Charts and expand a chart category.
For example, expand Bar.
The chart types for that category are displayed.
5. From the navigation pane to the widget, drag a chart that you want to use.
For example, if you want to add Stacked Bars to a widget, then you must drag the Stacked Bars chart from the navigation pane to the widget.
For more information about the various chart types, see Charts.
Instead of dragging a chart to the widget area, you can drag any one of the following widgets:
Drag a template widget to the widget and click Use this Template.
Drag an existing custom widget and modify it. For more information about modifying a custom widget, see Modifying widgets
6. Optional: Click the icon to select the default filters and custom widget-level filters.
Note:
For the widget-level filters to work properly, you must map metrics to filters when you set data definitions or in custom data definitions.
For more information about mapping metrics to filters or setting and adding cases for the queries or REST API methods, see Creating a custom data
definition.
You can select maximum five filters. This number includes the default and custom filters, including conditional or dependent filters.
When you select a child filter, its parent filter is selected automatically.
You can also rearrange the widget-level filters. However, parent-child filters cannot be switched. A parent filter always precedes its child filter.
To change values in the child filters, you must first change values in the parent filter. For example, the PM filters, Summarization and Aggregation are
child filters and dependent on the parent filter, Interval. If you directly change the filter value in Summarization without first changing its parent filter
value, then the Summarization filter displays a None value.
You cannot add filters to a widget that streams real-time data.
For more information about default and custom filters, and creating custom filters, see Filters.
If widget-level filters are set, then the widget displays a check mark on Set Filters icon. Else, Set Filters icon does not display any check mark.
7. Click icon to select a data source and its monitoring elements.
For more information about setting data definitions, see the following topics:
Setting data definitions by using custom data definitions
8. Click icon to set the widget and chart properties.
For more information about setting widget and chart properties, see the following topics:
Setting widget properties for all the chart types
Setting chart properties
9. Optional: To add a background image to a widget, complete the following steps:
a. Click icon that is displayed on the upper right of the widget.
b. In the Background Image pop-up window, click Add Background Image, and then click Select from File.
c. Browse to the image file location on your computer, select the file, and then click Open.
Note: You can add PNG, JPEG, JPG, or GIF image files of size less than or equal to 2 MB.
The selected image is added as a background image to the widget. To replace the image, repeat the steps, and select another image. To delete the image,
click No Background Image.
10. To save the widget as a custom widget, click Save, and complete the following steps in the Save Widget window:
a. In the SAVE AS pane, click Widget.
448 IBM Telco Network Cloud Manager - Performance 1.4.5

Note: The SAVE AS pane is displayed only when you use APM, ICAM, or ITM Connectors in the widget.
To save the custom widget as a custom template, see Saving custom widgets as templates.
b. In the Name field, enter a name for the widget.
c. To save the widget to an existing category, click Existing category, select a category name from the drop-down list, and then click Save.
d. To save the widget to a new category, click New Category, enter a category name, and then click Save.
11. To save the widget with another name, click the Save As option, and in the Save As Widget window, enter the required details.
12. Optional: For Bar, Time Series, and Pie chart categories, you can replace the selected chart with another chart that belongs to the same category. Click the Change
Chart Type icon and select the required chart type from the available options.
You can change a chart type at any step of widget creation.
The existing chart is replaced with the selected chart type without any changes to the data definitions or chart properties.
13. After you save a widget, to preview it, click the Preview icon.
Results
The newly created custom widgets and widget templates are listed under Most Recently Created Widgets in the navigation pane. Each widget displays an icon next to it.
The icon indicates the chart type that is used in the widget.
What to do next
You can complete any of the following tasks:
Publish the custom widgets.
For more information, see Publishing custom widgets.
Use custom widgets or widget templates in a dashboard.
For more information, see Creating a dashboard.
Setting widget properties for all the chart types
You must set widget properties for every chart.
Setting widget properties for all the chart types
You must set widget properties for every chart.
About this task
The following procedure lists the widget properties for all the chart types. The widget properties for a Badge chart are documented in a separate section. A few properties
can be auto-populated based on whether you created a data definition by using connectors or used a custom data definition for the chart.
Note: A few properties might not be applicable to a chart type and hence, might not be displayed for those charts.
Procedure
Setting widget properties for all chart types, except Badge chart.
To set widget properties for all the chart types, complete the following steps:
1. On the widget page, click the Set Properties icon.
The Set Properties window opens. By default, the TITLE BAR tab under the WIDGET tab is displayed.
2. To hide the title of the widget, select the Hide title bar checkbox.
3. The Widget title field displays the widget title or the name of the first column in the widget. If you want to modify it or replace it, then you must enter a new
title in this field.
4. The Append Title with Master Parameter Values checkbox is selected by default. If the widget is set as a listener widget in a master-listener relation, then the
widget title is appended with the values that are received from its related master widget.
However, if you do not want the widget title to be appended with the values that are received from its related master widget, then you must clear the Append
Title with Master Parameter Values checkbox.
For more information about master-listener relation, see Setting relations.
5. To enable the expand and collapse option for the widget when it is previewed or published on Engine, select the Enable Expand/Collapse checkbox.
The widget displays the Collapse icon when it is previewed or published.
Note: Even if you select the Enable Expand/Collapse checkbox, due to some limitation, the widgets do not display the Expand and Collapse icons
when they are previewed on Dashboard Designer or published on Engine.
6. To enable the maximize option for the widget, select the Enable Maximize checkbox.
The widget displays the Maximize icon when it is previewed or published.
7. To enable the change chart type option for the widget when it is published on Engine, select the Enable Change Chart Type checkbox.
The widget displays the Chart Type icon when it is previewed or published.
8. To set widget area properties, complete the following steps:
a. In the left navigation pane of the WIDGET tab, click WIDGET AREA.
b. To specify borders for the widget, select a required option from the Widget border list.
The widget borders are displayed after it is previewed or published.
IBM Telco Network Cloud Manager - Performance 1.4.5 449

c. To define a custom style for the widget area, enter a CSS style in the Other styles field.
For example, font-family: Arial; font-size:20px; color: #777777; height: 333px
Setting widget properties for a Badge chart.
1. On the widget page, click the Set Properties icon.
The Set Properties window opens. By default, the WIDGET tab is displayed.
2. To display widget borders, from the Widget border list, select the required option.
3. To define border colors and border width, complete any of the following steps:
To use the default border colors, in the Border Color pane, click Default.
To customize border colors, in the Border Color pane, click Custom, and select color and width for the borders.
Setting chart properties
Dashboard Designer contains different chart types that you can use within widgets or dashboards. Whenever you use a chart, you must set its properties.
About this task
Following are the different chart types and the properties that must be set.
Setting properties for Badge charts
Every Badge chart contains two areas, title area and value area. Title area contains the title bar along with the title. The remaining area is termed as the value area. You
can set properties for both these areas.
Procedure
Complete the following steps to set chart properties for Badge charts:
1. On the widget page, click the Set Properties icon.
The Set Properties window opens.
2. In the CHART tab, set the following chart properties, and close the Set Properties window.
Setting title properties
You must set the following properties for the title area of a Badge chart.
Procedure
Complete the following steps to set properties of the title area within a Badge chart:
1. In the left navigation pane of the CHART tab, click TITLE.
2. The Badge Title field displays the default title of the chart.
You can modify the title, if required.
3. The Badge Title Tooltip field, enter a tooltip text that you want to be displayed when the dashboard is published.
4. In the Title Position pane, click the chart image of your choice.
5. From the Title Area height/width list, select height and width of the title area in percentage.
The remaining area is allotted to value area of the Badge chart.
6. From the Font list, select a font for the Badge title.
7. From the Size list, select a font-size for the Badge title.
8. On the Style toolbar, click the required style to display the Badge title in bold, italics, and with an underline.
9. On the Text Direction toolbar, click the required text orientation.
10. On the Horizontal align and Vertical align toolbar, click the required alignments for the Badge title.
11. In the Other specific styles for Badge Title Bar, enter any additional styles in CSS format for the Badge title.
Setting value properties
You must set the following properties for the value area of a Badge chart. The Badge Value field can be auto populated based on whether you created a data definition by
using connectors or used a custom data definition.
Procedure
Complete the following steps to set properties of the value area within a Badge chart:
1. In the left navigation pane of the CHART tab, click VALUE.
2. In the Badge Value field, you must enter the name of the column that must be displayed.
450 IBM Telco Network Cloud Manager - Performance 1.4.5

The Badge Value field is auto-populated, if you created data definition by using connectors. However, if you used a saved custom data definition, then you must
enter a column name.
3. From the Font list, select a font for the text.
4. From the Size list, select a font-size for the text.
5. On the Style toolbar, click the required style to display the text in bold, italics, or with an underline.
6. On the Horizontal align and Vertical align toolbar, click the required alignments for the text in the value area.
7. Optional: To add a unit along with the value, select the Add Unit along with Value checkbox, and complete the following steps:
a. In the Unit field, enter a unit for the value that is displayed in the chart.
b. From the Unit Position list, select a position for the unit.
c. From the Size list, select font size for the unit value.
8. In the Other Specific Styles for the Value Area, enter any additional styles in CSS format for the value area.
Setting color properties for Badge charts
You must set the following color properties for the title and value areas of a Badge chart.
Procedure
Complete the following steps to set color properties of the title and value areas within a Badge chart:
1. In the left navigation pane of the CHART tab, click COLORS.
2. To display the title and value area according to the dashboard theme, click As per Theme.
3. To set a specific text color and background color for title and value area, click Fixed Background and Text Colors, and complete the following steps to set
background and text colors for title, value, and unit:
a. Click each of the list boxes, such as Title Bg, Title, Value Bg, Value, and Unit.
The Edit color and opacity pop-up window is displayed.
b. Click the colored box within the pop-up window to open the Color window.
c. Select a color and click OK.
d. Move the slider to adjust the opacity of the selected color.
4. To define a set of value ranges and to set a specific text and background color for each range, click Change Background and Text colors as per range, and complete
the following steps:
a. In the Range fields, set a range by entering or selecting values.
b. Click each of the list boxes, such as Title Bg, Title, Value Bg, Value, and Unit.
The Edit color and opacity pop-up window is displayed.
c. Click the colored box within the pop-up window to open the Color window.
d. Select a color and click OK.
e. Move the slider to adjust the opacity of the selected color.
To add another range, click Add Another, and repeat this step.
To delete a range and its associated colors, click the Delete icon that is displayed next to the range.
Setting chart properties for Bar, Area, and Line charts
You need to set chart properties for the charts that you add to a widget.
Procedure
Complete the following steps to set chart properties for Bar, Area, and Line charts:
1. On the widget page, click Set Properties icon.
The Set Properties window opens.
2. In the CHART tab, set the following chart properties, and close the Set Properties window.
3. You do not need to set the chart color properties. The chart is displayed according to the theme applied on Engine.
Setting X-axis and Y-axis properties
You can set chart properties for every chart that you add to a widget.
About this task
The following procedure lists all the X-axis and Y-axis properties, irrespective of the chart type. A few properties might not be applicable to a chart type and hence, might
not present for those charts. Also, a few properties can be auto-populated based on whether you created a data definition by using connectors or used a saved data
definition for the chart.
Procedure
Complete the following steps to set X-axis and Y-axis properties:
IBM Telco Network Cloud Manager - Performance 1.4.5 451

1. To set properties for X-axis, in the left navigation pane of the CHART tab, click X-AXIS, and set the properties that are provided in the following X-axis and Y-axis
properties table.
2. To set properties for Y-axis, in the left navigation pane of the CHART tab, click Y-AXIS, and set the properties that are provided in the following X-axis and Y-axis
properties table.
Table 1. X-axis and Y-axis properties
Field User action
Axis Title Enter a title for the axis.
The title is displayed when you preview or publish the widget.
Tooltip Title Enter a tooltip title for the axis.
The tooltip title along with the axis value is displayed when you preview or publish the widget.
Data Points Limit Enter the number of data points that must be displayed on the Line chart for real-time data.
The valid value range is 10-9999.
Note: This field is displayed only for Line charts with real-time data.
Enable Zoom If you want the published dashboard to display a horizontal slide bar on the X-axis to zoom in or zoom out the data, select the Enable
Zoom checkbox.
TICKS & LABELS Complete any one of the following steps:
To display major labels, major and minor ticks, and to auto-adjust the number of displayed labels according to the data and size
of the published widget, click Auto-set Axis Ticks and Labels to Display.
To manually select the types of ticks, tick steps, and tick labels that must be displayed in the published or previewed widget,
click Manually-set Axis Ticks and Labels to Display, and complete the following steps:
Under TICKS, select the type of ticks that you want to be displayed on the widget.
Under TICK STEPS, if you click Manually-set steps, then you must enter a data range value for each tick that you selected
under TICKS.
Tick steps define the amount of data range that must be skipped before the next tick is displayed.
Note:
If you enter invalid values that are not in sync with the chart, then the chart is not displayed.
If you do not enter any value for the tick steps, then the tick steps are auto-set.
Under TICK LABELS, if you click Manually-set Label, then you must select the appropriate checkboxes to display labels for
the selected ticks.
Tick label displays a label for the selected ticks.
Note: If you do not select any labels, then the labels are auto-set.
Axis Labels Rotation (in
degree)
To specify angular rotation in degrees for the axis labels, select the required value from Axis Labels Rotation (in degree) list.
Truncate labels after
num characters
Where num is the
number of characters.
To cut short the labels after certain characters, select the number of characters to be displayed on the chart from Truncate labels after
num characters list.
AXIS COUNT > MIN
COUNT VALUE
To define the minimum count value, click any one of the following options under MIN COUNT VALUE:
To start the axis at zero, click Start at 0.
To start the axis at a specified value, click Start at, and select the required value.
To start the axis dynamically according to the data, click Dynamic as per Data.
AXIS COUNT > MAX
COUNT VALUE
To define the maximum count value, click any one of the following options under MAX COUNT VALUE:
To end the axis at specific value, click End at, and select the value.
To end the axis dynamically according to the data, click Dynamic as per Data.
3. Optional: While setting data definition, if you selected multiple metric values for Y-axis, then you can define a right Y-axis. To define a right Y-axis, click Add Right Y-
axis, and set the properties that are provided in the X-axis and Y-axis properties table.
For more information about setting data definition, see Creating a custom data definition.
Setting plot properties
You can set maximum two plots on a chart. The default plot is based on the chart type that you select first. For example, if the first chart type is Area, then the default plot
is Area.
Before you begin
The second plot that you can add to a chart is based on the default chart type that you select.
For Clustered Bars and Stacked Bars, you can plot dual charts only among themselves that is, Clustered Bar with another Clustered Bar or Clustered Bar with Stacked bar.
Similarly, a Stacked Bar can be plotted with another Stacked Bar or Clustered Bar.
About this task
The following procedure lists all the plot properties, irrespective of the chart type. A few properties might not be applicable to a chart type and hence, might not present
for those charts.
Procedure
Complete the following steps to set plot properties for the default chart:
1. To set plot properties, in the left navigation pane of the CHART tab, click PLOTS.
2. From the Y-Axis list, select the default Y-axis for the chart.
Usually, the default Y-axis is Default Left Y-axis.
452 IBM Telco Network Cloud Manager - Performance 1.4.5

3. Complete any one of the following steps based on the chart type:
If the chart is a Bar chart, then complete the following steps:
From the Column Size list, select the required column size.
From the Gap between Columns list, select the required space between two consecutive bars or columns in a chart.
If the chart is a Time Series chart, then complete the following steps:
From the Line Style list, select the required style for the plot.
If you select Straight Line, it indicates a straight line.
To display markers, select Show Markers.
Note: The first plot that you define is the default plot. The second plot that you add is known as the non-default plot.
4. To add a non-default plot, complete the following steps:
a. Click Add Another Plot, and expand PLOT 2.
b. From the Chart Type list, select a chart type other than the one selected for the default first plot.
c. From the Y-Axis list, select a Y-axis for the chart, and repeat the steps that are provided earlier in to set plot properties for the selected chart type.
Note: You can select Right Y-Axis only if you added a right Y-axis while setting properties for Y-axis. For more information, see Setting X-axis and Y-axis
properties.
To delete the second plot, click the Delete icon that is displayed on the plot.
Setting series properties
You must set series properties based on the type of series such as Dynamic series or Manual series.
About this task
When you create a custom widget, you can set data definition either by using connectors or custom data definition. If you use connectors, then a dynamic series is created
automatically. If you use custom data definition, then you can select manual or dynamic series.
For a dynamic series that is created by using connectors, the data definition columns are already mapped to X-axis, Y-axis, or legends. Hence, you can set only a few series
properties. Also, dual Y-axis is not supported for any dynamic series.
For manual series, you must map the data definition column for every series that you want to plot.
Note: After you define a series type and a series, you cannot change the series type unless you delete all the already defined series, and clear all the values that are
entered for the default series.
Procedure
Complete the following steps to set series properties for a chart where data definition is set by using connectors:
1. In the left navigation pane of the CHART tab, click SERIES.
2. In the SERIES tab, complete the following steps in each SERIES pane:
Note: The number of SERIES panes that are displayed in the SERIES tab depend on the number of metric values that are selected when you created data
definition.
a. From the Plot list, select a plot type for the series.
Note: The default plot type for any series is Default. You can select Non-default only if you added a non-default plot while setting plot properties. For
more information, see Setting plot properties.
b. To change the display format of the source data that is in Epoch format or ISO 8601 format, select the Change display format if source data is in Epoch
or ISO 8601 time format checkbox, and complete the following steps:
i. From the Source Data Unit list, select the format of the source data.
ii. From the Display Format lists, select the format in which the date and time must be displayed on the X-axis.
Note: For dynamic series, you must not select the Is Data Definition Array nested checkbox.
Repeat these steps to set properties in each SERIES pane.
3. To delete a series from the chart, click the Delete icon that is displayed on individual SERIES panes.
4. In the OTHER DETAILS tab, complete the following steps:
From the X-axis Labels Data Type list, select a data type.
In the Sort X-axis Labels by field, enter a column name that must be used to sort the labels.
Complete the following steps to set series properties for a chart where a custom data definition is used:
1. In the left navigation pane of the CHART tab, click SERIES.
2. Click any one of the following options in the SERIES TYPE tab:
To set one hardcoded legend at a time that results into a single line per series, click Define a Manual Series.
To set multiple lines per series, click Define a Dynamic Series.
Note: The OTHER DETAILS tab is displayed, only when you select Define a Dynamic Series.
3. In the SERIES tab, complete the following steps:
a. If you do not want a plot to be displayed as default, then from the Plot list, select Non-default.
b. In the X-axis Labels field, enter the required column name from the custom data definition preview. Enter the column name that you want to display
on the chart.
c. In the Y-axis Values field, enter the required column name from the custom data definition preview. Enter the column name that you want to display
on the chart.
d. To change the display format of the source data that is in Epoch format or ISO 8601 format, select the Change display format if source data is in Epoch
or ISO 8601 time format checkbox, and complete the following steps:
i. From the Source Data Unit list, select the format of the source data.
ii. From the Display Format lists, select the format in which the date and time must be displayed on the X-axis.
e. In the Legends field, complete any one of the following steps:
For dynamic series, enter a corresponding column name that is used in the custom data definition.
For manual series, enter any attribute value that is used in the custom data definition.
f. Only for a manual series, you must select the Is Data Definition Array nested checkbox, and in the Dataset Identifier name field, enter the name of the
data set that is used for nested arrays.
IBM Telco Network Cloud Manager - Performance 1.4.5 453

g. If you want to add an extra series, click Add Another Series, expand the SERIES 2 pane, and complete the following steps:
i. In the Data Definition field, enter the name of the data definition that you used to create the chart.
ii. From the Plot list, select a plot type for the series.
Note: The default plot type for any series is Default. You can select Non-default only if you added a non-default plot while setting plot
properties. For more information, see Setting plot properties.
iii. Repeat the earlier steps to enter information in the remaining fields.
h. To delete a series from the chart, click the Delete icon that is displayed on individual SERIES pane.
4. In the OTHER DETAILS tab, complete the following steps:
From the X-axis Labels Data Type list, select a data type.
In the Sort X-axis Labels by field, enter a column name that must be used to sort the labels.
Note: The OTHER DETAILS tab is displayed only when you click Define a Dynamic Series in the SERIES tab.
Setting legend properties
You can set the following legend properties that are applicable for the chart type you select.
Procedure
Complete the following steps to set legend properties:
1. In the left navigation pane of the CHART tab, click LEGENDS.
2. If you do not want legends to be displayed in the published or previewed dashboard, then clear the Show Legends checkbox.
3. If you do not want to view data of a single series at a time, then clear the Make Legends Interactive checkbox.
4. If you want the legends to be displayed vertically on the widget, then click Vertical. Else, click Horizontal.
Setting chart color properties
You can set the following color values that are applicable for the chart type that you select.
Procedure
Complete the following steps to set color properties:
1. In the left navigation pane of the CHART tab, click COLORS.
2. If you want the published chart to display colors according to the dashboard theme, click As per Theme.
3. If you want the published chart to display specific colors, click Custom, and complete the following steps:
To display the chart in a defined set of standard colors, click Standard Colors, and complete any of the following steps:
To display the chart in a colorful scheme, click any of the predefined color ranges that are listed under Colorful.
To display the chart in tints of a single color, click any of the predefined color ranges that are listed under Monochromatic.
To display the chart in colors of your choice, click User Defined Colors, and complete any of the following steps:
To display the chart in a color range that was recently defined by you, click a color scheme that is listed under Recently Defined.
To define a new color range, click the colored box that is displayed under Define Other Custom Colors, and complete the following steps in the Edit
color and opacity pop-up window:
Click the colored box within the pop-up window to open the Color window. Select a color, and click OK.
Move the slider to adjust the opacity of the selected color.
To add a color before or after the selected color, click the Add a color before this or Add a color after this option.
To delete a color, click the Delete option.
To append colors, click the Add icon.
Setting properties for Baseline chart
You need to set chart properties for the charts that you add to a widget.
Procedure
Setting chart properties.
Complete the following steps to set chart properties:
1. On the widget page, click the Set Properties icon.
The Set Properties window opens.
2. Click the CHART tab.
3. In the left navigation pane of the CHART tab, click CHART.
4. To change the display format of the source data that is in Epoch format or ISO 8601 format, select the Change display format if source data is in Epoch or ISO
8601 time format checkbox, and complete the following steps:
a. From the Source Data Unit list, select the format of the source data.
b. From the Display Format lists, select the format in which the date and time must be displayed on the X-axis.
5. In the Y-Axis Title field, enter a title for the Y-axis.
454 IBM Telco Network Cloud Manager - Performance 1.4.5

The title is displayed when you preview or publish the widget.
Setting series properties.
In the left navigation pane of the CHART tab, click SERIES, and complete the following steps in SERIES pane:
In the X-Axis Label, Actual Value, High Value, Low Value, and Baseline Value fields, enter the required column names from the custom data definition
preview. Enter only those column names that you want to display on the chart.
The data in the High Value and Low Value columns is used to plot the background range area, and a line graph is plotted by using the Actual Value data.
Note: Baseline field is optional. If you want a line graph to be plotted to show the baseline reference values, then you must enter a column name in the
Baseline Value field.
Setting color properties.
In the left navigation pane of the CHART tab, click COLORS, and complete the following steps to select colors for the baseline and actual value line. You can also set
different actual value line colors to be displayed when the line ascends or descends the high or low values.
Click the colored box that is displayed next to each label.
In the Color window, select a color, and click OK.
Setting chart properties for Bullet charts
You need to set chart properties for the charts that you add to a widget.
Procedure
Setting chart properties.
Complete the following steps to set chart properties:
1. On the widget page, click the Set Properties icon.
The Set Properties window opens.
2. Click the CHART tab.
3. In the left navigation pane of the CHART tab, click SERIES.
4. In the Bullet Name and Bullet Value fields, enter the required column names from the custom data definition preview. Enter only those column names that
you want to display on the chart.
5. In the Actual Value field, enter a tooltip text for the Bullet Value field. This text is displayed as tooltip on the published chart.
6. In the Range field, enter range values that must be displayed on the chart, when the dashboard is published.
7. To add a target, select the Add Target checkbox, and complete the following steps:
In the Target Value field, enter the required column names from the custom data definition preview. Enter only those column names that you want to
display on the chart.
From the Target Line Color list, select a color for the target line.
In the Tooltip Text pane, complete the following steps:
In the Target Value field, enter a tooltip text for the Target Value field. This text is displayed as tooltip on the published chart.
In the Target Completion field, enter a target completion value that must be displayed on the chart, when the dashboard is published.
8. For multi-series charts, to add a series title, select Add Series Title checkbox, and enter a series title.
Setting color properties.
In the left navigation pane of the CHART tab, click COLORS, and complete the following steps:
To display the chart by using the default color scheme, click Use Default Colors as per Theme.
To define a value range and set a color for the range, click Define a Custom Color Range, and complete the following steps:
In the Range fields, set a range by entering or selecting values.
Click the BG list to open the Color window, select a color, and click OK.
To add more value ranges, click Add Another, and repeat the earlier steps.
To delete a value range, click the Delete icon that is displayed next to the range.
Click the colored box under Bullet Color to open the Color window, select a color, and click OK.
Setting chart properties for Circos charts
You need to set chart properties for the charts that you add to a widget.
Procedure
Complete the following steps to set chart properties for Circos charts:
1. On the widget page, click the Set Properties icon.
The Set Properties window opens.
2. Click the CHART tab.
3. In the left navigation pane of the CHART tab, click CHART, and complete the following steps:
In the Source, Destination, and Value fields, enter the required column names from the custom data definition preview. Enter only those column names that
you want to display on the chart.
To define a unit for the Value field, select the Add Unit along with Value checkbox.
In the Unit field, enter a unit name for the data definition values, and select a position for the unit from the Unit Position list.
4. You do not need to set the chart color properties. The chart is displayed according to the theme applied on Engine.
IBM Telco Network Cloud Manager - Performance 1.4.5 455

5. To set chart color properties in the COLORS tab, see Setting chart color properties.
Setting properties for Complex Gauge chart
You need to set chart properties for the charts that you add to a widget.
Procedure
Complete the following steps to set chart properties for Complex Gauge chart:
1. On the widget page, click the Set Properties icon.
The Set Properties window opens.
2. Click the CHART tab.
3. In the left navigation pane of the CHART tab, click SERIES.
4. In the OUTER GAUGE and INNER GAUGE panes, set the following properties:
In the Data Definition, Value, and Additional Value fields, enter the required column names from the custom data definition preview. Enter only those column
names that you want to display on the chart.
5. In the left navigation pane of the CHART tab, click CHART.
6. In the OUTER GAUGE and INNER GAUGE panes, set the following properties:
In the Min Value and Max Value fields, select or enter the minimum and maximum values that must be displayed on the chart.
In the Label for Value in Tooltip fields, enter a label for the values that are displayed on the chart.
In the Label for Additional Value in Tooltip fields, enter a label for any additional value that is displayed on the chart.
To display tooltip summary on the chart, select the Display Gauge Summary in the center and Display Gauge Summary at the bottom check boxes.
To define a unit for the values, select the Display Unit in the center checkbox, and in the Unit field, enter a unit name.
To set tick interval, complete any one of the following steps:
To display ticks and to auto-adjust the number of displayed ticks according to the data and size of the published widget, click Auto.
To define specific tick intervals, click Define Specific tick Interval and enter or select the tick interval value.
Setting value ranges and colors
You can set the following data value ranges and assign a color for each range for the chart type that you select.
Procedure
Complete the following steps to define data value ranges and assign a color to each range:
1. In the left navigation pane of the CHART tab, click COLORS.
2. In the OUTER GAUGE and INNER GAUGE panes, complete the following steps:
a. In the Range fields, select or enter minimum and maximum range values.
b. Click the Color box.
The Color window is displayed.
c. Select a color and click OK.
d. To add more value ranges, click Add Another, and repeat the earlier steps.
e. To delete an already added range, click the Delete icon that is displayed next to the range.
Setting chart properties for Gauge charts
You need to set chart properties for the charts that you add to a widget.
Procedure
Complete the following steps to set chart properties for Gauge charts:
1. On the widget page, click the Set Properties icon.
The Set Properties window opens.
2. In the CHART tab, set the following chart properties, and close the Set Properties window:
Setting chart properties
3. In the COLOR tab, complete the following steps to define a value range and set a color for each range:
Setting value ranges and colors
Setting value ranges and colors
You need to set data value ranges and associate color for each range in the Gauge chart.
456 IBM Telco Network Cloud Manager - Performance 1.4.5

Procedure
Complete the following steps to set value ranges and associate a color for each range:
1. In the left navigation pane of the CHART tab, click COLORS.
2. In the Range fields, select minimum and maximum values for each range.
3. Click the Color box.
The Color window is displayed.
4. Select a color and click OK.
5. Optional: To define more data ranges and to associate a color for each range, click Add Another.
6. Optional: To delete a range, click the Delete icon next to the range.
Setting properties for Grid charts
You need to set chart properties for the Grid charts that you add to the dashboard.
Procedure
Complete the following steps to set chart properties for Grid charts:
1. On the widget page, click the Set Properties icon.
The Set Properties window opens.
2. In the CHART tab, set the following chart properties, and close the Set Properties window.
Setting column properties
You must set the following properties for every column that is displayed in the Grid chart.
Procedure
Complete the following steps to set column properties:
1. In the left navigation pane of the CHART tab, click COLUMNS.
2. Complete the following steps in each COLUMN pane that is displayed:
Note: The number of COLUMN panes that are displayed depend on the number of metric values that you selected when you created data definition. However, if you
used a saved custom data definition, then you need to manually enter column name in the Column Content Value field, and click Add Another Column to add
additional columns to the Grid chart.
3. If you want to change the default column header name, then in the Column Header Name field, enter a name.
4. Under Column Width, complete any of the following steps:
To automatically adjust the column width according to the size of the table, click Auto.
To manually specify the column width, click Manual, and enter the width in percentage for the column.
5. The Column Content Value field is auto-filled if you created a data definition. However, if you selected a custom data definition, then you must enter the required
column name from the custom data definition preview. Enter the column name that you want to display on the chart.
6. On the Alignment toolbar, click the required alignment to left, right, or center align the column text.
7. On the Style toolbar, click the required style to display the column text in bold, italics, and with an underline.
Note: You cannot define any alignment or style for the column header.
8. From the Data Type list, select the type of the data that is displayed in the column, and then specify a format for that data type.
Complete any one of the following steps to specify data format:
If the data type is number, then from the Data Type list, select number, and complete any of the following steps:
To display data in decimals, click Decimal points, and enter the decimal points that must be displayed. For example, to display data up to two decimal
points, enter 2.
To display shortened form of numbers, click Shorten Number.
For example, 1200 appears as 1.2K.
To set a specific icon for a range of values, click Show Number + Status Icons as per Range, enter a range in the Range fields, and select an icon for the
range from the Icons list.
Click Add Another, and repeat this step to define multiple ranges and set a specific icon for each range. To delete a range, click the Delete icon
that is displayed next to it.
To set a specific background color and text color for a range of values, click Show Number + Change Background & Text Color as per Range, enter a
range in the Range fields, and select background color and text color for the range from the BG and Text lists.
Click Add Another, and repeat this step to define multiple ranges, and set a specific background and text color for each range. To delete a range, click
the Delete icon that is displayed next to it.
To replace numbers with a progress bar, click Replace Number with Progress Bar and in the Progress Bar Range field, enter a range for which a
progress bar must be displayed.
To display data as numbers only, click Show Number Only.
If the data type is time or date, then complete the following steps:
From the Data Type list, select the appropriate data type.
From the Source Data Unit and Display Format lists, select a unit and format in which the date or time must be displayed.
IBM Telco Network Cloud Manager - Performance 1.4.5 457

If the data type is a String or Boolean value, then select that data type from the Data Type list. You do not need to set any additional properties for string or
boolean data types.
9. To delete a column, click the Delete icon that is displayed in the column pane.
Setting other properties
You can set the following properties for a Grid chart.
Procedure
Complete the following steps to set other properties for a Grid chart:
1. In the left navigation pane of the CHART tab, click OTHERS.
2. The Enable Grid Filter checkbox is selected by default. If you want to hide the filter, clear the checkbox.
3. To display the grid data in multiple pages, select the Show Pagination checkbox.
4. If pagination is enabled on the data server, then you can enable server-side pagination. Select the Support Bulk Data on Load checkbox, and enter the name of the
primary column that must be used for pagination.
5. To display a scroll bar when you preview or publish a grid, in the Freeze Column Count field, enter the number of columns that must remain static in the table.
For example, if you want the first three columns of a table to remain static, then enter 3 in the Freeze Column Count field. The preview displays the first three
columns as static and a scroll-bar is added to scroll through the remaining columns of the table.
Note: You can set this property only when the column width is set manually to more than 100% in the COLUMNS tab.
6. From the Column Header Sorting list, select any of the following options:
To enable sorting of data only for a single column, select Apply on Single Column.
To enable sorting of data by using any two columns, select Apply on Multiple Column.
Setting table or column width in a Grid chart
If a Grid chart displays too many columns, then you must set the table properties manually so that the table is displayed properly when you preview it in the dashboard.
Procedure
Complete the following steps to adjust the width of individual columns:
1. In the custom widget, click Set Properties ( ).
2. In the Set properties window, click CHART, and in the left navigation pane, click COLUMNS.
3. To manually set width of each column, you must complete the following steps in each column pane:
a. Expand each COLUMN pane.
b. Under Column Width, click Manual, and enter a width in percentage for the column.
Note: You can increase or decrease the width of columns so that they are displayed properly.
Setting chart properties for Heatmap charts
You need to set chart properties for the charts that you add to a widget.
Procedure
Setting chart properties.
Complete the following steps to set chart properties:
1. On the widget page, click the Set Properties icon.
The Set Properties window opens.
2. Click the CHART tab.
3. In the left navigation pane of the CHART tab, click ROWS or COLUMNS, and complete the following steps:
In the Tooltip Title field, enter a tooltip text that must be displayed on the table row or column, when the dashboard is published.
The Show Row Labels or Show Column Labels check boxes are selected by default. Clear the selections, if you do not want the labels to be displayed
on the published chart.
To specify angular rotation in degrees for the labels, select the required value from the Labels Rotation (in degree) list.
To cut short the labels after certain characters, select the number of characters to be displayed on the chart from the Truncate labels after num
characters list.
Where, num is the number of characters.
Setting series properties.
In the left navigation pane of the CHART tab, click SERIES, and complete the following steps:
In the Row Values, Column Values, and Heat Values fields, enter the required column names from the custom data definition preview. Enter only those
column names that you want to display on the chart.
The Show Heat Value on each Box checkbox is selected by default. Clear the selection, if you do not want the values to be displayed on the chart.
458 IBM Telco Network Cloud Manager - Performance 1.4.5

Setting color properties.
In the left navigation pane of the CHART tab, click COLORS, and complete the following steps:
If you want the chart to display colors according to the default color theme, click Use Default Colors as per Theme.
If you want to define value ranges, set colors, and specify a name for each range, click Define a Custom Static Color Range, and complete the following steps:
1. From the Range column, select minimum and maximum values.
2. In the Name field, enter a name for the selected range.
3. Click the colored box under BG and Text.
The Color window is displayed.
4. Select a color and click OK.
5. To add more value ranges, click Add Another.
6. To delete an already added range, click the Delete icon that is displayed next to the range.
7. The Show Range Name on each Box and Show Range in Legend check boxes are selected by default. Clear the selections, if you do not want the name
and ranges to be displayed.
If you do not want to define multiple ranges but want to specify colors only for the lowermost and uppermost values, then click Define a Custom Linear
Range, and complete the following steps:
1. Click the colored boxes next to Min Heat and Max Heat.
The Color window is displayed.
2. Select a color and click OK.
The chart is rendered based on the colors that you select for the minimum and maximum values.
Setting chart properties for Pie, Donut, or Gauge charts
You need to set chart properties for the charts that you add to a widget.
Procedure
Complete the following steps to set chart properties for Pie charts:
1. On the widget page, click the Set Properties icon.
The Set Properties window opens.
2. In the CHART tab, set the following chart properties, and close the Set Properties window.
Setting legend properties
Setting chart color properties
3. You do not need to set the chart color properties. The chart is displayed according to the theme applied on Engine.
Setting chart properties
You must set the following chart properties for a Pie, Donut, or Gauge chart.
About this task
The following procedure lists all the properties, irrespective of the chart type. A few properties might not be applicable to a chart type and hence, might not present in that
chart.
Procedure
Complete the following steps to set chart properties:
1. In the left navigation pane of the CHART tab, click CHART.
2. From the Radius field, select a radius for the chart.
The default value is Medium.
3. The Show %age on Slice and Show Tooltip check boxes are selected by default. If you don’t want any of these values to be displayed, then you can clear the
selection.
Note: The Show %age on Slice checkbox isn’t displayed for Gauge chart.
4. In the Value field, enter a corresponding column name that is used in the saved data definition.
Note: The Value field is displayed only for Gauge chart.
Setting series properties
You must set the following series properties for the Pie or Donut chart.
Procedure
Complete the following steps to set series properties:
IBM Telco Network Cloud Manager - Performance 1.4.5 459

1. In the left navigation pane of the CHART tab, click SERIES.
2. In the Value field, enter the required column name from the custom data definition preview. Enter the column name for which you want to plot a Pie or Donut chart.
3. In the Slice Labels field, enter the required column name from the custom data definition preview. Enter the column name that contains labels for each slice of the
chart.
4. From the Sort order list, select a display order for the data.
The default value is Ascending, which displays increasing data values in clockwise direction.
What to do next
Setting legend properties
Setting chart color properties
Setting chart properties for Quadrant Motion charts
You need to set chart properties for the charts that you add to a widget.
Procedure
Complete the following steps to set chart properties for Quadrant Motion charts:
1. On the widget page, click the Set Properties icon.
The Set Properties window opens.
2. Click the CHART tab.
3. To set properties of X-AXIS and Y-AXIS, see Setting X-axis and Y-axis properties for Quadrant Motion chart.
4. In the left navigation pane of the CHART tab, click CHART, and complete the following steps:
To display and define titles for each quadrant, select the Show Quadrant Titles checkbox, and enter a title for each quadrant.
To display and define titles for motion controller, select the Show Title besides Motion Controller checkbox, and enter titles for motion controller.
5. In the left navigation pane of the CHART tab, click SERIES.
6. In the X-axis Value, Y-axis Value, Motion Control Value, and Legend fields, enter the required column names from the custom data definition preview. Enter only
those column names that you want to display on the chart.
7. To set chart color properties in the COLORS tab, see Setting color properties for Quadrant Motion charts.
Setting X-axis and Y-axis properties for Quadrant Motion chart
You can set chart properties for every chart that you add to a widget.
About this task
The following procedure lists all the X-axis and Y-axis properties for Quadrant Motion chart.
Procedure
Complete the following steps to set X-axis and Y-axis properties:
1. To set properties for X-axis, in the left navigation pane of the CHART tab, click X-AXIS, and set the properties that are provided in the following X-axis and Y-axis
properties table.
2. To set properties for Y-axis, in the left navigation pane of the CHART tab, click Y-AXIS, and set the properties that are provided in the following X-axis and Y-axis
properties table.
Table 1. X-axis and Y-axis properties
Field User action
MIN COUNT To start the axis at a specific value, select or enter a minimum count value.
MAX COUNT To end the axis at a specific value, select or enter a maximum count value.
Tooltip Title Enter a tooltip title for the axis.
The tooltip title along with the axis value is displayed when you preview or publish the widget.
Show X-Axis
Title
If you want the chart to display a title for the X-axis, then select Show X-Axis Title, and complete the following steps:
In the Title field, enter a title.
To position the title at the bottom of the chart, select the Bottom checkbox, and if required, select or enter a value to adjust the position.
To position the title at the top of the chart, select the Top checkbox, and if required, select or enter a value to adjust the position.
Show Y-Axis
Title
If you want the chart to display a title for Y-axis, then select Show Y-Axis Title, and complete the following steps:
In the Title field, enter a title.
To position the title at the left of the chart, select the Left checkbox, and if required, select or enter a value to adjust the position.
To position the title at the right of the chart, select the Right checkbox, and if required, select or enter a value to adjust the position.
Show Ticks &
Labels
Select the checkbox, if you want to display major labels, and major and minor ticks on the chart. The labels and ticks are auto-adjusted and
displayed according to the data and size of the published widget.
Setting color properties for Quadrant Motion charts
460 IBM Telco Network Cloud Manager - Performance 1.4.5

You must set the following color properties for the Quadrant Motion charts.
Procedure
Complete the following steps to set color properties for Quadrant Motion chart:
1. In the left navigation pane of the CHART tab, click COLORS.
2. To display the chart according to the default color theme, click Use Default Colors as per Theme.
3. To manually define colors for each quadrant, click Define Custom Quadrant Colors, and complete the following steps to set a color for each quadrant:
Click the colored box under Left Top, Left Bottom, Right Top, and Right Bottom.
The Color window is displayed.
Select a color and click OK.
Setting properties for Radar chart
You need to set chart properties for the charts that you add to a widget.
Procedure
Complete the following steps to set chart properties for Radar chart:
1. On the widget page, click the Set Properties icon.
The Set Properties window opens.
2. Click the CHART tab.
3. In the left navigation pane of the CHART tab, click AXIS. To set the X-axis and Y-axis properties, see Setting X-axis and Y-axis properties.
4. In the left navigation pane of the CHART tab, click SERIES and set the following properties:
In the Series Name (that appears in Tooltip) field, enter the tooltip value that must be displayed on the chart.
In the X-axis Values and Y-axis Values fields, enter the required column names from the custom data definition preview. Enter only those column names that
you want to display on the chart.
If you want to add more than one series, click Add Another Series and repeat this step.
To delete a series, click the Delete icon that is displayed on the SERIES pane.
5. In the left navigation pane of the CHART tab, click LEGENDS. To set the legend properties see Setting legend properties.
6. You do not need to set the chart color properties. The chart is displayed according to the theme applied on Engine.
7. In the left navigation pane of the CHART tab, click COLORS. To set the color properties, see Setting chart color properties.
Setting X-axis and Y-axis properties
You can set chart properties for every chart that you add to a widget.
About this task
The following procedure lists all the X-axis and Y-axis properties for Radar chart.
Procedure
Complete the following steps to set X-axis and Y-axis properties:
To set properties for X-axis and Y-axis, in the left navigation pane of the CHART tab, click AXIS, and set the properties that are provided in the following X-axis and Y-axis
properties table.
Table 1. X-axis and Y-axis properties
Field User action
Truncate labels after num
characters
Where num is the number of
characters.
To cut short the labels after certain characters, select the number of characters to be displayed on the chart from Truncate labels
after list.
Linear > MIN COUNT VALUE To define the minimum count value, click any one of the following options under MIN COUNT VALUE:
If you want to set the minimum count value from zero, click Start at 0.
If you want to set dynamically according to the data, click Dynamic as per Data.
Logarithmic > MIN COUNT VALUE To define the minimum count value, click the following options under MIN COUNT VALUE:
In the Start at field, select or enter the value to start the axis at specific value.
Logarithmic > MAX COUNT VALUE To define the maximum count value, click the following options under MAX COUNT VALUE:
In the End at field, select or enter the value to end the axis at specific value.
Invert Y-axis If you want the chart to display the maximum count in the center and minimum count on the outer edge of the chart, select Invert
Y-axis check box.
IBM Telco Network Cloud Manager - Performance 1.4.5 461

Field User action
Axis position (in degrees) To specify angular rotation in degrees for the Y-axis, select the required value from Axis position (in degree) list.
Setting chart properties for Range Column charts
You need to set chart properties for the charts that you add to a widget.
Procedure
Complete the following steps to set chart properties for Range Column chart:
1. On the widget page, click the Set Properties icon.
The Set Properties window opens.
2. Click the CHART tab.
3. In the left navigation pane of the CHART tab, click CHART, and complete the following steps:
In the X-axis Title and Y-axis Title fields, enter a title for the axis.
The titles are displayed when you preview or publish the widget.
By default, Enable Zoom is selected. Clear the selection, if you do not want the published dashboard to display a horizontal slide bar on the X-axis to zoom in
or zoom out the data.
To specify space between the columns that are displayed on the chart, click Auto. If you do not want any space between the chart columns, click None.
4. In the left navigation pane of the CHART tab, click SERIES.
5. In the X-axis Label, High Value, and Low Value fields, enter the required column names from the custom data definition preview. Enter only those column names
that you want to display on the chart.
6. If you want the high values to be displayed on the chart, then select the Show Values on Chart checkbox.
7. You do not need to set the chart color properties. The chart is displayed according to the theme applied on Engine.
8. To set chart color properties in the COLORS tab, see Setting chart color properties.
Setting chart properties for Sankey charts
You need to set chart properties for the charts that you add to a widget.
Procedure
Complete the following steps to set chart properties for Sankey chart:
1. On the widget page, click the Set Properties icon.
The Set Properties window opens.
2. Click the CHART tab.
3. In the left navigation pane of the CHART tab, click CHART and complete the following steps:
In the Width of Source/Destination boxes (in %) list, select or enter a value that defines the width of each box that is displayed in the chart.
In the Padding between boxes (in px), select or enter a value that defines the spacing between the boxes that are displayed in the chart.
To define a unit for the tooltip values, select the Add Unit to Tooltip values checkbox and in the Unit field, enter a unit name.
4. In the left navigation pane of the CHART tab, click SERIES and complete the following steps:
In the Source, Destination, and Weightage fields, enter the required column names from the custom data definition preview. Enter only those column names
that you want to display on the chart.
5. You do not need to set the chart color properties. The chart is displayed according to the theme applied on Engine.
6. To set chart color properties in the COLORS tab, see Setting chart color properties.
Setting properties for Scatter and Bubble charts
You need to set chart properties for the charts that you add to a widget.
About this task
A few properties might not be applicable to a chart type and hence, might not present in that chart.
Procedure
Complete the following steps to set chart properties for Scatter and Bubble charts:
1. On the widget page, click the Set Properties icon.
The Set Properties window opens.
2. Click the CHART tab.
3. To set X-AXIS and Y-AXIS properties, see Setting X-axis and Y-axis properties.
4. For Bubble chart, in the left navigation pane of the CHART tab, click CHART, and in the Min Bubble Size % of chart and Max Bubble size % of chart fields, select or
enter the minimum and maximum bubble sizes.
5. In the left navigation pane of the CHART tab, click SERIES, and complete the following steps in each SERIES pane:
462 IBM Telco Network Cloud Manager - Performance 1.4.5

In the Bubble Size, X-axis Values and Y-axis Values fields, enter the required column names from the custom data definition preview. Enter only those
column names that you want to display on the chart.
Note: In the Scatter chart's X-axis Values and Y-axis Values fields, enter names of only those columns that contain numeric data.
If you want to add more than one series, click Add Another Series and repeat this step.
To delete a series, click the Delete icon that is displayed on the SERIES pane.
6. To set LEGENDS properties, see Setting legend properties.
7. You do not need to set the chart color properties. The chart is displayed according to the theme applied on Engine.
8. To set COLOR properties, see Setting chart color properties.
Setting properties for Tag Cloud chart
You need to set chart properties for the charts that you add to a widget.
Procedure
Setting chart properties.
Complete the following steps to set chart properties:
1. On the widget page, click the Set Properties icon.
The Set Properties window opens.
2. Click the CHART tab.
3. In the left navigation pane of the CHART tab, click CHART.
4. If you want the published widget to display the chart in spiral mode or rectangular mode, click Spiral or Rectangular.
5. In the Angles of text field, enter the angle to display the text in the way you want. You can enter multiple angles by separating them with a comma.
For example, text displayed on a Tag Cloud chart can be rotated by certain angles. By specifying the angles such as 90,0,90 in this field, the text gets rotated
in these angles.
6. In the Text spacing (in px.) field, select or enter the value that specifies spacing between the text.
Setting series properties.
In the left navigation pane of the CHART tab, click SERIES, and complete the following steps in each SERIES pane:
In the Word, Value/Frequency, Category, and Additional Tooltip Text fields, enter the required column names from the custom data definition preview. Enter
only those column names that you want to display on the chart.
If you want the published widget to display values according to logarithmic scale, select the Show Value as per Logarithmic scale checkbox.
Setting color properties.
In the left navigation pane of the CHART tab, click COLORS, and complete the following steps to set the color properties:
If you want the chart to be displayed in the default color theme without scale, click No Scale & Default Color as per Theme.
If you want the published widget to display a liner scale according to the value or frequency of the word, click Show a Linear Scale, and complete the
following steps:
Click the colored box next to Min Value Color and Max Value Color.
A Color window is displayed.
Select a color and click OK.
If you want the chart to display a scale and threshold colors that are set according to the value or frequency of a word, click Show Scale as per Threshold.
In the Range fields, select or enter minimum and maximum values.
Click the colored box under Color to open the Color window.
Select a color and click OK.
To add more value ranges, click Add Another and repeat the earlier steps.
To delete the range, click the Delete icon.
If you want the chart to display a scale according to the category, click Show Scale as per Category.
The chart is displayed according to the theme applied on Engine.
If you want the published chart to display colors according to the dashboard theme, click As per Theme.
If you want the published chart to display specific colors, click Custom, and complete the following steps:
To display the chart in a defined set of standard colors, click Standard Colors, and complete any of the following steps:
To display the chart in a colorful scheme, click any of the predefined color ranges that are listed under Colorful.
To display the chart in tints of a single color, click any of the predefined color ranges that are listed under Monochromatic.
To display the chart in colors of your choice, click User Defined Colors, and complete any of the following steps:
To display the chart in a color range that was recently defined by you, click a color scheme that is listed under Recently Defined.
To define a new color range, click the color box that is displayed under Define Other Custom Colors, and complete the following steps in
the Edit color and opacity pop-up window:
1. Click the color box within the pop-up window to open the Color window. Select a color and click OK.
2. Move the slider to adjust the opacity of the selected color.
3. To add a color before or after the selected color, click the Add a color before this or Add a color after this option.
To delete a color, click the Delete option.
To append colors, click the Add icon.
Setting properties for Topology chart
IBM Telco Network Cloud Manager - Performance 1.4.5 463

You need to set chart properties for the charts that you add to a widget.
Procedure
Setting chart properties.
Complete the following steps to set chart properties:
1. On the widget page, click the Set Properties icon.
The Set Properties window opens.
2. Click the CHART tab.
3. In the left navigation pane of the CHART tab, click CHART.
4. In the Tooltip value label field, enter a tooltip label that is displayed on a node of the chart.
5. To add a unit to the tooltip values, select the Add a unit to the tooltip values checkbox, and complete the following steps:
In the Unit field, enter a unit of measurement.
From the Unit position list, select a position for the unit of measurement.
6. To display names of the nodes on the chart, select the Show node names on chart checkbox.
Setting series properties.
In the left navigation pane of the CHART tab, click SERIES, and complete the following steps in SERIES pane:
In the Nodes, Value, Source, Destination, and Groups fields, enter the required column names from the custom data definition preview. Enter only those
column names that you want to display on the chart.
Note: Groups and Nodes columns are used to classify nodes within the chart. These two columns are not displayed when you change the chart type to Grid
chart.
Setting color properties.
In the left navigation pane of the CHART tab, click COLORS, and complete the following steps:
If you want the chart to display colors according to the default color theme, click As per Theme.
If you want to define value ranges, set colors, and thickness for each edge, click Specify edge color and thickness for a range, and complete the following
steps:
1. In the Range fields, select or enter minimum and maximum values.
2. Click the colored box under Edge color to open the Color window.
3. Select an edge color and click OK.
4. In the Thickness field, select or enter a thickness for the edge.
5. To add more ranges, click Add Another and repeat the earlier steps.
6. To delete the range, click the Delete icon.
Setting properties for Tree chart
You need to set chart properties for the charts that you add to a widget.
Procedure
Setting chart properties.
Complete the following steps to set chart properties:
1. On the widget page, click the Set Properties icon.
The Set Properties window opens.
2. Click the CHART tab.
3. In the left navigation pane of the CHART tab, click CHART.
4. In the Tooltip value label field, enter a tooltip label for the values that are displayed on the chart.
5. If you want total node counts to be displayed on the chart, select the Show total nodes count checkbox, and click any one of the following options:
To display the total node count in brackets next to the parent node, click In brackets against parent node name.
To display the total node count in the tooltip, click In tooltip and enter a tooltip label in the Tooltip label field.
Setting series properties.
In the left navigation pane of the CHART tab, click SERIES, and complete the following steps in SERIES pane:
In the ID, Parent, Type, Node label, and Metric value fields, enter the required column names from the custom data definition preview. Enter only those
column names that you want to display on the chart.
Note: The parent-child relation in the Tree chart is based on the ID and Parent columns.
From the Sort By list, select a sorting option.
To sort the data by using the node labels, select Node label.
To sort the data by using the metric values, select Metric value.
From the Sorting Order list, select any one of the following options:
To sort the data in ascending order, select Ascending.
To sort the data in descending order, select Descending.
If you do not want to sort the data, select None.
Setting icons
In the left navigation pane of the CHART tab, click ICONS, and complete the following steps in ICONS pane:
1. If you want to specify an icon for every node, click Set an icon for every node type.
2. In the Node type field, enter a node type for which you want to specify an icon.
464 IBM Telco Network Cloud Manager - Performance 1.4.5

3. Click Select icon and select an image to be displayed for the node.
Add a transparent image of PNG, GIF, JPEG, or JPG file format. The image is added and its width and height are also displayed.
4. To replace an already selected image icon, click the image and select another image.
5. To add another node and node icon, click Add Another.
6. To delete an already added node type and its node icon, click icon that is displayed next to the node type.
Setting color properties.
In the left navigation pane of the CHART tab, click COLORS, and complete the following steps:
If you want the chart to display colors according to the default color theme, click As per Theme.
If you want to define value ranges and set label colors for each range, click Specify node label color for a range, and complete the following steps:
1. In the Range fields, select or enter minimum and maximum values.
2. Click the colored box under Label text to open the Color window.
3. Select a label text color and click OK.
4. To add more ranges, click Add Another and repeat the earlier steps.
5. To delete the range, click the Delete icon.
Setting properties for Treemap chart
You need to set chart properties for the charts that you add to a widget.
Procedure
Setting chart properties
Complete the following steps to set chart properties:
1. On the widget page, click the Set Properties icon.
The Set Properties window opens.
2. Click the CHART tab.
3. In the left navigation pane of the CHART tab, click CHART.
4. In the Chart depth list, enter or select the number of hierarchy levels to be displayed simultaneously on the chart.
The default value is 1, where only the root and the first-level parent elements are displayed on the chart.
For example, consider the following data:
Root element
Two parent elements
Three child elements per parent element
Two subchild elements per child element
Using the default Chart depth value, the published or previewed chart displays only the root element and the two parent elements. If you set the Chart depth
value to 2, then the chart shows, the root, the parent, and the three child elements.
5. In the Chart hint list, enter or select the number of hidden hierarchy levels to be displayed as lines on the chart. These hidden hierarchy levels are the child
and the subchild elements that are displayed on the chart.
The default value is 0, where the hidden hierarchy levels are not displayed.
Chart hint depends on Chart depth. Child or subchild elements are displayed on the chart based on the chart depth value.
For example, consider the following data:
Root element
Two parent elements
Three child elements per parent element
Two subchild elements per child element
If both Chart depth and Chart hint are set to 1, then the published or previewed chart displays the root and the parent elements, and each parent element
displays three cells that indicate the child elements.
However, if you set Chart depth as 2, and Chart hint as 1. The chart shows, the root, the parent, and the three child elements, and each child element
displays two cells that indicate two subchild elements.
6. If you want the chart to display a tooltip label for the Size and Value fields, then select the Show tooltips checkbox, and enter tooltip labels in the Tooltip
label for Size and Tooltip label for Value fields.
You can specify the Size and Value fields in the SERIES tab.
7. If you want the chart to display a unit for the tooltips, then select the Add a unit to the tooltips checkbox, enter a unit for the tooltip in the Unit for Size and
Unit for Value fields, and from the Unit position lists, select the unit position.
8. If you want the chart to display name of each parent and child node, and also its value, then select Show lables on the chart checkbox, and select the Show
Name and Show Value check boxes.
Setting series properties
In the left navigation pane of the CHART tab, click SERIES, and complete the following steps in SERIES pane:
1. In the ID, Parent, Node label, Size, and Node value fields, enter the required column names from the custom data definition preview. Enter only those column
names that you want to display on the chart.
Note: The parent-child relation in the Treemap chart is based on the ID and Parent columns.
2. From the Sorting Order list, select any one of the following options to sort the Size column data. If the Size column is not provided, then data is sorted for the
Node value column.
To sort the data in ascending order, select Ascending.
IBM Telco Network Cloud Manager - Performance 1.4.5 465

To sort the data in descending order, select Descending.
If you do not want to sort the data, select None.
Setting color properties
In the left navigation pane of the CHART tab, click COLOR, and complete the following steps:
If you want the chart to be displayed according to the default color theme, click As per Theme.
If you want to define value ranges and set background color and label color for each range, click Define a Custom Static Color Range, and complete the
following steps:
1. In the Range fields, select or enter minimum and maximum values.
2. Click the colored boxes under BG and the colored box next to Text to open the Color window.
3. Select a color and click OK.
4. To add more ranges, click Add Another.
5. If you want the chart to display the ranges as legends, then select the Show Range as Legend checkbox.
Each range is displayed in the lower chart area.
If you want the chart to be displayed in a linear color range, then click Define a Custom Linear Range, and complete the following steps:
1. Click the colored list boxes under Max value, Min value, and Text to open the Color window.
2. Select a color and click OK.
Setting chart properties for Venn charts
You need to set chart properties for the charts that you add to a widget.
Procedure
Complete the following steps to set chart properties for Venn chart:
1. On the widget page, click the Set Properties icon.
The Set Properties window opens.
2. Click the CHART tab.
3. In the left navigation pane of the CHART tab, click SERIES.
4. In the Data Set ID, Data Set Value, Data Set Display Name, and Data Set Tooltip fields, enter the required column names from the custom data definition preview.
Enter only those column names that you want to display on the chart.
5. You do not need to set the chart color properties. The chart is displayed according to the theme applied on Engine.
6. To set chart color properties in the COLORS tab, see Setting chart color properties.
Setting properties for Map chart
You need to set chart properties for the charts that you add to a widget.
Before you begin
Your source data must contain the following mandatory columns for the chart to be plotted properly. The column names can differ but the data within the columns must
match.
Latitude
This column must contain all the standard latitudes of the continents and countries to be mapped. The Global Positioning System (GPS) coordinates for the
latitudes must be in decimal degree format. South latitudes must be indicated with a minus sign.
For example, 8.7822oS must be indicated as -8.7822
Longitude
This column must contain all the standard longitudes of the continents and countries to be mapped. The GPS coordinates for the longitudes must be in decimal
degree format. West longitudes must be indicated with a minus sign.
For example, 55.7822oW must be indicated as -55.7822
Map
This column must contain one or more of the following entries. The following list provides the country or continent names that are sorted alphabetically. The names
are case-insensitive but must be in the provided formats.
world
asia
africa
australia
europe
north_america
south_america
china
brazil
france
germany
india
malaysia
mexico
466 IBM Telco Network Cloud Manager - Performance 1.4.5

united_arab_emirates
united_kingdom
united_states_of_america
The listed maps are the only maps that are supported by Designer tool. Any locations other than the ones listed earlier are not displayed on Designer tool.
Therefore, if the source data contains unsupported locations, then those maps are not displayed on Designer tool.
For all the unsupported locations, you must enter null as a value in the Map column and for supported locations, the entries in your source data must match with
the ones that are provided in the list.
For example, if one of the entries in the Map column is united states of america, then it does not match with the database entry and the map is not displayed.
ID and Parent
The entries in the ID and Parent columns must match. Nested maps are created based on the correlation that exists between these columns. To view nested maps,
you must click any data point on the published or previewed Map chart. The nested map is displayed as a drill-down map. You can drill down to up to three map-
levels only. To go back to the parent map, you must refresh the dashboard or widget.
If you do not want nested maps to be created, then you must enter null as a value for that particular location.
Display name
This column must contain the names of the locations to be plotted.
Procedure
Setting Series properties
Complete the following steps to set series properties:
1. On the widget page, click the Set Properties icon.
The Set Properties window opens.
2. Click the CHART tab.
3. In the left navigation pane of the CHART tab, click SERIES.
4. In the MAP pane, in the following fields, enter the required column names from the custom data definition preview. Enter only those column names that are
required to plot a map.
Latitude
Longitude
Display name
ID
Parent
Map
Note: Nested maps are generated based on the ID, Parent, and Map fields.
5. In the KPIs pane, complete the following steps:
a. In the Data Definition column field, enter the required column names from the custom data definition preview. Enter only those column names that
you want to display on the chart.
Note:
You can specify maximum five column-names that signify key performance indicators (KPIs).
If you want to assign a default shape or icon to a specific KPI value, then you must enter its KPI column name first.
b. In the KPI tooltip field, enter a tooltip for each column.
c. In the Unit field, enter a unit for each column value.
d. From the Unit position list, select a unit placement.
Setting chart properties
In the left navigation pane of the CHART tab, click CHART, and complete the following steps:
1. From the Map to be Plotted list, select the map that you want to plot.
2. In the Define shape or icon indicators pane, complete any one of the following steps:
To specify a default shape for all the KPIs that are displayed on the parent as well as nested maps, click Default shape indicator for all the maps, and
complete the following steps:
1. From the Shape list, select a shape.
2. To render the chart by using the theme colors, click As per Theme.
The map is rendered according to the theme that is applied on Engine.
3. To render the chart by using custom colors, click Custom, and click the colored box next to it.
The Color window is displayed.
4. Select a color and click OK.
To specify a default shape or icon for specific KPI string values, click Default shapes or icons for specific KPI strings, and complete the following steps:
1. In the KPI field, enter any data definition column name that you entered in the KPIs pane, in the SERIES tab.
To specify default shapes for specific KPI values, under Indicators, click Shapes, and complete the following steps:
1. In the Value field, enter a specific value for which you want to specify a shape.
2. From the Shape list, select a shape.
3. Click the colored box under Color to open the Color window, and click OK.
4. Click Add Another and repeat the steps to specify more KPI values, their shapes, and colors.
5. To delete a KPI value and the shape that you assigned to it, click the Delete icon that is displayed next to it.
To specify default icons for specific KPI values, under Indicators, click Icons, and complete the following steps:
1. In the Value field, enter a specific value for which you want to specify an icon.
2. Click Select icon, browse to the location where the icon images are saved, select an image file, and click Open.
The icon is displayed next to the value field. The width and height of the icon is also displayed.
Note: Use a transparent image of size less than or equal to 14x14 pixels.
3. Click Add Another and repeat the steps to specify more KPI values and their icons.
IBM Telco Network Cloud Manager - Performance 1.4.5 467

4. To delete a KPI value and the icon that you assigned to it, click the Delete icon that is displayed next to it.
To specify a default shape or icon for specific KPI string values, click Default shapes or icons for threshold values or ranges of a specific KPI, and complete
the following steps:
1. In the KPI field, enter any data definition column name that you entered in the KPIs pane, in the SERIES tab.
To specify a default shape for a specific KPI value range, complete the following steps:
1. Under Indicators, click Shapes.
2. Under Define Threshold based on, click Range.
3. In the Range fields, enter or select range values for which you want to specify a shape.
4. From the Shape list, select a shape.
5. Click the colored box under Color to open the Color window.
6. Select a color and click OK.
7. Click Add Another and repeat the steps to specify more KPI values, their shapes, and colors.
8. To delete a KPI value and the icon that you assigned to it, click the Delete icon that is displayed next to it.
To specify a default icon for a specific KPI value range, complete the following steps:
1. Under Indicators, click Icons.
2. Under Define Threshold based on, click Range.
3. In the Range fields, enter or select range values for which you want to specify an icon.
4. Click Select icon, browse to the location where the icon images are saved, select an image file, and click Open.
The icon is displayed next to the value field. The width and height of the icon is also displayed.
Note: Use a transparent image of size less than or equal to 14x14 pixels.
5. Click Add Another and repeat the steps to specify more KPI value ranges and their icons.
6. To delete a KPI value range and the icon that you assigned to it, click the Delete icon that is displayed next to it.
To specify default shapes for specific KPI values, complete the following steps:
1. Under Indicators, click Shapes.
2. Under Define Threshold based on, click Value.
3. In the Value field, enter or select a specific value for which you want to specify a shape.
4. From the Shape list, select a shape.
5. Click the colored box under Color to open the Color window.
6. Select a color and click OK.
7. Click Add Another and repeat the steps to specify more KPI values, their shapes, and colors.
8. To delete a KPI value and the icon that you assigned to it, click the Delete icon that is displayed next to it.
To specify default icons for specific KPI values, complete the following steps:
1. Under Indicators, click Icons.
2. Under Define Threshold based on, click Value.
3. In the Value field, enter a specific value for which you want to specify an icon.
4. Click Select icon button, browse to the location where the icon images are saved, select an image file, and click Open.
The icon is displayed next to the value field. The width and height of the icon is also displayed.
Note: Use a transparent image of size less than or equal to 14x14 pixels.
5. Click Add Another and repeat the steps to specify more KPI values and their icons.
6. To delete a KPI value and the icon that you assigned to it, click the Delete icon that is displayed next to it.
Setting color properties
In the left navigation pane of the CHART tab, click COLORS, and complete the following steps:
If you want the chart to be displayed according to the default color theme, click As per Theme.
If you want to define custom colors for each map level, click Custom Colors per Level, and complete the following steps to set background, border, and label
colors:
1. Click each of the list boxes, such as BG, Border, and Label.
The Color window is displayed.
2. Select a color and click OK.
3. To define colors for another level, click Add for another level, and repeat the steps.
4. To delete custom colors that are defined for a map level, click the Delete icon that is displayed next to that level.
Note: You can define maximum three map-levels.
Saving custom widgets as templates
You can save a widget as a custom widget template, only when you create the custom widget for the first time.
Procedure
Complete the following steps to save a custom widget as a custom widget template:
1. Create a custom widget by using Telco Network Cloud Manager - Performance Connector.
2. To save the widget, click Save, and in the SAVE AS pane of the Save Widget window, complete any of the following steps:
To save the widget only as a template, click Template.
To save the widget as well as a template, click Widget as well as Template.
3. Based on your selections, enter information in the following fields as required:
In the Widget Name field, enter a unique name for the widget, if not entered in the earlier step.
To save the widget to an existing category, click Existing category, select a category name from the drop-down list, and then click Save.
To save the widget to a new category, click New Category, enter a category name, and then click Save.
468 IBM Telco Network Cloud Manager - Performance 1.4.5

The newly created widget is listed under Most Recently Created Widgets in the navigation pane. The widget name displays a chart icon next to it. The chart
icon is of the chart type that is used in widget creation. For example, if the widget is created by using a Line chart, then a Line chart icon is displayed.
In the Template Name field, enter a unique name for the template.
To save the template to an existing category, click Existing category, select a category name from the drop-down list, and then click Save.
To save the template to a new category, click New Category, enter a category name, and then click Save.
The newly created widget template is listed under Most Recently Created Widgets in the navigation pane. The template name displays a chart icon within
curly brackets next to it. The chart icon is of the chart type that is used in widget creation. For example, if the widget template is created by using a Line
chart, then a Line chart icon is displayed within curly brackets. Also, when you open the template, it displays an incomplete data definition icon as
the data source and instance selections are lost.
Results
The newly created custom widgets and widget templates are listed under Most Recently Created Widgets in the navigation pane.
What to do next
You can use custom widgets or widget templates in a dashboard. For more information, see Creating a dashboard.
Specialized widgets
You can create specialized widgets and save them independently. You can also create these widgets within a dashboard.
The following are the specialized widgets that you can create and save independently.
Multi-chart widgets
You can edit the layout of a widget and add multiple widget placeholders within a widget. Thus, a single widget can host multiple widgets or charts. To create a
multi-chart widget, you must edit the layout of the host widget and manually draw widget placeholders in the widget area. You can then drag custom widgets,
widget templates, or charts to each of those placeholders. You can also enter an external URL to create a web widget within the multi-chart widget. You can save
the widget as an independent multi-chart widget but cannot save it as a template widget or publish it independently like other widgets. To publish the multi-chart
widget, you must add it to a dashboard. The widget displays a Multi-chart widget icon next to it.
To each child-widget within the multi-chart widget, you can add widget-level or dashboard-level filters, add background image, set data definition, set widget and
chart properties. To set relations within the child-widgets, you must drag this multi-chart widget to a dashboard. All the child-widgets within a multi-chart widget
function as any other custom widget, irrespective of their placing. Therefore, you can set master-listener relation across any widgets within the dashboard.
You can add a background image to the multi-chart widget, set widget properties, and modify or delete the multi-chart widget. Like any other custom widget, you
can create a multi-chart widget independently, and then drag it to a dashboard or create a multi-chart widget directly within a dashboard.
For more information about creating a multi-chart widget, see Creating a multi-chart widget.
Web widgets
You can embed a web application or website in a widget by entering an external URL within a widget and save the widget as an independent web widget. When you
preview or publish the widget, it displays the website or web application within the widget itself and not in a separate browser window. You can add a background
image and add independent or dependent dashboard-level filters to the widget. For the filters to work, you need to specify the filter names in the URL. You must
enter the filter name within curly brackets in the URL at an appropriate location, based on the URL syntax.
You cannot add data definition or widget-level filter to this widget. Also, you cannot add this widget as a master widget when you set master-listener or drill-down
relation. In a relation, you can add this widget either as a listener widget or as a drill-down widget.
You can save and publish this widget as an independent widget but cannot save it as a template widget. A saved widget displays a web widget icon next to it.
The icon is displayed on the Manage Widgets page and in the navigation pane. As this widget does not contain any chart, you do not need to set chart properties.
You need to set widget properties only. Like any other custom widget, you can create web widget independently, and then drag it to a dashboard or create a web
widget directly within a dashboard.
For more information about creating a web widget, see Creating a web widget.
Grid chart widget to list all instances
You can use a Grid chart to list all the instances of a selected source and resource type for Telco Network Cloud Manager - Performance data sources. You can
create, save, and publish this widget independently, but cannot save this widget as a template widget. Like any other custom widget, you can create this widget
independently, and then drag it to a dashboard or create the widget directly within a dashboard.
For more information about creating a widget that lists all the instances, see Creating custom widgets to list all instances.
Creating custom widgets to list all instances
For Telco Network Cloud Manager - Performance data sources, by using a Grid chart, you create a custom widget that lists all the instances for a selected source
and resource type. You can add this widget as a master widget in a master-listener or a drill-down relation to drill down to other widgets that display data for the
selected instances. You cannot add this widget as a listener widget or a drill-down widget. You must add this widget as a master widget only.
Creating a web widget
You can embed an external URL within a widget and save the widget independently as a web widget. When you preview or publish the widget, it displays the
website or web application within the widget itself and not in a separate browser window. You cannot add widget-level filters or save this widget as a template. For
the dashboard-level filters to work, you need to specify the filter names in the URL. You must enter the filter name within curly brackets in the URL at an appropriate
location, based on the URL syntax.
Creating a multi-chart widget
You can add multiple charts or widget placeholders to a widget. Thus, a single widget can host multiple widgets. To create a multi-chart widget, you must first edit
the layout of a widget to manually draw widget placeholders within it. Each of the widget placeholder functions like any other widget placeholder.
IBM Telco Network Cloud Manager - Performance 1.4.5 469

Creating custom widgets to list all instances
For Telco Network Cloud Manager - Performance data sources, by using a Grid chart, you create a custom widget that lists all the instances for a selected source and
resource type. You can add this widget as a master widget in a master-listener or a drill-down relation to drill down to other widgets that display data for the selected
instances. You cannot add this widget as a listener widget or a drill-down widget. You must add this widget as a master widget only.
Before you begin
Ensure that the data sources for which you want to list the instances are already added.
If you want to set a background image for the widget, then ensure that the image is already available on your computer.
About this task
After you log in to the Dashboard Designer, you can create custom widgets by using any of the following options on the landing page:
Click CREATE COMPONENTS, then in the Create Components page, click WIDGETS.
Click the Expand icon to open the left navigation pane of Dashboard Designer, and click Custom Widgets > Create New Widget.
Note: You cannot change the chart type from Grid to any other chart. Also, you cannot save this widget as a template widget nor can you add multiple data sources to this
widget.
Procedure
Complete the following steps to create an instances custom widget:
1. In the left navigation pane of Dashboard Designer, click Custom Widgets > Create New Widget.
The New Widget page opens.
2. Click the Edit icon that is displayed next to the New Widget, Widget Description, and Widget Title fields, and enter a name, title, and description for your
widget.
Note: Only alphanumeric characters, spaces, and underscore are supported.
3. The Show Gridlines checkbox is selected by default.
If you do not want the grid-line view, clear the checkbox.
4. In the left navigation pane, click Charts > Other Charts, and drag a Grid chart to the widget.
5. Click icon.
6. In the Set Data Definition window, click Create a Data Definition, and then click Continue.
7. From the Connector Type list, select Telco Network Cloud Manager - Performance Connector.
8. In the Data Definition with pane, click All Instances, and complete the following steps:
a. From the SOURCE list, select a data source.
b. From the RESOURCE TYPE list, select a monitoring agent.
9. Click the Save icon.
10. Optional: To clear the selections, click the Clear icon.
11. Optional: To modify the selection, click the Edit icon.
12. Click icon to set the widget and chart properties.
For more information about setting widget and chart properties, see the following topics:
Setting widget properties for all the chart types
Setting properties for Grid charts
13. Optional: To add a background image to the widget, complete the following steps:
a. Click icon that is displayed on the upper-right of the widget.
b. In the Background Image pop-up window, click Add Background Image, and then click Select from File.
c. Browse to the image file location on your computer, select the file, and then click Open.
Note: You can add PNG, JPEG, JPG, or GIF image files of size less than or equal to 2 MB.
The selected image is added as a background image to the widget. To replace the image, repeat the steps, and select another image. To delete the image,
click No Background Image.
14. To save the widget as a custom widget, click Save, and complete the following steps in the Save Widget window:
a. In the Name field, enter a name for the widget.
b. To save the widget to an existing category, click Existing category, select a category name from the drop-down list, and then click Save.
c. To save the widget to a new category, click New Category, enter a category name, and then click Save.
15. To save the widget with another name, click the Save As option, and in the Save As Widget window, enter the required details.
Results
The newly created custom widget is listed under Most Recently Created Widgets in the navigation pane.
What to do next
You can complete any of the following tasks:
Publish the custom widgets.
For more information, see Publishing custom widgets.
470 IBM Telco Network Cloud Manager - Performance 1.4.5

Use the custom widgets in a dashboard and set master-listener or drill-down relation to view data of individual instances.
For more information, see Creating a dashboard.
Creating a web widget
You can embed an external URL within a widget and save the widget independently as a web widget. When you preview or publish the widget, it displays the website or
web application within the widget itself and not in a separate browser window. You cannot add widget-level filters or save this widget as a template. For the dashboard-
level filters to work, you need to specify the filter names in the URL. You must enter the filter name within curly brackets in the URL at an appropriate location, based on
the URL syntax.
Before you begin
If you want to set a background image for the web widget, then ensure that the image is already available on your computer.
Ensure that the website does not have any IFrame restrictions and can be embedded within Designer tool and other websites. To view the IFrame restrictions, you
must check the response header of the external URL. If the Network tab displays any of the following options, then the website cannot be embedded:
X-Frame-Options: deny
X-Frame-Options: sameorigin
X-Frame-Options: allow-from https://example.com/
You can add URLs that start with http or https only.
For example, http://www.example.com
If you want to add one or more dashboard-level filters to the widget, then you must specify the filter names in the URL itself. You must be aware of the valid filter
parameters that can be used to filter the website.
About this task
After you log in to the Dashboard Designer, you can create web widgets by using any of the following options on the landing page:
Click CREATE COMPONENTS, then in the Create Components page, click WIDGETS.
Click the Expand icon to open the left navigation pane of Dashboard Designer, and click Custom Widgets > Create New Widget.
Procedure
To embed a website or web application in a widget, complete the following steps:
1. In the left navigation pane of Dashboard Designer, click Custom Widgets > Create New Widget.
The New Widget page opens.
2. Click the Edit icon that is displayed next to the New Widget, Widget Description, and Widget Title fields, and enter a name, title, and description for your
widget.
Note: Only alphanumeric characters, spaces, and underscore are supported.
3. The Show Gridlines checkbox is selected by default.
If you do not want the grid-line view, clear the checkbox.
4. Click Specify an external URL and in the External URL field, enter an external URL of the web application or website that you want to embed in the widget.
To go back to normal widget, click Cancel or click the Delete icon that is displayed on the widget.
5. If you want to map one or more dashboard-level filters, then you must enter the filter names within the curly brackets in the URL.
For example, https://www.example.com/{filter_name_1}/{filter_name_2}
Note: You can map multiple dashboard-level filters but cannot map any widget-level filters to the widget.
6. Click icon to set the widget properties.
For more information, see Setting widget properties for all the chart types.
7. Optional: To add a background image to the widget, complete the following steps:
a. Click icon that is displayed on the upper-right of the widget.
b. In the Background Image pop-up window, click Add Background Image, and then click Select from File.
c. Browse to the image file location on your computer, select the file, and then click Open.
Note: You can add PNG, JPEG, JPG, or GIF image files of size less than or equal to 2 MB.
The selected image is added as a background image to the widget. To replace the image, repeat the steps, and select another image. To delete the image,
click No Background Image.
8. To save the widget as a web widget, click Save, and complete the following steps in the Save Widget window:
a. In the Name field, enter a name for the web widget.
b. To save the widget to an existing category, click Existing category, select a category name from the drop-down list, and then click Save.
c. To save the widget to a new category, click New Category, enter a category name, and then click Save.
9. To save the widget with another name, click the Save As option, and in the Save As Widget window, enter the required details.
Results
The newly created web widget is listed under Most Recently Created Widgets in the navigation pane.
What to do next
IBM Telco Network Cloud Manager - Performance 1.4.5 471

You can complete any of the following tasks:
Publish the web widget.
For more information, see Publishing custom widgets.
Use the web widget in a dashboard and set master-listener or drill-down relation.
For more information, see Creating a dashboard.
Creating a multi-chart widget
You can add multiple charts or widget placeholders to a widget. Thus, a single widget can host multiple widgets. To create a multi-chart widget, you must first edit the
layout of a widget to manually draw widget placeholders within it. Each of the widget placeholder functions like any other widget placeholder.
Before you begin
To create custom widgets within the host widget, see Creating custom widgets.
To create a web widget within the host widget, see Creating a web widget.
To create a Grid widget that lists all the instances, see Creating custom widgets to list all instances.
If you want to set a background image for the host widget and any other child-widgets within it, then ensure that the images are already available on your computer.
About this task
After you log in to the Dashboard Designer, you can create specialized widgets by using any of the following options on the landing page:
Click CREATE COMPONENTS, then in the Create Components page, click WIDGETS.
Click the Expand icon to open the left navigation pane of Dashboard Designer, and click Custom Widgets > Create New Widget.
Procedure
To create a multi-chart widget, complete the following steps:
1. In the left navigation pane of Dashboard Designer, click Custom Widgets > Create New Widget.
The New Widget page opens.
2. Click the Edit icon that is displayed next to the New Widget, Widget Description, and Widget Title fields, and enter a name, title, and description for your
widget.
Note: Only alphanumeric characters, spaces, and underscore are supported.
3. The Show Gridlines checkbox is selected by default.
If you do not want the grid-line view, clear the checkbox.
4. To add multiple widget placeholders to a widget, click the Add/Edit Layout icon within the widget.
The widget displays a toolbar that shows Undo , Redo , Delete , and Reset icons.
5. To create widget placeholders, place the pointer in the Draw layout here area and drag it to create a box.
You can create multiple widget placeholders of different sizes in the widget area. You can move or resize the placeholders. The placeholders cannot overlap each
other.
6. To go back to the widget view, click the Back To Dashboard Design View icon.
A widget with multiple widget placeholders is created. The host widget displays the following icons:
A Set Properties icon to set widget properties.
For more information, see Setting widget properties for all the chart types.
A Background Image icon to set a background image.
For more information, see Adding a background image to custom widgets.
An Add/Edit Layout icon to edit the layout of the widget.
Use this icon to add, delete, or reorganize child-widgets within the multi-chart widget.
A Delete icon to delete the multi-chart widget.
7. Drag a chart, widget template, custom template, custom widget, or specialized widget to the child-widgets. You can also enter an external URL in any of the widget
placeholders.
Results
Each widget placeholder within the multi-chart widget displays horizontally and vertically placed More options icons. Click these icons to view the toolbar
embedded within them. The widget placeholders function as any other custom widget.
What to do next
1. In each of the widget placeholders complete the following tasks and save the multi-chart widget:
472 IBM Telco Network Cloud Manager - Performance 1.4.5

Add and map dashboard-level or widget-level filters.
Set data definitions, and set widget and chart properties.
Add a background image.
For more information about all these tasks, see Creating custom widgets.
2. You can drag the multi-chart widget to a dashboard, and then publish the dashboard.
Note:
You cannot drag the multi-chart widget to another multi-chart widget that you create within a dashboard.
You cannot publish the multi-chart widget independently or save it as a template widget.
Related tasks
Managing custom widgets, custom templates, or specialized widgets
Managing custom widgets, custom templates, or specialized widgets
You can view, search, modify, copy, or delete custom widgets, custom templates, or specialized widgets. You can publish custom widgets and specialized widgets
independently, except multi-chart widget. You can also view, modify, or delete data definitions, chart properties, widget-level filters, and chart types within a custom
widget or a custom template.
About this task
If you use multiple instances of a custom widget within a dashboard, then whenever you modify a single occurrence of the custom widget, all its remaining occurrences
within the same dashboard or in any other dashboard remain unchanged.
Procedure
Viewing, deleting, or searching the existing custom widgets, custom templates, or specialized widgets.
To view, delete, or search the existing widgets, complete the following steps:
1. In the left navigation pane of Dashboard Designer, click Custom Widgets > Manage Widgets.
An All Widgets page opens in a new tab. The page displays all the already created custom widgets, custom templates, or specialized widgets. Custom
widgets, template widgets, and specialized widgets display a chart icon or widget icon next to them. However, for a template widget, the chart icon is
displayed within curly brackets.
2. Complete any of the following steps:
To view widgets or templates that belong to a category, from the View list, select a category.
To find a widget or a template, enter the name of the widget or template in the Search field.
To delete a widget or a template, either select a widget or a template, and click the Delete button, or click the Delete icon on the widget or
template row.
To delete multiple widgets and templates, select the widgets and templates that you want to delete, and then click the Delete button.
To create a copy of a widget or a template, click the Copy icon on the widget or template row. In the Create Copy window, complete the following
steps:
In the Name field, enter a unique name for the widget or the template. You can use alphanumeric characters, spaces, and underscore in the
dashboard name.
To save the widget or the template to an existing category, click Existing Category, and select a category from the list.
To save the widget or the template to a new category, click New Category, and enter a name for the new category.
To save the widget or template copy, click Save.
Modifying widgets, and replacing or deleting charts and widgets in custom widgets and specialized widgets.
To modify a widget, complete the following steps:
1. In the All Widgets page, click the View/Edit icon that is displayed on the widget row.
The widget opens in a new tab. The page displays the widget name, widget title, and a chart.
2. The Show Gridlines checkbox is selected by default. If you do not want gridlines view, clear the checkbox.
3. To modify name, title, or description of a widget or to modify title of a child-widget within a multi-chart widget, click the Edit icons that are displayed
next to the respective fields, and make the required changes.
4. For Bar, Time Series, and Pie chart categories, you can replace the selected chart with another chart that belongs to the same category. Click the Change
Chart Type icon and select the required chart type from the available options.
The existing chart is replaced with the selected chart type without any changes to the data definitions or chart properties.
Note:
If you set multiple plots in the chart, you cannot change a chart type.
Change chart type is not supported for Grid, Badge, and Complex Gauge charts.
All the remaining charts can be changed to Grid chart only, except Bubble chart. A Bubble chart can also be changed to a Scatter chart.
Only if numeric data is displayed on X-axis and Y-axis, then a Bubble chart can be changed to Scatter chart. Else, it can be changed to a Grid chart only.
5. To add or delete widget-level filters, click icon, and complete any of the following steps:
To remove a widget-level filter, in the Selected Filters pane, click icon that is displayed next to the filter.
Note: If you remove a parent filter, then its child-filters are also removed.
To add more widget-level filters to a widget, in the Available Filters pane, expand filters under Default or Custom, and select the checkbox that is
displayed next to required filter.
For the widget-level filters to work properly, you must map metrics to filters, when you set data definition or in custom data definition.
IBM Telco Network Cloud Manager - Performance 1.4.5 473

For more information about mapping metrics to filters or setting and adding cases for the query or REST API methods, Creating a custom data
definition.
You can select maximum five widget-level filters. This number includes default and custom filters, including conditional or dependent filters.
To rearrange widget-level filters in the Selected Filters pane, drag the filter to the required position.
Note: Parent-child filters cannot be switched. A parent filter always precedes its child filter.
Note: If you modify a filter that is already assigned to a widget, then those filter modifications are not displayed on the widget, unless you reassign the newly
modified filter to the widget.
6. To view the data definitions that are used in the widget, click icon. The Set Data Definition window displays any of the following details based on the
number and types of connectors that are used in the widget:
If custom data definition queries are used, then the Set Data Definition window displays a table that shows all the available data definition queries and
the selected data definition queries.
If a single connector is used, then the Set Data Definition window displays the connector type, data source, monitoring parameters, and instances.
If multiple connectors are used, then the Set Data Definition window displays a table that shows all the connectors and connector sources. To view the
details of a connector type, its data sources, monitoring parameters, and instances, click the View icon that is displayed on the connector row. To
go back to the main window that displays all the connectors, click View All Data Definition.
7. To add, delete, or modify data definitions, see Creating a custom data definition.
8. To modify chart properties, see Setting chart properties.
9. To delete a chart along with its chart properties and data definitions or to delete a specialized widget, click the Delete icon that is displayed on the All
Widgets page.
10. To preview a widget, click the Preview icon that is displayed on the widget page.
Note: You cannot modify a widget template nor can you preview a template. However, you can use a template to create a new template or a widget.
11. To save the changes, click Save.
Note: You cannot modify an existing widget and save it as a template. You can save a widget as a template only when you create a widget for the first time.
Using an existing template to create a new widget or a new template.
To use an existing template to create a new widget or a new template, complete the following steps:
1. In the All Widgets page, click the View/Edit icon that is displayed on the template row.
The template opens in a new tab.
2. Click Use this Template.
The template opens in a New Widget tab.
3. Modify the widget by completing the steps that are provided in the Modifying a widget or deleting an existing chart within a widget section.
4. You can save the modified template as a new widget or as a new template or as both a new widget and a new template.
Viewing JSON source of any widget or a template.
To view JSON source of a widget or a template, complete the following steps:
1. In the All Widgets page, click the View/Edit icon that is displayed on the widget or template row.
The widget or template opens in a new tab.
2. Click the View Source icon.
Viewing or searching the existing widgets or templates by using View All Custom Widgets option.
To view or search the existing widgets or templates, complete the following steps:
1. In the left navigation pane of Dashboard Designer, click Custom Widgets > View All Custom Widgets.
A Custom Widgets pop-up window is displayed.
2. Complete any of the following steps:
To view widgets or templates that belong to a category, from the All Categories list, select a category.
To find a widget or a template, enter the name of the widget or template in the Search field.
Modifying layout of a multi-chart widget to add more widget placeholders or delete existing widgets.
To modify the layout of a multi-chart widget, complete the following steps:
1. In the multi-chart widget, click the Add/Edit Layout icon.
The widget displays a toolbar that shows Undo , Redo , Delete , and Reset icons.
2. To resize a widget within the multi-chart widget, click the widget and drag the widget points in or out.
3. To move the widget to a blank area within the multi-chart widget, click the widget and drag it to the blank area.
4. To delete any of the existing widgets or any of the newly added widget placeholders, click the widget or placeholder, and then click the Delete icon on
the toolbar.
5. To undo or redo your changes, click the Undo icon or the Redo icon.
6. To delete all the existing widgets and all the newly created placeholders, click the Reset icon.
Note: After you click the Reset icon, you cannot undo or redo your changes. The entire host widget is cleared.
7. To go back to the dashboard design view, click icon.
Modifying the URL within a web widget
To modify the URL within a web widget, see Creating a web widget.
474 IBM Telco Network Cloud Manager - Performance 1.4.5

Publishing custom widgets
You can publish a custom widget individually or collectively to an Engine instance and to one or more Engine User Groups. You can modify the published details of an
already published custom widget to add or delete user groups. You can also unpublish widgets.
About this task
Users with a Menu Administrator role, System Administrator role, or Publisher role can publish widgets, modify the published details of an already published
custom widget, or unpublish widgets.
Note: You cannot publish a template widget or a multi-chart widget independently.
Procedure
Publishing custom widgets.
To publish a custom widget, complete the following steps:
1. In the left navigation pane of Dashboard Designer, click Custom Widgets > Manage Widgets.
An All Widgets page opens in a new tab. The page displays all the already created widgets and templates.
2. Select a custom widget or select multiple custom widgets, and click Publish.
3. In the Publish Widget(s) window, from the User Group(s) pane, select one or more user groups, and click to add the user groups to the Selected User
Group(s) pane.
Only the selected user groups can access the published widgets.
4. Optional: To delete a user group from the Selected User Group(s) pane, click the Delete icon that is displayed next to the user group.
5. Click Publish.
A message confirming whether the selected widgets must be published is displayed.
6. Click Ok.
The custom widgets are published to the selected user groups, and the Published to column on the All Widgets page displays the number of users groups
that can access the published widgets.
Modifying the published details of an already published custom widget or unpublishing a widget.
To modify the published details of an already published custom widget or to unpublish widgets, complete the following steps:
1. For an already published widget, click the user groups that are displayed in the Published to column on the All Widgets page.
The Published to column on the All Widgets page displays the number of users groups that can access the published widgets.
2. In the Edit Published Details window, complete any or all of the following steps:
To add new user groups, select one or more user groups, and click to add the user groups to the Selected User Group(s) pane.
To delete the already selected user groups, in the Selected User Group(s) pane, click the Delete icon that is displayed next to the user groups.
For every user group that you delete, a message confirming whether you want to delete the selected user group is displayed. Click Ok to delete the
selected user group.
To unpublish a widget, you must delete all the already selected user groups. In the Selected User Group(s) pane, click the Delete icon that is
displayed next to each user group.
For every user group that you delete, a message confirming whether you want to delete the selected user group is displayed. Click Ok to delete the
selected user group.
3. Click Update Published Details.
Based on addition or deletion of user groups, any of the following messages are displayed:
If you added or deleted user groups, then a message confirming whether you want to publish the widget to the selected user groups is displayed.
If you deleted all the user groups, then a message confirming whether you want to unpublish the widget from Engine is displayed.
4. Click Ok.
If you added or deleted user groups, then a message indicating that the widgets are published successfully is displayed, and the Published to column
displays the updated number of users groups that can access the published widgets.
If you deleted all the user groups, then a message indicating that the custom widget is unpublished successfully is displayed.
What to do next
After you publish a widget, you must log in to Engine and view the published widgets.
Related tasks
Viewing dashboards and widgets
Testing database connection with Connector Source
Use the Connector component to connect to a data source and select and configure the data provider. Connector is the predefined interface template and is the base for
Connector sources.
IBM Telco Network Cloud Manager - Performance 1.4.5 475

About this task
Connector sources are the instances of connector types, which can be configured to connect directly to data providers. These connector sources can then be used to
create data definitions.
Procedure
1. In the navigation pane, go to Connector & Sources > Connector Sources.
2. From the View list, select NPI Connector.
You can see Source Name as default_npi. The default_npi cannot be edited or deleted.
Note: Currently, you cannot create new Source.
3. Click Test Connection to make sure that the connection to Telco Network Cloud Manager - Performance database is successful.
Data Definitions
Data definition is the data source that is used in a widget. You can configure the data definitions according to your dashboard requirements to monitor various data
sources. Dashboard Designer displays two types of data definitions, default data definitions and custom data definitions.
Default Data Definitions
Default data definitions are used in default filters only and must not be used elsewhere. Also, you cannot preview these data definitions. Currently, no default data
definitions are available in the Dashboard Designer tool.
Custom Data Definitions
Use the Create New Data Definition option in the left navigation pane of Dashboard Designer to create custom data definitions. After you create custom data definitions,
you can use these saved custom data definitions in your widgets.
Set Data Definitions
The Dashboard Designer displays a Set Data Definition icon in a widget that must be used to set data definition.
You can set data definitions by using any of the following options in Dashboard Designer:
Create a Data Definition
Use this option to create a data definition by selecting a source, resource type, metrics, and instances. Thus, this option provides an assisted mode for creating data
definition. The data definition set by using this option is also known as assisted data definition.
The Telco Network Cloud Manager - Performance connector is readily available in Dashboard Designer.
Select from saved Data Definition
Use this option to select an already created custom data definition. Currently, in Telco Network Cloud Manager - Performance this option alone is available.
Creating a custom data definition
You must create custom data definitions for Telco Network Cloud Manager - Performance timeseries datasource that has real-time performance data.
Managing custom data definitions
You can view, search, modify, delete, or copy data definitions.
Creating a custom data definition
You must create custom data definitions for Telco Network Cloud Manager - Performance timeseries datasource that has real-time performance data.
Before you begin
By default, Designer tool has built-in Connector Source for Telco Network Cloud Manager - Performance. For more information, see Testing database connection
with Connector Source.
If you need to provide custom headers for NPI Connector, then ensure that you have that information available with you.
Custom headers are request headers that are needed to retrieve REST API information from a web service. For example, Authorization request headers or Accept-
Charset request headers. Authorization request headers contain authorization information that is needed by the web services. Accept-Charset indicates the
acceptable data characters that the response must contain.
For more information about the URI formats or query formats for each connector type, see the following links:
About this task
Any Dashboard Designer user can create customized data definitions.
After you log in to Dashboard Designer, you can create data definitions by using any of the following options on the landing page:
A widget displays any of the following icons based on the state of the data definitions:
476 IBM Telco Network Cloud Manager - Performance 1.4.5

Incomplete data definition icon.
Complete data definition icon.
Deleted data definition icon.
Procedure
1. Click CREATE COMPONENTS > DATA DEFINITION.
Or
2. Click the Expand icon to open the navigation pane of Dashboard Designer, and click Data Definition > Custom > Create New Data Definition.
The New Data Definition tab opens.
3. Click the icon to enter a name for the custom data definition.
4. By default, the Connector Type list shows NPI.
5. By default, the Connector Source Name list shows default-npi as the Connector Source.
6. By default, the Endpoint URL list shows https://ui:30021, which is the URL for the UI Service from where the data is fetched.
7. From the Method list, select a method and complete any of the following steps, based on the method that you select:
For GET method, in the URI field, enter the uniform resource identified (URI) for the source.
For POST method, in the URI field, enter the URI for the source, and in the Request Body field, enter the post request.
Under Custom Headers, complete the following steps:
In the Name field, enter the request header name that is provided by the REST API service provider.
In the Value field, enter the request header value that is provided by the REST API service provider.
Note: If you want to set master-listener or drill-down relation between widgets or dashboards that contain custom data definition, then ensure that the parameter
name and the common metric value for the master widget are already specified in the custom data definition of the listener or drill-down widget.
For more information, see Setting relations.
8. Optional: If you want to filter data by using filters, then you must set and add cases to the query or the REST API methods.
Complete the following steps to set default case and add cases:
a. In the Default Case area, in the Attribute field, enter a filter name or attribute name, and in the Value field, enter a display name.
You can click Add Attribute and repeat this step to add multiple attributes and display values.
b. To add a conditional filter, click Add Case, and then set the filter conditions by entering values in the Attribute and Value fields.
You can add and set multiple attributes and values for each case.
9. To save the custom data definition, click Save.
10. In the Save Data Definition window, follow these steps:
a. In the Name field, enter a new name for the data definition. You can use alphanumeric characters and underscore in the name field.
b. To save the data definition to an existing category, click Existing Category, select a category from the list, and click Save.
c. To save the data definition to a new category, click New Category, and enter a name for the new category, and click Save.
To save the data definition with another name, click the Save As option.
11. To view and validate the response that is received from the custom data definition that you created, click the icon.
The response from the custom data definitions must be displayed in a tabular format. If the response is in an incorrect format, then it is not displayed in a tabular
format.
Results
The newly created custom data definition is listed under Most Recently Created Data Definitions in the navigation pane.
What to do next
You can use custom data definitions in widgets or dashboards. For more information, see Creating custom widgets or Creating a dashboard.
Managing custom data definitions
You can view, search, modify, delete, or copy data definitions.
About this task
If you modify a custom data definition, then those modifications are not displayed on the widget, unless you reattach the newly modified custom data definition to the
widget.
Procedure
Viewing, deleting, or searching the existing data definitions.
To view, delete, or search the existing data definitions, complete the following steps:
1. In the navigation pane of Dashboard Designer, click Data Definitions > Custom > Manage Data Definitions.
An All Data Definition page opens in a new tab. The page displays all the already created custom data definitions.
2. Complete any of the following steps:
IBM Telco Network Cloud Manager - Performance 1.4.5 477

To view custom data definitions that belong to a category, from the View list, select a category.
To find a data definition, enter the name of the data definition in the Search field.
To delete a data definition, either select a data definition and click the Delete button, or click the Delete icon on the data definition row.
To delete multiple data definitions, select the data definitions that you want to delete, and then click the Delete button.
To create a copy of a data definition, click the Copy icon on the data definition row. In the Create Copy window, complete the following steps:
In the Name field, enter a new name for the data definition. You can use alphanumeric characters, spaces, and underscore in the dashboard
name.
To save the data definition to an existing category, click Existing Category, and select a category from the list.
To save the data definition to a new category, click New Category, and enter a name for the new category.
To save a copy of the data definition, click Save.
Modifying the name of a data definition.
To modify the name of a data definition, complete the following steps:
1. In the All Data Definition page, click the View/Edit icon that is displayed on the data definition row.
The data definition opens in a new tab. The page displays the name of the data definition.
2. To modify the name of the data definition, click the Edit icon that is displayed next to it, and edit the name.
Modifying or deleting cases within a data definition.
To modify a data definition, complete the following steps:
1. In the All Data Definition page, click the View/Edit icon that is displayed on the data definition row.
The data definition opens in a new tab. The page displays the data definition name, and its details.
2. To select another data source, from the Connector Source Name list, select another data source.
3. Complete any of the following steps to add or delete the default cases:
To delete an attribute within the default case, click the Delete icon next to that attribute.
To add another attribute within the default case, click Add Attribute, and enter values in the Attribute and Value fields.
To delete an attribute within the conditional filter, click the Delete icon next to that attribute.
To add another attribute to the conditional filter, click Add Attribute, and enter values in the Attribute and Value fields.
To add another case, click Add Case.
4. To save the changes, click Save.
What to do next
After you modify a data definition, you must click the icon to view and validate the response that is received from the custom data definition.
The response from the custom data definitions must be displayed in a tabular format. If the response is in an incorrect format, then it is not displayed in a tabular format.
Filters
Use filters to filter data that is displayed within dashboards and widgets. Filters help you to interactively explore the data that you want to display in the widgets. You can
add filters at dashboard-level and at widget-level. Dashboard Designer displays two types of filters, default filters and custom filters. Default filters are already provided in
the Dashboard Designer. However, you can also create your own filters and save them as custom filters. You can create multiple custom filters, categorize them, and save
them for future use. Adding custom filters or default filters to dashboards is optional. You can add filters when you are creating or modifying dashboards.
Layouts or dashboards display a filter area where you can add filters. Widgets also display a Set Filters icon to set widget-level filters.
Whenever you add dashboard-level filters or widget-level filters, you must map them while setting data definition in individual widgets of a dashboard. If filters are not
mapped, then you cannot filter data in widgets. For example, if a dashboard contains four widgets, and you mapped filters in two widgets only, then whenever you apply
filters, data in those two widgets is filtered. The data in the remaining two widgets remains unaffected.
If a dashboard has multiple occurrences of the same filter at dashboard-level and widget-level, then always only a single common version of that filter is maintained
within the dashboard. Whenever you modify such a custom filter and reattach it to a single widget within the dashboard, all the other similar filter occurrences, use the
recently added filter version.
The following are the filter version scenarios that you must consider while reattaching filters:
If two dashboards contain multiple occurrences of the same filter, then each dashboard maintains its individual version. If you modify the filter and reattach it to
only one dashboard, then only that dashboard uses the updated version of filter. The filter version in the second dashboard remains unchanged.
The recently added filter version always overrides the existing filter versions, irrespective of the individual filter versions. For example, when two versions of a
custom filter exist, and an older version of the filter is attached to a widget template, whereas a modified version of the same filter exists within a dashboard. Then,
if you add the widget template to the dashboard, the filter version of the widget template is used because it is the recently added filter.
Default filters
Default filters are the ready to use filters that are already provided in the Dashboard Designer. Use the default filters to filter dashboard or widget data over a time period.
Note: You cannot use the default filters to create custom filters.
Custom filters
478 IBM Telco Network Cloud Manager - Performance 1.4.5

You can create simple to complex filters with Dashboard Designer. You can create two types of custom filters:
Direct or independent filter
Use these filters to specify the parsed and displayed values for a dashboard. You can also use values that are specified in Data Definitions queries.
Based on the values that are passed to the filter you can create the following variations:
Filters with static values
Filters with values through a store
Conditional or dependent filter
Conditional or dependent filters are based on direct or independent filters. The conditional filters refine the values that are filtered by the direct filter based on a
specific condition.
Note: You cannot use any default filters to create custom filters.
Creating a conditional or dependent filter
You can create a conditional or dependent custom filter for a dashboard. This type of filter is created based on an existing filter to refine its filtering conditions.
Creating a direct or independent filter
You can create a direct or independent custom filter for a dashboard.
Managing filters
You can view, search, modify, or delete filters. You can also view, modify, or delete values within a filter.
Related concepts
Widgets
Managing Engine user interface
Related tasks
Creating a dashboard
Viewing dashboards and widgets
Creating a conditional or dependent filter
You can create a conditional or dependent custom filter for a dashboard. This type of filter is created based on an existing filter to refine its filtering conditions.
Procedure
Complete the following steps to create a conditional or dependent filter:
1. In the left navigation pane of Dashboard Designer, click Filters > Custom > Create New Filters.
The New Filter page opens.
2. Click the Edit icon that is displayed next to the New Filter field, and enter a name for the filter.
Note: Only alphanumeric characters and underscore are supported.
3. Click Conditional/Dependent Filter.
4. In the Parent Filters area, complete the following steps:
a. From the Category list, select a filter category that contains the filter to be refined.
The Filters area displays all the filters that are contained within the selected category.
b. In the Filters area, select a filter that you want to add conditions to.
The Parent Filter field in the Filter Value Conditions area, displays the selected filter.
If you want to define a condition for multiple filters within different categories, then you can repeat this step to add those filters.
5. In the Filter value Conditions area, complete the following steps:
a. From the Value list, select any one of the following options:
To filter values in the parent filter based on the specified value, in the Value list, enter the value.
The value that is entered must be a present in the parent filter.
To filter values in the parent filter based on any value other than the specified values, from the Value list, select Any other than specified.
All the values in the parent filter are displayed.
b. Based on the condition that is specified, you can create any one of the following dependent filters with static values:
Direct or Independent filter based on static values.
Direct or Independent filter based on data definition.
For more information about creating these filters, see Creating a direct or independent filter.
To add multiple conditions, click Add Another Condition.
To delete an already created condition, click Delete Condition.
6. Optional: If you do not want a filter to be displayed on any dashboard, then select the Save As Hidden Filter checkbox.
7. To save the filter, click Save.
8. In the Save Filter window, complete the following steps:
In the Name field, enter a name for the filter.
To save the filter to an existing category, click Existing category, select a category name from the drop-down list, and then click Save.
To save the filter to a new category, click New Category, enter a category name, and then click Save.
To save the filter with another name, click the Save As option.
IBM Telco Network Cloud Manager - Performance 1.4.5 479

Creating a direct or independent filter
You can create a direct or independent custom filter for a dashboard.
Before you begin
If you want to use data definition queries in the filter, then ensure that those data definitions are already created. For more information about creating data definitions, see
Creating a custom data definition.
About this task
After you log in to Dashboard Designer, you can create custom filters by using any of the following options on the landing page:
Click CREATE COMPONENTS, then in the Create Components page, click FILTERS.
Click the Expand icon to open the left navigation pane of Dashboard Designer, and click Filters > Custom > Create New Filters.
Procedure
Direct or Independent filter based on static values.
To create a Direct or Independent filter based on static values, complete the following steps:
1. In the left navigation pane of Dashboard Designer, click Filters > Custom > Create New Filters.
The New Filter page opens.
2. Click the Edit Filter Name icon that is displayed next to the New Filter field, and enter a name for the filter.
Note: Only alphanumeric characters and underscore are supported.
3. Click Direct / Independent Filter.
4. Click Specify Static Values to provide hardcoded values for filter display.
5. In the Value to be Parsed and Value to be Displayed fields, specify the values.
Note: The value that is entered in the Value to be Displayed field is displayed on the dashboard where this filter is added.
6. Click the Save icon.
7. The values that you enter first in the Value to be Parsed and Value to be Displayed fields are set as default values. However, if you want a specific set of
parsed and displayed values to be displayed as the default values in the dashboard filter, then click the Default icon against a row in filter.
Similarly, you can add more filter values.
To modify or delete the parsed and displayed values that are already entered, complete any of the following steps:
To modify the values, click the Edit icon that is displayed on that row.
To delete the values, click the Delete icon that is displayed on that row.
8. Optional: If you do not want a filter to be displayed on any dashboard, then select the Save As Hidden Filter check box.
9. To save the filter, click Save.
10. In the Save Filter window, complete the following steps:
In the Name field, enter a name for the filter.
To save the filter to an existing category, click Existing category, select a category name from the drop-down list, and then click Save.
To save the filter to a new category, click New Category, enter a category name, and then click Save.
To save the filter with another name, click the Save As option.
Direct or Independent filter based on data definition.
To create a Direct or Independent filter based on data definition, complete the following steps:
1. In the left navigation pane of Dashboard Designer, click Filters > Custom > Create New Filters.
The New Filter page opens.
2. Click Direct/Independent Filter.
3. Click Specify Values through a Data Definition to get the values for the filter from data definition.
4. From the Data Definition list, select an already created query that you want to filter.
5. In the Value to be Parsed and Value to be Displayed fields, specify a column name that is used in the data definition.
6. In the Default Value field, specify a value that matches with one of the values that is used in the data definition.
Note: The value that is entered in the Value to be Displayed field is displayed on the dashboard where this filter is added.
7. Optional: If you do not want a filter to be displayed on any dashboard, then select the Save As Hidden Filter check box.
8. To save the filter, click Save.
9. In the Save Filter window, complete the following steps:
In the Name field, enter a name for the filter.
To save the filter to an existing category, click Existing category, select a category name from the drop-down list, and then click Save.
To save the filter to a new category, click New Category, enter a category name, and then click Save.
To save the filter with another name, click the Save As option.
Results
The newly created custom filter is listed under Most Recently Created Filters in the navigation pane.
What to do next
480 IBM Telco Network Cloud Manager - Performance 1.4.5

You can use filters in a dashboard. For more information, see Creating a dashboard.
Managing filters
You can view, search, modify, or delete filters. You can also view, modify, or delete values within a filter.
About this task
If you modify a filter that is already assigned to dashboards or widgets, then those modifications are not displayed on the widgets or dashboards, unless you reassign the
newly modified filter to the widgets or dashboards. Similarly, if you delete a filter, it remains assigned to the dashboards or widgets, unless you explicitly delete it from
them.
Procedure
Viewing, deleting, or searching the existing filters.
To view, delete, or search the existing filters, complete the following steps:
1. In the left navigation pane of Dashboard Designer, click Filters > Manage Filters.
An All Filters page opens in a new tab. The page displays all the already created filters.
2. Complete any of the following steps:
To view filters that belong to a category, from the View list, select a category.
To find a filter, enter the name of the filter in the Search field.
To delete a filter, either select a filter and click the Delete button, or click the Delete icon on the filter row.
To delete multiple filters, select the filters that you want to delete, and then click the Delete button.
To create a copy of a filter, click the Copy icon on the filter row. In the Create Copy window, complete the following steps:
In the Name field, enter a new name for the filter. You can use alphanumeric characters and underscore in the dashboard name.
To save the filter to an existing category, click Existing Category, and select a category from the list.
To save the filter to a new category, click New Category, and enter a name for the new category.
To save the filter copy, click Save.
Modifying filter name, filter conditions, or previewing a filter.
To modify filter name, filter conditions, or to preview it, complete the following steps:
1. In the All Filters page, click the View/Edit icon that is displayed on the filter row.
The filter opens in a new tab. The page displays the filter name, and the filter details.
2. In the filter page, complete any of the following steps:
To edit filter name, click the Edit Filter Name icon that is displayed next to it, and enter a name.
To preview the filter, click the Preview icon.
The filter preview opens in a new tab.
To modify filter values, click the Edit icon that is displayed next to it, and specify new values.
To save the changes, click Save.
Viewing or searching the existing filters by using View All Filters option
To view or search the existing filters, complete the following steps:
1. In the left navigation pane of Dashboard Designer, click Filters > View All Filters.
A Filters pop-up window is displayed.
2. Complete any of the following steps:
To view filters that belong to a category, from the Category list, select a category.
To find a filter, enter the name of the filter in the Search field.
Dashboards
Use Dashboard Designer to create, view, modify, delete, import, or export dashboards. You can create dashboards to view multiple widgets and set relations between the
widgets. You can also view, modify, or delete widgets within a dashboard.
You can create dashboards either by creating dashboard components from scratch or by creating custom components first and then adding them to your dashboard. You
can also create specialized widgets such as web widgets or multi-chart widgets within a dashboard.
For more information about creating a dashboard, see Quick reference to creating dashboards.
Following are the components of a dashboard:
Layouts
Dashboard Designer contains default ready to use layouts. You can also create custom layouts according to your requirements. Layouts contain placeholders for
charts, widget templates, custom widgets, or external URLs.
For more information about Layouts, see Layouts.
IBM Telco Network Cloud Manager - Performance 1.4.5 481

Charts
Dashboard Designer displays multiple chart types under various categories. You cannot create custom charts.
For more information about Charts, see Charts.
Data Definitions
Data definition is the data source that is used in a widget. Dashboard Designer displays two types of data definitions, default data definitions and custom data
definitions.
For more information about Data Definitions, see Data Definitions.
Widgets
Widgets are charts with defined data sources, monitoring metrics, widget properties, filters, and chart properties. Dashboard Designer contains default ready to use
widget templates. You can also create multi-chart widgets, web widgets, or create custom widgets according to your requirements.
For more information about Widgets, see Widgets.
For more information about creating specialized widgets within a dashboard, see Specialized widgets.
Filters
Use filters to interactively explore the data that you want to display in the widgets in the dashboard. Dashboard Designer contains default ready to use filters. You
can also create custom filters according to your requirements.
For more information about Filters, see Filters.
After you create a dashboard, you can set relations between related widgets within a dashboard or you can set relations between a widget and another related dashboard.
For more information about setting relations between widgets and dashboards, see Setting relations.
You must attach dashboards to a Menu. After you publish the Menu, the dashboards are displayed on Engine.
For more information about Menus, see Menu Access.
Creating a dashboard
Dashboard Designer contains ready to use default components for layouts, charts, widget templates, data definitions, and filters. You can either use these default
components and create your dashboard, or you can first create your own custom components, and then drag them to a dashboard.
Managing dashboards
You can view, search, modify, delete, import or export dashboards. You can also view, modify, or delete widgets within a dashboard.
Exporting and importing dashboards
You can import or export dashboards between test and production environments, between multiple servers, multiple instances, or production environments, and
among various Tool Content Groups on a single setup. The exported dashboard along with its dashboard components is saved as a single file with a PRDD
extension. You can share this PRDD file for import. You can choose to import only a dashboard or import the dashboard along with its components, where along
with the dashboard, each component is also saved as a separate entity. Dashboard components include custom data definitions, widgets, custom filters, drill-down
dashboards, and the components of the drill-down dashboard. Connector sources are not exported or imported. Before you import dashboards, you must replicate
the connector sources in your import environment.
Predefined dashboard components
Telco Network Cloud Manager - Performance has a library of predefined or custom widgets and dashboards that are readily available in the Dashboard Designer
tool. You can add these widgets to a dashboard layout, previewed, and published immediately. These widgets come with readily available data definitions and filters
and there by saving much time and provide high level of flexibility.
Creating a dashboard
Dashboard Designer contains ready to use default components for layouts, charts, widget templates, data definitions, and filters. You can either use these default
components and create your dashboard, or you can first create your own custom components, and then drag them to a dashboard.
Before you begin
If you want to use custom components in your dashboard, then ensure that those components are created.
Ensure that an appropriate user role assigned to you.
A user with Dashboard
Developer role can create dashboards. A user with Menu Administrator or System Administrator role can create menus and publish dashboards. A user
with Publisher role can deploy dashboards on Engine.
For more information, see Default Dashboard designer roles and users.
If you want to set a background image for each widget within the dashboard, then ensure that those images are already available on your computer.
For information about creating specialized widgets within the dashboard, see Specialized widgets.
Specialized widgets include multi-chart widget, web widget, or widget that lists all the instances for a selected source and resource type. To create a web widget,
you must ensure that the website does not have any IFrame restrictions.
If you want to create a widget to continuously render real-time data of applications, then you must use the Real Time connector. Also, you must use a Line chart
only and in the chart properties, you must specify the number of data points to be displayed on the chart. You can add only one custom data definition and define
only one series in the Line chart. Hence, you must select Define a Manual Series option in the SERIES TYPE tab while setting chart properties. If you select Define a
Dynamic Series option, then the real-time data is not displayed. Also, multiple Y-axes are not supported. You must map time stamp data on X-axis only. You cannot
change the chart type nor can you add widget-level filters or assign dashboard-level filters to the widget.
About this task
After you log in to the Dashboard Designer, you can select any of the following options on the landing page:
If you select the CREATE DASHBOARDS option, then a select layout window is displayed, after you select a layout, you are directed to a new dashboard page. The
Dashboard Designer also displays a left navigation pane with all the dashboard components.
482 IBM Telco Network Cloud Manager - Performance 1.4.5

If you select CREATE COMPONENTS, then a create components page is displayed, you must select a component that you want to create. For example, layouts,
widgets, data definitions, or filters. After you select a component, you are directed to that component. Dashboard Designer also displays a left navigation pane with
all the dashboard components.
Alternatively, you click the Expand icon to open the left navigation pane of Dashboard Designer. You can either click Dashboards and create a dashboard, or create any
custom components.
You can save a dashboard at any step of dashboard creation. If the data definition is not set or is incomplete, then the dashboard is saved as a draft dashboard, and a Draft
icon is displayed next to it. After you set data definition in all the widgets of a dashboard, the dashboard is complete, and it displays a dashboard icon next to it.
Procedure
To create a dashboard, complete the following steps:
1. In the left navigation pane of Dashboard Designer, click Dashboards, and then click Create New Dashboard.
The Create a New Dashboard: Select a layout window is displayed. The window displays three tabs:
Recently used layouts
Default layouts
Custom layouts
The window also displays a Create a New Layout option.
For more information about default layouts and creating custom layouts, see Layouts.
2. In the Create a New Dashboard: Select a layout window, click a layout, and then click Select.
The selected layout opens in a new New Dashboard page.
3. Click the Edit icon that is displayed next to the New Dashboard and Sub Title fields, and enter a name and sub title for your dashboard.
Note: Only alphanumeric characters, spaces, and underscore are supported.
4. The Show Gridlines checkbox is selected by default.
If you do not want the grid-lines view, clear the checkbox.
5. The Filter Area checkbox is selected by default.
If you do not want the filter area to be displayed, clear the checkbox.
6. Optional: To add multiple widget placeholders or charts within a widget of a dashboard, see Creating a multi-chart widget.
7. To add either a custom widget, default widget template, custom widget template, external URL, or a chart to each widget placeholder in a dashboard, complete any
of the following steps:
To add a custom widget or custom widget template, in the left navigation of Dashboard Designer, click Widgets > Custom, expand a widget category, and drag
a custom widget or a custom widget template to the widget area.
For more information about creating a custom widget or a custom widget template, and changing chart types, see Creating custom widgets, Creating custom
widgets to list all instances, and Saving custom widgets as templates.
To add a default widget template, in the left navigation of Dashboard Designer, click Widgets > Default, expand a template category, and drag a template to
the widget area.
After you drag a default widget template, click the Set Data Definition icon to select data sources and instances.
To add a chart, in the left navigation pane of Dashboard Designer, click Chart, and drag a chart to the widget or chart area.
Note: If you add a chart, then you need to set data definitions and chart properties to complete a widget. For more information, see Creating custom widgets.
You can add one or more widgets to a dashboard, and can also add multiple data sources to a single widget.
To create a web widget in a dashboard, see Creating a web widget.
8. Optional: To add default or custom filters to the dashboard, in the left navigation pane of Dashboard Designer, click Filters, and complete any of the following steps:
Expand Default, and drag one or more filters to the filter area of the dashboard.
Expand Custom, and expand any of the listed custom categories, and drag one or more custom filters to the filter area of the dashboard.
For more information about default and custom filters, and creating custom filters, see Filters.
After you add filters, you must map the filters in the widgets, complete the following steps to map the filters:
a. In each widget, click the Set Data Definition icon.
b. In the Set Data Definition window, click the Edit icon.
c. Click MAP METRICS & FILTERS, and complete the following steps:
To map the default filters to the respective metric values in the data definition, select Automap Columns With Default Filters.
To map more metric values to preselected custom filters, click Map Another, and select the required metric value and filter.
To delete all the mappings, click Delete All Mappings.
To delete an already added filter mapping, click the Delete icon next to the mapping.
d. Click the Save icon.
9. Optional: To add a background image to any widget within a dashboard, complete the following steps:
a. Click icon that is displayed on the upper-right of that widget.
b. In the Background Image pop-up window, click Add Background Image, and then click Select from File.
c. Browse to the image file location on your computer, select the file, and then click Open.
Note: You can add PNG, JPEG, JPG, or GIF image files of size less than or equal to 2 MB.
The selected image is added as a background image to the widget. To replace the image, repeat the steps, and select another image. To delete the image,
click No Background Image.
10. Optional: To move a widget to an empty widget area within the dashboard, click and drag icon to the empty widget area.
Note: If a dashboard contains a multi-chart widget, then you cannot move that widget to an empty widget area within the dashboard nor can you move any other
widget to an empty widget placeholder within the multi-chart widget.
11. Optional: After you add widgets to a dashboard, you can click the Set Relation icon to set relations between the widgets.
IBM Telco Network Cloud Manager - Performance 1.4.5 483

For more information about setting relations, see Setting relations.
12. To save the dashboard, click Save.
13. In the Save Dashboard window, complete the following steps:
In the Dashboard Title field, enter a name for the dashboard.
To save the dashboard to an existing category, click Existing category, select a category name from the drop-down list, and then click Save.
To save the dashboard to a new category, click New Category, enter a category name, and then click Save.
To save the dashboard with another name, click the Save As option.
You can save a dashboard at any step of dashboard creation.
14. After you save a dashboard, to preview it, click the Preview icon.
Results
The newly created dashboard is listed under Most Recently Created Dashboards in the navigation pane, and displays any one of the following icons:
If data definition is set for all the widgets within the dashboard, then it displays a Dashboard icon next to it.
If data definition is not set or incomplete for any of the widgets within the dashboard, then it displays a Draft icon next to it.
What to do next
After a dashboard is created, complete any of the following tasks based on your user role:
A user with Menu Administrator and System Administrator role must attach the dashboard to a menu and publish it. Only such dashboards that are
attached to menus are displayed on Engine.
A user with a Publisher role can deploy the dashboard independently, that is, without attaching them to a menu. Click the Deploy icon to deploy the
dashboard on Engine.
Such independently deployed dashboards are not displayed on the Engine user interface as they are not attached to any menu. However, such independent
dashboards are listed in the Schedule Task window only.
If you want such independently deployed dashboards to be displayed on the Engine user interface, then you must attach them to a menu node and publish them.
You can view the published dashboards on the Engine only if you have access to an Engine instance and an Engine User Group.
Setting relations
Use set relations to view and compare data between various data sources and resource types based on common metrics. You can set relations between two
widgets, between a widget and a dashboard, or between a widget and an external web page or web application. When a widget is broadcasting information, it is the
source widget, and is also known as a master widget. When a widget is listening to another widget, it is the target widget, and is also known as listener widget or
drill-down widget.
Related tasks
Managing dashboards
Adding new menu item to Home menu
Setting relations
Use set relations to view and compare data between various data sources and resource types based on common metrics. You can set relations between two widgets,
between a widget and a dashboard, or between a widget and an external web page or web application. When a widget is broadcasting information, it is the source widget,
and is also known as a master widget. When a widget is listening to another widget, it is the target widget, and is also known as listener widget or drill-down widget.
About this task
You can set the following types of communications:
Master-Listener
Sets a widget to widget communication. From a master widget, you can go to a listener widget that displays related details of the master widget object. A
synchronization occurs between the master and listener widgets based on common metrics. You can add multiple listener widgets in a master-listener relation.
After you set a master-listener relation, you must map the common metric values, else the relation is not established.
Consider the following points when you set master-listener relation between widgets:
If you embedded a website or web application within a widget of a dashboard, then you can add such a widget as a listener widget only. Also, you can add
only one such widget as a listener widget.
If a dashboard contains a widget that lists all instances, then you can set such a widget as a master widget only.
If a dashboard contains a multi-chart widget, then all the widgets in that multi-chart widget function as any other dashboard widgets. You can set a master-
listener relation between any of the dashboard widgets, irrespective of whether they belong to a multi-chart widget or not.
Drill-down Dashboard
Sets a widget to dashboard communication. A drill-down relation is set between two widgets that belong to two separate dashboards. From a source widget that
belongs to one dashboard, you can go to a target widget that belongs to another dashboard. A synchronization occurs between the source widget and the target
widget based on common metrics. The target dashboard is the dashboard that contains the target widget and is also known as a drill-down dashboard. If a target
dashboard contains multiple widgets, then you need to select a single target widget when you map the common metrics.
You can add only one drill-down dashboard either to a source widget or to a listener widget. After you define a drill-down relation, you cannot set any other relation
for that drill-down dashboard. Also, you must map the common metric values in the source widget and the target widget in the drill-down dashboard, else the
484 IBM Telco Network Cloud Manager - Performance 1.4.5

relation is not established.
Consider the following points when you set drill-down relations:
If a drill-down dashboard contains a widget that lists all instances, then you must not select such a widget as a target widget. The all instances custom
widget must always be selected as a master widget only.
If a drill-down dashboard contains a widget where you embedded a web application or website, then you can select such a widget as a target widget.
If a dashboard contains a multi-chart widget, then all the widgets in that multi-chart widget function as any other dashboard widgets. Hence, you can set
drill-down relation to these widgets as well.
Drill-down URL
Sets a widget to web page communication. From a source widget, you can go to a target web page that is specified by a URL. If a dashboard contains a multi-chart
widget, then all the widgets in that multi-chart widget function as any other dashboard widgets. Hence, you can set drill-down URL relation to these widgets as well.
You can add only one drill-down URL either to a source widget or to a listener widget. You cannot add a drill-down URL to a drill-down dashboard in a master-drill-
down dashboard relation.
Creating a master-listener relation
Master-listener relation is a widget level interaction to display related details. You first set a source widget and then add a target widget to it.
Creating a drill-down relation
Sets a widget to dashboard level interaction to display related details. You first set a source widget and then add a target dashboard to it. If the target dashboard
contains multiple widgets, then you must select a target drill-down widget when you map the metrics data. You can add a drill-down dashboard either to a source
widget or to a listener widget in a master-listener relation.
Mapping metrics data
After you set master-listener relation or drill-down relation, you must specify the default metric values to be published on the source widget, and map those metric
values on the target widget. The published dashboard displays master-listener relation or drill-down relation only when the mapping is set.
Creating a drill-down URL relation
Sets a widget to a web page communication. From a source widget, you can go to a target web page. You first set a source widget and then specify the URL of the
target web page. You can either specify a static URL or a dynamic URL. You can add only a single drill-down URL to a source widget or to a master-listener relation.
You cannot add a drill-down URL to a drill-down dashboard.
Creating a master-listener relation
Master-listener relation is a widget level interaction to display related details. You first set a source widget and then add a target widget to it.
Before you begin
Ensure that the dashboard contains all the widgets that you want to link as master and listener.
Ensure that the widgets are complete. For example, all the widget-level and page-level filters are mapped, and all the widget and chart properties are set.
Ensure that the widgets display proper data when previewed.
Ensure that the widgets that you plan to pair as master and listener widgets have a common metric value.
For widgets that contain custom data definition, ensure that the parameter name and the common metric value that you specify for the master widget are already
specified in the custom data definition of the listener widget.
If you plan to use Map and Treemap charts as listener widgets, then you must use the column names that you entered in the ID and Parent fields as the common
metric values. Ensure that these values are already specified in the custom data definition and in the Set Properties window.
Example of the custom data definition, SELECT * FROM <table_name> WHERE
<ID_column_name> LIKE '<attribute>' OR <Parent_column_name> LIKE
'<attribute>'
Where,
<table_name> is the name of the database table.
<ID_column_name> is the column name that you specified in the ID field in the Set Properties window.
<Parent_column_name> is the column name that is specified in the Parent field in the Set Properties window.
<attribute> is any attribute value to be mapped.
Map chart must either be used as a master widget or a listener widget but not as both. If you set a master-listener relation between two supported Map chart
locations, then both the charts display similar map locations.
About this task
You can define master-listener relations is the following ways:
A single source widget can be connected to a single target widget.
For example, a single source widget can be connected to a single widget with an embedded website or web application.
A single source widget can be connected to multiple target widgets.
A single source widget can be connected to multiple target widgets that are in turn connected to one or more target widgets.
An all instances custom widget must always be set as a master widget only.
If a dashboard contains a multi-chart widget, then all the widgets in that multi-chart widget function as any other dashboard widgets. You can set a master-listener
relation between any of the dashboard widgets, irrespective of whether they belong to a multi-chart widget or not.
Note: For setting master-listener relations that involve multiple widgets, you cannot reuse any widget.
Procedure
Complete the following steps to set a master-listener relation:
1. In the left navigation pane of Dashboard Designer, click Dashboards.
IBM Telco Network Cloud Manager - Performance 1.4.5 485

Open a dashboard where you want to set relations. You can open a dashboard, either from the Most Recently Created Dashboard list or from Manage Dashboards
list.
Note: The dashboard must display multiple widgets. The widgets for which you want to set master-listener relation must contain common metrics.
2. Click the Set Relation icon.
The Set Relation window opens. The window displays a Widgets tab and a Dashboard tab. The Widgets tab shows all the widgets that are available in the current
dashboard. If the dashboard contains multi-chart widget, then those widgets are also displayed in the Widgets tab.
The Dashboard tab lists all the dashboards that are available in the user group.
3. From the Widgets tab, either select a widget or locate it by entering its name in the Search field. Drag the widget to the widget area to set it as a source widget.
Note: If you are using an all instances custom widget, then you must set it as a source widget only.
4. Right-click the source widget and click Add a Listener Widget to add a target widget.
5. From the Widgets tab, select and drag a widget that you want to set as a target widget for communications.
6. Optional: If you want to add another master-listener relation, then right-click either the source widget or a target widget, and click Add Another Relation.
You can specify a source and target widget as mentioned in the earlier steps. Similarly, you can set master-listener relation for all the widgets within a dashboard or
for a few widgets within a dashboard.
7. After all the master-listener relations are set, you must set parameters that must be passed from the source to the target widgets for communication. For more
information, see Mapping metrics data.
8. Optional: You can complete any of the following steps to modify or delete the mapping or the relations:
To delete a master-listener relation, you must first delete the mapping in its target widget. For more information, see Mapping metrics data.
To delete an existing master-listener relation, right-click the target widget, and click Delete.
To replace a widget in an existing master-listener relation, right-click either a source widget or a target widget, and click Delete Chart. You can then drag
another chart to that widget area.
9. Click Save to save the relation.
What to do next
You can also add a drill-down relation to a target widget, and then map metrics data. For more information, see Creating a drill-down relation and Mapping metrics data.
Creating a drill-down relation
Sets a widget to dashboard level interaction to display related details. You first set a source widget and then add a target dashboard to it. If the target dashboard contains
multiple widgets, then you must select a target drill-down widget when you map the metrics data. You can add a drill-down dashboard either to a source widget or to a
listener widget in a master-listener relation.
Before you begin
Ensure that both the dashboards, such as the one that contains the source widget and another dashboard that contains the target widget are already created and
are complete. For example, all the widget-level and page-level filters are mapped, and all the widget and chart properties are set.
Ensure that both the dashboards display proper data when previewed.
If you want to add a drill-down dashboard to a master-listener relation, then ensure that the master-listener relation is already defined.
Ensure that the widgets that you plan to pair as master and drill-down widgets have a common metric value.
For widgets that contain custom data definition, ensure that the parameter name and the common metric value that you specify for the master widget are already
specified in the custom data definition of the drill-down widget.
About this task
You can define master-drill-down relation is the following ways:
A single source widget can be connected to a single drill-down dashboard. If the drill-down dashboard contains multiple widgets, then you must select a target
widget from the drill-down dashboard whenever you map the metrics data. You can select a widget with an embedded website or web application as a target
widget.
You can add a drill-down dashboard to a master-listener relation. The listener widget acts as a source widget for the target drill-down dashboard.
An all instances custom widget must always be set as a master widget only. You cannot set the widget as a drill-down widget.
If a dashboard contains a multi-chart widget, then all the widgets in that multi-widget function as any other dashboard widgets. Hence, you can set drill-down relation for
these widgets as well.
Note: After the drill-down relation is set, you cannot add any other relation to the target drill-down widget.
Procedure
Complete the following steps to set a drill-down relation:
1. In the left navigation pane of Dashboard Designer, click Dashboards.
Open a dashboard where you want to set the drill-down relation. You can open a dashboard, either from the Most Recently Created Dashboard list, or from Manage
Dashboards list.
Note: Both the source widget and the target dashboard must contain common metrics.
2. Click the Set Relation icon.
The Set Relation window opens. The window displays a Widgets tab and a Dashboard tab. The Widgets tab shows all the widgets that are available in the current
dashboard. If the dashboard contains a multi-chart widget, then those widgets are also displayed in the Widgets tab.
The Dashboard tab lists all the dashboards that are available in the user group.
486 IBM Telco Network Cloud Manager - Performance 1.4.5

3. From the Widgets tab, either select a widget or locate it by entering its name in the Search field. Drag the widget to the widget area to set it as a source widget.
Note: If you are using the all instances custom widget, then you must set it as a source widget only.
4. Right-click the source widget and click Add a Drilldown Dashboard to add a target drill-down dashboard.
5. From the Dashboard tab, select and drag the dashboard that you want to set as a target drill-down dashboard for communications.
Note: If you are adding a drill-down dashboard to a master-listener widget, then you must first set the mapping in the master-listener relation, and then add the
target drill-down dashboard to it.
6. Optional: If you want to add drill-down relation for another source widget, then right-click the source widget, and click Add Another Relation.
You can specify a source widget and a target dashboard as mentioned in the earlier steps. Similarly, you can set drill-down relation for all the widgets within a
dashboard or for a few widgets within a dashboard.
7. After all the drill-down relations are set, you must set parameters that must be passed from the source widget to a target widget within a target dashboard for
communication. For more information, see Mapping metrics data.
8. Optional: You can complete any of the following steps to modify or delete the mapping or relations:
To delete a drill-down relation, you must first delete the mapping in its target widget. For more information, see Mapping metrics data.
To delete an existing drill-down relation, right-click the target drill-down dashboard, and click Delete.
To replace a target dashboard in an existing drill-down relation, you must first delete the drill-down dashboard, and then add another target dashboard to the
widget.
9. Click Save to save the relation.
What to do next
You must map metrics data. For more information, see Mapping metrics data.
Mapping metrics data
After you set master-listener relation or drill-down relation, you must specify the default metric values to be published on the source widget, and map those metric values
on the target widget. The published dashboard displays master-listener relation or drill-down relation only when the mapping is set.
Before you begin
For master-listener relation, the source and target widgets must already be specified in the dashboard.
For drill-down relation, the source widget and the target dashboard must already be specified in the dashboard.
For widgets that contain custom data definition, the metric values to be published on the source widget must already be specified in the custom data definition of
the target widget.
About this task
Mapping metric data involves the following steps:
1. On the source widget, select the metrics that you want to publish on the target widget or target drill-down dashboard. Enter a name for each of the selected metric
values in the Parameter field.
2. On the target widget (for master-listener relation) or target widget of the target dashboard (for drill-down relation), you must map those selected metrics to the
predefined master parameters.
If the target widget contains custom data definition, then that custom data definition must contain the common metric value and the value that you enter in
the Parameter field for the source widget.
If the target widget contains an embedded web application or website, then the website URL or web application URL must contain the value that you enter in
the Parameter field for the source widget.
For example, https://www.example.com/{filter_name}/{parameter_name}
Note: You can add multiple parameters to a URL.
For drill-down relation, based on the state of the data definition in the target dashboard, the target dashboard can display any of the following Map Drilldown Metrics To
Master Parameters icons:
Incomplete Map Drilldown Metrics To Master Parameters icon. This icon is displayed when the data definition is incomplete.
Complete Map Drilldown Metrics To Master Parameters icon. This icon is displayed when the data definition is complete.
Deleted Map Drilldown Metrics To Master Parameters icon. This icon is displayed when the data definition is deleted.
Procedure
Complete the following steps to map metric on the source widgets and target widget or target dashboard:
1. On the source widget, complete the following steps:
a. Click the Set Master Parameters icon.
A Set Master Parameters window is displayed. The DEFAULT PARAMETER TO BE PUBLISHED pane displays the default value that is published to the target
widget.
Note:
This value is the first metric value that you selected while setting data definitions for the widget.
b. In the Parameter field, enter a name for the value.
Note:
If the listener or drill-down widget contains custom data definition, then ensure that this parameter name is already specified in the custom data
definition.
If the listener or drill-down widget contains an embedded website or web application, then ensure that this parameter name is already specified in the
URL.
IBM Telco Network Cloud Manager - Performance 1.4.5 487

c. Optional: If you want to specify a parameter name for each of the remaining metric values, then in the ADDITIONAL PARAMETERS TO BE PUBLISHED pane,
select individual metric values and specify a parameter name for each metric value.
Note:
For ICAM data sources, you cannot select additional metric values.
If the listener or drill-down widget contains custom data definition, then ensure that these additional parameter names are already specified in the
custom data definition.
If the listener or drill-down widget contains an embedded website or web application, then ensure that these additional parameter names are already
specified in the URL.
d. Optional: If you want a specific metric value to be filtered and displayed on the target widget or dashboard, then in the SET STATIC VALUES pane, you must
manually enter that metric value, and enter a parameter name for that metric value.
Note:
If the listener or drill-down widget contains custom data definition, then ensure that the metric value and its parameter name are already specified in
the custom data definition.
If the listener or drill-down widget contains an embedded website or web application, then ensure that the metric value and its parameter name are
already specified in the URL.
e. Optional: For drill-down relation, if you want the drill-down dashboard to open in a new tab on Engine, then select Open Drilldown in new tab.
2. On the target widget or target dashboard, you must complete the following steps to map all the metric values that you specified in the earlier step:
a. For target listener widget, click Map Listener Metrics To Master Parameters icon or click Map Drilldown Metrics To Master Parameters icon for target
drill-down dashboard.
For drill-down relation, the target dashboard opens displaying one or more widgets. You must identify a target widget, and then click the Map Drilldown
Metrics To Master Parameters icon on that widget.
The Map Drilldown Metrics to Master Parameters window is displayed.
Note:
Map Listener Metrics To Master Parameters or Map Drilldown Metrics To Master Parameters icon is not displayed on target listener or drill-down
widget that contains saved data definition. You do not need to perform any additional steps as the common metric and parameter name are already
specified in the custom data definition, and hence, are already mapped.
If you are mapping a widget to an all instances custom widget, then the mapping is implicit and you do not need to select the metric that needs to be
mapped with the master parameter. The mapping is implemented soon after you click the Map Listener Metrics To Master Parameters icon or
Map Drilldown Metrics To Master Parameters icon and open the corresponding window.
If the target dashboard contains a multi-chart widget, then you can select an individual widget from the multi-chart widget as a target widget.
b. Complete any of the following steps based on the number of data sources contained in the widget:
If the widget contains a single data source, then click the edit icon on the source row.
If the widget contains multiple data sources, click the view icon on the connector source row of your choice, and then click the edit icon on the
source row of your choice.
Note: Widgets with multiple data sources cannot be mapped to a custom widget that lists all the instances.
A Map Metrics pane is displayed.
c. Complete the following steps in the Map Metrics pane:
From the Metric list, select the metric that you selected in the source widget.
From the Operator list, select the default operator.
From the Master Parameter list, select the parameter value that you specified in the source widget.
To map additional metrics, click Add Metric.
To delete an individual mapped row, click the Delete icon that is displayed next to that row.
To delete all the mapped rows, click Delete All Mappings.
Note:
You must delete all the mapping before you delete any master-listener or drill-down relation.
To delete mapping of a widget or a dashboard that is attached to a custom widget that lists all the instances, click the Edit icon and select
another set of instances.
To delete mapping of a widget that contains an embedded website or web application, delete the parameter name that you entered in the URL.
To save the mapping, click the Save icon.
Note: Repeat this step to map all the metrics values with their individual parameter values.
d. Close the Map Listener Metrics To Master Parameters or Map Drilldown Metrics To Master Parameters window, and click the Save button on the dashboard.
Note: If you do not click the Save button on the dashboard, then the mapping might get deleted.
What to do next
After you set the relations, you must first preview the drill-down relation, followed by preview of the master relation, and then preview and publish the dashboards. You
can view the relations on Engine after the dashboards are published.
Creating a drill-down URL relation
Sets a widget to a web page communication. From a source widget, you can go to a target web page. You first set a source widget and then specify the URL of the target
web page. You can either specify a static URL or a dynamic URL. You can add only a single drill-down URL to a source widget or to a master-listener relation. You cannot
add a drill-down URL to a drill-down dashboard.
Before you begin
You must ensure that the source widget is created or the master-listener relation to which you want to add the drill-down URL is set.
All the widget-level and page-level filters are mapped.
All the chart properties are set.
488 IBM Telco Network Cloud Manager - Performance 1.4.5

About this task
A static URL renders a permanent web page whereas a dynamic URL renders a web page based on the query or search strings that are present in the URL. You can add
multiple search string values to a URL. Search string values are the source widget or listener widget values that you map in the URL.
The following are the different search string values that you can map in a dynamic URL:
Column names that are mapped in the chart properties of the source widget.
Page-level and widget-level filters.
To view the valid search string values that you can use in a drill-down URL, enter an open curly bracket in the URL. A pop-up list with the valid search string values is
displayed.
If you are adding a drill-down URL to an existing master-listener relation, then you can map the search string values either from the listener widget or from both master
and listener widget. To view the valid search string values, enter an open curly bracket in the URL. The pop-up list displays the search string values of the listener widget
only. You need to manually enter search string values of the master widget.
https://www.example.com/search?q={System Load} and
{Timestamp} and {Aggregation} and {Datetime} and {Interval} and
{Summarization}
Where,
{System Load} is the Y-axis value and {Timestamp} is the X-axis value of the source widget.
{Aggregation}, {Datetime}, {Interval}, and {Summarization} are the filters that are attached to the widget.
Note:
You must define dynamic URL query or search string values based on the web page that you want to view.
Sankey, Sunburst, Circos, Tag Cloud, Bullet, Quadrant Motion, and Treemap charts do not support drill-down URL relation.
Procedure
Complete the following steps to set a drill-down URL relation:
1. In the left navigation pane of Dashboard Designer, click Dashboards.
Open a dashboard where you want to set drill-down relation. You can open a dashboard, either from the Most Recently Created Dashboard list, or from Manage
Dashboards list.
2. Click the Set Relation icon.
The Set Relation window opens. The window displays a Widgets tab and a Dashboard tab. The Widgets tab shows all the widgets that are available in the current
dashboard. Individual widgets with a multi-chart widget are also displayed in the Widgets tab.
The Dashboard tab lists all the dashboards that are available in the user group.
3. From the Widgets tab, either select a widget or locate it by entering its name in the Search field. Drag the widget to the widget area to set it as a source widget.
Note: If you are adding a drill-down URL to a listener widget, then you must first set the mapping in the master-listener relation, and then add the drill-down URL.
4. Right-click the source widget and click Add a Drilldown URL to add a target web page.
5. In the Drilldown URL field, enter either a dynamic or static web page URL.
For dynamic URL, enter a curly bracket to view a list of search strings.
Note: The auto populated search string list displays values of the immediate source widget. However, if you want to specify search string values of a master widget
instead of a listener widget, then you must enter those values manually in the URL.
Example of a static URL format:
https://www.example.com/pages/page.html
Example of a dynamic URL format:
https://www.example.com/search?q={SearchStr1}%20and%20{SearchStrN}
Or
https://www.example.com/search?q={SearchStr1}and{SearchStrN}
Where,
https is the communication protocol. The other standard supported protocols are http, file, sftp, ssl, jdbc, and so on.
Note: You must add a protocol in the URL. If you do not enter any protocol, then the web page is not displayed and the web address displays the Engine URL
appended to your URL entry.
www.example.com is the hostname.
/pages/page.html is the static path to the web page.
?q={SearchStr1}%20and%20{SearchStrN} is the search string in the dynamic path to the web page. You can add multiple search strings.
6. Optional: If you want to add drill-down relation for another source widget, then right-click the source widget, and click Add Another Relation.
You can specify a source widget and a target web page URL as mentioned in the earlier steps. Similarly, you can set drill-down URL relation for one or more widgets
within a dashboard.
7. Optional: You can complete any of the following steps to modify or delete the relations:
To delete an existing drill-down URL relation, right-click the target web page URL, and click Delete.
To modify or replace an existing web page URL, click the Drilldown URL field, and edit the URL.
8. Click Save to save the relation.
Managing dashboards
IBM Telco Network Cloud Manager - Performance 1.4.5 489

You can view, search, modify, delete, import or export dashboards. You can also view, modify, or delete widgets within a dashboard.
About this task
If data definition is not set or is incomplete for any of the widgets within a dashboard, then the dashboard is saved as a draft dashboard, and a Draft icon is displayed
next to it. After you set data definition in all the widgets of the dashboard, the dashboard is complete, and it displays a dashboard icon next to it.
Procedure
Viewing, deleting, or searching the existing dashboards.
To view, delete, or search the existing dashboards, complete the following steps:
1. In the left navigation pane of Dashboard Designer, click Dashboards > Manage Dashboards.
An All Dashboards page opens in a new tab. The page displays all the already created dashboards.
2. Complete any of the following steps:
To view dashboards that belong to a category, from the View list, select a category.
To find a dashboard, enter the name of the dashboard in the Search field.
To delete a dashboard, either select a dashboard and click the Delete button, or click the Delete icon on the dashboard row.
To delete multiple dashboards, select the dashboard that you want to delete, and then click the Delete button.
To create a copy of a dashboard, click the Copy icon on the dashboard row. In the Create Copy window, complete the following steps:
In the Name field, enter a new name for the dashboard. You can use alphanumeric characters, spaces, and underscore in the dashboard name.
To save the dashboard to an existing category, click Existing Category, and select a category from the list.
To save the dashboard to a new category, click New Category, and enter a name for the new category.
To save the dashboard copy, click Save.
Modifying name of a dashboard or widget.
To modify name of a dashboard, its sub title, or name of the widgets that are contained within the dashboard, complete the following steps:
1. In the All Dashboards page, click the View/Edit icon that is displayed on the dashboard row.
The dashboard opens in a new tab. The page displays the dashboard name, sub title (if any), and all its widgets.
2. Complete any of the following steps:
To modify name of a dashboard, click the Edit Dashboard Name icon that is displayed next to it, and enter a name.
To modify sub title of a dashboard, click the Edit Description icon that is displayed next to it, and enter a name.
To modify name of any widget that is contained within the dashboard, click the Edit Widget Title icon that is displayed next to it, and enter a
name.
3. To save the changes, click Save.
Modifying dashboard layouts to add more widget placeholders or delete existing widgets.
To modify layout of a dashboard, complete the following steps:
1. In the All Dashboards page, click the View/Edit icon that is displayed on the dashboard row.
The dashboard opens in a new tab. The page displays the dashboard name, sub title (if any), and all its widgets.
2. The Show Gridlines checkbox is selected by default. If you do not want grid lines, clear the checkbox.
3. Click list, and click Edit Layout.
The page displays a toolbar that shows the Undo , Redo , Delete , and Reset icons.
4. Go to the end of dashboard, and drag the layout edge to increase its height.
5. Complete any of the following actions:
To add a widget placeholder to the layout, place the pointer in the layout area and drag it to create a box. You can add multiple placeholders to the
dashboard.
To delete any of the existing widgets or any of the newly added placeholders, click the widget or placeholder, and then click the Delete icon on
the toolbar.
To undo or redo your changes, click the Undo icon or the Redo icon.
To delete all the existing widgets and all the newly created placeholders, click the Reset icon.
Note: After you click the Reset icon, you cannot undo or redo your changes. The entire dashboard is cleared.
6. To switch back to the dashboard design view, click the Back To Dashboard Design View icon.
7. To save the changes, click Save.
Adding, deleting, or modifying widgets within a dashboard.
You can add, delete, or modify custom widgets or specialized widgets within a dashboard.
For information about modifying custom and specialized widgets, see Managing custom widgets, custom templates, or specialized widgets.
For information about modifying web widgets, see Creating a web widget
To save the changes, click Save.
490 IBM Telco Network Cloud Manager - Performance 1.4.5

Adding, deleting, or modifying existing relations (if any) within dashboard widgets.
To add, delete, or modify existing relations within dashboard widgets, see Setting relations.
Adding or deleting dashboard-level filters.
To add or delete dashboard-level filters, complete the following steps:
1. In the All Dashboards page, click the View/Edit icon that is displayed on the dashboard row.
The dashboard opens in a new tab. The page displays the dashboard name, sub title (if any), and all its widgets.
2. To delete a filter, click the Delete icon that is displayed near the filter.
3. To add a default or custom filter, in the left navigation pane, click Filters, expend either Default or Custom, and drag a filter to the filter area on the dashboard.
If you add filters, then you must map them to the widgets. For more information, see Creating a dashboard.
For more information about default and custom filters, see Filters.
4. To save the changes, click Save.
Previewing or Deploying dashboards.
To preview or deploy a dashboard, complete the following steps:
1. In the All Dashboards page, click the View/Edit icon that is displayed on the dashboard row.
The dashboard opens in a new tab. The page displays the dashboard name, sub title (if any), and all its widgets.
2. Complete any of the following steps:
To preview the dashboard, click the Preview icon.
The dashboard preview opens in a new tab.
Only a Menu Administrator, System Administrator, or Publisher can deploy a dashboard. Click the Deploy icon.
The dashboard is deployed on Engine. Only if the dashboard is attached to a menu, it is displayed on the Engine user interface. Else, the dashboard is
only listed in the Schedule Task window.
Viewing JSON source of a dashboard.
To view JSON source of a dashboard, complete the following steps:
1. In the All Dashboards page, click the View/Edit icon that is displayed on the dashboard row.
The dashboard opens in a new tab. The page displays the dashboard name, sub title (if any), and all its widgets.
2. To view JSON code of the dashboard, click the View Source icon.
Importing or exporting dashboards
For information about importing or exporting dashboards, see Exporting and importing dashboards.
Exporting and importing dashboards
You can import or export dashboards between test and production environments, between multiple servers, multiple instances, or production environments, and among
various Tool Content Groups on a single setup. The exported dashboard along with its dashboard components is saved as a single file with a PRDD extension. You can
share this PRDD file for import. You can choose to import only a dashboard or import the dashboard along with its components, where along with the dashboard, each
component is also saved as a separate entity. Dashboard components include custom data definitions, widgets, custom filters, drill-down dashboards, and the
components of the drill-down dashboard. Connector sources are not exported or imported. Before you import dashboards, you must replicate the connector sources in
your import environment.
Before you begin
All the Dashboard Designer users, irrespective of their user roles can export or import dashboards.
Dashboards that are imported by a system administrator are accessible to other system administrators only and are not accessible to any other Dashboard Designer
users.
The display and use of the imported dashboards and their components is restricted to the Tool Content Groups in which they are imported. All the users who belong
to the same Tool Content Group can view, use, modify, and delete the imported dashboards and their components.
Before you import dashboards, you must check the connector sources that are used in the dashboards and create similar connector sources with the same names
on your computer. For the imported dashboards to work, the data definition requests must fetch data in your import environment. If the connector sources are not
created in advance, then the imported dashboards do not display any data. However, the dashboards will display data after you create similar connector sources in
the imported environment.
Note: Listener-widgets or widgets of drill-down dashboards that are created by using an assisted mode of data definition are not imported. However, listener-
widgets or drill-down dashboards that are created by using custom data definitions are imported.
The assisted mode of data definition is created by using the Create a Data Definition option. For more information, see Data Definitions.
To import a dashboard, ensure that the encrypted JSON file of the dashboard with a PRDD extension is available on your computer. For example,
Dashboard_example.prdd
Drill-down dashboards or dashboards that are in the Draft state cannot be exported.
Drill-down dashboards are exported along with their master dashboard only as a single PRDD file.
If you import a dashboard that contains a direct or independent filter that is based on another data definition, then that other data definition is also saved as a
separate component. The data definition uses the naming convention that is used by the other custom data definition.
Default filters and default data definitions cannot be exported or imported.
IBM Telco Network Cloud Manager - Performance 1.4.5 491

About this task
While you are importing a dashboard, by default, the dashboard components are saved as separate entities. The dashboard components include custom data definitions,
widgets, custom filters, drill-down dashboards, and components of each drill-down dashboard. Each component is saved to its custom component list under the same
category name as specified for the imported dashboard. If you specify a new category, then the components are saved under the new category name.
Unlike the other dashboard components, filters are imported and saved with their existing names only. If a filter name exists, then that filter is not imported. Only the filter
names are checked for similarity. The filter contents are not verified.
The following are a few scenarios that are related to importing custom filters with similar names on same or different servers:
On a shared server, if you export and import a dashboard from one Tool Content Group to another, then the filter is not imported as a separate entity, as the
database is shared across the Tool Content Groups. In the Tool Content Group where the dashboard is imported, the filter is not displayed in the left navigation
pane of Dashboard Designer but is displayed on the imported dashboard and works as designed.
When two servers contain different filters but with the same names, then the filter is not imported. The existing filter is displayed on the dashboard and it might not
filter the content of the imported dashboard.
The dashboard components are saved with the following naming conventions:
Widgets
Each widget within the imported dashboard is saved as an individual widget by using the dashboard name that you enter while importing the dashboard. The widget
name is appended with an incremental widget number that starts with W001.
If that dashboard name contains a space, then that space is replaced with an underscore and a random system-generated five-digit number is also appended to the
widget name.
If the dashboard name is more than 39 characters, then only the first 39 characters of the dashboard name are used along with a random system-generated five-
digit number. The widget name does not differ even when the dashboard name contains a space.
For example,
If the dashboard name that is entered in the Dashboard Name field does not contain a space, then the widgets are named as Dashboardname_W001,
Dashboardname_W002, and so on.
If the dashboard name that is entered in the Dashboard Name field contains a space, then the widgets are named as Dashboard_name_11111_W001,
Dashboard_name_11110_W002, and so on.
If the dashboard name that is entered in the Dashboard Name field is more than 39 characters, then the widgets are named as
39_characters_of_dashboardname_11111_W001, 39_characters_of_dashboardname_11110_W002, and so on.
Where:
Dashboardname or Dashboard_name is the name of the dashboard.
11111 and 11110 are random system-generated five-digit numbers.
Multi-chart widgets
Multi-chart widget is not saved as a separate entity. However, each widget within the multi-chart widget is saved individually. The dashboard name is appended
with the parent widget number and then with the child widget number.
If that dashboard name contains a space, then that space is replaced with an underscore and a random system-generated five-digit number is also appended to the
widget name.
If the dashboard name is more than 34 characters, then only the first 34 characters of the dashboard name are used along with a random system-generated five-
digit number. The widget name does not differ even when the dashboard name contains a space.
For example,
If the dashboard name that is entered in the Dashboard Name field does not contain a space, then each widget within a multi-chart widget is named as
Dashboardname_W001_W001, Dashboardname_W001_W002, Dashboardname_W001_W003, and so on.
If the dashboard name that is entered in the Dashboard Name field contains a space, then each widget within a multi-chart widget is named as
Dashboard_name_11111_W001_W001, Dashboard_name_11110_W001_W002, Dashboard_name_11120_W001_W003, and so on.
If the dashboard name that is entered in the Dashboard Name field is more than 34 characters, then each widget within a multi-chart widget is named as
34_characters_of_dashboardname_11111_W001_W001; 34_characters_of_dashboardname_11110_W001_W002, and so on.
Where:
Dashboardname or Dashboard_name is the name of the dashboard.
11111, 11120, and 11110 are random system-generated five-digit numbers.
In this example, all the widgets belong to a single multi-chart widget, W001.
Custom data definitions
Each custom data definition within the dashboard is saved individually by using the dashboard name that you enter while importing the dashboard. The custom
data definition name is appended with an incremental custom data definition number that starts with DD001.
If that dashboard name contains a space, then that space is replaced with an underscore and a random system-generated five-digit number is also appended to the
custom data definition name.
If the dashboard name is more than 38 characters, then only the first 38 characters of the dashboard name are used along with a random system-generated five-
digit number. The custom data definition name does not differ even when the dashboard name contains a space.
If a single custom data definition is used multiple times in the imported dashboard, then only one instance of such custom data definition is saved.
For example,
If the dashboard name that is entered in the Dashboard Name field does not contain a space, then the custom data definitions are named as
Dashboardname_DD001, Dashboardname_DD002, and so on.
If the dashboard name that is entered in the Dashboard Name field contains a space, then the custom data definitions are named as
Dashboard_name_11111_DD001, Dashboard_name_11110_DD002, and so on.
492 IBM Telco Network Cloud Manager - Performance 1.4.5

If the dashboard name that is entered in the Dashboard Name field is more than 38 characters, then the custom data definitions are named as
38_characters_of_dashboardname_11111_DD001; 38_characters_of_dashboardname_11110_DD002.
Where:
Dashboardname or Dashboard_name is the name of the dashboard.
11111 and 11110 are random system-generated five-digit numbers.
Drill-down dashboards
Each drill-down dashboard is saved individually by using the dashboard name that you enter while importing the dashboard. If the dashboard name contains a
space, then that space is replaced with an underscore. The drill-down dashboard name is appended with an incremental drill-down dashboard number that starts
with drilldown1.
For example, Dashboardname_drilldown1, Dashboardname_drilldown2, and so on.
If the dashboard name is more than 33 characters, then only the first 33 characters of the dashboard name are used along with a random system-generated five-
digit number.
For example, 33_characters_of_dashboardname_11111_drilldown1; 33_characters_of_dashboardname_11110_drilldown2
Where, 11111 and 11110 are random system-generated five-digit numbers.
Widgets within drill-down dashboards
Each widget within the drill-down dashboard is saved separately. The widget name is appended with the parent drill-down dashboard number, and then with the
child widget number.
If the dashboard name contains a space, then that space is replaced with an underscore and a random system-generated five-digit number is also appended to the
widget name.
If the dashboard name is more than 28 characters, then only the first 28 characters of the dashboard name are used along with a random system-generated five-
digit number. The widget name does not differ even when the dashboard name contains a space.
For example,
If the dashboard name that is entered in the Dashboard Name field does not contain a space, then each widget within a drill-down dashboard is named as
Dashboardname_drilldown1_W001, Dashboardname_drilldown1_W002, Dashboardname_drilldown1_W003 and so on.
If the dashboard name that is entered in the Dashboard Name field contains a space, then each widget within a drill-down dashboard is named as
Dashboard_name_11111_drilldown1_W001, Dashboard_name_11110_drilldown1_W002, Dashboard_name_11120_drilldown1_W003, and so on.
If the dashboard name that is entered in the Dashboard Name field is more than 28 characters, then each widget within a drill-down dashboard is named as
28_characters_of_dashboardname_11111_drilldown1_W001; 28_characters_of_dashboardname_11110_drilldown1_W002, and so on.
Where:
Dashboardname or Dashboard_name is the name of the dashboard.
11111, 11120, and 11110 are random system-generated five-digit numbers.
In this example, all the three widgets belong to a single drill-down dashboard, drilldown1.
Custom data definitions within drill-down dashboards
Custom data definitions within the widgets of the drill-down dashboards are saved individually. The custom data definition name is appended with the parent drill-
down dashboard number, and then with the child custom data definition number.
If the dashboard name contains a space, then that space is replaced with an underscore and a random system-generated five-digit number is also appended to the
custom data definition name.
If the dashboard name is more than 27 characters, then only the first 27 characters of the dashboard name are used along with a random system-generated five-
digit number. The custom data definition name does not differ even when the dashboard name contains a space.
For example,
If the dashboard name that is entered in the Dashboard Name field does not contain a space, then each custom data definition within a drill-down dashboard
is named as Dashboardname_drilldown1_DD001, Dashboardname_drilldown1_DD002, Dashboardname_drilldown1_DD003, and so on.
If the dashboard name that is entered in the Dashboard Name field contains a space, then each custom data definition within a drill-down dashboard is
named as Dashboard_name_11111_drilldown1_DD001, Dashboard_name_11110_drilldown1_DD002, Dashboard_name_11120_drilldown1_DD003, and
so on.
If the dashboard name that is entered in the Dashboard Name field is more than 27 characters, then each custom data definition within a drill-down
dashboard is named as 27_characters_of_dashboardname_11111_drilldown1_DD001; 27_characters_of_dashboardname_11110_drilldown1_DD002
Where:
Dashboardname or Dashboard_name is the name of the dashboard.
11111, 11120, and 11110 are random system-generated five-digit numbers.
In this example, all the three custom data definitions belong to a single drill-down dashboard, drilldown1.
Multi-chart widgets within drill-down dashboards
Multi-chart widgets are not saved as a separate entity. However, each widget within the multi-chart widget is saved individually. The widget name is appended with
the parent drill-down dashboard number, parent widget number, and then with the child widget number.
If the dashboard name contains a space, then that space is replaced with an underscore and a random system-generated five-digit number is also appended to the
widget name.
If the dashboard name is more than 24 characters, then only the first 24 characters of the dashboard name are used along with a random system-generated five-
digit number. The widget name does not differ even when the dashboard name contains a space.
For example,
If the dashboard name that is entered in the Dashboard Name field does not contain a space, then each widget within a multi-chart widget of a drill-down
dashboard is named as Dashboardname_drilldown1_W003_W001, Dashboardname_drilldown1_W003_W002, Dashboardname_drilldown1_W003_W003
and so on.
IBM Telco Network Cloud Manager - Performance 1.4.5 493

If the dashboard name that is entered in the Dashboard Name field contains a space, then each widget within a multi-chart widget of a drill-down dashboard
is named as Dashboard_name_11111_drilldown1_W003_W001, Dashboard_name_11110_drilldown1_W003_W002,
Dashboard_name_11120_drilldown1_W003_W003, and so on.
If the dashboard name that is entered in the Dashboard Name field is more than 24 characters, then each widget within a multi-chart widget of a drill-down
dashboard is named as 24_characters_of_dashboardname_11111_drilldown1_W001_W001;
24_characters_of_dashboardname_11110_drilldown1_W002_W001
Where:
Dashboardname or Dashboard_name is the name of the dashboard.
11111, 11120, and 11110 are random system-generated five-digit numbers.
In this example, all the three multi-chart widgets belong to a single drill-down dashboard, drilldown1 and to a single parent widget, W003.
If you do not choose to save the dashboard components, then only the dashboard is imported. The dashboard components, such as custom data definitions, custom
filters, widgets, and drill-down dashboards are not saved separately. Also, data definitions that are created by using an assisted mode of data definition are not imported
as individual dashboard components.
Procedure
Exporting a dashboard
Complete the following steps to export a dashboard:
1. In the left navigation pane of Dashboard Designer, click Dashboards > Manage Dashboards.
An All Dashboards page opens in a new tab. The page displays all the already created dashboards.
2. Click the Export Dashboard icon that is displayed on the dashboard row.
The dashboard is exported, and you can save the dashboard to the required location on your computer. The exported file displays a PRDD extension.
Importing a dashboard
Complete the following steps to import a dashboard:
1. Click Import Dashboard.
The Import Dashboard window is displayed.
2. In the Select a PRDD file field, click Browse and select a PRDD file that is placed on your computer.
3. In the Dashboard Name field, enter a new name for the imported dashboard.
If you enter a name that contains a space in it, then each component is saved individually and space is replaced with underscore.
4. If you do not want to save the dashboard components as separate entities, then clear the Save the Dashboard and its components as separate entities
checkbox.
By default, the Save the Dashboard and its components as separate entities checkbox is selected, and the dashboard components are saved as separate
entities. If you clear the selection, then only the dashboard is imported.
5. By default, the dashboard is saved to an existing category. However, if you want to save the dashboard to a new category, click New Category and enter a
category name.
6. Click Import.
The dashboard is imported and displayed under the specified category in Dashboard Designer. If you chose to save the dashboard components as separate entities,
then each of the dashboard component is displayed under its individual custom component list, under the same category name as specified for the imported
dashboard.
Predefined dashboard components
Telco Network Cloud Manager - Performance has a library of predefined or custom widgets and dashboards that are readily available in the Dashboard Designer tool. You
can add these widgets to a dashboard layout, previewed, and published immediately. These widgets come with readily available data definitions and filters and there by
saving much time and provide high level of flexibility.
All the predefined content is categorized based on the Technology Packs in which they are available. Currently, the following Technology Packs and their dependent packs
must be installed to use these predefined widgets and dashboards:
Network Health for Cisco Devices
Network Health for Huawei Devices
Network Health for Juniper Devices
Network Health Generic
Network Health
Network Health (Extension)
Predefined content is available as custom dashboards, custom data definitions, custom filters, and custom widgets.
Predefined dashboards
Table 1. Network Health Device
Dashboard name Available widgets
494 IBM Telco Network Cloud Manager - Performance 1.4.5

Dashboard name Available widgets
Environmental Health Summary Resource Fan State Summary
Power Supply State Summary
Temperature Level (0C) Summary
VoltageLevel(Volts)Summary
Environmental Health Details Fan State Trend
Power Supply State Trend
Temperature Level (0C) Trend
Voltage Level (Volts) Trend
Table 2. Network Health Generic
Dashboard name Available widgets
Packet Health Summary Resource Top 10 Inbound Errors (Packets)
Top 10 Outbound Errors (Packets)
Packet Health Summary
Packet Health (Packet) Details Inbound Packets Trend
Outbound Packets Trend
Inbound Errors (Packets) Trend
Outbound Errors (Packets) Trend
Inbound Discards(Packets)Trend
Outbound Discards (Packets) Trend
Unknown Protocols (Packets) Trend
Packet Health Top 5 Resource Inbound Errors (Packets) Grid
Inbound Errors (Packets) Bar
Outbound Errors (Packets) Grid
Outbound Errors (Packets) Bar
Inbound Discards (Packets) Grid
Inbound Discards (Packets) Bar
Outbound Discards (Packets) Grid
Outbound Discards (Packets) Bar
Packet Throughput Summary Resource Packet Throughput Summary
Packet Throughput (Packet) Details Inbound Unicast (pps)Trend
Outbound Unicast (pps) Trend
Inbound Multicast (pps) Trend
Outbound Multicast (pps) Trend
Inbound Broadcast (pps) Trend
Outbound Broadcast (pps) Trend
Packet Throughput Top 5 Resource Inbound Unicast (pps) Grid
Inbound Unicast (pps) Bar
Outbound Unicast (pps) Grid
Outbound Unicast (pps) Bar
Inbound Multicast (pps) Grid
Inbound Multicast (pps) Bar
Outbound Multicast (pps) Grid
Outbound Multicast (pps) Bar
Inbound Broadcast (pps) Grid
Inbound Broadcast (pps) Bar
Outbound Broadcast (pps) Grid
Outbound Broadcast (pps) Bar
IBM Telco Network Cloud Manager - Performance 1.4.5 495

Dashboard name Available widgets
Bit Throughput Summary Resource Top10 Inbound Utilization
Top10 Outbound Utilization
Bit Throughput Summary
Bit Throughput (Octets) Details Inbound Utilization (%) Trend
Outbound Utilization (%) Trend
Inbound Throughput (bps) Trend
Outbound Throughput (bps) Trend
Bit Throughput Top 5 Resource Inbound Utilization (%) Grid
Inbound Utilization (%) Bar
Outbound Utilization (%) Grid
Outbound Utilization(%) Bar
Inbound Throughput (bps) Grid
Inbound Throughput (bps) Bar
Outbound Throughput (bps) Grid
Outbound Throughput (bps) Bar
CPU and Memory Utilization Summary Resource CPU Utilization (%) Summary
Memory Utilization(%) Summary
CPU and Memory Utilization Details CPU Utilization(%)
Memory Utilization (%)
CPU Utilization (%) Trend
Memory Utilization (%) Trend
Predefined data definitions
All the data definitions that are used by the predefined widgets are available in Dashboard Designer tool and can be accessed from Data Definitions > Custom > Manage
Data Definitions. You can see the available data definitions from network_health_device and network_health_generic categories in the All Data Definitions page.
Predefined filters
The Dashboard Designer tool also has some predefined filters that you must use in the widgets and dashboards specifically.
The following filters are available for use:
Custom filters under Network Health Generic category
entityName
entityResourceType
DeviceName
Default filter under NPI category
timePeriod
Follow these guidelines to use these filters:
All trend widgets that are based on timeseries charts must use all the filters.
entityName
entityResourceType
DeviceName
timePeriod
All other widgets that are based on bar or pie charts must use the DeviceName custom filter and timePeriod default filter.
Predefined widgets
Table 3. Network Health Device widgets
Widget name Data definition Metric display name Actual metric name
Fan State Summary FanStateSummaryStore Max Fan State
Avg Fan State
Min Fan State
MAX(Environment.Fan.State)
AVG(Environment.Fan.State)
MIN(Environment.Fan.State)
Fan State Trend FanStateTrendStore Fan State Environment.Fan.State
496 IBM Telco Network Cloud Manager - Performance 1.4.5

Widget name Data definition Metric display name Actual metric name
Power Supply State Summary PowerSupplyStateSummaryStore Max Power Supply State
Avg Power Supply State
Min Power Supply State
MAX(Environment.Power.Supply.State)
AVG(Environment.Power.Supply.State)
MIN(Environment.Power.Supply.State)
Power Supply State Trend PowerSupplyStateTrendStore Power Supply State Environment.Power.Supply.State
Temperature Level (0C) Summary TemperatureLevelCelsiusSummaryStore Max Temperature Level (˚C)
Avg Temperature Level (˚C)
Min Temperature Level (˚C)
MAX(Environment.Temperature.Level.Celsius)
AVG(Environment.Temperature.Level.Celsius)
MIN(Environment.Temperature.Level.Celsius)
Temperature Level (0C) Trend TemperatureLevelCelsiusTrendStore Temperature Level 0C) Environment.Temperature.Level.Celsius
Voltage Level (volts) Summary VoltageLevelVoltsSummaryStore Max Voltage Level (Volts)
Avg Voltage Level (Volts)
Min Voltage Level (Volts)
MAX(Environment.Voltage.Level.Volts)
AVG(Environment.Voltage.Level.Volts)
MIN(Environment.Voltage.Level.Volts)
Voltage Level (volts) Trend VoltageLevelVoltsTrendStore Voltage Level (Volts) Environment.Voltage.Level.Volts
Table 4. Network Health Generic widgets
Widget name Data definition Metric display name Actual metric name
Bit Throughput Summary BitThroughputSummaryStore Max Inbound Throughput (bps)
Avg Inbound Throughput (bps)
Max Outbound Throughput (bps)
Avg Outbound Throughput (bps)
Max Inbound Utilization (%)
Avg Inbound Utilization (%)
Max Outbound Utilization (%)
Avg Outbound Utilization (%)
CPU Utilization (%) CPUUtilizationPercentLastValueStore Last(CPU.Utilization.Percent)
CPU Utilization (%) Summary CPUUtilizationPercentSummaryStore Max CPU Utilization (%)
Avg CPU Utilization (%)
Min CPU Utilization (%)
MAX(CPU.Utilization.Percent)
AVG(CPU.Utilization.Percent)
MIN(CPU.Utilization.Percent)
CPU Utilization (%) Trend CPUUtilizationPercentTrendStore CPU Utilization (%) CPU.Utilization.Percent
Inbound Broadcast (pps) Bar Top5InboundBroadcastppsStoreBar Max Inbound Broadcast (pps)
Avg Inbound Broadcast (pps)
MAX(Network.Inbound.Broadcast.pps)
AVG(Network.Inbound.Broadcast.pps)
Inbound Broadcast (pps) Grid Top5InboundBroadcastppsStoreGrid Max Inbound Broadcast (pps)
Avg Inbound Broadcast (pps)
MAX(Network.Inbound.Broadcast.pps)
AVG(Network.Inbound.Broadcast.pps)
Inbound Broadcast (pps) Trend InboundBroadcastppsTrendStore Network.Inbound.Broadcast.pps
Inbound Discards (Packets) Bar Top5InboundDiscardsPacketsStoreBar Sum Inbound Discards (Packets) SUM(Network.Inbound.Errors.Count)
Inbound Discards (Packets) Grid Top5InboundDiscardsPacketsStoreGrid Sum Inbound Discards (Packets) SUM(Network.Inbound.Discards.Count)
Inbound Discards (Packets) Trend InboundDiscardsPacketsTrendStore SUM(Network.Inbound.Discards.Count)
Inbound Errors (Packets) Bar Top5InboundErrorsPacketsStoreBar Sum Inbound Errors (Packets) SUM(Network.Inbound.Errors.Count)
Inbound Errors (Packets) Grid Top5InboundErrorsPacketsStoreGrid Sum Inbound Errors (Packets) SUM(Network.Inbound.Errors.Count)
Inbound Errors (Packets) Trend InboundErrorsPacketsTrendStore SUM(Network.Inbound.Errors.Count)
Inbound Multicast (pps) Bar Top5InboundMulticastppsStoreBar Max Inbound Multicast (pps)
Avg Inbound Multicast (pps)
MAX(Network.Inbound.Multicast.pps)
AVG(Network.Inbound.Multicast.pps)
Inbound Multicast (pps) Grid Top5InboundMulticastppsStoreGrid Max Inbound Multicast (pps)
Avg Inbound Multicast (pps)
MAX(Network.Inbound.Multicast.pps)
AVG(Network.Inbound.Multicast.pps)
Inbound Multicast (pps) Trend InboundMulticastppsTrendStore Network.Inbound.Multicast.pps
Inbound Packets Trend InboundPacketsTrendStore SUM(Network.Inbound.Packets.Count)
Inbound Throuput (bps) Bar Top5InboundThroughputbpsStoreBar Max Inbound Throughput (bps)
Avg Inbound Throughput (bps)
MAX(Network.Inbound.Throughput.bps)
AVG(Network.Inbound.Throughput.bps)
Inbound Throuput (bps) Grid Top5InboundThroughputbpsStoreGrid Max Outbound Utilization (%)
Avg Outbound Utilization (%)
MAX(Network.Outbound.Utilization.Percent)
AVG(Network.Outbound.Utilization.Percent)
Inbound Throuput (bps) Trend InboundThroughputbpsTrendStore Network.Inbound.Throughput.bps
Inbound Unicast (pps) Bar Top5InboundUnicastppsStoreBar Max Inbound Unicast (pps)
Avg Inbound Unicast (pps)
MAX(Network.Inbound.Unicast.pps)
AVG(Network.Inbound.Unicast.pps)
Inbound Unicast (pps) Grid Top5InboundUnicastppsStoreGrid Max Inbound Unicast (pps)
Avg Inbound Unicast (pps)
MAX(Network.Inbound.Unicast.pps)
AVG(Network.Inbound.Unicast.pps)
Inbound Unicast (%) Trend InboundUnicastppsTrendStore
IBM Telco Network Cloud Manager - Performance 1.4.5 497

Widget name Data definition Metric display name Actual metric name
Inbound Utilization (%) Bar Top5InboundUtilizationPercentStoreBar Max Inbound Utilization (%)
Avg Inbound Utilization (%)
MAX(Network.Inbound.Utilization.Percent)
AVG(Network.Inbound.Utilization.Percent)
Inbound Utilization (%) Grid Top5InboundUtilizationPercentStoreGrid Max Inbound Utilization (%)
Avg Inbound Utilization (%)
MAX(Network.Inbound.Utilization.Percent)
AVG(Network.Inbound.Utilization.Percent)
Inbound Utilization (%) Trend InboundUtilizationPercentTrendStore Network.Inbound.Utilization.Percent
Memory Utilization (%) MemoryUtilizationPercentLastValueStore Last(Memory.Utilization.Percent)
Memory Utilization (%) Summary MemoryUtilizationPercentSummaryStore Max Memory Utilization (%)
Avg Memory Utilization (%)
Min Memory Utilization (%)
MAX(Memory.Utilization.Percent)
AVG(Memory.Utilization.Percent)
MIN(Memory.Utilization.Percent)
Memory Utilization (%) Trend MemoryUtilizationPercentTrendStore Memory Utilization (%) Memory.Utilization.Percent
Outbound Broadcast (pps) Bar Top5OutboundBroadcastppsStoreBar Max Outbound Broadcast (pps)
Avg Outbound Broadcast (pps)
MAX(Network.Inbound.Broadcast.pps)
AVG(Network.Inbound.Broadcast.pps)
Outbound Broadcast (pps) Grid Top5OutboundBroadcastppsStoreGrid Max Outbound Broadcast (pps)
Avg Outbound Broadcast (pps)
MAX(Network.Inbound.Broadcast.pps)
AVG(Network.Inbound.Broadcast.pps)
Outbound Broadcast (pps) Trend OutboundBroadcastppsTrendStore Network.Outbound.Broadcast.pps
Outbound Discards (Packets) Bar Top5OutboundDiscardsPacketsStoreBar Sum Outbound Discards (Packets) SUM(Network.Outbound.Discards.Count)
Outbound Discards (Packets) Grid Top5OutboundDiscardsPacketsStoreGrid Sum Outbound Discards (Packets) SUM(Network.Outbound.Discards.Count)
Outbound Discards (Packets) Trend OutboundDiscardsPacketsTrendStore SUM(Network.Outbound.Discards.Count)
Outbound Errors (Packets) Bar Top5OutboundDiscardsPacketsStoreBar Sum Outbound Discards (Packets) SUM(Network.Outbound.Errors.Count)
Outbound Errors (Packets) Grid Top5OutboundErrorsPacketsStoreGrid Sum Outbound Errors (Packets) SUM(Network.Outbound.Errors.Count)
Outbound Errors (Packets) Trend OutboundErrorsPacketsTrendStore SUM(Network.Outbound.Errors.Count)
Outbound Multicast (pps) Bar Top5OutboundMulticastppsStoreBar
Outbound Multicast (pps) Grid Top5OutboundMulticastppsStoreGrid Max Outbound Multicast (pps)
Avg Outbound Multicast (pps)
MAX(Network.Outbound.Multicast.pps)
AVG(Network.Outbound.Multicast.pps)
Outbound Multicast (pps) Trend OutboundMulticastppsTrendStore Max Outbound Multicast (pps)
Avg Outbound Multicast (pps)
MAX(Network.Outbound.Multicast.pps)
AVG(Network.Outbound.Multicast.pps)
Outbound Packets Trend OutboundPacketsTrendStore SUM(Network.Outbound.Packets.Count)
Outbound Throughput (bps) Bar Top5OutboundThroughputbpsStoreBar Max Outbound Throughput (bps)
Avg Outbound Throughput (bps)
MAX(Network.Outbound.Throughput.bps)
AVG(Network.Outbound.Throughput.bps)
Outbound Throughput (bps) Grid Top5OutboundThroughputbpsStoreGrid Max Outbound Throughput (bps)
Avg Outbound Throughput (bps)
MAX(Network.Outbound.Throughput.bps)
AVG(Network.Outbound.Throughput.bps)
Outbound Throughput (bps) Trend OutboundThroughputbpsTrendStore Network.Outbound.Throughput.bps
Outbound Unicast (pps) Bar Top5OutboundUnicastppsStoreBar Max Outbound Unicast (pps)
Avg Outbound Unicast (pps)
MAX(Network.Outbound.Unicast.pps)
AVG(Network.Outbound.Unicast.pps)
Outbound Unicast (pps) Grid Top5OutboundUnicastppsStoreGrid Max Outbound Unicast (pps)
Avg Outbound Unicast (pps)
MAX(Network.Outbound.Unicast.pps)
AVG(Network.Outbound.Unicast.pps)
Outbound Unicast (pps) Trend OutboundUnicastppsTrendStore Network.Outbound.Unicast.pps
Outbound Utilization (%) Bar Top5OutboundUtilizationPercentStoreBar Max Outbound Utilization (%)
Avg Outbound Utilization (%)
MAX(Network.Outbound.Utilization.Percent)
AVG(Network.Outbound.Utilization.Percent)
Outbound Utilization (%) Grid Top5OutboundUtilizationPercentStoreGrid Max Outbound Utilization (%)
Avg Outbound Utilization (%)
MAX(Network.Outbound.Utilization.Percent)
AVG(Network.Outbound.Utilization.Percent)
Outbound Utilization (%) Trend OutboundUtilizationPercentTrendStore Network.Outbound.Utilization.Percent
Packet Health Summary PacketHealthSummaryStore Sum Inbound Packets
Sum Inbound Errors (Packets)
Sum Inbound Discards (Packets)
Sum Outbound Packets
Sum Outbound Errors (Packets)
Sum Outbound Discards (Packets)
Sum Unknown Protocols (Packets)
SUM(Network.Inbound.Packets.Count)
SUM(Network.Inbound.Errors.Count)
SUM(Network.Inbound.Discards.Count)
SUM(Network.Outbound.Packets.Count)
SUM(Network.Outbound.Errors.Count)
SUM(Network.Outbound.Discards.Count)
SUM(Network.Unknown.Protocols.Dropped.Count)
498 IBM Telco Network Cloud Manager - Performance 1.4.5

Widget name Data definition Metric display name Actual metric name
Packet Throughput Summary PacketThroughputSummaryStore Max Inbound Unicast (pps)
Avg Inbound Unicast (pps)
Max Inbound Multicast (pps)
Avg Inbound Multicast (pps)
Max Outbound Broadcast (pps)
Avg Outbound Broadcast (pps)
Max Outbound Unicast (pps)
Avg Outbound Unicast (pps)
Max Outbound Multicast (pps)
Avg Outbound Multicast (pps)
Max Inbound Broadcast (pps)
Avg Inbound Broadcast (pps)
MAX(Network.Inbound.Unicast.pps)
AVG(Network.Inbound.Unicast.pps)
MAX(Network.Inbound.Multicast.pps)
AVG(Network.Inbound.Multicast.pps)
MAX(Network.Inbound.Broadcast.pps)
AVG(Network.Inbound.Broadcast.pps)
MAX(Network.Outbound.Unicast.pps)
AVG(Network.Outbound.Unicast.pps)
MAX(Network.Outbound.Multicast.pps)
AVG(Network.Outbound.Multicast.pps)
MAX(Network.Outbound.Broadcast.pps)
AVG(Network.Outbound.Broadcast.pps)
Top 10 Inbound Errors (Packets) Top10InboundErrorsPacketsStore SUM(Network.Inbound.Errors.Count)
Top 10 Inbound Utilization (%) Top10InboundUtilizationPercentStore MAX(Network.Inbound.Utilization.Percent)
Top 10 Outbound Errors (Packets) Top10OutboundErrorsPacketsStore SUM(Network.Outbound.Errors.Count)
Top 10 Outbound Utilization (%) Top10OutboundUtilizationPercentStore MAX(Network.Outbound.Utilization.Percent)
Unknown Protocols (Packets) Trend UnknownProtocolsPacketsTrendStore SUM(Network.Outbound.Discards.Count)
Creating custom dashboards with the predefined components
You can mix and match the ready to use widgets and create a custom dashboard according to your use case.
Scenarios for the usage of predefined dashboard components
Some useful network data monitoring scenarios and step by step instructions to create or use the predefined or custom dashboards and widgets for these scenarios
are provided.
Creating custom dashboards with the predefined components
You can mix and match the ready to use widgets and create a custom dashboard according to your use case.
About this task
Follow these steps to access and use the predefined widgets in dashboards:
Important: You can add the predefined or custom widgets to a dashboard and publish the dashboard to an existing or new menu. Or, you can attach the widgets directly to
an existing or new menu and publish to Engine.
Procedure
1. Access the Dashboard Designer.
2. Click Widgets > Custom > View All Custom widgets.
IBM Telco Network Cloud Manager - Performance 1.4.5 499

You can see the following categories of custom or predefined widgets:
3. Create a dashboard with a layout based on the number of widgets that are needed for the use case.
a. In the left navigation pane of Dashboard Designer, click Dashboards, and then click Create New Dashboard.
The Create a New Dashboard: Select a layout window is displayed.
For more information about default layouts and creating custom layouts, see Layouts.
b. In the Create a New Dashboard: Select a layout window, click a layout, and then click Select.
The selected layout opens in a new New Dashboard page.
c. Click the Edit icon that is displayed next to the New Dashboard and Sub Title fields, and enter a name and sub title for your dashboard.
Note: Only alphanumeric characters, spaces, and underscore are supported.
d. The Show Gridlines checkbox is selected by default.
If you do not want the grid-lines view, clear the checkbox.
e. The Filter Area checkbox is selected by default.
If you do not want the filter area to be displayed, clear the checkbox.
f. To add multiple widget placeholders or charts within a widget of a dashboard, see Creating a multi-chart widget.
g. In the left navigation of Dashboard Designer, click Widgets > Custom, expand a widget category, and drag a custom widget or a custom widget template to
the widget area.
4. To add default or custom filters to the dashboard, in the left navigation pane of Dashboard Designer, click Filters, and complete any of the following steps:
Expand Default, and drag one or more filters to the filter area of the dashboard.
Expand Custom, and expand any of the listed custom categories, and drag one or more custom filters to the filter area of the dashboard.
5. Optional: After you add widgets to a dashboard, you can click the Set Relation icon to set relations between the widgets.
For more information about setting relations, see Setting relations.
6. To save the dashboard, click Save.
7. After you save a dashboard, to preview it, click the Preview icon.
8. Attach the dashboard to an existing menu or create a new menu and publish the menu and the dashboard.
See Menu Access.
Publishing a predefined widget
You can directly publish the custom widgets without attaching them to a menu. These published widgets can then be added to an already published predefined
dashboard from the Telco Network Cloud Manager - Performance Dashboards.
Related tasks
Creating a dashboard
Publishing a predefined widget
You can directly publish the custom widgets without attaching them to a menu. These published widgets can then be added to an already published predefined dashboard
from the Telco Network Cloud Manager - Performance Dashboards.
Procedure
1. Access the Dashboard Designer tool.
2. Click Widgets > Custom > View All Custom Widgets.
3. Select the widget that you want to publish and click Publish.
500 IBM Telco Network Cloud Manager - Performance 1.4.5

4. Select the user groups that must have access to this widget from the User Groups pane and click the Move to selected icon ( ) to move user groups to
Selected User Groups pane.
5. Click Publish and click Ok.
You can see the published widget from any dashboard that is available from reporting interface.
6. Log in to TNCP reporting interface.
7. Select any custom dashboard from the menu and click the Add Widgets icon ( ) to see the newly published widget.
You can add this widget to the dashboard as described in Scenario 2 - Add different predefined widgets to an existing predefined dashboard.
Scenarios for the usage of predefined dashboard components
Some useful network data monitoring scenarios and step by step instructions to create or use the predefined or custom dashboards and widgets for these scenarios are
provided.
Managing and monitoring basic performance indicators of network devices are one of the key roles for an OSS Engineer. The interface traffic metrics such as throughput
(bps), packet dropped, and packet errors of these network devices are vital in ensuring early detection of problem in their network. The dashboards and widgets are
readily available in Dashboard Designer tool and can either be previewed inside tool or published to the Dashboard page.
You can also create your own dashboards by dragging the widgets and associated filters or edit existing predefined dashboards.
You can use the predefined widgets in the following scenarios:
Scenario 1 - Create the custom dashboards by dragging the predefined widgets to a dashboard layout, preview, and publish to an existing menu or to a new menu.
Scenario 2 - Add different but complementary widgets to an existing predefined dashboard.
Scenario 3 - Add or remove custom widgets to an already published dashboard.
Scenario 4 - Add new metrics to an existing custom dashboard.
Scenario 1 - Create a custom dashboard with predefined widgets
Use case description
As an OSS Engineer, you want to create custom dashboard by using the predefined widgets to monitor the device health.
In this scenario, you can develop a summary dashboard by combining device metrics from vendor-specific health and interface metrics from MIB-II. You can either
choose from default layout or create custom layout and drag the predefined grid widgets to each section in the layout. To complete the dashboard, drag the
following filters for summary-related data.
DeviceName
timePeriod
Dashboard creation tasks
1. Access the Dashboard Designer tool.
2. Select and use the default 2X2 Layout to create a dashboard.
3. Create a dashboard with by dragging the following custom widgets:
CPU Utilization (%) Summary
Inbound Discards (Packets)
Top 10 Inbound Errors (Packets)
Top 10 Outbound Errors (Packets)
4. Specify the name of the dashboard as Device Health Summary Dashboard.
5. Add the following filters to the dashboard:
DeviceName
timePeriod
6. Click Save and click the Preview icon.
IBM Telco Network Cloud Manager - Performance 1.4.5 501

7. Build a menu and add the Device Health Summary Dashboard dashboard to the menu.
8. View the dashboards from TNCP Dashboards interface.
Scenario 2 - Add different predefined widgets to an existing predefined dashboard
Use case description
As an OSS Engineer, you want to monitor a problematic interface by analyzing the trend of packets dropped, throughput, and utilization for the last hour.
Currently, the predefined dashboards are created based on common metric types. For example, packet-related metrics are combined into a single dashboard
whereas the octets-related metrics are in a separate report. If an interface utilization is high, you must monitor for packet loss during the same timestamp so that
you can take further action.
For this scenario, the existing Bit Throughput (Octets) Details dashboard is modified by removing two utilization trend widgets and replacing with two packets trend
widgets. To complete the dashboard, drag the following filters for trend-related data.
DeviceName
timePeriod
Dashboard creation tasks
1. Access the Dashboard Designer tool.
2. Click Dashboards > Manage Dashboards
3. Select networ-health-generic from the list in the All Dashboards page.
4. Select the Bit Throughput (Octets) Details dashboard from the list and click View/Edit icon from the Actions pane.
5. Remove the following dashboards from the dashboard:
Inbound Utilization (%) Trend
Outbound Utilization (%) Trend
6. Add the following dashboards from Widgets > Custom > network_health-generic:
Inbound Packets Trend
Outbound Packets Trend
7. Rename the dashboard as Custom Interface Traffic Details.
8. Make sure that the following filters are available in the dashboard:
DeviceName
entityName
timePeriod
9. Click Save and click the Preview icon.
502 IBM Telco Network Cloud Manager - Performance 1.4.5

10. Build a menu and add the Interface Packets and Octets Details dashboard to the menu.
11. View the dashboards from TNCP Dashboards interface.
Scenario 3 - Add new widgets to an already published dashboard
Use case description
IBM Telco Network Cloud Manager - Performance 1.4.5 503

As a dashboard user, you want to add widget into a dashboard that is published to a dashboard. Click the add widget icon and search for a widget that you want to
add or replace.
Note: Make sure that the widget is already published. See Publishing a predefined widget.
In this scenario, the Device Health Summary Dashboard dashboard that is published is selected from the reporting interface and modified by removing two existing
widgets and adding two new published widgets.
Custom widgets added
Inbound Discards (Packets)
Outbound Discards (Packets)
Dashboard creation tasks
1. Log in to the reporting interface.
2. Navigate to the Device Health Summary Dashboard dashboard that you want to customize from Infra > Device > Device Monitoring.
The Device Health Summary Dashboarddashboard that is published in scenario 1 opens.
3. Click the Add Widgets icon .
4. Drag the following widgets to the dashboard from the network_generic_health category:
Outbound Discards (Packets) Bar
Inbound Discards (Packets) Bar
Note: Only the published widgets are displayed in this view.
5. Click the Save this view icon ( ) to save the updated dashboard.
504 IBM Telco Network Cloud Manager - Performance 1.4.5

6. Optional, click the Reset view icon to discard the changes.
Scenario 4 - Add new metrics to a predefined dashboard
Use case description
As a dashboard user, you want to view summary of top five total packets, total errors, and total discard packets. Since summary of top five errors and discards is
part of predefined widgets, you might want to create a new widget to show summary of top five total packets and its corresponding data definition by using the
existing predefined components.
Dashboard creation tasks
1. Create new data definition for the new metric by modifying the predefined data definition.
Access the Dashboard Designer tool.
Click Data Definitions > Custom > Manage Data Definitions.
You can see the available data definitions from network_health_device and network_health_generic categories in the All Data Definitions page.
Select the Top5OutboundDiscardsPacketsBarStore and click View/Edit icon ( ).
Click Save As and rename the data definition to Top5OutboundTotalPacketsBarStore and save it to a new category.
IBM Telco Network Cloud Manager - Performance 1.4.5 505

Edit the content in the URI field to modify the Network.Outbound.Discards.Count metric to Network.Outbound.Packets.Count metric and
it's sort metric.
Old
/service/dataset/metric/summary?parentNames={DeviceName}&metrics=SUM(Network.Outbound.Discards.Count)
&start={timeFrom}&end={timeTo}&count=5&properties=displayName&sort=-SUM(Network.Outbound.Discards.Count)
&suppressSummary=true&flatten=true&metricDoubleValue=true
New
/service/dataset/metric/summary?parentNames={DeviceName}&metrics=SUM(Network.Outbound.Packets.Count)
&start={timeFrom}&end={timeTo}&count=5&properties=displayName&sort=-SUM(Network.Outbound.Packets.Count)
&suppressSummary=true&flatten=true&metricDoubleValue=true
Click Save and close.
2. Customize an existing widget and add the new Top5OutboundTotalPacketsBarStore data definition to it.
3. Click Set Properties icon
4. In the WIDGET tab, click TITLE BAR and change the title to Outbound Total Packets Bar.
5. In the CHART tab, click SERIES > SERIES and change the value in the Y-axis Values to SUM(Network.Outbound.Packets.Count)
6. Click Save As to save the widget with the name Outbound Total Packets Bar to a new category.
7. You can either publish the widget to be used in another published widget, or you can create a dashboard to add this widget.
See Publishing a predefined widget.
Themes
Use Dashboard Designer to create, preview, modify, copy, delete, or deploy custom themes. You can also view the default themes in Dashboard Designer, but cannot
modify, delete, or deploy them. Both the default and the custom themes can be applied to Engine only. You cannot apply these themes to the Dashboard Designer. The
default themes along with the deployed custom themes are displayed on Engine.
Each default or custom theme displays a theme icon that is prefixed to the theme name. All the default and custom themes are available to all the Dashboard Designer
users, irrespective of their Tool Content Groups. However, Engine users can view only the default themes and the deployed custom themes, irrespective of their Engine
User Groups.
Default Themes
The following are the default themes that are displayed in Dashboard Designer and Engine:
Carbon
Charcoal
Classic
Daisy
Indigo
Jade
Pearl
Scarlet
Sepia
Custom Themes
You can create your own themes and deploy them to Engine. These published themes are displayed along with the default themes on Engine and can be applied to the
Engine user interface only.
You can create a custom theme and define the following components of a dashboard:
506 IBM Telco Network Cloud Manager - Performance 1.4.5

Font
Specify a global font that must be used for any text that is displayed on the dashboard.
Background color for the layout
Specify the background color that must be used for the headers, footers, menus, pages, and filters.
Background color for the widget
Specify the background color that must be used for every widget and pop-up window. You can also specify the chart colors that must be used for every chart within
the widgets.
The Preview pane in the New Theme window of the Dashboard Designer displays the preview of your custom themes.
Creating and deploying a theme
Use Dashboard Designer to create and deploy custom themes.
Managing custom themes
You can view, search, modify, copy, or delete themes.
Creating and deploying a theme
Use Dashboard Designer to create and deploy custom themes.
Before you begin
All the Dashboard Designer users can create themes.
However, only users with Publisher, Menu Administrator, and System Administrator roles can deploy the themes to Engine.
About this task
The font, chart, and background colors that you select for layout and widget elements are displayed in the Preview pane in the New Theme window. At any point of custom
theme creation, you can click Reset to Classic to reset your selections to the default Classic theme.
Procedure
To create a custom theme, complete the following steps:
1. Log in to Dashboard Designer.
2. Click the Expand icon to open the left navigation pane of Dashboard Designer and click Themes > Custom > Create New Theme.
The New Theme page opens.
3. Click the Edit Theme Name icon that is displayed next to the New Theme field and enter a name for your custom theme.
Note: Only alphanumeric characters, spaces, and underscore are supported.
4. To define a font to be used for all the text elements of the dashboard, click GLOBAL FONT, and from the Font list, select a font.
The Preview pane displays all the text elements in the selected font.
To reset your font selection to the default Classic theme font, click the Reset icon that is displayed next to GLOBAL FONT.
5. To specify background colors for the headers, footers, menus, pages, and filters, click LAYOUT BACKGROUND, and complete the following steps for the Header and
Menu, Page, Filter, and Footer:
a. Click the colored list box next to each item.
The Color window is displayed.
b. Select a color and click OK.
To reset your selections to the default Classic theme color pattern, click the Reset icon that is displayed next to LAYOUT BACKGROUND.
The Preview pane displays all the layout components in the selected colors.
6. To specify background colors for widgets and pop-windows, and to specify chart colors, click WIDGET BACKGROUND / CHARTS and complete the following steps
for Widget and Chart color:
a. Click the colored list box next to each item.
The Color window is displayed.
b. Select a color and click OK.
c. To add more chart colors, under Chart color, click the Add a color icon.
d. To delete a chart color, click the Delete icon.
To reset your selections to the default Classic theme color pattern, click the Reset icon that is displayed next to WIDGET BACKGROUND / CHARTS.
The Preview pane displays all the widget components in the selected colors.
7. To view the font, chart, and background color for the Engine pop-up windows, complete the following steps in the Preview pane:
a. Select the Show pop-up window checkbox.
b. To close the pop-up window, clear the Show pop-up window checkbox.
8. To save the theme, click Save.
9. In the Save Theme window, complete the following steps:
In the Theme Name field, enter a name for the theme, and click Save
To save the custom theme with another name, click the Save As option.
10. Click the Deploy icon to deploy the theme on Engine.
IBM Telco Network Cloud Manager - Performance 1.4.5 507

A message indicating that the theme is deployed successfully is displayed.
Results
The newly created theme is listed under Most Recently Created Themes in the navigation pane on Dashboard Designer.
What to do next
You can view, edit, or delete the custom themes. You can also create a copy of a theme. For more information, see Managing custom themes.
Managing custom themes
You can view, search, modify, copy, or delete themes.
About this task
Any Dashboard Designer user can create and manage themes.
Procedure
Viewing, copying, deleting, or searching the existing themes.
To view, copy, delete, or search the custom themes, complete the following steps:
1. In the left navigation pane of Dashboard Designer, click Themes > Custom > Manage Themes.
An All Themes page opens in a new tab. The page displays all the already created custom themes.
2. Complete any of the following steps:
To find a theme, enter the name of the theme in the Search field.
To delete a custom theme, either select the theme and click the Delete button, or click the Delete icon on the theme row.
To delete multiple custom themes, select the themes that you want to delete, and then click the Delete button.
To create a copy of a custom theme, click the Copy icon on the theme row. In the Create Copy window, complete the following steps:
In the Name field, enter a new unique name for the theme. You can use alphanumeric characters, spaces, and underscore in the theme name.
To save the theme copy, click Save.
Modifying a theme.
To modify a theme, complete the following steps:
1. In the All Themes page, click the View/Edit icon that is displayed on the theme row.
The theme opens in a new tab. The page displays the theme name.
2. To modify the name of a theme, click the Edit Theme Name icon that is displayed next to it, and enter a name.
3. To change the existing font, background colors for charts, pop-up window, widgets, and widget elements, see Creating and deploying a theme.
Menu Access
To publish dashboards, you must add them to a menu. You can publish a menu to Telco Network Cloud Manager - Performance Engine. A menu contains two types of
nodes, category nodes and dashboard nodes. A menu can host multiple dashboards that are categorized by using category nodes.
Important: The Telco Network Cloud Manager - Performance has ready-to-use built-in dashboards. You must publish these ready-to-use dashboards menus to Telco
Network Cloud Manager - Performance Engine. See, Optional: Publishing Telco Network Cloud Manager - Performance Dashboards menus.
Use category nodes to group similar dashboards together in a single category. A single category node can host two dashboard nodes.
Category nodes
You can publish a menu only when it contains either a single category node or multiple category nodes. You cannot add dashboards and user groups directly to a
category node. You must add a dashboard node to a category node. You can add only two dashboard nodes to a single category node.
Dashboard nodes
To each dashboard node, you can add only a single dashboard. However, you can add multiple Engine User Groups to a dashboard node.
After you publish a menu, you must use Telco Network Cloud Manager - Performance Engine to access the published dashboards.
Adding new menu item to Home menu
If you create a new dashboard and want to attach it to the default Home menu, use these steps. Home menu is the alias name.
Managing menus
You can view, search, modify, or delete menus. You can also modify or delete category nodes and dashboard nodes within a menu.
Adding new menu item to Home menu
508 IBM Telco Network Cloud Manager - Performance 1.4.5

If you create a new dashboard and want to attach it to the default Home menu, use these steps. Home menu is the alias name.
About this task
After you create the dashboard with all its components, you must add it to a menu and publish it to be able to view it on Engine user interface with in the existing
navigation.
CAUTION:
If you create a new menu with your custom dashboards and publish it, it replaces the default Home menu.
Procedure
1. Log in to the Dashboard Designer.
2. In the navigation pane of Dashboard Designer, click Menu Access.
You can see the default Home menu.
3. Click Home and wait for the menu to load.
4. Right-click on the last category node, and select Add Sibling to add new category node.
5. Right-click the new category node, and select Add Child, and enter a name for the dashboard node.
6. To add Engine User Groups and a dashboard to a dashboard node, complete the following steps:
a. In the Dashboards tab on the right, expand the dashboard categories, and drag the dashboard that you want to add to the dashboard node.
Note: The Dashboards tab displays only those dashboards that are in complete state. You can add only one dashboard per dashboard node.
The dashboard is added to the dashboard node, and the color of the dashboard icon on the dashboard node changes to blue.
b. To add Engine User Groups, in the User Groups tab on the right drag a user group that you want to add to a dashboard node.
Currently, for default Home menu, you can use npiadmin alone as the user group.
7. Click Save.
8. Click Publish and select Publish Menu and Dashboards
What to do next
After you publish a menu, you must log in to Engine and view the published dashboards. See, Getting started with the Dashboard Designer.
Managing menus
You can view, search, modify, or delete menus. You can also modify or delete category nodes and dashboard nodes within a menu.
About this task
Users with a Menu Administrator role or System Administrator role can modify, delete, and publish menus only when they have access to an Engine instance and
one or more Engine User Groups.
Procedure
Viewing, deleting, or searching the existing menus.
To view, delete, or search the existing menus, complete the following steps:
1. In the left navigation pane of Dashboard Designer, click Menu Access > Manage Menus.
An All Menus page opens in a new tab. The page displays all the already created menus.
2. Complete any of the following steps:
To view category nodes or dashboard nodes within a menu, click the View/Edit icon that is displayed on the menu row.
To delete a menu, either select a menu and click the Delete button, or click the Delete icon on the menu row.
To delete multiple menus, select the menus that you want to delete, and then click the Delete button.
To find a menu, enter the name of the menu in the Search field.
Renaming existing menus and nodes.
To rename a menu, category node, or dashboard node, complete the following steps:
1. In the All Menus page, click the View/Edit icon that is displayed on the menu row.
The menu opens in a new tab. The page displays the menu name, and all its category and dashboard nodes.
2. To modify menu name, click the Edit Menu Name icon, enter a name, and then click Save.
3. To modify name of a category node or a dashboard node, right-click the node that you want to modify, click Rename, enter a name, and then click Save.
Adding, deleting, or modifying category nodes or dashboard nodes.
To add, delete, or modify a category node or a dashboard node within a menu, complete the following steps:
1. In the All Menus page, click the View/Edit icon that is displayed on the menu row.
The menu opens in a new tab. The page displays the menu name, and all its category and dashboard nodes.
2. Complete any of the following steps:
To add category nodes, right-click a category node, click Add Sibling, and enter a name for the category node.
IBM Telco Network Cloud Manager - Performance 1.4.5 509

To add dashboard nodes, right-click a category node, click Add Child, and enter a name for the dashboard node.
To add user groups to a dashboard node, in the User Groups tab on the right, drag a user group that you want to add to the dashboard node.
The user groups are added to the dashboard node, and the color of the user group icon on the dashboard node changes to blue. The icon also
displays the number of user groups that are added to the dashboard node.
Note: You can add multiple user groups to a dashboard node.
To delete a user group from a dashboard node, click the user group icon on the dashboard node, and in the pop-up User Groups window, click
the Delete icon that is displayed next to the user group that you want to delete. The user group is deleted.
To delete a dashboard from a dashboard node, click the Dashboard icon on the dashboard node, and in the pop-up Dashboard window, click the
Delete icon. The dashboard is deleted.
To delete a category node or dashboard node, right-click a node and click the Delete icon.
Note: To delete a category node, you must first delete the dashboard nodes that are attached to it, and then delete the category node.
3. To save the changes, click Save.
Replacing dashboard on a dashboard node.
To replace an existing dashboard on a dashboard node with another dashboard, complete the following steps:
1. Click the View/Edit icon that is displayed on the menu row.
The menu opens in a new tab. The page displays the menu name, and all its category and dashboard nodes.
2. On a dashboard node, click the Dashboard icon, in the pop-up window that is displayed, click the Delete icon.
3. On the confirmation message window, click Ok.
The color of the Dashboard icon on the dashboard node changes to gray, as it does not contain any dashboard.
4. In the Dashboards tab on the right, expand the dashboard categories, and drag the dashboard that you want to add to the dashboard node.
Note: The Dashboards tab displays only those dashboards that are in complete state. You can add only one dashboard per dashboard node.
The dashboard is added to the dashboard node, and the color of the Dashboard icon on the dashboard node changes to blue.
5. Click Save.
Managing Engine user interface
After you publish menus or widgets in Dashboard Designer, the dashboards and widgets are displayed on Telco Network Cloud Manager - Performance Engine.
Use Engine to complete the following tasks:
View dashboards
Important: Every new menu that is published by using Dashboard Designer overwrites the existing menu and its dashboards that are displayed on Engine. If a menu with
multiple category nodes and multiple dashboard nodes is published, then each category node is displayed separately on the menu bar. Click each category node to view a
list of all its dashboard nodes, and select an individual dashboard node that you want to view.
Access to the published dashboards is based on Engine User Groups. Engine users can view only those dashboards that are assigned to their Engine User Groups. For
example, if you are assigned to two Engine User Groups, then you can access all the dashboards that are assigned to those groups only.
View embedded websites or web applications
If an external website or web application is embedded within a dashboard, then whenever you preview or publish the dashboard, the external website or web application
is displayed on Engine. The rendering of the website in a widget is based on the responsive design of the website or web application.
Create Free Form dashboards
Every user can customize the layouts of widgets within a dashboard and save such dashboards as dashboard views. You can also modify the dashboard view. The
dashboard view is user-specific. You cannot view or modify any dashboard view that is created by other users, even if you belong to same Engine user groups.
Note: You cannot create and save a dashboard view if the dashboard contains a multi-chart widget.
After dashboards and widgets are published, you can view individual dashboards, and complete any of the following tasks on each dashboard to customize its view. You
can save the view as a dashboard view.
Drag one or more published widgets from the Widget pop-up window to a dashboard.
Note:
A multi-chart widget cannot be published independently and hence, it is not displayed in the Widget pop-up window.
To add a published widget to a dashboard, you must drag-and-drop the published widget over any widget other than the widget that contains an embedded
website or web application.
Delete one or more published widgets that are added to a dashboard.
Note: You can delete the published widgets only. The built-in dashboard widgets cannot be deleted.
Resize or rearrange the published widgets and the built-in dashboard widgets.
Note: You cannot resize the widget to a width or height that is smaller than 130 pixels.
Change chart types in any of the published widgets and the built-in dashboard widgets.
However, you can save only one such view of every dashboard. You cannot create and save multiple dashboard views for a single dashboard.
You can also reset the dashboard to its original state. On reset, all the published widgets that you added to the dashboard are deleted, and the chart type, widget resize,
and widget rearrange changes are reverted.
Note: Dashboard-level filters and widget-level filters are not supported in saved dashboard view.
510 IBM Telco Network Cloud Manager - Performance 1.4.5

For example, after you filter the dashboard data by applying dashboard-level filters or widget-level filters, if you save that dashboard view. Then, whenever you open such
a dashboard, it displays data values according to the default dashboard-level filters.
Export dashboards and widgets, and set export preferences
You can export dashboards to PDF, XLS, and CSV file formats. You can set the following preferences for the exported reports:
Define a format for the exported PDF and CSV reports.
Include or exclude date, time, legends, page numbers, or user ID, and also specify their position and alignment within the report.
Enable password protection for the reports, and specify the password that must be used to open the report.
Note: If a real-time widget in a dashboard does not display any data, then XLS and CVS reports are not downloaded. Also, the PDF report that is downloaded does not
display any data.
Filter data by using dashboard-level filters and widget-level filters
Both dashboard-level filters and widget-level filters can be applied only if they are mapped to widgets. You can use widget-level filters and dashboard-level filters in the
following ways:
Use dashboard-level filters to filter data across all the widgets within the dashboard.
For example, if a dashboard contains six widgets, of which four are mapped to dashboard-level filters and the remaining two widgets are not mapped. Then,
whenever you apply dashboard-level filters, data is filtered only for those four widgets within the dashboard.
Use widget-level filters to filter individual widget data. Data in the other widgets remains unaffected.
If you use same filters at dashboard-level and widget-level, then data is filtered based on the latest filter that is applied. So, if you first apply widget-level filters, the
widgets display data according to the applied widget-level filters, and then if you apply dashboard-level filters, all the widgets display data according to the applied
dashboard-level filter, and vice versa.
For example, if a dashboard contains three widgets, of which one widget contains Datetime and Interval filters, and the same filters are also present at
dashboard-level. When you apply a filter at the dashboard-level, all the three widgets display data according to the applied dashboard-level filter. If you apply a
widget-level filter to filter data by using a different time range, then that widget displays data according to the conditions selected in its widget-level filter. The
remaining two widgets display data that is filtered according to the dashboard-level filter. However, now, if you again apply a dashboard-level filter, then all the
widgets display data that is filtered according to the applied dashboard-level filter.
If you use same filters at dashboard-level and widget-level, and set auto-refresh interval for the dashboard, then at every refresh, dashboard-level filters override
the widget-level filters. So, all the widgets display data according to the filter condition selected in dashboard-level filter.
If you use different filters at dashboard-level and widget-level, and set auto-refresh interval for the dashboard, then at every refresh, the widgets with widget-level
filters display data according to the filter conditions selected in the widget-level filter. All the remaining widgets display data according to the filter condition
selected in the dashboard-level filter.
Maximize or minimize widgets and set auto-refresh interval
You can maximize and minimize individual widgets within a dashboard, and set an auto-refresh time interval for the dashboard. The dashboard data is refreshed at the
defined time-interval.
Set themes
You can customize your Engine view by applying a default or a custom theme to the dashboards.
Classic is the default theme for Engine. However, you can replace this theme with any other default or custom theme of your choice.
Email dashboard PDF
You can email a dashboard as a PDF attachment to a user. If you want the dashboard to display some specific data, then you must apply dashboard-level or widget-level
filters to the dashboard before you send it out as an attachment.
View drill-down dashboard, listener widget, or drill-down URL
A Drill down icon on a widget within a dashboard indicates that a drill-down dashboard is attached to it.
Similarly, a Drill down URL icon indicates that a drill-down web page URL is attached to the widget. If a static drill-down URL is attached to the widget, then when you
click any data point in the widget, the attached web page is displayed. However, if a dynamic drill-down URL is attached, then whenever you apply page-level and widget-
level filters to the source widget, and click a data point on the source widget, an external URL is generated and launched. The search string values that are mapped in the
dynamic drill-down URL are replaced with the actual widget data and filter values in the external URL.
For example, the following drill-down URL is an example of a dynamic drill-down URL that is attached to a source widget, and the external URL is an example of an external
URL that is launched after you apply filters to the same source widget and click a data point on the source widget:
Drill-down URL that is added to the source widget :
https://www.example.com/search?q={System name} and {Timestamp} and {Aggregation} and
{Datetime} and {Interval} and {Summarization}
External URL that gets launched from the source widget:
https://www.example.com/search?q=System 23 and 18 Jun 13:38 and avg and
CURRENT_TIME and -1H and 5m
Where,
{System name} is the Y-axis value and {Timestamp} is the X-axis value of the source widget.
In the dynamic URL, these values are added as search strings.
IBM Telco Network Cloud Manager - Performance 1.4.5 511

In the external URL, the search string values are replaced with the actual values. {System name} is replaced with System 23 and {Timestamp} value is
replaced with 18 Jun 13:38.
{Aggregation}, {Datetime}, {Interval}, and {Summarization} are the filters that are attached to the source widget.
In the dynamic URL, these values are added as search strings.
In the external URL, the search string values are replaced with the actual values:
{Aggregation} is replaced with avg
{Datetime} is replaced with CURRENT_TIME
{Interval} is replaced with -1H
{Summarization} is replaced with 5m
The replacement of search string values in the external URL is governed by the following rules:
Search string replacement is case-insensitive, and the entire word is matched along with spaces and characters. So, if you enter a search value that is in uppercase
or lowercase or combination of both uppercase and lowercase, the corresponding widget value is replaced in the external URL. However, when the search string
value is incorrect and does not match with column names or filters, then the search string is appended to the external URL, and the web page is not displayed.
If {Datetime} is used as a search string, then based on the filter that you apply to the source widget, the external URL displays either CURRENT_TIME or the
actual custom value range that is selected in the widget.
If the search string does not have any value, then an empty string is displayed in the external URL, and the web page might not be displayed.
If a widget-level filter is named same as the page-level filter, then the external URL displays the values of the page-level filter only. However, if you apply a widget-
level filter just before you launch an external URL, then the external URL displays the widget-level filter value because that is the latest filter that is applied to the
widget.
If a page-level filter, widget-level filter, and a column name (X-axis or Y-axis label) share a common name, then the URL displays the column name value only.
For Time Series and Bar charts, if you change the chart type to Grid, and then view the drill-down URL, the URL might not display search string values for Y-axis
label and legend.
To view a drill-down URL that is added to an existing master-listener relation and that contains search string values of both master and listener widgets, you must
first click a data point on the master widget to view its listener widget, and then click a data point on the listener widget to view its drill-down URL. By doing so, the
external URL displays both the search string values. However, if you directly click a data point on the listener widget without viewing the master-listener relation
first, then the external URL displays only the listener widget's value.
Schedule tasks
You can schedule tasks to generate and email dashboard reports at a defined time interval. You can schedule one or more tasks for each dashboard node. A report is
generated and emailed for each dashboard node.
Note:
A report that is generated for a drill-down dashboard might not display data. This data display is based on whether the default parameter is mapped while setting
the drill-down relation. If the default parameter is mapped, then the report displays data. However, if the default parameter is not mapped then the data is not
displayed.
For information about creating a drill-down relation and mapping default parameters, see Setting relations.
If all the widgets within a dashboard contain an embedded website or web application, then you cannot schedule a task for such a dashboard.
You can define the following parameters for each schedule task:
Specify a format in which the dashboard report must be generated, either CSV, PDF, or XLS.
Note: The reports do not display any data for widgets that stream real-time data.
Add one or more email addresses to which the dashboard report must be emailed. The email addresses can belong to different domains.
Specify a subject line and message body for the email that is sent to users. The dashboard report is sent as an attachment in the email.
Specify schedule pattern for emailing the reports, either daily, weekly, monthly, or yearly.
Specify an end date for the scheduled tasks.
You can also view, edit, cancel, activate, reschedule, or delete the already scheduled tasks.
Viewing dashboards and widgets
You can view, export, email, auto refresh, and customize dashboards. You can also create Free Form dashboards, where you create, modify, save, or reset a
dashboard view. If dashboard-level and widget-level filters are provided, then you can use those filters to filter widget data. You can export the dashboards to PDF,
XLS, and CSV file formats.
Viewing dashboards and widgets
You can view, export, email, auto refresh, and customize dashboards. You can also create Free Form dashboards, where you create, modify, save, or reset a dashboard
view. If dashboard-level and widget-level filters are provided, then you can use those filters to filter widget data. You can export the dashboards to PDF, XLS, and CSV file
formats.
Before you begin
You can create, modify, and save or reset a dashboard view only for those dashboards that you can access. The access to dashboards is based on Engine user
groups that are assigned to you.
Also, the dashboard view that you create is accessible to you only and cannot be accessed by any other Engine user, irrespective of their User Groups.
You can email dashboard URLs to other Engine users only. Ensure that those users have access to the Engine User Group for which the dashboard is published. If
the users do not have access to the User Group, then they must contact the system administrator and get access to that Engine User Group.
About this task
You can create and save only one dashboard view per dashboard. Multiple dashboard views for a single dashboard are not supported.
512 IBM Telco Network Cloud Manager - Performance 1.4.5

If a dashboard contains a widget that hosts multiple widgets, then all the widgets in that host widget function as any other dashboard widgets. All the tasks that are
mentioned in the topic are also applicable to those widgets.
Procedure
Viewing dashboards, resizing or rearranging widgets, adding or deleting published widgets, and saving or restoring a dashboard view.
To view dashboards, resize or rearrange widgets, add one or more published widgets to a dashboard, and save or restore a dashboard view, complete the following
steps:
1. Log in to the Engine.
If a menu with multiple category nodes and multiple dashboard nodes is published, then each category node is displayed separately on the menu bar.
2. To view a dashboard that belongs to a category node, click the category node, and then click the dashboard node that you want to view.
The dashboard with all its widgets is displayed.
3. To add one or more published widgets to the dashboard, complete the following steps:
a. Click the Add widgets icon.
A WIDGETS pop-up window opens. It displays a categorical list of all the published widgets.
To view widgets that belong to a category, from the All Categories list, select a category.
To find a widget, enter the name of the widget in the Search field.
b. Expand a widget category and drag a widget to the dashboard.
Repeat this step to add multiple widgets to the dashboard.
c. Close the pop-up window.
d. To delete a published widget that you manually added, on the widget that you want to delete, click .
The widget is deleted.
Note: You can delete a manually added widget only.
4. To resize or rearrange widgets and to change chart types, complete the following steps:
To rearrange widgets within a dashboard, hover the cursor over the blank area between the widget title and widget icons. A drag cursor appears,
select the widget and drag it to the required area within the dashboard.
The widget is placed at the required area and all the other widgets are rearranged according to the available empty area.
To resize widgets within a dashboard, drag the widget boundary inwards or outwards.
You cannot drag the upper-boundary of the widget to resize it.
To change chart type, in the widget, click and select an appropriate option from the list to change the existing chart type.
Note:
For Bar, Time Series, and Pie chart categories, you can change a selected chart type with any of the other chart types within the same category
or to a Grid chart.
For example, if you add a Line chart, then you can change the Line chart to an Area chart.
Change chart type is not supported for Grid, Badge, and Complex Gauge charts.
All the remaining charts can be changed to Grid chart only. A Bubble chart can also be changed to a Scatter chart, only if numeric data is
displayed on X-axis and Y-axis.
5. After you add published widgets, resize or rearrange widgets, or change chart types, you can save the view as a dashboard view. Complete the following
steps to save or reset a dashboard view:
Click .
The dashboard view is saved. Whenever you open the dashboard, it is displayed in the saved view only. You can also modify a dashboard view by
rearranging or resizing its widgets, changing chart types, or by adding or deleting one or more published widgets.
To revert the dashboard to its original view, click .
On reset, all the published widgets that you added to the dashboard are deleted, and the chart type, widget resize, and widget rearrange changes are
reverted.
Filtering dashboard data by applying dashboard-level and widget-level filters, and setting auto refresh for the dashboards.
To filter dashboard data and set auto refresh, complete the following steps:
To filter data in all the widgets that are displayed on the dashboard, select filter conditions from the dashboard-level filters, and click Apply Filter.
Based on the supported and mapped filters, the widgets within the dashboard display data according to the selected filters. For more information, see
Filters.
Complete the following steps to apply a custom filter either at dashboard-level or widget-level:
1. From the Datetime list, select Custom.
2. In the Custom Time Period Selection window, select a start and end date, and start and end time.
3. Click Ok.
4. Click Apply Filter.
Data is filtered according to the selected filter conditions.
If widget-level filters are assigned to widgets, then click . In the pop-up window that opens, select filter conditions, and click Apply Filter.
The widget displays data according to the selected filters.
If PM filters are assigned to a widget, then the filter icon on the widget displays a check mark, , and the filter duration is displayed next to the widget-title.
If a widget title is truncated, then to view the widget title and the filter duration that is applied to a specific widget, you must hover the pointer over the
widget title.
For Grid charts, along with the widget-level filters, you can use column-filters to filter data column-wise. Complete the following steps to filter column data:
1. Click that is displayed on the column. A pop-up window opens.
2. From the drop-down list, select a filter condition, and enter a value for the selected condition.
Note: You can filter numeric values and text values by selecting appropriate conditions.
IBM Telco Network Cloud Manager - Performance 1.4.5 513

3. Click Apply Filter to filter the data that is displayed in the grid column.
4. Click Clear Filter and click Apply Filter again to clear the filter results.
Additionally, in Grid charts, to sort data in multiple columns, you must press the SHIFT key, and then click the columns that need to be sorted.
The lower left area in a widget displays check boxes for each metric. Select or clear the Legends check boxes for each metric to view data of a particular
metric or multiple metrics.
To turn on auto refresh for dashboards and widgets, click .
The color of the Refresh icon changes to gray.
Note:
Default refresh time is 1 minute.
Refresh fetches the latest available data for the selected data sources.
You can click the Refresh icon again to turn auto refresh off.
Exporting a dashboard as a CSV, XLS, or PDF file.
To export and save a dashboard as a CSV, XLS, or PDF file, complete the following steps:
1. Optional: If you want the saved files to display filtered data, then you must apply dashboard-level and widget-level filters.
2. Complete any of the following steps:
To export a dashboard as a CSV file, click , and then click CSV.
A single CSV file is created for every widget within the dashboard. This rule also applies to individual widgets hosted within a widget. Therefore, based
on the number of widgets, multiple CSV files are saved to your computer in a .zip format.
Extract the downloaded compressed file. The extracted files are plain text files. So, if a widget contains a background image, then the image is not
displayed. Each file contains dashboard name, widget names, and widget data or website URL. If dashboard-level and widget-level filters are
assigned, then those filters are also displayed. A website URL is displayed only when the dashboard contains a widget with an embedded web
application or website. The default data delimiter is pipe. You can open the CSV files by using an appropriate editor or import the files to excel by
specifying appropriate value separators.
Important: If the file is not downloaded to your computer, then check whether the software to block pop-up windows is enabled. You can add this site
to your exception list.
To export a dashboard as a PDF file, click , and then click PDF.
The exported PDF file contains dashboard name, widget names, time stamp, page number, user name, and widget data or website URL. If dashboard-
level and widget-level filters are attached, then those filters are also displayed. Background images are not displayed in the PDF file. A website URL is
displayed only when the dashboard contains a widget with an embedded web application or website. To view the widget-level filter, for Badge charts,
hover the cursor over the Badge title and for all the remaining charts, hover the cursor over the widget title.
To export a dashboard as an XLS file, click , and then click XLS.
The downloaded excel workbook displays data in multiple worksheets. For each widget within the dashboard, a worksheet is created. This rule also
applies to individual widgets hosted within a widget. Each worksheet displays, widget title, widget-level filter, and widget data or website URL. A
website URL is displayed only when the dashboard contains a widget with an embedded web application or website. The Details worksheet within the
workbook displays dashboard name, dashboard-level filter, and duration. If a widget contains a background image, then the image is not displayed in
the XLS file.
Viewing listener widget, drill-down dashboard, or drill-down URL.
To view drill-down dashboard, drill-down URL, or listener widget complete the following steps:
If a dashboard contains a drill-down dashboard attached to it, only then the master dashboard displays a Drill down icon.
Click any one of the metrics to view its drill-down dashboard. Only for Time Series markers charts, you need to double-click any one of the metrics to view its
drill-down dashboard.
A drill-down dashboard is displayed. From the drill-down dashboard, click to go back to its master dashboard.
If a widget within a dashboard contains a drill-down URL attached to it, only then the widget displays a Drill down URL icon.
Click any one of the metrics to view its related web page in a separate tab. Only for Time Series markers charts, you need to double-click any one of the
metrics to view the web page.
A drill-down URL can also be attached to a listener widget in a master-listener relation. Also, the drill-down URL can contain search string values that belong
to master widget and listener widget. To view such a drill-down URL, you must first click a data point on the master widget to view its listener widget, and
then click a data point on the listener widget to view its drill-down URL. By doing so, the external URL displays search string values of the listener widget and
master widget. However, if you directly click a data point on the listener widget without viewing the master-listener relation first, then the external URL
displays search string values of the listener widget only.
If master-listener relation is defined between widgets of a dashboard, then you must click any one of the metrics to view its listener widget. Only for Time
Series markers charts, you need to double-click any one of the metrics to view its listener widget.
Emailing dashboard PDF
To email a dashboard as a PDF file, complete the following steps:
1. Click icon, and then click Email Dashboard PDF.
Note: If you want the PDF to display some specific data, then you must first apply widget-level or dashboard-level filters, and then click Email Dashboard
PDF.
2. In the Email the PDF file window, enter a subject line, an email address, and a message, and then click Send.
Note:
Ensure that the email address is valid and in the correct format.
You must enter only one email address. This email address can also be a group email address.
514 IBM Telco Network Cloud Manager - Performance 1.4.5

Emailing dashboard URL
To email a dashboard URL, complete the following steps:
1. Click icon, and then click Email Dashboard URL.
2. In the Email Dashboard URL window, enter a subject line, email addresses, and a message, and then click Send.
Note: Ensure that the email addresses are valid and are in the correct formats.
A static hypertext link to the dashboard is emailed.
Emailing dashboard URL to link or embed.
To email a dashboard URL, either to launch it from an external application or to embed it in an external application, complete the following steps:
1. Click icon, and then click Email Dashboard URL to link or embed.
2. In the Email Dashboard URL to link or embed window, complete the following steps:
a. From the Generate a link list, select the required option.
b. Enter a subject line, email addresses, and a message, and then click Send.
Note:
Ensure that the email addresses are valid and are in the correct formats.
For PM or custom filters, the email recipients can either manually enter filter values in the dynamic URL before they access it or can select filter values
after the dashboard is launched. Ensure that the manually entered filter values are in the valid formats.
A dynamic URL of the dashboard is emailed.
Viewing widgets, and maximizing or minimizing widgets.
To view widgets, and minimize or maximize widgets, complete any of the following steps:
To collapse the widget, click .
To expand the widget, click .
To maximize the widget to the size of the page, click .
To restore the widget to its original size, click .
Report scheduling
You can define a schedule to generate dashboard reports in a specific format and email them to one or more email addresses at a defined time interval. You can also view,
edit, cancel, activate, reschedule, or delete the already scheduled tasks.
Before you begin
Only those Telco Network Cloud Manager - Performance Dashboards users who have access to Scheduler can create and manage Report scheduling for all the
dashboards that are deployed on Telco Network Cloud Manager - Performance Dashboards.
Check SMTP configuration that is used within your organization. You can send emails to one or more domains based on the SMTP configurations that are used
within your organization. The sole ownership of emailing reports to users, who are internal or external to your organization, lies with you. You must have
permissions, authorizations, and consents from users to use their email addresses. IBM® Telco Network Cloud Manager - Performance is not responsible for GDPR
compliance issues that are related to email addresses.
Configure scheduler and the SMTP server for email notifications. See, Report scheduler configurations.
About this task
You can perform the following tasks from the scheduling task page.
Go to Reporting > Report scheduling and select the DASHBOARDS tab.
You can create a schedule task for Telco Network Cloud Manager - Performance Dashboards.
If you have Scheduler access, then you can schedule tasks for all the dashboard nodes that are displayed on Telco Network Cloud Manager - Performance
Dashboards portal.
Go to Reporting > Report scheduling and select the SCHEDULE TASKS tab.
You can manage the scheduled tasks. After the tasks are scheduled, the page also displays the status of each task that is scheduled for each dashboard node. You
can view, edit, cancel, activate, reschedule, or delete the already scheduled tasks.
Scheduling tasks
Managing scheduled tasks
Related tasks
Managing scheduled tasks
Scheduling tasks
IBM Telco Network Cloud Manager - Performance 1.4.5 515

About this task
Complete the following steps to schedule tasks:
Procedure
1. Click Reporting > Report scheduling.
The DASHBOARDS tab displays a Dashboard Name column that lists all the dashboards that are deployed on Telco Network Cloud Manager - Performance
Dashboards.
2. Click the DASHBOARDS tab.
3. Select one or more dashboard nodes for which you want to schedule a task, and then click Schedule Tasks from the Available Dashboards list.
The Schedule Task window loads with three tabs: DASHBOARDS, TASK DETAILS, and SCHEDULE PATTERN
4. The DASHBOARDS tab of the window displays a Selected Dashboards pane that lists all the already selected dashboard nodes.
To add a dashboard node to the task, click one of the nodes that are listed under Dashboards (select one or more) pane, and click to add the node to the
Selected Dashboards pane.
Note: Scheduling task for the drill-down dashboards and Metric viewer dashboard is not supported.
Click Set Filters to apply the filter properties to the dashboard.
If you do not want to schedule a task for a dashboard node, then click the icon that is displayed next to it.
Note:
If you schedule a task for any of the system configuration pages, you do not receive any emails with PDF.
5. Click Next.
The TASK DETAILS tab is displayed.
Add the following values in the TASK DETAILS tab:
Table 1. Task details
Field User action
Task Name Enter a name for the schedule task.
Report Format Select a report format.
Send To Enter the email addresses to send dashboard reports to.
An Email Confidentiality Statement is displayed. If you want to schedule the task, you must click Agree.
Note: You must have permissions, authorizations, and consents from users to use their email addresses. IBM® Telco Network Cloud
Manager - Performance is not responsible for GDPR compliance issues that are related to email addresses.
The email addresses that you enter while scheduling tasks are encrypted and stored in Telco Network Cloud Manager - Performance.
When you enter multiple email addresses, make sure that no space is introduced between the comma-separated addresses. For
example, xx@ibm.com,abc@ibm.com.
Subject Enter a subject line for the email.
Message Enter a message for the email.
6. Click Next.
The SCHEDULE PATTERN tab is displayed.
Add the following values in the SCHEDULE PATTERN tab:
Table 2. Schedule pattern
Field User action
Start Date & Time From the date and time lists, select or enter a start date and time for the task.
Schedule Pattern >
One-time-only
Only if you want to schedule a one-time-task, select this option, and then click Save.
Schedule Pattern >
Recurring
To schedule a recurring task, click any one option in the Recurring Pattern pane.
Recurring Pattern >
Daily
By default, the report is triggered everyday as the default value is 1.
To trigger a report after a defined number of days, click Every <num> day(s), and enter the number of the days after which
the report must be generated and emailed.
For example, if you enter 2, then the report is generated on every alternative day. Similarly, if you enter 115, then the report
is generated on every 115th day.
To trigger a report on every weekday, click Every Weekday.
A report is generated on every weekday, except Saturday and Sunday.
Recurring Pattern >
Weekly
By default, the report is triggered on Monday, every week.
To trigger a report after a defined number of weeks, in the Recur every <num> week(s) on field, enter the number of weeks
after which the report must be triggered.
To trigger a report on defined days of a week, select one or more weekdays.
If you want the report to be generated on all the days of the week, select all the weekdays.
For example, if you enter 2 in the Recur every <num> week(s) on field, and select Tuesday, then the report is generated on every
alternative Tuesday.
516 IBM Telco Network Cloud Manager - Performance 1.4.5

Field User action
Recurring Pattern >
Monthly
By default, the report is triggered every month on the current date of selection. For example, if you are scheduling a report today,
then today's date is displayed in the Day <current_day> of every <num> month(s) field.
To trigger a report on a specific month, in the Day <current_day of every <num> month(s) option, enter a month number.
For example, if the <current_day is 21, and you enter <num> month(s) as 7, then the report is triggered on 21st day of the
seventh month from the current month. So, a report is triggered on 21 October, 21 May, and so on.
To trigger a report on the first or last weekday of a specific month, click the The <first or last> <weekday> of every <num>
month(s) option, and select or enter the following values:
<first or last>: Select First or Last to specify first or last day of the month.
<weekday>: Select any days (Monday to Sunday) on which the report must be generated.
<num>: Enter a month number.
For example,
From the <first or last> list, you select last.
From the <weekday> list, you select Wednesday.
From the <num> field, you enter 5.
Then, a report is generated on the last Wednesday of every fifth month, such as May, October, March.
For this option, by default, the report is triggered on last Sunday of every month.
Recurring Pattern >
Yearly
By default, the report is triggered every year on the current date of selection. For example, if you are scheduling a report today,
then today's date is displayed in the On <current_month> <current_day> fields.
To trigger a report on a specific year, in the Recur every <num> Year(s) on field, enter a year number, and then click any one of the
following options:
To trigger a report on the current date of a specific year, click the On <current_month> <current_day> option.
For example, if you select 2 in the number of years field, and the current date is 5 March, then the report is triggered on 5
March, every alternative year.
To trigger a report on the first or last weekday of a specific month of a specific year, click the The <first or last> <weekday> of
every <month> option, and select or enter the following values:
<first or last>: Select First or Last to specify first or last day of the month.
<weekday>: Select a weekday on which the report must be generated.
<month>: Select a month.
For example, if you select 2 in the number of years field, and then from the <first or last> list, if you select last, from
<weekday> list, if you select Wednesday, and from the <month> list, if you select August, then a report is generated every
alternative year, on the last Wednesday of August.
For this option, by default, the report is triggered on the last Sunday of January.
Range of Recurrence >
No end date
If you do not want the recurring task that you scheduled in the Recurring Pattern pane to end, then select this option.
Range of Recurrence >
End after <num>
occurrences
If you want the recurring task that you scheduled in the Recurring Pattern pane to end after a specified number of occurrences,
select this option.
For example, if you enter 5 in the <num> field, then the recurring task ends after five occurrences.
Range of Recurrence >
End by <date> <time>
If you want the recurring task that you scheduled in the Recurring Pattern pane to end at a defined date and time, select this
option, and select or enter an end date and time.
For example, if you enter 05/28/2029 in the <date> field and 1:00 PM in the <time> field, then the recurring task ends at 1:00 PM
on 28 May 2029.
7. To save the one-time-task or recurring task, click Save.
A message the displays the task details and indicates that the task is created is displayed.
What to do next
The reports are triggered and emailed to the specified email addresses. Confirm whether reports are delivered to the specified email addresses.
Managing scheduled tasks
About this task
You can view, edit, cancel, activate, reschedule, or delete the already scheduled tasks.
Procedure
Viewing scheduled tasks.
To view scheduled tasks and their state, complete the following steps:
1. Click Reporting > Schedule Tasks.
The Schedule Tasks page is displayed.
The DASHBOARDS tab displays a Dashboard Name column that lists all the dashboards that are deployed on Telco Network Cloud Manager - Performance
Dashboards.
The SCHEDULE TASKS tab displays the scheduled tasks. The page also displays the status of each task that is scheduled for each dashboard node.
2. To view each scheduled task, its schedule pattern, and its state, click the SCHEDULE TASKS tab. The SCHEDULE TASKS tab displays multiple child tabs,
complete the following steps to view report tasks according to their states:
Click the All tab to view all the report tasks along with their details and state.
A task can be in any of the following states:
IBM Telco Network Cloud Manager - Performance 1.4.5 517

- Active
- Completed
- Scheduled
- Cancelled
Note: The Cancel Schedule is not supported.
Click the Active tab to view all the report tasks that are in Active state.
You can cancel the tasks that are in Active state, either by using the All tab or the Active tab.
Click the Scheduled tab to view all the report tasks that are in Scheduled state.
Click the Cancelled tab to view all the report tasks that are in Cancelled state.
You can activate the tasks that are in Cancelled state, either by using the All tab or the Cancelled tab.
Click the Completed tab to view all the report tasks that are in Completed state.
Note: You can edit or delete all the tasks that are in active, scheduled, or cancelled state. You cannot edit tasks that are in completed state.
3. To view details of each report task, complete the following steps in any tab:
a. In the Report Task column, click any report task.
A Report Task Details window is displayed.
b. Click each tab within the window to view name of the dashboard node, its report details, and report schedule pattern.
Canceling, activating, or deleting scheduled tasks.
To cancel, activate, or delete a scheduled task, complete the following steps:
1. To cancel a task that is in Active state, complete the following steps in the All or Active tab:
a. Click for the task that is in active state.
A message confirming whether you want to cancel the scheduled task is displayed.
b. Click Ok.
The task is cancelled, and its state changes from Active to Cancelled. The task is also displayed in the Cancelled tab.
2. To activate a task that is in Cancelled state, complete the following steps in the All or Cancelled tab:
a. Click for the task that is in canceled state.
A message confirming whether you want to activate the canceled task is displayed.
b. Click Ok.
The task is activated, and its state changes from Cancelled to Active. The task is also displayed in the Active tab.
3. To delete tasks, complete any of the following steps on any of the SCHEDULE TASKS tabs:
To delete tasks, either select a task and click the Delete button or click on the task row.
To delete multiple tasks, select the tasks that you want to delete, and then click the Delete button.
Editing or rescheduling tasks that are in active, cancelled, or scheduled state:
To edit a scheduled task, complete the following steps in All, Active, Scheduled, or Cancelled tab:
1. In the Actions column, click for the report task that you want to edit, or in the Report Task column, click any report task, and then click the Edit button
that is displayed on the Report Task Details window.
An Edit Report window is displayed.
2. Based on whether the task is a one-time-only task or a recurring task, complete the following steps:
a. In the Start Date & Time pane, from the date and time lists, select or enter a start date and time for the task.
Note: For one-time-tasks, you can edit only the start date and time.
b. In the Range of Recurrence pane, select any one of the following options:
Table 1. Schedule pattern
Field User action
Range of Recurrence > No end date If you do not want the task to end, then select this option.
Range of Recurrence > End after num
occurrences
If you want the task to end after a specified number of occurrences, select this option.
For example, if you enter 5 in the num field, then the recurring task ends after five occurrences.
Range of Recurrence > End by date
time
If you want the task to end at a defined date and time, select this option.
For example, if you enter 05/28/2020 in the date field and 1:00 PM in the time field, then the recurring task
ends at 1:00 PM on 28 May 2020.
3. Click Save.
The task is rescheduled.
Scenarios and use cases for IBM® Telco Network Cloud Manager - Performance
Use these example scenarios to understand how you can use Telco Network Cloud Manager - Performance in your organization.
Monitoring the Busy hours based on UDCs
You can calculate the busy hour values for a set of metrics from any Resource type by using the enhanced Busy hour REST API. The REST API displays the values for
Busy hour determiner that is used in the API call in a clean format and the metrics that are used in the UDC creation. The Busy hour can be calculated based on the
metrics from the descendant hierarchy of the parent Resource type level.
Monitoring the Busy hours based on metrics from child Resource level that are rolled up to Parent level
You can calculate the busy hour values for a set of metrics from any child Resource Type, and then roll up to Parent level by using the enhanced REST API. The REST
API displays the values for Busy Hour determiner that is used in the API call in a clean format and also the child level metrics that are rolled up to parent level.
518 IBM Telco Network Cloud Manager - Performance 1.4.5

Monitoring the Busy hours based on UDCs
You can calculate the busy hour values for a set of metrics from any Resource type by using the enhanced Busy hour REST API. The REST API displays the values for Busy
hour determiner that is used in the API call in a clean format and the metrics that are used in the UDC creation. The Busy hour can be calculated based on the metrics from
the descendant hierarchy of the parent Resource type level.
This information helps you understand how to create a dashboard that displays the busy hour data for specific metrics.
Steps to create a customized dashboard to display the peak hours in your network based on the selected determiner with one or more metrics.
Create a UDC with one or more raw metrics that can be used as determiner in defining a stored busy hour.
Create a stored busy hour by using the UDC as the determiner.
Call the REST API definition in a customized dashboard
Create a customized dashboard to display the busy hour determiner and the metrics that are used in the UDC.
Installed Technology Packs
You can install any 2G, 3G, 4G, or 5G Technology Pack to see create this scenario.
Create a UDC that can be used as determiner in defining a stored busy hour
Follow these steps to create a UDC:
1. Log in to Telco Network Cloud Manager - Performance Dashboards directly in dedicated stand-alone installation.
Or
Log in to Dashboard Application Services Hub if your environment is integrated with Watson™ AIOps components.
2. Click Administration > Metric Management > User-defined calculations (UDC).
You can see the User-defined calculations (UDC) page that has a grid with configured UDCs and their details.
3. Click Create new and enter or select the following details in the Create new UDC page:
Provide the following details:
Field Example value
Insert UDC name SBH.UDC_plusNutrancell1
Focal Resource type nUtranCell
Aggregation Average
Description UDC to be used in SBH definition
Add field From the Metric field type, select the following metric:
nUtranCell.N.RRC.ReEst.Att
Use the + operator and select another metric.
nUtranCell.N.RRC.SetupReq.Att
You can use the following formula:
[nUtranCell]![{nUtranCell.N.RRC.ReEst.Att}] + [nUtranCell]![{nUtranCell.N.RRC.SetupReq.Att}]
Validate Validate the formula.
4. Click Save to be able to see your UDC and its details on the User-defined calculations (UDC) page.
See the SBH.UDC_plusNutrancell1 UDC creation with the nUtranCell.N.RRC.ReEst.Att and nUtranCell.N.RRC.SetupReq.Att metrics in the following
video.
Create a stored busy hour by using the UDC as the determiner
Follow these steps:
1. Log in to Telco Network Cloud Manager - Performance Dashboards directly in dedicated stand-alone installation.
Or
Log in to Dashboard Application Services Hub if your environment is integrated with Watson AIOps components.
2. Click Administration > Metric Management > Busy hour definition.
You can see the Busy hour definition page that has a grid with configured Busy hours and their details.
3. Click Create new and enter the following details in the Create new Busy hour page:
Table 1. Entering values in Create new Busy hour page
Field Example value
Busy hour name SBH_nUtranell_plus1
Focal Resource type and group nUtranCell
Aggregation type Select max
Schedule name Select the EVERYDAY schedule type.
Sliding mode Select nonsliding mode. By default, the value for this parameter is nonsliding.
Nonsliding means that the busy hour is always aligned to hours, for example 14:00 to 15:00 or 18:00 to 19:00.
Sliding busy hours are calculated down to the interval of the data, for example 14:15 to 15:15.
Slide by Select hour.
Metrics pane
A busy hour determiner is the metric that is
used to determine the busiest hour.
SBH.UDC_plusNutrancell1
Select a Focal Resource type nUtranCell
IBM Telco Network Cloud Manager - Performance 1.4.5 519

Field Example value
Select a field type. Select UDC.
Click the arrow ( ) to move the selected metric to the Selected metrics pane.
4. Click Save.
The newly created Busy hour definition with all its attributes is available in the Busy hour definition page.
See the SBH_nUtranell_plus1 Busy hour definition creation with the AVG(nUtranCell.N.User.RRCConn.Active.Avg),
AVG(nUtranCell.N.User.RRCConn.Active.Max) metrics in the following video.
REST API definition
REST API definition that can be used in a customized dashboard to retrieve the busy hour data for specific metrics from the Timeseries database.
https://<dashboard_route>/service/dataset/metric/busyhourvalue?
resourceType=nUtranCell&sbhdeterminer=sbhd_max_day_SBH.UDC_plusNutrancell&sbhvalues=AVG(nUtranCell.N.User.RRCConn.Active.Avg),A
VG(nUtranCell.N.User.RRCConn.Active.Max)&flatten=true&start=1670803200000&end=1673481600000&properties=technology,vendor
Enter the URI in a single line.
https://<dashboard_hostname><dashboard_port>/service/dataset/metric/busyhourvalue?
resourceType=nUtranCell&sbhdeterminer=sbhd_max_day_SBH.UDC_plusNutrancell&sbhvalues=AVG(nUtranCell.N.User.RRCConn.Active.Avg),A
VG(nUtranCell.N.User.RRCConn.Active.Max)&flatten=true&start=1670803200000&end=1673481600000&properties=technology,vendor
Enter the URI in a single line.
Method
The supported request type.
https GET
URL parameters
Name Required Default value Description
sbhdetermine
rYes N/A Metric that is used to monitor for Busy hour
sbhvalues No N/A Metrics that are used in the API to monitor along with the SBH determiner.
start Yes N/A The start time for which busy hour data must be returned.
end Yes N/A The end time for which busy hour data must be returned.
properties No N/A Comma-separated list of properties that are returned for the entities that are specified. For example,
vendor, and technology.
sortBy No N/A Metric expression that defines the sort order of the specified sbhvalues. Only one metric is allowed with
the sortBy expression. Prefix + or - to indicate sort direction.
groupByPrope
rty No N/A Note: Property name is case-sensitive.
resourceType Yes N/A Comma-separated list of Resource Types. For example, nUtranCell.
flatten Yes True Output of the result without nested the objects.
Give True value to be able to create a dashboard from the retrieved values.
Sample URLs
https://<dashboard_route>/service/dataset/metric/
busyhourvalue?
resourceType=nUtranCell&sbhdeterminer=sbhd_max_day_SBH.UDC_plusNutrancell&sbhvalues=AVG(nUtranCell.N.User.RRCConn.Active.A
vg),AVG(nUtranCell.N.User.RRCConn.Active.Max)&flatten=true&start=1672963200000&end=1673481600000&properties=technology,ven
dor
https://<dashboard_route>/service/dataset/metric/
busyhourvalue?
resourceType=nUtranCell&sbhdeterminer=sbhd_max_day_SBH.UDC_plusNutrancell&sbhvalues=AVG(nUtranCell.N.User.RRCConn.Active.A
vg),AVG(nUtranCell.N.User.RRCConn.Active.Max)&flatten=true&start=1672963200000&end=1673481600000&properties=technology,ven
dor&sortBy=sbhd_max_day_SBH.UDC_plusNutrancell&groupByProperty=vendor
Special behavior
The difference between the start and end time must always be one day or seven days. For example,
Friday, January 6, 2023 8:00:00 AM
Thursday, January 12, 2023 8:00:00 AM
Note: Provide the UNIX timestamp for the start and end time.
Response
https://<dashboard_route>/service/dataset/metric/
busyhourvalue?
resourceType=nUtranCell&sbhdeterminer=sbhd_max_day_SBH.UDC_plusNutrancell&sbhvalues=AVG(nUtranCell.N.User.RRCConn.Active.A
vg),AVG(nUtranCell.N.User.RRCConn.Active.Max)&flatten=true&start=1672963200000&end=1673481600000&properties=technology,ven
dor&sortBy=sbhd_max_day_SBH.UDC_plusNutrancell&groupByProperty=vendor
The results are returned as JSON data that contains an array of the following fields:
Parameter Type Description
sbhdeterminer String ResourceType!sbhdMetric
sbhvalues List[String] List of resourcetype!Metric
Start time Long Start time
End time Long End time
properties List[String] property
520 IBM Telco Network Cloud Manager - Performance 1.4.5

Parameter Type Description
sortBy String ResourceID or sbhdeterminer value
groupByProperty String ResourceID
ResourceType String Resource Type
[
{
"sbhd_max_day_SBH.UDC_plusNutrancell": 40,
"timestamp": 1672963200000,
"AVG(nUtranCell.N.User.RRCConn.Active.Avg)": 21,
"AVG(nUtranCell.N.User.RRCConn.Active.Max)": 19,
"technology": "NR",
"resource": "KH2000_AUH-12345_3/0",
"vendor": "Huawei"
},
{
"sbhd_max_day_SBH.UDC_plusNutrancell": 40,
"timestamp": 1673049600000,
"AVG(nUtranCell.N.User.RRCConn.Active.Avg)": 21,
"AVG(nUtranCell.N.User.RRCConn.Active.Max)": 19,
"technology": "NR",
"resource": "KH2000_AUH-12345_3/0",
"vendor": "Huawei"
},
{
"sbhd_max_day_SBH.UDC_plusNutrancell": 40,
"timestamp": 1673236800000,
"AVG(nUtranCell.N.User.RRCConn.Active.Avg)": 21,
"AVG(nUtranCell.N.User.RRCConn.Active.Max)": 19,
"technology": "NR",
"resource": "KH2000_AUH-12345_3/0",
"vendor": "Huawei"
},
{
"sbhd_max_day_SBH.UDC_plusNutrancell": 40,
"timestamp": 1673308800000,
"AVG(nUtranCell.N.User.RRCConn.Active.Avg)": 21,
"AVG(nUtranCell.N.User.RRCConn.Active.Max)": 19,
"technology": "NR",
"resource": "KH2000_AUH-12345_3/0",
"vendor": "Huawei"
},
{
"sbhd_max_day_SBH.UDC_plusNutrancell": 40,
"timestamp": 1673395200000,
"AVG(nUtranCell.N.User.RRCConn.Active.Avg)": 21,
"AVG(nUtranCell.N.User.RRCConn.Active.Max)": 19,
"technology": "NR",
"resource": "KH2000_AUH-12345_3/0",
"vendor": "Huawei"
},
{
"sbhd_max_day_SBH.UDC_plusNutrancell": 112,
"timestamp": 1672963200000,
"AVG(nUtranCell.N.User.RRCConn.Active.Avg)": 34,
"AVG(nUtranCell.N.User.RRCConn.Active.Max)": 78,
"technology": "NR",
"resource": "KH2000_AUH-12345_3/1",
"vendor": "Huawei"
},
{
"sbhd_max_day_SBH.UDC_plusNutrancell": 112,
"timestamp": 1673049600000,
"AVG(nUtranCell.N.User.RRCConn.Active.Avg)": 34,
"AVG(nUtranCell.N.User.RRCConn.Active.Max)": 78,
"technology": "NR",
"resource": "KH2000_AUH-12345_3/1",
"vendor": "Huawei"
},
{
"sbhd_max_day_SBH.UDC_plusNutrancell": 112,
"timestamp": 1673236800000,
"AVG(nUtranCell.N.User.RRCConn.Active.Avg)": 34,
"AVG(nUtranCell.N.User.RRCConn.Active.Max)": 78,
"technology": "NR",
"resource": "KH2000_AUH-12345_3/1",
"vendor": "Huawei"
},
{
"sbhd_max_day_SBH.UDC_plusNutrancell": 112,
"timestamp": 1673308800000,
"AVG(nUtranCell.N.User.RRCConn.Active.Avg)": 34,
"AVG(nUtranCell.N.User.RRCConn.Active.Max)": 78,
"technology": "NR",
"resource": "KH2000_AUH-12345_3/1",
"vendor": "Huawei"
},
{
"sbhd_max_day_SBH.UDC_plusNutrancell": 112,
"timestamp": 1673395200000,
"AVG(nUtranCell.N.User.RRCConn.Active.Avg)": 34,
"AVG(nUtranCell.N.User.RRCConn.Active.Max)": 78,
"technology": "NR",
"resource": "KH2000_AUH-12345_3/1",
IBM Telco Network Cloud Manager - Performance 1.4.5 521

"vendor": "Huawei"
},
{
"sbhd_max_day_SBH.UDC_plusNutrancell": 0,
"timestamp": 1672963200000,
"AVG(nUtranCell.N.User.RRCConn.Active.Avg)": 0,
"AVG(nUtranCell.N.User.RRCConn.Active.Max)": 0,
"technology": "NR",
"resource": "KH2000_AUH-12345_3/2",
"vendor": "Huawei"
},
{
"sbhd_max_day_SBH.UDC_plusNutrancell": 0,
"timestamp": 1673049600000,
"AVG(nUtranCell.N.User.RRCConn.Active.Avg)": 0,
"AVG(nUtranCell.N.User.RRCConn.Active.Max)": 0,
"technology": "NR",
"resource": "KH2000_AUH-12345_3/2",
"vendor": "Huawei"
},
{
"sbhd_max_day_SBH.UDC_plusNutrancell": 0,
"timestamp": 1673236800000,
"AVG(nUtranCell.N.User.RRCConn.Active.Avg)": 0,
"AVG(nUtranCell.N.User.RRCConn.Active.Max)": 0,
"technology": "NR",
"resource": "KH2000_AUH-12345_3/2",
"vendor": "Huawei"
},
{
"sbhd_max_day_SBH.UDC_plusNutrancell": 0,
"timestamp": 1673308800000,
"AVG(nUtranCell.N.User.RRCConn.Active.Avg)": 0,
"AVG(nUtranCell.N.User.RRCConn.Active.Max)": 0,
"technology": "NR",
"resource": "KH2000_AUH-12345_3/2",
"vendor": "Huawei"
},
{
"sbhd_max_day_SBH.UDC_plusNutrancell": 0,
"timestamp": 1673395200000,
"AVG(nUtranCell.N.User.RRCConn.Active.Avg)": 0,
"AVG(nUtranCell.N.User.RRCConn.Active.Max)": 0,
"technology": "NR",
"resource": "KH2000_AUH-12345_3/2",
"vendor": "Huawei"
}
]
Create a customized dashboard to display the busy hour data
Follow these steps to create a simple dashboard that displays the busy hour data:
1. Access the Dashboard Designer.
Create a data definition.
2. Click Data Definitions > Create New Data Definition from the left navigation. For more information, see Data Definitions.
3. Enter the following details:
Field Details
New Data
Definition Click the Edit ( ) button and provide the name sbhDD to the data definition.
Connector Type Select NPI.
Connector
Source Name
default-npi
Method Get
Endpoint URL https://ui:30021, which is the URL for the UI Service from where the data is fetched.
URI Provide the following URI
/service/dataset/metric/busyhourvalue?
resourceType=nUtranCell&sbhdeterminer=sbhd_max_day_SBH.UDC_plusNutrancell&sbhvalues=AVG(nUtranCell.N.User.R
RCConn.Active.Avg),AVG(nUtranCell.N.User.RRCConn.Active.Max)&flatten=true&start=1670803200000&end=167348160
0000&properties=technology,vendor
4. Save the data definition in a new category by name SBH category.
Create a layout.
5. Create a 1x1 Layout to hold a single widget and click Use this Layout.
You can either use the default layout or create a custom one. For more information, see Layouts.
Create a widget.
6. Click WidgetsCustomCreate new widget. For more information, see Widgets.
7. Click Charts from the left navigation and drag the Grid chart from Other Charts category. For more information, see Charts.
Assign an existing data definition to the widget.
8. Click the More options ( ) button and select Set Data Definition.
522 IBM Telco Network Cloud Manager - Performance 1.4.5

9. In the Set Data Definition window, select the sbhDD data definition that is listed under Data Definition (select one or more) pane, and click the Move to Selected
button to add the data definitions to Selected Data Definition pane.
10. Set the properties for the dashboard to display the metrics and the Busy hour determiner.
11. Preview the dashboard before you deploy it.
Related information
Managing User-defined calculations
Managing Busy hours
Monitoring the Busy hours based on metrics from child Resource level that are rolled
up to Parent level
You can calculate the busy hour values for a set of metrics from any child Resource Type, and then roll up to Parent level by using the enhanced REST API. The REST API
displays the values for Busy Hour determiner that is used in the API call in a clean format and also the child level metrics that are rolled up to parent level.
This information helps you understand how to create a dashboard that displays the busy hour data for specific metrics.
Steps to create a customized dashboard to display the peak hours in your network based on the selected determiner with one or more metrics.
1. Define daily rollup batch job to aggregate metric_a with Focal entity as parent Resource type. Granularity is day. The aggregator for the metric is AvgSum. Result
metric might look like tavgssum_day_<metric_a>.
2. Define hourly rollup batch jobs to aggregate the metric_a with Focal entity as parent Resource type. Granularity is hour. The aggregator for the metric is AvgMax.
Result metric might look like tavgsmax_hour_<metric_a>
3. Define hourly rollup batch jobs to aggregate the metric_b with Focal entity as parent Resource type. Granularity is hour. The aggregator for the metric is AvgSum.
Result metric might look like tavgssum_hour_<metric_b>
4. Define rollup busy hour definition for a metric with Focal entity as parent Resource type. Result metric like: sbhd_day_<metric_a>. This metric is the Busy hour
determiner.
5. Use the enhanced REST API definition in a customized dashboard.
6. Create a customized dashboard to display the Busy hour data based on the determiner from the parent Resource type. Compare it with the same metric from the
child Resource types and display the child Resource type that is most loaded during the busy hours of the parent.
For example, see the following REST API call:
{"resource":"resource", <!-- Refers to the Parent Resource type -->
"timestamp":timestamp,
“busyhourdeterminer metric”:”value busyhourdeterminer metric”,
“metric1”: “value metric1”,
“metric2”: “value metric2”,
“sbhdvalue metric1”: “value sbhdvalue metric1” <!-- Refers to metrics from child Resource type -->
“sbhdvalue metric2”: “value sbhdvalue metric2” <!-- Refers to metrics from child Resource type -->
“sbhdvalue metric2”: “value sbhdvalue metric2” <!-- Refers to metrics from child Resource type -->
"property1":"value property1",
"property2":"value property2"}]
Installed Technology Packs
network-health
network-health-extension
Any Wireline Cisco Technology Pack
Create a batch job for metric_a with aggregator as AvgSum and rolled up daily
Follow these steps:
1. Log in to Telco Network Cloud Manager - Performance Dashboards directly in dedicated stand-alone installation.
Or
Log in to Dashboard Application Services Hub if your environment is integrated with Watson™ AIOps components.
2. Click Administration > Analytics > Batch analytics.
You can see the Batch analytics page that has a grid with configured batch jobs and their details.
3. Click Create new and enter or select the following details in the Create new job page:
Provide the following details:
Field Example value
Job name SBH.rollup.day.avgsum
Focal Resource type and group device
Schedule name EVERYDAY
Time period Last day
Granularity Day
Metric interface.ICMP.Ping.Response.Time.ms
Aggregator AvgSum
4. Click Save to save the job.
The newly created job with all its attributes is available in the Batch analytics page.
Note: By default, the created job is enabled.
IBM Telco Network Cloud Manager - Performance 1.4.5 523

Create a batch job for metric_a with aggregator as AvgMax and rolled up hourly
Follow these steps:
1. Log in to Telco Network Cloud Manager - Performance Dashboards directly in dedicated stand-alone installation.
Or
Log in to Dashboard Application Services Hub if your environment is integrated with Watson AIOps components.
2. Click Administration > Analytics > Batch analytics.
You can see the Batch analytics page that has a grid with configured batch jobs and their details.
3. Click Create new and enter or select the following details in the Create new job page:
Provide the following details:
Field Example value
Job name SBH.rollup.hr.avgmax
Focal Resource type and group device
Schedule name EVERYHOUR
Time period Last hour
Granularity Hour
Metric interface.ICMP.Ping.Response.Time.ms
Aggregator AvgMax
4. Click Save to save the job.
The newly created job with all its attributes is available in the Batch analytics page.
Note: By default, the created job is enabled.
Create a batch job for metric_b with aggregator as AvgSum and rolled up hourly
Follow these steps:
1. Log in to Telco Network Cloud Manager - Performance Dashboards directly in dedicated stand-alone installation.
Or
Log in to Dashboard Application Services Hub if your environment is integrated with Watson AIOps components.
2. Click Administration > Analytics > Batch analytics.
You can see the Batch analytics page that has a grid with configured batch jobs and their details.
3. Click Create new and enter or select the following details in the Create new job page:
Provide the following details:
Field Example value
Job name SBH.rollup.hr.avgsum
Focal Resource type and group device
Schedule name EVERYHOUR
Time period Last hour
Granularity Hour
Metric interface.ICMP.Ping.Status
Aggregator AvgSum
4. Click Save to save the job.
The newly created job with all its attributes is available in the Batch analytics page.
Note: By default, the created job is enabled.
Create a stored busy hour that can be used as a determiner metric (metric_a)
A busy hour determiner is the metric that is used to determine the busiest hour. Follow these steps to create a busy hour definition:
1. Log in to Telco Network Cloud Manager - Performance Dashboards directly in dedicated stand-alone installation.
Or
Log in to Dashboard Application Services Hub if your environment is integrated with Watson AIOps components.
2. Click Administration > Metric Management > Busy hour definition.
You can see the Busy hour definition page that has a grid with configured Busy hours and their details.
3. Click Create new and enter or select the following details in the Create new Busy hour page:
Field Example value
Busy hour name SBH.device.rollup
Focal Resource type and group device
Aggregation type Max
Schedule name EVERYDAY
Time period Last day
Granularity Day
Sliding mode Non-sliding
Metrics pane
Metric From the Metric field type, select the following metric:
interface.ICMP.Ping.Response.Time.ms
4. Click Save to be able to see your job and its details on the Batch analytics page.
524 IBM Telco Network Cloud Manager - Performance 1.4.5

REST API definition
REST API definition that can be used in a customized dashboard to retrieve the busy hour data for specific metrics from the Timeseries database.
https://<dashboard_route>/service/dataset/metric/busyhoursummvalue?
resourceType=device&sbhdeterminer=sbhd_max_day_ICMP.Ping.Response.Time.ms&metrics=tavgssum_day_ICMP.Ping.Response.Time.ms&sbhva
lues=tavgsmax_hour_ICMP.Ping.Response.Time.ms,tavgssum_hour_ICMP.Ping.Status&flatten=true&start=1679331600000&end=1679504400000
&properties=vendor,displayName
Enter the URI in a single line.
https://<dashboard_route>//service/dataset/metric/busyhoursummvalue?
resourceType=device&sbhdeterminer=sbhd_max_day_ICMP.Ping.Response.Time.ms&metrics=tavgssum_day_ICMP.Ping.Response.Time.ms&sbhva
lues=tavgsmax_hour_ICMP.Ping.Response.Time.ms,tavgssum_hour_ICMP.Ping.Status&flatten=true&start=1679331600000&end=1679504400000
&properties=vendor,displayName
Enter the URI in a single line.
Method
The supported request type.
https GET
URL parameters
Name Required Default value Description
sbhdetermine
rYes N/A Metric that is used to determine the busy hour.
sbhd_max_day_ICMP.Ping.Response.Time.ms
metrics Yes N/A tavgssum_day_ICMP.Ping.Response.Time.ms
sbhvalues No N/A tavgsmax_hour_ICMP.Ping.Response.Time.ms,
tavgssum_hour_ICMP.Ping.Status
start Yes N/A The start time for which busy hour data must be returned.
end Yes N/A The end time for which busy hour data must be returned.
properties No N/A Comma-separated list of properties that are returned for the entities that are specified. For example,
vendor, and displayName.
resourceType Yes N/A Comma-separated list of Resource Types. For example, device.
flatten Yes True Output of the result without nested the objects.
Give True value to be able to create a dashboard from the retrieved values.
Note: If you mention flatten is equal to force,
Special behavior
The difference between the start and end time must always be one day or seven days. For example,
Friday, January 6, 2023 8:00:00 AM
Thursday, January 12, 2023 8:00:00 AM
Note: Provide the UNIX timestamp for the start and end time.
Response
https://<dashboard_route>/service/dataset/metric/busyhoursummvalue?
resourceType=device&sbhdeterminer=sbhd_max_day_ICMP.Ping.Response.Time.ms&metrics=tavgssum_day_ICMP.Ping.Response.Time.ms&
sbhvalues=tavgsmax_hour_ICMP.Ping.Response.Time.ms,tavgssum_hour_ICMP.Ping.Status&flatten=true&start=1679331600000&end=167
9504400000&properties=vendor,displayName
The results are returned as JSON data that contains an array of the following fields:
Parameter Type Description
sbhdeterminer String ResourceType!sbhdMetric
metrics String List of resourcetype!aggr(Metric)
sbhvalues List[String] List of resourcetype!Metric
start time Long Start time
end time Long End time
properties List[String] property
resourceType String Resource Type
[
{
"displayName": "Agent4.persistent.co.in",
"tavgssum_day_ICMP.Ping.Response.Time.ms": null,
"tavgsmax_hour_ICMP.Ping.Response.Time.ms": 287.36041666666665,
"sbhd_max_day_ICMP.Ping.Response.Time.ms": 3541.2,
"timestamp": 1679493600000,
"tavgssum_hour_ICMP.Ping.Status": 200,
"resource": "10.55.239.4",
"altDisplayName": "Agent4.persistent.co.in",
"vendor": "Cisco"
}
]
Create a customized dashboard to display the busy hour data
Follow these steps to create a simple dashboard that displays the busy hour data:
1. Access the Dashboard Designer.
Create a data definition.
IBM Telco Network Cloud Manager - Performance 1.4.5 525

2. Click Data Definitions > Create New Data Definition from the left navigation. For more information, see Data Definitions.
3. Enter the following details:
Field Details
New Data Definition
Click the Edit ( ) button and provide the name sbhDD to the data definition.
Connector Type Select NPI.
Connector Source Name default-npi
Method Get
Endpoint URL https://ui:30021, which is the URL for the UI Service from where the data is fetched.
URI Provide the following URI
/service/dataset/metric/busyhoursummvalue?resourceType=device&sbhdeterminer=
sbhd_max_day_ICMP.Ping.Response.Time.ms&metrics=tavgssum_day_ICMP.Ping.Response.Time.ms&sbhvalues=
tavgsmax_hour_ICMP.Ping.Response.Time.ms,tavgssum_hour_ICMP.Ping.Status&flatten=true&start=
1679331600000&end=1679504400000&properties=vendor,displayName
4. Save the data definition in a new category by name SBH category.
Create a layout.
5. Create a 1x1 Layout to hold a single widget and click Use this Layout.
You can either use the default layout or create a custom one. For more information, see Layouts.
Create a widget.
6. Click WidgetsCustomCreate new widget. For more information, see Widgets.
7. Click Charts from the left navigation and drag the Grid chart from Other Charts category. For more information, see Charts.
Assign an existing data definition to the widget.
/service/dataset/metric/busyhoursummvalue?
resourceType=device&sbhdeterminer=sbhd_max_day_ICMP.Ping.Response.Time.ms&metrics=tavgssum_day_ICMP.Ping.Response.Time.ms&
sbhvalues=tavgsmax_hour_ICMP.Ping.Response.Time.ms,tavgssum_hour_ICMP.Ping.Status&flatten=true&start=1679331600000&end=167
9504400000&properties=vendor,displayName
8. Click the More options ( ) button and select Set Data Definition.
9. In the Set Data Definition window, select the sbhDD data definition that is listed under Data Definition (select one or more) pane, and click the Move to Selected
button to add the data definitions to Selected Data Definition pane.
10. Set the properties for the dashboard to display the metrics and the Busy hour determiner.
11. Preview the dashboard before you deploy it.
Related information
Managing User-defined calculations
Managing Busy hours
Troubleshooting and support
You can use this troubleshooting and support information to troubleshoot problems with IBM® Telco Network Cloud Manager - Performance. Make sure you have a
working installation of IBM Telco Network Cloud Manager - Performance
Troubleshooting a problem
Troubleshooting is a systematic approach to solving a problem. The goal of troubleshooting is to determine why something does not work as expected and how to
resolve the problem.
Log files in Telco Network Cloud Manager - Performance
Log files that are associated with different services and components in Telco Network Cloud Manager - Performance and their location.
Known problems and solutions
A list of known problems and their solutions.
Troubleshooting a problem
Troubleshooting is a systematic approach to solving a problem. The goal of troubleshooting is to determine why something does not work as expected and how to resolve
the problem.
The first step in the troubleshooting process is to describe the problem completely. Problem descriptions help you and the IBM technical-support representative know
where to identify the cause of the problem. This step includes asking yourself basic questions:
What are the symptoms of the problem?
Where does the problem occur?
When does the problem occur?
Under which conditions does the problem occur?
Can the problem be reproduced?
The answers to these questions typically lead to a good description of the problem, which can then lead you a problem resolution.
What are the symptoms of the problem?
526 IBM Telco Network Cloud Manager - Performance 1.4.5

When starting to describe a problem, the most obvious question is "What is the problem?" This question might seem straightforward; however, you can break it down into
several more-focused questions that create a more descriptive picture of the problem. These questions can include:
Who, or what, is reporting the problem?
What are the error codes and messages?
How does the system fail? For example, is it a loop, hang, crash, performance degradation, or incorrect result?
Where does the problem occur?
Determining where the problem originates is not always easy, but it is one of the most important steps in resolving a problem. Many layers of technology can exist between
the reporting and failing components. Networks, disks, and drivers are only a few of the components to consider when you are investigating problems.
The following questions help you to focus on where the problem occurs to isolate the problem layer:
Is the problem specific to one platform or operating system, or is it common across multiple platforms or operating systems?
Is the current environment and configuration supported?
If one layer reports the problem, the problem does not necessarily originate in that layer. Part of identifying where a problem originates is understanding the environment
in which it exists. Take some time to completely describe the problem environment, including the operating system and version, all corresponding software and versions,
and hardware information. Confirm that you are running within an environment that is a supported configuration; many problems can be traced back to incompatible levels
of software that are not intended to run together or have not been fully tested together.
When does the problem occur?
Develop a detailed timeline of events leading up to a failure, especially for those cases that are one-time occurrences. You can most easily develop a timeline by working
backward: Start at the time an error was reported (as precisely as possible, even down to the millisecond), and work backward through the available logs and information.
Typically, you need to look only as far as the first suspicious event that you find in a diagnostic log.
To develop a detailed timeline of events, answer these questions:
Does the problem happen only at a certain time of day or night?
How often does the problem happen?
What sequence of events leads up to the time that the problem is reported?
Does the problem happen after an environment change, such as upgrading or installing software or hardware?
Responding to these types of questions can give you a frame of reference in which to investigate the problem.
Under which conditions does the problem occur?
Knowing which systems and applications are running at the time that a problem occurs is an important part of troubleshooting. These questions about your environment
can help you to identify the root cause of the problem:
Does the problem always occur when the same task is being performed?
Does a certain sequence of events need to occur for the problem to surface?
Do any other applications fail at the same time?
Answering these types of questions can help you explain the environment in which the problem occurs and correlate any dependencies. Remember that just because
multiple problems might have occurred around the same time, the problems are not necessarily related.
Can the problem be reproduced?
From a troubleshooting standpoint, the ideal problem is one that can be reproduced. Typically, when a problem can be reproduced you have a larger set of tools or
procedures at your disposal to help you investigate. Consequently, problems that you can reproduce are often easier to debug and solve. However, problems that you can
reproduce can have a disadvantage: If the problem is of significant business impact, you do not want it to recur. If possible, re-create the problem in a test or development
environment, which typically offers you more flexibility and control during your investigation.
Can the problem be re-created on a test system?
Are multiple users or applications encountering the same type of problem?
Can the problem be re-created by running a single command, a set of commands, or a particular application?
Log files in Telco Network Cloud Manager - Performance
Log files that are associated with different services and components in Telco Network Cloud Manager - Performance and their location.
Log files location
Log files location for different services.
Service Log location
analytics-batch /opt/basecamp/analytics/logs
analytics-stream /opt/basecamp/analytics/logs
app /opt/basecamp/app/logs
cassandra /opt/cassandra/logs
dashboard /opt/basecamp/dashboard/logs
IBM Telco Network Cloud Manager - Performance 1.4.5 527

Service Log location
diamond-db
View the log messages from Logs tab.
Click View logs icon ( ) to see the log messages.
diamond-db-read
View the log messages from Logs tab.
Click View logs icon ( ) to see the log messages.
diamond-db-export
View the log messages from Logs tab.
Click View logs icon ( ) to see the log messages.
/opt/basecamp/diamond-db/logs
dns-collector /opt/basecamp/dns-collector/logs
file-collector /opt/basecamp/file-collector/logs
flow-analytics /opt/basecamp/flow-analytics/logs
flow-collector /opt/basecamp/flow-collector/logs
inventory /opt/basecamp/inventory/logs
ping-collector /opt/basecamp/ping-collector/logs
kafka
View the log messages from Logs tab.
Click View logs icon ( ) to see the log messages.
nfs
View the log messages from Logs tab.
Click View logs icon ( ) to see the log messages.
Note: It is applicable in Kubernetes environment alone.
nifi /opt/nifi/nifi-current/logs
pack-service /opt/basecamp/pack/logs
postgres
View the log messages from Logs tab.
Click View logs icon ( ) to see the log messages.
postgres-th
View the log messages from Logs tab.
Click View logs icon ( ) to see the log messages.
security
View the log messages from Logs tab.
Click View logs icon ( ) to see the log messages.
snmp-collector /opt/basecamp/snmp-collector/logs
snmp-discovery /opt/basecamp/snmp-discovery/logs
threshold /opt/basecamp/threshold/logs
timeseries /opt/basecamp/timeseries/logs
ui /opt/basecamp/ui/logs
528 IBM Telco Network Cloud Manager - Performance 1.4.5

Service Log location
zookeeper
View the log messages from Logs tab.
Click View logs ( ) icon to see the log messages.
Log message format
Typically, each log message indicates the log level, timestamp, component, thread, error code, and event description.
An example log message:
[INFO] [2020-06-22 09:21:51.524] [akka.cluster.Cluster(akka://npi)] [main] Cluster Node [akka.tcp://npi@10.254.12.162:2572] -
Starting up...
[INFO] [2020-06-22 09:21:51.913] [akka.cluster.Cluster(akka://npi)] [main] Cluster Node [akka.tcp://npi@10.254.12.162:2572] -
Registered cluster JMX MBean [akka:type=Cluster]
[INFO] [2020-06-22 09:21:51.919] [akka.cluster.Cluster(akka://npi)] [main] Cluster Node [akka.tcp://npi@10.254.12.162:2572] -
Started up successfull
Known problems and solutions
A list of known problems and their solutions.
Technology Pack installation might fail after an upgrade
It might happen in some rare scenarios where the user on the Pack Service is shown as basecamp.
Troubleshooting installation, upgrade, and setup
Problems that might occur during installation, uninstallation, upgrade, and setup. Information is provided to resolve the issues wherever applicable. You can also
see issues that are related to some services in Telco Network Cloud Manager - Performance.
Troubleshooting Telco Network Cloud Manager - Performance Dashboards
Use this troubleshooting information when you view Telco Network Cloud Manager - Performance Dashboards.
Technology Pack installation might fail after an upgrade
It might happen in some rare scenarios where the user on the Pack Service is shown as basecamp.
Symptoms
Sometimes you might notice that the Technology Packs cannot be installed from the Pack Service UI after an upgrade on OpenShift® Container Platform environment
where Telco Network Cloud Manager - Performance is integrated with Netcool® Operations Insight®. You might the following error message:
Resolving the problem
To resolve this issue, follow these steps:
1. Log in to your OpenShift Container Platform web console on your primary cluster.
2. Click Workloads > Pods > pack-service-0.
3. Click the Terminal tab and check the user who is accessing the Pack Service with the following command:
IBM Telco Network Cloud Manager - Performance 1.4.5 529

whoami
basecamp
If you see the user as basecamp, proceed with the rest of the steps.
4. Go to /pack-content directory and give the following commands to give write permission to the hidden folders in the directory:
cd /pack-content
chmod a+w .installed .uninstalled .install_failed .uninstall_failed
5. Go to the /opt/basecamp/pack/work directory and give the following commands to give write permission to the .db files in the directory:
cd /opt/basecamp/pack/work
chmod a+w *.db
6. Go to the /opt/basecamp/pack/logs directory and give the following commands to give the write permission to the log files in the directory:
cd /opt/basecamp/pack/logs
chmod a+w *.log
Troubleshooting installation, upgrade, and setup
Problems that might occur during installation, uninstallation, upgrade, and setup. Information is provided to resolve the issues wherever applicable. You can also see
issues that are related to some services in Telco Network Cloud Manager - Performance.
Custom time period setting must match with the aggregated data retention value
The setting in common Config Map for timeseries pre-aggregated data retention value must match with the custom time period setting.
Resource types and Resource groups are not loaded in the dashboard filter bar
You might see this issue in both SNMP and File-based Technology Packs.
Metrics from the selected Resource groups are not loaded in some Analytics configuration pages
After you upgrade your Telco Network Cloud Manager - Performance to 1.4.5, you might not see Resource group metrics from some Analytics configuration pages.
Set the polling interval to filter the Resource types from Condition editor
When you want to filter Resource types from Resource filter field in based on their polling interval, you must make sure that the polling interval is set for the
Resource types on the Resource management page.
Use UDCs instead of metrics in a batch job or stream creation
In certain situations, it is better to use UDCs than metrics that are same in multiple sub-groups or Resource types with the same aggregator in a batch job or
stream.
Retaining the metrics from Batch Analytics with weekly and monthly schedules
The metrics that are created with weekly, monthly, or custom schedules that are longer than 90 days granularity are not retained in the database tables.
Not able to accept the certificate on Chrome browser on Mac
This issue is noticed in Chrome browser on Mac only.
Managing resources for Cassandra and Inventory nodes
When you create a Pod, the Kubernetes scheduler selects a node for the Pod to run on. The scheduler ensures that, for each resource type, the sum of the resource
requests of the scheduled containers is less than the capacity of the node. You can also colocate some services to be installed on the same node.
Common issues in Telco Network Cloud Manager - Performance services
The following are the common issues that are found in microservice in Telco Network Cloud Manager - Performance.
Error in writing the Flow raw data to the database
When the device filter is changed from a drill-down Flow dashboard, Resource ID mapping is incorrect
When you change the resource type from a drill-down Flow dashboard, the resource ID mapping is incorrect in the REST API call. It leads to incorrect data that is
fetched from other resource instead of resource in context.
Changing the mandatory path setting
In each .model file, the mandatory path setting is shortest path to reach from source object to destination object. It is applicable for Wireless Technology Packs
alone.
Delay in ICMP Ping collection for newly discovered devices
Duplicate ICMP Ping metrics
Duplicate ICMP Ping metrics after upgrade
Custom time period setting must match with the aggregated data retention value
The setting in common Config Map for timeseries pre-aggregated data retention value must match with the custom time period setting.
Symptoms
Consider the following scenario. If you create a Busy hour definition with the following parameters:
Sliding mode = Non-sliding
Schedule name = EVERYMONTH
Time period= Last month
Granularity = Week or Month
You might notice that no Resource types are returned in the database when the Custom Time period selection from Run during the selected period ( ) is more than the
default value for the timeseries.pre-agg.hourly.retention.period.inday setting. The default value for the timeseries.pre-
agg.hourly.retention.period.inday setting is 32.
Resolving the problem
530 IBM Telco Network Cloud Manager - Performance 1.4.5

To resolve this issue, change the default value of the timeseries.pre-agg.hourly.retention.period.inday setting in common Config Map to a higher value. For
example, timeseries.pre-agg.hourly.retention.period.inday=90
Note: Currently, it works only in fresh installation scenario.
Related information
Managing Busy hours
Configuring retention period for timeseries data
Resource types and Resource groups are not loaded in the dashboard filter bar
You might see this issue in both SNMP and File-based Technology Packs.
Symptoms
After the data flow is started for the installed Technology Packs, you might notice that Telco Network Cloud Manager - Performance Dashboards do not load the Resource
types in the filter bar.
You might also notice that Resource groups are not loaded in the Telco Network Cloud Manager - Performance Dashboards that have Group option in the filter bar.
Resolving the problem
If you encounter this issue, stop and start the UI Service. Follow these steps:
1. Stop the UI Service with the following command:
kubectl scale -n <namespace> statefulset ui-0 --replicas=0
2. Start the UI Service with the following command:
kubectl scale -n <namespace> statefulset ui-0 --replicas=1
1. Click Stateful Sets in Workloads pane and select the service that you want to stop or scale down.
2. Or, click the Actions list for the service that you want to stop or scale down.
3. Select Edit Stateful Set.
The YAML file is displayed.
4. To stop the service, reduce the replicas number to zero in the file.
For example,
spec:
replicas: 0
selector:
matchLabels:
service: analytics-batch
5. To start the service, increase the replicas number to 1 or more in the file.
spec:
replicas: 1
selector:
matchLabels:
service: analytics-batch
Metrics from the selected Resource groups are not loaded in some Analytics
configuration pages
After you upgrade your Telco Network Cloud Manager - Performance to 1.4.5, you might not see Resource group metrics from some Analytics configuration pages.
Symptoms
If you select a configured Resource group from the following Administration pages:
Batch analytics
Streaming analytics
Busy hour definition
You might notice that metrics that are relevant to the Resource group are not populated in the Metrics pane.
Resolving the problem
IBM Telco Network Cloud Manager - Performance 1.4.5 531

To resolve this issue, restart the specific Analytics service that you see this issue. For example, if you see this issue on Batch analytics page, restart the analytics-
batch service.
Set the polling interval to filter the Resource types from Condition editor
When you want to filter Resource types from Resource filter field in based on their polling interval, you must make sure that the polling interval is set for the Resource
types on the Resource management page.
Symptoms
If you want to set the condition as resource.ifIndex == 4 &&
resource.pollingInterval == 300 in the Condition editor. You might find that the filter is not working correctly even though 300 seconds is the default polling
interval for all Resource types.
You might see the same behavior if you specify any other value.
Resolving the problem
To resolve this issue, ensure that you set the value for pollingInterval property in the Resource management page.
Use UDCs instead of metrics in a batch job or stream creation
In certain situations, it is better to use UDCs than metrics that are same in multiple sub-groups or Resource types with the same aggregator in a batch job or stream.
Symptoms
When a Resource group or Resource type that has multiple subgroups and sub Resource types is selected from the Focal Resource type and group field from Batch
Analytics or Streaming analytics page, you also select common metrics that are in the sub-groups with same aggregator, you might notice that job or stream does not run
correctly.
For example, you select device as the Resource type and select card.metricA and cpu.metricA with aggregator as sum for both. The job or stream does not run as
expected.
Resolving the problem
To resolve this issue, create different UDCs for card.metricA and cpu.metricA and use those UDCs in the batch job or stream creation.
Retaining the metrics from Batch Analytics with weekly and monthly schedules
The metrics that are created with weekly, monthly, or custom schedules that are longer than 90 days granularity are not retained in the database tables.
Symptoms
Consider a batch job with the following example:
Job name: testEMGDLM
Metric: device!ICMP.Ping.Response.Time.ms
Start date: December 10th, 2022
End date: March 15thm 2023
Granularity: 1-day
Time period: last-month
Peak: 10 MAX
Metric Aggr: Sum
The metric, tsum_day_10peak_max_ICMP.Ping.Response.Time.ms is created in timeseries database. But the metric table is not created in the Diamond DB.
Causes
The issue is because of the default value of 90 for the setting in the Timeseries Service, timeseries.late.data.limit.day, and the time period to run the batch job
is more than 90 days.
Resolving the problem
To resolve this issue, follow these steps:
1. Log in to Telco Network Cloud Manager - Performance cloud web console.
2.
Select tncp from Namespace pane.
532 IBM Telco Network Cloud Manager - Performance 1.4.5

3.
Select tncp from Projects pane.
4.
Expand Config and Storage > Config Maps > common in the navigation pane.
5. Expand Workloads > Config Maps > common.
6. Add the following property in the common Config Map:
timeseries.late.data.limit.day:120
You are overriding the default value of 90 days to retain the metric data for 120 days.
7. Restart the Timeseries Services.
Not able to accept the certificate on Chrome browser on Mac
This issue is noticed in Chrome browser on Mac only.
Symptoms
When you want to view the Telco Network Cloud Manager - Performance Dashboards from Dashboard Application Services Hub, Chrome browser is not accepting the
certificate. Due to this issue, the dashboards are not accessible.
Resolving the problem
To work around this issue, manually, add the self-signed certificate to the keyAccess and then mark as Trusted. Follow these steps:
1. Save the certificate.
2. Add certificate to Mac key access.
3. Mark the certificate to Always Trust.
Managing resources for Cassandra and Inventory nodes
When you create a Pod, the Kubernetes scheduler selects a node for the Pod to run on. The scheduler ensures that, for each resource type, the sum of the resource
requests of the scheduled containers is less than the capacity of the node. You can also colocate some services to be installed on the same node.
Symptoms
Typically, NFS container is installed on the node that has the highest resources in your cluster. In Telco Network Cloud Manager - Performance, Cassandra and Inventory
containers are designed to co-locate with NFS node. If the NFS node does not have sufficient resources (CPU and memory), you might notice that Cassandra and
Inventory Services might not start. In a cluster with six nodes, the following error might be seen: To
0/6 nodes are available: 1 node(s) didn't match node selector, 5 Insufficient memory.
Resolving the problem
To resolve this issue, follow the workaround:
Log in to Kubernetes Dashboard and change the namespace to npi.
Click Pods in Workloads pane.
Click the Actions icon ( ) on Inventory Pod and select Edit.
Optional: Or, click the Inventory Pod, and then click Edit resource ( ).
The Edit a resource window opens.
Remove the following lines from the YAML file and click Update:
nodeSelector:
storage: nfs
If the Cassandra Service is still not started, then repeat step1 for Cassandra Service YAML file also.
Log in to your cloud web console and change the namespace to noi.
https://<master_node_IP>:<Dashboard_externalPort>
Click Pods in Workloads pane.
IBM Telco Network Cloud Manager - Performance 1.4.5 533

Click the Actions icon ( ) on Inventory Pod and select Edit.
Optional: Or, click the Inventory Pod, and then click Edit resource ( ).
The Edit a resource window opens.
Remove the following lines from the YAML file and click Update:
nodeSelector:
storage: nfs
If the Cassandra Service is still not started, then repeat step1 for Cassandra Service YAML file also.
CAUTION:
You might see a degradation in performance of both Inventory and Cassandra Services since the Pods must communicate across nodes.
Common issues in Telco Network Cloud Manager - Performance services
The following are the common issues that are found in microservice in Telco Network Cloud Manager - Performance.
When the Cassandra Service is down, the Inventory Service fails to reconnect. If that happens, restart the Inventory Service. See Start stop services.
The Flow Collector Service is unable to recover connection to Postgres Service after upgrade if the Flow Collector Service completed scale up before the Postgres Service.
To work around the issue, restart the Flow Collector Service.
The Inventory Service is unable to recover its connection to the Kafka Service if the Inventory Service is running before the Kafka Service. To work around this issue,
restart the Inventory Service.
After an upgrade, if you set the security config other than ldap in the common ConfigMap, you must change the manager annotation value to a value other than tncp-
operator.
Error in writing the Flow raw data to the database
Symptoms
You might notice the following error in the Flow Collector log file along with some Flow raw data loss in DiamondDB:
Failed to import:
java.io.IOException: Clean files request is failed for default.flow_raw_18. Not able to acquire the table status lock due to other o
Please try after some time.
Resolving the problem
To work around this issue, restart the DiamondDB Service.
When the device filter is changed from a drill-down Flow dashboard, Resource ID
mapping is incorrect
When you change the resource type from a drill-down Flow dashboard, the resource ID mapping is incorrect in the REST API call. It leads to incorrect data that is fetched
from other resource instead of resource in context.
Symptoms
Consider the following scenario,
When you access the Flow dashboards and drill down to any other Flow dashboard, change the resource type from the drill-down dashboard. You might notice that the
data that is displayed in the drill-down dashboard is not pertinent to the resource type in context.
You might also observe errors in the UI Service log file. The Resource ID mapping from the original device to the changed device from the filter on the drill-down
dashboard is in correct.
Resolving the problem
To work around this issue, change the values from all the filters to see the correct device or interface.
Changing the mandatory path setting
In each .model file, the mandatory path setting is shortest path to reach from source object to destination object. It is applicable for Wireless Technology Packs alone.
534 IBM Telco Network Cloud Manager - Performance 1.4.5

About this task
The mandatory path has a true or false value. To reflect the mandatory path setting changes, drop the metakey space and restart the Inventory Service.
Procedure
1. Log in to your cluster web console and change to the correct namespace where you installed Telco Network Cloud Manager - Performance.
2. Go to workloads > Pods, and then click inventory.
3. At the inventory Service, click Terminal.
4. At the inventory Service, click the Exec into pod ( ) icon.
5. At the prompt, change to the network-wireless directory and edit a .model file.
[basecamp@inventory-0 ]$ cd content/model/Relationship/network-wireless
[basecamp@inventory-0 network-wireless]$ cat bsc-cell.model
relationship contain bsc ->> cell
mandatoryPath = true
6. In the .model file, set the mandatoryPath value to true or false.
7. Stop the Inventory Service.
8. At the cassandra Pod, click the Exec into pod icon. Type cqlsh.
9. In the cqlsh prompt, type the following commands:
cqlsh> select * from system_schema.keyspaces ;
cqlsh> drop keyspace meta
10. Start the inventory service.
Delay in ICMP Ping collection for newly discovered devices
Symptoms
Consider the following scenario,
You created a new grouping rule and applied that group to an ICMP Ping profile.
A new device is introduced or the devices and their interfaces are updated in your network. These devices and their interfaces are with in the range of the grouping
rule that is applied to the ping profile.
In this scenario, you might notice that the device is discovered and the group reflects the new device immediately. But the Ping Collector takes almost an hour to consider
the newly discovered device and its interfaces and to display the details in the dashboards.
Causes
It is due to the Ping Collector resource cache that refreshes once in every hour.
Resolving the problem
To resolve this issue, follow these steps:
1. Log in to cloud web console of your cluster.
2.
Select tncp from Namespace pane.
3.
Select tncp from Projects pane.
4.
Expand Config and Storage > Config Maps > common in the pane in the navigation pane.
5. Expand Workloads > Config Maps > common.
6. Add the following property in the common Config Map:
"ping-collector.resource-refresh-interval-minutes": "14"
The default value is 60 minutes. The resource cache is refreshed in 14 minutes and the device or interface is considered by the Ping Collector as soon as it is
discovered.
7. Restart the Ping Collector Service.
Duplicate ICMP Ping metrics
Duplicate ICMP Ping metrics after upgrade
Symptoms
IBM Telco Network Cloud Manager - Performance 1.4.5 535

After the upgrade of Telco Network Cloud Manager - Performance to V1.4.5, you might notice duplicate ICMP Ping metrics in the Metric viewer dashboard. Two sets of the
same metrics appear with differences in capitalization as shown.
Old metrics
Icmp.Ping.Status
Icmp.Ping.Response.Time.ms
Icmp.Ping.Packet.Loss.Percent
New metrics
ICMP.Ping.Status
ICMP.Ping.Response.Time.ms
ICMP.Ping.Packet.Loss.Percent
Note: When these metrics are queried from the Metric viewer dashboard, only the new metrics return values and the old metrics do not return any values.
Troubleshooting Telco Network Cloud Manager - Performance Dashboards
Use this troubleshooting information when you view Telco Network Cloud Manager - Performance Dashboards.
Common issues in Telco Network Cloud Manager - Performance Dashboards
The following are the common issues that are found in Telco Network Cloud Manager - Performance Dashboards.
Common issues in Telco Network Cloud Manager - Performance Dashboards translated pages
The following are the common issues that are found in translated pages.
Kubernetes dashboard UI fails to start when the worker nodes are restarted
Common issues in Telco Network Cloud Manager - Performance Dashboards
The following are the common issues that are found in Telco Network Cloud Manager - Performance Dashboards.
If you log in to the Telco Network Cloud Manager - Performance Dashboards, with any user other than npiadmin user, you might not see the dashboards in IBM®
Carbon 10 Theme. Instead, you might see them in Carbon 9 Theme.
After you log in to the Telco Network Cloud Manager - Performance Dashboards with any user other than npiadmin user and want to log in back with npiadmin,
make sure to clear the browser cache, or close the browser and start a new session.
The Email dashboard URL and Email dashboard URL to link or embed shows no data that is found in the Metric Viewer History drill-down of mobile dashboards.
In mobile dashboards, badge widgets show precise values instead of rounded-up values.
For all grid charts in Load balancer dashboards, filter options do not work correctly for columns with decimal values and rounded off integer values.
In the Load balancer dashboards, you see JSON format errors after you open the Dashboard URL that was sent by the Email Dashboard URL to link or embed option.
When you change the filter, the grid updates, but the badge after the grid does not. To update the badge's value, select a row from the grid.
In the Source and destination details dashboard, if you reselect the source and destination, the reselected source label and destination label do not appear after
the Source – Destination: badge. Currently, no workaround exists.
In all dashboards, the data is not populated in timeseries chart when only one data point is available.
In flow dashboards, if no consecutive data points are available, the stacked area and area charts show no data points. The stacked areas and areas chart types need
at least two consecutive data points in order for the chart types to plot. However, only line charts show data points.
In flow dashboards, when you have one row in grid table, the data points in its chart widget are not visible for Areas, Stacked Areas, and Lines. However, hovering
over the Areas chart reveals the data points.
In donut charts, tooltips show incomplete names. In the grid, you can see complete names.
In flow dashboards, after you switch the data source, the chart will always remain the selected chart type. For example, from the Traffic Volume chart, you change
the chart type from the default Stacked Areas to Lines. When you switch the data source to Throughput, it shows a stacked areas chart type. When you switch the
data source back to Traffic Volume, it remains as line chart type. If you change from any chart type to grid chart, then it remains as grid chart forever, until you
refresh the dashboard.
In the timeseries data of all dashboards, the data granularity shows null data points within seven days for Last 365 days time period. For example, in the Inbound
Utilization (%) Trend and Outbound Utilization (%) timeseries charts of the Interface Traffic Monitoring dashboard.
In the Metric Viewer History dashboard, the link in the export email function is not working.
In mobile dashboards, the Email Dashboard URL to link or embed link is not working. To make the link valid, replace the "®ion" to "®ion".
In Schedule Tasks, the recurring email function is not working properly.
If you restart the dashboard pod, you must go to Schedule Tasks to reschedule your earlier scheduled and activated tasks.
In the CPUandMemoryUtilizationDetails and EnvironmentalHealthDetails dashboards, the EntityName filter populates all resources when no EntityResourceTypes
are available in the discovered devices. Therefore, ensure that discovered devices have resources data for the supported EntityResourceType (cpu, card, memory,
fan, powerSupply, temperature, and chassis).
In all dashboards, after you maximize the trend chart and minimize the same chart, the dashboard scrolls up instead of showing the following charts.
In Chrome, table contents are misaligned under Users and Groups.
To get all jobs to return records, restart Batch Analytics or Stream Analytics.
The Audit trail page fails to retrieve records when special characters are used in the Description field.
Leading and trailing double quotation marks are not accepted as part of resource property values. The double quotation marks are discarded. The Audit trail and
Resource management pages show resource property values without double quotation marks.
The create, delete, import, and update operations that use REST API with cURL keeps on running if the input JSON file contains more than 30 - 40 lines.
In the IP links performance overview dashboard, the time period from the URL in the Email Dashboard URL is different than the time period that you specify. The
drill-down Source and destination details dashboard also has this issue.
Initially, you can create two different Discovery profiles with different single or multiple IP addresses or hostnames, and different resource context value. If you
change one profile to make its single or multiple IP addresses or hostnames, and the different resource context value the same as the other profile, it is allowed.
Some charts or graphs show repeated values in the x-axis or y-axis when the consecutive decimal values are very close to each other.
In a chart or graph with distinct axis values, you see data points that are shown within two axis values. The data point's tooltip value is the same as one of the axis
values. This data point appears so because the data points are mapped as in raw values but tooltips are mapped with rounded-off values.
If the site is created but it does not appear in Resource management, restart the app pod.
536 IBM Telco Network Cloud Manager - Performance 1.4.5

When you click the URL received in email, the drill-down dashboard appears. In the drill-down dashboard, the dashboard tab title is different from the dashboard
title under the tab.
The Email dashboard URL and Email dashboard URL to link or embed are not working in all drill-down dashboards.
Some downloaded PDF files or emailed PDF files contain a grid with overlapped column text. Such PDF files are generated from dashboards where that grid has
static columns.
In the grid chart, the column filters are not working for decimal and integer values with a K, M, or G suffix.
When a line chart is switched to a grid, database column names show in the grid column names.
Database column names appear in grid column names in downloaded CSV and XLS files.
In Group configuration, the logical operators >, >=, <, and <= in the conditional filter do not work.
When a line chart is converted into a grid, the column filter where Equals is set to null does not filter null values.
The following issues are specific to the Metric viewer dashboard:
When you compare by resources, the tooltip for legends is missing if you select only a single resource.
When you compare by metrics, the timestamp displays differently on the x-axis and on the data point's tooltip.
When you compare by metrics, long integer values are visible on the y-axis, x-axis, and on the data point's tooltip.
The values Region and Market occur as a resource type in the Resource type list. These invalid values have no metrics.
Nonadmin users cannot generate charts.
The Metric viewer dashboard goes blank when you import an invalid file, such as an exported .pdf or .zip file.
You cannot export PDF or export all .zip file.
The following issues are specific to SD-WAN dashboards:
In all dashboards, in the line charts that are converted to grid tables, time filtering is not possible in the Timestamp column.
When you export PDF files of SD-WAN dashboards, the PDF has text alignment issues in the grid widget.
New resources are not cached until UI service is restarted.
The SD-WAN configuration page rejects valid URL input.
In gauge widgets, the numbers and number tooltips are not rounded up.
In the Application details grid in the Application performance dashboard, the Percentage of Total Traffic Volume values sum up to under or over 100% for all
the applications. This sum is not 100% because the number of occurrences of any application differs from other applications, which affects the percentage
values.
In the Application performance dashboard, when multiple Technology Packs from different vendors are installed, the Application filter shows incorrect
options. After you select Site, Vendor, and Device filters, the Application filter shows options that come from multiple Technology Packs instead of options
that are specific to the Technology Pack selected. Only after you select the Vendor or Device filter again, the correct options appear in the Application filter.
In the Tunnel QoE dashboard, when multiple Technology Packs from different vendors are installed, the Tunnel filter shows incorrect options. After you
select Site, Vendor, and Device filters, the Tunnel filter shows options that come from multiple Technology Packs instead of options that are specific to the
Technology Pack selected. Only after you select the Vendor or Device filter again, the correct options appear in the Tunnel filter.
When you export the dashboards in CSV or Excel formats, you might see these issues:
The startTimestamp and endTimestamp display in UNIX epoch time on timeseries chart. This issue is seen on Mobile Access and Core dashboards.
The timestamp is showing as Invalid Date for Traffic and Subscribers widgets. This issue is seen on Mobile Core dashboard. You might encounter this
issue in Firefox browser.
The duration and chart title values are empty.
When you export the dashboards in PDF format, you might see these issues:
You might notice that the PDF content is truncated and displays incorrect data or empty data.
If you swap the position of widgets in the Interface traffic monitoring dashboard, the generated PDF shows missing widgets.
If you add new widgets to the Interface traffic monitoring dashboard, you cannot export the dashboards in PDF format.
In the exported Load balancer overview dashboard PDF, the Top 5 Virtual Server by Current Connections chart title's tooltip differs from the chart title.
The High, Medium, and Low legends appear in dashboards but are missing in the downloaded PDF file.
You might see the following issues on the Telco Network Cloud Manager - Performance Administration pages:
Blank space on the page.
Extra scroll bar.
Vertical scroll bar does not work.
The following issues are specific to TNC-P monitoring dashboards:
In the TNC-P overview dashboard, a few of the PersistentVolumeClaims that are part of the tncp namespace are not listed in Total PersistentVolumeClaims
badges.
In the TNC-P PersistentVolumeClaim details dashboard, a few of the PersistentVolumeClaims that are part of the tncp namespace are not listed in
PersistentVolumeClaim Summary grid and PVC Utilization (%) Trend chart.
In the TNC-P Pod details dashboard, the restart count is not getting populated correctly on the heatmap when restarts happened before the first data was
collected.
In the TNC-P Pod details dashboard, all the labels do not display in the maximized view of Pod Restart Status chart.
Repeated colors of legends and line charts are visible on PVC Utilization (%) Trend.
In the TNC-P overview dashboard, the values of CPU Limit, CPU Request, Memory Request, and Memory Limit are not supported on OpenShift Container
Platform environment. They show as null values.
In the exported XLS file, the CPU Usage Summary and Memory Usage Summary tabs are blank.
In the Pod Summary dashboard, the CPU Utilization (%) and Memory Utilization (%) show null values in the grid.
In the TNC-P Node details dashboard, the Avg Utilization (%) column has null values in the CPU Usage Summary grid and Memory Usage Summary grid.
In the Node details dashboard, the Node Details grid shows null values for the CPU Utilization (%) column and Memory Utilization (%) column.
In the Container details dashboard, the Container field has an undefined value. To display the correct value, click Apply Filter.
In the Node details dashboard, the Cluster and Node fields have undefined values. To display the correct value, click Apply Filter.
In the Pod details dashboard, some pod values on the heatmap chart are not refreshed.
You cannot open an exported PDF file and your PDF reader displays an error message. Add the following line to the Dashboard service's YAML file:
- '-- http.max-request-size=5000000'
Save the YAML file and restart the Dashboard service.
Common issues in Telco Network Cloud Manager - Performance Dashboards
translated pages
IBM Telco Network Cloud Manager - Performance 1.4.5 537

The following are the common issues that are found in translated pages.
The numbers with decimal values in Telco Network Cloud Manager - Performance Dashboards are not displaying correctly.
This issue is seen on simplified Chinese and traditional Chinese language pages.
The Date and Time pattern in Telco Network Cloud Manager - Performance Dashboards is not displaying correctly.
For example, the Date and Time pattern display as, DD de mar 12:59, instead of DD/MM/YY HH:MM.
This issue is seen on Portuguese (Brazil), French, and German language pages.
Kubernetes dashboard UI fails to start when the worker nodes are restarted
Symptoms
When you restart the worker nodes from your Telco Network Cloud Manager - Performance cluster, you might notice that Kubernetes dashboard UI fails to start
automatically.
Resolving the problem
Run the following commands to start the Kubernetes dashboard manually.
kubectl scale --replicas=1 deployment/dashboard-metrics-scraper --namespace=kubernetesdashboard
kubectl scale --replicas=1 deployment/kubernetes-dashboard --namespace=kubernetesdashboard
Reference
Use the following reference information to enhance your understanding of IBM® Telco Network Cloud Manager - Performance and to help you work with IBM Telco
Network Cloud Manager - Performance effectively.
REST API definitions
Dashboard reference
SNMP Formula language reference
UDC expressions and functions reference
Configuring Flow devices
REST API definitions
The APIs in Telco Network Cloud Manager - Performance that give access to the database data for constructing the dashboards.
Using Telco Network Cloud Manager - Performance REST API commands requires the same permissions as using the web interface. These REST APIs are available so that
you can retrieve the data outside of the web interface.
Each REST resource contains information such as URLs, functions, parameters, descriptions, sample input, and output data.
All the REST APIs must be accessed via the Dashboard Service only.
In OpenShift® Container Platform environment, access the APIs by using the Dashboard Service route that is created after the installation of Telco Network Cloud
Manager - Performance and port number 80. For example, use the following format: <Dashboard_route>:80.
In K8 environment, access the APIs by using the hostname of any of the worker nodes in the cluster and Dashboard Service port number, which is 31443 by default.
For example, use the following format: https://<hostname>:<port>.
Where, <hostname> is the hostname of any worker node in your cluster and <port> is nodePort of the Dashboard Service, which is 31443.
Common REST API status codes
HTTP status code Generic description
200 Success
400 Failure
Metric APIs
REST APIs that retrieve entity metric data that is collected by various collectors in Telco Network Cloud Manager - Performance and analyzed by the analytics
services.
Flow APIs
REST APIs that are related Flow data that is collected by Flow Collector Service and analyzed by Flow Analytics Service.
REST APIs for Resource Management
Use these APIs to manage the resource types, their instances, and properties and store them in the Cassandra database.
REST APIs to configure the Telco Network Cloud Manager - Performance system
If you want to configure the system with REST APIs instead of the configuration UI pages, use this information. You can run the curl commands to configure in bulk
for all the actions on a page.
538 IBM Telco Network Cloud Manager - Performance 1.4.5

Metric APIs
REST APIs that retrieve entity metric data that is collected by various collectors in Telco Network Cloud Manager - Performance and analyzed by the analytics services.
anomalies
Provides anomalies in timeseries entity metric data.
lastValue
Retrieves the last value of metric data.
metrics
Provides a list of metrics that are available for the specified entities and time frame.
entity
Provides a list of entities and their properties for a resource type and search conditions.
resources
Retrieves the Resource type instances list that is stored in CarbonData database that is associated with Timeseries and DiamondDB Services.
resourceTypes
Retrieves the Resource types list that is stored in CarbonData database that is associated with Timeseries and DiamondDB Services.
summary
Provides a summary of the metric data.
timeseries
Provides timeseries entity metric data.
anomalies
Provides anomalies in timeseries entity metric data.
This API queries and retrieves information from THRESHOLD.STATE table.
URL
https://<dashboard_route>/insight/service/dataset/metric/anomalies
https://<dashboard_hostname>:<dashboard_port>/insight/service/dataset/metric/anomalies
https://<myserver.ibm.com>:31443/insight/service/dataset/metric/anomalies
Method
The supported request type.
https GET
URL parameters
Name Required Default value Description
entityNames No N/A Comma-separated list of resource IDs
metrics Yes N/A Comma-separated names of the metrics and their aggregation expression.
parentNames No N/A Comma-separated list of parent resource IDs
searchByProper
ties No N/A Resource filter that is based on resource properties value. It follows the JavaScript notation in this format,
resource.<propertyName><operators>
'<propertyValue>'
for example:
resource.id=='127.1.0.0'
Note: Property name and value are case-sensitive.
start No N/A The start of the period for which flow data that must be returned.
end No N/A The end of the period for which flow data that must be returned.
time No N/A The name of time-short cut used. For example:
last-hour
last-day
last-week
last-month
last-year
excludeParent No false A flag to exclude the parent ID from response.
IBM Telco Network Cloud Manager - Performance 1.4.5 539

Name Required Default value Description
childTypes No * Comma-separated list of entity types of node that must be filtered in the result. Supported childTypes filter
values are interface, device, probe, and * (All).
entityResource
Types No N/A Entity Type of node that must be filtered in result. For example,
interface
device
probe
physicalcard
site No ALL Configured site name.
bizHour No ALL Configured business hours for a site. Expected values are OFF, ON and ALL.
Sample URLs
/service/dataset/metric/anomalies?entityNames=127.1.0.0_interface:<1>,127.1.0.0_interface:
<2>&metrics=Network.Inbound.Octets.Bytes&time=lastweek
/service/dataset/metric/anomalies?entityNames=127.1.0.0_interface:
<1>&metrics=Network.Inbound.Octets.Bytes&start=1466008260000&end=1466011860000
/service/dataset/metric/anomalies?entityNames=127.1.0.0_interface:<1>,127.1.0.0_interface:
<2>&metrics=Network.Inbound.Octets.Bytes&start=1466008260000&end=1466011860000
/service/dataset/metric/anomalies?entityNames=T1
1/1,T11/2&start=1466008260000&end=1466011860000&metrics=Network.Inbound.Octets.Bytes
/service/dataset/metric/anomalies?parentNames=127.1.0.0&entities=127.1.0.0_interface:
<1>&start=1466008260000&end=1466011860000&metrics=Network.Inbound.Octets.Bytes,Network.Outbound.Octets.Bytes
/service/dataset/metric/anomalies?
parentNames=10.55.239.42,10.55.239.4&entityNames=T11/1&start=1466008260000&end=1466011860000&metrics=ifInDiscards
/service/dataset/metric/anomalies?start=1466008260000&end=1466011860000&metrics=ifInDiscards&resource.physicaladdress='30' AND
resource.location='KL'
/service/dataset/metric/anomalies?parentNames=10.55.239.42,10.55.239.4&metrics=Network.Outbound.Octets.Bytes&time=lastday&
childTypes=interface,device
Note:
At least one or more of the following parameters must be provided:
entityNames
parentNames
searchByProperties
entityResourceTypes
time or a combination of start AND or OR end must be provided.
time parameter is superseded by combination of start AND or OR end if both combinations are present and it must support last-hour and last_day only.
Define searchByProperties filter expression:
searchByProperties is a condition expression to filter target resources based on the properties. The condition expression has the following JavaScript notation:
<propertyName><operators>'<propertyValue>'
For example, resource.displayName=='myDevice'. Property name must be suffixed with resource.
The supported binary operators for properties filter are as follows:
==
!=
The supported logical operators for properties filter are as follows:
AND
OR
The supported partial search functions (regular expressions) for properties filter are as follows:
like
Not like
For example,
searchByProperties=resource.type=='device'
searchByProperties=resource.type=='device' AND resource.id=='127.0.0.0'
searchByProperties=resource.sysName=='10.55.239.40' AND resource.if==897
searchByProperties=resource.physicalAddress=='30' AND resource.location=='KL'
searchByProperties=resource.type=='device' AND resource.id=='127.*'
searchByProperties=resource.type=='device' AND resource.id.like'127.*'
Note: "%" is reserved keyword. It must be encoded with %25.
Error Response
{"errorMesg":"Either entities, parents, entityNames, parentNames or searchByProperties should be
provided"}
{
"errorMesg": "Invalid start, end and granularity combination. Granularity : 1 minute StartMs :
1568373360000 endMs : 1468375200000"
}
Response
The results are returned as JSON data that contains an array of the following fields:
Name Data type Description
540 IBM Telco Network Cloud Manager - Performance 1.4.5

Name Data type Description
entity number The entity that is associated with the time and metric value.
parent number The parent entity ID that is associated with the entity. The value is defaulted to -1 if enrichment fails.
entityName string The entity name. The value is defaulted to unknown if enrichment fails.
parentName string The entity’s parent name. The value is defaulted to unknown if enrichment fails.
metric string The metric name for the associated time and metric value.
type string The type of anomaly that is detected.
severity string The severity of the anomaly.
start number The time that is associated with the start of the anomaly.
end number The time that is associated with the end of the anomaly.
This field is available when the anomaly is ended, but not when anomaly is still outstanding.
value number The last violation metric value for the associated time
details string JSON blob that contains the details of the anomaly.
JSON code
[
{
"parent":6,
"entityName":"",
"parentName":"10.55.239.2",
"metric":"ifInDiscards",
"entity":59,
"details":"{'effectiveTimeStamp':1472098732320,'limitType':0,'upperLimit':10,'lowerLimit':5,'numEvents':2}",
"severity":"critical",
"type":"StaticThreshold",
"start":1472099473383,
"value":20
},
{
"parent":6,
"entityName":"0",
"parentName":"10.55.239.2",
"metric":"ifInDiscards",
"entity":81,
"details":"{'effectiveTimeStamp':1472098732320,'limitType':0,'upperLimit':10,'lowerLimit':5,'numEvents':2}",
"severity":"critical",
"type":"StaticThreshold",
"start":1472099473384,
"value":10
}
]
lastValue
Retrieves the last value of metric data.
This API queries and retrieves information from CarbonData database that is associated with Timeseries and DiamondDB Services.
URL
https://<dashboard_route>/insight/service/dataset/metric/lastValue
https://<dashboard_hostname>:<dashboard_port>/insight/service/dataset/metric/lastValue
https://<myserver.ibm.com>:31443/insight/service/dataset/metric/lastValue?
entities=ncim-217,ncim-218&metrics=snmpInBandwidth&time=last-hour
Method
The supported request type.
https GET
URL parameters
Name Required Default value Description
entities No N/A Comma-separated list of entity IDs
entityNames No N/A Comma-separated list of entity names
metrics Yes N/A Comma-separated names of the metrics. Also supports metricIDs.
parents No N/A Comma-separated list of main node IDs.
Note: Must be associated with childTypes for related metrics.
IBM Telco Network Cloud Manager - Performance 1.4.5 541

Name Required Default value Description
parentNames No N/A Comma-separated list of device names.
Note: Must be associated with childTypes for related metrics.
searchByPrope
rties No N/A Properties filter in this format,
"<propertyName>"<ops>'
<propertyValue>'
Note: Property name and value are case-sensitive.
For example:
"IFTYPESTRING"='ethernet-csmacd'
time No N/A Specific time values are as follows:
last-hour
last-day
last-week
last-month
last-year
Note: You need either start/end or time parameters in the URL.
start No N/A The start time for which flow data must be returned.
end No N/A The end time for which flow data must be returned.
excludeParent No false A flag to exclude the parent ID from response.
childTypes No * Comma-separated list of entity types of nodes that must be filtered in the result. By default, it is device and
interface. Supported childTypes filter values are as follows:
interface
device
probe
physicalcard
* (All)
entityResourc
eTypes No N/A Entity type of node that must be filtered in result. For example,
interface
device
probe
physicalcard
parentChildRe
lation No union Set operation between result from parent ID search and entity ID search. For example, intersection, union.
site No ALL Configured site name.
bizHour No ALL Configured business hours for a site. Expected values are OFF, ON and ALL.
Sample URLs
/insight/service/dataset/metric/lastValue?entities=ncim-217&metrics=snmpInBandwidth&
start=1466008260000&end=1466011860000
/insight/service/dataset/metric/lastValue?entities=ncim-217,ncim-218&metrics=snmpInBandwidth&
time=last-hour
/insight/service/dataset/metric/lastValue?entities=ncim-217&metrics=snmpInBandwidth&
time=last-hour
/insight/service/dataset/metric/lastValue?entities=ncim-217&metrics=snmpInBandwidth&
start=1466008260000&end=1466011860000
/insight/service/dataset/metric/lastValue?entityNames=T1 1/1,T1 1/2&metrics=snmpInBandwidth&
start=1466008260000&end=1466011860000
/insight/service/dataset/metric/lastValue?entities=ncim-217,ncim-218&metrics=snmpInBandwidth&
time=last-hour
/insight/service/dataset/metric/lastValue?metrics=snmpInBandwidth&time=lasthour&
searchByProperties="PHYSICALADDRESS"='30' AND "LOCATION"='KL'
/insight/service/dataset/metric/lastValue?parents=3&metrics=snmpInBandwidth&time=lastday&
childTypes=interface,device
Note:
At least one or more of the following parameters must be provided as follows:
entities
parents
entityNames
parentNames
searchByProperties
entityResourceTypes
time or a combination of start AND or OR end must be provided.
time parameter is superseded by combination of start AND or OR end if both combinations are present.
Supported operators for searchByProperties filter are as follows:
,
=
<>
IN
LIKE
AND
OR
542 IBM Telco Network Cloud Manager - Performance 1.4.5

For example,
searchByProperties="sysName"='"10.55.239.40"' AND "If"='897'
searchByProperties="sysName"='"10.55.239.40"' AND "If" IN ('897','898')
searchByProperties="sysName" like '"10.55.239.%25"' AND "If"='897'
Note: "%" is reserved keyword. It must be encoded with %25.
Error response
For example,
{
"errorMesg":"Either entities, parents, entityNames, parentNames or searchByProperties
should be provided"
}
Response
The results are returned as JSON data that contains an array of the following fields:
Name Data type Description
entity number The entity that is associated with the time and metric value.
parent number The parent entity ID associated with the entity.
entityName string The entity name. This value is defaulted as unknown if enrichment fails.
parentName string The parent entity name. This value is defaulted as unknown if enrichment fails.
MetricValue map Map of metric given in input parameters their values.
JSON code
[
{
"parent":2,
"entityName":"entity1",
"parentName":"parent2",
"health":10.0,
"entity":1,
"cpuUsage":10.0
},
{
"parent":4,
"entityName":"entity2",
"parentName":"parent4",
"health":10.0,
"entity":2,
"cpuUsage":10.0
}
]
metrics
Provides a list of metrics that are available for the specified entities and time frame.
This API queries and retrieves information from the CarbonData database that is associated with Timeseries and DiamondDB Services.
URL
https://<dashboard_route>/insight/service/dataset/metrics
https://<dashboard_hostname>:<dashboard_port>/insight/service/dataset/metrics
https://<myserver.ibm.com>:31443/insight/service/dataset/metrics?
entities=ncim-217,ncim-218&metrics=snmpInBandwidth&time=last-hour
Method
The supported request type.
https GET
URL parameters
Name Required Default value Description
IBM Telco Network Cloud Manager - Performance 1.4.5 543

Name Required Default value Description
entities No N/A Comma-separated list of entity IDs
entityNames No N/A Comma-separated list of entity names
resourceType No To get the metrics of a Resource type.
parents No N/A Comma-separated list of main node IDs
parentNames No N/A Comma-separated list of device names.
Note: Must be associated with childTypes for metrics.
searchByPrope
rties No N/A Properties filter in this format:
"<propertyName>"<ops>'
<propertyValue>'
Note: Property name and value are case-sensitive.
For example:
"IFTYPESTRING"='ethernet-csmacd'
time No N/A Specific time values are as follows:
last-hour
last-day
last-week
last-month
last-year
Note: You need either start/end or time parameters in the URL.
start No N/A The start time for which flow data must be returned.
end No N/A The end time for which flow data must be returned.
excludeParent No false A flag to exclude the parent ID from response.
childTypes No * Comma-separated list of entity types of nodes that must be filtered in the result. By default, it is device and
interface. Supported childTypes filter values are as follows:
interface
device
probe
physicalcard
* (All)
entityResourc
eTypes No N/A Entity Type of node that must be filtered in result. For example:
interface
device
probe
physicalcard
parentChildRe
lation No union Set operation between result from parent ID search and entity ID search. For example, intersection, union.
Sample URLs
/insight/service/dataset/metrics?resourceType=eUtranCell
/insight/service/dataset/metrics?entities=ncim-217&start=1466008260000&end=1466011860000
/insight/service/dataset/metrics?entities=ncim-217&time=last-hour
/insight/service/dataset/metrics?entityNames=T1 1/1,T1 1/2&time=last-hour
/insight/service/dataset/metrics?parents=3&time=last-month
/insight/service/dataset/metrics?parents=3,1&entities=ncim-86,ncim-217&time=last-month
/insight/service/dataset/metrics?parentNames=10.55.239.42,10.55.239.4&entityNames=T1 1/1&time=last-month
/insight/service/dataset/metrics?time=last-month&="PHYSICALADDRESS"='30' AND "LOCATION"='KL'
/insight/service/dataset/metrics?parents=3&time=last-day&childTypes=interface
Note:
At least one or more of the following parameters must be provided as follows:
entities
parents
entityNames
parentNames
entityResourceTypes
time or a combination of start AND or OR end must be provided.
time parameter is superseded by combination of start AND or OR end if both combinations are present.
Supported operators for searchByProperties filter are as follows:
,
=
<>
IN
LIKE
AND
OR
For example,
searchByProperties="sysName"='"10.55.239.40"' AND "If"='897'
544 IBM Telco Network Cloud Manager - Performance 1.4.5

searchByProperties="sysName"='"10.55.239.40"' AND "If" IN ('897','898')
searchByProperties="sysName" like '"10.55.239.%25"' AND "If"='897'
Note: "%" is reserved keyword. It must be encoded with %25.
Response
The results are returned as JSON data that contains an array of the following fields:
Name Data type Description
metric string The metric name
metricID long The metric ID for the associated time and metric value.
units string Unit of measurement for the metric. For example, #, %, undef
JSON code
[
{
"metric": "ifInDiscards",
"units": "#",
"metricId": 2118
},
{
"metric": "health",
"units": "undef",
"metricId": 2119
},
{
"metric": "snmpInBandwidth",
"units": "%",
"metricId": 2120
}
]
entity
Provides a list of entities and their properties for a resource type and search conditions.
This API queries and retrieves information from the aggregated tables in DiamondDB and Cassandra.
URL
https://<dashboard_route>/insight/service/dataset/metric/entity
https://<dashboard_hostname>:<dashboard_port>/insight/service/dataset/metric/entity
https://<myserver.ibm.com>:31443/insight/service/dataset/metric/entity
Method
The supported request type.
https GET
URL parameters
Name Required Default value Description
entityResourceT
ypes No N/A Comma-separated list of entity IDs
all No false Comma-separated list of entity names
properties No N/A Comma-separated list of properties to output.
Note: properties is not applicable for NetFlow resource types.
searchByPropert
ies No N/A Properties filter in this format,
"<propertyName>"<ops>'
<propertyValue>'
Note: Property name and value are case-sensitive.
For example:
"IFTYPESTRING"='ethernet-csmacd'
Note: searchByProperties is not applicable for NetFlow resource types.
IBM Telco Network Cloud Manager - Performance 1.4.5 545

Name Required Default value Description
scope true flow Scope must be set to true for ART and QoS resource types.
Note: For all the performance data that is collected and analyzed from your Cacti deployment scenario, scope
is set to cacti.
flowEnabled No false If set to true, the result must contain the flow enabled entities.
interfaceEnable
dNo false This parameter is applicable for resource type interface only. If set to true, it returns a list of interfaces for
which data collection is enabled.
parentChildRela
tion No union Set operation between result from parent ID search and entity ID search. For example, intersection, union.
site No ALL Configured site name.
bizHour No ALL Configured business hours for a site. Expected values are OFF, ON and ALL.
Sample URLs
/insight/service/dataset/metric/entity?entityResourceTypes=device
/insight/service/dataset/metric/entity?entityResourceTypes=interface&flowEnabled=true
/insight/service/dataset/metric/entity?entityResourceTypes=device&all=true
/insight/service/dataset/metric/entity?entityResourceTypes=interface&flowEnabled=true
/insight/service/dataset/metric/entity?
parentNames=10.53.17.207,10.53.12.200&entityResourceTypes=interface&scope=flow&interfaceEnabled=true
Note:
At least one or more of the following parameters must be provided,
entities
parents
entityNames
parentNames
searchByProperties
entityResourceTypes
Supported operators for properties filter are as follows,
,
=
<>
IN
LIKE
AND
OR
For example,
searchByProperties="sysName"='"10.55.239.40"' AND "If"='897'
searchByProperties="sysName"='"10.55.239.40"' AND "If" IN ('897','898')
searchByProperties="sysName" like '"10.55.239.%25"' AND "If"='897'
Note: "%" is reserved keyword. It must be encoded with %25.
Error response
For example,
{"errorMesg":"Either entities, parents, entityNames, parentNames, entityResourceTypes, or serachByProperties should be
provided"}
Response
The results are returned as JSON data that contains an array of the following fields:
Name Data type Description
entityId number An entity ID
entityName string Name of the entity
parentId number Parent entity ID
parentName string Parent entity name
properties map Map of properties that are given in input parameters their values.
inIfId number Inbound interface IDs for the entities if they are enriched.
outIfId number Outbound interface IDs for the entities if they are enriched.
JSON code without flowEnabled flag set is as follows:
[
{
"entityId":-1,
"entityName":"ALL",
"parentId":-1,
"parentName":"ALL"
},
{
"entityId":5,
"entityName":"10.55.239.202",
"parentId":5,
"parentName":"10.55.239.202"
},
{
"entityId":1,
546 IBM Telco Network Cloud Manager - Performance 1.4.5

"entityName":"10.55.239.201",
"parentId":1,
"parentName":"10.55.239.201"
},
{
"entityId":6,
"entityName":"10.55.239.4",
"parentId":6,
"parentName":"10.55.239.4"
},
{
"entityId":9,
"entityName":"10.55.239.221",
"parentId":9,
"parentName":"10.55.239.221"
},
{
"entityId":7,
"entityName":"10.55.239.249",
"parentId":7,
"parentName":"10.55.239.249"
},
{
"entityId":3,
"entityName":"10.55.239.3",
"parentId":3,
"parentName":"10.55.239.3"
},
{
"entityId":8,
"entityName":"10.55.239.250",
"parentId":8,
"parentName":"10.55.239.250"
},
{
"entityId":4,
"entityName":"10.55.239.203",
"parentId":4,
"parentName":"10.55.239.203"
}
]
JSON code with flowEnabled flag set is as follows:
[
{
"entityId":995,
"inIfId":8589936607,
"entityName":"Se1/0:0",
"parentName":"10.55.239.250",
"outIfId":8589936606,
"parentId":960
}
]
resources
Retrieves the Resource type instances list that is stored in CarbonData database that is associated with Timeseries and DiamondDB Services.
URL
https://<dashboard_route>/insight/service/dataset/resources
https://<dashboard_hostname>:<dashboard_port>/insight/service/dataset/resources
https://<myserver.ibm.com>:31443/insight/service/dataset/resources?
parentType=device&parentId=10.55.239.188&resourceType=interface
Method
The supported request type.
https GET
URL parameters
Name Required Default value Description
IBM Telco Network Cloud Manager - Performance 1.4.5 547

Name Required Default value Description
resourceType Yes N/A The Resource instances that must be filtered in the result. For example,
device
interface
memory
parentType No N/A The parent Resource type for the Resource type instance. resourceType parameter in the URL.
parentId No N/A The Parent Resource type instance ID for the Resource type resourceType parameter in the URL.
Sample URLs
/insight/service/dataset/resources?resourceType=device
/insight/service/dataset/resources?resourceType=ALL
/insight/service/dataset/resources?parentType=ALL&parentId=ALL&resourceType=card
/insight/service/dataset/resources?parentType=device&parentId=10.55.239.137&resourceType=interface
Note: When parent is needed to filter the result, both parentId and parentType parameters are mandatory in the query.
Error Response
{"errorMesg":"Either entities, parents, entityNames, parentNames or searchByProperties should be
provided"}
{
"errorMesg": "Invalid start, end and granularity combination. Granularity : 1 minute StartMs :
1568373360000 endMs : 1468375200000"
}
Response
The results are returned as JSON data that contains an array of the following fields:
Name Data type Description
id string The Resource type instance that is associated to the Resource type resourceType parameter in the URL. For example,
10.55.239.137_interface:<13>.
displayName string The user-friendly name of the Resource type instance resourceType parameter in the URL. For example, 10.55.239.137-
vlan_522.
JSON code
[
{
"id":"10.55.239.137_interface:<13>",
"displayName":"10.55.239.137-vlan_522"
},
{
"id":"10.55.239.137_interface:<5>",
"displayName":"10.55.239.137-eth0.1"
},
{
"id":"10.55.239.137_interface:<4>",
"displayName":"10.55.239.137-sit0"
},
{
"id":"10.55.239.137_interface:<2>",
"displayName":"10.55.239.137-eth0"
},
{
"id":"10.55.239.137_interface:<3>",
"displayName":"10.55.239.137-eth1"
},
{
"id":"10.55.239.137_interface:<1>",
"displayName":"10.55.239.137-lo"
}
]
resourceTypes
Retrieves the Resource types list that is stored in CarbonData database that is associated with Timeseries and DiamondDB Services.
URL
https://<dashboard_route>/insight/service/dataset/resourceTypes
https://<dashboard_hostname>:<dashboard_port>/insight/service/dataset/resourceTypes
548 IBM Telco Network Cloud Manager - Performance 1.4.5

https://<myserver.ibm.com>:31443/insight/service/dataset/resourceTypes?appendAll=true&parentOnly=true
Method
The supported request type.
https GET
URL parameters
Name Required Default value Description
appendAll No N/A Flag to append dummy Resource type ALL in response.
parentOnly No N/A Flag to get non-leaf Resource type.
parentType No N/A To get the child Resource type of a specific parent type.
parentId No N/A To get child Resource type of specific a parent Resource type and parent Resource type instance.
Sample URLs
/insight/service/dataset/resourceTypes?appendAll=true&parentOnly=true
/insight/service/dataset/resourceTypes?parentType=device
/insight/service/dataset/resourceTypes?parentType=device&parentId=10.55.239.137
Note:
The parameters appendAll and parentOnly are not supported in combination with parameter parentType and parentID.
The value ALL is case-insensitive.
Error Response
{"errorMesg":"Either entities, parents, entityNames, parentNames or searchByProperties should be
provided"}
{
"errorMesg": "Invalid start, end and granularity combination. Granularity : 1 minute StartMs :
1568373360000 endMs : 1468375200000"
}
Response
The results are returned as JSON data that contains an array of the following fields:
Name Data type Description
resourceType string Resource type. For example, ltmAggr.
JSON code
[
{"resourceType":"ltmAggr"},
{"resourceType":"poolMemberAggr"},
{"resourceType":"interface"}
]
summary
Provides a summary of the metric data.
This API queries and retrieves information from CarbonData database that is associated with Timeseries and DiamondDB Services.
URL
https://<dashboard_route>/insight/service/dataset/metric/summary
https://<dashboard_hostname>:<dashboard_port>/insight/service/dataset/metric/summary
https://<myserver.ibm.com>:31443/insight/service/dataset/metric/summary
Method
The supported request type.
IBM Telco Network Cloud Manager - Performance 1.4.5 549

https GET
URL parameters
Name Required Default value Description
entities No N/A Comma-separated list of entity IDs.
entityNames No N/A Comma-separated list of entity names.
metrics Yes N/A Comma-separated name of the metric expression that includes the type of aggregation.
For example, snmpInBandwidth, health, max(health), min(health)
parents No N/A Comma-separated list of main node IDs.
parentNames No N/A Comma-separated list of device names
searchByProp
erties No N/A Properties filter is in this format.
"<propertyName>"<ops>'
<propertyValue>'
Note: Property name and value are case-sensitive.
For example:
"IFTYPESTRING"='ethernet-csmacd'
start No N/A The start time for which flow data must be returned.
end No N/A The end time for which flow data must be returned.
Note: start and end parameters must be used together.
time No N/A Specific time values are as follows:
last-hour
last-day
last-week
last-month
last-year
Note: You need either start/end or time parameters in the URL.
sort No N/A Metric expression that defines the sort order of the records. Only one metric is allowed with the sort expression.
Prefix + or - to indicate sort direction.
count No -1 Number of entities summary that must be returned. Combined with sort provides topN or bottomN functions.
page No 1 The index of the page for data display. This parameter is supplied with count parameter to indicate page size. By
default, it is 1.
excludeParen
tNo false Flag to exclude the parent ID from the result. By default, this parameter is set to False.
childTypes No * Comma-separated list of entity types of nodes that must be filtered in the result. By default, it is device and
interface. Supported childTypes filter values are as follows:
interface
device
probe
physicalcard
* (All)
flatten No false Output of the result without nested the objects.
suppressSumm
ary No N/A Output of the result without the summary portion.
entityResour
ceTypes No N/A Entity Type of node that must be filtered in result. For example,
interface
device
probe
physicalcard
parentChildR
elation No union Set operation between the result from parent identifier search and entity identifier search.
flowEnabled No false If set to true, the result must contain the flow enabled entities.
site No ALL Configured site name.
bizHour No ALL Configured business hours for a site. Expected values are OFF, ON and ALL.
properties
No N/A Comma-separated list of properties to output. You can retrieve the source IP address and target IP address
properties. For example:
properties=sourceAddress,targetAddress
propertiesOrElse=sourceLocation:sourceAddress,
targetLocation:targetAddress
propertiesOr
Else
No N/A This parameter is required for IP Links Performance Overview and Source and Destination Details dashboards.
Most of the queries to the UI Service support source IP address and target IP address. However, if the source IP
address is not enriched, it shows only source IP address and not the target IP address. The properties
parameter displays the content as sourceLocation:sourceIP, targetLocation:targetIP. It also
supports string literal, targetLocation:'unknown', where it returns the targetLocation if available, else
returns the string unknown.
Sample URLs
550 IBM Telco Network Cloud Manager - Performance 1.4.5

/insight/service/dataset/metric/summary?entities=ncim-217&metrics=snmpInBandwidth&
start=1466008260000&end=1466011860000
/insight/service/dataset/metric/summary?entities=ncim-217,ncim-218&metrics=snmpInBandwidth&time=last-hour
/insight/service/dataset/metric/summary?entities=ncim-217&metrics=snmpInBandwidth&time=last-hour
/insight/service/dataset/metric/summary?entities=ncim-217&metrics=snmpInBandwidth&start=1466008260000&end=1466011860000
/insight/service/dataset/metric/summary?entityNames=T1 1/1,T1 1/2&metrics=snmpInBandwidth&start=1466008260000&
end=1466011860000
/insight/service/dataset/metric/summary?parents=3&metrics=max(health),min(health),avg(health),sum(health),
count(health)&time=last-month/insight
/insight/service/dataset/metric/summary?parents=3,4&entities=ncim-217,ncim-218&metrics=max(health),min(health),
avg(health),sum(health),count(health)&time=last-month
/insight/service/dataset/metric/summary?parents=3,4&entities=ncim-217,ncim-218&metrics=max(health),min(health),
avg(health),sum(health),count(health)&time=last-month&sort=-sum(health)
/insight/service/dataset/metric/summary?parents=3,4&entities=ncim-217,ncim-218&metrics=max(health),min(health),
avg(health),sum(health),count(health)&time=last-month&sort=-sum(health)&count=10
/insight/service/dataset/metric/summary?parentNames=10.55.239.42,10.55.239.4&entityNames=T11/1&metrics=max(health),
min(health),avg(health),sum(health),count(health)&time=last-month&sort=-sum(health)&count=10
/insight/service/dataset/metric/summary?entities=ncim-217,ncim-218&metrics=snmpInBandwidth&time=lasthour&page=2&count=10
/insight/service/dataset/metric/summary?metrics=snmpInBandwidth&time=last-hour&page=2&count=10&
searchByProperties="PHYSICALADDRESS"='30' AND "LOCATION"='KL'
/insight/service/dataset/metric/summary?parents=3&metrics=snmpInBandwidth&time=lastday&childTypes=interface,
device/service/dataset/metric/summary?metrics=ifInDiscards&time=last-hour&entityResourceType=interface
/insight/service/dataset/metric/summary?entities=ncim-138&metrics=max(ifInDiscards),sum(health),count(health)&
time=last-hour&flatten=true
/insight/service/dataset/metric/summary?entities=ncim-135&metrics=count(health)&time=lasthour&suppressSummary=true
/insight/service/dataset/metric/summary?entities=ncim-138&metrics=max(ifInDiscards),sum(snmpInBandwidth),
count(ifOutErrors)&time=lasthour&suppressSummary=false
/insight/service/dataset/metric/summary?entities=ncim-135&metrics=count(health)&time=lasthour&
parentChildRelation=[union/intersection]
/insight/service/dataset/metric/summary?entityResourceTypes=probe&metrics=Probe.Jitter.Outbound.One-way.Avg.ms&time=
last-hour&searchByProperties="testType"=%27jitter%27&suppressSummary=true&flatten=true&site=ALL&
bizHour=ALL&propertiesOrElse=sourceLocation:sourceAddress,targetLocation:targetAddress
Note:
At least one or more of the following parameters must be provided:
entities
parents
entityNames
parentNames
searchByProperties
entityResourceTypes
time or a combination of start AND or OR end must be provided.
The start and end parameters must be used together. The time parameter supersedes start and end if they are all present in the URL.
Supported operators for properties filter are as follows:
,
=
<>
IN
LIKE
AND
OR
propertiesOrElse
For example,
searcByProperties="IFADMINSTATUS"='"up" AND "If"="897"
searcByProperties="sysName"='"10.55.239.40" AND "If" IN ("897","898")'
searcByProperties="sysName" like '"10.55.239.%25" AND "If"="897"
Note: "%" is reserved keyword. It must be encoded with %25.
count must be provided with sort.
metric used in the sort parameter must be in one of the expressions that is used in metrics parameter.
When sort is not provided, output is sorted by entities and rank is shown as zero.
Error response
For example,
{"errorMesg":"Either entities, parents, entityNames, parentNames, entityResourceType or
searchByProperties should be provided"}
{
"errorMesg": "Invalid start, end and granularity combination. Granularity : 1 minute StartMs :
1568373360000 endMs : 1468375200000"
}
Response
The results are returned as JSON data that contains an array of the following fields:
Name Data type Description
total number Total number of records available
page number Current page number
count number Number of records in the page
items list List of metric values. The entity that is associated with the time and metric value.
IBM Telco Network Cloud Manager - Performance 1.4.5 551

Name Data type Description
entity number The entity that is associated with the time and metric value.
parent number The entity that is associated with the time and metric value.
entityName string The parent entity ID that is associated with the entity.
parentName string Parent entity name. This value is defaulted to unknown, if enrichment fails.
startTimestamp number The start time that is associated with the metric value.
endTimestamp number The end time that is associated with the metric value.
rank number The rank (1-N) of the record relative to all other entities based on sort. Defaults to 0 if sort parameter is not provided.
metricValues list The list metric names and their values.
metric string The metric expression for the associated time and metric value.
metricId long The metric ID for the associated time and metric value.
value number The metric value for the associated time, entity, and metric expression.
inIfId number In interface IDs for given entities if enriched.
outIfId number Out interface IDs for given entities if enriched.
JSON code without suppressSummary flag set:
{
"total":27,
"page":1,
"count":27,
"items":[
{
"entity":59,
"startTimestamp":1469515500000,
"endTimestamp":1469615500000,
"rank":1,
"metricValues":[
{
"metric":"min(health)",
"metricId":2118,
"value":0
},
{
"metric":"max(health)",
"metricId":2118,
"value":54
},
{
"metric":"avg(health)",
"metricId":2118,
"value":50
},
{
"metric":"avg(snmpInBandwidth)",
"metricId":2119,
"value":150
}
]
},
{
"entity":61,
"scope":"ibm-itnm",
"startTimestamp":1469515500000,
"endTimestamp":1469615500000,
"rank":2,
"metricValues":[
{
"metric":"min(health)",
"metricId":2118,
"value":0
},
{
"metric":"max(health)",
"metricId":2118,
"value":54
},
{
"metric":"avg(health)",
"metricId":2118,
"value":50
},
{
"metric":"avg(snmpInBandwidth)",
"metricId":2119,
"value":150
}
]
}
]
}
JSON code with suppressSummary flag set:
[
{
"entity":59,
"startTimestamp":1469515500000,
"endTimestamp":1469615500000,
"rank":1,
"metricValues":[
552 IBM Telco Network Cloud Manager - Performance 1.4.5

{
"metric":"min(health)",
"metricId":2118,
"value":0
},
{
"metric":"max(health)",
"metricId":2118,
"value":54
}
]
}
]
JSON code with flatten and without suppressSummary flags set:
{
"total":27,
"page":1,
"count":27,
"items":[
{
"entity":59,
"startTimestamp":1469515500000,
"endTimestamp":1469615500000,
"rank":1,
"min(health)":0,
"max(health)":54,
"avg(health)":50,
"avg(snmpInBandwidth)":150
},
{
"entity":61,
"startTimestamp":1469515500000,
"endTimestamp":1469615500000,
"rank":2,
"min(health)":54,
"avg(health)":50,
"avg(snmpInBandwidth)":150
}
]
}
JSON code with flatten and suppressSummary flag set:
[
{
"entity":59,
"startTimestamp":1469515500000,
"endTimestamp":1469615500000,
"rank":1,
"min(health)":0,
"max(health)":54
},
{
"entity":61,
"startTimestamp":1469515500000,
"endTimestamp":1469615500000,
"rank":2,
"min(health)":54,
"avg(health)":50,
"avg(snmpInBandwidth)":150
}
]
timeseries
Provides timeseries entity metric data.
This API queries and retrieves information from CarbonData database that is associated with Timeseries and DiamondDB Services.
URL
https://<dashboard_route>/insight/service/dataset/metric/timeseries
https://<dashboard_hostname>:<dashboard_port>/insight/service/dataset/metric/timeseries
https://<myserver.ibm.com>:31443/insight/service/dataset/metric/timeseries?entities=ncim-348
&metrics=ifInDiscards&time=last-hour
IBM Telco Network Cloud Manager - Performance 1.4.5 553

Method
The supported request type.
https GET
URL parameters
Name Required Default value Description
entities No N/A Comma-separated list of entity IDs.
entityNames No N/A Comma-separated list of entity names.
metrics Yes N/A Comma-separated list of metrics and their aggregation.
For example, snmpInBandwidth, health, max(health), min(health)
parents No N/A Comma-separated list of main node ID.
parentNames No N/A Comma-separated list of device names
searchByProp
erties No N/A Properties filter in this format:
<propertyName><ops>=='<propertyValue>'
Note: Property name and value are case-sensitive.
For example:
&searchByProperties=resource.deviceName=='BR-03-AKHMW'
start No N/A The start time for which flow data must be returned.
end No N/A The end time for which flow data must be returned.
time No N/A The name of the time short cut. For example:
last-hour
last-day
last-week
last-month
last-year
requestgranu
larity No N/A The granularity for which the data must be aggregated. The default granularity can be as follows:
1-minute
15-minute
30-minute
6-hour
1-day
7-day
sort No N/A An expression that defines the sort order of the records. Prefix + or - to indicate sort direction. For example,
+metric -upper_limit indicates that the sorting must be by metric in ascending order, and then by
upper_limit in descending order.
childTypes No * Comma-separated list of entity types of nodes that must be filtered in the result. By default, it is device and
interface. Supported childTypes filter values are as follows:
interface
device
probe
physicalcard
artTarget
qosQueue
* (All)
excludeParen
tNo N/A Flag to exclude the parent ID from the result. By default, this parameter is set to False.
flatten No false Output of the result without nested the objects.
entityResour
ceTypes No N/A Entity Type of node that must be filtered in result. For example,
interface
device
probe
physicalcard
parentChildR
elation No union Set operation between result from parent ID search and entity ID search. For example, intersection, union.
site No ALL Configured site name.
bizHour No ALL Configured business hours for a site. Expected values are OFF, ON and ALL.
properties No N/A Comma-separated list of properties that are returned for the entities that are specified.
Sample URLs
/insight/service/dataset/metric/timeseries?entities=ncim-217&metrics=snmpInBandwidth&start=1466008260000&end=1466011860000
/insight/service/dataset/metric/timeseries?entities=ncim-217&metrics=snmpInBandwidth&time=last-hour
/insight/service/dataset/metric/timeseries?entities=ncim-217&metrics=snmpInBandwidth&time=lasthour&requestgranularity=5-min
/insight/service/dataset/metric/timeseries?entities=ncim-217&metrics=snmpInBandwidth&start=1466008260000&end=1466011860000
&requestgranularity=30%20min
/insight/service/dataset/metric/timeseries?entityNames=T1 1/1,T1 1/2&metrics=snmpInBandwidth&start=1466008260000&
554 IBM Telco Network Cloud Manager - Performance 1.4.5

end=1466011860000&requestgranularity=30%20min
/insight/service/dataset/metric/timeseries?parents=3&metrics=max(health),min(health),avg(health),sum(health),count
(health)&time=last-month&requestgranularity=30%20min
/insight/service/dataset/metric/timeseries?parents=3&entities=ncim-86&metrics=max(health),min(health),avg(health),
sum(health),count(health)&time=last-month
/insight/service/dataset/metric/timeseries?parentNames=10.55.239.42,10.55.239.4&entityNames=T11/1&metrics=max(health),
min(health),avg(health),sum(health),count(health)&time=last-month
/insight/service/dataset/metric/timeseries?metrics=max(health),min(health),avg(health),sum(health),count(health)&time
=last-month&searchByProperties=resource.physicaladdress='30' AND resource.location='KL'
/insight/service/dataset/metric/timeseries?parents=3&metrics=snmpInBandwidth&time=lastday&childTypes=interface,device
/insight/service/dataset/metric/timeseries?entityResourceTypes=probe&metrics=Probe.Echo.Probe.Loss.Percent&
parentNames=10.55.239.235&start=1561381980000&end=1561468379000&count=10&
properties=sourceAddress,targetAddress,vendor
Note:
At least one or more of the following parameters must be provided as follows:
entities
parents
entityNames
parentNames
searchByProperties
entityResourceTypes
time or a combination of start and end or start or end must be provided.
Sort by metric, entitities, and timestamp are only supported.
The start and end parameters must be used together. The time parameter supersedes start and end if they are all present in the URL.
time parameter is superseded by combination of start AND or OR end.
Supported operators for properties filter are as follows:
,
=
<>
IN
LIKE
AND
OR
For example,
searchByProperties=resource.sysName=='10.55.239.40' AND resource.If=='897'
searchByProperties=resource.sysName=='10.55.239.40' AND resource.If IN ('897','898')
searchByProperties=resource.sysName like '10.55.239.%25' AND resource.If=='897'
Note: "%" is reserved keyword. It must be encoded with %25.
If requestgranularity is not provided, it is computed as follows:
If time range is <= 3 hours and <=24 hour, then granularity = 1 minute.
If time range is >24 hour and <=7 days, granularity = 1-hour.
If time range is >7 and <=90 days, granularity = 1 day.
If time range is between 90 days and 359 days, granularity is 1-week.
If time range >= 360 days, granularity is 1 month.
When the parents or parentNames and entities or entityNames are used in the same URL and the parentChildRelation is equal to intersection, the
result is related to the specific parent and entity. By default, the relation is union, and displays all the parents and entities.
Special behavior
When you specify a granularity period with a start and end time in your query, the API engine always returns the data from the next available round-up time. For example,
if you give a query as follows:
https://<myserver.ibm.com>:31443/insight/service/dataset/metric/timeseries?entities=43064,188&
metrics=ifInDiscards&start=1497052800000&end=1497117600000&requestgranularity=18-hours
Start time is calculated based on the aggregation round-up time. For 18-hrs granularity, the round-up aggregation times for the start time of 9 June 2017 12:00:00 AM
are:
9 June 2017 12:00:00 PM
10 June 2017 6:00:00 AM
11 June 2017 12:00:00 AM
The query returns the aggregated data from next available round-up time that is 10 June 2017 6:00:00 AM and not from 10 June 2017 12:00:00 AM.
Note: This behavior is noticed with timeseries API only.
Error response
For example,
{"errorMesg":"Either entities, parents, entityNames, parentNames or serachByProperties should be provided"}
{
"errorMesg": "Invalid start, end and granularity combination. Granularity : 1 minute StartMs : 1568373360000
endMs : 1468375200000"
}
}
Response
IBM Telco Network Cloud Manager - Performance 1.4.5 555

The results are returned as JSON data that contains an array of the following fields:
Name Data type Description
entity number The entity that is associated with the time and metric value.
parent number The parent entity ID that is associated with the entity.
entityName string The entity name. The value is defaulted to unknown if enrichment fails.
parentName string The entity’s parent name. The value is defaulted to unknown if enrichment fails.
metric string The metric name for the associated time and metric value
metricId long The metric ID for the associated time and metric value.
timestamp number The time that is associated with the metric value.
value number The metric value for the associated time
<property> string Values of the requested properties that are specified in the request URL.
JSON code without flatten parameter set:
[
{
"parent":6,
"timestamp":1471503616000,
"entityName":"0",
"parentName":"10.55.239.2",
"metric":"ifOutErrors",
"metricId":2118,
"entity":86,
"value":5398
},
{
"parent":-1,
"timestamp":1471501946000,
"entityName":"unknown",
"parentName":"unknown",
"metric":"ifOutErrors",
"metricId":2118,
"entity":134,
"value":40
},
{
"parent":8,
"timestamp":1471501956000,
"entityName":"T1 1/2",
"parentName":"10.55.239.4",
"metric":"ifOutErrors",
"metricId":2118,
"entity":114,
"value":0
}
]
JSON code with flatten parameter set:
[
{
"parent":587,
"timestamp":1506250800000,
"entityName":"0",
"parentName":"10.55.239.31",
"AVG(ifInDiscards)":6,
"entity":607,
"SUM(ifInDiscards)":6
},
{
"parent":587,
"timestamp":1506258000000,
"entityName":"0",
"parentName":"10.55.239.31",
"AVG(ifInDiscards)":6,
"entity":607,
"SUM(ifInDiscards)":6
}
]
JSON code with properties
[{
"targetAddress":"4.20.45.112",
"parent":3202,
"timestamp":1561423380000,
"entityName":"10.55.239.235_udpEcho:<201>",
"parentName":"10.55.239.235",
"metric":"Probe.Echo.Probe.Loss.Percent",
"sourceAddress":"20.10.11.119",
"entity":3878,
"vendor":"Cisco",
"value":50
},
{
"targetAddress":"4.10.110.47",
"parent":3202,
"timestamp":1561387380000,
"entityName":"10.55.239.235_echo:<106>",
"parentName":"10.55.239.235",
"metric":"Probe.Echo.Probe.Loss.Percent",
"sourceAddress":"10.25.238.209",
556 IBM Telco Network Cloud Manager - Performance 1.4.5

"entity":3852,
"vendor":"Cisco",
"value":100
}
]
Flow APIs
REST APIs that are related Flow data that is collected by Flow Collector Service and analyzed by Flow Analytics Service.
aggregation
Provides a list of Flow aggregations that are visible to the user.
qossummary
Provides the summary of policyQosQueueDrop flow metric that measures the QoS queue drops. This API is applicable for Flow data only.
summary
Provides the top 10 values for an aggregation on a flow interface over a period. This API is specific for Flow data only.
timeseries
Provides a timeseries of data for an aggregation on a flow interface over a period. For timeseries return with top10 query, the utilization is only calculated if the
speed information is available in NCIM database. If the information is not available, value null is returned.
aggregation
Provides a list of Flow aggregations that are visible to the user.
This API queries and retrieves information from CFG.AGGREGATION_DISABLE table.
URL
https://<dashboard_route>/service/dataset/flow/aggregation
https://<dashboard_hostname>:<dashboard_port>/service/dataset/flow/aggregation
https://<myserver.ibm.com>:31443/service/dataset/flow/aggregation
Method
The supported request type.
https GET
URL parameters
Name Required Default value Description
visible No true Fields that must be returned.
Sample URLs
/service/dataset/flow/aggregation
/service/dataset/flow/aggregation/?visible=true
Response
The results are returned as JSON data that contains an array of the following fields:
Name Data type Description
aggregation string The key for the aggregation on the flow metric.
agg_fields string The columns that are used to group by for the calculation of aggregation.
aggregation_name string The name of the aggregation on the flow metric.
visible boolean A flag to indicate whether the aggregation is visible to the user or not.
enabled boolean A flag to indicate whether the aggregation is enabled by the administrator or not.
order_id number It indicates the sorting order of this list.
JSON code with visible flag set to true:
[
{
"aggregation": "app",
IBM Telco Network Cloud Manager - Performance 1.4.5 557

"aggregation_name": "Top Applications",
"agg_fields": "APP_NAME",
"visible": true,
"enabled": true,
"order_id": 1
},
{
"aggregation": "app_srctos",
"aggregation_name": "Top Applications with Source ToS",
"agg_fields": "APP_NAME, SRC_TOS",
"visible": true,
"enabled": true,
"order_id": 2
},
{
"aggregation": "srcip",
"aggregation_name": "Top Sources",
"agg_fields": "SRC_IP",
"visible": true,
"enabled": true,
"order_id": 3
},
{
"aggregation": "srcip_app",
"aggregation_name": "Top Sources with Application",
"agg_fields": "SRC_IP, APP_NAME",
"visible": true,
"enabled": true,
"order_id": 4
},
{
"aggregation": "dstip",
"aggregation_name": "Top Destinations",
"agg_fields": "DST_IP",
"visible": true,
"enabled": true,
"order_id": 5
},
{
"aggregation": "dstip_app",
"aggregation_name": "Top Destinations with Application",
"agg_fields": "DST_IP, APP_NAME",
"visible": true,
"enabled": true,
"order_id": 6
},
{
"aggregation": "conv",
"aggregation_name": "Top Conversations",
"agg_fields": "SRC_IP, DST_IP",
"visible": true,
"enabled": true,
"order_id": 7
},
{
"aggregation": "conv_app",
"aggregation_name": "Top Conversations with Application",
"agg_fields": "SRC_IP, DST_IP, APP_NAME",
"visible": true,
"enabled": true,
"order_id": 8
},
{
"aggregation": "conv_tos",
"aggregation_name": "Top Conversations with ToS",
"agg_fields": "SRC_IP, DST_IP, SRC_TOS",
"visible": true,
"enabled": true,
"order_id": 9
},
{
"aggregation": "prot",
"aggregation_name": "Top Protocols",
"agg_fields": "PROTOCOL_ID",
"visible": true,
"enabled": true,
"order_id": 10
},
{
"aggregation": "prot_app",
"aggregation_name": "Top Protocols with Application",
"agg_fields": "PROTOCOL_ID, APP_NAME",
"visible": true,
"enabled": true,
"order_id": 11
},
{
"aggregation": "prot_srcip",
"aggregation_name": "Top Protocols with Source Ip",
"agg_fields": "PROTOCOL_ID, SRC_IP",
"visible": true,
"enabled": true,
"order_id": 12
},
{
"aggregation": "prot_dstip",
558 IBM Telco Network Cloud Manager - Performance 1.4.5

"aggregation_name": "Top Protocols with Destination Ip",
"agg_fields": "PROTOCOL_ID, DST_IP",
"visible": true,
"enabled": true,
"order_id": 13
},
{
"aggregation": "prot_conv",
"aggregation_name": "Top Protocols with Conversation",
"agg_fields": "PROTOCOL_ID, SRC_IP, DST_IP",
"visible": true,
"enabled": true,
"order_id": 14
},
{
"aggregation": "srcas",
"aggregation_name": "Top Source Autonomous System",
"agg_fields": "BGP_SRC_AS_NUM",
"visible": true,
"enabled": true,
"order_id": 15
},
{
"aggregation": "dstas",
"aggregation_name": "Top Destination Autonomous System",
"agg_fields": "BGP_DST_AS_NUM",
"visible": true,
"enabled": true,
"order_id": 16
},
{
"aggregation": "conv_as",
"aggregation_name": "Top Autonomous System Conversations",
"agg_fields": "BGP_SRC_AS_NUM, BGP_DST_AS_NUM",
"visible": true,
"enabled": true,
"order_id": 17
},
{
"aggregation": "srctos",
"aggregation_name": "Top Source ToS",
"agg_fields": "SRC_TOS",
"visible": true,
"enabled": true,
"order_id": 18
},
{
"aggregation": "hierarchy_queueid",
"aggregation_name": "Top QoS Hierarchies with Queue Id",
"agg_fields": "POLICY_QOS_CLASSIFICATION_HIERARCHY, POLICY_QOS_QUEUE_ID",
"visible": true,
"enabled": true,
"order_id": 19
},
{
"aggregation": "dstipgroup",
"aggregation_name": "Top Destination Ip Groups",
"agg_fields": "DST_IP_GROUP",
"visible": true,
"enabled": true,
"order_id": 20
},
{
"aggregation": "dstipgroup_app",
"aggregation_name": "Top Destination Ip Groups with Application",
"agg_fields": "DST_IP_GROUP, APP_NAME",
"visible": true,
"enabled": true,
"order_id": 21
},
{
"aggregation": "dstipgroup_prot",
"aggregation_name": "Top Destination Ip Groups with Protocol",
"agg_fields": "DST_IP_GROUP, PROTOCOL_ID",
"visible": true,
"enabled": true,
"order_id": 22
},
{
"aggregation": "dstipgroup_tos",
"aggregation_name": "Top Destination Ip Groups with Source ToS",
"agg_fields": "DST_IP_GROUP, SRC_TOS",
"visible": true,
"enabled": true,
"order_id": 23
},
{
"aggregation": "srcipgroup",
"aggregation_name": "Top Source Ip Groups",
"agg_fields": "SRC_IP_GROUP",
"visible": true,
"enabled": true,
"order_id": 24
},
{
"aggregation": "srcipgroup_app",
IBM Telco Network Cloud Manager - Performance 1.4.5 559

"aggregation_name": "Top Source Ip Groups with Application",
"agg_fields": "SRC_IP_GROUP, APP_NAME",
"visible": true,
"enabled": true,
"order_id": 25
},
{
"aggregation": "srcipgroup_prot",
"aggregation_name": "Top Source Ip Groups with Protocol",
"agg_fields": "SRC_IP_GROUP, PROTOCOL_ID",
"visible": true,
"enabled": true,
"order_id": 26
},
{
"aggregation": "srcipgroup_tos",
"aggregation_name": "Top Source Ip Groups with Source ToS",
"agg_fields": "SRC_IP_GROUP, SRC_TOS",
"visible": true,
"enabled": true,
"order_id": 27
},
{
"aggregation": "convgroup",
"aggregation_name": "Top Ip Group Conversations",
"agg_fields": "SRC_IP_GROUP, DST_IP_GROUP",
"visible": true,
"enabled": true,
"order_id": 28
}
{
"aggregation": "convgroup_app",
"aggregation_name": "Top Ip Group Conversations with Application",
"agg_fields": "SRC_IP_GROUP, DST_IP_GROUP, APP_NAME",
"visible": true,
"enabled": true,
"order_id": 29
}
]
JSON code with visible flag set to false:
[
{
"aggregation": "convgroup_prot",
"aggregation_name": "Top Ip Group Conversations with Protocol",
"agg_fields": "SRC_IP_GROUP, DST_IP_GROUP, PROTOCOL_ID",
"visible": false,
"enabled": false,
"order_id": 1
},
{
"aggregation": "convgroup_tos",
"aggregation_name": "Top Ip Group Conversations with Source ToS",
"agg_fields": "SRC_IP_GROUP, DST_IP_GROUP, SRC_TOS",
"visible": false,
"enabled": false,
"order_id": 2
}
]
qossummary
Provides the summary of policyQosQueueDrop flow metric that measures the QoS queue drops. This API is applicable for Flow data only.
This API queries and retrieves information from FLOW_METRIC.RAW, and other FLOW_METRIC. 1MIN/30MIN/1DAY AGGREGATION tables.
URL
https://<dashboard_route>/service/dataset/aggregation/qossummary
https://<dashboard_hostname>:<dashboard_port>/service/dataset/aggregation/qossummary
https://<myserver.ibm.com>:31443/service/dataset/aggregation/
qossummary?entity=127.0.0.1-533&start=1505887200000&
end=1505888940000&count=10
Method
The supported request type.
560 IBM Telco Network Cloud Manager - Performance 1.4.5

https GET
URL parameters
Name Required Default value Description
entity Yes N/A The entity ID representing the interface.
The three type of entities are:
<FLOW_METRIC.INTERFACE.exporter_ip> -<FLOW_METRIC.INTERFACE.if_index>
ncim-<NCIM.NETWORK_INTERFACES. entityID>
flow-<FLOW_METRIC.INTERFACE. entityID>
start Yes N/A The start of the period for which flow data that must be returned.
end Yes N/A The end of the period for which flow data that must be returned.
time Yes N/A The name of time short cut:
last-hour
last-day
last-week
last-month
last-year
count No -1 Number of queues to return. For example, top 10 talkers of the resource.
remaining No false A flag to indicate whether a row with the total of the remaining records must be provided.
Sample URL
/service/dataset/aggregation/qossummary?entity=127.0.0.1-533&start=1505887200000&
end=1505888940000&count=10
/service/dataset/aggregation/qossummary?entity=ncim-342&time=last-hour
/service/dataset/aggregation/qossummary?entity=ncim-342&time=last-hour&remaining=true
Error response
For example:
{
"errorMesg": "Invalid start, end and granularity combination. Granularity : 1 minute StartMs :
1568373360000 endMs : 1468375200000"
}
Response
The results are returned as JSON data that contains an array of the following fields:
Name Data type Description
rank number Rank (1-10) of the record that is relative to all other records. Rank 11 indicates remaining records in total.
QueueId number Policy QoS Queue ID
hierarchyName string The hierarchy name for the queue combined with policy name and class name in format <policyName>-<comma-
separated-list of
classNames>.
policyName string QoS policy name
classNames string QoS Class Name
droppedPackets number Sum of policyQosQueueDrop metric
droppedPacketPercent number Percent of policyQosQueueDrop for this queue over total policyQosQueueDrop for this interface
droppedPacketOverTotalPa
cket number Percent of policyQosQueueDrop over total number of packets that pass through this interface.
JSON code:
[
{
"rank":1,
"policyName":"Policy1",
"hierarchyName":"Policy1-Class1",
"droppedPacketPercent":1.169494703290522,
"droppedPacketOverTotalPacket":21.169494703290522,
"droppedPackets":499,
"QueueId":13,
"classNames":"Class1"
},
{
"rank":2,
"policyName":"Policy2",
"hierarchyName":"Policy2-Class1,Class11",
"droppedPacketPercent":1.3077716321364956,
"droppedPacketOverTotalPacket":21.169494703290522,
"droppedPackets":558,
"QueueId":8,
"classNames":"Class1,Class11"
IBM Telco Network Cloud Manager - Performance 1.4.5 561

}
]
summary
Provides the top 10 values for an aggregation on a flow interface over a period. This API is specific for Flow data only.
This API queries and retrieves information from FLOW_METRIC.RAW, and other FLOW_METRIC. 1MIN/30MIN/1DAY AGGREGATION tables.
URL
https://<dashboard_route>/service/dataset/aggregation/summary
https://<dashboard_hostname>:<dashboard_port>/service/dataset/aggregation/summary
https://<myserver.ibm.com>:31443/service/dataset/aggregation
/summary?aggregation=app_srctos&entity=ncim-102&time=lasthour&granularity=1-minutes
Method
The supported request type.
https GET
URL parameters
Name Required Default value Description
entity Yes N/A The entity ID that represents the interface.
The three type of entities are:
<FLOW_METRIC.INTERFACE.exporter_ip> -<FLOW_METRIC.INTERFACE.if_index>
ncim-<NCIM.NETWORK_INTERFACES.entityID>
flow-<FLOW_METRIC.INTERFACE.entityID>
aggregation Yes N/A The aggregation ID that represents how the data must be aggregated.
direction No Both The direction of the flow data that must be returned.
start Yes N/A The start time of the period for which flow data must be returned.
end Yes N/A The end time of the period for which flow data must be returned.
time Yes N/A The name of time short cut:
last-hour
last-day
last-week
last-month
granularity No See Note. The granularity for which the data must be aggregated. For example, 5 minutes, 14000 minutes.
remaining No false A flag to indicate whether a row with the total of the remaining records must be provided.
extendedAppIn
fo No false A flag to indicate whether app base aggregation result contains additional NBAR, and NBAR2 application
information as follows:
description
businessRelevance
applicationGroup
applicationCategory
applicationSubcategory
p2p_technology
tunnelTechnology
encryptedTechnology
Sample URL
/service/dataset/aggregation/summary?aggregation=app_srctos&entity=ncim-102&time=lasthour&
granularity=1-minutes
/service/dataset/aggregation/summary?
aggregation=app&entity=ncim-102&time=lasthour&granularity=1-minutes&extendedAppInfo=true
562 IBM Telco Network Cloud Manager - Performance 1.4.5

Error response
For example:
{
"errorMesg": "Invalid start, end and granularity combination. Granularity : 1 minute StartMs :
1568373360000 endMs : 1468375200000"
}
{
"errorMesg":"Missing mandatory parameter :aggregation"
}
Response
The results are returned as JSON data that contains an array of the following fields:
Name Data type Description
rank number Rank (1-10) of the record that is relative to all other records. Rank 11 indicates remaining records in total.
application string Application name as specified in the NBAR2 Protocol Pack.
Note: Applicable only if the extendedAppInfo parameter is enabled.
description string Description of the application as specified in the NBAR2 Protocol Pack.
Note: Applicable only if the extendedAppInfo parameter is enabled.
srctos string Note: Applicable only if the extendedAppInfo parameter is enabled.
octets number The aggregated octets value for a time period
packets number The aggregated packets value for a time period
percentage number The relative percentage of total octets for a time period.
maxThroughput number The granularity wise max throughput(octets) for a time period
avgThroughput number The granularity wise avg throughput(octets) for a time period
maxUtilization number The granularity wise max utilization(octets) for a time period
avgUtilization number The granularity wise max utilization(octets) for a time period
label string Aggregation key values that are separated by /.
businessRelevance string Specifies whether the application is considered relevant to the business activity of the organization.
Note: Applicable only if the extendedAppInfo parameter is enabled.
applicationGroup string Allows the configuration of applications that are grouped based on the same networking application as the match criteria.
Note: Applicable only if the extendedAppInfo parameter is enabled.
applicationCategor
ystring Allows you to configure applications that are grouped based on the first level of categorization for each protocol as the
match criteria.
Note: Applicable only if the extendedAppInfo parameter is enabled.
applicationSubCate
gory string Provides the option to configure applications that are grouped based on the second level of categorization for each protocol
as the match criteria.
Note: Applicable only if the extendedAppInfo parameter is enabled.
p2p_technology string Provides the option to indicate whether a protocol uses p2p technology.
Note: Applicable only if the extendedAppInfo parameter is enabled.
tunnelTechnology string Provides the option to configure protocols based on whether a protocol tunnels the traffic of other protocols.
Note: Applicable only if the extendedAppInfo parameter is enabled.
encryptedTechnolog
ystring Provides the option to configure applications that are grouped based on whether the protocol is an encrypted protocol or
not as the match criteria.
Note: Applicable only if the extendedAppInfo parameter is enabled.
Note:
The actual fields returned depend on the type of aggregation in the URL. The rank, octets, and percentage values are constant for all aggregations.
If granularity is not provided, it is computed as follows:
If time range is <= 3 hours, granularity = 1 minute.
If time range is >3 hour and <=12 hour, granularity = 15 minutes.
If time range is >12 hour and <=7 days, granularity = 30 minutes.
If time range is between 7 and <90 days, granularity = 1 day.
If time range is >=90 days, granularity = 7days.
The supported aggregations are as follows:
app – (Application)
app_srctos – (Applications, Source TOS)
conv – (Source, Destination)
conv_app – (Source, Destination, Application)
conv_as – (Source Autonomous System Conversation, Destination Autonomous System Conversation)
conv_tos – (Conversations, TOS)
convgroup – (Source IP Group, Destination IP Group)
convgroup_app – (Source IP Group, Destination IP Group, Application)
convgroup_prot – (Source IP Group, Destination IP Groups, Protocol)
convgroup_tos – (Source IP group, Destination IP Groups, Source TOS)
dstas – (Destination Autonomous System)
dstip – (Destination)
dstip_app – (Destination, Application)
dstipgroup – (Destination IP Group)
dstipgroup_app – (Destination IP Group, Application)
dstipgroup_prot – (Destination IP Group, Protocol)
dstipgroup_tos – (Destination IP Group, Source TOS)
hierarchy_queueid – (QoS Hierarchies with Classification, QoS Hierarchies with Queue ID)
IBM Telco Network Cloud Manager - Performance 1.4.5 563

prot – (Protocol)
prot_app – (Protocol, Application)
prot_conv – (Protocol, Source, Destination)
prot_dstip – (Protocol, Destination)
prot_srcip – (Protocol, Source)
srcas – (Source Autonomous System)
srcip – (Source)
srcip_app – (Source, Application)
srcipgroup – (Source IP group)
srcipgroup_app – (Source IP group, Application)
srcipgroup_prot – (Source IP group, Protocol)
srcipgroup_tos – (Source IP group, Source TOS)
srctos – (Source TOS)
JSON code:
[
{
"rank":1,
"application":"ftp",
"srctos":"AF13",
"label":"ftp/AF13",
"octets":22866690,
"packets":44379,
"percentage":19.43,
"maxThroughput":532756.93,
"avgThroughput":190555.75,
"maxUtilization":0.05,
"avgUtilization":0.02
},
{
"rank":2,
"application":"ssh",
"srctos":"AF13",
"label":"ssh/AF13",
"octets":16502348,
"packets":35801,
"percentage":14.02,
"maxThroughput":318072.67,
"avgThroughput":137519.57,
"maxUtilization":0.03,
"avgUtilization":0.01
},
{
"rank":3,
"application":"https",
"srctos":"AF13",
"label":"https/AF13",
"octets":16055850,
"packets":38910,
"percentage":13.64,
"maxThroughput":370810.53,
"avgThroughput":152912.86,
"maxUtilization":0.04,
"avgUtilization":0.02
},
{
"rank":4,
"application":"https",
"srctos":"AF13",
"label":"https/AF13",
"octets":10447134,
"packets":18166,
"percentage":8.88,
"maxThroughput":260432.53,
"avgThroughput":107150.09,
"maxUtilization":0.03,
"avgUtilization":0.01
},
{
"rank":5,
"application":"bootps",
"srctos":"AF13",
"label":"bootps/AF13",
"octets":9739971,
"packets":17876,
"percentage":8.28,
"maxThroughput":230403.47,
"avgThroughput":118060.25,
"maxUtilization":0.02,
"avgUtilization":0.01
},
{
"rank":6,
"application":"nicname",
"srctos":"AF13",
"label":"nicname/AF13",
"octets":9577779,
"packets":19000,
"percentage":8.14,
"maxThroughput":178783.87,
"avgThroughput":91216.94,
564 IBM Telco Network Cloud Manager - Performance 1.4.5

"maxUtilization":0.02,
"avgUtilization":0.01
},
{
"rank":7,
"application":"sqlserv",
"srctos":"AF13",
"label":"sqlserv/AF13",
"octets":9437316,
"packets":26845,
"percentage":8.02,
"maxThroughput":340232.93,
"avgThroughput":125830.88,
"maxUtilization":0.03,
"avgUtilization":0.01
},
{
"rank":8,
"application":"domain",
"srctos":"AF13",
"label":"domain/AF13",
"octets":9058840,
"packets":14997,
"percentage":7.70,
"maxThroughput":287669.60,
"avgThroughput":109804.12,
"maxUtilization":0.03,
"avgUtilization":0.01
},
{
"rank":9,
"application":"irc",
"srctos":"AF13",
"label":"irc/AF13",
"octets":7185223,
"packets":9944,
"percentage":6.10,
"maxThroughput":197913.07,
"avgThroughput":106447.75,
"maxUtilization":0.02,
"avgUtilization":0.01
},
{
"rank":10,
"application":"bootpc",
"srctos":"AF13",
"label":"bootpc/AF13",
"octets":6827520,
"packets":9747,
"percentage":5.80,
"maxThroughput":159044.53,
"avgThroughput":82757.82,
"maxUtilization":0.02,
"avgUtilization":0.01
}
]
Response for the URL with extendedAppInfo flag set:
[
{
"rank":1,
"application":"ftp",
"description":"",
"businessRelevance":"",
"applicationGroup":"",
"applicationCategory":"",
"applicationSubCategory":"",
"p2p_technology":"",
"tunnelTechnology":"",
"encryptedTechnology":"",
"label":"ftp",
"octets":1627476,
"packets":5392,
"percentage":17.00,
"maxThroughput":216996.80,
"avgThroughput":216996.80,
"maxUtilization":0.02,
"avgUtilization":0.02
},
{
"rank":2,
"application":"bootps",
"description":"",
"businessRelevance":"",
"applicationGroup":"",
"applicationCategory":"",
"applicationSubCategory":"",
"p2p_technology":"",
"tunnelTechnology":"",
"encryptedTechnology":"",
"label":"bootps",
"octets":1600439,
"packets":3975,
"percentage":16.71,
"maxThroughput":213391.87,
IBM Telco Network Cloud Manager - Performance 1.4.5 565

"avgThroughput":213391.87,
"maxUtilization":0.02,
"avgUtilization":0.02
}
]
Related information
NBAR Categorization and Attributes
NBAR2 Protocol Pack 33.0.0
timeseries
Provides a timeseries of data for an aggregation on a flow interface over a period. For timeseries return with top10 query, the utilization is only calculated if the speed
information is available in NCIM database. If the information is not available, value null is returned.
This API queries and retrieves information from FLOW_METRIC.RAW, and other FLOW_METRIC. 1MIN/30MIN/1DAY AGGREGATION tables.
URL
https://<dashboard_route>/service/dataset/aggregation/timeseries
https://<dashboard_route>/service/dataset/aggregation/timeseries/top10
https://<dashboard_hostname>:<dashboard_port>/service/dataset/aggregation/timeseries
https://<dashboard_hostname>:<dashboard_port>/service/dataset/aggregation/timeseries//top10
https://<myserver.ibm.com>:31443/service/dataset/aggregation/timeseries?entity=ncim-217
&direction=ingress&aggregation=conv_app&start=1466008260000&end=1466011860000&granularity=1-minute
&key=221.87.136.94%252F176.188.66.226%2520%252F%2520ftp-data
Method
The supported request type.
https GET
URL parameters
Name Required Default value Description
entity Yes N/A The entity ID that represents the interface.
The three type of entities are:
<FLOW_METRIC.INTERFACE.exporter_ip>
-<FLOW_METRIC.INTERFACE.if_index>
ncim-<NCIM.NETWORK_INTERFACES.
entityID>
flow-<FLOW_METRIC.INTERFACE.
entityID>
aggregation Yes N/A The aggregation ID that represents how the data must be aggregated.
direction No Both The direction of the flow data that must be returned.
start Yes N/A The start time of the period for which flow data must be returned.
end Yes N/A The end time of the period for which flow data must be returned.
granularity No N/A The granularity for which the data must be aggregated. The default granularity can be as follows:
1-minute
15-minute
30-minute
1-day
7-day
key Yes
No (For top10
query)
N/A Combination of grouping keys that are separated by /. This key must be in the same aggregation order and
support only the top 10 grouping from aggregation summary.
The grouping key value must be same as the grouping result of aggregation summary API. The key parameter is
ignored for top10 where all top 10 timeseries data is returned.
566 IBM Telco Network Cloud Manager - Performance 1.4.5

Name Required Default value Description
time Yes N/A The name of time short cut:
last-hour
last-day
last-week
last-month
last-year
suppressSumm
ary No false Output result without result summary portion.
Sample URL
/service/dataset/aggregation/timeseries?entity=ncim-217&direction=ingress&aggregation=conv_app
&start=1466008260000&end=1466011860000&granularity=1-minute&key=221.87.136.94%252F176.188.66.226
%2520%252F%2520ftp-data
/service/dataset/aggregation/timeseries/top10?entity=ncim-217&direction=ingress&aggregation=conv_app&
start=1466008260000&end=1466011860000&granularity=1-minute
Note:
The query supports the top 10 grouping from the aggregation summary for the provided time period.
This query runs on aggregation summary result cache and the parameter key value must be as appeared in aggregation summary API result.
If granularity is not provided, it is computed as follows:
If time range is <= 3 hours, granularity = 1 minute.
If time range is >3 hour and <=12 hour, granularity = 15 minutes.
If time range is >12 hour and <=7 days, granularity = 30 minutes.
If time range is between 7 and <90 days, granularity = 1 day.
If time range is >=90 days, granularity = 7days.
Error response
For example:
{
"errorMesg":"Missing mandatory parameter :aggregation"
}
{
"errorMesg": "Invalid start, end and granularity combination. Granularity : 1 minute StartMs :
1568373360000 endMs : 1468375200000"
}
{
"errorMesg":"Key parameter must be provided"
}
Response
The timeseries API query results are returned as JSON data that contains an array of the following fields:
Name Data type Description
timestamp number The time that is associated with the aggregated value.
value number The aggregated octets value for the associated time
JSON code:
[
{
"timestamp":1466008980000,
"value":999771
},
{
"timestamp":1466008990000,
"value":999771
},
{
"timestamp":1466009000000,
"value":999771
},
{
"timestamp":1466009100000,
"value":999771
}
]
The timeseries/top10 API query results are returned as JSON data that contains an array of the header and result fields as follows:
Table 1. Header fields
Name Data type Description
interface number The interface for which top 10 timeseries is calculated.
direction number The direction of the interface
exporter string The exporter IP of the interface
keysSeparator string The separator that is used for combining the grouping keys.
keys string The grouping keys that are used for the aggregation.
IBM Telco Network Cloud Manager - Performance 1.4.5 567

Name Data type Description
speed long The speed of the interface.
Table 2. Result Fields
Name Data type Description
key string The grouping key value for this record,
timestamp long The time that is associated with the aggregated value.
sumOctet long The sumoctets that is calculated for this grouping key value.
sumPacket long The sumpackets that is calculated for this grouping key value.
throughput double The number of packets aggregated per granularity specified.
utilization string It is the throughput based on speed of the interface.
JSON code without timeseries/top10 query
[
{
"timestamp":1466008980000,
"value":999771
},
{
"timestamp":1466008990000,
"value":999771
},
{
"timestamp":1466009000000,
"value":999771
},
{
"timestamp":1466009100000,
"value":999771
}
]
JSON code for timeseries/top10 query:
{
"interface":1,
"direction":"ingress",
"exporter":"127.0.0.1",
"keysSeparator":"/",
"speed":10000000,
"keys":[
"srcIp",
"dstIp",
"appName"
],
"timeseries":[
{
"key":"56.199.177.191/40.47.23.8/https",
"timestamp":1503540000000,
"sumOctet":998005,
"sumPacket":8457,
"throughput":887.1155555555556,
"utilization":0.008871155555555557
},
{
"key":"192.178.122.236/61.186.117.57/https",
"timestamp":1503540000000,
"sumOctet":996126,
"sumPacket":1617,
"throughput":885.4453333333333,
"utilization":0.008854453333333333
},
{
"key":"132.118.233.143/212.104.175.192/nntp",
"timestamp":1503540000000,
"sumOctet":999710,
"sumPacket":1308,
"throughput":888.6311111111111,
"utilization":0.00888631111111111
},
{
"key":"176.3.79.144/98.139.180.149/ipv6:21",
"timestamp":1503540000000,
"sumOctet":996046,
"sumPacket":4955,
"throughput":885.3742222222222,
"utilization":0.008853742222222223
},
{
"key":"212.219.83.229/91.32.174.183/ftp",
"timestamp":1503540000000,
"sumOctet":999397,
"sumPacket":4714,
"throughput":888.3528888888889,
"utilization":0.008883528888888888
},
{
"key":"143.94.84.129/89.245.62.143/ftp-data",
"timestamp":1503540000000,
"sumOctet":997156,
"sumPacket":1959,
"throughput":886.3608888888889,
568 IBM Telco Network Cloud Manager - Performance 1.4.5

"utilization":0.00886360888888889
},
{
"key":"149.86.219.239/5.191.66.50/ipv6:445",
"timestamp":1503540000000,
"sumOctet":999563,
"sumPacket":962,
"throughput":888.5004444444445,
"utilization":0.008885004444444445
},
{
"key":"232.149.79.235/18.156.162.132/sctp:68",
"timestamp":1503540000000,
"sumOctet":999358,
"sumPacket":4781,
"throughput":888.3182222222222,
"utilization":0.008883182222222223
},
{
"key":"remaining",
"timestamp":1503540000000,
"sumOctet":1096729557,
"sumPacket":7823086,
"throughput":9001125.84088889,
"utilization":90.01125840888889
},
{
"key":"127.105.91.253/251.24.126.55/ftp",
"timestamp":1503540000000,
"sumOctet":999579,
"sumPacket":1516,
"throughput":888.5146666666667,
"utilization":0.008885146666666668
},
{
"key":"165.147.4.136/132.106.235.232/ipv6:53",
"timestamp":1503540000000,
"sumOctet":999932,
"sumPacket":1022,
"throughput":888.8284444444445,
"utilization":0.008888284444444445
}
]
}
REST APIs for Resource Management
Use these APIs to manage the resource types, their instances, and properties and store them in the Cassandra database.
inventory resources
Retrieves the resource type instances list based in on the resource property value conditions from the Cassandra database.
inventory descendants
Retrieves a list of child resource types of a parent resource type in inventory.
inventory relations
Retrieves relationship models that are defined for the resource types from Cassandra database. Relationship models for all the resource types are defined in the
Technology Packs in inventory model files.
inventory create
Create or update resource type instances and store them in the Cassandra database. The Resource Management Service checks whether the instance exists based
on the key properties. If it exists, the API updates the existing instance else, it creates a new instance.
inventory tenants
Create or update tenants for the resource type instances and store them in the Cassandra database. By default all resource type instances have base tenant. To
enable multi-tenancy, you must create other tenants who have access to specific dashboards.
inventory resources
Retrieves the resource type instances list based in on the resource property value conditions from the Cassandra database.
URL
https://<dashboard_route>/inventory/rest/topology/resources
https://<dashboard_hostname>:<dashboard_port>/inventory/rest/topology/resources
https://<myserver.ibm.com>:31443/inventory/rest/topology/resources
IBM Telco Network Cloud Manager - Performance 1.4.5 569

Method
The supported request type.
https GET
URL parameters
Name Required Default value Description
type Yes N/A To retrieve all resource instances for the resource type. For example, device.
tenantSopes No base To retrieve the resource instances by tenants that are associated with them. For example, base.
projections No N/A To retrieve specific resource properties. By default id, type, and tenant are retrieved. For example,
displayName.
Note: Any property that belongs to the requested resource type as request parameter can be retrieved and
resource instances can be filtered by provided value.
Sample URLs
/inventory/rest/model/types/resources?type=device
/inventory/rest/topology/resources?type=device&id=10.55.239.249
/inventory/rest/topology/resources?type=device&id=10.55.239.249&projections=*
Error Response
Status code Description
200 Success
400 Failure
Response
The results are returned as JSON data that contains an array of the following fields:
Name Data type Description
id string The Resource type instance that is associated to the Resource type resourceType parameter in the URL. For example,
10.55.239.249.
tenant string The tenants that are associated with the resource instance. For example, base.
type string The resource type. For example, device.
JSON code
{
"totalrecords": 1,
"result": [
{
"id": "10.55.239.249",
"isNetflow": "true",
"start": "1568187459313",
"tenant": "base",
"type": "device"
}
inventory descendants
Retrieves a list of child resource types of a parent resource type in inventory.
URL
https://<dashboard_route>/inventory/rest/topology/resources/descendants
https://<dashboard_hostname>:<dashboard_port>/inventory/rest/topology/resources/descendants
https://<myserver.ibm.com>:31443/inventory/rest/topology/resources/descendants
Method
The supported request type.
https GET
570 IBM Telco Network Cloud Manager - Performance 1.4.5

URL parameters
Name Required Default value Description
source_type Yes N/A Source Resource Type For example, device.
target_type No N/A Target Resource Type. For example, interface.
relationship No contain Type of relation.
tenantSopes No base To retrieve the resource instances by tenants that are associated with them. For example, base.
projections No N/A To retrieve specific resource properties. By default id, type, and tenant are retrieved. For example,
displayName.
Note:
Any property that belongs to the requested resource type as request parameter can be retrieved and
resource instances can be filtered by provided value.
Parent property must be suffixed with source_ and child resource property must be suffixed with _ in the
request parameter.
Sample URLs
/inventory/rest/topology/resources/descendants?source_type=device
/inventory/rest/topology/resources/descendants?source_type=device&target_type=interface
/inventory/rest/topology/resources/descendants?source_type=device&target_type=interface&relationship=contain
/inventory/rest/topology/resources/descendants?source_type=device&target_type=interface&relationship=contain&target_index=3
/inventory/rest/topology/resources/descendants?
source_type=device&target_type=interface&relationship=contain&target_index=3&source_id=10.55.239.249&projections=*
Error Response
Status code Description
200 Success
400 Failure
Response
The results are returned as JSON data that contains an array of the following fields:
Name Data type Description
id string The Resource type instance that is associated to the Resource type resourceType parameter in the URL. For example,
10.55.239.249_interface:<3>.
tenant string The tenants that are associated with the resource instance. For example, base.
type string The resource type. For example, interface.
JSON code
{
"totalrecords": 1,
"result": [
{
"interface": [
{
"flowEnable": "true",
"id": "10.55.239.249_interface:<3>",
"index": "3",
"npiIfIdIn": "1020",
"npiIfIdOut": "1021",
"parentId": "10.55.239.249",
"start": "1568187459184",
"tenant": "base",
"type": "interface"
}
]
}
]
}
inventory relations
Retrieves relationship models that are defined for the resource types from Cassandra database. Relationship models for all the resource types are defined in the
Technology Packs in inventory model files.
URL
https://<dashboard_route>/inventory/rest/model/types/relations
IBM Telco Network Cloud Manager - Performance 1.4.5 571

https://<dashboard_hostname>:<dashboard_port>/inventory/rest/model/types/relations
https://<myserver.ibm.com>:31443/inventory/rest/model/types/relations
Method
The supported request type.
https GET
URL parameters
Name Required Default value Description
source No N/A Source resource type to get the relationship metadata. For example, device.
target No N/A Target resource type to get the relationship metadata. For example, interface.
Sample URLs
/inventory/rest/model/types/relations
/inventory/rest/model/types/relations?source=device
/inventory/rest/model/types/relations?target=wirelessController
Error Response
Status code Description
200 Success
400 Failure
Response
The results are returned as JSON data that contains an array of the following fields:
Name Data type Description
source string The source resource type. For example, device.
target string The target resource type. For example, interface.
name string The name of the relation. For example, contain.
cardinality string The cardinality of the relation. For example, one-to-many.
JSON code
[
{
"source": "device",
"target": "wirelessController",
"name": "contain",
"cardinality": "one-to-many"
}
]
inventory create
Create or update resource type instances and store them in the Cassandra database. The Resource Management Service checks whether the instance exists based on the
key properties. If it exists, the API updates the existing instance else, it creates a new instance.
URL
https://<dashboard_route>/inventory/rest/topology/resources/create
https://<dashboard_hostname>:<dashboard_port>/inventory/rest/topology/resources/create
https://<myserver.ibm.com>:31443/inventory/rest/topology/resources/create
Method
The supported request type.
572 IBM Telco Network Cloud Manager - Performance 1.4.5

https POST
Payload format
{
# Array of resource json object
"resources": [
{
"id":"resource id",
"type":"resource type",
#property value pairs need to add/update for resource
},
......
]
"updateBy": "user" # default value system.if user then property not get override by system
}
Note:
Refer to the resource type model file for properties definition.
If property in input JSON file is not define in the model, the property is discarded.
Key properties such as id and type are mandatory.
Base properties such as start, end, and lastUpdate are managed internally and not part of the input JSON file.
Sample
{
"resources": [
{
"tenant": "base",
"id": "192.121.12.11_INTERFACE<11>",
"type": "interface",
"index": "11",
"ifName": "inf11"
},
{
"tenant": "base",
"id": "192.121.12.11_INTERFACE<12>",
"type": "interface",
"index": "12",
"ifName": "inf12"
}
]
}
Error Response
Status code Description
200 Success
400 Failure
inventory tenants
Create or update tenants for the resource type instances and store them in the Cassandra database. By default all resource type instances have base tenant. To enable
multi-tenancy, you must create other tenants who have access to specific dashboards.
URL
https://<dashboard_route>/inventory/rest/topology/resources/tenant
https://<dashboard_hostname>:<dashboard_port>/inventory/rest/topology/resources/tenant
tenant
https://<myserver.ibm.com>:31443/inventory/rest/topology/resources/tenant
Method
The supported request type.
https POST
Payload format
IBM Telco Network Cloud Manager - Performance 1.4.5 573

{
# Array of resource json object
"resources": [
{
"id":"resource id",
"type":"resource type",
#Resource json should have all key properties of resources
},
......
],
"tenant":"myTenant" # comma separated tenant values required as tenant of provided resources
"updateBy": "user" # default value system.if user then property not get override by system
}
Note:
Refer to the resource type model file for properties definition.
If property in input JSON file is not define in the model, the property is discarded.
Key properties such as id and type are mandatory.
The default base value cannot be removed or updated.
Sample
{
"resources": [
{
"id": "192.121.12.11_INTERFACE<11>",
"type": "interface",
"index": "11"
},
{
"id": "192.121.12.11_INTERFACE<12>",
"type": "interface",
"index": "12"
}
],
"updateBy":"user",
"tenant":"myTenant"
}
Note: A new tenant value myTenant is added to all the resource types in the list. The existing tenant values except the base are deleted.
Error Response
Status code Description
200 Success
400 Failure
REST APIs to configure the Telco Network Cloud Manager - Performance system
If you want to configure the system with REST APIs instead of the configuration UI pages, use this information. You can run the curl commands to configure in bulk for all
the actions on a page.
Get cookie
Alarm rules
Time schedules
Alarm target
Alarm target groups
Autonomous systems
Domain names
Flow aggregations
Flow Interface
Flow IP grouping
Flow NBAR
Flow Type of Service (ToS)
Flow Retention profile
Ping profiles
Threshold definitions
SNMP Discovery profile
SNMP credentials
Batch analytics
Stored Busy hours
Streaming analytics
User-defined calculations (UDC)
Site groups
Inventory
Group configuration or Resource grouping
Note: When you change any of these configuration settings, the Audit trail configuration page is also updated to reflect the changes,
574 IBM Telco Network Cloud Manager - Performance 1.4.5

Get cookie
It is common to all APIs.
curl -k --cookie-jar mycookie -X POST -d "j_username=npiadmin&j_password=npiadmin&Login=" https://<hostname>:
<port>/dashboards/j_security_check
Where,
<hostname> is the Dashboard route.
<hostname> is the hostname of any worker node in your cluster and <port> is the Dashboard Service port number, which is 31443 by default.
Note: nodePort must be created. For more information, see Accessing Telco Network Cloud Manager - Performance dashboards for Kubernetes environment.
Alarm rules
For more information about configuring Alarm rules from UI, see Managing Alarm rules.
List all Alarm rules
curl -k --cookie mycookie https://<hostname>:<port>/threshold/rest/alarm/rule/list
Create Alarm rules from a JSON file
curl -k --cookie mycookie -X POST -H "Content-Type: application/json" -d @sampleAR.json -k https://<hostname>:
<port>/threshold/rest/alarm/rule/create
Sample reference of input file for POST request. The JSON file format for all other POST request is similar.
$ cat sampleAR.json
{
"name": "restAR1",
"enabled": true,
"target_group": "",
"category": 1,
"target": "omniTarg"
}
Field Description
name Alarm rule name
enabled Enable or disable the alarm.
target_group Target group name
target Target name
Update alarm rules
curl -k --cookie mycookie -X PUT -H "Content-Type: application/json" -d @sampleAR.json -k https://<hostname>:
<port>/threshold/rest/alarm/rule/update
Delete Alarm rules
curl -k --cookie mycookie -X DELETE -H "Content-Type: application/json" -d @sampleAR.json -k https://<hostname>:
<port>/threshold/rest/alarm/rule/delete
Import Alarm rules
curl -k --cookie mycookie -X POST -H "Content-Type: application/json" -d @sampleAR.json -k https://<hostname>:
<port>/threshold/rest/alarm/rule/import
Enable or disable Alarm rules
curl -k --cookie mycookie -X PUT -H "Content-Type: application/json" -d @sampleAR.json -k https://<hostname>:
<port>/threshold/rest/alarm/rule/update
Time schedules
For more information about configuring Time schedules from UI, see Managing time schedules.
List all-Time schedules
curl -k --cookie mycookie https://<hostname>:<port>/threshold/rest/alarm/schedule/list
Create Time schedules
curl -k --cookie mycookie -X POST -H "Content-Type: application/json" -d @sampleAS.json -k https://<hostname>:
<port>/threshold/rest/alarm/schedule/create
Sample reference of input file for POST request. The JSON file format for all other POST request is similar.
$ cat sampleAS.json
{
"name": "testTS",
"time_period": [
{
"from": 28800000,
"to": 32400000
}
],
"rank_of_week": 0,
IBM Telco Network Cloud Manager - Performance 1.4.5 575

"enabled": true,
"tz": "GMT",
"rank_of_week_day": 0,
"day_of_month": 0,
"end": "26/02/2024 06:40 PM",
"frequency": 0,
"every_day": 1,
"start": "25/02/2024 06:40 PM",
"day": 0,
"day_of_month_type": 0,
"month": 0
}
]
Field Description
name Schedule name
time_period Specific start and end time period in hours, minutes
rank_of_week
enabled
rank_of_week_day
day_of_month
end
frequency Frequency can be daily, weekly, or monthly.
every_day
start
day
day_of_month_type
month
Update Time schedules
curl -k --cookie mycookie -X PUT -H "Content-Type: application/json" -d @sampleAS.json -k https://<hostname>:
<port>/threshold/rest/alarm/schedule/update
Delete Time schedules
curl -k --cookie myusercookie.txt -X DELETE -H "Content-Type: application/json" -d @sampleAS.json -k
https://<hostname>:<port>/threshold/rest/alarm/schedule/delete
Import Time schedules
curl -k --cookie mycookie -X POST -H "Content-Type: application/json" -d @sampleAS.json -k https://<hostname>:
<port>/threshold/rest/alarm/schedule/import
Alarm target
For more information about configuring Alarm target from UI, see Managing Alarm rules.
List all Alarm targets
curl -k --cookie mycookie https://<hostname>:<port>/threshold/rest/alarm/target/list
Create Alarm targets
curl -k --cookie mycookie -X POST -H "Content-Type: application/json" -d @sampleAT.json -k https://<hostname>:
<port>/threshold/rest/alarm/target/create
Sample reference of input file for POST request. The JSON file format for all other POST request is similar.
$ cat sampleAT.json
[
{
"emailCC": "",
"program": "",
"name": "restAT_targ_insert",
"emailBCC": "",
"snmpPort": 161,
"kafkaBrokerList": "restabc:6667",
"snmpAuthentication": "",
"snmpEncryptionPassword": "",
"snmpCommunity": "",
"emailTo": "",
"snmpContext": "",
"kafkaTopic": "restmyTopic",
"snmpVersion": 2,
"snmpHost": "",
"snmpAuthenticationPassword": "",
"snmpLevel": "noAuthNoPriv",
"snmpUsername": "",
"snmpEncryption": "",
"targetType": 5
},
{
"emailCC": "",
"program": "",
"name": "rest1AT_targ_insert",
"emailBCC": "",
"snmpPort": 161,
"kafkaBrokerList": "rest1abc:6667",
"snmpAuthentication": "",
576 IBM Telco Network Cloud Manager - Performance 1.4.5

"snmpEncryptionPassword": "",
"snmpCommunity": "",
"emailTo": "",
"snmpContext": "",
"kafkaTopic": "rest1myTopic",
"snmpVersion": 2,
"snmpHost": "",
"snmpAuthenticationPassword": "",
"snmpLevel": "noAuthNoPriv",
"snmpUsername": "",
"snmpEncryption": "",
"targetType": 5
}
]
Field Description
emailCC Email address on CC
program
name Name of the Alarm target
emailBCC Email address on Bcc
snmpPort SNMP port. By default, it is 161.
kafkaBrokerList List of Kafka broker hosts. For example,
<kafka_broker_host>:<kafka_broker_
port>
snmpAuthentication SNMP version
v2c
v3
snmpLevel It is applicable for SNMP V3 version only. It has these options.
noAuthNoPriv
authNoPriv
authPriv
snmpUsername Username of the SNMP-enabled device
snmpEncryption Encryption on the SNMP-enabled device
targetType
Update Alarm targets
curl -k --cookie mycookie -X PUT -H "Content-Type: application/json" -d @sampleAT.json -k https://<hostname>:
<port>/threshold/rest/alarm/target/update
Delete Alarm target
curl -k --cookie mycookie -X DELETE -H "Content-Type: application/json" -d @sampleAT.json -k https://<hostname>:
<port>/threshold/rest/alarm/target/delete
Import Alarm targets
curl -k --cookie mycookie -X POST -H "Content-Type: application/json" -d @sampleAT.json -k https://<hostname>:
<port>/threshold/rest/alarm/target/import
Alarm target groups
For more information about configuring Alarm target groups from UI, see Managing Alarm rules.
List all Alarm target groups
curl -k --cookie mycookie https://<hostname>:<port>/threshold/rest/alarm/target/group/list
Create Alarm target groups
curl -k --cookie mycookie -X POST -H "Content-Type: application/json" -d @sampleATG.json -k https://<hostname>:
<port>/threshold/rest/alarm/target/group/create
Sample reference of input file for POST request. The JSON file format for all other POST request is similar.
$ cat sampleATG.json
{
"name": "resttg2Delete",
"targets": [
"omniTarg"
]
}
Field Description
name Target name
targets Target types
OMNIbus
Kafka
SNMP Trap
Update Alarm target groups
curl -k --cookie mycookie -X PUT -H "Content-Type: application/json" -d @sampleATG.json -k https://<hostname>:
<port>/threshold/rest/alarm/target/group/update
Delete Alarm target groups
curl -k --cookie mycookie -X DELETE -H "Content-Type: application/json" -d @sampleATG.json -k https://<hostname>:
<port>/threshold/rest/alarm/target/group/delete
IBM Telco Network Cloud Manager - Performance 1.4.5 577

Import Alarm target groups
curl -k --cookie mycookie -X POST -H "Content-Type: application/json" -d @sampleATG.json -k https://<hostname>:
<port>/threshold/rest/alarm/target/group/import
Autonomous systems
For more information about configuring Autonomous systems from UI, see Managing Autonomous systems.
List all Autonomous systems
curl -k --cookie mycookie https://<hostname>:<port>/flow-collector/rest/as/list
Create Autonomous systems
curl -k --cookie mycookie -X POST -H "Content-Type: application/json" -d @sampleASys.json -k https://<hostname>:
<port>/flow-collector/rest/as/create
Sample reference of input file for POST request. The JSON file format for all other POST request is similar.
$ cat sampleASys.json
[
{
"ID": 11111888,
"NAME": "restABC",
"COUNTRY": "AL",
"PUBLIC": true
},
{
"ID": 11111889,
"NAME": "restXYZ",
"COUNTRY": "AL",
"PUBLIC": false
}
]
Field Description
ID ID that that represents a unique ASN.
Note: Autonomous System numbers one to 64511 are available by IANA/ARIN (IANA/American Registry for Internet Numbers) for global
use. The 64512 - 65535 series is reserved for private and reserved purposes.
NAME Name of the Autonomous System.
Note: Autonomous System numbers, one to 64511 contain predefined names for global use. The 64512 - 65535 series is reserved for
private and reserved purposes.
COUNTRY Country to which the specific network routing domain belongs.
PUBLIC Flag that represents whether the network domain is a private use ASN or with in the public Autonomous System range.
Update Autonomous systems
curl -k --cookie mycookie -X PUT -H "Content-Type: application/json" -d @sampleASys.json -k https://<hostname>:
<port>/flow-collector/rest/as/update
Delete Autonomous systems
curl -k --cookie mycookie -X DELETE -H "Content-Type: application/json" -d @sampleASys.json -k https://<hostname>:
<port>/flow-collector/rest/as/delete
Import Autonomous systems
curl -k --cookie mycookie -X POST -H "Content-Type: application/json" -d @sampleASys.json -k https://<hostname>:
<port>/flow-collector/rest/as/import
Domain names
For more information about configuring Domain names from UI, see Managing domain names.
List all Domain names
curl -k --cookie mycookie https://<hostname>:<port>/dns-collector/config/domain-name/list
Create Domain names
curl -k --cookie mycookie -X POST -H "Content-Type: application/json" -d @sampleDN.json -k https://<hostname>:
<port>/dns-collector/config/domain-name/create
Sample reference of input file for POST request. The JSON file format for all other POST request is similar.
$ cat sampleDN.json
{
"domainName": "test.co.in",
"resolved": 1622021120000
}
Field Description
domainName Name of the domain
resolved Timestamp when the domain name is resolved by the DNS server.
Update Domain names
curl -k --cookie myusercookie.txt -X POST -H "Content-Type: application/json" -d @sampleDN.json -k
https://<hostname>:<port>/dns-collector/config/domain-name/update
Delete Domain names
578 IBM Telco Network Cloud Manager - Performance 1.4.5

curl -k --cookie mycookie -X DELETE -H "Content-Type: application/json" -d @sampleDN.json -k https://<hostname>:
<port>/dns-collector/config/domain-name/delete
Import Domain names
curl -k --cookie mycookie -X POST -H "Content-Type: application/json" -d @sampleDN.json -k https://<hostname>:
<port>/dns-collector/config/domain-name/import
Flow aggregations
For more information about configuring Flow aggregations from UI, see Managing Flow aggregations.
List all Flow aggregations
curl -k --cookie mycookie https://<hostname>:<port>/flow-analytics/rest/aggregation/list
Update Flow aggregations
curl -k --cookie mycookie -X POST -H "Content-Type: application/json" -d @sampleFA.json -k https://<hostname>:
<port>/flow-analytics/rest/aggregation/update
Sample reference of input file for POST request.
$ cat sampleFA.json
{
"AGGREGATION": "srcipgroup_tos",
"AGG_FIELDS": "SRC_IP_GROUP, SRC_TOS",
"VISIBLE": true,
"ENABLED": false
}
Field Description
AGGREGATION Name of the aggregation
AGG_FIELDS Fields that are associated with the aggregation.
VISIBLE Ignore this field.
ENABLED Flag to represent whether the aggregation is enabled or disabled.
Flow Interface
Flow collector service provide rest interface to list and controlled NetFlow data collection for interfaces.
List Flow interfaces
curl -k --cookie mycookie https://<hostname>:<port>/flow-collector/rest/interface/list
Sample reference of input file for POST request.
[
{
"entityId":8589934652,
"ifIndex":1,
"remoteContext":"",
"interfaceName":"T1 1/0_AY123_upd",
"enabled":true,
"interfaceDescription":"T1 1/1",
"startMs":1656930875427,
"direction":0,
"key":"10.55.239.236_interface:<1>_ingress",
"id":"10.55.239.236_interface:<1>",
"exporterIp":"10.55.239.236",
"speed":1000000
},
{
"entityId":8589934653,
"ifIndex":1,
"remoteContext":"",
"interfaceName":"T1 1/0_AY123_upd",
"enabled":true,
"interfaceDescription":"T1 1/1",
"startMs":1656930875427,
"direction":1,
"key":"10.55.239.236_interface:<1>_egress",
"id":"10.55.239.236_interface:<1>",
"exporterIp":"10.55.239.236",
"speed":1000000
},
]
Enable NetFlow data collection for Flow interface
curl -k --cookie mycookie -X POST -H "Content-Type: application/json" -d @sampleInterface.json
-k https://<hostname>:<port>/flow-collector/rest/interface/enable
Sample reference of input file for POST request.
{
"entityId":8589934652,
"ifIndex":1,
"remoteContext":"",
"interfaceName":"T1 1/0_AY123_upd",
"enabled":false,
"interfaceDescription":"T1 1/1",
"startMs":1656930875427,
IBM Telco Network Cloud Manager - Performance 1.4.5 579

"direction":0,
"key":"10.55.239.236_interface:<1>_ingress",
"id":"10.55.239.236_interface:<1>",
"exporterIp":"10.55.239.236",
"speed":1000000
}
Field Description
entityId Entity ID of Flow interface. Unique ID that is assigned by the Flow collector when it discovers on arrival of Flow data.
ifIndex Interface index
remoteContext Remote Context from which interface discovered.
interfaceName Interface Name
enabled Field use by flow collector to controlled netflow data collection for interface
interfaceDescription
startMs
direction Integer representing direction of interface INGRESS/0 or EGRESS/1
key Key to identify interface with direction
id Unique identifier for interface in inventory
It flow convention <remote context>/<exporter ip>_interface:<ifIndex>
exporterIp Netflow exporter id address
speed Speed of interface
Disable netflow data collection for flow interface
Flow collector will not collect and store data for interfaces those marked to disable.
curl -k --cookie mycookie -X POST -H "Content-Type: application/json" -d @sampleInterface.json
-k https://<hostname>:<port>/flow-collector/rest/interface/disable
Sample reference of input file for POST request.
$cat sampletos.json
[{
"entityId":8589934652,
"ifIndex":1,
"remoteContext":"",
"interfaceName":"T1 1/0_AY123_upd",
"enabled":true,
"interfaceDescription":"T1 1/1",
"startMs":1656930875427,
"direction":0,
"key":"10.55.239.236_interface:<1>_ingress",
"id":"10.55.239.236_interface:<1>",
"exporterIp":"10.55.239.236",
"speed":1000000
}]
Flow IP grouping
For more information about configuring IP grouping from UI, see Managing Flow IP Grouping.
List all IP Groups
curl -k --cookie mycookie https://<hostname>:<port>/flow-collector/rest/ipgroup/list
Create IP Groups
curl -k --cookie mycookie -X POST -H "Content-Type: application/json" -d @sampleIP.json -k https://<hostname>:
<port>/flow-collector/rest/ipgroup/create
Sample reference of input file for POST request. The JSON file format for all other POST request is similar.
$ cat sampleIP.json
{
"IP_ADDRESS_ID": "b3aaec79-7774-4e89-9ed4-b4f63b3ebe18",
"IP_ADDRESS_GROUP": "restIpGrp#%test_.-user",
"ENABLED": true,
"IP_ADDRESS_START": "11.11.21.100",
"IP_ADDRESS_END": "11.11.21.150",
"UPDATE_DATE": 1622024291
}
Field Description
IP_ADDRESS_ID IP address group ID
IP_ADDRESS_GROUP Logical name to the group. Create your IP Grouping by location. For example, branch offices or departments for easier monitoring.
ENABLED A flag to enable or disable the specified IP address group.
IP_ADDRESS_START Start IP address for the range.
IP_ADDRESS_END End IP address for the range.
UPDATE_DATE Timestamp when the IP address group is created or updated.
Update IP groups
curl -k --cookie myusercookie.txt -X POST -H "Content-Type: application/json" -d @sampleIP.json -k
https://<hostname>:<port>/flow-collector/rest/ipgroup/update
Delete IP groups
curl -k --cookie mycookie -X DELETE -H "Content-Type: application/json" -d @sampleIP.json -k https://<hostname>:
<port>/flow-collector/rest/ipgroup/delete
580 IBM Telco Network Cloud Manager - Performance 1.4.5

Import IP groups
curl -k --cookie mycookie -X POST -H "Content-Type: application/json" -d @sampleIP.json -k https://<hostname>:
<port>/flow-collector/rest/ipgroup/import
Flow NBAR
For more information about configuring NBAR from UI, see Managing NBAR.
List all NBAR entries
curl -k --cookie mycookie https://<hostname>:<port>/flow-collector/rest/nbar/list
Update NBAR entries
curl -k --cookie mycookie -X POST -H "Content-Type: application/json" -d @sampleNBAR.json -k https://<hostname>:
<port>/flow-collector/rest/nbar/update
Sample reference of input file for POST request.
$ cat sampleNBAR.json
{
"ENGINE_ID": 13,
"SELECTOR_ID": 631,
"NAME": "ms-lync",
"DESCRIPTION": "Skype for Businessupdated",
"ENABLE_ART": false,
"ENABLE_ART_SOURCE": 0,
"CATEGORY_NAME": "business-and-productivity-tools",
"SUBCATEGORY_NAME": "voice-video-chat-collaboration",
"GROUP_NAME": "ms-lync-group",
"P2P_TECHNOLOGY": "no",
"TUNNEL_TECHNOLOGY": "no",
"ENCRYPTED_TECHNOLOGY": "yes",
"BUSINESS_RELEVANCE": "business-relevant"
}
Field Description
ENGINE_ID A unique identifier for the engine that determined the Selector ID. The Engine ID is the first 8 bits that provide information about the
engine that classifies the flow.
SELECTOR_ID The remaining 24 bits that provide information about the application.
Note: Engine ID and Selector ID constitute the Application ID.
NAME Name of the application that is derived from the Application ID.
DESCRIPTION Application description that can be derived from the Application option template.
ENABLE_ART Flag to enable or disable ART.
ENABLE_ART_SOURC
E
CATEGORY_NAME Provides the first-level categorization for each application.
SUBCATEGORY_NAME Provides the second-level categorization for each application.
GROUP_NAME Identifies the group application that belongs to the same networking application.
P2P_TECHNOLOGY Specifies whether an application is based on peer-to-peer technology.
TUNNEL_TECHNOLOG
YSpecifies whether an application tunnels the traffic of other protocols.
ENCRYPTED_TECHNO
LOGY Specifies whether an application is an encrypted networking protocol.
BUSINESS_RELEVAN
CE Business relevance as business-relevant or default.
Flow Type of Service (ToS)
For more information about configuring ToS from UI, see Managing Type of Service.
List all ToS entries
curl -k --cookie mycookie https://<hostname>:<port>/flow-collector/rest/tos/list
Update ToS entries
curl -k --cookie mycookie -X POST -H "Content-Type: application/json" -d @sampletos.json -k https://<hostname>:
<port>/flow-collector/rest/tos/update
Sample reference of input file for POST request. The JSON file format for all other POST request is similar.
$ cat sampletos.json
{
"TOSID": 0,
"TOSNAME": "Best Effortupd"
}
Fields Description
TOSID This field implements the Type of Service on the NetFlow packet to tradeoff on delay, throughput, reliability, and cost.
TOSNAME You can specify any name to your Type of Service class. See Managing Type of Service.
Import ToS
curl -k --cookie mycookie -X POST -H "Content-Type: application/json" -d @sampletos.json -k https://<hostname>:
<port>/flow-collector/rest/tos/list/import
IBM Telco Network Cloud Manager - Performance 1.4.5 581

Flow Retention profile
For more information about configuring Retention profile from UI, see Managing flow data retention profiles.
List Retention profiles
curl -k --cookie mycookie https://<hostname>:<port>/flow-collector/rest/retention/list
Update Retention profiles
curl -k --cookie mycookie -X PUT -H "Content-Type: application/json" -d @samplerp.json -k https://<hostname>:
<port>/flow-collector/rest/retention/update
Sample reference of input file for POST request. The JSON file format for all other POST request is similar.
$ cat samplerp.json
{
"ID": 5,
"NAME": "DNS",
"UNIT": 2,
"PERIOD": 6
}
Fields Description
ID ID of the profile
NAME Profile data name
UNIT Unit can be Days, Weeks, or Months.
PERIOD The period for which you want to retain the data.
Ping profiles
For more information about configuring ICMP Ping profiles from UI, see Managing ICMP Ping profiles.
List all Ping profiles
curl -k --cookie cookie.txt https://<hostname>:<dashboard_port>/ping-collector/rest/icmp
Create Ping profiles
sudo curl -k --cookie cookie.txt -X POST -H "Content-Type: application/json" -d @profile.json -k https://<hostname>:
<dashboard_port>/ping-collector/rest/icmp/create
Sample reference of input file for POST request. The JSON file format for all other POST request is similar.
$ cat profile.json
[
{
"name": "Profile1",
"ping_count": 1,
"description": "test profile",
"enabled": true,
"groups": [
"local_snmp_dev"
],
"last_run": 1656411301027,
"interval": 300,
"status": "Pinged 7/8 in 1008 ms, skipped 1",
"resources": [
{
"display_name": "10.212.7.248",
"resource_id": "10.212.7.248",
"resource_type": "device"
},
{
"display_name": "10.212.7.248-Lo69",
"resource_id": "10.212.7.248_interface:<69>",
"resource_type": "interface"
}
],
"remote_context": "",
"timeout": 1,
"payload_size": 32
}
]
Field Description
payload_size Size of ICMP packets to be used for the ping request. Default is set to 32 bytes. (Min 32 bytes, Max 65507 bytes)
ping_count Number of ping attempts on target device before giving up.(Min 1, Max 10)
polling Interval (s) Number of ping requests that must be initiated.
timeout How long the polling process must wait for a response from the target device before sending a new ping packet. (Min 1s, Max 10s)
interval How frequently the ping request must be initiated. (Min 10, Max 43200)
name Ping profile name
description Ping profile name
enabled Ping profile enabled or disabled flag
remote_context Remote context name for ping profile if it is required to be executed from Remote Ping Collector.
last_run The last run date of the ping profile. If a profile is newly created and the ping is yet to run, this column displays the value Not run.
status tatus of last ping profile run. For example, Pinged 7/8 in 1008 ms, skipped 1.
582 IBM Telco Network Cloud Manager - Performance 1.4.5

Field Description
resources Information on devices and interfaces that must be pinged.
groups Groups information that consists of devices and interfaces that msut be pinged.
Update Ping profiles
sudo curl -k –cookie cookie.txt -X POST -H “Content-Type: application/json” -d @profile.json -k https://<hostname>:
<dashboard_port>/ping-collector/rest/icmp/update
Delete Ping profiles
sudo curl -k --cookie cookie.txt -X DELETE -H "Content-Type: application/json" -d @profile.json -k
https://<hostname>:<dashboard_port>/ping-collector/rest/icmp/delete
Import Ping profiles
curl -k –cookie cookie.txt -X POST -H “Content-Type: application/json” -d @profile.json -k https://<hostname>:
<dashboard_port>/ping-collector/rest/icmp/import
Count of existing Ping profiles
curl -k --cookie cookie.txt https://<hostname>:<dashboard_port>/ping-collector/rest/icmp/count
Enable Ping collector profiles
sudo curl -k –cookie cookie.txt -X POST -H “Content-Type: application/json” -d @profile.json -k https://<hostname>:
<dashboard_port>/ping-collector/rest/icmp/enable
Disable Ping collector profiles
sudo curl -k –cookie cookie.txt -X POST -H “Content-Type: application/json” -d @profile.json -k https://<hostname>:
<dashboard_port>/ping-collector/rest/icmp/disable
Get inventory device information
sudo curl -k –cookie cookie.txt https://<hostname>:<dashboard_port>/ping-collector/rest/inventory/resources?
type=device
Get inventory interface information
sudo curl -k –cookie cookie.txt https://<hostname>:<dashboard_port>/ping-collector/rest/inventory/resources?
type=interface
Get inventory group information
sudo curl -k –cookie cookie.txt https://<hostname>:<dashboard_port>/ping-collector/rest/inventory/resources?
type=ResourcesGroup
Threshold definitions
For more information about configuring Threshold definitions from UI, see Managing thresholds.
List all Threshold definitions
curl -k --cookie mycookie https://<hostname>:<port>/threshold/rest/threshold/list
Create Threshold definitions
curl -k --cookie mycookie -X POST -H "Content-Type: application/json" -d @sampleTD.json -k https://<hostname>:
<port>/threshold/rest/threshold/create
Sample reference of input file for POST request. The JSON file format for all other POST request is similar.
$ cat sampleTD.json [
{
"name": "testTP",
"creation_time": 1708951650858,
"target_rule": "",
"tag": "",
"resource": [],
"evaluations": [
{
"burst_major_lower_limit": 0,
"burst_major_clear_time": 0,
"burst_major_upper_limit": 0,
"active_until": "No end date",
"period_critical_lower_limit": 0,
"period_critical_time": 0,
"burst_critical_lower_limit": 0,
"period_granularity": 1,
"burst_warning_mode": 0,
"burst_minor_occurrence": 0,
"burst_critical_enabled": false,
"burst_critical_time": 0,
"period_critical_enabled": false,
"period_critical_mode": 0,
"burst_warning_clear_time": 0,
"period_warning_enabled": false,
"period_warning_upper_limit": 0,
"period_major_lower_limit": 0,
"burst_critical_upper_limit": 0,
"period_minor_time": 0,
"burst_warning_enabled": false,
"period_major_enabled": false,
"period_minor_mode": 0,
IBM Telco Network Cloud Manager - Performance 1.4.5 583

"burst_minor_clear_time": 0,
"burst_minor_lower_limit": 0,
"burst_warning_lower_limit": 0,
"burst_major_clear_occurrence": 0,
"burst_warning_upper_limit": 0,
"burst_critical_mode": 0,
"burst_minor_clear_occurrence": 0,
"burst_minor_upper_limit": 0,
"burst_warning_time": 0,
"burst_warning_occurrence": 0,
"burst_minor_mode": 0,
"period_major_mode": 0,
"period_generate_event": true,
"period_major_upper_limit": 0,
"burst_generate_event": true,
"burst_enabled": false,
"burst_critical_clear_time": 0,
"period_minor_lower_limit": 0,
"burst_critical_occurrence": 0,
"burst_warning_clear_occurrence": 0,
"schedule": "",
"burst_major_time": 0,
"period_critical_upper_limit": 0,
"schedule_desc": "Always",
"period_major_time": 0,
"period_warning_time": 0,
"burst_minor_enabled": false,
"baseline_enabled": false,
"burst_major_enabled": false,
"period_enabled": false,
"period_minor_enabled": false,
"burst_major_mode": 0,
"burst_reset_time": 0,
"period_warning_lower_limit": 0,
"burst_critical_clear_occurrence": 0,
"period_minor_upper_limit": 0,
"burst_minor_time": 0,
"burst_major_occurrence": 0,
"period_warning_mode": 0
}
],
"threshold_group": [],
"metric": "Memory.Swap.Utilization.Percent",
"update_time": 1708951650858
}
]
Field Description
burst_major_clear_time
active_until
name
creation_time
period_critical_time
target_rule
period_granularity
burst_major_clear_occurence
burst_critical_enabled
burst_critical_time
period_critical_enabled
burst_warning_clear_time
period_critical_level
burst_major_occurence
period_minor_level
period_warning_enabled
burst_minor_clear_occurence
burst_major_level
period_minor_time
burst_warning_enabled
period_major_enabled
burst_minor_clear_time
burst_warning_level
period_mode
burst_warning_clear_occurence
burst_warning_time
burst_mode
period_generate_event
burst_generate_event
burst_enabled
burst_critical_clear_time
resource
burst_critical_level
threshold_group
584 IBM Telco Network Cloud Manager - Performance 1.4.5

Field Description
metric
period_warning_level
schedule
burst_major_time
schedule_desc
burst_warning_occurence
period_major_time
burst_critical_clear_occurence
period_warning_time
burst_minor_enabled
baseline_enabled
burst_major_enabled
period_enabled
period_minor_enabled
burst_reset_time
burst_minor_level
burst_minor_occurence
period_major_level
burst_minor_time
update_time
burst_critical_occurence
Update Threshold definitions
curl -k --cookie mycookie -X PUT -H "Content-Type: application/json" -d @sampleTD.json -k https://<hostname>:
<port>/threshold/rest/threshold/update
Delete Threshold definitions
curl -k --cookie mycookie -X DELETE -H "Content-Type: application/json" -d @sampleTD.json -k https://<hostname>:
<port>/threshold/rest/threshold/delete
Import Threshold definitions
curl -k --cookie mycookie -X POST -H "Content-Type: application/json" -d @sampleTD.json -k https://<hostname>:
<port>/threshold/rest/threshold/import
SNMP Discovery profile
For more information about configuring SNMP Discovery profiles from UI, see Managing SNMP Discovery profiles.
List all SNMP Discovery profiles
curl -k --cookie cookie.txt https://<hostname>:<dashboard_port>/snmp-discovery/rest/profile/list
Run Discovery for the exiting profiles
$ curl -k --cookie cookie.txt https://<hostname>:<dashboard_port>/snmp-discovery/rest/discovery?discover-
profile=”profile_name”
Run Discovery for a specific agent
sudo curl -k --cookie cookie.txt https://<hostname>:<dashboard_port>/snmp-discovery/rest/discovery?discover-
agent=”agent_name”
Run Discovery for all profiles
curl -k –cookie cookie.txt https://<hostname>:<dashboard_port>/snmp-discovery/rest/discovery?discover-all
Create Discovery profiles
sudo curl -k --cookie cookie.txt -X POST -H "Content-Type: application/json" -d @profile.json -k https://<hostname>:
<dashboard_port>/snmp-discovery/rest/profile/create
Sample reference of input file for POST request. The JSON file format for all other POST request is similar.
$ cat discoveryProf.json[
{
"HOST_NAMES":"",
"ENABLED":false,
"NAME":"<Agent101toAgent231>",
"IS_RUNNING":"Completed",
"IP_ADDRESSES":"<10.55.236.101-10.55.236.221>",
"LAST_RUN":1652784011691,
"STATUS":"Discovered 4/121 in 135129 ms",
"REMOTE_CONTEXT":"",
"FAILED_LIST":"<10.55.236.101>,<10.55.236.160>,<10.55.236.145>,<10.55.236.175>",
"SNMP_CREDENTIAL":""
}
]
Fields Description
NAME Name for the discovery profile.
ENABLED Flag to enable or disable the profile.
IBM Telco Network Cloud Manager - Performance 1.4.5 585

Fields Description
IP_ADDRESSES Provide the IP address range that defines the scope of the devices to be discovered.
Values in this field can be as follows:
IP address range
For example, 10.55.239.137-10.55.239.140
Individual IP addresses as a comma-separated list
For example, 10.55.239.31, 10.55.240.45
Combination of both
For example, 10.55.239.137-10.55.239.140,10.55.239.31
Note: IPv6 address format is supported.
HOST_NAMES Comma-separated list of hostnames. For example, hostname1, hostname2.
REMOTE_CONTE
XT The same name of the remote context that you mentioned in the application.conf file to set up the remote SNMP discovery and
collection.
IS_RUNNING Flag to understand if the discovery is currently running for the profile.
LAST_RUN The last run date of the discovery profile. If a profile is newly created and the discovery is yet to run, this column displays the value Not
run.
STATUS The discovery status as Completed, Not run, or In
progress.
FAILED_LIST If one or more devices from the discovery profile are not discovered for any reason, the IP addresses or the hostnames of the devices
that are not discovered from the profile are listed.
Update Discovery profiles
sudo curl -k –cookie cookie.txt -X POST -H “Content-Type: application/json” -d @profile.json -k https://<hostname>:
<dashboard_port>/snmp-discovery/rest/profile/update
Delete Discovery profiles
sudo curl -k --cookie cookie.txt -X DELETE -H "Content-Type: application/json" -d @profile.json -k
https://<hostname>:<dashboard_port>/snmp-discovery/rest/profile/delete
Import Discovery profiles
curl -k –cookie cookie.txt -X POST -H “Content-Type: application/json” -d @profile.json -k https://<hostname>:
<dashboard_port>/snmp-discovery/rest/profile/import
Count of existing Discovery profiles
curl -k --cookie cookie.txt https://<hostname>:<dashboard_port>/snmp-discovery/rest/profile/count
Run the discovery for a profile in Test mode
curl -k --cookie cookie.txt https://<hostname>:<dashboard_port>/snmp-discovery/rest/discovery?run-profile=
<profile_name>
Run the discovery for a profile in Live mode
curl -k --cookie cookie.txt https://<hostname>:<dashboard_port>/snmp-discovery/rest/discovery?test-profile=
<profile_name>
Get the discovery logs
curl -k --cookie cookie.txt https://<hostname>:<dashboard_port>/snmp-discovery/rest/discovery?logs=<profile_name>
Stop the discovery for a profile
curl -k --cookie cookie.txt https://<hostname>:<dashboard_port>/snmp-discovery/rest/discovery?stop-profile=
<profile_name>
SNMP credentials
For more information about configuring SNMP credentials from UI, see Managing SNMP credentials.
List all SNMP credentials
curl -k --cookie cookie.txt https://<hostname>:<dashboard_port>/snmp-discovery/rest/credential/list
Count of existing SNMP credentials
curl -k –cookie cookie.txt https://<hostname>:<dashboard_port>/snmp-discovery/rest/credential/count
Create SNMP credentials
curl -k --cookie cookie.txt -X POST -H "Content-Type: application/json" -d @profile.json -k https://<hostname>:
<dashboard_port>/snmp-discovery/rest/credential/create
Sample reference of input file for POST request. The JSON file format for all other POST request is similar.
$ cat SNMPcred.json
[
{
"NAME": "C1",
"VERSION": 1,
"PORT": 161,
"READ_COMMUNITY": "public",
586 IBM Telco Network Cloud Manager - Performance 1.4.5

"WRITE_COMMUNITY": "",
"USERNAME": "",
"AUTHENTICATION": "",
"AUTHENTICATION_PASSWORD": "",
"ENCRYPTION": "",
"ENCCONTEXTRYPTION_PASSWORD": "",
"CONTEXT": "",
"PRIORITY": 0,
"RETRIES": 7,
"TIMEOUT": 7000,
"LEVEL": ""
}
]
Fields Description
NAME Credential name
VERSION Specify the SNMP version that is associated with this SNMP configuration. Make sure to select the version that is supported on the
device. SNMP versions are as follows:
V1
Basic version of SNMP. This version is supported by most devices and simple to set up. It has limited security.
V2
Supports 64-bit counters to monitor the bandwidth usage of networks high volumes of data. It has limited security.
V3
Supports authentication and encryption of the credentials for multiple users. Highly secure version.
PORT SNMP port. By default, it is 161.
READ_COMMUNI
TY Specify the name of the SNMP read community. It is used to retrieve the information from a device in read-only mode. SNMP community
string is like the user ID or password and is needed for SNMP V1 and V2 versions only. SNMP V3 version uses username and password
credentials with encryption key.
By default, the SNMP community strings for SNMP V1 and V2 versions are set to Public. You can change all the community strings to
customized values in this field.
WRITE_COMMUN
ITY SNMP write community.
USERNAME Security Name is used when access control is set up.
AUTHENTICATI
ON This field is applicable if the level is authPriv to specify the type of encryption for the privacy password. The following types of encryption
are available:
DES
AES128
AES192
AES256
AUTHENTICATI
ON_PASSWORD Privacy password. It must be same as the device privacy password.
Note: The minimum length of the Priv password must be eight characters.
ENCRYPTION This field is applicable if the level is AuthNoPriv and AuthPriv to specify the type of encryption for the authentication password. The
following types of encryption are available:
SHA1
MD5
ENCRYPTION_P
ASSWORD Auth password
CONTEXT An SNMP context defines a collection of management information that is accessible to an SNMP entity. Each context in a management
domain has a unique identifier. The Context Name field is optional and depends on the user.
PRIORITY Priority
RETRIES Specify how many times that you want the SNMP helper and polling operations to attempt to access a device.
TIMEOUT Specify the time in milliseconds to wait for a reply from SNMP request before the timeout.
LEVEL Specify the needed level of authentication and privacy. The following levels are available:
noAuthNoPriv
Select this option for SNMP communities that have no authentication or private key. In this case, you do not need to specify any
passwords. Then, specify the Context Name and Security Name.
AuthNoPriv
Select this option for SNMP communities that have an authentication key but no private key. Then, specify values in the Auth Type,
Context Name, Security Name, and Auth Password fields.
Note: The minimum length of the Auth Password must be eight characters and provide the same password that is set on the
device.
AuthPriv
Select this option for SNMP communities that have both an authentication and a private key. Then, specify values in the Auth type,
Priv type, Priv password, Context name, Security name, Auth password, Priv password fields.
Note: The minimum length of the Priv password must be eight characters and provide the same password that is set on the device.
Update SNMP credentials
sudo curl -k --cookie cookie.txt -X PUT -H "Content-Type: application/json" -d @profile.json -k https://<hostname>:
<dashboard_port>/snmp-discovery/rest/credential/update
Delete SNMP credentials
curl -k --cookie cookie.txt -X DELETE -H "Content-Type: application/json" -d @profile.json -k https://<hostname>:
<dashboard_port>/snmp-discovery/rest/credential/delete
Import SNMP credentials
IBM Telco Network Cloud Manager - Performance 1.4.5 587

curl -k –cookie cookie.txt -X POST -H “Content-Type: application/json” -d @profile.json -k https://<hostname>:
<dashboard_port>/snmp-discovery/rest/credential/import
Batch analytics
For more information about configuring Batch jobs from UI, see Managing batch jobs for metrics.
List all Batch jobs
curl -k --cookie cookie.txt https://<hostname>:<dashboard_port>/analytics-batch/rest/job/list
Count of existing Batch jobs
curl -k --cookie cookie.txt https://<hostname>:<dashboard_port>/analytics-batch/rest/job/count
Create Batch jobs
curl -k -–cookie cookie.txt -X POST -H “Content-Type: application/json” -d @profile.json -k https://<hostname>:
<dashboard_port>/analytics-batch/rest/job/create
Sample reference of input file for POST request. The JSON file format for all other POST request is similar.
$ cat BAjob.json
[
{
"createTime": 1639029708786,
"definition": {
"focalEntity": "eNodeBFunction",
"groupBy": "HOUR",
"lastUnit": "HOUR",
"lastValue": 1,
"metricList": [
"eUtranCell!eUtranCell.Huawei_4G_Cell_Availability_Percent",
"eUtranCell!eUtranCell.Huawei_4G_ERAB_Drop_Rate_Percent",
"eUtranCell!eUtranCell.Huawei_4G_ERAB_Establish_Success_Rate_Percent",
"eUtranCell!eUtranCell.Huawei_4G_Mobility_Success_Rate_Percent",
"eUtranCell!eUtranCell.Huawei_4G_RRC_Setup_Success_Rate_Percent"
],
"reportName": "PS_ACCESS_HUAWEI_4G_JOB_ENODEBFUNCTION",
"resourceFilter": [],
"vendorFilter": []
},
"enableFlag": true,
"jobName": "PS_ACCESS_HUAWEI_4G_JOB_ENODEBFUNCTION",
"scheduleName": "EVERYHOURBYMIN10",
"updateTime": 1639029708786
}
]
Field Description
createTime Timestamp when the job is created.
focalEntity Focal Resource type from where the metrics can be selected for a specific Resource type.
groupBy Select any of the following options:
15 Min
30 Min
Hour
Day
Based on the time attribute selected, the data is rolled up or aggregated for that timeframe.
lastUnit It is the relative calculation period unit, hour, or day. Select a value from the following options:
Hour
Day
lastValue Last value defines the time period for which data that is available in Diamond-db is processed by a job. It is the relative calculation period
based on Last unit. The maximum value can be 168, which is 7*24.
Value depends on the selected last unit. If Last unit is Hour, then select any value 1 - 168. If Last unit is Day, then select any value 1 - 7.
Consider the following options to calculate daily summaries:
Group by is Day.
Last unit is Day.
Last value is 1.
Schedule name is EVERYDAY or EVERYDAYBYHOUR2.
Consider the following options to calculate hourly summaries:
Group by is Hour.
Last unit is Hour.
Last value is 1.
Schedule name is EVERYHOUR or EVERYHOURBYMIN10.
588 IBM Telco Network Cloud Manager - Performance 1.4.5

Field Description
metricList Select a metric type from the following options:
Analytic
It represents the metrics that come from batch jobs, streams, and stored busy hour definitions that are defined by users.
Metric
It represents the raw metrics that come from installed Technology Packs.
UDC
It represents the metrics that are created by user.
Metrics that are available in the selected field type are displayed.
Select a single metric or multiple metrics and click the arrow ( ) to move the selected metric to the Selected metrics pane.
Click Delete metrics ( ) to delete the selected metric.
reportName Dashboard name
resourceFilt
er Resource type hierarchy.
vendorFilter Vendor type hierarchy
enableFlag Enable or disable the batch job.
jobName Provide a name for the batch job.
scheduleName Select the schedule name from the following options:
EVERYHOUR
EVERYHOURBYMIN10
EVERYDAY
EVERYDAYBYHOUR2
EVERY2HOURS
EVERY15MIN
EVERY15MINDELAY2
EVERY15MINDELAY10
updateTime Timestamp when the job is updated.
Update Batch jobs
curl -k --cookie cookie.txt -X POST -H "Content-Type: application/json" -d @profile.json -k https://<hostname>:
<dashboard_port>/analytics-batch/rest/job/update
Delete Batch jobs
curl -k –cookie cookie.txt -X DELETE -H “Content-Type: application/json” -d @profile.json -k https://<hostname>:
<dashboard_port>/analytics-batch/rest/job/delete
Import Batch jobs
curl -k –cookie cookie.txt -X POST -H “Content-Type: application/json” -d @profile.json -k https://<hostname>:
<dashboard_port>/analytics-batch/rest/job/import
Enable Batch jobs
curl -k --cookie cookie.txt -X POST -H "Content-Type: application/json" -d @profile.json -k https://<hostname>:
<dashboard_port>/analytics-batch/rest/job/enable
Disable Batch jobs
curl -k –-cookie cookie.txt -X POST -H “Content-Type: application/json” -d @profile.json -k https://<hostname>:
<dashboard_port>/analytics-batch/rest/job/disable
Stored Busy hours
For more information about configuring Stored Busy hours from UI, see Managing Busy hours.
List all stored Busy hours
curl -k --cookie cookie.txt https://<hostname>:<dashboard_port>/analytics-batch/rest/sbh/list
Count of existing stored Busy hours
curl -k --cookie cookie.txt https://<hostname>:<dashboard_port>/analytics-batch/rest/sbh/count
Create stored Busy hour definitions
curl -k –-cookie cookie.txt -X POST -H “Content-Type: application/json” -d @profile.json -k https://<hostname>:
<dashboard_port>/analytics-batch/rest/sbh/create
Sample reference of input file for POST request. The JSON file format for all other POST request is similar.
$ cat SBH.json
[
{
“createTime”: 1639132269936,
“definition”: {
“aggr”: “min”,
“calculationType”: “nonsliding”,
“determiner”: “cell!cell.8PSK.MEAN.BEP.EQU.0.NUM”,
“focalEntity”: “cell”,
“groupBy”: “hour”,
IBM Telco Network Cloud Manager - Performance 1.4.5 589

“metricList”: [],
“resourceFilter”: [],
“sbhName”: “cellTest”,
“vendorFilter”: []
},
“enableFlag”: true,
“sbhName”: “cellTest”,
“scheduleName”: “EVERYHOUR”,
“updateTime”: 1639132269936
}
]
Field Description
createTime Timestamp when the Busy hour is created.
aggr Use any of the following options:
min
max
Smallest or largest value to be used for the busy hour, min, or max. If a value is omitted, the default max is used. max uses the greatest
value for the busy hour. min uses the smallest value for the busy hour. For example, min is used where a metric represents the
percentage of a channel's availability - the busier the equipment the less percentage availability there is.
calculationT
ype Sliding type. Use either sliding or nonsliding mode. By default, the value for this parameter is nonsliding.
A sliding busy hour is a busy hour that is calculated based on the busiest hour of the day, across intervals other than hourly boundaries.
The default interval for sliding busy hours is 15 minutes. Using this interval that a sliding busy hour can start at any 15-minute interval of
an hour and extend thereafter for 60 minutes. For example, from 10:15 to 11:15 or 10:30 to 11:30.
Nonsliding means that the busy hour is always aligned to hours, for example 14:00 to 15:00 or 18:00 to 19:00. Sliding busy hours are
calculated down to the interval of the data, for example 14:15 to 15:15.
determiner It is the metric that is used to determine the busiest hour. Metrics that are used for busy hour determination typically represent a suitable
metric for measuring how busy a system is
focalEntity Focal Resource type from where the metrics can be selected for a specific Resource type. It is the main Resource type from which you
want to view metrics.
groupBy
metricList Array of metric names that must be included in the Busy hour definition.
resourceFilt
er Array of Resource type names that must be included in the Busy hour definition.
sbhName Stored Busy hour name
vendorFilter Array of vendors that must be included in the Busy hour definition.
enableFlag Flag to enable or disable the Busy hour definition.
sbhName Busy hour definition name
scheduleName It is the schedule type and has the following options:
EVERYHOUR
EVERYHOURBYMIN10
EVERYDAY
EVERYDAYBYHOUR2
EVERY2HOURS
EVERY15MIN
EVERY15MINDELAY2
EVERY15MINDELAY10
updateTime Timestamp when the Busy hour definition is created or modified.
Update stored Busy hour definitions
curl -k –-cookie cookie.txt -X POST -H “Content-Type: application/json” -d @profile.json -k https://<hostname>:
<dashboard_port>/analytics-batch/rest/sbh/update
Delete stored Busy hour definitions
curl -k –-cookie cookie.txt -X DELETE -H “Content-Type: application/json” -d @profile.json -k https://<hostname>:
<dashboard_port>/analytics-batch/rest/sbh/delete
Import stored Busy hour definitions
curl -k –-cookie cookie.txt -X POST -H “Content-Type: application/json” -d @profile.json -k https://<hostname>:
<dashboard_port>/analytics-batch/rest/sbh/import
Enable stored Busy hour definitions
curl -k –-cookie cookie.txt -X POST -H “Content-Type: application/json” -d @profile.json -k https://<hostname>:
<dashboard_port>/analytics-batch/rest/sbh/enable
Disable stored Busy hour definitions
curl -k –-cookie cookie.txt -X POST -H “Content-Type: application/json” -d @profile.json -k https://<hostname>:
<dashboard_port>/analytics-batch/rest/sbh/disable
Streaming analytics
For more information about configuring analytics streams from UI, see Managing streams for metrics.
List all streams
curl -k –cookie cookie.txt https://<hostname>:<dashboard_port>/analytics-stream/rest/stream/list
Create streams
590 IBM Telco Network Cloud Manager - Performance 1.4.5

curl -k –-cookie cookie.txt -X POST -H “Content-Type: application/json” -d @profile.json -k https://<hostname>:
<dashboard_port>/analytics-stream/rest/stream/create
Sample reference of input file for POST request. The JSON file format for all other POST request is similar.
$ cat Stream.json
[
{
"createTime": 1639592254247,
"focalEntity": "device",
"groupBy": "15_MIN",
"metricList": [
{
"aggr": [
"Sum"
],
"name": "device!ICMP.Message.Received.pps"
}
],
"statuses": [],
"streamName": "Stream",
"updateTime": 1639592254247
}
]
Field Description
createTime Timestamp when the stream is created.
focalEntity Focal Resource type from where the metrics can be selected for a specific Resource type. It is the main Resource type from which you
want to view metrics.
groupBy Use any of the following options:
1_MIN
5_MIN
15_MIN
30_MIN
60_MIN
Based on the time attribute selected the data is rolled up or aggregated for that timeframe.
metricList
aggr Aggregation used
name Name of the metric used in the stream creation.
statuses Status of the stream. It can be start or stop.
streamName Name of the stream
updateTime Timestamp when the stream is updated.
Update streams
curl -k –cookie cookie.txt -X POST -H “Content-Type: application/json” -d @profile.json -k https://<hostname>:
<dashboard_port>/analytics-stream/rest/stream/update
Delete streams
curl -k –cookie cookie.txt -X DELETE -H “Content-Type: application/json” -d @profile.json -k https://<hostname>:
<dashboard_port>/analytics-stream/rest/stream/delete
Count of existing streams
curl -k –cookie cookie.txt https://<hostname>:<dashboard_port>/analytics-stream/rest/stream/count
Import streams
curl -k –cookie cookie.txt -X POST -H “Content-Type: application/json” -d @profile.json -k https://<hostname>:
<dashboard_port>/analytics-stream/rest/stream/import
Start streams
curl -k –cookie cookie.txt -X PUT -H “Content-Type: application/json” -d @profile.json -k https://<hostname>:
<dashboard_port>/analytics-stream/rest/stream/start
Stop streams
curl -k –cookie cookie.txt -X PUT -H “Content-Type: application/json” -d @profile.json -k https://<hostname>:
<dashboard_port>/analytics-stream/rest/stream/stop
User-defined calculations (UDC)
For more information about configuring UDCs from UI, see Managing User-defined calculations.
List all UDCs
curl -k --cookie cookie.txt https://<hostname>:<dashboard_port>/analytics-stream/rest/udcconfig/list
Create UDCs
curl -k --cookie cookie.txt -X POST -H "Content-Type: application/json" -d @profile.json -k https://<hostname>:
<dashboard_port>/analytics-stream/rest/udcconfig/create
IBM Telco Network Cloud Manager - Performance 1.4.5 591

[
{
"AGGREGATION": "AvgNull",
"DATA_TYPE": "DOUBLE",
"DESCRIPTION": "pqr",
"FIELD_TYPE": "UserDefined",
"FOCAL_ENTITY": "deviceGtm",
"FORMULA": "[deviceGtm]![{Common.Inbound.Throughput.Client.Side.bps}]",
"MODIFIED": 1638354315342,
"OWNER": "Admin",
"PARSED_FORMULA": "enil(tavg({&Common.Inbound.Throughput.Client.Side.bps}))",
"UDC_CONFIG_NAME": "deviceGtm.test1"
}
]
Field Description
AGGREGATION Aggregation type to be used in the UDC.
DATA_TYPE Data type of the UDC
DESCRIPTION Description of the UDC
FIELD_TYPE Field type has the following options:
UDC
It represents the metrics that are created by user.
Metric
It represents the raw metrics that come from installed Technology Packs.
Analytic
It represents the metrics that come from batch jobs, streams, and busy hour definitions that are defined by users.
FOCAL_ENTITY Focal Resource type from where the metrics can be selected for a specific Resource type and to which you want to apply the UDC. It is
the main Resource type from which you want to view metrics.
FORMULA Function to be used in the UDC definition.
MODIFIED Timestamp when the UDC is created or modified.
OWNER Owner who created the UDC.
PARSED_FORMU
LA Validated formula.
UDC_CONFIG_N
AME UDC name
Update UDCs
curl -k –cookie cookie.txt -X POST -H “Content-Type: application/json” -d @profile.json -k https://<hostname>:
<dashboard_port>/analytics-stream/rest/udcconfig/update
Delete UDCs
curl -k –cookie cookie.txt -X DELETE -H “Content-Type: application/json” -d @profile.json -k https://<hostname>:
<dashboard_port>/analytics-stream/rest/udcconfig/delete
Count of existing UDCs
curl -k –cookie cookie.txt https://<hostname>:<dashboard_port>/analytics-stream/rest/udcconfig/count
Import UDCs
curl -k –cookie cookie.txt -X POST -H “Content-Type: application/json” -d @profile.json -k https://<hostname>:
<dashboard_port>/analytics-stream/rest/udcconfig/import
Site groups
For more information about configuring Sites from UI, see Managing site grouping.
List all existing Site groups
curl -k --cookie cookie.txt https://<hostname>:<dashboard_port>/app/sites/list
Create Sites
curl -k --cookie cookie.txt -X POST -H "Content-Type: application/json" -d @profile.json -k https://<hostname>:
<dashboard_port>/app/sites/create
Sample reference of input file for POST request. The JSON file format for all other POST request is similar.
[
{
"siteName": "Site",
"ipRange": "10.55.239.137",
"priority": 0
}
]
Field Description
siteName Logical name to the site. Create your site by location.
ipRange Provide the IP address range that defines the scope of the devices for site grouping.
priority Priority
Update Sites
curl -k --cookie cookie.txt -X POST -H "Content-Type: application/json" -d @profile.json -k https://<hostname>:
<dashboard_port>/app/sites/update
592 IBM Telco Network Cloud Manager - Performance 1.4.5

Delete Sites
curl -k --cookie cookie.txt -X DELETE -H "Content-Type: application/json" -d @profile.json -k https://<hostname>:
<dashboard_port>/app/sites/delete
Count of existing Sites
curl -k --cookie cookie.txt https://<hostname>:<dashboard_port>/app/sites/count
Import Sites
curl -k --cookie cookie.txt -X POST -H "Content-Type: application/json" -d @profile.json -k https://<hostname>:
<dashboard_port>/app/sites/import
Inventory
For more information about configuring Resource types from UI, see Managing Resource types.
List all Resource types
curl -k --cookie cookie.txt https://<hostname>:<dashboard_port>/inventory/rest/topology/resources?type=device
Create Resource types
Note: If a resource already exists, it is updated based on the POST request if not, it is inserted.
curl -k --cookie cookie.txt -X POST -H "Content-Type: application/json" -d @profile.json https://<hostname>:
<dashboard_port>/inventory/rest/topology/resources/create
Sample reference of input file for POST request. The JSON file format for all other POST request is similar.
{
"resources": [
{
"id": "10.55.239.131_interface:<3>",
"type": "interface",
"bandwidth": "100000"
}
]
}
Field Description
id Specify an ID for the Resource type.
type Resource type name
bandwidth The volume of information that can be sent over a connection in a measured amount of time. It is calculated in megabits per second
(Mbps).
Delete Resource types
curl -k --cookie cookie.txt -X DELETE -H "Content-Type: application/json" -d @profile.json https://<hostname>:
<dashboard_port>/inventory/rest/topology/resources/delete
Update Resource types
curl -k --cookie cookie.txt -X POST -H "Content-Type: application/json" -d @profile.json https://<hostname>:
<dashboard_port>/inventory/rest/topology/resources/create
Create relation
curl -k --cookie cookie.txt -X POST -H "Content-Type: application/json" -d @profile.json https://<hostname>:
<dashboard_port>/inventory/rest/topology/relations/create
Sample reference of input file for POST request. The JSON file format for all other POST request is similar.
[
{
"relations": {
"source": {
"id": "10.10.10.1",
"type": "device"
},
"target": {
"id": "10.10.10.1_interface:<10>",
"type": "interface"
},
"type": "contain"
}
}
]
Field Description
source Source details in the relation
id Source ID
type Source Resource type
target Target details in the relation
id Target ID
type Target Resource type
Delete relation
curl -k --cookie cookie.txt -X DELETE -H "Content-Type: application/json" -d @profile.json https://<hostname>:
<dashboard_port>/inventory/rest/topology/relations/delete
IBM Telco Network Cloud Manager - Performance 1.4.5 593

Get all descendants
curl -k --cookie cookie.txt https://<hostname>:<dashboard_port>/inventory/rest/topology/resources/descendants?
source_type=device&source_id=10.55.239.31
Get all ascendents
curl -k --cookie cookie.txt https://<hostname>:<dashboard_port>/inventory/rest/topology/resources/ancestor?
source_type=interface&source_type=interface&source_id=10.10.10.1_interface:<10>
Group configuration or Resource grouping
For more information about configuring Resource groups, see
List all groups
curl -k --cookie cookie.txt https://<hostname>:<dashboard_port>/inventory/rest/topology/groups
List specific group
curl -k --cookie cookie.txt https://<hostname>:<dashboard_port>/inventory/rest/topology/groups ?groupName=<group
definition name>
Count
curl -k --cookie cookie.txt https://<hostname>:<dashboard_port>/inventory/rest/topology/groups/count
Create static group
To create a static group you must provide group member resources. Backend will group the provided resources.
curl -k --cookie cookie.txt -X POST -H "Content-Type: application/json" -d @profile.json https://<hostname>:
<dashboard_port>/inventory/rest/topology/groups
Sample reference of input file
{
"startTime":0,
"groupType":"static",
"relation":"groupOf",
"description":"",
"condition":"",
"groupBy":"",
"groupName":"testStatic",
"status":"ACTIVE",
"updateTime":1641207969369,
"resources":[
{
"id":"AUH02/BSC03-001",
"type":"bsc",
"tenant":"base"
},
{
"id":"AUH02/BSC04-001",
"type":"bsc",
"tenant":"base"
}
]
}
Create a dynamic group (In active mode)
In dynamic grouping group membership decided base group condition provided. Backend also internally sub group resources based on resource properties if
groupBy is provided. If a dynamic group created in active mode, the group definition is added and grouping is initialized.
curl -k --cookie cookie.txt -X POST -H "Content-Type: application/json" -d @profile.json https://<hostname>:
<dashboard_port>/inventory/rest/topology/groups
Sample reference of input file
{
"startTime":0,
"groupType":"dynamic",
"relation":"groupOf",
"description":"",
"condition":"resource.type=='device'",
"groupBy":"",
"groupName":"testDynamic",
"status":"ACTIVE",
"updateTime":1641209478572,
"resources":""
}
Create a dynamic group (In inactive mode)
If a dynamic group is created in inactive mode, group definition is added but grouping not initialized.
curl -k --cookie cookie.txt -X POST -H "Content-Type: application/json" -d @profile.json https://<hostname>:
<dashboard_port>/inventory/rest/topology/groups
Sample reference of input file
{
"startTime":0,
"groupType":"dynamic",
"relation":"groupOf",
"description":"",
594 IBM Telco Network Cloud Manager - Performance 1.4.5

"condition":"resource.type=='device'",
"groupBy":"",
"groupName":"testDynamic",
"status":"INACTIVE",
"updateTime":1641209478572,
"resources":""
}
Validate groups
Validation request validates the group definition and returns group hierarchy build after the group creation. Validation does not create any grouping at the
backend.
curl -k --cookie cookie.txt -X POST -H "Content-Type: application/json" -d @profile.json https://<hostname>:
<dashboard_port>/inventory/rest/topology/validate
Sample reference of input file
{
"startTime":1641209469011,
"groupType":"dynamic",
"relation":"groupOf",
"description":"",
"condition":"resource.type=='device'",
"groupBy":"",
"groupName":"testDynamic",
"status":"ACTIVE",
"updateTime":1641209478572
}
Update group
curl -k --cookie cookie.txt -X PUT -H "Content-Type: application/json" -d @profile.json https://<hostname>:
<dashboard_port>/inventory/rest/topology/groups
Sample reference of input file
{
"startTime":1640768829810,
"groupType":"dynamic",
"relation":"groupOf",
"description":"kl/10.212.7.244 a",
"condition":"resource.remoteContext=='kl' && resource.type=='device'",
"groupBy":"",
"groupName":"DynamicGroup_kl/10.212.7.244",
"status":"ACTIVE",
"updateTime":1641378345533,
"resources":""
}
Delete group
curl -k --cookie cookie.txt -X DELETE -H "Content-Type: application/json" -d @profile.json https://<hostname>:
<dashboard_port>/inventory/rest/topology/groups
Sample reference of input file
[
{
"startTime":1640771073162,
"groupType":"dynamic",
"relation":"groupOf",
"description":"DynamicGroup_IND/10.212.7.244",
"condition":"resource.remoteContext=='IND' && resource.type=='device'",
"groupBy":"",
"groupName":"DynamicGroup_IND/10.212.7.244",
"status":"ACTIVE",
"resources":"",
"updateTime":1640771079025
}
]
inactivate group
Inactivating group stops the group membership reconciliation.
curl -k --cookie cookie.txt -X PUT -H "Content-Type: application/json" -d @profile.json https://<hostname>:
<dashboard_port>/inventory/rest/topology/groups/inactivate
Sample reference of input file
[
{
"startTime":1640768829810,
"groupType":"dynamic",
"relation":"groupOf",
"description":"kl/10.212.7.244 a",
"condition":"resource.remoteContext=='kl' && resource.type=='device'",
"groupBy":"",
"groupName":"DynamicGroup_kl/10.212.7.244",
"status":"INACTIVE",
"resources":"",
"updateTime":1641378345533
}
]
Activate group
IBM Telco Network Cloud Manager - Performance 1.4.5 595

Activating the group initializes an inactive group hierarchy and backend starts to monitor members that are updated to reconcile group.
curl -k --cookie cookie.txt -X PUT -H "Content-Type: application/json" -d @profile.json https://<hostname>:
<dashboard_port>/inventory/rest/topology/groups/inactivate
Sample reference of input file
[
{
"startTime":1641374519766,
"groupType":"dynamic",
"relation":"groupOf",
"description":"",
"condition":"resource.type=='powerSupplies'",
"groupBy":"",
"groupName":"testDynamic",
"status":"ACTIVE",
"resources":"",
"updateTime":1641387213311
}
]
Import group
Helps to add group definitions in bulk.
Note: When dynamic group condition is too generic and more definitions are in import, group membership evaluation and group initialization are heavy
operations. It might have performance impact.
curl -k --cookie cookie.txt -X POST -H "Content-Type: application/json" -d @profile.json https://<hostname>:
<dashboard_port>/inventory/rest/topology/groups/import
Sample reference of input file
[
{
"startTime":1641374519766,
"groupType":"dynamic",
"relation":"groupOf",
"description":"",
"condition":"resource.type=='powerSupplies'",
"groupBy":"",
"groupName":"testDynamicImport",
"status":"ACTIVE",
"resources":"",
"updateTime":1641387223875
},
{
"startTime":1641374370710,
"groupType":"static",
"relation":"groupOf",
"description":"",
"condition":"",
"groupBy":"",
"groupName":"testStaticImport",
"status":"ACTIVE",
"resources":[
{
"id":"schztxce-d2325618-001/controller-0",
"tenant":"base",
"type":"kubernetesNode"
},
{
"id":"hnrtnycr-d5063707-001/controller-0",
"tenant":"base",
"type":"kubernetesNode"
}
],
"updateTime":1641374370970
}
]
Dashboard reference
Use this reference to understand the metrics that are displayed on each Telco Network Cloud Manager - Performance dashboard, and other properties of the dashboard.
The following types of metrics are stored in Telco Network Cloud Manager - Performance database:
Raw metrics
UDCs metrics
Analytic metrics
For more information, see Data storage in time series database.
These individual metrics and a combination of the metrics are displayed in various dashboards and widgets. The data is queried and retrieved from the database with the
help of REST APIs.
REST (REpresentational State Transfer) APIs rely on a stateless, client/server, cacheable communications protocol. REST applications use HTTP requests to post data
(create and update), read data (such as running queries), and delete data. REST is a lightweight alternative to mechanisms like RPC (Remote Procedure Calls) and Web
Services (such as SOAP and WSDL). Much like Web Services, a REST service is:
Platform-independent
596 IBM Telco Network Cloud Manager - Performance 1.4.5

Language-independent
Standards-based (runs on top of HTTP)
Able to be used in the presence of firewalls.
Properties of the summary-level dashboards
Summary-level dashboards are strategic dashboards for organizational decisions that provide the significant overview about your network health and performance.
These dashboards improve visibility by displaying metrics with birds-eye-view visualizations and to consolidate the insights.
Properties of the summary-level dashboards
Summary-level dashboards are strategic dashboards for organizational decisions that provide the significant overview about your network health and performance. These
dashboards improve visibility by displaying metrics with birds-eye-view visualizations and to consolidate the insights.
Properties of the Interface traffic monitoring dashboard
This information provides the properties of the Interface traffic monitoring dashboard and its widgets.
Properties of the IP links performance overview dashboards
This information provides the properties of the IP links performance overview dashboards and their associated widgets.
Properties of the GPON Optical Line Terminal (OLT) dashboards
This information provides the properties of the GPON dashboards and their associated widgets.
Properties of the ICMP Ping dashboards
This information provides the properties of ICMP Ping dashboards, it's listener and drill-down dashboards and widgets.
Properties of the Load balancer dashboards
This information provides the properties of the Load balancer dashboards and their associated widgets.
Properties of the Mobile Circuit switch access dashboard
This information provides the properties of the Mobile Circuit switch access dashboard and its associated widgets.
Properties of the Mobile Circuit switch core dashboard
This information provides the properties of the Mobile Circuit switch core dashboard and its associated widgets.
Properties of the Mobile Packet switch access dashboard
This information provides the properties of the Mobile Packet switch access dashboard and its associated widgets.
Properties of the WiFi overview dashboard
This information provides the properties of the WiFi overview and its associated widgets.
Properties of the NetFlow dashboards
This information provides the properties of all the NetFlow dashboards.
Properties of the Cisco SD-WAN dashboards
This information provides the properties of Cisco SD-WAN dashboards, it's drill-down dashboards and widgets.
Properties of the Interface traffic monitoring dashboard
This information provides the properties of the Interface traffic monitoring dashboard and its widgets.
The data on Interface traffic monitoring dashboard is populated from the following technology packs.
network-health-generic
network-health
network-health-extension
Data flow to Interface traffic monitoring dashboard and its widgets
Widget name Type of data Metric
Top 10 Inbound Utilization (%) Raw Max(Network.Inbound.Utilization.Percent)
Top 10 Outbound Utilization (%) Raw Max(Network.Outbound.Utilization.Percent)
Inbound Utilization (%) Trend Raw Network.Inbound.Utilization.Percent
Outbound Utilization (%) Trend Raw Network.Outbound.Utilization.Percent
Interface Traffic Summary Aggregated metrics Max(Network.Inbound.Utilization.Percent)
Max(Network.Outbound.Utilization.Percent)
Max(Network.Outbound.Throughput.bps)
Max(Network.Inbound.Octets.Bytes)
Sum(Network.Outbound.Octets.Bytes)
Sum(Network.Inbound.Packets.Count)
Sum(Network.Outbound.Packets.Count)
Sum(Network.Inbound.Errors.Count)
Sum(Network.Outbound.Errors.Count)
Sum(Network.Inbound.Discards.Count)
Sum(Network.Outbound.Discards.Count)
Max(Network.Inbound.Throughput.bps)
Properties of the IP links performance overview dashboards
This information provides the properties of the IP links performance overview dashboards and their associated widgets.
IBM Telco Network Cloud Manager - Performance 1.4.5 597

The data on IP links performance overview dashboards is populated from the following technology packs.
Dependent technology packs:
Network Health v1.18.0
SNMP technology packs:
network-probe-cisco
network-probe-huawei
network-probe-juniper
Data flow to IP links performance overview dashboard and its widgets
Widget name Metrics Type of data Technology Pack
Average Outbound One Way Latency for Speech Application Probe.Jitter.Outbound.One-way.Avg.ms Raw network-probe-cisco
network-probe-huawei
network-probe-juniper
Data flow to Source and destination details dashboard and its widgets
Widget name Metrics Type of data Technology Pack
Maximum Latency - Outbound (ms) MAX(Probe.Jitter.Outbound.One-way.Avg.ms) Raw network-probe-cisco
network-probe-huawei
network-probe-juniper
Maximum Latency - Inbound (ms) MAX(Probe.Jitter.Inbound.One-way.Avg.ms) Raw network-probe-cisco
network-probe-huawei
network-probe-juniper
Maximum Jitter - Outbound (ms) MAX(Probe.Jitter.Outbound.Avg.ms) Raw network-probe-cisco
network-probe-huawei
network-probe-juniper
Maximum Jitter - Inbound (ms) MAX(Probe.Jitter.Inbound.Avg.ms) Raw network-probe-cisco
network-probe-huawei
network-probe-juniper
Maximum Packet Loss - Outbound (%) MAX(Probe.Jitter.Outbound.Packet.Loss.Percent) Raw network-probe-cisco
network-probe-huawei
network-probe-juniper
Maximum Packet Loss - Inbound (%) MAX(Probe.Jitter.Inbound.Packet.Loss.Percent) Raw network-probe-cisco
network-probe-huawei
network-probe-juniper
Latency (ms) Probe.Jitter.Inbound.One-way.Avg.ms
Probe.Jitter.Outbound.One-way.Avg.ms
Raw network-probe-cisco
network-probe-huawei
network-probe-juniper
Jitter (ms) Probe.Jitter.Inbound.Avg.ms
Probe.Jitter.Outbound.Avg.ms
Raw network-probe-cisco
network-probe-huawei
network-probe-juniper
Packet Loss (%) Probe.Jitter.Inbound.Packet.Loss.Percent
Probe.Jitter.Outbound.Packet.Loss.Percent
Raw network-probe-cisco
network-probe-huawei
network-probe-juniper
Related information
IP Links Performance Overview
Source and destination details
Properties of the GPON Optical Line Terminal (OLT) dashboards
This information provides the properties of the GPON dashboards and their associated widgets.
The data on GPON dashboards is populated from the following technology packs.
Dependent technology packs:
neutral-access-gom
network-health
SNMP technology packs:
network-access-huawei
File-based
network-access-nokia
598 IBM Telco Network Cloud Manager - Performance 1.4.5

Data flow to GPON OLT overview dashboard and its widgets
Widget name Metrics Type of data Technology Pack
System Health
CPU Utilization smax_GPON.Card.CPU.Utilization.Percent Stream
Analytics
network-access-
huawei
network-access-
nokia
Memory Utilization smax_GPON.Card.Memory.Utilization.Percent Stream
Analytics
Traffic Monitoring (Uplink Interface)
Ethernet Incoming Utilization smax_GPON.Interface.Ethernet.Incoming.Utilization.Percent Stream
Analytics
network-access-
huawei
network-access-
nokia
Ethernet Outgoing Utilization smax_GPON.Interface.Ethernet.Outgoing.Utilization.Percent Stream
Analytics
Traffic Monitoring (PON Port)
Upstream Utilization smax_GPON.Interface.PON.OLT.Side.Total.Utilization.Up.Max.Percent Stream
Analytics
network-access-
huawei
network-access-
nokia
Downstream Utilization smax_GPON.Interface.PON.OLT.Side.Total.Utilization.Down.Max.Percen
tStream
Analytics
network-access-
huawei
network-access-
nokia
Downstream Broadcast
Utilization
smax_GPON.Interface.PON.OLT.Side.Broadcast.Utilization.Down.Max.Pe
rcent Stream
Analytics
network-access-
nokia
Downstream Multicast
Utilization
smax_GPON.Interface.PON.OLT.Side.Multicast.Utilization.Down.Max.Pe
rcent Stream
Analytics
network-access-
nokia
Downstream Unicast Utilization smax_GPON.Interface.PON.OLT.Side.Unicast.Utilization.Down.Max.Perc
ent Stream
Analytics
network-access-
nokia
Optical Monitoring
Transmitted Optical Signal smin_GPON.Interface.PON.OLT.Transmitted.Optical.Power.Signal.dBm Stream
Analytics
network-access-
huawei
network-access-
nokia
Received Optical Signal smin_GPON.Interface.PON.OLT.Received.Optical.Power.Signal.dBm Stream
Analytics
network-access-
huawei
Laser Bias Current smax_GPON.Interface.PON.OLT.Laser.Bias.Current.mA Stream
Analytics
network-access-
nokia
Voltage smax_GPON.Interface.PON.OLT.Voltage.V Stream
Analytics
network-access-
nokia
Temperature smax_GPON.Interface.PON.OLT.Temperature.Celsius Stream
Analytics
network-access-
nokia
Data flow to System health details dashboard and its widgets
Widget name Metrics Type of data Technology Pack
System Health Summary
Card displayName Raw
CPU Utilization (%) GPON.Card.CPU.Utilization.Percent Raw network-access-huawei
network-access-nokia
Max CPU Utilization (%) MAX (GPON.Card.CPU.Utilization.Percent) Raw
Memory Utilization (%) GPON.Card.Memory.Utilization.Percent Raw
Max Memory Utilization (%) MAX (GPON.Card.Memory.Utilization.Percent) Raw
CPU Utilization Trend GPON.Card.CPU.Utilization.Percent Raw
Memory Utilization Trend GPON.Card.Memory.Utilization.Percent Raw
Data flow to Traffic monitoring (Uplink Interface) details dashboard and its widgets
Widget name Metrics Type of data Technology Pack
Traffic Monitoring (Uplink Interface) Summary
Ethernet Port displayName Raw
Incoming Utilization (%) GPON.Interface.Ethernet.Incoming.Utilization.Percent Raw network-access-huawei
network-access-nokia
Max Incoming Utilization (%) MAX (GPON.Interface.Ethernet.Incoming.Utilization.Percent) Raw
Outgoing Utilization (%) GPON.Interface.Ethernet.Outgoing.Utilization.Percent Raw
Max Outgoing Utilization (%) MAX (GPON.Interface.Ethernet.Outgoing.Utilization.Percent) Raw
Incoming Throughput GPON.Interface.Ethernet.Incoming.Throughput.bps Raw network-access-nokia
Max Incoming Throughput MAX (GPON.Interface.Ethernet.Incoming.Throughput.bps) Raw
Outgoing Throughput GPON.Interface.Ethernet.Outgoing.Throughput.bps Raw
Max Outgoing Throughput MAX (GPON.Interface.Ethernet.Outgoing.Packets.Count) Raw
Incoming Packets GPON.Interface.Ethernet.Incoming.Packets.Count Raw
Max Incoming Packets MAX (GPON.Interface.Ethernet.Incoming.Packets.Count) Raw
Outgoing Packets GPON.Interface.Ethernet.Outgoing.Packets.Count Raw
Max Outgoing Packets MAX (GPON.Interface.Ethernet.Outgoing.Packets.Count) Raw
Incoming Utilization Trend GPON.Interface.Ethernet.Incoming.Utilization.Percent Raw network-access-huawei
IBM Telco Network Cloud Manager - Performance 1.4.5 599

Widget name Metrics Type of data Technology Pack
network-access-nokia
Outgoing Utilization Trend GPON.Interface.Ethernet.Outgoing.Utilization.Perc Raw
Incoming Throughput Trend GPON.Interface.Ethernet.Incoming.Throughput.bps Raw network-access-nokia
Outgoing Throughput Trend GPON.Interface.Ethernet.Outgoing.Throughput.bps Raw
Incoming Packets Trend GPON.Interface.Ethernet.Incoming.Packets.Count Raw
Outgoing Packets Trend GPON.Interface.Ethernet.Outgoing.Packets.Count Raw
Data flow to Traffic monitoring (PON Port) details dashboard and its widgets
Widget name Metrics Type of data Technology Pack
Traffic Monitoring (PON Port) Summary
PON Port displayName Raw
Upstream Utilization (%) GPON.Interface.PON.OLT.Side.Total.Utilization.Up.Max.Percent Raw network-access-
huawei
network-access-
nokia
Max Upstream Utilization (%) MAX
(GPON.Interface.PON.OLT.Side.Total.Utilization.Up.Max.Percent) Raw
Downstream Utilization (%) GPON.Interface.PON.OLT.Side.Total.Utilization.Down.Max.Percent Raw
Max Downstream Utilization (%) MAX
(GPON.Interface.PON.OLT.Side.Total.Utilization.Down.Max.Percen
t)
Raw
Downstream Broadcast Utilization (%) GPON.Interface.PON.OLT.Side.Broadcast.Utilization.Down.Max.Per
cent Raw network-access-
nokia
Max Downstream Broadcast Utilization
(%)
MAX
(GPON.Interface.PON.OLT.Side.Broadcast.Utilization.Down.Max.Pe
rcent)
Raw
Downstream Multicast Utilization (%) GPON.Interface.PON.OLT.Side.Multicast.Utilization.Down.Max.Per
cent Raw
Max Downstream Multicast Utilization
(%)
MAX
(GPON.Interface.PON.OLT.Side.Multicast.Utilization.Down.Max.Pe
rcent)
Raw
Downstream Unicast Utilization (%) GPON.Interface.PON.OLT.Side.Unicast.Utilization.Down.Max.Perce
nt Raw
Max Downstream Unicast Utilization
(%)
MAX
(GPON.Interface.PON.OLT.Side.Unicast.Utilization.Down.Max.Perc
ent)
Raw
Upstream Dropped Bytes GPON.Interface.PON.OLT.Side.Total.Dropped.Bytes.Up.Count Raw
Max Upstream Dropped Bytes MAX (GPON.Interface.PON.OLT.Side.Total.Dropped.Bytes.Up.Count) Raw
Downstream Dropped Bytes GPON.Interface.PON.OLT.Side.Multicast.Dropped.Bytes.Down.Count Raw
Max Downstream Dropped Bytes MAX
(GPON.Interface.PON.OLT.Side.Multicast.Dropped.Bytes.Down.Coun
t)
Raw
Upstream Utilization Trend GPON.Interface.PON.OLT.Side.Total.Utilization.Up.Max.Percent Raw network-access-
huawei
network-access-
nokia
Downstream Traffic Utilization Trend GPON.Interface.PON.OLT.Side.Total.Utilization.Down.Max.Percent
GPON.Interface.PON.OLT.Side.Broadcast.Utilization.Down.Max.Per
cent
GPON.Interface.PON.OLT.Side.Multicast.Utilization.Down.Max.Per
cent
GPON.Interface.PON.OLT.Side.Unicast.Utilization.Down.Max.Perce
nt
Raw
Upstream Dropped Bytes Trend GPON.Interface.PON.OLT.Side.Total.Dropped.Bytes.Up.Count Raw network-access-
nokia
Downstream Dropped Bytes Trend GPON.Interface.PON.OLT.Side.Multicast.Dropped.Bytes.Down.Count Raw
Upstream Dropped Packets Trend GPON.Interface.PON.OLT.Side.Total.Dropped.Packets.Up.Count Raw
Downstream Dropped Packets Trend GPON.Interface.PON.OLT.Side.Multicast.Dropped.Packets.Down.Cou
nt Raw
Data flow to Optical monitoring details dashboard and its widgets
Widget name Metrics Type of data Technology Pack
Optical Monitoring Summary
PON Port displayName Raw
Transmitted Optical Signal (dBm) GPON.Interface.PON.OLT.Transmitted.Optical.Power.Signal.dBm Raw network-access-
huawei
network-access-nokia
Min Transmitted Optical Signal
(dBm)
MIN
(GPON.Interface.PON.OLT.Transmitted.Optical.Power.Signal.dBm) Raw
Received Optical Signal (dBm) GPON.Interface.PON.OLT.Received.Optical.Power.Signal.dBm Raw network-access-
huawei
Min Received Optical Signal (dBm) MIN (GPON.Interface.PON.OLT.Received.Optical.Power.Signal.dBm) Raw
Laser Bias Current (mA) GPON.Interface.PON.OLT.Laser.Bias.Current.mA Raw network-access-nokia
Max Laser Bias Current (mA) MAX (GPON.Interface.PON.OLT.Laser.Bias.Current.mA) Raw
Volatge (V) GPON.Interface.PON.OLT.Voltage.V Raw
Max Volatge (V) MAX (GPON.Interface.PON.OLT.Voltage.V) Raw
Temperature (˚C) GPON.Interface.PON.OLT.Temperature.Celsius Raw
Max Temperature (˚C) MAX (GPON.Interface.PON.OLT.Temperature.Celsius) Raw
Transmitted Optical Signal Trend GPON.Interface.PON.OLT.Transmitted.Optical.Power.Signal.dBm Raw network-access-
huawei
network-access-nokia
600 IBM Telco Network Cloud Manager - Performance 1.4.5

Widget name Metrics Type of data Technology Pack
Received Optical Signal Trend GPON.Interface.PON.OLT.Received.Optical.Power.Signal.dBm Raw network-access-
huawei
Laser Bias Current Trend GPON.Interface.PON.OLT.Laser.Bias.Current.mA Raw network-access-nokia
Volatge Trend GPON.Interface.PON.OLT.Voltage.V Raw
Temperature Trend GPON.Interface.PON.OLT.Temperature.Celsius Raw
Related information
GPON Optical Line Terminal (OLT) dashboards
Properties of the ICMP Ping dashboards
This information provides the properties of ICMP Ping dashboards, it's listener and drill-down dashboards and widgets.
The data in the ICMP Ping dashboards is populated from the following technology packs:
network-health
network-health-extension
Data flow to Ping overview dashboard
Widget name Metric or Property Type of data
Total Devices ICMP.Ping.Status
Reachable Devices ICMP.Ping.Status
Unreachable Devices ICMP.Ping.Status
Worst Devices Reachability
Hostname
IP address
Vendor
Reachability (%)
Current Ping Status
Hostname
IP address
Vendor
ICMP.Ping.Status
last(ICMP.Ping.Status)
Worst Response Time
Hostname
IP address
Vendor
Response Time (ms)
Hostname
IP address
Vendor
ICMP.Ping.Response.Time.ms
Worst Packet Loss
Hostname
IP address
Vendor
Packet Loss (%)
Hostname
IP address
Vendor
ICMP.Ping.Packet.Loss.Percent
Device overview
Widget name Metrics or Property Type of data
Devices
Hostname
IP address
Vendor
Reachability (%)
Response Time (ms)
Packet Loss (%)
Current Ping Status
Hostname
IP address
Vendor
ICMP.Ping.Status
ICMP.Ping.Response.Time.ms
ICMP.Ping.Packet.Loss.Percent
last(ICMP.Ping.Status)
Device ping details
Widget name Metric or Property Type of data
IBM Telco Network Cloud Manager - Performance 1.4.5 601

Widget name Metric or Property Type of data
Device Ping Details
Hostname
IP address
Vendor
Reachability (%)
Response Time (ms)
Packet Loss (%)
Current Ping Status
Device Interfaces
Interface
Interface Index
Reachability (%)
Response Time (ms)
Packet Loss (%)
Current Ping Status
Interface name (Enriched)
Interface index
ICMP.Ping.Status
ICMP.Ping.Response.Time.ms
ICMP.Ping.Packet.Loss.Percent
last(ICMP.Ping.Status)
Reachability (%) Trend ICMP.Ping.Status
Response Time (ms) Trend ICMP.Ping.Response.Time.ms
Packet Loss (%) Trend ICMP.Ping.Packet.Loss.Percent
Interface ping details
Widget name Metric or Property Type of data
Interface Ping Details
Interface
Interface Index
Reachability (%)
Response Time (ms)
Packet Loss (%)
Current Ping Status
Interface name (Enriched)
Interface index
ICMP.Ping.Status
ICMP.Ping.Response.Time.ms
ICMP.Ping.Packet.Loss.Percent
last(ICMP.Ping.Status)
Reachability (%) Trend ICMP.Ping.Status
Response Time (ms) Trend ICMP.Ping.Response.Time.ms
Packet Loss (%) Trend ICMP.Ping.Packet.Loss.Percent
Related concepts
ICMP Ping dashboards
Properties of the Load balancer dashboards
This information provides the properties of the Load balancer dashboards and their associated widgets.
The data on Load balancer dashboards is populated from the following technology packs.
Dependent technology packs:
network-health
SNMP technology packs:
load-balancer-f5BigIp
Data flow to Load balancer overview dashboard and its widgets
Widget name Metrics Type of data Technology Pack
Local Traffic Managers This is calculated by using REST API as:
resource type =deviceLtm
Raw load-balancer-f5BigIp
Local Traffic Managers - Red Ltm.Child.State.Critical.Number Raw load-balancer-f5BigIp
Local Traffic Managers - Yellow Ltm.Child.State.Warning.Number Raw load-balancer-f5BigIp
Local Traffic Managers - Green Ltm.Child.State.Good.Number Raw load-balancer-f5BigIp
Virtual Servers Virtual.Server.Total.Number Raw load-balancer-f5BigIp
Virtual Servers - Red Virtual.Server.State.Critical.Number Raw load-balancer-f5BigIp
Virtual Servers - Yellow Virtual.Server.State.Warning.Number Raw load-balancer-f5BigIp
Virtual Servers - Green Virtual.Server.State.Good.Number Raw load-balancer-f5BigIp
Global Traffic Managers This is calculated by using REST API as:
resource type =deviceGtm
Raw load-balancer-f5BigIp
Global Traffic Managers - Red Gtm.Child.State.Critical.Number Raw load-balancer-f5BigIp
Global Traffic Managers - Yellow Gtm.Child.State.Warning.Number Raw load-balancer-f5BigIp
Global Traffic Managers - Green Gtm.Child.State.Good.Number Raw load-balancer-f5BigIp
602 IBM Telco Network Cloud Manager - Performance 1.4.5

Widget name Metrics Type of data Technology Pack
Pools Pool.Total.Number Raw load-balancer-f5BigIp
Pools - Red Pool.State.Critical.Number Raw load-balancer-f5BigIp
Pools - Yellow Pool.State.Warning.Number Raw load-balancer-f5BigIp
Pools - Green Pool.State.Good.Number Raw load-balancer-f5BigIp
Pool Members Pool.Member.Total.Number Raw load-balancer-f5BigIp
Pool Members - Red Pool.Member.State.Critical.Number Raw load-balancer-f5BigIp
Pool Members - Yellow Pool.Member.State.Warning.Number Raw load-balancer-f5BigIp
Pool Members - Green Pool.Member.State.Good.Number Raw load-balancer-f5BigIp
Top 5 LTM - Ranked by Current Connections
LTM entityName Raw load-balancer-f5BigIp
Current Connections Common.Current.Connections.Client.Side Raw load-balancer-f5BigIp
Connections per Second Common.New.Connections.Client.Side.Per.Second Raw load-balancer-f5BigIp
Inbound Throughput (bps) Common.Inbound.Throughput.Client.Side.bps Raw load-balancer-f5BigIp
Outbound Throughput (bps) Common.Outbound.Throughput.Client.Side.bps Raw load-balancer-f5BigIp
CPU Utilization (%) Common.CPU.Utilization.Percent Raw load-balancer-f5BigIp
Memory Utilization (%) Common.TMM.Memory.Utilization.Percent Raw load-balancer-f5BigIp
Top 5 Virtual Servers by Current Connections - <LTM_Device>
Current Connections Virtual.Server.Current.Connections Raw load-balancer-f5BigIp
Data flow to GTM details dashboard and its widgets
Widget name Metrics Type of data Technology Pack
GTM Health Summary
GTM entityName device level Raw load-balancer-f5BigIp
IP Address ipAddress Raw load-balancer-f5BigIp
Requests per Second Gtm.Requests.Per.Second Raw load-balancer-f5BigIp
Max Requests per Second MAX (Gtm.Requests.Per.Second) Raw load-balancer-f5BigIp
Resolutions per Second Gtm.Resolutions.Per.Second Raw load-balancer-f5BigIp
Max Resolutions per Second MAX (Gtm.Resolutions.Per.Second) Raw load-balancer-f5BigIp
Dropped per Second Gtm.Total.Dropped.Per.Second Raw load-balancer-f5BigIp
Max Dropped per Second MAX (Gtm.Total.Dropped.Per.Second) Raw load-balancer-f5BigIp
Current Connections Common.Concurrent.Connections.Client.Side Raw load-balancer-f5BigIp
Max Current Connections MAX (Common.Concurrent.Connections.Client.Side) Raw load-balancer-f5BigIp
Connections per Second Common.New.Connections.Client.Side.Per.Second Raw load-balancer-f5BigIp
Max Connections per Second MAX (Common.New.Connections.Client.Side.Per.Second) Raw load-balancer-f5BigIp
Inbound Throughput (bps) Common.Inbound.Throughput.Client.Side.bps Raw load-balancer-f5BigIp
Max Inbound Throughput (bps) (MAX)Common.Inbound.Throughput.Client.Side.bps Raw load-balancer-f5BigIp
Outbound Throughput (bps) Common.Outbound.Throughput.Client.Side.bps Raw load-balancer-f5BigIp
Max Outbound Throughput (bps) (MAX)Common.Outbound.Throughput.Client.Side.bps Raw load-balancer-f5BigIp
GTM Health Details > HEALTH DETAILS
Status Gtm.Child.Status.Number Raw load-balancer-f5BigIp
CPU Utilization (%) Common.CPU.Utilization.Percent Raw load-balancer-f5BigIp
Memory Utilization (%) Common.TMM.Memory.Utilization.Percent Raw load-balancer-f5BigIp
Dropped per Second Trend Gtm.Total.Dropped.Per.Second Raw load-balancer-f5BigIp
Request per Second Trend Gtm.Requests.Per.Second Raw load-balancer-f5BigIp
Resolutions per Second Trend Gtm.Resolutions.Per.Second Raw load-balancer-f5BigIp
Current Connections Trend Common.Current.Connections.Client.Side Raw load-balancer-f5BigIp
Connections per Second Trend Common.New.Connections.Client.Side.Per.Second Raw load-balancer-f5BigIp
Inbound Throughput (bps) Trend Common.Inbound.Throughput.Client.Side.bps Raw load-balancer-f5BigIp
Outbound Throughput (bps) Trend Common.Outbound.Throughput.Client.Side.bps Raw load-balancer-f5BigIp
GTM Health Details > WIDE IPS
Status WideIP.Status.Number Raw load-balancer-f5BigIp
Wide IP Name altDisplayName Resource Level Raw load-balancer-f5BigIp
Requests per Second WideIp.Total.Resolutions.Per.Second Raw load-balancer-f5BigIp
Max Requests per Second (MAX)WideIp.Total.Resolutions.Per.Second Raw load-balancer-f5BigIp
Resolutions per Second WideIp.Total.Requests.Per.Second Raw load-balancer-f5BigIp
Max Resolutions per Second (MAX)WideIp.Total.Requests.Per.Second Raw load-balancer-f5BigIp
Dropped per Second WideIp.Total.Dropped.Per.Second Raw load-balancer-f5BigIp
Max Dropped per Second (MAX)WideIp.Total.Dropped.Per.Second Raw load-balancer-f5BigIp
Data flow to LTM details dashboard and its widgets
Widget name Metrics Type of data Technology pack
LTM Health Summary
LTM entityName device level Raw load-balancer-f5BigIp
IP Address ipAddress Raw load-balancer-f5BigIp
Current Connections Common.Current.Connections.Client.Side Raw load-balancer-f5BigIp
IBM Telco Network Cloud Manager - Performance 1.4.5 603

Widget name Metrics Type of data Technology pack
Max Current Connections (MAX)Common.Current.Connections.Client.Side Raw load-balancer-f5BigIp
Connections per Second Common.New.Connections.Client.Side.Per.Second Raw load-balancer-f5BigIp
Max Connections per Second (MAX)Common.New.Connections.Client.Side.Per.Second Raw load-balancer-f5BigIp
Inbound Throughput (bps) Common.Inbound.Throughput.Client.Side.bps Raw load-balancer-f5BigIp
Max Inbound Throughput (bps) (MAX)Common.Inbound.Throughput.Client.Side.bps Raw load-balancer-f5BigIp
Outbound Throughput (bps) Common.Outbound.Throughput.Client.Side.bps Raw load-balancer-f5BigIp
Max Outbound Throughput (bps) (MAX)Common.Outbound.Throughput.Client.Side.bps Raw load-balancer-f5BigIp
CPU Utilization (%) Common.CPU.Utilization.Percent Raw load-balancer-f5BigIp
Max CPU Utilization (%) (MAX)Common.CPU.Utilization.Percent Raw load-balancer-f5BigIp
Memory Utilization (%) Common.TMM.Memory.Utilization.Percent Raw load-balancer-f5BigIp
Max Memory Utilization (%) (MAX)Common.TMM.Memory.Utilization.Percent Raw load-balancer-f5BigIp
LTM Health Details
Status Ltm.Child.Status.Number Raw load-balancer-f5BigIp
Virtual Servers Virtual.Server.Total.Number Raw load-balancer-f5BigIp
Virtual Server - Red Virtual.Server.State.Critical.Number Raw load-balancer-f5BigIp
Virtual Server - Yellow Virtual.Server.State.Warning.Number Raw load-balancer-f5BigIp
Virtual Server - Green Virtual.Server.State.Good.Number Raw load-balancer-f5BigIp
Pools Pool.Total.Number Raw load-balancer-f5BigIp
Pools - Red Pool.State.Critical.Number Raw load-balancer-f5BigIp
Pools - Yellow Pool.State.Warning.Number Raw load-balancer-f5BigIp
Pools - Green Pool.State.Good.Number Raw load-balancer-f5BigIp
Pool Members Pool.Member.Total.Number Raw load-balancer-f5BigIp
Pool Members - Red Pool.Member.State.Critical.Number Raw load-balancer-f5BigIp
Pool Members - Yellow Pool.Member.State.Warning.Number Raw load-balancer-f5BigIp
Pool Members - Green Pool.Member.State.Good.Number Raw load-balancer-f5BigIp
CPU Utilization (%) Common.CPU.Utilization.Percent Raw load-balancer-f5BigIp
Memory Utilization (%) Common.TMM.Memory.Utilization.Percent Raw load-balancer-f5BigIp
Top 5 Virtual Servers by Current Connections Virtual.Server.Current.Connections Raw load-balancer-f5BigIp
Current Connections Trend Common.Current.Connections.Client.Side Raw load-balancer-f5BigIp
Connections per Second Trend Common.New.Connections.Client.Side.Per.Second Raw load-balancer-f5BigIp
Inbound Throughput (bps) Trend Common.Inbound.Throughput.Client.Side.bps Raw load-balancer-f5BigIp
Outbound Throughput (bps) Trend Common.Outbound.Throughput.Client.Side.bps Raw load-balancer-f5BigIp
Data flow to Pool details dashboard and its widgets
Widget name Metrics Type of data Technology Pack
Pool Health Summary
Status Pool.Status.Number Raw load-balancer-f5BigIp
Pool altDisplayName resource level Raw load-balancer-f5BigIp
Load Balancing Algorithm loadBalancingAlgorithm Raw load-balancer-f5BigIp
Current Connections Pool.Current.Connections Raw load-balancer-f5BigIp
Max Current Connections (MAX) Pool.Current.Connections Raw load-balancer-f5BigIp
Connections per Second Pool.New.Connections.Per.Second Raw load-balancer-f5BigIp
Max Connections per Second (MAX) Pool.New.Connections.Per.Second Raw load-balancer-f5BigIp
Inbound Throughput (bps) Pool.Inbound.Throughput.bps Raw load-balancer-f5BigIp
Max Inbound Throughput (bps) (MAX) Pool.Inbound.Throughput.bps Raw load-balancer-f5BigIp
Outbound Throughput (bps) Pool.Outbound.Throughput.bps Raw load-balancer-f5BigIp
Max Outbound Throughput (bps) (MAX) Pool.Outbound.Throughput.bps Raw load-balancer-f5BigIp
Pool Health Details
Current Connections Trend Pool.Current.Connections Raw load-balancer-f5BigIp
Connections per Second Trend Pool.New.Connections.Per.Second Raw load-balancer-f5BigIp
Inbound Throughput (bps) Trend Pool.Inbound.Throughput.bps Raw load-balancer-f5BigIp
Outbound Throughput (bps) Trend Pool.Outbound.Throughput.bps Raw load-balancer-f5BigIp
Data flow to Pool member details dashboard and its widgets
Widget name Metrics Type of data Technology Pack
Pool Member Health Summary
Status Pool.Member.Status.Number Raw load-balancer-f5BigIp
Pool Member altDisplayName resource level Raw load-balancer-f5BigIp
IP Address poolMemberIpAddress Raw load-balancer-f5BigIp
Connection Limit Pool.Member.Connection.Limit Raw load-balancer-f5BigIp
Current Connections Pool.Member.Current.Connections Raw load-balancer-f5BigIp
Max Current Connections (MAX) Pool.Member.Current.Connections Raw load-balancer-f5BigIp
Connections per Second Pool.Member.New.Connections.Per.Second Raw load-balancer-f5BigIp
Max Connections per Second (MAX) Pool.Member.New.Connections.Per.Second Raw load-balancer-f5BigIp
Inbound Throughput (bps) Pool.Member.Inbound.Throughput.bps Raw load-balancer-f5BigIp
604 IBM Telco Network Cloud Manager - Performance 1.4.5

Widget name Metrics Type of data Technology Pack
Max Inbound Throughput (bps) (MAX)Pool.Member.Inbound.Throughput.bps Raw load-balancer-f5BigIp
Outbound Throughput (bps) Pool.Member.Outbound.Throughput.bps Raw load-balancer-f5BigIp
Max Outbound Throughput (bps) (MAX)Pool.Member.Outbound.Throughput.bps Raw load-balancer-f5BigIp
Pool Member Health Details
Current Connections Trend Pool.Current.Connections Raw load-balancer-f5BigIp
Connections per Second Trend Pool.New.Connections.Per.Second Raw load-balancer-f5BigIp
Inbound Throughput (bps) Trend Pool.Inbound.Throughput.bps Raw load-balancer-f5BigIp
Outbound Throughput (bps) Trend Pool.Outbound.Throughput.bps Raw load-balancer-f5BigIp
Data flow to Virtual server details dashboard and its widgets
Widget name Metrics Type of data Technology Pack
Virtual Server Health Summary
Status Virtual.Status.Number Raw load-balancer-f5BigIp
Virtual Server altDisplayName resource level Raw load-balancer-f5BigIp
IP Address vsIpAddress Raw load-balancer-f5BigIp
Connection Limit Virtual.Server.Connection.Limit Raw load-balancer-f5BigIp
Current Connections Virtual.Server.Current.Connection.Client Raw load-balancer-f5BigIp
Max Current Connections (MAX)Virtual.Server.Current.Connection.Client Raw load-balancer-f5BigIp
Connections per Second Virtual.Server.New.Connections.Per.Second Raw load-balancer-f5BigIp
Max Connections per Second (MAX)Virtual.Server.New.Connections.Per.Second Raw load-balancer-f5BigIp
Total Request Virtual.Server.Total.Requests Raw load-balancer-f5BigIp
Max Total Request (MAX)Virtual.Server.Total.Requests Raw load-balancer-f5BigIp
Inbound Throughput (bps) Virtual.Server.Inbound.Throughput.bps Raw load-balancer-f5BigIp
Max Inbound Throughput (bps) (MAX)Virtual.Server.Inbound.Throughput.bps Raw load-balancer-f5BigIp
Outbound Throughput (bps) Virtual.Server.Outbound.Throughput.bps Raw load-balancer-f5BigIp
Max Outbound Throughput (bps) (MAX)Virtual.Server.Outbound.Throughput.bps Raw load-balancer-f5BigIp
CPU Utilization (%) Virtual.Server.CPU.Utilization.percent Raw load-balancer-f5BigIp
Max CPU Utilization (%) (MAX)Virtual.Server.CPU.Utilization.percent Raw load-balancer-f5BigIp
Virtual Server Health Details
Current Connections Trend Virtual.Server.Current.Connection.Client
Virtual.Server.Connection.Limit
Raw load-balancer-f5BigIp
Connections per Second Trend Virtual.Server.New.Connections.Per.Second Raw load-balancer-f5BigIp
Inbound Throughput (bps) Trend Virtual.Server.Inbound.Throughput.bps Raw load-balancer-f5BigIp
Outbound Throughput (bps) Trend Virtual.Server.Outbound.Throughput.bps Raw load-balancer-f5BigIp
Total Request Trend Virtual.Server.Total.Requests Raw load-balancer-f5BigIp
CPU Utilization (%) Trend Virtual.Server.CPU.Utilization.Percent Raw load-balancer-f5BigIp
Related information
Load balancer dashboards
Properties of the Mobile Circuit switch access dashboard
This information provides the properties of the Mobile Circuit switch access dashboard and its associated widgets.
The data on Mobile Circuit switch access dashboards is populated from the following technology packs.
Dependent technology packs:
network-wireless
File-based technology packs:
gsm-huawei-bss-v900r021c10spc600
umts-huawei-utran-v100r015c10spc156
Mobile Access dashboards populate UDC metrics that are aggregated at a Region level through Batch Analytics. The created metrics for batch jobs are stored in timeseries
database with this naming convention, t<aggragator>_<groupby_time>_<metric_name>.
Data flow to Mobile Circuit switch access dashboard and its widgets
Widget
component Widget name Metrics Type of data Technology Pack
Accessibility 2G TCH Availability (%) tsum_hour_Region.Huawei_2G_TCH_Availability_Percent Batch Analytics gsm-huawei-bss-
v900r021c10spc600
Call Setup Success Rate
(%)
tsum_hour_Region.Huawei_2G_Call_Setup_Success_Rate_Pe
rcent
TCH Blocking Rate (%) tsum_hour_Region.Huawei_2G_TCH_Blocking_Rate_Percent
Accessibility 3G Availability (%) tsum_hour_Region.Huawei_3G_Cell_Availability_Percent Batch Analytics umts-huawei-utran-
v100r015c10spc156
RAB Success Rate (%) tsum_hour_Region.Huawei_3G_RAB_Establish_Success_Rate
_CS_Percent
IBM Telco Network Cloud Manager - Performance 1.4.5 605

Widget
component Widget name Metrics Type of data Technology Pack
Call Setup Success Rate
(%)
tsum_hour_Region.Huawei_3G_Call_Setup_Success_Rate_Pe
rcent
Retainability 2G Call Drop Rate (%) tsum_hour_Region.Huawei_2G_Call_Drop_Rate_Percent Batch Analytics gsm-huawei-bss-
v900r021c10spc600
Outgoing HO Success
Rate (%)
tsum_hour_Region.Huawei_2G_Outgoing_Handover_Success_
Rate_Percent
Incoming HO Success
Rate (%)
tsum_hour_Region.Huawei_2G_Incoming_Handover_Success_
Rate_Percent
Retainability 3G Call Drop Rate (%) tsum_hour_Region.Huawei_3G_Call_Drop_Rate_CS_Percent Batch Analytics umts-huawei-utran-
v100r015c10spc156
Soft HO Success Rate
(%)
tsum_hour_Region.Huawei_3G_Soft_Handover_Success_Rate
_Percent
InterRAT HO Success
Rate (%)
tsum_hour_Region.Huawei_3G_InterRAT_Handover_Success_
Rate_CS_Percent
Usage Usage 2G tsum_hour_Region.Huawei_2G_TCH_Attempts_Count
(Bar plot)
tsum_hour_Region.Huawei_2G_TCH_Traffic_Erlang
(Line plot)
Batch Analytics gsm-huawei-bss-
v900r021c10spc600
Usage 3G tsum_hour_Region.Huawei_3G_RAB_Attempts_Count
(Bar plot)
tsum_hour_Region.Huawei_3G_Voice_Call_Erlang
(Line plot)
Batch Analytics umts-huawei-utran-
v100r015c10spc156
Data flow to Mobile Circuit switch access 2G drill-down dashboard and its widgets
Dashboard name Widget name Metrics Type of data
CS Access - 2G Cell: Latest
Hourly Data
Worst 10 cells by TCH Availability (%) tsum_hour_cell.Huawei_2G_TCH_Availability_Percent Batch Analytics
CS Access - 2G Cell: Latest
Hourly Data
Worst 10 cells by Call Setup Success Rate
(%)
tsum_hour_cell.Huawei_2G_Call_Setup_Success_Rate_Perc
ent Batch Analytics
CS Access - 2G Cell: Latest
Hourly Data
Worst 10 cells by TCH Blocking Rate (%) tsum_hour_cell.Huawei_2G_TCH_Blocking_Rate_Percent Batch Analytics
CS Access - 2G Cell: Latest
Hourly Data
Worst 10 cells by Call Drop Rate (%) tsum_hour_cell.Huawei_2G_Call_Drop_Rate_Percent Batch Analytics
CS Access - 2G Cell: Latest
Hourly Data
Worst 10 cells by Outgoing HO Success
Rate (%)
tsum_hour_cell.Huawei_2G_Outgoing_Handover_Success_Ra
te_Percent Batch Analytics
CS Access - 2G Cell: Latest
Hourly Data
Worst 10 cells by Incoming HO Success
Rate (%)
tsum_hour_cell.Huawei_2G_Incoming_Handover_Success_Ra
te_Percent Batch Analytics
Data flow to Mobile Circuit switch access 3G drill-down dashboard and its widgets
Dashboard name Widget name Metrics Type of data
CS Access - 3G utranCell: Latest
Hourly Data
Worst 10 utranCells by 3G Availability (%) tsum_hour_utranCell.Huawei_3G_Cell_Availability_Perc
ent Batch Analytics
CS Access - 3G utranCell: Latest
Hourly Data
Worst 10 utranCells by 3G RAB Establish
Success Rate (%)
tsum_hour_utranCell.Huawei_3G_RAB_Establish_Success_
Rate_CS_Percent Batch Analytics
CS Access - 3G utranCell: Latest
Hourly Data
Worst 10 utranCells by 3G Call Setup
Success Rate (%)
tsum_hour_utranCell.Huawei_3G_Call_Setup_Success_Rat
e_Percent Batch Analytics
CS Access - 3G utranCell: Latest
Hourly Data
Worst 10 utranCells by 3G Call Drop Rate
(%)
tsum_hour_utranCell.Huawei_3G_Call_Drop_Rate_CS_Perc
ent Batch Analytics
CS Access - 3G utranCell: Latest
Hourly Data
Worst 10 utranCells by 3G InterRAT HO
Success Rate (%)
tsum_hour_utranCell.Huawei_3G_InterRAT_Handover_Succ
ess_Rate_CS_Percent Batch Analytics
CS Access - 3G utranCell: Latest
Hourly Data
Worst 10 utranCells by Soft HO Success
Rate (%)
tsum_hour_utranCell.Huawei_3G_Soft_Handover_Success_
Rate_Percent Batch Analytics
Related information
Circuit switch access dashboards
Properties of the Mobile Circuit switch core dashboard
This information provides the properties of the Mobile Circuit switch core dashboard and its associated widgets.
The data on Mobile Circuit switch core dashboards is populated from the following technology packs.
Dependent technology packs:
network-wireless
File-based technology packs:
umts-huawei-mscs-v200r011c10
606 IBM Telco Network Cloud Manager - Performance 1.4.5

Mobile Core dashboards populate UDC metrics that are aggregated at a Region level through Batch Analytics. The created metrics for batch jobs are stored in timeseries
database with this naming convention, t<aggragator>_<groupby_time>_<metric_name>.
Data flow to Mobile Circuit switch core dashboard and its widgets
Widget
component Widget name Metrics Type of data Technology Pack
Accessibility IMEI Check Success Rate (%) tsum_hour_Region.Huawei_IMEI_Check_Success_Rate_Percent Batch Analytics umts-huawei-
mscs-v200r011c10
HLR Authentication Success
Rate (%)
tsum_hour_Region.Huawei_HLR_Authentication_Success_Rate_
Percent
Call Setup Success Rate (%) tsum_hour_Region.Huawei_Call_Setup_Success_Rate_Percent
VOIP Seizure Success Rate (%) tsum_hour_Region.Huawei_VoIP_Seizure_Attempts_Success_Ra
te_Percent
Paging Success Rate (%) tsum_hour_Region.Huawei_Paging_Success_Rate_Percent
Location Update Success Rate
(%)
tsum_hour_Region.Huawei_Location_Update_Success_Rate_Per
cent
LAC Signaling Operations
Success Rate (%)
tsum_hour_Region.Huawei_GMSC_MAP_Signaling_Operations_Su
ccess_Rate_Percent
Send Routing Information
Success Rate (%)
tsum_hour_Region.Huawei_SRI_Success_Rate_Percent
Retainability Outgoing HO Success Rate (%) tsum_hour_Region.Huawei_Outgoing_Handover_Success_Rate_P
ercent Batch Analytics umts-huawei-
mscs-v200r011c10
Incoming HO Success Rate (%) tsum_hour_Region.Huawei_Incoming_Handover_Success_Rate_P
ercent
IntraMSC HO Success Rate (%) tsum_hour_Region.Huawei_IntraMSC_Handover_Success_Rate_P
ercent
IntraMSC WCDMA-GSM HO
Success Rate (%)
tsum_hour_Region.Huawei_IntraMSC_WCDMAtoGSM_Handover_Suc
cess_Rate_Percent
InterMSC WCDMA-GSM HO
Success Rate (%)
tsum_hour_Region.Huawei_InterMSC_WCDMAtoGSM_Handover_Suc
cess_Rate_Percent
Usage Traffic tsum_hour_Region.Huawei_Call_Attempts_Count (Bar
plot)
tsum_hour_Region.Huawei_Voice_Traffic_Erlang (Line
plot)
Batch Analytics umts-huawei-
mscs-v200r011c10
Subscribers tsum_hour_Region.Huawei_Own_Subscribers_Count
(Stacked Bar plot - bottom)
tsum_hour_Region.Huawei_Roaming_Subscribers_Count
(Stacked Bar plot - top)
Batch Analytics umts-huawei-
mscs-v200r011c10
Data flow to Mobile Circuit switch core drill-down dashboard and its widgets.
Dashboard name Widget name Metrics Type of data
CS Core - bsc and rnc: Latest
Hourly Data
Worst 10 BSCs by IMEI Check Success Rate (%) Batch Analytics
CS Core - bsc and rnc: Latest
Hourly Data
Worst 10 RNCs by IMEI Check Success Rate (%) Batch Analytics
CS Core - gtpPeerEntityName:
Latest Hourly Data
Worst 10 gtpPeerEntityNames by InterMSC
WCDMA-GSM HO Success Rate (%)
tsum_hour_gtpPeerEntityName.Huawei_InterMSC_WCDMAto
GSM_Handover_Success_Rate_Percent Batch Analytics
CS Core - gtpPeerEntityName:
Latest Hourly Data
Worst 10 gtpPeerEntityNames by IntraMSC
WCDMA-GSM HO Success Rate (%)
tsum_hour_gtpPeerEntityName.Huawei_IntraMSC_WCDMAto
GSM_Handover_Success_Rate_Percent Batch Analytics
CS Core - hoTypeMSC: Latest
Hourly Data
Worst 10 hoTypeMSCs by Outgoing HO Success
Rate (%)
tsum_hour_hoTypeMSC.Huawei_Outgoing_Handover_Succes
s_Rate_Percent Batch Analytics
CS Core - hoTypeMSC: Latest
Hourly Data
Worst 10 hoTypeMSCs by Incoming HO Success
Rate (%)
tsum_hour_hoTypeMSC.Huawei_Incoming_Handover_Succes
s_Rate_Percent Batch Analytics
CS Core - hoTypeMSC: Latest
Hourly Data
Worst 10 hoTypeMSCs by IntraMSC HO Success
Rate (%)
tsum_hour_hoTypeMSC.Huawei_IntraMSC_Handover_Succes
s_Rate_Percent Batch Analytics
CS Core - lac: Latest Hourly
Data
Worst 10 lacs by Location Update Success Rate
(%)
tsum_hour_lac.Huawei_Location_Update_Success_Rate_P
ercent Batch Analytics
CS Core - lac: Latest Hourly
Data
Worst 10 lacs by LAC Signalling Operations
Success Rate (%)
tsum_hour_lac.Huawei_GMSC_MAP_Signaling_Operations_
Success_Rate_Percent Batch Analytics
CS Core - lZone: Latest Hourly
Data
Worst 10 lZones by HLR Authentication Success
Rate (%)
tsum_hour_lZone.Huawei_HLR_Authentication_Success_R
ate_Percent Batch Analytics
CS Core - mgwPair: Latest
Hourly Data
Worst 10 mgwPairs by VOIP Seizure Success
Rate (%)
tsum_hour_mgwPair.Huawei_VoIP_Seizure_Attempts_Succ
ess_Rate_Percent Batch Analytics
CS Core - msc: Latest Hourly
Data
Worst 10 mscs by Paging Success Rate (%) tsum_hour_msc.Huawei_Paging_Success_Rate_Percent Batch Analytics
CS Core - msc: Latest Hourly
Data
Worst 10 mscs by Send Routing Information
Success Rate (%)
tsum_hour_msc.Huawei_SRI_Success_Rate_Percent Batch Analytics
CS Core - officeDirectionMSC:
Latest Hourly Data
Worst 10 officeDirectionMSCs by Call Setup
Success Rate (%)
tsum_hour_officeDirectionMSC.Huawei_Call_Setup_Succ
ess_Rate_Percent Batch Analytics
Related information
IBM Telco Network Cloud Manager - Performance 1.4.5 607

Circuit switch core dashboards
Properties of the Mobile Packet switch access dashboard
This information provides the properties of the Mobile Packet switch access dashboard and its associated widgets.
The data on Mobile Packet switch access dashboards is populated from the following technology packs.
Dependent technology packs:
network-wireless
File-based technology packs:
gsm-huawei-bss-v900r021c10spc600
umts-huawei-utran-v100r015c10spc156
lte-huawei-eutran-v100r015c10
nr-huawei-nutran-v100r015c10
Mobile Access dashboards populates UDC metrics that are aggregated at a Region level through Batch Analytics. The created metrics for batch jobs are stored in
timeseries database with this naming convention, t<aggragtor>_<groupby_time>_<metric_name>.
Data flow to Mobile Packet switch access dashboard and its widgets
Widget
component Widget name Metrics Type of data Technology pack
Accessibility 2G TCH Availability (%) tsum_hour_Region.Huawei_2G_TCH_Availability_Percent Batch Analytics gsm-huawei-bss-
v900r021c10spc600
TBF DL Success Rate (%) tsum_hour_Region.Huawei_2G_Downlink_TBF_Success_Rate_
Percent
PDCH Congestion Rate (%) tsum_hour_Region.Huawei_2G_PDCH_Congestion_Rate_Perce
nt
Accessibility 3G Availability (%) tsum_hour_Region.Huawei_3G_Cell_Availability_Percent Batch Analytics umts-huawei-utran-
v100r015c10spc156
RRC Establish Success Rate
(%)
tsum_hour_Region.Huawei_3G_RRC_Setup_Success_Rate_Per
cent
RAB Establish Success Rate
(%)
tsum_hour_Region.Huawei_3G_RAB_Establish_Success_Rate
_PS_Percent
Accessibility 4G Availability (%) tsum_hour_Region.Huawei_4G_Cell_Availability_Percent Batch Analytics lte-huawei-eutran-
v100r015c10
RRC Establish Success Rate
(%)
tsum_hour_Region.Huawei_4G_RRC_Setup_Success_Rate_Per
cent
ERAB Establish Success
Rate (%)
tsum_hour_Region.Huawei_4G_ERAB_Establish_Success_Rat
e_Percent
Accessibility 5G Availability (%) tsum_hour_Region.Huawei_5G_Cell_Availability_Percent Batch Analytics nr-huawei-nutran-
v100r015c10
RRC Establish Success Rate
(%)
tsum_hour_Region.Huawei_5G_RRC_Setup_Success_Rate_Per
cent
Call Setup Success Rate (%) tsum_hour_Region.Huawei_5G_Call_Setup_Success_Rate_Pe
rcent
Retainability 3G Call Drop Rate (%) tsum_hour_Region.Huawei_3G_Call_Drop_Rate_PS_Percent Batch Analytics umts-huawei-utran-
v100r015c10spc156
InterRAT HO Success Rate
(%)
tsum_hour_Region.Huawei_3G_InterRAT_Handover_Success_
Rate_PS_Percent
HSPA Drop Rate (%) tsum_hour_Region.Huawei_3G_HSPA_Drop_Rate_Percent
Retainability 4G ERAB Abnormal Release
Rate (%)
tsum_hour_Region.Huawei_4G_ERAB_Drop_Rate_Percent Batch Analytics lte-huawei-eutran-
v100r015c10
Mobility Success Rate (%) tsum_hour_Region.Huawei_4G_Mobility_Success_Rate_Perc
ent
Retainability 5G InterRAT Incoming HO
Success Rate (%)
tsum_hour_Region.Huawei_5G_IntraRAT_Incoming_Handover
_Success_Rate_Percent Batch Analytics nr-huawei-nutran-
v100r015c10
InterRAT Outgoing HO
Success Rate (%)
tsum_hour_Region.Huawei_5G_InterRAT_Outgoing_Handover
_Success_Rate_Percent
Usage Uplink 4G (%) tsum_hour_Region.Huawei_4G_Uplink_Traffic_Volume
_GB (Bar plot)
tsum_hour_Region.Huawei_4G_Uplink_Throughput_MBp
s (Line plot)
Batch Analytics lte-huawei-eutran-
v100r015c10
Downlink 4G (%) tsum_hour_Region.Huawei_4G_Downlink_Traffic_Volu
me_GB (Bar plot)
tsum_hour_Region.Huawei_4G_Downlink_Throughput_M
Bps (Line plot)
Uplink 5G (%) tsum_hour_Region.Huawei_5G_Uplink_Traffic_Volume
_GB (Bar plot)
tsum_hour_Region.Huawei_5G_Uplink_Throughput_Gbp
s (Line plot)
Batch Analytics nr-huawei-nutran-
v100r015c10
Downlink 5G (%) tsum_hour_Region.Huawei_5G_Downlink_Traffic_Volu
me_GB (Bar plot)
tsum_hour_Region.Huawei_5G_Downlink_Throughput_G
bps (Line plot)
608 IBM Telco Network Cloud Manager - Performance 1.4.5

Data flow to Mobile Packet switch access 2G drill-down dashboard and its widgets.
Widget name Metrics Type of data Technology Pack
2G TCH Availability (%) ssum_Region.2G.TCH.Availability.Percent Batch Analytics gsmgprs-huawei-bss-v900r021c10spc600
2G TBF DL Success Rate (%) ssum_Region.2G.Downlink.TBF.Success.Rate.Percent
2G PDCH Congestion Rate (%) ssum_Region.2G.PDCH.Congestion.Rate.Percent
Data flow to Mobile Packet switch access 3G drill-down dashboard and its widgets.
Widget name Metrics Type of data Technology Pack
3G Availability (%) ssum_Region.3G.Cell.Availability.Percent Batch Analytics umts-huawei-utran-
v100r015c10spc156
3G RRC Establish Success Rate
(%)
ssum_Region.3G.RRC.Setup.Success.Rate.Percent
3G RAB Establish Success Rate
(%)
ssum_Region.3G.RAB.Establish.Success.Rate.Percent
3G Call Drop Rate (%) ssum_Region.3G.Call.Drop.Rate.Percent
3G InterRAT HO Success Rate (%) ssum_Region.3G.InterRAT.Handover.Success.Rate.Perce
nt
3G HSPA Drop Rate (%) ssum_Region.3G.HSPA.Drop.Rate.Percent
Data flow to Mobile Packet switch access 4G drill-down dashboard and its widgets.
Widget name Metrics Type of data Technology Pack
4G Availability (%) ssum_Region.4G.Cell.Availability.Percent Batch Analytics lte-huawei-eutran-v100r015c10
4G RRC Establish Success Rate (%) ssum_Region.4G.RRC.Setup.Success.Rate.Percent
4G ERAB Establish Success Rate (%) ssum_Region.4G.ERAB.Establish.Success.Rate.Percent
4G ERAB Abnormal Release Rate (%) ssum_Region.4G.ERAB.Drop.Rate.Percent
4G Mobility Success Rate (%) ssum_Region.4G.Mobility.Success.Rate.Percent
Data flow to Mobile Packet switch access 5G drill-down dashboard and its widgets.
Widget name Metrics Type of data Technology Pack
5G Availability (%) ssum_Region.5G.Cell.Availability.Percent Batch Analytics nr-huawei-nutran-
v100r015c10
5G RRC Establish Success Rate (%) ssum_Region.5G.RRC.Setup.Success.Rate.Percent
5G Call Setup Success Rate (%) ssum_Region.5G.Call.Setup.Success.Rate.Percent
5G IntraRAT Incoming HO Success
Rate (%)
ssum_Region.5G.IntraRAT.Incoming.Handover.Success.Rate.P
ercent
5G InterRAT Outgoing HO Success Rate
(%)
ssum_Region.5G.InterRAT.Outgoing.Handover.Success.Rate.P
ercent
Data flow to Mobile Circuit switch access 2G, 3G, 4G, and 5G drill-down dashboard and its
widgets
Dashboard name Widget name Metrics Type of data
PS Access - 2G cell: Latest
Hourly Data
Worst 10 cells by 2G TCH Availability (%) tsum_hour_cell.Huawei_2G_TCH_Availability_Percent Batch Analytics
PS Access - 2G cell: Latest
Hourly Data
Worst 10 cells by 2G TBF DL Success Rate
(%)
tsum_hour_cell.Huawei_2G_Downlink_TBF_Success_Rate_P
ercent Batch Analytics
PS Access - 2G cell: Latest
Hourly Data
Worst 10 cells by 2G PDCH Congestion Rate
(%)
tsum_hour_cell.Huawei_2G_PDCH_Congestion_Rate_Percen
tBatch Analytics
PS Access - 3G utranCell:
Latest Hourly Data
Worst 10 utranCells by 3G Availability (%) tsum_hour_utranCell.Huawei_3G_Cell_Availability_Perc
ent Batch Analytics
PS Access - 3G utranCell:
Latest Hourly Data
Worst 10 utranCells by 3G RRC Establish
Success Rate (%)
tsum_hour_utranCell.Huawei_3G_RRC_Setup_Success_Rate
_Percent Batch Analytics
PS Access - 3G utranCell:
Latest Hourly Data
Worst 10 utranCells by 3G RAB Establish
Success Rate (%)
tsum_hour_utranCell.Huawei_3G_RAB_Establish_Success_
Rate_PS_Percent Batch Analytics
PS Access - 3G utranCell:
Latest Hourly Data
Worst 10 utranCells by 3G Call Drop Rate (%) tsum_hour_utranCell.Huawei_3G_Call_Drop_Rate_PS_Perc
ent Batch Analytics
PS Access - 3G utranCell Worst 10 utranCells by 3G InterRAT HO
Success Rate (%)
tsum_hour_utranCell.Huawei_3G_InterRAT_Handover_Succ
ess_Rate_PS_Percent Batch Analytics
PS Access - 3G utranCell:
Latest Hourly Data
Worst 10 utranCells by 3G HSPA Drop Rate
(%)
tsum_hour_utranCell.Huawei_3G_HSPA_Drop_Rate_Percent Batch Analytics
PS Access - 4G eUtranCell:
Latest Hourly Data
Worst 10 eUtranCells by 4G Availability (%) tsum_hour_eUtranCell.Huawei_4G_Cell_Availability_Per
cent Batch Analytics
PS Access - 4G eUtranCell:
Latest Hourly Data
Worst 10 eUtranCells by 4G RRC Establish
Success Rate (%)
tsum_hour_eUtranCell.Huawei_4G_RRC_Setup_Success_Rat
e_Percent Batch Analytics
PS Access - 4G eUtranCell:
Latest Hourly Data
Worst 10 eUtranCells by 4G ERAB Establish
Success Rate (%)
tsum_hour_eUtranCell.Huawei_4G_ERAB_Establish_Succes
s_Rate_Percent Batch Analytics
PS Access - 4G eUtranCell:
Latest Hourly Data
Worst 10 eUtranCells by 4G ERAB Abnormal
Release Rate (%)
tsum_hour_eUtranCell.Huawei_4G_ERAB_Drop_Rate_Percen
tBatch Analytics
IBM Telco Network Cloud Manager - Performance 1.4.5 609

Dashboard name Widget name Metrics Type of data
PS Access - 4G eUtranCell:
Latest Hourly Data
Worst 10 eUtranCells by 4G Mobility Success
Rate (%)
tsum_hour_eUtranCell.Huawei_4G_Mobility_Success_Rate
_Percent Batch Analytics
PS Access - 5G nUtranCell:
Latest Hourly Data
Worst 10 nUtranCells by 5G Availability (%) tsum_hour_nUtranCell.Huawei_5G_Cell_Availability_Per
cent Batch Analytics
PS Access - 5G nUtranCell:
Latest Hourly Data
Worst 10 nUtranCells by 5G RRC Establish
Success Rate (%)
tsum_hour_nUtranCell.Huawei_5G_RRC_Setup_Success_Rat
e_Percent Batch Analytics
PS Access - 5G nUtranCell:
Latest Hourly Data
Worst 10 nUtranCells by 5G Call Setup
Success Rate (%)
tsum_hour_nUtranCell.Huawei_5G_Call_Setup_Success_Ra
te_Percent Batch Analytics
PS Access - 5G nUtranCell:
Latest Hourly Data
Worst 10 nUtranCells by 5G IntraRAT
Incoming HO Success Rate (%)
tsum_hour_nUtranCell.Huawei_5G_IntraRAT_Incoming_Han
dover_Success_Rate_Percent Batch Analytics
PS Access - 5G nUtranCell:
Latest Hourly Data
Worst 10 nUtranCells by 5G InterRAT
Outgoing HO Success Rate (%)
tsum_hour_nUtranCell.Huawei_5G_InterRAT_Outgoing_Han
dover_Success_Rate_Percent Batch Analytics
Related information
Packet switch access dashboards
Properties of the WiFi overview dashboard
This information provides the properties of the WiFi overview and its associated widgets.
The data on WiFi overview dashboards is populated from the following technology packs.
Dependent technology packs:
network-health
SNMP technology packs:
wifi-health-cisco
Data flow to WiFi overview dashboard and its widgets
Widget Name Metrics Type of data Technology Pack
Total APs Controller.APs.Connected.Count Entity metric wifi-health-
cisco
Total SSIDs Controller.Ssid.Count Entity metric wifi-health-
cisco
2.4GHz Clients Controller.2.4G.Total.Client.Count Entity metric wifi-health-
cisco
5GHz Clients Controller.5G.Total.Client.Count Entity metric wifi-health-
cisco
Clients by RSSI Quality Controller.Client.Count.RSSI.Good Entity metric wifi-health-
cisco
Controller.Client.Count.RSSI.Average Entity metric wifi-health-
cisco
Controller.Client.Count.RSSI.Poor Entity metric wifi-health-
cisco
Clients by SNR Quality Controller.Client.Count.SNR.Good Entity metric wifi-health-
cisco
Controller.Client.Count.SNR.Average Entity metric wifi-health-
cisco
Controller.Client.Count.SNR.Poor Entity metric wifi-health-
cisco
WiFi Network Details wlanSsid Entity metric wifi-health-
cisco
wlanAdminStatus Entity metric
wlanQos [0:bronze, 1:silver, 2:gold,
3:platinum] Entity metric
Ssid.Client.Count Entity metric
Access Point Details apName Entity metric wifi-health-
cisco
apLocation Entity metric
apIpAddress Entity metric
apAdminStatus Entity metric
AP.Total.Associated.Client.Count Entity metric
2.4GHz: Worst 10 Performing Radio by Channel Utilization
(%)
Radio.Slot.Channel.Utilization.2.4G.Percent Entity metric wifi-health-
cisco
5GHz: Worst 10 Performing Radio by Channel Utilization (%) Radio.Slot.Channel.Utilization.5G.Percent Entity metric wifi-health-
cisco
Worst 10 Performing Channels by Interference Channel.Interference.Utilization.Percent Entity metric wifi-health-
cisco
Properties of the WiFi client count dashboard
This information provides the properties of the WiFi client count and its associated widgets.
Properties of WiFi interference and noise performance dashboard
This information provides the properties of the WiFi interference and noise performance and its associated widgets.
610 IBM Telco Network Cloud Manager - Performance 1.4.5

Properties of the WiFi client count dashboard
This information provides the properties of the WiFi client count and its associated widgets.
Data flow to WiFi client count dashboard and its widgets
Widget Name Metrics Type of data Technology Pack
2.4GHz:Client Count Trend Controller.2.4G.Total.Client.Count Entity metric wifi-health-cisco
5GHz:Client Count Trend Controller.5G.Total.Client.Count Entity metric wifi-health-cisco
Client Count by RSSI Quality Trend Controller.Client.Count.RSSI.Good Entity metric wifi-health-cisco
Controller.Client.Count.RSSI.Average Entity metric wifi-health-cisco
Controller.Client.Count.RSSI.Poor Entity metric wifi-health-cisco
Client Count by SNR Quality Trend Controller.Client.Count.SNR.Good Entity metric wifi-health-cisco
Controller.Client.Count.SNR.Average Entity metric wifi-health-cisco
Controller.Client.Count.SNR.Poor Entity metric wifi-health-cisco
Properties of WiFi interference and noise performance dashboard
This information provides the properties of the WiFi interference and noise performance and its associated widgets.
Data flow to WiFi interference and noise performance dashboard and its widgets
Widget Name Metrics Type of data Technology Pack
Interference Score (%) Trend Channel.Interference.Utilization.Percent Entity metric wifi-health-cisco
Interference Power (dBm) Trend Channel.Interference.Power.dBm Entity metric wifi-health-cisco
Noise (dBm) Trend Channel.Noise.Power.dBm Entity metric wifi-health-cisco
Properties of the NetFlow dashboards
This information provides the properties of all the NetFlow dashboards.
The data on NetFlow dashboards is populated from the following technology packs.
Dependent technology packs:
network-health
network-health-extension
network-health-generic
Flow technology pack:
network-flow
Data flow to the NetFlow dashboards and widgets
NetFlow dashboards Flow metrics are stored in Telco Network Cloud Manager - Performance database. The raw metrics from Flow records are aggregated and stored
FLOW_METRIC schema tables.
The following table shows the data properties of the Top Talker views in the NetFlow dashboards.
Table 1. NetFlow Dashboards
Aggregation name Grouping keys
Top Applications with ToS IF_ID + APP_NAME+SRC_TOS
Top Applications IF_ID + APP_NAME
Top Destination Autonomous Systems IF_ID+BGP_DST_AS_NUM
Top Source Autonomous Systems IF_ID+BGP_SRC_AS_NUM
Top Autonomous System Conversations IF_ID+BGP_SRC_AS_NUM+BGP_DST_AS_NUM
Top Conversations with Application IF_ID+SRC_IP+DST_IP+APP_NAME
Top Conversations with ToS IF_ID+SRC_IP+DST_IP+SRC_TOS
Top Conversations IF_ID+SRC_IP+DST_IP
Top Destinations with Application IF_ID+DST_IP+APP_NAME
Top Destinations IF_ID+DST_IP
Top IP Group Conversations IF_ID +SRC_IP_GROUP+DST_IP_GROUP
Top IP Group Conversations with Application IF_ID +SRC_IP_GROUP+DST_IP_GROUP+APP_NAME
Top Source IP Groups with Protocol IF_ID+SRC_IP_GROUP+PROTOCOL_ID
Top Destination IP Groups with Protocol IF_ID+DST_IP_GROUP+PROTOCOL_ID
Top Source IP Groups with ToS IF_ID+SRC_IP_GROUP+SRC_TOS
Top IP Group Conversations with Protocol IF_ID +SRC_IP_GROUP+DST_IP_GROUP+PROTOCOL_ID
IBM Telco Network Cloud Manager - Performance 1.4.5 611

Aggregation name Grouping keys
Top Destination IP Groups with ToS IF_ID+DST_IP_GROUP+SRC_TOS
Top Source IP Groups with Application IF_ID+SRC_IP_GROUP+APP_NAME
Top IP Group Conversations with ToS IF_ID +SRC_IP_GROUP+DST_IP_GROUP+SRC_TOS
Top Destination IP Groups IF_ID+SRC_IP_GROUP
Top Source IP Groups IF_ID+SRC_IP_GROUP
Top Destination IP Groups with Application IF_ID+DST_IP_GROUP+APP_NAME
Top Protocols with Conversation IF_ID+PROTOCOL_ID+SRC_IP+DST_IP
Top Protocols with Destination IF_ID+PROTOCOL_ID+DST_IP
Top Protocols with Application IF_ID+PROTOCOL_ID+APP_NAME
Top Protocols with Source IF_ID+PROTOCOL_ID+SRC_IP
Top Protocols IF_ID+PROTOCOL_ID
QoS Queue Drops IF_ID+POLICY_QOS_CLASSIFICATION_HIERARCHY+POLICY_QOS_QUEUE_ID
Top Sources IF_ID+SRC_IP
Top Sources with Application IF_ID+SRC_IP+APP_NAME
Top ToS IF_ID+SRC_TOS
Properties of the Network traffic overview dashboard
This information provides the properties of the Network traffic overview and its associated widgets.
Properties of the Applications response overview dashboard
This information provides the properties of the Applications response overview and its associated widgets.
Related information
Managing Flow aggregations
Properties of the Network traffic overview dashboard
This information provides the properties of the Network traffic overview and its associated widgets.
Data flow to Network traffic overview dashboard and its widgets
The following table shows the flow data properties in Network traffic overview dashboard widgets.
Widget name Metrics
Top 10 Inbound Utilization (%) avg(interfaceInUtilization)
Top 10 Outbound Utilization (%) avg(interfaceOutUtilization)
Utilization Deviation avg(interfaceInUtilization)
avg(interfaceOutUtilization)
Utilization interfaceInUtilization
interfaceOutUtilization
Traffic Volume (Octets) sum(interfaceInOctets)
sum(interfaceOutOctets)
Interface Speed (bps) speed
4-Weeks Utilization Trend avg(interfaceOutUtilization)
Utilization Trend interfaceOutUtilization
interfaceInUtilization
The following table shows the flow data properties of the Top Talkers views in the Network traffic overview dashboard.
Widget name Aggregation name Grouping keys
Top 10 Applications by Traffic Volume (Octets) Top Application IF_ID + APP_NAME
Top 10 Protocols by Traffic Volume (Octets) Top Protocols IF_ID+PROTOCOL_ID
Top 10 ToS by Traffic Volume (Octets) Top ToS IF_ID+SRC_TOS
Top 10 Conversations by Traffic Volume (Octets) Top Conversations IF_ID+SRC_IP+DST_IP
Top 10 Sources by Traffic Volume (Octets) Top Sources IF_ID+SRC_IP
Top 10 Destinations by Traffic Volume (Octets) Top Destinations IF_ID+DST_IP
Related information
Managing Flow aggregations
Properties of the Applications response overview dashboard
This information provides the properties of the Applications response overview and its associated widgets.
Data flow to Applications response overview dashboard and its widgets
612 IBM Telco Network Cloud Manager - Performance 1.4.5

The following table shows the flow data properties in Applications response overview dashboard widgets.
Widget name Metrics
Top 10 Applications by Client Network Delay (ms) max(maxClientNwkTime)
Top 10 Applications by Server Network Delay (ms) max(maxServerNwkTime)
Top 10 Applications by Application Delay (ms) max(maxServerRespTime)
Top 10 Applications by Total Delay (ms) max(maxTotalRespTime)
Properties of the Cisco SD-WAN dashboards
This information provides the properties of Cisco SD-WAN dashboards, it's drill-down dashboards and widgets.
The data in the Cisco SD-WAN dashboards is populated from the following technology packs:
cisco-sdwan
Data flow to SD-WAN health overview dashboard and its widgets
Widget name Metric Type of data
Device Details site raw
displayName raw
CPU.Utilization.Percent raw
Memory.Utilization.Percent raw
savg_Network.Inbound.Octets.Bytes Stream Analytics
savg_Network.Outbound.Octets.Bytes Stream Analytics
Top 10 Interface Utilization (%) Network.Outbound.Utilization.Percent raw
Top 10 Tunnels shortDisplayName raw
state raw
tunnel.Jitter.ms raw
Top 10 Applications application.Usage.Bytes raw
Top 10 WAN links Latency(ms) wanLink.Latency.ms raw
Data flow to Application performance dashboard and its widgets
Widget name Metric Type of data
Traffic Volume (Bytes) Trend application.Usage.Bytes raw
FEC Recovery (%) Rate Trend application.FEC.Recovery.Rate.Percent raw
Application performance shortDisplayName raw
application.Usage.Bytes raw
application.Total.Traffic.Percent raw
application.FEC.Recovery.Rate.Percent raw
Data flow to WAN link details dashboard and its widgets
Widget name Metric Type of data
Jitter (ms) Trend wanLink.Jitter.ms raw
Latency (ms) Trend wanLink.Latency.ms raw
Packet Loss (%) Trend wanLink.Loss.Percent raw
WAN Link Details localColor raw
wanLink.Jitter.ms raw
wanLink.Loss.Percent raw
wanLink.Latency.ms raw
Data flow to Device health dashboard and its widgets
Widget name Metric Type of data
Device Model model raw
Reboot sdwanDevice.Reboot.Count raw
Crash sdwanDevice.Crash.Count raw
CPU Utilization (%) max(CPU.Utilization.Percent) raw
last(CPU.Utilization.Percent) raw
Memory Utilization (%) max(Memory.Utilization.Percent) raw
last(Memory.Utilization.Percent) raw
CPU Utilization (%) Trend CPU.Utilization.Percent raw
Memory Utilization (%) Trend Memory.Utilization.Percent raw
Data flow to Tunnel QoE dashboard and its widgets
IBM Telco Network Cloud Manager - Performance 1.4.5 613

Widget Metric Type of data
Widget Metric Type of data
Inbound Volume (Bytes) Trend Network.Inbound.Octets.Bytes raw
Outbound Volume (Bytes) Trend Network.Outbound.Octets.Bytes raw
Jitter (ms) Trend tunnel.Jitter.ms raw
Latency (ms) Trend tunnel.Latency.ms raw
Packet Loss (%) Trend tunnel.Loss.Percent raw
FEC Loss Recovery (%) Trend tunnel.FEC.Loss.Recovery.Percent raw
Tunnel Details shortDisplayName raw
protocol raw
state raw
tunnel.QoE.Score raw
Network.Inbound.Octets.Bytes raw
Network.Outbound.Octets.Bytes raw
tunnel.Jitter.ms raw
tunnel.Latency.ms raw
tunnel.Loss.Percent raw
tunnel.FEC.Loss.Recovery.Percent raw
Data flow to Interface details drill-down dashboard
Widget name Metrics Type of data
Inbound Utilization (%) Trend Network.Inbound.Utilization.Percent raw
Inbound Throughput (kbps) Trend Network.Inbound.Throughput.kbps raw
Inbound Discards Count Trend Network.Inbound.Discards.Count raw
Inbound Errors Count Trend Network.Inbound.Errors.Count raw
Inbound Volume (Bytes) Trend Network.Inbound.Octets.Bytes raw
Inbound Packets Trend Network.Inbound.Packets.Count& raw
Outbound Utilization (%) Trend Network.Outbound.Utilization.Percent raw
Outbound Throughput (kbps) Trend Network.Outbound.Throughput.kbps raw
Outbound Discards Count Trend Network.Outbound.Discards.Count raw
Outbound Errors Count Trend Network.Outbound.Errors.Count raw
Outbound Volume (Bytes) Trend Network.Outbound.Octets.Bytes raw
Outbound Packets Trend Network.Outbound.Packets.Count& raw
Interface Traffic Details shortDisplayName raw
ifIndex raw
ifAdminStatus raw
ifOperStatus raw
physicalAddress raw
ipv4Address raw
ipv6Address raw
ifSpeed raw
Network.Inbound.Utilization.Percent raw
Network.Outbound.Utilization.Percent raw
Network.Inbound.Throughput.kbps raw
Network.Outbound.Throughput.kbps raw
Network.Inbound.Discards.Count raw
Network.Outbound.Discards.Count raw
Network.Inbound.Errors.Count raw
Network.Outbound.Errors.Count raw
Network.Inbound.Octets.Bytes raw
Network.Outbound.Octets.Bytes raw
Network.Inbound.Packets.Count raw
Network.Outbound.Packets.Count raw
lastUpdate raw
Data flow to Application per tunnel details drill-down dashboard
Widget name Metrics Type of data
Traffic Volume (Bytes) Trend applicationPerTunnel.Usage.Bytes raw
Traffic Volume (Packets) Trend applicationPerTunnel.Usage.Packets raw
Application Details shortDisplayName raw
applicationPerTunnel.Usage.Bytes raw
applicationPerTunnel.Usage.Packets raw
applicationPerTunnel.Total.Traffic.Percent raw
Formula language developer's reference
614 IBM Telco Network Cloud Manager - Performance 1.4.5

Use this information to understand how to write your own Technology Pack content that includes discovery formulas, collection formulas, and metrics. This formula
language can be used by application engineers who need to create the custom content for new devices in their network.
You can create content for both SNMP-based Technology Packs and File-based Technology Packs.
Note: This information assumes that you are familiar with the architecture of Telco Network Cloud Manager - Performance and its Technology Paks.
Language basics
Specific formula language that is supported in Telco Network Cloud Manager - Performance.
SNMP formula language
Detailed information about the SNMP formula language that can be used to create custom collection formulas, discovery formulas, and metrics.
File-based formula language
Detailed information about the File-based Technology Pack formula language that can be used to create custom collection formulas, discovery formulas, model
files, and metrics.
Language basics
Specific formula language that is supported in Telco Network Cloud Manager - Performance.
Formula structure is different for SNMP-based and File-based Technology Packs. But metric structure is more or less the same in both.
Formulas
A formula is a calculation that is performed against an SNMP data. It is written in a proprietary language. You can use a formula to customize the information collected by
Telco Network Cloud Manager - Performance.
Two types of formulas:
Discovery formulas
Discovery formulas are used against managed nodes or hosts and their resources. These formulas are designed to return a list of resources from a device. You can
write a new discovery formula to include a device that does not have an in-built support in Telco Network Cloud Manager - Performance.
Collection formulas
It is a collection of OID functions, and standard mathematical operations that are applied to a resource type to perform a computation.
Collection formulas are used to collect metrics about the status of the devices in your network during polling. These formulas are applied against a resource or
managed item in the host to produce a result (numeric). The result is saved in the time series database. A resource type can be a physical or logical object such as
port, interface, virtual circuit, or DLCI.
Telco Network Cloud Manager - Performance has many predefined collection formulas in Technology Packs that are available in the media. However, you can write
additional formulas for a customized collection process.
Metrics
Collected data values. From the database perspective, a metric is a single data value that can be identified by a resource. From the reporting perspective, a metric is a data
value that is shown in a report. It is a set of database metrics, pre-aggregated over time by using a statistical function like average or maximum. A report metric can be
aggregated across a set of resources and their types.
MIB files
Management Information Base (MIB) is a collection of information that is organized hierarchically. MIBs provide definitions for the properties of a managed object within a
device.
SNMP formula language
Detailed information about the SNMP formula language that can be used to create custom collection formulas, discovery formulas, and metrics.
All the custom content can be validated, bundled, and installed in the system along with Telco Network Cloud Manager - Performance according to your requirements.
Network device discovery
Network discovery is a process that helps to map and monitor your network infrastructure. All the network devices can connect and communicate with each other.
Writing custom collection formulas
A collection formula is applied against a resource to produce a result that is always a number. The result is then saved to the timeseries database. The collection
formulas are executed regularly based on the polling interval and applied on a larger scale than discovery formulas. These collection formulas must be as simple as
possible.
Writing custom metrics
A metric is a single collected data value that is identified by its generic name, timestamp, and value. From the reporting perspective, a metric is a data value that is
shown in a report. Metric files contain metadata such as metric name, description, and alias. For every collection formula, a corresponding metric file must be
created.
Related information
Rapid SNMP device onboarding
IBM Telco Network Cloud Manager - Performance 1.4.5 615

Network device discovery
Network discovery is a process that helps to map and monitor your network infrastructure. All the network devices can connect and communicate with each other.
The virtual and mobile networks are changing dynamically. It is essential to have an automatic discovery for continuous device onboarding. It helps to monitor the network
state to identify bottlenecks and failures, and to ensure optimum network efficiency.
The discovery methods that function at layer 3, discover the devices, resources, and their properties in the network. Typically, three methods of discovery are available in
Telco Network Cloud Manager - Performance.
SNMP discovery
Discovery that is performed on the SNMP-based devices.
File-based discovery
Discovery that is performed on the file-based devices.
Writing custom discovery formulas
Discovery formulas are used against devices and their resources during discovery and are designed to return a list of resources from a device.
Writing custom discovery formulas
Discovery formulas are used against devices and their resources during discovery and are designed to return a list of resources from a device.
Discovery process
The discovery process consists of several steps.
Telco Network Cloud Manager - Performance discovers the resources in the network and returns the following information:
Devices
SNMP credentials for the devices
Telco Network Cloud Manager - Performance runs discovery to get a list of resource types from the discovered devices based on the applicable discovery formulas.
If a new device is added to the network, the ad hoc discovery is run. Resources are discovered on the device and updated in the database.
Note: Telco Network Cloud Manager - Performance comes with predefined vendor-specific discovery formulas and their required MIB files. All the discovery files and their
MIB files are available in /opt/IBM/npi/npi-itnm-collector/discovery/content directory.
You can use the Technology Pack Development Tool to create, validate, package your own discovery formulas.
Discovery formula structure
All the discovery formula files must have the file extension as .discovery.
Creating discovery formulas
Use this information to write or model your own discovery formulas. Typically, these discovery formulas are written based on the MIB table structure from a single
table or with the help of joins to combine more than one table.
Discovery formula structure
All the discovery formula files must have the file extension as .discovery.
when clause
Specifies the resource types that are appropriate for executing a specific discovery formula. The components of when clause are as follows:
resource.type
resource.type = 'device'
Resource type device is discovered by Telco Network Cloud Manager - Performance.
Note: The value for resource.type must be in single quotation marks.
resource.sysobjectid
You can narrow the discovery to a specific vendor type by specifying the sysobjectid. The sysobjectid represents the type of device and can also indicate the
model number in a dotted decimal format. For example:
Table 1. Vendor and model identification
numbers
Vendor OID
Cisco 1.3.6.1.4.1.9
Huawei 1.3.6.1.4.1.2011
Juniper 1.3.6.1.4.1.2636
Juniper Networks/Unisphere 1.3.6.1.4.1.4874
For more information about the vendor and model identification numbers, see IANA-registered Private Enterprise Numbers.
All the discovery files that have the same sysobjectid as that is returned from system-objectid.discovery are run to obtain the resources from those devices.
name.<IP_address>
It is the IP address of an interface or device.
616 IBM Telco Network Cloud Manager - Performance 1.4.5

Example
when resource.type = 'device' and resource.sysobjectid like '1.3.6.1.4.1.9'
Note: The value for sysobjectid must be in single quotation marks.
select statement
In Telco Network Cloud Manager - Performance discovery, MIB tables are represented as relational database tables. Hence you can write the discovery definitions in SQL.
Selects data from a table or multiple tables. An SQL statement that retrieves resource properties from the tables that are available in the associated vendor-specific MIB
file. The select statement has the following components:
property names
A list of property names and their aliases.
from table expression
Selects data from a table or multiple tables. In this case, it is <MIB _file_name.MIB_table_name>. For example:
when resource.type = 'device' and resource.sysobjectid like '1.3.6.1.4.1.9'
select index, ciscomemorypooltype as memoryPoolType, ciscomemorypoolname
as memoryPoolName, ciscomemorypoolvalid as memoryPoolValid from
CiscoMemoryPoolMib.ciscoMemoryPoolTable where ciscomemorypoolvalid = 1
set type = 'memory'
set vendor = 'Cisco'
set name = context.host + '_MemoryPool<' + resource.index + '>'
CiscoMemoryPoolMib is the code representation of the MIB file CISCO-MEMORY-POOL-MIB.
You can get these details by running the bin/snmp-mib-tool pack-demo list command from the Technology Pack Development Tool installation
directory.
ciscoMemoryPoolTable is MIB table from CISCO-MEMORY-POOL-MIB file.
You can get these details by running the bin/snmp-mib-tool pack-demo show CISCO-MEMORY-POOL-MIB command from the Technology Pack
Development Tool installation directory.
join table expression
Joins tables to combine rows from two or more tables, based on a related column between them. The different types of joins in SQL are as follows:
inner join
Returns records that have matching values in both tables.
left join
Returns all records from the left table, and the matched records from the right table. It is also known as outer join.
right join
Returns all records from the right table, and the matched records from the left table. It is also known as outer join.
full join
Returns all records when there is a match in either left or right table.
Note:
The index column is a special column that discovery adds automatically to the MIB tables. It contains the MIB index details.
If the select statement contains joins with multiple tables and the column name is not unique for a table, then you must add the MIB table name to qualify
the column name. For example, ciscoMemoryPoolTable.index.
There is no support for scalar MIBs.
where condition
The where condition is used to extract only those records that fulfill a specified condition.
Operators
You can use all the SQL supported operators in the select statements. Typically, the following operators are used in the predefined discovery formulas.
like
The like operator is used in a where clause to search for a specified pattern in a column.
IN
The IN operator allows you to specify multiple values in a where clause.
ON
ON represents one or more JOIN conditions by which to match the records from one table to another.
Example
select hwEntityStateTable.index, hwEntityAdminStatus, hwEntityOperStatus,
hwEntityStandbyStatus, hwEntityTemperature, entPhysicalTable.index, entPhysicalIndex,
entPhysicalDescr, entPhysicalVendorType, entPhysicalName, entPhysicalClass from
HuaweiEntityExtentMib.hwEntityStateTable left join EntityMib.entPhysicalTable on
hwEntityStateTable.index = entPhysicalTable.index where entPhysicalClass = 6
Note: You can use complex nested select statements to create your discovery formulas by using the Technology Pack Development Tool.
set definitions
Discovery formulas provide an additional way to add resource properties. The set definition can contain a literal string, or combination of discovered properties, or special
placeholder called context. For example:
set type = '<resource_type>'
IBM Telco Network Cloud Manager - Performance 1.4.5 617

set vendor = '<vendor>'
set id = context.host + '_<resource_name>:<' + resource.index + '>'
The expressions in the set definitions are as follows:
context
context is the special place holder that is used in the discovery formulas. It contains the following two components:
host
The context.host string returns the host name of the device. In this case, it is the IP address of the device.
port
The context.port string returns the SNMP port number of the device.
The expression, set id = context.host + '_Huawei_PowerSupply:<' + resource.index +
'>' results in the name as:
10.55.239.56_Huawei_PowerSupply:<1835017>
Example
set type = 'card'
set vendor = 'Huawei'
set id = context.host + '_Huawei_PowerSupply:<' + resource.index + '>'
unset definitions
Unset removes or deletes the specified set values.
Example
unset jnxfilleddescr
unset jnxoperatingcontentsindex
unset jnxoperatingl1index
unset jnxoperatingl2index
unset jnxoperatingl3index
Note: The set and unset definitions support JavaScript expressions.
Required properties
type
Resource type to which the resource that is discovered belongs to. The resource types can be configured from Resource Types page in System Configuration on
Dashboard Application Services Hub portal.
In Cisco devices, it can be memory, temperature, fan, cpu, and others.
vendor
Vendor device to which the discovery formula is applicable.
id
The resource on the device for which the discovery is to be done.
index
Index number of the resource.
Stitch definitions
Create a discovery file with stitch definitions. The format of the syntax is as follows:
RELATE <source_resource_type> TO <target_resource_type> AS <relation_type> WHEN <filtering and joining conditions>
Note:
You can specify multiple releate conditions.
The when clause meant for two purposes; condition for joining source and target resources and filtering unrelated relate rules for a device's resources.
The definition file must not be shared with the discovery definitions above.
For example:
Relate interface To channel AS contain when source.AP_Name == target.AP_Name && source.ap_slot_Id == target.ap_slot_Id &&
source.vendor == 'Cisco'
SNMP bulk get
Packs such as Huawei NQA requires to get stats values from tables that have dynamic or running indexes. It is not possible to obtain these indexes during discovery.
During discovery, the index property must have static indexes only and for dynamic indexes, it must be replaced with *. For example:
when resource.type = 'device' and resource.sysobjectid like '1.3.6.1.4.1.2011'
select * from NqaMib.nqaAdminCtrlTable
set vendor='Huawei'
set type='probe'
set id='HuaweiNQA<'+resource.index+'>'
set index=resource.index+'.*'
618 IBM Telco Network Cloud Manager - Performance 1.4.5

Note: set
index = resource.index + '.*' appends '*' to the end of index property.
Examples
Some vendor-specific discovery formula examples:
Cisco
cisco-powersupply.discovery
when resource.type = 'device' and resource.sysobjectid like '1.3.6.1.4.1.9'
select index, ciscoenvmonsupplystatusdescr as envPowerSupplyStatusDescription,
ciscoenvmonsupplystate as envPowerSupplyState, ciscoenvmonsupplysource as
envPowerSupplySource from CiscoEnvmonMib.ciscoEnvMonSupplyStatusTable
where ciscoenvmonsupplystate!=5
set type = 'environment'
set vendor = 'Cisco'
set id = context.host + '_PowerSupply:<' + resource.index + '>'
Juniper
juniper-chassis.discovery
when resource.type = 'device' and resource.sysobjectid like '1.3.6.1.4.1.2636'
SELECT jnxContentsTable.index, jnxOperatingContentsIndex, jnxOperatingL1Index,
jnxOperatingL2Index, jnxOperatingL3Index, jnxOperatingDescr as
jnxOperatingDescription, jnxContainersIndex, jnxContainersView,
jnxContainersLevel, jnxContainersDescr as jnxContainersDescription,
jnxFilledState, jnxFilledDescr as jnxFilledDescription, jnxFilledContainerIndex,
jnxContentsContainerIndex, jnxContentsSerialNo, jnxContentsRevision, jnxContentsPartNo
FROM JuniperMib.jnxContentsTable
INNER JOIN JuniperMib.jnxContainersTable ON jnxContentsTable.jnxContentsContainerIndex
= jnxContainersTable.jnxContainersIndex
INNER JOIN JuniperMib.jnxFilledTable ON jnxContentsTable.index = jnxFilledTable.index
INNER JOIN JuniperMib.jnxOperatingTable ON jnxContentsTable.index =
jnxOperatingTable.index
WHERE jnxOperatingDescr NOT LIKE '%temp sensor%' AND (jnxOperatingDescr LIKE '%SSB%' OR
jnxOperatingDescr LIKE '%SCB%' OR jnxOperatingDescr LIKE '%SFM%' OR jnxOperatingDescr
LIKE '%FEB%' OR jnxOperatingDescr LIKE '%FPC%' OR jnxOperatingDescr LIKE '%PIC%' OR
jnxOperatingDescr LIKE '%midplane%')
AND jnxContainersLevel = 0
set type = 'chassis'
set vendor = 'Juniper'
set id = context.host + '_Chassis:<' + resource.jnxoperatingcontentsindex + '>
<' + resource.jnxoperatingl1index + '><' + resource.jnxoperatingl2index + '>
<' + resource.jnxoperatingl3index + '>'
Juniper ERX
junipererx-module.discovery
when resource.type = "device" and resource.sysobjectid like "1.3.6.1.4.1.4874"
select 'module' as type,juniSystemSlotTable.index,junisystemslotstatus,
junisystemslottype, juniSystemModuleTable.index,junisystemmoduleoperstatus
as ModuleOperStatus, junisystemmodulecurrenttype as ModuleType from
JuniperSystemMib.juniSystemSlotTable
LEFT JOIN JuniperSystemMib.juniSystemModuleTable ON
JuniperSystemMib.juniSystemSlotTable.index =
JuniperSystemMib.juniSystemModuleTable.index where junisystemslotstatus =4
and junisystemslottype IN(1,2,16,17,18) and junisystemmodulecurrenttype IS NOT NULL
set vendor = "Juniper"
set CLASSNAME = "JuniperERX"
set id = context.host + "_JuniperERXModule:<" + resource.index + ">"
Huawei
huawei-powersupply.discovery
when resource.type = 'device' and resource.sysobjectid like '1.3.6.1.4.1.2011'
select hwEntityStateTable.index, hwEntityAdminStatus, hwEntityOperStatus,
hwEntityStandbyStatus, hwEntityTemperature, entPhysicalTable.index, entPhysicalIndex,
entPhysicalDescr, entPhysicalVendorType, entPhysicalName, entPhysicalClass from
HuaweiEntityExtentMib.hwEntityStateTable LEFT JOIN EntityMib.entPhysicalTable ON
hwEntityStateTable.index = entPhysicalTable.index where entPhysicalClass = 6
set type = 'card'
set vendor = 'Huawei'
set id = context.host + '_Huawei_PowerSupply:<' + resource.index + '>'
Related information
H2 SQL Grammar
Creating discovery formulas
IBM Telco Network Cloud Manager - Performance 1.4.5 619

Use this information to write or model your own discovery formulas. Typically, these discovery formulas are written based on the MIB table structure from a single table or
with the help of joins to combine more than one table.
The different options that available for creating your discovery formulas is displayed in the following image.
Single table discovery formulas
Follow this example to create a discovery formula from a single table ciscoEnvMonSupplyStatusTable table, which is defined in CISCO-ENVMON-MIB file:
Index ciscoEnvMonSupplyStatusIndex ciscoEnvMonSupplyStatusDescr ciscoEnvMonSupplyState ciscoEnvMonSupplySource
1 1 MainPowerSupply 1 2
2 2 RedundantPowerSupply 5 5
3 3 PowerSupply 2 2
From the table, create the following SQL statement for the second and third columns:
SELECT ciscoEnvMonSupplyState, ciscoEnvMonSupplyStatusDescr FROM CiscoEnvmonMib.CiscoEnvMonSupplyStatusEntry
Note: The table, CiscoEnvMonSupplyStatusEntry might not be unique in all MIB modules. Specify the MIB file name (CISCO-ENVMON-MIB) and table name
(CiscoEnvMonSupplyStatusEntry) with dot notation. Also, you cannot use hyphens in identifier in SQL statements, you must use the MIB file name as CiscoEnvmonMib.
With the specified select statement, the following resources can be obtained:
Resource type 1 (ciscoEnvMonSupplyState=1, ciscoEnvMonSupplyStatusDescr=MainPowerSupply)
Resource type 2 (ciscoEnvMonSupplyState=5, ciscoEnvMonSupplyStatusDescr=RedundantPowerSupply)
Resource type 3 (ciscoEnvMonSupplyState=2, ciscoEnvMonSupplyStatusDescr=PowerSupply)
Note: If you want to rename the resource type to something more meaningful, update the select statement as follows:
SELECT envPowerSupplyState AS envStatus, ciscoEnvMonSupplyStatusDescr AS entityDescr FROM
CiscoEnvmonMib.CiscoEnvMonSupplyStatusEntry
With the specified select statement, the following resources can be obtained:
Resource type 1 (envStatus=1, entityDescr=MainPowerSupply)
Resource type 2 (envStatus=5, entityDescr=RedundantPowerSupply)
Resource type 3 (envStatus=2, entityDescr=PowerSupply)
If you want to index and to use the ciscoEnvMonSupplyStatusIndex, update the select statement as follows:
SELECT index, ciscoEnvMonSupplyState AS envStatus, ciscoEnvMonSupplyStatusDescr AS entityDescr FROM
CiscoEnvmonMib.CiscoEnvMonSupplyStatusEntry
With the specified select statement, the following resource types can be obtained with index:
Resource type 1 (index=1, envStatus=1, entityDescr=MainPowerSupply)
Resource type 2 (index=2, envStatus=5, entityDescr=RedundantPowerSupply)
Resource type 3 (index=3, envStatus=2, entityDescr=PowerSupply)
In Telco Network Cloud Manager - Performance, each resource type must have two main properties to uniquely identify them, which are id and type.
Update the select statement to add properties as follows:
620 IBM Telco Network Cloud Manager - Performance 1.4.5

SELECT index as id, index, type as 'powerSupply', ciscoEnvMonSupplyState AS envStatus, ciscoEnvMonSupplyStatusDescr AS
entityDescr FROM CiscoEnvmonMib.CiscoEnvMonSupplyStatusEntry
Note:
With the specified select statement, the following resource types can be obtained with index:
Resource type 1 (id=1, index=1, type=powerSupply, envStatus=1, entityDescr=MainPowerSupply)
Resource type 2 (id=2, index=2, type=powerSupply, envStatus=5, entityDescr=RedundantPowerSupply)
Resource type 3 (id=3, index=3, type=powerSupply, envStatus=2, entityDescr=PowerSupply)
Note: Even though index is not a mandatory property for a resource type in Telco Network Cloud Manager - Performance, index is required for SNMP-related resources.
This property is used by the collection formulas to build up the OID to poll.
Most often, the id property must be more verbose with better clarity. You can use set statements along with the select statements to build the id based on hostname,
type and the index. Update the select statement as follows:
SELECT index, type as 'powerSupply', ciscoEnvMonSupplyState AS envStatus, ciscoEnvMonSupplyStatusDescr AS entityDescr FROM
CiscoEnvmonMib.CiscoEnvMonSupplyStatusEntry
SET id = context.host + '_PowerSupply:<' + resource.index + '>'
context is special place holder for host and the resource object is applicable for every resource type that produced by the SQL expression. Similarly, you can also
create type property with set statement as follows:
SELECT index, ciscoEnvMonSupplyState AS envStatus, ciscoEnvMonSupplyStatusDescr AS entityDescr FROM
CiscoEnvmonMib.CiscoEnvMonSupplyStatusEntry
SET id = context.host + '_PowerSupply:<' + resource.index + '>'
SET type = 'powerSupply'
With the specified select statement, three resource types can be obtained.
Resource type 1 (id=10.1.1.10_PowerSupply:<1>, type=powerSupply, index=1, envStatus=1, entityDescr=MainPowerSupply)
Resource type 2 (id=10.1.1.10_PowerSupply:<2>, type=powerSupply, index=2, envStatus=5, entityDescr=RedundantPowerSupply)
Resource type 3 (id=10.1.1.10_PowerSupply:<3>, type=powerSupply, index=3, envStatus=2, entityDescr=PowerSupply)
Optionally, use the where clause to filter resource types that you do not want. For example, if you do not want ciscoEnvMonSupplyState five resource type, use the
following select statement:
SELECT index, envPowerSupplyState AS envStatus, ciscoEnvMonSupplyStatusDescr AS entityDescr FROM
CiscoEnvmonMib.CiscoEnvMonSupplyStatusEntry WHERE envStatus != 5
SET id = context.host + '_PowerSupply:<' + resource.index + '>'
SET type = 'powerSupply'
With the specified select statement, only two resource types can be obtained.
Resource type 1 (id=10.1.1.10_PowerSupply:<1>, type=powerSupply, index=1, envStatus=1, entityDescr=MainPowerSupply)
Resource type 2 (id=10.1.1.10_PowerSupply:<3>, type=powerSupply, index=3, envStatus=2, entityDescr=PowerSupply)
Discovery formulas by joining two tables
Sometimes discoveries might involve more than a single table to discover resources. Follow this example to create a discovery formula from two tables from HUAWEI-
ENTITY-EXTENT-MIB and ENTITY-MIB.
The hwEntityStateTable in HUAWEI-ENTITY-EXTENT-MIB file.
Index hwEntityAdminStatus hwEntityOperStatus hwEntityStandbyStatus hwEntityTemperature
1 11 2 2 50
2 11 2 2 60
3 11 2 2 40
4 11 3 2 30
5 11 1 2 37
6 11 3 2 30
The entPhysicalTable in ENTITY-MIB
entPhysicalindex entPhysicalDescr entPhysicalVendorType entPhysicalName entPhysicalClass
1 Power Supply 1.3.6.1.4.2011.20021210.11.667652 AR2220 6
2 Board 0 Board Slot 0 5
3 SRU Board 1.3.6.1.4.2011.20021210.12.667652 SRU Board 0 9
4 Fan 1.3.6.1.4.2011.20021210.14.667657 Fan 0/0 7
5 Port 1.3.6.1.4.2011.20021210.11.667654 GigabitEthernet0/0/1 10
6 Fan Card 1.3.6.1.4.2011.20021210.13.0 Fan Card 0/1 7
The discovered resource types from hwEntityStateTable table are further enriched from entPhysicalTable table, so that the final resource types that are discovered contain
objects such as entPhysicalDescr, entPhysicalVendorType. It can be done by cross-referencing both table indexes as shown in the following figure.
IBM Telco Network Cloud Manager - Performance 1.4.5 621

The hwEntityStateTable returns all the resource types such as power supply, fan, board. But you also need to determine the instance type of each source type. So you
need to access the entity physical class from entPhysicalTable to get this information.
You can use the LEFT join expression when you want to return all records from hwEntityStateTable that match records from the entPhysicalTable.
SELECT hwEntityStateTable.index, hwEntityAdminStatus, hwEntityOperStatus,
hwEntityStandbyStatus, hwEntityTemperature, entPhysicalTable.index, entPhysicalIndex,
entPhysicalDescr, entPhysicalVendorType, entPhysicalName, entPhysicalClass
FROM HuaweiEntityExtentMib.hwEntityStateTable LEFT JOIN EntityMib.entPhysicalTable
Note: The index objects are qualified by its table name as both tables contain the column of the same name.
The discovery is still incomplete since the common column to be matched is not defined yet. Use the SQL operator ON that represents one or more JOIN conditions to
match the records from one table to another. Here the common column is the index.
SELECT hwEntityStateTable.index, hwEntityAdminStatus, hwEntityOperStatus, hwEntityStandbyStatus,
hwEntityTemperature, entPhysicalTable.index, entPhysicalIndex, entPhysicalDescr, entPhysicalVendorType, entPhysicalName,
entPhysicalClass FROM HuaweiEntityExtentMib.hwEntityStateTable left join
EntityMib.entPhysicalTable ON hwEntityStateTable.index = entPhysicalTable.index
With the specified select statement, only six resource types can be obtained.
Resource 1 (index = 1, hwEntityAdminStatus=11, hwEntityOperStatus=2,
hwEntityStandbyStatus=2, hwEntityTemperature=50, entPhysicalDescr=Power
Supply, entPhysicalVendorType=1.3.6.1.4.2011.20021210.11.667652,
entPhysicalName=AR2220, entPhysicalClass=6)
Resource 2 (index = 2, hwEntityAdminStatus=11, hwEntityOperStatus=2,
hwEntityStandbyStatus=2, hwEntityTemperature=60,
entPhysicalDescr=Board, entPhysicalVendorType=0,
entPhysicalName=Board Slot 0, entPhysicalClass=5)
Resource 3 (index = 3, hwEntityAdminStatus=11, hwEntityOperStatus=2,
hwEntityStandbyStatus=2, hwEntityTemperature=40, entPhysicalDescr=SRU
Board, entPhysicalVendorType=1.3.6.1.4.2011.20021210.12.667652,
entPhysicalName=SRU Board 0, entPhysicalClass=9)
Resource 4 (index = 4, hwEntityAdminStatus=11, hwEntityOperStatus=3,
hwEntityStandbyStatus=2, hwEntityTemperature=30, entPhysicalDescr=Fan,
entPhysicalVendorType=1.3.6.1.4.2011.20021210.14.667657,
entPhysicalName=Fan 0/0, entPhysicalClass=7)
Resource 5 (index = 5, hwEntityAdminStatus=11, hwEntityOperStatus=1,
hwEntityStandbyStatus=2, hwEntityTemperature=37, entPhysicalDescr=Port,
entPhysicalVendorType=1.3.6.1.4.2011.20021210.11.667654,
entPhysicalName=GigabitEthernet0/0/1, entPhysicalClass=10)
Resource 6 (index = 6, hwEntityAdminStatus=11, hwEntityOperStatus=3,
hwEntityStandbyStatus=2, hwEntityTemperature=30, entPhysicalDescr=Fan
Card, entPhysicalVendorType=1.3.6.1.4.2011.20021210.13.0,
entPhysicalName=Fan Card 0/1, entPhysicalClass=7)
If you want to discover the fan resource type alone, you can filter out in entPhysicalClass 7 'fan' by adding SQL WHERE clause with the following statement.
SELECT hwEntityStateTable.index, hwEntityAdminStatus, hwEntityOperStatus, hwEntityStandbyStatus,
hwEntityTemperature, entPhysicalTable.index, entPhysicalIndex, entPhysicalDescr,
entPhysicalVendorType, entPhysicalName, entPhysicalClass FROM HuaweiEntityExtentMib.hwEntityStateTable
left join EntityMib.entPhysicalTable ON hwEntityStateTable.index = entPhysicalTable.index WHERE entPhysicalClass = 7
With the specified select statement, two resource types can be obtained:
Resource type1 (index = 4, hwEntityAdminStatus=11, hwEntityOperStatus=3,
hwEntityStandbyStatus=2, hwEntityTemperature=30, entPhysicalDescr=Fan,
entPhysicalVendorType=1.3.6.1.4.2011.20021210.14.667657,
entPhysicalName=Fan 0/0, entPhysicalClass=7)
Resource type2 (index = 6, hwEntityAdminStatus=11, hwEntityOperStatus=3,
hwEntityStandbyStatus=2, hwEntityTemperature=30, entPhysicalDescr=Fan
Card, entPhysicalVendorType=1.3.6.1.4.2011.20021210.13.0,
entPhysicalName=Fan Card 0/1, entPhysicalClass=7
To complete the discovery, include the mandatory id, type, and index properties. The index property is defined within SQL select statement itself whereas id and type
properties are defined in SET statement.
622 IBM Telco Network Cloud Manager - Performance 1.4.5

SELECT hwEntityStateTable.index, hwEntityAdminStatus, hwEntityOperStatus,
hwEntityStandbyStatus, hwEntityTemperature, entPhysicalTable.index, entPhysicalIndex,
entPhysicalDescr, entPhysicalVendorType, entPhysicalName, entPhysicalClass FROM
HuaweiEntityExtentMib.hwEntityStateTable left join EntityMib.entPhysicalTable
ON hwEntityStateTable.index = entPhysicalTable.index WHERE entPhysicalClass = 7
SET type = 'fan'
SET id = context.host + '_Huawei_Fan:<' + resource.index + '>'
With the specified select statement, two resource types can be obtained.
Resource type1 (id=10.1.1.11_Huawei_Fan:<4>, type=fan, index = 4,
hwEntityAdminStatus=11, hwEntityOperStatus=3, hwEntityStandbyStatus=2,
hwEntityTemperature=30, entPhysicalDescr=Fan,
entPhysicalVendorType=1.3.6.1.4.2011.20021210.14.667657,
entPhysicalName=Fan 0/0, entPhysicalClass=7)
Resource type2 (id=10.1.1.11_Huawei_Fan:<6>, type=fan, index = 6,
hwEntityAdminStatus=11, hwEntityOperStatus=3, hwEntityStandbyStatus=2,
hwEntityTemperature=30, entPhysicalDescr=Fan Card,
entPhysicalVendorType=1.3.6.1.4.2011.20021210.13.0,
entPhysicalName=Fan Card 0/1, entPhysicalClass=7)
Regular Expression for index property
The regular expression can be used in two scenarios.
Scenario 1: Joining two tables where the index column to be matched is composed from multiple fields
For example, join two tables, bsnAPTable and bsnAPIfChannelInterferenceInfoTable from the AIRESPACE-WIRELESS-MIB file.
Table 1. bsnAPTable contains access points (APs) records and indexed by
a single field bsnAPDot3MacAddress.
Index bsnAPDot3MacAddress bsnAPName bsnApIpAddress
136.117.86.59.62.96 88-75-56-3B-3E-40 AP30f7.0de6 10.211.10.1
136.117.86.59.64.160 88-75-56-3B-20-A0 AP30f7.4f9d 10.211.10.2
136.117.86.59.80.144 88-75-56-3B-20-80 AP30f7.0218 10.211.10.3
136.117.86.59.99.144 88-75-56-3B-63-60 AP30f7.d669 10.211.10.4
Table 2. bsnAPIfChannelInterferenceInfoTable contains channel records and
indexed by several fields. In this case, bsnAPDot3MacAddress, bsnAPIfSlotId,
and bsnAPIfInterferenceChannelNo.
Index bsnAPIfInterferenceChannelNo bsnAPIfInterferencePower
136.117.86.59.62.96.0.1 1 -64
136.117.86.59.62.96.0.2 2 -128
136.117.86.59.62.96.0.3 3 -75
136.117.86.59.62.160.0.1 1 -70
136.117.86.59.62.160.0.2 2 -65
You can join the table by using SQL JOIN and ON operators. The index for bsnAPIfChannelInterferenceInfoTable is enriched with the regex functions to access the
first field only.
SELECT
bsnAPIfChannelInterferenceInfoTable.index,
bsnapifinterferencechannelno AS channelno,
bsnAPTable.index,
bsnapname AS apName,
bsnApIpAddress AS apIpAddress,
bsnapdot3macaddress AS resolvedMacAddress
FROM AirespaceWirelessMib.bsnAPTable INNER JOIN AirespaceWirelessMib.bsnAPIfChannelInterferenceInfoTable
ON bsnAPTable.index = regexp_replace(bsnAPIfChannelInterferenceInfoTable.index, '[.][0-9]+[.][0-9]+$', '')
With the specified select statement, five resource types can be obtained.
Resource type1 (index = 136.117.86.59.62.96.0.1, channelno=1,
apName=AP30f7.0de6, apIpAddress=10.211.10.1,
resolvedMacAddress=88-75-56-3B-3E-40)
IBM Telco Network Cloud Manager - Performance 1.4.5 623

Resource type2 (index = 136.117.86.59.62.96.0.2, channelno=2,
apName=AP30f7.0de6, apIpAddress=10.211.10.1,
resolvedMacAddress=88-75-56-3B-3E-40)
Resource type3 (index = 136.117.86.59.62.96.0.3, channelno=3,
apName=AP30f7.0de6, apIpAddress=10.211.10.1,
resolvedMacAddress=88-75-56-3B-3E-40)
Resource type4 (index = 136.117.86.59.62.160.0.1, channelno=1,
apName=AP30f7.4f9d, apIpAddress=10.211.10.2,
resolvedMacAddress=88-75-56-3B-20-A0)
Resource type5 (index = 136.117.86.59.62.160.0.2, channelno=2,
apName=AP30f7.4f9d, apIpAddress=10.211.10.2,
resolvedMacAddress=88-75-56-3B-20-A0)
Scenario2: Creating property from the multiple fields of an index
Discovery can be extended further to access and retrieve the value as part of properties. You can access and retrieve the three fields from 136.117.86.59.62.96.0.3
as three different properties.
136.117.86.59.62.96
0
3
Combine the SQL AS to assign an object name to a property and the expression that can be further enhanced to include the regex function.
SELECT
bsnAPIfChannelInterferenceInfoTable.index,
bsnapifinterferencechannelno AS channelno,
bsnAPTable.index,
bsnapname AS apName,
bsnApIpAddress AS apIpAddress,
bsnapdot3macaddress AS resolvedMacAddress,
regexp_replace(bsnAPIfChannelInterferenceInfoTable.index, '[.][0-9]+[.][0-9]+$', '') AS tempMacAddress,
regexp_replace(bsnAPIfChannelInterferenceInfoTable.index, '^.*[.]([0-9]+)[.][0-9]+$', '$1') AS apSlotId,
regexp_replace(bsnAPIfChannelInterferenceInfoTable.index, '^.*[.][0-9]+[.]([0-9]+)$', '$1') AS channel
FROM AirespaceWirelessMib.bsnAPTable INNER JOIN AirespaceWirelessMib.bsnAPIfChannelInterferenceInfoTable
ON bsnAPTable.index = regexp_replace(bsnAPIfChannelInterferenceInfoTable.index, '[.][0-9]+[.][0-9]+$', '')
With the specified select statement, five resource types can be obtained.
Resource type1 (index = 136.117.86.59.62.96.0.1, channelno=1,
apName=AP30f7.0de6, apIpAddress=10.211.10.1,
resolvedMacAddress=88-75-56-3B-3E-40,
tempMacAddressIndex=136.117.86.59.62.96, apSlotId=0, channel=1)
Resource type2 (index = 136.117.86.59.62.96.0.2, channelno=2,
apName=AP30f7.0de6, apIpAddress=10.211.10.1,
resolvedMacAddress=88-75-56-3B-3E-40,
tempMacAddressIndex=136.117.86.59.62.96, apSlotId=0, channel=2)
Resource type3 (index = 136.117.86.59.62.96.0.3, channelno=3,
apName=AP30f7.0de6, apIpAddress=10.211.10.1,
resolvedMacAddress=88-75-56-3B-3E-40,
tempMacAddressIndex=136.117.86.59.62.96, apSlotId=0, channel=3)
Resource type4 (index = 136.117.86.59.62.160.0.1, channelno=1,
apName=AP30f7.4f9d, apIpAddress=10.211.10.2,
resolvedMacAddress=88-75-56-3B-20-A0,
tempMacAddressIndex=136.117.86.59.62.160, apSlotId=0, channel=1)
Resource type5 (index = 136.117.86.59.62.160.0.2, channelno=2,
apName=AP30f7.4f9d, apIpAddress=10.211.10.2,
resolvedMacAddress=88-75-56-3B-20-A0,
tempMacAddressIndex=136.117.86.59.62.160, apSlotId=0, channel=2)
Add a condition to filter the necessary resource types and ensure that all the mandatory properties are defined.
SELECT
bsnAPIfChannelInterferenceInfoTable.index,
bsnapifinterferencechannelno AS channelno,
bsnAPTable.index,
bsnapname AS apName,
bsnApIpAddress AS apIpAddress,
bsnapdot3macaddress AS resolvedMacAddress,
regexp_replace(bsnAPIfChannelInterferenceInfoTable.index, '[.][0-9]+[.][0-9]+$', '') AS tempMacAddress,
regexp_replace(bsnAPIfChannelInterferenceInfoTable.index, '^.*[.]([0-9]+)[.][0-9]+$', '$1') AS apSlotId,
regexp_replace(bsnAPIfChannelInterferenceInfoTable.index, '^.*[.][0-9]+[.]([0-9]+)$', '$1') AS channel
FROM AirespaceWirelessMib.bsnAPTable INNER JOIN AirespaceWirelessMib.bsnAPIfChannelInterferenceInfoTable
ON bsnAPTable.index = regexp_replace(bsnAPIfChannelInterferenceInfoTable.index, '[.][0-9]+[.][0-9]+$', '')
WHERE bsnapifinterferencepower IS NOT NULL
SET type = 'channel'
SET id = context.host + '_channel:<' + resource.index + '>'
SET index = resource.index
With the specified select statement, five resource types can be obtained.
Resource type1 (id=10.1.1.12_channel:<136.117.86.59.62.96.0.1>,
type=channel, index = 136.117.86.59.62.96.0.1, channelno=1,
apName=AP30f7.0de6, apIpAddress=10.211.10.1,
resolvedMacAddress=88-75-56-3B-3E-40,
tempMacAddressIndex=136.117.86.59.62.96, apSlotId=0, channel=1)
624 IBM Telco Network Cloud Manager - Performance 1.4.5

Resource type2 (id=10.1.1.12_channel:<136.117.86.59.62.96.0.2>,
type=channel, index = 136.117.86.59.62.96.0.2, channelno=2,
apName=AP30f7.0de6, apIpAddress=10.211.10.1,
resolvedMacAddress=88-75-56-3B-3E-40,
tempMacAddressIndex=136.117.86.59.62.96, apSlotId=0, channel=2)
Resource type3 (id=10.1.1.12_channel:<136.117.86.59.62.96.0.3>,
type=channel, index = 136.117.86.59.62.96.0.3, channelno=3,
apName=AP30f7.0de6, apIpAddress=10.211.10.1,
resolvedMacAddress=88-75-56-3B-3E-40,
tempMacAddressIndex=136.117.86.59.62.96, apSlotId=0, channel=3)
Resource type4 (id=10.1.1.12_channel:<136.117.86.59.62.160.0.1>,
type=channel, index = 136.117.86.59.62.160.0.1, channelno=1,
apName=AP30f7.4f9d, apIpAddress=10.211.10.2,
resolvedMacAddress=88-75-56-3B-20-A0,
tempMacAddressIndex=136.117.86.59.62.160, apSlotId=0, channel=1)
Resource type5 (id=10.1.1.12_channel:<136.117.86.59.62.160.0.2>,
type=channel, index = 136.117.86.59.62.160.0.2, channelno=2,
apName=AP30f7.4f9d, apIpAddress=10.211.10.2,
resolvedMacAddress=88-75-56-3B-20-A0,
tempMacAddressIndex=136.117.86.59.62.160, apSlotId=0, channel=2)
SNMP bulk get (Accessing array)
The SNMP GETBULK operation enables SNMP to retrieve a large section of a table at once. This operation requires continuous GETNEXT operations. You can retrieve arrays
of values from tables where indexing involves dynamic or running indexes. Typically, a probe that is sent to measure a ping test can form a probe resource type with
contains owner index and test name. For example, in Huawei NQA, the nqaAdminCtrlTable is indexed by nqaAdminCtrlOwnerIndex and nqaAdminCtrlTestName. You can
discover the probe resource types from Huawei devices by discovering the object names from NQA-MIB.
Table 3. nqaAdminCtrlEntry table
index nqaAdminCtrlTa
g
nqaAdminCtrlTyp
e
nqaAdminCtrlFrequenc
y
4.105.97.110.102.13.73.97.110.95.68.110.115.95.84.101.115.116.49 0 11 0
4.105.97.110.102.14.73.97.110.95.72.116.116.112.95.84.101.115.116.49 http test 3 0
4.105.97.110.102.16.73.97.110.95.74.105.116.116.101.114.95.84.101.115.116.50 0 5 0
4.105.97.110.102.21.73.97.110.95.73.99.109.112.74.105.116.116.101.114.49.95.84.101.115.11
6.49
0 5 120
To discover probe resources with test type 5 (jitterAppl), a simple discovery formula can be created by selecting object names of interest to form the probe resources for
jitter test type. Then, complete the discovery with the mandatory properties; id, type and index. Use the following formula:
SELECT index, nqaAdminCtrlTag, nqaAdminCtrlType, nqaAdminCtrlFrequency, nqaAdminCtrlStatus FROM NqaMib.nqaAdminCtrlTable
WHERE nqaAdminCtrlType = 5
set type = 'probe'
set id = context.host + '_jitter:<' + resource.index + '>'
set testType = 'jitter'
With the specified select statement, two probe resource types can be obtained.
Resource type1
(id=10.1.1.11_jitter:<4.105.97.110.102.16.73.97.110.95.74.105.116.116.101.114.95.84.101.115.116.50>,
type=probe, index =
4.105.97.110.102.16.73.97.110.95.74.105.116.116.101.114.95.84.101.115.116.50,
testType=jitter, nqaAdminCtrlTag=0, nqaAdminCtrlType=5,
nqaAdminCtrlFrequency=0, nqaAdminCtrlStatus=1)
Resource type2
(id=10.1.1.11_jitter:<4.105.97.110.102.21.73.97.110.95.73.99.109.112.74.105.116.116.101.114.49.95.84.101.115.116.49>,
type=probe, index =
4.105.97.110.102.21.73.97.110.95.73.99.109.112.74.105.116.116.101.114.49.95.84.101.115.116.49,
testType=jitter, nqaAdminCtrlTag=0, nqaAdminCtrlType=5,
nqaAdminCtrlFrequency=120, nqaAdminCtrlStatus=1)
If you want to collect statistics for two unique probe resource types that are discovered, you cannot do that with the current discovery. The third index is not part of the
index that is parsed to the collector and therefore modify the discovery to perform SNMP get bulk instead. See the following example.
Table 4. nqaJitterStatsEntry table
index nqaJitterStatsAvgJitterS
D
nqaJitterStatsAvgJitterD
S
4.105.97.110.102.16.73.97.110.95.74.105.116.116.101.114.95.84.101.115.116.50.1 0 0
4.105.97.110.102.21.73.97.110.95.73.99.109.112.74.105.116.116.101.114.49.95.84.101.115.116.49.344
27
100 150
4.105.97.110.102.21.73.97.110.95.73.99.109.112.74.105.116.116.101.114.49.95.84.101.115.116.49.344
28
200 250
4.105.97.110.102.21.73.97.110.95.73.99.109.112.74.105.116.116.101.114.49.95.84.101.115.116.49.344
29
300 350
4.105.97.110.102.21.73.97.110.95.73.99.109.112.74.105.116.116.101.114.49.95.84.101.115.116.49.344
30
400 450
Multiple nqaJitterStatsIndex are available for a unique probe resource type. Use aggregation operator such as max, min, avg, or sum and report this value on individual
probe resource type. For example, Average(nqaJitterStatsAvgJitterSD) of resource type 2 and results in Average(nqaJitterStatsAvgJitterSD) = 250.
nqaJitterStatsAvgJitterSD.4.105.97.110.102.21.73.97.110.95.73.99.109.112.74.105.116.116.101.114.49.95.84.101.115.116.49.34
427
:100
IBM Telco Network Cloud Manager - Performance 1.4.5 625

nqaJitterStatsAvgJitterSD.4.105.97.110.102.21.73.97.110.95.73.99.109.112.74.105.116.116.101.114.49.95.84.101.115.116.49.34
429
:300
nqaJitterStatsAvgJitterSD.4.105.97.110.102.21.73.97.110.95.73.99.109.112.74.105.116.116.101.114.49.95.84.101.115.116.49.34
430
:400
To include the running third index into discovery, append "*" to end of index property in the select statement.
SELECT index, nqaAdminCtrlTag, nqaAdminCtrlType, nqaAdminCtrlFrequency, nqaAdminCtrlStatus FROM NqaMib.nqaAdminCtrlTable
WHERE nqaAdminCtrlType = 5
set type = 'probe'
set id = context.host + '_jitter:<' + resource.index + '>'
set testType = 'jitter'
set index = resource.index + '.*'
With the specified select statement, two probe resource types can be obtained with updated index value.
Resource type1
(id=10.1.1.11_jitter:<4.105.97.110.102.16.73.97.110.95.74.105.116.116.101.114.95.84.101.115.116.50.*>,
type=probe, index =
4.105.97.110.102.16.73.97.110.95.74.105.116.116.101.114.95.84.101.115.116.50.*,
testType=jitter, nqaAdminCtrlTag=0, nqaAdminCtrlType=5,
nqaAdminCtrlFrequency=0, nqaAdminCtrlStatus=1)
Resource type2
(id=10.1.1.11_jitter:<4.105.97.110.102.21.73.97.110.95.73.99.109.112.74.105.116.116.101.114.49.95.84.101.115.116.49.*>,
type=probe, index =
4.105.97.110.102.21.73.97.110.95.73.99.109.112.74.105.116.116.101.114.49.95.84.101.115.116.49.*,
testType=jitter, nqaAdminCtrlTag=0, nqaAdminCtrlType=5,
nqaAdminCtrlFrequency=120, nqaAdminCtrlStatus=1)
The id property must be enhanced for the value to be unique. It is not advisable to include the "*" in id. The "*" must be removed from the id. You can apply the regex as
follows:
SELECT index, nqaAdminCtrlTag, nqaAdminCtrlType, nqaAdminCtrlFrequency, nqaAdminCtrlStatus,
regexp_replace(nqaAdminCtrlTable.index, '(^[0-9]+)(.*)', '$1') AS testOwnerIndex,
regexp_replace(nqaAdminCtrlTable.index, '(^[0-9]+).(.*)', '$2') AS testName
FROM NqaMib.nqaAdminCtrlTable
WHERE nqaAdminCtrlType = 5
set type = 'probe'
set id = context.host + '_jitter:<' + resource.testOwnerIndex + '.' + resource.testName + '>'
set testType = 'jitter'
set index = resource.index + '.*'
With the specified select statement, two probe resource types can be obtained.
Resource type1
(id=10.1.1.11_jitter:<4.105.97.110.102.16.73.97.110.95.74.105.116.116.101.114.95.84.101.115.116.50>,
type=probe, index =
4.105.97.110.102.16.73.97.110.95.74.105.116.116.101.114.95.84.101.115.116.50.*,
testType=jitter, testOwnerIndex=4.105.97.110.102,
testName=16.73.97.110.95.74.105.116.116.101.114.95.84.101.115.116.50,
nqaAdminCtrlTag=0, nqaAdminCtrlType=5, nqaAdminCtrlFrequency=0,
nqaAdminCtrlStatus=1)
Resource type2
(id=10.1.1.11_jitter:<4.105.97.110.102.21.73.97.110.95.73.99.109.112.74.105.116.116.101.114.49.95.84.101.115.116.49>,
type=probe, index =
4.105.97.110.102.21.73.97.110.95.73.99.109.112.74.105.116.116.101.114.49.95.84.101.115.116.49.*,
testType=jitter, testOwnerIndex=4.105.97.110.102,
testName=21.73.97.110.95.73.99.109.112.74.105.116.116.101.114.49.95.84.101.115.116.49,
nqaAdminCtrlTag=0, nqaAdminCtrlType=5, nqaAdminCtrlFrequency=120,
nqaAdminCtrlStatus=1)
To complete the SNMP BULK GET, modify the collection formula. In the collection formula for those object names that returns arrays of values, append 'Array' suffix. For
example,
Probe.Jitter.Inbound.Avg.ms = average(value(NQA_MIB.nqaJitterStatsAvgJitterDSArray)) when
resource.type == 'probe' && resource.testype == 'jitter'
Note:
NQA_MIB.nqaJitterStatsAvgJitterDS is the object name. However, when bulk get is used on the object name, then use Array suffix as
NQA_MIB.nqaJitterStatsAvgJitterDSArray. The value(NQA_MIB.nqaJitterStatsAvgJitterDSArray) returns array of values.
To access the first element in the list, use syntax as (NQA_MIB.nqaJitterStatsAvgJitterDSArray)[0]
Use advanced JavaScript array methods by Java.from(value(NQA_MIB.nqaJitterStatsAvgJitterDSArray) so that .reduce() and other methods can
be used.
The predefined functions such as max, min, sum, count, and average can be used with this array.
Writing custom collection formulas
626 IBM Telco Network Cloud Manager - Performance 1.4.5

A collection formula is applied against a resource to produce a result that is always a number. The result is then saved to the timeseries database. The collection formulas
are executed regularly based on the polling interval and applied on a larger scale than discovery formulas. These collection formulas must be as simple as possible.
About this task
Explains how to create custom collection formulas.
Collection formula structure
Use this information to understand the syntax for writing the collection formulas easily. A collection formula is a calculation that is performed against raw SNMP
data. It is a combination of functions, conditions, and standard mathematical operations.
Operators
The operators supported by the formula language.
Common functions
The common functions supported in collection formulas.
Collection formula structure
Use this information to understand the syntax for writing the collection formulas easily. A collection formula is a calculation that is performed against raw SNMP data. It is
a combination of functions, conditions, and standard mathematical operations.
Collection formula structure
All collection formulas must have the extension .formula. If a formula file has more than one formula, save it with the extension .formulas.
Name of the formula
Typically, formula names follow a dot notation that includes the following structure:
<resource_group>.<metric_name>.<units>.formula
For example:
Environment.Temperature.Level.Celcius.formula
Network.Outbound.Broadcast.pps.formulas
function
Built-in functions that can be used in the collection formula language that can perform a calculation on the metrics and return a value. See Common functions.
when clause
Filter condition to pick from the specified values or to compare the expression to determine the value. It contains a set of key value pairs.
when resource.type == 'card' && resource.vendor =='Huawei'
Note: All string values must be in single quotation marks.
resource type
Typically, the when condition must specify the resource type from which to poll that is followed by other conditions. For example:
when resource.type == 'interface' && number(resource.ifSpeed)>429496729
SNMP bulk get
In collection formulas, for those OIDs that return arrays of values, append Array as suffix. For example:
nqaJitterStatsAvgJitterDS.octets = average(value(NQA_MIB.nqaJitterStatsAvgJitterDSArray)) when resource.vendor == 'Huawei'
Where, NQA_MIB.nqaJitterStatsAvgJitterDS is the OID. When bulk get is used on the OID, then use the suffix Array as
NQA_MIB.nqaJitterStatsAvgJitterDSArray.
The expression, value(NQA_MIB.nqaJitterStatsAvgJitterDSArray) returns an array of values.
To access the first element in the list, use value(NQA_MIB.nqaJitterStatsAvgJitterDSArray)[0].
You can also use more advanced JavaScript array methods such as .reduce() can be used on
Java.from(value(NQA_MIB.nqaJitterStatsAvgJitterDSArray)).
Predefined functions such as max, min, sum, count, and average can also be used with these arrays.
CPU.Utilization.Percent.formula
CPU.Utilization.Percent = value(CISCO_PROCESS_MIB.cpmCPUTotal5minRev) when resource.type == 'cpu' && resource.vendor
=='Cisco'
Network.Inbound.Broadcast.pps.formulas
Network.Inbound.Broadcast.pps = positive(delta(IF_MIB.ifHCInBroadcastPkts))/duration(IF_MIB.ifHCInBroadcastPkts)*100 when
resource.type == 'interface' && number(resource.ifSpeed)>4294967295
Network.Inbound.Broadcast.pps = positive(delta(IF_MIB.ifInBroadcastPkts))/duration(IF_MIB.ifInBroadcastPkts)*100 when
resource.type == 'interface' && number(resource.ifSpeed)<4294967295
IBM Telco Network Cloud Manager - Performance 1.4.5 627

Operators
The operators supported by the formula language.
Mathematical conventions
The formula language uses standard priority rules between operators. Expressions are evaluated from left to right, respecting parentheses and mathematical precedence
rules. You can use parentheses to alter priority or to increase readability.
Binary Operators
A list of the mathematical operators supported by the formula language.
Table 1. Mathematical Operators
Symbol Definition Comments
+Addition When used between numbers, it is mathematical addition. When used between strings, it is the concatenation operator.
-Subtraction or negation This symbol is used either as a subtraction operator, or in front of an expression to negate the value of the expression.
*Multiplication
/Division
%Modulo Returns the remainder. For example, 155 % 10=5.
b& Binary AND Converts numbers to binary and performs an AND operation.
For example,
252 b& 63 = 60
11111100 b& 00111111 =
00111100
b| Binary OR Converts numbers to binary and performs an OR operation.
For example,
127 b| 128 = 255
01111111 b| 10000000 =
11111111
The result of a Boolean operation is an integer value: 0 for False, 1 for True . The value is considered to be False if it is 0, or True for any value other than 0.
Boolean Operators
Table 2. Boolean Operators
Symbol Definition Comments
>Greater than
>= Greater than or
equal
<Less than
<= Less than or equal
== Equal
!= Not equal
Like Like It is a string comparison tool. The right argument is a string that can contain wildcard characters. The wildcard characters are as
follows.
*- Replaces 0 or more characters
? - Replaces one character.
&& Logical AND
|| Logical OR
Common functions
The common functions supported in collection formulas.
delta
Purpose
Returns the difference between the current value of binding x and its previous value, (n)-(n-1). If the delta() of a MIB object with counter syntax is
negative, it is not considered a problem.
Syntax
628 IBM Telco Network Cloud Manager - Performance 1.4.5

delta (x)
xThe value whose delta value you want to find.
Example
positive(delta(CISCO_ENHANCED_MEMPOOL_MIB.cempMemPoolFreeHit))
Which is equal to:
positive(currentValue(CISCO_ENHANCED_MEMPOOL_MIB.cempMemPoolFreeHit) –
previousValue(CISCO_ENHANCED_MEMPOOL_MIB.cempMemPoolFreeHit))
previousDelta
Purpose
Returns the difference between the previous value of binding x and its previous value, (n-1)-(n-2). If previousDelta() of a MIB object with counter
syntax is negative, it is not considered a problem.
Syntax
previousDelta (x)
xThe value whose previousDelta value you want to find.
Example
Network.Outbound.Octets.Bytes.Previous.Delta = positive(previousDelta(IF_MIB.ifHCOutOctets)) when resource.type
== 'interface' && number(resource.ifSpeed)>4294967295
Network.Outbound.Octets.Bytes.Previous.Delta = positive(previousDelta(RFC1213_MIB.ifOutOctets)) when
resource.type == 'interface' && number(resource.ifSpeed)<4294967295
value
Purpose
Returns the value of a binding x. The value function is same as the currentValue function.
Syntax
value (x)
xThe binding whose value you want to find.
Examples
value(CISCO_ENVMON_MIB.ciscoEnvMonSupplyState)
values
Purpose
Returns an array of values of a binding x that is stored in current state.
Syntax
values(x)
xThe binding whose values from its stored current state that you want to find.
Example
positive(values(CISCO_ENHANCED_MEMPOOL_MIB.cempMemPoolFreeHit)[0])
duration
Purpose
Returns the difference of the current value collection time and the previous value collection time of a binding x.
Syntax
duration (x, ['seconds'])
xThe binding whose value you want to find.
seconds Optional argument that indicates the unit of time. By default, it returns the value in milliseconds. If you want the function to return
seconds, an argument 'second' must be added to the formula. It can be given as any of the following formats in single quotation marks:
's'
'sec'
'secs'
'second'
'seconds'
Example
positive(delta(IF_MIB.ifHCOutUcastPkts)/
duration(IF_MIB.ifHCOutUcastPkts))
Which is equal to:
positive(
IBM Telco Network Cloud Manager - Performance 1.4.5 629

currentTime(IF_MIB.ifHCOutUcastPkts) –
previousTime(IF_MIB.ifHCOutUcastPkts))
time
Purpose
Returns the collection time of the current value of a binding x. The time function is same as the currentTime function.
Syntax
time (x, ['seconds'])
xThe binding whose value you want to find.
seconds Optional argument that indicates the unit of time. By default, it returns the value in milliseconds. If you want the function to return
seconds, an argument 'second' must be added to the formula. It can be given as any of the following formats in single quotation marks:
's'
'sec'
'secs'
'second'
'seconds'
Example
positive(time(CISCO_ENHANCED_MEMPOOL_MIB.cempMemPoolFreeHit))
times
Purpose
Returns an array of collection times of all the values of a binding x that is stored in the current state.
Syntax
times(x, ['seconds'])
xThe binding whose value you want to find.
seconds Optional argument that indicates the unit of time. By default, it returns the value in milliseconds. If you want the function to return
seconds, an argument 'second' must be added to the formula. It can be given as any of the following formats in single quotation marks:
's'
'sec'
'secs'
'second'
'seconds'
Example
positive(times(CISCO_ENHANCED_MEMPOOL_MIB.cempMemPoolFreeHit)[0])
currentTime
Purpose
Returns the collection time of the current value of a binding x.
Syntax
currentTime (x, ['seconds'])
xThe binding whose value you want to find.
seconds Optional argument that indicates the unit of time. By default, it returns the value in milliseconds. If you want the function to return
seconds, an argument 'second' must be added to the formula. It can be given as any of the following formats in single quotation marks:
's'
'sec'
'secs'
'second'
'seconds'
Example
positive(currentTime(CISCO_ENHANCED_MEMPOOL_MIB.cempMemPoolFreeHit))
previousTime
Purpose
Returns the collection time of the previous value of a binding.
Syntax
previousTime (x, ['seconds'])
xThe binding whose value you want to find.
seconds Optional argument that indicates the unit of time. By default, it returns the value in milliseconds. If you want the function to return
seconds, an argument 'second' must be added to the formula. It can be given as any of the following formats in single quotation marks:
's'
'sec'
'secs'
630 IBM Telco Network Cloud Manager - Performance 1.4.5

'second'
'seconds'
Example
previousTime(CISCO_ENHANCED_MEMPOOL_MIB.cempMemPoolFreeHit)
rate
Purpose
Returns the rate of change between the current value and previous value of a binding.
Syntax
rate (x, ['seconds'])
xThe binding whose value you want to find.
seconds Optional argument that indicates the unit of time. By default, it returns the value in milliseconds. If you want the function to return
seconds, an argument 'second' must be added to the formula. It can be given as any of the following formats in single quotation marks:
's'
'sec'
'secs'
'second'
'seconds'
Example
positive(rate(IF_MIB.ifHCOutUcastPkts, 'second'))
Which is equal to:
positive(delta(IF_MIB.ifHCOutUcastPkts)/duration(IF_MIB.ifHCOutUcastPkts, 'second'))
currentValue
Purpose
Returns the value of a binding x.
Syntax
currentValue (x)
xThe value whose currentValue value you want to find.
Example
currentValue(CISCO_ENHANCED_MEMPOOL_MIB.cempMemPoolFreeHit)
previousValue
Purpose
Returns the previous value of a binding.
Syntax
previousValue (x)
xThe value whose previousValue value you want to find.
Example
previousValue(CISCO_ENHANCED_MEMPOOL_MIB.cempMemPoolFreeHit)
positive
Purpose
Returns the value of the expression as follows,
If the value of the binding is positive, it returns the value.
If the value of the binding is negative, it returns null. You can provide a default value to be returned. For example, positive(-1, 10), it returns 10.
When you write a custom formula that uses positive function, enclose the function within the expression so it returns a null value instead of zero.
For example,
positive(value(RFC1213_MIB.ifOutOctets) * 8000)
returns null as intended. Whereas
positive(value(RFC1213_MIB.ifOutOctets)) * 8000
returns zero, which are incorrect.
Syntax
posistive (x, [default_value])
xThe binding whose value is returned. If the binding is positive, then the value is returned. If it is negative, then null is returned. If the
binding is a negative value, provide a default value. Then, the default value is returned.
[default_val
ue] An optional argument. Value that must be returned for a negative result from the expression.
Example
IBM Telco Network Cloud Manager - Performance 1.4.5 631

positive(rate(IF_MIB.ifHCOutOctets, 'second')*8 /
value(IF_MIB.ifHighSpeed)/10000)
Writing custom metrics
A metric is a single collected data value that is identified by its generic name, timestamp, and value. From the reporting perspective, a metric is a data value that is shown
in a report. Metric files contain metadata such as metric name, description, and alias. For every collection formula, a corresponding metric file must be created.
About this task
Explains how to create custom metrics and use them in creating custom collection formulas. All performance metrics in Telco Network Cloud Manager - Performance are
stored in time series database. These metrics can be displayed in real time on Metric Viewer dashboard.
Metric structure
Typical structure of a metric that is used in a collection formula. A metric has these components. Metrics structure follows HOCON format, which is derived from
JSON.
Metric structure
Typical structure of a metric that is used in a collection formula. A metric has these components. Metrics structure follows HOCON format, which is derived from JSON.
name
It is the normalized metric name for the same metric across all supported vendors. For example, the built-in metrics that are available in Technology Packs has the
following structure:
<resource_group>-<metric_name>-<units>.metric
Note: All metrics must have an extension .metric.
description
Provide a simple description of what SNMP data that the metric returns. The data type for description is string.
Note: Description must be in double quotation marks.
units
Provide an applicable unit for the metric based on the information that it represents and its result. For example,
Number (count, type)
Percent
Bytes
Volt
Celsius
Milliseconds
aliases
An array of comma-separated vendor-specific formula names by which the metric can be identified. It must match the formula name that can be mapped to the metric
name.
properties
It contains the resource types that are associated with this metric. This field can be left blank with open and closed braces.
Some examples of metrics are as follows,
Environment-Voltage-Level-Volts.metric
name=Environment.Voltage.Level.Volts
description="The voltage of entity"
units=volt
aliases=[CiscoDevice Voltage Level,Huawei Voltage Level]
properties={
resource-types="powerSupply,card"
}
CPU-Utilization-Percent.metric
632 IBM Telco Network Cloud Manager - Performance 1.4.5

name=CPU.Utilization.Percent
description="The percentage of CPU utilization"
units=Percent
aliases=[cpuBusy,JuniperERX CPU Utilization,JuniperChassis CPU Utilization avg last 5min,Huawei CPU
Utilization,CiscoDevice System CPU Utilization CPM]
properties={
resource-types="cpu,card,device"
}
IP-Fragment-Failure-pps.metric
name=IP.Fragment.Failure.pps
description="The number of IP datagrams that is discarded because they needed to be fragmented at this entity but might
not be."
units=pps
aliases=[RFCMIBII Fragmentation Failures]
properties={
resource-types="device"
}
Related information
Using HOCON, the JSON Superset
File-based formula language
Detailed information about the File-based Technology Pack formula language that can be used to create custom collection formulas, discovery formulas, model files, and
metrics.
All the custom content can be validated, bundled, and installed in the system along with Telco Network Cloud Manager - Performance according to your requirements.
Related information
Rapid File device onboarding
Expressions and functions in User-defined calculations
Use this information to understand expressions and provides examples of the use of expressions, functions, and operators in the creation of UDCs (User-defined
calculations).
An expression is a way of calculating a new value or result from existing fields. For example, calculating A/B*100 from two metrics A and B.
An expression can be made up of the following entities:
Other expressions include metrics and formulas that are delivered with a Technology Pack.
UDCs (User-defined calculations)
Important: An expression must contain at least one metric. Reports without metrics are not supported. See Computation for complex metrics.
General expressions
Basic building blocks of an expression that can be used in UDCs.
Operators
Operators are used to combine metrics to create new expressions.
Functions
A function is a built-in algorithm that takes zero or more comma-separated arguments and returns a (possibly NULL ) result.
Aggregation types
Given a set of data a single aggregate value can be calculated for that data. A number of ways aggregations can be calculated in Telco Network Cloud Manager -
Performance, depending on the field and aggregation type that is used. Aggregation types and computation of aggregation for complex metrics are introduced.
General expressions
Basic building blocks of an expression that can be used in UDCs.
Elements
Expressions follow the basic concepts of unary, binary, and conditional expressions.
Table 1. Expressions - elements
Element Description
Unary Expression in the form - operator
expression.
Binary Expression in the form - expression
operator expression.
IBM Telco Network Cloud Manager - Performance 1.4.5 633

Element Description
Conditional Expression in the form - expression ?
expression : expression.
Constant Literal Integer, and Float values.
Function Expression in the form -
functionName(expr1, ..., exprN)
Remarks
The following case-insensitive tokens are reserved for use as keywords in expressions:
AND OR (INT) (FLOAT)
The following characters are used as operators for punctuation:
! - + * / % ^
Examples
The table below shows some simple examples of expressions that are built up from metrics in a neutral Technology Pack, including unary, binary, conditional operators
and functions.
Table 2. Expressions - examples
Expression Description
[Cell]!
[{Neutral.tch.call_seizure_
failures}]
Basic example of unary operator to negate a metric.
[Cell]!
[{Neutral.tch.call_seizure_
successes}] /
[Cell]!
[{Neutral.tch.call_seizure_
attempts}] *100
Binary expression with constant: Percentage of tch call seizure successes.
[Cell]!
[{Neutral.tch.call_seizure_
successes}] > 3000 ?
[Cell]!
[{Neutral.sdcch._%_seizure_
failure}] :
[Cell]!
[{Neutral.sdcch._%_seizure_
success}]
Logic operator example that uses a constant and Technology Pack formulas (the percentage fields are based on A/B*100
expressions). Where call_seizure_successes is greater than 3000 select %_seizure_failures otherwise return
%_seizure_successes.
DECODE( [Cell]!
[{Nok.Traffic.tch_call_req}
] ,
nullInt(), [Cell]!
[{Neutral.tch.call_seizure_
attempts}] ,
[Cell]!
[{Nok.Traffic.tch_call_req}
])
`
Use of DECODE function to select an alternative metric where a vendor-specific metric is NULL.
If Nok.Traffic.tch_call_req is NULL.
THEN
return
Neutral.tch.call_seizure-attempts
ELSE
return
Nok.Traffic.tch_call_req
Constants
Applies To
General Expressions.
Description
Constants (often referred to as literals) are values that do not change. There are two types of constants: integer and float.
Syntax
[[ Integer | Float ]]
Elements
Table 3. Constants - elements
Element Description
Integer Constant Consists of a sequence of decimal digits.
Float Constant Consists of a sequence of decimal digits and exactly one period '.'
Examples
Table 4. Constants
Integer Constants Float Constants
10 10.2
99999 .234
Conditions
634 IBM Telco Network Cloud Manager - Performance 1.4.5

Applies To
General Expressions
Description
A condition is a logic expression, which returns true or false (1 or 0). Typically, conditions are not used as expressions in isolation but part of a larger expression. For
example, selecting alternative metrics depending on whether a condition is true or false:
[Cell]![{Neutral.tch.call_seizure_successes}] > 3000 ?
[Cell]![{Neutral.sdcch._%_seizure_failure}] :
[Cell]![{Neutral.sdcch._%_seizure_success}]
Example
The following table shows the full conditional expression support available.
Table 5. Conditions -
examples
Expression Result
10 > 20 0
10 < 20 1
Operators
Operators are used to combine metrics to create new expressions.
Operators
Operators are used to combine metrics to create new expressions.
The following types are operators can be used in expressions:
Arithmetic operators
The most commonly used operators that are used to add, divide, subtract, and multiply metrics to create new expressions.
Logic Operators
Used in conditional expressions to select the branches of an expression that is based on whether a condition is true or false.
Applies To
General Expressions.
Description
Operators are used in expressions for arithmetic or logical operations. The two types of operators are unary and binary. Unary operators use one operand in the
format:
operand operator
Binary operators use two operands in the format:
operand1 operator operand2
Unary operators are right associative; binary operators are left associative. The following expression must be read as the one that follows:
a - b - c < -d
((a - b) - c) < (-d)
Type Casting
Some operators can, depending on their operands, cause conversion of the operand value from one type to another. This process is known as implicit casting. Most
binary operators use a set of standard type conversions whereby if either operand is of type FLOAT, then the other operand is converted to a FLOAT. Any variation
from this rule is described in the relevant operator section.
Syntax
The following table summarizes the precedence among operators. Each operator in a block shares precedence and is evaluated from left to right. An operator in a
higher block has a higher precedence than operators in a lower block.
For example,
a + b * c ==> a + (b * c)
Because * has a higher precedence than +. Also, a + b - c ==> (a + b) -
c.
Because + and - have the same precedence and because + is left associative.
Arithmetic operators
Logic Operators
The following table contains full set of logic operators supported.
Arithmetic operators
The sample expressions in the following table shows the usage of basic arithmetic operators to create some new expressions.
Table 1. Arithmetic Operators
IBM Telco Network Cloud Manager - Performance 1.4.5 635

Expression DescriptionExpression Description
[Cell]!
[{Neutral.TCH.handover_seizure_successes}] +
[Cell]!
[{Neutral.TCH.handover_seizure_failures}]
Expression to calculate the total handovers based on the sum of handover successes and handover
failures.
[Cell]![{Neutral.TCH.seizure_attempts}] -
[Cell]![{Neutral.TCH.seizure_failures}] Expression to calculate the successful TCH seizures based on seizure attempts less failures.
[Cell]![{Neutral.TCH.call_seizure_successes}]
/
[Cell]![{Neutral.TCH.call_seizure_attempts}]
*100
Typical example of division and multiplication operators to create a percentage successful call attempts
expression.
[Cell]![{Neutral.TCH.call_seizure_successes}]
% 100 Modulus operator gives the remainder after dividing seizure successes by 100.
[Cell]![{Neutral.TCH.call_seizure_successes}]
^ 2 Raise an expression to a power, in this example 2. The result is the square of
call_seizure_succcesses .
Logic Operators
The following table contains full set of logic operators supported.
A number of examples are contained in the following section that uses some of these logic operators in conditions.
Table 1. Logic operators
Operator Description Syntax
!Not ! expr
-Unary minus (negation) - expr
== Equality expr == expr
=Equality expr = expr
!= Inequality expr != expr
<Less than expr < expr
<= Less than or equal to expr <= expr
>Greater than expr > expr
>= Greater than or equal to expr >= expr
?: Conditional Expression expr ? expr : expr
AND Logical AND expr AND expr
&& Logical AND expr && expr
OR Logical OR expr OR expr
|| Logical OR expr || expr
Sample expressions
Table 2. Logic operators examples
Expression Description
([Cell]![{Neutral.TCH.seizure_attempts}] > 2000 AND
[Cell]![{Neutral.TCH.seizure_successes}]
< 1700) ? [Cell]![{Neutral.TCH.total_dropped_calls}]
:
nullInt()
Following are the combination of logic operators to create conditions:
Where seizure_attempts is greater than 2000 and seizure_successes is less than
1700.
Then, return total_dropped_call
else return NULL.
Remarks
Values of attributes in an Application Gateway object are sometimes NULL. That means no data was read from the database, ASCII file or other repository source. If you
apply an operator to a NULL attribute, the NULL is returned.
You can use the function isNull to determine whether an attribute or expression has a value.
Functions
A function is a built-in algorithm that takes zero or more comma-separated arguments and returns a (possibly NULL ) result.
General Expressions
The number and type of the arguments are specific to each function and are described in the following sections for each function. In general, the arguments to a
function can be any valid expression, including another function call.
[[function_name (arg1, arg2, ..., argN )]]
Elements
Table 1. Function elements
636 IBM Telco Network Cloud Manager - Performance 1.4.5

Elements Description
function_name Function names begin with a letter and continue with any alphanumeric character or underscore.
argX Any valid expression. Must match the type that is needed by the function.
Elements
Expressions follow the basic concepts of unary, binary, and conditional expressions.
Math functions
Math functions are an extension of the basic arithmetic operators (+, -, / and *) to do less common functions on integer or float expressions.
Special aggregation functions
Logic functions
Some logic functions.
Null functions
Conversion functions
Traffic functions
Elements
Expressions follow the basic concepts of unary, binary, and conditional expressions.
Table 1. Expression elements
Element Description
Unary Expression in the form - operator
expression.
Binary Expression in the form - expression
operator expression.
Conditional Expression in the form - expression ?
expression : expression.
Constant Literal Integer, and Float values.
Function Expression in the form -
functionName(expr1, ..., exprN)
Math functions
Math functions are an extension of the basic arithmetic operators (+, -, / and *) to do less common functions on integer or float expressions.
The following examples use constants to demonstrate their use. Equally expressions or metrics can be used as any of these function arguments.
abs
ceil
exp
Calculates the exponential of N, expressed as a float. Satisfies the equation: exp(N) = exp(1) ^ N
floor
Largest integer value not greater than N, expressed as a float.
log
Calculates the natural logarithm of N expressed as a float. If N <= 0.0, then a warning is output and NULL is returned.
round
Returns the integer value nearest N in the direction of the current IEEE754 rounding mode, expressed as a float.
sqr
Calculates the square of N, expressed as a float. Satisfies the equation: sqr (N) == N ^ 2
sqrt
Calculates the square root of N, expressed as a float. If N is less than 0, then NULL is returned. Satisfies the equation:
trunc
Integer value of N, expressed as a float. Returns the same value as the expression:
abs
Returns the absolute value of numeric attribute N.
NUMBER abs(NUMBER
N)
Table 1. abs function examples
Expression Result
abs(10) 10
abs(-10) 10
abs(1.0 * 10) 10.000000
abs(1.0 * -10) 10.000000
ceil
IBM Telco Network Cloud Manager - Performance 1.4.5 637

Returns the smallest integer value not less than N, expressed as a float.
FLOAT ceil(NUMBER N)
Table 1. ceil Function
examples
Expression Result
ceil(1.3) 2.000000
ceil(1.5) 2.000000
ceil(1.7) 2.000000
ceil(-1.3) -1.0000000
ceil(-1.5) -1.0000000
ceil(-1.7) -1.0000000
exp
Calculates the exponential of N, expressed as a float. Satisfies the equation: exp(N) = exp(1) ^ N
FLOAT exp(NUMBER N)
Table 1. exp Function examples
Expression Result
exp(1) 2.718282
exp(1) == exp(1) ^ 1 1
exp(2) == exp(1) ^ 2 1
floor
Largest integer value not greater than N, expressed as a float.
FLOAT floor(NUMBER
N)
Table 1. floor Function
examples
Expression Result
floor(1.3) 1.000000
floor(1.5) 1.000000
floor(1.7) 1.000000
floor(-1.3) -2.0000000
floor(-1.5) -2.0000000
floor(-1.7) -2.0000000
log
Calculates the natural logarithm of N expressed as a float. If N
<= 0.0, then a warning is output and NULL is returned.
FLOAT log(NUMBER
N
)
Table 1. log Function
examples
Expression Result
log(1) 0.000000
log(10) 1.000000
log(100) 2.000000
log(1000) 2.000000
log(-1.0) NULL
round
Returns the integer value nearest N in the direction of the current IEEE754 rounding mode, expressed as a float.
FLOAT round(NUMBER
N)
638 IBM Telco Network Cloud Manager - Performance 1.4.5

Table 1. round Function
examples
Expression Result
round(1.3) 1.000000
round(1.5) 2.000000
round(1.7) 2.000000
round(-1.3) -1.000000
round(-1.5) -2.000000
round(-1.7) -2.000000
sqr
Calculates the square of N, expressed as a float. Satisfies the equation: sqr (N) == N ^ 2
FLOAT sqr(NUMBER
N)
Table 1. sqr Function
examples
Expression Result
sqr(0) 0.000000
sqr(1) 1.000000
sqr(2) 4.000000
sqr(-2) 4.000000
sqr(10) 100.000000
sqrt
Calculates the square root of N, expressed as a float. If N is less than 0, then NULL is returned. Satisfies the equation:
sqr(sqrt (N)) == N
FLOAT sqrt(NUMBER N)
Table 1. sqrt Function examples
Expression Result
sqrt(0) 0.000000
sqrt(1) 1.000000
sqrt(9) 3.000000
sqrt(-1) NULL
sqr(sqrt(100)) 100.000000
trunc
Integer value of N, expressed as a float. Returns the same value as the expression:
(FLOAT)(INT) N
FLOAT trunc(NUMBER
N
)
Table 1. trunc Function examples
Expression Result
trunc(1.3) 1.000000
trunc(1.5) 1.000000
trunc(1.7) 1.000000
trunc(-1.3) -1.000000
trunc(-1.5) -1.000000
trunc(-1.7) -1.000000
trunc( [Cell]![{Neutral.TCH.traffic}] + .0003)
Special aggregation functions
vsum()
IBM Telco Network Cloud Manager - Performance 1.4.5 639

vsum is an extension of the basic "+" operator with special NULL handling. It applies vector summation semantics to a collection of scalar values. If a particular
result is NULL, it is ignored. If at least one result is not-NULL, then the result is not NULL. If all values are NULL, then the result is NULL.
vsum(field, ...)
field
One or more fields that are added.
Table 1. vsum() Function examples
Expression Result
vsum(1, 2, 3, 0) = 6
Not NULL - The zero forces the result to never be NULL and does not affect the calculated summation.
vsum(1, 2, 3) = 6
vsum(nullInt(),nullInt(),nullInt()) NULL
All values are NULL. Therefore, the result is NULL.
vsum(
[Cell]![{Nok.MS_Speed.speed
_class1_samples}],
[Cell]![{Nok.MS_Speed.speed
_class2_samples}],[Cell]![{Nok.MS_Speed.
speed_class3_samples}] )
Calculate the total number of MS_Speed samples for all classes and ignore the values where they are null.
If this expression was built as A + B + C, if C was null then no results would be returned for A + B.
Logic functions
Some logic functions.
InGroup
The InGroup operator returns true or false depending on whether an expression value maTCHes any one of a set of test values. For example, INT InGroup(ATTR
A, ATTR T1, ...,ATTR Tn)- is the value of A one of the values that are specified by T1, T2, ..., TN.
isNull
isNull is typically used as part of logic expressions to check whether a metric value is null. 1 means true whereas 0 means false.
nullValue
If attribute A is NULL (for example, has no value, or traverses a null relationship) then V is returned, otherwise A is returned.
decode
Conditional Operator (?)
Allows a simple IF.THEN.ELSE statement. That is, if test_expr returns a nonzero result, then the value of expr1 is used. Otherwise, the value of expr2 is used.
Both expr1 and expr2 must return the same type.
InGroup
The InGroup operator returns true or false depending on whether an expression value maTCHes any one of a set of test values. For example, INT InGroup(ATTR A,
ATTR T1, ...,ATTR Tn)- is the value of A one of the values that are specified by T1, T2, ..., TN.
INT InGroup(ATTR A, ATTR T1, ...,ATTR Tn)
Table 1. InGroup Function examples
Expression Result
InGroup([Cell]![{Neutral.TCH.defined_ch}] , 14, 16, 18) ?
[Cell]![{Neutral.TCH.call_seizure_successes}] :
( [Cell]![{Neutral.TCH.call_seizure_successes}] * .2)
If Cell.defined_ch (defined channels) is any one of 14, 16 or 18.
THEN
Return seizure_successes
ELSE
Return seizure_successes * .2
isNull
isNull is typically used as part of logic expressions to check whether a metric value is null. 1 means true whereas 0 means false.
INT isNull(ATTR A)
Table 1. isNull Function examples
Expression Result
isNull(nullInt()) 1 (division by zero always results in null, which is converted into (1)
for true.)
640 IBM Telco Network Cloud Manager - Performance 1.4.5

Expression Result
IsNull([nUtranCell]![{nUtranCell.N.User.RRCConn.Active.UL.Max}]+
[nUtranCell]![{nUtranCell.N.User.RRCConn.Active.DL.Max}]) ? 100:0 Returns 100 if
IsNull([nUtranCell]!
[{nUtranCell.N.User.RRCConn.Active.UL.Max}]+
[nUtranCell]!
[{nUtranCell.N.User.RRCConn.Active.DL.Max}]) ?
100:20
is null or 0 if not null.
IsNull([nUtranCell]![{nUtranCell.N.User.RRCConn.Active.UL.Max}]+
[nUtranCell]!
[{nUtranCell.N.User.RRCConn.Active.DL.Max}]) ?100 : ([nUtranCell]!
[{nUtranCell.N.User.RRCConn.Active.UL.Max}]+[nUtranCell]!
[{nUtranCell.N.User.RRCConn.Active.DL.Max}]
= 0) ?100 : (([nUtranCell]![{nUtranCell.N.User.RRCConn.Active.UL.Max}]
/
([nUtranCell]![{nUtranCell.N.User.RRCConn.Active.UL.Max}]+[nUtranCell]!
[{nUtranCell.N.User.RRCConn.Active.DL.Max}])) * 100)
This means, if
'[nUtranCell]!
[{nUtranCell.N.User.RRCConn.Active.UL.Max}]+
[nUtranCell]!
[{nUtranCell.N.User.RRCConn.Active.DL.Max}]'
is null, then calculation returns 100 else if
'[nUtranCell]!
[{nUtranCell.N.User.RRCConn.Active.UL.Max}]+
[nUtranCell]!
[{nUtranCell.N.User.RRCConn.Active.DL.Max}]'
is zero, then calculation returns 100, else the calculation returns a
value of (A/(B+C))*100.
([nUtranCell]!
[{nUtranCell.N.User.RRCConn.Active.UL.Max}] /
([nUtranCell]!
[{nUtranCell.N.User.RRCConn.Active.UL.Max}]+
[nUtranCell]!
[{nUtranCell.N.User.RRCConn.Active.DL.Max}])) * 100
nullValue
If attribute A is NULL (for example, has no value, or traverses a null relationship) then V is returned, otherwise A is returned.
The return type of this function is the same as attribute A's type. Attribute V must be of the same type as Attribute A.
ATTR nullValue(ATTR A, ATTR V)
Table 1. nullValue Function examples
Expression Result
nullValue(10/0, 0) 0
NullValue([Cell]![{Neutral.TCH.traffic}],
[Cell]![{Neutral.TCH.total_dropped_calls}] )
If TCH_traffic is NULL, then return total_dropped_calls.
decode
The decode() function is equivalent to the IF:ELSE IF:ELSE or SWITCH statements. It is interpreted as IF:THEN:ELSEIF:THEN:ELSE. You can have multiple
ELSEIF statements to achieve the needed evaluations.
Note: In decode and conditional expressions, null is treated differently. Theoretically the result from both the following expressions is expected to be the same, but null is
treated differently in each expression.
Select decode(null, null, 1, 2) from dual. It returns 1 because decode assumes null = null.
Select case when null = null then 1 ELSE 2 end from dual. It returns 2 because this statement assumes null is not equal to null.
decode(test_expr, expr1, return1, expr2, ..., exprN, returnN,
returnX)
Table 1. decode Function examples
Expression Result
DECODE( [Cell]![{Nok.Traffic.TCH_call_req}], nullInt(),
[Cell]![{Neutral.TCH.call_seizure_attempts}] ,
[Cell]![{Nok.Traffic.TCH_call_req}])
Use of decode function to select an alternative metric where a vendor-specific metric is
NULL.
If Nok.Traffic.TCH_call_req is NULL, then
return Neutral.TCH.call_seizure_attempts
Else return
Nok.Traffic.TCH_call_req.
Conditional Operator (?)
IBM Telco Network Cloud Manager - Performance 1.4.5 641

Allows a simple IF.THEN.ELSE statement. That is, if test_expr returns a nonzero result, then the value of expr1 is used. Otherwise, the value of expr2 is used. Both
expr1 and expr2 must return the same type.
Note: In decode and conditional expressions, null is treated differently. Theoretically the result from both the following expressions is expected to be the same, but null is
treated differently in each expression.
Select decode(null, null, 1, 2) from dual. It returns 1 because decode assumes null = null.
Select case when null = null then 1 ELSE 2 end from dual. It returns 2 because this statement assumes null is not equal to null.
Conditionals can be nested to any depth.
[[test_expr ? expr1 : expr2]]
Table 1. Conditional operator examples
Expression Result
[Cell]![{Neutral.TCH.seizure_successes}]
> 3000 ?
[Cell]!
[{Neutral.sdcch._%_seizure_failure}] :
[Cell]!
[{Neutral.sdcch._%_seizure_success}]
If seizure_successes is greater than 3000, then return percentage seizure failures, otherwise return
percentage seizure success.
Null functions
nullFloat
Returns a null value where type FLOAT is needed. Typically, it is used as a comparison as part of a conditional logic operator.
FLOAT NullFloat()
Table 1. nullFloat Function examples
Expression Result
DECODE([Cell]![{Neutral.TCH._%_seizure_success}]) nullFloat(),
[[Cell]![{Neutral.TCH.seizure_successes}], [Cell]!
[{Neutral.TCH.seizure_failures}])
If the metric percentage seizure success is NULL, then
Return
seizure_successes Else return
seizure_failures.
nullInt
Returns a null value where type INT is needed.
INT NullInt()
Table 2. nullInt Function
examples
Expression Result
NullInt
Conversion functions
stringToInt
Converts a string into an integer number (of base 10). The string to convert must be in a valid format, otherwise NULL is returned.
INT stringToInt(STRING
S)
Table 1. stringToInt Function examples
Expression Result
stringToInt("1234") 1234
stringToInt("98659") 98659
Traffic functions
Some traffic functions.
percentFail
percentOk
Returns the percentage ratio of successful attempts to total attempts. This function returns 100.0 when the denominator is 0.
thresholdDiv
Erlang based functions
circ
crit
Critical Traffic. Returns the critical traffic value for a number of circuits and design grade of service, you can use the Erlang B or Erlang C algorithm.
642 IBM Telco Network Cloud Manager - Performance 1.4.5

gos
Grade of service. Returns the grade of service (blocking probability) when traffic is offered to a number of circuits, you can use the Erlang B or Erlang C algorithm.
gose
Grade of service. Returns the grade of service (blocking probability) when traffic is offered to a number of circuits, and sources (callers), by using the Engset
algorithm.
TC4
toff
Offered traffic. Returns the offered traffic value for a number of circuits and given carried traffic that you can use the Erlang B algorithm.
percentFail
Returns the percentage ratio of failed attempts to total attempts. This function returns 0.0 when the denominator is 0.
percentFail(numerator,denominator)
Table 1. percentFail Function examples
Expression Result
percentFail(10,100) 10
percentFail([Cell]![Cell_Offered_Traffic],
[Cell]![Cell_Critical_Traffic] ) Percentage utilization is based on the offered traffic and critical traffic.
percentOk
Returns the percentage ratio of successful attempts to total attempts. This function returns 100.0 when the denominator is 0.
percentOK(numerator,denominator)
Table 1. percentOk Function
examples
Expression Result
percentOK(10,100) 10
thresholdDiv
Returns the ratio of two values with thresholding on the denominator. If a denominator element is less than the threshold_value, then the insertValue is returned.
This function can be used to screen out low-activity data. For example, the calculation of an RF loss/Erlang value can be dominated by the occasional dropped call in
the middle of the night due to the low traffic level. Performing the division that uses thresholdDiv and setting the threshold to a reasonable amount of traffic can mask
this problem.
thresholdDiv(numerator, denominator, thresholdValue, insertValue)
Table 1. thresholdDiv Function examples
Expression Result
thresholdDiv(5000, 10010, 10000, 0) 0.4995
Erlang based functions
Telco Network Cloud Manager - Performance provides a number of functions that can be used to analyze traffic data. These functions are based around:
The Erlang B loss function, which models the behavior of contention for a non-queued limited resource.
The Erlang C function, which models the behavior of contention of a queued limited resource.
The Engset function, which models the behavior of contention by using the expected peak traffic, the number of sources (callers), and the number of circuits.
These functions allow the probability of blocking for the resource to be estimated, and thus the traffic that is offered to a resource and the capacity of an element to be
calculated.
The grade of service calculation
The grade of service of a resource can be expressed as the probability of traffic that is being offered to the resource meeting a blocking condition. It is commonly
used to assess network resources such as a circuit group or cell TCH. Grade of service is important both as a measure of the actual quality of service that is offered
to subscribers, and also as a design parameter, the design grade of service. Grade of service is calculated from the perspective of the element that is providing the
resource. What happens to the service request, the call, depends on the system in question:
In a loss system, the call is typically offered to an alternative trunk group or a different cell or sector. In a queued system, the call is queued and might later receive
service from the element.
Therefore, care must be taken when the association between grade of service and subscriber-visible effects of congestion are made.
Offered traffic
The first step in calculating grade of service is to estimate the traffic that is offered to a resource. The offered traffic can be thought of as the traffic that would be
carried if the resource had unlimited capacity. In general, the offered traffic cannot be measured directly because one of the following points is true:
IBM Telco Network Cloud Manager - Performance 1.4.5 643

The number of bids for a resource is not known, such as an incoming circuit group.
If the bids are known, only the traffic that might result from them can be estimated. For example, a measure of offered traffic might be obtained from bid and
mean holding time data.
For a loss system, it is usual to estimate the offered traffic that uses the Erlang B function to calculate the lost traffic and thus the offered traffic. The algorithm uses
an iterative approach to solve the equations.
For a queued system, the traffic that is offered is considered identical to the traffic carried. As the model assumes that an infinite queue is available, all traffic that is
offered is ultimately carried, though perhaps after a significant delay. If the measurement period is long relative to the average holding time, this assumption is
reasonable for the purposes of the model.
The toff function is provided for Erlang B that is passed the number of circuits and the measured carried traffic. The function returns the offered traffic. For
example,
toff( 10, 4.3, "B" ) returns the offered traffic when 4.3 Erlangs is carried on 10 circuits.
Blocking probability
The grade of service, or blocking probability, is calculated that uses the gos function for Erlang B and C. This function is passed the number of available circuits and
the offered traffic. For example,
gos({Neutral.TCH.defined_ch},{Neutral.TCH.offered_b},"B")
The function returns the grade of service that is expressed as a probability 0 - 1. For example, a value of 0.008 implies a blocking probability of 8 in 1000.
Capacity calculations
The theoretical maximum capacity of a resource is equal to the number of circuits available on the resource. For example, a circuit group of 60 circuits can
potentially carry 60 Erlangs if all circuits are busy. However, it is clear that in such a situation the amount of blocking is high. Any traffic that is offered to the circuit
group might have a probability of 1 of meeting a block condition.
Therefore, it is normal to define capacity in terms of that level of offered traffic that results in a grade of service equal to the design grade of service. It is known as
the nominal capacity.
The nominal capacity of a resource is the traffic level at which the grade of service is equal to some predefined value. It is known as the critical traffic level.
Critical traffic
Typical values for the design grade of service are around 0.008.
The critical traffic level for a resource can be calculated with the crit function for Erlang B and C. This function is passed the number of available circuits and the
design grade of service that is expressed as a probability.
For example, crit([Cell]![{Neutral.TCH.available_ch}] , .02, "B") returns the critical traffic, which might be carried based on a GOS of 0.2. If the
number of circuits is negative, a value of 0 is used.
TC4 full availability
Using critical traffic to define capacity essentially defines a grade of service at a nominal load. Other measures of capacity also attempt to define levels of service at
varying degrees of overload.
The TC4 traffic level is defined as that level of offered traffic that provides a grade of service of:
0.008 at nominal load
0.02 at 10% overload
0.05 at 20% overload
The TC4 capacity tends to be less than the critical traffic after approximately 30 circuits, as the second and third criteria start to limit the value as the number of circuits
increase.
The function TC4 is passed the number of available circuits and returns the capacity figure. For example,
TC4(3, "B" )
Typically, this function is used for capacity of circuit groups, and not for elements with small numbers of circuits such as cells.
circ
Circuit required. Returns the smallest integer number of circuits that can deliver the specified design grade of service for the specified offered traffic, you can use the
Erlang B or Erlang C algorithm.
circ(OFFERED, DGOS, "B")
circ(OFFERED, DGOS, "C")
Table 1. circ Function examples
Expression Result
circ(5, 0.7, "B" ) Returns the needed number of circuits to deliver a DGOS of 0.7 for an offered traffic value of 5. Result is 2.0.
circ({Neutral.TCH.offered_c} ,
{Neutral.TCH.gos_c} , "C" ) Returns the required number of circuits to deliver a DGOS defined by Neutral.TCH.gos_c, for offered traffic that is
defined by Neutral.TCH.offered_c.
circ({Neutral.TCH.offered_c} ,
0.95 , "C" ) Returns the needed number of circuits that it is to deliver a DGOS of 0.95.
crit
Critical Traffic. Returns the critical traffic value for a number of circuits and design grade of service, you can use the Erlang B or Erlang C algorithm.
crit(CIRCUITS, DGOS, "B")
644 IBM Telco Network Cloud Manager - Performance 1.4.5

crit(CIRCUITS, DGOS, "C")
Table 1. crit Function examples
Expression Result
crit(6, 0.6, "B" ) Returns the critical traffic value of 13.552001953125, for six circuits that are based on a DGOS of 0.6.
crit({Neutral.TCH.defined_ch} ,
{Neutral.TCH.gos_b} , "B" ) Returns the critical traffic value for the number of circuits that are defined by Neutral.TCH.defined_ch, based on a
DGOS defined by Neutral.TCH.gos_b.
crit([Cell]!
[{Neutral.TCH.available_ch}] ,
.02, "B")
Returns the critical traffic, which is carried based on a DGOS of 0.2.
gos
Grade of service. Returns the grade of service (blocking probability) when traffic is offered to a number of circuits, you can use the Erlang B or Erlang C algorithm.
gos(number_of_circuits, traffic_offered, "B")
gos(number_of_circuits, traffic_offered, "C")
Table 1. gos Function examples
Expression Result
gos( 10, 4.3, "B" ) Returns the grade of service for 4.3 Erlangs if offered to 10 circuits, = 0.00811999517242912.
gos({Neutral.TCH.defined_ch} ,
{Neutral.TCH.offered_b } , "B" ) Returns the grade of service for the available circuits and offered traffic.
gose
Grade of service. Returns the grade of service (blocking probability) when traffic is offered to a number of circuits, and sources (callers), by using the Engset algorithm.
gose(number_of_circuits , traffic_offered, number_of_sources)
Table 1. gose Function examples
Expression Result
gose( 10, 2, 5 ) The returned value is 0.0175.
TC4
The TC4 traffic level is defined as that level of offered traffic that provides a grade of service of:
0.008 at nominal load
0.02 at 10% overload
0.05 at 20% overload
The algorithm that is used is Erlang B.
TC4(circuits, algorithm)
Table 1. TC4 Function examples
Expression Result
TC4(3, "B" ) 0.41757
TC4({Neutral.TCH.defined_ch}, "B" ) Returns the TC4 traffic level for Neutral.TCH.defined_ch.
toff
Offered traffic. Returns the offered traffic value for a number of circuits and given carried traffic that you can use the Erlang B algorithm.
toff(circuits, carried, "B")
Table 1. toff Function examples
Expression Result
toff( [Cell]!
[{Neutral.TCH.available_ch}] ,
[Cell]![{Neutral.TCH.traffic}] ,
"B")
Calculates offered traffic that is based on the available circuits and the carried traffic by Neutral.TCH.available_ch
and Neutral.TCH.traffic.
Aggregation types
IBM Telco Network Cloud Manager - Performance 1.4.5 645

Given a set of data a single aggregate value can be calculated for that data. A number of ways aggregations can be calculated in Telco Network Cloud Manager -
Performance, depending on the field and aggregation type that is used. Aggregation types and computation of aggregation for complex metrics are introduced.
To apply the before time aggregator and after time aggregator in analytics where the resource type level rollup is intended, you can define a UDC metric with the formula
and the aggregator at the same level as the metric. This UDC metric can then be used in a batch job or stream, which is rolled up to the expected level.
Metrics
metrics are fields that are based on a raw data count.
After time aggregation and after entity aggregation
After time aggregation
Before time aggregation
Aggregation properties
The behavior of time and entity aggregators change depending on the values of some properties.
Metrics
metrics are fields that are based on a raw data count.
The list of possible aggregation types for metric fields is shown in the following table.
Table 1. Metric aggregation types
Name Time
Aggregator
Entity
Aggregator Comment
Sum Sum Sum Sum - the sum of all values.
Average Average Average Average - the mean average value.
Max Max Max Max - the maximum value.
Min Min Min Min - the minimum value.
NULL Null Null Null - no aggregation. Used to prevent any kind of aggregation from occurring. As a result, reports show no
summary values for fields of this aggregation type.
Count Count Count Count - number of non-null values.
Complex metrics
Complex metrics (Analytic and UDC) are fields that are based on more than one counter or an expression.
Complex metrics
Complex metrics (Analytic and UDC) are fields that are based on more than one counter or an expression.
The list of possible aggregation types for use with Analytic and UDC are listed in the following table.
Table 1. Analytic and UDC aggregation types
Name Time Aggregator Entity Aggregator
Average Average Average
AvgMax Average Max
AvgMin Average Min
AvgNull Average Null
AvgSum Average Sum
Count Count Count
Max Max Max
MaxAvg Max Average
MaxMin Max Min
MaxNull Max Null
MaxSum Max Sum
Min Min Min
MinAvg Min Average
MinMax Min Max
MinNull Min Null
MinSum Min Sum
NULL Null Null
NullAvg Null Average
NullMax Null Max
NullMin Null Min
NullSum Null Sum
Sum Sum Sum
SumAvg Sum Average
SumMax Sum Max
SumMin Sum Min
SumNull Sum Null
Computation for complex metrics
646 IBM Telco Network Cloud Manager - Performance 1.4.5

Computation for complex metrics
When time and entity aggregations are involved, the three different ways to compute aggregation for complex metrics are explained.
Before time aggregation
Before entity aggregation
After entity aggregation
The following examples analyze a complex metric of A/B for the following aggregation types:
SumSum
SumMin
MinSum
MinMin
As Avg and Sum are handled identically, and Min and Max are handled in the same way, these four examples are illustrative of all aggregation types. The following table
and sections and detail how these aggregation types are calculated.
Table 1. Complex metric aggregation example
Entity Timestamp A B A/B A B esum(tsum(A)) / esum(tsum(B))
Raw Raw tsum(A) tsum(B) tsum(A)/tsum(B) tmin(A/B)
Cell1 00:00 80 10 8 120 30 4 2
12:00 40 20 2
Cell2 00:00 40 2 20 60 6 10 5
12:00 20 4 5
Entity Agg 180 36
After time aggregation and after entity aggregation
The following are the list of aggregation types after time and after entity aggregations are applied:
Average,
AvgSum
AvgNull
Count
Null
NullSum
NullAvg
Sum
SumAvg
SumNull
SumSum
In this example, SumSum(A/B) gets expanded into esum(tsum(A))/esum(tsum(B)). A and B get individually summed across time, then (still individually) across
entity. The final values are then divided, as shown in the following steps.
1. Counters summed across time:
Cell 1 Counter A 80 + 40 = 120
Cell 2 Counter A 40 + 20 = 60
Cell 1 Counter B 10 + 20 = 30
Cell 2 Counter B 2 + 4 = 6
2. Counters summed across entity:
Counter A 120 + 60 = 180
Counter B 30 + 6 = 36
3. The following computation is the after time aggregation and after entity aggregation:
180/36 = 5
After time aggregation
After time aggregation applies to the following aggregation types:
AvgMin
SumMin
NullMin
AvgMax
SumMax
NullMax
SumMin
IBM Telco Network Cloud Manager - Performance 1.4.5 647

In this example, SumMin(A/B) gets expanded into emin(tsum(A)/ tsum(B)). A and B get individually summed across time. The two values then get divided for each
cell, and the minimum of all values is returned:
1. Counters summed across time:
Cell 1 Counter A: 80 + 40 = 120
Cell 2 Counter A: 40 + 20 = 60
Cell 1 Counter B: 10 + 20 = 30
Cell 2 Counter B: 2 + 4 = 6
2. Computation after time aggregation:
Cell 1 120/30 = 4, Cell 2 60/6 = 10. The minimum value = 4.
Before time aggregation
Before time aggregation applies to the following aggregation types:
MinAvg
MinMax
MinSum
MinNull
Min
MaxAvg
MaxMin
MaxSum
MaxNull
Max
MinSum
In this example, MinSum(A/B) gets expanded into esum(tmin(A/B)). Because the time aggregation is min, computation happens immediately before time aggregation.
A and B get divided for each cell/time interval. The lowest value for each cell is then selected, and all selected values are summarized across cells:
1. Computation before time aggregation:
a. A and B divided for each cell/time interval:
Cell 1 at 00:00 A/B: 80/10 = 8
Cell 1 at 12:00 A/B: 40/20 = 2
Cell 2 at 00:00 A/B: 40/2 = 20
Cell 2 at 12:00 A/B: 20/4 = 5
2. Minimum values summarized across cells: Cell 1 = 2 Cell 2 = 5, 2 + 5 = 7
Min
In this example, Min(A/B) gets expanded into emin(tmin(A/B)). Because the time aggregation is min, computation happens immediately before time aggregation. A
and B get divided for each cell/time interval. The lowest value for each cell is then selected, and then the minimal value across all cells is returned.
1. Computation before time aggregation:
a. A and B divided for each cell or time interval:
Cell 1 at 00:00 A/B: 80/10 = 8
Cell 1 at 12:00 A/B: 40/20 = 2
Cell 2 at 00:00 A/B: 40/2 = 20
Cell 2 at 12:00 A/B: 20/4 = 5
b. Minimum values that are selected across cells: Cell 1 = 2 Cell 2 = 5
c. Minimum value across all cells returned: 2
Aggregation properties
The behavior of time and entity aggregators change depending on the values of some properties.
force-sum-summarisation
force-override-counter-timeaggregator
By default, these properties are set to False. If these properties are set to True, consider these points.
force-sum-summarisation
For complex metrics (UDCs) with more than one counter or an expression, all aggregators are ignored and the aggregator Sum is used instead.
force-override-counter-timeaggregator
Overrides the aggregation in a counter. For complex metrics (UDCs), the counter aggregators are ignored and the complex metrics (UDCs) aggregator is used.
Note: These parameters must be set in the yaml file of analytics-stream Service.
Configuring Flow devices
Provides the command reference with examples for configuring the flow devices to enable them to work with IBM® Telco Network Cloud Manager - Performance, version
1.4.5.
648 IBM Telco Network Cloud Manager - Performance 1.4.5

Before Telco Network Cloud Manager - Performance can gather data, routers and other network devices must be configured to send NetFlow data. These configurations
are needed to ensure that routers send NetFlow data periodically to the Collector subsystem.
For more detailed information about setting up flow devices for Telco Network Cloud Manager - Performance, see the specific vendor documentation.
CAUTION:
Only IT administrators with experience in configuring routers and switches must use this information.
Supported devices and flow formats
IBM Telco Network Cloud Manager - Performance, version 1.4.5 supports most of the devices and their flow formats that are available in the market.
Configuring NetFlow on Cisco routers
Netflow is a data collection and reporting protocol for monitoring network traffic that is supported by multiple vendors.
Configuring flow on Juniper devices
Provides commands and examples to configure J-Flow on an SRX Series device.
Configuring NetStream traffic on Huawei devices
Huawei devices support NetStream flow, which is a supported flow type in Telco Network Cloud Manager - Performance.
Supported devices and flow formats
IBM® Telco Network Cloud Manager - Performance, version 1.4.5 supports most of the devices and their flow formats that are available in the market.
Some of devices and their flow formats that Telco Network Cloud Manager - Performance supports:
Device Flow format
Cisco NetFlow (v1, v5, v9, and IPFIX versions) and Flexible NetFlow with AVC, sFlow v5
Juniper J-Flow (v5 and v9), sFlow v5
Alcatel Cflow (v5 and v9), sFlow v5
Huawei NetStream (v5 and v9), sFlow v5
Related information
sFlow Network equipment
Configuring NetFlow on Cisco routers
Netflow is a data collection and reporting protocol for monitoring network traffic that is supported by multiple vendors.
As a part of this configuration, network administrators must configure the devices to transmit NetFlow information actively to the network monitoring application and
configure the interfaces to gather information about the traffic conversations. The configurations that you perform must be in line with the capacity of the network
application. In this case, Telco Network Cloud Manager - Performance.
NetFlow also monitors layers 2-4 of Open Systems Interconnection (OSI) model and other flow technologies and provides information on network usage and port
conversations activity.
Cisco IOS command modes
You use the CLI to access Cisco IOS software.
Configuring Flexible NetFlow and Application Visibility and Control (AVC)
Use these configuration steps to enable your devices for the mandatory Flow fields and the enterprise Flow fields to support AVC solution.
Enabling NetFlow on your devices
To enable NetFlow, configure IP routing and use these commands in global configuration mode.
Configuring the Flow Exporters
NetFlow information can also be exported to network management applications.
Customizing the number of entries in flow cache
You can increase or decrease the number of entries that are maintained in the cache to meet your NetFlow traffic rates. The number of entries can be 1024 -
524288. The default is 65536.
Monitoring NetFlow information
Use these commands to verify whether the NetFlow data export is functioning and displaying the data.
An example Cisco device configuration
Cisco device configuration.
Related information
Cisco IOS Configuration Fundamentals Command Reference, Release 12.2
Cisco IOS command modes
You use the CLI to access Cisco IOS software.
Enter a question mark (?) at the CLI prompt to obtain a list of commands that are available for each command mode.
When you log in to the CLI, you are in user EXEC mode. User EXEC mode contains only a limited subset of commands. To have access to all commands, you must enter
privileged EXEC mode, normally by using a password. From privileged EXEC mode, you can give any EXEC command; user or privileged mode. Or, you can enter global
IBM Telco Network Cloud Manager - Performance 1.4.5 649

configuration mode.
These configuration modes are needed for you to change the running configuration. If you later save the running configuration to the start configuration, these changed
commands are stored when the software is rebooted. To enter specific configuration modes, you must start at global configuration mode. From global configuration mode,
you can enter interface configuration mode and various other modes, such as protocol-specific modes.
Command modes
Describes how to use various common command modes of the Cisco IOS software.
Command modes
Describes how to use various common command modes of the Cisco IOS software.
Command modes
Shows examples of the prompts displayed.
Command mode Command
User Exec
When you log in to the CLI, you are in User Exec mode. Contains only a limited subset of commands.
Router>
Privileged Exec
You can have access to all commands in this mode. Typically, require a password. Use the enable command. Your
prompt changes to Router#.
Router> enable
Password <password>
Router#
Global configuration
Enter the configure terminal privileged EXEC command to enter global configuration mode. Your prompt changes to
Router(config)#.
Router# configure terminal
Router(config)#
Note: Enter configuration commands, one per line.
End with CTRL+Z or Exit command.
Interface configuration
From global configuration mode, specify an interface by using an interface command. Your prompt changes to
Router(config_if)#.
Note: Enter "?" to display what you must enter next on the command line.
Router(config)# interface serial ?
<0-6> Serial interface number
Router(config)# interface serial 4 ?
/
Router(config)# interface serial 4/ ?
<0-3> Serial interface number
Router(config)# interface serial 4/0
Router(config-if)#
ROM monitor mode
ROM monitor mode is a separate mode that is used when the Cisco IOS software cannot load properly. From
privileged EXEC mode, use the reload EXEC command. Your prompt changes to rommon #>.
Router# reload
>
Configuring Flexible NetFlow and Application Visibility and Control (AVC)
Use these configuration steps to enable your devices for the mandatory Flow fields and the enterprise Flow fields to support AVC solution.
About this task
AVC is integrated approach that provides application recognition and performance monitoring capabilities to your NetFlow enabled devices. The information that is
collected by Cisco AVC is exported in an open standard format such as Netflow Version 9 and IPFIX. These formats allow both Cisco and third-party network management
to support Cisco AVC solution.
The following Cisco AVC solution components are supported in Telco Network Cloud Manager - Performance:
Network-Based Application Recognition (NBAR)
Next Generation Network-Based Application Recognition (NBAR2)
Application Response Time (ART)
Quality of Service (QoS)
Configuring standard Flow fields
The flow record defines the record fields that must be exported from the device to the collector.
Configuring Quality of Service (QoS) on Cisco devices
QoS provides prioritization and rate-limiting of traffic. High-priority, latency-sensitive traffic can be put into the priority queue.
Configuring Application Response Time (ART) on Cisco devices
ART metrics are extracted or calculated by the ART engine. These metrics are available only for TCP flows.
Related information
Configuration Examples for Flexible Netflow
Configuring standard Flow fields
The flow record defines the record fields that must be exported from the device to the collector.
650 IBM Telco Network Cloud Manager - Performance 1.4.5

About this task
Standard Flow fields configuration.
Procedure
1. Configure to specify where the Flow data must be exported to:
configure terminal
flow exporter <NPI_exporter>
destination 100.100.10.10
source GigabitEthernet0/3
transport udp 2050
export-portocol netflow-v9
# Configure this option template to support application id to name and description mapping
option application table
# Configure if required to support NBAR2 for application attributes
option application attributes
exit
2. Configure the Flow record to collect the Flow fields:
Note: This example is for NetFlow V9 records.
configure terminal
flow record type performance-monitor Netflow_v9
match ipv4/ipv6 tos
match ipv4/ipv6 protocol
match ipv4/ipv6 source address
match ipv4/ipv6 destination address
match transport source-port
match transport destination-port
match interface input
match application name
collect interface output
collect counter bytes
collect counter packets
collect flow direction
collect routing source as
collect routing destination as
collect routing next-hop address ipv4
collect transport tcp flags
collect timestamp sys-uptime first
collect timestamp sys-uptime last
exit
3. Configure the Flow monitor that creates new NetFlow cache and the required Flow record and Flow Exporter:
configure terminal
flow monitor <NPI_monitor>
description Netflow v9 monitor
record Netflow_v9
exporter <NPI_exporter>
exit
4. Configure to apply the Flow Monitor to an interface:
configure terminal
interface GigabitEthernet0/3
ip flow monitor <NPI_monitor> input
ip flow monitor <NPI_monitor> output
exit
Related information
Cisco IOS Flexible NetFlow Command Reference
Configuring Quality of Service (QoS) on Cisco devices
QoS provides prioritization and rate-limiting of traffic. High-priority, latency-sensitive traffic can be put into the priority queue.
About this task
QoS Flow fields configuration.
Procedure
1. Configure to specify where the Flow data must be exported to:
configure terminal
IBM Telco Network Cloud Manager - Performance 1.4.5 651

flow exporter <NPI_monitor>
destination 100.100.10.10
source GigabitEthernet0/3
transport udp 2050
export-portocol netflow-v9
option application table
# NBAR fields to support application id to name and description mapping
option application attributes
[Configure if required to support NBAR2 for application attributes
option c3pl-policy-table
# Configure if required to support QoS HIeararchy and Queue Drops reporting
option c3pl-class-table
# Configure if required to support QoS HIeararchy and Queue Drops reporting
exit
2. Configure the Flow record to collect the QoS fields:
configure terminal
flow record type performance-monitor Netflow_v9
match ipv4/ipv6 tos
match ipv4/ipv6 protocol
match ipv4/ipv6 source address
match ipv4/ipv6 destination address
match transport source-port
match transport destination-port
match interface input
match application name
collect interface output
collect counter bytes
collect counter packets
collect flow direction
collect routing source as
collect routing destination as
collect routing next-hop address ipv4
collect transport tcp flags
collect policy qos class hierarchy
collect policy qos queue id
collect timestamp sys-uptime first
collect timestamp sys-uptime last
exit
a. Configure the QoS Queue Drops field collection:
Note: QoS Queue Drops must be configured in a separate Flow record as mandated by Cisco. See AVC Configuration.
configure terminal
flow record type performance monitor QoS_Queue_Drop
match policy qos queue index
collect policy qos queue drops
collect interface output
collect timestamp absolute monitoring-interval start
collect timestamp absolute monitoring-interval end
exit
3. Configure the Flow monitor that creates new NetFlow cache and the required Flow record and Flow Exporter:
configure terminal
flow monitor <NPI_monitor>
description Netflow v9 monitor
record Netflow_v9
exporter <NPI_monitor>
exit
a. Configure the QoS monitor:
configure terminal
flow monitor type performance-monitor <qos_Monitor>
exporter <NPI_exporter>
record QoS_Queue_Drop
exit
b. Configure to create Performance Monitor Policy for QoS:
Note: Ensure that the required QoS policies and classes are defined. See AVC Configuration.
configure terminal
policy-map type performance monitor pm-qos
class class-default
flow monitor qos-monitor
exit
4. Configure to apply the Flow Monitor to an interface:
configure terminal
interface GigabitEthernet0/3
ip flow monitor NPI_monitor input
ip flow monitor NPI_monitor output
service-policy type performance monitor output pm-qos
exit
652 IBM Telco Network Cloud Manager - Performance 1.4.5

Configuring Application Response Time (ART) on Cisco devices
ART metrics are extracted or calculated by the ART engine. These metrics are available only for TCP flows.
About this task
ART Flow fields configuration.
Procedure
1. Configure to specify where the Flow data must be exported to:
configure terminal
flow exporter <NPI_exporter>
destination 100.100.10.10
source GigabitEthernet0/3
transport udp 2050
export-portocol netflow-v9
option application table
option application attributes
exit
2. Configure a separate Flow record template for Application Response Time (ART) configuration as ART records contain bi-directional data:
configure terminal
flow record type performance-monitor ART_record
match ipv4/ipv6 protocol
match application name
match connection client ipv4 address
match connection server ipv4 address
match connection server transport port
collect ipv4/ipv6 dscp
collect interface input
collect interface output
collect timestamp sys-uptime first
collect timestamp sys-uptime last
collect connection delay network to-server max
collect connection delay network to-client max
collect connection delay application max
collect connection delay response client-to-server
3. Configure the Flow monitor that creates new NetFlow cache and the required Flow record and Flow Exporter:
configure terminal
flow monitor type performance-monitor ART-monitor
exporter NPI_exporter
record ART_record
exit
4. Create the Performance Monitor Policy:
configure terminal
policy-map type performance monitor ART
class class-default
flow monitor ART-monitor
5. Associate the Performance Monitor to an interface:
configure terminal
interface <interface>
service-policy type performance monitor output ART
Enabling NetFlow on your devices
To enable NetFlow, configure IP routing and use these commands in global configuration mode.
About this task
Enabling flow monitoring for an interface.
Command Description
Router(config)# interface type
slot/port-adapter/port Enters interface configuration mode and configures the interface.
For example, interface GigabitEthernet1/0/3
Router(config-if)# ip route-cache flow Enables NetFlow for IP routing.
Router(config-if)# ip route-cache ingress
Router(config-if)# ip route-cache egress
Router(config-if)# ip flow egress
Router(config-if)# ip flow ingress
Enables NetFlow on the sub interfaces with direction.
IBM Telco Network Cloud Manager - Performance 1.4.5 653

Configuring the Flow Exporters
NetFlow information can also be exported to network management applications.
About this task
To configure a router to export NetFlow information that is maintained in the NetFlow cache to Telco Network Cloud Manager - Performance, use these commands in
global configuration mode. NetFlow information is exported to Telco Network Cloud Manager - Performance when the Flow expires in NetFlow cache.
Command Description
Router(config)# ip flow-export
ip-address udp-port
Where
<IP_address>
IP address of the system to which
you want to send the NetFlow
information.
udp-port
UDP protocol-specific port
number.
Configures a router to export NetFlow cache entries to a Collector.
Note: To disable IP routing, use the no IP routing command as: no ip flow-export.
Router(config)# ip flow-export
version 9 [peer-as | origin-as
| bgp-nexthop]
Specifies that the export packet uses the Version 9 format. Optionally, specify the origin or peer autonomous systems.
peer-as
Specifies that export statistics include the originating autonomous system for the source and destination.
origin-as
Specifies that export statistics include the peer autonomous system for the source and destination.
bgp-nexthop
Specifies that export statistics include BGP next hop-related information.
show ip flow export Displays statistics for the NetFlow data export, including statistics for the main cache and for all other enabled caches.
Router(config)# ip flow-export
source
<interface>/<interface_number>
Sets the source IP address of the NetFlow exports that are sent by the device to the specified IP address.
Router(config)# ip flow-cache
timeout active 1 Active timeout is the frequency of active flow records that are exported from the flow cache to Telco Network Cloud Manager -
Performance. Default value is 30 min. To get real-time traffic reports, set this value to 1.
Router(config)# ip flow-cache
timeout inactive 15 Inactive timeout is the frequency of inactive flow records that are exported from the flow cache to Telco Network Cloud
Manager - Performance. A flow record is inactive when the conversation between two interfaces is stopped. Default value is
15 sec.
Related information
Configuring NetFlow and NetFlow Data Export
Customizing the number of entries in flow cache
You can increase or decrease the number of entries that are maintained in the cache to meet your NetFlow traffic rates. The number of entries can be 1024 - 524288. The
default is 65536.
About this task
Command Description
Router(config)# ip flow-cache
entries <number>
Changes the number of entries that are maintained in the NetFlow cache.
CAUTION:
Improper use of this feature might cause network problems. To return to the default NetFlow cache entries, use the no ip
flow-cache entries in global configuration mode.
Monitoring NetFlow information
Use these commands to verify whether the NetFlow data export is functioning and displaying the data.
About this task
Command Description
Router# show ip flow export Displays information about NetFlow flow exporters and statistics.
Router# show flow exporter <exporter_name> Displays the statistics of the specified Flow Exporter.
654 IBM Telco Network Cloud Manager - Performance 1.4.5

Command Description
Router# show ip flow interface Displays NetFlow accounting configuration on interfaces.
Router# show ip interface Displays the usability status of interfaces that are configured for IP.
Router# show ip cache flow Displays the NetFlow statistics such as:
IP packet size distribution
IP flow cache information
Flow information; protocol, total flow, flows per second
Router# clear ip flow stats Clears the NetFlow statistics.
An example Cisco device configuration
Cisco device configuration.
configure terminal
interface serial 3/0/0
ip route-cache flow
exit
ip flow-export 127.1.0.0 0 version 5 peer-as
exit
clear ip flow stats
Router# show ip cache flow
The output is as shown:
IP packet size distribution (230151 total packets):
1-32 64 96 128 160 192 224 256 288 320 352 384 416 448 480
.999 .000 .000 .000 .000 .000 .000 .000 .000 .000 .000 .000 .000 .000 .000
512 544 576 1024 1536 2048 2560 3072 3584 4096 4608
.000 .000 .000 .000 .000 .000 .000 .000 .000 .000 .000
Configuring flow on Juniper devices
Provides commands and examples to configure J-Flow on an SRX Series device.
Command modes
Command mode Description
Operational mode
When you log in to the router and type
the CLI command, you are
automatically in operational mode:
user@host>
This mode displays the status of the device. In operational mode, you enter commands to monitor and troubleshoot the Junos
OS, devices, and network connectivity.
Configuration mode
user@host>configure
user@host#
To exit the mode, give the following
commands:
user@host# commit and-quit
commit complete
user@host
To exit without commit:
user@host# exit
Exiting configuration mode
user@host>
A configuration for a device that is running on Junos OS is stored as a hierarchy of statements. In configuration mode, you enter
these statements to define all properties of the Junos OS, including interfaces, general routing information, routing protocols,
user access, and several system and hardware properties.
Active Flow monitoring
Flow monitoring versions 5, 8, and 9 support active flow monitoring. For active flow monitoring, the monitoring station participates in the network as an active router. A
router performs the following actions during active Flow monitoring:
Sampling
The router selects and analyzes only a portion of the traffic.
Sampling with templates
The router selects, analyzes, and arranges a portion of the traffic into templates.
Sampling per sampling instance
The router selects, analyzes, and arranges a portion of the traffic according to the configuration and binding of a sampling instance.
Port mirroring
The router copies entire packets and sends the copies to another interface.
IBM Telco Network Cloud Manager - Performance 1.4.5 655

Multiple port mirroring
The router sends multiple copies of monitored packets to multiple export interfaces with the next-hop-group statement at the (edit forwarding-options)
hierarchy level.
Discard accounting
The router accounts for selected traffic before it discards. Such traffic is not forwarded out of the router. Instead, the traffic is quarantined and deleted.
Flow-tap processing
The router processes requests for active flow monitoring dynamically by using the Dynamic Tasking Control Protocol (DTCP).
Some of the commands for these actions are described here.
Configuring J-Flow versions 5 and 8
Commands to configure J-Flow versions 5 and 8.
Configuring J-Flow version 9
Commands to configure J-Flow versions 9.
Configuring J-Flow version 9 for SRX-DataCenter devices
Commands to configure J-Flow versions 9 for SRX-DataCenter devices.
Using the show commands
Describes the possible show command options in configuration mode and Operational mode.
Related information
Flow Monitoring Feature Guide for Routing Devices
Active Flow Monitoring Overview
Configuring J-Flow versions 5 and 8
Commands to configure J-Flow versions 5 and 8.
About this task
Commands Description
user@host# set interfaces
ge-0/0/0 unit 0 family
inet sampling input
user@host# set interfaces
ge-0/0/0 unit 0 family
inet sampling output
Enables sampling on one or more interfaces and specify the direction.
user@host# set forwarding-
options sampling
input rate 100
Specifies the sampling rate.
CAUTION:
Caution: Activation of flow collection can have a significant impact on the performance of the SRX Series device. The smaller the
sample rate, the bigger the impact. It is recommended to not use a sampling input rate of 1.
Where:
forwarding-options
Starts the inline J-Flow configuration, so that the sampling and the J-Flow service thread are implemented in the
forwarding engine.
sampling
Configures the J-Flow packet sampling options.
input
Enables sampling.
rate
Specifies the ratio of packets to be sampled.
user@host# set forwarding-
options sampling family
inet output flow-server
10.10.10.1 port 2056
Specifies the UDP port number of the host that is collecting cflowd packets.
user@host# set forwarding-
options sampling family
inet output flow-server
10.10.10.1 version 5
Specify the version format 5.
Related information
SRX Getting Started - Configure J-Flow
Configuring J-Flow version 9
Commands to configure J-Flow versions 9.
About this task
656 IBM Telco Network Cloud Manager - Performance 1.4.5

Commands Description
user@host# set services flow-monitoring
version9
template v4
flow-active-timeout 30
user@host# set services flow-monitoring
version9
template v4 flow-inactive-timeout 30
user@host# set services flow-monitoring
version9
template v4 <ipv4-template>
Configures the J-Flow v9 template.
Note: Currently, the IPv4 template is supported.
user@host# set forwarding-options
sampling
input rate 100
user@host# set forwarding-options
sampling
input run-length 0
Specifies the sampling rate and run length.
user@host# set forwarding-options
sampling
family inet output flow-server
<IP_add> port 2222
user@host# set forwarding-options
sampling
family inet output flow-server
<IP_address>
version9 template <template_name>
Configures the external flow collector and its port number.
Note: The J-Flow v9 template is associated with the external flow collector. Up to eight flow collectors can be
simultaneously configured.
user@host# set forwarding-options
sampling
user@host# set forwarding-options
sampling input
user@host# set forwarding-options
sampling output
family inet output inline-jflow source-
address
<IP_address>
Configure the inline-jflow, so that the sampling and the J-Flow service thread are implemented in the forwarding
engine.
user@host# set interfaces ge-0/0/14 unit
0 family
inet sampling input
user@host# set interfaces ge-1/0/0 unit
0 family
inet sampling output
user@host# set interfaces ge-0/0/14 unit
0 family
inet address <IP_address>/24
Configure the sampling filter on an interface (or interfaces) in the direction, on which the J-Flow service is
required.
user@host# show interfaces descriptions Displays all the configured interfaces.
Configuring the sampling instance
You can configure active sampling by using a sampling instance and associate that sampling instance to a particular Packet Forwarding Engine. In addition, you can
define multiple sampling instances that are associated with multiple destinations (as many as the number of Packet Forwarding Engines in the chassis), with
multiple protocol families per each sampling instance destination.
Related information
Juniper Flow Monitoring
Configuring the sampling instance
You can configure active sampling by using a sampling instance and associate that sampling instance to a particular Packet Forwarding Engine. In addition, you can define
multiple sampling instances that are associated with multiple destinations (as many as the number of Packet Forwarding Engines in the chassis), with multiple protocol
families per each sampling instance destination.
About this task
set chassis fpc 0 sampling-instance s0
set interfaces ge-0/1/0 unit 0 family inet sampling input
set interfaces ge-0/1/0 unit 0 family inet address
set interfaces ge-1/0/0 unit 0 family inet address
set interfaces sp-2/0/0 unit 0 family inet
set forwarding-options sampling instance s0 input rate 1
set forwarding-options sampling instance s0 input run-length 0
set forwarding-options sampling instance s0 family inet output
flow-server 2.2.2.2 port 2055
set forwarding-options sampling instance s0 family inet output
flow-server 2.2.2.2 version9 template v4;
set forwarding-options sampling instance s0 family inet output
interface sp-2/0/0 source-address 1.1.1.1
set routing-options static route 50.0.0.0/8 next-hop 20.0.0.2
set services flow-monitoring version9 template v4 flow-active-timeout 30
set services flow-monitoring version9 template v4 flow-inactive-timeout 30
set services flow-monitoring version9 template v4 ipv4-template
IBM Telco Network Cloud Manager - Performance 1.4.5 657

Related information
Example: Sampling Instance Configuration
Configuring J-Flow version 9 for SRX-DataCenter devices
Commands to configure J-Flow versions 9 for SRX-DataCenter devices.
About this task
Commands Description
user@host# set services flow-monitoring
version9
template <template_name>
Configures the J-Flow v9 template
user@host# set samplng family inet
output
flow server <flow_collector_ip_add>
port <flow_collector_port>
version9 template <template_name>
Configures external flow collector, in this case, Telco Network Cloud Manager - Performance Collector.
user@host# set forwarding-options
sampling
instance <instance1>
input rate 100
user@host# set forwarding-options
sampling
instance <instance1> input
run-length 0
Specifies the sampling rate.
Note: Currently, IPv4 template is supported.
user@host# set forwarding-options
sampling
instance instance1 family inet
output flow-server <Ip_address> port
2222
user@host# set forwarding-options
sampling
instance instance1 family inet
output flow-server <Ip_address> version9
template <template_name>
Configures the external flow collector and its port address.
Note: The J-Flow v9 template is associated with the external flow collector. Up to eight flow collectors can be
simultaneously configured.
user@host# set forwarding-options
sampling
instance instance1 family inet output
inline-jflow source-address <Ip_address>
Configures the inline-jflow, so that the sampling and the J-Flow service thread are implemented in the
forwarding engine.
user@host# set interfaces ge-0/0/14 unit
0
family inet sampling input
user@host# set interfaces ge-0/0/14 unit
0
family inet address 2.2.2.1/24
Configures the sampling filter on an interface (or interfaces) in the direction, on which the J-Flow service is
required.
Related information
SRX Getting Started - Configure J-Flow
Using the show commands
Describes the possible show command options in configuration mode and Operational mode.
About this task
configure
//To enter a configuration mode
show ?
<[Enter]> Execute this command
> access Network access configuration
> access-profile Access profile for this instance
> accounting-options Accounting data configuration
> applications Define applications by protocol characteristics
+ apply-groups Groups from which to inherit configuration data
> chassis Chassis configuration
> class-of-service Class-of-service configuration
> ethernet-switching-options Ethernet-switching configuration options
> event-options Event processing configuration
> firewall Define a firewall configuration
> forwarding-options Configure options to control packet forwarding
> groups Configuration groups
> interfaces Interface configuration
> multi-chassis
658 IBM Telco Network Cloud Manager - Performance 1.4.5

> multicast-snooping-options Multicast snooping option configuration
> policy-options Policy option configuration
> protocols Routing protocol configuration
> routing-instances Routing instance configuration
> routing-options Protocol-independent routing option configuration
> schedulers Security scheduler
> security Security configuration
> services Set services parameters
> smtp Simple Mail Transfer Protocol service configuration
> snmp Simple Network Management Protocol configuration
> system System parameters
> vlans VLAN configuration
| Pipe through a command
Exit
//To exit the configuration mode
Show
// To run the show command options in User Excec mode
accounting Show accounting profiles and records
arp Show system Address Resolution Protocol table entries
as-path Show table of known autonomous system paths
authentication-whitelist Show 802.1X White List MAC addresses
bfd Show Bidirectional Forwarding Detection information
bgp Show Border Gateway Protocol information
chassis Show chassis information
class-of-service Show class-of-service (CoS) information
cli Show command-line interface settings
configuration Show current configuration
connections Show circuit cross-connect connections
database-replication Show database replication information
dhcp Show Dynamic Host Configuration Protocol information
dhcpv6 Show Dynamic Host Configuration Protocol v6 information
dialer Show dialer information
dot1x Show 802.1X information
dvmrp Show Distance Vector Multicast Routing Protocol information
dynamic-tunnels Show dynamic tunnel information information
esis Show end system-to-intermediate system information
ethernet-switching Show Ethernet-switching information
event-options Show event-options information
firewall Show firewall information
forwarding-options Show forwarding-options information
gvrp Show Generic VLAN Registration Protocol information
helper Show port-forwarding helper information
hfrr Show information related to Host (Direct route) Fast reroute
host Show hostname information from domain name server
iccp Show Inter Chassis Control Protocol information
igmp Show Internet Group Management Protocol information
igmp-snooping Show IGMP snooping information
ingress-replication Show Ingress-Replication tunnel information
interfaces Show interface information
ipv6 Show IP version 6 information
isdn Show Integrated Services Digital Network information
isis Show Intermediate System-to-Intermediate System information
l2circuit Show Layer 2 circuit information
l2vpn Show Layer 2 VPN information
lacp Show Link Aggregation Control Protocol information
ldp Show Label Distribution Protocol information
lldp Show Link Layer Discovery Protocol information
log Show contents of log file
mld Show multicast listener discovery information
mld-snooping Show MLD snooping information
mpls Show mpls information
msdp Show Multicast Source Discovery Protocol information
multicast Show multicast information
mvpn Show Multicast Virtual Private Network (MVPN) information
network-access Show network-access related information
ntp Show Network Time Protocol information
oam Show OAM-related information
ospf Show Open Shortest Path First information
ospf3 Show Open Shortest Path First version 3 information
pfe Show Packet Forwarding Engine information
pgm Show Pragmatic Generalized Multicast information
pim Show Protocol Independent Multicast information
policer Show interface policer counters and information
policy Show policy information
ppp Show PPP process information
pppoe Show PPP over Ethernet information
r2cp Show Radio-to-Router Protocol information
rip Show Routing Information Protocol information
ripng Show Routing Information Protocol for IPv6 information
route Show routing table information
rsvp Show Resource Reservation Protocol information
sap Show Session Announcement Protocol information
schedulers Show the information on one or more schedulers
security Show security information
services Show services
smtp Show Simple Mail Transfer Protocol information
snmp Show Simple Network Management Protocol information
spanning-tree Show Spanning Tree Protocol information
system Show system information
task Show routing protocol per-task information
ted Show Traffic Engineering Database information
tgm Show telephony gateway module information
version Show software process revision levels
IBM Telco Network Cloud Manager - Performance 1.4.5 659

vlans Show VLAN information
vpls Show VPLS information
vrrp Show Virtual Router Redundancy Protocol information
wan-acceleration Show WAN acceleration module information
Verifying the configuration with show commands
To verify that your configuration is correct, use these commands on the monitoring station that is configured for active flow monitoring.
Viewing device configuration
An example configuration for the J-Flow v9 template ipv4-test, flow collector 172.19.101.85 (port 2222) with sampling rate 1:100 and run length as 0.
Verifying the configuration with show commands
To verify that your configuration is correct, use these commands on the monitoring station that is configured for active flow monitoring.
About this task
show services
show services flow-monitoring
show services flow-monitoring version9 template <template_name>
show services accounting errors
show services accounting (flow | flow-detail)
show services accounting memory
show services accounting packet-size-distribution
show services accounting status
show services accounting usage
show services accounting aggregation template template-name
name (detail | extensive | terse)
Most active flow monitoring operational mode commands contain equivalent output information to the following passive flow monitoring commands:
show services accounting errors = show passive-monitoring error
show services accounting flow = show passive-monitoring flow
show services accounting memory = show passive-monitoring memory
show services accounting status = show passive-monitoring status
show services accounting usage = show passive-monitoring usage
The active flow monitoring commands can be used with most active flow monitoring applications, including sampling, discard accounting, port mirroring, and multiple port
mirroring. The following command shows the output of the show commands that are used with the configuration example:
user@router> show services accounting errors
Service Accounting interface: sp-2/0/0, Local interface index: 542
Service name: (default sampling)
Error information
Packets dropped (no memory): 0, Packets dropped (not IP): 0
Packets dropped (not IPv4): 0, Packets dropped (header too small): 0
Memory allocation failures: 0, Memory free failures: 0
Memory free list failures: 0
Memory overload: No, PPS overload: No, BPS overload: Yes
user@router> show services accounting flow-detail limit 10
Service Accounting interface: sp-2/0/0, Local interface index: 468
Service name: (default sampling)
Protocol Source Source Destination Destination Packet Byte
Address Port Address Port count count
udp(17) 10.1.1.2 53 10.0.0.1 53 4329 3386035
ip(0) 10.1.1.2 0 10.0.0.2 0 4785 3719654
ip(0) 10.1.1.2 0 10.0.1.2 0 4530 3518769
udp(17) 10.1.1.2 0 10.0.7.1 0 5011 3916767
tcp(6) 10.1.1.2 20 10.3.0.1 20 1 1494
tcp(6) 10.1.1.2 20 10.168.80.1 20 1 677
tcp(6) 10.1.1.2 20 10.69.192.1 20 1 446
tcp(6) 10.1.1.2 20 10.239.240.1 20 1 1426
tcp(6) 10.1.1.2 20 10.126.160.1 20 1 889
tcp(6) 10.1.1.2 20 10.71.224.1 20 1 1046
user@router> show services accounting memory
Service Accounting interface: sp-2/0/0, Local interface index: 468
Service name: (default sampling)
Memory utilization
Allocation count: 437340, Free count: 430681, Maximum allocated: 6782
Allocations per second: 3366, Frees per second: 6412
Total memory used (in bytes): 133416928, Total memory free (in bytes): 133961744
user@router> show services accounting packet-size-distribution
Service Accounting interface: sp-2/0/0, Local interface index: 468
Service name: (default sampling)
Range start Range end Number of packets Percentage packets
64 96 1705156 100
user@router> show services accounting status
660 IBM Telco Network Cloud Manager - Performance 1.4.5

Service Accounting interface: sp-2/0/0, Local interface index: 468
Service name: (default sampling)
Interface state: Monitoring
Group index: 0
Export interval: 60 secs, Export format: cflowd v5
Protocol: IPv4, Engine type: 55, Engine ID: 5
Route record count: 13, IFL to SNMP index count: 30, AS count: 1
Time set: Yes, Configuration set: Yes
Route record set: Yes, IFL SNMP map set: Yes
user@router> show services accounting usage
Service Accounting interface: sp-2/0/0, Local interface index: 468
Service name: (default sampling)
CPU utilization
Uptime: 4790345 milliseconds, Interrupt time: 1668537848 microseconds
Load (5 second): 71%, Load (1 minute): 63%
Related information
Verifying Your Work
Viewing device configuration
An example configuration for the J-Flow v9 template ipv4-test, flow collector 172.19.101.85 (port 2222) with sampling rate 1:100 and run length as 0.
For example, to view the configuration for the following set commands:
set services flow-monitoring version9 template ipv4-test ipv4-template
set forwarding-options sampling input rate 1
set forwarding-options sampling input run-length 0
set forwarding-options sampling family inet output flow-server 172.19.101.85 port
2222
set forwarding-options sampling family inet output flow-server 172.19.101.85
version9 template ipv4-test
set forwarding-options sampling family inet output inline-jflow source-address
172.19.101.132
set interfaces ge-0/0/14 unit 0 family inet sampling input
set interfaces ge-0/0/14 unit 0 family inet address 23.23.23.1/24
Give this command to view the details:
show configuration
Configuring NetStream traffic on Huawei devices
Huawei devices support NetStream flow, which is a supported flow type in Telco Network Cloud Manager - Performance.
Configuring NetStream export
Huawei NetStream works much like Cisco NetFlow. The NetStream process gathers detailed data about flows and stores them to a cache table. NetStream then
processes the flow data from the cache table and sends it to Telco Network Cloud Manager - Performance for monitoring.
Related information
NetStream Configuration
Configuring NetStream export
Huawei NetStream works much like Cisco NetFlow. The NetStream process gathers detailed data about flows and stores them to a cache table. NetStream then processes
the flow data from the cache table and sends it to Telco Network Cloud Manager - Performance for monitoring.
About this task
There are export options for flow sampling, aggregation, and flow record content depending on how and what you are monitoring and how you need to export and report.
Commands Description
[RouterA] ip NetStream export host <hostname>|
<ip_address> 9996 Enables NetStream on Huawei devices
ip NetStream export source interface <interface_name> Exports the NetStream data to a specified IP address.
[RouterA] ip NetStream sampler inbound 100
[RouterA] ip NetStream sampler outbound 100
Configures global sampling.
[RouterA] interface gigabitethernet 1/0/0
[RouterA-GigabitEthernet1/0/0] ip address
<IP_address1> <IP_address2>
Sets up an interface.
IBM Telco Network Cloud Manager - Performance 1.4.5 661

Commands Description
[RouterA-GigabitEthernet1/0/0] ip NetStream inbound
[RouterA-GigabitEthernet1/0/0] ip NetStream outbound
Enables NetStream statistics on the inbound and outbound interfaces
662 IBM Telco Network Cloud Manager - Performance 1.4.5