Renewable Energy for a Sustainable Future PDF Free Download
1 / 105/105
100%

RENEWABLE ENERGY
FOR A SUSTAINABLE
FUTURE
Part B
2024 Current
Environmental Issue
STUDY RESOURCES

Renewable Energy for a Sustainable Future
Current Environmental Issue Study Resources- Part B
Table of Contents
Key Topic #1: New York State Actions and Goals for Conversion to Renewable Energy…….. 3
Key Topic #2: New York State Clean Energy Goals – Individual and Community Actions ..... 28
Key Topic #3: Social, Environmental, and Economic Impacts of Renewable Energy in NYS .. 73

NCF-Envirothon 2024 New York
Current Issue Part B Study Resources
Key Topic #1: New York State Actions and Goals for Conversion to Renewable Energy
1. Describe the current energy use levels across New York State (NYS) and the potential
to convert to renewable energy sources.
2. Describe the key components in New York State’s strategy to achieve the goal of
reaching 70% renewable energy by 2030.
3. Explain the steps needed to expand the renewable energy sector in New York State
(NYS).
Study Resources
Resource Title Source Located on
New York State Energy Profile-2024 U.S. Energy Information
Administration, April 2024 Page 4-9
Advancing NYS Clean Energy Goals Independent Power Producers of
NY and others, 2022
Pages 10-15
Towards a Clean Energy Future: A Strategic
Outlook 2022 through 2025-Renewable Energy New York State Energy Research
and Development Authority, 2022
Pages 16-18
Solar Data and Energy Storage Project Maps New York State Energy Research
and Development Authority, 2023
Pages 19-20
Pages 21-22
New York State Offshore Wind New York State Energy Research
and Development Authority, 2022
Pages 23-25
NYS Clean Energy Standard New York State Energy Research
and Development Authority, 2022
Pages 26-27
Study Resources begin on the next page!
NYS 30m and 80m Wind Maps and
Wind Rose Instructions
WINDExchange, Office of Energy
Efficiency & Renewable Energy,
US Department of Energy, 2023

New York State Energy Profile
New York Quick Facts
•New York law requires 70% renewable electricity by 2030 and 100% carbon-free electricity from both
renewable sources and nuclear energy by 2040. In 2022, renewable sources and nuclear power combined
supplied 51% of New York's total in-state generation from utility-scale and small-scale facilities.
•Nuclear power accounted for 21% of New York's utility-scale net generation in 2022, down from 34%
in 2019 because the Indian Point nuclear power plant, one of the state's four nuclear power plants, shut
down. The last two reactors at the Indian Point plant shutdown in 2020 and 2021.
•In 2022, New York accounted for 11% of U.S. hydroelectricity net generation, and the state was the
third-largest producer of hydropower in the nation, after Washington and Oregon.
•New York consumes less total energy per capita than the residents in all but one other state, and per
capita energy consumption in New York’s transportation sector is lower than in all other states.
•New York’s per capita energy-related carbon dioxide emissions are consistently lower than those of any
other state in the nation.
Data (Last Update: April 18, 2024)
Demography
New York
Share of U.S.
Period
Population
19.6 million
5.8%
2023
Civilian Labor Force
9.7 million
5.8%
Feb-24
Economy
New York
U.S. Rank
Period
Gross Domestic Product
$ 2,053.2 billion
3
2022
Gross Domestic Product for the
Manufacturing Sector
$ 83,749 million
9
2022
Per Capita Personal Income
$ 78,089
5
2022
Vehicle Miles Traveled
115,382 million miles
6
2022
Land in Farms
6.5 million acres
36
2023
Climate
New York
U.S. Rank
Period
Average Temperature
48.2 degrees Fahrenheit
36
2023
Precipitation
47.0 inches
16
2023
Total Utility-Scale Net Electricity
Generation
New York
Share of U.S.
Period
Total Net Electricity Generation 11,248 thousand MWh
3.0%
Jan-24
Utility-Scale Net Electricity
Generation (share of total)
New York
U.S. Average
Period
Petroleum-Fired
1.0 %
0.4 %
Jan-24
Natural Gas-Fired
47.2 %
42.2 %
Jan-24
Nuclear
21.9 %
18.2 %
Jan-24
Renewables
29.5 %
18.8 %
Jan-24
Fueling Stations
New York
Share of U.S.
Period
Motor Gasoline
4,676 stations
4.2%
2021

Propane
42 stations
1.7%
Mar-24
Electric Vehicle Charging Locations 3,759 stations
6.2%
Mar-24
E85
70 stations
1.6%
Mar-24
Biodiesel, Compressed Natural Gas,
and Other Alternative Fuels 28 stations
1.0%
Mar-24
Summary
New York
U.S. Rank
Period
Total Consumption
3,541 trillion Btu
8
2021
Total Consumption per Capita
178 million Btu
50
2021
Total Expenditures
$ 59,525 million
4
2021
Total Expenditures per Capita
$ 2,998
51
2021
by End-Use Sector
New York
Share of U.S.
Period
Consumption
»Residential
1,108 trillion Btu
5.3%
2021
»Commercial
1,045 trillion Btu
6.0%
2021
»Industrial
367 trillion Btu
1.1%
2021
»Transportation
1,021 trillion Btu
3.8%
2021
by Source
New York
Share of U.S.
Period
Consumption
»Petroleum
237 million barrels
3.3%
2021
»Natural Gas
1,360 billion cu ft
4.2%
2022
Consumption for Electricity
Generation
New York Share of U.S. Period
Petroleum
209 thousand barrels
7.5%
Jan-24
Natural Gas
41,222 million cu ft
3.6%
Jan-24
Energy Source Used for Home
Heating (share of households)
New York U.S. Average Period
Natural Gas
58.4 %
46.2 %
2022
Fuel Oil
16.5 %
3.9 %
2022
Electricity
15.3 %
41.3 %
2022
Propane
5.2 %
5.0 %
2022
Other/None
4.6 %
3.5 %
2022
Renewable Energy Capacity
New York
Share of U.S.
Period
Total Renewable Energy Electricity
Net Summer Capacity
9,386 MW 2.8% Jan-24
Ethanol Plant Nameplate Capacity
62 million gal/year
0.4%
2023
Renewable Energy Production
New York
Share of U.S.
Period
Utility-Scale Hydroelectric Net
Electricity Generation
2,554 thousand MWh 12.0% Jan-24
Analysis (Last Updated: December 21, 2023)

Overview
New York consumes less total energy per capita than all but one other state.
New York is the nation's fourth-most populous state and has the country's third-largest economy. The state's
largest metropolitan area, New York City, is the nation's financial hub and has been the U.S. city with the most
residents in every census since 1790. Although more than two-fifths of the state's population lives in New York
City, the state as a whole is less densely populated than six other states. New York is geographically diverse,
and much of the state is rolling agricultural land and rugged mountains, including those in the Adirondack State
Park, the largest state park in the nation at more than 6 million acres. New York is the nation's 27th largest state
overall and eighth in the amount of its area that is covered by water. Portions of two of the Great Lakes—Lake
Erie and Lake Ontario—are in the state. The Niagara River, with its massive falls, flows between those lakes
and makes the state one of the nation's leading producers of hydroelectric power. The Great Lakes and Atlantic
Ocean shorelines also have some of the state's best wind resources. Solar energy, primarily from small-scale
installations, and biomass provide the state with additional renewable resources. New York produces a small
amount of natural gas and crude oil. New York has one of the most energy-efficient economies in the nation,
and New Yorkers consume less total energy per capita than all other states, except Rhode Island. However, the
state depends on energy supplies from elsewhere to meet nearly four-fifths of its energy needs.
Because New York is a Great Lakes State, its overall energy use increases during winter when arctic winds and
lake-effect snows sweep in from Canada across the state's two Great Lakes. The residential sector accounts for
more than three-tenths of state energy consumption, the commercial sector uses about three-tenths, and the
transportation sector accounts for almost three-tenths. Per capita energy consumption in New York's
transportation sector is lower than in all other states, in part because of the wide use of mass transportation in
New York's densely populated urban areas. In 2022, more than one in five state residents used public transit to
commute to work, seven times the national average. The industrial sector accounts for about one-tenth of state
energy use, a smaller share than in all other states except Maryland and Connecticut. Many of New York's key
economic activities, like finance, real estate, professional and business services, and government, are not
energy-intensive industries.
Electricity
Natural gas, hydropower, and nuclear energy have consistently generated more than 90% of New York’s
electricity during the past decade.
Natural gas, hydropower, and nuclear energy have consistently generated more than 90% of New York's
electricity during the past decade. Renewable resources, including solar energy, from both utility-scale (1
megawatt and larger) and small-scale (less than 1 megawatt) installations, as well as wind and biomass,
provided almost all the rest of New York State's electricity net generation in 2022. Natural gas fuels 6 of the
state's 10 largest power plants by capacity and 5 of the 10 largest by generation. In 2022, natural gas-fired
power plants accounted for almost three-fifths of New York's generating capacity and 47% of New York's total
electricity generation. To increase reliability, especially during the winter months when natural gas pipelines are
highly congested, natural gas-fired electricity generating units with dual-fuel capability can switch fuels in the
event of a natural gas supply disruption. In 2022, about two-thirds of the state's natural gas-fired capacity had
dual-fuel capability, allowing them to also burn petroleum products.
In 2022, renewable resources provided three-tenths of New York's total in-state electricity generation, most of it
from hydroelectric plants. New York is among the nation's top four hydropower producers, and conventional
hydroelectricity typically supplies between one-fifth and one-third of New York's in-state power generation. In
2022, hydropower provided more than 21% of the state's total generation, surpassing nuclear power for the first
time, in large part because nuclear power's share of New York's in-state electricity generation declined when
one of the state's four nuclear power plants closed. The state's remaining three nuclear power plants have about
3,300 megawatts of generating capacity, down from more than 5,350 megawatts four years earlier. In 2022,
nuclear power supplied almost 21% of the state's electricity generation.
Conventional hydroelectric power combined with other renewable resources, including small-scale solar power,
wind, and biomass, have supplied a larger share of the state's total generation than nuclear power has in every
year since 2020. In 2022, solar, wind, and biomass alone provided almost one-tenth of the state's total electricity
generation The amount of electricity generated at in-state utility-scale and small-scale (less than 1 megawatt)
solar photovoltaic (PV) installations increased substantially during the past decade and exceeded the amount
generated from biomass for the first time in 2019. In 2022, solar energy also accounted for a larger portion of
the state's total generation than wind for the first time.
Petroleum is used sparingly as a backup fuel at dual-fueled natural gas-fired electricity generating facilities. In
2022, petroleum fueled slightly more than 1% of the state's total net generation. Coal, which accounted for 16%
of the state's electricity net generation two decades ago, no longer fuels any of New York's in-state net
generation. The state's last coal-fired power plant closed in 2020. In 2022, New York was one of the six states
that did not have any utility-scale coal-fired electricity generation.
Electricity in New York State usually flows east and south toward the state's high-demand areas in the New
York City and Long Island regions. The state typically needs more power than it generates, and New York
receives additional electricity supply from neighboring states and Canada. However, per capita electricity
consumption in New York is among the lowest in the nation; only Hawaii, California, and Rhode Island are
lower. The commercial sector accounts for about half of the state's electricity consumption. The residential
sector, where only one in seven households heat with electricity and about one in five have central air
conditioning, uses more than one-third. The industrial sector consumes slightly more than one-tenth and the
transportation sector uses the rest. In 2022, New York's transportation sector, which consists of its extensive
public rail systems, accounted for about two-fifths of the nation's total transportation sector electricity use. The
state also has almost 3,600 public access electric vehicle charging locations.
Renewable energy
New York's 2,500-megawatt Robert Moses Niagara power plant is the nation’s third-largest conventional
hydroelectric power plant.
New York generates more power from renewable resources than any other state east of the Mississippi River. In
2022, the state ranked seventh in the nation in renewable-sourced electricity generation from utility-scale (1
megawatt and larger) and small-scale (less than 1 megawatt) installations combined. About three-tenths of New
York's total net generation, including small-scale facilities, was from renewable resources, most of it was
provided by hydroelectric plants.
New York is consistently among the nation's top four producers of hydroelectricity. In 2022, New York
produced more hydroelectric power than all but two other states, Washington and Oregon, accounting for about
21% of New York's total in-state power generation. The 2,500-megawatt Robert Moses Niagara hydroelectric
power plant at Lewiston near Niagara Falls produces the largest share of New York's hydropower. The plant is
the third-largest conventional hydroelectric power plant by capacity and the fourth-largest hydropower plant of
any kind in the United States. The associated Lewiston pumped-storage hydroelectric plant, with 12 pump
turbines and a 1,900-acre storage reservoir, operates during periods of peak power demand to supplement power
from the Robert Moses plant.
In 2022, New York ranked third in the nation in electricity generation from small-scale solar.

Solar energy accounted for 4% of New York's total power generation in 2022. About two-thirds of the state's
solar generation was from small-scale systems with capacities of less than 1 megawatt each. New York
encourages small-scale solar photovoltaic (PV) installations, such as rooftop solar panels, with net metering and
a variety of financial support programs. In 2022, the state ranked third in the nation in electricity generation
from small-scale solar. There are also more than 400 utility-scale solar PV installations in New York, but most
of them have capacities of less than 20 megawatts. However, there are 10 large solar facilities in the state with
capacities of 20 megawatts or more. By September 2023, New York had about 4,400 megawatts of solar PV
capacity at utility-scale and small-scale installations.
New York's wind-powered electricity generation was surpassed by solar for the first time in 2022. Wind is now
the state's third-largest source of renewable electricity generation. In 2022, wind accounted for 3.6% of New
York's total net generation and about 12% of the state's electricity from renewables. As of September 2023,
New York had more than 2,500 megawatts of wind capacity at 32 utility-scale wind farms. New York's
additional onshore wind energy potential is located primarily at the eastern end of the state's Great Lakes, along
the Long Island shoreline, and on the ridges in the Adirondack Mountains and the Catskill Mountains.
However, the state's highest peaks are in state parks where wind development is restricted. New York also has
offshore wind resources off Long Island and in the two Great Lakes. The state mandated the deployment of at
least 9,000 megawatts of offshore wind capacity by 2035, and several offshore wind energy projects are in
development, but some are facing economic challenges.
Although biomass fueled only about 1.5% of New York's total net generation in 2022, the state ranked ninth in
the amount of electricity generated from biomass. Municipal solid waste facilities account for almost three-
fifths of the state's biomass-generating capacity. New York has many smaller landfill gas-fueled generators
across the state, accounting for one-fourth of the state's biomass-generating capacity. New York's two utility-
scale wood- and wood waste-fueled facilities account for about one-sixth of the state's biomass-generating
capacity. However, in 2022, the wood-fueled power plants contributed almost three-tenths of the state's
biomass-fueled generation. New York has other biomass and biofuel resources that are used for purposes other
than electricity generation. The state has five wood pellet plants that have a combined manufacturing capacity
of about 303,000 tons of pellets each year. Wood pellets are used for heating as well as for electricity
generation.
Although some fuel ethanol is produced in New York, in 2021 the state consumed nine times more than it
produced. New York's only fuel ethanol production plant has a capacity of about 62 million gallons per year. In
2021, the state consumed about 542 million gallons of fuel ethanol, the fourth-largest amount of any state.
Typically, fuel ethanol produced in the Midwest and imports from overseas arrive through New York Harbor
for distribution throughout the state and beyond. New York does not have any biodiesel production, but the
state was the nation's sixth-largest biodiesel consumer in 2021. Biodiesel consumption per capita, however, was
less than in half of the states.
In July 2019, New York enacted the Climate Leadership and Community Protection Act (CLCPA) also called
the Climate Act, which requires 70% renewable electricity by 2030 and 100% carbon-free electricity by 2040.
The legislation also calls for 100% economy-wide net-zero carbon emissions by 2050. Existing nuclear power
plants in the state are considered zero-emission resources. Facilities that are not technically capable of
eliminating all carbon emissions can purchase carbon offsets to meet a portion of the required 100% net-zero
goal. The offsets must be from nearby sources that reduce carbon, such as forests and agriculture. New York's
per capita energy-related carbon dioxide emissions are consistently lower than those of any other state in the
nation.
Petroleum
New York is one of the nation’s largest petroleum consumers, but the state consumes less petroleum per capita
than any other state.
Despite a long history of crude oil production, New York currently has no significant proved reserves and
produces only a small amount of crude oil. The small amount of crude oil currently produced in New York is
shipped to out-of-state refineries.
Crude oil refineries in New Jersey and Pennsylvania, refined product pipelines from the Gulf Coast and the
Midwest, and imports, mostly from Canada, provide the petroleum products consumed in New York.
With its large population, New York is one of the nation's largest consumers of petroleum overall, but the state
uses less petroleum per capita than any other state. The transportation sector uses more than three-fourths of the
petroleum consumed in the state. In 2021, New York was the fourth-largest consumer of both motor gasoline
and jet fuel, even though it had the second-lowest per capita transportation sector energy consumption among
the states. New York also had the lowest per capita motor gasoline consumption of any state in large part
because of the wide use of mass transportation. The residential sector accounts for about one-tenth of New
York's petroleum consumption. About one in five New York households heat with petroleum products,
primarily fuel oil. The industrial and commercial sectors account for the rest of the state's petroleum
consumption. In 2021, the industrial sector and the commercial sector each accounted for about 6%.
Natural gas
In 2022 New York produced less than 10 billion cubic feet of natural gas. Most of the natural gas consumed in
New York is produced in other states. The largest share comes through and from Pennsylvania. The Marcellus
Shale, is a natural gas-bearing formation that extends under parts of New York. It is the largest natural gas area
in the United States as ranked by estimated proved reserves. New York banned hydraulic fracturing in 2020.
Only a few natural gas wells were drilled into New York's Marcellus Shale before the ban. As a result, the total
amount of natural gas retrievable from the Marcellus Shale in New York is unknown.
New York is the sixth-largest natural gas consumer among the states.
New York is the sixth-largest natural gas consumer among the states. However, New York consumes less
natural gas per capita than almost three-fourths of the states. In 2022, natural gas fueled nearly half of the state's
electricity generation, and 36% of the natural gas delivered to consumers in New York in 2022 went to the
electric power sector. The residential sector, where three out of every five households heat with natural gas,
accounted for 34% of the natural gas delivered to New York consumers. The commercial sector received 23%
of the natural gas deliveries, and the industrial sector accounted for about 7%. The transportation sector used
very little natural gas as vehicle fuel, but there are nearly 50 public and private access compressed natural gas
fueling stations in New York.

MISSION OUTCOME
Renewable
Energy
STATE POLICY GOAL
FOR RENEWABLE ENERGY
The Climate Act mandates that at least
70% of New York’s electricity come from
renewable energy sources such as wind
and solar by 2030 (70x30).
As a companion to the Climate Act, the Accelerated Renewable Energy
Growth and Community Benefit Act followed in the Spring of 2020 to
address the urgency of our climate transition. The intent is to integrate
the acceleration of permitting timelines, seeking regulatory efficiencies,
mandating careful study of our electricity grid and the identification of
priority upgrades, and deepening community engagement. Armed with
the nation’s most aggressive climate goals and expedited processes
to match, achievement of the 70 x 30 mandate will move the State
closer to delivering just, equitable climate action to New Yorkers,
including improving air quality, buttressing a more resilient grid, and
spurring a clean economy through supply chain investments, workforce
development, and job creation.
In the 21st century, the future is electric and NYSERDA is working
tirelessly to remove barriers and deliver our State’s goals and benefits to
New Yorkers — including more than $17 billion in net benefits estimated
over the lifetime of Tier 1 and offshore wind procurements under the
Clean Energy Standard (not yet inclusive of the benefits from the Tier 4
awards announced in 2021).
Towards a Clean Energy Future:
A Strategic Outlook
2022 through 2025

NYSERDA’S ROLE
Facilitate continued ramp-up of
steady, predictable procurements for
renewable generation, offering market
confidence and supply chain stability.
Support smart siting policies to
maximize co-benefits between industries,
cultivate infrastructure ecologies, and
build community engagement.
Support climate equity through the
prioritization of benefits and workforce
development delivered to Disadvantaged
Communities across the State.
Drive supply chain localization, local
port and manufacturing investments,
and job creation and training, including
through new $500 million State
investment to support offshore wind
ports and manufacturing.
Reduce costs by delivering economies
of scale, removing barriers to
deployment, and supporting innovation.
Participate actively in transmission
analysis needed to cost-effectively
accommodate 25+ GW of Tier 1 and
Offshore Wind renewable projects
anticipated for State goals.
Develop a blueprint to guide the
retirement and redevelopment of New
York’s oldest and most-polluting fossil
facilities by 2030, working with DEC and
DPS – as announced in January 2022.
INDICATORS
OF PROGRESS
■MWh: progress toward the 70x30
and 100x40 targets
■MW and facilities (large-scale,
offshore, and behind-the-meter)
completed and in the pipeline:
progress toward goals
■Benefits of renewable energy
investments accruing for
Disadvantaged Communities (%)
and M/WBE engagement
■Private market investment, clean
energy jobs, and costs per
Renewable Energy Credit (REC)
STRATEGIES FOR 2022–2025
■Accelerate efforts to achieve the Climate Act’s 70x30 renewable goal
via build-out of on- and off-shore resources, as well as construction
of new Tier 4 transmission line projects into Zone J/New York City.
■Continue the sprint toward and past Climate Act goals of
6,000 MW of solar by 2025, 3,000 MW of storage by 2030,
9,000 MW of offshore wind by 2035, and the delivery of benefits to
Disadvantaged Communities.
■Collaborate with market participants to complete technical studies,
such as New York State Cable Corridor Study announced in January
2022, and promote infrastructure investments like transmission and
energy storage that will unlock system efficiencies and unbottle
resources to drive progress on our goals and ensure cost savings
to ratepayers.
■Collaborate with utilities and other market participants to build
transparency in interconnection processes, overcome grid
constraints on project capacity, and pricing/curtailment issues.
■Develop and launch new ‘Offshore Wind Master Plan 2.0 – Deep
Water’ as planning and execution framework for at least 9,000 MW
of offshore wind by 2035, featuring pursuit of next-generation
floating turbine technologies and preparation for a mesh-ready
offshore buildout.
■Engage in detailed sector studies of evolving resiliency design
approaches and best practices to mitigate future climate risks and
to deepen the carbon performance of projects through reducing
embodied carbon.
■Continue working to dramatically reduce project development
timelines under new 94C siting process and via interconnection
efficiencies.
■Work closely with communities to inform and spur adoption of
smart local siting rules/laws and cultivate welcoming renewable
energy zones.
■Engage with NYS Tax and Finance to implement and refine
successful model renewable energy taxation policy.
TRANSFORMATION 2030
■New York is well on its way to powering electricity
with wind, water, and solar
■70% renewable electricity statewide
■Virtually all large-scale resources procured by
2026/2027 to complete 2030 portfolio
■At least 10 GW of distributed solar, roughly 16 GW
of large-scale solar, approximately 4 GW of onshore
wind, and at least 6 GW of offshore wind to serve
expected statewide annual load of 151,678 GWh
■Build-out of inter- and intra-regional transmission
infrastructure, long-duration storage underway

The Climate Act and new, expanded goals
ramp up renewable energy, including:
QUADRUPLING NEW YORK’S OFFSHORE WIND TARGET TO
9,000 MW by 2035
up from 2,400 MW by 2030
DOUBLING DOWN ON DISTRIBUTED SOLAR DEPLOYMENT TO AT LEAST
10,000 MW BY 2030
up from 6,000 MW by 2025
New York State continues to grow a strong
pipeline of projects to meet the 70x30 goal.
AS OF DECEMBER 2021,
THERE WERE APPROXIMATELY:
32 GW
OF ACTIVE RENEWABLE
ENERGY PROJECTS
IN THE NY Independent
System Operators
INTERCONNECTION QUEUE
Additionally, there are currently more
than 35 PROJECTS in or in the process of
applying for the Active Article 10 and Article
94c (ORES) queues, with nine certificates/
permits granted in 2021 – indicating more of
the pipeline is coming to fruition.
There have been MORE THAN 1.2 GW OF
ENERGY STORAGE awarded statewide,
with another 400+ MW OUT TO BID as of
the end of 2021 and several hundred MWs
expected to be built in 2022.
In addition, there have been MORE THAN
3.5 GW OF DISTRIBUTED SOLAR installed
statewide, with a PIPELINE OF 2.6 GW (high
project maturity – lower than 10% attrition).

2030 Clean Energy
Standard target:
70% electricity
from renewable sources
PROGRESS TOWARDS 70X30 GOAL
106,174 GWh to reach goal*
* GWh required to meet goal is based on 2020 Clean Energy Standard Order
load projection for 2030 and is subject to future adjustment.
2020 Actual
Statewide Load
147,944 GWh
2030 Statewide Load
as per CES Order
151,678 GWh
150K Expected Future
Contributions (7%)
140K 2020 Renewable
130K
120K
110K
100K
90K
Existing, Awarded,
and Contracted
Renewable
Generation (63%)
80K
70K Non-Renewable
Generation (73%)
60K
50K
40K
30K
20K
10K
0K
2020 2030
107,408 GWh
40,572 GWh Generation (27%)
Non-Renewable
Generation (30%)
11,034 GWh
95,141 GWh
45,503 GWh
HIGHLIGHTED
PROGRAMS AND
INITIATIVES
Large-Scale Renewables
supports the development of
large-scale renewable energy
projects.
Offshore Wind establishes
a significant, cost effective,
renewable generation source
with promise of new industry in
New York State.
Tier 4** is a new tier of the Clean
Energy Standard helping bring
forth new transmission and
new renewables to serve New
York City, via two major projects
selected for award in 2021.
Build-Ready complements
private sector development and
expedites the pre-development
of large-scale renewable assets
with a focus on underutilized,
previously developed sites.
Community Solar makes solar
affordable and accessible for
all New Yorkers.
Solar for All makes subscriptions
to community solar projects
available at no cost for low-
income consumers.
NY-Sun and Energy Storage
drive distributed solar adoption
through residential/commercial
rooftop and larger community
solar projects, reducing costs,
making solar accessible to all
New Yorkers, while deploying
at least 1,500 MW of energy
storage by 2025 with a goal of
realizing a self-sustaining market.
** Pipeline of existing, awarded, and
contracted renewable generation includes
14,636 GWh of hydroelectric, land-based
wind, and utility-scale solar large-scale
renewables generation contracted under
the Clean Energy Standard 2021 Tier 4
solicitation, T4RFP21-1, currently subject to
approval by the Public Service Commission.

MISSION OUTCOME
Resilient and
Distributed
Energy System
STATE POLICY GOAL
FOR THE ENERGY SYSTEM
Build a resilient and distributed energy system — and
supportive social infrastructure — that can anticipate,
absorb, adapt to, and recover quickly from a wide range
of shocks and stresses, including climate,
environmental, cyber, financial, aging infrastructure,
and other emerging vulnerabilities.
In this period of dynamic and fast-paced change, marked by a global pandemic, wildfires, extreme
storms, record-breaking heat, and cyber threats, the energy system faces a range of new risks and
disruptions, even as the system moves away from a more vulnerable centralized power generation
towards an increasingly balanced, diversified, and digitalized network.
As New York strives to meet its aggressive
climate targets, the State will need to contend
with new risks and opportunities.
With electric power enabling nearly all critical infrastructure and services, including communications,
emergency systems, banking, and transportation, it is crucial that the transition to clean energy and
net zero emissions also advances via a resilient and modernized grid. This includes considerations
for infrastructure given changing flood zones, sea level rise, and storm surge zones as well as new
solutions and designs to withstand high windspeed, hail, and higher temperatures, and
advancements in flexible, responsive resources such as energy storage and building load flexibility.
Measuring and valuing risk reduction and resilience can help catalyze opportunities to harness the
market system in service of these important goals.
Climate impacts land disproportionately on Disadvantaged Communities — populations that often
have fewer resources to respond — so it is vital that investments also address questions of equity
with targeted approaches for vulnerable communities. To this end, building a resilient and distributed
energy system can also generate new workforce opportunities and create avenues to strengthen
social cohesion, a quality of community resilience, through citizen engagement with shared energy
and infrastructure.

NYSERDA’S ROLE
Lead-by-example by factoring
resilience goals in the State’s clean
energy infrastructure investments.
Partner with other State agencies to
identify and implement best practices
around climate resilience, including
through the Extreme Heat Action Plan
announced with DEC in January 2022.
Spearhead next generation of climate
adaptation research to provide
insights for infrastructure, investment,
and energy system planning decisions
based on new/updated climate
projection data.
Spur development and integration of
a wide array of smart grid technologies
that support a distributed energy system
and advance resilience including storage,
smart demand response, and vehicle to
home/grid (V2H/G) flexible charging.
Continue to administer and refine
flagship distributed energy resources
(DER) programs like NY-Sun, and
energy storage incentive programs to
boost resilience, provide grid value,
and reduce costs.
STRATEGIES FOR 2022–2025
■Accelerate pace of deployment for energy storage technologies to
achieve updated 2030 goal of 6 GWs, as announced by Governor
Hochul in January 2022.
■Incorporate resilience considerations and incentives into NYSERDA
programs, including floodplain mapping, onsite generation and
storage, and other means to ensure investments factor in shifts like
increased electrification, future climate impacts, and other energy
system disruptions.
■Explore potential mechanisms for the finance and insurance of
resilient energy infrastructure, in partnership with the Department of
Financial Services; support efforts to price resilience into everything
touching energy, transport, and buildings, from insurance to
construction codes and utility regulation.
■Spur development and integration of smart grid technologies
to ensure buildings are flexible and responsive under changing
conditions, with a focus on load pockets where environmental and
health outcomes are critical (e.g., Disadvantaged Communities).
■Work with Public Service Commission to effectuate systemic grid
operation changes, including to better make use of DER, including
transportation and storage, in a way that fully integrates them and
allows for greater self-healing capabilities.
■Support resiliency and grid flexibility, i.e., balance the growing
intermittent renewable resources. Continue efforts to scale up
energy storage to achieve statewide goals, with a focus on the
Downstate region where energy storage is critically needed to
replace dirty peaker plants, support grid congestion, and offshore
wind procurements. Foster virtual power plant (VPP) pilots into robust,
mature programs offered ubiquitously by utilities.
■Drawing from the Carbon Neutral Buildings Roadmap work, develop
solutions and playbooks for resilient communities and resilient
housing focusing on passive survivability, resilience solutions for
all-electric buildings and facilities of refuge to withstand future
disruptions to the energy system system — all recognizing that in an
electrified future, efficiency is an inherent resilience measure.
■Leverage engagement with communities to catalyze county and
municipal resilience strengthening, from backup for critical loads
to physical spaces embodying a comprehensive vision for social
cohesion and emergency resilience.
■Partner with NYS Division of Homeland Security and Emergency
Services (DHSES) to refine model local laws based on climate
assessment study findings, integrate clean resilience solutions
into state hazard mitigation plan program and funding for backup
power, and develop local guidebooks for resilience to supplement
Community Risk and Resilience Act (CRRA) plans
INDICATORS
OF PROGRESS
■Progress toward storage
(6,000 MW by 2030) and
distributed solar (10,000 MW
by 2030) deployment goals
■Statewide grid-interactive
building load
■Percentage of NYSERDA
solicitations that incorporate
resilience provisions
■Penetration of homes and
buildings equipped with onsite
generation and energy storage
(stationary batteries, electric
vehicles)

1. MAINTAIN SAFE, RELIABLE, AND
RESILIENT ENERGY INFRASTRUCTURE.
Electricity and natural gas permeate all sectors of daily society and assist people to lead
productive, safe and fulfilling lives. We wake up to these critical energy sources with our alarms,
we use them to cook our breakfast, they fuel many of the cars, buses, and trains we use to get to
work, they power our schools and hospitals, they charge our cell phones, and the list goes on.
As such, the reliability and resiliency of this infrastructure are paramount, especially in the face of
increasing extreme weather events. Private sector investment in resources - such as wind, solar,
and emissions reducing technologies and fuels - will be essential to meeting the State's goals. As
New York State transitions its electric generation resources to more intermittent renewable
sources and energy storage, the need for more flexible resources will increase. Accordingly,
maintaining baseload and quick-start resources to address this intermittency is essential for a
robust and reliable grid. Foundational fuels and associated infrastructure, like the State’s robust
natural gas system, are necessary to ensure ongoing reliability, and, until new storage technologies
are developed and matured, large baseload generators will be essential to balance fluctuations in
renewable electric generation.
Further, as New York State develops new generation technologies able to leverage low- and no-
carbon fuels (i.e. carbon neutral/negative renewable natural gas (RNG), green hydrogen, etc.)
the existing gas system, which consists of approximately 50,000 miles of storm-resistant
pipelines, will remain an indispensable piece of New York State’s green economy. The State’s
fuel suppliers also are poised to provide other new fuels, such as renewable jet fuel and
renewable distillate. Additional technologies, such as long duration energy storage and carbon
capture and sequestration, also could have a role in maintaining reliability and zero
emissions.
2. COMMUNICATE IMPACTS ON ENERGY
CONSUMERS AND BUSINESSES.
Due to the magnitude of investments needed to decarbonize the economy, cost-
effectiveness and consumer affordability are essential. Approaches that can achieve the Climate
Leadership and Community Protection Act (CLCPA) targets while minimizing economic impacts
on consumers and businesses, including utility bill impacts (especially during the winter),
must be prioritized. As New Yorkers continue to recover from the impacts of COVID-19, this
priority takes on even greater importance.
Despite a directive in the CLCPA to evaluate the total potential costs of the Scoping Plan, especially
costs of implementation, and multiple requests from certain Climate Action Council (CAC)
members and numerous stakeholders, there has yet to be issued a comprehensive evaluation of the
practical cost impact of the State’s energy transformation on individuals, businesses, and industries
in New York. Information that has been provided on the CAC’s Integration Analysis suggests that
costs for individuals to convert their homes to a zero emissions environment will likely be significant
– $20,000 to $50,000 for a single-family home in the Upstate New York region. Similarly, in
May 2021, the Consumer Energy Alliance estimated that this cost was approximately $35,000.
Given these significant impacts to consumers, in addition to the other costs that will flow
from the enormous infrastructure buildout required by the CLCPA, no Scoping Plan can
reasonably be considered without the requisite cost analysis that shows practical impacts on
consumers and how to afford paying them.
Advancing New York State's Clean Energy Goals

3. CREATE AND RETAIN HIGH QUALITY UNION LABOR
JOBS.
New York State programs for investment to reach the CLCPA’s goals should include the
prevailing wage, project labor agreements, labor peace, and Buy American provisions that were
enacted in the 2021 State Budget for renewable energy systems, along with an apprenticeship
training program. These quality-based contracting and labor provisions are highly valuable in
promoting successful project delivery, especially in light of the complexity and time
sensitivity of affected projects. Vital for the Just Transition envisioned by the CLCPA, these
provisions will: create and retain good paying union jobs in New York State; spur local
manufacturing and further the State’s clean economy goals; help encourage the repurposing of
existing facilities; and facilitate private investment in new, zero-carbon emissions technologies
that strengthen local communities.
4. LEVERAGE THE POWER OF MARKETS TO ACHIEVE
DECARBONIZATION.
The New York Independent System Operator (NYISO) has administered competitive
wholesale energy markets, successfully fulfilling public policy objectives for two decades. In the
last 20 years: electric reliability has improved materially; emissions have declined substantially;
and consumers' electric supply costs have decreased significantly.
Competitive markets have proven to be the most effective tool to attract new technology
investments and reduce emissions at the lowest cost when unencumbered by
technology-specific mandates. Harmonizing public policy objectives, such as valuing
renewable and zero-emitting generation, with the wholesale electricity markets will: diminish New
York State's reliance on out-of-market subsidies; accelerate the decarbonization of the State’s
generation fleet; accelerate entry of new renewable projects; create stronger economic incentives
for cost-effective transmission investment; and reduce the cost and time to achieve the State's
clean energy goals.
The sooner New York State adopts market-based solutions to achieve its public policy goals, such
as the NYISO's carbon pricing proposal related to electric generation, the sooner New York's public
policies will be achieved. NYISO’s carbon pricing proposal can help grow investment and innovation
in clean energy generation and provide efficient market incentives to site renewable energy
systems and zero-emitting generation where they are particularly needed for reliability and for the
creation of associated local jobs. Those jobs must be accompanied with minimum labor standards
for all participants in line with the points outlined in the third Principle above.

5. REDUCE EMISSIONS FROM ALL SECTORS, INCLUDING
TRANSPORTATION AND HEATING.
As part of an economy-wide approach, substantial emissions reductions from the
transportation and building sectors are needed to meet New York State's decarbonization goals.
Emphasis should be placed on exploring diverse solutions for emission reductions, including
energy efficiency programs that ensure early attainment of the most significant energy reductions
possible and dual-source heating options (i.e., using low- and no-carbon fuels in high
efficiency natural gas furnaces in combination with air source heat pumps), to ensure that New
Yorkers remain safe and healthy. For transportation, electric vehicles are a main compliance
pathway, while carbon neutral/negative RNG and green hydrogen are viable emissions reduction
options for hard-to-electrify medium and heavy-duty vehicles.
6. PROMOTE DEVELOPMENT AND MAINTENANCE OF
NEEDED ENERGY INFRASTRUCTURE.
Approximately 80% of New York State's electricity transmission lines entered service before
1980. Market signals will create stronger economic incentives for cost-effective transmission
investment, providing the downstate market access to cleaner and more efficient resources
located upstate and offshore, growing the market for renewables, and stimulating the State’s
economy. Use of the natural gas transmission system, as a pathway for the delivery of low-
and no-carbon fuels, will balance the need to expand the electricity transmission system and
help ensure an affordable, reliable, and resilient energy system.
7. SUPPORT FUEL AND TECHNOLOGY DIVERSITY.
A diversified electric system is essential to cost-effectively maintain and strengthen reliability,
while minimizing price volatility by avoiding an over-reliance on any single fuel source with
uncertain availability. Resource diversity provides this stability as New York State pursues an
emissions-free electric system along with increased electricity demand resulting from the
electrification of the transportation and building sectors.
All emissions-reduction technologies should be considered, and bans on existing types of facilities
and appliances should not be imposed, especially where such bans would sacrifice reliability,
resiliency, and cost-efficiency. The focus should be on the economic benefit of finding ways for
equipment and facilities to be the leading pathways for the use of emissions reducing fuels and
technologies.
Use of low- and no-carbon technologies, like carbon neutral/negative RNG and green hydrogen,
will be important to ensure reliability and resiliency and to decarbonize hard (and in some cases
impossible) to electrify industries, heavy duty transportation and certain multi-family and older
residential housing, particularly in colder climate regions of the State. For certain industries where
electrification is possible but cost prohibitive, use of low- and no-carbon fuels could help support
ongoing investment and continued operation in the State. The State needs to consider and
research all options to reduce emissions, including (but not limited to) green hydrogen, carbon
neutral/negative RNG, long duration energy storage, renewable jet fuel, renewable distillate,
biofuels, renewable propane, biodiesel, and carbon capture and sequestration.

Clean Energy Standard
The most comprehensive and ambitious clean energy goal in the
State's history.
Progress to Date
Combined with the existing baseline of renewable facilities in New York, the current pipeline of
renewables already under contract and in development projects will power 66% of New York's
electricity once they are operational.
New York’s Clean Energy Standard (CES) is designed to fight climate change, reduce harmful air
pollution, and ensure a diverse and reliable low carbon energy supply. The expansion of the CES so that
70% of New York's electricity comes from renewable energy sources such as solar and wind by 2030
was codified under the Climate Leadership and Community Protection Act (Climate Act) . By focusing
on low carbon energy sources, the CES will bring investment, economic development, and jobs to New
York State.
• Investment in New York’s renewable energy transition can be seen through more than $29
billion in public and private investment which includes nearly 100 onshore solar, wind and hydro, and
offshore wind projects; as well as investments in transmission as part of constructing New York's Green
Energy Transmission Superhighway.
• The renewable energy infrastructure created by these investments (in-service, contracted, and to-
be contracted) will provide the following benefits to New Yorkers:
o More than 40 million megawatt hours of clean energy annually
o More than 25% of the electricity expected to be consumed in New York State in 2030
o Eliminating over 20 million tons of greenhouse gas emissions every year

• In addition to renewable energy, New York is laser focused on driving down energy demand
through investment in energy efficiency. Through NYSERDA and utility programs, over $6.8 billion is
being invested to decarbonize buildings across the State. By improving energy efficiency in buildings
and including onsite storage, renewables, and electric vehicle charging equipment, the State will reduce
carbon pollution and achieve the ambitious target of reducing on-site energy consumption by 185 trillion
BTUs by 2025, the equivalent of powering 1.8 million homes.
Turning Targets into Reality
The CES creates two mechanisms to turn New York State’s ambitious clean energy goal into a reality.
Together the renewable energy standard (RES) and the zero-emissions credit (ZEC) requirement will
help create a low carbon energy system.
• The RES requires every load serving entity (LSE) in New York State to procure renewable
energy certificates(RECs) associated with new renewable energy resources—known as Tier 1—for their
retail customers. If LSEs cannot demonstrate they are meeting the Tier 1 obligation through the
possession of RECs, they may make alternative compliance payments (ACPs).
• The ZEC requirement mandates the LSEs procure ZECs from NYSERDA. The number of ZECs
is based on each LSE’s proportionate amount of statewide load, or energy demanded, in a given
compliance year.
In addition to these programs, NYSERDA is also advancing offshore wind energy projects through its
Offshore Wind Program. NYSERDA also works with its State partners and local communities to rapidly
advance new “Build-Ready” projects, prioritizing the development of existing or abandoned commercial
sites, brownfields, landfills, former industrial sites, and other abandoned or underutilized sites.
The New York Generation Attribute Tracking System (NYGATS) will record and track information on
electricity generated, imported, and consumed within New York State. Additionally, NYGATS will
demonstrate LSE compliance with, and progress toward, the CES goal.
Solar Data Maps
New York continues to be a national leader in the clean energy transition with the most aggressive climate
change program in the nation putting the State on the path to be entirely carbon-neutral across all sectors of the
economy. New York State's Climate Leadership and Community Protection Act (CLCPA) calls for 70 percent
of the State's electricity to come from renewable sources by 2030 and 6,000 megawatts of solar by 2025. NY-
Sun, New York’s solar initiative advances the scale-up of solar and is moving the State to a more sustainable,
self-sufficient solar industry. NYSERDA has created two data maps on the State’s installed solar.
Statewide Distributed Solar Projects
Based on interconnection data, this map represents the most comprehensive summary available of installed
solar capacity and annual trends, including projects that did not receive State funding, for all of New York since
2000.

New York State aims to reach 1,500 MW of energy storage by 2025 and 3,000 MW by 2030. In addition to
providing roughly $3 billion in gross benefits and avoiding more than two million metric tons of CO2 emissions, by
2030 New York’s energy storage industry could create approximately 30,000 jobs. Additionally, energy storage will
help achieve the aggressive Climate Leadership and Community Protection Act goal of getting 70% of New York’s
electricity from renewable sources by 2030.

"
"
"
"
"
"
"
"
"
""
"
"
"
"
"
"
"
72°
72°
73°
73°
74°
74°
75°
75°
76°
76°
77°
77°
78°
78°
79°
79°80°
45° 45°
44° 44°
43° 43°
42° 42°
41° 41°
New York
Annual Average
Wind Speed
at 30 m
Albany
Niagara
Falls
Jamestown Binghamton
Elmira
Syracuse
Glens Falls
Watertown
Olean
05-APR-2012 2.1.1
Utica
Poughkeepsie
Smithtown
Plattsburgh
Rochester
Wind Speed
m/s
>10.5
10.0
9.5
9.0
8.5
8.0
7.5
7.0
6.5
6.0
5.5
5.0
4.5
4.0
< 4.0
Buffalo
50 0 50 100 Miles
50 0 50 100 150 200 Kilometers
Ithaca
Lake Erie
Lake Ontario
New York
The average wind speeds indicated on this map are model-derived
estimates that may not represent the true wind resource at any
given location. Small terrain features, vegetation, buildings, and
atmospheric effects may cause the wind speed to depart from the
map estimates. Expert advice should be sought in placing wind
turbines and estimating their energy production.
Source: Wind resource estimates developed by AWS Truepower,
LLC. Web: http://www.awstruepower.com. Map developed by
NREL. Spatial resolution of wind resource data: 2.0 km.
Projection: UTM Zone 18 WGS84.

"
"
"
"
"
"
"
"
"
""
"
"
"
"
"
"
"
72°
72°
73°
73°
74°
74°
75°
75°
76°
76°
77°
77°
78°
78°
79°
79°80°
45° 45°
44° 44°
43° 43°
42° 42°
41° 41°
New York
Annual Average
Wind Speed
at 80 m
Albany
Niagara
Falls
Jamestown Binghamton
Elmira
Syracuse
Glens Falls
Watertown
Olean
02-NOV-2010 1.1.1
Utica
Poughkeepsie
Smithtown
Plattsburgh
Rochester
Wind Speed
m/s
>10.5
10.0
9.5
9.0
8.5
8.0
7.5
7.0
6.5
6.0
5.5
5.0
4.5
4.0
< 4.0
Buffalo
50 0 50 100 Miles
50 0 50 100 150 200 Kilometers
Ithaca
Lake Erie
Lake Ontario
New York
Source: Wind resource estimates developed by AWS Truepower,
LLC for windNavigator . Web: http://www.windnavigator.com |
http://www.awstruepower.com. Spatial resolution of wind resource
data: 2.5 km. Projection: UTM Zone 18 WGS84.
¶
The wind resource map shows the predicted mean annual wind speeds at an 80-m height, presented at a spatial resolution of about 2 kilometers that is interpolated to a finer scale for display. Areas with
annual average wind speeds around 6.5 meters per second and greater at 80-m height are generally considered to have a resource suitable for wind development. Utility-scale, land-based wind turbines
are typically installed between 80- and 100-m high although tower heights for new installations are increasing—up to 140 m—to gain access to better wind resources higher aloft.
The average wind speeds indicated on this map are model-derived estimates that may not represent the true wind resource at any given location. Small terrain features, vegetation, buildings, and
atmospheric effects may cause the wind speed to depart from the map estimates. Anyone planning to estimate energy production potential should seek expert advice or detailed wind resource
assessments.

How to read a wind rose
The wind rose located in the top right corner of each data map shows the general wind
direction and speed for each sampling period. The circular format of the wind rose
shows the direction the winds blew from and the length of each "spoke" around the
circle shows how often the wind blew from that direction. For example, the wind rose
above shows that during this particular sampling period the wind blew from the west
30% of the time, and from the north and the northeast 12% of the time, etc.
The different colors of each spoke provide details on the speed, in knots
(1 knot=1.15 mph), of the wind from each direction. Using the example above, the
longest spoke shows the wind blew from the west at speeds between 1-4 knots (light
blue) about 4% of the time, 4-7 knots (dark green) about 18% of the time and 7-11 knots
(dark blue) about 7% of the time.
The source of the data in the example is from an EPA meteorological monitor located on the
roof of the EPA Willowbrook Warehouse.

New York will help responsibly develop
9,000 megawatts of
oshore wind power
by 2035, enough to power up to
6 million homes
New York State Oshore Wind
Overview
Oshore wind is key
to achieving New York
State’s nation-leading
clean energy goals
of 70% renewable
energy by 2030
and 100% clean
electricity by 2040
Oshore wind is ready to power New York
NYSERDA is leading the responsible and cost-eective advancement of at least 9,000 megawatts
(MW) of oshore wind energy in New York State by 2035. In close collaboration with State and
federal agencies and engaging critical stakeholders, NYSERDA is working diligently to anchor
New York as the nation’s hub for this important global industry. Oshore wind presents significant
opportunities statewide, including infrastructure development, workforce opportunities, economic
benefits, and a just transition to a clean energy economy. Oshore wind is a cornerstone of New
York’s ambitious and comprehensive climate and clean energy legislation, the Climate Leadership
and Community Protection Act (Climate Act), which requires that at least 70% of New York’s
electricity is generated from renewable sources by 2030 and commits to 100% zero-emission
electricity by 2040.
Oshore wind will bring:
■ Clean, locally produced power where demand is highest
■ Significant investments in infrastructure and communities along
New York’s Atlantic Coast and up to the Capital Region
■ The opportunity for thousands of short- and long-term skilled
construction, manufacturing, and operations jobs
■ Diversified electricity supply
■ Avoided greenhouse gas emissions
Oshore Wind Master Plan and New Master
Plan 2.0: Deepwater
NYSERDA developed the award-winning New York State Oshore Wind Master Plan as a
comprehensive roadmap that encourages responsible and cost-eective development of oshore
wind in a manner sensitive to environmental, maritime, social, and economic issues. The Master
Plan helps minimize project risks and encourages competition among project developers, resulting
in reduced costs. Building on the success of New York’s award winning oshore wind master plan,
NYSERDA will initiate a new master plan 2.0: Deepwater in 2022 to unlock the next frontier of
oshore wind development.
Visit nyserda.ny.gov/ofshorewind for more information on the Master Plan.

Achieving New York’s oshore wind goals Up
To
National leader in oshore wind procurements
$700million
The addition of Empire Wind 2 and Beacon Wind brings New York’s total procured oshore wind
capacity to more than 4,300 MW, or nearly 50% of the State’s 9,000 MW target by 2035. To date,
five projects have been procured, including South Fork (132 MW), Empire Wind 1 (816 MW), Sunrise
Wind (924 MW), and Empire Wind 2 (1,260 MW) and Beacon Wind (1,230 MW). NYSERDA’s oshore
wind projects are anticipated to yield significant new investments in port infrastructure and supply
chain opportunities. Projects are expected to be operational by the mid- to late-2020s and bring a
combined $12.1 billion to Upstate, Downstate, and Long Island over the approximate 25-year project
lifespan, as well as create more than 6,800 high-quality jobs with salaries averaging $100,000.
investment
New York Port and
Manufacturing Facilities
More Than
Investing in jobs and infrastructure
$77 million
Paired with private investments, New York has unlocked more than $644 million in resilient port
facilities and manufacturing, helping to jumpstart project development and drive job growth.
NYSERDA’s 2020 oshore wind solicitation included a public-private investment opportunity for
New York ports to further the State’s position as a global wind energy manufacturing powerhouse.
The 2020 solicitation yielded investments at the Port of Albany and South Brooklyn Marine Terminal,
bringing the number New York ports in active development to five when added to the ongoing work
at the Port of Coeymans, and Port Jeerson in Montauk Harbors. In 2022, New York will invest up
to an additional $500 million in the ports, manufacturing, and supply chain infrastructure needed
to advance its oshore wind industry, leveraging private capital to deliver more than $2 billion in
economic activity while creating more than 2,000 good-paying green jobs. This investment brings
the State’s public commitments to a nation-leading $700 million and will ensure that New York has
the strongest oshore wind energy market along the Eastern Seaboard, enabling us to be the
oshore wind supply chain hub for other projects up and down the coast. The projects will also spur
investments in a $20 million Oshore Wind Training Institute, a $10 million National Oshore Wind
Training Center, and a $5 million Community and Workforce Benefits Fund to educate, train, and
employ New Yorkers. Together with diverse private, federal, and State funding, New York is poised to
deliver more than $77 million in oshore wind workforce training investments in the coming years – a
nation-leading investment.
Public and Private
Oshore Wind
workforce training investments
$5 million
Community and Workforce
Benefits Fund
with public & private partnerships
Fostering stakeholder outreach and public engagement
NYSERDA continues to create opportunities for facilitating dialogue with interested stakeholders, developers, and the public through
community engagement, open houses, and webinars. New York’s four Technical Working Groups—Environmental, Fishing, Maritime,
and Jobs and Supply Chain—ensure continued collaboration among entities with subject-matter expertise, practical experience, and
professional interest to responsibly advance oshore wind in the State.
NYSERDA holds the nation’s gold standard for stakeholder engagement as a pillar to our oshore wind program. As part of our
commitment to those standards NYSERDA published the Guiding Principles for Stakeholder Engagement. These guidelines are intended
to support developers as they design their Stakeholder Engagement Plans, which, similar to existing Environmental and Fisheries
Mitigation Plans, will be required in future NYSERDA solicitations for Oshore Wind Renewable Energy Certificates (ORECs).
To learn more on how all New Yorkers will be involved in this exciting and prosperous new industry please visit our website
https://www.nyserda.ny.gov/All-Programs/Oshore-Wind/Focus-Areas/Connecting-With-New-Yorkers.
Conducting research
NYSERDA is continuing to analyze various elements of oshore wind development, including the collection of metocean data, wildlife
surveying, air-quality assessment, and supply chain. In addition, the U.S. Department of Energy selected NYSERDA to lead the National
Oshore Wind Research and Development Consortium—a nationally focused, independent organization dedicated to reducing oshore
wind development costs by managing industry-focused research, development activities, and transmission planning. This includes both
oshore wind development and cable routing planning to minimize onshore and ocean floor impacts, and realize an oshore wind grid
able to deliver at least 6 gigawatts of oshore wind energy directly into New York City.
Coordinating between State and federal agencies and stakeholders
NYSERDA works closely with the U.S. Department of the Interior’s Bureau of Ocean Energy Management (BOEM) to successfully permit
existing wind projects and identify new wind energy areas o New York’s Atlantic Coast. New York supports rigorous field work, analysis
and stakeholder outreach for wind energy development that support the least conflict and greatest opportunities for development of this
powerful renewable energy resource.
Learn more about oshore wind
in New York State.
nyserda.ny.gov/oshorewind
LSR-OSW-ov-fs-1-v16 6/22

NCF-Envirothon 2024 New York
Current Issue Part B Study Resources
Key Topic #2: New York State Clean Energy Goals – Individual and Community Actions
4. Describe what steps communities and individuals should take when making
renewable energy decisions.
5. Describe what impacts renewable energy decisions have on communities and
individuals.
Study Resources
Resource Title Source Located on
Pages 29-30
Consumer Guide to
Residential Renewable Energy
Office of Energy Saver, Office of Energy
Efficiency & Renewable Energy, US
Department of Energy 2023
Pages 31-33
Planning for Micro-hydropower
Office of Energy Saver, Office of Energy
Efficiency & Renewable Energy
US Department of Energy 2023 Pages 34-35
Clean Energy and Your Comprehensive
Plan For Local Governments
WIND Exchange, Office of Energy,
Efficiency & Renewable Energy, US
Department of Energy, 2023
Pages 36-54
Pages 55-59
NYS Energy Storage Fact Sheet New York State Energy Research
and Development Authority, 2023
Pages 60-70
Study Resources begin on the next page!
Planning for Home Renewable
Energy Systems
New York State Energy Research
and Development Authority, 2021
Office of Energy Saver, Office of Energy
Efficiency & Renewable Energy
US Department of Energy 2023
New York State Energy Research
and Development Authority, 2023
Excepts from New York Solar
Guidebook for Local Governments
Small Wind Guidebook
Pages 71-72

Consumer Guide
to Residential
Renewable Energy
Installing residential
renewable energy
systems, such as
geothermal heat
pumps and wind or
solar energy systems,
can save energy, lower
utility bills, and earn
homeowners money.
Start with Energy Efficiency
Making the home energy-efficient before installing a renewable energy system will
save money on electricity bills. Energy-efficiency improvements can conserve energy
and prevent heat or cool air from escaping. Homeowners can obtain home energy
assessments and install proper insulation, air sealing, and ENERGY STAR®–qualified
windows, heating and cooling equipment, kitchen appliances, and lighting systems.
Smart water use, available daylight, proper landscaping, and native vegetation can
also improve home efficiency.
Incorporate Renewable Energy
Once home energy-efficiency improvements have been made, homeowners are best
positioned to consider options for installing a renewable energy system.
Geothermal Heat Pumps
Geothermal heat pumps, also known as ground source or water source heat pumps,
transfer heat into and out of the home, using the ground as both a heat source and
a heat sink. These pumps can achieve efficiencies two to three times greater than
commonly used air source heat pumps (ASHPs), because they rely on the relatively
consistent ground temperatures to transfer heat to or from a home. Across much
of the United States, the temperature of the upper 10 feet of the ground remains
between 45°F and 75°F, and often between just 50°F and 60°F. By contrast, air
temperatures can range, over the course of a year, from below 0°F to over 100°F.
Geothermal heat pumps are long-lasting and durable, and specially equipped
systems can also supply hot water during the summer. While purchasing and
installing a geothermal heat pump costs more than installing an ASHP system with
similar capacity, the additional costs can be recouped through energy savings in
10 to 15 years compared with ASHPs.
Solar water heaters use
sunlight to heat water for the
home. Solar water heating
systems use insulated storage
tanks and solar collectors to
capture and retain heat from
the sun, and heat circulating
water. Solar water heaters
require a backup system,
such as conventional hot
water heaters, when there
is insufficient sunlight.
energy.gov/energysaver

Solar Energy Systems
Solar photovoltaic (PV) systems convert sunlight into electricity.
Solar energy can generate all or some of a home’s electricity
needs, depending on the number of solar panels used, and
can heat water as well. With ample sunlight, PV systems can
harness energy in hot and cold climates. The basic building
block of a PV system is the solar cell. Multiple solar cells
form modules called solar panels that range in output from
10 to 400 watts. Panels are designed to survive storm and
hail damage and are resistant to degradation from ultraviolet
rays. They are highly reliable and require little maintenance.
Panels are typically grouped together on a building rooftop or
at ground level in a rack to form a PV array. The array can be
mounted at a fixed angle or on a tracking device that follows
the sun to maximize sunlight capture.
Wind Energy Systems
Small residential wind energy systems can generate all or
some of a home’s electricity needs (if sufficient land area and
average wind speeds are available) and can be integrated
with solar and battery storage to provide emergency backup
power. Wind turbines use the motion of the wind to turn a shaft
attached to a generator, which makes electricity. The size of
the turbine and the speed of the wind determine how much
electricity it will make.
Typical residential wind energy systems have power ratings
ranging from 5 to 30 kilowatts. To be a suitable candidate
for a wind system, a homeowner should have at least one
acre of land and live in an area that has an average annual
wind speed of at least 10 miles per hour. The turbine tower
height should be selected based on the height of nearby wind
obstructions, such as buildings or vegetation, and are typically
60 to 140 feet high.
Estimated Costs
Federal and state incentives can significantly reduce the
upfront costs of installing a renewable energy system. The
Database of State Incentives for Renewables & Efficiency
can help homeowners find incentives near them. Plus,
renewable energy systems can pay for themselves over time.
Grid-connected solar and wind systems are particularly
cost-effective because excess electricity is sent back to the
power grid and can earn homeowners direct rebates or credits
from local utility providers.
• Solar PV systems cost about $3 per watt installed.
A 7,000 watt (7 kilowatt) system therefore costs
about $21,000 to install. Such a system would
provide 20 to 35 kilowatt-hours of electricity per
day, depending on climate, and could meet most
of a household’s demand.
• Solar hot water systems can meet 50% of the hot
water needs for a family of four and generally cost
between $5,000 and $7,000 to install.
• Small wind energy systems cost an average of $5
per 120 kilowatts to install. Purchasing and installing
a system can range from $10,000 to $70,000,
depending on local zoning, permitting, and utility
interconnection costs.
Selling Energy
Many homeowners can sell any excess energy their solar
and wind systems produce back to their utility providers and,
therefore, pay off their renewable energy investments more
quickly. Most states have established “net metering” rules for
customers who generate excess electricity through solar, wind,
or other systems and feed it into the grid. In net metering,
a bi-directional meter records both the electricity the home
draws from the grid and the excess electricity the homeowner’s
system feeds back into the grid.
FURTHER READING
Energy Saver Consumer Guides
energy.gov/energysaver/publications
Energy Saver: Geothermal Heat Pumps
energy.gov/energysaver/geothermal-heat-pumps
Energy Saver: Buying and Making Electricity
energy.gov/energysaver/buying-and-making-electricity
Wind Exchange Small Wind Guidebook
windexchange.energy.gov/small-wind-guidebook
energy.gov/energysaver
DOE/EE-2625 | August 2022

Planning for Home Renewable Energy Systems
Planning for a home renewable energy system is a process that includes analyzing your existing electricity use,
looking at local codes and requirements, deciding if you want to operate your system on or off of the electric
grid, and understanding technology options you have for your site.
Maybe you are considering purchasing a renewable energy system to generate electricity at your home.
Although it takes time and money to research, buy, and maintain a system, many people enjoy the
independence they gain and the knowledge that their actions are helping the environment.
A renewable energy system can be used to supply some or all of your electricity needs, using technologies like:
•Small solar electric systems -- A small solar electric or photovoltaic system can be a reliable and
pollution-free producer of electricity for your home or office. Small photovoltaics systems also provide
a cost-effective power supply in locations where it is expensive or impossible to send electricity through
conventional power lines.
•Small wind electric systems -- Small wind electric systems are one of the most cost-effective home-
based renewable energy systems. They can also be used for a variety of other applications, including
water pumping on farms and ranches.
•Micro hydropower systems – Micro hydropower systems usually generate up to 100 kilowatts of
electricity, though a 10-kilowatt system can generally provide enough power for a large home, small
resort, or a hobby farm.
•Small “hybrid” solar and wind electric systems -- Because the peak operating times for wind and solar
systems occur at different times of the day and year, hybrid systems are more likely to produce power
when you need it.
Planning for a home renewable energy system is a process that includes analyzing your existing electricity use
(and considering energy efficiency measures to reduce it), looking at local codes and requirements, deciding if
you want to operate your system on or off of the electric grid, and understanding technology options you have
for your site.
If you're designing a new home, work with the builder and your contractor to incorporate your small
renewable energy system into your whole-house design, an approach for building an energy-efficient home.
Analyzing Your Electricity Loads
Calculating your electricity needs is the first step in the process of investigating renewable energy systems for
your home or small business. A thorough examination of your electricity needs helps you determine the
following:
•The size (and therefore, cost) of the system you will need
•How your energy needs fluctuate throughout the day and over the year
•Measures you can take to reduce your electricity use.
Conducting a load analysis involves recording the wattage and average daily use of all of the electrical devices
that are plugged into your central power source such as refrigerators, lights, televisions, and power tools. Some
loads, like your refrigerator, use electricity all the time, while others, like power tools, use electricity
intermittently. Loads that use electricity intermittently are often referred to as selectable loads. If you are willing
to use your selectable loads only when you have extra power available, you may be able to install a smaller
renewable energy system.
To determine your total electricity consumption:
•Multiply the wattage of each appliance by the number of hours it is used each day (be sure to take
seasonal variations into account). Some appliances do not give the wattage, so you may have to calculate
the wattage by multiplying the amperes times the volts. Generally, power use data can be found on a
sticker, metal plate, or cord attached to the appliance.
•Record the time(s) of day the load runs for all selectable loads.
Considering energy efficiency measures in your home before you buy your renewable energy system
will reduce your electricity use and allow you to buy a smaller and less expensive system. For information
about determining the overall energy efficiency of your home, see energy assessments.
Local Codes and Requirements for Small Renewable Energy Systems
Each state and community have its own set of codes and regulations that you will need to follow to add a small
renewable energy system to your home or small business. These regulations can affect the type of renewable
energy system you are allowed to install and who installs it. They can also affect whether you decide to connect
your system to the electricity grid or use it in place of grid-supplied electricity as a stand-alone system.
A local renewable energy company or organization, your state energy office, or your local officials should be
able to tell you about the requirements that apply in your community. If you want to connect your system to the
electricity grid, these groups may also be able to help you navigate your power provider's grid-connection
requirements.
Here are some of the state and community requirements you may encounter:
•Building codes
•Easements
•Local covenants and ordinances
•Technology-specific requirements
•Building codes.
Electrical and building inspectors ensure that your system complies with standards. Building inspectors are
interested in making sure the structure you are adding is safe. Your system may be required to pass electrical
and/or plumbing inspections to comply with local building codes.
Many building code offices also require their zoning board to grant you a conditional-use permit or a variance
from the existing code before they will issue you a building permit. Check with your building code office before
you buy a renewable energy system to learn about their specific inspection requirements.
You are most likely to gain the inspector's approval if you or your installer follow the National Electrical Code
(NEC); install pre-engineered, packaged systems; properly brief the inspector on your installation; and include a
complete set of plans as well as the diagrams that come with the system. In addition, you should be sure your
system is composed of certified equipment, and that it complies with local requirements and appropriate
technical standards (the links at the bottom of the page provide more information on technical standards).
Easements
Some states permit easements, which are a voluntary, legally binding agreement between owners of adjacent
land regarding use of the land. For example, you might seek an easement specifying that no structure which
blocks the renewable resource necessary to run a renewable energy system will be built. These agreements are
binding regardless of changing land ownership. In addition, you may want to do a title search of your deed to
determine if any prior easements or other agreements exist that could prevent you from adding a renewable
energy system to your own property.
Local Covenants and Ordinances
Some communities have covenants or other regulations specifying what homeowners can and can't do with their
property. Sometimes these regulations prohibit the use of renewable energy systems for aesthetic or noise-
control reasons. However, sometimes these regulations have provisions supporting renewable energy systems.
Check with your homeowner’s association or local government for details. In addition, you may want to discuss
your intentions with your neighbors to avoid any future public objections.
Grid-Connected or Stand-Alone System
Some people connect their systems to the grid and use them to reduce the amount of conventional power
supplied to them through the grid. A grid-connected system allows you to sell any excess power you produce
back to your power provider.
For grid-connected systems, aside from the major small renewable energy system components, you will need to
purchase some additional equipment (called "balance-of-system") to safely transmit electricity to your loads and
comply with your power provider's grid-connection requirements. This equipment may include power
conditioning equipment, safety equipment, and meters and instrumentation.
Other people, especially those in remote areas, use the electricity from their systems in place of electricity
supplied to them by power providers (i.e., electric utilities). These are called stand-alone(off-grid) systems.
For stand-alone systems, balance-of-system components include batteries and a charge controller in addition to
power conditioning equipment, safety equipment, and meters and instrumentation.
Choosing the Right Renewable Energy Technology
To begin choosing the right small renewable electric system for your home, you will need a basic understanding
of how each technology works, as well as:
•Renewable energy resource availability
•Economics and costs
•System siting
•System sizing
•Codes and regulations
•Installation and maintenance considerations.
Remember that all of these technologies can be used by themselves, combined, or used in conjunction with a
fossil fuel system. When these technologies are combined or used with a fossil fuel generator, the result is a
hybrid system.
Technology options include solar, wind, micro hydropower, and hybrid electric systems (solar and wind).

Planning a Microhydropower System
Microhydropower can be one of the most simple and consistent forms or renewable energy on your property. If
you have water flowing through your property, you might consider building a small hydropower system to
generate electricity. Microhydropower systems usually generate up to 100 kilowatts of electricity. Most of the
hydropower systems used by homeowners and small business owners, including farmers and ranchers, would
qualify as microhydropower systems. But a 10-kilowatt microhydropower system generally can provide enough
power for a large home, a small resort, or a hobby farm.
A microhydropower system needs a turbine, pump, or waterwheel to transform the energy of flowing water into
rotational energy, which is converted into electricity.
How a System Works
Microhydropower System Components
Run-of-the-river microhydropower systems consist of these basic components:
•Water conveyance -- channel, pipeline, or pressurized pipeline (penstock) that delivers the water
•Turbine, pump, or waterwheel -- transforms the energy of flowing water into rotational energy
•Alternator or generator -- transforms the rotational energy into electricity
•Regulator -- controls the generator
•Wiring -- delivers the electricity.
Commercially available turbines and
generators are usually sold as a package.
Do-it-yourself systems require careful
matching of a generator with the turbine
horsepower and speed.
Many systems also use an inverter to
convert the low-voltage direct current
(DC) electricity produced by the system
into 120 or 240 volts of alternating
current (AC) electricity. (Alternatively,
you can buy household appliances that
run on DC electricity.)
Whether a microhydropower system
will be grid-connected or stand-alone
will determine many of its balance of
system components. For example, some
stand-alone systems use batteries to
store the electricity generated by the
system. However, because hydropower
resources tend to be more seasonal in
nature than wind or solar resources, batteries may not always be practical for microhydropower systems. If you
do use batteries, they should be located as close to the turbine as possible because it is difficult to transmit low-
voltage power over long distances.
To see if a micro-hydropower system would work for you, determine the vertical distance (head) available and
flow (quantity) of the water. To build a micro-hydropower system, you need access to flowing water on your
property. A sufficient quantity of falling water must be available, which usually, but not always, means that
hilly or mountainous sites are best.
To see if a microhydropower system would work for you, you will want to determine the amount of power that
you can obtain from the flowing water on the site. This involves determining these two things:
•Head-the vertical distance the water falls
•Flow-the quantity of water falling
Once you've determined the head and the flow, then you can use a simple equation to estimate the power output
for a system with 50% to 70% efficiency or more, which representative of most microhydropower systems.
Other considerations for a potential micro-hydropower site include its power output, economics, permits, and
water rights.
Economics
If you determine from your estimated power output that a microhydropower system would be feasible, then you
can determine whether it economically makes sense.
Since saving energy costs less than generating it, be sure your home is as energy efficient as possible, reducing
your electricity usage so that you do not purchase a system that is bigger (and more costly) than you need.
Add up all the estimated costs of developing and maintaining the site over the expected life of your equipment,
and divide the amount by the system's capacity in Watts. This will tell you how much the system will cost in
dollars per Watt. Then you can compare that to the cost of utility-provided power or other alternative power
sources.
Whatever the upfront costs, a hydroelectric system will typically last a long time and, in many cases,
maintenance is not expensive. In addition, sometimes there are a variety of financial incentives available on the
state, utility, and federal level for investments in renewable energy systems. They include income tax credits,
property tax exemptions, state sales tax exemption, loan programs, and special grant programs, among others.
Permits and Water Rights
When deciding whether to install a micro-hydropower system on your property, you also need to know your
local permit requirements and water rights.
Whether your system will be grid-connected or stand-alone will affect what requirements you must follow. If
your micro-hydropower system will have minimal impact on the environment, and you are not planning to sell
power to a utility, the permitting process will most likely involve minimal effort.
Locally, your first point of contact should be the county engineer. Your state energy office may be able to
provide you with advice and assistance as well. In addition, you'll need to contact the Federal Energy
Regulatory Commission and the U.S. Army Corps of Engineers.
You'll also need to determine how much water you can divert from your stream channel. Each state controls
water rights; you may need a separate water right to produce power, even if you already have a water right for
another use.

Printed on 21 Aug 2023
Provided by WINDExchange at windexchange.energy.gov/small-wind-guidebook
Introduction
First, How Can I Make My Home More Energy Efficient?
Can I use wind energy to power my home? More people across the country are asking this
question as they look for a hedge against increasing electricity rates and a way to harvest their
local wind resources. Although wind turbines large enough to provide a significant portion of the
electricity needed by the average U.S. home generally require 1 acre of property or more,
approximately 19.3% of the U.S. population lives in rural areas and may own land parcels large
enough to accommodate a wind energy system.
Small wind electric systems can contribute to our nation's energy needs. This guide will provide
you with basic information about small wind electric systems to help you decide if wind energy will
work for you.
Why Should I Choose Wind?
Wind energy systems can be one of the most cost-effective home-based renewable energy
systems. Depending on your wind resource, a small wind energy system can lower your
electricity bill slightly or up to 100%, help you avoid the high costs of extending utility power lines
to remote locations, and sometimes can provide DC or off-grid power. In addition, wind energy is
clean, indigenous, renewable energy.
How Do Wind Turbines Work?
Wind is created by the unequal heating of the Earth's surface by the sun. Wind turbines convert the
kinetic energy in wind into mechanical power that runs a generator to produce clean electricity.
Today's turbines are versatile modular sources of electricity. Their blades are aerodynamically
designed to capture the maximum energy from the wind. The wind turns the blades, which spin a
shaft connected to a generator or the generator's rotor, which makes electricity.
Before choosing a wind system for your home, you should consider reducing your energy
consumption by making your home or business more energy efficient. You can start by learning how
electricity is used in U.S. homes. Reducing your energy consumption will significantly lower your
utility bills and will reduce the size of the home-based renewable energy system you need. To
achieve maximum energy efficiency, you should take a whole-building approach. View your home
as an energy system with interrelated parts, all of which work synergistically to contribute to the
efficiency of the system. From the insulation in your home's walls to the light bulbs in its fixtures,
there are many ways to make your home more efficient.
•Improving insulation and sealing air leaks in a home are two of the fastest and most cost-effective
ways to reduce energy waste. Homes built prior to 1950 use approximately 60% more energy per
square foot than those constructed in 2000 or later.
•Turning your thermostat down 7° to 10°F for 8 hours a day from its normal setting can save as much
as 10% on heating and cooling.
•Low-e exterior or interior storm windows can save you 12% to 33% on heating and cooling costs,
depending on the type of window already installed in the home.
•By replacing your home's five most frequently used light fixtures or bulbs with models that have
earned the ENERGY STAR, you can save money on utility bills and protect the environment by
reducing greenhouse gas emissions.
•When shopping for appliances, look for the Energy Star® label. Energy Star® appliances have been
Small Wind Guidebook

Printed on 21 Aug 2023
Provided by WINDExchange at windexchange.energy.gov/small-wind-guidebook
Is Wind Energy Practical for Me?
What Size Wind Turbine Do I Need?
identified by the U.S. Environmental Protection Agency and U.S. Department of Energy as being the
most energy-efficient products in their classes.
A small wind energy system can provide you with a practical and economical source of electricity if:
•Your property has a good wind resource.
• Your home or business is located on at least 1 acre of land.
•Your local zoning codes or covenants allow wind turbines.
•You can determine how much electricity you need or want to produce.
•It works for you economically (you may be eligible for state/utility or federal incentives). You're
comfortable with long-term investments.
•Your average electricity bills are high or you don't have access to utility grid power.
Zoning and Permitting Issues
Zoning refers to the general local regulations that allow and restrict various types of projects,
whereas permitting refers to acquiring permits for a specific project within the scope of those
zoning rules.
The zoning and permitting processes for wind energy installations seek to address safety,
aesthetics, and community interests and concerns. Some of these concerns might include sound
level, visual impact, wildlife impact, TV/radio interference, ice shedding, or broken equipment.
Practices vary dramatically across the country so becoming familiar with the local regulations,
authorities, and general requirements is helpful. In some cases, zoning and permitting
expectations are consistent and straightforward. In other cases, hearings may be required and the
process is uncertain. A project designed within the existing limitations will experience a much
smoother permitting process and will be more likely to receive a permit. But if your project falls
outside of defined limits, it must usually undergo a special review process to obtain a variance
from the existing rules and regulations — a potentially expensive and time-consuming process
that often involves at least one public hearing and has no guarantee of success.
Before you invest in a wind energy system, you should research potential zoning and permitting
obstacles. Some jurisdictions restrict the height of the structures permitted in residential-zoned
areas, although variances may be obtained. Most zoning ordinances have a height limit of 35 feet.
You can find out more about zoning and permitting requirements by:
•Contacting the local building inspector, board of supervisors, or planning board. They can tell you if
you will need to obtain a building permit and will provide you with a list of requirements.
•Visiting the Distributed Wind Energy Association's Permitting and Zoning Resource Center.
•Utilizing the Clean Energy States Alliance's Distributed Wind Energy Zoning and Permitting: A
Toolkit for Local Governments.
In addition to zoning issues, your neighbors might object to a wind turbine that blocks their view, or
they might be concerned about the sound it produces. Most zoning and aesthetic concerns can be
addressed by supplying objective data. For example, a typical 2-kilowatt wind turbine operates at a
noise level of approximately 55 dB 50 feet away from the hub of the turbine. At that level, the sound
of the wind turbine can be picked out of surrounding noise if a conscious effort is made to hear it.
The size of the wind turbine you need depends on your application. Small turbines range in size
from 20 Watts to 100 kilowatts (kW). The smaller or "micro" (20- to 500-Watt) turbines are used in
applications such as charging batteries for recreational vehicles and sailboats.
One- to 10-kW turbines can be used in applications such as pumping water. Wind energy has been

Printed on 21 Aug 2023
Provided by WINDExchange at windexchange.energy.gov/small-wind-guidebook
used for centuries to pump water and grind grain. Although mechanical windmills still provide a
sensible, low-cost option for pumping water in low-wind areas, farmers and ranchers are finding that
wind- electric pumping is more versatile and they can pump twice the volume for the same initial
investment. In addition, mechanical windmills must be placed directly above the well, which may not
take advantage of available wind resources. Wind-electric pumping systems can be placed where
the wind resource is the best and connected to the pump motor with an electric cable. However, in
areas with a low wind resource, mechanical windmills can provide more efficient water pumping.
Turbines used in residential applications can range in size from 400 Watts to 100 kW (100 kW for
very large loads), depending on the amount of electricity you want to generate. For residential
applications, you should establish an energy budget and see whether financial incentives are
available. This information will help determine the turbine size you will need. Because energy
efficiency is usually less expensive than energy production, making your house more energy
efficient will probably be more cost effective and will reduce the size of the wind turbine you need
Wind turbine manufacturers, dealers, and installers can help you size your system based on your
electricity needs and the specifics of your local wind resource and micro-siting.
A typical home uses approximately 10,649 kilowatt-hours (kWh), an average of 877 kWh per month
Depending on the average wind speed in the area, a wind turbine rated in the range of 5 to 15 kW
would be required to make a significant contribution to this demand. A 1.5-kW wind turbine will
meet the needs of a home requiring 300 kWh per month in a location with a 14 MPH (6.26 meters
per second) annual average wind speed. The manufacturer, dealer, or installer can provide you
with the expected annual energy output of the turbine as a function of annual average wind speed.
The manufacturer will also provide information about any maximum wind speeds at which the
turbine is designed to operate safely. Most turbines have automatic overspeed- governing systems
to keep the rotor from spinning out of control in extremely high winds.
Along with information about your local wind resource (wind speed and direction) and your energy
budget, this information will help you decide which size turbine will best meet your electricity
needs.
Home wind energy systems generally comprise a rotor, a generator
or alternator mounted on a frame, a tail (usually), a tower, wiring,
and the "balance of system" components: controllers, inverters,
and/or batteries. Through the spinning blades, the rotor captures
the kinetic energy of the wind and converts it into rotary motion to
drive the generator, which produces either AC or wild AC (variable
frequency, variable voltage), which is typically converted to grid-
compatible AC electricity.
Wind Turbine
Small wind turbines can be divided into two groups: horizontal axis and vertical axis. The most
commonly used turbine in today's market is the horizontal- axis wind turbine. These turbines
typically have two or three blades that are usually made of a composite material such as
fiberglass. Vertical-axis wind turbines consist of two types: Savonius and Darrieus. A Savonius
turbine can be recognized by its "S" shaped design when viewed from above. Darrieus turbines
look like an eggbeater and have vertical blades that rotate into and out of the wind.
The amount of power a horizontal-axis turbine will produce is determined by the diameter of its
rotor. The diameter of the rotor defines its "swept area," or the quantity of wind intercepted by the
turbine. The turbine's frame is the structure onto which the rotor, generator, and tail are attached.
The tail keeps the turbine facing into the wind.
What Are the Basic Parts of a Small Wind Electric System?

Printed on 21 Aug 2023
Provided by WINDExchange at windexchange.energy.gov/small-wind-guidebook
Tower
Because wind speeds increase with height, the turbine is
mounted on a tower. In general, the higher the tower, the
more power the wind system can produce. The tower also
raises the turbine above the air turbulence that can exist
close to the ground because of obstructions such as hills,
buildings, and trees. A general rule of thumb is to install a
wind turbine on a tower with the bottom of the rotor blades
at least 30 feet (9 meters) above any obstacle that is within
300 feet (90 meters) of the tower. Relatively small
investments in increased tower height can yield very high rates of return in power production.
Tilt-down towers provide easy maintenance for turbines.
There are two types of towers: self-supporting (free-standing) and guyed. Guyed towers, which
are the least expensive, can consist of lattice sections, pipe, or tubing (depending on the design);
supporting guy wires; and the foundation. They are easier to install than self-supporting towers.
However, because the guy radius must be one-half to three-quarters of the tower height, guyed
towers require space to accommodate them. Although tilt-down towers are more expensive, they
offer the consumer an easy way to perform maintenance on smaller lightweight turbines (usually 5
kW or smaller). Tilt- down towers can also be lowered to the ground during hurricanes and other
hazardous weather conditions. Aluminum towers are prone to cracking and should be avoided.
Most turbine manufacturers provide wind energy system packages that include a range of tower
options.
Balance of System
Costs in addition to the turbine and the tower are the balance of system, including parts and labor,
which will depend on your application. Most manufacturers can provide you with a system package
that includes all the parts you need for your application. For example, the parts required for a water-
pumping system will be different from the parts required for a residential, grid-connected application.
The balance of system equipment required will also depend on whether the system is grid-
connected, stand-alone, or part of a hybrid system. For a residential grid-connected application,
the balance of system parts may include a controller, storage batteries, a power conditioning unit
(inverter), wiring, foundation, and installation. Many wind turbine controllers, inverters, or other
electrical devices may be stamped by a recognized testing agency, such as Underwriters
Laboratories or Intertek.
Batteries for Stand-Alone Systems
Stand-alone systems (systems not connected to the utility grid) require batteries to store excess
power generated for use when the wind is calm. They also need a charge controller to keep the
batteries from overcharging. Deep-cycle batteries, such as those used for golf carts, can discharge
and recharge 80% of their capacity hundreds of times, which makes them a good option for
remote renewable energy systems. Automotive batteries are shallow-cycle batteries and should not
be used in renewable energy systems because of their short life in deep-cycling operations.
Small wind turbines generate direct current (DC) electricity. In very small systems, DC appliances
operate directly off the batteries. If you want to use standard appliances that use conventional
household alternating current (AC), you must install an inverter to convert DC electricity from the
batteries to AC. Although the inverter slightly lowers the overall efficiency of the system, it allows
the home to be wired for AC, a definite plus with lenders, electrical code officials, and future
homebuyers.
For safety, batteries should be isolated from living areas and electronics because they contain
corrosive and explosive substances. Lead-acid batteries also require protection from temperature
extremes.

Printed on 21 Aug 2023
Provided by WINDExchange at windexchange.energy.gov/small-wind-guidebook
What Do Wind Systems Cost?
How Do I Find a Certified Small Wind Turbine?
Where Can I Find Installation and Maintenance Support?
Inverters for Grid-Connected Systems
In grid-connected systems, the only additional equipment required is a power conditioning unit
(inverter) that makes the turbine output electrically compatible with the utility grid. Batteries are
usually not required.
Installation costs vary greatly depending on local zoning, permitting, and utility interconnection
costs. The capacity-weighted average cost of small wind projects installed in 2021 was
$5,120/kilowatt (based on 16 projects in three states for a combined rated capacity of 396 kW).
Although wind energy systems involve a significant initial investment, they can be competitive with
conventional energy sources when you account for a lifetime of reduced or avoided utility costs.
The length of the payback period—the time before the savings resulting from your system equal
the cost of the system—depends on the system you choose, the wind resource on your site,
electricity costs in your area, and how you use your wind system.
Compare prices when shopping for a wind system as you would any major purchase by reviewing the
product literature from several manufacturers.
To justify your investment in a small wind turbine, you will want assurances that your turbine
model has been evaluated for safety, performance, and functionality. The following resources will
help you.
The Small Wind Certification Council provides independent, accredited certification of small
wind turbines and consumer information, and you should familiarize yourself with this
material.
The National Renewable Energy Laboratory's (NREL's) National Wind Technology Center
provides information about NREL's small wind turbine testing and development. The U.S.
Department of Energy (DOE) and NREL have selected four partners (Intertek Testing Services
NA, Inc. in New York, Kansas State University, The Alternative Energy Institute at West
Texas A&M University, and Windward Engineering, LLC in Utah) to establish small wind
Regional Test Centers to conduct tests on small wind turbines to meet national and
international standards. Reports from these Regional Test Centers are available for
consumers.
The Interstate Turbine Advisory Council (ITAC) compiles a national unified list of small and mid-
size wind turbines eligible for incentive funding from ITAC state and utility member programs.
As a collaborative and common inventory of turbines, the unified list assures customers that
rate- or taxpayer funding is “supporting the installation of technology with a demonstrated
record of durability, safety, and warranty service, as well as reasonable acoustic and
performance characteristics.”
Research small wind turbine companies to be sure they offer certified turbines and that parts and
service will be available when you need them. Ask for references from past customers with
installations similar to the one you are considering. Ask the system owners about performance,
reliability, and maintenance and repair requirements, and whether the system is meeting their
expectations. Also, find out how long the warranty lasts and what it includes.
You must decide whether you will perform the installation and maintenance work on your small
wind turbine or whether you will hire an experienced small wind installer. This decision will affect
your system's cost. Many people elect to install their own turbines.

Printed on 21 Aug 2023
Provided by WINDExchange at windexchange.energy.gov/small-wind-guidebook
How Much Energy Will My System Generate?
Before attempting to install your wind turbine, ask yourself the following questions:
•Can I pour a proper cement foundation?
•Do I have access to a lift or a way to safely erect the tower?
•Do I know the difference between AC and DC wiring?
•Do I know enough about electricity to safely wire my turbine?
•Do I know how to safely handle and install batteries?
If you answered no to any of the above questions, you should probably hire a system integrator or
installer. Contact the manufacturer for help or call your state energy office and local utility for a list
of local system installers. A credible installer may be able to provide many services such as
permitting, obtaining interconnection approval, etc. Find out if the installer is a licensed electrician.
Ask for references and check them. You may also want to check with the Better Business Bureau.
Turbine and tower manufacturers should provide their own operations and maintenance plan;
however, turbine owners should be aware that all rotating equipment will require some
maintenance. Many turbines require periodic lubrication, oil changes, and replacement of wear
surfaces such as brake pads. Bolts and electrical connections should be checked and tightened if
necessary. The machines should be checked for corrosion and the guy wires for proper tension. In
addition, you should check for and replace any worn leading edge tape on the blades, if appropriate.
After 10 years, the blades or bearings may need to be replaced, but with proper installation and
maintenance, the machine should last 20 years or longer.
Every turbine should include an owner's manual or operations manual to provide the consumer
with scheduled and unscheduled maintenance information as well as other unique product
information. Scheduled maintenance guidelines should be followed. If you do not have the
expertise to maintain the machine, ask whether your installer provides a service and maintenance
program.
According to the AWEA Small Wind Turbine Performance and Safety Standard, the Rated Annual
Energy of a wind turbine is the calculated total energy that would be produced during a 1-year
period with an average wind speed of 5 meters/second (m/s, or 11.2 mph). The following formula
illustrates factors that are important to the performance of a wind turbine. Notice that the wind
speed (V) has an exponent of 3 applied to it. This means that even a small increase in wind speed
results in a large increase in power. That is why a taller tower will increase the productivity of any
wind turbine by giving it access to higher wind speeds.
The formula for calculating the power from a wind turbine is:
Power = Cp 1/2 ρ A V³
Where:

Printed on 21 Aug 2023
Provided by WINDExchange at windexchange.energy.gov/small-wind-guidebook
Is There Enough Wind on My Site?
•P = Power output, watts
•Cp = Maximum power coefficient, ranging from 0.25 to 0.45,
dimension less (theoretical maximum = 0.59) ρ = Air density, kg/m³
•A = Rotor swept area, m² or
•π D² / 4 (D is the rotor
diameter in m, π = 3.1416)
•V = Wind speed, mps
The rotor-swept area (A) is important because the rotor captures the wind energy. So the larger
the rotor, the more energy it can capture. The air density, ρ, changes slightly with air temperature
and with elevation. The ratings for wind turbines are based on standard conditions of 59° F (15° C)
at sea level. A density correction should be made for higher elevations as shown in the Air Density
Change with Elevation graph. A correction for temperature is typically not needed for predicting the
long-term performance of a wind turbine.
Although the calculation of wind power illustrates
important features about wind turbines, the best
measure of wind turbine performance is annual energy
output. The difference between power and energy is
that power (kilowatts [kW]) is the rate at which
electricity is consumed while energy (kilowatt-hours
[kWh]) is the quantity consumed. An estimate of the
annual energy output from your wind turbine,
kWh/year, is the best way to determine whether a
particular wind turbine and tower will produce enough
electricity to meet your needs. Contact a wind turbine
manufacturer, a dealer/installer, or a site assessor to help you estimate the energy production you
can expect. They will use a calculation based on the particular wind turbine power curve, the
average annual wind speed at your site, the height of the tower that you plan to use, micro-siting
characteristics of your site and, if available, the frequency distribution of the wind (an estimate of
the number of hours that the wind will blow at each speed during an average year). They should
also adjust this calculation for the elevation of your site.
To get a preliminary estimate of the performance of a particular wind turbine, use the formula below.
AEO = 0.01328 D² V³
Where:
•AEO = Annual energy output, kWh/year
•D = Rotor diameter, feet
•V = Annual average wind speed, mph
The Wind Energy Payback Period Workbook is a Microsoft Excel spreadsheet tool that can help you
analyze the economics of a small wind electric system and decide whether wind energy will work for
you. It asks you to provide information about how you will finance the system, the characteristics of
your site, and the properties of the system you're considering. It then provides you with a simple
payback estimation (assumes no increase in electricity rates) in years. If the number of years
required to regain your capital investment is greater than or almost equal to the life of the system,
then wind energy will not be practical for you.
Is the wind resource at your site good enough to justify your investment in a small wind turbine
system? That is a key question and not always easily answered. The wind resource can vary
significantly over an area of just a few miles because of local terrain influences on the wind flow.
Yet, there are steps you can take to answer the above question.
The highest average wind speeds in the United States are generally found along seacoasts, on
ridgelines, and on the Great Plains however, many areas have wind resources strong enough to
make a small wind turbine project economically feasible.

Printed on 21 Aug 2023
Provided by WINDExchange at windexchange.energy.gov/small-wind-guidebook
Although there may be many methodologies for
understanding the wind resource at a specific
location, gathering on-site, measured wind data is
typically preferred.
Prior to conducting an on-site measurement campaign,
some small wind project developers use state wind
maps to conservatively estimate the wind resource at
turbine hub height. While these maps can provide a
general indication of good or poor wind resources, they
do not provide a resolution high enough to identify local
site features. State wind maps cannot include
information on complex terrain, ground cover, wind
speed distribution, direction distribution, turbulence
intensity, and other local effects. Purchased maps or
services can often provide higher resolution and more
flexibility with zooming, orientation, and additional
features. Pay attention to a map's height above ground
as it relates to the potential project's tower height.
Adjusting the wind speed for the height difference between the map and the turbine height adds a
potential source of error depending on the wind shear exponent that is selected, and the greater the
height difference the greater the potential error. Therefore, for small wind generator applications,
30-to 40-m wind maps are far more useful than 10-, 60-, 80-, or 100-m wind maps. It is also
important to understand the resolution of the wind map or model-generated data set. If the
resolution is lower than the terrain features, adjustments will be needed to account for local terrain
effects.
Local airport or weather stations can offer local wind data, but these data may be less reliable than
actual site data. If airport data (typically recorded at 30 ft or 10 m above ground) or weather station
data (typically recorded at 5 to 20 ft above ground) are used, inquire not only about the site's
current equipment and location but also if it is historically consistent with the data collection
equipment and siting. Equipment at these sites is not primarily intended for wind resource
assessment, so it may not be positioned at an appropriate height or in a location free of obstructions.
Unfortunately, airport and weather stations are usually far from the site of interest, with considerably
different topography, tree cover, and monitoring height, making these data of questionable
usefulness. Given the expertise required to effectively establish and correlate wind resource data,
the data provided by airport and weather stations may only provide a rough screening assessment.
Average wind speeds increase with height and may be 15% to 25% greater at a typical wind turbine
hub height of 80 ft (24 m) than those measured at airport anemometer heights. The National
Climatic Data Center collects data from airports in the United States and makes wind data
summaries available for purchase.
Another useful indirect measurement of the wind resource is
the observation of an area's vegetation. Trees, especially
conifers or evergreens, can be permanently deformed by
strong winds. This deformity, known as "flagging," has been
used to estimate the average wind speed for an area.
Flagging, the effect of strong winds on area vegetation, can
help determine area wind speeds. Small wind site assessors
can help you determine whether you have a good wind
resource on your site. State or utility incentive programs may
be able to refer you to site assessors with training in
assessing the wind resource at specific sites. Computer
programs that estimate the wind resource at a particular site
given specific obstacles are also available. Site assessors and
computer programs can help to refine the estimates provided on wind resource maps.

Printed on 21 Aug 2023
Provided by WINDExchange at windexchange.energy.gov/small-wind-guidebook
On-site data measurement adds a new layer of confidence to the techniques discussed above, but
with substantial additional costs, effort, and time, especially when the preferred methodology is to
match turbine hub height and collect data for a minimum of 1 year. Obtaining several years of
data is better, or 1 year that can be referenced to a longer-term data set if there is good correlation
with the on-site data. A number of small, affordable wind data collection systems are available for
on-site measurement and are best run for at least 1 year. These systems include anemometers,
wind vanes, and temperature sensors that are mounted as close to hub height as possible.
Calculating the wind shear exponent requires collecting data at two different heights. Having wind
shear data is essential for conducting an accurate analysis of the cost versus benefits of taller
towers. In addition, analysis must be performed to determine wind speed averages and extremes,
wind distribution, Weibull parameters, the wind direction rose, turbulence intensity, vertical wind
shear exponent, and associated uncertainties.
Finally, if there is a small wind turbine system in your area, you may be able to obtain information
on the annual output of the system and also wind speed data if available.How Do I Choose the
Best Site for My Wind Turbine?
The farther you place your wind turbine from obstacles such as buildings or trees, the less turbulence
you will encounter.
A proper site assessment is a detailed process that includes wind resource assessment and the
evaluation of site characteristics. With this in mind, you may wish to consider hiring an experienced
small wind site assessor who can determine your property's optimal turbine location. The following
information highlights key steps in the site selection/assessment process.
If the surrounding area of a potential site is not relatively flat for several miles, then an evaluation
of the main topographic features is necessary, both nearby (macro siting) and at the proposed
turbine site (micro siting). The topographical evaluation should include shape, height, length, width,
and distance and direction away from the proposed turbine site of any landforms. "Nearby" could
include influences from large objects such as hills, groves of trees, or high wind breaks up to a
mile away, and smaller objects could include single trees and buildings, especially within 500 feet
of the proposed turbine location.
Owners of projects located near complex terrain should take care in selecting the installation site.
Landforms (or orography) can influence wind speed, which affects the amount of electricity that a
wind turbine can generate. Elevated areas not only experience increased wind speeds because of
their increased height in the wind profile but also may cause local acceleration of the wind speed,
depending on the size and shape of the landform. If you site your wind turbine on the top of or on
the windy side of a hill, for example, you will have more access to prevailing winds than in a gully or
on the leeward (sheltered) side of a hill on the same property. Other elevated landforms (bluffs,
cliffs) can create turbulence, including back eddies, as the wind passes up and over them. Siting the
tower to avoid the zones of turbulence created by the landform is critical.
Turbulence intensity is a major issue for small turbines because of their tower height and location
around "ground clutter." Turbulence can reduce the annual energy output estimate from 15% to

Printed on 21 Aug 2023
Provided by WINDExchange at windexchange.energy.gov/small-wind-guidebook
Can I Connect My System to the Utility Grid?
25% because wind turbine power curves are typically developed based on measurements taken
at sites with relatively low turbulence intensity compared to typical small wind project sites.
Varied wind resources can exist within the same property. In addition to measuring or finding the
annual wind speeds, you need to know about the prevailing directions of the wind at your site.
Knowing the prevailing wind direction(s) is essential to determining the impact of obstacles and
landforms when seeking the best available site location and estimating the wind resource at that
location. To help with this process, small wind site assessors typically develop a wind rose, which
shows the wind direction distributions of a given area. The wind rose divides a compass into
sectors (usually 8 or 16) and indicates the average wind speed, average percentage of time that the
wind blows from each direction, and/or the percentage of energy in the wind by sector. Wind roses
can be generated based on annual average wind speeds, or by season, month, or even time of day
as needed.
In addition to geologic formations, you need to consider existing obstacles such as trees, houses,
and sheds, and you need to plan for future obstructions such as new buildings or trees that have
not reached their full height. Your turbine needs to be sited upwind of buildings and trees, and it
needs to be 30 feet above anything within a 500-foot horizontal radius. You also need enough
room to raise and lower the tower for maintenance, and if your tower is guyed, you must allow
room for the guy wires.
Whether the system is stand-alone or grid-connected, you also need to consider the length of the
wire run between the turbine and the load (house, batteries, water pumps, etc.). A substantial
amount of electricity can be lost as a result of the wire resistance—the longer the wire run, the
more electricity is lost. Using more or larger wire will also increase your installation cost. Your wire
run losses are greater when you have direct current (DC) instead of alternating current (AC). So, if
you have a long wire run, it is advisable to invert DC to AC.
You may wish to consider hiring an experienced small wind site assessor who can determine where the
turbine should be located on your property.
Wind Turbines Mounted on Buildings
While there have been instances of wind turbines mounted on rooftops, it should be noted that all
wind turbines vibrate and transmit the vibration to the structure on which they are mounted. This can
lead to noise problems within the building. Also, the wind resource on the rooftop is in an area of
increased turbulence, which can shorten the life of the turbine and reduce energy production.
Additional costs related to mitigating these concerns, combined with the fact that they produce less
power, make rooftop-mounted wind turbines less cost-effective than small wind systems that are
installed on a tower connected to the ground.
Small wind energy systems can be connected to the electricity distribution system. A grid-connected
wind turbine can reduce your consumption of utility- supplied electricity for lighting, appliances, and
electric heat. If the turbine cannot deliver the amount of energy you need, the utility makes up the
difference. When the wind system produces more electricity than the household requires, the
excess is sent or sold to the utility. These arrangements with the utility company are typically called
net metering or net billing, and they address the value of the electricity sold or net excess
generation, the time period for valuing the electricity (typically annually or monthly), and any other
contractual requirements with the utility.
Grid-connected systems can be practical if the following conditions exist:
•You live in an area with average annual wind speed of at least 10 mph (4.5 m/s).
•Utility-supplied electricity is expensive in your area (about 10 to 15 cents per kilowatt-hour).
•The utility's requirements for connecting your system to its grid are not prohibitively expensive.
•There are good incentives for the sale of excess electricity, sale of the renewable energy credit,
and/or for the purchase of wind turbines.

Printed on 21 Aug 2023
Provided by WINDExchange at windexchange.energy.gov/small-wind-guidebook
A grid-connected wind turbine can reduce your consumption of utility-supplied electricity.
Federal regulations (the Public Utility Regulatory Policies Act of 1978, or PURPA) require utilities
to connect with and purchase power from small wind energy systems. However, you should contact
your utility before purchasing a wind turbine system and connecting to their distribution lines to
address any power quality and safety concerns. Your utility can provide you with a list of
requirements for connecting your system to the grid.
Net Metering
Net metering programs are designed to allow the electric meters of customers with generating
facilities to "turn backwards" when their generators are producing more energy than the
customers' demand. Net metering allows customers to use their generation to offset their
consumption over the entire billing period, not just instantaneously. This offset would enable
customers with generating facilities to receive retail prices for more of the electricity they
generate.
Net metering varies by state and by utility company, depending on whether net metering was
legislated or directed by the Public Utility Commission. Net metering programs specify a way to
handle the net excess generation (NEG) in terms of payment for electricity and/or length of time
allowed for NEG credit. If the net metering requirements define NEG on a monthly basis,
consumers can only receive credit for their excess that month. But if the net metering rules allow
for annual NEG, the NEG credit can be carried for up to a year. Most of North America sees more
wind in the winter than in the summer. For people using wind energy to displace a large load in
the summer (like air conditioning or irrigation water pumping), having an annual NEG credit
allows them to produce NEG in the winter and receive credits in the summer.
Safety Requirements
Whether or not your wind turbine is connected to the utility grid, the installation and operation of the
wind turbine is probably subject to the electrical codes that your local city or county government, or
in some instances your state government, has in place. The government's principal concern is the
safety of the facility, so these code requirements emphasize proper wiring and installation and the
use of components that have been certified for fire and electrical safety by approved testing
laboratories, such as Underwriters Laboratories. Most local electrical codes requirements are based
on the National Electrical Code (NEC), which is published by the National Fire Protection
Association. The latest version of the NEC includes sections specific to the installation of small
wind energy facilities. It is available for purchase online at the National Fire Protection Association
website and can also be found at most local libraries.

Printed on 21 Aug 2023
Provided by WINDExchange at windexchange.energy.gov/small-wind-guidebook
If your wind turbine is connected to the local utility grid so that any of the power produced by your
wind turbine is delivered to the grid, then your utility also has legitimate concerns about safety and
power quality that need to be addressed. The utility's principal concern is that your wind turbine
automatically stops delivering any electricity to its power lines during a power outage. Otherwise
line workers and the public, thinking that the line is "dead," might not take normal precautions and
might be hurt or even killed by the power from your turbine. Another concern among utilities is
whether the power from your facility synchronizes properly with the utility grid and it matches the
utility's power in terms of voltage, frequency, and power quality.
A few years ago, some state governments started developing new standardized interconnection
requirements for small renewable energy generating facilities (including wind turbines). In most
cases, the new requirements are based on consensus-based standards and testing procedures
developed by independent third-party authorities, such as the Institute of Electrical and Electronic
Engineers (IEEE) and Underwriters Laboratories. Utility companies will typically require compliance
with IEEE 1547, which addresses electrical safety requirements for wind turbine systems. Some
utilities may require appropriate electrical listing before allowing interconnection of the wind system.
Interconnection Requirements
In most cases, it is quite advantageous to interconnect a small turbine with the customer's utility
service, thereby using the utility for backup power to cover the variability of the turbine's energy
production as well as storage of excess energy. Such interconnection typically requires utility
permission, which is usually in the form of an interconnection agreement. This agreement will
address metering and billing arrangements with the utility and may include requirements for
additional safety equipment or procedures, protection devices, and inspections.
In states that have retail competition for electricity service (e.g., your utility operates the local wires,
but you have a choice of electricity provider), you may have to sign a separate agreement with each
company. Usually these agreements are written by the utility or the electricity provider. In the case of
private (investor-owned) utilities, the terms and conditions in these agreements must be reviewed
and approved by state regulatory authorities.
Insurance
Some utilities require small wind turbine owners to maintain liability insurance in amounts of $1
million or more to protect them from liability for facilities they do not own and have no control over.
Other utilities consider the insurance requirements excessive and unduly burdensome, making wind
energy uneconomic. In seven states (California, Georgia, Maryland, Nevada, Oklahoma, Oregon,
and Washington), laws or regulatory authorities prohibit utilities from imposing any insurance
requirements on small wind systems that qualify for net metering. In at least two other states (Idaho,
Virginia), regulatory authorities have allowed utilities to impose insurance requirements but have
reduced the required coverage amounts to levels consistent with conventional residential or
commercial insurance policies (e.g., $100,000 to $300,000). If your insurance amounts seem
excessive, you can ask for a reconsideration from regulatory authorities (in the case of private
investor-owned utilities) or the utility's governing board (in the case of publicly owned utilities).
Indemnification
An indemnity is an agreement between two parties in which one agrees to secure the other
against loss or damage arising from some act or some assumed responsibility. In the context of
customer-owned generating facilities, utilities often want customers to indemnify them for any
potential liability arising from the operation of the customer's generating facility. Although the
basic principle is sound—utilities should not be held responsible for property damage or personal
injury attributable to someone else—indemnity provisions should not favor the utility but should be
fair to both parties. Look for language that says, "each party shall indemnify the other . . ." rather
than "the customer shall indemnify the utility . . ."

Printed on 21 Aug 2023
Provided by WINDExchange at windexchange.energy.gov/small-wind-guidebook
Customer Charges
Customer charges can take a variety of forms, including interconnection charges, metering
charges, and standby charges. You should not hesitate to question any charges that seem
inappropriate to you. Federal law (Public Utility Regulatory Policies Act of 1978, or PURPA, Section
210) prohibits utilities from assessing discriminatory charges to customers who have their own
generation facilities.
A hybrid system that combines a wind system with a solar and/or diesel generator can provide reliable
off-grid power around the clock.
Hybrid Systems
Hybrid wind energy systems can provide reliable off-grid power for homes, farms, or even entire
communities (a co-housing project, for example) that are far from the nearest utility lines.
According to many renewable energy experts, a "hybrid" system that combines wind and
photovoltaic (PV) technologies offers several advantages over either single system. In much of the
United States, wind speeds are low in the summer when the sun shines brightest and longest. The
wind is strong in the winter when less sunlight is available and may be stronger at night compared
to the day. Because the peak operating times for wind and PV occur at different times of the day
and year, hybrid systems are more likely to produce power when you need it.
For the times when neither the wind turbine nor the PV modules are producing, most hybrid
systems provide power through batteries and/or an engine- generator powered by conventional
fuels such as diesel. If the batteries run low, the engine-generator can provide power and
recharge the batteries.
Adding an engine-generator makes the system more complex, but modern electronic controllers can
operate these systems automatically. An engine- generator can also reduce the size of the other
components needed for the system. Keep in mind that the storage capacity must be large enough to
supply electrical needs during non-charging periods. Battery banks are typically sized to supply the
electric load for 1 to 3 days.

Printed on 21 Aug 2023
Provided by WINDExchange at windexchange.energy.gov/small-wind-guidebook
Glossary of Terms
An off-grid hybrid system may be practical for you if:
•You live in an area with an average annual wind speed of at least 9 mph (4 m/s).
•A grid connection is not available or can only be made through an expensive extension. (The cost of
running a power line to a remote site to connect with the utility grid can be prohibitive, ranging from
$15,000 to more than $50,000 per mile, depending on terrain.)
•You would like to gain energy independence from the utility.
•You would like to generate clean power.
Airfoil—The shape of the blade cross-section, which for most modern horizontal-axis wind
turbines is designed to enhance the lift and improve turbine performance.
Alternator—An electric generator for producing alternating current. See also generator.*
Ambient—Of the surrounding area or environment; completely surrounding; encompassing. Used
to distinguish environmental conditions, e.g. temperature or sound, from what is added by
mechanical devices.*
Ampere-hour—A unit for the quantity of electricity obtained by integrating current flow in amperes
over the time in hours for its flow; used as a measure of battery capacity.
Anemometer—A device to measure the wind speed.
Availability—A measure of the ability of a wind turbine to make power, regardless of
environmental conditions. Generally defined as the time in a period when a turbine is able to
make power, expressed as a percentage.*
Average wind speed—The mean wind speed over a specified period of time.
Beaufort scale—A scale of wind forces, described by name and range of velocity, and classified
from force 0 to 12, with an extension to 17. The initial (1805) Francis Beaufort wind force scale of
13 classes (0 to 12) did not reference wind speed numbers but related qualitative wind conditions
to effects on the sails of a frigate, then the main ship of the Royal Navy, from "just sufficient to give
steerage" to "that which no canvas sails could withstand." Although the Beaufort scale has little
use in site assessments, a system of tree flagging observations has been used to estimate
prevailing wind directions and levels on the scale over time.
Behind-the-meter / behind-the-fence generation—An electrical generating system connected
on the user's side of a utility meter, primarily for energy usage on site instead of for sale to energy
retailers. See also net metering.*
Betz limit—The maximum power coefficient (Cp) of a theoretically perfect wind turbine equal to
16/27 (59.3%) as proven by German physicist Albert Betz in 1919. This is the maximum amount of
power that can be captured from the wind. In reality, this limit is never achived because of drag,
electrical losses, and mechanical inefficiencies. See also Cp.*
Certification—A process by which small wind turbines (100 kW and under) can be certified by an
independent certification body to meet or exceed the performance and durability requirements of
the American Wind Energy Association (AWEA) Standard.*
Cp—Power coefficient; the ratio of the power extracted from the wind by a wind turbine relative to the
power available in the wind. See alsoBetz limit.*
Cut-in wind speed—The wind speed at which a wind turbine begins to generate electricity.
Cut-out wind speed—The wind speed at which a wind turbine ceases to generate electricity.

Printed on 21 Aug 2023
Provided by WINDExchange at windexchange.energy.gov/small-wind-guidebook
Direct drive—A blade and generator configuration where the blades are connected directly to the
electrical generating device so that one revolution of the rotor equates to one revolution of the
electrical generating device.*
Displacement height—The height above ground level where wind speed is theoretically zero based on
the effects of ground cover.
Distributed generation—Energy generation projects where electrical energy is generated
primarily for on-site consumption. Term is applied for wind, solar, and non-renewable energy.*
Drag—An aerodynamic force that acts in the direction of the airstream flowing over an airfoil.*
Dual-metering—Buying electricity from the utility and selling it to the utility with two different energy
rates, typically retail (buying) and wholesale (selling).
Electric cost adjustment—An energy charge (dollars per kilowatt-hour) on a utility bill in addition to
the standard rate in the tariff, which is associated with extra costs to purchase fuel, control
emissions, construct transmission upgrades, and so on. These various costs may be itemized or
rolled into one electric cost adjustment rate. Sometimes referred to as fuel cost adjustment.
Electric utility company—A company that engages in the generation, transmission, and distribution
of electricity for sale, generally in a regulated market. Electric utilities may be investor owned,
publicly owned, cooperatives, or nationalized entities.*
Energy curve—A diagram showing the annual energy production at different average wind speeds,
typically assuming a Rayleigh wind distribution (with a Weibull shape factor of 2.0).
Energy production—Energy is power exerted over time. Energy production is hence the energy
produced in a specific period of time. Electrical energy is generally measured in kilowatt-hours (
kWh). See also power.*
Flagging—The deformation of local vegetation toward one direction, indicating the prevailing wind
direction and relative strength (more formally called Krummholtz formation). Flagging is sometimes
used with the Beaufort scale to generate an initial estimate of local site conditions. (Note: flagging
does not determine the wind resource, but is a confirming indicator of it. For example, sometimes
flagging is the result of sunlight availability, or trimming of tree branches near electrical lines. The
assessor needs to understand when flagging is relevant, or when it is a confirming indicator of
another condition at the site.)
Frequency distribution—A statistical function presenting the amount of time at each wind speed
level for a given data set and location, usually in percent of time or hours per year.
Furling—A passive protection for the turbine in which the rotor folds up or around the tail vane.
Gearbox—A compact, enclosed unit of gears or the like for the purpose of transferring force
between machines or mechanisms, often with changes of torque and speed. In wind turbines,
gearboxes are used to increase the low rotational speed of the turbine rotor to a higher speed
required by many electrical generators.*
Generator—A machine that converts mechanical energy to electricity. The mechanical power for
an electric generator is usually obtained from a rotating shaft. In a wind turbine, the mechanical
power comes from the wind causing the blades on a rotor to rotate. See also blade, rotor, stator,
alternator.*
Governor—A device used to limit the RPM of the rotor. Limiting RPM serves to reduce centrifugal
forces acting on the wind turbine and rotor as well as limit the electrical output of the generating
device. Governors can be electrical, also know as "dynamic braking," or mechanical. Mechanical
governors can be "passive," using springs to pitch the blades out of their ideal orientation, or an
offset rotor that pitches out of the wind, or "active" by electrically or hydraulically pitching blades out
of their ideal orientation.*
Printed on 21 Aug 2023
Provided by WINDExchange at windexchange.energy.gov/small-wind-guidebook
Grid—The utility distribution system. The network that connects electricity generators to electricity users.
Grid-connected—Small wind energy systems that are connected to the electricity distribution
system. These often require a power-conditioning unit that makes the turbine output electrically
compatible with the utility grid. See also inverter.*
Gross annual energy production—The amount of annual energy (usually in kilowatt-hours)
estimated for a given wind turbine at a given location, before adjusting for losses (see net annual
energy production).
Guyline—A guyline (or guy wire) supports guyed towers, which are the least expensive way to
support a wind turbine. Guyed towers can consist of lattice sections, pipe, or tubing. Because the
guy radius must be one-half to three-quarters of the tower height, guyed towers require more
space to accommodate them than monopole or self-standing lattice towers.*
Horizontal-axis wind turbine (HAWT)—A wind turbine with a rotor axis that lies in or close to a
horizontal plane. Often called a "propeller-style" wind turbine.*
Hub—That component of a wind turbine to which the blades are affixed. See alsorotor, blade.*
Hub Height—The distance from the foundation to which the tower is attached to the center of the hub of
a HAWT.*
Induction generator—An asynchronous AC motor designed for use as a generator. Generates
electricity by being spun faster than the motor's standard "synchronous" speed. Must be
connected to an already-powered circuit to function (i.e. the grid), but does not require an inverter
to produce grid-ready electricity.*
Interannual variability—The variation from year to year in average wind speed, distribution, and
patterns.
Interconnection standards—Specifies the technical and procedural process by which a customer
connects an electricity-generating device to the grid. Such standards include the technical and
contractual terms that system owners and utilities must abide by. State public utility commissions
typically establish standards for interconnection to the distribution grid, while the Federal Energy
Regulatory Commission (FERC) establishes standards for interconnection to the transmission grid.
While many states have adopted interconnection standards, some states' standards apply only to
investor-owned utilities and not to municipal utilities or electric cooperatives.*
Intermittency—Stopping or ceasing for a time; alternately ceasing and beginning again. Wind
and solar resources are described as intermittent because they change without regard to peoples'
needs or wants.*
International Electrotechnical Commission (IEC)—The international wind-industry standards body.*
Inverter—A device that converts direct current (DC) to alternating current (AC).
kW—Kilowatt, a measure of power for electrical current (1,000 Watts).
kWh—Kilowatt-hour, a measure of energy equal to the use of 1 kilowatt in 1 hour.
Lift—An aerodynamic force that acts at right angles to the airstream flowing over an airfoil.*
Micrositing—A resource assessment tool used to determine the exact position of one or more
wind turbines on a parcel of land to optimize the power production.
Microturbine—A very small wind turbine, usually under a 1,000 Watt rating, which is appropriate
for small energy needs (e.g., for cabins, campers, sailboats, very small communication stations,
or other small off-grid loads).
Printed on 21 Aug 2023
Provided by WINDExchange at windexchange.energy.gov/small-wind-guidebook
Monopole—A freestanding type of tower that is essentially a tube, often tapered.*
MW—Megawatt, a measure of power (1,000,000 Watts).
Nacelle—The body of a propeller-type wind turbine, containing the gearbox, generator, blade hub, and
other parts.
Nameplate capacity—The power capacity of a generating device that is typically affixed to the
generating device. Nameplate capacity typically, but not necessarily, represents the maximum
continuous power output of the generating device.*
Net annual energy production—The amount of annual energy (usually in kilowatt hours)
produced or estimated for a given wind turbine at a given location, after subtracting losses from
the gross annual energy production. A variety of losses may be estimated for obstacle wind
shadows, turbulence, turbine wake effects, turbine availability, high-wind hysteresis effects,
electrical efficiency, blade icing, blade soiling and surface degradation, idling parasitic losses,
control errors, low temperature shutdown, utility system maintenance, and other issues specific to
a given turbine installation.
Net metering / net billing—For electric customers who generate their own electricity, net metering
allows for the flow of electricity both to and from the customer. When a customer's generation
exceeds the customer's use, electricity from the customer flows back to the grid, offsetting
electricity consumed by the customer at a different time during the same billing cycle. In effect, the
customer uses excess generation to offset electricity that the customer otherwise would have to
purchase at the utility's full retail rate. Net metering is required by law in most U.S. states, but state
policies vary widely. See also behind-the-meter.*
Obstruction—A general term for any significant object that would disturb wind flow passing
through a turbine rotor. Most common examples are homes, buildings, trees, silos, and fences.
Topographical features such as hills or cliffs that might also affect wind flow and are not called
obstructions.*
Off-grid—Energy-generating systems that are not interconnected directly into an electrical grid.
Energy produced in these systems is often used for battery charging.*
Orography—A branch of physical geography that deals with mountains.
Overall height—The total height of a wind turbine from its base at grade to its uppermost extent.
Peak demand—The maximum electricity consumption level (in kilowatts) reached during the
month or billing period, usually for a 15- or 30-minute duration. The definition of peak demand
may vary by electric utility. This is a simplified definition of a complex topic.
Peak power—The maximum instantaneous power than can be produced by a power-generating system
or consumed by a load. Peak power may be significantly higher than average power.*
Permitting—The process of obtaining legal permission to build a project, potentially from a
number of government agencies, but primarily from the local building department (i.e., the city,
county, or state). During this process, a set of project plans is submitted for review to assure that
the project meets local requirements for safety, sound, aesthetics, setbacks, engineering, and
completeness. The permitting agency typically inspects the project at various milestones for
adherence to the plans and building safety standards.
Power coefficient—The ratio of the power extracted by a wind turbine to the power available in the wind
stream.
Power curve—A chart showing a wind turbine's power output across a range of wind speeds.
Prevailing wind—The most common direction or directions that the wind comes from at a site.
Prevailing wind usually refers to the amount of time the wind blows from that particular direction
Printed on 21 Aug 2023
Provided by WINDExchange at windexchange.energy.gov/small-wind-guidebook
but may also refer to the direction the wind with the greatest power density comes from.*
PUC—Public Utility Commission, a state agency that regulates utilities. In some areas known as Public
Service Commission (PSC).
PURPA—Public Utility Regulatory Policies Act (1978), 16 U.S.C. § 2601.18 CFR §292 that refers to
small generator utility-connection rules.
Rated output capacity—The output power of a wind machine operating at the rated wind speed.
Rated wind speed—The lowest wind speed at which the rated output power of a wind turbine is
produced.
Reactive power—When the voltage and current waveforms for AC power are out of phase the
resulting instantaneous power flow is modeled as real power and reactive power. The presence
of reactive power increases the instantaneous current flow required to do work. The increase in
current flow results in additional line losses. The utility tariff for larger customers may include a
charge for reactive power compensation, measured in kilo-volt-amp- reactive.
Rotor—The rotating part of a wind turbine, including either the blades and blade assembly or the
rotating portion of a generator.
Rotor diameter—The diameter of the circle swept by the rotor.
Rotor speed—The revolutions per minute of the wind turbine rotor.
Shadow flicker—A moving shadow that occurs when rotating turbine blades come between the viewer
and the sun.
Small wind turbine—A wind turbine that has a rating of up to 100-kilowatts, and is typically installed
near the point of electric usage, such as near homes, businesses, remote villages, and other kinds of
buildings.
Start-up wind speed—The wind speed at which a wind turbine rotor will begin to spin. See alsoCut-in
wind speed.
Stator—The stationary part of a rotary machine or device, especially a generator or motor. Most
especially related to the collection of stationary parts in its magnetic circuits. The stator and rotor
interact to generate electricity in a generator and to turn the driveshaft in a motor.*
Swept area—The area swept by the turbine rotor, A = π R2, where R is the radius of the rotor. See also
rotor diameter.
Tip-speed ratio—The speed at the tip of the rotor blade as it moves through the air divided by the
wind velocity. This is typically a design requirement for the turbine.
Tower—A structure designed to support a wind turbine at a substantial height above grade in a
wind flow. Typical types include monopole, guyed lattice, and self-supporting lattice designs.*
Turbulence—The changes in wind speed and direction, frequently caused by obstacles.
Turbulence intensity—A basic measure of turbulence that is defined by the ratio of the standard
deviation of the wind speed to the mean wind speed. For wind energy applications this is typically
defined as a 10-minute average wind speed and standard deviation based on 1-second samples.
Turbulence intensity is important for wind energy applications because it has implications for both
power performance and turbine loading. Experience indicates that it can be a significant issue for
small turbines because of their tower height and location around ground clutter, which puts them in
the most turbulent area of the atmospheric boundary layer. The effects of turbulence on distributed
wind turbines can be seen in both power production and loading
Upwind rotor—A horizontal-axis wind turbine whose propeller is located upwind of the tower; a
Printed on 21 Aug 2023
Provided by WINDExchange at windexchange.energy.gov/small-wind-guidebook
wind turbine with an architecture such that the wind flow passes through the propeller prior to
flowing past the tower.*
Vertical-axis wind turbine (VAWT)—A wind turbine whose rotor spins about a vertical or near-vertical
axis.*
Wet stamp—Refers to a specific engineering review of a specific plan or set of drawings by an in-
state licensed engineer who subsequently approves the plan or drawings with his/her stamp. A
wet stamp implies an original stamped document, not a copy.*
Wind shadow—A turbulent and/or low-wind-speed region downwind of (behind) an object such as a
building, tower, or trees.
Wind shear—The difference in wind speed and direction over a relatively short distance in the
atmosphere. Wind shear can be broken down into vertical and horizontal components, with horizontal
wind shear seen across storm fronts and near the coast, and vertical shear seen typically near the
surface (though also at higher levels in the atmosphere near upper-level jets and frontal zones aloft).
Wind turbine—A mechanical device that converts kinetic energy in the wind into electrical energy.*
Yaw—The movement of the tower top turbine that allows the turbine to stay into the wind.
Zoning—Most land has been delegated to various zones by a region's local government and
building department officials (at the city, county, or state level [occasionally]). The zones control
types of land use, such as agricultural, residential, commercial, and industrial, and include
subcategories. Each type of zoning carries its own specific permitting restrictions, such as building
height and property line offsets (required separation distance).

1. Introduction
This resource guide was created to help New York State municipalities develop and adopt clean energy policies for their
comprehensive plans. A comprehensive plan, also called a master plan, is a written document containing goals, objectives,
and strategies to guide a community’s future development. Formally adopted by the local legislature, a comprehensive plan
steers the municipality’s physical and economic development and accommodates its social, environmental, and regional
concerns. As further described, comprehensive plans often incorporate environmental, economic, and sustainability
strategies, including language addressing clean energy development.
It is important to understand the role of local governments in land-use planning and regulation and in approving private
parties’ development applications. New York State empowered local governments to adopt land-use plans, regulate land-
uses, and review and approve development proposals through various boards, including legislatures, planning boards,
zoning boards of appeal, architectural review boards, historic preservation commissions, and conservation advisory
commissions. Each of these boards can facilitate or create barriers to clean energy facilities. The process of removing
barriers begins with planning, proceeds to zoning and land-use regulation changes, and concludes with streamlining the
review and approval process.
This resource guide is designed to show local governments how to develop and adopt policies and plans addressing clean
energy development by:
•Examining the importance of planning for clean energy development
•Showing the significance of adopting a policy resolution
•Identifying funding opportunities
•Appointing a special board to evaluate existing conditions
•Engaging the entire community in the process so clean energy policies, plans, and regulations reflect
community interests
•Presenting best practices to incorporate into planning
•Explaining the legally required process which municipalities must undergo to adopt a new comprehensive
plan
•Providing helpful resources and examples for reference
Commentary: Defining and Understanding “Clean Energy”
As established under the Clean Energy Standard (2016) and the Climate Leadership and Community Protection Act
(2019), New York has a suite of ambitious, economy-wide climate and energy goals driving the adoption of clean energy
technologies, policies, and programs across the state. To plan for this development, it is imperative municipalities
understand and clearly identify the technologies and strategies that they wish to encourage and/or regulate in their
communities.
A comprehensive definition of clean energy should reflect two key, related concepts:
•Zero-emission, renewable energy generating technologies
• Existing technologies, strategies, and concepts supporting the implementation of renewables or
reducing dependence on fossil fuels
Examples of renewable energy sources include:
•Solar
•Wind
•Hydroelectric
•Geothermal
•Tidal and wave energy
Examples of related technologies, concepts, and strategies include
:
•Battery energy storage systems
•Green hydrogen
•Fuel cell technologies
•Energy efficiency and conservation measures
•Electric vehicles and charging infrastructure
• Clean heating and cooling technologies
(e.g., ground source or air source heat pumps)
•Acquisition of Renewable Energy Certificates
Clean Energy and Your Comprehensive Plan For
Local Governments
Note: Many written article use "Clean Energy"
and "Renewable Energy" interchangeably.

2. Why Does Clean Energy Belong in a Comprehensive Plan?
Local governments engage in land-use planning to inventory a community’s needs and assets, develop a
shared vision for the future, and build consensus and support for actions to implement the plan. Local
governments should begin the process with a planning initiative because New York State’s zoning and
planning enabling acts require land-use regulations to be “in accordance with a comprehensive plan” or “in
accordance with a well considered plan.” (NYS Village Law § 7-704; Gen. City Law § 20(25); Town Law §
263.) If a locality adopts new land-use regulations without adopting or prior to updating a comprehensive
plan, and these regulations were subject to legal challenge or review, the courts will examine all of the
municipality’s land-use policies and actions (including existing applicable regulations) for evidence of the
comprehensive plan to which zoning and other land-use actions must conform. Thus, adopting or updating a
comprehensive plan to include clean energy prior to creating clean energy regulations may provide
significant legal protection for these regulations.
Commentary: Evidence of Comprehensive Planning
In the event that a municipality’s land-use regulations become subject to legal challenge or review, the courts will seek
to identify evidence of a comprehensive plan to which the regulations under review must conform. Municipal policies
and actions which may be reviewed by the courts include, but are not limited to, the following items:
• Municipal zoning laws and their legislative findings
• Previously adopted plans and policies
• Previous land-use decisions
• Minutes of the legislative body
• Existing conditions (or other) studies
• Environmental reviews and findings
Adherence to a community’s comprehensive plan is also a key consideration for municipalities wherein a major
renewable energy facility is proposed. Since 2020, in New York State, renewable energy facilities larger than
25 megawatts1 (MW), including solar, land-based wind, and other projects, are reviewed and permitted in
accordance with the regulations of
the NYS Office of Renewable Energy Siting (ORES). ORES regulations specifically require applicants to
submit a statement identifying and declaring whether the proposed facility is consistent with any applicable
local comprehensive plans, along with a copy of those plans and an indication of applicable plan sections (9
NYCRR § 900.2.4[h]). To this end, adopting a balanced, well-considered comprehensive plan that accounts for
clean energy may serve to articulate the community’s priorities and expectations for major renewable energy
facilities.
Because the New York State zoning enabling act requires that land-use regulations be in accordance with a
well-considered plan, the comprehensive plan should include language that addresses clean energy and lays
the policy foundation for
clean energy regulations. Comprehensive plans can accomplish this by including planning goals, objectives,
strategies, and implementation measures that facilitate clean energy development. To address local clean
energy resources, municipalities may choose to update the entire comprehensive plan or to amend it by
adopting a single component that only discusses a community’s clean energy resources. If financially limited in
its ability to completely update or amend the comprehensive plan, a municipality may choose to adopt a
separate functional plan addressing the community’s energy resources. A functional plan provides similar legal
protection for regulations.
1 New renewable energy projects between 20-25 MW, as well as projects in the initial stages of Article 10 review, may voluntarily opt-in to the ORES
review process.

Getting Started: Identify an Appropriate Plan Format & Process
Does your community
have an existing
Comprehensive Plan?
Was it adopted less than
10 years ago, or does it
require periodic review?
Consider amending your
existing Comprehensive
Plan to include clean energy
goals and objectives
Will your plan contain
a standalone clean
energy component?
Review the existing plan
and decide whether a
new plan or an update
is appropriate
Will you incorporate
clean energy goals and
objectives throughout
your plan as appropriate?
Create a new
Comprehensive Plan:
Evaluate your options
Ye s
Ye s No
No
Update an Existing Plan
Create a New Plan
Commentary: Land-Use Moratoria – What they are and how to use them effectively
A moratorium on development is a local law or ordinance suspending (for a reasonable time) property owners’ rights to
obtain development approvals. Moratoria are intended to grant a community time to consider, draft, and adopt land-use
plans or rules to respond to new or changing circumstances not adequately dealt with under its current laws.
A moratorium may be general or specific: a general moratorium prevents the consideration and approval of all
development in the community, while a specific moratorium only applies to a particular type of development or geographic
area. For example, municipalities in New York State have previously implemented moratoria focused solely on the
construction of docks, telephone antennas, wind turbines, and other types of development.
Communities should be cautious when considering the adoption of a moratorium. Moratoria involving the suspension of a
landowner’s right to use their property are often litigated and can be invalidated by the courts if the community is unable to
show the necessity for the moratorium and its reasonableness under the circumstances.
Key Considerations for Municipalities:
•A moratorium must be reasonable to avoid the risk of being challenged and voided by the courts.
-Reasonableness is best established by local legislative findings documenting the moratorium’s necessity in light
of health/safety risks or a new land-use problem that the municipality’s existing regulations were not designed to
handle.
-The more specific and legitimate the municipality’s plan and timetable for the moratorium are, the more likely
the moratorium will be found to be reasonable.
-Generally, courts are deferential to the local legislature’s findings. However, courts will void a moratorium
when there is proof of special facts showing that the municipality acted unreasonably, arbitrarily, or in bad
faith in adopting the moratorium.
•A moratorium must be adopted in conformance with all procedures required of any zoning or land-use action,
including notice, hearing, the formalities of adoption, and filing.
•A moratorium does not apply to approved projects where the developer has completed construction or has
undergone substantial construction in reliance on a development approval or permit.

3. Policy and Process Development
To address clean energy in a comprehensive plan, municipalities should adopt a policy resolution, identify
funding opportunities, appoint a special board, and evaluate existing conditions. These steps do not need to
be followed in the specific order presented, and many may happen simultaneously. To develop a strategy for
updating or creating a clean energy component for a comprehensive plan, communities may start by reviewing
their appropriate utility hosting capacity maps (see commentary box for additional details). Analyzing local
hosting capacity can help communities identify and account for areas with higher or lower potential for clean
energy development based on proximity and feasibility of interconnection to the grid.
Commentary: Hosting Capacity Maps
The “hosting capacity” of the local electric distribution system will affect clean energy development in a community.
Hosting capacity refers to an estimate of the location and quantity of new distributed energy resources (DER), such
as solar energy systems, which can be interconnected without adversely impacting power quality or requiring costly
infrastructure upgrades.
Analyzing local hosting capacity can help communities identify and account for areas with higher or lower potential
for clean energy development. The Joint Utilities of New York publish and regularly update hosting capacity maps for
public use.
Recognizing that clean energy development is more likely to occur in areas with available hosting capacity,
NYSERDA recommends municipalities consider the following:
• Analyzing hosting capacity maps alongside local zoning maps and other resources can help promote clean
energy in areas with higher development potential.
• Utility hosting capacity maps do not include high-voltage transmission lines; therefore, these maps may not be
predictive of all future clean energy development.
• Hosting capacity is subject to change based on factors like grid upgrades and should not be the sole factor
shaping a municipality’s planning around clean energy.
4. Public Engagement and Education
Public participation is essential for successful clean energy policy and planning efforts because buy-in from all
stakeholders—including citizens, local officials, land-use board members, local businesses, developers, real
estate experts, environmental leaders, residents, and local media—is critical to the effort’s success and long-
term implementation. Empowering various stakeholders to share local knowledge and preferences strengthens
process outcomes, and implementing several methods of public engagement to engage all citizens in the
process increases confidence and support for the resulting plan, which will guide future clean energy
development decisions.
Ensuring community participation is essential. Each public engagement process will be different, involve a
variety of stakeholders, and utilize different engagement methods. People may participate for a variety of
reasons, including to improve services for their community, be a part of change, have their voices heard, build
self-confidence, and meet new people.
Municipalities can use a variety of tools to engage participants in a collaborative process, including interviews,
polls and surveys, hot lines, websites, email lists, focus groups, advisory groups, community meetings,
neighborhood walks, social media (such as Twitter and Facebook), and mobile texting. Although many people
participate willingly, municipalities may consider encouraging participation by offering tangible incentives,
including refreshments. People also participate more frequently where their engagement is secondary to a
main event, such as a community picnic or parade. It is also helpful if a municipality can provide free childcare
to assist parents. Consider using creative locations to attract diverse stakeholders to participate, such as
parks, restaurants, schools, shopping centers, homeowner association meetings, senior and recreational
centers, and business locations, including agribusinesses and local farms.

5. How to Create Clean Energy Content for a Comprehensive Plan
Collected data and stakeholder input set the foundation for a comprehensive plan’s content. As described
above,
a comprehensive plan is a written document that contains goals, objectives, and strategies organized into
chapters, components, elements, or themes to guide a community’s future development. Before drafting clean
energy planning language, a community must select an appropriate format and style for the plan. Some
communities may have a recently updated comprehensive plan, and therefore, do not expect to engage in a
complete planning process. Other communities may anticipate an upcoming process to completely update
their existing comprehensive plan. Depending on these local circumstances, municipalities may choose to
integrate clean energy planning language into a larger process or engage in a smaller one focused entirely on
identifying clean energy goals, objectives, and strategies.
The extent to which a community wishes to address clean energy will also vary given local circumstances and
the amount of clean energy development a municipality anticipates in the future. Where extensive clean
energy development is certain, communities may choose to adopt an entire clean energy component in a
comprehensive plan or to create a stand-alone clean energy plan. Where clean energy development will be
limited, municipalities may decide to add a small selection
of locally relevant goals, objectives, and strategies to existing plans or integrate this planning language
throughout more traditional components in a new comprehensive plan, such as the agriculture, natural
resources/environment, economy, sustainability, municipal services, housing, or community character
components.
5.1 Develop Clear Goals and Objectives
Using gathered information from the studies and community engagement effort, the municipality should develop long-
term clean energy goals and related shorter-term objectives. Planning goals are broad statements of ideal future
conditions that the community desires for clean energy development. Goals should aim to eliminate identified problems
while strengthening the community’s positive attributes. When setting clean energy specific goals, planners and the
community should consider how clean energy systems would help meet existing community goals, as well as appropriate
scales and contexts for these systems. In addition, communities should consider how clean energy development might
complement or otherwise relate to other interests, such as existing and future trees and vegetation, community character
issues, and agricultural uses. After setting goals, a community can identify measurable, intermediate-term objectives that
will help reach each goal.
5.2 Select Strategies and Develop Implementation Plan
After selecting goals and objectives, the municipality should identify strategies or actions to accomplish each
objective. A local government should select relevant strategies, and adapt them to local circumstances and
priorities, as appropriate.
5.3 Complete the Legally Required Process
As required by NYS Village Law §7-722; Gen. City Law § 28-a; and Town Law § 272-a, the board preparing
the plan must forward the completed comprehensive plan to the local legislature, along with the board’s
adopted resolution recommending the plan. The local legislature must make the plan publicly available and
hold a public hearing within 90 days of receiving the plan. This is the second required public hearing. The first
required public hearing must be held by the preparing board on the draft plan. The plan must be referred to
the County Department of Planning for recommendations. If the local legislature or a special board created
the plan, they also may forward the plan to the planning board for review and recommendations. Finally, the
local legislature must review the draft plan under the New York State Environmental Quality Review Act
(SEQRA). As the only board with the authority to adopt a comprehensive plan, the local legislature would
serve as lead agency for this SEQRA review.

NYSERDA developed thi s tool in collaboration with the New York Department of State, solar contractors, and other
stakeholders. It supports NYSERDA’s efforts to implement a unified permitting process for residential solar PV systems.
Standardizing
the
permitting
and
inspecting
process
across
New
York
State
will
reduce
costs
for
municipalities
and
solar
custo mers, create local jobs, and advance New York’s clean energy goals.
What
the
Tool
Is
This tool is a free resource to help code enforcement officials review and evaluate solar electric systems for grid-tied
residential
solar
PV
installations
of
25
kW
or
less.
Off-grid
and
commercial-scal e
solar
PV
systems
are
more
complex
and
warrant greater detail than this tool provides.
What
the
Tool
is
Not
This tool is not all-encompassing. Electric construction is a complicated process governed by the NYS Uniform Fire
Prevention and Building Code (Uniform Code), which references other codes. This tool highlights many common and
important design issues referenced in the National Electrical Code (NEC), but it should not be considered comprehensive.
Distri bution
AHJs and other entities are welcome to use and distribute this tool. AHJs may wish to update the Unified Solar Permit
Application itself and Submittal Instructions to reflect any unique requirements that apply to their municipality (such as a
schedule
of
fees).
The
inspection
and
design
review
checklists
can
also
be
changed
to
reflect
additional
requirements.
AHJs should keep in mind that changing the Unified Solar Permit’s contents may diminish consistency and increase the
cost
of
solar
energy
for
their
constituents.
Changes
may
not
be
obvious
to
contractors
working
across
many
local
governments,
so
AHJs should hi ghlight any changes made to the standard documents.
Disclaimer
This
document
and
the
New
York
Unified
Solar
Permit
are
provided
to
support
and
standardize
the
solar
permitting
process.
Thes e documents should not be used as a substitute for proper solar PV system design calculations. Users of these
documents assume all responsibility for solar PV system design, installation, and permitting, as required by New York
State law. NYSERDA and its contractors cannot be held liable for any errors or omissions in these documents.
This
section
provides
an
overview
of
issues
involved
in
solar
PV
system
design.
It
is
critical
that
designers
optimize
safety
and
performance because systems have expected lifespans of 20-30 years.
New York Solar Guidebook for Local Governments
Overview
To allow officials to be tter understand the permitting and inspecting process, and ensure them an efficient, transparent, and
safe beginning to their solar development project, this section reviews the solar photovoltaic (PV) permitting and inspection
process for local government officials and authorities having jurisdiction (AHJs).
Tools and materials are provided to assist local officials and AHJs on evaluations of solar systems less than 25kW. Solar PV
design issues, design reviews of construction documents, and field inspection checklists are among the topics discussed.
Intended Use

Array Siting
Designing a sol ar PV system involves many factors, but the most important is siting the array to maximize sunlight. South-
facing roofs are ideal, but PV modules (“panels”) can be located on southwest- or southeast-facing roofs with minimal
losses.
North-facing
roofs
and
heavily
shaded
roofs
should
be
avoided.
Prior
to
installation,
solar
PV
contractors
measure
the
amount
of sunlight a location receives annually, either with a hand-held tool or aerial imagery software.
Residents planning to remove trees to increase solar access should clearly mark the trees on construction documents
submitted
with
their
permit
application.
The
p rojected
growth
of
vegetation
should
also
be
c onsidered
when
designing
a
sys tem, especially for ground-mounted arrays.
When a house does not have a clear south-facing roof, contractors can install on garages, outbuildings, or in the ground.
Experienced designers will maximize solar access and minimize wire runs, building penetrations, and labor costs. Depending
on
the layout of a house, conductors can be run on exterior roofs and walls, through attic or basement spaces, or in wall
cavities.
Irradiance and Temperature
Solar electric modules convert solar radiation into electric current. Their power output is variable, based on the intensity of
sunlight (irradiance) and the temperature of the cells. All modules have a nameplate capacity, which states the power
(Wattage) produced by the module under Standard Test Conditions (STC), defined as 1,000 Watts per square meter at 25 °C.
The module’s actual
output
at
a
specific
point
in
time
is
typically
lower
than
the
nameplate
capacity
but
can
be
higher
under
certain
conditions.
Solar
electric
modules
have
the
greatest
power
output
when
exposed
to
high
levels
of
irradiance
(intensity
of
sunlight)
at
low
temperatures. There is a positive relationship between irradiance and the current (Amperes) solar PV modules
produce: as irradiance increases, current increases (with little change in voltage). There is an inverse relationship
between temperature and a PV module’s voltage: at temperatures below 25 °C, modules produce voltage higher than
during STC. At higher temperatures, voltage decreases (see NEC 690.7), with no significant change to amperage.
In addition to reducing voltage (and therefore Wattage), high temperatures have other detrimental effects on solar PV
systems. Prolonged exposure to high temperatures accelerates the rate at which solar PV cells degrade. Therefore,
most roof-mounted arrays are located on racking, which places the PV cells 3 to 6 inches above the roof surface and
allows airflow
under the array. Inverters may be installed outdoors but perform slightly better when not in direct sunlight.
High temperatures
must be considered wh en sizing conductors located on hot roofs, as the current carrying capacity of
conductors decreases
when
exposed
to
heat.
Conduit
runs
must
also
have
expansion
fittings
(as
required
by
code)
to
account
for
thermal
expansion
and contraction.
Because the output voltage of solar PV modules increases significantly in colder weather, installers must account for the
lowest
expected ambient temperature when determining the maximum number of solar PV modules per string (NEC
690.7).
System Sizing and Equipment Selection
Solar electric installations are highly customized. Installers must carefully design systems to meet site-specific conditions and
choose equipment that satisfies detailed technical requirements. Solar electric modules have different STC electrical outputs
(voltage and current), which vary with temperature and irradiance. At residential sites the NEC limits the maximum DC string
voltage to 600 volts, so installers must determine the maximum number of modules per string, based on design low
temperatures (i.e. when module voltage is highest). DC strings of modules must also have a minimum voltage (based o n
design high temperatures) greater than the minimum voltage required to activate the system’s inverter. Certain technologies
allow for increased flexibility in system design, such as multiple power point trackers (MPPTs), DC optimizers, and
microinverters.
Solar PV Array Design Issues Use

DC
array
sizes
should
not
exceed
an
inverter’s
maximum
input
rating.
If
an
inverter
is
significantly
undersized
for
an
array,
so lar
PV
production
during
peak
hours
will
be
limited.
Generally,
a
solar
PV
system’s
DC
Wattage
should
not
exceed
1.3
times the AC rating of its inverter. Many inverter manufacturers have developed computer programs that assist in string sizing
and
optimizing sy stem design, such as www.fronius.com/froniusdownload/tool.html
Grounding
One
of
the
more
challenging
aspects
of
solar
PV
system
design
and
installation
is
thoroughly
grounding
and
bonding
the
system in accordance with the NEC
.
The grounding electrode conductor (GEC) is the reference ground that establishes the voltage relationships between
the ungrounded conductors and earth ground. The GEC must be run with irreversible splices from any separately derived
power supply (i.e., inverters that contain transformers) to the grounding electrode. All solar PV systems with a
transformer-based inverter will require a GEC from the inverter to the grounding electrode. Table 250.66 in the NEC
governs the sizing of the GEC. The GEC must be a minimum of number six American Wire Gauge Building Wire (#6 AWG)
when exposed and must be bare or covered with green insulation. When exposed and insulated, the wire must be UV-
protected.
The
grounded
conductor
(or
“neutral”
conductor)
is
intentionally
grounded
and
carries
current
under
normal
conditions.
It is
always
insulated
and
may
be
white
or
gray
in
color.
Current
flows
out
on
the
ungrounded
conductors
and
returns
on
the
grounded conductor, completing the circuit.
The equipment grounding conductor (EGC) does not carry current under normal conditions. It provides a path back to
the grounded conductor (neutral) when a fault occurs. The EGC may include all bonded metal components, such as the
racking, boxes, enclosures, building steel, and metal roofing materials. (Bonding is the physical connecting of metal
components so that they are at equal potential. They may or may not be grounded. Bonding jumpers may be extensions
of the GEC, EGC, or grounded conductor.) Table 250.122 in the NEC governs EGC sizing. The EGC is required on both
grounded and ungrounded (transformer-less) systems. The EGC must be a minimum of #6 AWG when exposed and
must be bare or insulated green.
When exposed and insulated, the wire must be UV-protected. The GEC, EGC, and grounded conductor must be bonded
together at the main service disconnect(s) and at the overcurrent protection/disconnects when performing a supply-
side connection.
Labeling
The NEC provides many unique labeling requirements for solar PV systems, located in Sections 690, 705, 706 and
elsewhere. To assist contractors and inspections, NYSERDA has developed an extensive Labeling Guide, located as
Section 8 of this document.
Zoning
Considerations
Solar photovoltaic is a relatively new technology. Many municipalities are unsure how solar PV installations fit into their
existing zoning and land-use regulations. Large-scale systems in particular raise land use, aesthetic, decommissioning, and
disposal concerns.
Municipalities should review their existing zoning requirements to ensure they clearly describe how solar PV systems are
classified,
and what restrictions are placed upon them. For more information, please reference Chapter 10 - Model Solar
Energy Law.
Win d and Snow Loads
Solar electric contractors are responsible for ensuring that their installations do not jeopardize the structural integrity of the

buildings upon which they are mounted. Due to their large surface areas, solar PV arrays can catch updrafts and create
significant
amounts
of
uplift
during
windy
conditions.
Forces
are
especially
strong
when
modules
are
located
at
the
ridge
of
a
roof, when they are mounted a significant distance above the roof surface, or when they are not mounted parallel to
the roof surface. Ground-mounted arrays are also subject to large wind forces. Detailed calculations are required to
determine the exact amount of pressure for which systems should be designed.
Solar electric arrays, including racking and mounting hardware, typically add 4-6 pounds per square foot of dead load to
a structure. Although this amount is modest, it may become significant when combined with a roof’s existing dead load
and snow load. The International Residential Code provides snow load data, which range from 20-80 pounds per square
foot in
New York State.
A Professional Engineer or Registered Architect should perform detailed calculations to ensure
solar PV designs meet all structural requirements, taking wind load and snow load into account.
Design Review of
Construction
Documents
As part of their permit application, applicants must submit a site plan, an electrical wiring diagram, a structural analysis, and
specification
sheets
for
the
modules,
inverter,
and
racking
system.
This
section
includes
a
checklist
of
items
for
code
officials
to check as part of their design review.
The construction documents must be stamped by a New York State licensed professional engineer (PE) or registered
architect
(RA).
The
local
code
official
will
determine
the
depth
of
review
necessary.
The
following
three-part
checklist
may
be expanded
should
the
code
official
require
examination
at
greater
depth,
such
as
checking
wire
sizing
and
other
calculations.
Field
Inspection
Checklist
A “rough inspection” (which occurs when all boxes and wires are installed to the point when walls or trenches are ready
to be closed) is not necessary on most small residential installations with existing construction.
When
a
field
inspection
is
necessary,
inspectors
should
consider
bringing
the
following
items:
•
Ladder
with
non-conductive
sides.
•
Binoculars
for
surveying
inaccessible
roof-mounted
equipment.
•
Screwdriver for opening enclosures.
•
A
copy
of
the
contractor’s
submitted
design.
Code
enforcement
officers
should
consider
asking
solar
PV
contractors
for
a
set
of
construction
photos.
Contractors
typically
document their installation progress with photos, which are sometimes required by their internal quality assurance
team or
financing
partners.
Code
enforcement
officers
can
use such photos to review hard-to-access parts of the
installation (such as roof-mounted racking).
Fire Prevention and Building Codes
Through the 2020 New York State Uniform Fire Prevention and Building Code (Uniform Code), specific codes are set in
place regarding rooftop access and ventilation when installing a solar photovoltaic (PV) system. This section provides
information on the parts of the
2020 Residential Code of New York State (2020 RCNYS) and the 2020 Fire Code of New York
State (2020 FCNYS) that are applicable to solar PV installers and Authorities Having Jurisdiction (AHJ), when installing and
inspecting PV systems.
We encourage you to have a discussion with your local code official to determine the specific requirements for your
solar
installation.
In
New
York
State,
it
is
the
responsibility
of
the
local
AHJ
to
administer
and
enforce
the
Uniform
Code
as
well
as
any applicable local zoning and land use laws.
Always consult with your local code official to determine code compliance.

State Environmental Quality Review
When beginning solar development in your respective community, municipalities must participate in a State Environmental
Quality Review (SEQR) for rooftop and ground-mount solar photovoltaic (PV) energy systems. Throughout this section, we
provide readers with an overview on the SEQR process, with step-by-step instructions for large solar projects and the
background on SEQR regulations. Additionally, we include sections on preparing the environmental assessment form (EAF),
agency coordination, solar developer guidance and a list of frequently asked questions (FAQs) regarding the process.
To make this guidance document more relevant for solar energy projects supported by NYSERDA, it assumes that projects would
be sited and designed in a manner that will avoid any significant environmental impacts. This by no means reduces the level of
evaluation that is required to make a determination of significance. Rather, it assumes that the outcome of the rigorous process
of review, coupled with good site selection on the part of the project developer and good guidance from the municipal board,
will result in the avoidance of significant environmental impacts.
Users of this document are encouraged to first review Section 1, “SEQR Quick Reference Guide,” which summarizes the
steps a municipal board completing the SEQR process for a solar energy project must complete. This section includes
references to other sections of this document if readers require more information. Other sections of this document provide
step-by-step instructions to fill out SEQR forms and answer questions that are specific to solar energy systems.
SEQR Quick-Reference Guide
A Lead Agency must complete the SEQR process for a typical large-scale solar project. (This guidance document assumes a
municipal board will serve as Lead Agency.)
Most solar projects in NY-Sun’s Commercial and Industrial programs are 2-5 MW AC ground-mount systems. Ground-mount
installations require approximately five acres of land per megawatt. As a result, these systems tend to be located in rural areas
on flat to gently sloping farmland. Due to the limited area of impact associated with solar panel support structures, much of the
land can be maintained as grassland between and beneath the panels.
Since solar developers prefer the most economical projects, they are incentivized to avoid significant impacts to wetlands,
threatened and endangered species habitat, and
archeological/historic sites. Solar installations do not require lighting and water and sewer services. They do not increase
population and school-age children that can impact services provided by the community, county and State. Once constructed,
the amount of traffic entering or leaving a solar installation is minimal. As a result, many of the environmental impacts are
avoided by design or simply do not exist due to the nature of the installations. However, municipalities may still struggle with
issues of land use compatibility, protection of agricultural lands and visual impacts.
NYS Real Property Tax Law
It is increasingly important for local governments to be aware of the New York State Real Property Tax Law § 487 as it relates to
developing solar electric systems in your community. We provide answers to questions that may arise when local officials are
deciding whether to opt-in or opt-out of the Real Property Tax Law.
Real Property Tax Law § 487
This law provides a 15-year real property tax exemption for properties located in New York State with renewable energy
systems, including solar electric systems. This law only applies to the value that a solar electric system adds to the overall value of
the property; it does not mean that landowners with an installed renewable energy system are exempt from all property tax. A
local government that does not opt out can still benefit

financially through payment-in- lieu-of-taxes (PILOT) agreements.
In local governments that have taken no action one way or the other, the exemption is in effect. If a local law, ordinance, or
resolution opting out of the exemption is adopted, a copy must be filed with the New York State Department of Taxation and
Finance, and the New York State Energy Research and Development Authority
(NYSERDA).
Local Economic Impact of Solar
New York State’s solar market is one of the fastest growing solar markets in the country. Installations grew by almost 1,000
percent from 2011 to December 2017. During 2011 to 2017, the U.S. as a whole saw a 452 percent increase. New York State
ranked 12th nationwide for cumulative solar installed capacity in 2017.
The solar industry is creating jobs across the State with more than 770 solar companies employing more than 9,000 people. In
2017, the solar industry added approximately 900 new jobs throughout the State, a 11 percent increase over 2016 job growth. New
York is currently ranked number 3 in solar jobs.
With average wages of $21 per hour, the solar industry is responsible for creating thousands of living-wage jobs that allow
workers to contribute to their local economies. Most jobs are local or regional and cannot be outsourced.
Why would jurisdictions opt out of the RPTL § 487?
All local governments must offer the RPTL § 487 exemption unless they have opted out not to. Local governments can decide to
opt out. As the solar market in New York continues to grow, many large-scale solar projects are being proposed throughout New
York. Some local governments are opting out of RPTL § 487 so they can tax these multimillion-dollar projects and generate
additional property tax revenue. However, these jurisdictions may find that they will not actually collect substantially more tax
revenue from solar or other renewable energy systems because the systems may not be built if they are fully taxable. Property
taxes can have a significant impact on the financial viability of solar electric projects, sometimes impacting project economics in a
way that unintentionally prohibits solar electric development. Jurisdictions that opt out of RPTL § 487 may unintentionally prevent
solar electric development at the local level. Activity in other states suggests there is less solar development in jurisdictions that
opt out of the property tax exemption, with little to no additional tax revenue collected.
Can jurisdictions opt out of RPTL§ 487 for large-scale solar only?
No. Under RPTL § 487, jurisdictions are not permitted to conditionally opt out of the property tax exemption. In other words,
jurisdictions cannot choose to tax large systems but not small ones. A jurisdiction that opts out of RPTL § 487 to generate tax
revenue from larger projects makes solar installations more expensive for homeowners and local businesses.
Capturing revenue from installations without opting out of RPTL§ 487
The law allows jurisdictions that offer the RPTL § 487 exemption to negotiate payments in lieu of taxes (PILOTs). The purpose of a
PILOT is to reduce the tax burden and tax rate uncertainty on the property and/or system owner, while preserving some of the
forgone revenue that would have been paid in property taxes. PILOTs are often used for large-scale renewable energy projects,
including solar electric systems. They are annual payments commonly related to the system’s size (often in dollars per megawatt
[MW]) and cannot exceed the amount of taxes that would be owed without the exemption.
Each taxing jurisdiction (except the school districts of New York, Buffalo, Rochester, Syracuse, and Yonkers) that has not opted out
of RPTL § 487 may require the owner of a solar installation to enter a PILOT. The PILOT may not exceed a 15-year term, but it
cannot require payments that exceed the value of taxes that would be paid without the exemption provided by RPTL § 487. PILOT
agreements can be an

effective tool for jurisdictions to generate comparable revenue without making solar costs prohibitive for most homeowners
and businesses.
Opting back in
The New York State Department of Taxation and Finance has stated that local governments can reinstate the RPTL § 487
exemption simply by repealing the local law, ordinance, or resolution that implemented the opt out. The final step to reinstate
the exemption is to provide a copy of the new law, ordinance, or resolution to the New York State Department of Taxation and
Finance and NYSERDA.
Property tax exemptions in other states
Thirty-three states offer some form of tax exemptions for renewable energy. Twenty-two of those states mandate
property tax exemptions for 100 percent of the value of solar energy installations over
10 or more years. These states include ones with significant solar development such as California, Massachusetts, and New
Jersey, as well as states with minimal solar capacity such as South Dakota, Kansas, and Montana. The majority of states
recognize the positive financial impact property tax exemptions can have on solar electric development and the local economic
benefits of a robust solar industry.
Agricultural Impacts
When navigating solar energy projects in accordance with New York State policies, local officials may have unanswered
questions regarding solar installations taking
place in their respective agricultural districts. In this section, we discuss
agricultural
assessments, farm-related solar projects, laws and penalties as they relate to solar development in agricultural
districts.
Many local governments are implementing strategies to review solar installations within their community by updating their
comprehensive
plan
and
adopting
zoning
requirements
for
the
siting,
installation,
and
decommissioning
of
large-scale
solar
arrays. To protect productive farmland, municipalities should consider siting the non-farm solar energy projects on less
productive land. There is a distinction between farm- related solar systems, and solar systems built on agricultural land that
primarily serve off-site uses.
Agricultural
Districts
New York State’s Agriculture and Markets Law provides a bottoms-up approach for the protection of vi able farmland
by
including land within an Agricultural District. Landowners petition the County Legislature to include their land into an
Agricultural
District,
affected
municipalities
are
notified,
a
public
hearing
is
held,
and
the
County
Legislature
creates
or
modifies an Agricultural District by adding or removing land from the District. Farm operations located within an Agricultural
District are provided certain protections, such as limited protection from eminent domain and condemnation; unreasonably
restrictive local rules, regulations, laws, and ordinances; agricultural assessment; protection from private nuisance lawsuits;
and other benefits.
Agricultural
Assessments
An
agricultural
assessment
is
an
assessed
value
placed
on
eligible
land
that
is
used
for
agricultural
production,
based
on
the
land’s ability to produce a crop. The taxes paid on the property by the owner are based on the agricultural assessment.
Land inside and outside of an agricultural district is eligible for an agricultural assessment. To qualify, farmers must produce
crops, livestock, or livestock products on seven plus acres of land and have an average gross sale of $10,000 in the prior
two years. Land that is used in agricultural production that has less than seven acres in production must have an average
gross sale of $50,000 in the prior two years.
Additionally, a land owner receiving an agricultural assessment inside an agricultural district annually commits the land to an
agricultural use for the next five years, or eight years if located outside of an agricultural district. Farmlands outside
agricultural districts are
generally not eligible for other agricultural district benefits and protections.

Protections
for
farm-related
solar
The Department of Agriculture and Markets considers solar panel systems to be “on-farm” equipment when they are
designed, installed, and operated so that the anticipated annual total amounts of electrical energy generated do not
exceed the anticipated annual total electrical needs of the farm by more than 110 percent. If a local government
classifies solar
equipment as structures or buildings, they are deemed on-farm buildings. As on-farm equipment
or buildings,
the installation
of solar panel systems are protected under the Agricultural Districts Law.
To ensure that the electrical output of solar equipment does not exceed the 110-percent threshold, an initial energy
assessment may be required to separate farm-related energy consumption from other uses.
Further,
if
the
solar
equipment
is
connected
by
remote
net
metering,
multiple
meters
must
be
combined
to
determine
the
electrical needs of on-farm equipment.
Regulations
for
on-farm
solar
Reasonable
regulations
for
solar
development
include:
•
A
streamlined
site
plan
review
process
that
involves
a
shorter
review
period
and
fewer
submission
requirements.
•
A
building/zoning
permit
and
compliance
with
the
State’s
Fire
Prevention
and
Building
Code
requirements.
“Overly
restrictive”
regulations
for
solar
development
include:
•
Extensive
site
plan
regulations.
•
Special use permit regulations.
•
Nonconforming
use
requirements.
•
Height
restrictions
and
excessive
setbacks
from
buildings
and
property
lines.
•
A
Full
Environmental
Assessment
Form
(on-farm
solar
development
is
considered
a
Type
II
action
in
the
State
Environmental Quality Review (SEQR) process, which does not require EAF preparation).
•
Visual
impact
assessments.
•
Prohibiting
the
construction
of
on-farm,
solar
generated
electricity
to
offset
the
energy
demands
of
the
farm.
Penalties
for
converting
farmland
to
solar
A conversion penalty is imposed if farmland that is subject to an agricultural assessment is located in an agricultural
district
and is converted to a nonagricultural use within five years of the last agricultural assessment (or eight years if the
farmland is
located outside an agricultural district). No conversion penalty is imposed if agricultural land is converted for oil,
gas, or wind
energy development that does not support agricultural production. Because solar energy is not included in
this exemption,
the conversion penalty could apply if electrical output of solar equipment substantially exceeds (e.g., is more
than 110 percent
of) a farm’s anticipated electrical needs.
The assessor determines whether a conversion has occurred on the basis of the facts of each case:
•
Conversion is d efined as “an outward or affirmative act changing the use of agricultural land” to a nonagricultural use, in
New York State’s Agriculture and Markets Law.
•
A conversion p enalty involves a payment to capture the tax savings a property owner received while the land was under
an
agricultural assessment. This is limited to a five-year roll-back as specified in New York State’s Agriculture and Markets Law.
•
Conversion payments are equal to five times the taxes saved in the most recent year that the land received an
agricultural assessment, plus interest.
When only a portion of a parcel is converted, the assessor apportions the real property tax assessment and the
agricultural
assessment,
determines
the
tax
savings
attributable
to
the
converted
portion,
and
computes
the
conversion
payment
based
on that p ortion. If the remaining land within a parcel is used for agricultural purposes and the eligibility criteria
are met, that
land may still receive an agricultural assessment.
Payments for the conversion of agricultural land to nonagricultural use are added to the taxes of the converted land.
Properties may be subject to a tax sale if conversion penalty payments are not made. These payments generally become
the
landowner’s
responsibility
at
the
time
of
conversion.
Failure
to
notify
may
result
in
a
penalty
of
two
times
the
payments

owed,
to a maximum of $1,000.
Land Use Issues
As local governments develop solar regulations and landowners negotiate land leases, it is important to understand the
options for decommissioning solar panel systems and restoring project sites to their original status.
From a land use perspective, solar panel systems are generally considered large-scale when they constitute the primary use of
the land and can range from less than one acre in urban areas to 10 or more acres in rural areas. Depending on where
they are sited, large-scale solar projects can have habitat, farmland, and aesthetic impacts. As a result, large-scale systems
must often adhere to specific development standards.
Abandonment and Decommi ssi oni ng
Abandonment occurs when a solar array is inactive for a certain period of time.
•
Abandonment requires that solar panel systems be removed after a specified period of time if they are no longer in use.
Local governments establish timeframes for the removal of abandoned systems based on aesthetics, system size and
complexity, and location. For example, the Town of Geneva, NY, defines a solar panel system as abandoned if construction has
not started within 18 months of site plan approval, or if the completed system has been nonoperational for more than one year.
•
Once a local government determines a solar panel system is abandoned and has provided thirty
(30) days prior written notice to the owner it can take enforcement actions, including imposing civil penalties/fines, and
removing the system and imposing a lien on the property to recover associated costs.
Decommissioning is the process for removing an abandoned solar panel system and remediating the land.
•
When describing requirements for decommissioning sites, it is possible to specifically require the removal of
infrastructure, disposal of any components, and the stabilization and re-vegetation of the site.
Decommissioning Plans
Local governments may require having a plan in place to remove solar panel systems at the end of their lifecycle, which
is typically 20-40 years. A decommissioning plan outlines required steps to remove the system, dispose of or recycle its
components, and restore the land to its original state. Plans may also include an estimated cost schedule and a form of
decommissioning security.
Estimated
Cost
of
Decommissioning
Given
the
potential
costs
of
decommissioning
and
land
reclamation,
it
is
reasonable
for
landowners
and
local
governments
to proactively consider system removal guarantees. A licensed professional engineer, preferably with solar
d
evelopment experience, can estimate decommissioning costs, which vary across the United States. Decommissioning
costs will vary depending upon project size, location, and complexity.
Decommissioning costs for a New York solar installation may differ. Some materials from solar installations may be recycled,
reused, or even sold resulting in no costs or compensation. Consider allowing a periodic reevaluation of decommissioning costs
during the project’s lifetime by a licensed professional engineer, as costs could decrease, and the required payment should be
reduced accordingly.
Ensuring
Decommissioning
Landowners and local governments can ensure appropriate decommissioning and reclamation by using financial and
regulatory
mechanisms.
However,
these
mechanisms
come
with
tradeoffs.
Including
decommissioning
costs
in
the
upfront
price of solar projects increases overall project costs, which could discourage solar development. As a result, solar
developers are sometimes hesitant to provide or require financial surety for decommissioning costs.
It is also important to note that many local governments choose to require a financial mechanism for decommissioning.
Although similar to telecommunications installations, there is no specific authority to do so as part of a land use approval for
solar projects
. Therefore, a local government should consult their municipal attorney when evaluating financial
mechanisms.
Financial mechanisms
Decommissioning Provisions in Land-Lease Agreements.
If a decommission plan is required, public or private
landowners should make sure a decommissioning clause is included in the land-lease agreement. This clause may
depend on the decommissioning preferences of the landowner and the developer. The clause could require the solar
project developer
to
remove
all
equipment
and
restore
the
land
to
its
original
condition
after
the
end
of
the
contract,
or
after
generation
drops below
a
certain
level,
or
it
could
offer
an
option
for
the
landowner
to
buy-out
and
continue
to
use
the
equipment
to
generate
electricity. The decommissioning clause should also address abandonment and the possible
failure of the developer to comply with the decommissioning plan. This clause could allow for the landowner to pay for
removal of the system or pass
the costs to the developer.
Decommissioning Trusts or Escrow Accounts.
Solar developers can establish a cash account or trust fund for
decommissioning purposes. The developer makes a series of payments during the project’s lifecycle until the fund
reaches
the estimated cost of decommissioning. Landowners or third-party financial institutions can manage these accounts.
Terms on
individual payment amounts and frequency can be included in the land lease.
Removal or Surety Bonds.
Solar developers can provide decommissioning security in the form of bonds to guarantee
the
availability
of
funds
for
system
removal.
The
bond
amount
equals
the
decommissioning
and
reclamation
costs
for
the
entire
system. The bond must remain valid until the decommissioning obligations have been met. Therefore, the bond
must be renewed or replaced if necessary to account for any changes in the total decommissioning cost.
Letters of credit.
A letter of credit is a document issued by a bank that assures landowners a payment up to a specified
amount, given that certain conditions have been met. In the case that the project developer fails to remove the system,
the
landowner
can
claim
the
specified
amount
to
cover
decommissioning
costs.
A
letter
of
credit
should
clearly
state
the
conditions for payment, supporting documentation landowners must provide, and an expiration date. The document must be
continuously renewed or replaced to remain effective until obligations under the decommissioning plan are met.
Nonfinancial mechanisms
Local governments can establish nonfinancial decommissioning requirements as part of the law. Provisions for
decommissioning
large-scale
solar
panel
systems
are
similar
to
those
regulating
telecommunications
installations,
such
as
cellular towers and antennas. The following options may be used separately or together.
Abandonment and Removal Clause.
Local governments can include in their zoning code an abandonment and
removal clause for solar panel systems. These cases effectively become zoning enforcement matters where project
owners can be mandated to remove the equipment via the imposition of civil penalties and fines, and/or by imposing a
lien on the property to recover the associated costs. To be most effective, these regulations should be very specific about
the length of time that constitutes abandonment. Establishing a timeframe for the removal of a solar panel system can
be based on system aesthetics, size, location, and complexity. Local governments should include a high degree of
specificity when defining “removal” to avoid ambiguity and potential conflicts
•
Special Permit Application.
A local government may also mandate through its zoning code that a decommissioning plan
be
submitted by the solar developer as part of a site plan or special permit application. Having such a plan in place allows the
local
government, in cases of noncompliance, to place a lien on the property to pay for the costs of removal and remediation.
•
Temporary Variance/Special Permit Process.
As an alternative to requiring a financial mechanism as part of a land
use
approval,
local
governments
could
employ
a
temporary
variance/special
permit
process
(effectively
a
re-
licensing
system). Under this system, the locality would issue a special permit or variance for the facility for a term of 20 or more
years; once expired (and if not renewed), the site would no longer be in compliance with local zoning, and the locality
could then use their regular zoning enforcement authority to require the removal of the facility.

Energy storage is critical to New York’s clean energy future.
Energy Storage in New York
Technology, Regulations, and Safety
What Are Energy Storage Systems?
Energy storage is essential for creating a cleaner, more ecient, and resilient electric grid, which can ultimately reduce energy
costs for New Yorkers. As New York State transitions to renewable energy technologies like wind and solar, energy storage
can provide energy when the wind isn’t blowing or the sun isn’t shining. Most energy storage systems being deployed around
the world today use lithium-ion batteries.
Energy storage systems:
■are a back-up energy source for homes and businesses
■can supply energy to a home, to a business, to a community, or to the electric grid
■can be integrated with wind and solar to enable our transition to a fully decarbonized electric system
■provide economic and environmental benefits to both customers and the electric grid
■helps deliver electricity to meet the demand of customers and increase grid reliability
RESIDENTIAL
Provides back-up power at homes
and small businesses. Can oset
utility bills by reducing usage
during high-price periods.
COMMERCIAL
Provides economic benefits
to system owners and the electric
grid and reduces pollution
for local customers.
BULK
Enables grid decarbonization,
provides regional grid reliability,
and increases electric
system eciency.

Dierences Between Energy Storage and E-bike Batteries
In recent years, there have been fires in New York caused by batteries that power electric bikes, scooters, and mopeds.
Some of these batteries pass rigorous, standards-based safety testing (e.g., UL certification). However, there are others in
circulation that have not passed testing, which are believed to be primarily responsible for the recent lithium-ion battery fires
in New York City.
In contrast, all energy storage systems authorized for installation in New York must have undergone many stages of rigorous
safety testing (e.g. UL certification), have required project design and equipment reviews and inspections by permitting
authorities (e.g. Code Enforcement Ocials), and are equipped with built-in safety precautions.
Energy Storage Systems: A Regulated Industry
Energy storage systems are thoroughly regulated, with oversight from federal, state, and local authorities. There are
thousands of energy storage systems installed in New York that have successfully met all applicable regulations.
Federal: Construction and safety code standards are developed collaboratively, involving years of consensus-building
between technology experts and State and local code/building ocials. The creation of codes and standards is led by
federally approved organizations, including:
■International Code Council (ICC) — developed the International Fire Code (IFC) and revises it every three years
■National Fire Protection Association (NFPA) — developed the NFPA 855 standard for regulating energy storage systems
■Underwriters Laboratories (UL) Standards — developed the UL 9540 standard and the UL 9540A test for energy storage
State: New York State’s Code Council reviews and approves codes for energy storage systems in the State, resulting in the
Uniform Code (UC), which applies without the need for local adoption. The members of Council represent the Secretary
of State, architects, engineers, builders, trade unions, persons with disabilities, code enforcement, fire prevention, villages,
towns, cities, counties, State agencies, and the State Fire Administrator. Additionally:
■State Environmental Quality Review (SEQR) assesses environmental impacts of various types of development,
including energy storage.
■ The Uniform Codes, based on the International Codes, are adapted to suit New York’s unique characteristics from nationally
recognized criteria for construction and/or associated equipment to ensure the safety of workers and the public.
Local: All code, location, spacing, and other local requirements must be met. In addition to general code compliance,
additional site-specific protections may be required to be addressed by operations and emergency procedures
and fire service coordination.
■Local zoning regulations designate which zoning districts are appropriate for residential, commercial, and bulk energy
storage projects.
■Site plan review and special use permits allow local governments to regulate energy storage systems beyond applicable
regulations in the Fire, Residential, and Building codes that apply without need for local adoption.
■The NYS Fire Code contains a peer review requirement, giving local fire ocials the authority to mandate that the energy
storage developer supply funding for a third-party fire protection engineer to assist local authorities with reviewing
project-specific applications.
NYSERDA’s Vision
New York is a global climate leader building a
healthier future with thriving communities; homes and
businesses powered by clean energy; and economic
opportunities accessible to all New Yorkers.
NYSERDA’s Mission
Advance clean energy innovation and investments
to combat climate change, improving the health,
resiliency, and prosperity of New Yorkers and
delivering benefits equitably to all.
NYSERDA’s Promise
NYSERDA provides resources, expertise, and
objective information so New Yorkers can make
confident, informed energy decisions.
NYSERDA’s Role
NYSERDA’s Clean Energy Siting team routinely delivers energy storage fire
code and zoning trainings to local decision makers throughout the State.
NYSERDA’s Battery Energy Storage System Guidebook contains information,
tools, and step-by-step instructions to support municipalities managing
battery energy storage system development in their communities, provides
local ocials in-depth details about the permitting and inspection process to
ensure eciency, transparency, and safety in their communities.
NYSERDA inspects all energy storage projects supported by its programs
prior to commissioning with a detailed checklist to make sure the system has
been installed to code and has followed the regulatory requirements.
nyserda.ny.gov/energy-storage
ES-ovnys-fs-1-v2 6/23

NCF-Envirothon 2024 New York
Current Issue Part B Study Resources
Key Topic #3: Social, Environmental, and Economic Impacts of Renewable Energy in NYS
6. Describe various economic incentives provided in NYS to foster renewable
energy conversions.
7. Describe positive and negative environmental impacts of an expanded renewable
energy system in NYS and beyond.
8. Describe NYS efforts to address social injustices in the transition to renewable
energy.
Study Resources
Resource Title Source Located on
Renewables, Land Use, and Local
Opposition in the United States Samantha Gross, Brookings
Institution, 2020
Pages 74-77
Guide to Wind Energy & Wildlife Renewable Energy Wildlife Institute,
2022-2024 Pages 78-83
Pages 84-95
New York Renewable Energy and Energy
Efficiency Programs
DSIRE is operated by the N.C.
Clean Energy Technology Center
at N.C. State University, 2023
Pages 96-105
NYS Strategic Outlook 2022-2025-Clean
Energy Economy New York State Energy Research
and Development Authority, 2022
Study Resources begin on the next page!

New York Renewable Energy and Energy Efficiency Programs
Renewable energy and energy efficiency programs exist in the state of New York across a wide range of
technology types and are available for commercial, residential, and utility-scale customers and producers.
The chart at the end of the document lists some of the 127 programs available in NYS
A history of renewable energy and energy efficiency in New York
The state of New York has been a leader in clean energy since the establishment of NYSERDA (New York
State Energy Research and Development Authority) in 1975. When the New York State Energy Office closed
its doors in 1995; NYSERDA took on critical roles in energy efficiency, energy planning and assessments, and
policy analysis. In 2008, New York created its Energy Efficiency Portfolio Standard, which was aimed at
creating programs and incentives to reduce electricity usage in the state. Also in 2008, New York joined the
Regional Greenhouse Gas Initiative (RGGI) along with eight other Northeast and Mid-Atlantic states. The
RGGI became the US's first mandatory, market-based effort to limit emissions of greenhouse gases. In 2014,
NY Green Bank was established as a specialized entity within NYSERDA, and was aimed at increasing private
investment in renewable energy. Governor Cuomo launched his ambitious “Reforming the Energy Vision”
(REV) program in the same year, which would grow to define energy policy in the State of New York. The
2015 State Energy Plan was created as a roadmap for accomplishing Governor Cuomo's vision. During the
same year, the Clean Energy Standard was enacted under the direction of the governor, which expanded New
York's Renewable Portfolio Standard (RPS).
New York's Renewable Portfolio Standard
New York's Renewable Portfolio Standard was first created and introduced in 2004. In 2016, it was expanded
by Governor Cuomo's Clean Energy Standard (CES). The CES contains the goal of reducing greenhouse gas
emissions by 40% by 2030 and 80% by 2050. New York's current RPS calls for 50% of New York's energy to
come from renewable sources by 2030. In order to accomplish these goals, New York has created a Renewable
Energy Standard (RES) and a Zero-Emissions credit (ZEC) requirement. New York's RPS supports three kinds
of projects: the construction of new renewables, the preservation of existing renewables, and the maintenance of
existing safely operating nuclear power plants. The Clean Energy Standard was expanded again in October
2020 following passage of the Climate Leadership and Community Protection Act in 2019.4
Important renewable energy organizations in New York
NYSERDA (New York State Energy Research and Development Authority) is one of the most important
renewable energy organizations in the State of New York. NYSERDA aims its efforts at economic growth,
reduction of greenhouse gas emissions, and reduction of customer energy bills. NYSERDA is led by a board of
13 members. Two of these members are the Commissioner of the Department of Environmental Conservation
and the Commissioner of the Department of Transportation. The other nine members are appointed by the
Governor and include three at-large members, as well as an economist, a consumer advocate, an
environmentalist, an engineer/scientist, and an officer of a gas utility. NYSERDA is funded primarily through
System Benefits Charges which are paid by customers of participating utilities.
Another important renewable energy organization in the State of New York is the Department of Public
Service. The purpose of the Department of Public Service is to regulate utilities so as to provide safe,
affordable, secure, and reliable access to utility services while protecting the environment. The Department of
Public Service is chaired by up to five bipartisan commissioners. These commissioners are appointed by the
Governor and confirmed by the senate for six year terms.

The New York Independent System Operator (NYISO) is another important renewable energy and energy
efficiency organization in the state. NYISO is charged with managing the electric grid and the electric market in
the State of New York. NYISO is an independent company not affiliated with any energy company or level of
government which works to ensure a transparent market that works for all customers. NYISO is currently
working with policymakers, energy suppliers, and other stakeholders to transform New York's power grid into a
smart grid.
Utilities are also a major player in New York involved in the advancement of renewable energy and energy
efficiency within the state. The state of New York has six large Investor-Owned Utilities (IOUs). Consolidated
Edison (ConEd) is the largest utility in the state in terms of number of customers served. It serves New York
City and a large portion of Westchester. The other five large IOUs are Orange and Rockland Utilities (ORU),
Central Hudson Gas and Electric, Rochester Gas and Electric, New York State Electric and Gas (NYSEG), and
National Grid. Additionally, New York has one large municipal utility, Long Island Power Authority (LIPA).
This is the second largest municipal utility in the nation. New York also has a variety of smaller utilities.
Name Category Policy/Incentive Type
Energy Storage Target
Regulatory Policy
Energy Storage Target
Local Option - Solar, Wind & Biomass Energy
Systems Exemption
Financial Incentive
Property Tax Incentive
Energy Conservation Improvements Property Tax
Exemption
Financial Incentive
Property Tax Incentive
Local Option - Real Property Tax Exemption for
Green Buildings
Financial Incentive
Property Tax Incentive
Energy Conservation Improvements Property Tax
Exemption
Financial Incentive
Property Tax Incentive
New York Solar Easements & Solar Rights Laws
Regulatory Policy
Solar/Wind Access Policy
NY Green Bank
Financial Incentive
Other Incentive
NY-Sun Loan Program
Financial Incentive
Loan Program
Green Pass Discount
Financial Incentive
Other Incentive
NYSERDA - Residential Financing Options
Financial Incentive
Loan Program
EmPower New York
Financial Incentive
Grant Program
Energy Efficiency Resource Standard
Regulatory Policy
Energy Efficiency Resource
Standard
VW Funding for Diesel Replacement and EVSE
Projects
Financial Incentive
Grant Program
Qualified Commercial Clean Vehicle Tax Credit
Financial Incentive
Corporate Tax Credit
Alternative Fuel Vehicle Refueling Property Tax
Credit (Corporate)
Financial Incentive
Corporate Tax Credit
NYSERDA – Buildings of Excellence Early Design
Support (RFP 3925 – D)
Financial Incentive
Grant Program
Renewable Electricity Production Tax Credit (PTC)
Financial Incentive
Corporate Tax Credit
Business Energy Investment Tax Credit (ITC)
Financial Incentive
Corporate Tax Credit
NY-Sun PV Incentive Program (Residential, Low-
Income, and Small Business)
Financial Incentive
Rebate Program
Environmental Disclosure Program
Regulatory Policy
Generation Disclosure
Energy and Emissions Goals and Standards for
Federal Government
Regulatory Policy
Energy Standards for Public
Buildings
Energy Efficiency Standards for State Facilities
Regulatory Policy
Energy Standards for Public
Buildings
Modified Accelerated Cost-Recovery System
(MACRS)
Financial Incentive
Corporate Depreciation

New York State Electric and Gas - Electric Vehicle
Make-Ready Program
Financial Incentive
Rebate Program
Building Energy Code
Regulatory Policy
Building Energy Code
Electric Vehicle Supply Equipment Rebate Program
Financial Incentive
Rebate Program
Residential Energy Conservation Subsidy Exclusion
(Corporate)
Financial Incentive
Corporate Tax Exemption
NYSERDA - New York Truck Voucher Incentive
Program
Financial Incentive
Rebate Program
NYSERDA - Charge Ready NY
Financial Incentive
Rebate Program
NYSERDA - Industrial and Process Efficiency
Performance Incentives
Financial Incentive
Rebate Program
NYSERDA Bulk Energy Storage Incentive Program
Financial Incentive
Rebate Program
NYSERDA Retail Energy Storage Incentive Program
Financial Incentive
Rebate Program
NYSERDA - Drive Clean Rebate
Financial Incentive
Rebate Program
NYSERDA - Assisted Home Performance with
ENERGY STAR
Financial Incentive
Rebate Program
Energy-Efficient New Homes Tax Credit for Home
Builders
Financial Incentive
Corporate Tax Credit
Residential Solar Tax Credit
Financial Incentive
Personal Tax Credit
Refundable Clean Heating Fuel Tax Credit
(Corporate)
Financial Incentive
Corporate Tax Credit
Refundable Clean Heating Fuel Tax Credit (Personal)
Financial Incentive
Personal Tax Credit
Alternative Fuels and EV-Recharging Property Credit
Financial Incentive
Corporate Tax Credit
Community Distributed Generation
Regulatory Policy
Community Solar Rules
Net Metering
Regulatory Policy
Net Metering
Low Income Home Energy Assistance Program
(LIHEAP)
Financial Incentive
Grant Program
Residential Energy Efficiency Tax Credit
Financial Incentive
Personal Tax Credit
NY Open C-PACE
Financial Incentive
PACE Financing
U.S. Department of Energy - Loan Guarantee
Program
Financial Incentive
Loan Program
Plug-In Electric Drive Vehicle Tax Credit
Financial Incentive
Personal Tax Credit
Previously-Owned Clean Vehicle Tax Credit
Financial Incentive
Personal Tax Credit
Alternative Fuel Vehicle Refueling Property Tax
Credit (Personal)
Financial Incentive
Personal Tax Credit
Energy-Efficient Commercial Buildings Tax
Deduction
Financial Incentive
Corporate Tax Deduction
Residential Renewable Energy Tax Credit
Financial Incentive
Personal Tax Credit
Residential Energy Conservation Subsidy Exclusion
(Personal)
Financial Incentive
Personal Tax Exemption
USDA - High Energy Cost Grant Program
Financial Incentive
Grant Program
Weatherization Assistance Program (WAP)
Financial Incentive
Grant Program
State of NY Commercial PACE Financing Program
Financial Incentive
PACE Financing
Green Power Purchasing Goal for Federal
Government
Regulatory Policy
Green Power Purchasing
Clean Energy Fund (CEF)
Regulatory Policy
Public Benefits Fund
System Benefits Charge
Regulatory Policy
Public Benefits Fund
Energy-Efficient Appliance Manufacturing Tax Credit
Financial Incentive
Industry
Recruitment/Support
Federal Appliance Standards
Regulatory Policy
Appliance/Equipment

Efficiency Standards
New York Appliance and Equipment Energy
Efficiency Standards
Regulatory Policy
Appliance/Equipment
Efficiency Standards
Clean Energy Standard
Regulatory Policy
Renewables Portfolio
Standard
Offshore Wind Standard
Regulatory Policy
Renewables Portfolio
Standard
Energy-Efficient Mortgages
Financial Incentive
Loan Program
Residential Wood Heating Fuel Exemption
Financial Incentive
Sales Tax Incentive
Local Option - Solar Sales Tax Exemption
Financial Incentive
Sales Tax Incentive
Solar Sales Tax Exemption
Financial Incentive
Sales Tax Incentive
Fannie Mae Green Financing – Loan Program
Financial Incentive
Loan Program
Office of Indian Energy Policy and Programs -
Funding Opportunities
Financial Incentive
Grant Program
USDA - Biorefinery, Renewable Chemical, and
Biobased Product Manufacturing Assistance Program
Financial Incentive
Loan Program
Interconnection Standards
Regulatory Policy
Interconnection
Qualified Energy Conservation Bonds (QECBs)
Financial Incentive
Loan Program
USDA - Rural Energy for America Program (REAP)
Loan Guarantees
Financial Incentive
Loan Program
USDA - Rural Energy for America Program (REAP)
Grants
Financial Incentive
Grant Program
USDA - Rural Energy for America Program (REAP)
Energy Audit and Renewable Energy Development
Assistance (EA/REDA) Program
Financial Incentive
Grant Program
Clean Renewable Energy Bonds (CREBs)
Financial Incentive
Loan Program
NY-Sun Commercial and Industrial Incentive
Program
Financial Incentive
Grant Program
Interconnection Standards for Small Generators
Regulatory Policy
Interconnection
Guidance for Local Wind Energy Ordinances
Regulatory Policy
Solar/Wind Permitting
Standards
About DSIRE®
DSIRE is the most comprehensive source of information on incentives and policies that support renewables and energy efficiency in
the United States. Established in 1995, DSIRE is operated by the N.C. Clean Energy Technology Center at N.C. State University and
receives support from EnergySage.

Guide to Wind Energy & Wildlife
Current U.S. carbon emission reduction goals indicate that wind and solar power will need to expand to five
times today’s capacity by 2050 to reduce the risk of climate change to people and wildlife. Wind energy
turbines do not release greenhouse gases or other air pollutants during operation, which contributes to a net
reduction in the emissions that cause global warming. Over the entire project life-cycle, wind energy production
uses substantially less water and causes fewer environmental impacts than biomass fuel, natural gas, or coal
(even when paired with carbon capture technologies). However, wind energy, like all power sources, can have
adverse impacts on wildlife. After more than 25 years of focused research, these impacts are much better
understood, although uncertainty remains.
This guide summarizes the statutory and regulatory framework and context of wind energy and wildlife, the
state-of-the-science on wind-wildlife interactions, and the strategies that are being implemented to avoid,
minimize, and compensate for adverse impacts from onshore wind energy in the U.S. to wildlife and habitats.
Framework, State-of-the-Science, and Strategies to Manage Impacts
Wind energy facility siting and development is a complex process. Efforts to understand and address wildlife
impacts begin with siting, permitting, and project development, through operation and management, to eventual
repowering or decommissioning. Wind project development takes place in the context of federal laws,
regulations, and guidelines, as well state and local requirements and recommendations for protecting wildlife.
Impacts to wildlife from wind energy include collision fatalities of birds and bats and changes in the quality or
availability of habitat that occur during construction and operation of a wind facility. Through ongoing
collaboration between scientists and other stakeholders, we are learning about factors that influence collision
risk and how to reduce risk. Habitat-based impacts are more complicated and less well-understood and represent
an important area for future research.
The first opportunities to avoid and minimize wildlife impacts occur during the earliest phases of project
development: landscape assessment, site screening, site characterization, and project design. Siting is a key
component to avoiding habitat-based impacts.
Mitigation Hierarchy: Avoid, Minimize, Compensate
Birds, bats, and other wildlife are present everywhere in the U.S. As such, it is not possible for wind energy
facilities to avoid overlap with wildlife. Wind energy developers and wildlife management agencies therefore
focus on what can be done to mitigate adverse impacts, which may include collisions as well as habitat-based
impacts. Agencies and developers follow an agreed-upon mitigation hierarchy to first avoid adverse impacts;
then minimize impacts that cannot be avoided; and lastly offset, or compensate for, unavoidable impacts.
Avoidance
The first and sometimes best opportunities to avoid adverse impacts occur early in the wind energy
development process, before construction begins. As the name suggests, site “prospecting” is the initial,
exploratory phase in which project developers look on a relatively broad geographic scale for areas that meet
threshold criteria for developing a wind energy project. These criteria could include quality of the wind
resource, access to energy markets, and potential for impacts to wildlife. In terms of avoiding adverse wildlife
impacts, “red flags” may include areas with high conservation value, unique or rare natural communities, major
avian migratory routes, or ecological communities (such as wetlands or native prairie) that provide critical
habitat for endangered species or species of concern.
Once a site is selected, project design – including the micro-siting of turbines and other project infrastructure –
is informed by existing knowledge and on-site field studies to document the relative abundance, behavior, and
habitat use of species that may be sensitive to project impacts.
Minimization
While some adverse impacts can be avoided through careful siting, birds and bats are found in every part of the
country, and the risk of collisions can never be completely avoided. Additionally, evidence suggests that the
presence or absence of bats in an area before a wind project is built may not correlate with the risk of collision
fatalities once a project is operational. Researchers continue to study which groups and species are most at risk
of colliding with wind turbines, and stakeholders have developed an array of strategies and technologies to
minimize the risk of collision for species of concern. The two basic approaches to minimizing collision risk are
deterrence and curtailment.
Deterrence strategies actively discourage birds or bats from entering the high-risk rotor-swept zone, in most
cases, using visual or auditory signals designed either to help birds or bats perceive and avoid the risk, or simply
to repel them from approaching the turbine. Bird and bat ecologists continue to study the mechanisms that
create higher risk for certain species and to develop best deterrent strategies and engineers continue to develop
best deterrence strategies. Curtailment strategies involve stopping or slowing turbine blade rotation when
collision risk is high. Better understanding the conditions associated with collision risk will make it possible to
further refine curtailment strategies such that both risks to birds and bats, as well as power generation losses, are
minimized.
Compensation
Compensatory mitigation is required for eagles in the United States under the Bald and Golden Eagle Protection
Act (BGEPA) and for species listed as threatened or endangered under the Endangered Species Act (ESA). If it
is determined that a wind project may result in fatalities or the loss of habitat needed to sustain these species,
the project developer must come up with a plan to compensate for, or offset, any potential losses. Compensation
may take various forms, such as the preservation of high-quality habitat, restoration of degraded habitat,
funding of conservation programs, or specific actions shown to reduce fatalities to a given species from other
causes. Conservation plans may also be implemented on a voluntary basis to preclude a species from becoming
endangered.
A Common Toolkit for Evaluating Risk and Impacts
In 2012, the U.S. Fish & Wildlife Service issued voluntary Land-Based Wind Energy Guidelines (Guidelines).
The Guidelines were a first for the Service, which saw an opportunity to engage with wind energy developers
and other stakeholders to advance wildlife conservation and renewable energy goals beyond the confines of the
regulatory context. The Guidelines provide a consistent framework to use in systematically considering and
addressing wind-wildlife interactions. Most wind energy developers follow the Guidelines when siting new
projects.
The Guidelines’ decision tree draws on the logic of the mitigation hierarchy – first seek to avoid adverse
impacts, minimize impacts that cannot be avoided, and offset or compensate for unavoidable impacts An
underlying principle is a recognition that the level of due diligence and investment in studying and preventing
impacts should be commensurate with the level of risk posed by a project, recognizing that wind projects vary
in size, location, turbine specifications, and therefore the level of risk to sensitive species
The tiered approach helps wind developers make decisions about whether to proceed with or abandon the
development of specific projects, and when and how to collect additional information. This approach embodies

adaptive management by collecting increasingly detailed information used in decision-making as a developer
moves through the tiers. It does not require that every tier, or every element within each tier, be implemented
for every project; rather, it strives for efficient use of developer and wildlife agency resources with increasing
levels of effort until sufficient information and the desired precision for the risk assessment is acquired.
Pre-construction
During the pre-construction project planning and siting stages (Tiers 1-3), developers seek the best available
science and coordinate with the Service to identify whether there are risks to wildlife as they make preliminary
decisions about avoiding and minimizing risk.
Tier 1 – Preliminary, landscape-level screening. Sites or broad areas under consideration are screened for high
potential risk to wildlife based on existing research, databases, and maps. Potential wildlife impacts are among
of many site characteristics, including wind resource, land ownership, and access to transmission lines, that
companies must consider when prospecting for potential project sites.
Tier 2 – Site characterization. Once the options have been narrowed to specific possible project sites, one or
two in-person reconnaissance visits are made by trained wildlife biologists to further assess potential wildlife
issues. The biologists look for evidence that known species of concern may use the site, either year-round or
seasonally, based on site attributes or records indicating the presence of nesting sites, migration stopovers or
corridors, leks, or other areas where species of concern congregate. Project developers also begin
communication and coordination with the Service and state agencies to inform risk assessment and project
planning, and this coordination continues throughout the tiered process.
Tier 3 – Detailed field studies. If warranted based on risks identified in Tiers 1 and 2, detailed field studies are
conducted to document the relative abundance, behavior, and site use of species of concern, and quantify
potential project impacts. Information gathered at this stage serves several purposes: (1) to enable a decision
whether to proceed with or abandon site development; (2) to design a project that avoids or minimizes wildlife
risk; (3) to establish a baseline against which to evaluate actual project impacts; and (4) to identify
compensatory mitigation measures (if necessary) to offset projected unavoidable adverse impacts.
Post-construction
During construction and operation of a wind energy project, developers assess whether their actions to avoid
and minimize impacts are successful. The outcome of studies in Tiers 1, 2, and 3 are used to determine the
duration and level of effort of post-construction studies.
Tier 4 – Fatality monitoring and habitat impact assessment. Post-construction fatality monitoring (PCM)
studies (Tier 4a) involve searching for bird and bat carcasses beneath turbines to estimate the number and
species composition of fatalities
Tier 5 – Additional studies. If warranted based on Tier 4 study outcomes, additional studies may be performed
to further understand any significant impacts, improve mitigation efforts, or assess potential population-level
impacts. Most wind projects do not proceed to Tier 5 studies – instead, the Service may encourage developers to
participate in non-project-specific collaborative research studies or studies on an experimental mitigation
technique, such as differences in turbine cut-in speed to reduce bat fatalities, but this is beyond the scope of Tier
5 studies.
What Do We Know about Impacts & Risk Factors to Wildlife and
Habitat?
To maximize wind energy’s benefits while addressing the risk to wildlife, a first step is to better understand the
extent and nature of the risk. Risk is defined as the likelihood that adverse impacts will occur to individuals or
populations of wildlife as a result of wind energy development and operation. The potential impacts of wind
energy to wildlife can be grouped in two categories: collision impacts, and habitat-based impacts. Impacts are
studied at individual projects, but by analyzing the results of many studies we can gain insights about risk
factors and potential solutions, as well as potential cumulative and population-level impacts.
What is the likelihood that adverse impacts will occur to wildlife as a result of wind energy development and
operation, and what are the ecological consequences of those impacts? Risk can be defined as a function of
hazard, vulnerability, and exposure, either to individual animals or to a population. Site assessment activities
can provide cursory information on which species are most likely to be exposed to a particular wind energy
project. Risk models and post-construction fatality data at operational projects can help us predict the wildlife
impacts that might result from future wind energy projects and can also help us estimate the cumulative impacts
of wind energy development on a larger scale.
In discussing the risks wind energy can pose to wildlife, we define risk in terms of three components: hazard,
vulnerability, and exposure.
The Risk Framework
Hazard
A hazard is any activity or thing that causes an adverse impact. Many human-made structures pose a collision
threat to birds, including wind turbines – even when they are stationary. Bats are not likely to collide with
stationary turbines but can collide with or be struck by rotating turbine blades. Wind energy facilities can also
constitute a hazard if a species changes its use of the surrounding landscape. For example, species may avoid a
wind energy site during the construction phase of a project and may not habituate to and the presence of
turbines once the facility is operational. The presence of turbines and access roads may result in fragmentation
of a species’ habitat, or change the balance of prey and predator species, affecting the survival or reproductive
success of species of concern. The size and number of turbines within a project and the project footprint are
aspects of the hazard that we consider when assessing risk.
Vulnerability
Vulnerability pertains to the consequences of being exposed to a hazard. In the case of collisions with wind
turbines, the consequence to an individual animal is injury or death. In the case of habitat impacts, vulnerability
is a measure of how species’ use of habitat, survival, and reproductive success rates are affected by the presence
or proximity of wind energy facilities. Whether individual fatalities render populations vulnerable to decline
depends on the size and reproductive rate of the population, and cumulative impacts to populations from
additional sources of take. A species’ population is more vulnerable to an impact if a small level of take can
lead to changes in population size. Endangered and threatened species are considered more vulnerable to
impacts because their populations are already facing smaller sizes and conservation threats. Species with low
reproduction rates also tend to be more vulnerable to impacts from wind energy because they tend to have lower
rates of reproduction. As an example, Golden Eagle populations, for which individuals take several years to
reach maturity and only produce one to two chicks per year, are more vulnerable to impacts from wind energy
than Mallard populations, because Mallards are able to reproduce early in life and can produce multiple broods
of a dozen eggs annually.
Exposure
Exposure considers the amount of time and number of individuals within a population are likely to interact with
wind energy facilities. In the case of collisions, exposure considers the frequency that birds or bats enter the
collision risk zone of a wind turbine and the amount of time spent within that zone. In the case of habitat
impacts, exposure is a measure of the likelihood that a wind facility is constructed in habitat used by a species.
Site assessment activities that measure species occurrence within a site provide a cursory measure of exposure
when estimating risk.
What do we know about collision impacts to birds and bats?
For birds, 75% of studies in AWWIC reported 2.3 or fewer fatalities per MW per year, with a median fatality
estimate of 1.3 birds per MW per year. Overall, bird fatality rates ranged from 0 to 19 fatalities per MW per
year.
Adjusted bat fatality rates tend to be higher and more variable than bird fatality rates. 75% of studies in
AWWIC reported estimates of fewer than 7.7 bat fatalities per MW per year, with a median of 3 bats per MW
per year. Some projects along the forested ridgelines of the central Appalachians report rates close to 50 bats
per MW per year.

Minimizing Collision Risk to Wildlife During Operations
Because there is no way to avoid all wind-wildlife interactions, stakeholders have developed an array of
strategies and technologies to minimize collision impacts, and researchers are evaluating the effectiveness of
different minimization approaches. There are two main strategies to minimizing collision risk during wind
energy project operation: deterring birds and bats from getting too close to a turbine, using audible or visual
signals, or curtailing (shutting down or slowing) turbines during times of higher collision risk. Detection of
animals approaching the risk zone can be used to inform deterrence or curtailment strategies.
Deterrents include:
•Ultrasonic and audible deterrents
•Visual deterrents to reduce risk for birds
•Visual deterrents to reduce risk for bats
Curtailment is the feathering of wind turbine blades (angling the blades parallel to the wind to slow or stop them
from turning) when risk of collision is determined to be high.
Curtailment options include:
•Raising the cut-in speed
•Blanket curtailment
•Smart curtailment
•Informed curtailment: Monitoring and selective shut-down

INTRODUCTION
A renewable electricity system sounds like an environmental utopia, relying on the sun and wind to meet
our energy needs. However, as more solar and wind power generation is built, we are beginning to see
some of the negative impacts of these energy sources come to the fore.
Production of fossil fuels for electricity generation, mainly coal and natural gas, generally happens away
from population centers. The fuel is then transported to generation plants that tend to be large facilities
located away from most of the population. The environmental justice issues and local pollution near fuel
production and electricity generation are often borne by the poor and those with less political power. Few of
us see the industrial facilities that generate our electricity; many people view their electricity as coming from
the outlet in the wall and don’t think beyond that.
Renewable sources of electricity raise different challenges. Air pollution is not an issue, but wind and solar
generation are more land-intensive than their fossil fuel counterparts. Fossil fuels are very concentrated
forms of energy, while renewable sources are abundant, but much more diffuse.1 In an electricity system
based on renewables, the fuel can’t be transported. Instead, wind and solar generation must be located in
areas with good resources, where they may come into conflict with wildlife, recreation, or scenic views.2
By their nature, renewable electricity systems will be more widely-distributed geographically, with an
extensive transmission system to move power to where it is needed.3 The expanding land needs of a
renewable energy system raise concerns about “energy sprawl.”
For these reasons, an energy system based on renewables will have a different shape than the fossil fuel-
based system Americans are accustomed to. Production facilities will cover more land in areas that are not
accustomed to energy infrastructure. Trillions of dollars of infrastructure will be needed to achieve a
renewable power system, for construction of generation and transmission capacity.4
Most people say that they are in favor of renewable energy, in the abstract. But we are beginning to see a
backlash against the land use implications of renewable energy in the United States, especially in wealthy,
politically-active communities. Wind projects have encountered opposition from people concerned about
the turbines’ noise, impact on scenic views,5 and harm to birds.6 Solar projects in the desert have faced
concern about habitat loss for rare plants and animals.7 Renewables are not an environmental panacea,
but often raise concerns of their own, just like every other form of energy.
Policymakers have come to expect opposition to many “undesirable” forms of land use, from low- income
housing to industrial facilities and oil and gas production. However, the general public’s favorable opinion
toward renewable energy is shifting attention away from the strong local opposition arising in some areas
as wind and solar generation expands. Recognizing these challenges and facing them head-on will be an
important part of moving toward a deeply decarbonized energy system.
RENEWABLE ELECTRICITY USES MORE LAND THAN THE FOSSIL FUEL SYSTEM
To understand the land implications of different forms of energy, a few terms will be helpful. Energy
density is the amount of energy contained in a fuel by volume or weight. Coal and oil have a very high
energy density, meaning that they pack a great deal of energy into a small space. Natural gas is not
energy dense by volume but is certainly energy dense in terms of weight. Energy dense fuels are easily
moved from place to place, a useful quality in today’s energy system.
Renewables, Land Use, and Local Opposition in the United States
Power density is the land surface area needed to produce a given amount of energy. Power density is
often used to describe renewable sources of energy, calculating how much land area must be covered by
solar panels or wind turbines to produce energy. Several factors weigh into the overall power density,
including the average intensity and duration of sunshine or wind over time, and the conversion efficiency of
the solar panel or wind turbine.
Although power density is easiest to understand in terms of renewable forms of energy, the concept can
also be applied to natural gas- and coal-fired power to consider how the land use of a power system based
on renewables might compare to today’s fossil-based system. Calculating the power density for power
generated from these fuels involves adding up the land area disturbed to produce and process the gas or
coal, transport it to the power plant, and generate electricity.
We tend to think of fossil fuel production as environmentally destructive. This is sometimes true, but the
high energy density of fossil fuels means that the overall land area disturbed per unit of energy produced
can be quite low for very high-quality fossil resources. Clearly, mountaintop removal for thin coal seams
results in much greater land disturbed per unit of energy produced than an efficient mine of a thick coal
seam near the surface, or a very productive natural gas well. Land use at fossil fuel power plants tends to be
very low per unit of power produced, although coal plants need more space to store fuel while natural gas
arrives on a just-in-time basis via pipeline.
Despite the wide range in possible power densities for fossil fuel electricity production, we only need order-
of-magnitude estimates of power density for the discussion here. Additionally, the lowest power density
resources tend to be uneconomic to produce, narrowing the range a bit. All in, the fossil fuel electricity
system in the United States has a power density of less than 200 to nearly 1,000 watts (W) per square
meter (W/m2).8 This number is meaningless without some context. The average
U.S. household uses an average of 10,400 kilowatt- hours (kWh) of electricity in a year which equals an
average flow of 1,190 W of power.9 Understanding that power demand is not constant, let’s assume that
an average household needs to have 2,500 W of power generation capacity in place to keep the lights on
consistently. This equates to around 2.5 to 12.5 square meters of disturbed area, or 27 to 135 square feet
(a range from the average bathroom size to the average bedroom size in an American home).10 Clearly this
disturbed area adds up when you consider every household in the United States, and fossil fuels have very
important environmental impacts beyond their land footprint. Nonetheless, this is an important starting
point as we consider the footprint of renewable power.
The power density of renewable power is one to two orders of magnitude lower than that for fossil fuel
power, meaning that renewable power requires at least ten times more land area per unit of power
produced.11 Solar photovoltaic cells have a power density of about 10 W/m2 in sunny locations and wind’s
power density is around 1 to 2 W/m2 in the United States.12 These power density values are averages
over time, taking into account that wind and sun are intermittent sources of energy. Maximum
instantaneous power density values would be much larger. These values also include all the land area of a
solar or wind facility, including access roads and the spacing required between wind turbines for optimum
operation. The space between wind turbines can be used for other purposes, like agriculture or grazing;13
considering only the area of turbines and required infrastructure gives a figure of about 10 W/m2. The
correct figure to use depends on the question being asked — total impacted land area or area unavailable
for another use.
Understanding the power density numbers for renewables also requires context (see Figure 1). Fossil fuel

power is generally available whenever needed, while wind and solar power depend on wind or sun
conditions. Siting renewable resources over a wide area makes their production less correlated — for
example, if the wind is not blowing in one place, it may be windy somewhere else. Additionally, electricity
storage will become a more important part of a renewable power system over time, allowing renewable
power to meet the varying demand of customers.14 Finally, power systems based on renewables may have
some fossil fuel backup for times when geographic diversity and storage still do not meet demand.
Without knowing the nature of a renewables-based system, one can’t make assumptions about the
generation capacity needed to meet demand. However, considering the 2,500 W of capacity per household
assumed for a fossil system and counting only land unavailable for other uses (10 W/m2 power density for
both wind and solar) means that 250 square meters or 2,700 square feet of space would be needed,
roughly the average floor area of a new single-family home in the United States.15 A system with more
fossil backup would be closer to this number, while a system reliant on energy storage could be much
larger to deal with variability.
FIGURE 1: POWER DENSITY OF SELECTED SOURCES OF ELECTRICITY
10000
1000
100
10
1
Onshore wind Offshore wind Solar Coal Nuclear Natural gas
The bars represent the range of values and the dot represents the median value.
Source: John van Zalk and Paul Behrens, “The spatial extent of renewable and non-renewable power generation.”16
These calculations for land use in fossil and renewable systems are indicative, meant to help in
visualizing differences in power density. Extrapolating them to the overall power system would create a
host of problems, related to the variable power production of renewables and the need for ongoing
production of fossil fuels. But clearly a difference in power density of as much as one to 100 makes an
important difference in the land use implications of a power system with ever more renewable power.
Renewable power production will take place in areas that have not seen energy development before.
Despite the order-of-magnitude difference in power density, renewables have an important land use
advantage over fossil fuels. Renewable energy can be sustained indefinitely on the same land base, while
energy production from fossil fuels requires that new resources are continually exploited to meet demand.
Anne Trainor, Robert McDonald, and Joseph Fargione introduce the concept of time-to-land-use
Power Density (W/m2)

equivalency, meaning the amount of time it takes for fossil resources to catch up with renewable forms of
energy in terms of land disturbed to produce a given cumulative amount of energy.17 Considering the
direct footprint of renewables (land unavailable for other uses) rather than the overall land disturbed leads
to interesting results, especially for wind. In 1.4 to 6.9 years, electricity production from natural gas
reaches the same level of land use as wind, if the land around the
turbines
is
considered
available
for
other use. This time extends to as much as 44 years if one considers the entire footprint of a wind farm,
including the area between the turbines. Solar photovoltaic power takes longer to reach equivalent land use
with natural gas, from 15.8 to 78.5 years. The wide range depends on the efficiency and resource quality of
the renewable energy systems, along with the productivity and life of the natural gas wells.18 Importantly,
these calculations consider land disturbed for fossil production as permanently disturbed. Producers in the
United States generally must restore lands after fossil fuel production ends, although restoration cannot
necessarily return land to its previous state.
CONCENTRATED FOSSIL SYSTEM MEANS FEWER PEOPLE INTERACT WITH ENERGY
PRODUCTION
A key feature of the current fossil-based energy system is how little land it occupies, given its central role
in our economy. Estimates from 2010 and 2015 show that the fossil fuel, nuclear power, and
hydroelectric system occupies 0.5% of U.S. land area.19 This area is divided in roughly equal proportions
among fossil fuel production and use, hydroelectric reservoir area, and rights-of-way for fuel
transportation.20 Approximately 7,300 square miles were involved in fossil fuel production in 2010,
roughly the size of New Jersey. U.S. fossil fuel production is concentrated in the southern Plains states,
Appalachia, and the Mountain West.
The limited land area means that relatively few people live near fossil fuel production, although these
residents are concentrated in certain states. An estimated 17.6 million people, 5% of the U.S. population,
lived within one mile of an operating oil and gas well in 2014.22 This number is likely an overestimate of
today’s level, since 2014 had the highest number of operating wells in recent years.23 Data on populations
living near coal mines is harder to find, but the nearby population is certainly much smaller, given that coal
mining is more geographically-concentrated than oil and gas production.
Fossil fuel production and electricity generation negatively impact local communities, through local air
pollution, disturbed landscapes, and issues related to aesthetics like lower property values.24 This is an
environmental justice issue for those living closest to energy facilities, frequently the poor and minorities with
less political power. This relatively small immediately-affected population bears much of the brunt of the
current fossil fuel system. (Air pollution from fossil facilities can also be much more widely dispersed, but
the conversation here focuses on those closest to the facilities that bear the worst of pollution and other
negative impacts.)
LAND USE REQUIREMENTS MAKE SITING RENEWABLES A CHALLENGE
Wind and solar resources, and thus generation capacity, are distributed differently than oil and gas
resources. Solar resources are best in the Sun Belt of the Southwest, although the southeastern United
States also has strong resources. Wind resources and development are strongest in the Great Plains
states and Texas along with the Upper Midwest, as shown in Figure 4. Wind and solar generation is
being built in some areas unaccustomed to large-scale industrial energy development.
FIGURE 4: GEOGRAPHIC DISTRIBUTION OF U.S. WIND POWER GENERATION
Source: U.S. Energy Information Administration26
With power density as much as 100 times less than fossil fuels, one might be concerned about running out
of appropriate land as the electricity system becomes more reliant on renewable sources. However, a real
zero-carbon power system will not take up nearly as much land as its power density might suggest. Such
a system is likely to include more power dense sources, such as nuclear power and gas-fired power with
carbon capture and storage to deal with intermittency. Wind and solar technologies will become more
efficient over time, reducing the space required per unit of power produced. Land disturbed for fossil fuel
production adds up, whereas the land used for renewable production is only disturbed once. Finally,
renewable power can also be co-located with other land uses, such as solar generation on city rooftops27
and wind and solar facilities sharing land with agriculture.28
Nonetheless, densely-populated states may face challenges in siting enough renewable energy to meet
their in-state goals. For example, meeting New York’s goal of 50% renewable generation by 2030 will
require approximately 6,800 megawatts (MW) of solar photovoltaics and 3,500 MW of onshore wind,
which would require an estimated 136 square kilometers and 700 square kilometers, respectively.29
Together these amount to only 0.5% of the state’s land area, but more than half of New York state is
occupied by forest and woodland, and farmland accounts for nearly one quarter of the total land area.30
The greater challenge will be siting renewable facilities in ways that minimize public opposition and
conflicts with existing land use. For renewable electricity, the site “chooses” the project, rather than the
other way around.31 This lack of flexibility in site selection raises challenges. The areas with the best sunlight
or wind resources are not necessarily located near demand centers or existing energy infrastructure, such

as high voltage transmission lines.32 There are often trade-offs between the best sites for power generation
and the costs of accessing infrastructure. Transmission infrastructure is also often inflexible in its siting;
avoiding sensitive areas or areas of public opposition can be difficult.
Power infrastructure will also extend into areas where local citizens are not accustomed to seeing it. In the
United States today, wind and solar make up only 8.7% of power generation and 11.1% of generation
capacity, yet these land use challenges are already coming to a head in some areas.33 At the end of 2015,
nearly 1.4 million homes in the United States were within five miles of a utility-scale wind project.34
Local opposition to projects
Public opinion toward renewable energy is generally positive in industrialized countries, including the
United States.35 Political attitudes toward renewable energy in the United States are less polarized than
those toward climate change, and several states that vote Republican are leaders in renewable energy,
including Texas, Oklahoma, and North Carolina.36 Nationally, 82% of Americans would support tax rebates
for energy-efficient vehicles or solar panels. However, public perception can turn negative, even among
those generally in favor of renewable energy, when people believe that a renewable development will
cause them economic or health problems or when they dislike the aesthetics of the project.
Large solar and wind farms and the infrastructure that serves them are often unpopular at the local level.
People like clean energy in the abstract, but some object to large-scale projects near their homes.
Renewable electricity requires more and different land area than today’s fossil fuel system and thus often
brings about opposition in areas not currently affected by energy development. Nearby
residents
are
concerned
about
impact on their property values.37 Conflicts can arise between landowners that stand to
profit from wind, solar, or power line development and those nearby who will be affected by the
development without compensation. Renewable energy projects are not alone in generating public
opposition, but the juxtaposition of strong general support for the technologies with sometimes strong
local opposition to wind, solar, and transmission projects can catch policymakers unprepared.
Concerns about losing forest, agricultural lands,38 or other important ecosystems39 to renewable
development are real, as are apprehensions about the water requirements of solar in water- constrained
areas.40 Studies have shown that the conservation value of lands has degraded following renewables
development in fragile areas, such as the Mojave Desert.41
Wind projects generate particular opposition because of their size. Modern wind turbines are huge;
two important factors make them so. Winds are more consistent at higher altitude, so a taller turbine
means greater power generation. Additionally, larger and longer blades catch more wind and allow more
power production from each turbine. Larger and taller turbines have been key factors in increasing wind
efficiency in past years, made possible by stronger materials that can take the stress of high winds
without flexing too much. Most new onshore wind turbines in the United States are just under 500 feet
tall, or roughly the height of a 35-story building, to avoid additional regulations from the Federal Aviation
Administration if they reach 500 feet.42 Offshore turbines are even larger. The only offshore wind project in
operation in the United States, at Block Island, Rhode Island, has turbines 590 feet tall, while GE is
designing an offshore turbine that will be more than 850 feet tall, with blades longer than a football
field.43
These huge turbines create turbulence around them, meaning that for maximum efficiency, turbines in a
wind farm must be spaced far enough apart that they don’t interfere with each other. Suggested spacing
is generally 3 to 10 rotor diameters. Assuming the average rotor diameter in the United States of 380 feet
and 7 diameters of spacing, turbines would be more than half a mile apart.44 A wind farm in a prime
location can have hundreds of turbines; the largest wind farm in the United States is in Tehachapi Pass in
Southern California, with more than 4,000 turbines and more than 1.5 gigawatts of generating capacity.45
Additionally, since the turbines need unobstructed wind to produce power efficiently, they tend to be
located in open plains or ridgetops, meaning that they can be seen over long distances. Their beauty is in
the eye of the beholder (or not), but modern wind turbines can certainly take over a landscape.
Lawrence Berkeley National Laboratory conducted a survey of residents living within five miles of modern,
utility-scale turbines, which they defined as those at least 354 feet tall and at least 1.5 MW in capacity.46
Fifty-seven percent of those surveyed viewed their local wind project positively or very positively. Attitudes
changed only slightly for those located within half a mile of the project, with 50% of respondents viewing
the projects positively or very positively. Positive attitudes toward projects were correlated with residents
being compensated for the projects’ impacts and their perception that the planning process was fair.47
On the other hand, projects that begin in secret and developers that are seen as aggressive or misleading
toward landowners and community members foster opposition and mistrust.48
Even though the majority of people in the vicinity of wind projects favor them, wind energy can still face
significant challenges from local residents, especially those who will not receive direct financial benefits
from the projects. Residents are concerned about noise and shadow flicker, potential declines in property
values, and bird kills, and many believe that wind turbines are an eyesore.49 Additionally, wind projects are
often large enough to cross jurisdictional boundaries, meaning that opposition in one jurisdiction can stop
an entire project.50
Studies have found mixed results on the impact
of wind turbines on property values. A large study in
2013 found no statistical evidence that wind development affects nearby home values.51 However, other
studies have found significant decreases in property values near wind projects, of as much as 15% within
one mile of a turbine.52 U.S. courts have generally not provided any recourse for decreasing property value
due to wind development. For example, in Wisconsin Realtors Association v. Public Service Commission of
Wisconsin, several building and real estate interests sued over the state’s wind energy rules. The plaintiffs
argued that the Public Service Commission failed to prepare a housing impact report for the Wisconsin
Legislature, as required, when their new wind energy rules affected housing valuation in the state. The
Wisconsin Supreme Court ultimately decided that there was no causal relationship between the siting of
wind turbines and a measurable change in property values, and thus that the housing impact report was
not required.53
A frequent complaint is that the power produced in these projects is not needed locally and will only
benefit people in cities far away. However, given the distribution of wind resources, the sparsely populated
Great Plains and Upper Midwest are key areas for U.S. wind development. Nonetheless, bills in Nebraska
have proposed to exclude wind energy from the state’s definition of renewable energy and to require new
turbines to be at least three miles from homes.54 Public opposition recently stopped a project in Kansas, the
U.S. state that gets the highest proportion of its power from wind, at 36%.55 A small wind project in Iowa was
recently dismantled amid public opposition, when a court determined that the permits for the project were
issued illegally.56
Although solar energy does not produce noise and is only visible over short distances, solar
development faces many of the same challenges as wind. California’s San Bernardino County, the largest
county in the United States by area, recently prohibited utility-oriented
renewable
energy projects, defined
as those where more than 50% of the electricity generated will be used outside the local area, in more
than a dozen unincorporated areas and in rural living zones. Sparsely populated and sunny areas in San
Bernardino County could be ideal for solar development. However, local residents argue that such projects
disturb pristine desert, scenic views, and wildlife habitat. The prohibition eliminates more than one million
acres of private land from development.57 Nonetheless; the State of California requires utilities to get 60%
of their electricity from renewable sources by 2030.58
This sort of opposition is not unique to California. A 500 MW solar farm in Virginia that would be the largest
solar facility east of the Rocky Mountains has attracted fierce opposition from locals concerned about the
development reducing property values and ruining the rural character of the area.59 Meanwhile, in 2018
the Virginia General Assembly passed legislation aiming to increase solar capacity in the state to 5,000
MW.60
Transmission capacity also brings opposition
Building the infrastructure to move renewable energy to market is an additional challenge, in financing,
policy, and public acceptance. Renewable power facilities generally produce less power at a single site than
their fossil fuel counterparts and their electricity production is intermittent, meaning that lines will carry less
power than those connected to fossil generation.61 Transmission lines to move renewable power follow
different paths than many existing lines, from areas of good renewable resources toward areas of strong
power demand, mostly cities. These factors can make financing transmission infrastructure for renewables
more challenging and risky.62 The lack of transmission capacity can create a chicken-and-egg problem for
renewable projects. Without adequate and accessible transmission capacity, renewable projects are less
likely to be economically viable, but investments in renewable energy are needed to justify construction of
new transmission.63
The U.S. power transmission grid needs significant upgrading, in addition to the challenge of integrating
renewables. Most U.S. high voltage transmission lines were built in 1950s and 1960s, with an expected
lifespan of approximately 50 years. The grid is also congested, with many lines operating well beyond
their design range.64 The structure of the grid is currently fractured among regional entities and utilities,
but greater interconnectivity would reduce the impact of intermittent generation, since wind speed is not
correlated over large distances.
In the United States, federal and state governments can force property owners to sell land for public use, so
long as the government offers the property owners just compensation, a power known as “eminent
domain.” However, for transmission lines, the power of eminent domain lies with states and a single
project often needs to get approvals from multiple state and local jurisdictions. States differ in their policy
toward using eminent domain for power lines that are separate from incumbent utilities or that transfer
power outside the state.65 Some states encourage such development, believing that it encourages
investment in their state. Others discourage it by forbidding the use of eminent domain in siting or through
other polices.66 Many states approve projects based on the benefits they provide to the state, which is
minimal when the line is merely transiting the state, not providing local power.67
Significant new transmission lines are particularly needed to move wind power from the Great Plains and
Upper Midwest to load centers further east. However, some landowners in transit states are resisting
these transmission projects, complaining that they are being forced to sell land for easements and deal with
the visual impact of transmission projects that do not benefit them. For example, the Grain Belt Express
transmission line is intended
to bring wind power generated in Kansas through Missouri, Illinois, and
Indiana, where it will connect into the eastern power grid. The line’s developers have met public and
legal resistance in both Missouri and Illinois.68 In Missouri, the state House of Representatives approved
a bill preventing the use of eminent domain to acquire land for the project; the bill died in the Senate due
to a filibuster.69 This opposition is understandable, but transmission lines such as this one will be
necessary to maximize the amount of renewable power used in the United States.
As renewable energy expands, “sweet spots”
for development — those with good wind or solar
resources and proximity to power demand, transmission capacity, or at least minimal opposition to new
transmission — may be more difficult to find. Is there another way to get around siting challenges?
TECHNOLOGICAL SOLUTIONS TO REDUCE PUBLIC OPPOSITION
A number of technologies may help lessen the land use impact and public opposition to renewable
development. One potential solution to land use concerns is to move these projects away from land
entirely. Wind is particularly amenable to moving offshore. Winds are generally stronger offshore and wind
speed and direction are more consistent, leading to greater potential generation and greater efficiency.70
Offshore wind may be particularly helpful in the Northeast, where several states have ambitious renewable
energy goals, but less open space for renewable development. The U.S. Bureau of Ocean Energy
Management has leased a total of 1.7 million acres off the East Coast for offshore wind development
(see Figure 5).71
FIGURE 5: OFFSHORE WIND LEASES IN FEDERAL WATERS AS OF MARCH 2019
Source: U.S. Department of the Interior’s Bureau of Ocean Energy Management72
Public opinion of offshore wind depends on the specifics of the project. The ill-fated Cape Wind project,
which intended to place 130 wind turbines in the shallow waters of Nantucket Sound, provides a stark
example of a project gone wrong. Opposition to the project was fierce, from wealthy homeowners concerned
about the project spoiling their views and from other citizens concerned about its high cost, hazards to
navigation, and threats to the marine environment. The developer finally pulled the plug on the project in
2017, after 16 years of legal battles.73 A new project, Vineyard Wind, is now proposed for an area nearby, 15
miles off Martha’s Vineyard. Vineyard Wind is also facing challenges, as the U.S. government decided in
August 2019 to extend the environmental review process,74 which will delay the project schedule.75
Meanwhile, the project faces continued opposition due to concerns about potential impacts to commercial
fisheries,76 and of underwater cables on the endangered North Atlantic right whale.77
As Cape Wind was dying a slow and painful death, five turbines about three miles off Rhode Island’s Block
Island began operation in December 2016, the first offshore wind farm in the United States. Block Island is
a summer tourist destination and the turbines are visible from the island and from the ferries that tourists
take to and from the island. Concern that the wind farm would negatively affect tourism was an important
argument against the project, but preliminary data show that the development actually increased tourism
to the area, perhaps, in part, due to curiosity about the project.78 Impacts on fishing are mixed. The turbine
structures are acting as artificial reefs, attracting a variety of fish and other marine life to the area. The
area around the turbines has become a prime destination for recreational fishing, but commercial
fisherman view the additional traffic in the area negatively and are concerned about navigating around the
turbines.79 The project also connected the island to the mainland electricity grid for the first time and
eliminated the diesel generating system that had previously provided power, eliminating nearly 1 million
gallons of annual diesel fuel use.80
Solar generation can also be installed on water. Floating photovoltaic (PV) systems, sometimes called
“floatovoltaics,” can be installed on man- made bodies of water with few other uses, such as utility cooling
ponds. In addition to their land use advantages, floating PV systems are more efficient than their land-
based counterparts due to lower temperatures under the panel. A study from the
U.S. National Renewable Energy Laboratory found that sites appropriate for floating PV could provide 10%
of current U.S. electricity generation.81
Combining solar systems with agriculture is another potential technological solution to the challenge of
siting large-scale solar facilities. Such systems mount the solar panels on stilts, allowing standard
agricultural machinery to work beneath the panels. Crops below are partially shaded as the sun moves
across the sky during the day. Some crops are tolerant of partial shade and may even produce higher
yields during times of drought stress, due to lower water transpiration through the leaves and a reduction
in heat stress.82 Colocation of solar PV with agriculture can also increase the efficiency of electricity
production because vegetation tends to lower the temperature beneath the panels.83 Finally, combining
solar power generation with agriculture could provide additional revenue to farmers, helping to protect
farmland and keep food costs down.
LOCAL COOPERATION AND STRONG LAWS ARE KEY TO RENEWABLE ENERGY
DEVELOPMENT
A shift toward renewable electricity involves a wholesale change in the shape of the power system and the
required infrastructure. Power plants and the transmission lines to move that power to load centers will be

located in areas not accustomed to industrial development, and potentially areas with strong, politically
active opposition. Clearly, project developers will need to engage in serious public consultation to get buy-
in The concepts of “social license to operate”— acceptance from local communities and
stakeholders — and “above-ground risk” are common in mining and oil and gas development. Renewable
project developers sometimes assume that the inherent benefits of their projects mean that such
community approval is automatic, but lessons-learned from extractive industries can be applied to
renewable development as well. Best practices include establishing an ongoing dialogue with external
stakeholders, understanding who represents the community and not dealing exclusively with the loudest
or most powerful members, and considering global and local concerns together, since nothing is truly local
in our hyperconnected world.84
The debate about siting renewable energy and transmission has much in common with other debates
about socially important, but “undesirable” types of businesses and infrastructure, including low-income
housing; water, wastewater or solid waste facilities; and logistics centers. As land use decisions have
become more responsive to local concerns, siting such facilities has become more challenging. However,
paying too much attention to local opposition runs the risk of siting necessary but unpopular facilities only in
areas with lower levels of political activity or clout, potentially exacerbating issues of environmental justice
or disparities in property values. Our current system of land use governance is not well-suited to providing
public goods in socially-optimal ways.
The concept of “not-in-my-backyard,” or “NIMBY- ism,” comes to mind when stakeholders generally support
a technology, but don’t want it located near them. However, the term is pejorative, minimizes communities’
genuine concerns about projects, and can distract from efforts to look for common ground.85 People often
feel a strong attachment to their local area and value its aesthetic qualities. Change is difficult. Wind projects are
particularly challenging in this respect because they can be seen for much greater distances, but solar projects
are not immune from concerns about changing the character of a landscape.
Additionally, a power system based on renewables will require greater coordination across geography and
different market design than the current system, to minimize the disruptive effect of intermittent generation
with zero marginal operating cost. Achieving these changes may prove challenging for existing power
governance structures, like the independent system operators and regional transmission organizations that
operate in various regions of the United States today. However, these changes may create winners and
losers and involve giving up some element of local control, making them difficult to implement politically.
Achieving U.S. and global goals for decarbonization will require cooperation across levels of government. At
the national level, it’s easy to see how particular projects are in the public interest, but often the benefits
of these projects accrue nationally or globally, while the land use impacts are local. This problem is
similar to the larger climate problem getting people to make local sacrifices for the greater good is
always a challenge.
A number of specific policies can make siting and land use decisions easier. None of these policies is a
panacea, but a combination of policies can increase collaboration and minimize community resistance to
development.
●Improving land use planning: Planning and zoning are crucial to balance energy needs with other
community goals and concerns. Defining the siting requirements for renewable generation and
transmission and declaring particularly sensitive areas off-limits in advance can help communities
effectively deal with developers and prevent the scramble of project supporters and opponents that
can occur without clear rules. The reverse is also true — establishing renewable energy zones and
encouraging generation and transmission development in these areas can streamline siting and
permitting in the best resource areas. However, many local governments, especially in rural areas,
lack the expertise and capacity to effectively regulate siting of renewable generation and
transmission.
●Converting brownfields: Renewable development can be focused on previously- disturbed lands, such
as brownfields or degraded agricultural land. Not all of these lands will be appropriate for renewables
and there is not enough degraded land to meet energy needs. Nonetheless, renewable energy
development on brownfields can be an attractive business proposition since the sites often have
existing infrastructure and likely result in lower land costs. Streamlining permitting for these areas and
removing barriers to development could bring renewable generation to areas less likely to face
community opposition or alternative uses.
●Facilitating rooftop solar: Rooftop solar installations directly benefit the consumers that host them,
more than any other renewable technology. Commercial and residential installations of rooftop solar
are likely to cause less backlash and are more appropriate for crowded or protected settings. Rules that
make rooftop solar more difficult, like those preserving the historical character of buildings, are
unhelpful.86
●Expediting transmission infrastructure: Some areas have more land appropriate for renewables
than others. Densely-populated areas and areas with low wind and solar resources will likely need
to import power from other areas. Federal, state, and local regulations that facilitate the
development of transmission infrastructure needed to move renewable power will be important.
Rules that favor infrastructure projects that benefit the immediate local area will be challenging if
they make interstate transfer of power more difficult.
There is no perfect way to produce electricity, especially on an industrial scale. Any modern energy system
will require disturbing land as well as visual impacts that some will find objectionable. Moving toward an
electricity system based on renewable power will not eliminate these problems and will make some of
them worse. Local air pollution issues will certainly improve in a system with more renewables, but
renewables will bring power system impacts to people not accustomed to them, especially rural
residents. A transition toward more renewable power must recognize these challenges and work with
affected populations to understand and assuage their concerns.

MISSION OUTCOME
NYS Strategic Outlook
2022-2025: Clean Energy
Economy
With nearly 160,000 clean energy jobs across the
State at the end of 2020
— and with hundreds of thousands of new jobs to be
created by Climate Act investments on the near-
horizon — New York’s nation-leading climate policies
continue to drive investment and job-creation.
Following the setbacks in the aftermath of the early phases of the coronavirus pandemic,
subsequent job rebounds have shown tremendous resilience in the sector — only 4% of New
York’s clean energy workers lost their job as of the end of 2020, compared to 9% of clean
energy workers nationally. The resilience of the clean energy bounce-back is also on display
benchmarked against both the rest of the New York State economy, and compared to other
regional clean energy industries. Nonetheless, the State needs the clean energy industry to
continue to grow and thrive in the years ahead, helping drive a sustainable, equitable, and
enduring economic recovery for New York.
Achieving the Climate Act’s nation-leading goals and building back a thriving industry sector
will mean expanded deployment of existing technologies as well as substantial investment in
the State’s clean energy innovation economy to develop new solutions for a low-carbon
future.
New York’s ecosystem of start-ups will develop these technology and business-model solutions for demonstration and
use in the State, as well as for export to markets across the globe. Growing new industries in our state, such as battery
manufacturing and research in Binghamton, will help realize significant positive economic impacts in the form of job
creation and community investment. Furthermore, to build an inclusive clean energy economy and cultivate a just
transition, NYSERDA, other State agencies, and clean energy industry partners will be ramping up efforts to develop a
pipeline of skilled labor and open-up economic opportunities to to workers, communities, and historically disadvantaged
populations who may be transitioning from fossil fuel-based economic activities.

STRATEGIES FOR 2022–2025
NY Green Bank
■Increase the size, volume, and breadth of sustainable infrastructure investment activity throughout the State, expand the base of
investors focused on clean energy, and increase market participants’ access to capital on commercial terms.
■Address barriers to mobilization of private capital and financing for clean energy projects: identify where barriers exist,
demonstrate investment model, entice private capital, and repeat.
■Replicate and refine the transaction-model executed in 2021 with major U.S. bank to expand impact in the private financial world,
boost liquidity, and deliver value for ratepayers.
■Support priority policy areas through a growing pipeline of investments in energy efficiency, energy storage, electric vehicles,
affordable housing, offshore wind port infrastructure, and beyond.
■Consistent with the goals of the Climate Act, expand the impact of the new initiative to invest in projects that support and deliver
benefits to Disadvantaged Communities.
■Explore and refine new financing models (e.g., energy efficiency pay- for-performance) and new technology/solution areas (e.g.,
microgrids).
■Continue issuing targeted RFPs and organizing convenings in strategic areas to grow the clean energy investment pipeline.
■Develop strategy for supporting full life-cycle supply chain build-out in New York, from manufacturing to recycling and reuse.
Innovation
■Support the development of climate technologies necessary to meet the State’s Climate Act goals through funding,
developing teams, customer introductions, advisory services, and the development and support of independent innovation
organizations.
■Address barriers and support regulations, processes, and rulemaking that enable a robust climate innovation economy by
stimulating demand and supporting private sector innovation efforts.
■Invest in the development of New York’s green economy, supporting relocation of climate-tech companies to New York, the
growth of existing companies already in the State, and the human capital of the innovation ecosystem across the State.
■Consistent with the goals of the Climate Act, ensure the State’s innovation development system, as well as the innovations
developed, deliver benefits to Disadvantaged Communities.
■Coordinate and partner with the national innovation ecosystem to align and leverage State priorities and support New York
climate-tech companies’ access to finance and expertise.
■Demonstrate the role of innovation in deep decarbonization, helping New York State to develop pathways to achieve the most
challenging last 20% of our long-term emission reduction goals.
■Partner with existing industries to collaborate on and grow the new carbon-to-value (C2V)/carbontech hub, and to support
pre-commercial deployment opportunities related to a wide-variety of applications from CO products and new battery
chemistries to hydrogen infrastructure/hardware.
Workforce Development
■Prioritize and scale-up our impact on the recruitment, training, job preparedness, and placement for priority populations and
Disadvantaged Communities.
■Develop training infrastructure to upskill existing workers and prepare the next generation of clean energy workers in high-
growth areas like high-efficiency HVAC, building electrification, energy storage, and offshore wind.
■Ensure training curricula and programmatic support respond to industry and market needs.
■Provide targeted support to reduce the time it takes to bring a new worker to full productivity and offset risks that might prevent
clean energy firms from hiring or training new workers, particularly workers with additional barriers to employment.
■Boost partnership and collaboration with labor unions, community- based organizations, helping develop and place employees
firmly in career pathways.
Economic Development
■Establish strategy to help organize and make State economic development resources more impactful, via greater strategic
alignment and less episodic engagement on supply chain, community-center developments.

2
TRANSFORMATION 2030
■Nearly Half-a-Million Climate Jobs in
New York by 2030
■Good-quality clean energy jobs
supporting workers’ families and
delivering high-value to customers
■Fine-tuned matching of workforce
development programs to the
job creation from expected Climate
Act investments
■An additional roughly $12–$15 billion
in capital leveraged via NY Green
Bank and Innovation.
■Comprehensive economic
development strategy has made
New York the leading market
for clean energy business growth
and supply chain localization
■The Southern Tier of New York has
become the nation’s next battery
manufacturing and research hub
INDICATORS
OF PROGRESS
■Statewide clean energy industry
jobs, job creation driven by
Climate Act investments
■Priority populations trained and
employed in clean energy
■Commercialized climate solutions
and launches of incubated firms,
including related revenues
■Total value of capital mobilized
using NY Green Bank support, and
capital mobilized in Disadvantaged
Communities
New York’s clean energy industry can help drive
a sustainable recovery for the State’s economy
HIGHLIGHTED PROGRAMS AND INITIATIVES
NY Green Bank works with the private sector to
increase investments into the State’s clean energy
markets, including through transactions related to:
■Community solar/Community distributed generation
■Affordable housing and energy efficiency
■Electric vehicles, charging infrastructure, and clean
transportation
■Energy storage
Innovation supports an affordable and just transition
and the achievement of New York’s climate goals
through investments in and advisory services to
researchers and companies, including:
■Carbontech support programs with Activate and Columbia
University
■Hydrogen and other solutions for deep
decarbonization and a resilient energy
system
■Long-duration energy storage solutions
supporting a resilient, flexible, clean grid
■Natural solutions to mitigation greenhouse gases
■Building the grid of the future
■Clean heating and cooling research and development
■Tech to Market resources including accelerators like the
Clean Fight and Cleantech Open Northeast; the M-Corps
manufacturing scaleup program; and the Entrepreneur in
Residence (EIR) mentorship program
Workforce Development supports training for new clean
energy workers, driven by industry needs, and develops the
clean energy sector talent pipeline:
■HVAC/Building Electrification Career Pathway Program
■Climate Justice Fellowship Program
■Building Operation and Maintenance Staff Training
■On-the-Job Training
■Clean Energy Internships
■Clean Energy Talent Pipeline Development

STRATEGIC FOCUS AREA
Building an Inclusive
Clean Energy Economy
LONG-TERM VISION AND VALUE PROPOSITION
A strong and inclusive clean energy economy will
lead to economic opportunities, improved health,
and engagement for all New Yorkers especially
those who have not benefitted in the past.
New York State’s frontline communities, including environmental justice, LMI, communities of
color, and otherwise Disadvantaged* Communities, have disproportionately been impacted by
energy costs; pollution from fossil fuel combustion; disinvestment in housing; systemic inequities
in education and workforce opportunities; and limited ability to engage in and inform policy making
that affects their community.
*As part of the implementation of the Climate Act, the Climate Justice Working Group is charged with
developing criteria for Disadvantaged Communities for prioritization and benefit through New York
State investments in clean energy.
KEY CHALLENGES/ BARRIERS
■Systemic and institutional inequities have led to limited opportunities for communities of color and
other frontline or Disadvantaged Communities to participate in and benefit from the clean energy economy, including
access to green jobs, ownership of distributed energy resources, and informing policy
and programs.
■Energy burden for lower-income households can exceed 20% of annual income, and nearly half of New York’s
population has annual income below 80% of the Area Median Income, especially within communities of color.
■Access to capital, misaligned incentives, and historically fragmented administration of key programs present
barriers to scaling clean energy solutions
within the LMI market segment and Disadvantaged Communities.
■The size of income-eligible and disadvantaged populations requires innovative approaches to achieve adoption at
scale, with careful attention to program/policy designs to avoid regressive outcomes/ impacts.
■Engaging with Disadvantaged Communities and bringing their voice to the table is inherently challenging given chronic
lack of resources within LMI and EJ communities.

ILLUSTRATIVE INITIATIVES TO ADVANCE AN INCLUSIVE
CLEAN ENERGY ECONOMY BY PORTFOLIO
MARKET DEVELOPMENT
Clean Green Schools – funding solutions for eligible
P-12 schools to reduce school energy use and assist in
the conversion to carbon-free fuels
EmPower New York – no-cost and discounted efficiency solutions
to income-eligible New Yorkers, helping save energy and money
Technical Assistance and Predevelopment – support for housing
agencies, contractors, developers, and builders for clean energy,
high-performance building, and retrofits
Beneficial Electrification for LMI and Affordable Housing
–replicable solutions for heat pump adoption in the LMI and
affordable housing sectors, while ensuring customer protections
Raise the Green Roof – pre-development support, grants and
financing for building decarbonization measures deployed in Homes
and Community Renewal’s (HCR) affordable housing portfolio
Community-Based Workforce Development –
community-based training partnerships between clean energy
businesses, training organizations, industry associations, and un/
underemployed residents in Disadvantaged Communities
On-the-job training for priority populations – support for clean
energy businesses to hire persons from priority populations
Career Pathways Funding and Training – solicitation to train and
place new entrants to the HVAC and building electrification industry
Climate Justice Corps – funding for fellows to improve engagement
of Disadvantaged Communities, identify community-based, climate
justice focused projects and solutions, and build capacity of local
organizations to advance climate justice
NY GREEN BANK / FINANCE
Financing for Affordable Housing and
Energy Efficiency in Disadvantaged
Communities – new initiative using
financing to catalyze clean energy within the
existing capital stack for affordable housing,
aiming to invest at least
$150 million in clean energy and energy
efficiency solutions that benefit the State’s
affordable multifamily housing market
Exploring tariff-backed and other
innovative, inclusive financing models –
approaches to overcome LMI/Disadvantaged
Communities finance challenges, stabilize
energy costs, and improve air quality in
Disadvantaged Communities
Partnering with other agencies to explore
innovative opportunities to put NY Green
Bank capital to work, including new areas
such as energy resiliency
Through Green Jobs–Green New York
–providing New Yorkers with access to
energy assessments, installation services,
low-interest financing, and pathways to
training for various green-collar careers
Cultivating diverse ecosystem of
investment partners and counterparties –
explore funding to cover transaction costs
and/or pro bono/in-kind transaction support
NY-SUN / DISTRIBUTED ENERGY RESOURCES
Solar for All – utility bill assistance program funding solar to benefit homeowners/renters unable to access solar
Affordable Multifamily Housing Incentive – PV installations serving affordable housing properties
Technical Assistance and Predevelopment – grants to address key barriers to PV and storage projects providing
benefits to LMI, Environmental Justice and Disadvantaged Communities
Community Solar, Solar paired with Storage, and Energy Efficiency – incentive adders for community PV, projects that
pair PV and energy storage and provide resiliency and/or financial benefits to LMI customers and affordable housing
Peaker Reduction and Replacement – project deployments that support the potential for solar and energy storage to
repower, replace, and back-down electric generating peaker units
Good-Paying Community Solar Jobs – require prevailing wage for workers on projects above 1 MW
Place-based decarbonization models – work with sister agencies to demonstrate novel partnerships surrounding
place-based decarbonization with a focus on Disadvantaged Communities, such as the new interagency team we will
lead with NYPA on Hunts Point in the Bronx

INNOVATION AND RESEARCH
Advanced HVAC Challenge – heating and cooling technology innovations targeting common LMI building
types and needs
Innovation for Affordable Decarbonization – investments designed to reduce the cost of clean energy
through optimization of the power grid, clean building technologies, and clean gas and liquid fuels
Evolving work on resilience – tools to support adaptation to climate change for all New Yorkers, including
those most vulnerable
Clean Neighborhoods Challenge – scalable, community-aligned clean transportation solutions that reduce local air
pollution and remove barriers to widespread electric and active transportation use in disadvantaged communities
Electric Mobility Challenge – community-informed clean transportation solutions that transform access to
electric mobility options and reduce emissions in disadvantaged communities
Electric Truck & Bus Challenge – innovative demonstrations that accelerate medium- and heavy-duty vehicle
electrification, expand access to cost-effective, user-friendly solutions, and reduce emissions
LARGE-SCALE RENEWABLES
RFP Design – prioritize in the evaluation of projects’ economic benefits to disadvantaged communities, the role of renewables and
energy storage to support the phaseout of the most polluting fossil generators downstate
Agriculture, natural resources and smart siting policies – maximize co-benefits between
industries and cultivate infrastructure ecologies (e.g., supporting supplemental income diversification, promoting carbon sequestration
through soil enrichment, water quality improvements)
Implement 2021 Executive Budget proposals – complete Buy American market assessment, MWBE and SDVOB assessment,
and implement updated prevailing wage requirements for project construction and operation.”
Transmission planning – active participation in transmission planning to align with project development and seek important
partnerships and cultivate benefits with communities, including via Tier 4
PRIORITY ACTIONS FOR NEW YORK
■Work toward a goal of driving 40% of the benefits of clean energy spending to Disadvantaged Communities.
■Increase engagement of frontline, climate-vulnerable communities in developing the clean energy economy, including
ensuring community representation in decision-making and policymaking.
■Align State resources and strategy to increase impact from public investments in energy affordability and expand access to
clean energy solutions for lower-income households, affordable housing, and Disadvantaged Communities.
■Leverage regulatory, policy, and financing mechanisms to increase adoption of clean energy solutions in affordable housing,
including beneficial electrification.
■Facilitate a just transition to a clean energy economy by supporting unemployed or underemployed workers and priority
populations, including workers in fossil-based industries, by addressing barriers to training and job opportunities for residents
of Disadvantaged Communities and priority populations.
■Advance access to clean transportation for residents of Disadvantaged Communities and accelerate the transition to electric
vehicles within EJ areas to reduce emissions and improve air quality.
■Develop solutions and models for deploying utility-scale DER, clean transportation, and energy efficiency in the built
environment to reduce emissions and co-pollutants especially within Disadvantaged Communities.
■Quantify and maximize health and economic benefits from deploying clean energy solutions, especially within
Disadvantaged Communities.
■Develop a path for decarbonizing affordable housing, including models that advance beneficial electrification across the
LMI market segment.
■Publish, finalize, and implement findings from the Climate Act Disadvantaged Communities Barriers Report.

STRATEGIC FOCUS AREA
Supporting Clean Energy
Jobs and New York’s
Economic Recovery
LONG-TERM VISION AND VALUE PROPOSITION
New York’s nation-leading climate action policies and
investments have driven steady growth in the State’s
clean energy economy, outpacing economy- wide
growth for the last three years.
However, like other sectors, the clean energy industry suffered significant job losses as a result of the
pandemic. Jobs are rebounding, but continued investment is needed to address current worker
dislocation in the near term, build labor capacity, and ensure that New Yorkers and New York firms
reap the financial benefits that will result from delivering clean energy solutions at the scale needed
to meet Climate Act goals. The State’s continued leadership and investment in its clean energy
workers and businesses will also create the foundation for a just transition in the decades to come,
beginning with prioritizing training, job placement, and wrap-around support for individuals from
Disadvantaged Communities, underserved populations, or those entering the clean energy workforce
from a fossil-based job.
KEY CHALLENGES/BARRIERS
■Historically marginalized populations
face greater barriers to employment.
■Strains on businesses as a result of the
pandemic threaten the recruitment,
retention, and training of workers.
■Public, private, and philanthropic
resources are increasingly scarce,
and in some cases, have constraints
on how they can be used (e.g.,
geography, direct technical training
versus wrap-around services).
■Ongoing demographic transitions and
retirements require the State to entice
new entrants to this energy field and
ensure that training is in sync with job
placement opportunities.
PRIORITY ACTIONS
FOR NEW YORK
■Harness the State’s clean energy
investments to provide economic
opportunity and quality jobs for New
Yorkers, including LMI and historically
disadvantaged populations.
■Support the work of the Climate Action
Council and Just Transition Working
Group to ensure workforce development
considerations are prioritized.
■Integrate the definition of Disadvantaged
Communities and guidance from the
Climate Justice Working Group into
workforce-related programs and offerings
■Advocate for climate/clean energy
investments as part of State and federal
stimulus efforts.

Spotlight
New York State Climate Jobs Study
Based on independent research conducted for New York’s Just
Transition Working Group, Climate Act Scoping Plan Investments
are expected to spur hundreds of thousands of new jobs in
coming decades.
+285,000
+172,000
Expected clean energy
job growth 2X greater
than 2016–2020
Offshore wind will be
one of the fastest
growing sectors
■Employment in growth sub-sectors increases by at least
172,000 jobs by 2030, a 55% increase in the workforce from
2019 to 2030
■Employment grows in these sub-sectors by at least
285,000 jobs through 2050
■In New York State, clean energy jobs, in their comparable
sub-sectors, are expected to grow annually at more than twice
the rate from 2021 through 2030 as the growth experienced
between 2016 through 2020
■By 2050, growth sub-sectors, in New York State will reach
nearly 600,000 jobs
More than half of new
jobs will tackle building
decarbonization
Key Employment Findings — S2: LCF Scenario
■Sub-Sectoral Breakdown of 172,000 jobs added by 2030
■Over half of the new jobs, in the growth sub-sectors,
from 2019 to 2030, will be found in the buildings sub-sectors
(shaded blue)
■The next largest growth sub-sectors are solar and offshore
wind electricity generation, and electric vehicle charging and
hydrogen fueling stations
* Includes Transmission, Storage, Other Generation, Bioenergy, Residential
Other, Hydrogen, Onshore Wind, and Vehicle Manufacturing

STRATEGIC FOCUS AREA
Fostering Healthy and
Resilient Communities
New York’s diverse communities have a critical
role to play in the State’s clean energy transition.
They serve as essential partners both in the rapid expansion of clean energy generation as well as the
decarbonization of society — including the built environment and the transportation and industrial
sectors — thereby creating healthy, livable environments and supporting larger projects with far-
reaching statewide benefits.
But to succeed, we need to provide communities with the necessary tools and other resources to carry
out this work. On the renewable generation side, efforts such as the Office of Renewable Energy Siting
(ORES), NYSERDA’s Build-Ready program, and the new host community benefits framework, are
designed to reduce barriers for localities and overcome obstacles to mutually beneficial project
development.
In order to decarbonize the State’s building stock by mid-century, New York will have to quickly
move beyond a building-by-building approach to a neighborhood-by-neighborhood approach,
developing carbon neutral communities.
There are more than 6 million buildings in
New York. More than 200,000 buildings per year would
need to be decarbonized for the next 30 years to
address the entire existing building stock by 2050. The
State needs to build scale to succeed, and action at the
community-level will be critical.
The disparate health and air quality impacts borne by Disadvantaged Communities as a
result of historical and continuing environmental injustice remain front of mind, a reality that
has been underscored and exacerbated by the COVID-19 pandemic.
We can begin to reverse and repair these inequitable community outcomes by providing
resources to Disadvantaged Communities that ensure all New Yorkers benefit from the clean
energy transition. Decarbonized communities will have improved outdoor air quality (e.g., through
the elimination of peaker plants and on-site combustion of fossil fuels), safer and healthier
buildings (through electrification, energy efficiency and measures to guard against airborne
pathogens), job and economic opportunities, and increased economic activity, collectively
fostering healthy communities.

KEY CHALLENGES/BARRIERS
■Communities lack resources to
adequately address many on-the-ground
challenges associated with the energy
transformation — from competing interest
for land use and challenging siting issues,
to a diverse building stock coupled with
complex and evolving building codes and
aging infrastructure.
■Local resource constraints were
exacerbated by COVID-19 and the
associated economic challenges.
■Some communities have a negative
perception of large-scale renewable
projects, and are negatively disposed to
development of these projects.
■Disadvantaged communities face
disparate exposure to air pollution from
multiple sources (vehicles, power plants,
industrial facilities) and often are burdened
with a building stock that does not provide
healthy indoor air quality.
■Health and safety benefits that result
from community decarbonization are
not always well understood and can be
difficult to quantify and monetize.
PRIORITY ACTIONS
FOR NEW YORK
■Continue to provide and expand upon training and
technical resources to help communities prepare
for responsible renewable energy development,
embrace decarbonization and energy efficiency,
and support progressive building codes.
■Facilitate paths for community engagement
on decarbonization wherever possible,
including through grants and financial support,
local coordinators, clear technical guidance
and templates, recognition, and interagency
coordination.
■Incorporate decarbonization into various existing
State funding programs, like the Downtown
and Upstate Revitalization Initiatives and other
opportunities under the Consolidated Funding
Application.
■Develop and establish a robust framework for host
community benefit agreements as part of large-
scale renewable projects clarifying local benefits
and making benefits packages more compelling.
■Through the Office of Renewable Energy Siting,
issue new uniform, standardized guidelines
for responsible large-scale renewable siting to
improve consistency, expedite approval of projects
not located on greenfield sites, and reduce
burdens for local community intervention.
■Focus on turning underutilized lands, such
as brownfields, landfills, and former industrial
properties, into revenue-generating clean energy
projects, and advance project development on
other sites that present development challenges
for commercial developers.
■Facilitate passage and/or implementation of
proactive community-level clean energy policies
such as Community Choice Aggregation (CCA),
benchmarking, and other climate-friendly codes,
standards, and mandates recommended by the
Climate Action Council.


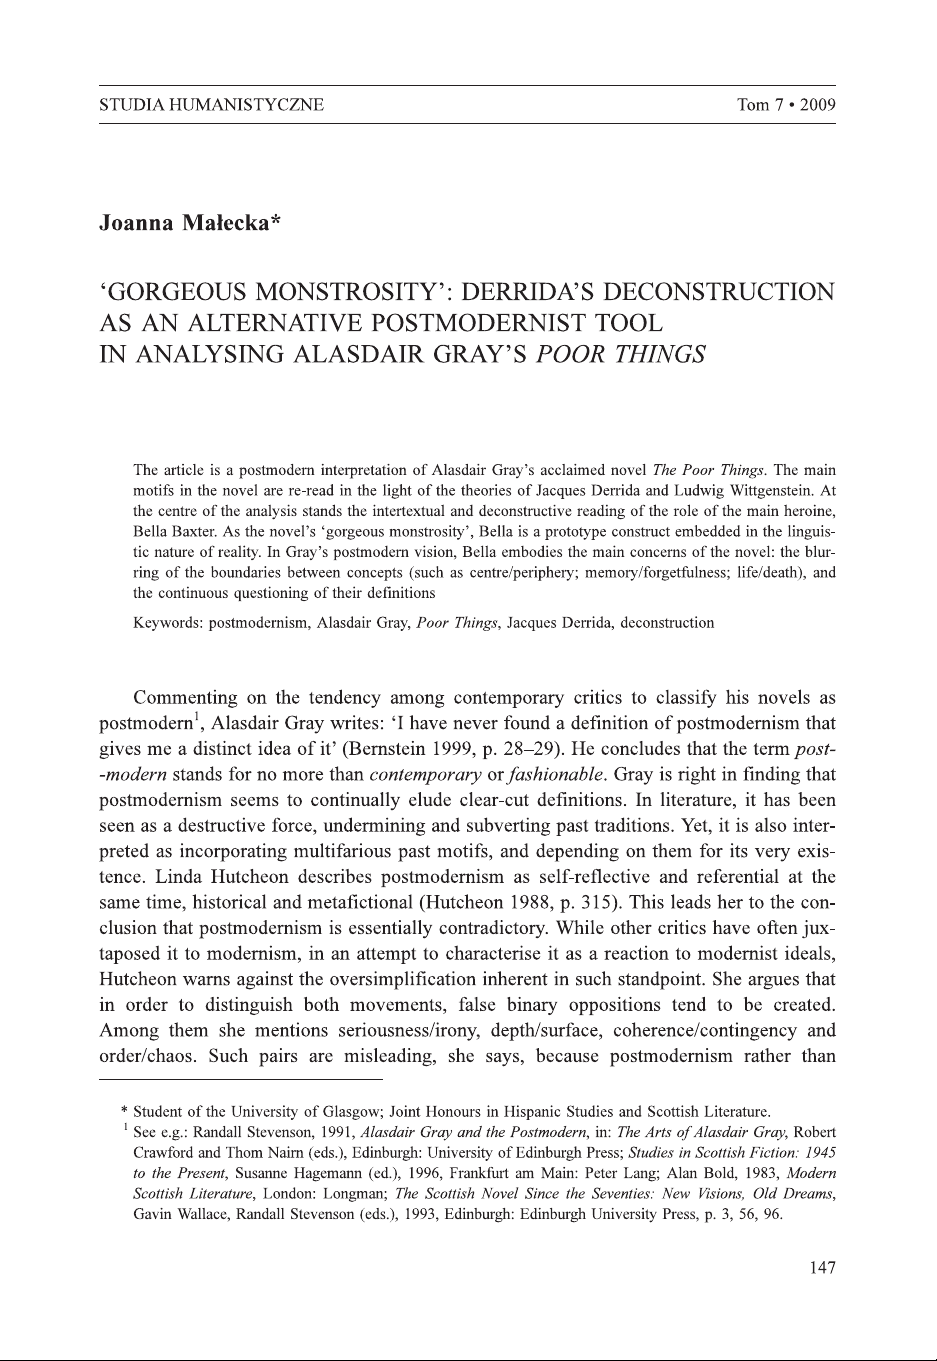


![[ PDF Database Document ] - BTCC Cryptocurrency Exchange BYD Aktie Prognose & Kursziel 2024, 2025, 2030: BYD-Aktie kaufen oder nicht?](https://s3.us-east-1.amazonaws.com/outstation.idea/pdf-mt/8720638253975465984/pdf/fd8496a7-505d-4e0c-9335-aab95ac51498/imgs/page1.png)
